
Our approach to risk - Hang Seng Bank
67
Our approach to risk Our risk appetite We recognise the importance of a strong risk culture, which refers to our shared attitudes, values and norms that shape behaviours related to risk awareness, risk taking and risk management. All our people are responsible for the management of risk, with the ultimate accountability residing with the Board. We seek to build our business for the long term by balancing social, environmental and economic considerations in the decisions we make. Our strategic priorities are underpinned by our endeavour to operate in a sustainable way. This helps us to carry out our social responsibility and manage the risk profile of the business. We are committed to managing and mitigating climate-related risks, both physical and transition, and will continue to incorporate this into how we manage and oversee risks internally and with our customers. The following principles guide the Group’s overarching appetite for risk and determine how our businesses and risks are managed. Financial position • We aim to maintain a strong capital position, defined by regulatory and internal capital ratios. • We carry out liquidity and funding management for each operating entity, on a stand-alone basis. Operating model • We seek to generate returns in line with a conservative risk appetite and strong risk management capability. • We aim to deliver sustainable earnings and consistent returns for shareholders. Business practice • We have zero tolerance for any of our people to knowingly engage in any business, activity or association where foreseeable reputational risk or damage has not been considered and / or mitigated. • We have no appetite for deliberately or knowingly causing detriment to consumers, or incurring a breach of the letter or spirit of regulatory requirements. • We have no appetite for inappropriate market conduct by a member of staff or by any business. Enterprise-wide application Our risk appetite encapsulates consideration of financial and non-financial risks. We define financial risk as the risk of a financial loss as a result of business activities. We actively take these types of risks to maximise shareholder value and profits. Non-financial risk is defined as the risk to achieving our strategy or objectives as a result of inadequate or failed internal processes, people and systems or from external events. Our risk appetite is expressed in both quantitative and qualitative terms. It continues to evolve and expand its scope as part of our regular review process. The Board reviews and approves the Group’s risk appetite twice a year to make sure it remains fit for purpose. The risk appetite is considered, developed and enhanced through: • an alignment with our strategy, purpose, values and customer needs; • trends highlighted in other Group risk reports; • communication with risk stewards on the developing risk landscape; • strength of our capital, liquidity and balance sheet; • compliance with applicable laws and regulations; • effectiveness of the applicable control environment to mitigate risk, informed by risk ratings from risk control assessments; • functionality, capacity and resilience of available systems to manage risk; and • the level of available staff with the required competencies to manage risks. We formally articulate our risk appetite through our risk appetite statement (‘RAS’), which is approved by the Board on the recommendation of the Risk Committee (‘RC’). Setting out our risk appetite ensures that planned business activities provide an appropriate balance of return for the risk we are taking, and that we agree a suitable level of risk for our strategy. In this way, risk appetite informs our financial planning process and helps senior management to allocate capital to business activities, services and products. The RAS consists of qualitative statements and quantitative metrics, covering financial and non-financial risks. It is fundamental to the development of business line strategies, strategic and business planning, and senior management balanced scorecards. HANG SENG BANK 48 Risk (Figures expressed in millions of Hong Kong dollars unless otherwise indicated)
-
Upload
khangminh22 -
Category
Documents
-
view
2 -
download
0
Transcript of Our approach to risk - Hang Seng Bank
Our approach to risk
Our risk appetiteWe recognise the importance of a strong risk culture, which refers to our shared attitudes, values and norms that shape behaviours related to risk awareness, risk taking and risk management. All our people are responsible for the management of risk, with the ultimate accountability residing with the Board.
We seek to build our business for the long term by balancing social, environmental and economic considerations in the decisions we make. Our strategic priorities are underpinned by our endeavour to operate in a sustainable way. This helps us to carry out our social responsibility and manage the risk profile of the business. We are committed to managing and mitigating climate-related risks, both physical and transition, and will continue to incorporate this into how we manage and oversee risks internally and with our customers.
The following principles guide the Group’s overarching appetite for risk and determine how our businesses and risks are managed.
Financial position• We aim to maintain a strong capital position, defined by
regulatory and internal capital ratios.
• We carry out liquidity and funding management for each operating entity, on a stand-alone basis.
Operating model• We seek to generate returns in line with a conservative
risk appetite and strong risk management capability.
• We aim to deliver sustainable earnings and consistent returns for shareholders.
Business practice• We have zero tolerance for any of our people to knowingly
engage in any business, activity or association where foreseeable reputational risk or damage has not been considered and / or mitigated.
• We have no appetite for deliberately or knowingly causing detriment to consumers, or incurring a breach of the letter or spirit of regulatory requirements.
• We have no appetite for inappropriate market conduct by a member of staff or by any business.
Enterprise-wide applicationOur risk appetite encapsulates consideration of financial and non-financial risks. We define financial risk as the risk of a financial loss as a result of business activities. We actively take these types of risks to maximise shareholder value and profits. Non-financial risk is defined as the risk to achieving our strategy or objectives as a result of inadequate or failed internal processes, people and systems or from external events.
Our risk appetite is expressed in both quantitative and qualitative terms. It continues to evolve and expand its scope as part of our regular review process.
The Board reviews and approves the Group’s risk appetite twice a year to make sure it remains fit for purpose. The risk appetite is considered, developed and enhanced through:
• an alignment with our strategy, purpose, values and customer needs;
• trends highlighted in other Group risk reports;
• communication with risk stewards on the developing risk landscape;
• strength of our capital, liquidity and balance sheet;
• compliance with applicable laws and regulations;
• effectiveness of the applicable control environment to mitigate risk, informed by risk ratings from risk control assessments;
• functionality, capacity and resilience of available systems to manage risk; and
• the level of available staff with the required competencies to manage risks.
We formally articulate our risk appetite through our risk appetite statement (‘RAS’), which is approved by the Board on the recommendation of the Risk Committee (‘RC’). Setting out our risk appetite ensures that planned business activities provide an appropriate balance of return for the risk we are taking, and that we agree a suitable level of risk for our strategy. In this way, risk appetite informs our financial planning process and helps senior management to allocate capital to business activities, services and products.
The RAS consists of qualitative statements and quantitative metrics, covering financial and non-financial risks. It is fundamental to the development of business line strategies, strategic and business planning, and senior management balanced scorecards.
HANG SENG BANK48
Risk(Figures expressed in millions of Hong Kong dollars unless otherwise indicated)
Performance against the RAS is reported to the Risk Management Meeting (‘RMM’) regularly so that any actual performance that falls outside the approved risk appetite is discussed and appropriate mitigating actions are determined. This reporting allows risks to be promptly identified and mitigated, and informs risk-adjusted remuneration to drive a strong risk culture.
Risk ManagementWe recognise that the primary role of risk management is to protect our business, customers, colleagues, shareholders and the communities that we serve, while ensuring we are able to support our strategy and provide sustainable growth.
We are focused upon implementation of our business strategy and it is critical that we ensure we use active risk management to manage the execution risks.
We will also perform periodic risk assessments, including strategies to ensure retention of key personnel for our continued safe operation.
We use a comprehensive risk management framework across the organisation and across all risk types, underpinned by our culture and values. This outlines the key principles, policies and practices that we employ in managing material risks, both financial and non-financial.
The framework fosters continual monitoring, promotes risk awareness and encourages sound operational and strategic decision making. It also ensures a consistent approach to identify, assess, manage and report the risks we accept and incur in our activities.
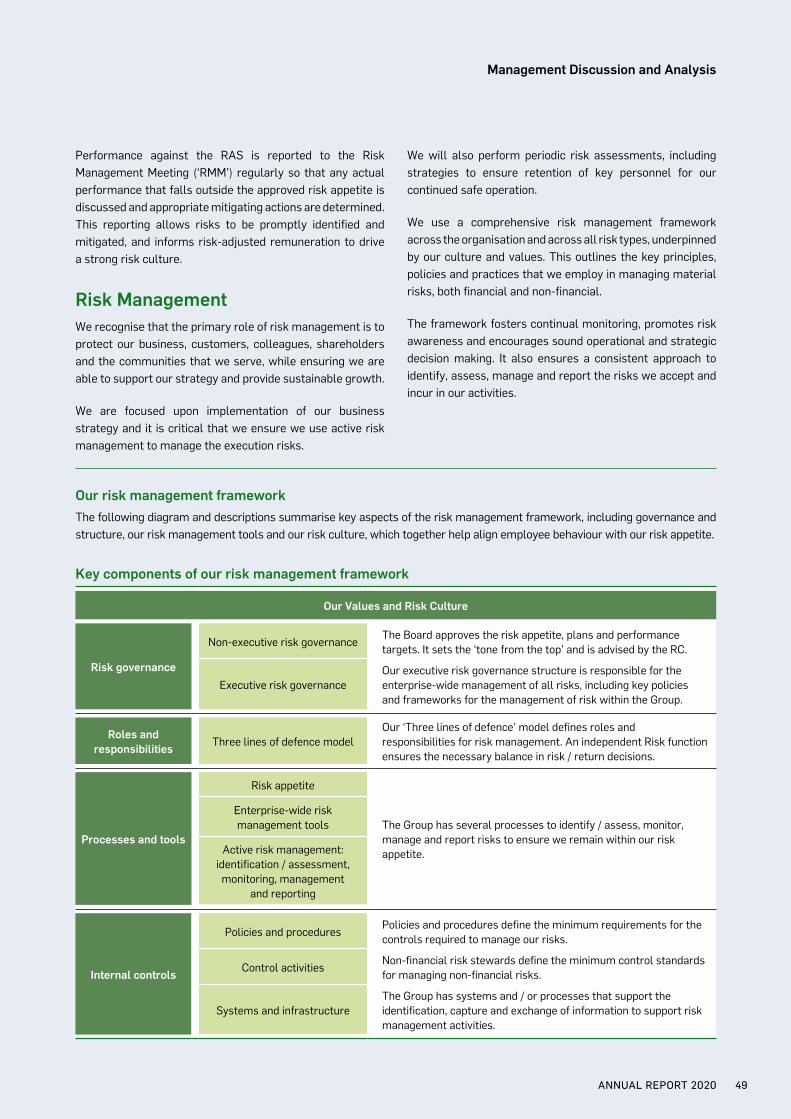
Our risk management frameworkThe following diagram and descriptions summarise key aspects of the risk management framework, including governance and structure, our risk management tools and our risk culture, which together help align employee behaviour with our risk appetite.
Key components of our risk management framework
Our Values and Risk Culture
Risk governance
Non-executive risk governanceThe Board approves the risk appetite, plans and performance targets. It sets the ‘tone from the top’ and is advised by the RC.
Executive risk governanceOur executive risk governance structure is responsible for the enterprise-wide management of all risks, including key policies and frameworks for the management of risk within the Group.
Roles and responsibilities Three lines of defence model
Our ‘Three lines of defence’ model defines roles and responsibilities for risk management. An independent Risk function ensures the necessary balance in risk / return decisions.
Processes and tools
Risk appetite
The Group has several processes to identify / assess, monitor, manage and report risks to ensure we remain within our risk appetite.
Enterprise-wide risk management tools
Active risk management: identification / assessment, monitoring, management
and reporting
Internal controls
Policies and proceduresPolicies and procedures define the minimum requirements for the controls required to manage our risks.
Control activitiesNon-financial risk stewards define the minimum control standards for managing non-financial risks.
Systems and infrastructureThe Group has systems and / or processes that support the identification, capture and exchange of information to support risk management activities.
ANNUAL REPORT 2020 49
Management Discussion and Analysis
Risk governanceThe Board has ultimate responsibility for the effective management of risk and approves our risk appetite. It is advised on risk-related matters by the RC.
The Chief Risk Officer, supported by the RMM, holds executive accountability for the ongoing monitoring, assessment and management of the risk environment and the effectiveness of the risk management framework.
The management of regulatory compliance risk and financial crime risk reside with the Head of Regulatory Compliance and Head of Financial Crime Compliance respectively. Oversight is maintained by the Chief Risk Officer in line with his enterprise risk oversight responsibilities, through the RMM.
Day-to-day responsibility for risk management is delegated to senior managers with individual accountability for decision making. All our people have a role to play in risk management. These roles are defined using the three lines of defence model, which takes into account the Group’s business and functional structures.
We use a defined executive risk governance structure to help ensure there is appropriate oversight and accountability of risk, which facilitates reporting and escalation to the RMM.
A Product Oversight Committee reporting to the RMM and comprising senior executives from Risk, Legal, Compliance, Finance, and Operations / IT, is responsible for reviewing and approving the launch of such new products and services. Each new service and product launch is also subject to an operational risk self-assessment process, which includes identification, evaluation and mitigation of risk arising from the new initiative. Internal Audit is consulted on the internal control aspect of new products and services in development prior to implementation.
Our roles and responsibilitiesAll our people are responsible for identifying and managing risk within the scope of their role as part of the three lines of defence model.
Three lines of defence
To create a robust control environment to manage risks, we use an activity-based three lines of defence model. This model delineates management accountabilities and responsibilities for risk management and the control environment.
This model underpins our approach to risk management by clarifying responsibility and encouraging collaboration, as well as enabling efficient coordination of risk and control activities.
The three lines of defence are summarised below:
• The first line of defence owns the risks and is responsible for identifying, recording, reporting and managing them in line with risk appetite, and ensuring that the right controls and assessments are in place to mitigate them.
• The second line of defence sets the policy and guidelines for managing specific risk areas, provides advice and guidance in relation to the risk, and challenges the first line of defence on effective risk management.
• The third line of defence is our Internal Audit function, which provides independent assurance that our risk management, governance and internal control processes are designed and operating effectively.
Independent risk function
The Group’s Risk function, headed by the Chief Risk Officer, is responsible for the Group’s risk management framework. This responsibility includes establishing and monitoring of risk profiles and forward-looking risk identification and management. The Group’s Risk function is made up of sub-functions covering all risks to our operations and forms part of the second line of defence. It is independent from the businesses, including sales and trading functions, to provide challenge, appropriate oversight and balance in risk / return decisions.
Responsibility for minimising both financial and non-financial risk lies with our people. They are required to manage the risks of the business and operational activities for which they are responsible.
We maintain adequate oversight of our risks through various specialist Risk Stewards, along with our aggregate overview through Chief Risk Officer.
Risk management toolsThe Group uses a range of tools to identify, monitor and manage risk. The key tools are summarised below.
HANG SENG BANK50
Risk
Risk appetite
The RAS is a written articulation of the aggregate level and types of risk that the Group is willing to accept in order to achieve its business objectives. Our risk appetite encapsulates consideration of both financial and non-financial risks and is expressed in both quantitative and qualitative terms.
The RMM reviews the Group’s actual risk appetite profile against the limits set out in the RAS regularly to enable senior management to monitor the risk profile and guide business activities in order to balance risk and return. The actual risk appetite profile is also reported to the RC and Board by Chief Risk Officer including material deviation and related management mitigating actions.
Risk map
The Group uses a risk map to provide a point-in-time view of its residual risk profile across both financial and non-financial risks. This highlights the potential for these risks to materially affect our financial results, reputation or business sustainability. Risk stewards assign risk ratings, supported by commentary. Risks that have an ‘Amber’ or ‘Red’ risk rating require monitoring and mitigating action plans being either in place or initiated to manage the risk down to acceptable levels.
Top and emerging risks
(unaudited)
We use a top and emerging risks process to provide a forward-looking view of issues with the potential to threaten the execution of our strategy or operations over the medium to long term.
We proactively assess the internal and external risk environment, as well as review the themes identified across our organisation and global businesses, for any risks that may require escalation, updating our top and emerging risks as necessary.
We define a ‘top risk’ as a thematic issue that may form and crystallise within one year, and has the potential to materially affect the Group’s financial results, reputation or long-term business model. It may arise across any combination of risk types, countries or global businesses. The impact may be well understood by senior management and some mitigating actions may already be in place.
An ‘emerging risk’ is a thematic issue with large unknown components that may form and crystallise beyond a one-year time horizon. If it were to materialise, it could have a significant material impact on the Group’s long-term strategy, profitability and / or reputation. Existing mitigating
action plans are likely to be minimal, reflecting the uncertain nature of these risks at this stage. Some high-level analysis and / or stress testing may have been carried out to assess the potential impact.
Stress testing and recovery planning
The Group operates a wide-ranging stress testing programme that is a key part of our risk management and capital planning. Stress testing provides management with key insights into the impact of severely adverse events on the Group, and provides confidence to regulators on the Group’s financial stability.
Our stress testing programme assesses our capital strength through a rigorous examination of our resilience to external shocks. As well as undertaking regulatory-driven stress tests, we conduct our own internal stress tests, in order to understand the nature and level of all material risks, quantify the impact of such risks and develop plausible business as usual mitigating actions.
Many of our regulators – including the Hong Kong Monetary Authority (‘HKMA’) – use stress testing as a prudential regulatory tool, and the Group has focused significant governance and resources to meet their requirements.
Internal stress tests
Our internal capital assessment uses a range of stress scenarios that explore risks identified by management. They include potential adverse macroeconomic, geopolitical and operational risk events, as well as other potential events that are specific to the Group.
The selection of scenarios is based upon the output of our top and emerging risks identified and our risk appetite. Stress testing analysis helps management understand the nature and extent of vulnerabilities to which the Group is exposed. Using this information, management decides whether risks can or should be mitigated through management actions or, if they were to crystallise, should be absorbed through capital. This in turn informs decisions about preferred capital levels and allocations.
In addition to the Group-wide stress testing scenarios, the Group also participate, as required, in the regulatory stress testing programmes of the jurisdictions in which they operate, and the stress tests of the HKMA. Functions and businesses also perform bespoke stress testing to inform their assessment of risks in potential scenarios.
The Group stress testing programme is overseen by the RC and results are reported, where appropriate, to the RMM and RC.
ANNUAL REPORT 2020 51
Management Discussion and Analysis
We also conduct reverse stress tests each year at a group level and, where required, at subsidiary entity level to understand potential extreme conditions that would make our business model non-viable. Reverse stress testing identifies potential stresses and vulnerabilities we might face, and helps inform early warning triggers, management actions and contingency plans designed to mitigate risks.
Recovery and resolution plans
Recovery and resolution plans form an integral framework in the safeguarding of the Group’s financial stability. Together with stress testing, it helps us understand the outcomes of adverse business or economic conditions and the identification of mitigating actions.
Key developments in 2020
There were no material changes to the policies and practices for the management of risk in 2020. However, where required, appropriate exceptional handling approaches were exercised in response to Coronavirus Disease 2019 (‘COVID-19’) developments.
We have been actively managing the risks resulting from the COVID-19 outbreak and its impacts on our customers and operations during 2020 as well as other key risks described in this section.
In 2020, we enhanced our risk management in the following areas:
• In January 2020, we simplified our approach and articulation of risk management through the combination of our enterprise risk management framework and our operational risk management framework.
• We adopted the HSBC Group model risk policy and associated standards which were revised to improve how we manage model risk and meet enhanced external expectations.
• We continued to focus on simplifying our approach to non-financial risk management. We are driving more effective oversight and better end-to-end identification and management of non-financial risks.
• We continue to support the business and our customers throughout the global pandemic, while continuing to manage financial crime risk. We continued to invest in both advanced analytics and artificial intelligence, which remain key components of our next generation of tools to fight financial crime. From 2021, we will combine our RMM and Financial Crime Risk Management Committee Meetings to ensure a holistic view of all risks.
Areas of special interest(unaudited)
During 2020, a number of areas were identified and considered as part of our top and emerging risks because of the effect they may have on the Group. We place particular focus in this section on geopolitical and macroeconomic risks, IBOR transition and risks related to COVID-19.
Geopolitical and macroeconomic risks
Our operations and portfolios are exposed to risks associated with US-China tensions, social unrest and COVID-19, which could lead to disruption of our operations, physical risk to our staff and / or physical damage to our assets.
The COVID-19 outbreak dominated the political and economic landscape through much of 2020. The twin shocks of a public health emergency and the resultant economic fallout have been felt around the world, and hit both advanced and emerging markets. The closure of borders threatened medical and food supplies for many markets, leading to countries and territories focusing efforts on building resilient supply chains closer to home. COVID-19 and the corresponding vaccine rollout will likely dominate the political and economic agenda for most of 2021.
Tensions could be raised as countries compete for access for the array of vaccines under development, approved or pending approval, while the potential differences of protection offered, the speed and scale with which they can be manufactured, and the take-up rates of vaccines will impact the speed of economic recovery.
The COVID-19 outbreak also heightened existing US-China tensions. Tensions span a wide range of issues, including trade, finance, military, technology and human rights. The COVID-19 outbreak has accelerated US and Chinese efforts to reduce mutual dependence in strategic industries such as sensitive technology, pharmaceuticals and precursor chemicals.
A range of tensions in US-China relations could have potential ramifications for the Group and its customers. These tensions may affect the Group as a result of the impact of sanctions (including sanctions that impact the Group’s customers), as well as regulatory, reputational and market risks.
HANG SENG BANK52
Risk
The US has imposed a range of sanctions and trade restrictions on Chinese persons and companies, focusing on entities the US believes are involved in human rights violations, information technology and communications equipment and services, and miltary activities. In response, China has announced a number of sanctions and trade restrictions that target or provide authority to target foreign officials and companies, including those in the US.
The Hong Kong Autonomy Act passed by the US provides ‘secondary sanctions’ authority that allows for the imposition of US sanctions against non-US financial institutions found to be engaged in significant transactions with certain Chinese individuals and entities subject to US sanctions as a result of a US determination that these individuals or entities engaged in activities undermining Hong Kong’s autonomy. The US has also imposed restrictions on US persons’ ability to engage in transactions in or relating to publicly traded securities of a number of prominent Chinese companies. China has subsequently adopted regulations providing a framework for specific prohibitions against compliance with, and private rights of action for damages resulting from, measures that the government determines have an unjustified extraterritorial application that impairs Chinese sovereignty.
No penalties have yet been imposed against financial institutions under any of these measures, and their scope and application remain uncertain. These and any future measures that may be taken by the US and China may affect the Group, its customers, and the markets in which we operate.
It remains unclear the extent to which the new US administration will impact geopolitical tensions.
While UK-China relations have historically been shaped by strong trade and investment, there are also emerging challenges. Following the implementation of the Hong Kong National Security Law, the UK offered residency rights and a path to citizenship to eligible British National (Overseas) passport holders in Hong Kong. In addition, both the UK and Hong Kong governments have suspended their extradition treaties with each other.
China’s expanding data privacy and cybersecurity laws could pose potential challenges to intra-Group data sharing, especially within the Greater Bay Area (‘GBA’). China’s draft Personal Information Protection Law and Data Security Law, if passed in their current forms, could increase financial institutions’ compliance burdens in respect of cross-border
transfers of personal information. In Hong Kong, there is also an increasing focus by regulators on the use of big data and artificial intelligence. Use of personal data through digital platforms for GBA initiatives may need to take into account these evolving data privacy and cybersecurity obligations.
Most developed markets, including Hong Kong, are expected to recover from the COVID-19 crisis. However, permanent business closures and job losses in some sectors may prevent several developed markets from achieving pre-crisis growth rates or activity levels in the near term.
The contraction in the global economy during 2020 has had varying effects on our customers, with some of them experiencing financial difficulties. This has resulted in an increase in expected credit losses (‘ECL’) and risk-weighted assets (‘RWAs’) as explained further in Credit Risk section and Capital Management section.
Central banks have reduced interest rates in most financial markets due to the adverse impact on the timelines and the path for economic recovery from the COVID-19 outbreak, which has in turn increased the likelihood of negative interest rates. This raises a number of risks and concerns, such as the readiness of our systems and processes to accommodate zero or negative rates, the resulting impacts on customers, regulatory constraints and the financial implications given the significant impact that prolonged low interest rates have had, and may continue to have, on our net interest income. For some products, we have floored deposit rates at zero or made decisions not to charge negative rates. This, alongside loans repriced at lower rates, will result in our commercial margins being compressed, which is expected to be reflected in our profitability. The pricing of this risk will need to be carefully considered. These factors may challenge the long-term profitability of the banking sector, including ourselves.
We continually monitor the geopolitical developments and actively manage our credit portfolio through thematic reviews, internal stress tests, etc. We will continue to support our customers and manage risk and exposures as appropriate.
IBOR transition
Interbank offered rates (‘IBORs’) are used to set interest rates on hundreds of trillions of US dollars of different types of financial transactions and are used extensively for valuation purposes, risk measurement and performance benchmarking.
ANNUAL REPORT 2020 53
Management Discussion and Analysis
The UK’s Financial Conduct Authority (‘FCA’) announced in July 2017 that it will no longer persuade or require banks to submit rates for the London interbank offered rate (‘LIBOR’) after 2021. In addition, the 2016 EU Benchmark Regulation, which defines the minimum reliability standards for interest rate benchmarks, has resulted in other regulatory bodies’ reassessment of benchmarks. As a result, national working groups are actively discussing the mechanisms for an orderly transition of the five LIBOR currencies, the Euro Overnight Index Average (‘EONIA’), and the Singapore interbank offered rate (‘SIBOR’) to their chosen replacement rates.
As our IBOR transition programme progresses into the execution phase, resilience and operational risks, are heightened due to an expected increase in the number of new near risk-free rate (‘RFR’) products being rolled out, compressed timelines for transition of legacy IBOR contracts and the extensive systems and process changes required to facilitate both new products and transition. This is being exacerbated by the current interest rate environment where low LIBOR rates, in comparison with replacement RFR, could affect decisions to transition contracts early, further compressing transition timelines. Regulatory compliance, legal and conduct risks may also increase as a result of both the continued sale of products referencing IBORs, as well as the sale of new products referencing RFRs due to the lack of established market conventions.
Financial risks resulting from the discontinuation of IBORs and the development of RFR market liquidity will also affect the Group throughout transition. The differences in IBOR and RFR interest rates will create a basis risk that we need to actively manage through appropriate financial hedging. As contracts are transitioned from IBORs to RFRs, there is a risk that the associated financial hedges will not be aligned.
The continued orderly transition from IBORs continues to be the programme’s key objective throughout 2021 and can be broadly grouped into two streams of work: development of alternative rate product capabilities, and the transition of legacy contracts.
Development of alternative rate product capabilities
The Group have been developing system and operational capabilities for alternative rates products during 2020. Further product releases for Sterling Overnight Index Average (‘SONIA’) and Secured Overnight Financing Rate (‘SOFR’) in the first half of 2021, in addition to other LIBOR currencies through 2021. These developments have enabled the Group to cease selling certain IBOR-related products.
While IBOR sales do continue for a number of product lines, IBOR exposures that have post-2021 maturities are expected to be reduced as a result of transacting new activities in alternative RFR products as market liquidity builds.
Transition legacy contracts
In addition to offering new alternative rate based products, the development of new product capabilities will also help facilitates the transition of legacy IBOR products. Hang Seng has begun to engage clients to determine their ability to transition in line with the readiness of the alternative rate product availability. The COVID-19 outbreak and the interest rate environment may have affected the ability of clients to transition early and has resulted in compressed timelines for IBOR transition. However, this may be mitigated in part by the recent announcement by InterContinental Exchange Benchmark Administration (‘IBA’), the LIBOR Benchmark Administrator, to consult on extending the publication of most US dollar LIBOR setting (excluding one week and two month tenors) to enable the legacy US dollar book transition by 30 June 2023. Despite the proposed extension, regulatory and industry guidance has been clear that market participants should cease writing new US dollar LIBOR contracts as soon as is practicable, and in any event, by the end of 2021. While the extended deadline will result in additional US dollar LIBOR transactions maturing before cessation, not all of them will, hence it is possible that other proposed solutions, including legislative relief, will still be needed.
For the derivatives exposures, the adoption of the International Swaps and Derivatives Association (‘ISDA’) protocol, which comes into effect in the first quarter of 2021, and the successful changes made by clearing house to discount derivatives using in SOFR and Euro Short Term Rate (‘€STR’) reduce the risk of a disorderly transition of the derivative market.
For the Group’s loan book, our businesses have developed commercial strategies that include active client engagement and communication, providing detailed information on RFR products to assist our clients to transition to a suitable alternative rate or replacement RFR product before IBOR cessation.
HANG SENG BANK54
Risk
Mitigating actions
• We have put in place the IBOR transition programme to facilitate an orderly transition to replacement rates for our business and our clients, which is overseen by the Chief Risk Officer;
• We have and continue to carry out extensive training, communication and client engagement to facilitate appropriate selection of products, with dedicated teams in place to support the development of, and transition to, alternative rate and replacement RFR products;
• We are implementing IT and operational change to enable a longer transition window;
• We have met 2020 regulatory expectations for implementing relevant contractual language changes for loan products;
• We are targeting regulatory set and industry agreed milestones for the cessation of new standard LIBOR trades (sterling LIBOR in the first quarter of 2021, other LIBORs in the second quarter of 2021) leading to a reduction in the Group’s IBOR portfolio;
• We have assessed, monitored and are dynamically managing risks, and implemented specific mitigating controls as required;
• We continue to engage with regulatory and industry bodies actively to mitigate risks relating to hedge accounting changes, multiple loan conventions, and those contracts that have no appropriate replacements or no likelihood of renegotiation to transition (‘tough legacy’).
Financial instruments impacted by IBOR reform(audited)
Amendments to HKFRSs issued in October 2020 (Interest Rate Benchmark Reform Phase 2) represents the second phase of the project on the effects of interest rate benchmark reform, addressing issues affecting financial statements when changes are made to contractual cash flows and hedging relationships as a result of reform.
Under these amendments, changes made to a financial instrument that are economically equivalent and required by interest rate benchmark reform do not result in the derecognition or a change in the carrying amount of the financial instrument, but instead require the effective interest rate to be updated to reflect the change in the interest rate benchmark. In addition, hedge accounting will not be discontinued solely because of the replacement of the interest rate benchmark if the hedge meets other hedge accounting criteria.
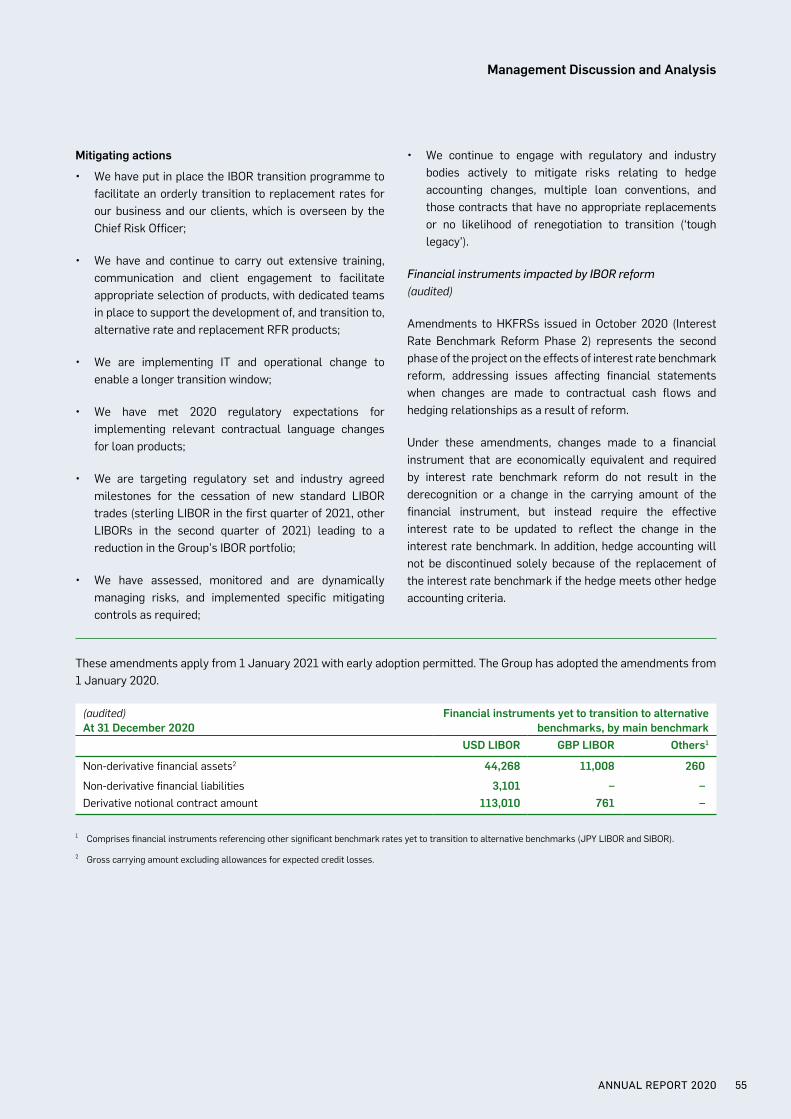
These amendments apply from 1 January 2021 with early adoption permitted. The Group has adopted the amendments from 1 January 2020.
(audited)At 31 December 2020
Financial instruments yet to transition to alternative benchmarks, by main benchmark
USD LIBOR GBP LIBOR Others1
Non-derivative financial assets2 44,268 11,008 260
Non-derivative financial liabilities 3,101 – –Derivative notional contract amount 113,010 761 –
1 Comprises financial instruments referencing other significant benchmark rates yet to transition to alternative benchmarks (JPY LIBOR and SIBOR).
2 Gross carrying amount excluding allowances for expected credit losses.
ANNUAL REPORT 2020 55
Management Discussion and Analysis
The amounts in the above table relate to the Group’s main operating entities and provide an indication of the extent of the Group’s exposure to the IBOR benchmarks which are due to be replaced. Amounts are in respect of financial instruments that:
• contractually reference an interest rate benchmark that is planned to transition to an alternative benchmark;
• have a contractually maturity date after 31 December 2021, the date by which LIBOR is expected to cease; and
• are recognised on the Group’s Consolidated Balance Sheet.
The administrator of LIBOR, IBA, has announced a proposal to extend the publication date of most USD LIBOR tenors until 30 June 2023. Publication of one week and two month tenors will cease after 31 December 2021. This proposal, if endorsed, would reduce the amounts presented in the above table as some financial instruments included will reach their contractual maturity date prior to 30 June 2023.
Risks related to COVID-19
The COVID-19 outbreak and its effect on the global economy have impacted our customers and our performance, and the future effects of the outbreak remain uncertain. The outbreak necessitated governments to respond at unprecedented levels to protect public health, local economies and livelihoods. It has affected countries at different times and to varying degrees as it has developed. The varying government support measures and restrictions in response have added challenges, given the rapid pace of change and significant operational demands. The speed at which countries and territories will be able to unwind the government support measures and restrictions and return to pre-COVID-19 economic levels will vary based on the levels of infection, local governmental decisions and access to and ability to roll out vaccines. There remains a risk of subsequent waves of infection. Renewed outbreaks emphasise the ongoing threat of COVID-19 even in countries that have recorded lower than average cases so far.
Government restrictions imposed around the world to limit the spread of COVID-19 resulted in a sharp contraction in global economic activity during 2020. At the same time, governments also took steps designed to soften the extent of the damage to investment, trade and labour markets. The rapidly increasing trend of local confirmed COVID-19 cases in Hong Kong since November 2020 would likely hit the pace of business recovery in Hong Kong as the Government has further tightened and prolonged the social distancing
measures. Gradual recovery in economic activity is expected in 2021, but this is contingent on the successful containment of the virus and the evolution of other top risks, including social unrest in Hong Kong and tensions between the US and China. It also relies on the willingness and ability of households and businesses to return towards pre-crisis spending levels.
Hong Kong Government has deployed extensive measures to support households and corporates. Measures implemented by Government have included income support to households and funding support to businesses. Some of these measures are being extended.
Apart from Government relief measures, we have initiated market-specific measures to support our personal and business customers through these challenging times, including principal moratorium, payment holidays, the waiver of certain fees and charges, etc. for businesses facing market uncertainty and short-term cash flow issue and for individuals facing salary reduction. These measures have been well received and we remain responsive to our customers’ changing needs.
The rapid introduction and varying nature of the Government support schemes, as well as customer expectations, can lead to risks as the Group implements large-scale changes in a short period of time. This has led to increased operational risks, including complex conduct considerations, increased reputational risk and increased risk of fraud. These risks are likely to be heightened further as and when those Government support schemes are unwound.
At 31 December 2020, our CET1 ratio was 16.8%, compared with 16.9% at 31 December 2019, and our liquidity coverage ratio (‘LCR’) was 230.4%. Our capital, funding and liquidity position is expected to help us to continue supporting our customers throughout the COVID-19 outbreak.
The COVID-19 outbreak has led to a weakening in GDP in Hong Kong, a key input used for calculating ECL, and there remains the risk of more adverse economic scenarios given its ongoing impact. Furthermore, ECL will also increase from other parts of our business impacted by the disruption to supply chains. The impact will vary by sectors of the economy. The impact of the outbreak on the long-term prospects of businesses in these sectors is uncertain and may lead to significant ECL charges on specific exposures, which may not be fully captured in ECL estimates. In addition, in times of crisis, fraudulent activity is often more prevalent, leading to potentially significant ECL charges or operational losses.
HANG SENG BANK56
Risk
The significant changes in economic and market drivers, customer behaviours and government actions caused by COVID-19 have also impacted the performance of financial models. HKFRS 9 model performance has been impacted over the course of 2020 which has increased reliance on management judgement in determining the appropriate level of ECL estimates. These models are driven by forecasts of economic factors such as GDP and unemployment. The significant volatility in these measures has impacted the reliability of the model outputs. In order to address the model limitations and performance issues, some key models have been enhanced. These models have been independently validated and assessed as having the ability to deliver reliable credit loss estimates, for reducing the reliance on management judgement. HKFRS 9 model redevelopment will continue as the economic consequences of the COVID-19 crisis become clearer over time as economic conditions normalise and actual credit losses occur.
As a result of COVID-19, business continuity plans have been successfully implemented and the majority of service level agreements have been maintained. We have not experienced any major impacts to the supply chains from our third-party
service providers due to COVID-19. The risk of damage or theft to our physical assets or criminal injury to our employees remains unchanged, with no significant incidents impacting our buildings or staff. Exceptional handling to ensure the continuity of critical customer services are being documented through governance.
There remain significant uncertainties in assessing the duration of the COVID-19 outbreak and its impact. The actions taken by the various governments and central banks, in particular in Hong Kong, mainland China, the US and the UK, provide an indication of the potential severity of the downturn and post-recovery environment, which from a commercial, regulatory and risk perspective could be significantly different to past crises and persist for a prolonged period. A prolonged period of significantly reduced economic activity as a result of the impact of the outbreak would have a materially adverse effect on our financial condition, results of operations, prospects, liquidity, capital position and credit ratings. We continue to monitor the situation closely, and given the novel or prolonged nature of the outbreak, additional mitigating actions may be required.
Our material banking and insurance risksThe material risk types associated with our banking and insurance manufacturing operations are described in the following tables.
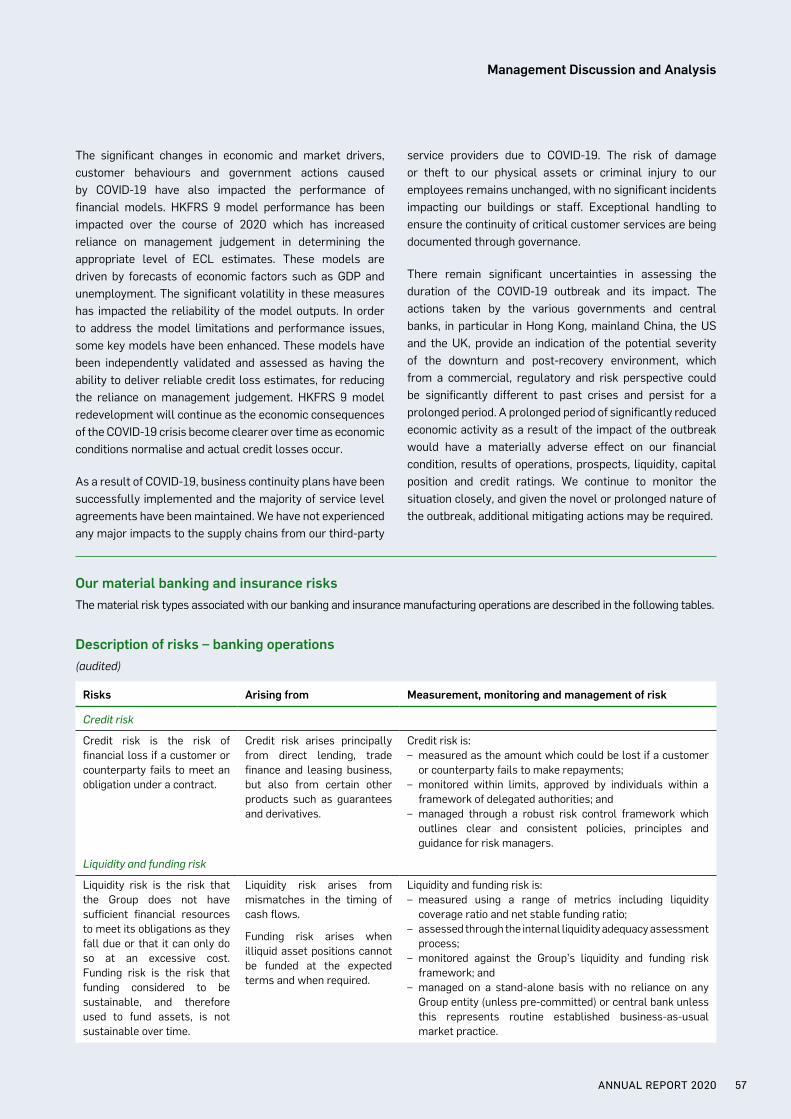
Description of risks – banking operations(audited)
Risks Arising from Measurement, monitoring and management of risk
Credit risk
Credit risk is the risk of financial loss if a customer or counterparty fails to meet an obligation under a contract.
Credit risk arises principally from direct lending, trade finance and leasing business, but also from certain other products such as guarantees and derivatives.
Credit risk is:– measured as the amount which could be lost if a customer
or counterparty fails to make repayments;– monitored within limits, approved by individuals within a
framework of delegated authorities; and– managed through a robust risk control framework which
outlines clear and consistent policies, principles and guidance for risk managers.
Liquidity and funding risk
Liquidity risk is the risk that the Group does not have sufficient financial resources to meet its obligations as they fall due or that it can only do so at an excessive cost. Funding risk is the risk that funding considered to be sustainable, and therefore used to fund assets, is not sustainable over time.
Liquidity risk arises from mismatches in the timing of cash flows.
Funding risk arises when illiquid asset positions cannot be funded at the expected terms and when required.
Liquidity and funding risk is:– measured using a range of metrics including liquidity
coverage ratio and net stable funding ratio;– assessed through the internal liquidity adequacy assessment
process;– monitored against the Group’s liquidity and funding risk
framework; and– managed on a stand-alone basis with no reliance on any
Group entity (unless pre-committed) or central bank unless this represents routine established business-as-usual market practice.
ANNUAL REPORT 2020 57
Management Discussion and Analysis
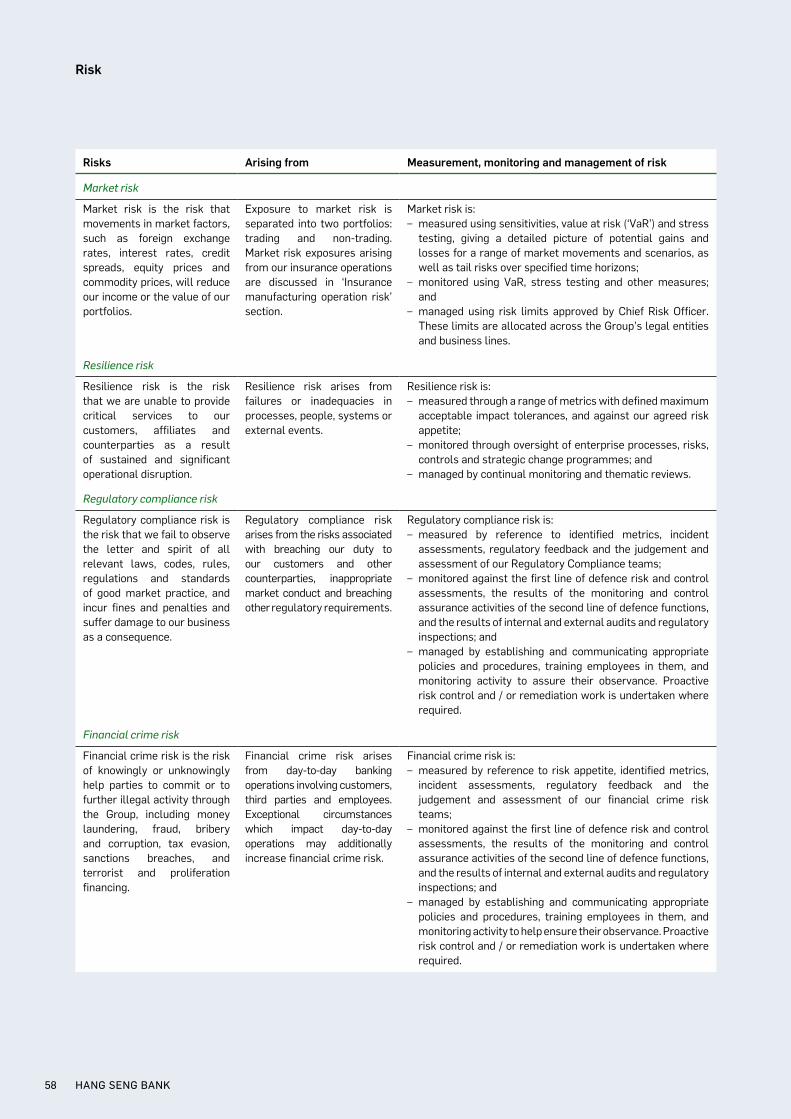
Risks Arising from Measurement, monitoring and management of risk
Market risk
Market risk is the risk that movements in market factors, such as foreign exchange rates, interest rates, credit spreads, equity prices and commodity prices, will reduce our income or the value of our portfolios.
Exposure to market risk is separated into two portfolios: trading and non-trading. Market risk exposures arising from our insurance operations are discussed in ‘Insurance manufacturing operation risk’ section.
Market risk is:– measured using sensitivities, value at risk (‘VaR’) and stress
testing, giving a detailed picture of potential gains and losses for a range of market movements and scenarios, as well as tail risks over specified time horizons;
– monitored using VaR, stress testing and other measures; and
– managed using risk limits approved by Chief Risk Officer. These limits are allocated across the Group’s legal entities and business lines.
Resilience risk
Resilience risk is the risk that we are unable to provide critical services to our customers, affiliates and counterparties as a result of sustained and significant operational disruption.
Resilience risk arises from failures or inadequacies in processes, people, systems or external events.
Resilience risk is:– measured through a range of metrics with defined maximum
acceptable impact tolerances, and against our agreed risk appetite;
– monitored through oversight of enterprise processes, risks, controls and strategic change programmes; and
– managed by continual monitoring and thematic reviews.
Regulatory compliance risk
Regulatory compliance risk is the risk that we fail to observe the letter and spirit of all relevant laws, codes, rules, regulations and standards of good market practice, and incur fines and penalties and suffer damage to our business as a consequence.
Regulatory compliance risk arises from the risks associated with breaching our duty to our customers and other counterparties, inappropriate market conduct and breaching other regulatory requirements.
Regulatory compliance risk is:– measured by reference to identified metrics, incident
assessments, regulatory feedback and the judgement and assessment of our Regulatory Compliance teams;
– monitored against the first line of defence risk and control assessments, the results of the monitoring and control assurance activities of the second line of defence functions, and the results of internal and external audits and regulatory inspections; and
– managed by establishing and communicating appropriate policies and procedures, training employees in them, and monitoring activity to assure their observance. Proactive risk control and / or remediation work is undertaken where required.
Financial crime risk
Financial crime risk is the risk of knowingly or unknowingly help parties to commit or to further illegal activity through the Group, including money laundering, fraud, bribery and corruption, tax evasion, sanctions breaches, and terrorist and proliferation financing.
Financial crime risk arises from day-to-day banking operations involving customers, third parties and employees. Exceptional circumstances which impact day-to-day operations may additionally increase financial crime risk.
Financial crime risk is:– measured by reference to risk appetite, identified metrics,
incident assessments, regulatory feedback and the judgement and assessment of our financial crime risk teams;
– monitored against the first line of defence risk and control assessments, the results of the monitoring and control assurance activities of the second line of defence functions, and the results of internal and external audits and regulatory inspections; and
– managed by establishing and communicating appropriate policies and procedures, training employees in them, and monitoring activity to help ensure their observance. Proactive risk control and / or remediation work is undertaken where required.
HANG SENG BANK58
Risk
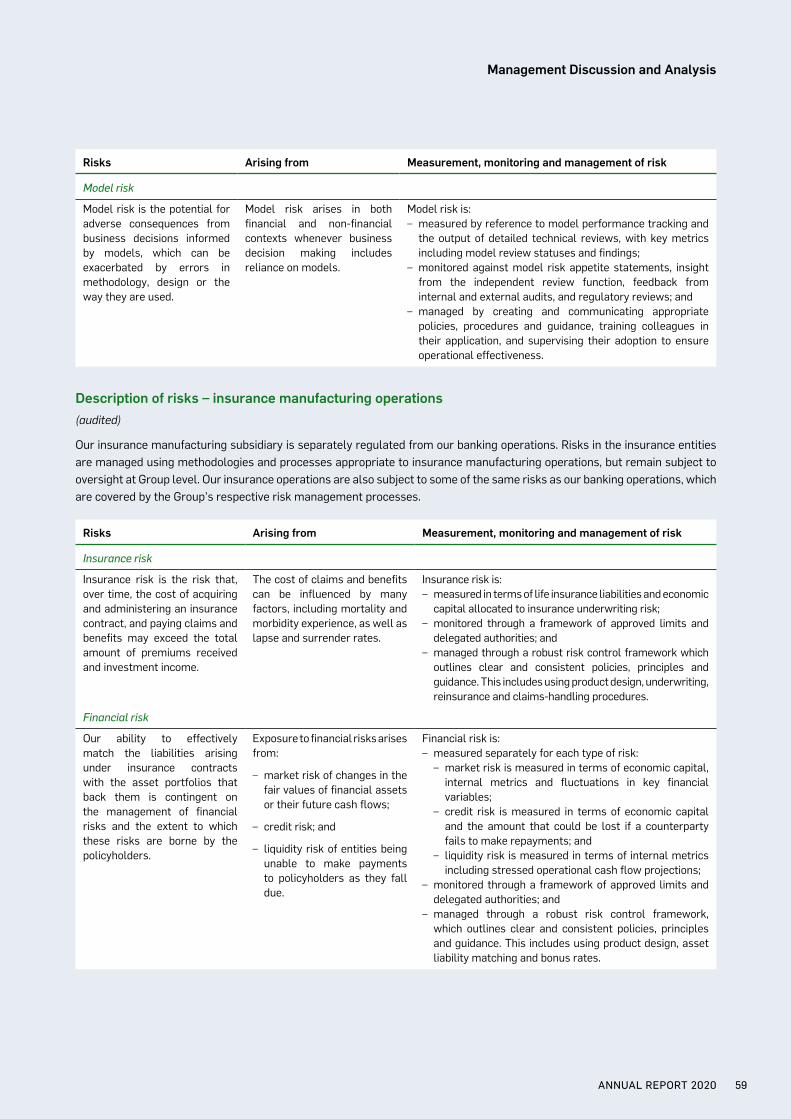
Risks Arising from Measurement, monitoring and management of risk
Model risk
Model risk is the potential for adverse consequences from business decisions informed by models, which can be exacerbated by errors in methodology, design or the way they are used.
Model risk arises in both financial and non-financial contexts whenever business decision making includes reliance on models.
Model risk is:– measured by reference to model performance tracking and
the output of detailed technical reviews, with key metrics including model review statuses and findings;
– monitored against model risk appetite statements, insight from the independent review function, feedback from internal and external audits, and regulatory reviews; and
– managed by creating and communicating appropriate policies, procedures and guidance, training colleagues in their application, and supervising their adoption to ensure operational effectiveness.
Description of risks – insurance manufacturing operations(audited)
Our insurance manufacturing subsidiary is separately regulated from our banking operations. Risks in the insurance entities are managed using methodologies and processes appropriate to insurance manufacturing operations, but remain subject to oversight at Group level. Our insurance operations are also subject to some of the same risks as our banking operations, which are covered by the Group’s respective risk management processes.
Risks Arising from Measurement, monitoring and management of risk
Insurance risk
Insurance risk is the risk that, over time, the cost of acquiring and administering an insurance contract, and paying claims and benefits may exceed the total amount of premiums received and investment income.
The cost of claims and benefits can be influenced by many factors, including mortality and morbidity experience, as well as lapse and surrender rates.
Insurance risk is:– measured in terms of life insurance liabilities and economic
capital allocated to insurance underwriting risk;– monitored through a framework of approved limits and
delegated authorities; and– managed through a robust risk control framework which
outlines clear and consistent policies, principles and guidance. This includes using product design, underwriting, reinsurance and claims-handling procedures.
Financial risk
Our ability to effectively match the liabilities arising under insurance contracts with the asset portfolios that back them is contingent on the management of financial risks and the extent to which these risks are borne by the policyholders.
Exposure to financial risks arises from:
– market risk of changes in the fair values of financial assets or their future cash flows;
– credit risk; and
– liquidity risk of entities being unable to make payments to policyholders as they fall due.
Financial risk is:– measured separately for each type of risk:
– market risk is measured in terms of economic capital, internal metrics and fluctuations in key financial variables;
– credit risk is measured in terms of economic capital and the amount that could be lost if a counterparty fails to make repayments; and
– liquidity risk is measured in terms of internal metrics including stressed operational cash flow projections;
– monitored through a framework of approved limits and delegated authorities; and
– managed through a robust risk control framework, which outlines clear and consistent policies, principles and guidance. This includes using product design, asset liability matching and bonus rates.
ANNUAL REPORT 2020 59
Management Discussion and Analysis
The following information describes the Group’s management and control of risks, in particular, those associated with its use of financial instruments (‘financial risks’). Major types of risks to which the Group is exposed include credit risk, liquidity risk, market risk and insurance risk.
(a) Credit Risk
OverviewCredit risk is the risk of financial loss if a customer or counterparty fails to meet an obligation under a contract. Credit risk arises principally from direct lending, trade finance and leasing business, but also from other products such as guarantees and credit derivatives.
Credit risk management(audited)
Key developments in 2020
There were no material changes to the policies and practices for the management of credit risk in 2020. We continued to apply the requirements of HKFRS 9 ‘Financial Instruments’ within Credit Risk.
Due to the unique market conditions in the COVID-19 outbreak, we expanded operational practices to provide short-term support to customers under the current policy framework.
Governance and structure
We have established credit risk management and related HKFRS 9 processes throughout the Group. We continue to actively assess the impact of economic developments on specific customers, customer segments or portfolios. As credit conditions change, we take mitigating action, including the revision of risk appetites or limits and tenors, as appropriate. In addition, we continue to evaluate the terms under which we provide credit facilities within the context of individual customer requirements, the quality of the relationship, local regulatory requirements, market practices and our local market position.
Credit risk sub-function
(audited)
With the delegation from the Board, credit approval authorities are delegated by the Executive Committee to the Chief Executive together with the authority to sub-delegate them. The Credit Risk sub-function is responsible for the key policies and processes for managing credit risk, which include formulating the Group’s credit policies and risk rating
frameworks, guiding the Group’s appetite for credit risk exposures, undertaking independent reviews and objective assessment of credit risk, and monitoring performance and management of portfolios.
The principal objectives of our credit risk management are:
• to maintain across the Group a strong culture of responsible lending, and robust risk policies and control frameworks;
• to both partner and challenge our businesses in defining, implementing and continually re-evaluating our risk appetite under actual and scenario conditions; and
• to ensure there is independent, expert scrutiny of credit risks, their costs and their mitigation.
Key risk management processes
HKFRS 9 ‘Financial Instruments’ process
The HKFRS 9 process comprises three main areas: modelling and data; implementation; and governance.
Modelling and data
We have established modelling and data processes in various geographies, which are subject to internal model risk governance including independent review of significant model developments.
Implementation
A centralised impairment engine performs the expected credit loss (‘ECL’) calculation using data, which is subject to a number of validation checks and enhancements, from a variety of client, finance and risk systems. Where possible, these checks and processes are performed in a globally consistent and centralised manner.
Governance
Management review forums are established in order to review and approve the impairment results. Management review forums have representatives from Credit Risk and Finance. The approvals are reported up to the Impairment Committee for final approval of the Group’s ECL for the period. Required members of the Impairment Committee are the heads of Wholesale Credit, Market Risk, and Wealth and Personal Banking Risk, as well as the Chief Financial Officer and the Chief Accounting Officer.
HANG SENG BANK60
Risk
(a) Credit Risk
Credit risk management continued
(audited)
Key risk management processes continued
Concentration of exposure
(audited)
Concentrations of credit risk arise when a number of counterparties or exposures have comparable economic characteristics, or such counterparties are engaged in similar activities or operate in the same geographical areas or industry sectors so that their collective ability to meet contractual obligations is uniformly affected by changes in economic, political or other conditions. We use a number of controls and measures to minimise undue concentration of exposure in our portfolios across industries, countries and businesses. These include portfolio and counterparty limits, approval and review controls, and stress testing.
Credit quality of financial instruments
(audited)
Our risk rating system facilitates the internal ratings-based approach under the Basel framework adopted by the Group to support the calculation of our minimum credit regulatory capital requirement.
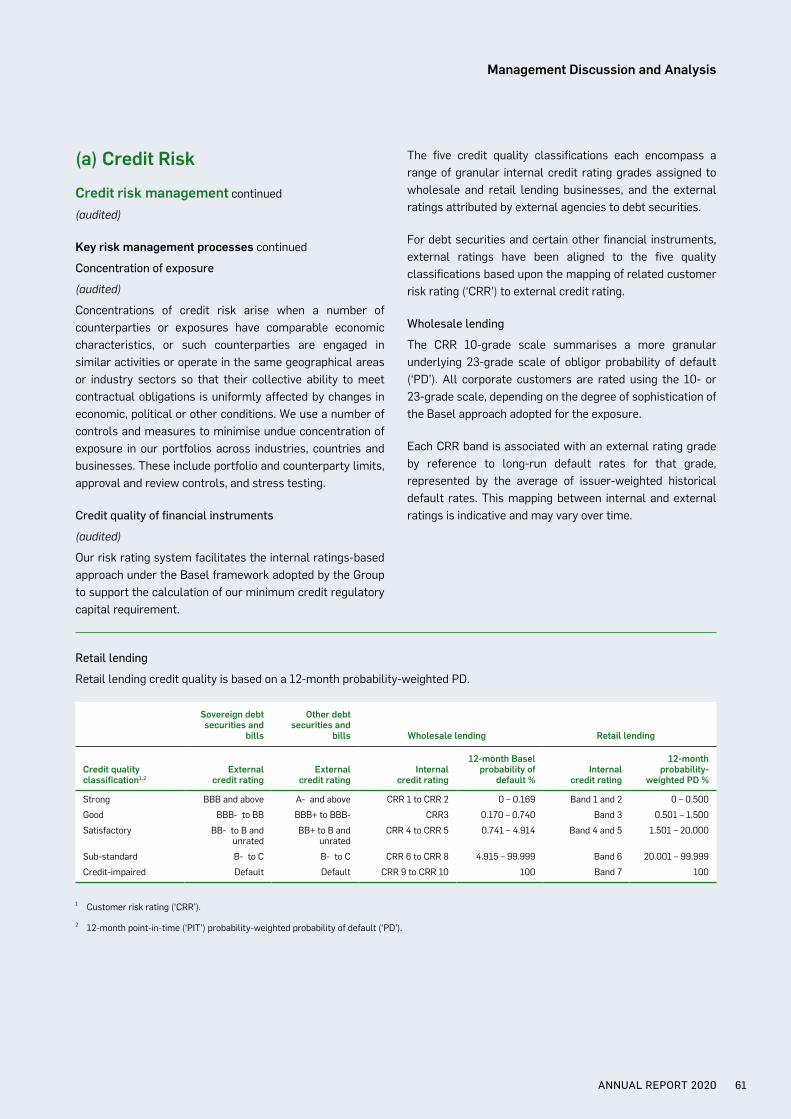
The five credit quality classifications each encompass a range of granular internal credit rating grades assigned to wholesale and retail lending businesses, and the external ratings attributed by external agencies to debt securities.
For debt securities and certain other financial instruments, external ratings have been aligned to the five quality classifications based upon the mapping of related customer risk rating (‘CRR’) to external credit rating.
Wholesale lending
The CRR 10-grade scale summarises a more granular underlying 23-grade scale of obligor probability of default (‘PD’). All corporate customers are rated using the 10- or 23-grade scale, depending on the degree of sophistication of the Basel approach adopted for the exposure.
Each CRR band is associated with an external rating grade by reference to long-run default rates for that grade, represented by the average of issuer-weighted historical default rates. This mapping between internal and external ratings is indicative and may vary over time.
Retail lending
Retail lending credit quality is based on a 12-month probability-weighted PD.
Sovereign debt securities and
bills
Other debt securities and
bills Wholesale lending Retail lending
Credit quality classification1,2
External credit rating
External credit rating
Internal credit rating
12-month Basel probability of
default % Internal
credit rating
12-month probability-
weighted PD %
Strong BBB and above A- and above CRR 1 to CRR 2 0 – 0.169 Band 1 and 2 0 – 0.500
Good BBB- to BB BBB+ to BBB- CRR3 0.170 – 0.740 Band 3 0.501 – 1.500
Satisfactory BB- to B and unrated
BB+ to B and unrated
CRR 4 to CRR 5 0.741 – 4.914 Band 4 and 5 1.501 – 20.000
Sub-standard B- to C B- to C CRR 6 to CRR 8 4.915 – 99.999 Band 6 20.001 – 99.999
Credit-impaired Default Default CRR 9 to CRR 10 100 Band 7 100
1 Customer risk rating (‘CRR’).
2 12-month point-in-time (‘PIT’) probability-weighted probability of default (‘PD’).
ANNUAL REPORT 2020 61
Management Discussion and Analysis
(a) Credit Risk
Credit risk management continued
(audited)
Key risk management processes continued
Quality classification definitions:
• Strong exposures demonstrate a strong capacity to meet financial commitments, with negligible or low probability of default and / or low levels of expected loss.
• Good exposures require closer monitoring and demonstrate a good capacity to meet financial commitments, with low default risk.
• Satisfactory exposures require closer monitoring and demonstrate an average-to-fair capacity to meet financial commitments, with moderate default risk.
• Sub-standard exposures require varying degrees of special attention and default risk is of greater concern.
• Credit-impaired exposures have been assessed as described on note 2(j) on the Consolidated Financial Statements.
Renegotiated loans and forbearance
(audited)
‘Forbearance’ describes concessions made on the contractual terms of a loan in response to an obligor’s financial difficulties.
A loan is classed as ‘renegotiated’ when we modify the contractual payment terms on concessionary terms because we have significant concerns about the borrowers’ ability to meet contractual payments when due.
Non-payment-related concessions (e.g. covenant waivers), while potential indicators of impairment, do not trigger identification as renegotiated loans.
Loans that have been identified as renegotiated retain this designation until maturity or derecognition.
For details of our policy on derecognised renegotiated loans, see note 2(j) on the Consolidated Financial Statements.
Credit quality of renegotiated loans
On execution of a renegotiation, the loan will also be classified as credit-impaired if it is not already so classified. In wholesale lending, all facilities with a customer, including
loans that have not been modified, are considered credit-impaired following the identification of a renegotiated loan.
Wholesale renegotiated loans are classified as credit-impaired until there is sufficient evidence to demonstrate a significant reduction in the risk of non-payment of future cash flows, observed over a minimum one-year period, and there are no other indicators of impairment. Personal renegotiated loans are deemed to remain credit-impaired until repayment or derecognition.
Renegotiated loans and recognition of expected credit losses
(audited)
For retail lending, unsecured renegotiated loans are generally segmented from other parts of the loan portfolio. Renegotiated expected credit loss assessments reflect the higher rates of losses typically encountered with renegotiated loans. For wholesale lending, renegotiated loans are typically assessed individually. Credit risk ratings are intrinsic to the impairment assessments. The individual impairment assessment takes into account the higher risk of the future non-payment inherent in renegotiated loans.
Impairment assessment
(audited)
For details of our impairment policies on loans and advances and financial investments, see note 2(j) on the Consolidated Financial Statements.
Write-off of loans and advances
(audited)
For details of our policy on the write-off of loans and advances, see note 2(j) on the Consolidated Financial Statements.
Unsecured personal facilities, including credit cards, are generally written off at 180 days contractually delinquent. Write-off periods may be earlier, e.g. bankruptcy.
For secured facilities, write-off should occur upon repossession of collateral, receipt of proceeds via settlement, or determination that recovery of the collateral will not be pursued.
Any secured assets maintained on the balance sheet beyond 60 months of consecutive delinquency-driven default require additional monitoring and review to assess the prospect of recovery.
HANG SENG BANK62
Risk
(a) Credit Risk
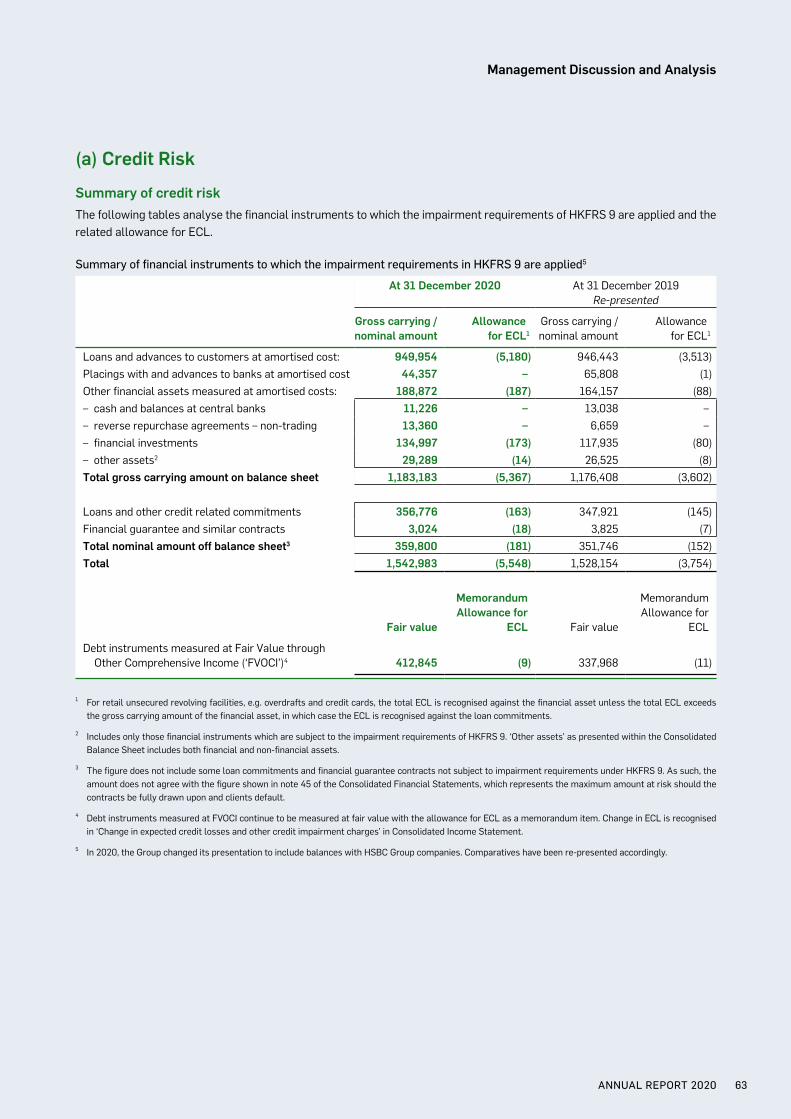
Summary of credit riskThe following tables analyse the financial instruments to which the impairment requirements of HKFRS 9 are applied and the related allowance for ECL.
Summary of financial instruments to which the impairment requirements in HKFRS 9 are applied5
At 31 December 2020 At 31 December 2019 Re-presented
Gross carrying / nominal amount
Allowancefor ECL1
Gross carrying / nominal amount
Allowancefor ECL1
Loans and advances to customers at amortised cost: 949,954 (5,180) 946,443 (3,513)Placings with and advances to banks at amortised cost 44,357 – 65,808 (1)Other financial assets measured at amortised costs: 188,872 (187) 164,157 (88)– cash and balances at central banks 11,226 – 13,038 –– reverse repurchase agreements – non-trading 13,360 – 6,659 –– financial investments 134,997 (173) 117,935 (80)– other assets2 29,289 (14) 26,525 (8)Total gross carrying amount on balance sheet 1,183,183 (5,367) 1,176,408 (3,602)
Loans and other credit related commitments 356,776 (163) 347,921 (145)Financial guarantee and similar contracts 3,024 (18) 3,825 (7)Total nominal amount off balance sheet3 359,800 (181) 351,746 (152)Total 1,542,983 (5,548) 1,528,154 (3,754)
Fair value
MemorandumAllowance for
ECL Fair value
MemorandumAllowance for
ECL
Debt instruments measured at Fair Value through Other Comprehensive Income (‘FVOCI’)4 412,845 (9) 337,968 (11)
1 For retail unsecured revolving facilities, e.g. overdrafts and credit cards, the total ECL is recognised against the financial asset unless the total ECL exceeds the gross carrying amount of the financial asset, in which case the ECL is recognised against the loan commitments.
2 Includes only those financial instruments which are subject to the impairment requirements of HKFRS 9. ‘Other assets’ as presented within the Consolidated Balance Sheet includes both financial and non-financial assets.
3 The figure does not include some loan commitments and financial guarantee contracts not subject to impairment requirements under HKFRS 9. As such, the amount does not agree with the figure shown in note 45 of the Consolidated Financial Statements, which represents the maximum amount at risk should the contracts be fully drawn upon and clients default.
4 Debt instruments measured at FVOCI continue to be measured at fair value with the allowance for ECL as a memorandum item. Change in ECL is recognised in ‘Change in expected credit losses and other credit impairment charges’ in Consolidated Income Statement.
5 In 2020, the Group changed its presentation to include balances with HSBC Group companies. Comparatives have been re-presented accordingly.
ANNUAL REPORT 2020 63
Management Discussion and Analysis
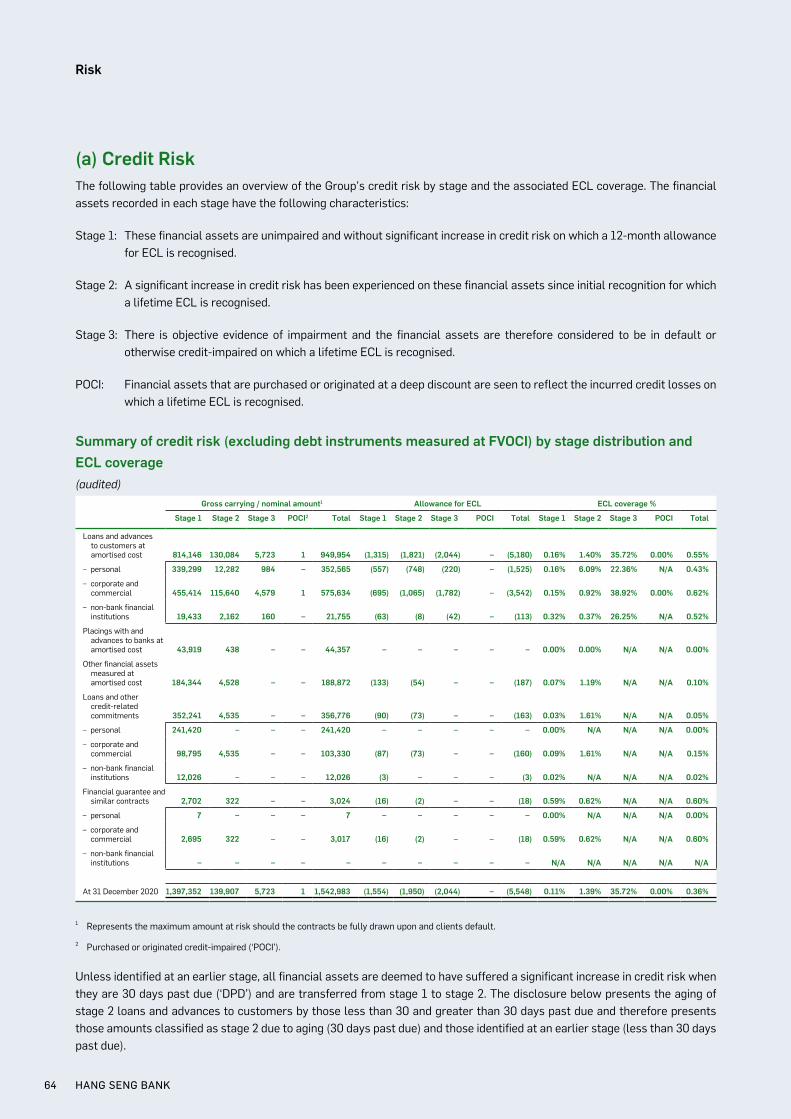
(a) Credit RiskThe following table provides an overview of the Group’s credit risk by stage and the associated ECL coverage. The financial assets recorded in each stage have the following characteristics:
Stage 1: These financial assets are unimpaired and without significant increase in credit risk on which a 12-month allowance for ECL is recognised.
Stage 2: A significant increase in credit risk has been experienced on these financial assets since initial recognition for which a lifetime ECL is recognised.
Stage 3: There is objective evidence of impairment and the financial assets are therefore considered to be in default or otherwise credit-impaired on which a lifetime ECL is recognised.
POCI: Financial assets that are purchased or originated at a deep discount are seen to reflect the incurred credit losses on which a lifetime ECL is recognised.
Summary of credit risk (excluding debt instruments measured at FVOCI) by stage distribution and ECL coverage(audited)
Gross carrying / nominal amount1 Allowance for ECL ECL coverage %
Stage 1 Stage 2 Stage 3 POCI2 Total Stage 1 Stage 2 Stage 3 POCI Total Stage 1 Stage 2 Stage 3 POCI Total
Loans and advances to customers at amortised cost 814,146 130,084 5,723 1 949,954 (1,315) (1,821) (2,044) – (5,180) 0.16% 1.40% 35.72% 0.00% 0.55%
– personal 339,299 12,282 984 – 352,565 (557) (748) (220) – (1,525) 0.16% 6.09% 22.36% N/A 0.43%
– corporate and commercial 455,414 115,640 4,579 1 575,634 (695) (1,065) (1,782) – (3,542) 0.15% 0.92% 38.92% 0.00% 0.62%
– non-bank financial institutions 19,433 2,162 160 – 21,755 (63) (8) (42) – (113) 0.32% 0.37% 26.25% N/A 0.52%
Placings with and advances to banks at amortised cost 43,919 438 – – 44,357 – – – – – 0.00% 0.00% N/A N/A 0.00%
Other financial assets measured at amortised cost 184,344 4,528 – – 188,872 (133) (54) – – (187) 0.07% 1.19% N/A N/A 0.10%
Loans and other credit-related commitments 352,241 4,535 – – 356,776 (90) (73) – – (163) 0.03% 1.61% N/A N/A 0.05%
– personal 241,420 – – – 241,420 – – – – – 0.00% N/A N/A N/A 0.00%
– corporate and commercial 98,795 4,535 – – 103,330 (87) (73) – – (160) 0.09% 1.61% N/A N/A 0.15%
– non-bank financial institutions 12,026 – – – 12,026 (3) – – – (3) 0.02% N/A N/A N/A 0.02%
Financial guarantee and similar contracts 2,702 322 – – 3,024 (16) (2) – – (18) 0.59% 0.62% N/A N/A 0.60%
– personal 7 – – – 7 – – – – – 0.00% N/A N/A N/A 0.00%
– corporate and commercial 2,695 322 – – 3,017 (16) (2) – – (18) 0.59% 0.62% N/A N/A 0.60%
– non-bank financial institutions – – – – – – – – – – N/A N/A N/A N/A N/A
At 31 December 2020 1,397,352 139,907 5,723 1 1,542,983 (1,554) (1,950) (2,044) – (5,548) 0.11% 1.39% 35.72% 0.00% 0.36%
1 Represents the maximum amount at risk should the contracts be fully drawn upon and clients default.
2 Purchased or originated credit-impaired (‘POCI’).
Unless identified at an earlier stage, all financial assets are deemed to have suffered a significant increase in credit risk when they are 30 days past due (‘DPD’) and are transferred from stage 1 to stage 2. The disclosure below presents the aging of stage 2 loans and advances to customers by those less than 30 and greater than 30 days past due and therefore presents those amounts classified as stage 2 due to aging (30 days past due) and those identified at an earlier stage (less than 30 days past due).
HANG SENG BANK64
Risk
(a) Credit Risk
Summary of credit risk (excluding debt instruments measured at FVOCI) by stage distribution and ECL coverage continued
(audited)
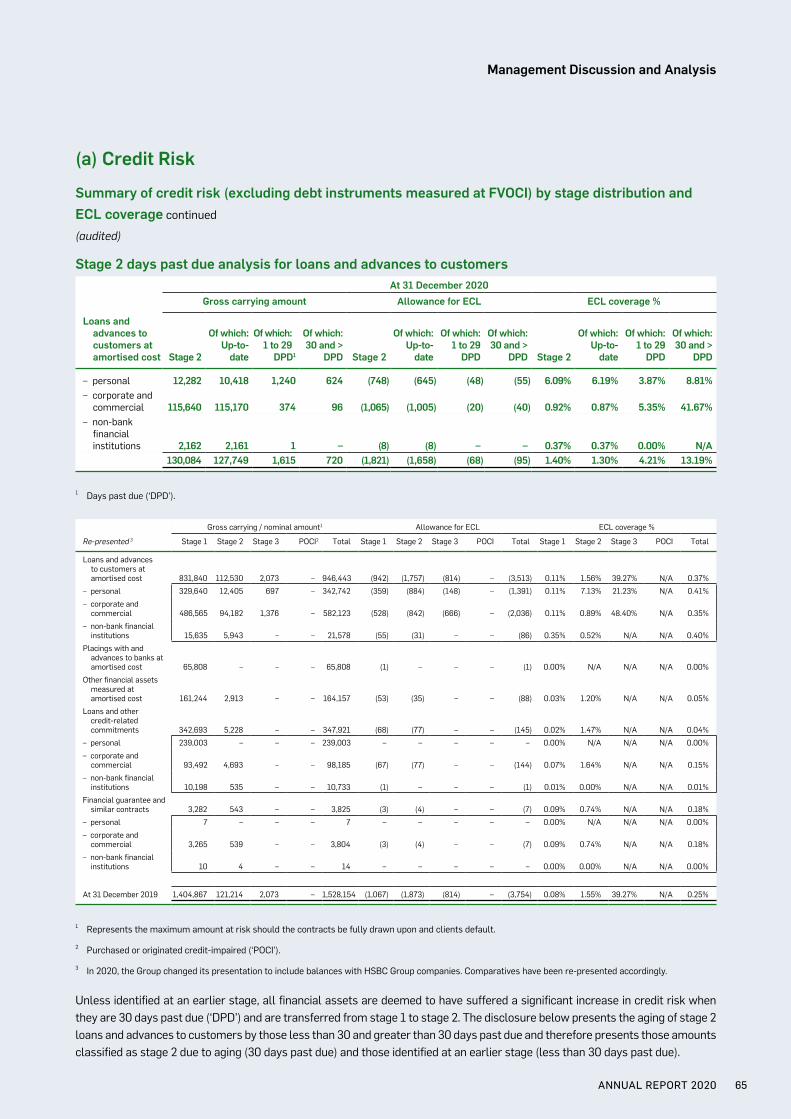
Stage 2 days past due analysis for loans and advances to customers At 31 December 2020
Gross carrying amount Allowance for ECL ECL coverage %
Loans and advances to customers at amortised cost Stage 2
Of which: Up-to-
date
Of which: 1 to 29
DPD1
Of which: 30 and >
DPD Stage 2
Of which: Up-to-
date
Of which: 1 to 29
DPD
Of which: 30 and >
DPD Stage 2
Of which: Up-to-
date
Of which: 1 to 29
DPD
Of which: 30 and >
DPD
– personal 12,282 10,418 1,240 624 (748) (645) (48) (55) 6.09% 6.19% 3.87% 8.81%– corporate and commercial 115,640 115,170 374 96 (1,065) (1,005) (20) (40) 0.92% 0.87% 5.35% 41.67%– non-bank financial institutions 2,162 2,161 1 – (8) (8) – – 0.37% 0.37% 0.00% N/A
130,084 127,749 1,615 720 (1,821) (1,658) (68) (95) 1.40% 1.30% 4.21% 13.19%
1 Days past due (‘DPD’).
Gross carrying / nominal amount1 Allowance for ECL ECL coverage %
Re-presented 3 Stage 1 Stage 2 Stage 3 POCI2 Total Stage 1 Stage 2 Stage 3 POCI Total Stage 1 Stage 2 Stage 3 POCI Total
Loans and advances to customers at amortised cost 831,840 112,530 2,073 – 946,443 (942) (1,757) (814) – (3,513) 0.11% 1.56% 39.27% N/A 0.37%
– personal 329,640 12,405 697 – 342,742 (359) (884) (148) – (1,391) 0.11% 7.13% 21.23% N/A 0.41%
– corporate and commercial 486,565 94,182 1,376 – 582,123 (528) (842) (666) – (2,036) 0.11% 0.89% 48.40% N/A 0.35%
– non-bank financial institutions 15,635 5,943 – – 21,578 (55) (31) – – (86) 0.35% 0.52% N/A N/A 0.40%
Placings with and advances to banks at amortised cost 65,808 – – – 65,808 (1) – – – (1) 0.00% N/A N/A N/A 0.00%
Other financial assets measured at amortised cost 161,244 2,913 – – 164,157 (53) (35) – – (88) 0.03% 1.20% N/A N/A 0.05%
Loans and other credit-related commitments 342,693 5,228 – – 347,921 (68) (77) – – (145) 0.02% 1.47% N/A N/A 0.04%
– personal 239,003 – – – 239,003 – – – – – 0.00% N/A N/A N/A 0.00%
– corporate and commercial 93,492 4,693 – – 98,185 (67) (77) – – (144) 0.07% 1.64% N/A N/A 0.15%
– non-bank financial institutions 10,198 535 – – 10,733 (1) – – – (1) 0.01% 0.00% N/A N/A 0.01%
Financial guarantee and similar contracts 3,282 543 – – 3,825 (3) (4) – – (7) 0.09% 0.74% N/A N/A 0.18%
– personal 7 – – – 7 – – – – – 0.00% N/A N/A N/A 0.00%
– corporate and commercial 3,265 539 – – 3,804 (3) (4) – – (7) 0.09% 0.74% N/A N/A 0.18%
– non-bank financial institutions 10 4 – – 14 – – – – – 0.00% 0.00% N/A N/A 0.00%
At 31 December 2019 1,404,867 121,214 2,073 – 1,528,154 (1,067) (1,873) (814) – (3,754) 0.08% 1.55% 39.27% N/A 0.25%
1 Represents the maximum amount at risk should the contracts be fully drawn upon and clients default.
2 Purchased or originated credit-impaired (‘POCI’).
3 In 2020, the Group changed its presentation to include balances with HSBC Group companies. Comparatives have been re-presented accordingly.
Unless identified at an earlier stage, all financial assets are deemed to have suffered a significant increase in credit risk when they are 30 days past due (‘DPD’) and are transferred from stage 1 to stage 2. The disclosure below presents the aging of stage 2 loans and advances to customers by those less than 30 and greater than 30 days past due and therefore presents those amounts classified as stage 2 due to aging (30 days past due) and those identified at an earlier stage (less than 30 days past due).
ANNUAL REPORT 2020 65
Management Discussion and Analysis
(a) Credit Risk
Summary of credit risk (excluding debt instruments measured at FVOCI) by stage distribution and ECL coverage continued
(audited)
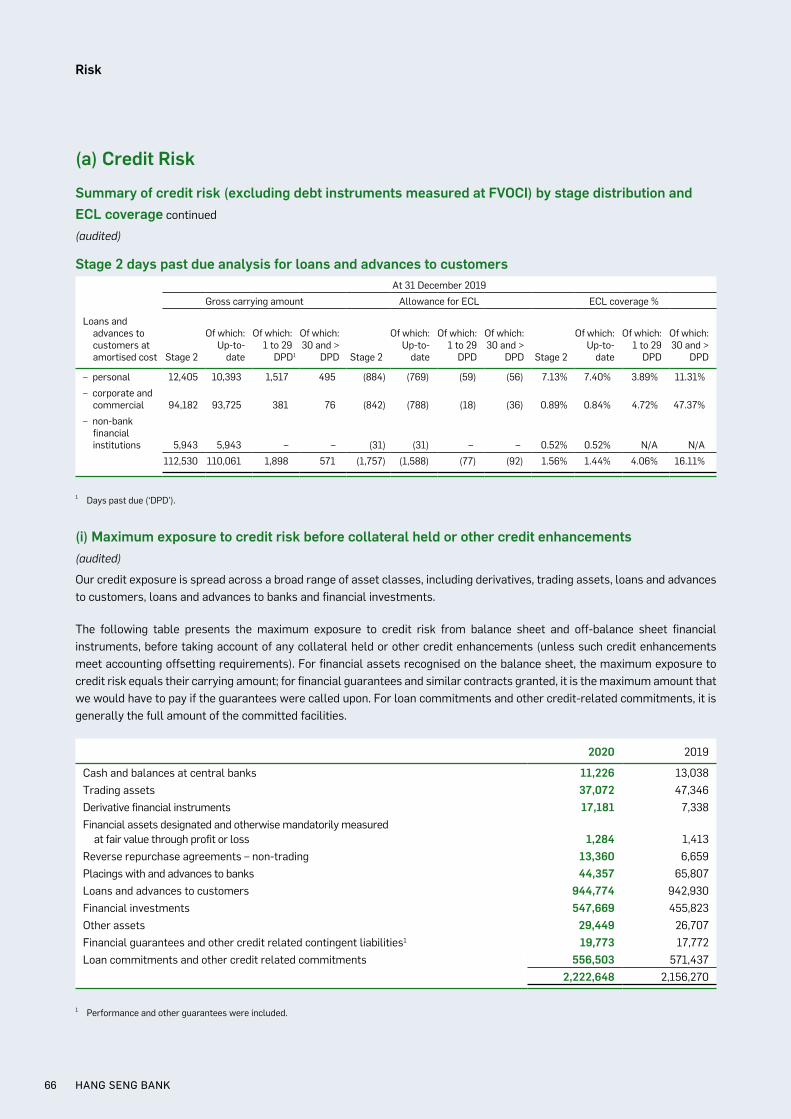
Stage 2 days past due analysis for loans and advances to customersAt 31 December 2019
Gross carrying amount Allowance for ECL ECL coverage %
Loans and advances to customers at amortised cost Stage 2
Of which: Up-to-
date
Of which: 1 to 29
DPD1
Of which: 30 and >
DPD Stage 2
Of which: Up-to-
date
Of which: 1 to 29
DPD
Of which: 30 and >
DPD Stage 2
Of which: Up-to-
date
Of which: 1 to 29
DPD
Of which: 30 and >
DPD
– personal 12,405 10,393 1,517 495 (884) (769) (59) (56) 7.13% 7.40% 3.89% 11.31%
– corporate and commercial 94,182 93,725 381 76 (842) (788) (18) (36) 0.89% 0.84% 4.72% 47.37%
– non-bank financial institutions 5,943 5,943 – – (31) (31) – – 0.52% 0.52% N/A N/A
112,530 110,061 1,898 571 (1,757) (1,588) (77) (92) 1.56% 1.44% 4.06% 16.11%
1 Days past due (‘DPD’).
(i) Maximum exposure to credit risk before collateral held or other credit enhancements(audited)
Our credit exposure is spread across a broad range of asset classes, including derivatives, trading assets, loans and advances to customers, loans and advances to banks and financial investments.
The following table presents the maximum exposure to credit risk from balance sheet and off-balance sheet financial instruments, before taking account of any collateral held or other credit enhancements (unless such credit enhancements meet accounting offsetting requirements). For financial assets recognised on the balance sheet, the maximum exposure to credit risk equals their carrying amount; for financial guarantees and similar contracts granted, it is the maximum amount that we would have to pay if the guarantees were called upon. For loan commitments and other credit-related commitments, it is generally the full amount of the committed facilities.
2020 2019
Cash and balances at central banks 11,226 13,038Trading assets 37,072 47,346Derivative financial instruments 17,181 7,338Financial assets designated and otherwise mandatorily measured at fair value through profit or loss 1,284 1,413Reverse repurchase agreements – non-trading 13,360 6,659Placings with and advances to banks 44,357 65,807Loans and advances to customers 944,774 942,930Financial investments 547,669 455,823Other assets 29,449 26,707Financial guarantees and other credit related contingent liabilities1 19,773 17,772Loan commitments and other credit related commitments 556,503 571,437
2,222,648 2,156,270
1 Performance and other guarantees were included.
HANG SENG BANK66
Risk
(a) Credit Risk
(ii) Measurement uncertainty and sensitivity analysis of ECL estimates(audited)
The recognition and measurement of ECL involves the use of significant judgement and estimation. We form multiple economic scenarios based on economic forecasts, apply these assumptions to credit risk models to estimate future credit losses, and probability-weight the results to determine an unbiased ECL estimate.
Methodology
Four economic scenarios have been used to capture the exceptional nature of the current economic environment and to articulate management’s view of the range of potential outcomes. Scenarios produced to calculate ECL are aligned to the Group’s Top and Emerging Risks. Three of these scenarios are drawn from consensus forecasts and distributional estimates. These include a central scenario, representing a most likely outcome, a downside and an upside scenario that represent meaningfully different outcomes from the central. The central scenario is created using the average of a panel of external forecasters (‘the consensus’) while consensus upside and downside scenarios are created with reference to distributions for selected markets that capture forecasters’ views of the entire range of outcomes. Management have chosen to use a fourth scenario to represent their view of severe downside risks. The use of an additional scenario is in line with the HSBC’s forward economic guidance (‘FEG’) methodology and has been regularly used over the course of 2020. Management may include additional scenarios if they feel that the consensus scenarios do not adequately capture the Top and Emerging Risks. Unlike the consensus scenarios, these additional scenarios are driven by narrative assumptions, could be country-specific and may result in shocks that drive economic activity permanently away from trend.
Description of Consensus Economic Scenarios
The economic assumptions presented in this section have been formed internally with reference to external forecasts specifically for the purpose of calculating ECL.
The world economy experienced a deep economic shock in 2020. As COVID-19 spread globally, governments in many of our markets sought to limit the human impact by imposing significant restrictions on mobility, in turn driving the deep falls in activity that were observed in the first half of the year. Restrictions were eased as cases declined in response to the initial measures which in turn supported an initial rebound in economic activity by 3Q 2020. This increase in mobility unfortunately led to renewed transmission of the virus in several countries, such that by year end, infection rates, hospitalisations and deaths had reached dangerously high levels, placing an enormous burden on health-care systems and leading governments to re-impose restrictions on mobility and causing economic activity to decline once more.
Economic forecasts are subject to a high degree of uncertainty in the current environment. Limitations of forecasts and economic models require a greater reliance on management judgement in addressing both the error inherent in economic forecasts and in assessing associated ECL outcomes. The scenarios used to calculate ECL in the Annual Report 2020 are described below.
The consensus Central scenario
The Central scenario features an improvement in economic growth in 2021 as activity and employment gradually return to the levels experienced prior to the outbreak of COVID-19.
Despite the sharp contraction in activity, government fiscal support in advanced economies played a crucial role in averting significant financial distress. At the same time, the HKMA included implementing emergency support measures for funding markets, and either restarting or increasing quantitative easing programs in order to support economies and the financial system. The Government is expected to continue to ensure that households and firms receive an appropriate level of financial support until restrictions on economic activity and mobility can be materially eased. Such support will ensure that labour and housing markets do not experience abrupt, negative corrections and will also limit the extent of long term structural damage to economies.
Differences across markets in the speed and scale of economic recovery in the Central scenario reflect timing differences in the progression of the COVID-19 outbreak, national level differences in restrictions imposed, the coverage achieved by vaccination programmes and the scale of support measures.
ANNUAL REPORT 2020 67
Management Discussion and Analysis
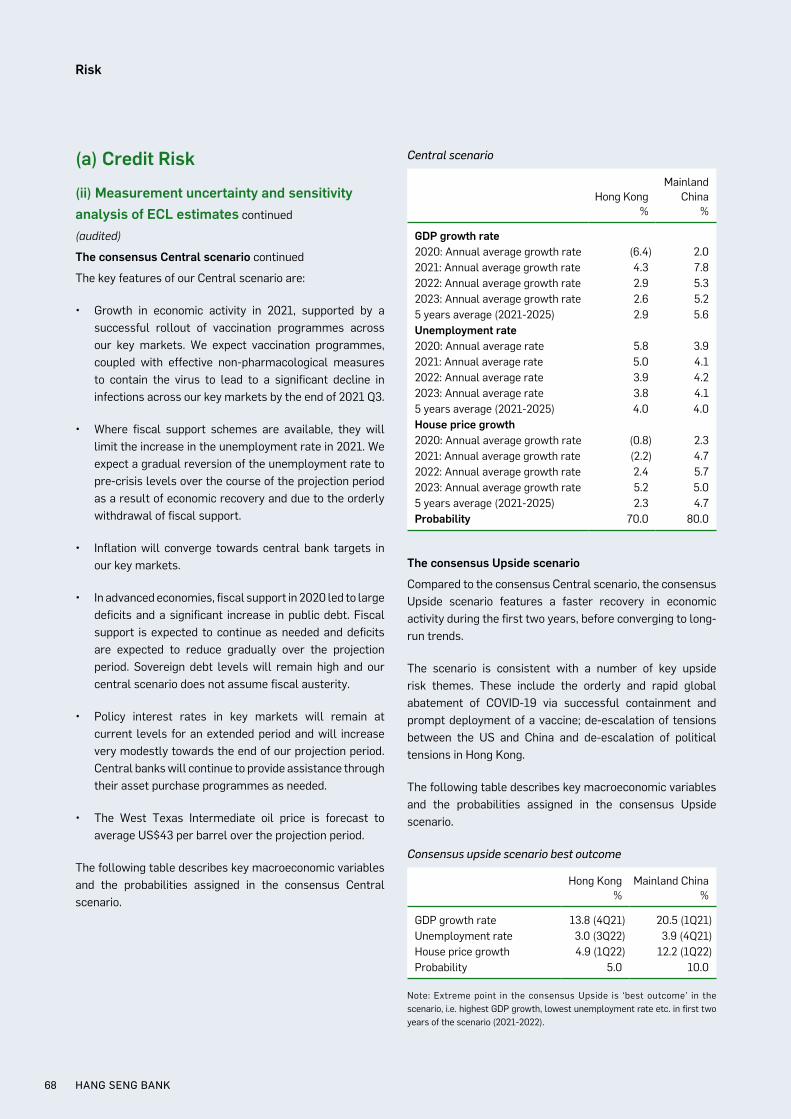
(a) Credit Risk
(ii) Measurement uncertainty and sensitivity analysis of ECL estimates continued
(audited)
The consensus Central scenario continued
The key features of our Central scenario are:
• Growth in economic activity in 2021, supported by a successful rollout of vaccination programmes across our key markets. We expect vaccination programmes, coupled with effective non-pharmacological measures to contain the virus to lead to a significant decline in infections across our key markets by the end of 2021 Q3.
• Where fiscal support schemes are available, they will limit the increase in the unemployment rate in 2021. We expect a gradual reversion of the unemployment rate to pre-crisis levels over the course of the projection period as a result of economic recovery and due to the orderly withdrawal of fiscal support.
• Inflation will converge towards central bank targets in our key markets.
• In advanced economies, fiscal support in 2020 led to large deficits and a significant increase in public debt. Fiscal support is expected to continue as needed and deficits are expected to reduce gradually over the projection period. Sovereign debt levels will remain high and our central scenario does not assume fiscal austerity.
• Policy interest rates in key markets will remain at current levels for an extended period and will increase very modestly towards the end of our projection period. Central banks will continue to provide assistance through their asset purchase programmes as needed.
• The West Texas Intermediate oil price is forecast to average US$43 per barrel over the projection period.
The following table describes key macroeconomic variables and the probabilities assigned in the consensus Central scenario.
Central scenario
Hong Kong%
Mainland China
%
GDP growth rate2020: Annual average growth rate (6.4) 2.02021: Annual average growth rate 4.3 7.82022: Annual average growth rate 2.9 5.32023: Annual average growth rate 2.6 5.25 years average (2021-2025) 2.9 5.6Unemployment rate2020: Annual average rate 5.8 3.92021: Annual average rate 5.0 4.12022: Annual average rate 3.9 4.22023: Annual average rate 3.8 4.15 years average (2021-2025) 4.0 4.0House price growth2020: Annual average growth rate (0.8) 2.32021: Annual average growth rate (2.2) 4.72022: Annual average growth rate 2.4 5.72023: Annual average growth rate 5.2 5.05 years average (2021-2025) 2.3 4.7Probability 70.0 80.0
The consensus Upside scenario
Compared to the consensus Central scenario, the consensus Upside scenario features a faster recovery in economic activity during the first two years, before converging to long-run trends.
The scenario is consistent with a number of key upside risk themes. These include the orderly and rapid global abatement of COVID-19 via successful containment and prompt deployment of a vaccine; de-escalation of tensions between the US and China and de-escalation of political tensions in Hong Kong.
The following table describes key macroeconomic variables and the probabilities assigned in the consensus Upside scenario.
Consensus upside scenario best outcome
Hong Kong%
Mainland China%
GDP growth rate 13.8 (4Q21) 20.5 (1Q21)Unemployment rate 3.0 (3Q22) 3.9 (4Q21)House price growth 4.9 (1Q22) 12.2 (1Q22)Probability 5.0 10.0
Note: Extreme point in the consensus Upside is ‘best outcome’ in the scenario, i.e. highest GDP growth, lowest unemployment rate etc. in first two years of the scenario (2021-2022).
HANG SENG BANK68
Risk
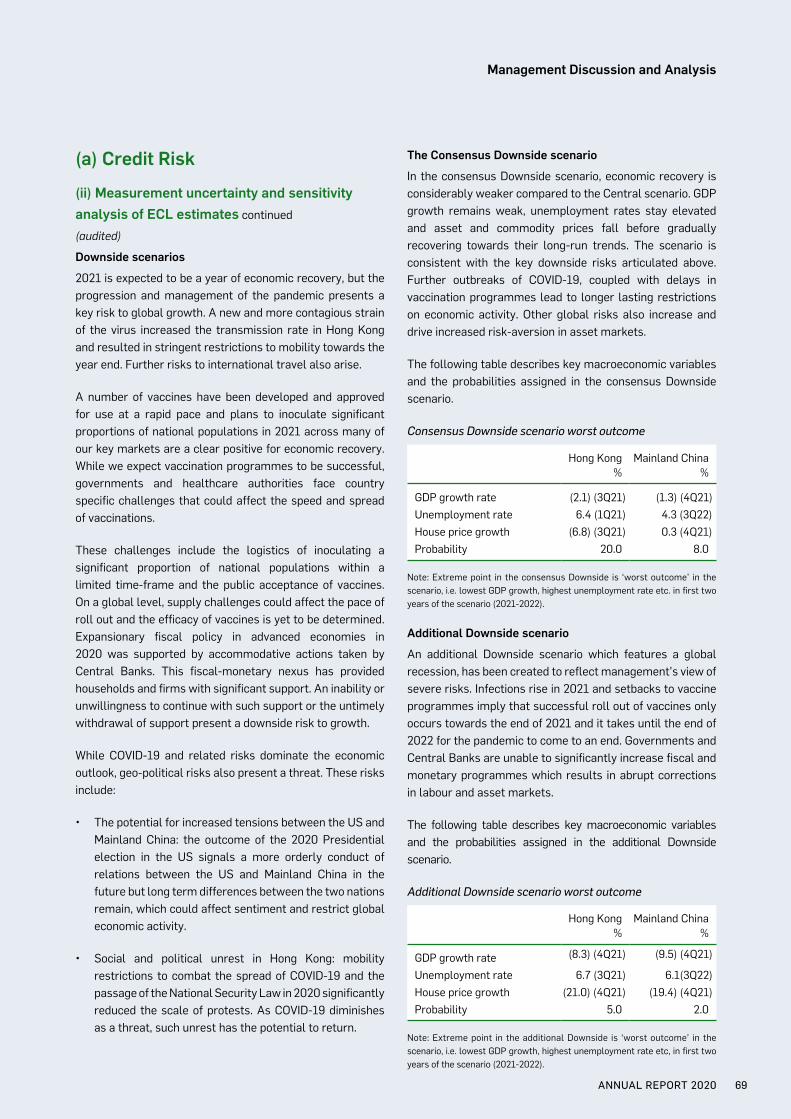
(a) Credit Risk
(ii) Measurement uncertainty and sensitivity analysis of ECL estimates continued
(audited)
Downside scenarios
2021 is expected to be a year of economic recovery, but the progression and management of the pandemic presents a key risk to global growth. A new and more contagious strain of the virus increased the transmission rate in Hong Kong and resulted in stringent restrictions to mobility towards the year end. Further risks to international travel also arise.
A number of vaccines have been developed and approved for use at a rapid pace and plans to inoculate significant proportions of national populations in 2021 across many of our key markets are a clear positive for economic recovery. While we expect vaccination programmes to be successful, governments and healthcare authorities face country specific challenges that could affect the speed and spread of vaccinations.
These challenges include the logistics of inoculating a significant proportion of national populations within a limited time-frame and the public acceptance of vaccines. On a global level, supply challenges could affect the pace of roll out and the efficacy of vaccines is yet to be determined. Expansionary fiscal policy in advanced economies in 2020 was supported by accommodative actions taken by Central Banks. This fiscal-monetary nexus has provided households and firms with significant support. An inability or unwillingness to continue with such support or the untimely withdrawal of support present a downside risk to growth.
While COVID-19 and related risks dominate the economic outlook, geo-political risks also present a threat. These risks include:
• The potential for increased tensions between the US and Mainland China: the outcome of the 2020 Presidential election in the US signals a more orderly conduct of relations between the US and Mainland China in the future but long term differences between the two nations remain, which could affect sentiment and restrict global economic activity.
• Social and political unrest in Hong Kong: mobility restrictions to combat the spread of COVID-19 and the passage of the National Security Law in 2020 significantly reduced the scale of protests. As COVID-19 diminishes as a threat, such unrest has the potential to return.
The Consensus Downside scenario
In the consensus Downside scenario, economic recovery is considerably weaker compared to the Central scenario. GDP growth remains weak, unemployment rates stay elevated and asset and commodity prices fall before gradually recovering towards their long-run trends. The scenario is consistent with the key downside risks articulated above. Further outbreaks of COVID-19, coupled with delays in vaccination programmes lead to longer lasting restrictions on economic activity. Other global risks also increase and drive increased risk-aversion in asset markets.
The following table describes key macroeconomic variables and the probabilities assigned in the consensus Downside scenario.
Consensus Downside scenario worst outcome
Hong Kong%
Mainland China%
GDP growth rate (2.1) (3Q21) (1.3) (4Q21)Unemployment rate 6.4 (1Q21) 4.3 (3Q22)House price growth (6.8) (3Q21) 0.3 (4Q21)Probability 20.0 8.0
Note: Extreme point in the consensus Downside is ‘worst outcome’ in the scenario, i.e. lowest GDP growth, highest unemployment rate etc. in first two years of the scenario (2021-2022).
Additional Downside scenario
An additional Downside scenario which features a global recession, has been created to reflect management’s view of severe risks. Infections rise in 2021 and setbacks to vaccine programmes imply that successful roll out of vaccines only occurs towards the end of 2021 and it takes until the end of 2022 for the pandemic to come to an end. Governments and Central Banks are unable to significantly increase fiscal and monetary programmes which results in abrupt corrections in labour and asset markets.
The following table describes key macroeconomic variables and the probabilities assigned in the additional Downside scenario.
Additional Downside scenario worst outcome
Hong Kong%
Mainland China%
GDP growth rate (8.3) (4Q21) (9.5) (4Q21)
Unemployment rate 6.7 (3Q21) 6.1(3Q22)House price growth (21.0) (4Q21) (19.4) (4Q21)Probability 5.0 2.0
Note: Extreme point in the additional Downside is ‘worst outcome’ in the scenario, i.e. lowest GDP growth, highest unemployment rate etc, in first two years of the scenario (2021-2022).
ANNUAL REPORT 2020 69
Management Discussion and Analysis
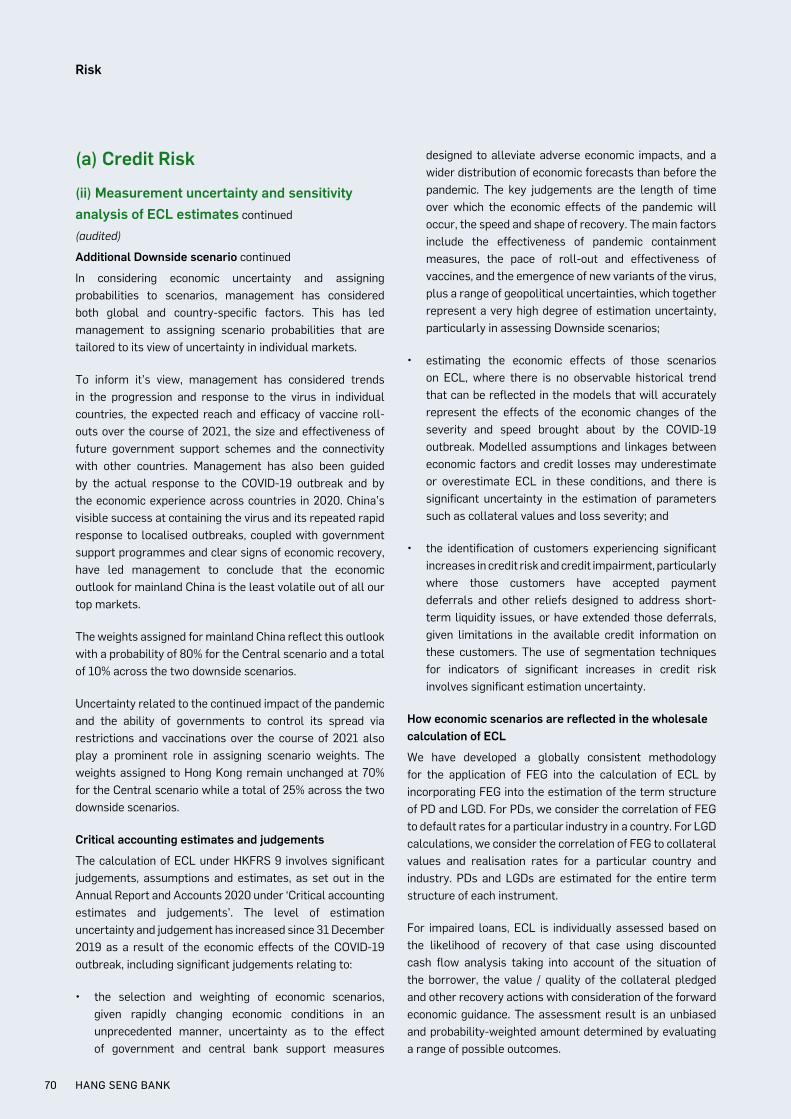
(a) Credit Risk
(ii) Measurement uncertainty and sensitivity analysis of ECL estimates continued
(audited)
Additional Downside scenario continued
In considering economic uncertainty and assigning probabilities to scenarios, management has considered both global and country-specific factors. This has led management to assigning scenario probabilities that are tailored to its view of uncertainty in individual markets.
To inform it’s view, management has considered trends in the progression and response to the virus in individual countries, the expected reach and efficacy of vaccine roll-outs over the course of 2021, the size and effectiveness of future government support schemes and the connectivity with other countries. Management has also been guided by the actual response to the COVID-19 outbreak and by the economic experience across countries in 2020. China’s visible success at containing the virus and its repeated rapid response to localised outbreaks, coupled with government support programmes and clear signs of economic recovery, have led management to conclude that the economic outlook for mainland China is the least volatile out of all our top markets.
The weights assigned for mainland China reflect this outlook with a probability of 80% for the Central scenario and a total of 10% across the two downside scenarios.
Uncertainty related to the continued impact of the pandemic and the ability of governments to control its spread via restrictions and vaccinations over the course of 2021 also play a prominent role in assigning scenario weights. The weights assigned to Hong Kong remain unchanged at 70% for the Central scenario while a total of 25% across the two downside scenarios.
Critical accounting estimates and judgements
The calculation of ECL under HKFRS 9 involves significant judgements, assumptions and estimates, as set out in the Annual Report and Accounts 2020 under ‘Critical accounting estimates and judgements’. The level of estimation uncertainty and judgement has increased since 31 December 2019 as a result of the economic effects of the COVID-19 outbreak, including significant judgements relating to:
• the selection and weighting of economic scenarios, given rapidly changing economic conditions in an unprecedented manner, uncertainty as to the effect of government and central bank support measures
designed to alleviate adverse economic impacts, and a wider distribution of economic forecasts than before the pandemic. The key judgements are the length of time over which the economic effects of the pandemic will occur, the speed and shape of recovery. The main factors include the effectiveness of pandemic containment measures, the pace of roll-out and effectiveness of vaccines, and the emergence of new variants of the virus, plus a range of geopolitical uncertainties, which together represent a very high degree of estimation uncertainty, particularly in assessing Downside scenarios;
• estimating the economic effects of those scenarios on ECL, where there is no observable historical trend that can be reflected in the models that will accurately represent the effects of the economic changes of the severity and speed brought about by the COVID-19 outbreak. Modelled assumptions and linkages between economic factors and credit losses may underestimate or overestimate ECL in these conditions, and there is significant uncertainty in the estimation of parameters such as collateral values and loss severity; and
• the identification of customers experiencing significant increases in credit risk and credit impairment, particularly where those customers have accepted payment deferrals and other reliefs designed to address short-term liquidity issues, or have extended those deferrals, given limitations in the available credit information on these customers. The use of segmentation techniques for indicators of significant increases in credit risk involves significant estimation uncertainty.
How economic scenarios are reflected in the wholesale calculation of ECL
We have developed a globally consistent methodology for the application of FEG into the calculation of ECL by incorporating FEG into the estimation of the term structure of PD and LGD. For PDs, we consider the correlation of FEG to default rates for a particular industry in a country. For LGD calculations, we consider the correlation of FEG to collateral values and realisation rates for a particular country and industry. PDs and LGDs are estimated for the entire term structure of each instrument.
For impaired loans, ECL is individually assessed based on the likelihood of recovery of that case using discounted cash flow analysis taking into account of the situation of the borrower, the value / quality of the collateral pledged and other recovery actions with consideration of the forward economic guidance. The assessment result is an unbiased and probability-weighted amount determined by evaluating a range of possible outcomes.
HANG SENG BANK70
Risk
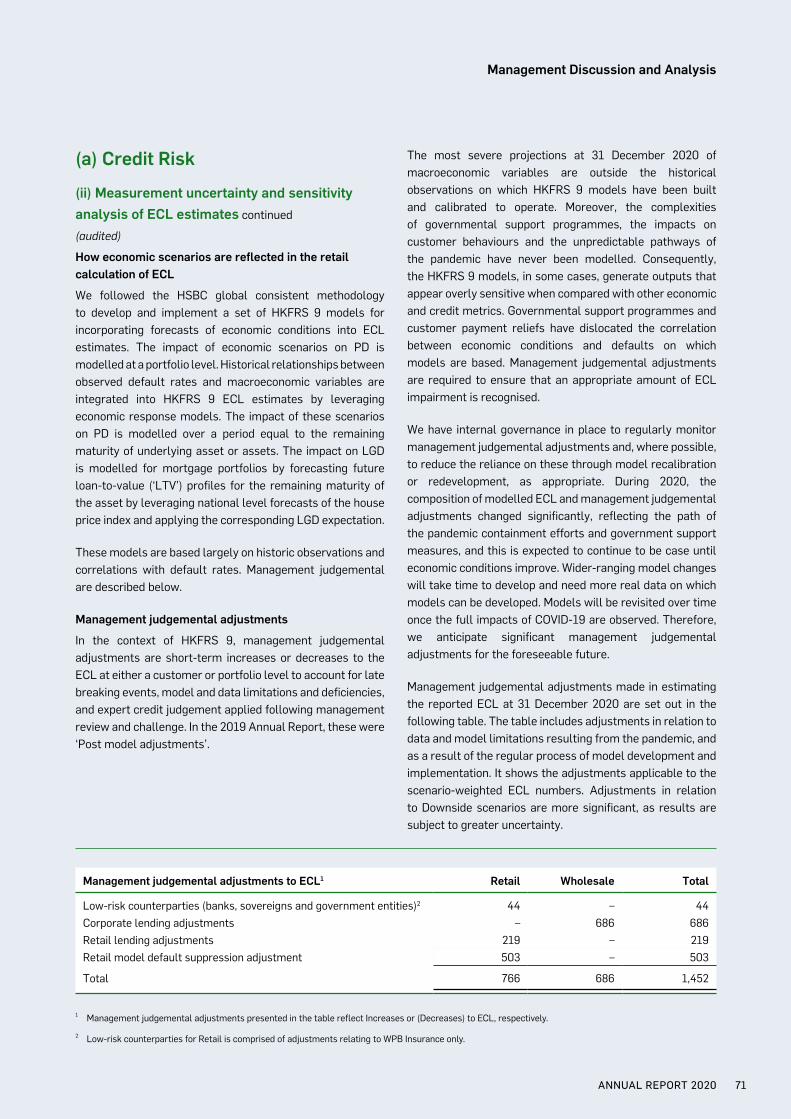
(a) Credit Risk
(ii) Measurement uncertainty and sensitivity analysis of ECL estimates continued
(audited)
How economic scenarios are reflected in the retail calculation of ECL
We followed the HSBC global consistent methodology to develop and implement a set of HKFRS 9 models for incorporating forecasts of economic conditions into ECL estimates. The impact of economic scenarios on PD is modelled at a portfolio level. Historical relationships between observed default rates and macroeconomic variables are integrated into HKFRS 9 ECL estimates by leveraging economic response models. The impact of these scenarios on PD is modelled over a period equal to the remaining maturity of underlying asset or assets. The impact on LGD is modelled for mortgage portfolios by forecasting future loan-to-value (‘LTV’) profiles for the remaining maturity of the asset by leveraging national level forecasts of the house price index and applying the corresponding LGD expectation.
These models are based largely on historic observations and correlations with default rates. Management judgemental are described below.
Management judgemental adjustments
In the context of HKFRS 9, management judgemental adjustments are short-term increases or decreases to the ECL at either a customer or portfolio level to account for late breaking events, model and data limitations and deficiencies, and expert credit judgement applied following management review and challenge. In the 2019 Annual Report, these were ‘Post model adjustments’.
The most severe projections at 31 December 2020 of macroeconomic variables are outside the historical observations on which HKFRS 9 models have been built and calibrated to operate. Moreover, the complexities of governmental support programmes, the impacts on customer behaviours and the unpredictable pathways of the pandemic have never been modelled. Consequently, the HKFRS 9 models, in some cases, generate outputs that appear overly sensitive when compared with other economic and credit metrics. Governmental support programmes and customer payment reliefs have dislocated the correlation between economic conditions and defaults on which models are based. Management judgemental adjustments are required to ensure that an appropriate amount of ECL impairment is recognised.
We have internal governance in place to regularly monitor management judgemental adjustments and, where possible, to reduce the reliance on these through model recalibration or redevelopment, as appropriate. During 2020, the composition of modelled ECL and management judgemental adjustments changed significantly, reflecting the path of the pandemic containment efforts and government support measures, and this is expected to continue to be case until economic conditions improve. Wider-ranging model changes will take time to develop and need more real data on which models can be developed. Models will be revisited over time once the full impacts of COVID-19 are observed. Therefore, we anticipate significant management judgemental adjustments for the foreseeable future.
Management judgemental adjustments made in estimating the reported ECL at 31 December 2020 are set out in the following table. The table includes adjustments in relation to data and model limitations resulting from the pandemic, and as a result of the regular process of model development and implementation. It shows the adjustments applicable to the scenario-weighted ECL numbers. Adjustments in relation to Downside scenarios are more significant, as results are subject to greater uncertainty.
Management judgemental adjustments to ECL1 Retail Wholesale Total
Low-risk counterparties (banks, sovereigns and government entities)2 44 – 44Corporate lending adjustments – 686 686Retail lending adjustments 219 – 219Retail model default suppression adjustment 503 – 503
Total 766 686 1,452
1 Management judgemental adjustments presented in the table reflect Increases or (Decreases) to ECL, respectively.
2 Low-risk counterparties for Retail is comprised of adjustments relating to WPB Insurance only.
ANNUAL REPORT 2020 71
Management Discussion and Analysis
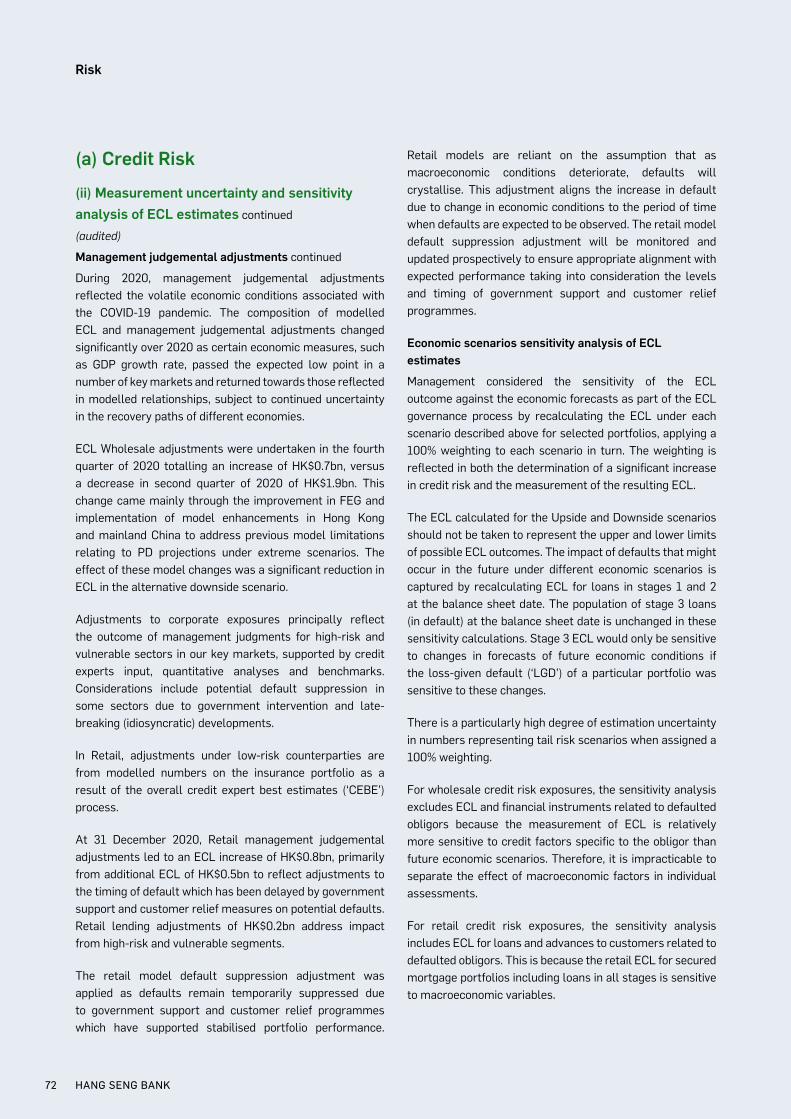
(a) Credit Risk
(ii) Measurement uncertainty and sensitivity analysis of ECL estimates continued
(audited)
Management judgemental adjustments continued
During 2020, management judgemental adjustments reflected the volatile economic conditions associated with the COVID-19 pandemic. The composition of modelled ECL and management judgemental adjustments changed significantly over 2020 as certain economic measures, such as GDP growth rate, passed the expected low point in a number of key markets and returned towards those reflected in modelled relationships, subject to continued uncertainty in the recovery paths of different economies.
ECL Wholesale adjustments were undertaken in the fourth quarter of 2020 totalling an increase of HK$0.7bn, versus a decrease in second quarter of 2020 of HK$1.9bn. This change came mainly through the improvement in FEG and implementation of model enhancements in Hong Kong and mainland China to address previous model limitations relating to PD projections under extreme scenarios. The effect of these model changes was a significant reduction in ECL in the alternative downside scenario.
Adjustments to corporate exposures principally reflect the outcome of management judgments for high-risk and vulnerable sectors in our key markets, supported by credit experts input, quantitative analyses and benchmarks. Considerations include potential default suppression in some sectors due to government intervention and late-breaking (idiosyncratic) developments.
In Retail, adjustments under low-risk counterparties are from modelled numbers on the insurance portfolio as a result of the overall credit expert best estimates (‘CEBE’) process.
At 31 December 2020, Retail management judgemental adjustments led to an ECL increase of HK$0.8bn, primarily from additional ECL of HK$0.5bn to reflect adjustments to the timing of default which has been delayed by government support and customer relief measures on potential defaults. Retail lending adjustments of HK$0.2bn address impact from high-risk and vulnerable segments.
The retail model default suppression adjustment was applied as defaults remain temporarily suppressed due to government support and customer relief programmes which have supported stabilised portfolio performance.
Retail models are reliant on the assumption that as macroeconomic conditions deteriorate, defaults will crystallise. This adjustment aligns the increase in default due to change in economic conditions to the period of time when defaults are expected to be observed. The retail model default suppression adjustment will be monitored and updated prospectively to ensure appropriate alignment with expected performance taking into consideration the levels and timing of government support and customer relief programmes.
Economic scenarios sensitivity analysis of ECL estimates
Management considered the sensitivity of the ECL outcome against the economic forecasts as part of the ECL governance process by recalculating the ECL under each scenario described above for selected portfolios, applying a 100% weighting to each scenario in turn. The weighting is reflected in both the determination of a significant increase in credit risk and the measurement of the resulting ECL.
The ECL calculated for the Upside and Downside scenarios should not be taken to represent the upper and lower limits of possible ECL outcomes. The impact of defaults that might occur in the future under different economic scenarios is captured by recalculating ECL for loans in stages 1 and 2 at the balance sheet date. The population of stage 3 loans (in default) at the balance sheet date is unchanged in these sensitivity calculations. Stage 3 ECL would only be sensitive to changes in forecasts of future economic conditions if the loss-given default (‘LGD’) of a particular portfolio was sensitive to these changes.
There is a particularly high degree of estimation uncertainty in numbers representing tail risk scenarios when assigned a 100% weighting.
For wholesale credit risk exposures, the sensitivity analysis excludes ECL and financial instruments related to defaulted obligors because the measurement of ECL is relatively more sensitive to credit factors specific to the obligor than future economic scenarios. Therefore, it is impracticable to separate the effect of macroeconomic factors in individual assessments.
For retail credit risk exposures, the sensitivity analysis includes ECL for loans and advances to customers related to defaulted obligors. This is because the retail ECL for secured mortgage portfolios including loans in all stages is sensitive to macroeconomic variables.
HANG SENG BANK72
Risk
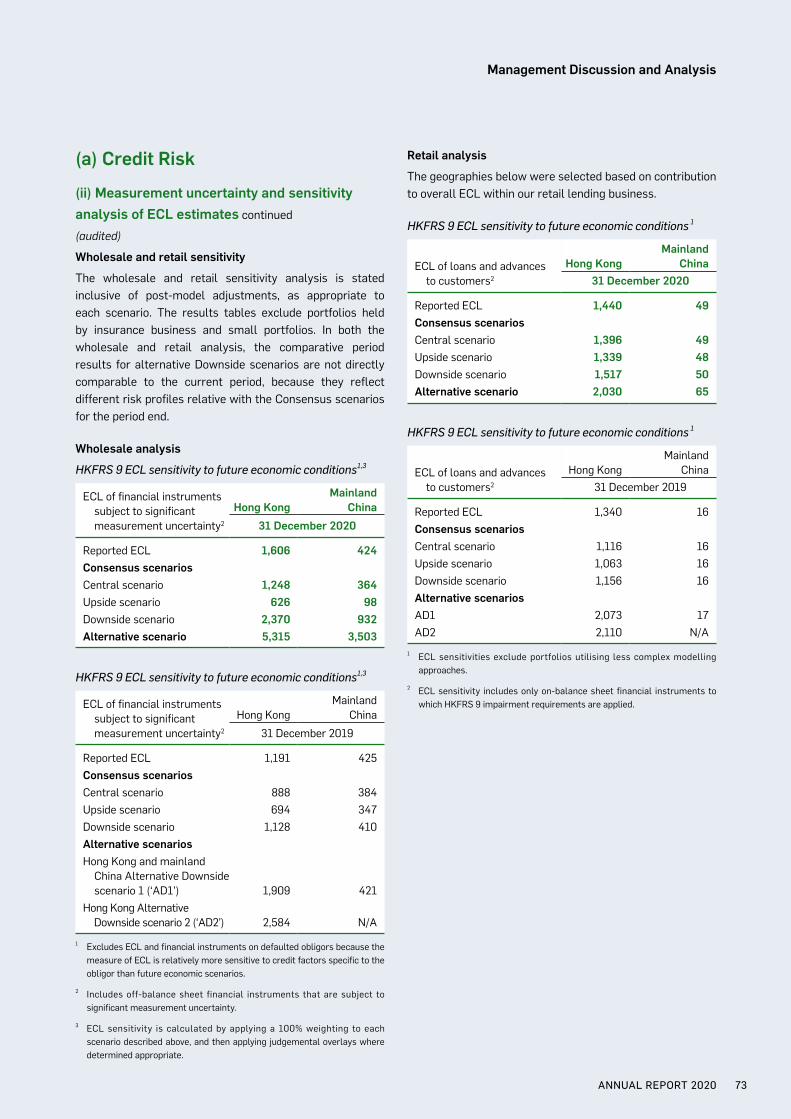
(a) Credit Risk
(ii) Measurement uncertainty and sensitivity analysis of ECL estimates continued
(audited)
Wholesale and retail sensitivity
The wholesale and retail sensitivity analysis is stated inclusive of post-model adjustments, as appropriate to each scenario. The results tables exclude portfolios held by insurance business and small portfolios. In both the wholesale and retail analysis, the comparative period results for alternative Downside scenarios are not directly comparable to the current period, because they reflect different risk profiles relative with the Consensus scenarios for the period end.
Wholesale analysis
HKFRS 9 ECL sensitivity to future economic conditions1,3
ECL of financial instruments subject to significant measurement uncertainty2
Hong KongMainland
China
31 December 2020
Reported ECL 1,606 424Consensus scenariosCentral scenario 1,248 364Upside scenario 626 98Downside scenario 2,370 932Alternative scenario 5,315 3,503
HKFRS 9 ECL sensitivity to future economic conditions1,3
ECL of financial instruments subject to significant measurement uncertainty2
Hong KongMainland
China
31 December 2019
Reported ECL 1,191 425Consensus scenariosCentral scenario 888 384Upside scenario 694 347Downside scenario 1,128 410Alternative scenariosHong Kong and mainland China Alternative Downside scenario 1 (‘AD1’) 1,909 421Hong Kong Alternative Downside scenario 2 (‘AD2’) 2,584 N/A
1 Excludes ECL and financial instruments on defaulted obligors because the measure of ECL is relatively more sensitive to credit factors specific to the obligor than future economic scenarios.
2 Includes off-balance sheet financial instruments that are subject to significant measurement uncertainty.
3 ECL sensitivity is calculated by applying a 100% weighting to each scenario described above, and then applying judgemental overlays where determined appropriate.
Retail analysis
The geographies below were selected based on contribution to overall ECL within our retail lending business.
HKFRS 9 ECL sensitivity to future economic conditions 1
ECL of loans and advances to customers2
Hong KongMainland
China 31 December 2020
Reported ECL 1,440 49Consensus scenariosCentral scenario 1,396 49Upside scenario 1,339 48Downside scenario 1,517 50Alternative scenario 2,030 65
HKFRS 9 ECL sensitivity to future economic conditions 1
ECL of loans and advances to customers2
Hong KongMainland
China 31 December 2019
Reported ECL 1,340 16Consensus scenariosCentral scenario 1,116 16Upside scenario 1,063 16Downside scenario 1,156 16Alternative scenariosAD1 2,073 17AD2 2,110 N/A
1 ECL sensitivities exclude portfolios utilising less complex modelling approaches.
2 ECL sensitivity includes only on-balance sheet financial instruments to which HKFRS 9 impairment requirements are applied.
ANNUAL REPORT 2020 73
Management Discussion and Analysis
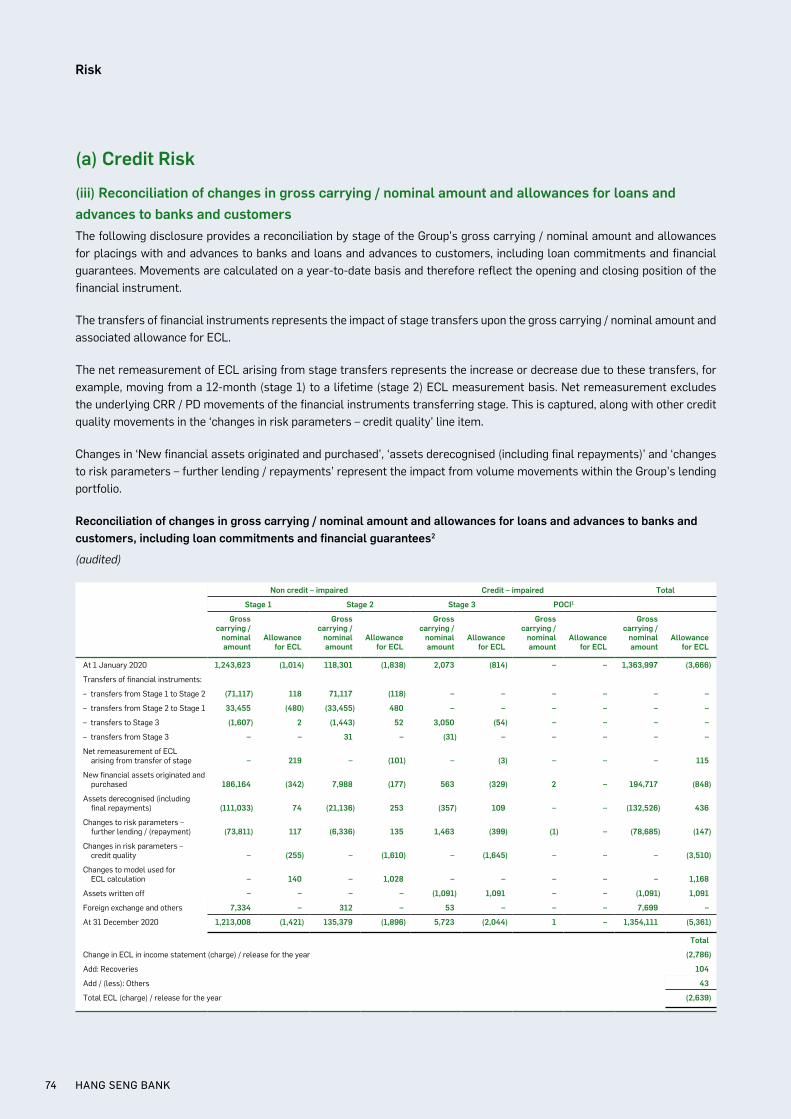
(a) Credit Risk
(iii) Reconciliation of changes in gross carrying / nominal amount and allowances for loans and advances to banks and customersThe following disclosure provides a reconciliation by stage of the Group’s gross carrying / nominal amount and allowances for placings with and advances to banks and loans and advances to customers, including loan commitments and financial guarantees. Movements are calculated on a year-to-date basis and therefore reflect the opening and closing position of the financial instrument.
The transfers of financial instruments represents the impact of stage transfers upon the gross carrying / nominal amount and associated allowance for ECL.
The net remeasurement of ECL arising from stage transfers represents the increase or decrease due to these transfers, for example, moving from a 12-month (stage 1) to a lifetime (stage 2) ECL measurement basis. Net remeasurement excludes the underlying CRR / PD movements of the financial instruments transferring stage. This is captured, along with other credit quality movements in the ‘changes in risk parameters – credit quality’ line item.
Changes in ‘New financial assets originated and purchased’, ‘assets derecognised (including final repayments)’ and ‘changes to risk parameters – further lending / repayments’ represent the impact from volume movements within the Group’s lending portfolio.
Reconciliation of changes in gross carrying / nominal amount and allowances for loans and advances to banks and customers, including loan commitments and financial guarantees2
(audited)
Non credit – impaired Credit – impaired Total
Stage 1 Stage 2 Stage 3 POCI1
Gross carrying /
nominal amount
Allowance for ECL
Gross carrying /
nominal amount
Allowance for ECL
Gross carrying /
nominal amount
Allowance for ECL
Gross carrying /
nominal amount
Allowance for ECL
Gross carrying /
nominal amount
Allowance for ECL
At 1 January 2020 1,243,623 (1,014) 118,301 (1,838) 2,073 (814) – – 1,363,997 (3,666)
Transfers of financial instruments:
– transfers from Stage 1 to Stage 2 (71,117) 118 71,117 (118) – – – – – –
– transfers from Stage 2 to Stage 1 33,455 (480) (33,455) 480 – – – – – –
– transfers to Stage 3 (1,607) 2 (1,443) 52 3,050 (54) – – – –
– transfers from Stage 3 – – 31 – (31) – – – – –
Net remeasurement of ECL arising from transfer of stage – 219 – (101) – (3) – – – 115
New financial assets originated and purchased 186,164 (342) 7,988 (177) 563 (329) 2 – 194,717 (848)
Assets derecognised (including final repayments) (111,033) 74 (21,136) 253 (357) 109 – – (132,526) 436
Changes to risk parameters – further lending / (repayment) (73,811) 117 (6,336) 135 1,463 (399) (1) – (78,685) (147)
Changes in risk parameters – credit quality – (255) – (1,610) – (1,645) – – – (3,510)
Changes to model used for ECL calculation – 140 – 1,028 – – – – – 1,168
Assets written off – – – – (1,091) 1,091 – – (1,091) 1,091
Foreign exchange and others 7,334 – 312 – 53 – – – 7,699 –
At 31 December 2020 1,213,008 (1,421) 135,379 (1,896) 5,723 (2,044) 1 – 1,354,111 (5,361)
Total
Change in ECL in income statement (charge) / release for the year (2,786)
Add: Recoveries 104
Add / (less): Others 43
Total ECL (charge) / release for the year (2,639)
HANG SENG BANK74
Risk
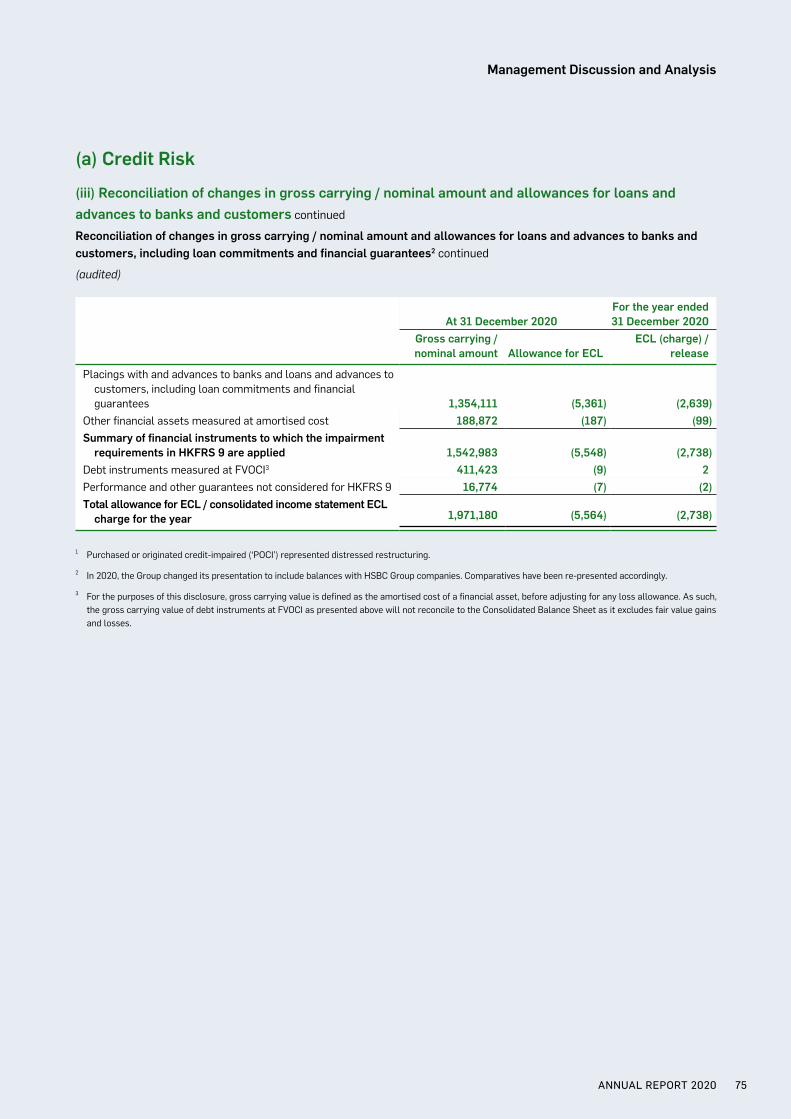
(a) Credit Risk
(iii) Reconciliation of changes in gross carrying / nominal amount and allowances for loans and advances to banks and customers continued
Reconciliation of changes in gross carrying / nominal amount and allowances for loans and advances to banks and customers, including loan commitments and financial guarantees2 continued
(audited)
At 31 December 2020For the year ended 31 December 2020
Gross carrying / nominal amount Allowance for ECL
ECL (charge) / release
Placings with and advances to banks and loans and advances to customers, including loan commitments and financial guarantees 1,354,111 (5,361) (2,639)Other financial assets measured at amortised cost 188,872 (187) (99)Summary of financial instruments to which the impairment requirements in HKFRS 9 are applied 1,542,983 (5,548) (2,738)Debt instruments measured at FVOCI3 411,423 (9) 2Performance and other guarantees not considered for HKFRS 9 16,774 (7) (2)Total allowance for ECL / consolidated income statement ECL charge for the year 1,971,180 (5,564) (2,738)
1 Purchased or originated credit-impaired (‘POCI’) represented distressed restructuring.
2 In 2020, the Group changed its presentation to include balances with HSBC Group companies. Comparatives have been re-presented accordingly.
3 For the purposes of this disclosure, gross carrying value is defined as the amortised cost of a financial asset, before adjusting for any loss allowance. As such, the gross carrying value of debt instruments at FVOCI as presented above will not reconcile to the Consolidated Balance Sheet as it excludes fair value gains and losses.
ANNUAL REPORT 2020 75
Management Discussion and Analysis
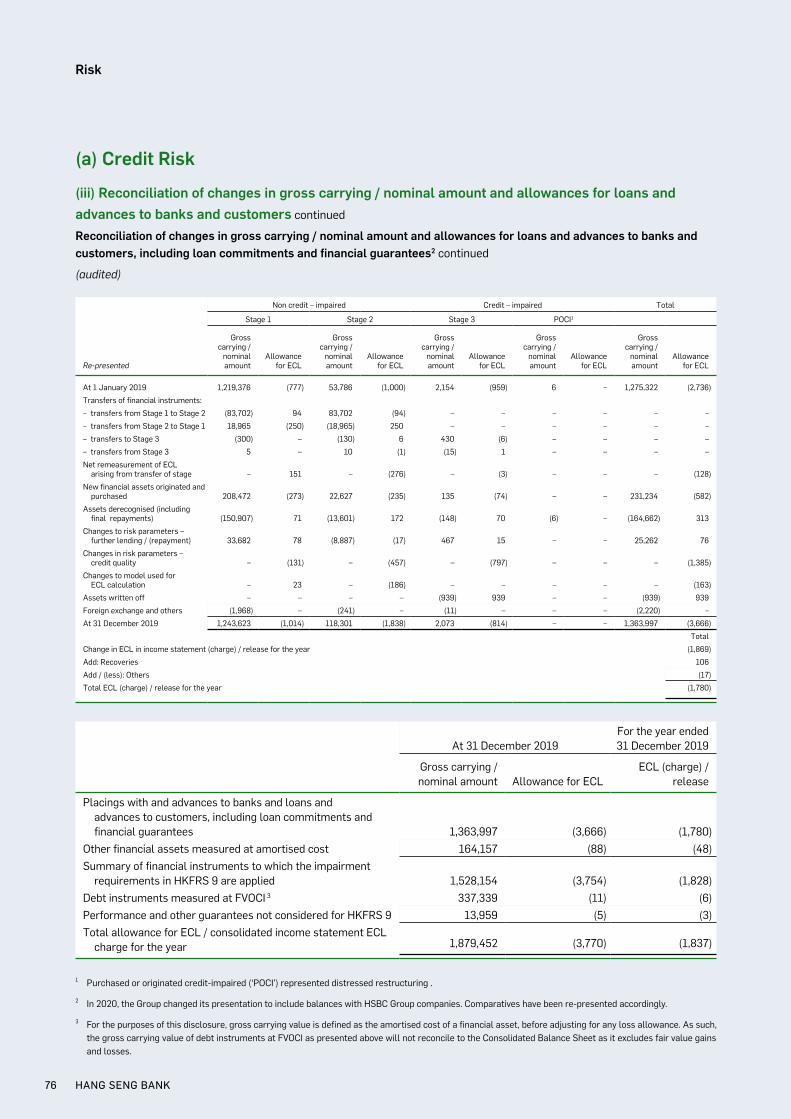
(a) Credit Risk
(iii) Reconciliation of changes in gross carrying / nominal amount and allowances for loans and advances to banks and customers continued
Reconciliation of changes in gross carrying / nominal amount and allowances for loans and advances to banks and customers, including loan commitments and financial guarantees2 continued
(audited)
Non credit – impaired Credit – impaired Total
Stage 1 Stage 2 Stage 3 POCI1
Re-presented
Grosscarrying /
nominalamount
Allowancefor ECL
Grosscarrying /
nominalamount
Allowancefor ECL
Grosscarrying /
nominalamount
Allowancefor ECL
Grosscarrying /
nominalamount
Allowancefor ECL
Grosscarrying /
nominalamount
Allowancefor ECL
At 1 January 2019 1,219,376 (777) 53,786 (1,000) 2,154 (959) 6 – 1,275,322 (2,736)
Transfers of financial instruments:
– transfers from Stage 1 to Stage 2 (83,702) 94 83,702 (94) – – – – – –
– transfers from Stage 2 to Stage 1 18,965 (250) (18,965) 250 – – – – – –
– transfers to Stage 3 (300) – (130) 6 430 (6) – – – –
– transfers from Stage 3 5 – 10 (1) (15) 1 – – – –
Net remeasurement of ECL arising from transfer of stage – 151 – (276) – (3) – – – (128)
New financial assets originated and purchased 208,472 (273) 22,627 (235) 135 (74) – – 231,234 (582)
Assets derecognised (including final repayments) (150,907) 71 (13,601) 172 (148) 70 (6) – (164,662) 313
Changes to risk parameters – further lending / (repayment) 33,682 78 (8,887) (17) 467 15 – – 25,262 76
Changes in risk parameters – credit quality – (131) – (457) – (797) – – – (1,385)
Changes to model used for ECL calculation – 23 – (186) – – – – – (163)
Assets written off – – – – (939) 939 – – (939) 939
Foreign exchange and others (1,968) – (241) – (11) – – – (2,220) –
At 31 December 2019 1,243,623 (1,014) 118,301 (1,838) 2,073 (814) – – 1,363,997 (3,666)
Total
Change in ECL in income statement (charge) / release for the year (1,869)
Add: Recoveries 106
Add / (less): Others (17)
Total ECL (charge) / release for the year (1,780)
At 31 December 2019For the year ended 31 December 2019
Gross carrying / nominal amount Allowance for ECL
ECL (charge) / release
Placings with and advances to banks and loans and advances to customers, including loan commitments and financial guarantees 1,363,997 (3,666) (1,780)Other financial assets measured at amortised cost 164,157 (88) (48)Summary of financial instruments to which the impairment requirements in HKFRS 9 are applied 1,528,154 (3,754) (1,828)Debt instruments measured at FVOCI 3 337,339 (11) (6)Performance and other guarantees not considered for HKFRS 9 13,959 (5) (3)Total allowance for ECL / consolidated income statement ECL charge for the year 1,879,452 (3,770) (1,837)
1 Purchased or originated credit-impaired (‘POCI’) represented distressed restructuring .
2 In 2020, the Group changed its presentation to include balances with HSBC Group companies. Comparatives have been re-presented accordingly.
3 For the purposes of this disclosure, gross carrying value is defined as the amortised cost of a financial asset, before adjusting for any loss allowance. As such, the gross carrying value of debt instruments at FVOCI as presented above will not reconcile to the Consolidated Balance Sheet as it excludes fair value gains and losses.
HANG SENG BANK76
Risk
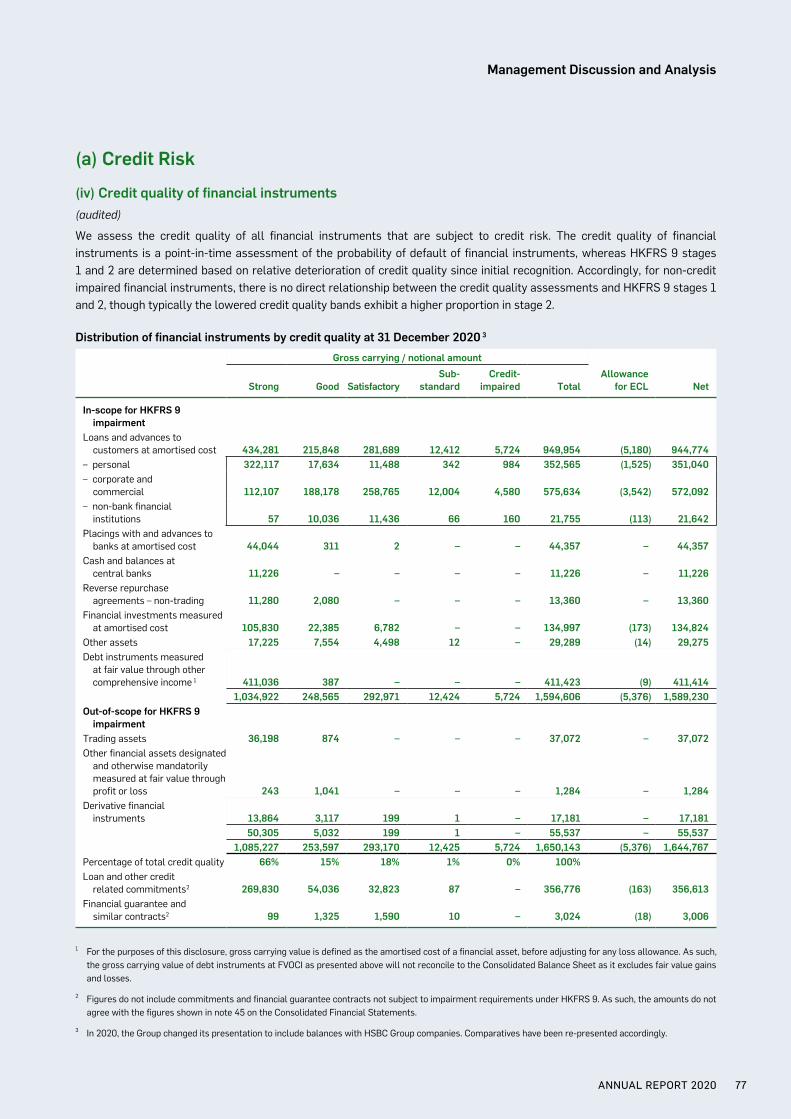
(a) Credit Risk
(iv) Credit quality of financial instruments(audited)
We assess the credit quality of all financial instruments that are subject to credit risk. The credit quality of financial instruments is a point-in-time assessment of the probability of default of financial instruments, whereas HKFRS 9 stages 1 and 2 are determined based on relative deterioration of credit quality since initial recognition. Accordingly, for non-credit impaired financial instruments, there is no direct relationship between the credit quality assessments and HKFRS 9 stages 1 and 2, though typically the lowered credit quality bands exhibit a higher proportion in stage 2.
Distribution of financial instruments by credit quality at 31 December 2020 3
Gross carrying / notional amount
Strong Good SatisfactorySub-
standardCredit-
impaired TotalAllowance
for ECL Net
In-scope for HKFRS 9 impairmentLoans and advances to customers at amortised cost 434,281 215,848 281,689 12,412 5,724 949,954 (5,180) 944,774– personal 322,117 17,634 11,488 342 984 352,565 (1,525) 351,040– corporate and commercial 112,107 188,178 258,765 12,004 4,580 575,634 (3,542) 572,092– non-bank financial institutions 57 10,036 11,436 66 160 21,755 (113) 21,642Placings with and advances to banks at amortised cost 44,044 311 2 – – 44,357 – 44,357Cash and balances at central banks 11,226 – – – – 11,226 – 11,226Reverse repurchase agreements – non-trading 11,280 2,080 – – – 13,360 – 13,360Financial investments measured at amortised cost 105,830 22,385 6,782 – – 134,997 (173) 134,824Other assets 17,225 7,554 4,498 12 – 29,289 (14) 29,275Debt instruments measured at fair value through other comprehensive income 1 411,036 387 – – – 411,423 (9) 411,414
1,034,922 248,565 292,971 12,424 5,724 1,594,606 (5,376) 1,589,230Out-of-scope for HKFRS 9 impairmentTrading assets 36,198 874 – – – 37,072 – 37,072Other financial assets designated and otherwise mandatorily measured at fair value through profit or loss 243 1,041 – – – 1,284 – 1,284Derivative financial instruments 13,864 3,117 199 1 – 17,181 – 17,181
50,305 5,032 199 1 – 55,537 – 55,5371,085,227 253,597 293,170 12,425 5,724 1,650,143 (5,376) 1,644,767
Percentage of total credit quality 66% 15% 18% 1% 0% 100%Loan and other credit related commitments2 269,830 54,036 32,823 87 – 356,776 (163) 356,613Financial guarantee and similar contracts2 99 1,325 1,590 10 – 3,024 (18) 3,006
1 For the purposes of this disclosure, gross carrying value is defined as the amortised cost of a financial asset, before adjusting for any loss allowance. As such, the gross carrying value of debt instruments at FVOCI as presented above will not reconcile to the Consolidated Balance Sheet as it excludes fair value gains and losses.
2 Figures do not include commitments and financial guarantee contracts not subject to impairment requirements under HKFRS 9. As such, the amounts do not agree with the figures shown in note 45 on the Consolidated Financial Statements.
3 In 2020, the Group changed its presentation to include balances with HSBC Group companies. Comparatives have been re-presented accordingly.
ANNUAL REPORT 2020 77
Management Discussion and Analysis
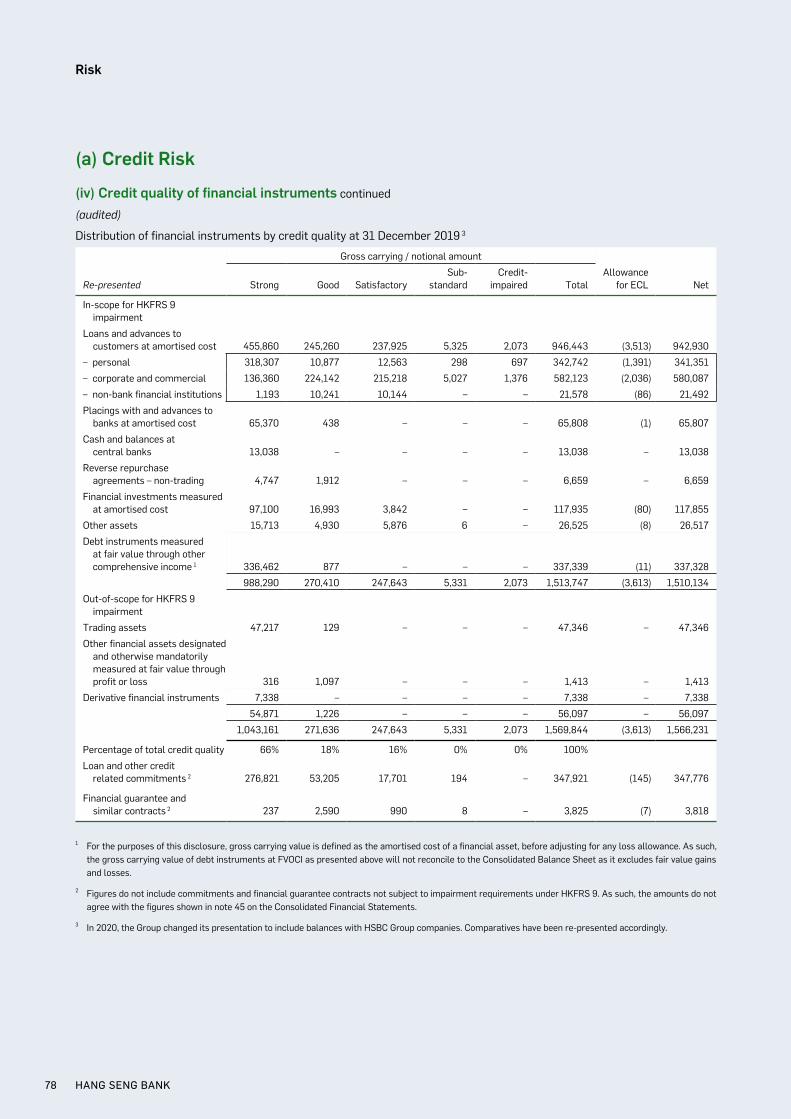
(a) Credit Risk
(iv) Credit quality of financial instruments continued
(audited)
Distribution of financial instruments by credit quality at 31 December 2019 3
Gross carrying / notional amount
Re-presented Strong Good SatisfactorySub-
standardCredit-
impaired TotalAllowance
for ECL Net
In-scope for HKFRS 9 impairment
Loans and advances to customers at amortised cost 455,860 245,260 237,925 5,325 2,073 946,443 (3,513) 942,930
– personal 318,307 10,877 12,563 298 697 342,742 (1,391) 341,351
– corporate and commercial 136,360 224,142 215,218 5,027 1,376 582,123 (2,036) 580,087
– non-bank financial institutions 1,193 10,241 10,144 – – 21,578 (86) 21,492
Placings with and advances to banks at amortised cost 65,370 438 – – – 65,808 (1) 65,807
Cash and balances at central banks 13,038 – – – – 13,038 – 13,038
Reverse repurchase agreements – non-trading 4,747 1,912 – – – 6,659 – 6,659
Financial investments measured at amortised cost 97,100 16,993 3,842 – – 117,935 (80) 117,855
Other assets 15,713 4,930 5,876 6 – 26,525 (8) 26,517
Debt instruments measured at fair value through other comprehensive income 1 336,462 877 – – – 337,339 (11) 337,328
988,290 270,410 247,643 5,331 2,073 1,513,747 (3,613) 1,510,134
Out-of-scope for HKFRS 9 impairment
Trading assets 47,217 129 – – – 47,346 – 47,346
Other financial assets designated and otherwise mandatorily measured at fair value through profit or loss 316 1,097 – – – 1,413 – 1,413
Derivative financial instruments 7,338 – – – – 7,338 – 7,338
54,871 1,226 – – – 56,097 – 56,097
1,043,161 271,636 247,643 5,331 2,073 1,569,844 (3,613) 1,566,231
Percentage of total credit quality 66% 18% 16% 0% 0% 100%
Loan and other credit related commitments 2 276,821 53,205 17,701 194 – 347,921 (145) 347,776
Financial guarantee and similar contracts 2 237 2,590 990 8 – 3,825 (7) 3,818
1 For the purposes of this disclosure, gross carrying value is defined as the amortised cost of a financial asset, before adjusting for any loss allowance. As such, the gross carrying value of debt instruments at FVOCI as presented above will not reconcile to the Consolidated Balance Sheet as it excludes fair value gains and losses.
2 Figures do not include commitments and financial guarantee contracts not subject to impairment requirements under HKFRS 9. As such, the amounts do not agree with the figures shown in note 45 on the Consolidated Financial Statements.
3 In 2020, the Group changed its presentation to include balances with HSBC Group companies. Comparatives have been re-presented accordingly.
HANG SENG BANK78
Risk
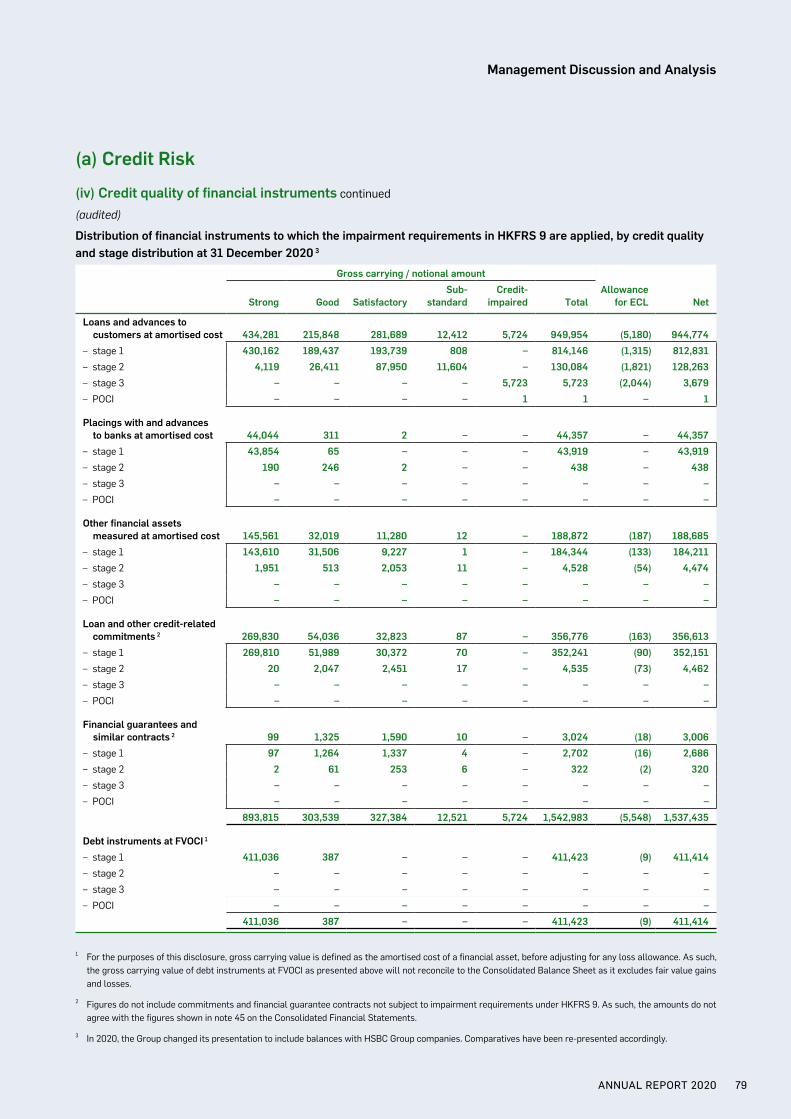
(a) Credit Risk
(iv) Credit quality of financial instruments continued
(audited)
Distribution of financial instruments to which the impairment requirements in HKFRS 9 are applied, by credit quality and stage distribution at 31 December 2020 3
Gross carrying / notional amount
Strong Good SatisfactorySub-
standardCredit-
impaired TotalAllowance
for ECL Net
Loans and advances to customers at amortised cost 434,281 215,848 281,689 12,412 5,724 949,954 (5,180) 944,774– stage 1 430,162 189,437 193,739 808 – 814,146 (1,315) 812,831– stage 2 4,119 26,411 87,950 11,604 – 130,084 (1,821) 128,263– stage 3 – – – – 5,723 5,723 (2,044) 3,679– POCI – – – – 1 1 – 1
Placings with and advances to banks at amortised cost 44,044 311 2 – – 44,357 – 44,357– stage 1 43,854 65 – – – 43,919 – 43,919– stage 2 190 246 2 – – 438 – 438– stage 3 – – – – – – – –– POCI – – – – – – – –
Other financial assets measured at amortised cost 145,561 32,019 11,280 12 – 188,872 (187) 188,685– stage 1 143,610 31,506 9,227 1 – 184,344 (133) 184,211– stage 2 1,951 513 2,053 11 – 4,528 (54) 4,474– stage 3 – – – – – – – –– POCI – – – – – – – –
Loan and other credit-related commitments 2 269,830 54,036 32,823 87 – 356,776 (163) 356,613– stage 1 269,810 51,989 30,372 70 – 352,241 (90) 352,151– stage 2 20 2,047 2,451 17 – 4,535 (73) 4,462– stage 3 – – – – – – – –– POCI – – – – – – – –
Financial guarantees and similar contracts 2 99 1,325 1,590 10 – 3,024 (18) 3,006– stage 1 97 1,264 1,337 4 – 2,702 (16) 2,686– stage 2 2 61 253 6 – 322 (2) 320– stage 3 – – – – – – – –– POCI – – – – – – – –
893,815 303,539 327,384 12,521 5,724 1,542,983 (5,548) 1,537,435
Debt instruments at FVOCI 1
– stage 1 411,036 387 – – – 411,423 (9) 411,414– stage 2 – – – – – – – –– stage 3 – – – – – – – –– POCI – – – – – – – –
411,036 387 – – – 411,423 (9) 411,414
1 For the purposes of this disclosure, gross carrying value is defined as the amortised cost of a financial asset, before adjusting for any loss allowance. As such, the gross carrying value of debt instruments at FVOCI as presented above will not reconcile to the Consolidated Balance Sheet as it excludes fair value gains and losses.
2 Figures do not include commitments and financial guarantee contracts not subject to impairment requirements under HKFRS 9. As such, the amounts do not agree with the figures shown in note 45 on the Consolidated Financial Statements.
3 In 2020, the Group changed its presentation to include balances with HSBC Group companies. Comparatives have been re-presented accordingly.
ANNUAL REPORT 2020 79
Management Discussion and Analysis
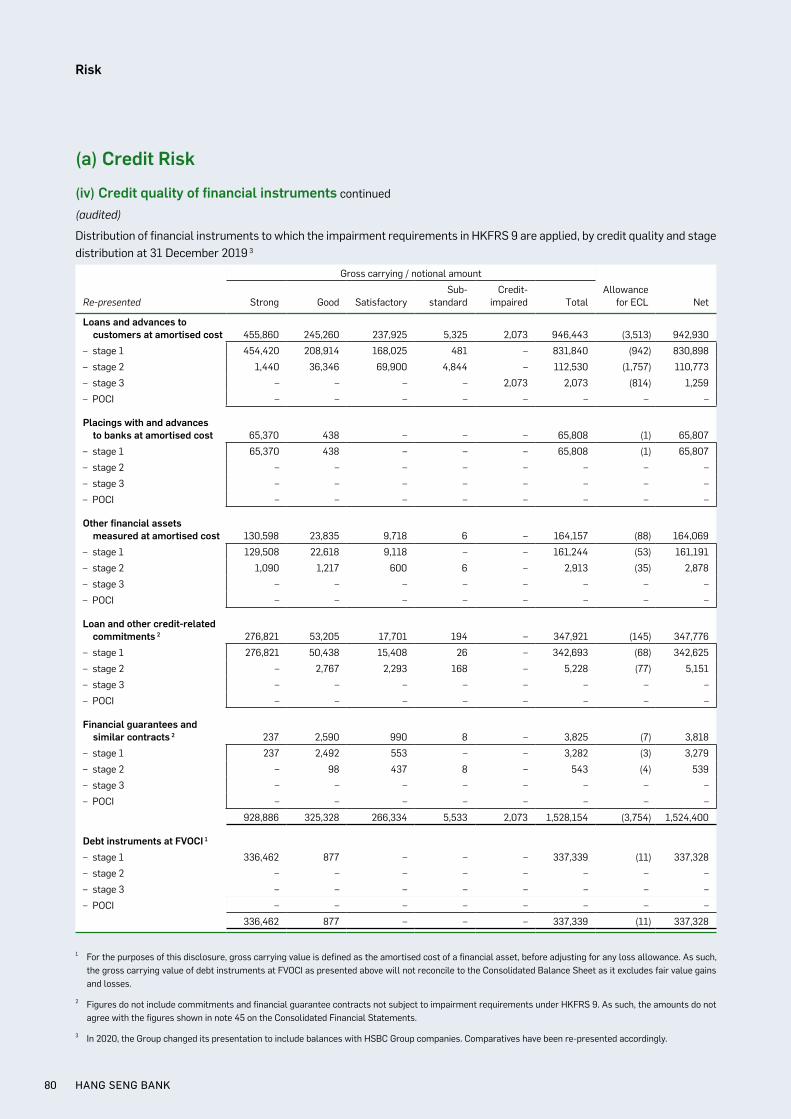
(a) Credit Risk
(iv) Credit quality of financial instruments continued
(audited)
Distribution of financial instruments to which the impairment requirements in HKFRS 9 are applied, by credit quality and stage distribution at 31 December 2019 3
Gross carrying / notional amount
Re-presented Strong Good SatisfactorySub-
standardCredit-
impaired TotalAllowance
for ECL Net
Loans and advances to customers at amortised cost 455,860 245,260 237,925 5,325 2,073 946,443 (3,513) 942,930
– stage 1 454,420 208,914 168,025 481 – 831,840 (942) 830,898
– stage 2 1,440 36,346 69,900 4,844 – 112,530 (1,757) 110,773
– stage 3 – – – – 2,073 2,073 (814) 1,259
– POCI – – – – – – – –
Placings with and advances to banks at amortised cost 65,370 438 – – – 65,808 (1) 65,807
– stage 1 65,370 438 – – – 65,808 (1) 65,807
– stage 2 – – – – – – – –
– stage 3 – – – – – – – –
– POCI – – – – – – – –
Other financial assets measured at amortised cost 130,598 23,835 9,718 6 – 164,157 (88) 164,069
– stage 1 129,508 22,618 9,118 – – 161,244 (53) 161,191
– stage 2 1,090 1,217 600 6 – 2,913 (35) 2,878
– stage 3 – – – – – – – –
– POCI – – – – – – – –
Loan and other credit-related commitments 2 276,821 53,205 17,701 194 – 347,921 (145) 347,776
– stage 1 276,821 50,438 15,408 26 – 342,693 (68) 342,625
– stage 2 – 2,767 2,293 168 – 5,228 (77) 5,151
– stage 3 – – – – – – – –
– POCI – – – – – – – –
Financial guarantees and similar contracts 2 237 2,590 990 8 – 3,825 (7) 3,818
– stage 1 237 2,492 553 – – 3,282 (3) 3,279
– stage 2 – 98 437 8 – 543 (4) 539
– stage 3 – – – – – – – –
– POCI – – – – – – – –
928,886 325,328 266,334 5,533 2,073 1,528,154 (3,754) 1,524,400
Debt instruments at FVOCI 1
– stage 1 336,462 877 – – – 337,339 (11) 337,328
– stage 2 – – – – – – – –
– stage 3 – – – – – – – –
– POCI – – – – – – – –
336,462 877 – – – 337,339 (11) 337,328
1 For the purposes of this disclosure, gross carrying value is defined as the amortised cost of a financial asset, before adjusting for any loss allowance. As such, the gross carrying value of debt instruments at FVOCI as presented above will not reconcile to the Consolidated Balance Sheet as it excludes fair value gains and losses.
2 Figures do not include commitments and financial guarantee contracts not subject to impairment requirements under HKFRS 9. As such, the amounts do not agree with the figures shown in note 45 on the Consolidated Financial Statements.
3 In 2020, the Group changed its presentation to include balances with HSBC Group companies. Comparatives have been re-presented accordingly.
HANG SENG BANK80
Risk
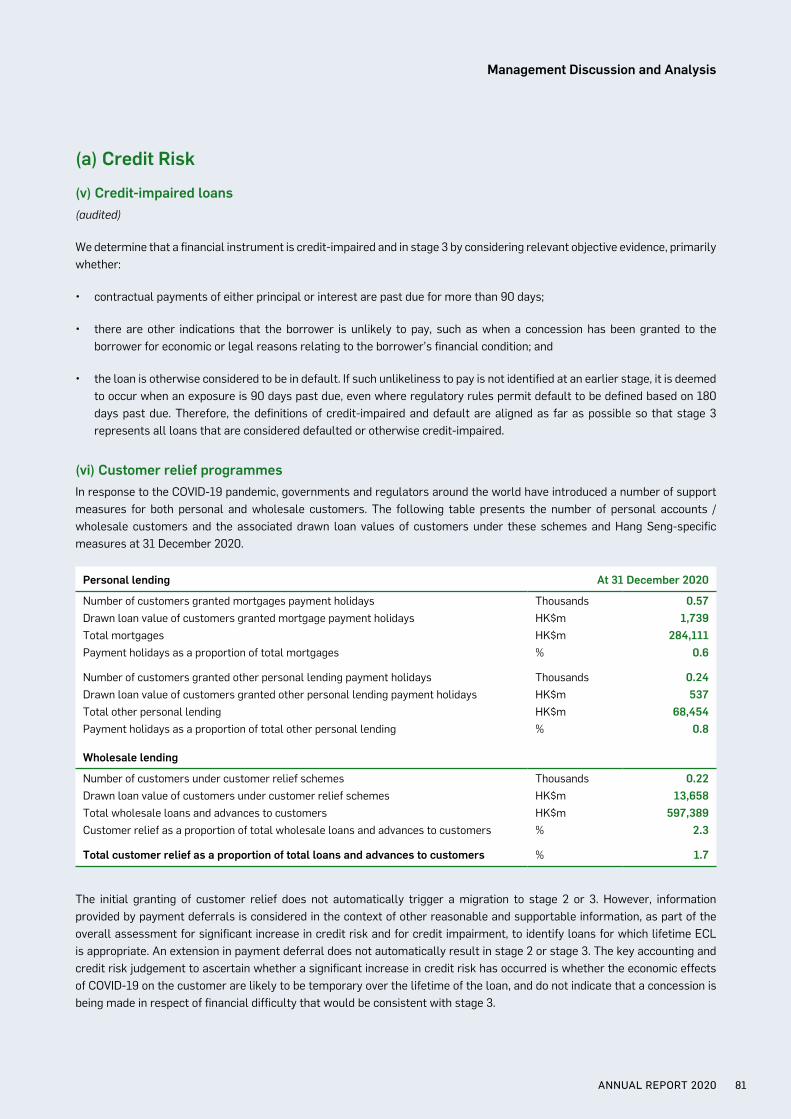
(a) Credit Risk
(v) Credit-impaired loans(audited)
We determine that a financial instrument is credit-impaired and in stage 3 by considering relevant objective evidence, primarily whether:
• contractual payments of either principal or interest are past due for more than 90 days;
• there are other indications that the borrower is unlikely to pay, such as when a concession has been granted to the borrower for economic or legal reasons relating to the borrower’s financial condition; and
• the loan is otherwise considered to be in default. If such unlikeliness to pay is not identified at an earlier stage, it is deemed to occur when an exposure is 90 days past due, even where regulatory rules permit default to be defined based on 180 days past due. Therefore, the definitions of credit-impaired and default are aligned as far as possible so that stage 3 represents all loans that are considered defaulted or otherwise credit-impaired.
(vi) Customer relief programmesIn response to the COVID-19 pandemic, governments and regulators around the world have introduced a number of support measures for both personal and wholesale customers. The following table presents the number of personal accounts / wholesale customers and the associated drawn loan values of customers under these schemes and Hang Seng-specific measures at 31 December 2020.
Personal lending At 31 December 2020
Number of customers granted mortgages payment holidays Thousands 0.57Drawn loan value of customers granted mortgage payment holidays HK$m 1,739Total mortgages HK$m 284,111Payment holidays as a proportion of total mortgages % 0.6
Number of customers granted other personal lending payment holidays Thousands 0.24Drawn loan value of customers granted other personal lending payment holidays HK$m 537Total other personal lending HK$m 68,454Payment holidays as a proportion of total other personal lending % 0.8
Wholesale lending
Number of customers under customer relief schemes Thousands 0.22Drawn loan value of customers under customer relief schemes HK$m 13,658Total wholesale loans and advances to customers HK$m 597,389Customer relief as a proportion of total wholesale loans and advances to customers % 2.3
Total customer relief as a proportion of total loans and advances to customers % 1.7
The initial granting of customer relief does not automatically trigger a migration to stage 2 or 3. However, information provided by payment deferrals is considered in the context of other reasonable and supportable information, as part of the overall assessment for significant increase in credit risk and for credit impairment, to identify loans for which lifetime ECL is appropriate. An extension in payment deferral does not automatically result in stage 2 or stage 3. The key accounting and credit risk judgement to ascertain whether a significant increase in credit risk has occurred is whether the economic effects of COVID-19 on the customer are likely to be temporary over the lifetime of the loan, and do not indicate that a concession is being made in respect of financial difficulty that would be consistent with stage 3.
ANNUAL REPORT 2020 81
Management Discussion and Analysis
(a) Credit Risk
(vi) Customer relief programmes continued
(audited)
Customer relief schemes in Hong Kong
Wholesale
Given the continued challenges encountered by the Hong Kong business community on the back of the COVID-19 outbreak, the Bank has rolled out certain temporary relief measures in 2020 to support our corporate clients during this period. The overarching premise of these initiatives was to support the immediate cash flow and liquidity of our customers, without increasing the overall quantum of exposure / risk appetite to these clients. Eligible customers were required to meet a set of credit criteria.
The prescribed eligibility criteria (which include parameters for CRR, favourable past due history and no Worry-Watch-Monitor classification etc.) are to ensure that these measures are extended only to the ‘good book’, clients are not already showing any signs of stress and that these arrangements are more proactive and flexible approaches to commercial restructuring as opposed to forbearance / renegotiated loans / distressed restructuring.
The relief measures are as follows:
• Programmes implemented by the Bank in Hong Kong in February 2020 for ‘eligible client’ include:
– Up to 60-day extension of import or export trade loans;
– Taxi / public light bus hire purchase loans: Up to 6-month principal moratorium;
– Secured loans: 6-month principal moratorium;
– Loans under SME Financing Guarantee Scheme: Up to 6-month principal moratorium;
• A supplemental industry-wide relief programme initiated by the Hong Kong Monetary Authority (‘HKMA’) for eligible corporates with turnover not exceeding HK$800m and other prescribed criteria was launched in May 2020. The Pre-approved Principal Payment Holiday Scheme (‘PPPHS’) entailed essentially a up to 90-day tenor extension for trade facilities and up to 6-month principal payment holiday for other loans. On 2 September 2020, the HKMA announced that this scheme has been extended for a further six months to April 2021;
• A special 100% Loan Guarantee under the SME Financing Guarantee Scheme (‘SFGS100’) was launched in April 2020. The guarantee covers a maximum tenor of 3 years and maximum loan size of HK$4m, and involved transfer of title of the loan to the Hong Kong Mortgage Corporation (‘HKMCI’), a quasi-government agency. In September 2020, the HKMCI has further enhanced the maximum loan amount to HK$5m and loan tenor to 5 years.
HANG SENG BANK82
Risk
(a) Credit Risk
(vi) Customer relief programmes continued
(audited)
Customer relief schemes in Hong Kong continued
Retail
The HKMA in early February 2020 encouraged Authorised Institutions to adopt a sympathetic stance in dealing with customers facing financial stress due to the COVID-19 and, to the extent prudent risk management principles permit, consider requests from these borrowers for temporary relief arrangements favourably. The Bank introduced a suite of comprehensive relief measures to ease the financial burden and short term cash flow pressures on personal customers created by the spread of COVID-19. This exemplifies the Bank’s commitment to support the local community during these tough times.
The relief measures are as follows:
• Deferred Mortgage Principal Repayment Plan is generally in 6 months and further extension of 6 months is allowed upon request (total up to 12 months). Eligible customers only need to repay interest during the period and the plan is offered to existing mortgage loan customers who have a good repayment record in the past 6 months and also covers Government Home Ownership Scheme (‘GHOS’) / Tenants Purchase Scheme (‘TPS’);
• Personal Instalment Relief Loan of up to HK$30,000 with a maximum tenor of 24 months for existing customers employed in the affected industries (e.g. tourism, entertainment, catering and retail industries). The choice of repayment period is from 6 months to 24 months.
(vii) Collateral and other credit enhancements(audited)
Although collateral can be an important mitigant of credit risk, it is the Group’s practice to lend on the basis of the customer’s ability to meet their obligations out of their cash flow resources rather than rely on the value of security offered. Depending on the customer’s standing and the type of product, facilities may be provided unsecured. However, for certain lending decisions a charge over collateral is usually obtained, and is important for the credit decision and pricing, and it is the Bank’s practice to obtain that collateral and sell it in the event of default as a source of repayment.
Such collateral has a significant financial effect in mitigating our exposure to credit risk and the objective of the disclosure below is to quantify these forms. We may also manage our risk by employing other types of collateral and credit risk enhancements, such as second charges, other liens and unsupported guarantees, but the valuation of such mitigants is less certain and their financial effect has not been quantified in the loans shown below.
We have quantified below the value of fixed charges we hold over a specific asset (or assets) of a borrower for which we have a practical ability and history of enforcing in satisfying a debt in the event of a borrower failing to meet their contractual obligations and where the asset is cash or can be realised in the form of cash by sale in an established market.
Personal lending
(audited)
For personal lending, the collateral held has been analysed below separately for residential mortgages and other personal lending due to the different nature of collateral held on the portfolios.
ANNUAL REPORT 2020 83
Management Discussion and Analysis
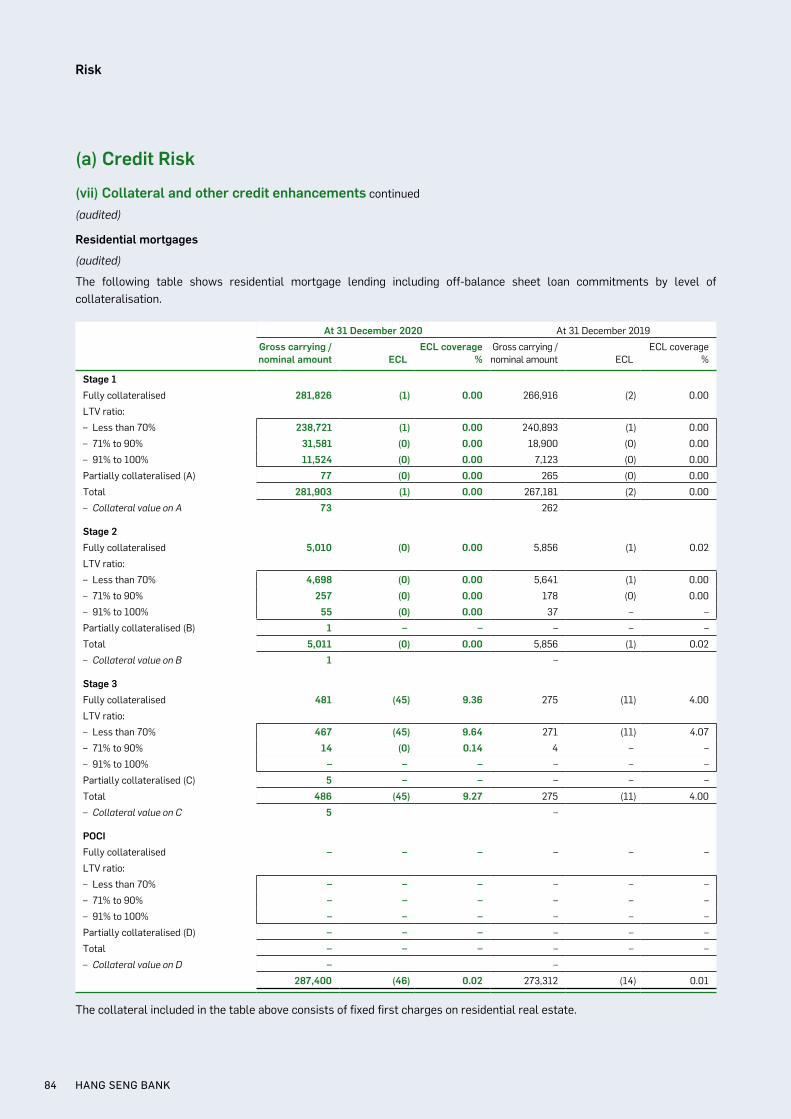
(a) Credit Risk
(vii) Collateral and other credit enhancements continued
(audited)
Residential mortgages
(audited)
The following table shows residential mortgage lending including off-balance sheet loan commitments by level of collateralisation.
At 31 December 2020 At 31 December 2019
Gross carrying / nominal amount ECL
ECL coverage%
Gross carrying / nominal amount ECL
ECL coverage %
Stage 1Fully collateralised 281,826 (1) 0.00 266,916 (2) 0.00
LTV ratio:
– Less than 70% 238,721 (1) 0.00 240,893 (1) 0.00
– 71% to 90% 31,581 (0) 0.00 18,900 (0) 0.00
– 91% to 100% 11,524 (0) 0.00 7,123 (0) 0.00
Partially collateralised (A) 77 (0) 0.00 265 (0) 0.00
Total 281,903 (1) 0.00 267,181 (2) 0.00
– Collateral value on A 73 262
Stage 2Fully collateralised 5,010 (0) 0.00 5,856 (1) 0.02
LTV ratio:
– Less than 70% 4,698 (0) 0.00 5,641 (1) 0.00
– 71% to 90% 257 (0) 0.00 178 (0) 0.00
– 91% to 100% 55 (0) 0.00 37 – –
Partially collateralised (B) 1 – – – – –
Total 5,011 (0) 0.00 5,856 (1) 0.02
– Collateral value on B 1 –
Stage 3Fully collateralised 481 (45) 9.36 275 (11) 4.00
LTV ratio:
– Less than 70% 467 (45) 9.64 271 (11) 4.07
– 71% to 90% 14 (0) 0.14 4 – –
– 91% to 100% – – – – – –
Partially collateralised (C) 5 – – – – –
Total 486 (45) 9.27 275 (11) 4.00
– Collateral value on C 5 –
POCIFully collateralised – – – – – –
LTV ratio:
– Less than 70% – – – – – –
– 71% to 90% – – – – – –
– 91% to 100% – – – – – –
Partially collateralised (D) – – – – – –
Total – – – – – –
– Collateral value on D – –
287,400 (46) 0.02 273,312 (14) 0.01
The collateral included in the table above consists of fixed first charges on residential real estate.
HANG SENG BANK84
Risk
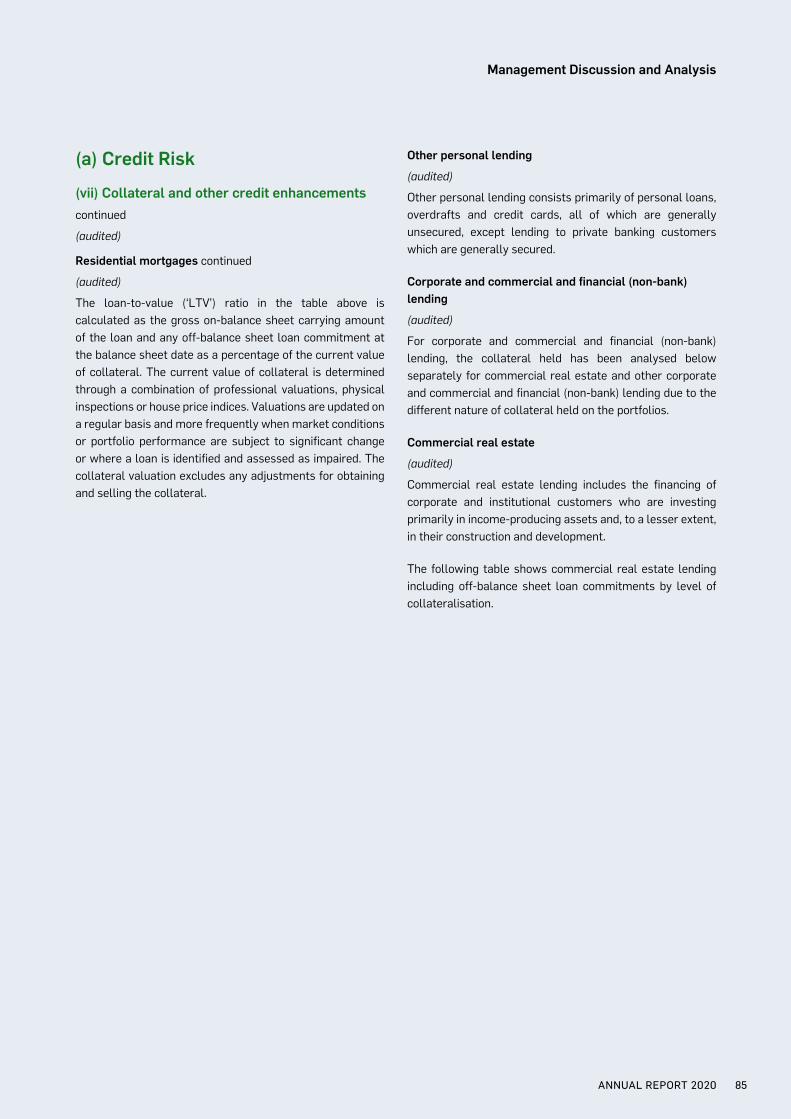
(a) Credit Risk
(vii) Collateral and other credit enhancements
continued
(audited)
Residential mortgages continued
(audited)
The loan-to-value (‘LTV’) ratio in the table above is calculated as the gross on-balance sheet carrying amount of the loan and any off-balance sheet loan commitment at the balance sheet date as a percentage of the current value of collateral. The current value of collateral is determined through a combination of professional valuations, physical inspections or house price indices. Valuations are updated on a regular basis and more frequently when market conditions or portfolio performance are subject to significant change or where a loan is identified and assessed as impaired. The collateral valuation excludes any adjustments for obtaining and selling the collateral.
Other personal lending
(audited)
Other personal lending consists primarily of personal loans, overdrafts and credit cards, all of which are generally unsecured, except lending to private banking customers which are generally secured.
Corporate and commercial and financial (non-bank) lending
(audited)
For corporate and commercial and financial (non-bank) lending, the collateral held has been analysed below separately for commercial real estate and other corporate and commercial and financial (non-bank) lending due to the different nature of collateral held on the portfolios.
Commercial real estate
(audited)
Commercial real estate lending includes the financing of corporate and institutional customers who are investing primarily in income-producing assets and, to a lesser extent, in their construction and development.
The following table shows commercial real estate lending including off-balance sheet loan commitments by level of collateralisation.
ANNUAL REPORT 2020 85
Management Discussion and Analysis
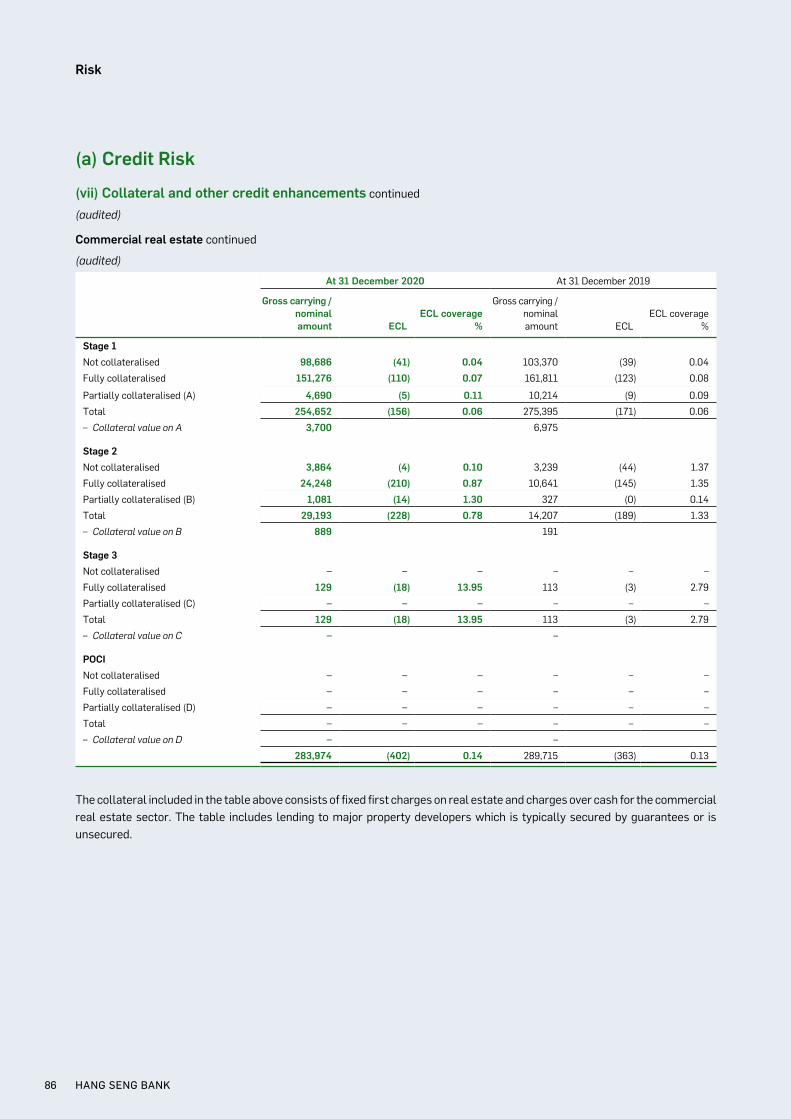
(a) Credit Risk
(vii) Collateral and other credit enhancements continued
(audited)
Commercial real estate continued
(audited)
At 31 December 2020 At 31 December 2019
Gross carrying / nominal amount ECL
ECL coverage %
Gross carrying / nominal amount ECL
ECL coverage %
Stage 1Not collateralised 98,686 (41) 0.04 103,370 (39) 0.04
Fully collateralised 151,276 (110) 0.07 161,811 (123) 0.08
Partially collateralised (A) 4,690 (5) 0.11 10,214 (9) 0.09
Total 254,652 (156) 0.06 275,395 (171) 0.06
– Collateral value on A 3,700 6,975
Stage 2Not collateralised 3,864 (4) 0.10 3,239 (44) 1.37
Fully collateralised 24,248 (210) 0.87 10,641 (145) 1.35
Partially collateralised (B) 1,081 (14) 1.30 327 (0) 0.14
Total 29,193 (228) 0.78 14,207 (189) 1.33
– Collateral value on B 889 191
Stage 3Not collateralised – – – – – –
Fully collateralised 129 (18) 13.95 113 (3) 2.79
Partially collateralised (C) – – – – – –
Total 129 (18) 13.95 113 (3) 2.79
– Collateral value on C – –
POCINot collateralised – – – – – –
Fully collateralised – – – – – –
Partially collateralised (D) – – – – – –
Total – – – – – –
– Collateral value on D – –
283,974 (402) 0.14 289,715 (363) 0.13
The collateral included in the table above consists of fixed first charges on real estate and charges over cash for the commercial real estate sector. The table includes lending to major property developers which is typically secured by guarantees or is unsecured.
HANG SENG BANK86
Risk
(a) Credit Risk
(vii) Collateral and other credit enhancements continued
(audited)
Commercial real estate continued
(audited)
The value of commercial real estate collateral is determined through a combination of professional and internal valuations and physical inspection. Due to the complexity of collateral valuations for commercial real estate, local valuation policies determine the frequency of review based on local market conditions. Revaluations are sought with greater frequency where, as part of the regular credit assessment of the obligor, material concerns arise in relation to the transaction which may reflect on the underlying performance of the collateral, or in circumstances where an obligor’s credit quality has declined sufficiently to cause concern that the principal payment source may not fully meet the obligation (i.e. the obligor’s credit quality classification indicates it is at the lower end e.g. sub-standard, or approaching impaired).
Commercial real estate lending includes the financing of corporate, institutional and high net worth customers who are investing primarily in income-producing assets and, to a lesser extent, in their construction and development.
Other corporate and commercial and financial (non-bank) lending
(audited)
The following table shows corporate, commercial and financial (non-bank) lending including off-balance sheet loan commitments by level of collateralisation. 1
At 31 December 2020 At 31 December 2019 Re-presented
Gross carrying / nominal amount ECL
ECL coverage %
Gross carrying / nominal amount ECL
ECL coverage %
Stage 1Not collateralised 266,101 (371) 0.14 283,389 (259) 0.09
Fully collateralised 139,653 (252) 0.18 133,854 (172) 0.13
Partially collateralised (A) 46,560 (69) 0.15 57,068 (50) 0.09
Total 452,314 (692) 0.15 474,311 (481) 0.10
– Collateral value on A 20,574 27,318
Stage 2Not collateralised 36,635 (198) 0.54 40,475 (292) 0.72
Fully collateralised 55,445 (512) 0.92 53,689 (406) 0.76
Partially collateralised (B) 15,051 (207) 1.38 10,251 (63) 0.61
Total 107,131 (917) 0.86 104,415 (761) 0.73
– Collateral value on B 7,724 4,423
Stage 3Not collateralised 1,903 (1,342) 70.52 703 (581) 82.76
Fully collateralised 945 (37) 3.92 445 (48) 10.81
Partially collateralised (C) 1,763 (428) 24.28 116 (33) 28.47
Total 4,611 (1,807) 39.19 1,264 (662) 52.43
– Collateral value on C 1,084 61
POCINot collateralised 1 – – – – –
Fully collateralised – – – – – –
Partially collateralised (D) – – – – – –
Total 1 – – – – –
– Collateral value on D – –
564,057 (3,416) 0.61 579,990 (1,904) 0.33
1 In 2020, the Group changed its presentation to include balances with HSBC Group companies. Comparatives have been re-presented accordingly.
ANNUAL REPORT 2020 87
Management Discussion and Analysis
(a) Credit Risk
(vii) Collateral and other credit enhancements
continued
(audited)
Other corporate and commercial and financial (non-bank) lending continued
(audited)
The collateral used in the assessment of the above primarily includes first legal charges over real estate and charges over cash in the commercial and industrial sector and charges over cash and marketable financial instruments in the financial sector.
It should be noted that the table above excludes other types of collateral which are commonly taken for corporate and commercial lending such as unsupported guarantees and floating charges over the assets of a customer’s business. While such mitigants have value, often providing rights in insolvency, their assignable value is insufficiently certain. They are assigned no value for disclosure purposes.
As with commercial real estate the value of real estate collateral included in the table above is generally determined through a combination of professional and internal valuations and physical inspection. The frequency of revaluation is undertaken on a similar basis to commercial real estate loans and advances; however, for financing activities in corporate and commercial lending that are not predominantly commercial real estate-oriented, collateral value is not as strongly correlated to principal repayment performance. Collateral values will generally be refreshed when an obligor’s general credit performance deteriorates and it is necessary to assess the likely performance of secondary sources of repayment should reliance upon them prove necessary. For the purposes of the table above, cash is valued at its nominal value and marketable securities at their fair value.
Placings with and advances to banks
(audited)
Placings with and advances to banks are typically unsecured. At 31 December 2020, HK$44,357m (2019: HK$65,807m) of placings with and advances to banks rated CRR 1 to 5, including loan commitments, are uncollateralised.
Derivatives
(audited)
The ISDA Master Agreement is our preferred agreement for documenting derivatives activity. It provides the contractual framework within which dealing activity across a full range of over-the-counter (‘OTC’) products is conducted, and contractually binds both parties to apply close-out netting across all outstanding transactions covered by an agreement if either party defaults or another pre-agreed termination event occurs. It is common, and the Group’s preferred practice, for the parties to execute a Credit Support Annex (‘CSA’) in conjunction with the ISDA Master Agreement. Under a CSA, collateral is passed between the parties to mitigate the counterparty risk inherent in outstanding positions. The majority of our CSAs are with financial institutional clients. Please refer to note 47 ‘Offsetting of financial assets and financial liabilities’ for further details.
Other credit risk exposures
(audited)
In addition to collateralised lending described above, other credit enhancements are employed and methods used to mitigate credit risk arising from financial assets. These are described in more detail below.
Government, bank and other financial institution-issued securities may benefit from additional credit enhancement, notably through government guarantees that reference these assets. Corporate-issued debt securities are primarily unsecured. Debt securities issued by banks and financial institutions include asset-backed securities (‘ABS’) and similar instruments, which are supported by underlying pools of financial assets. Credit risk associated with ABS is reduced through the purchase of credit default swap (‘CDS’) protection.
The Group’s maximum exposure to credit risk includes financial guarantees and similar arrangements that it issues or enters into, and loan commitments to which it is irrevocably committed. Depending on the terms of the arrangement, the Group may have recourse to additional credit mitigation in the event that a guarantee is called upon or a loan commitment is drawn and subsequently defaults. The risks and exposures from these are captured and managed in accordance with the Group’s overall credit risk management policies and procedures.
HANG SENG BANK88
Risk
(a) Credit Risk
(vii) Collateral and other credit enhancements
continued
(audited)
Collateral and other credit enhancements obtained
(audited)
The Group obtained assets by taking possession of collateral held as security, or calling other credit enhancement. The nature of these assets held as at 31 December 2020 are residential properties and commercial properties with carrying amount of HK$24m and HK$4m respectively (2019: residential properties of HK$19m).
(b) Liquidity and Funding Risk(audited)
OverviewLiquidity risk is the risk that we do not have sufficient financial resources to meet our obligations as they fall due or that we can only do so at an excessive cost. Liquidity risk arises from mismatches in the timing of cash flows. Funding risk is the risk that funding considered to be sustainable, and therefore used to fund assets, is not sustainable over time. Funding risk arises when illiquid asset positions cannot be funded at the expected terms and when required.
Liquidity and funding risk profileWe maintain a comprehensive liquidity and funding risk management framework (‘LFRF’) which aims to allow it to withstand very severe liquidity stresses. It is based on global policies that are designed to be adaptable to changing business models, markets and regulations. The LFRF comprises policies, metrics and controls designed to ensure that Group and entity management have oversight of our liquidity and funding risks in order to manage them appropriately.
We manage liquidity and funding risk at an operating entity level to ensure that obligations can be met in the jurisdiction where they fall due, generally without reliance on other parts of the Group. Operating entities are required to meet internal
minimum requirements and any applicable regulatory requirements at all times. These requirements are set against the Group’s implementation of the liquidity coverage ratio (‘LCR’) and the net stable funding ratio (‘NSFR’). Each entity is required to undertake a qualitative and quantitative assessment of the contractual and behavioural profile of its assets and liabilities when setting internal limits in order to reflect their expected behaviour under idiosyncratic, market-wide and combined stress scenarios.
Structure and organisationAsset, Liability and Capital Management (‘ALCM’) teams are responsible for the application of the LFRF at a local operating entity level. The elements of the LFRF are underpinned by a robust governance framework, the two major elements of which are:
• Asset and Liability Management Committees (‘ALCOs’) at the Group and entity level; and
• annual internal liquidity adequacy assessment process (‘ILAAP’) used to validate risk tolerance and set risk appetite.
All operating entities are required to prepare an internal liquidity adequacy assessment (‘ILAA’) document at appropriate frequency. The final objective of the ILAA, approved by the relevant Board of Directors, is to verify that the entity and subsidiaries maintain liquidity resources which are adequate in both amount and quality at all times, there is no significant risk that its liabilities cannot be met as they fall due, and a prudent funding profile is maintained.
The Board is ultimately responsible for determining the types and magnitude of liquidity risk that the Group is able to take and ensuring that there is an appropriate organisation structure for managing this risk. Under authorities delegated by the Executive Committee, the Group ALCO is responsible for managing all Asset, Liability and Capital Management issues including liquidity and funding risk management.
The Group ALCO delegates to the Group Tactical Asset and Liability Management Committee (‘TALCO’) the task of reviewing various analysis of the Group pertaining to liquidity and funding.
ANNUAL REPORT 2020 89
Management Discussion and Analysis
(b) Liquidity and Funding Risk(audited)
Structure and organisation continued
Compliance with liquidity and funding requirements is monitored by the ALCO and is reported to the RMM, Executive Committee, RC and the Board of Directors on a regular basis. This process includes:
• maintaining compliance with relevant regulatory requirements of the reporting entity;
• projecting cash flows under various stress scenarios and considering the level of liquid assets necessary in relation thereto;
• monitoring liquidity and funding ratios against internal and regulatory requirements;
• maintaining a diverse range of funding sources with adequate back-up facilities;
• managing the concentration and profile of term funding;
• managing contingent liquidity commitment exposures within pre-determined limits;
• maintaining debt financing plans;
• monitoring depositor concentration in order to avoid undue reliance on large individual depositors and ensuring a satisfactory overall funding mix; and
• maintaining liquidity contingency plans. These plans identify early indicators of stress conditions and describe actions to be taken in the event of difficulties arising from systemic or other crises, while minimising adverse long-term implications for the business.
GovernanceALCM teams apply the LFRF at both an individual entity and Group level, and are responsible for the implementation of Group-wide and local regulatory policy at a legal entity level. Markets Treasury has responsibility for cash and liquidity management.
Liquidity Risk Management (‘LRM’) carry out independent review, challenge and assurance of the appropriateness of the risk management activities undertaken by ALCM and Markets Treasury. Their work includes setting control standards, advising on policy implementation, and reviewing and challenging of reporting.
Internal Audit provide independent assurance that risk is managed effectively.
The management of liquidity and funding riskFunding and liquidity plans form part of the annual operating plan that is approved by the Board. The critical Board risk appetite measures are the LCR and NSFR. An appropriate funding and liquidity profile is managed through a wider set of measures:
• a minimum LCR requirement;
• a minimum NSFR requirement;
• a depositor concentration limit;
• three-month and twelve-month cumulative rolling term contractual maturity limits covering deposits from banks, deposits from non-bank financial institutions and securities issued;
• a minimum LCR requirement by currency;
• intra-day liquidity;
• the application of liquidity funds transfer pricing; and
• forward-looking funding assessments.
The LCR and NSFR metrics are to be supplemented by an internal liquidity metric (‘ILM’) in 2021.
HANG SENG BANK90
Risk
(b) Liquidity and Funding Risk(audited)
The management of liquidity and funding risk
continued
Liquidity coverage ratio
(unaudited)
The LCR aims to ensure that a bank has sufficient unencumbered high-quality liquid assets (‘HQLA’) to meet its liquidity needs in a 30-calendar-day liquidity stress scenario.
At 31 December 2020, all the Group’s principal operating entities were well above regulatory minimums and above the internally expected levels established by the Board.
Net stable funding ratio
(unaudited)
The Group uses the NSFR as a basis for ensuring operating entities raise sufficient stable funding to support their business activities. The NSFR requires institutions to maintain minimum amount of stable funding based on assumptions of asset liquidity.
At 31 December 2020, all the Group’s principal operating entities were above the internally expected levels established by the Board.
Depositor concentration and term funding maturity concentration
(unaudited)
The LCR and NSFR metrics assume a stressed outflow based on a portfolio of depositors within each deposit segment. The validity of these assumptions is challenged if the portfolio of depositors is not large enough to avoid depositor concentration. Operating entities are exposed to term refinancing concentration risk if the current maturity profile results in future maturities being overly concentrated in any defined period.
At 31 December 2020, all the Group’s principal operating entities were above the internally expected levels established by the Board.
Sources of funding
(unaudited)
Our primary sources of funding are customer deposits. We issue wholesale securities to supplement our customer deposits and change the currency mix or maturity profile of our liabilities.
Currency mismatch in the LCR
(unaudited)
The LFRF requires all operating entities to monitor material single currency LCR. Limits are set to ensure that outflows can be met, given assumptions on stressed capacity in the FX swap markets.
Additional contractual obligations
(unaudited)
Under the terms of our current collateral obligations under derivative contracts (which are ISDA compliant CSA contracts), the additional collateral required to post in the event of one-notch and two-notch downgrade in credit ratings is immaterial.
Liquidity and funding risk in 2020
(unaudited)
The Group is required to calculate its LCR and NSFR on a consolidated basis in accordance with rule 11(1) of The Banking (Liquidity) Rules (‘BLR’). The Group is required to maintain both LCR and NSFR of not less than 100%.
ANNUAL REPORT 2020 91
Management Discussion and Analysis
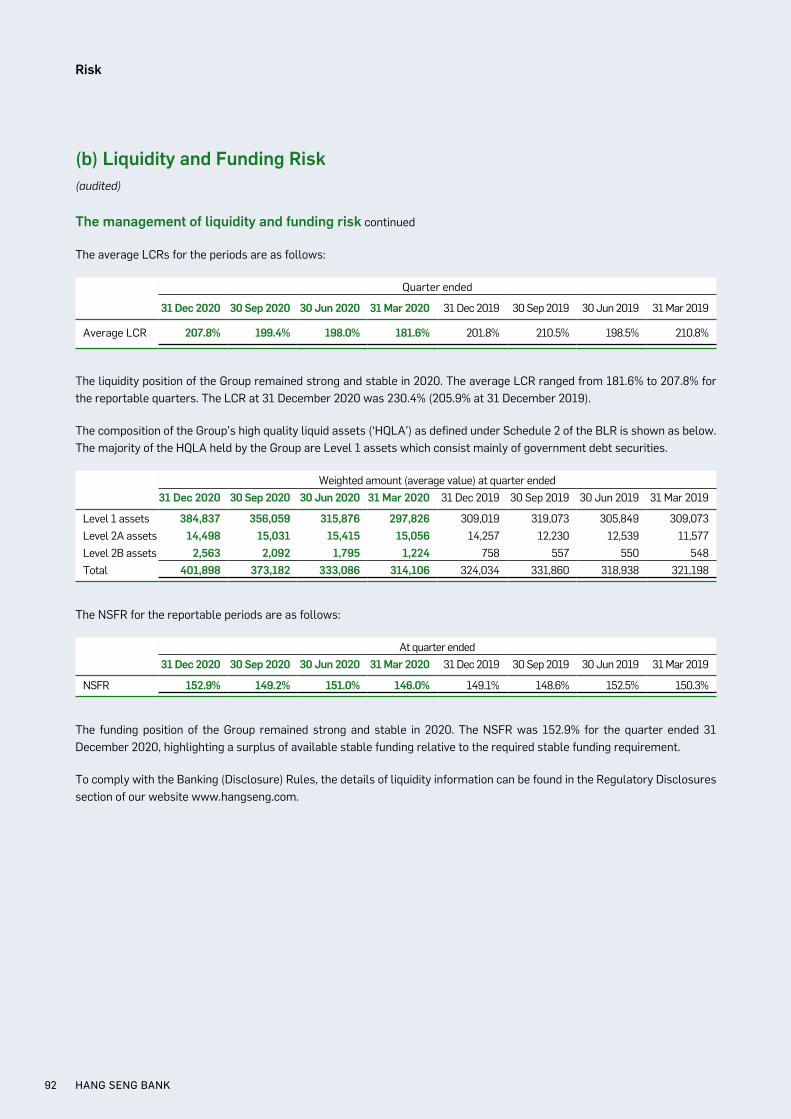
(b) Liquidity and Funding Risk(audited)
The management of liquidity and funding risk continued
The average LCRs for the periods are as follows:
Quarter ended
31 Dec 2020 30 Sep 2020 30 Jun 2020 31 Mar 2020 31 Dec 2019 30 Sep 2019 30 Jun 2019 31 Mar 2019
Average LCR 207.8% 199.4% 198.0% 181.6% 201.8% 210.5% 198.5% 210.8%
The liquidity position of the Group remained strong and stable in 2020. The average LCR ranged from 181.6% to 207.8% for the reportable quarters. The LCR at 31 December 2020 was 230.4% (205.9% at 31 December 2019).
The composition of the Group’s high quality liquid assets (‘HQLA’) as defined under Schedule 2 of the BLR is shown as below. The majority of the HQLA held by the Group are Level 1 assets which consist mainly of government debt securities.
Weighted amount (average value) at quarter ended31 Dec 2020 30 Sep 2020 30 Jun 2020 31 Mar 2020 31 Dec 2019 30 Sep 2019 30 Jun 2019 31 Mar 2019
Level 1 assets 384,837 356,059 315,876 297,826 309,019 319,073 305,849 309,073Level 2A assets 14,498 15,031 15,415 15,056 14,257 12,230 12,539 11,577Level 2B assets 2,563 2,092 1,795 1,224 758 557 550 548Total 401,898 373,182 333,086 314,106 324,034 331,860 318,938 321,198
The NSFR for the reportable periods are as follows:
At quarter ended31 Dec 2020 30 Sep 2020 30 Jun 2020 31 Mar 2020 31 Dec 2019 30 Sep 2019 30 Jun 2019 31 Mar 2019
NSFR 152.9% 149.2% 151.0% 146.0% 149.1% 148.6% 152.5% 150.3%
The funding position of the Group remained strong and stable in 2020. The NSFR was 152.9% for the quarter ended 31 December 2020, highlighting a surplus of available stable funding relative to the required stable funding requirement.
To comply with the Banking (Disclosure) Rules, the details of liquidity information can be found in the Regulatory Disclosures section of our website www.hangseng.com.
HANG SENG BANK92
Risk
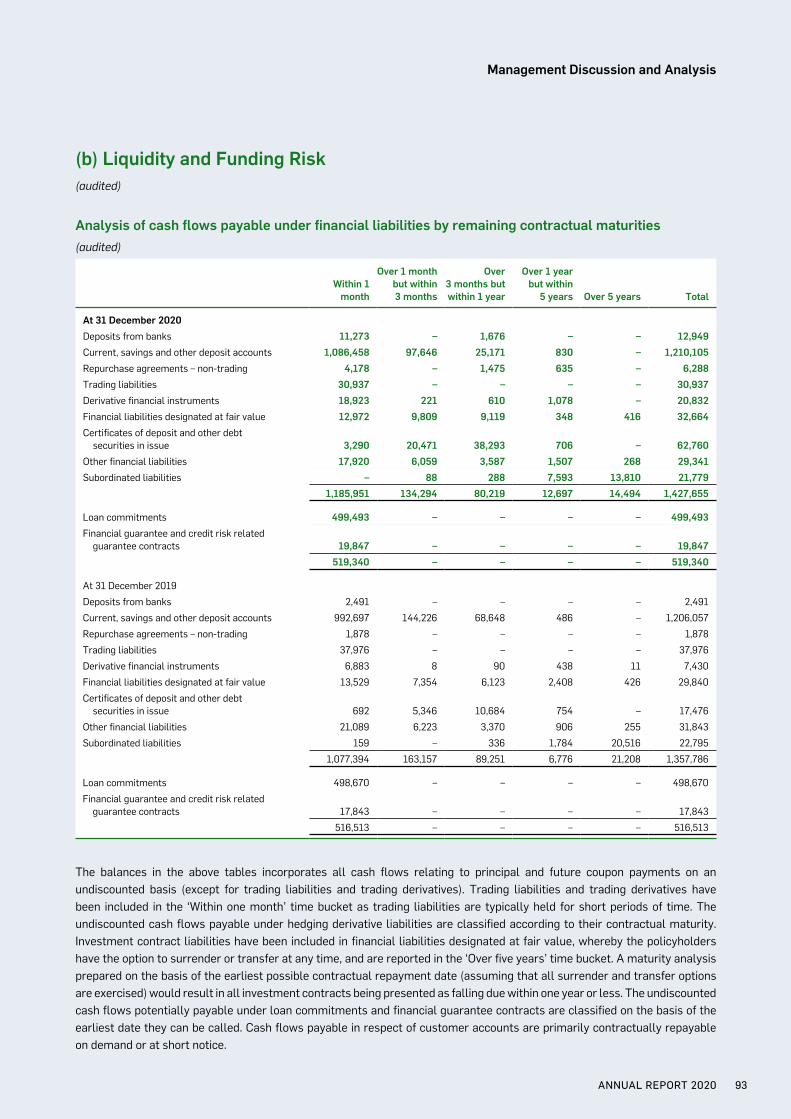
(b) Liquidity and Funding Risk(audited)
Analysis of cash flows payable under financial liabilities by remaining contractual maturities(audited)
Within 1 month
Over 1 month but within 3 months
Over 3 months but within 1 year
Over 1 year but within
5 years Over 5 years Total
At 31 December 2020Deposits from banks 11,273 – 1,676 – – 12,949Current, savings and other deposit accounts 1,086,458 97,646 25,171 830 – 1,210,105Repurchase agreements – non-trading 4,178 – 1,475 635 – 6,288Trading liabilities 30,937 – – – – 30,937Derivative financial instruments 18,923 221 610 1,078 – 20,832Financial liabilities designated at fair value 12,972 9,809 9,119 348 416 32,664Certificates of deposit and other debt securities in issue 3,290 20,471 38,293 706 – 62,760Other financial liabilities 17,920 6,059 3,587 1,507 268 29,341Subordinated liabilities – 88 288 7,593 13,810 21,779
1,185,951 134,294 80,219 12,697 14,494 1,427,655
Loan commitments 499,493 – – – – 499,493Financial guarantee and credit risk related guarantee contracts 19,847 – – – – 19,847
519,340 – – – – 519,340
At 31 December 2019
Deposits from banks 2,491 – – – – 2,491
Current, savings and other deposit accounts 992,697 144,226 68,648 486 – 1,206,057
Repurchase agreements – non-trading 1,878 – – – – 1,878
Trading liabilities 37,976 – – – – 37,976
Derivative financial instruments 6,883 8 90 438 11 7,430
Financial liabilities designated at fair value 13,529 7,354 6,123 2,408 426 29,840
Certificates of deposit and other debt securities in issue 692 5,346 10,684 754 – 17,476
Other financial liabilities 21,089 6,223 3,370 906 255 31,843
Subordinated liabilities 159 – 336 1,784 20,516 22,795
1,077,394 163,157 89,251 6,776 21,208 1,357,786
Loan commitments 498,670 – – – – 498,670
Financial guarantee and credit risk related guarantee contracts 17,843 – – – – 17,843
516,513 – – – – 516,513
The balances in the above tables incorporates all cash flows relating to principal and future coupon payments on an undiscounted basis (except for trading liabilities and trading derivatives). Trading liabilities and trading derivatives have been included in the ‘Within one month’ time bucket as trading liabilities are typically held for short periods of time. The undiscounted cash flows payable under hedging derivative liabilities are classified according to their contractual maturity. Investment contract liabilities have been included in financial liabilities designated at fair value, whereby the policyholders have the option to surrender or transfer at any time, and are reported in the ‘Over five years’ time bucket. A maturity analysis prepared on the basis of the earliest possible contractual repayment date (assuming that all surrender and transfer options are exercised) would result in all investment contracts being presented as falling due within one year or less. The undiscounted cash flows potentially payable under loan commitments and financial guarantee contracts are classified on the basis of the earliest date they can be called. Cash flows payable in respect of customer accounts are primarily contractually repayable on demand or at short notice.
ANNUAL REPORT 2020 93
Management Discussion and Analysis
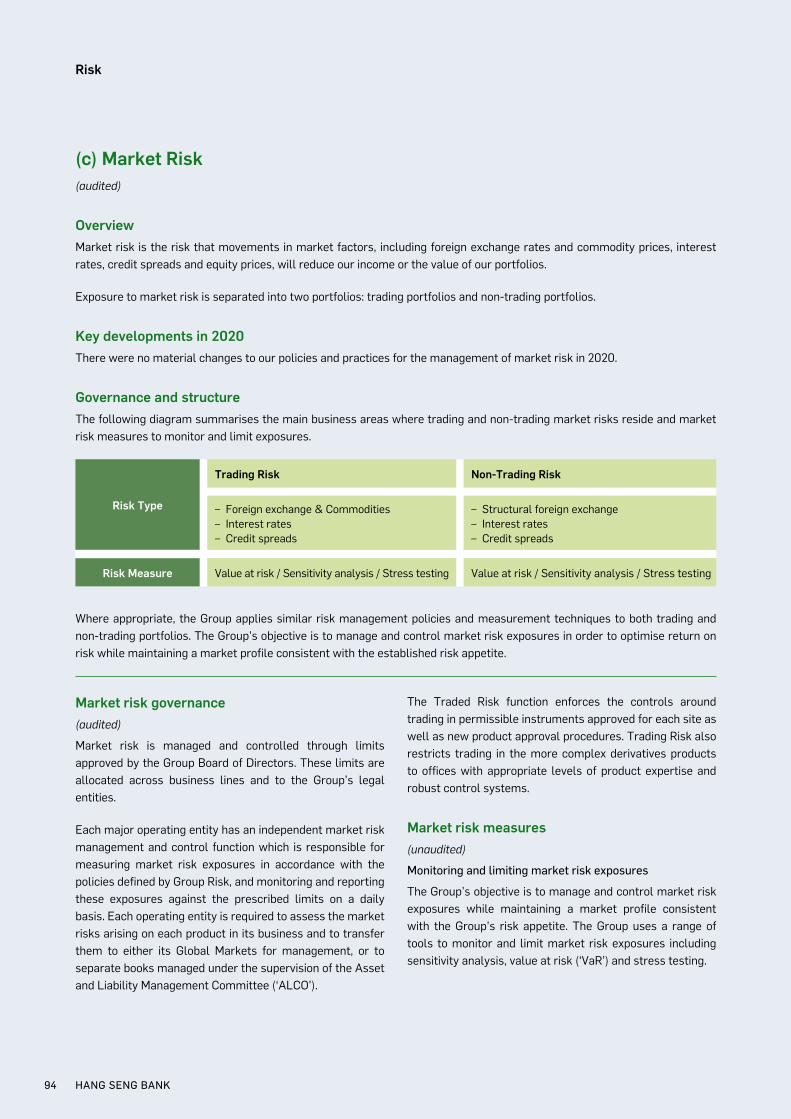
(c) Market Risk(audited)
OverviewMarket risk is the risk that movements in market factors, including foreign exchange rates and commodity prices, interest rates, credit spreads and equity prices, will reduce our income or the value of our portfolios.
Exposure to market risk is separated into two portfolios: trading portfolios and non-trading portfolios.
Key developments in 2020There were no material changes to our policies and practices for the management of market risk in 2020.
Governance and structureThe following diagram summarises the main business areas where trading and non-trading market risks reside and market risk measures to monitor and limit exposures.
Risk Type
Trading Risk Non-Trading Risk
– Foreign exchange & Commodities– Interest rates– Credit spreads
– Structural foreign exchange– Interest rates– Credit spreads
Risk Measure Value at risk / Sensitivity analysis / Stress testing Value at risk / Sensitivity analysis / Stress testing
Where appropriate, the Group applies similar risk management policies and measurement techniques to both trading and non-trading portfolios. The Group’s objective is to manage and control market risk exposures in order to optimise return on risk while maintaining a market profile consistent with the established risk appetite.
Market risk governance(audited)
Market risk is managed and controlled through limits approved by the Group Board of Directors. These limits are allocated across business lines and to the Group’s legal entities.
Each major operating entity has an independent market risk management and control function which is responsible for measuring market risk exposures in accordance with the policies defined by Group Risk, and monitoring and reporting these exposures against the prescribed limits on a daily basis. Each operating entity is required to assess the market risks arising on each product in its business and to transfer them to either its Global Markets for management, or to separate books managed under the supervision of the Asset and Liability Management Committee (‘ALCO’).
The Traded Risk function enforces the controls around trading in permissible instruments approved for each site as well as new product approval procedures. Trading Risk also restricts trading in the more complex derivatives products to offices with appropriate levels of product expertise and robust control systems.
Market risk measures(unaudited)
Monitoring and limiting market risk exposures
The Group’s objective is to manage and control market risk exposures while maintaining a market profile consistent with the Group’s risk appetite. The Group uses a range of tools to monitor and limit market risk exposures including sensitivity analysis, value at risk (‘VaR’) and stress testing.
HANG SENG BANK94
Risk

(c) Market Risk(audited)
Market risk measures continued
(unaudited)
Sensitivity analysis
(unaudited)
Sensitivity analysis measures the impact of individual market factor movements on specific instruments or portfolios including interest rates, foreign exchange rates and equity prices. The Group uses sensitivity measures to monitor the market risk positions within each risk type. Granular sensitivity limits are set primarily for trading desks with consideration of market liquidity, customer demand and capital constraints, among other factors.
Value at risk (‘VaR’)
VaR is a technique for estimating potential losses on risk positions as a result of movements in market rates and prices over a specified time horizon and to a given level of confidence. The use of VaR is integrated into market risk management and calculated for all trading positions regardless of how the Group capitalises them. In addition, the Group calculates VaR for non-trading portfolios to have a complete picture of risk. Where VaR is not calculated explicitly, the Group uses alternative tools as summarised in the ‘Stress testing’ section below.
Standard VaR is calculated at a 99% confidence level for a one-day holding period while Stressed VaR uses a 10-day holding period and a 99% confidence interval based on a continuous one-year historical significant stress period. The VaR models used by the Group are predominantly based on historical simulation which incorporate the following features:
• historical market rates and prices are calculated with reference to foreign exchange rates, commodity prices, interest rates, equity prices and the associated volatilities;
• potential market movements which are calculated with reference to data from the past two years; and
• Standard VaR is calculated to a 99% confidence level and using a one-day holding period.
The models also incorporate the effect of the option features on the underlying exposures. The nature of the VaR models means that an increase in observed market volatility will lead to an increase in VaR without any changes in the underlying positions.
VaR model limitations
Although a valuable guide to risk, VaR should always be viewed in the context of its limitations. For example:
• the use of historical data as a proxy for estimating future market moves may not encompass all potential market events, particularly those that are extreme in nature;
• the use of a one-day holding period for risk management purposes of trading and non-trading books assumes that this short period is sufficient to hedge or liquidate all positions;
• the use of a 99% confidence level, by definition does not take into account losses that might occur beyond this level of confidence; and
• VaR is calculated on the basis of exposures outstanding at the close of business and therefore does not reflect intra-day exposures.
Risk not in VaR (‘RNIV’) framework
(unaudited)
The risks not in VaR (‘RNIV’) framework aims to capture and capitalise material market risks that are not adequately covered in the VaR model.
Risk factors are reviewed on a regular basis and either incorporated directly in the VaR models, where possible, or quantified through either the VaR-based RNIV approach or a stress test approach within the RNIV framework.
ANNUAL REPORT 2020 95
Management Discussion and Analysis
(c) Market Risk(audited)
Market risk measures continued
(unaudited)
Stress testing
(audited)
Stress testing is an important tool that is integrated into the Group’s market risk management framework to evaluate the potential impact on portfolio values of more extreme, although plausible, events or movements in a set of financial variables. In such abnormal scenarios, losses can be much greater than those predicted by VaR modelling.
Stress testing is implemented at legal entity and overall Group levels. A scoring framework is in place for management to effectively assess the severity of the potential stress losses and the likelihood of occurrence of the stress scenarios. The risk appetite around potential stress losses for the Group is set and monitored against referral limits.
Market risk reverse stress tests are designed to identify vulnerabilities in our portfolios by looking for scenarios that lead to loss levels considered severe for the relevant portfolio. These scenarios may be quite local or idiosyncratic in nature, and complement the systematic top-down stress testing.
Stress testing and reverse stress testing provide senior management with insights regarding the ‘tail risk’ beyond VaR, for which risk appetite is limited.
Trading portfoliosTrading portfolios comprise positions held for client servicing and market-making, with the intention of short-term resale and / or to hedge risks resulting from such positions.
Market risk in 2020(unaudited)
Global financial conditions worsened rapidly with the onset of the COVID-19 outbreak from mid-February 2020. Market volatility reached extreme levels across most asset classes and equity prices fell sharply. In credit markets, spreads and yields reached multi-year highs. The gold market experienced COVID-19 related disruption in refining and transportation, affecting the relative pricing of gold futures contracts. Oil prices collapsed due to rising oversupply as demand reduced materially from the economic slowdown. Financial markets stabilised from April onwards, as governments announced economic recovery programmes and key central banks intervened to provide liquidity and support asset prices. Global equity markets substantially recovered from their losses in February-March and credit spreads reverted towards pre-COVID-19 levels. Markets remained susceptible to further bouts of volatility triggered by increases in COVID-19 cases and deaths, and various geopolitical risks.
We managed market risk prudently during 2020. Sensitivity exposures remained within appetite as the business pursued its core market-making activity in support of our customers during the outbreak. We also managed our portfolios to protect the business from potential future deterioration in credit conditions. Market risk continued to be managed using a complementary set of exposure measures and limits, including stress and scenario analysis.
Trading portfolios(audited)
Value at risk of the trading portfolios
The Trading VaR at 31 December 2020 increased when compared against 31 December 2019 due to the increase in interest rate trading positions. In average terms, the VaR level was also higher in 2020.
HANG SENG BANK96
Risk
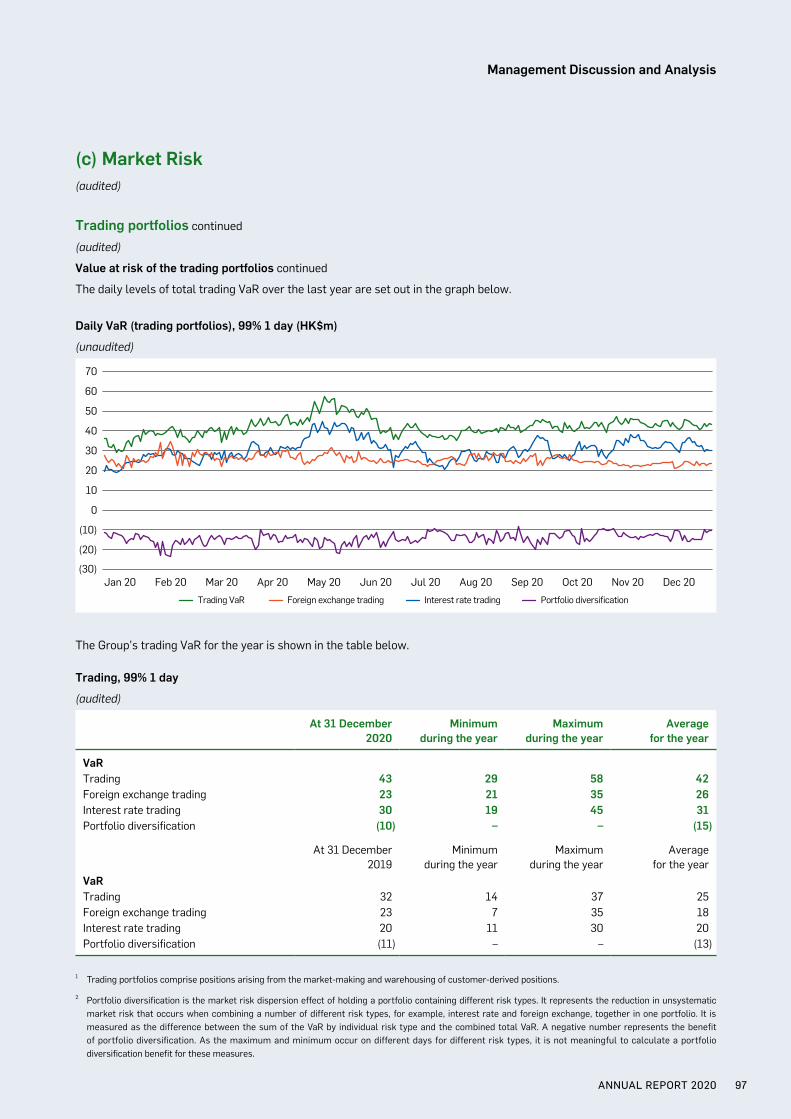
(c) Market Risk(audited)
Trading portfolios continued
(audited)
Value at risk of the trading portfolios continued
The daily levels of total trading VaR over the last year are set out in the graph below.
Daily VaR (trading portfolios), 99% 1 day (HK$m)
(unaudited)
(30)
(20)
(10)
0
10
20
30
40
50
60
70
Trading VaR Foreign exchange trading Interest rate trading Portfolio diversification
Dec 20Nov 20Oct 20Sep 20Aug 20Jul 20Jun 20May 20Apr 20Mar 20Feb 20Jan 20
The Group’s trading VaR for the year is shown in the table below.
Trading, 99% 1 day
(audited)
At 31 December2020
Minimumduring the year
Maximumduring the year
Averagefor the year
VaRTrading 43 29 58 42Foreign exchange trading 23 21 35 26Interest rate trading 30 19 45 31Portfolio diversification (10) – – (15)
At 31 December2019
Minimum during the year
Maximum during the year
Averagefor the year
VaRTrading 32 14 37 25Foreign exchange trading 23 7 35 18Interest rate trading 20 11 30 20Portfolio diversification (11) – – (13)
1 Trading portfolios comprise positions arising from the market-making and warehousing of customer-derived positions.
2 Portfolio diversification is the market risk dispersion effect of holding a portfolio containing different risk types. It represents the reduction in unsystematic market risk that occurs when combining a number of different risk types, for example, interest rate and foreign exchange, together in one portfolio. It is measured as the difference between the sum of the VaR by individual risk type and the combined total VaR. A negative number represents the benefit of portfolio diversification. As the maximum and minimum occur on different days for different risk types, it is not meaningful to calculate a portfolio diversification benefit for these measures.
ANNUAL REPORT 2020 97
Management Discussion and Analysis
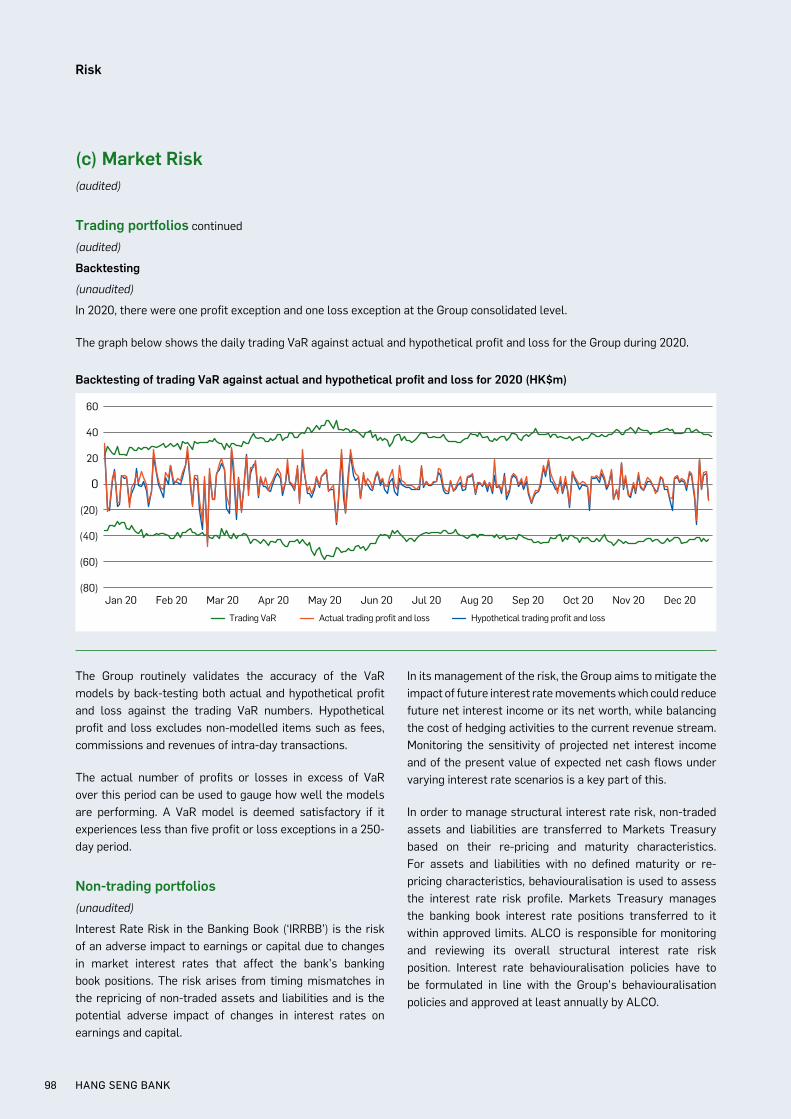
(c) Market Risk(audited)
Trading portfolios continued
(audited)
Backtesting
(unaudited)
In 2020, there were one profit exception and one loss exception at the Group consolidated level.
The graph below shows the daily trading VaR against actual and hypothetical profit and loss for the Group during 2020.
The Group routinely validates the accuracy of the VaR models by back-testing both actual and hypothetical profit and loss against the trading VaR numbers. Hypothetical profit and loss excludes non-modelled items such as fees, commissions and revenues of intra-day transactions.
The actual number of profits or losses in excess of VaR over this period can be used to gauge how well the models are performing. A VaR model is deemed satisfactory if it experiences less than five profit or loss exceptions in a 250-day period.
Non-trading portfolios(unaudited)
Interest Rate Risk in the Banking Book (‘IRRBB’) is the risk of an adverse impact to earnings or capital due to changes in market interest rates that affect the bank’s banking book positions. The risk arises from timing mismatches in the repricing of non-traded assets and liabilities and is the potential adverse impact of changes in interest rates on earnings and capital.
Trading VaR Actual trading profit and loss Hypothetical trading profit and loss
(80)
(60)
(40)
(20)
0
20
40
60
Dec 20Nov 20Oct 20Sep 20Aug 20Jul 20Jun 20May 20Apr 20Mar 20Feb 20Jan 20
Backtesting of trading VaR against actual and hypothetical profit and loss for 2020 (HK$m)
In its management of the risk, the Group aims to mitigate the impact of future interest rate movements which could reduce future net interest income or its net worth, while balancing the cost of hedging activities to the current revenue stream. Monitoring the sensitivity of projected net interest income and of the present value of expected net cash flows under varying interest rate scenarios is a key part of this.
In order to manage structural interest rate risk, non-traded assets and liabilities are transferred to Markets Treasury based on their re-pricing and maturity characteristics. For assets and liabilities with no defined maturity or re-pricing characteristics, behaviouralisation is used to assess the interest rate risk profile. Markets Treasury manages the banking book interest rate positions transferred to it within approved limits. ALCO is responsible for monitoring and reviewing its overall structural interest rate risk position. Interest rate behaviouralisation policies have to be formulated in line with the Group’s behaviouralisation policies and approved at least annually by ALCO.
HANG SENG BANK98
Risk
(c) Market Risk(audited)
Non-trading portfolios continued
(unaudited)
Sensitivity of net interest income
(audited)
A principal part of the Group’s management of non-traded interest rate risk is to monitor the sensitivity of projected net interest income at least quarterly under varying interest rate scenarios (simulation modelling), where all other economic variables are held constant. This monitoring is undertaken at bank level by ALCO, where the Group forecasts both one-year and five-year NII sensitivities across a range of interest rate scenarios.
Sensitivity of net interest income reflects the Group’s sensitivity of earnings due to changes in market interest rates. The Group forecasts net interest income sensitivities across a range of interest rate scenarios based on a static balance sheet assumption.
The table below sets out the effect on future net interest income of 100 basis points parallel rises or falls in all yield curves at the beginning of year from 1 January 2021 and 25 basis points parallel rises or falls in all yield curves at the beginning of year from 1 January 2021.
Assuming no management actions and all other non-interest rate risk variables remain constant, such a series of parallel rises in all yield curves would increase projected net interest income for the year ending 31 December 2021 by HK$4,159m for 100 basis points case and by HK$1,041m for 25 basis points case, while such a series of parallel falls in all-in yield curves would decrease projected net interest income by HK$3,136m for 100 basis points case and by HK$1,262m for 25 basis points case.
The sensitivity of projected net interest income is described as follows:
100bpparallel
increase
100bpparallel
decrease
25bpparallel
increase
25bpparallel
decrease
Change in 2021 projected net interest income– HKD 2,679 (1,311) 670 (759)– USD 411 (694) 103 (230)– other 1,069 (1,131) 268 (273)Total 4,159 (3,136) 1,041 (1,262)
Change in 2020 projected net interest income– HKD 1,514 (2,411) 374 (601)– USD 445 (973) 112 (242)– other 554 (602) 136 (138)Total 2,513 (3,986) 622 (981)
The interest rate sensitivities set out in the table above represent the effect of the movements in projected yield curves based on a constant balance sheet size and structure. This effect, however, does not incorporate actions which would probably be taken by Markets Treasury or in the business units to mitigate the effect of interest rate risk. In reality, Markets Treasury proactively seeks to change the interest rate risk profile to optimise net revenues. The net interest income sensitivity calculations assume that interest rates of all maturities move by the same amount in the ‘up-shock’ scenario. Rates are not assumed to become negative in the ‘down-shock’ scenario unless the central bank rate is already negative and then not assumed to go further negative, which may, in certain currencies, effectively result in non-parallel shock. In addition, the net interest income sensitivity calculations take into account of the effect on net interest income of anticipated differences in changes between interbank interest rates and interest rates over which the entity has discretion in terms of the timing and extent of rate changes.
ANNUAL REPORT 2020 99
Management Discussion and Analysis

(c) Market Risk(audited)
Non-trading portfolios continued
(unaudited)
Sensitivity of net interest income continued
(audited)
Key assumptions used in the measurement of interest rate sensitivities include business line interest rate pass-on assumptions, re-investment of maturing assets and refinancing of liabilities at market rates per shock scenario and prepayment risk. Markets Treasury is modelled based on no management actions i.e. the risk profile at the month end is assumed to remain constant throughout the forecast horizon. The projections make other assumptions, including that contractually fixed term positions run to maturity, managed rate products and non-interest bearing balances, such as interest-free current accounts, are subject to interest rate risk behaviouralisation.
Sensitivity of economic value of equity
Economic value of equity (‘EVE’) represents the present value of the future banking book cash flows that could be distributed to equity providers under a managed run-off scenario. This equates to the current book value of equity plus the present value of future net interest income in this scenario. EVE can be used to assess the economic capital
required to support interest rate risk in the banking book. An EVE sensitivity represents the expected movement in EVE due to pre-specified movements in interest rates, where all other economic variables are held constant. The Group is required to monitor EVE sensitivity as a percentage of Tier 1 capital resources.
The Group’s EVE sensitivity is prepared in accordance with the HKMA ‘Return of Interest Rate Risk Exposure – (MA(BS)12A)’. For details of the Group’s EVE sensitivity, please refer to the Banking Disclosure Statement that will be available in the ‘Regulatory Disclosures’ section of the Bank’s website.
Sensitivity of reserves
The Group measures the potential downside risk to the CET1 ratio due to interest rate and credit spread risk in the Hold to Collect and Sell (‘HTC&S’) portfolio by the portfolio’s stressed VaR, using 99% confidence level and an assumed holding period of one quarter. At 31 December 2020, the stressed VaR of the portfolio was HK$1,281m.
The Group monitors the sensitivity of reported cash flow hedge reserves to interest rate movements on a quarterly basis by assessing the expected reduction in valuation of cash flow hedge due to parallel movements of plus or minus 100bps in all yield curves. These particular exposures form only a part of the Group’s overall interest rate risk exposures.
The following table describes the sensitivity of reported cash flow hedge reserves to the stipulated movements in yield curves. The sensitivities are indicative and based on simplified scenarios.
At 31 December 2020
Maximum impact
Minimum impact
+ 100 basis points parallel move in all yield curves (51) (76) (51)As a percentage of shareholders’ equity at 31 December 2020 (%) (0.03) (0.04) (0.03)
– 100 basis points parallel move in all yield curves 98 251 98As a percentage of shareholders’ equity at 31 December 2020 (%) 0.05 0.14 0.05
At 31 December 2019
Maximum impact
Minimum impact
+ 100 basis points parallel move in all yield curves (76) (118) (76)As a percentage of shareholders’ equity at 31 December 2019 (%) (0.04) (0.07) (0.04)
– 100 basis points parallel move in all yield curves 182 224 180As a percentage of shareholders’ equity at 31 December 2019 (%) 0.10 0.13 0.10
HANG SENG BANK100
Risk

(c) Market Risk(audited)
Non-trading portfolios continued
(unaudited)
Foreign exchange exposures
(audited)
The Group’s structural foreign exchange exposure, monitored using sensitivity analysis, represents the Group’s foreign currency investments in subsidiaries, branches and associates, and the fair value of the Group’s long-term foreign currency equity investments, the functional currencies of which are currencies other than the HK dollar. An entity’s functional currency is normally that of the primary economic environment in which the entity operates. The Group’s structural foreign exchange exposures are managed by the Group’s ALCO with the primary objective of ensuring, where practical, that the Group’s and the Bank’s capital ratios are largely protected from the effect of changes in exchange rates.
Exchange differences on structural exposures are recognised in ‘Other comprehensive income’.
The Group’s foreign exchange exposures are prepared in accordance with the HKMA ‘Return of Foreign Currency Position – (MA(BS)6)’.
For details of the Group’s non-structural and structural foreign currency positions, please refer to the Banking Disclosure Statement that is available in the ‘Regulatory Disclosures’ section of the Bank’s website.
Equities exposures
(audited)
The Group’s equities exposures in 2020 and 2019 are reported as ‘Financial assets designated and otherwise mandatorily measured at fair value through profit or loss’, ‘Financial investments’ and ‘Trading assets’ in the financial statements. These are subject to trading limit and risk management control procedures and other market risk regime.
(d) Resilience Risk(unaudited)
OverviewResilience risk is the risk that we are unable to provide critical services to our customers, affiliates and counterparties, as a result of sustained and significant operational disruption. Resilience risk arises from failures or inadequacies in processes, people, systems or external events.
Resilience risk managementKey developments in 2020
Resilience Risk continued to provide guidance and stewardship to our businesses and functions about how we can prevent, adapt, and learn from resilience-related threats when something goes wrong. We view resilience through six lenses: strategic change and emerging threats, third-party risk, information and data resilience, payments and processing resilience, systems and cyber resilience, and protective security risk. In 2020 we have:
• Restructured the Risk Taxonomy and Control Library and conducted Risk and Control Assessment refreshes accordingly;
• Streamlined and simplified the policies for Resilience Risk;
• Developed a Target Operating Model to envision our desired state for the Operational and Resilience Risk function. We compared the desired state to our ‘as-is’ model to identify areas where we need to further develop the Operational and Resilience Risk vision; and
• Deployed risk management oversight of the material change initiatives across our businesses.
Key risk management processes
Operational Resilience is our ability to anticipate, prevent, adapt, respond to, recover and learn from internal or external disruption, protecting customers, the markets we operate in and their economic stability. Resilience is determined by assessing whether we are able to continue to provide our most important services, within an agreed level. We accept that we will not be able to prevent all disruption, but we prioritise investment to continuously improve our response and recovery capability for our most important business services.
ANNUAL REPORT 2020 101
Management Discussion and Analysis
(d) Resilience Risk(unaudited)
Governance and structure
A principal senior management meeting for Resilience Risk governance is the Resilience Risk Governance Meeting, co-chaired by Head of Resilience Risk and Chief Information Officer, with an escalation path to the HASE Risk Management Meeting and HSBC Asia Pacific Resilience Risk Governance Meeting.
Business operations continuity
As a result of COVID-19, we successfully implemented business continuity responses and continued to maintain the majority of service level agreements. We did not experience any major impacts to the supply chain from our third-party service providers due to COVID-19. The risk of damage or theft to our physical assets or criminal injury to our colleagues remains unchanged and no significant incidents impacted our buildings or people.
(e) Regulatory Compliance Risk(unaudited)
OverviewRegulatory compliance risk is the risk that we fail to observe the letter and spirit of all relevant laws, codes, rules, regulations and standards of good market practice, and incur fines and penalties and suffer damage to our business as a consequence.
The Regulatory Compliance function provides independent, objective oversight and challenge and promotes a compliance oriented culture, supporting the business in delivering fair outcomes for customers, maintaining the integrity of financial markets and achieving the Group’s strategic objectives.
Key developments in 2020
There were no material changes to the policies and practices for the management of regulatory compliance risk in 2020, except for the initiatives that we undertook to raise our standards in relation to the conduct of our business, as described below under ‘Conduct of business’.
Governance and structure
Regulatory Compliance is part of the Compliance function and provides guidance and advice to business and functions with the support and guidance provided by regional and country Regulatory Compliance teams.
Key risk management processes
We regularly review our policies and procedures. Global policies and procedures require the prompt identification and escalation of any actual or potential regulatory breach to Regulatory Compliance. Reportable events are escalated to the RMM and RC, as appropriate.
Conduct of business
In 2020, we continued to take steps to raise our standards relating to conduct, which included:
• delivering further mandatory conduct training to all employees;
• incorporating the assessment of expected values and behaviours as key determinants in recruitment, performance appraisal and remuneration processes;
• improving our market surveillance capability;
• introducing policies and procedures to strengthen support for potentially vulnerable customers;
• enhancing the quality and depth of conduct management information and how it is used across the Bank;
• implementing an assessment process to check the effectiveness of our conduct initiatives across the Bank; and
• assessing conduct standards and practices within our key third party suppliers and distributors.
HANG SENG BANK102
Risk
(f) Financial Crime Risk(unaudited)
OverviewFinancial crime risk is the risk that we knowingly or unknowingly help parties to commit or to further potentially illegal activity through the Bank, including money laundering, fraud, bribery and corruption, tax evasion, sanctions breaches, and terrorist and proliferation financing. Financial crime risk arises from day-to-day banking operations.
Financial crime risk managementKey developments in 2020
In 2020, we continued to strengthen our fight against financial crime and to enhance our financial crime risk management capability. Amid the challenges posed by COVID-19 pandemic, we introduced a number of financial crime risk management measures to support the business and our customers. These included:
• We supported the most vulnerable customers and those in financial difficulty, including the raising of fraud awareness during this period;
• The Compliance function proactively engaged with other parts of the organisation to ensure financial crime risks were considered as part of COVID-19-related decisions; and
• We supported customers and the organisation through policy exceptions and introducing virtual onboarding.
We consistently review the effectiveness of our financial crime risk management framework, which includes consideration of geopolitical and wider economic factors. The sanctions regulatory environment has remained changeable and uncertain during the course of 2020 due to the ongoing geopolitical tensions between the US and
China, and the increasing divergence in sanctions policies between the US and the EU on Iran and Russia. We comply with all applicable sanctions regulations in the jurisdictions in which we operate, and continue to monitor the geopolitical landscape for ongoing developments. We also continued to progress several key financial crime risk management initiatives, including:
• We continued to strengthen our anti-fraud capabilities, focusing on threats posed by new and existing technologies, and have delivered a comprehensive fraud training programme across the bank.
• We continued to invest in the use of artificial intelligence (‘AI’) and advanced analytics techniques to manage financial crime risk, and we published our principles for the ethical use of Big Data and AI.
• We continued to work on strengthening our ability to combat money laundering and terrorist financing. In particular, we focused on the use of technology to enhance our risk management processes while minimising the impact to the customer. We also continued to develop our approach of intelligence led financial crime risk management, in part, through enhancements to our automated transaction monitoring systems.
Governance and structure
Since establishing a global framework of Financial Crime Risk Management Committees in 2018, we have continued to strengthen and review the effectiveness of our governance framework to manage financial crime risk. They help to enable compliance with the letter and the spirit of all applicable financial crime compliance laws and regulations, as well as our own standards, values and policies relating to financial crime risks. The Financial Crime Risk Management Meeting, chaired by the Chief Executive, has served as the pinnacle of this governance structure, ultimately responsible for the management of financial crime risk.
ANNUAL REPORT 2020 103
Management Discussion and Analysis

(f) Financial Crime Risk(unaudited)
Financial crime risk management continued
Key risk management processes
The Group continued to deliver a programme to further enhance the policies and controls around identifying and managing the risks of bribery and corruption across our business. Recognising that the fight against financial crime is a constant challenge, we maintained our investment in operational controls and new technology to deter and detect criminal activity in the banking system. The Group continued to simplify our governance and policy frameworks, and our management information reporting process which demonstrates the effectiveness of our financial crime controls. We remain committed to enhancing our risk assessment capabilities and to delivering more proactive risk management, including our ongoing investment in the next generation of capabilities to fight financial crime by applying advanced analytics and AI.
We are committed to working in partnership with the wider industry and the public sector in managing financial crime risk, protecting the integrity of the financial system, and helping to protect the communities we serve. We are a strong advocate of public-private partnerships and participate in a number of information-sharing initiatives around the world.
The Group have been an advocate for a more effective international framework for managing financial crime risk, whether through engaging directly with intergovernmental bodies such as the Financial Action Task Force, the global money laundering and terrorist financing watchdog, or via our key role in industry groups such as the Wolfsberg Group and the Institute of International Finance.
(g) Model Risk(unaudited)
OverviewModel risk is the potential for adverse consequences from business decisions informed by models, which can be exacerbated by errors in methodology, design or the way they are used. Model risk arises in both financial and non-financial contexts whenever business decision making includes reliance on models.
Key developments in 2020
We adopted the refined HSBC Group model risk policy to enable a more risk-based approach to model risk management.
We reviewed the model governance arrangements overseeing model risk, resulting in a range of enhancements to the underlying structure to improve effectiveness and increase business engagement.
We worked with the businesses and functions to develop the Model Risk Control Assessments based on the new model risk controls in the Risk Control Library.
The consequences of COVID-19 on HKFRS 9 model performance and reliability has resulted in enhanced monitoring of those models and related model adjustments. Dramatic changes to model inputs such as GDP and unemployment rates have made the model results less reliable. As a result, greater reliance has been placed on management underlays / overlays based on business judgement to derive expected credit losses.
Key risk management processes
We use a variety of modelling approaches, including regression, simulation, sampling, machine learning and judgemental scorecards for a range of business applications, in activities such as customer selection, product pricing, financial crime transaction monitoring, creditworthiness evaluation and financial reporting.
We regularly review our model risk management policies and procedures, and require the first line of defence to demonstrate comprehensive and effective model risk controls.
We report on model risk to RMM on a regular basis. We also review the effectiveness of our model oversight structure to ensure appropriate understanding and ownership of model risk is embedded in the businesses and functions.
HANG SENG BANK104
Risk
(h) Insurance Manufacturing Operation Risk(audited)
Risk management objectives and policies for management of insurance riskThe majority of the risk in the insurance business derives from manufacturing activities and can be categorised as insurance risk and financial risk. Financial risks include market risk, credit risk and liquidity risk. Insurance risk is the risk, other than financial risk, of loss transferred from the holder of the insurance contract to the insurer.
Group’s bancassurance modelWe operate an integrated bancassurance model which provides insurance products principally for customers with whom we have a banking relationship. The insurance contracts we sell relate to the underlying needs of our banking customers, which we can identify from our point-of-sale contacts and customer knowledge. The majority of sales are of savings and investment products.
By focusing largely on personal and SME lines of business we are able to optimise volumes and diversify individual insurance risks.
We choose to manufacture these insurance products in a Group subsidiary based on an assessment of operational scale and risk appetite. Manufacturing insurance allows us to retain the risks and rewards associated with writing insurance contracts by keeping part of the underwriting profit and investment income within the Group. It also reduces distribution costs for our products by using our established branch network and direct channels, and enables us to control the quality of the sale process and the products themselves to ensure our customers receive products which address their specific needs at the best value.
Where we do not have the risk appetite or operational scale to be an effective insurance manufacturer, we engage with a handful of leading external insurance companies in order
to provide insurance products to our customers through our banking network and direct channels. These arrangements are generally structured with our exclusive strategic partners and earn the Group a combination of commissions, fees and a share of profits. We distribute insurance products in Hong Kong, China and Macau.
Insurance products are sold through all global businesses, but predominantly by WPB and CMB through our branches and direct channels.
GovernanceInsurance risks are managed to a defined risk appetite, which is aligned to the Group’s risk appetite and enterprise risk management framework (including the three lines of defence model). The Insurance Risk Management Meeting oversees the control framework and is accountable to the Group Risk Management Meeting on risk matters relating to insurance business.
The monitoring of the risks within the insurance operations is carried out by the Insurance Risk teams. Specific risk functions, including wholesale credit & market risk, operational risk, information security risk and financial crime compliance, support Insurance Risk teams in their respective areas of expertise.
MeasurementThe risk profile of our insurance manufacturing businesses is measured using an economic capital (‘EC’) approach. Assets and liabilities are measured on a market value basis and a capital requirement is defined to ensure that there is a less than 1 in 200 chance of insolvency over a one year time horizon, given the risks that the businesses are exposed to. The methodology for the economic capital calculation is largely aligned to the pan-European Solvency II insurance capital regulation. The EC coverage ratio (economic net asset value divided by the economic capital requirement) is a key risk appetite measure. Management has set out the risk appetite and tolerance level in which management actions are required. In addition to EC, the regulatory solvency ratio is also a metric used to manage risk appetite on an entity basis.
ANNUAL REPORT 2020 105
Management Discussion and Analysis
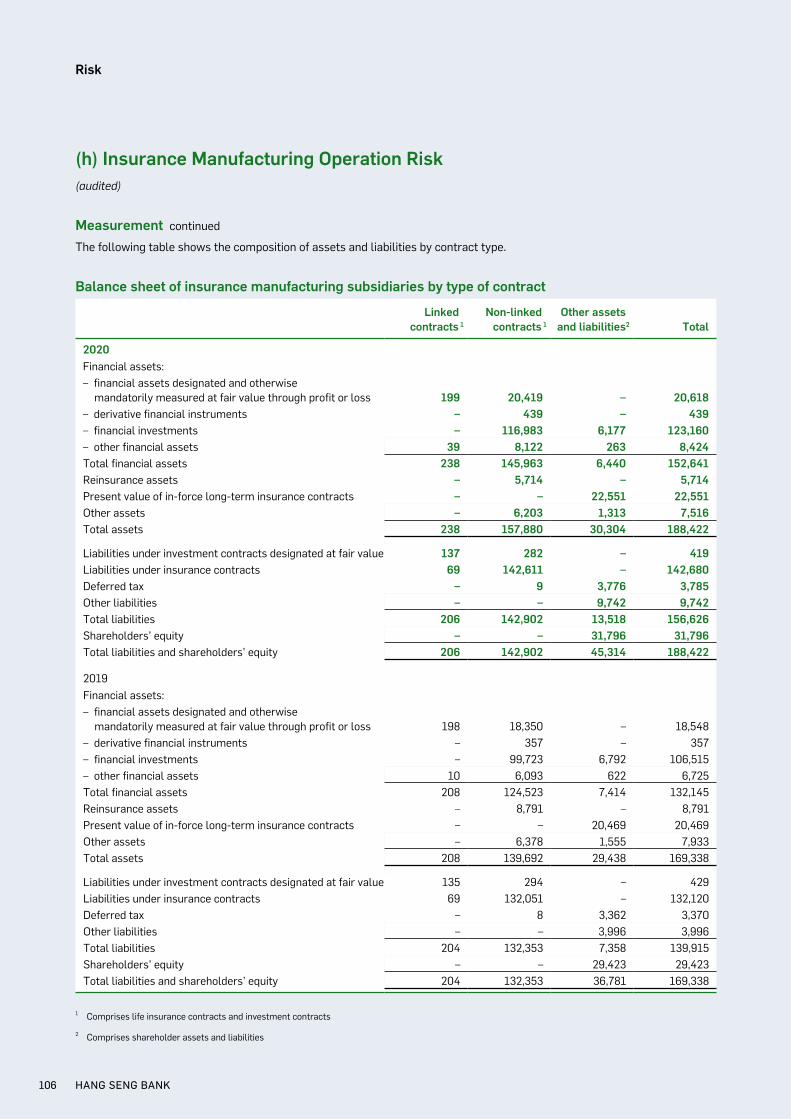
(h) Insurance Manufacturing Operation Risk(audited)
Measurement continued
The following table shows the composition of assets and liabilities by contract type.
Balance sheet of insurance manufacturing subsidiaries by type of contract
Linkedcontracts 1
Non-linkedcontracts 1
Other assetsand liabilities2 Total
2020Financial assets:– financial assets designated and otherwise mandatorily measured at fair value through profit or loss 199 20,419 – 20,618– derivative financial instruments – 439 – 439– financial investments – 116,983 6,177 123,160– other financial assets 39 8,122 263 8,424Total financial assets 238 145,963 6,440 152,641Reinsurance assets – 5,714 – 5,714Present value of in-force long-term insurance contracts – – 22,551 22,551Other assets – 6,203 1,313 7,516Total assets 238 157,880 30,304 188,422
Liabilities under investment contracts designated at fair value 137 282 – 419Liabilities under insurance contracts 69 142,611 – 142,680Deferred tax – 9 3,776 3,785Other liabilities – – 9,742 9,742Total liabilities 206 142,902 13,518 156,626Shareholders’ equity – – 31,796 31,796Total liabilities and shareholders’ equity 206 142,902 45,314 188,422
2019Financial assets:– financial assets designated and otherwise mandatorily measured at fair value through profit or loss 198 18,350 – 18,548– derivative financial instruments – 357 – 357– financial investments – 99,723 6,792 106,515– other financial assets 10 6,093 622 6,725Total financial assets 208 124,523 7,414 132,145Reinsurance assets – 8,791 – 8,791Present value of in-force long-term insurance contracts – – 20,469 20,469Other assets – 6,378 1,555 7,933Total assets 208 139,692 29,438 169,338
Liabilities under investment contracts designated at fair value 135 294 – 429Liabilities under insurance contracts 69 132,051 – 132,120Deferred tax – 8 3,362 3,370Other liabilities – – 3,996 3,996Total liabilities 204 132,353 7,358 139,915Shareholders’ equity – – 29,423 29,423Total liabilities and shareholders’ equity 204 132,353 36,781 169,338
1 Comprises life insurance contracts and investment contracts
2 Comprises shareholder assets and liabilities
HANG SENG BANK106
Risk
(h) Insurance Manufacturing Operation Risk(audited)
Stress and Scenario TestingStress testing forms a key part of the risk management framework for the insurance business. We participate in regulatory stress tests, including the Bank of England stress test of the banking system, the Hong Kong Monetary Authority stress test, and Hong Kong Insurance Authority stress test. These have highlighted that a key risk scenario for the insurance business is a prolonged low interest rate environment. In order to mitigate the impact of this scenario, the insurance subsidiary has a range of strategies that could be employed including the hedging of investment risk, repricing current products to reflect lower interest rates, improving risk diversification, moving towards less capital intensive products.
Key Risk TypesThe key risks for the insurance operations are market risks (in particular interest rate and equity), credit risks and liquidity risks, followed by insurance underwriting risk and operational risks.
Market risk (insurance)
Market risk is the risk of changes in market factors affecting the Group’s capital or profit. Market factors include interest rates, equity and growth assets, spread risk and foreign exchange rates.
Our exposure varies depending on the type of contract issued. Our most significant life insurance products are insurance contracts with discretionary participating features (‘DPF’) issued in Hong Kong. These products typically include some form of capital guarantee or guaranteed return, on the sums invested by the policyholders, to which discretionary bonuses are added if allowed by the overall performance of the funds. These funds are primarily invested in bonds with a proportion allocated to other asset classes, to provide customers with the potential for enhanced returns.
DPF products expose the Group to the risk of variation in asset returns, which will impact our participation in the investment performance. In addition, in some scenarios the asset returns can become insufficient to cover the policyholders’ financial guarantees, in which case the shortfall has to be met by the Group. Allowances are made against the cost of such guarantees, calculated by stochastic modelling.
For unit-linked contracts, market risk is substantially borne by the policyholders, but some market risk exposure typically remains as fees earned are related to the market value of the linked assets.
Our insurance manufacturing subsidiary has market risk mandates which specify the investment instruments in which they are permitted to invest and the maximum quantum of market risk which they may retain. They manage market risk by using, amongst others, some or all of the techniques listed below, depending on the nature of the contracts written:
• for products with DPF, adjusting dividends to manage the liabilities to policyholders. The effect is that a significant portion of the market risk is borne by the policyholders;
• asset and liability matching where asset portfolios are structured to support projected liability cash flows. The Group manages its assets using an approach that considers asset quality, diversification, cash flow matching, liquidity, volatility and target investment return. It is not always possible to match asset and liability durations due to uncertainty over the receipt of all future premiums and the timing of claims; and also because the forecast payment dates of liabilities may exceed the duration of the longest dated investments available. We use models to assess the effect of a range of future scenarios on the values of financial assets and associated liabilities, and ALCO reviews and decides on appropriate asset holdings and investment strategy in supporting liabilities;
• using derivatives to protect against adverse market movements or better support liability cash flows;
• for new products with investment guarantees, considering the cost when determining the level of premiums or the price structure;
• periodically reviewing products identified as higher risk, which contain investment guarantees and embedded optionality features linked to savings and investment products for active management;
• designing new products to mitigate market risk, such as changing the investment return sharing portion between policyholders and the shareholder, using Terminal Bonus feature instead of annual dividend, lower the level of guaranteed returns, etc;
• exiting, to the extent possible, investment portfolios whose risk is considered unacceptable; and
• repricing premiums charged to policyholders.
ANNUAL REPORT 2020 107
Management Discussion and Analysis
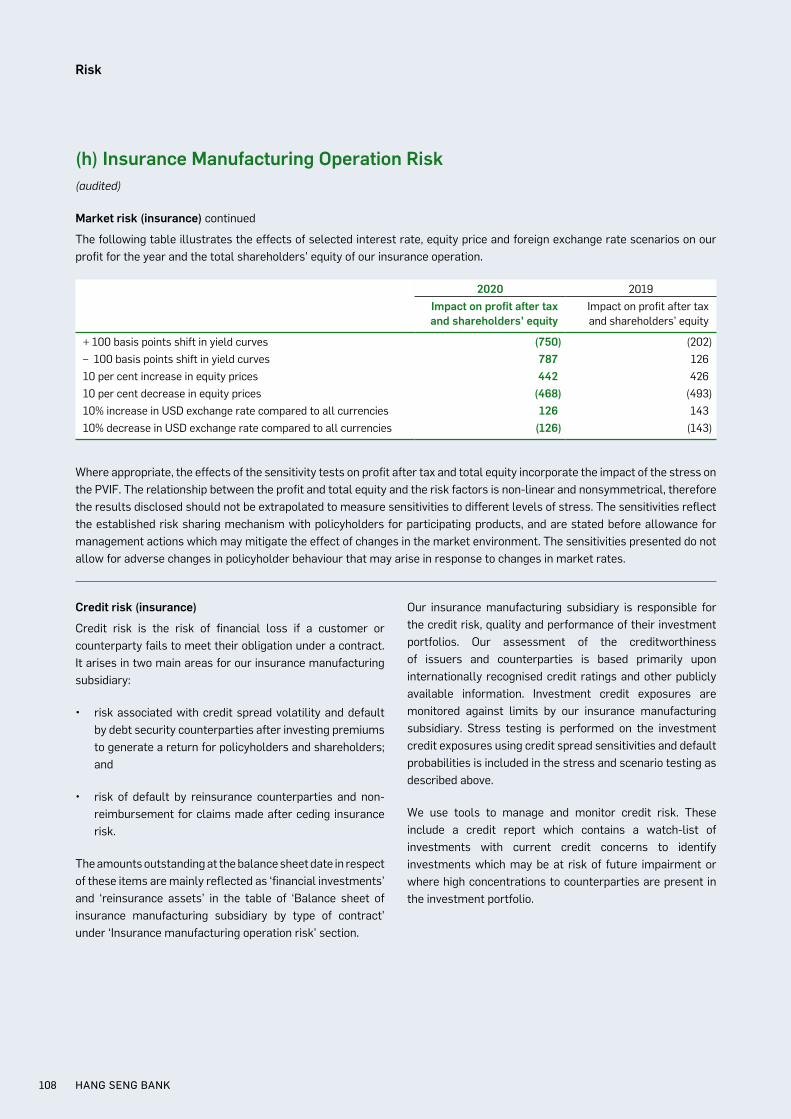
(h) Insurance Manufacturing Operation Risk(audited)
Market risk (insurance) continued
The following table illustrates the effects of selected interest rate, equity price and foreign exchange rate scenarios on our profit for the year and the total shareholders’ equity of our insurance operation.
2020 2019Impact on profit after tax and shareholders’ equity
Impact on profit after tax and shareholders’ equity
+ 100 basis points shift in yield curves (750) (202)– 100 basis points shift in yield curves 787 12610 per cent increase in equity prices 442 42610 per cent decrease in equity prices (468) (493)10% increase in USD exchange rate compared to all currencies 126 14310% decrease in USD exchange rate compared to all currencies (126) (143)
Where appropriate, the effects of the sensitivity tests on profit after tax and total equity incorporate the impact of the stress on the PVIF. The relationship between the profit and total equity and the risk factors is non-linear and nonsymmetrical, therefore the results disclosed should not be extrapolated to measure sensitivities to different levels of stress. The sensitivities reflect the established risk sharing mechanism with policyholders for participating products, and are stated before allowance for management actions which may mitigate the effect of changes in the market environment. The sensitivities presented do not allow for adverse changes in policyholder behaviour that may arise in response to changes in market rates.
Credit risk (insurance)
Credit risk is the risk of financial loss if a customer or counterparty fails to meet their obligation under a contract. It arises in two main areas for our insurance manufacturing subsidiary:
• risk associated with credit spread volatility and default by debt security counterparties after investing premiums to generate a return for policyholders and shareholders; and
• risk of default by reinsurance counterparties and non-reimbursement for claims made after ceding insurance risk.
The amounts outstanding at the balance sheet date in respect of these items are mainly reflected as ‘financial investments’ and ‘reinsurance assets’ in the table of ‘Balance sheet of insurance manufacturing subsidiary by type of contract’ under ‘Insurance manufacturing operation risk’ section.
Our insurance manufacturing subsidiary is responsible for the credit risk, quality and performance of their investment portfolios. Our assessment of the creditworthiness of issuers and counterparties is based primarily upon internationally recognised credit ratings and other publicly available information. Investment credit exposures are monitored against limits by our insurance manufacturing subsidiary. Stress testing is performed on the investment credit exposures using credit spread sensitivities and default probabilities is included in the stress and scenario testing as described above.
We use tools to manage and monitor credit risk. These include a credit report which contains a watch-list of investments with current credit concerns to identify investments which may be at risk of future impairment or where high concentrations to counterparties are present in the investment portfolio.
HANG SENG BANK108
Risk
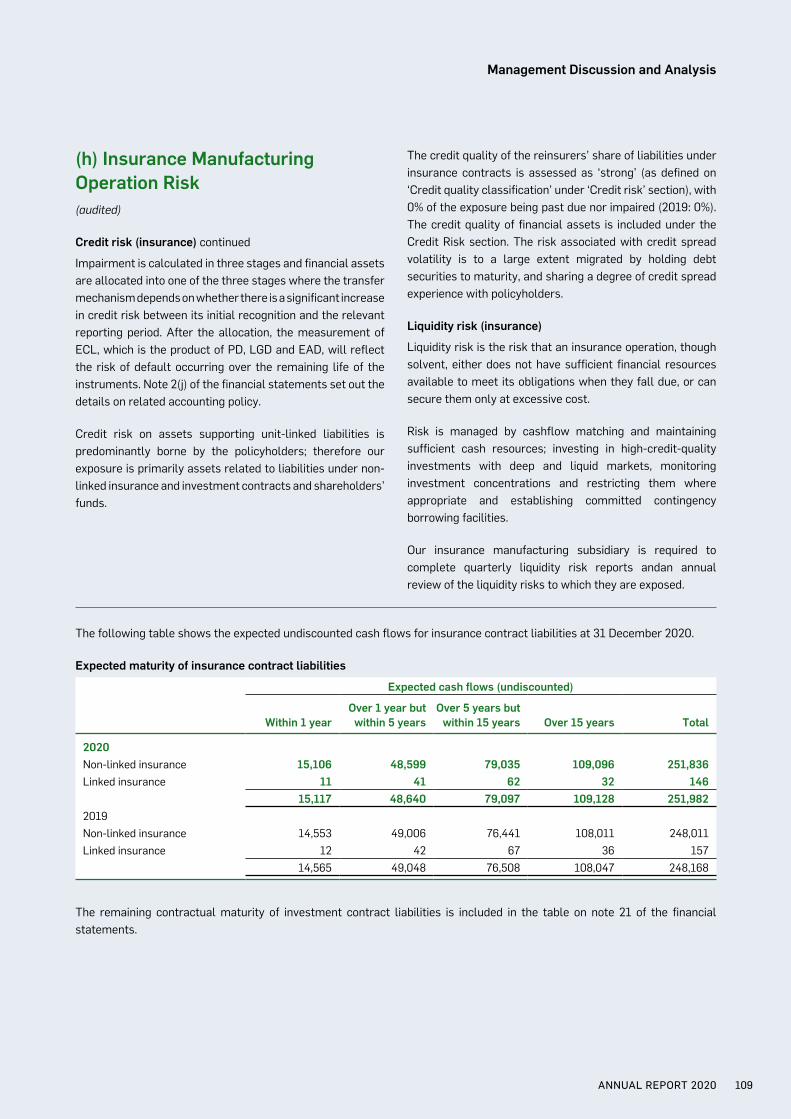
(h) Insurance Manufacturing Operation Risk(audited)
Credit risk (insurance) continued
Impairment is calculated in three stages and financial assets are allocated into one of the three stages where the transfer mechanism depends on whether there is a significant increase in credit risk between its initial recognition and the relevant reporting period. After the allocation, the measurement of ECL, which is the product of PD, LGD and EAD, will reflect the risk of default occurring over the remaining life of the instruments. Note 2(j) of the financial statements set out the details on related accounting policy.
Credit risk on assets supporting unit-linked liabilities is predominantly borne by the policyholders; therefore our exposure is primarily assets related to liabilities under non-linked insurance and investment contracts and shareholders’ funds.
The credit quality of the reinsurers’ share of liabilities under insurance contracts is assessed as ‘strong’ (as defined on ‘Credit quality classification’ under ‘Credit risk’ section), with 0% of the exposure being past due nor impaired (2019: 0%). The credit quality of financial assets is included under the Credit Risk section. The risk associated with credit spread volatility is to a large extent migrated by holding debt securities to maturity, and sharing a degree of credit spread experience with policyholders.
Liquidity risk (insurance)
Liquidity risk is the risk that an insurance operation, though solvent, either does not have sufficient financial resources available to meet its obligations when they fall due, or can secure them only at excessive cost.
Risk is managed by cashflow matching and maintaining sufficient cash resources; investing in high-credit-quality investments with deep and liquid markets, monitoring investment concentrations and restricting them where appropriate and establishing committed contingency borrowing facilities.
Our insurance manufacturing subsidiary is required to complete quarterly liquidity risk reports andan annual review of the liquidity risks to which they are exposed.
The following table shows the expected undiscounted cash flows for insurance contract liabilities at 31 December 2020.
Expected maturity of insurance contract liabilities
Expected cash flows (undiscounted)
Within 1 yearOver 1 year but
within 5 yearsOver 5 years but
within 15 years Over 15 years Total
2020Non-linked insurance 15,106 48,599 79,035 109,096 251,836Linked insurance 11 41 62 32 146
15,117 48,640 79,097 109,128 251,9822019Non-linked insurance 14,553 49,006 76,441 108,011 248,011Linked insurance 12 42 67 36 157
14,565 49,048 76,508 108,047 248,168
The remaining contractual maturity of investment contract liabilities is included in the table on note 21 of the financial statements.
ANNUAL REPORT 2020 109
Management Discussion and Analysis
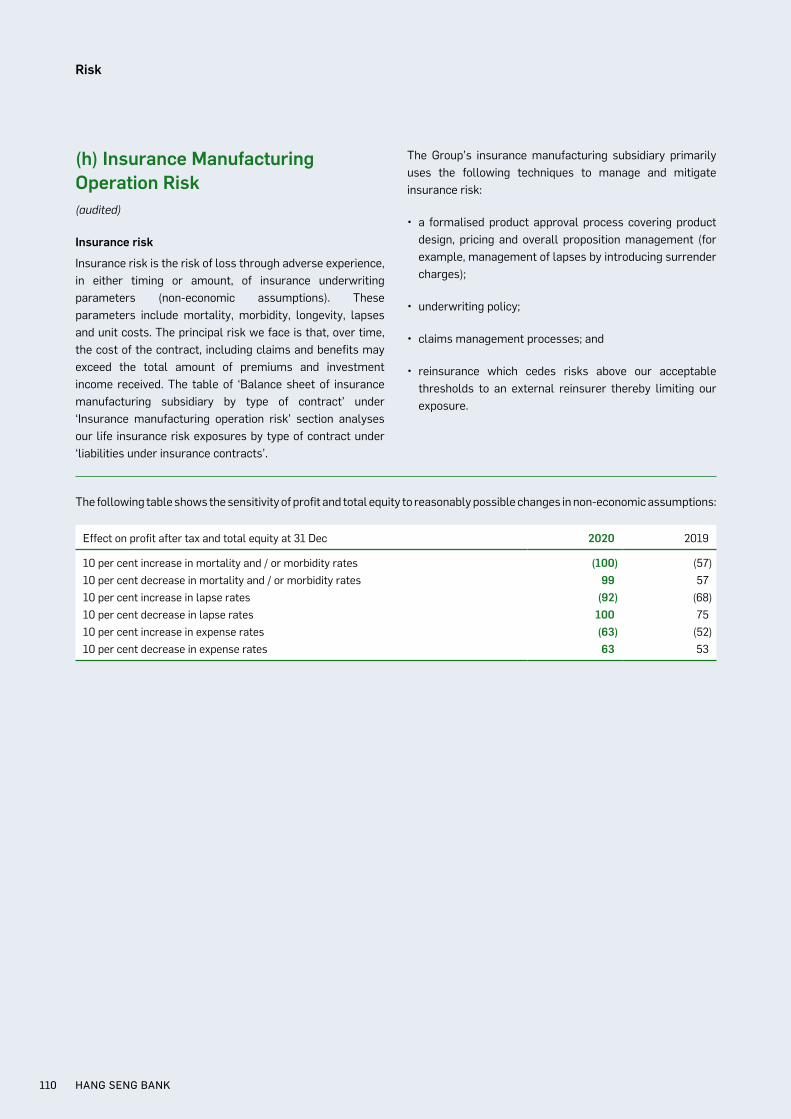
(h) Insurance Manufacturing Operation Risk(audited)
Insurance risk
Insurance risk is the risk of loss through adverse experience, in either timing or amount, of insurance underwriting parameters (non-economic assumptions). These parameters include mortality, morbidity, longevity, lapses and unit costs. The principal risk we face is that, over time, the cost of the contract, including claims and benefits may exceed the total amount of premiums and investment income received. The table of ‘Balance sheet of insurance manufacturing subsidiary by type of contract’ under ‘Insurance manufacturing operation risk’ section analyses our life insurance risk exposures by type of contract under ‘liabilities under insurance contracts’.
The Group’s insurance manufacturing subsidiary primarily uses the following techniques to manage and mitigate insurance risk:
• a formalised product approval process covering product design, pricing and overall proposition management (for example, management of lapses by introducing surrender charges);
• underwriting policy;
• claims management processes; and
• reinsurance which cedes risks above our acceptable thresholds to an external reinsurer thereby limiting our exposure.
The following table shows the sensitivity of profit and total equity to reasonably possible changes in non-economic assumptions:
Effect on profit after tax and total equity at 31 Dec 2020 2019
10 per cent increase in mortality and / or morbidity rates (100) (57)10 per cent decrease in mortality and / or morbidity rates 99 5710 per cent increase in lapse rates (92) (68)10 per cent decrease in lapse rates 100 7510 per cent increase in expense rates (63) (52)10 per cent decrease in expense rates 63 53
HANG SENG BANK110
Risk
(h) Insurance Manufacturing Operation Risk(audited)
Insurance risk continued
Mortality and morbidity risk is typically associated with life insurance contracts. The effect on profit of an increase in mortality or morbidity depends on the type of business being written.
Sensitivity to lapse rates depends on the type of contracts being written. In general, for life insurance contracts a policy lapse has two offsetting effects on profits, which are the loss of future income on the lapsed policy and the existence of surrender charge recouped at policy lapse. The net impact depends on the relative size of these two effects which varies with the type of contracts.
Expense rate risk is the exposure to a change in the cost of administering insurance contracts. To the extent that increased expenses cannot be passed on to policyholders, an increase in expense rates will have a negative effect on our profits.
Present value of in-force long-term insurance business (‘PVIF’)
In calculating PVIF, expected cash flows are projected after adjusting for a variety of assumptions made by insurance operation to reflect local market conditions and management’s judgement of future trends, and after applying risk margins to reflect any uncertainty in the underlying assumptions. Variations in actual experience and changes to assumptions can contribute to volatility in the results of the insurance business.
Actuarial Control Committee meets on a quarterly basis to review and approve assumptions proposed for use in the determination of the PVIF. All changes to non-economic assumptions, economic assumptions that are not observable and model methodology must be approved by the Actuarial Control Committee.
Economic assumptions are either set in a way that is consistent with observable market values or, in certain markets is made of long-term economic assumptions. Setting such assumptions involves the projection of long-term interest rates and the time horizon over which observable market rates trend towards these long-term assumptions. The assumptions are informed by relevant historical data and by research and analysis performed by internal and external experts, including regulatory bodies. The valuation of PVIF will be sensitive to any changes in these long-term assumptions in the same way that it is sensitive to observed market movements, and the impact of such changes is included in the sensitivities presented below.
The Group sets the risk discount rate applied to the PVIF calculation by starting from a risk-free rate curve and adding explicit allowances for risks not reflected in the best estimate cash flow modelling. Where shareholders provide options and guarantees to policyholders the cost of these options and guarantees is an explicit reduction to PVIF.
ANNUAL REPORT 2020 111
Management Discussion and Analysis
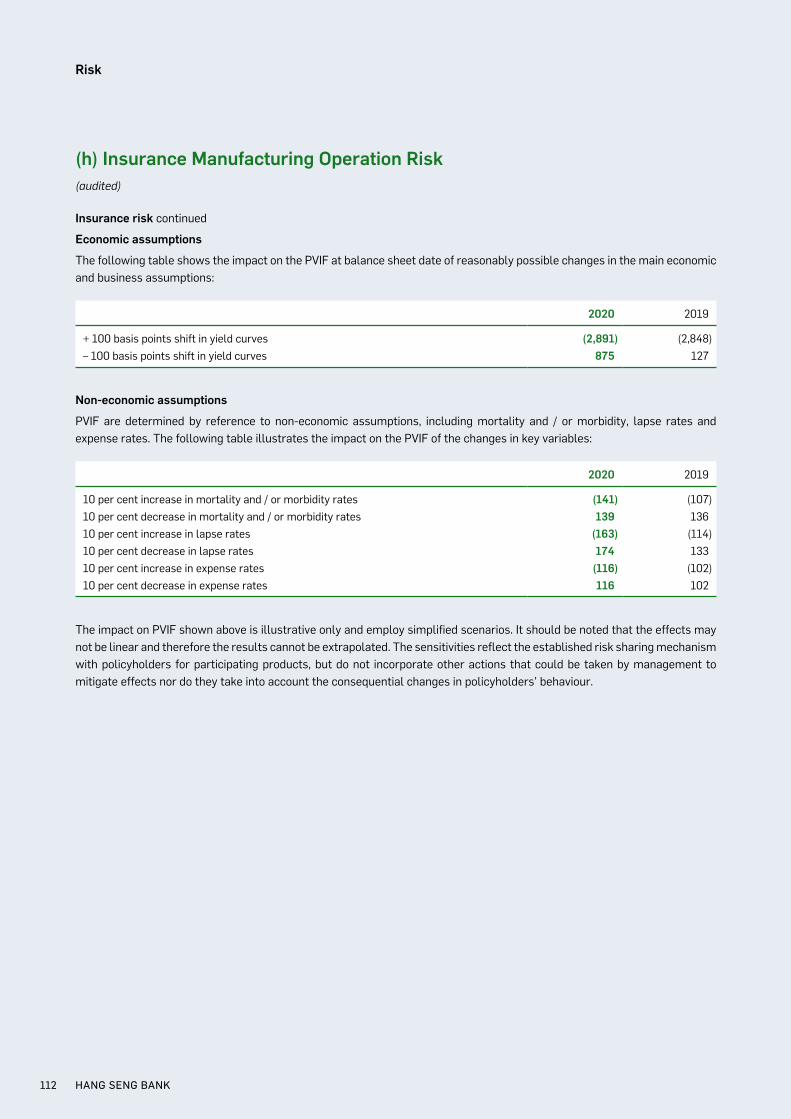
(h) Insurance Manufacturing Operation Risk(audited)
Insurance risk continued
Economic assumptions
The following table shows the impact on the PVIF at balance sheet date of reasonably possible changes in the main economic and business assumptions:
2020 2019
+ 100 basis points shift in yield curves (2,891) (2,848)– 100 basis points shift in yield curves 875 127
Non-economic assumptions
PVIF are determined by reference to non-economic assumptions, including mortality and / or morbidity, lapse rates and expense rates. The following table illustrates the impact on the PVIF of the changes in key variables:
2020 2019
10 per cent increase in mortality and / or morbidity rates (141) (107)10 per cent decrease in mortality and / or morbidity rates 139 13610 per cent increase in lapse rates (163) (114)10 per cent decrease in lapse rates 174 13310 per cent increase in expense rates (116) (102)10 per cent decrease in expense rates 116 102
The impact on PVIF shown above is illustrative only and employ simplified scenarios. It should be noted that the effects may not be linear and therefore the results cannot be extrapolated. The sensitivities reflect the established risk sharing mechanism with policyholders for participating products, but do not incorporate other actions that could be taken by management to mitigate effects nor do they take into account the consequential changes in policyholders’ behaviour.
HANG SENG BANK112
Risk
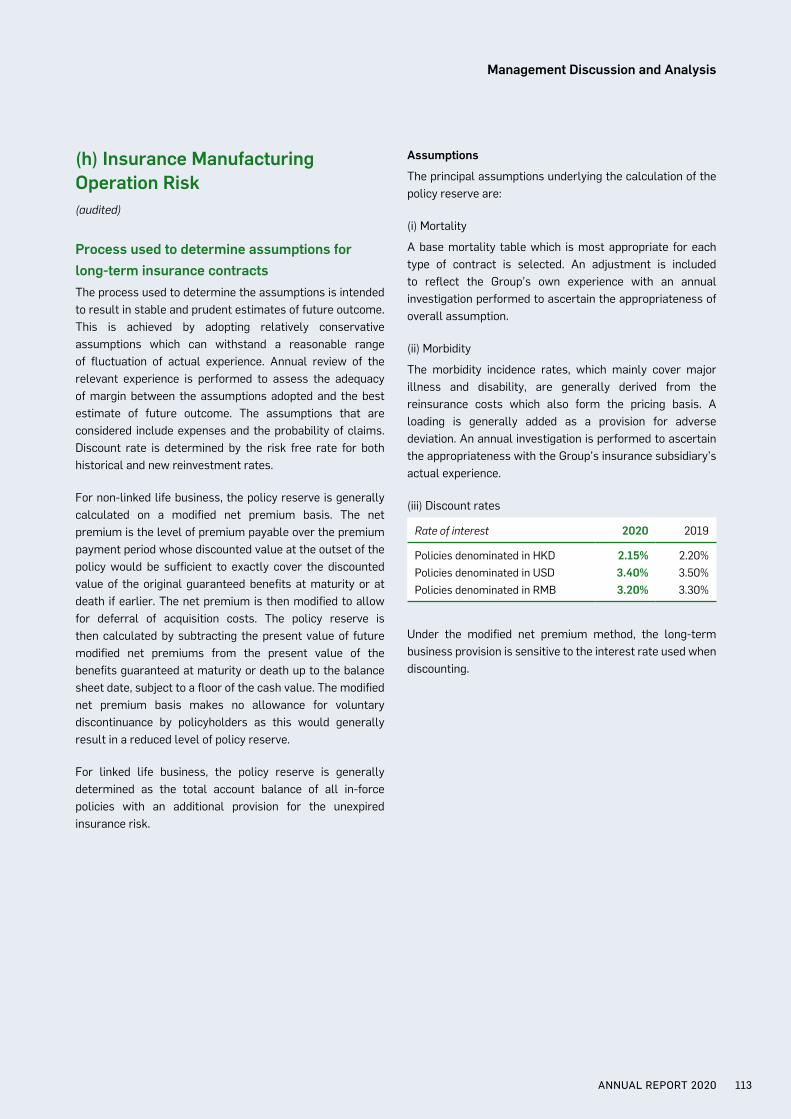
(h) Insurance Manufacturing Operation Risk(audited)
Process used to determine assumptions for long-term insurance contractsThe process used to determine the assumptions is intended to result in stable and prudent estimates of future outcome. This is achieved by adopting relatively conservative assumptions which can withstand a reasonable range of fluctuation of actual experience. Annual review of the relevant experience is performed to assess the adequacy of margin between the assumptions adopted and the best estimate of future outcome. The assumptions that are considered include expenses and the probability of claims. Discount rate is determined by the risk free rate for both historical and new reinvestment rates.
For non-linked life business, the policy reserve is generally calculated on a modified net premium basis. The net premium is the level of premium payable over the premium payment period whose discounted value at the outset of the policy would be sufficient to exactly cover the discounted value of the original guaranteed benefits at maturity or at death if earlier. The net premium is then modified to allow for deferral of acquisition costs. The policy reserve is then calculated by subtracting the present value of future modified net premiums from the present value of the benefits guaranteed at maturity or death up to the balance sheet date, subject to a floor of the cash value. The modified net premium basis makes no allowance for voluntary discontinuance by policyholders as this would generally result in a reduced level of policy reserve.
For linked life business, the policy reserve is generally determined as the total account balance of all in-force policies with an additional provision for the unexpired insurance risk.
Assumptions
The principal assumptions underlying the calculation of the policy reserve are:
(i) Mortality
A base mortality table which is most appropriate for each type of contract is selected. An adjustment is included to reflect the Group’s own experience with an annual investigation performed to ascertain the appropriateness of overall assumption.
(ii) Morbidity
The morbidity incidence rates, which mainly cover major illness and disability, are generally derived from the reinsurance costs which also form the pricing basis. A loading is generally added as a provision for adverse deviation. An annual investigation is performed to ascertain the appropriateness with the Group’s insurance subsidiary’s actual experience.
(iii) Discount rates
Rate of interest 2020 2019
Policies denominated in HKD 2.15% 2.20%Policies denominated in USD 3.40% 3.50%Policies denominated in RMB 3.20% 3.30%
Under the modified net premium method, the long-term business provision is sensitive to the interest rate used when discounting.
ANNUAL REPORT 2020 113
Management Discussion and Analysis
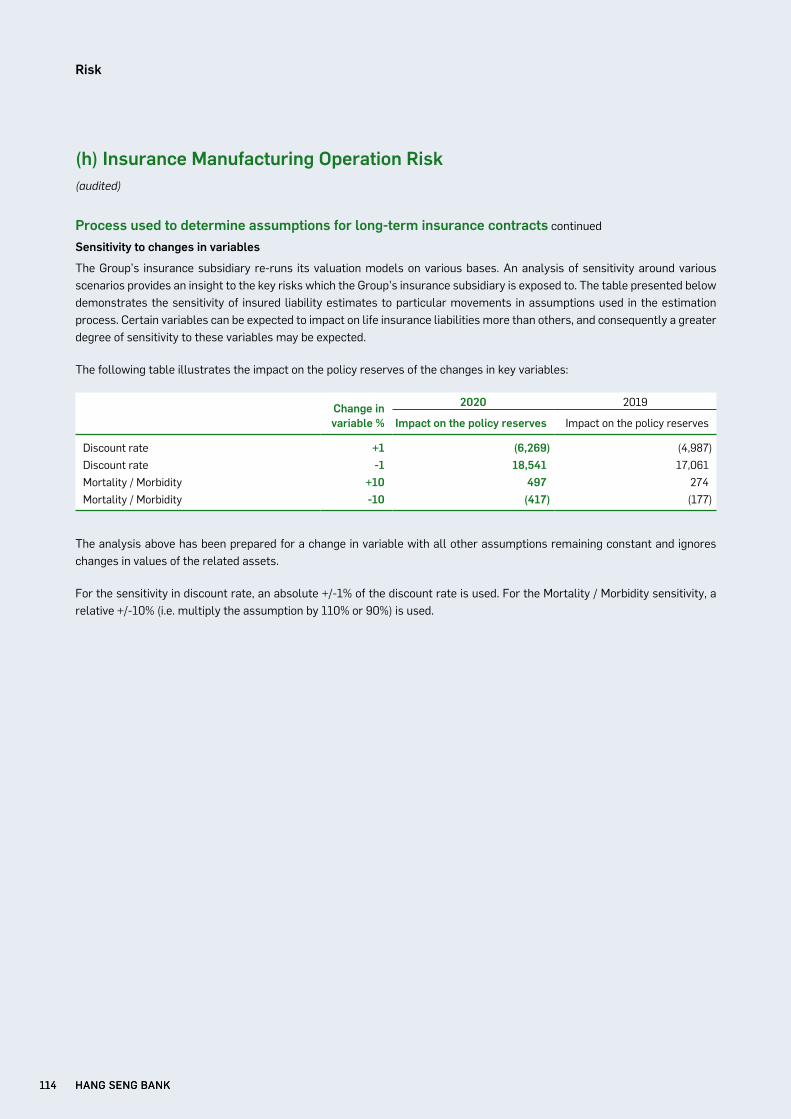
(h) Insurance Manufacturing Operation Risk(audited)
Process used to determine assumptions for long-term insurance contracts continued
Sensitivity to changes in variables
The Group’s insurance subsidiary re-runs its valuation models on various bases. An analysis of sensitivity around various scenarios provides an insight to the key risks which the Group’s insurance subsidiary is exposed to. The table presented below demonstrates the sensitivity of insured liability estimates to particular movements in assumptions used in the estimation process. Certain variables can be expected to impact on life insurance liabilities more than others, and consequently a greater degree of sensitivity to these variables may be expected.
The following table illustrates the impact on the policy reserves of the changes in key variables:
Change in variable %
2020 2019
Impact on the policy reserves Impact on the policy reserves
Discount rate +1 (6,269) (4,987)Discount rate -1 18,541 17,061Mortality / Morbidity +10 497 274Mortality / Morbidity -10 (417) (177)
The analysis above has been prepared for a change in variable with all other assumptions remaining constant and ignores changes in values of the related assets.
For the sensitivity in discount rate, an absolute +/-1% of the discount rate is used. For the Mortality / Morbidity sensitivity, a relative +/-10% (i.e. multiply the assumption by 110% or 90%) is used.
HANG SENG BANK114
Risk
HANG SENG BANK114