Hang Seng Bank Limited - 2006 Annual Report - HSBC Group
204
-
Upload
khangminh22 -
Category
Documents
-
view
2 -
download
0
Transcript of Hang Seng Bank Limited - 2006 Annual Report - HSBC Group

������ ���� ���
����
����
���
��� �
����������� ����
���� ���
����
#
��
$
#��
�!��
�

���$�� ����� ���� ������ ��� ���������� ������ ��� ��� ������ !��� "��� #��������$ ����%�� &�� �#�����#�%
'� ���������� �� �������� �� � ��� ��� &����#������������� �� (������ ������ ���� $��� )� ����*����� �� ��� +�� &�� ���)�� , ������� ��������# ����� ��
��%� �� *������ &��)�� %-
'��� $����� ����� ������ ���+� , .� �#���� , ��&��#���� ���������%�� $��+�# ����� � ��)�� � �������������� ����� �� �#�� ��� #���+�� ���#�������%-
���)��� &#����*����)���+���� �����%� ������+�+&����#��� ���%�#��� ��#������� %��� &�� �������� ����� #�����*���� �� �� #�++���$% �)��� #�������� ��� �����%�� �� ���#� ��) �������%

$'()*()+, $'-.'-/)* �-'012*
3 �*+42)+ 1( �-1*0
5 617*89*/- 61(/(:1/2 �4;;/-9
< �/='- �12*+)'(*+
>? �*:'@(1)1'(
>A $B/1-;/(C+ �)/)*;*()
>< $B1*0 �D*:4)17*C+ �*.'-)
,3 $'-.'-/)* �'7*-(/(:* /(E )B*- �(0'-;/)1'(
F< �4+1(*++ .*-/)1'(+
"������ �� ���� ����
"������ �� ��� /������
G, �/(@ �*(@ �(E*D*+
G3 $'-.'-/)* �*+.'(+1H121)9
3? 61(/(:1/2 �*71*I
5A �1'@-/.B1:/2 �*)/12+ '0 �1-*:)'-+
5< �1'@-/.B1:/2 �*)/12+ '0 �*(1'- �/(/@*;*()
<? �*.'-) '0 )B* �1-*:)'-+
<5 !""# 61(/(:1/2 �)/)*;*()+
>J5 �(E*.*(E*() �4E1)'-K+ �*.'-)
>J< �(/29+1+ '0 �B/-*B'2E*-+
>JJ �4H+1E1/-1*+
,?? $'-.'-/)* �(0'-;/)1'( /(E $/2*(E/-

CORPORATE PROFILE
Established in 1933, Hang Seng Bank is a world-class financial institution and one of Hong Kong’s largest listed companies in terms of market capitalisation (HK$203.2 billion as at the end of December 2006).
In Hong Kong, we serve over one-third of the population through around 150 branches and automated banking centres. Our mainland China network includes 16 outlets – seven branches (in Beijing, Dongguan, Fuzhou, Guangzhou, Nanjing, Shanghai and Shenzhen); eight sub-branches (one in Shenzhen, two in Guangzhou and five in Shanghai); and a representative office in Xiamen. We also have a branch in Macau and a representative office in Taipei.
Hang Seng is a principal member of the HSBC Group, one of the world’s largest banking and financial services organisations.
A World-Class
BANK2 HANG SENG BANK2 HANG SENG BANK

EMPLOYEES
Our employees are our most valuable asset. That’s why we work hard to create an environment in which they are engaged and inspired. In turn, their professional, pragmatic and thoughtful approach to business helps us stand out from our competitors.
CUSTOMERS
As reflected in our corporate tagline ‘Managing wealth for you, with you’, helping customers plan for the future and achieve their financial goals lies at the heart of everything we do.
SHAREHOLDERS
We generate returns for our shareholders by achieving sustainable growth over the long term and enhancing our position as a leading financial institution in Greater China.
COMMUNITY
Our corporate responsibility programmes reflect our commitment to improving the well-being of the communities that help to create our success as well as promoting sustainable practices.
3ANNUAL REPORT 2006

4 HANG SENG BANK
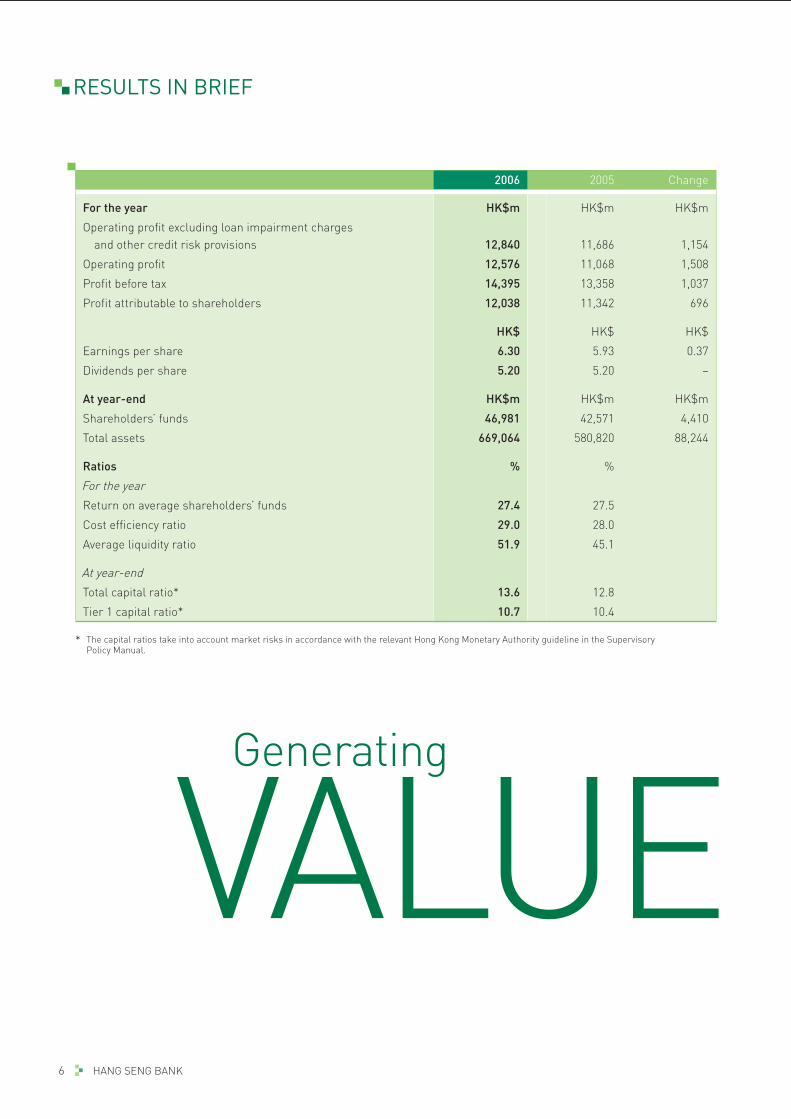
RESULTS IN BRIEF
5ANNUAL REPORT 2006
FIVE-YEAR FINANCIAL SUMMARY
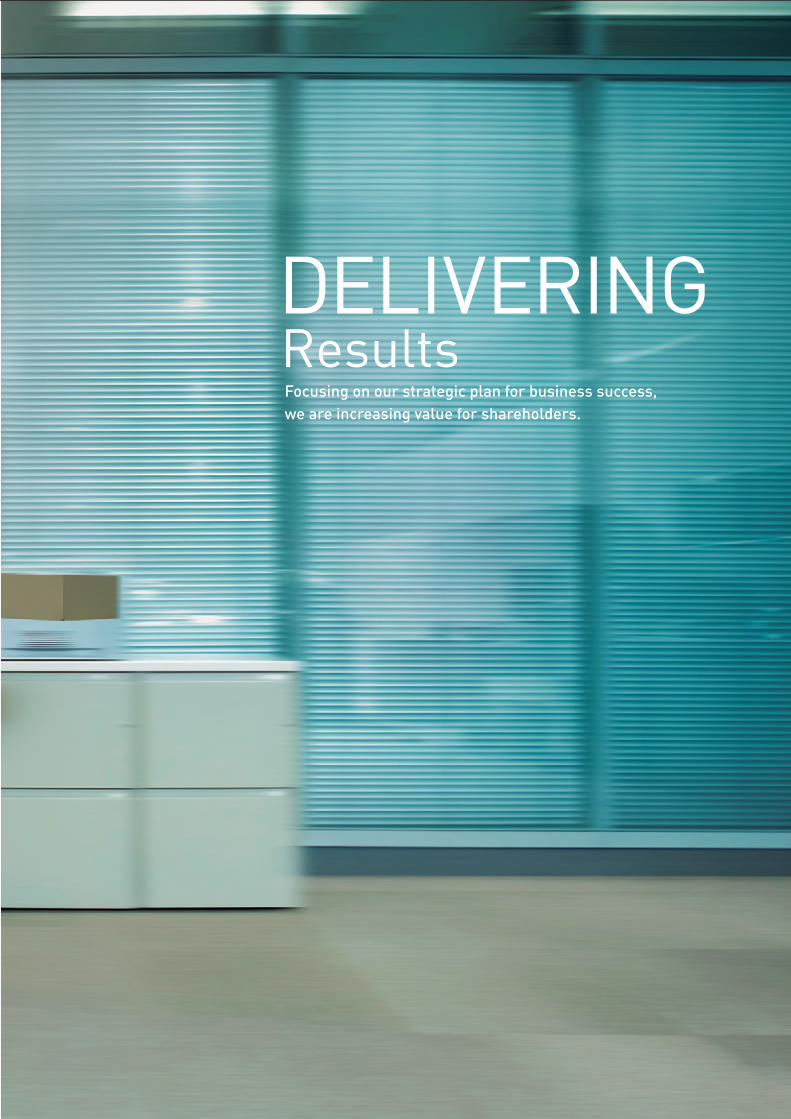
DELIVERINGFocusing on our strategic plan for business success, we are increasing value for shareholders.
Results
6 HANG SENG BANK
RESULTS IN BRIEF
2006 2005 Change
For the year HK$m HK$m HK$m
Operating profit excluding loan impairment charges and other credit risk provisions 12,840 11,686 1,154
Operating profit 12,576 11,068 1,508
Profit before tax 14,395 13,358 1,037
Profit attributable to shareholders 12,038 11,342 696
HK$ HK$ HK$
Earnings per share 6.30 5.93 0.37
Dividends per share 5.20 5.20 –
At year-end HK$m HK$m HK$m
Shareholders’ funds 46,981 42,571 4,410
Total assets 669,064 580,820 88,244
Ratios % %
For the year
Return on average shareholders’ funds 27.4 27.5
Cost efficiency ratio 29.0 28.0
Average liquidity ratio 51.9 45.1
At year-end
Total capital ratio* 13.6 12.8
Tier 1 capital ratio* 10.7 10.4
* The capital ratios take into account market risks in accordance with the relevant Hong Kong Monetary Authority guideline in the SupervisoryPolicy Manual.
Generating
VALUE

7ANNUAL REPORT 2006
FIVE-YEAR FINANCIAL SUMMARY
Results
Attributable Profit
Operating Profit Shareholders’ Funds
Post-Tax return onAverage Shareholders’ Funds
Total Assets
Special Interim Dividend per Share
Earnings per Share
Dividends per Share
Total Assets andShareholders’ Funds
Per Share Earnings and Dividends
2
10
8
6
4
0
HK$
30
5
10
15
20
25
0
%
400
800
700
600
100
200
300
500
0
HK$bnHK$bn
02 0603 0504 02 0603 0504 02 0603 0504
14
12
10
2
4
6
8
0
2002 2003 2004 2005 2006
For the year HK$bn HK$bn HK$bn HK$bn HK$bn
Operating profit 10.7 10.7 12.6 11.1 12.6
Profit before tax 11.2 11.1 13.3 13.4 14.4
Profit attributable to shareholders 9.9 9.5 11.4 11.3 12.0
At year-end HK$bn HK$bn HK$bn HK$bn HK$bn
Shareholders’ funds 43.1 39.6 40.9 42.6 47.0
Issued and paid up capital 9.6 9.6 9.6 9.6 9.6
Total assets 474.7 503.0 546.9 580.8 669.1
Per share HK$ HK$ HK$ HK$ HK$
Earnings per share 5.19 4.99 5.94 5.93 6.30
Dividends per share 5.40# 4.90 5.20 5.20 5.20
Ratios % % % % %
Post-tax return on average shareholders’ funds 23.1 23.4 28.5 27.5 27.4
Post-tax return on average total assets 2.1 2.0 2.2 2.0 1.9
Capital ratios
– Total ratio* 14.2 13.2 12.0 12.8 13.6
– Tier 1 ratio* 11.9 11.3 10.8 10.4 10.7
Cost efficiency ratio 25.4 25.4 26.4 28.0 29.0
# Including special interim dividend of HK$0.50 per share for 2002.
* The capital ratios take into account market risks in accordance with the relevant Hong Kong Monetary Authority guideline in the SupervisoryPolicy Manual.

8 HANG SENG BANK
MAJOR MILESTONES
JanuaryHang Seng launches China Equity Fund.
FebruaryHang Seng introduces two new cards – alpha card, a payment card for young people, and a commercial card for members of the New Territories General Chamber of Commerce.
Hang Seng begins offering insurance agency service at its Shanghai and Shenzhen branches and sub-branches.
HSI Services announces that mainland China H-share companies are eligible for inclusion in Hang Seng Index.
MarchHang Seng introduces Index-linked Capital Protected Investment product on the Mainland.
AprilHang Seng launches 24-hour Personal Loan application hotline.
MayHang Seng launches integrated brand revitalisation programme and introduces new corporate tagline –‘Managing wealth for you, with you’.
Hang Seng sells its property at 77 Des Voeux Road Central for HK$2.26 billion.
Hang Seng signs an agreement with Kerry Properties to lease 262,000 square feet of office space in Enterprise Square Five in Kowloon Bay, with occupancy planned for late 2007.
Hang Seng opens fourth Shanghai sub-branch.
Hang Seng launches VISA Infinite, an invitation-only prestige credit card.
Hang Seng extends Mainland insurance agency service to Guangzhou branch.
Hang Seng announces first interim dividend of HK$1.10 per share.
JuneHang Seng announces its debut US dollar subordinated notes offering amounting to US$450 million.
Hang Seng opens Business Banking Centre in Chai Wan to further expand network of outlets serving SMEs.
Hang Seng receives approval to provide RMB services and extend foreign currency services at Nanjing branch.

9ANNUAL REPORT 2006
JulyHang Seng introduces MediCash Lifetime Insurance Plan.
Hang Seng announces second interim dividend of HK$1.10 per share.
AugustHang Seng opens first Guangzhou sub-branch.
Hang Seng extends Mainland insurance agency service to Beijing branch.
SeptemberHang Seng relocates Macau branch to accommodate expansion of services and new Prestige Banking Centre.
Hang Seng receives approval for Qualified Domestic Institutional Investor (QDII) licence.
Hang Seng holds Board of Directors meeting on the Mainland for the first time.
Hang Seng opens fifth Shanghai sub-branch.
First H-share company enters Hang Seng Index.
OctoberHang Seng receives approval for US$300 million foreign exchange conversion quota under QDII licence.
Hang Seng becomes first foreign bank to open a branch in Dongguan.
NovemberHang Seng announces third interim dividend of HK$1.10 per share.
HSI Services launches Hang Seng China H-Financials Index to track performance of Mainland financial companies listed in Hong Kong.
DecemberHang Seng launches its first QDII investment product through Mainland branches and sub-branches.
Hang Seng becomes first bank to offer Octopus merchant services to retailers.
Hang Seng receives approval to prepare for the establishment of Mainland subsidiary bank.

10 HANG SENG BANK
RECOGNITION
2006 Awards
Best Retail Bank in Asia, Best Retail Bank in Hong Kong and Excellence in Wealth Management Awards, The Asian Banker.
Best Domestic Bank in Hong Kong, The Asset.
No. 1 for Financial Soundness and No. 7 Overall in Hong Kong category, Wall Street Journal Asia, 200 Most Admired Companies survey.
Trusted Brands Gold Awards in the Banking and Investment Funds categories, Reader’s Digest, Trusted Brands Awards.
Best Wealth Management Bank and No. 2 for Overall Competitiveness, 21st Century Business Herald, Asian Banks Competition.
Best Banking Service Award, Hong Kong Chamber of Small and Medium Business.
Highly Commended in Best Overall Investor Relations at a Hong Kong Company (large cap), Best Annual Report and Other Corporate Literature, and Best Corporate Governance categories, IR Magazine, Hong Kong & Taiwan Awards.
No. 85 in Top 100 Financial Institution Brands Worldwide and Brand Rating of A, The Banker.
290th Largest Listed Company in the World in terms of Market Capitalisation, Financial Times, FT Global 500.
No. 2 Local Cash Management Bank (Small Corporations) and No. 2 Local Cash Management Bank (Medium-sized Corporations), Asiamoney.
Green Enterprise of the Year, Federation of Hong Kong Industries.
Gold Award in the Community Relations category, China International Public Relations Association, China Golden Awards for Excellence in Public Relations.
Caring Company, Hong Kong Council of Social Service.
Bronze Award and Certificate of Excellence, Hong Kong Management Association, Awards for Excellence in Training.
China Top 10 Growing Financial Organisation (Hang Seng Shanghai Branch), China Council for the Promotion of International Trade and the Shanghai Committee of the Chinese People’s Political Consultative Conference, China International Financial Forum.
Silver Award for Photography, Bronze Award for Cover Design/Photo and Honors Award for Interior Design (Hang Seng 2005 Annual Report), International ARC Awards Competition.
Bronze Award, Hong Kong Management Association, Best Annual Reports Awards.
11ANNUAL REPORT 2006
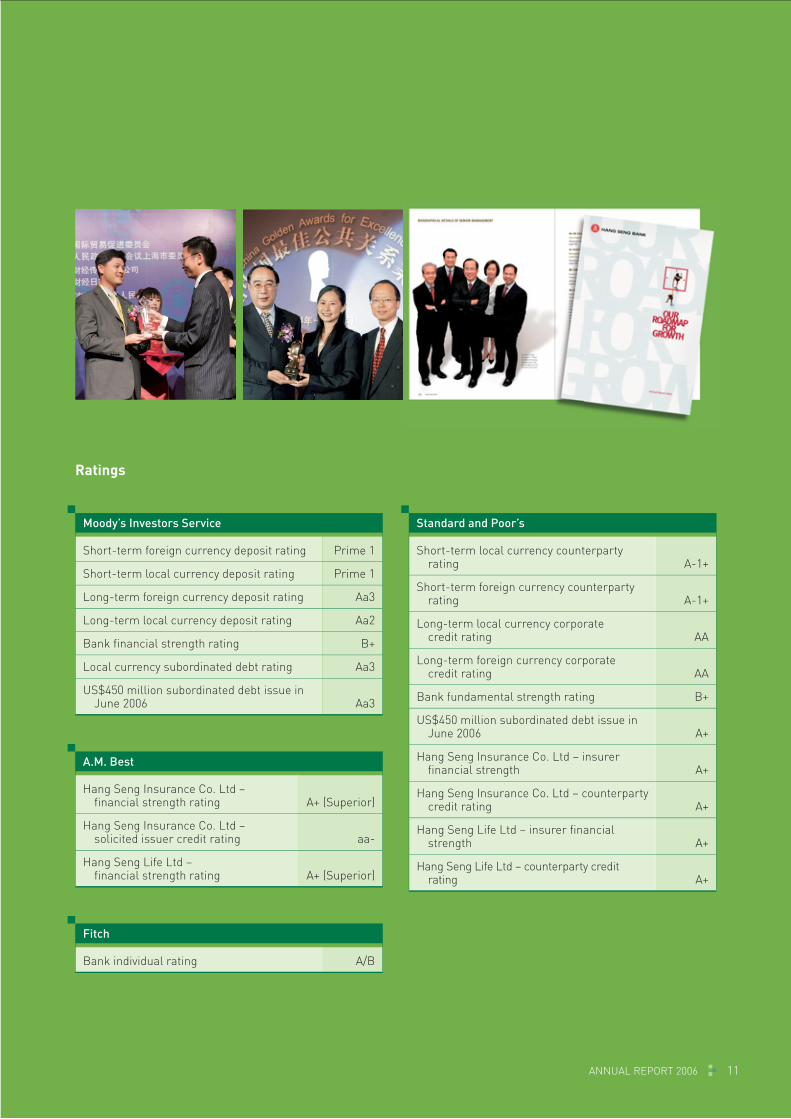
Moody’s Investors Service
Short-term foreign currency deposit rating Prime 1
Short-term local currency deposit rating Prime 1
Long-term foreign currency deposit rating Aa3
Long-term local currency deposit rating Aa2
Bank financial strength rating B+
Local currency subordinated debt rating Aa3
US$450 million subordinated debt issue in June 2006 Aa3
A.M. Best
Hang Seng Insurance Co. Ltd – financial strength rating A+ (Superior)
Hang Seng Insurance Co. Ltd – solicited issuer credit rating aa-
Hang Seng Life Ltd –financial strength rating A+ (Superior)
Fitch
Bank individual rating A/B
Ratings
Standard and Poor’s
Short-term local currency counterparty rating A-1+
Short-term foreign currency counterparty rating A-1+
Long-term local currency corporate credit rating AA
Long-term foreign currency corporate credit rating AA
Bank fundamental strength rating B+
US$450 million subordinated debt issue in June 2006 A+
Hang Seng Insurance Co. Ltd – insurer financial strength A+
Hang Seng Insurance Co. Ltd – counterparty credit rating A+
Hang Seng Life Ltd – insurer financial strength A+
Hang Seng Life Ltd – counterparty credit rating A+

12 HANG SENG BANK
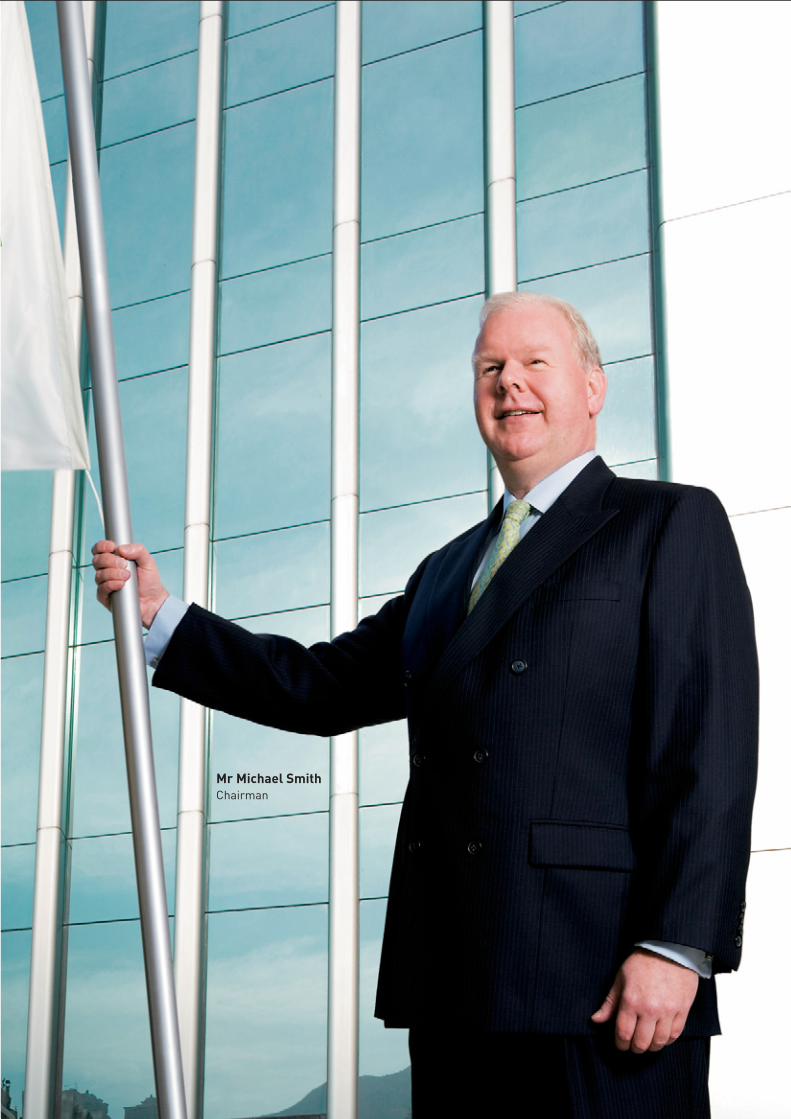
CHAIRMAN’S STATEMENT
LEADING“Hang Seng will continue to drive its business forward, flying the flag for premium customer service, sustainable growth and increasing value for shareholders.”
for Growth
13ANNUAL REPORT 2006
Mr Michael SmithChairman
14 HANG SENG BANK
CHAIRMAN’S STATEMENT
A sharp focus on our vision for long-term business growth along with good economic conditions helped Hang Seng achieve positive results in 2006.
Our personal wealth management business recorded significant rises in income from investment services, insurance and Private Banking. Commercial Banking performed strongly, underpinned by increases in customer advances and the development of corporate wealth management services. Additional investments in our mainland China operations yielded encouraging growth.
Operating profit rose by 13.6 per cent to HK$12,576 million, reflecting good growth of primary business drivers as well as a drop in loan impairment allowances. Operating profit excluding loan impairment charges and other credit risk provisions grew by 9.9 per cent to HK$12,840 million.
Attributable profit increased 6.1 per cent to a record HK$12,038 million. Earnings per share were up 6.2 per cent at HK$6.30.
The Directors have announced a fourth interim dividend of HK$1.90 per share. In light of capital requirements for future business expansion, particularly on the Mainland, total distribution for 2006 is HK$5.20 per share, the same as in 2005.
Operating expenses increased by 15.3 per cent to HK$5,241 million with further investments in human resources, IT, marketing and branding to support business growth in Hong Kong and on the Mainland.
Our return on average shareholders’ funds was 27.4 per cent.
Our total capital ratio was 13.6 per cent at year-end, up 0.8 percentage point compared with 31 December 2005. Our tier 1 ratio was up 0.3 percentage point at 10.7 per cent.
Personal Financial Services’ operating profit excluding loan impairment charges grew by 5.4 per cent to HK$7,840 million. Wealth management income was up 22.7 per cent at HK$4,281 million, reflecting record investment product sales, a high level of stock market activity and a 17.5 per cent rise in life insurance income. We also benefited from high levels of consumer confidence, recording increases in our credit card base and cardholder spending as well as in personal lending.
Commercial Banking’s operating profit excluding loan impairment charges rose 21.5 per cent to HK$2,001 million. Customer
advances grew by 22.2 per cent with trade finance gaining market share. Lending to the manufacturing industry and wholesale and retail sector outpaced the market average as a result of refined segmentation and deepened relationships.
Intensified marketing saw a 34.7 per cent increase in the number of new small and medium-sized enterprise accounts acquired in the second half of 2006 compared with the first half. Good progress with corporate wealth management services and card acquiring business underpinned growth in net fees and commissions and net trading income.
With keen competition continuing to put pressure on lending margins, Corporate Banking focused on asset yield. We further diversified our customer base, grew deposits by 32.5 per cent and took advantage of cross-selling opportunities. The strong growth of our targeted business segments helped to compensate for the decline in operating profit before loan impairment charges from lending to large corporates. Net operating income increased by 11.8 per cent. Net operating income excluding loan impairment charges rose 2.3 per cent. Operating profit excluding loan

15ANNUAL REPORT 2006
in market segments with high growth potential and growing our Mainland business more rapidly.
We have taken significant strides in the past year, but there is still much to do. Focusing on our strategic plan for growth, Hang Seng will continue to drive its business forward, flying the flag for premium customer service, sustainable growth and increasing value for shareholders.
Michael SmithChairmanHong Kong, 5 March 2007
impairment charges was HK$543 million, down 2 per cent compared with 2005.
Treasury’s operating profit excluding loan impairment charges declined 25 per cent to HK$887 million. Efforts to expand proprietary trading and customer-driven business helped trading income grow by 66.1 per cent to HK$628 million. However, net interest income fell by HK$514 million, or 51.7 per cent, as the balance sheet management portfolio continued to be challenged by rising funding costs and flattened yield curves.
Our Mainland business recorded good growth in advances, deposits, customer base and profit contribution. Operating profit excluding loan impairment charges at our Mainland branches rose by 211.9 per cent. We upgraded a representative office to a branch and opened three new sub-branches during the year. In December, we were granted permission to begin preparations for the establishment of a Mainland subsidiary. Our subsidiary bank will be named Hang Seng Bank (China) Limited and will be headquartered in Shanghai.
To demonstrate our strong commitment to this exciting market, in September we held a Board of Directors’ meeting on the Mainland for the first time.
Our PeopleBusiness success relies on the teamwork and talents of our staff. We work to bring out the best in our employees and they continue to
exceed our expectations. In 2006, putting our roadmap for growth strategy into action and ensuring that our comprehensive brand strengthening programme moved full steam ahead were just two of the tasks enthusiastically embraced by staff at all levels. That Hang Seng remains a standard-bearer for superior customer service is a testament to their commitment and professionalism.
In recognition of this dedication to excellence, the Directors approved performance-related salary increases of up to 8.75 per cent, which took effect in January 2007.
I also wish to convey the Board’s thanks to our customers and shareholders for their continued support of Hang Seng and for providing both inspiration and incentive as we work to enhance our position as a leading financial institution in Greater China.
Moving AheadHong Kong is likely to experience above-trend growth in 2007. Economic uncertainty in the US generated by weaknesses in the housing market may result in a slowing of export and re-export trade activity. However, sustained economic momentum, the
stabilisation of interest rates and the improving labour market will continue to drive domestic demand. The positive economic outlook for the Mainland also augurs well.
Against this backdrop, we will build on the good momentum generated in 2006 by making greater use of our competitive advantages, further developing our core business areas, strengthening our service capabilities
Business success relies on the teamwork and talents of our staff. We work to bring out the best in our employees and they continue to exceed our expectations.

16 HANG SENG BANK
CHIEF EXECUTIVE’S REPORT
SUCCESS“No one person can perform a symphony – it takes the efforts of an entire orchestra.”
Conducting

17ANNUAL REPORT 2006
Mr Raymond OrVice-Chairman and Chief Executive

18 HANG SENG BANK
CHIEF EXECUTIVE’S REPORT
I am pleased to report that Hang Seng gave an upbeat performance in 2006.
During our 2005 results announcement, we set out our roadmap for growth – a strategic plan to help us achieve our vision for future business success. Our hard work over the past year to put this strategy into action has yielded encouraging results.
From Vision To ActionSupported by the buoyant economic environment, we grew wealth management income by 22.7 per cent by further harmonising our service and product offerings with the investment and insurance needs of our customers.
Our Private Banking business built on its good growth momentum to achieve a 46.3 per cent increase in pre-tax profit. Given the progress made in the past year, we are confident of achieving our roadmap goal of doubling Private Banking’s pre-tax profit by 2008, two years ahead of schedule.
We capitalised on strong consumer demand to expand higher-yield lending, recording significant rises of
46.4 per cent in personal loans and 22.1 per cent in card receivables. Cards in issue reached 1.4 million.
Continued fine-tuning of relationships with Commercial Banking customers, especially small and medium-sized enterprises (SMEs), drove growth in trade finance, net fees and commissions, and net trading income. We gained market share in lending to the manufacturing industry and the wholesale and retail sector. Commercial Banking’s contribution to total pre-tax profit was 16.4 per cent, up from 8.8 per cent in 2005, putting us on track to achieve our five-year target of 20 per cent.
We further diversified our Treasury income base and promoted closer cooperation with other customer groups. This led to a 66.1 per cent increase in trading income, helping to offset the adverse effects of rising funding costs and flattened yield curves on the balance sheet management portfolio.
We picked up the pace of expansion in mainland China. Our number of full-time equivalent staff increased
by 284 to reach 661. We became the first foreign bank to have a branch in Dongguan and opened three new sub-branches in key cities. Including a Guangzhou sub-branch opened early this year, we now have 16 outlets on the Mainland.
This expansion in service capabilities helped us achieve strong growth in Mainland deposits and advances, which rose by 51.1 per cent and 50.9 per cent respectively.
In the second half of 2006, we obtained a licence and foreign exchange conversion quota under the Qualified Domestic Institutional Investors scheme. We finished the year on a high note by receiving approval to begin preparations to establish a Mainland subsidiary bank.
We stepped up mutually beneficial cooperation with our strategic partner Industrial Bank in areas such as customer referrals, accelerated remittance services and secondment of staff. We also actively explored possibilities for working together to enhance note delivery, cash deposit and other services.

19ANNUAL REPORT 2006
Including our share of profits from Industrial Bank, our Mainland business contributed 6.1 per cent of total pre-tax profit, up from 4.5 per cent in 2005, bringing us closer to our objective of 10 per cent by 2010.
We embarked on an integrated brand revitalisation programme designed to enhance our brand equity.
Emphasizing our progressive, pragmatic and thoughtful approach to service, this programme is helping us strengthen partnerships with existing customers and build relationships with new ones.
In May, we further rationalised our property portfolio with the sale of 77 Des Voeux Road Central for HK$2.26 billion. We also signed an agreement to lease 262,000 square feet of office space in Enterprise Square Five in Kowloon Bay. With occupancy planned for late 2007, moving some of our back office functions to this new site will help enhance our operating and cost efficiency.
Financial HighlightsGood growth in our core businesses and improved credit conditions saw operating profit grow 13.6 per cent to HK$12,576 million. Operating profit excluding loan impairment
Attributable profit reached a new high of HK$12,038 million.
charges was HK$12,840 million, up 9.9 per cent.
Pre-tax profit rose 7.8 per cent to HK$14,395 million, affected by a significant drop in property revaluation gains. Attributable profit reached a new high of HK$12,038 million, an increase of 6.1 per cent compared with 2005.
Increases in lending and contribution from net free funds helped net interest income grow by 8.3 per cent to HK$11,694 million. Average interest-earning assets were up 10.6 per cent at HK$578.6 billion.
The ratio of non-interest income to net operating income excluding loan impairment charges rose to 35.3 per cent, up from 33.5 per cent a year earlier.
Net interest income rose by HK$898 million, or 8.3 per cent. The loan portfolio expanded by 7.2 per cent driven by growth in consumer finance, trade finance and Mainland lending, contributing HK$419 million. Spreads on best lending rate-based loans improved, although strong market competition continued to exert downward pressure on mortgage and corporate loan pricing. Net free funds
+13.6%
Operating Profit

20 HANG SENG BANK
CHIEF EXECUTIVE’S REPORT (continued)
and the debt securities portfolio of life insurance fund investments contributed HK$867 million and HK$264 million respectively to the rise in net interest income.
These increases more than offset the HK$514 million decline in net interest income from the Treasury balance sheet management portfolio and the fall of HK$138 million due to the narrowing of spreads on Hong Kong dollar savings accounts and the change in deposit mix from savings to structured deposits.
Benefiting from the active stock market and positive investor sentiment, investment services income grew by 29.6 per cent. We offered new investment funds to capture growth on the Mainland and in other emerging markets, achieving a 40.6 per cent rise in retail fund sales. Income from structured products grew by 48.1 per cent.
The introduction of new products, the recruitment of more relationship managers and a continued emphasis on personalised advice saw Private
We embarked on an integrated brand revitalisation programme designed to enhance our brand equity.
+22.7%
Wealth Management income
Net fee income grew by 18.3 per cent to HK$3,497 million. Securities-related income rose 63.3 per cent, reflecting increases in turnover, customer base and market share. Card services income was up 22 per cent at HK$860 million, driven by rises of 10.5 per cent in the number of cards in issue and 11.7 per cent in cardholder spending.
Trading income grew by HK$445 million to HK$1,330 million, attributable mainly to a 50.1 per cent growth in foreign exchange income on the back of increased customer activity and improved trading results.
Income from wealth management rose by HK$793 million to HK$4,281 million.
Banking’s investment services income rise by 83.5 per cent. Assets under management increased 39.6 per cent.
Life insurance income grew by 17.5 per cent to HK$1,476 million as we further tapped the high-potential retirement and medical insurance markets.
Operating expenses rose by HK$695 million, or 15.3 percent. We made investments in staff, IT, marketing and branding to better position our Hong Kong business for continued growth and better prepare our Mainland business to take greater advantage of the growing opportunities.
Our cost efficiency ratio rose1 percentage point to 29 per cent, but
21ANNUAL REPORT 2006
remains among the lowest in the banking industry.
Underpinned by a HK$2,992 million rise in retained profits and an increase in the available-for-sale investment reserves, shareholders’ funds (excluding proposed dividends) grew by HK$4,410 million to HK$43,348 million. Return on average shareholders’ funds was 27.4 per cent.
As at 31 December 2006, our total and tier 1 capital ratios stood at 13.6 per cent and 10.7 per cent respectively, up from 12.8 per cent and 10.4 per cent a year earlier.
Our average liquidity ratio for 2006 was 51.9 per cent, up from 45.1 per cent in 2005.
Increases in both lending and deposits saw total assets grow by 15.2 per cent to HK$669.1 billion. At year-end, our advances-to-deposits ratio was 51.7 per cent, compared with 54.4 per cent at the end of 2005.
Gross advances to customers rose by 7.1 per cent to HK$280.3 billion.
The good investment climate helped us grow lending to the property
development sector by 9.8 per cent. Success with strengthening our Commercial Banking relationships was reflected in rises of 14.3 per cent and 18.4 per cent in lending to the wholesale and retail trade and the manufacturing sector respectively, as well as strong growth of 24 per cent in trade finance.
Lending to individuals rose 5.4 per cent (excluding the fall in Government Home Ownership Scheme mortgages) with improvement in the employment market underpinning demand. Strategic marketing, new credit card offerings and improved efficiency contributed to good growth in consumer finance. Our credit card business gained market share in terms of card base, spending and receivables.
Despite intense market competition, we increased residential mortgage lending by 5.9 per cent.
Loans for use outside Hong Kong increased by 39.8 per cent to HK$22,192 million, due largely to the 50.9 per cent rise in lending by our Mainland branches. Corporate lending on the Mainland enjoyed
good growth, driven by higher-margin RMB loans. Closer collaboration between our Mainland and Hong Kong teams led to a significant increase in Mainland trade finance.
At year-end, total loan impairment allowances as a percentage of gross advances to customers were 0.33 per cent, down from 0.39 per cent at the end of 2005. Gross impaired advances as a percentage of gross advances to customers were unchanged at 0.5 per cent.
Customer deposits, including certificates of deposit and other debt securities in issue, grew by 12.8 per cent. Hong Kong and US dollar savings accounts rose, reflecting a preference for liquidity in an active investment market. Additions to our range of structured products helped drive a 31.2 per cent increase in structured deposits, structured certificates of deposit and other debt securities in issue.
BrandingIn May 2006, we launched an integrated branding programme that covers advertising and key points of customer contact and is designed to establish us as the financial institution of choice for personal and commercial banking.
COMMERCIALStrong growth in
Banking

22 HANG SENG BANK
CHIEF EXECUTIVE’S REPORT (continued)

23ANNUAL REPORT 2006
The professionalism and dynamic attitude of our staff help define the Hang Seng spirit. When it comes to service, every member of our team is ready to jump into action to exceed ever-increasing customer expectations.
NEW HEIGHTSReaching

24 HANG SENG BANK
CHIEF EXECUTIVE’S REPORT (continued)
We launched a series of testimonial-style television commercials covering our SME, wealth management and insurance businesses. We also unveiled a fresh corporate look that uses a vibrant green to reflect our progressive and proactive attitude. All branches have adopted our new bulkhead and we are steadily rolling out our new branch design.
To engage all staff in the brand-building initiative, we have developed an internal branding framework comprising seven ‘Beliefs’ that ensure an excellent customer experience and strengthen our corporate value. In August we kicked-off ‘Live The Brand, Start With Me’, a Bank-wide communication and education campaign which is helping staff move from awareness to practical application of the seven ‘Beliefs’.
Focused On The FutureEfforts to reach our roadmap objectives are continuing to help us refine our business focus, putting us in a position to take better advantage of growth opportunities.
The economic outlook for the year ahead remains positive. Developments in the US housing sector may slow the pace of external trade, but increasing confidence in the local economy, the buoyant labour market and sustained growth on the Mainland should underpin domestic demand.
Supported by our revitalised brand, we are deepening relationships with existing customers and increasing our appeal among key customer groups.
Personal Financial Services will step up cross-selling efforts and expand
its customer base by leveraging its well-developed, all-weather portfolio of investment products. Private Banking’s growing service capabilities and open architecture will enable us to further tap the affluent customer segment by offering personalised financial solutions.
We have had notable success with our annuity and healthcare insurance plans and will continue to develop new products to complement our existing range.
We will capitalise on positive consumer sentiment to further grow personal lending.
On the Mainland, we will continue with our two-pronged approach of organic growth and close collaboration with Industrial Bank.
ExcellentCustomer
Experience
Engaged and Inspired Employee
Progressive Pragmatic Thoughtful
Cour
tesy
with
Pas
sion
Pro
fess
iona
lism
InnovationCorp
orat
e Re
spon
sibi
lity Execution Excellence
Corporate Governance
Our Seven ‘Beliefs’

25ANNUAL REPORT 2006
in the year ahead. We will work to identify more cross-selling opportunities and expand corporate treasury services. We will step up efforts to acquire new customers to grow our Corporate Banking deposit base.
We will further strengthen cooperation and communication between all customer groups.
No one person can perform a symphony – it takes the efforts of an entire orchestra. I am delighted to be working with a world-class ensemble whose members are in tune with each other and with our customers’ needs. Together we will continue to enhance our position as a leading financial institution in Greater China to the long-term benefit of our customers and shareholders.
Raymond OrVice-Chairman and Chief ExecutiveHong Kong, 5 March 2007
The establishment of our Mainland subsidiary bank, planned for the second quarter of this year, will mark a new phase of business expansion. We will take good advantage of the opportunities generated by the opening up of the retail RMB market and work to increase RMB deposits to support lending growth.
We will expand our Mainland customer base through setting up new outlets in high-growth areas,
I am delighted to be working with a world-class ensemble whose members are in tune with each other and with our customers’ needs.
By 2010, we aim to grow our Mainland business to more than 2,000 staff and over 50 outlets.
We will capitalise on our growing capabilities in southern China by offering a greater range of services to Commercial Banking customers with operations in Hong Kong and on the Mainland. Our closer partnerships with SME customers will help us grow trade finance and our corporate wealth management business.
increased marketing and more promotion of our strong brand, including leveraging our role as the compiler of the Hang Seng Index series.
In January this year we added a second Guangzhou sub-branch. We will soon open our sixth Shanghai sub-branch and have a further two planned for later in the year, giving us one of the largest networks among foreign banks in this strategic city. Other openings in the pipeline for 2007 include a branch in Hangzhou and a total of six sub-branches in Beijing, Guangzhou and Shenzhen.
Treasury will explore gapping opportunities while maintaining a prudent attitude towards growth in risk-weighted assets. We will further strengthen our customer-driven business and expand the scope of our proprietary trading. We will broaden our product range to include new commodity-linked, credit derivatives and hybrid instruments, and deepen our coverage in foreign exchange, interest rates and equity-linked structured products.
In a highly competitive market for corporate lending, Corporate Banking will continue to target asset yield

26 HANG SENG BANK
CORPORATE GOVERNANCE AND OTHER INFORMATION
In addition to the module on “Corporate Governance of Locally Incorporated Authorised Institutions” under the Supervisory Policy Manual issued by the Hong Kong Monetary Authority (“HKMA”) in September 2001, the Bank also follows all the code provisions set out in the Code on Corporate Governance Practices (the “Code”) contained in Appendix 14 of the Rules Governing the Listing of Securities on The Stock Exchange of Hong Kong Limited (the “Listing Rules”) throughout the year.
Board Of DirectorsThe BoardAt 5 March 2007, the Bank’s Board consisted of 15 Directors. The Board has collective responsibility for leadership and control of, and for promoting the success of, the Bank by directing and supervising the Bank’s affairs.
The types of decisions which are to be taken by the Board include those relating to :
– Annual plans and performance targets;
– Specified senior appointments;
– Acquisitions and disposals above predetermined thresholds; and
– Any substantial change in balance sheet management policy.
Chairman And Chief ExecutiveThe roles of Chairman of the Board and Chief Executive of the Bank are segregated, with a clear division of responsibilities. The Chairman of the Board is anon-executive Director who is responsible for the
leadership and effective running of the Board. The Chief Executive of the Bank is an executive Director who exercises all the powers, authorities and discretions of the Executive Committee as may be delegated to him in respect of the Bank and its subsidiaries.
Board Composition The Board comprises three executive Directors and 12 non-executive Directors. Of the 12 non-executive Directors, eight are independent non-executive Directors. All the independent non-executive Directors meet the guidelines for assessment of independence as set out in Rule 3.13 of the Listing Rules.
Members of the Board of the Bank, who come from a variety of different backgrounds, have a diverse range of business, banking and professional expertise. Brief biographical particulars of all Hang Seng Directors, together with information relating to the relationship among them, are set out in the “Biographical Details of Directors” section under the Bank’s 2006 Annual Report.
Board ProcessRegular Board/Committee meeting schedules for each year are made available to all Directors/Committee members at the beginning of the year. In addition, notice of meetings will be given to all Directors prior to each Board meeting, normally at least 14 days in advance.
Other than regular Board meetings, in 2006, the Chairman also met with non-executive Directors, including independent non-executive Directors, without the presence of executive Directors to discuss matters of particular interest.
Hang Seng is committed to high standards of corporate governance.
27ANNUAL REPORT 2006
All Directors have access to the Company Secretary who is responsible for ensuring that the Board procedures, and related rules and regulations, are followed.
Under the Articles of Association of the Bank, a Director shall not vote or be counted in the quorum in respect of any contract, arrangement, transaction or other proposal in which he or his associate(s), is/are materially interested.
Minutes of Board/Committee meetings are kept by the Company Secretary and are open for inspection by Directors.
Appointments, Re-election And Removal The Bank’s Articles of Association provide that each Director is required to retire by rotation once every three years and that one-third (or the number nearest to one-third) of the Directors shall retire from office every year during the Bank’s Annual General Meeting. A Director’s specific term of appointment, therefore, cannot exceed three years. Retiring Directors shall be eligible for re-election at the Annual General Meeting of the Bank.
Hang Seng uses a formal, considered and transparent procedure for the appointment of new Directors. Before a prospective Director’s name is formally proposed, the opinions of the existing Directors (including the independent non-executive Directors) are sought. After considering the proposal for the appointment of a new Director, the Executive Committee will make its recommendation to the Board for further decision. In accordance with the requirement under the Banking Ordinance, approval from the HKMA will also be obtained. All new Directors are subject to election by shareholders of the Bank at the next scheduled Annual General Meeting after their appointments become effective.
In 2006, Mr Edgar D Ancona was appointed a non-executive Director of the Bank. The appointment was approved by the Board at a meeting held on 27 April 2006. All Directors, except Mr John C C Chan, attended the meeting.
Responsibilities Of DirectorsThe Bank regularly reminds all Directors of their functions and responsibilities. Through regular Board meetings, all Directors are kept abreast of the conduct, business activities and development of the Bank.
Induction programmes are arranged for newly appointed Directors. All Directors are given opportunities to update and develop their skills and knowledge.
All Directors have full and timely access to all relevant information about the Bank so that they can discharge their duties and responsibilities as Directors. There are established procedures for Directors to seek independent professional advice on Bank-related matters where appropriate. All costs associated with obtaining such advice will be borne by the Bank. In addition, each Director has separate and independent access to the Bank’s senior management.
The Bank has adopted a Code for Securities Transactions by Directors on terms no less exacting than the required standards set out in the Model Code for Securities Transactions by Directors of Listed Issuers (set out in Appendix 10 to the Listing Rules). Specific enquiries have been made with all Directors (including those who have ceased to be Directors or who have become Directors during the year ended 31 December 2006) who have confirmed that they complied with the Bank’s Code for Securities Transactions by Directors at all the applicable times for the period from 1 January 2006 to 31 December 2006 (both dates inclusive).
The interests in Group securities, including HSBC Holdings plc and the Bank, held by Directors as at 31 December 2006 are disclosed in the Directors’ Report attached to the Bank’s 2006 Annual Report.

28 HANG SENG BANK
CORPORATE GOVERNANCE AND OTHER INFORMATION (continued)
Board Members’ Attendance
Name
Number of Board meetings held during the Director’s term of
office in 2006Number of
meetings attended
Mr Michael R P Smith# (Chairman) 7 7
Mr Raymond C F Or (Vice-Chairman and Chief Executive) 7 7
Mr Edgar D Ancona# (Appointed as Director on 4 September 2006) 2 2
Mr John C C Chan* 7 5
Mr Patrick K W Chan (Executive Director and Chief Financial Officer) 7 7
Dr Y T Cheng* 7 7
Dr Marvin K T Cheung* (Note) 7 3
Mr S J Glass# (Resigned as Director on 24 March 2006) 2 2
Mr Jenkin Hui* 7 6
Mr Peter T C Lee* 7 5
Dr Eric K C Li* 7 6
Dr Vincent H S Lo# 7 4
Mr Joseph C Y Poon (Managing Director and Deputy Chief Executive) 7 7
Dr David W K Sin* 7 7
Mr Richard Y S Tang* 7 6
Mr Peter T S Wong# 7 6
* Independent non-executive Director
# Non-executive Director
(Note: Dr Marvin K T Cheung has been indisposed since 20 July 2006, and will resume duty on 11 March 2007.)
Executive Committee
Members: Mr Raymond C F Or (Chairman) Mr Peter T S Wong Mr Joseph C Y Poon Mr Patrick K W Chan Mr William W LeungØ
Mrs Dorothy K Y P SitØ
(ØGeneral Manager)
Audit Committee
Members: Dr Eric K C Li (Chairman) Mr Richard Y S Tang Dr Marvin K T Cheung
Remuneration Committee
Members: Mr John C C Chan (Chairman) Mr Jenkin Hui Mr Peter T C Lee
Board
Delegation By The BoardManagement Functions And Board CommitteesThe Board has set up three committees: the Executive Committee, the Audit Committee and the Remuneration Committee.
Each of these committees has specific written terms of reference which deal clearly with their authority and duties. All committees, except the Executive Committee, are comprised solely of independent non-executive Directors.

29ANNUAL REPORT 2006
The Executive Committee meets each month and operates as a general management committee under the direct authority of the Board. It exercises the powers, authorities and discretions of the Board in so far as they concern the management and day-to-day running of the Bank in accordance with its terms of reference and such other policies and directives as the Board may determine from time to time. The Executive Committee also sub-delegates credit, investment and capital expenditure authorities to its members.
The Audit Committee meets regularly, normally four times a year, with the senior financial, internal audit and compliance management and the external auditors to consider the Bank’s financial reporting, the nature and
scope of audit reviews and the effectiveness of the systems of internal control and compliance. It is also responsible for the appointment, reappointment, removal and remuneration of external auditors. The Audit Committee reports to the Board following each Audit Committee meeting, drawing the Board’s attention to salient points that the Board should be aware of, identifying any matters in respect of which it considers that action or improvement is needed and making relevant recommendations.
The Remuneration Committee considers human resource issues and makes recommendations to the Board on the Bank’s policy and structure for remuneration of Directors and senior management. It meets at least twice a year.
Committee Members’ Attendance
Number of meetings attended during 2006
Name Executive Committee Audit CommitteeRemuneration
Committee
Mr Raymond C F Or 12 out of 12 – –
Mr John C C Chan* – – 2 out of 2
Mr Patrick K W Chan 12 out of 12 – –
Dr Marvin K T Cheung* (Note 1) – 2 out of 5 –
Mr Jenkin Hui* – – 2 out of 2
Mr Peter T C Lee* – – 2 out of 2
Dr Eric K C Li* – 5 out of 5 –
Mr Joseph C Y Poon 9 out of 12 – –
Mr Richard Y S Tang* – 5 out of 5 –
Mr Peter T S Wong# (Note 2) 12 out of 12 – –
Mr William W Leungø 11 out of 12 – –
Mrs Dorothy K Y P Sitø 10 out of 12 – –
* Independent non-executive Director
# Non-executive Director
ø General Manager
(Notes: 1. Dr Marvin K T Cheung has been indisposed since 20 July 2006, and will resume duty on 11 March 2007.
2. Seven meetings were attended by Mr Peter T S Wong’s alternates.)

30 HANG SENG BANK
CORPORATE GOVERNANCE AND OTHER INFORMATION (continued)
Business needs
General economic situation, including GDP growth and local inflation rates
Changes in appropriate markets, e.g. supply/demand fluctuations and changes in competitive conditions
Individual contributions to results as confirmed in the performance appraisal process
Retention considerations and individual potential
Remuneration packages of Executive Directors
The Remuneration Committee held two meetings in 2006. The work performed by the Committee during 2006 included:
– Reviewing the fees payable to the Directors and the members of the Board’s Committees;
– Reviewing the policy for the remuneration of the executive Directors of the Bank and the Directors of the Bank’s subsidiaries;
– Reviewing the remuneration of the executive Directors and senior management of the Bank;
– Determining the remuneration packages of a newly appointed senior executive of the Bank and the fees payable to members of a newly established Audit Committee of a subsidiary of the Bank; and
– Reviewing general and special salary increases of the Bank’s staff for 2007.
During the process of consideration, no individual Director was involved in decisions relating to his/her own remuneration.
The present scale of Director’s fees, and additional fees for membership on the Audit Committee and Remuneration Committee, is outlined below:
Amount
Board of Directors:Director’s annual fees
Chairman HK$230,000
Vice-Chairman HK$150,000
Other directors HK$150,000
Audit Committee:Additional annual fees
Chairman HK$120,000
Other members HK$80,000
Remuneration Committee:Additional annual fees
Chairman HK$60,000
Other members HK$40,000
Remuneration of Directors and Senior ManagementThe Level And Make-up Of Remuneration and Disclosure The Remuneration Committee is responsible for the policy on remuneration of Directors and senior management.
The Bank’s policy on remuneration is to maintain fair and competitive packages based on business needs and industry practice. For determining the level of fees paid to members of the Board of Directors, market rates and factors such as each Director’s workload and required commitment will be taken into account. The following factors are considered when determining the remuneration packages of Executive Directors:

31ANNUAL REPORT 2006
Board
– to approve risk management policies and major risk control limits
– to oversee the monitoring and control of various types of risks
Executive Committee / Audit Committee / Asset and Liability Management Committee / Credit Committee
– to review risk management reporting by business and functional units
Business and functional units
– to assess individual types of risk arising under their areas of responsibility
– to manage the risks in accordance with risk management procedures
– to report on risk management
The Bank’s internal control system comprises a well-established organisational structure and comprehensive policies and standards. Areas of responsibilities for each business and operational unit are clearly defined to ensure effective checks and balances.
Procedures have been designed for safeguarding assets against unauthorised use or disposition; for maintaining proper accounting records; and for ensuring the reliability of financial information used within the business or for publication. The procedures provide reasonable but not absolute assurance against material errors, losses or fraud. Procedures have also been designed to ensure compliance with applicable laws, rules and regulations.
Systems and procedures are in place in the Bank to identify, control and report on the major types of risks the Bank faces. In particular, the Bank has developed comprehensive procedures (ranging from a money laundering deterrence programme to health and safety rules) to manage reputational risks that may arise as a consequence of its daily operations. The Bank’s general risk management control procedures are also illustrated below:
Information relating to the remuneration of each Director for 2006 is set out in Note 18 to the Bank’s 2006 Financial Statements.
Accountability And AuditFinancial Reporting The Board aims at making a balanced, clear and comprehensive assessment of the Bank’s performance, position and prospects. An annual operating plan is reviewed and approved by the Board on a yearly basis. Reports on monthly financial results, business performance and variances against the approved annual operating plan are submitted to the Board at each Board meeting for regular monitoring.
Strategic planning cycles are generally from three to five years. The HSBC Group Strategic Plan for 2004 to 2008, Managing for Growth, was adopted by Hang Seng’s Board in January 2004.
The annual and interim results of the Bank are announced in a timely manner within the limits of three months and two months respectively after the end of the relevant periods.
The Directors acknowledge their responsibility for preparing the accounts of the Bank. As at 31 December 2006, the Directors are not aware of any material uncertainties relating to events or conditions which may cast significant doubt upon the Bank’s ability to continue as a going concern. Accordingly, the Directors have prepared the financial statements of the Bank on a going-concern basis.
The responsibilities of the external auditors with respect to financial reporting are set out in the report of the auditors attached to the Bank’s 2006 Financial Statements.
Internal ControlsSystem And ProceduresThe Directors are responsible for internal control at the Bank and its subsidiaries and for reviewing its effectiveness.

32 HANG SENG BANK
CORPORATE GOVERNANCE AND OTHER INFORMATION (continued)
More detailed discussions on the policies and procedures for management of each of the major types of risk the Bank faces, including credit, market, liquidity and operational risks, are included in the risk management section of the “Financial Review” section under the Bank’s 2006 Annual Report, and in Note 61 to the Bank’s 2006 Financial Statements.
Annual AssessmentA review of the effectiveness of the Bank’s internal control system covering all controls, including financial, operational and compliance and risk management controls, is conducted annually. The review at the end of 2006 was conducted with reference to the COSO (The Committee of Sponsoring Organisations) internal control framework, which assesses the Bank’s internal control system against the five elements of control environment, risk assessment, control activities, communication and monitoring. The result has been reported to the Audit Committee and the Board.
Internal AuditInternal audit plays an important role in the Bank’s internal control framework. It monitors the effectiveness of internal control procedures and compliance with policies and standards across all business and operational units. All management letters from external auditors and reports from regulatory authorities will be reviewed by the Audit Committee and all recommendations will be implemented. Management is required to annually provide the internal audit function with written confirmation that it has acted fully on all recommendations made by external auditors and regulatory authorities. The internal audit function also advises management on operational efficiency and other risk management issues. The work of the internal audit function is focused on areas of greatest risk to the Bank as determined by risk assessment. The head of internal audit of the Bank reports to the Chairman and the Audit Committee.
External AuditorsThe Bank’s external auditor is KPMG. The Audit Committee is responsible for making recommendations to the Board on the appointment, reappointment, removal and remuneration of the external auditor. The external auditor’s independence and objectivities are also reviewed and monitored by the Audit Committee.
During 2006, fees paid to the Bank’s external auditor for audit services totalled HK$11.2 million, compared with HK$10.8 million in 2005. For non-audit services, the fees paid amounted to HK$2.9 million, compared with HK$7.3 million in 2005. The significant non-audit service assignments covered by these fees include the following:
Nature of service Fees paid (HK$m)
Review of regulatory returns and interim review 1.9
Tax services 0.8
Other services 0.2
2.9
Audit CommitteeThe Audit Committee assists the Board in meeting its responsibilities for ensuring an effective system of internal control and compliance, and in meeting its external financial reporting obligations.
The Audit Committee held five meetings in 2006. The work performed by the Committee during 2006 included:
– Reviewing the Directors’ Report and Full-year Accounts for the year ended 31 December 2005 and the annual results announcement;
– Reviewing the Interim Accounts for the six months ended 30 June 2006 and the interim results announcement;
– Reviewing the recently issued accounting standards, and the progress of implementation work relating to the Sarbanes-Oxley Act and Basel II;
– Developing and implementing a policy on the employment of former employees of the external auditors;

33ANNUAL REPORT 2006
– Reviewing the preliminary internal audit and compliance framework for the establishment of a mainland China-incorporated foreign bank;
– Reviewing the internal audit plan for 2007;
– Reviewing essential matters or high-level reports relating to financial control, internal audit, credit and compliance, and the system of internal control, and discussing these with management;
– Reviewing regular risk management reports and the business continuity planning for avian influenza crisis; and
– Monitoring the staffing and resources of the Bank’s Internal Audit Department.
Communication With ShareholdersEffective CommunicationThe Bank attaches great importance to communications with shareholders and a number of means are used to promote greater understanding and dialogue with investment audiences. The Bank holds group meetings with analysts to announce its annual and interim results. The results announcements are also broadcast live via webcast. Apart from the above, designated senior executives maintain regular dialogue with institutional investors and analysts to keep them abreast of the Bank’s development. Including the two results announcements, a total of 77 meetings with 332 analysts and fund managers from 258 companies were held in 2006. The Bank’s Chief Executive and Chief Financial Officer made presentation at major investor forums held in Hong Kong and overseas. The Bank’s website www.hangseng.com contains an investor relations section which offers timely access to the Bank’s press releases and other business information.
The Annual General Meeting provides a useful forum for shareholders to exchange views with the Board. The Bank’s Chairman, executive Directors, Chairman of the Audit Committee and non-executive Directors are available atthe Annual General Meeting to answer questions from shareholders. Separate resolutions are proposed at general meetings for each substantial issue, including the
election of individual Directors. Procedures for voting by poll, which comply with the Listing Rules and the Articles of Association of the Bank, are set out in the circular to shareholders dispatched together with the Annual Report.
The Bank’s last Annual General Meeting of shareholders was held on Wednesday, 26 April 2006 at 3:30pm at the Penthouse of Hang Seng Bank Headquarters, 83 Des Voeux Road Central, Level 24, Hong Kong. All the resolutions proposed at that meeting were approved by shareholders of the Bank by poll voting. Details of the poll results are available under the investor relations section of the Bank’s website www.hangseng.com.
The next Annual General Meeting of shareholders will be held on Wednesday, 2 May 2007. Shareholders may refer to the “Corporate Information and Calendar” section under the Bank’s 2006 Annual Report for a calendar of other important dates for shareholders in the financial year 2007.
Other InformationThe Annual and Interim Reports contain comprehensive information on business strategies and developments. Discussions and analyses of the Bank’s performance during 2006 and the material factors underlying its results and financial position can be found in the Chairman’s Statement, the Chief Executive’s Report and the Financial Review in the Bank’s 2006 Annual Report.
Material Related Party Transactions And Contracts Of SignificanceThe Bank’s material related party transactions are set out in Note 60 to the 2006 Financial Statements. These transactions include those that the Bank has entered into with its immediate holding company and fellow subsidiary companies in the ordinary course of its interbank activities, including the acceptance and placement of interbank deposits, correspondent banking transactions, off-balance sheet transactions, and the provision of other banking and financial services.

34 HANG SENG BANK
CORPORATE GOVERNANCE AND OTHER INFORMATION (continued)
The Bank uses the IT services of, and shares an automated teller machine network with, The Hongkong and Shanghai Banking Corporation Limited, its immediate holding company. The Bank also shares IT and certain processing services with fellow subsidiaries on a cost recovery basis. For 2006, the Bank’s share of the costs include HK$174 million for system development services, HK$24 million for printing and stationery, HK$109 million for data processing, and HK$44 million for administrative services.
The Bank maintains a staff retirement benefit scheme for which a fellow subsidiary company acts as insurer and administrator. As part of its ordinary course of business with other financial institutions, the Bank also markets Mandatory Provident Fund products and distributes retail investment funds for fellow subsidiaries, with a fee income of HK$61 million and HK$77 million respectively in 2006. Hang Seng Investment Management Limited, a wholly owned subsidiary of the Bank, manages in the ordinary course of its business a fund administered by a fellow subsidiary, to whom management fee rebates were made. The rebate for 2006 amounted to HK$59 million.
The Bank also sells life insurance products issued byHang Seng Life Limited, which is a 50% subsidiary of the Bank (the remaining 50% is indirectly owned by the Bank’s controlling shareholder, The Hongkong and Shanghai Banking Corporation Limited). Hang Seng Life Limited subscribes to management services provided by a fellow subsidiary on a cost recovery basis and, for 2006,Hang Seng Life Limited’s share of the costs amounted to HK$72 million. Hang Seng Life Limited also uses the investment management services of a fellow subsidiary, and fees paid in 2006 amounted to HK$30 million.
These transactions were entered into by the Bank in the ordinary and usual course of business on normal commercial terms, and in relation to those which constitute connected transactions under the Listing Rules, they also comply with applicable requirements under the Listing Rules. The Bank regards its usage of the IT services of The Hongkong and Shanghai Banking Corporation Limited (amount of IT services cost incurred for 2006: HK$399 million), and the sale of life insurance products issued by Hang Seng Life Limited (amount of commission income for 2006: HK$697 million), as contracts of significance for 2006.
Human ResourcesThe human resources policies of the Bank are designed to attract people of the highest calibre and to motivate them to excel in their careers, as well as uphold the Bank’s culture of service quality.
Employee StatisticsAs at 31 December 2006, the Bank’s total headcount was 8,498, reflecting an increase of 610, or 7.73 per cent, compared with a year earlier. The total comprised 864 executives, 3,085 staff officers and 4,549 clerical and non-clerical staff.
Employee RemunerationCompensation packages take into account levels and composition of pay in the markets in which the Bank operates. Salaries are reviewed annually in the context of individual and business performance, market practice, internal relativities and competitive market pressures.
Under appropriate circumstances, performance-related variable pay is provided as an incentive for staff. In 2006, incentive payments were made to staff members who had chosen to join the Bank’s 12-month Pay Scheme with variable bonus under performance-based remuneration strategy.
Since 1999, the Bank has participated in the HSBC Holdings Savings-related Share Option Plan (Sharesave), which enables staff members to make monthly savings for the purchase of HSBC Group shares after a specified period. For Sharesave 2006, 2,666 staff members had subscribed to the plan.
Other incentive awards were also made. More than 1,300 staff were rewarded with HSBC Group shares or cash in 2006 for outstanding performance or displaying good potential.
Employee Involvement Communication with staff is a key aspect of the Bank’s policies. Information relating to employment matters, the Bank’s business direction, and strategies and factors affecting the Bank’s performance are conveyed to staff via different channels, including interchange sessions, focus group meetings, an intranet site, in-house magazines, morning broadcasts and training programmes. Employees are encouraged to contribute their ideas during work improvement programmes, cross-team projects and suggestion schemes.
35ANNUAL REPORT 2006
Staff DevelopmentIn order to fully develop staff members’ potential, the Bank offers a wide range of training programmes that help them fulfil their personal career goals or professional training requirements, including those for regulated businesses and activities, while equipping them to meet future challenges. Two training programmes respectively won The Bronze Award and Certificate of Excellence in the 2006 Award for Excellence in Training competition organised by Hong Kong Management Association. These programmes were also awarded American Society for Training and Development (ASTD) Excellence in Practice citations.
New staff joining the Bank attend an induction programme that provides them with a better understanding of the history, culture and values of the Bank. In 2006, the staff integration programme was delivered to facilitate the integration of new executives to familiarise them with the culture and strategies of the Bank. Continuous educational development is provided to staff through the Bank’s Learning Resource Centre, multi-media programmes, an intranet site and videos. Staff members are also encouraged to pursue professional or academic qualifications through the Bank’s Education and Professional Qualification Award System.
An in-branch pre-placement training scheme, comprising self-learning material, learning guide, training videos and online exercises as well as workplace coaching, was launched for new sales staff at Mainland branches to equip them with the necessary skills upon joining the Bank.
To foster the Bank’s ‘can-do’ spirit and ‘listening and speaking up’ culture, a new series of ‘Driving the Change’ programmes were launched. In support of the Bank’s Six Sigma initiatives, a seminar was organised for certain officers and executives in 2006.
The average number of training days per staff member in 2006 was 6.5 days.
Recruitment And RetentionThe employment market continued to be active in 2006. Various resourcing measures, including a number of employer branding and staff retention initiatives, were implemented to attract and retain high-quality staff.
The Bank in 2006 participated in the Financial Services Career Exhibition organised by the FinMan Committee and the Hong Kong Polytechnic University and the Career Expos organised by the Hong Kong Trade Development Council, the Hong Kong Federation of Youth Groups and the Labour Department of the Hong Kong government.
As part of the Bank’s staff retention programme, packages and career paths for certain job positions have been reviewed to increase career advancement opportunities and ensure market competitiveness. Trainee programmes have also been developed for jobs in selected functional areas.
Code Of ConductTo ensure the Bank operates according to the highest standards of ethical conduct and professional competence, all staff are required to strictly follow the Code of Conduct contained in the Staff Handbook. Following the relevant regulatory guidelines and other industry best practices, the Code sets out ethical standards and values to which staff are required to adhere and covers various legal, regulatory and ethical issues. These include topics such as prevention of bribery, dealing in securities, personal benefits, outside employment and anti-discrimination policies.
The Bank uses various communication channels to periodically remind staff of the requirement to adhere to the rules and ethical standards set out in the Code.
Health And SafetyThe Bank recognises the need for effective management of health and safety in order to provide a safe working environment. The Bank focuses on identifying health, safety and fire risks in advance, taking any measures necessary to remove, reduce or control material risks of fires and of accidents or injuries to employees and visitors.
Following the SARS outbreak in 2003, the Bank prepared a Communicable Diseases Plan. This sets out the key issues to be addressed and the responses to be taken in the event of a similar occurrence involving a serious communicable disease. To get the Bank prepared for the outbreak of avian influenza, an Avian Influenza Contingency Manual was prepared jointly with various divisions with reference to the SARS experience. Staff have been made aware through various channels of the importance of personal hygiene and health, and informed of the contingency measures to adopt should there be an outbreak.

36 HANG SENG BANK
BUSINESS OPERATIONS – BUSINESS IN HONG KONG

37ANNUAL REPORT 2006
CHAMPIONWhatever a customer’s financial goals, our award-winning services can help them achieve their objectives at their preferred pace.
A Wealth Management
38 HANG SENG BANK
BUSINESS OPERATIONS – BUSINESS IN HONG KONG
In a competitive operating environment, Hang Seng differentiated itself through customer service excellence, driven by a progressive and pragmatic approach to business as well as product and service innovations.
Commercial Banking and wealth management business both achieved significant increases in income as we stepped up efforts to refine our relationship management strategy and further personalise financial solutions. The strong labour market supported good growth in consumer finance, particularly personal loans and card receivables.
Our comprehensive brand strengthening programme helped us deepen existing customer relationships and broaden our appeal in key market segments such as young people, affluent individuals and small and medium-sized enterprises (SMEs).
Customer deposits, including certificates of deposit and other debt securities in issue, grew by 12.8 per cent to HK$540.3 billion, largely reflecting increases in savings and structured deposits, which rose by 18.2 per cent and 31.2 per cent respectively.
We further expanded and diversified our loan portfolio. This resulted in an HK$18.6 billion, or 7.1 per cent, increase in gross advances to customers.
We continued with our property portfolio rationalisation strategy, realising HK$3.1 billion through the sale of several properties.
To support business expansion, we hired more staff in key areas such as Commercial Banking, wealth management and IT. We also continued to place strong emphasis on employee development through various training, coaching and mentoring programmes and talent management initiatives. In a buoyant employment market, we focused on staff retention through a combination of competitive compensation packages, incentive schemes and career development programmes.
Personal Financial ServicesPersonal Financial Services recorded pre-tax profit of HK$7,730 million, representing 52.9 per cent of total pre-tax profit.
Net interest income rose 4.7 per cent, benefiting from the improvement of spreads on best lending rate-based loans and growth in customer advances.
Wealth management income grew by 22.7 per cent. The strong stock market and the introduction of new investment products helped investment services income increase by HK$576 million to HK$2,519 million. Private Banking achieved a 51.1 per cent rise in total operating income to HK$731 million. Life insurance income was up 17.5 per cent at HK$1,476 million.
+46.3%
Private Banking pre-tax profit

39ANNUAL REPORT 2006
Investment ServicesWe worked to capitalise on the positive investment climate by expanding our product range to meet changing market demands and grow fee income. We used increased marketing and competitive pricing strategies to acquire new customers and boost turnover. Investment services income rose by 29.6 per cent.
We grew our securities services customer base by 20.1 per cent through special promotions and enhancing delivery channels for faster and easier completion of transactions. Securities services income increased 63.3 per cent, with growth of 86.6 per cent in stockbroking turnover.
A 40.6 per cent increase in retail investment fund sales was achieved by offering a wide range of funds to suit different needs, the timely provision of supporting services such as market and fund performance
commentaries, and taking action to strengthen our fund management business. The number of investment fund accounts rose by 7.8 per cent.
We received number one rankings from Morningstar Asia, S&P’s Fund Services and Lipper for the 2006 performance of five Hang Seng funds, with one-year returns in Hong Kong dollars ranging from 52.3 per cent for the Hang Seng Hong Kong Property Equity Fund to 161.1 per cent for the Hang Seng China H-Share Index Leveraged 150 Fund.
In January 2006, we launched the Hang Seng China Equity Fund to increase choice for retail customers looking to benefit from the high growth potential of the mainland China market.
We continued to enjoy an excellent customer response to funds offered under our Qualified Foreign Institutional Investor licence. We have
applied to the Mainland authorities to increase our current quota of US$100 million, which is now fully utilised.
The introduction of more structured deposits and instruments, particularly those with shorter tenors and callable features, helped structured products issue volume and income grow by 93 per cent and 48.1 per cent respectively.
Private Banking’s 10th anniversary year proved a successful one. Assets under management grew by 39.6 per cent and investment services income rose by 83.5 per cent, driven by increases in the number of relationship managers, cross-referrals and product offerings. Pre-tax profit was up 46.3 per cent at HK$556 million.
Total funds under management, including discretionary and advisory, increased by 10.3 per cent to HK$106.4 billion.

40 HANG SENG BANK
BUSINESS OPERATIONS – BUSINESS IN HONG KONG (continued)
Residential mortgage lending grew by 5.9 per cent.
InsuranceOur life insurance income grew with the launch of products targeting expanding market segments. The Monthly Income Retirement Plan helped strengthen our retirement planning portfolio and the MediCash Lifetime Insurance Plan extended our retirement offerings to include health protection.
Operating income rose by 17.5 per cent to HK$1,476 million. The number of policies in force increased 18.5 per cent.
Consumer LendingExcluding the fall in Government Home Ownership Scheme mortgages, lending to individuals rose by 5.4 per cent. Personal loans rose significantly by 46.4 per cent and we gained market share.
Enhancements to ‘Mortgage-Link’ accounts as well as the expansion of our online mortgage services enabled us to grow residential mortgage lending by 5.9 per cent.
New credit cards such as VISA Infinite, an invitation-only card for affluent customers, and increased collaboration with merchants contributed to an 11.7 per cent increase in card spending. Card services income grew by 22 per cent to HK$860 million.
The launch of alpha card, a debit card for 15 to 18 year olds, helped us capture new business among young people.
41ANNUAL REPORT 2006
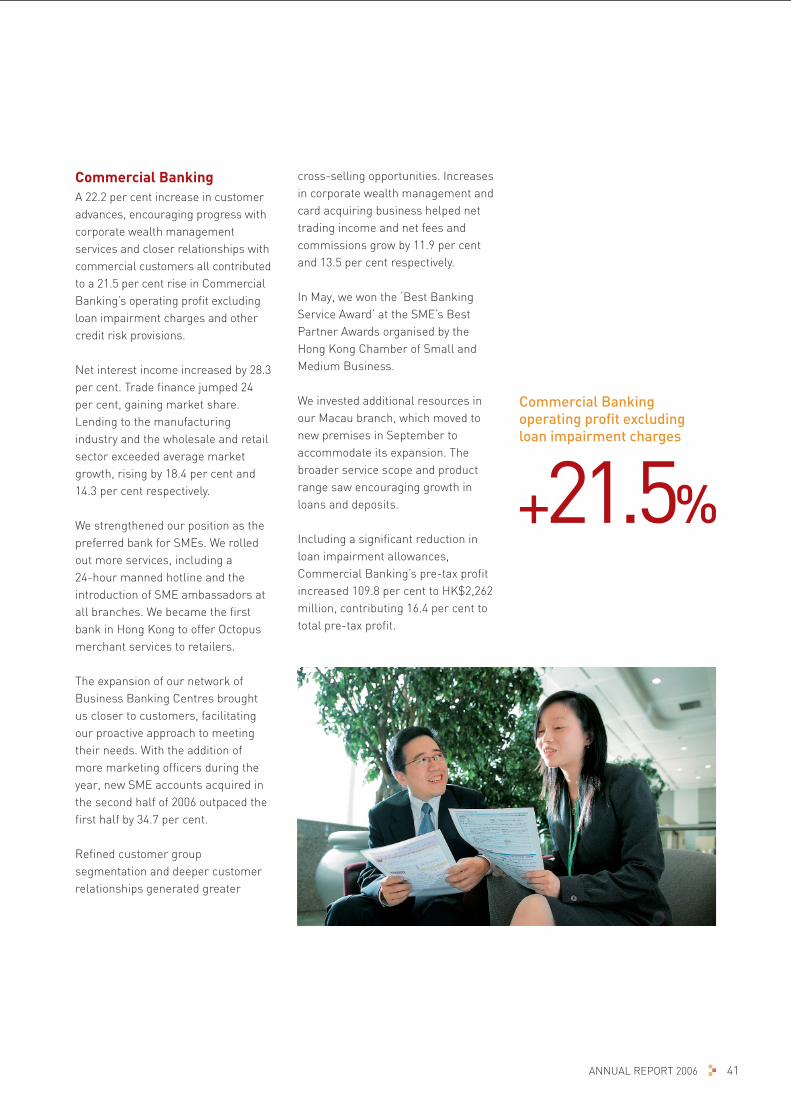
Commercial BankingA 22.2 per cent increase in customer advances, encouraging progress with corporate wealth management services and closer relationships with commercial customers all contributed to a 21.5 per cent rise in Commercial Banking’s operating profit excluding loan impairment charges and other credit risk provisions.
Net interest income increased by 28.3 per cent. Trade finance jumped 24 per cent, gaining market share. Lending to the manufacturing industry and the wholesale and retail sector exceeded average market growth, rising by 18.4 per cent and 14.3 per cent respectively.
We strengthened our position as the preferred bank for SMEs. We rolled out more services, including a 24-hour manned hotline and the introduction of SME ambassadors at all branches. We became the first bank in Hong Kong to offer Octopus merchant services to retailers.
The expansion of our network of Business Banking Centres brought us closer to customers, facilitating our proactive approach to meeting their needs. With the addition of more marketing officers during the year, new SME accounts acquired in the second half of 2006 outpaced the first half by 34.7 per cent.
Refined customer group segmentation and deeper customer relationships generated greater
cross-selling opportunities. Increases in corporate wealth management and card acquiring business helped net trading income and net fees and commissions grow by 11.9 per cent and 13.5 per cent respectively.
In May, we won the ‘Best Banking Service Award’ at the SME’s Best Partner Awards organised by the Hong Kong Chamber of Small and Medium Business.
We invested additional resources in our Macau branch, which moved to new premises in September to accommodate its expansion. The broader service scope and product range saw encouraging growth in loans and deposits.
Including a significant reduction in loan impairment allowances, Commercial Banking’s pre-tax profit increased 109.8 per cent to HK$2,262 million, contributing 16.4 per cent to total pre-tax profit.
+21.5%
Commercial Banking operating profit excluding loan impairment charges

42 HANG SENG BANK
BUSINESS OPERATIONS – BUSINESS IN HONG KONGPARTNERING Our commercial banking services offer customised financial solutions that evolve as a business changes and grows. Through these lasting partnerships we focus on supporting our customers, enabling them to focus on giving a stellar performance.
for Success

43ANNUAL REPORT 2006
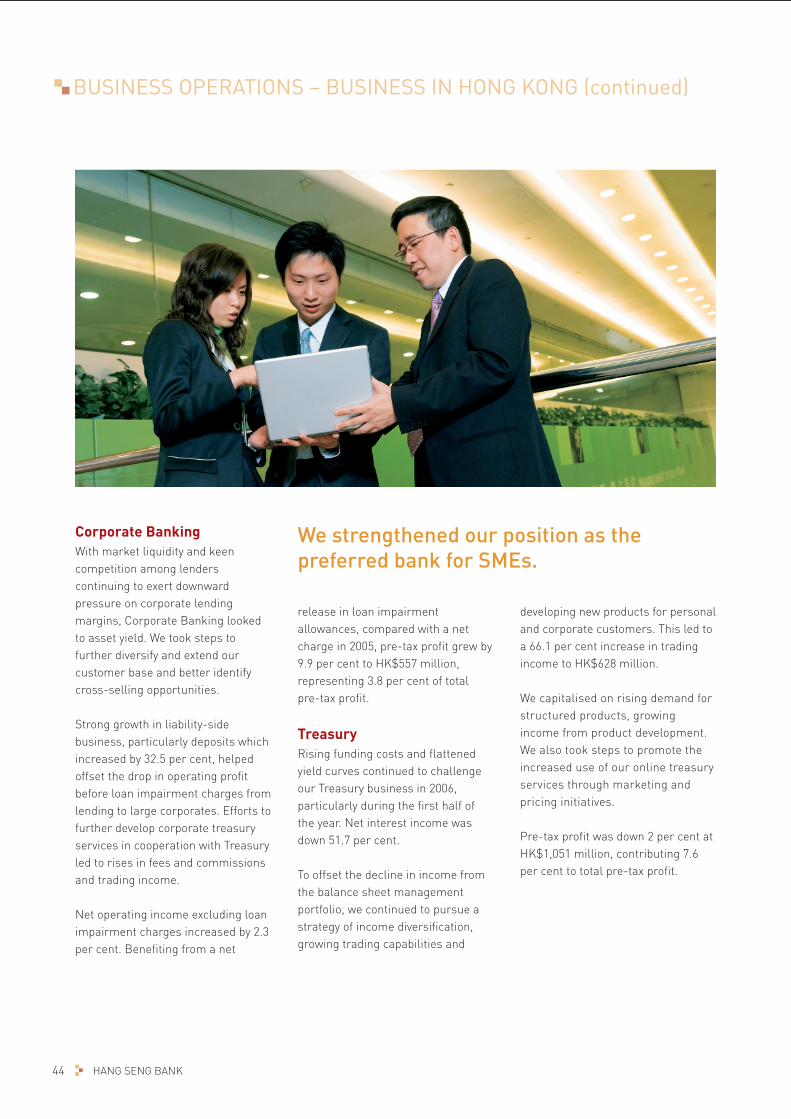
44 HANG SENG BANK
BUSINESS OPERATIONS – BUSINESS IN HONG KONG (continued)
Corporate BankingWith market liquidity and keen competition among lenders continuing to exert downward pressure on corporate lending margins, Corporate Banking looked to asset yield. We took steps to further diversify and extend our customer base and better identify cross-selling opportunities.
Strong growth in liability-side business, particularly deposits which increased by 32.5 per cent, helped offset the drop in operating profit before loan impairment charges from lending to large corporates. Efforts to further develop corporate treasury services in cooperation with Treasury led to rises in fees and commissions and trading income.
Net operating income excluding loan impairment charges increased by 2.3 per cent. Benefiting from a net
developing new products for personal and corporate customers. This led to a 66.1 per cent increase in trading income to HK$628 million.
We capitalised on rising demand for structured products, growing income from product development. We also took steps to promote the increased use of our online treasury services through marketing and pricing initiatives.
Pre-tax profit was down 2 per cent at HK$1,051 million, contributing 7.6 per cent to total pre-tax profit.
We strengthened our position as the preferred bank for SMEs.
release in loan impairment allowances, compared with a net charge in 2005, pre-tax profit grew by 9.9 per cent to HK$557 million, representing 3.8 per cent of totalpre-tax profit.
TreasuryRising funding costs and flattened yield curves continued to challenge our Treasury business in 2006, particularly during the first half of the year. Net interest income was down 51.7 per cent.
To offset the decline in income from the balance sheet management portfolio, we continued to pursue a strategy of income diversification, growing trading capabilities and

45ANNUAL REPORT 2006
E-BankingTechnology is a central part of our commitment to offering customers a fast, safe and convenient banking experience as well as enhancing cost and branch use efficiency.
In 2006, we redesigned our corporate website to reflect our new brand identity and make navigation easier. We also extended the range of services available through both Personal and Business e-Banking and used increased marketing and promotional offers to target new customers.
At year-end, we had more than 620,000 Personal e-Banking customers, a 21.2 per cent increase compared with a year earlier. Our number of Business e-Banking customers increased by 32.1 per cent to over 38,000, helping to support a 46.8 per cent rise in the number of business banking transactions completed online.
Technology is a central part of our commitment to offering customers a fast, safe and convenient banking experience as well as enhancing cost efficiency.
We introduced online settlement of credit card payments, credit card bill payments and cash dollar redemption for customers using Business e-Banking. In January 2007, we launched a new residential mortgage website, strengthening our position for online home financing solutions.
In December 2006, 43.5 per cent of all personal banking transactions were completed online. Internet transactions accounted for 75.1 per cent and 69.2 per cent respectively of IPO subscriptions and securities trading, compared with 62 per cent and 63.4 per cent in December 2005.
We introduced Internet service features that help customers identify their financial needs and drive online sales. This proved particularly successful for insurance business, with 76.4 per cent of travel insurance and 43.3 per cent of personal accident insurance sales completed
online in December 2006, compared with 49.1 per cent and 8.1 per cent at the same time in 2005.
Income from online sales and transactions rose 101.3 per cent to HK$803 million.
As an environmentally responsible bank, we continue to look for ways of employing technology to reduce our use of natural resources. More than 130,000 Personal e-Banking accounts now use our e-Statement service, under which customers receive electronic rather than paper statements, saving over 6 million sheets of paper per year.

46 HANG SENG BANK
BUSINESS OPERATIONS – BUSINESS ON THE MAINLAND

47ANNUAL REPORT 2006
THE PACEOur Mainland operations form a key part of our strategy for achieving sustainable long-term growth. The combined strength of our local understanding, strong brand value and world-class service is helping us set a new tempo for Mainland business expansion.
Picking up
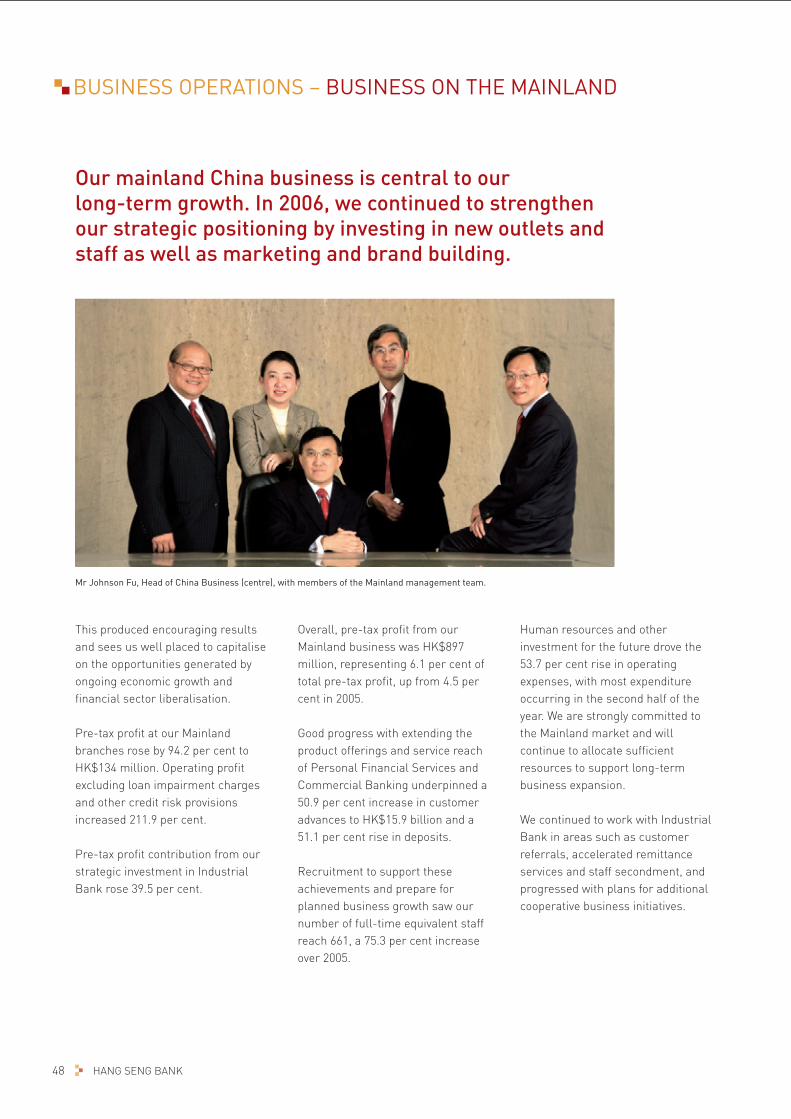
48 HANG SENG BANK
BUSINESS OPERATIONS – BUSINESS ON THE MAINLAND
Mr Johnson Fu, Head of China Business (centre), with members of the Mainland management team.
This produced encouraging results and sees us well placed to capitalise on the opportunities generated by ongoing economic growth and financial sector liberalisation.
Pre-tax profit at our Mainland branches rose by 94.2 per cent to HK$134 million. Operating profit excluding loan impairment charges and other credit risk provisions increased 211.9 per cent.
Pre-tax profit contribution from our strategic investment in Industrial Bank rose 39.5 per cent.
Overall, pre-tax profit from our Mainland business was HK$897 million, representing 6.1 per cent of total pre-tax profit, up from 4.5 per cent in 2005.
Good progress with extending the product offerings and service reach of Personal Financial Services and Commercial Banking underpinned a 50.9 per cent increase in customer advances to HK$15.9 billion and a 51.1 per cent rise in deposits.
Recruitment to support these achievements and prepare for planned business growth saw our number of full-time equivalent staff reach 661, a 75.3 per cent increase over 2005.
Human resources and other investment for the future drove the 53.7 per cent rise in operating expenses, with most expenditure occurring in the second half of the year. We are strongly committed to the Mainland market and will continue to allocate sufficient resources to support long-term business expansion.
We continued to work with Industrial Bank in areas such as customer referrals, accelerated remittance services and staff secondment, and progressed with plans for additional cooperative business initiatives.
Our mainland China business is central to our long-term growth. In 2006, we continued to strengthen our strategic positioning by investing in new outlets and staff as well as marketing and brand building.

49ANNUAL REPORT 2006
Network GrowthWe moved forward with our strategy to grow our presence in the Pearl River Delta and Yangtze River Delta regions, which offer excellent prospects for our Personal Financial Services and Commercial Banking businesses.
We now have six outlets in Shanghai following the addition of two new sub-branches in 2006. Our Mainland personal banking business strategy emphasizes the affluent and mass affluent market segments and this city offers good opportunities to grow our target customer base. With another Shanghai sub-branch opening in the first half of 2007 and a Hangzhou branch later in the year, we will continue to increase our coverage of this high-growth region, focusing
on the provision of Prestige Banking and wealth management services.
In September, our Shanghai branch was named a ‘China Top 10 Growing Financial Organisation’ by the China International Finance Forum, the only foreign bank to receive such recognition.
In August, we opened a sub-branch in Guangzhou and in October we became the first foreign bank to have a branch in Dongguan, the Mainland’s second largest export city. These developments have strengthened our ability to provide banking solutions to businesses operating in both Hong Kong and the Mainland. Leveraging our well-established small and medium-sized enterprise and middle market
HK$897M
Mainland Business pre-tax profit

50 HANG SENG BANK
BUSINESS OPERATIONS – BUSINESS ON THE MAINLAND (continued)
enterprise customer base in Hong Kong, we will use this competitive advantage to grow our Commercial Banking business.
We further extended our reach with the installation of new offsite ATMs in prominent locations in Beijing, Shanghai and Guangzhou.
At the end of the year, our expansion plans stepped up a gear following the approval of our application to begin preparations to set up a Mainland subsidiary bank, which will have its headquarters in Shanghai. Once established, our subsidiary will open up new business opportunities by enabling us to offer retail RMB
services to Mainland individuals without restriction.
We now operate 16 outlets on the Mainland: seven branches (in Beijing, Dongguan, Fuzhou, Guangzhou, Nanjing, Shanghai and Shenzhen); eight sub-branches (two in Guangzhou, five in Shanghai and one in Shenzhen); and a representative office in Xiamen.
Services GrowthThe growth of our network in 2006 was complemented by an increase in the scope of our services.
In February, our Fuzhou branch extended its RMB services to local
Our expansion plans stepped up a gear following the approval of our application to begin preparations to set up a Mainland subsidiary bank.
enterprises and foreign currency services to both local enterprises and individuals. Later in the year, our Nanjing branch introduced RMB services to foreign-invested enterprises, local enterprises and foreign individuals, and extended foreign currency services to local enterprises and individuals.
We took steps to grow our wealth management business, including launching an Index-linked Capital Protected Investment product on the Mainland for the first time.
In September, we obtained a licence under the Qualified Domestic Institutional Investors (QDII) scheme,
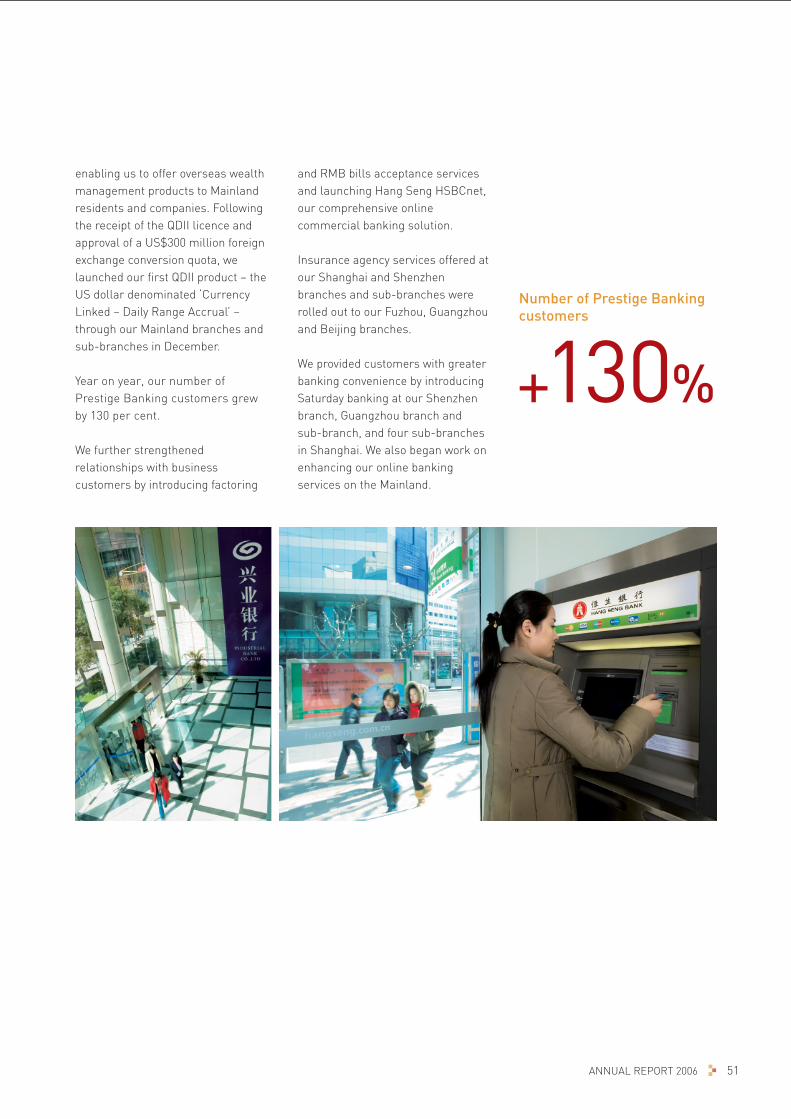
51ANNUAL REPORT 2006
enabling us to offer overseas wealth management products to Mainland residents and companies. Following the receipt of the QDII licence and approval of a US$300 million foreign exchange conversion quota, we launched our first QDII product – the US dollar denominated ‘Currency Linked – Daily Range Accrual’ – through our Mainland branches and sub-branches in December.
Year on year, our number of Prestige Banking customers grew by 130 per cent.
We further strengthened relationships with business customers by introducing factoring
+130%
Number of Prestige Banking customers
and RMB bills acceptance services and launching Hang Seng HSBCnet, our comprehensive online commercial banking solution.
Insurance agency services offered at our Shanghai and Shenzhen branches and sub-branches were rolled out to our Fuzhou, Guangzhou and Beijing branches.
We provided customers with greater banking convenience by introducing Saturday banking at our Shenzhen branch, Guangzhou branch and sub-branch, and four sub-branches in Shanghai. We also began work on enhancing our online banking services on the Mainland.

52 HANG SENG BANK
HANG SENG INDEXES
Mr Joseph Poon, Chairman of the HSI Advisory Committee (centre, seated) and Mr Vincent Kwan, Director and General Manager of HSI Services Ltd (centre, standing), with members of the Advisory Committee.
Initiated by the Hon Lee Quo-Wei, the Bank’s former Honorary Chairman, and launched to the public in 1969, the HSI is now the barometer of the performance of the Hong Kong stock market and is widely followed and quoted by investors and media around the world.
During the past four decades, the number of indexes compiled by HSI Services has grown to 60, including 30 real-time price indexes and 30 total return indexes. This growth reflects investor demand for separate benchmarks to assess the relative risk and return profiles of listed companies according to industry, geographical area or market capitalisation. It also reflects the increasing size and depth of the Hong Kong stock market, particularly as growing numbers of mainland China companies list their shares in Hong Kong.
Index operations and development are guided by an advisory committee that includes specialists from the Hong Kong government, universities and the legal and accounting professions as well as investment consultants. The committee meets at least four times a year to discuss issues relating to the indexes, such as constituent stock changes and new index development.
The Year In ReviewIn 2006, significant changes were made to the flagship HSI to ensure that it continues to reflect the structure of the Hong Kong stock market and to serve as the best market benchmark.
Following an extensive round of market consultation, HSI Services decided in February that Mainland companies with an H-share listing in Hong Kong would be eligible for
inclusion in the HSI. The firstH-share company entered the HSIon 11 September 2006.
It was also decided to change the HSI compilation methodology to a freefloat-adjusted market capitalisation weighted formula with a 15 per cent cap on individual stock weightings. The first phase of the change was completed in September 2006. The second phase will be implemented on 9 March 2007 after market close and the third and final phase is scheduled for September 2007. The adoption of the new methodology is designed to ensure that the HSI provides a good basis for the development of various index-linked derivatives.
The number of HSI constituents will also be expanded gradually to a maximum of 50.
In September 2006, HSI Services modified its Hang Seng Industry Classification System, broadening it to 11 industry and 28 sector categories to better address demand from investors for more detailed sector classification. A major exercise to classify all stocks listed on Hong Kong’s Main Board or Growth Enterprise Market (GEM) under the Industry Classification System was completed in 2006. This change will prove useful to investors and analysts tracking the performance of Hong Kong-listed companies.
In November 2006, the Hang Seng China H-Financials Index was introduced to track the performance of the growing number of Mainland financial services companies listing in Hong Kong. This new index covers all financial stocks included in the Hang Seng China Enterprises Index (H-share Index). It currently has eight constituents – five banks and three insurance companies.
Compiled and published by HSI Services Ltd, a wholly-owned subsidiary of Hang Seng Bank, the Hang Seng family of indexes can trace its roots to the development of the Hang Seng Index (HSI) in the 1960s.

53ANNUAL REPORT 2006
The H-share Index was the first Mainland-focused index, launched in 1994 to measure the performance of those Mainland companies listing their stocks in Hong Kong in the form of H-shares. This was followed in 1997 by the Hang Seng China-Affiliated Corporations Index, often referred to as the Red-chip Index, which tracks companies strategically owned by Mainland government authorities.
HSI Services now has 12 indexes in its index series tracking the growing Mainland segment of the market, which accounts for about 45 per cent of the market capitalisation of the Hong Kong market.
Index DerivativesIn addition to serving as benchmarks of market performance, HSI Services’ indexes continue to facilitate the development of index-linked investments and derivatives. By the end of 2006, exchange-traded funds (ETFs) licensed to passively track the Hang Seng Index and the H-share Index had assets under management of approximately HK$40 billion and HK$9 billion respectively. These ETFs are listed on the Hong Kong and Singapore stock exchanges, Euronext Paris, Borsa Italiana in Milan and Deutsche Borse in Frankfurt.
In 2006, futures and options on both the HSI and H-share Index traded on
the Futures Exchange of the Hong Kong Exchange and Clearing Company recorded significant increases in turnover. The number of futures and options contracts traded on the HSI grew by 29 and 33 per cent to 13.1 million and 4.1 million respectively compared with 2005. Those for the H-share Index showed even greater increases, risingyear-on-year by 147 per cent for futures and 195 per cent for options.
Both the HSI and H-share Index are widely used by investment banks and derivative issuers in Asia and Europe as the underlying indexes for various index-linked instruments such as warrants, structured products and many over-the-counter index-linked notes.
Hang Seng Indexes: A Brief History
1969 HSI launched
1985 HSI Sub-indexes launched
1986 HSI futures launched by Hong Kong Futures Exchange
1987 First HSI-linked bond launched by Paribas Investment (Asia)
1993 HSI options launched by Hong Kong Futures Exchange
1994 Hang Seng China Enterprises Index launched
1995 First HSI-linked fund launched by Hang Seng Investment Management
1997 Hang Seng China-Affiliated Corporations Index launched
1999 The Tracker Fund of Hong Kong, the first HSI exchange-traded fund, debuts on the Stock Exchange of Hong Kong
2000 Mini HSI futures launched by Hong Kong Futures Exchange
2001 Hang Seng Composite Index Series and Hang Seng Stock Classification System launched
2002 Hang Seng Freefloat Index Series launched Mini HSI options launched by Hong Kong Futures Exchange
2003 Hang Seng Freefloat Prime Indexes launched
H-share index futures launched by Hong Kong Futures Exchange and Hang Seng H-shares Index exchange-traded fund launched by Hang Seng Investment Management
2004 Hang Seng Total Return Index Series launched
H-share index options launched by Hong Kong Futures Exchange and HSI exchange-traded fund launched by Hang Seng Investment Management
2005 First overseas Hang Seng China Enterprises Index exchange-traded fund debuts on Euronext Paris
2006 Hang Seng China H-Financials Index launched

54 HANG SENG BANK
CORPORATE RESPONSIBILITY

55ANNUAL REPORT 2006
CARINGOur involvement in social and environmental initiatives is an important way for us to share our success with those communities which helped create it. It is also our contribution to the long-term development of society.
for the Community

56 HANG SENG BANK
CORPORATE RESPONSIBILITY
We serve our community in the same way we serve our customers – from the heart.
As a good corporate citizen, Hang Seng understands that success and responsibility go hand in hand. We are committed to improving the social and environmental well-being of the communities in which we operate as well as promoting sustainable practices within our business.
In 2006, we were named Green Enterprise of the Year by the Federation of Hong Kong Industries for our work to improve our environmental performance. The first local bank to attain ISO 14001 certification, we have environmental management systems in place at our Central headquarters building and at Hang Seng Tower in Kowloon Bay, covering a total area of 54,000 square metres.
Our corporate citizenship programmes have seen us recognised as a Caring Company by the Hong Kong Council of Social Service every year since 2003.
In 2001, we became a constituent stock of the FTSE4Good Global Index, which tracks the performance of companies that meet international standards of corporate responsibility.
In 2006 we published our first corporate social responsibility report online. This document also serves as an important internal benchmark for measuring our social and environmental performance.
Community ActionOur community initiatives focus on education, the environment, social welfare, and arts and sports development. Including the HK$21 million given in 2006, our financial support of charities and community sponsorships in the past 10 years totals more than HK$180 million.
Charitable donations in 2006 include HK$1.5 million to The Community Chest of Hong Kong which works with 139 local welfare agencies and HK$1 million to funds and trusts that provide welfare and educational support for Hong Kong Police Force officers and their families.
In mainland China, we gave RMB500,000 to the Shanghai Charity Foundation to help with teaching deaf children how to manage their disability and live life to the fullest. The donation is being used to upgrade and improve teaching equipment, facilitate staff training and purchase hearing aids.
Hang Seng’s key corporate responsibility statistics for 2006
making HK$21 million in donations and community sponsorships
contributing over 9,000 volunteer hours
planting 10,000 trees
saving 6.8 million sheets of paper
reducing emissions (CO2) by 1,100 tonnes

57ANNUAL REPORT 2006
Our e-Donation service continued to make it easier for customers to support their chosen charities. Donations made through this online channel in 2006 topped HK$1.1 million, bringing the total given since itslaunch in December 2001 to more than HK$7 million.
As part of our emphasis on giving through service, we encourage individuals at all levels of our organisation to help those in need.
Senior management act as mentors and share their business experience through various educational programmes supported by the Bank.
In 2006, our Staff Volunteer Team gave over 9,000 hours of their time to participate in a wide spectrum of voluntary projects. Activities organised by the Bank included tree-planting in Ma On Shan Country Park, mooncake making and hairdressing services for the elderly and a Christmas party for chronically ill children. Staff often bring their family and friends to lend a hand with our community work, which helps spread the volunteer spirit even wider.
Our employees are equally generous with their donations, raising about HK$400,000 for The Community Chest by participating in the 2006 Dress Special Day.
Developing Tomorrow’s LeadersToday’s young people are tomorrow’s leaders and youth development is a key focus of our corporate responsibility work.
We have a long history of supporting educational activities. Over the past decade, we have allocated more than HK$78 million to various scholarship schemes and development programmes.
Since 1995, our scholarships have helped over 960 outstanding students from Hong Kong and the Mainland pursue educational excellence at tertiary institutions in Hong Kong and overseas.
In partnership with Junior Achievement Hong Kong, around 40 of our executives assisted secondary students participating in the New Leaders Programme to explore ethical leadership and the development of sound values.
Designed to enhance young people’s vigilance against crime, the ‘Hang Seng Bank - Help the Police Fight Youth Crime Competition’, organised by Hong Kong Police and sponsored by Hang Seng, received 125,000 entries in 2006, the highest since the biennial competition’s launch in 1974.
Our support of the Ming Pao Student Reporter Programme and the Inter Post-Secondary College Debate Competition run by RTHK and the Hong Kong Federation of Students has offered around 4,700 young people the chance to improve their language skills, sharpen their powers
We encourage individuals at all levels of our organisation to help those in need.

58 HANG SENG BANK
CORPORATE RESPONSIBILITY (continued)
of reasoning and learn more about current affairs.
Helping Arts And Sports ThriveThe arts help enrich communities by providing creative channels for the expression, exchange and experiencing of different cultural, social and personal ideas.
In 2007, we will continue our long-standing association with the Hong Kong Arts Festival through our sponsorship of the Festival finale, Tango Buenos Aires.
The benefits of perseverance, teamwork and adopting an active lifestyle are just some of the positive lessons provided by participating in sport.
Since 1991, we have given over HK$20 million to support the development of table tennis in Hong
Kong. In 2001, we co-founded the Hang Seng Table Tennis Academy which promotes the sport and helps promising players and coaches to hone their talents. The Academy organised over 700 activities in 2006, benefiting more than 24,000 participants.
A Better Environment For AllOur concern for the environment begins with our own operations and extends into our relationships with customers, suppliers and the wider community. We continue to take actions to minimise the negative impacts of our business, engage in activities that have a positive effect on the environment and promote greater responsibility through our investment and financing policies.
Our Environmental Management Committee implements and monitors our environmental management
system, particularly compliance with ISO 14001 requirements.
Launched in 2003, our ‘HANG SENG Go Green Staff Awareness Campaign’ encourages employees to strive for continual improvement in environmental performance and helps raise awareness through various staff communication channels. Our Chief Operating Officer is the bank’s Green Champion.
Initiatives taken in 2006 include upgrading our headquarters building management system and installing energy-saving light bulbs in all Bank-owned public areas around the building. These two energy efficiency programmes will reduce our annual electricity consumption by about 4 per cent, saving approximately HK$550,000.
We continually monitor our use of resources and encourage the adoption of recycled or environmentally responsible materials. We have an established system for paper, plastic and aluminum can recycling and make efforts to find a new home for equipment and materials that we can no longer use. In 2006, we donated over 2,300 pieces of serviceable IT hardware and related accessories to the Caritas – Hong Kong Computer Recycle Project. We also recycled about 11,000 toner cartridges, a year-on-year increase of 32 per cent.
We work with environmental organisations and our suppliers on enhancing our efforts to help conserve biodiversity. As part of these efforts, we do not serve shark’s fin, endangered reef fish species or black moss at any Hang Seng function.
Our concern for the environment begins with our own operations and extends into our relationships with customers, suppliers and the wider community.
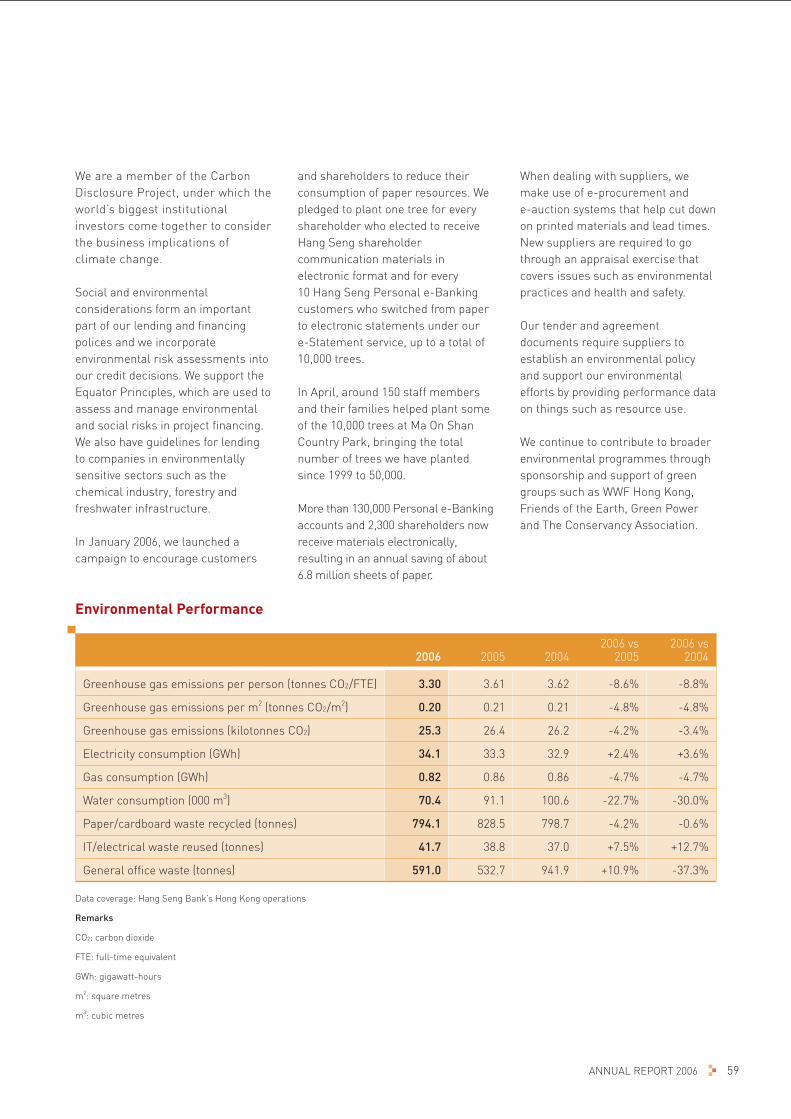
59ANNUAL REPORT 2006
We are a member of the Carbon Disclosure Project, under which the world’s biggest institutional investors come together to consider the business implications of climate change.
Social and environmental considerations form an important part of our lending and financing polices and we incorporate environmental risk assessments into our credit decisions. We support the Equator Principles, which are used to assess and manage environmental and social risks in project financing. We also have guidelines for lending to companies in environmentally sensitive sectors such as the chemical industry, forestry and freshwater infrastructure.
In January 2006, we launched a campaign to encourage customers
and shareholders to reduce their consumption of paper resources. We pledged to plant one tree for every shareholder who elected to receive Hang Seng shareholder communication materials in electronic format and for every10 Hang Seng Personal e-Banking customers who switched from paper to electronic statements under our e-Statement service, up to a total of 10,000 trees.
In April, around 150 staff members and their families helped plant some of the 10,000 trees at Ma On Shan Country Park, bringing the total number of trees we have planted since 1999 to 50,000.
More than 130,000 Personal e-Banking accounts and 2,300 shareholders now receive materials electronically, resulting in an annual saving of about 6.8 million sheets of paper.
When dealing with suppliers, we make use of e-procurement and e-auction systems that help cut down on printed materials and lead times. New suppliers are required to go through an appraisal exercise that covers issues such as environmental practices and health and safety.
Our tender and agreement documents require suppliers to establish an environmental policy and support our environmental efforts by providing performance data on things such as resource use.
We continue to contribute to broader environmental programmes through sponsorship and support of green groups such as WWF Hong Kong, Friends of the Earth, Green Power and The Conservancy Association.
Environmental Performance
2006 2005 20042006 vs
20052006 vs
2004
Greenhouse gas emissions per person (tonnes CO2/FTE) 3.30 3.61 3.62 -8.6% -8.8%
Greenhouse gas emissions per m2 (tonnes CO2/m2) 0.20 0.21 0.21 -4.8% -4.8%
Greenhouse gas emissions (kilotonnes CO2) 25.3 26.4 26.2 -4.2% -3.4%
Electricity consumption (GWh) 34.1 33.3 32.9 +2.4% +3.6%
Gas consumption (GWh) 0.82 0.86 0.86 -4.7% -4.7%
Water consumption (000 m3) 70.4 91.1 100.6 -22.7% -30.0%
Paper/cardboard waste recycled (tonnes) 794.1 828.5 798.7 -4.2% -0.6%
IT/electrical waste reused (tonnes) 41.7 38.8 37.0 +7.5% +12.7%
General office waste (tonnes) 591.0 532.7 941.9 +10.9% -37.3%
Data coverage: Hang Seng Bank’s Hong Kong operations
Remarks
CO2: carbon dioxide
FTE: full-time equivalent
GWh: gigawatt-hours
m2: square metres
m3: cubic metres

FINANCIAL REVIEW
60 HANG SENG BANK
05 06
Operating Profit Analysis
14
13
12
11
10
HK$bn
HK$m
2005 Operating Profit 11,068Changes Due to:
Net Interest Income 898 Net Fee Income 541 Trading Income 445 Other Operating Income (35 ) Operating Expenses (695 ) Loan Impairment Charges and Other Credit Risk Provisions 354
2006 Operating Profit 12,576
Financial PerformanceIncome StatementSummary of financial performance
Figures in HK$m 2006 2005
Total operating income 26,158 23,246
Total operating expenses 5,241 4,546
Operating profit after loan impairment charges and other credit risk provisions 12,576 11,068
Profit before tax 14,395 13,358
Profit attributable to shareholders 12,038 11,342
Earnings per share (in HK$) 6.30 5.93
Hang Seng Bank Limited (“the Bank”) and its subsidiaries and associates (“the Group”) reported an audited profit attributable to shareholders of HK$12,038 million for 2006, a rise of 6.1 per cent over 2005. Earnings per share were HK$6.30, up 6.2 per cent from 2005.
Operating profit after loan impairment charges and other credit risk provisions rose 13.6 per cent to HK$12,576 million.
This reflected an encouraging growth in total operating income and a substantial reduction in loan impairment charges, benefiting from sustained economic growth, a buoyant stock market and good investment sentiment supported by ample liquidity and a benign credit environment.
Net Operating Income
Net Interest Income
Non-Interest Income
02 0603 04 05
Net Operating Income
20
15
10
5
0
HK$bn
(Before loan impairment charges and other credit risk provisions)
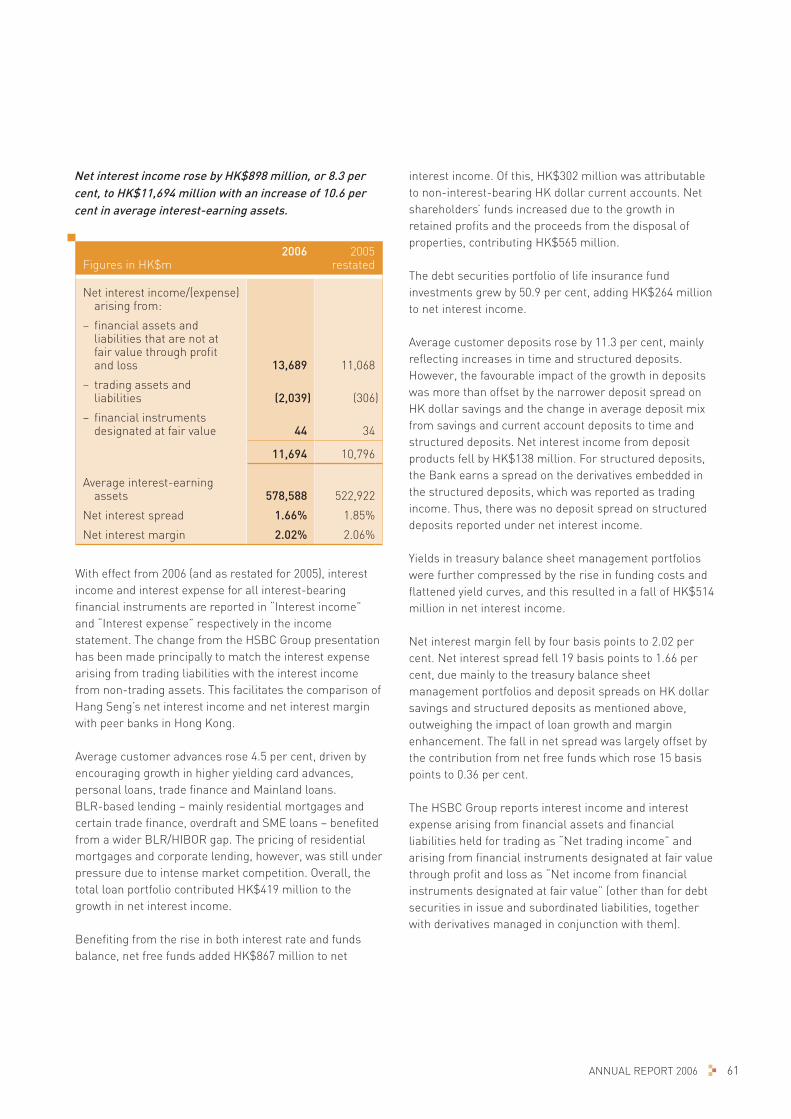
61ANNUAL REPORT 2006
Net interest income rose by HK$898 million, or 8.3 per cent, to HK$11,694 million with an increase of 10.6 per cent in average interest-earning assets.
Figures in HK$m2006 2005
restated
Net interest income/(expense) arising from:
– financial assets and liabilities that are not at fair value through profit and loss 13,689 11,068
– trading assets and liabilities (2,039) (306)
– financial instruments designated at fair value 44 34
11,694 10,796
Average interest-earning assets 578,588 522,922
Net interest spread 1.66% 1.85%
Net interest margin 2.02% 2.06%
With effect from 2006 (and as restated for 2005), interest income and interest expense for all interest-bearing financial instruments are reported in “Interest income” and “Interest expense” respectively in the income statement. The change from the HSBC Group presentation has been made principally to match the interest expense arising from trading liabilities with the interest income from non-trading assets. This facilitates the comparison of Hang Seng’s net interest income and net interest margin with peer banks in Hong Kong.
Average customer advances rose 4.5 per cent, driven by encouraging growth in higher yielding card advances, personal loans, trade finance and Mainland loans.BLR-based lending – mainly residential mortgages and certain trade finance, overdraft and SME loans – benefited from a wider BLR/HIBOR gap. The pricing of residential mortgages and corporate lending, however, was still under pressure due to intense market competition. Overall, the total loan portfolio contributed HK$419 million to the growth in net interest income.
Benefiting from the rise in both interest rate and funds balance, net free funds added HK$867 million to net
interest income. Of this, HK$302 million was attributable to non-interest-bearing HK dollar current accounts. Net shareholders’ funds increased due to the growth in retained profits and the proceeds from the disposal of properties, contributing HK$565 million.
The debt securities portfolio of life insurance fund investments grew by 50.9 per cent, adding HK$264 million to net interest income.
Average customer deposits rose by 11.3 per cent, mainly reflecting increases in time and structured deposits. However, the favourable impact of the growth in deposits was more than offset by the narrower deposit spread on HK dollar savings and the change in average deposit mix from savings and current account deposits to time and structured deposits. Net interest income from deposit products fell by HK$138 million. For structured deposits, the Bank earns a spread on the derivatives embedded in the structured deposits, which was reported as trading income. Thus, there was no deposit spread on structured deposits reported under net interest income.
Yields in treasury balance sheet management portfolios were further compressed by the rise in funding costs and flattened yield curves, and this resulted in a fall of HK$514 million in net interest income.
Net interest margin fell by four basis points to 2.02 per cent. Net interest spread fell 19 basis points to 1.66 per cent, due mainly to the treasury balance sheet management portfolios and deposit spreads on HK dollar savings and structured deposits as mentioned above, outweighing the impact of loan growth and margin enhancement. The fall in net spread was largely offset by the contribution from net free funds which rose 15 basis points to 0.36 per cent.
The HSBC Group reports interest income and interest expense arising from financial assets and financial liabilities held for trading as “Net trading income” and arising from financial instruments designated at fair value through profit and loss as “Net income from financial instruments designated at fair value” (other than for debt securities in issue and subordinated liabilities, together with derivatives managed in conjunction with them).
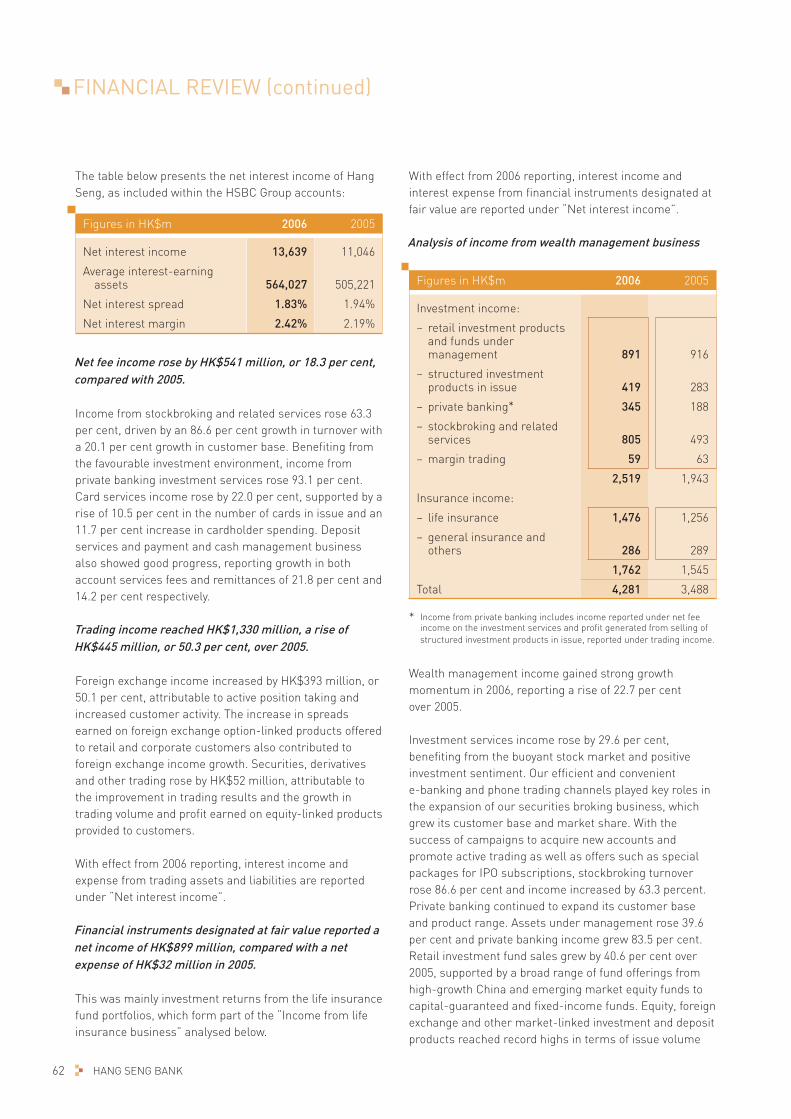
FINANCIAL REVIEW (continued)
62 HANG SENG BANK
The table below presents the net interest income of Hang Seng, as included within the HSBC Group accounts:
Figures in HK$m 2006 2005
Net interest income 13,639 11,046
Average interest-earning assets 564,027 505,221
Net interest spread 1.83% 1.94%
Net interest margin 2.42% 2.19%
Net fee income rose by HK$541 million, or 18.3 per cent, compared with 2005.
Income from stockbroking and related services rose 63.3 per cent, driven by an 86.6 per cent growth in turnover with a 20.1 per cent growth in customer base. Benefiting from the favourable investment environment, income from private banking investment services rose 93.1 per cent. Card services income rose by 22.0 per cent, supported by a rise of 10.5 per cent in the number of cards in issue and an 11.7 per cent increase in cardholder spending. Deposit services and payment and cash management business also showed good progress, reporting growth in both account services fees and remittances of 21.8 per cent and 14.2 per cent respectively.
Trading income reached HK$1,330 million, a rise of HK$445 million, or 50.3 per cent, over 2005.
Foreign exchange income increased by HK$393 million, or 50.1 per cent, attributable to active position taking and increased customer activity. The increase in spreads earned on foreign exchange option-linked products offered to retail and corporate customers also contributed to foreign exchange income growth. Securities, derivatives and other trading rose by HK$52 million, attributable to the improvement in trading results and the growth in trading volume and profit earned on equity-linked products provided to customers.
With effect from 2006 reporting, interest income and expense from trading assets and liabilities are reported under “Net interest income”.
Financial instruments designated at fair value reported a net income of HK$899 million, compared with a net expense of HK$32 million in 2005.
This was mainly investment returns from the life insurance fund portfolios, which form part of the “Income from life insurance business” analysed below.
With effect from 2006 reporting, interest income and interest expense from financial instruments designated at fair value are reported under “Net interest income”.
Analysis of income from wealth management business
Figures in HK$m 2006 2005
Investment income:
– retail investment products and funds under management 891 916
– structured investment products in issue 419 283
– private banking* 345 188
– stockbroking and related services 805 493
– margin trading 59 63
2,519 1,943
Insurance income:
– life insurance 1,476 1,256
– general insurance and others 286 289
1,762 1,545
Total 4,281 3,488
* Income from private banking includes income reported under net fee income on the investment services and profit generated from selling of structured investment products in issue, reported under trading income.
Wealth management income gained strong growth momentum in 2006, reporting a rise of 22.7 per centover 2005.
Investment services income rose by 29.6 per cent, benefiting from the buoyant stock market and positive investment sentiment. Our efficient and convenient e-banking and phone trading channels played key roles in the expansion of our securities broking business, which grew its customer base and market share. With the success of campaigns to acquire new accounts and promote active trading as well as offers such as special packages for IPO subscriptions, stockbroking turnover rose 86.6 per cent and income increased by 63.3 percent. Private banking continued to expand its customer base and product range. Assets under management rose 39.6 per cent and private banking income grew 83.5 per cent. Retail investment fund sales grew by 40.6 per cent over 2005, supported by a broad range of fund offerings from high-growth China and emerging market equity funds to capital-guaranteed and fixed-income funds. Equity, foreign exchange and other market-linked investment and deposit products reached record highs in terms of issue volume

63ANNUAL REPORT 2006
Premises and Equipment
51.4%
21.3%
20.9%
6.4%
Operating Expenses for 2006
Other Operating ExpensesEmployee Compensation and Benefits
Depreciation and Amortisation
and income earned, which were up by 68.6 per cent and 48.1 per cent respectively.
Life insurance recorded satisfactory income growth of 17.5 per cent to reach HK$1,476 million (as analysed in the table below). During the year, we continued to launch new products catering for customers’ investment and protection needs. The Monthly Income Retirement Plan was successful in capturing a section of the lucrative retirement plan market and the MediCash Lifetime Insurance Plan, which targets mid-market pre-retirees, was also well received.
Figures in HK$m 2006 2005
Net interest income andfee income 665 411
Investment return on life insurance funds 910 (25)
Net earned insurance premiums 7,534 7,483
Net insurance claims incurred and movement in policyholders’ liabilities (7,996) (6,929)
Movement in present value of in-force long-term insurance business 363 316
1,476 1,256
Income from general insurance and others maintained at the same level as 2005.
Operating expenses rose by HK$695 million, or 15.3 per cent, compared with 2005.
Employee compensation and benefits increased by 18.1 per cent, due to the annual salary increment, the increase in number of staff, and performance-based incentives and bonuses. General and administrative expenses were up 12.0 per cent. Rental expenses increased due to increases in rents for branches in Hong Kong and new branches on the Mainland. Other premises and equipment expenses increased by 10.4 per cent, attributable to IT systems development and enhancement for business expansion and regulatory related projects. The rise in marketing expenditure was attributable mainly to the launch of the Bank’s new brand image and increased promotion of investment and insurance products and credit cards. Depreciation charges rose by 15.4 per cent as a result of the increase in fair value of business premises. The Bank’s Mainland operations, which expanded its network from 12 to 15 outlets and increased its number of staff from 377 to 661 during 2006, also accounted for the Bank’s increase in operating expenses.
Staff numbers* by region
2006 2005
Hong Kong 7,748 7,425
Mainland 661 377
Others 55 43
Total 8,464 7,845
* Full-time equivalent
Operating Expenses for 2005
50.1%
22.4%
21.1%
6.4%
Other Operating ExpensesEmployee Compensation and Benefits
Premises and Equipment Depreciation and Amortisation

FINANCIAL REVIEW (continued)
64 HANG SENG BANK
The number of full-time equivalent staff increased by 619 compared with the previous year-end. New staff in Hong Kong were hired to further expand private banking’s financial advisory team and Commercial Banking’s relationship management and corporate wealth management teams, as well as to support IT systems development and enhancement. The number of staff at Mainland branches rose by 75.3 per cent, mainly to support the network expansion, building up sales and marketing force for personal banking business, and strengthening of the corporate and commercial relationship management and trade services teams.
The cost efficiency ratio for 2006 was 29.0 per cent, compared with 28.0 per cent in 2005.
Loan impairment charges and other credit risk provisions decreased by HK$354 million, or 57.3 per cent, to HK$264 million.
Figures in HK$m 2006 2005
Loan impairment (charges)/releases:
– individually assessed (107) (309)
– collectively assessed (145) (309)
(252) (618)
of which:
– new and additional (423) (1,070)
– releases 106 351
– recoveries 65 101
(252) (618)
Other provision (12) –
Loan impairment charges and other credit risk provisions (264) (618)
Under the benign credit environment, there was a decrease of HK$202 million in individually assessed provisions, mainly due to a substantial reduction in new and additional charges for commercial banking customers. Releases from commercial banking accounts increased but those from mortgages and personal lending were substantially lower. Of the collectively assessed charges, HK$139 million was made on card and personal loan portfolios, a rise of 13.9 per cent over last year. A charge of HK$6 million was made on advances not identified individually as impaired, compared with a charge of HK$187 million made in 2005. The reduction in historical loss rates used at the end of 2006 for calculation of this type of collectively assessed impairment provisions reflects the continued improvement in credit conditions in recent years.
Total loan impairment allowances as a percentage of gross advances to customers were as follows:
2006%
2005%
Loan impairment allowances:
– individually assessed 0.15 0.20
– collectively assessed 0.18 0.19
Total loan impairment allowances 0.33 0.39
Total loan impairment allowances as a percentage of gross advances to customers was 0.33 per cent at 31 December 2006, compared with 0.39 per cent at the previous year-end. Individually assessed allowances as a percentage of gross advances fell by 0.05 percentage points to 0.15 per cent, reflecting recoveries from doubtful accounts and writing off of irrecoverable balances against impairment allowances. The percentage of collectively assessed allowances was slightly lowered to 0.18 per cent from 0.19 per cent at the previous year-end.
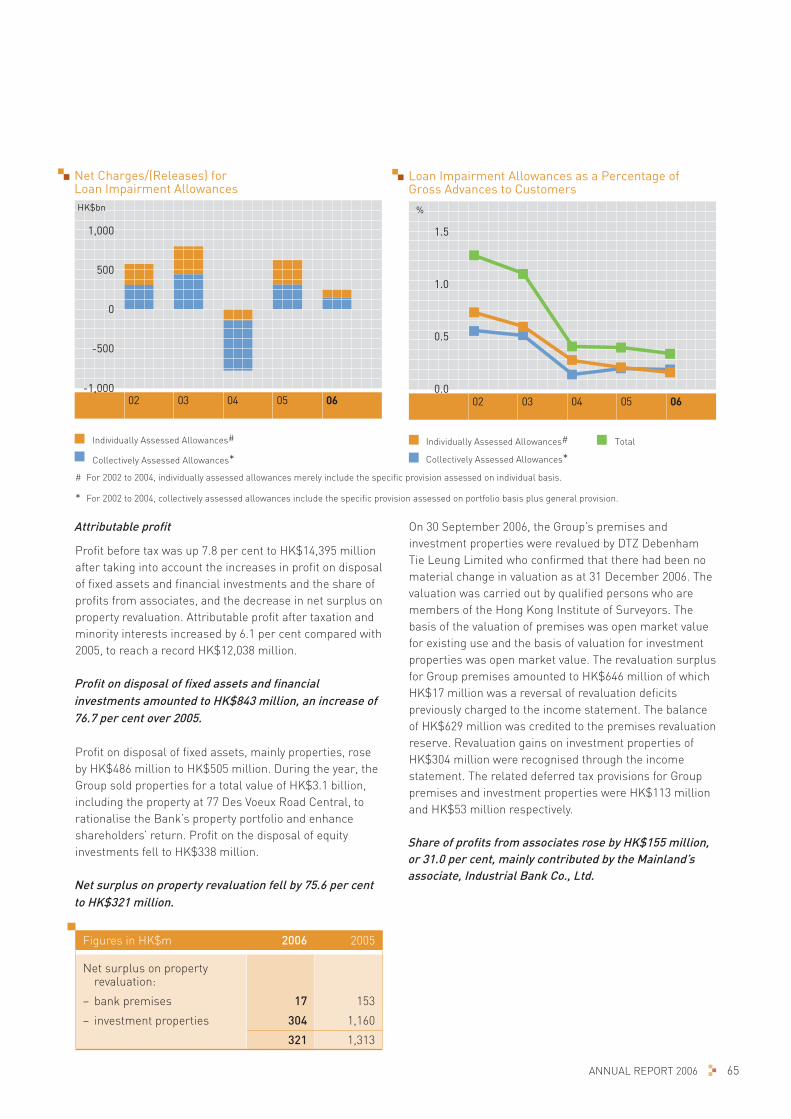
65ANNUAL REPORT 2006
02 0603 04 05
Loan Impairment Allowances as a Percentage of Gross Advances to Customers
Individually Assessed Allowances#
Collectively Assessed Allowances*Total
1.5
1.0
0.5
0.0
%
02 03 04 05 06
Individually Assessed Allowances#
Collectively Assessed Allowances*
Net Charges/(Releases) forLoan Impairment Allowances
-1,000
1,000
0
500
-500
HK$bn
# For 2002 to 2004, individually assessed allowances merely include the specific provision assessed on individual basis.
* For 2002 to 2004, collectively assessed allowances include the specific provision assessed on portfolio basis plus general provision.
Attributable profit
Profit before tax was up 7.8 per cent to HK$14,395 million after taking into account the increases in profit on disposal of fixed assets and financial investments and the share of profits from associates, and the decrease in net surplus on property revaluation. Attributable profit after taxation and minority interests increased by 6.1 per cent compared with 2005, to reach a record HK$12,038 million.
Profit on disposal of fixed assets and financial investments amounted to HK$843 million, an increase of 76.7 per cent over 2005.
Profit on disposal of fixed assets, mainly properties, rose by HK$486 million to HK$505 million. During the year, the Group sold properties for a total value of HK$3.1 billion, including the property at 77 Des Voeux Road Central, to rationalise the Bank’s property portfolio and enhance shareholders’ return. Profit on the disposal of equity investments fell to HK$338 million.
Net surplus on property revaluation fell by 75.6 per cent to HK$321 million.
Figures in HK$m 2006 2005
Net surplus on property revaluation:
– bank premises 17 153
– investment properties 304 1,160
321 1,313
On 30 September 2006, the Group’s premises and investment properties were revalued by DTZ Debenham Tie Leung Limited who confirmed that there had been no material change in valuation as at 31 December 2006. The valuation was carried out by qualified persons who are members of the Hong Kong Institute of Surveyors. The basis of the valuation of premises was open market value for existing use and the basis of valuation for investment properties was open market value. The revaluation surplus for Group premises amounted to HK$646 million of which HK$17 million was a reversal of revaluation deficits previously charged to the income statement. The balance of HK$629 million was credited to the premises revaluation reserve. Revaluation gains on investment properties of HK$304 million were recognised through the income statement. The related deferred tax provisions for Group premises and investment properties were HK$113 million and HK$53 million respectively.
Share of profits from associates rose by HK$155 million, or 31.0 per cent, mainly contributed by the Mainland’s associate, Industrial Bank Co., Ltd.

FINANCIAL REVIEW (continued)
66 HANG SENG BANK
Customer Group PerformancePersonal Financial Services (“PFS”) reported a growth of 5.4 per cent in operating profit excluding loan impairment charges to HK$7,840 million. Profit before tax was up by 0.6 per cent to HK$7,730 million. There was a net charge of HK$165 million in loan impairment provisions compared with a substantial net release of HK$232 million in 2005 (mainly from mortgages and personal loans). New and additional loan impairment charges were stable as the credit quality of the PFS loan portfolio remained benign.
Net interest income rose 4.7 per cent, driven by the growth in customer advances and improvement in spreads on BLR-based lending. The positive impact of encouraging growth of 13.6 per cent in customer deposits was, however, offset by the narrowing of deposit spreads on HK dollar savings and structured deposits.
The PFS loan portfolio grew 5.4 per cent, or HK$7,115 million, notwithstanding the fall in Government Home Ownership Scheme mortgages and the disposal of a part of the taxi loan portfolio to balance the overall loan portfolio structure. (Excluding such factors, PFS achieved a growth of 10.7 per cent in customer advances.) Residential mortgages, PFS’s core loan product, reported encouraging growth of 5.9 per cent and gained market share amid intense market competition. Marketing efforts proved successful in improving credit card spending as well as consumer borrowing such that personal loans and card advances rose 46.4 per cent and 22.1 per cent respectively. Advances for investment and IPO subscriptions, mainly to Private Banking and Prestige Banking customers, also reported significant growth. Non-interest income reported encouraging growth of 14.2 per cent with wealth management income rising 22.7 per cent.
High levels of stock market and IPO activities, underpinned by ample liquidity and bullish investment sentiment, helped investment services achieve impressive growth:
• Our stockbroking business out-performed the market with the growth of 86.6 per cent in turnover. Together with a 20.0 per cent increase in customer base, our securities services income rose 63.3 per cent. This reflected the popularity of our efficient e-banking and phone trading channels, the competitive pricing of broker commissions, IPO subscription package offers and successful promotion campaigns.
• Our endeavours to maintain a broad range of quality funds from high-growth China and emerging markets equity funds to more conservative capital-guaranteed and fixed income bond funds resulted in much success and recognition. Retail investment fund sales grew by 40.6 per cent over 2005. Three funds managed by Hang Seng Investment Management Limited were named top-performing funds at the Lipper Fund Awards Hong Kong 2007.
To capture the vast growth potential of the China equity market, Hang Seng continued to be active in launching and promoting China funds. The Bank’s flagship China funds, the Hang Seng China H-Share Index Leveraged 150 Fund and Hang Seng China Equity Fund reported returns of 161.1 per cent and 107.6 per cent respectively in 2006.
• Structured deposits and instruments continued to grow with the launch of more sophisticated structures linked to equities, indices, foreign exchange and bullion. Spreads earned on structured products rose by 48.1 per cent.
Private banking maintained its growth momentum and delivered an outstanding result by continuing to focus on providing tailor-made financial planning services. Total operating income rose 51.1 per cent to HK$731 million and profit before tax rose by 46.3 per cent to HK$556 million.
Hang Seng’s life insurance business maintained its leading market position for new annualised premiums business with the launch of new annuities and medical insurance products tailored for the needs of pre-retirees and retirees. As a result, life insurance reported a rise of 17.5 per cent in operating income, driven by growth of 18.5 per cent in the number of policies in force.
Card spending grew 11.7 per cent, boosted by promotions in joint effort with merchants and the continued improvement in consumer sentiment. Card services income rose by 22.0 per cent. The number of cards in force increased by 10.5 per cent to 1.4 million. New cards launched during 2006 include the alpha card, a debit card to tap the youth market, and VISA Infinite, which targets top-tier affluent customers.

67ANNUAL REPORT 2006
Commercial Banking (“CMB”) achieved an encouraging increase of 21.5 per cent in operating profit excluding loan impairment charges, driven by strong growth in customer advances and corporate wealth management business. Taking into account the reduction in loan impairment provisions, profit before tax rose 109.8 per cent.
Net interest income reported strong growth of 28.3 per cent. Customer advances rose 22.2 per cent, highlighting significant growth in trade finance and factoring loans with good gains in market share, and advances to the property, manufacturing, and wholesale and retail sectors. The opening of a branch in Dongguan, together with the existing branches in Guangzhou, Shenzhen and Macau, further strengthened the Bank’s competitive edge in providing seamless, one-stop commercial banking services to Hong Kong customers within the Pearl River Delta region.
The Bank further enhanced its position as the preferred SME bank through various initiatives, such as the SME “testimonial” TV commercial (part of the Bank’s brand revitalisation campaign), the launch of the Business Partner Direct 24-hour manned telephone service hotline and the extended opening hours of MTR branches. New SME accounts acquired in the second half of 2006 outpaced the first half by 34.7 per cent, as a result of intensified marketing.
The heightened focus upon CMB under the Bank’s Roadmap for Growth has resulted in growth of 13.5 per cent in net fees and commissions and 11.9 per cent in trading income.
The Bank has continued to launch customer-centric propositions for specific industries. The Bank is the only financial institution to have introduced Octopus Merchant services for retailers, which complement other retailer solutions such as credit card merchant services, renminbi deposits, retailer insurance protection and bulk cash deposit services. Net fee income from card acquiring business achieved strong growth of 45.1 per cent in 2006.
CMB identified great opportunities in developing corporate wealth management services. A dedicated wealth management team was established in early 2006 to better serve the investment, treasury and risk management
needs of commercial customers. Furthermore, keyperson insurance was launched in early 2006. With these initiatives, corporate wealth management grew strongly and accounted for 22.5 per cent of CMB’s non-interest income. An increasing trend in corporate wealth management is expected to further dilute the reliance on trade fee income.
The pace of online business banking has accelerated. At 31 December 2006, over 38,000 customers had registered for business e-banking services, an increase of 32.1 per cent from the end of 2005. The number of online business banking transactions also grew by 46.8 per cent.
Corporate Banking’s (“CIB”) net operating income increased by 11.8 per cent. Strong liquidity in the banking system continued to squeeze corporate loan margins, and CIB stayed focused on asset yield rather than loan growth. Customer deposits registered a healthy growth of 32.5 per cent. CIB also stepped up its efforts in collaboration with Treasury in providing corporate treasury services and structured products to grow non-fund income. Operating profit before impairment charges was down by 2.0 per cent. The strong growth of targeted business segments from diversification of customer base in Hong Kong and the Mainland largely compensated for the fall in lending to large corporates. Profit before tax increased by 9.9 per cent, benefiting from a release in collectively assessed impairment allowances.
Treasury’s (“TRY”) operating profit was down by 25.0 per cent at HK$887 million. Profit before tax, however, was down only 2.0 per cent, due to the absence of losses on the disposal of investment securities (a loss of HK$217 million was recorded in 2005). TRY continued to pursue its strategy of enhancing trading capability and providing more sophisticated products for corporate and individual customers. This led to a substantial 66.1 per cent increase in trading income, which reached HK$628 million. The balance sheet management portfolio, however, continued to face the challenge of the rise in funding costs, particularly for the US dollar portfolio, as well as flattened yield curves. Net interest income fell by 51.7 per cent. The position, however, has been improving since the second half of the year with the halt in US dollar interest rate hikes and subdued HK dollar interest rates due to ample market liquidity.
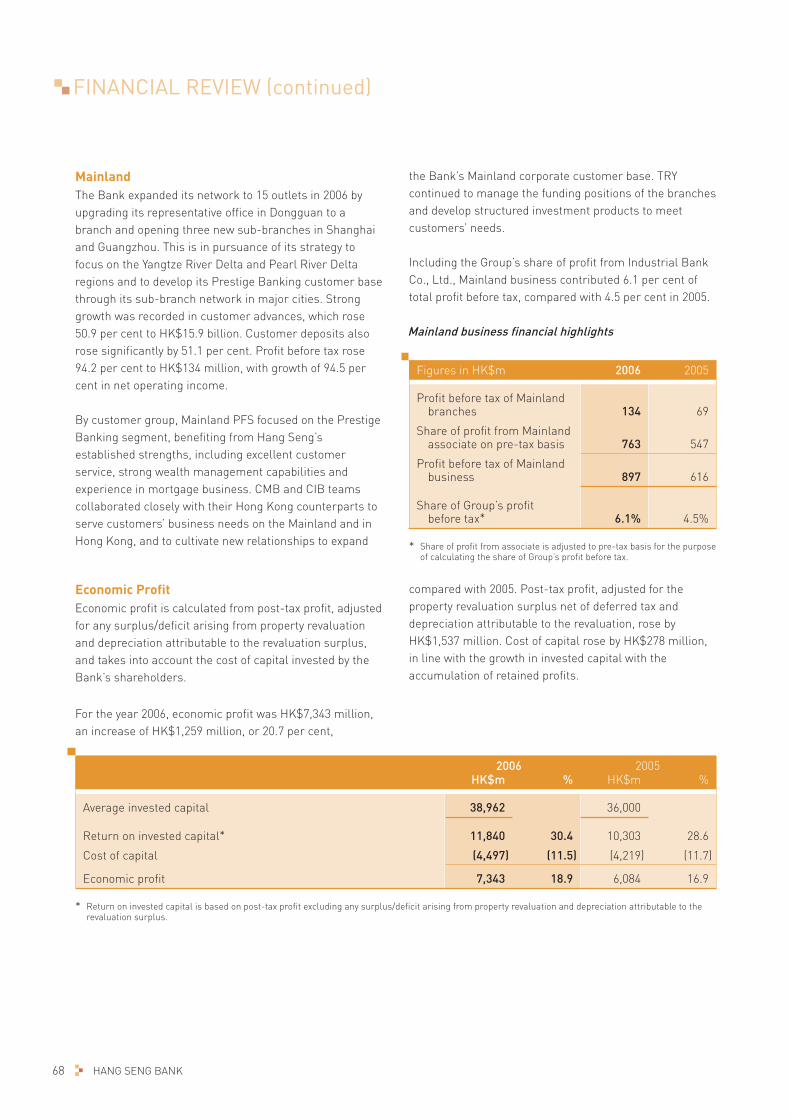
FINANCIAL REVIEW (continued)
68 HANG SENG BANK
MainlandThe Bank expanded its network to 15 outlets in 2006 by upgrading its representative office in Dongguan to a branch and opening three new sub-branches in Shanghai and Guangzhou. This is in pursuance of its strategy to focus on the Yangtze River Delta and Pearl River Delta regions and to develop its Prestige Banking customer base through its sub-branch network in major cities. Strong growth was recorded in customer advances, which rose 50.9 per cent to HK$15.9 billion. Customer deposits also rose significantly by 51.1 per cent. Profit before tax rose 94.2 per cent to HK$134 million, with growth of 94.5 per cent in net operating income.
By customer group, Mainland PFS focused on the Prestige Banking segment, benefiting from Hang Seng’s established strengths, including excellent customer service, strong wealth management capabilities and experience in mortgage business. CMB and CIB teams collaborated closely with their Hong Kong counterparts to serve customers’ business needs on the Mainland and in Hong Kong, and to cultivate new relationships to expand
the Bank’s Mainland corporate customer base. TRY continued to manage the funding positions of the branches and develop structured investment products to meet customers’ needs.
Including the Group’s share of profit from Industrial Bank Co., Ltd., Mainland business contributed 6.1 per cent of total profit before tax, compared with 4.5 per cent in 2005.
Mainland business financial highlights
Figures in HK$m 2006 2005
Profit before tax of Mainland branches 134 69
Share of profit from Mainland associate on pre-tax basis 763 547
Profit before tax of Mainland business 897 616
Share of Group’s profitbefore tax* 6.1% 4.5%
* Share of profit from associate is adjusted to pre-tax basis for the purpose of calculating the share of Group’s profit before tax.
2006 2005HK$m % HK$m %
Average invested capital 38,962 36,000
Return on invested capital* 11,840 30.4 10,303 28.6
Cost of capital (4,497) (11.5) (4,219) (11.7)
Economic profit 7,343 18.9 6,084 16.9
* Return on invested capital is based on post-tax profit excluding any surplus/deficit arising from property revaluation and depreciation attributable to the revaluation surplus.
Economic ProfitEconomic profit is calculated from post-tax profit, adjusted for any surplus/deficit arising from property revaluation and depreciation attributable to the revaluation surplus, and takes into account the cost of capital invested by the Bank’s shareholders.
For the year 2006, economic profit was HK$7,343 million, an increase of HK$1,259 million, or 20.7 per cent,
compared with 2005. Post-tax profit, adjusted for the property revaluation surplus net of deferred tax and depreciation attributable to the revaluation, rose by HK$1,537 million. Cost of capital rose by HK$278 million, in line with the growth in invested capital with the accumulation of retained profits.
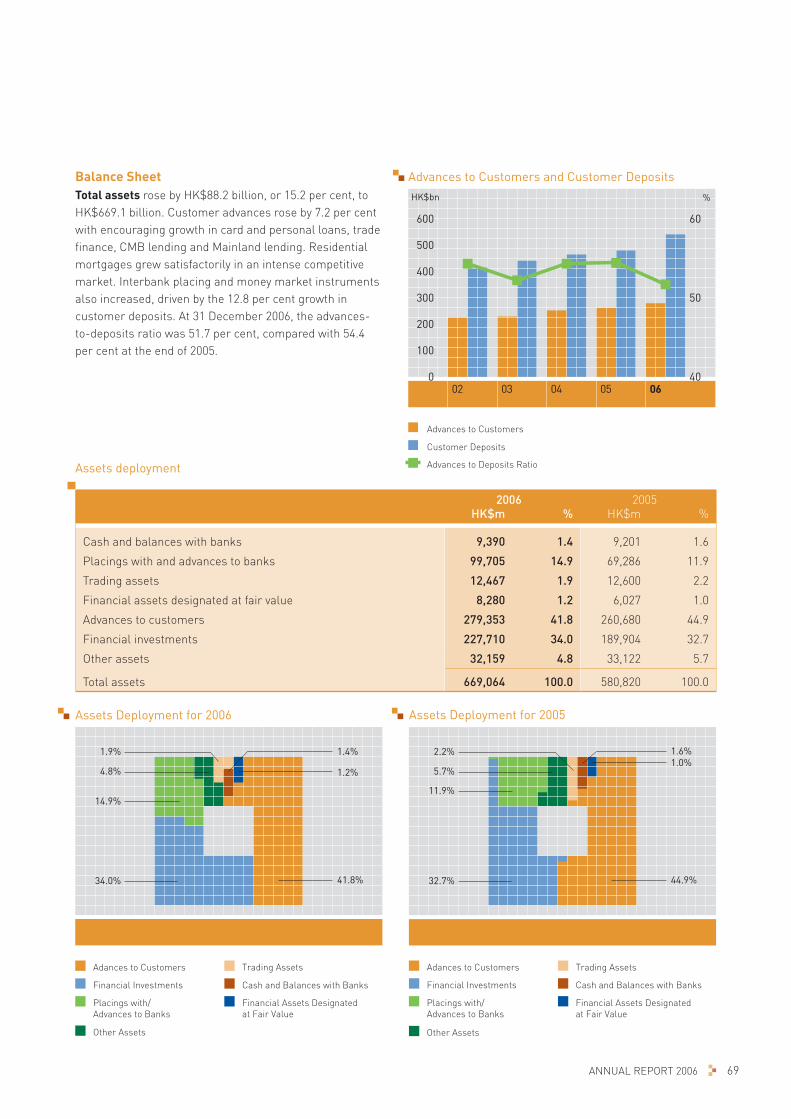
69ANNUAL REPORT 2006
Assets Deployment for 2006
Adances to Customers
Financial Investments
Placings with/ Advances to Banks
Other Assets
Trading Assets
Cash and Balances with Banks
Financial Assets Designatedat Fair Value
34.0%
14.9%
4.8%
1.9%
1.2%
1.4%
41.8%
Assets Deployment for 2005
Adances to Customers
Financial Investments
Placings with/ Advances to Banks
Other Assets
Trading Assets
Cash and Balances with Banks
Financial Assets Designatedat Fair Value
32.7%
11.9%
5.7%
2.2%
44.9%
1.0%1.6%
Advances to Customers
Customer Deposits
Advances to Deposits Ratio
02 03 04 05 06
Advances to Customers and Customer Deposits
600
500
400
300
200
100
0
HK$bn
60
50
%
40
Balance SheetTotal assets rose by HK$88.2 billion, or 15.2 per cent, to HK$669.1 billion. Customer advances rose by 7.2 per cent with encouraging growth in card and personal loans, trade finance, CMB lending and Mainland lending. Residential mortgages grew satisfactorily in an intense competitive market. Interbank placing and money market instruments also increased, driven by the 12.8 per cent growth in customer deposits. At 31 December 2006, the advances-to-deposits ratio was 51.7 per cent, compared with 54.4 per cent at the end of 2005.
Assets deployment
2006 2005HK$m % HK$m %
Cash and balances with banks 9,390 1.4 9,201 1.6
Placings with and advances to banks 99,705 14.9 69,286 11.9
Trading assets 12,467 1.9 12,600 2.2
Financial assets designated at fair value 8,280 1.2 6,027 1.0
Advances to customers 279,353 41.8 260,680 44.9
Financial investments 227,710 34.0 189,904 32.7
Other assets 32,159 4.8 33,122 5.7
Total assets 669,064 100.0 580,820 100.0
FINANCIAL REVIEW (continued)
70 HANG SENG BANK
Advances to customersAdvances to customers rose by 7.2 per cent compared with the end of 2005.
Lending to the property development sector rose 9.8 per cent, reflecting the increase in financing of development projects by CIB and CMB. The 4.6 per cent rise in property investment was largely residential mortgages to property holding vehicles controlled by individuals. Lending to investment companies grouped under the financial concerns sector rose significantly, driven by the active investment market. The encouraging growth of the CMB loan portfolio was reflected in rises of 14.3 per cent and 18.4 per cent in lending to the wholesale and retail trade and manufacturing sector respectively. Lending to the transport and transport equipment sector recorded a fall of 6.5 per cent, attributable to the disposal of a part of the taxi portfolio to balance the overall loan portfolio structure. Excluding such effect, lending to this sector rose 5.5 per cent.
Trade finance recorded strong growth of 24.0 per cent and gained substantial market share in 2006, reflecting CMB’s achievement in strengthening customer relationships and enhancing trade finance service efficiency.Lending to individuals recorded a rise of 2.1 per cent. Excluding the fall in Government Home Ownership Scheme mortgages, lending to individuals grew by 5.4 per cent. Residential mortgages to individuals rose by 2.8 per cent and the Bank gained market share amid intense market competition. Including mortgages held in the name of investment holding vehicles which were grouped under the property investment sector as mentioned above, the growth rate reached 5.2 per cent.
With the improved economic environment and positive consumer sentiment, personal loans and card advances rose 46.4 per cent and 22.1 per cent respectively. PFS further expanded its consumer finance business by stepping up marketing initiatives and improving process efficiency.
Loans for use outside Hong Kong increased by HK$6,316 million, or 39.8 per cent, over the previous year-end. This
was due largely to the 50.9 per cent expansion of lending by Mainland branches, which had reached HK$15,851 million at 31 December 2006. Strong growth was recorded in corporate lending, driven by renminbi loans which can be priced at a higher margin. Trade finance rose significantly, reflecting good collaboration between the Hong Kong and Mainland trade services teams. Mainland branches continued to grow residential mortgage business, leveraging the Bank’s strong capabilities and experience in Hong Kong.
Customer depositsCustomer deposits and certificates of deposit and other debt securities in issue rose by 12.8 per cent to HK$540.3 billion. Both HK dollar and US dollar savings accounts rose, reflecting customers’ preference for liquidity in an active investment market. Structured deposits, structured certificates of deposit and other debt securities in issue rose 31.2 per cent as the Bank continued to increase the diversity and sophistication of these products for customers to capture market opportunities.
Deposits at Mainland branches grew 51.1 per cent following efforts to increase the customer base through expansion of the network and the PFS sales force. To further develop the wealth management business, the Mainland branches expanded the range of investment-linked deposit products to meet the needs of the Prestige Banking customer segment.
Subordinated liabilitiesDuring 2006, the Bank issued floating-rate subordinated notes amounting to US$450 million that mature in July 2016 with a one-time call option exercisable by the Bank in July 2011. The notes were issued at the price of 99.869 per cent, bearing interest at the rate of three-month US dollar LIBOR plus 0.30 per cent, payable quarterly from the issue date to the call option date. Thereafter, if the notes are not redeemed on the call option date, the interest rate will be reset to three-month US dollar LIBOR plus 0.80 per cent payable quarterly. The notes, which qualify as tier 2 capital, serve to help the Bank maintain a more balanced capital structure and support business growth.
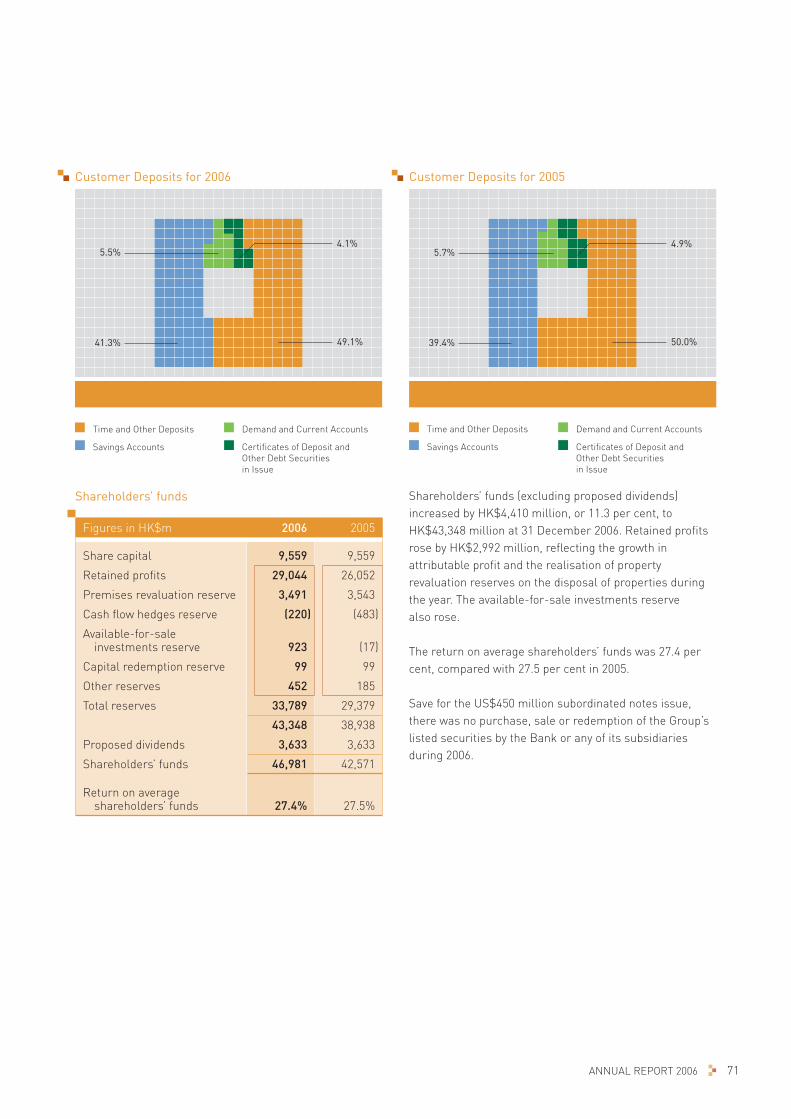
71ANNUAL REPORT 2006
Customer Deposits for 2005
Time and Other Deposits
Savings Accounts
Demand and Current Accounts
Certificates of Deposit andOther Debt Securitiesin Issue
39.4%
5.7%4.9%
50.0%
Customer Deposits for 2006
Time and Other Deposits
Savings Accounts
Demand and Current Accounts
Certificates of Deposit andOther Debt Securitiesin Issue
41.3%
5.5%4.1%
49.1%
Shareholders’ funds
Figures in HK$m 2006 2005
Share capital 9,559 9,559
Retained profits 29,044 26,052
Premises revaluation reserve 3,491 3,543
Cash flow hedges reserve (220) (483)
Available-for-sale investments reserve 923 (17)
Capital redemption reserve 99 99
Other reserves 452 185
Total reserves 33,789 29,379
43,348 38,938
Proposed dividends 3,633 3,633
Shareholders’ funds 46,981 42,571
Return on average shareholders’ funds 27.4% 27.5%
Shareholders’ funds (excluding proposed dividends) increased by HK$4,410 million, or 11.3 per cent, to HK$43,348 million at 31 December 2006. Retained profits rose by HK$2,992 million, reflecting the growth in attributable profit and the realisation of property revaluation reserves on the disposal of properties during the year. The available-for-sale investments reserve also rose.
The return on average shareholders’ funds was 27.4 per cent, compared with 27.5 per cent in 2005.
Save for the US$450 million subordinated notes issue, there was no purchase, sale or redemption of the Group’s listed securities by the Bank or any of its subsidiaries during 2006.

FINANCIAL REVIEW (continued)
72 HANG SENG BANK
Capital ManagementCapital Resources Management
Figures in HK$m 2006 2005
Capital base
Tier 1 capital
– Share capital 9,559 9,559
– Retained profits 25,724 21,439
– Classified as regulatory reserve (518) (510)
– Capital redemption reserve 99 99
– Less: goodwill (330) (318)
– Total 34,534 30,269
Tier 2 capital
– Property revaluation reserve 4,259 5,114
– Available-for-sale investment and equity revaluation reserve 542 (5)
– Collective impairment allowances 518 510
– Regulatory reserve 518 510
– Term subordinated debt 7,988 4,479
– Total 13,825 10,608
Unconsolidated investments and other deductions (4,242) (3,444)
Total capital base after deductions 44,117 37,433
Risk-weighted assets
On-balance sheet 308,127 277,617
Off-balance sheet 15,251 14,739
Total risk-weighted assets 323,378 292,356
Total risk-weighted assets adjusted for market risk 324,007 291,570
Capital adequacy ratios
After adjusting for market risk
– Tier 1* 10.7% 10.4%
– Total* 13.6% 12.8%
Before adjusting for market risk
– Tier 1 10.7% 10.4%
– Total 13.6% 12.8%
* The capital ratios take into account market risks in accordance with the relevant HKMA guideline in the Supervisory Policy Manual.
In accordance with the HKMA guideline, Impact of the New Hong Kong Accounting Standards on Authorised Institutions’ Capital Base and Regulatory Reporting, the Group has earmarked a “regulatory reserve” from retained profits. This regulatory reserve is included as tier 2 capital together with the Group’s collective impairment allowances.
The total capital ratio rose by 0.8 percentage points to 13.6 per cent at 31 December 2006, compared with 12.8 per cent at 31 December 2005. The tier 1 ratio increased from 10.4 per cent to 10.7 per cent. The capital base increased by HK$6,684 million to HK$44,117 million, mainly due to the increase in retained profits (including the realisation of property revaluation reserves on disposed properties) and the issue of US$450 million subordinated notes, which qualify as tier 2 capital. Risk-weightedassets adjusted for market risk grew by 11.1 per cent, attributable to the increase in advances to customers and financial investments.

73ANNUAL REPORT 2006
Risk ManagementThe effectiveness of the Group’s risk management polices and strategies is a key success factor. Operating in the financial services industry, the most important types of risks the Group is exposed to are credit, liquidity, market, insurance underwriting, operational and reputational risks. The Group has established policies and procedures to identify and analyse risks and to set appropriate risk limits to control this broad spectrum of risks. The risk management policies and major control limits are approved by the Board of Directors. Risk limits are monitored and controlled continually by dedicated departments by means of reliable and up-to-date management information systems. The management of various types of risks is well coordinated at the level of the Bank’s Board and various Management committees, such as, the Executive Committee, Asset and Liability Management Committee and Credit Committee.
Note 61 “Financial risk management” to the financial statements provides a detailed discussion and analysis of the Group’s credit risk, liquidity risk, market and interest rate risk and insurance underwriting risk. The management of operational risk and reputational risk are set out as follows:
Operational RiskOperational risk is the risk of loss arising through fraud, unauthorised activities, error, omission, inefficiency, system failure or from external events. It is inherent to every business organisation and covers a wide spectrum of issues. The Group manages its operational risk through a controls-based environment in which the processes and
controls are documented, authorisation is independent and transactions are reconciled and monitored. This is supported by periodic independent review of the internal control systems by Internal Audit. The operational risk management framework comprises assignment of responsibilities at senior management level, assessment of risk factors inherent in each business and operations units, information systems to record operational losses and analysis of loss events. Operational risk is mitigated by adequate insurance coverage on assets and business losses. To reduce the impact and interruptions to business activities caused by system failure or natural disaster, back-up systems and contingency business resumption plans are in place for all business and critical operations functions. Operational risk management is coordinated by the Chief Operating Officer and monitored by the Operational Risk Management Committee.
Reputational RiskReputational risks can arise from social, ethical or environmental issues, or as a consequence of operational risk events. Standards are set and policies and procedures are established in all areas of reputational risk and are communicated to all level of staff. These include treating customers fairly, conflicts of interest, money laundering deterrence, environmental impact and anti-corruption measures. The reputation downside to the Group is fully appraised before any strategic decision is taken.
The Group is a socially and environmental responsible organization. Its corporate social responsibility policies and practices are discussed in the corporate responsibility section of this Annual Report.

74 HANG SENG BANK
BIOGRAPHICAL DETAILS OF DIRECTORS
# Mr Michael Roger Pearson SMITH OBE
Chairman
Age 50. Appointed non-executive Chairman on 22 April 2005. The President and Chief Executive Officer of The Hongkong and Shanghai Banking Corporation Limited. Chairman of HSBC Bank Malaysia Berhad and Global Head of Commercial Banking of HSBC Group. A Director of HSBC Finance Corporation, HSBC Australia Holdings Pty Limited, HSBC Bank Australia Limited and The Shek O Development Company Limited. Head
of Advisory Council of Asia Investment Corporation and a member of Chongqing Mayor’s International Economic Advisory Council. A member of the Visa International Asia Pacific Regional Board and a Fellow of The Hong Kong Management Association.
Mr OR Ching Fai Raymond JP
Vice-Chairman and Chief Executive
Age 57. Appointed a Director of the Bank in February 2000 and became Vice-Chairman and Chief Executive in May 2005. A Director of The Hongkong and Shanghai Banking
Corporation Limited, Cathay Pacific Airways Limited, Esprit Holdings Limited and Hutchison Whampoa Limited. Vice President and a Council Member of the Hong Kong Institute of Bankers. Committee Member of The Hong Kong Association of Banks. Chairman of the Hang Seng School of Commerce. A Council Member of The University of Hong Kong and The City University of Hong Kong. An adviser of the Employers’ Federation of Hong Kong, a member of the Aviation Development Advisory Committee and the Planning Committee of the 5th East Asian Games. A Director of
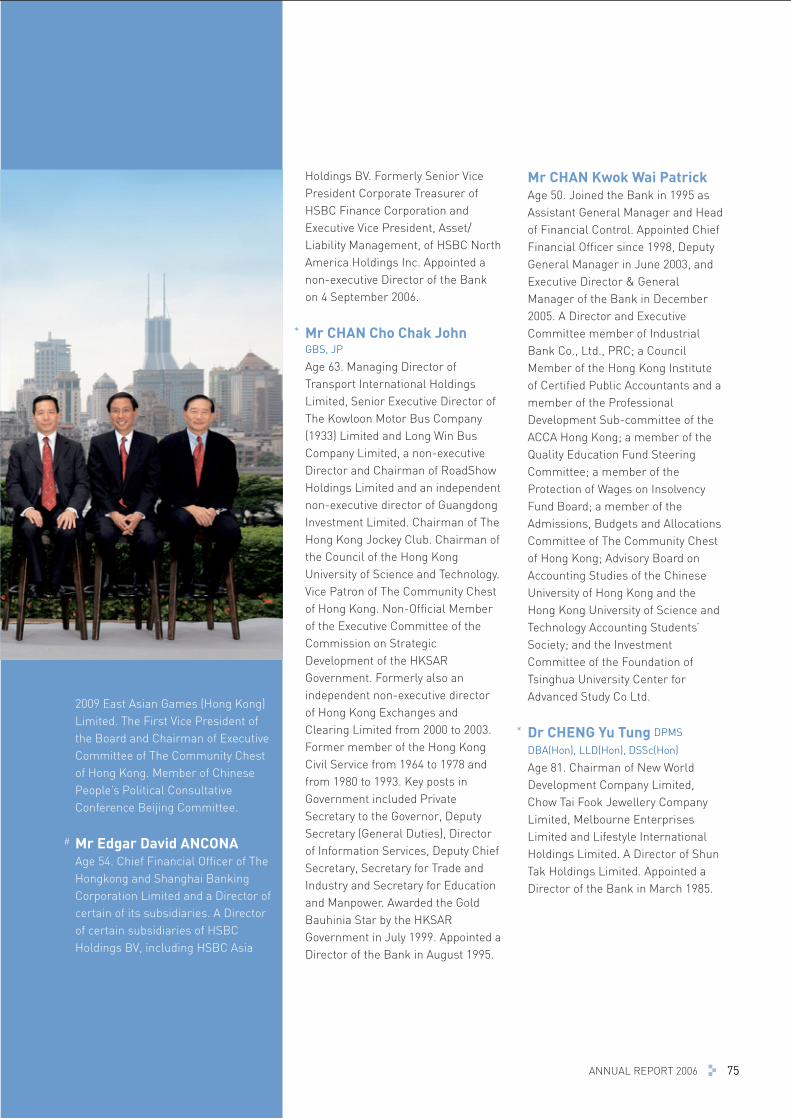
75ANNUAL REPORT 2006 75
2009 East Asian Games (Hong Kong) Limited. The First Vice President of the Board and Chairman of Executive Committee of The Community Chest of Hong Kong. Member of Chinese People’s Political Consultative Conference Beijing Committee.
# Mr Edgar David ANCONA Age 54. Chief Financial Officer of The
Hongkong and Shanghai Banking Corporation Limited and a Director of certain of its subsidiaries. A Director of certain subsidiaries of HSBC Holdings BV, including HSBC Asia
Holdings BV. Formerly Senior Vice President Corporate Treasurer of HSBC Finance Corporation and Executive Vice President, Asset/Liability Management, of HSBC North America Holdings Inc. Appointed a non-executive Director of the Bank on 4 September 2006.
* Mr CHAN Cho Chak John GBS, JP
Age 63. Managing Director of Transport International Holdings Limited, Senior Executive Director of The Kowloon Motor Bus Company (1933) Limited and Long Win Bus Company Limited, a non-executive Director and Chairman of RoadShow Holdings Limited and an independent non-executive director of Guangdong Investment Limited. Chairman of The Hong Kong Jockey Club. Chairman of the Council of the Hong Kong University of Science and Technology. Vice Patron of The Community Chest of Hong Kong. Non-Official Member of the Executive Committee of the Commission on Strategic Development of the HKSAR Government. Formerly also an independent non-executive director of Hong Kong Exchanges and Clearing Limited from 2000 to 2003. Former member of the Hong Kong Civil Service from 1964 to 1978 and from 1980 to 1993. Key posts in Government included Private Secretary to the Governor, Deputy Secretary (General Duties), Director of Information Services, Deputy Chief Secretary, Secretary for Trade and Industry and Secretary for Education and Manpower. Awarded the Gold Bauhinia Star by the HKSAR Government in July 1999. Appointed a Director of the Bank in August 1995.
Mr CHAN Kwok Wai Patrick Age 50. Joined the Bank in 1995 as
Assistant General Manager and Head of Financial Control. Appointed Chief Financial Officer since 1998, Deputy General Manager in June 2003, and Executive Director & General Manager of the Bank in December 2005. A Director and Executive Committee member of Industrial Bank Co., Ltd., PRC; a Council Member of the Hong Kong Institute of Certified Public Accountants and a member of the Professional Development Sub-committee of the ACCA Hong Kong; a member of the Quality Education Fund Steering Committee; a member of the Protection of Wages on Insolvency Fund Board; a member of the Admissions, Budgets and Allocations Committee of The Community Chest of Hong Kong; Advisory Board on Accounting Studies of the Chinese University of Hong Kong and the Hong Kong University of Science and Technology Accounting Students’ Society; and the Investment Committee of the Foundation of Tsinghua University Center for Advanced Study Co Ltd.
* Dr CHENG Yu Tung DPMS
DBA(Hon), LLD(Hon), DSSc(Hon)
Age 81. Chairman of New World Development Company Limited, Chow Tai Fook Jewellery Company Limited, Melbourne Enterprises Limited and Lifestyle International Holdings Limited. A Director of Shun Tak Holdings Limited. Appointed a Director of the Bank in March 1985.
76 HANG SENG BANK
BIOGRAPHICAL DETAILS OF DIRECTORS (continued)
* Dr CHEUNG Kin Tung Marvin DBA(Hon), SBS, OBE, JP
Age 59. Non-official Member of the Executive Council, Board Member of the Airport Authority Hong Kong, Member of the Exchange Fund Advisory Committee of the Hong Kong Monetary Authority, Member of the Greater Pearl River Delta Business Council, Vice-Chairman of the Council of the Hong Kong University of Science and Technology and Council Member of the Open University of Hong Kong. An independent non-executive Director of HKR International Limited and Hong Kong Exchanges and Clearing Limited. Director of The Association of Former Council Members of the Stock Exchange of Hong Kong Limited. Appointed a Director of the Bank in May 2004.
* Mr Jenkin HUI Age 63. Director and Chief Executive
of Pointpiper Investment Limited. A Director of Central Development Limited, Jardine Matheson Holdings Limited, Jardine Strategic Holdings Limited and Hongkong Land Holdings Limited. Appointed a Director of the Bank in August 1994.
* Mr Peter LEE Ting Chang JP
Age 53. Chairman of Hysan Development Company Limited. A non-executive Director of Cathay
Pacific Airways Limited, CLP Holdings Limited, SCMP Group Limited and Maersk China Ltd., and a Director of a number of other companies. Vice President of the Real Estate Developers Association of Hong Kong. Appointed a Director of the Bank in August 2002.
* Dr LI Ka Cheung Eric FCPA(Practising), GBS, OBE, JP
Age 53. Senior partner of Li, Tang, Chen & Co., Certified Public Accountants. Member of The Tenth National Committee of Chinese People’s Political Consultative Conference. Director of Sun Hung Kai Properties Limited, Transport International Holdings Limited, SmarTone Telecommunications Holdings Limited, Wong’s International (Holdings) Limited, CATIC International Holdings Limited, China Resources Enterprise, Limited, RoadShow Holdings Limited, Sinofert Holdings Limited, Bank of Communications Co., Ltd. and Meadville Holdings Limited. President of Hong Kong Society of Accountants in 1994. Chairman of Hong Kong Monetary Authority’s Process Review Committee and Member of Basel II Consultation Group. Member of the Clearing and Settlement Systems Appeals Tribunal. Awarded the Gold Bauhinia Star by the HKSAR Government in July 2003. Appointed a Director of the Bank in February 2000.
# Dr LO Hong Sui Vincent GBS, JP
Age 58. Chairman and Chief Executive Officer of Shui On Group. Chairman and Chief Executive Officer of Shui On Land Limited, and Chairman of Shui On Construction and Materials Limited. Director of Great Eagle Holdings Limited. An independent non-executive Director of China Telecom Corporation Ltd. Member of The Tenth National Committee of the Chinese People’s Political Consultative Conference. Vice Chairman of All-China Federation of Industry & Commerce. Honorary Life President of Business and Professionals Federation of Hong Kong. President of Shanghai-Hong Kong Council for the Promotion and Development of Yangtze. Economic Adviser to the Chongqing Municipal Government. Court Member of the Hong Kong University of Science and Technology. Awarded the Gold Bauhinia Star by the HKSAR Government in July 1998. Recipient of the Businessman of the Year award in the Hong Kong Business Awards 2001. Awarded Director of the Year in the category of Listed Company Executive Directors by The Hong Kong Institute of Directors in 2002 and Chevalier des Arts et des Lettres by the French government in 2005. Appointed a Director of the Bank in February 1999.

77ANNUAL REPORT 2006 77
Mr POON Chung Yin Joseph Age 52. Appointed Executive Director
and Deputy Chief Executive of the Bank in December 2004. Managing Director and Deputy Chief Executive since April 2005. Independent non-executive Director of Grandland Shipping Limited. A Director of certain subsidiaries of the Bank, including Hang Seng Bank (Trustee) Limited, Hang Seng Credit Limited, Hang Seng Finance Limited and Hang Seng Life Limited. Chairman of Hang Seng Index Advisory Committee of HSI Services Limited.
* Dr SIN Wai Kin David DSSc(Hon)
Age 77. Chairman of Myer Jewelry Manufacturer Limited. Vice-Chairman of Miramar Hotel and Investment Company Limited. Executive Director of New World Development Company Limited. Appointed a Director of the Bank in November 1991.
* Mr Richard Yat Sun TANG MBA, BBS, JP
Age 54. Chairman and Managing Director of Richcom Company Limited. A Vice Chairman of King Fook Holdings Limited. A Director of Miramar Hotel and Investment Company Limited and Hong Kong Commercial Broadcasting Company Limited. Chairman of the Correctional Services Children’s
Education Trust Investment Advisory Board of the Correctional Services Department. A member of the HKSAR Passports Appeal Board, a member of Disciplinary Panel A of the Hong Kong Institute of Certified Public Accountants. Chairman of Customs & Excise Service Children’s Education Trust Fund Committee. A member of Tang Shiu Kin and Ho Tim Charitable Fund. Appointed “Justice of the Peace” in 1997. Awarded the Bronze Bauhinia Star by the HKSAR Government in July 2000. Appointed a Director of the Bank in August 1995.
# Mr WONG Tung Shun Peter JP
Age 55. Executive Director of The Hongkong and Shanghai Banking Corporation Limited and Chairman of HSBC Insurance (Asia-Pacific) Holdings Limited. A Director of Bank of Communications Co., Ltd., Ping An Bank Limited, Ping An Insurance (Group) Company of China, Ltd., Hong Kong Interbank Clearing Limited and The Hong Kong General Chamber of Commence. Nominated representative of the Hong Kong Association of Banks and President of the Hong Kong Institute of Bankers. Chairman of the Financial Services Advisory Committee of the Hong Kong Trade Development Council and The Banking Industry Training Advisory Committee. Member of the Banking Advisory Committee of the Hong Kong Monetary Authority. Member of the
Greater Pearl River Delta Business Council. A Director of The Community Chest of Hong Kong. An Honorary Professor of The University of Hong Kong and a Member of the University Grants Committee, Government of the HKSAR. Appointed a non-executive Director of the Bank in May 2005.
* Independent non-executive Directors # Non-executive Directors
Mr Michael R P Smith is President and Chief Executive Officer of The Hongkong and Shanghai Banking Corporation Limited. Mr Raymond C F Or is a Director of The Hongkong and Shanghai Banking Corporation Limited. Mr Peter T S Wong is an Executive Director of The Hongkong and Shanghai Banking Corporation Limited. Mr Edgar D Ancona is a Director of certain subsidiaries of HSBC Holdings BV, including HSBC Asia Holdings BV, and Chief Financial Officer of The Hongkong and Shanghai Banking Corporation Limited. Each of HSBC Holdings BV, HSBC Asia Holdings BV and The Hongkong and Shanghai Banking Corporation Limited has an interest in the share capital of the Bank as disclosed under the provisions of Divisions 2 and 3 of Part XV of the Securities and Futures Ordinance.
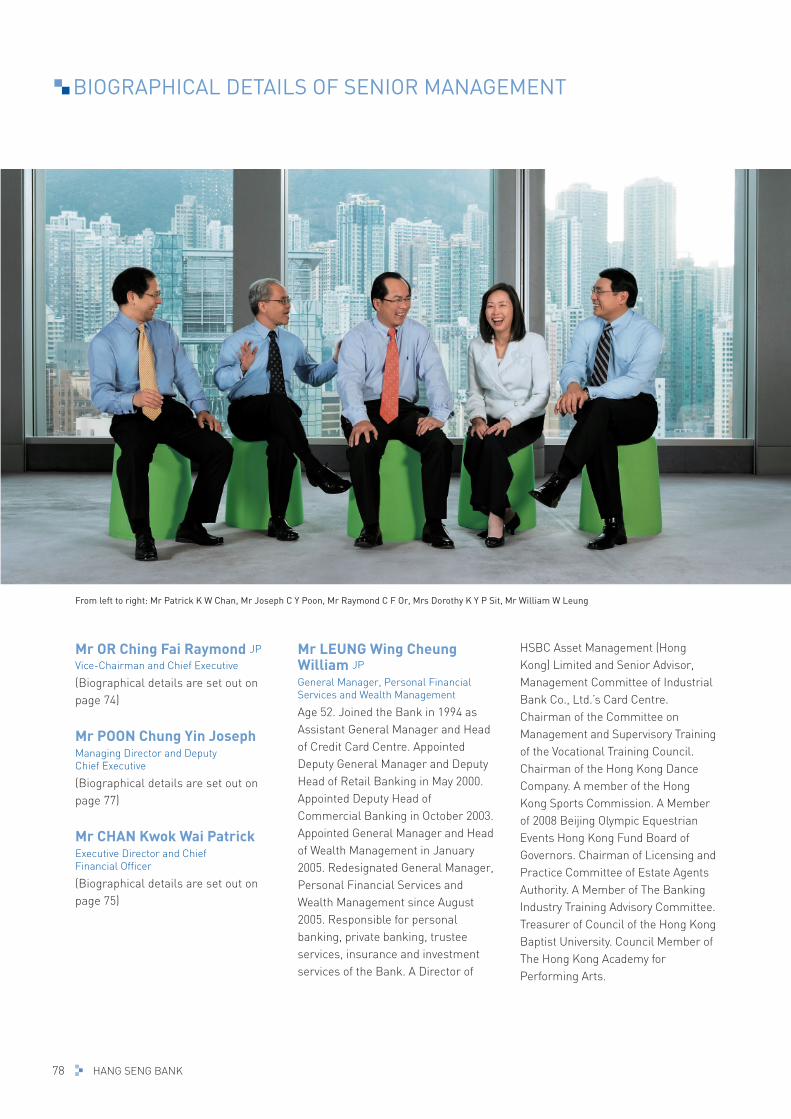
78 HANG SENG BANK
BIOGRAPHICAL DETAILS OF SENIOR MANAGEMENT
Mr OR Ching Fai Raymond JP
Vice-Chairman and Chief Executive
(Biographical details are set out on page 74)
Mr POON Chung Yin JosephManaging Director and Deputy Chief Executive
(Biographical details are set out on page 77)
Mr CHAN Kwok Wai PatrickExecutive Director and Chief Financial Officer
(Biographical details are set out on page 75)
Mr LEUNG Wing Cheung William JP
General Manager, Personal Financial Services and Wealth Management
Age 52. Joined the Bank in 1994 as Assistant General Manager and Head of Credit Card Centre. Appointed Deputy General Manager and Deputy Head of Retail Banking in May 2000. Appointed Deputy Head of Commercial Banking in October 2003. Appointed General Manager and Head of Wealth Management in January 2005. Redesignated General Manager, Personal Financial Services and Wealth Management since August 2005. Responsible for personal banking, private banking, trustee services, insurance and investment services of the Bank. A Director of
HSBC Asset Management (Hong Kong) Limited and Senior Advisor, Management Committee of Industrial Bank Co., Ltd.’s Card Centre. Chairman of the Committee on Management and Supervisory Training of the Vocational Training Council. Chairman of the Hong Kong Dance Company. A member of the Hong Kong Sports Commission. A Member of 2008 Beijing Olympic Equestrian Events Hong Kong Fund Board of Governors. Chairman of Licensing and Practice Committee of Estate Agents Authority. A Member of The Banking Industry Training Advisory Committee. Treasurer of Council of the Hong Kong Baptist University. Council Member of The Hong Kong Academy for Performing Arts.
From left to right: Mr Patrick K W Chan, Mr Joseph C Y Poon, Mr Raymond C F Or, Mrs Dorothy K Y P Sit, Mr William W Leung

79ANNUAL REPORT 2006
Mrs SIT KWAN Yin Ping DorothyGeneral Manager and Chief Operating Officer
Age 55. Joined the Bank in December 2005 as General Manager. Appointed Chief Operating Officer since January 2006. A Member of The Banking Industry Training Advisory Committee and an Ex-officio member of its Subcommittee on Specification of Competency Standards Development. Head of Personal Financial Services, Hong Kong for The Hongkong and Shanghai Banking Corporation Limited before joining the Bank.
Mr NG Yuen Tin FHKIB
Deputy General Manager and Head of Corporate Banking
Age 55. Joined the Bank in 1971. Appointed Assistant General Manager and Deputy Head of Corporate Banking Division in January 1994. Appointed Head of Corporate Banking Division in September 1999. Appointed Deputy General Manager and Head of Corporate Banking since July 2000. Responsible for overseeing the corporate and institutional banking business of the Bank. Director and Chief Executive of Hang Seng Finance Limited. A Director of HSI Services Limited and HSI International Limited. A member of the Hang Seng Index Advisory Committee. An Executive Committee Member of the Hong Kong Institute of Bankers.
Mr TAM Wai Hung David MBA, FCIB, FHKIB
Deputy General Manager and Head of Commercial Banking, Greater China
Age 57. Joined the Bank in 1999 as Assistant General Manager and Head of Commercial Banking. Appointed Deputy General Manager and Head of Commercial Banking since June 2003 and as Head of Commercial Banking, Greater China since January 2007. Responsible for overseeing the commercial banking business of the Bank in the Greater China region, the functional departments of trade services, customized trade solutions, business development, portfolio and project management and the Macau Branch. Member of Small and Medium Enterprises Committee and Council member of Hong Kong St John Ambulance.
Mr CHEUNG Tai Keung JackDeputy General Manager and Head of Treasury
Age 47. Joined the Bank in June 2004 as Deputy General Manager and Acting Head of Treasury. Responsible for overseeing the Treasury and Singapore operations. Appointed Deputy General Manager and Head of Treasury since August 2004. Director, Head of Balance Sheet Management, Asia-Pacific Global Markets of The Hongkong and Shanghai Banking Corporation Limited before joining the Bank.
Mr FU Chi King JohnsonDeputy General Manager and Head of China Business
Age 52. Joined the Bank in August 2005 as Deputy General Manager and Head of China Business. Responsible for overseeing the
Bank’s operations in mainland China and Taiwan, as well as the Bank’s business with Mainland and Taiwanese companies in Hong Kong and foreign-invested, state-owned and domestic companies on the Mainland. Honorable President of Hong Kong Chamber of Commerce in China – Shanghai. Regional Head of Corporate Banking, Asia Pacific and Alternate Chief Executive, Hong Kong of Commerzbank before joining the Bank.
Mr FUNG Hau Chung AndrewDeputy General Manager and Head of Investment and Insurance
Age 49. Joined the Bank in May 2006 as Deputy General Manager and Head of Investment and Insurance. Responsible for overseeing the Bank’s investment and insurance businesses with responsibility for management, sales and market strategy, as well as the development of new products and services.Director and General Manager of Hang Seng Investment Management Limited. A Director of Hang Seng Insurance Company Limited, Bankers Alliance Insurance Company Limited, Hang Seng Investment Services Limited and Hang Seng Securities Limited. An non-official Member of Commission on Strategic Development – Committee on Economic Development and Economic Cooperation with the Mainland and a Member of Process Review Panel for the Securities and Futures Commission. Managing Director, Advisory Sales, Greater China, Global Financial Markets, of DBS Bank Ltd before joining the Bank.
80 HANG SENG BANK
REPORT OF THE DIRECTORS
The Directors have pleasure in presenting their report together with the audited financial statements for the year ended 31 December 2006.
Principal ActivitiesThe Bank and its subsidiaries and associates are engaged in the provision of banking and related financial services.
ProfitsThe consolidated profit of the Bank and its subsidiaries and associates for the year is set out on page 89 together with particulars of dividends which have been paid or declared.
Major Customers The Directors believe that the five largest customers of the Bank accounted for less than 30% of the total of interest income and other operating income of the Bank in the year.
SubsidiariesParticulars of the Bank’s principal subsidiaries at31 December 2006 are set out on page 137.
Share CapitalNo change in either the authorised or issued share capital took place during the year.
DonationsCharitable donations made by the Bank and its subsidiaries during the year amounted to HK$16.8 million.
DirectorsThe Directors of the Bank who were in office at the end of the year were Mr Michael R P Smith, Mr Raymond C F Or, Mr Edgar D Ancona, Mr John C C Chan,Mr Patrick K W Chan, Dr Y T Cheng, Dr Marvin K T Cheung, Mr Jenkin Hui, Mr Peter T C Lee, Dr Eric K C Li,Dr Vincent H S Lo, Mr Joseph C Y Poon, Dr David W K Sin, Mr Richard Y S Tang and Mr Peter T S Wong.
Mr S J Glass resigned from the Board with effect from24 March 2006.
Mr Edgar D Ancona was appointed a Director of the Bank with effect from 4 September 2006. He retires under the provisions of the Bank’s Articles of Association and, being eligible, offers himself for re-election.
The Directors retiring by rotation in accordance with the Bank’s Articles of Association are Mr John C C Chan,Dr Eric K C Li, Dr Vincent H S Lo and Dr David W K Sin, who, being eligible, offer themselves for re-election.
No Director proposed for re-election at the forthcoming Annual General Meeting has a service contract with the Bank which is not determinable by the Bank within one year without payment of compensation (other than statutory compensation).
No contract of significance, to which the Bank or any of its holding companies or any of its subsidiaries or fellow subsidiaries was a party and in which a Director of the Bank had a material interest, subsisted at the end of the year or at any time during the year.
Status Of Independent Non-Executive DirectorsThe Bank has received from each independent non-executive Director an annual confirmation of his independence pursuant to Rule 3.13 of the Rules Governing the Listing of Securities on The Stock Exchange of Hong Kong Limited (“Stock Exchange”) (“the Listing Rules”) and the Bank still considers the independent non-executive Directors to be independent.
Directors’ And Alternate Chief Executives’ InterestsAt the end of the financial year, the interests of the Directors and Alternate Chief Executives in the shares, underlying shares of equity derivatives and debentures of the Bank and its associated corporations (all within the meaning of Part XV of the Securities and Futures Ordinance (“SFO”)) disclosed in accordance with the Listing Rules were detailed below.

81ANNUAL REPORT 2006
Personal Interests (held as
beneficial owner)
Family Interests
(Interests of spouse or child
under 18)
Corporate Interests
(Interests of controlled
corporation)Other
InterestsTotal
Interests
Total Interests as
% of the relevant
issued share capital
Number of Ordinary Shares of HK$5 each in the Bank
Directors:
Mr Raymond C F Or 50,000 – – – 50,000 0.00
Mr John C C Chan – – – 1,000 (1) 1,000 0.00
Mr Patrick K W Chan – 1,000 – – 1,000 0.00
Mr Joseph C Y Poon 5,000 – – – 5,000 0.00
Number of Ordinary Shares of US$0.50 each in HSBC Holdings plc
Directors:
Mr Michael R P Smith 143,800 (2) – – 305,777 (7) 449,577 0.00
Mr Raymond C F Or 152,119 36,874 – 248,052 (7) 437,045 0.00
Mr Edgar D Ancona 217,567 – – 203,807 (7) 421,374 0.00
Mr John C C Chan 14,283 – – 3,000 (1) 17,283 0.00
Mr Patrick K W Chan 2,390 5,018 – 49,571 (7) 56,979 0.00
Mr Jenkin Hui 10,601 24,342 1,174,636 (3) – 1,209,579 0.01
Dr Eric K C Li – 18,132 79,622 (4) – 97,754 0.00
Mr Joseph C Y Poon 27,468 (5) 59,818 – 60,966 (7) 148,252 0.00
Mr Peter T S Wong 86,783 20,896 – 87,491 (7) 195,170 0.00
Alternate Chief Executives:
Mr William W Leung 10,714 – – 39,082 (7) 49,796 0.00
Mrs Dorothy K Y P Sit 5,680 (6) 728 – 53,008 (7) 59,416 0.00
Notes:
(1) 1,000 shares in the Bank and 3,000 shares in HSBC Holdings plc were held by a trust of which Mr and Mrs John C C Chan were beneficiaries.
(2) These shares were jointly held by Mr and Mrs Michael R P Smith.
(3) Mr Jenkin Hui was entitled to fully control the voting power at general meetings of Parc Palais Incorporated, a private company, which beneficially held all of those shares referred to above as his corporate interests.
(4) Dr Eric K C Li was entitled to control no less than one-third of the voting power at general meetings of a private company which beneficially held all of those shares referred to above as his corporate interests.
(5) 22,599 shares were jointly held by Mr and Mrs Joseph C Y Poon.
(6) These shares were jointly held by Mrs Dorothy K Y P Sit and her husband.

82 HANG SENG BANK
REPORT OF THE DIRECTORS (continued)
(7) These represent interests in (i) options granted to Directors and Alternate Chief Executives under the HSBC Share Option Plans/HSBC Finance 1996 Long-Term Executive Incentive Compensation Plan to acquire ordinary shares of US$0.50 each in HSBC Holdings plc and (ii) conditional awards of shares under the HSBC Holdings plc Restricted Share Plan/HSBC Share Plans made in favour of Directors and Alternate Chief Executives and held by various trusts for ordinary shares of US$0.50 each in HSBC Holdings plc, as set against their respective names below:
Options (please refer to
the options table below for details)
Conditional awards ofshares under the
HSBC Holdings plcRestricted Share Plan/
HSBC Share Plans(please refer to the awards table
below for further information) Total
Directors:
Mr Michael R P Smith – 305,777 305,777
Mr Raymond C F Or 2,504 245,548 248,052
Mr Edgar D Ancona 135,438 68,369 203,807
Mr Patrick K W Chan 26,000 23,571 49,571
Mr Joseph C Y Poon 28,454 32,512 60,966
Mr Peter T S Wong – 87,491 87,491
Alternate Chief Executives:
Mr William W Leung 13,322 25,760 39,082
Mrs Dorothy K Y P Sit 5,435 47,573 53,008
OptionsAt the end of the financial year, the Directors and Alternate Chief Executives mentioned below held unlisted physically settled options to acquire the number of ordinary shares of US$0.50 each in HSBC Holdings plc set against their respective names. These options were granted for nil consideration by HSBC Holdings plc.
Options held at 31 December
2006
Options exercised during
the Director’s/Alternate Chief
Executive’s term of office in 2006
(ordinary shares of US$0.50 each)
Exercise price per share Date granted
Exercisable from
Exercisable until
Directors:
Mr Michael R P Smith – 22,500 (1) £3.3334 1 Apr 1996 1 Apr 1999 1 Apr 2006
– 24,000 (1) £5.0160 24 Mar 1997 24 Mar 2000 24 Mar 2007
– 24,000 (1) £6.2767 16 Mar 1998 16 Mar 2001 16 Mar 2008
Mr Raymond C F Or 1,515 – £6.4720 10 May 2004 1 Aug 2009 31 Jan 2010
989 – £6.6792 24 May 2005 1 Aug 2010 31 Jan 2011
2,504
Mr Edgar D Ancona 33,438 (5) – US$10.66 20 Nov 2002 20 Nov 2003 20 Nov 2012
51,000 – £9.1350 3 Nov 2003 3 Nov 2006 3 Nov 2013
51,000 – £8.2830 30 Apr 2004 30 Apr 2007 30 Apr 2014
135,438

83ANNUAL REPORT 2006
Options held at 31 December
2006
Options exercised during
the Director’s/Alternate Chief
Executive’s term of office in 2006
(ordinary shares of US$0.50 each)
Exercise price per share Date granted
Exercisable from
Exercisable until
Mr Patrick K W Chan – 1,059 (2) £5.3496 8 May 2003 1 Aug 2006 31 Jan 2007
6,500 – £7.4600 3 Apr 2000 3 Apr 2003 2 Apr 2010
6,000 – £8.7120 23 Apr 2001 23 Apr 2004 22 Apr 2011
6,500 – £8.4050 7 May 2002 7 May 2005 6 May 2012
7,000 – £6.9100 2 May 2003 2 May 2006 1 May 2013
26,000
Mr Joseph C Y Poon – 3,750 (4) £5.0160 24 Mar 1997 24 Mar 2000 24 Mar 2007
9,000 – £6.3754 29 Mar 1999 29 Mar 2002 29 Mar 2009
4,750 – £7.4600 3 Apr 2000 3 Apr 2003 3 Apr 2010
2,750 – £8.7120 23 Apr 2001 23 Apr 2004 23 Apr 2011
4,400 – £8.4050 7 May 2002 7 May 2005 7 May 2012
5,050 – £6.9100 2 May 2003 2 May 2006 2 May 2013
1,515 – £6.4720 10 May 2004 1 Aug 2009 31 Jan 2010
989 – £6.6792 24 May 2005 1 Aug 2010 31 Jan 2011
28,454
Alternate Chief Executives:
Mr William W Leung – 7,000 (3) £7.4600 3 Apr 2000 3 Apr 2003 2 Apr 2010
– 7,000 (3) £8.4050 7 May 2002 7 May 2005 6 May 2012
– 1,059 (2) £5.3496 8 May 2003 1 Aug 2006 31 Jan 2007
6,000 – £6.9100 2 May 2003 2 May 2006 1 May 2013
6,500 – £8.2830 30 Apr 2004 30 Apr 2007 29 Apr 2014
582 – £6.4720 10 May 2004 1 Aug 2007 31 Jan 2008
240 – HK$103.4401 26 Apr 2006 1 Aug 2007 31 Oct 2007
13,322
Mrs Dorothy K Y P Sit 3,000 – £8.7120 23 Apr 2001 23 Apr 2004 22 Apr 2011
2,435 – £6.6792 24 May 2005 1 Aug 2010 31 Jan 2011
5,435
Notes:
(1) At the date of exercise, 7 March 2006, the market value per share was £9.8950.
(2) At the date of exercise, 1 August 2006, the market value per share was £9.60.
(3) At the date of exercise, 10 October 2006, the market value per share was £10.10.
(4) At the date of exercise, 9 November 2006, the market value per share was £10.20.
(5) These represent Mr Edgar D Ancona’s interests in options under HSBC Finance 1996 Long-Term Executive Incentive Compensation Plan. These options arise from options he held over shares of Household International, Inc. (now HSBC Finance Corporation) before its acquisition, which were converted into options over HSBC Holdings plc ordinary shares in the same ratio as the offer for HSBC Finance Corporation and the exercise prices per share adjusted accordingly. These options were granted at nil consideration.

84 HANG SENG BANK
REPORT OF THE DIRECTORS (continued)
Conditional Awards Of SharesAt the end of the financial year, the interests of the Directors and Alternate Chief Executives in the conditional awards of shares made in favour of them under the HSBC Holdings plc Restricted Share Plan/HSBC Share Plans and held by various trusts for ordinary shares of US$0.50 each in HSBC Holdings plc were as follows:
Awards held at1 January 2006
Awards made during the Director’s/
Alternate Chief Executive’s term of
office in 2006
Shares awarded released during
the Director’s/Alternate Chief
Executive’s term of office in 2006
Awards held at 31 December 2006 (1)
Directors:
Mr Michael R P Smith 278,038 75,684 60,879 305,777
Mr Raymond C F Or 210,576 53,483 28,789 245,548
Mr Edgar D Ancona 67,804 (2) – – 68,369
Mr Patrick K W Chan 9,980 12,927 – 23,571
Mr Joseph C Y Poon 18,539 12,927 – 32,512
Mr Peter T S Wong 113,805 53,483 83,794 87,491
Alternate Chief Executives:
Mr William W Leung 20,002 12,927 7,995 25,760
Mrs Dorothy K Y P Sit 35,472 10,342 – 47,573
Notes:
(1) This includes additional shares arising from scrip dividends.
(2) This represents the awards held by Mr Edgar D Ancona on 4 September 2006 when he was appointed a Director of the Bank.
All the interests stated above represent long positions. As at 31 December 2006, no short positions were recorded in the Register of Directors’ and Alternate Chief Executives’ Interests and Short Positions required to be kept under section 352 of the SFO.
Save as disclosed in the preceding paragraphs, at no time during the year was the Bank or any of its holding companies or its subsidiaries or fellow subsidiaries a party to any arrangement to enable the Directors of the Bank to acquire benefits by means of the acquisition of shares in or debentures of the Bank or any other body corporate.
No right to subscribe for equity or debt securities of the Bank has been granted by the Bank to, nor have any such rights been exercised by, any person during the year ended 31 December 2006.
Directors’ Interests In Competing BusinessesPursuant to Rule 8.10 of the Listing Rules, at the end of the year, the following Directors had declared interests in the following entities which compete or are likely to compete, either directly or indirectly, with the businesses of the Bank:
Mr Michael R P Smith is the President and Chief Executive Officer of The Hongkong and Shanghai Banking Corporation Limited. Mr Smith is also the Chairman of HSBC Bank Malaysia Berhad, and a Director of HSBC Bank Australia Ltd, HSBC Australia Holdings Pty Ltd and HSBC Finance Corporation.
Mr Raymond C F Or is a Director of The Hongkong and Shanghai Banking Corporation Limited.
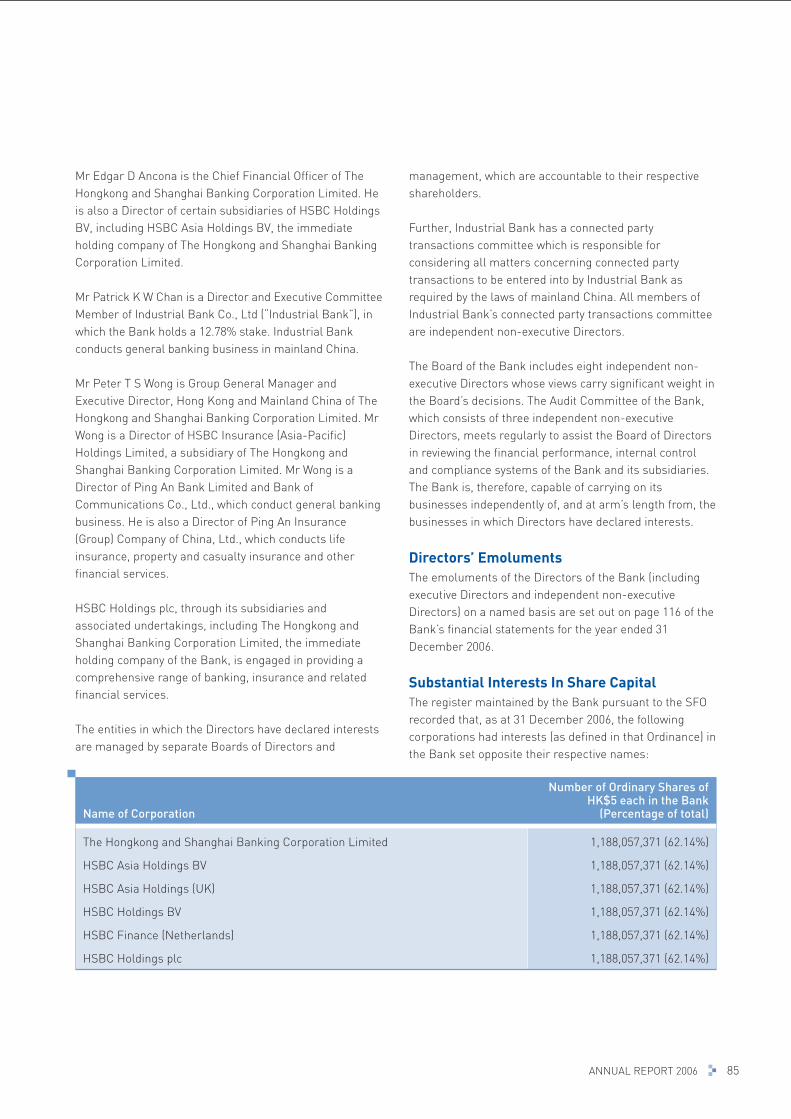
85ANNUAL REPORT 2006
Mr Edgar D Ancona is the Chief Financial Officer of The Hongkong and Shanghai Banking Corporation Limited. He is also a Director of certain subsidiaries of HSBC Holdings BV, including HSBC Asia Holdings BV, the immediate holding company of The Hongkong and Shanghai Banking Corporation Limited.
Mr Patrick K W Chan is a Director and Executive Committee Member of Industrial Bank Co., Ltd (“Industrial Bank”), in which the Bank holds a 12.78% stake. Industrial Bank conducts general banking business in mainland China.
Mr Peter T S Wong is Group General Manager and Executive Director, Hong Kong and Mainland China of The Hongkong and Shanghai Banking Corporation Limited. Mr Wong is a Director of HSBC Insurance (Asia-Pacific) Holdings Limited, a subsidiary of The Hongkong and Shanghai Banking Corporation Limited. Mr Wong is a Director of Ping An Bank Limited and Bank of Communications Co., Ltd., which conduct general banking business. He is also a Director of Ping An Insurance (Group) Company of China, Ltd., which conducts life insurance, property and casualty insurance and other financial services.
HSBC Holdings plc, through its subsidiaries and associated undertakings, including The Hongkong and Shanghai Banking Corporation Limited, the immediate holding company of the Bank, is engaged in providing a comprehensive range of banking, insurance and related financial services.
The entities in which the Directors have declared interests are managed by separate Boards of Directors and
management, which are accountable to their respective shareholders.
Further, Industrial Bank has a connected party transactions committee which is responsible for considering all matters concerning connected party transactions to be entered into by Industrial Bank as required by the laws of mainland China. All members of Industrial Bank’s connected party transactions committee are independent non-executive Directors.
The Board of the Bank includes eight independent non-executive Directors whose views carry significant weight in the Board’s decisions. The Audit Committee of the Bank, which consists of three independent non-executive Directors, meets regularly to assist the Board of Directors in reviewing the financial performance, internal control and compliance systems of the Bank and its subsidiaries. The Bank is, therefore, capable of carrying on its businesses independently of, and at arm’s length from, the businesses in which Directors have declared interests.
Directors’ EmolumentsThe emoluments of the Directors of the Bank (including executive Directors and independent non-executive Directors) on a named basis are set out on page 116 of the Bank’s financial statements for the year ended 31 December 2006.
Substantial Interests In Share CapitalThe register maintained by the Bank pursuant to the SFO recorded that, as at 31 December 2006, the following corporations had interests (as defined in that Ordinance) in the Bank set opposite their respective names:
Name of Corporation
Number of Ordinary Shares of HK$5 each in the Bank
(Percentage of total)
The Hongkong and Shanghai Banking Corporation Limited 1,188,057,371 (62.14%)
HSBC Asia Holdings BV 1,188,057,371 (62.14%)
HSBC Asia Holdings (UK) 1,188,057,371 (62.14%)
HSBC Holdings BV 1,188,057,371 (62.14%)
HSBC Finance (Netherlands) 1,188,057,371 (62.14%)
HSBC Holdings plc 1,188,057,371 (62.14%)

86 HANG SENG BANK
REPORT OF THE DIRECTORS (continued)
Public FloatAs at the date of this report, the Bank has maintained the prescribed public float under the Listing Rules, based on the information that is publicly available to the Bank and within the knowledge of the Directors of the Bank.
Supervisory Policy Manuals On Financial Disclosure By And Corporate Governance Of Locally Incorporated Authorised InstitutionsThe statutory accounts of the Bank for the year ended31 December 2006 fully comply with the module on “Financial Disclosure by Locally Incorporated Authorised Institutions” under the Supervisory Policy Manual issued by the Hong Kong Monetary Authority (“HKMA”) in November 2002. The Bank also follows the module on “Corporate Governance of Locally Incorporated Authorised Institutions” under the Supervisory Policy Manual issued by the HKMA in September 2001. Details of the Bank’s corporate governance practices are set out in the “Corporate Governance and Other Information” section under its 2006 Annual Report.
AuditorsKPMG retire and, being eligible, offer themselves for re-appointment. A resolution for the re-appointment of KPMG as auditors of the Bank is to be proposed at the forthcoming Annual General Meeting.
On behalf of the Board
Michael SmithChairmanHong Kong, 5 March 2007
The Hongkong and Shanghai Banking Corporation Limited is a subsidiary of HSBC Asia Holdings BV, which is a wholly-owned subsidiary of HSBC Asia Holdings (UK), which in turn is a wholly-owned subsidiary of HSBC Holdings BV. HSBC Holdings BV is a wholly-owned subsidiary of HSBC Finance (Netherlands), which in turn is wholly-owned by HSBC Holdings plc. Accordingly, The Hongkong and Shanghai Banking Corporation Limited’s interests are recorded as the interests of HSBC Asia Holdings BV, HSBC Asia Holdings (UK), HSBC Holdings BV, HSBC Finance (Netherlands) and HSBC Holdings plc.
The Directors regard HSBC Holdings plc to be the beneficial owner of 1,188,057,371 ordinary shares in the Bank (62.14%).
All the interests stated above represent long positions. As at 31 December 2006, no short positions were recorded in the Register of Interests in Shares and Short Positions required to be kept under section 336 of the SFO.
CapitalIn 2006, the Bank issued floating-rate subordinated notes amounting to US$450 million that mature in July 2016 with a one-time call option exercisable by the Bank in July 2011. The notes, listed on the Stock Exchange, were issued to strengthen the Bank’s capital base and support business growth in both Hong Kong and mainland China as part of the Bank’s strategy for continuing to increase shareholder value.
Purchase, Sale Or Redemption Of The Bank’s Listed SecuritiesSave for the issuance of subordinated notes ofUS$450 million, during the year, there was no purchase, sale or redemption by the Bank, or any of its subsidiaries, of the Bank’s listed securities.

87ANNUAL REPORT 2006
2006FINANCIALSTATEMENTS
88 HANG SENG BANK
CONTENTS
89 Consolidated Income Statement
90 Consolidated Balance Sheet
91 Balance Sheet
92 Consolidated Statement of Recognised Income And Expense
93 Consolidated Cash Flow Statement
94 Notes To The Financial Statements
1 Basis of preparation
2 Nature of business
3 Principal accounting policies
4 Changes in accounting policies
5 Accounting estimates and judgements
6 Possible impact of amendments, new standards and interpretations issued but not yet effective for the year ended 31 December 2006
7 Interest income/interest expense
8 Net fee income
9 Trading income
10 Net income/(expense) from financial instruments designated at fair value
11 Dividend income
12 Net earned insurance premiums
13 Other operating income
14 Net insurance claims incurred and movement in policyholders’ liabilities
15 Loan impairment charges and other credit risk provisions
16 Operating expenses
17 The emoluments of the five highest paid individuals
18 Directors’ emoluments
19 Auditors’ remuneration
20 Profit on disposal of fixed assets and financial investments
21 Net surplus on property revaluation
22 Tax expense
23 Profit attributable to shareholders
24 Earnings per share
25 Dividends per share
26 Segmental analysis
27 Analysis of assets and liabilities by remaining maturity
28 Accounting classifications
29 Cash and balances with banks and other financial institutions
30 Placings with and advances to banks and other financial institutions
31 Trading assets
32 Financial assets designated at fair value
33 Advances to customers
34 Financial investments
35 Investments in subsidiaries
36 Investments in associates
37 Investment properties
38 Premises, plant and equipment
39 Interest in leasehold land held for own use under operating lease
40 Intangible assets
41 Other assets
42 Current, savings and other deposit accounts
43 Trading liabilities
44 Financial liabilities designated at fair value
45 Certificates of deposit and other debt securities in issue
46 Other liabilities
47 Liabilities to customers under insurance contracts
48 Deferred tax and current tax liabilities
49 Subordinated liabilities
50 Share capital
51 Reserves
52 Capital adequacy ratios
53 Reconciliation of cash flow statement
54 Contingent liabilities, commitments and derivatives
55 Assets pledged as securityfor liabilities
56 Capital commitments
57 Lease commitments
58 Employee retirement benefits
59 Share-based payments
60 Material related-party transactions
61 Financial risk management
62 Use of derivatives
63 Fair value of financial instruments
64 Cross-border claims
65 Comparative figures
66 Non-adjusting post balancesheet event
67 Parent and ultimate holding company
68 Approval of financial statements
197 Independent Auditor’s Report
198 Analysis Of Shareholders
199 Subsidiaries
200 Corporate Information And Calendar
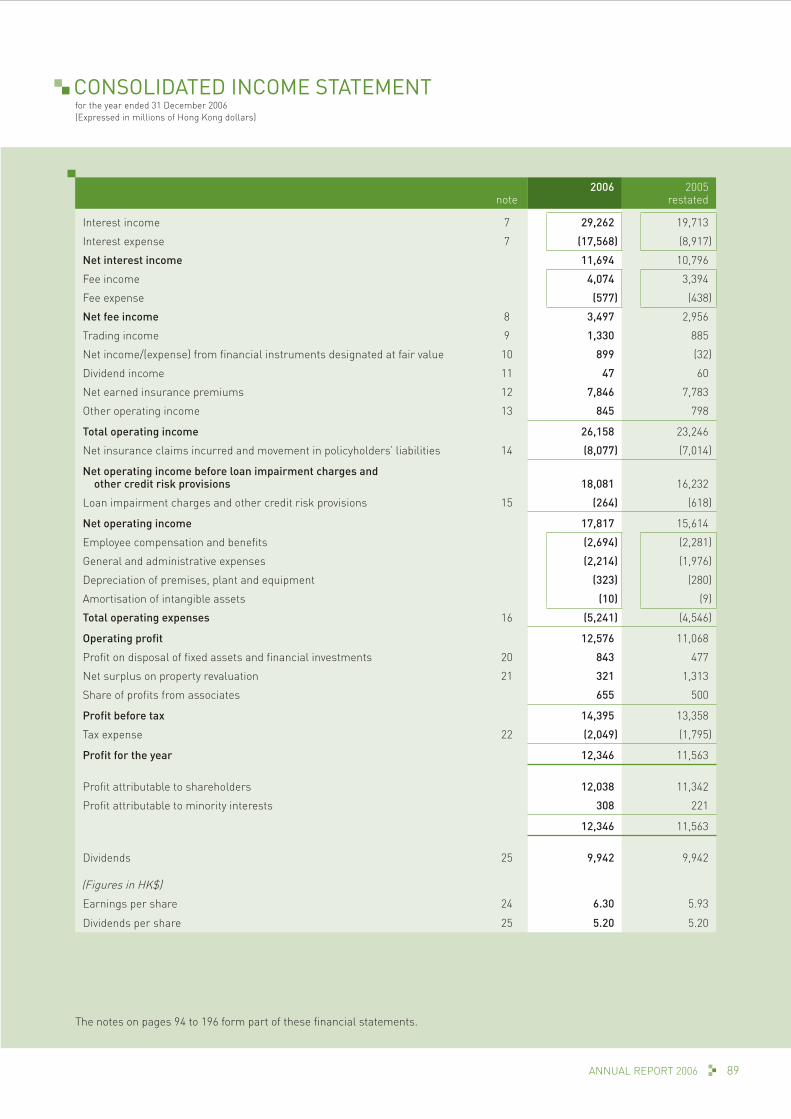
89ANNUAL REPORT 2006
for the year ended 31 December 2006(Expressed in millions of Hong Kong dollars)
CONSOLIDATED INCOME STATEMENT
note2006 2005
restated
Interest income 7 29,262 19,713
Interest expense 7 (17,568) (8,917)
Net interest income 11,694 10,796
Fee income 4,074 3,394
Fee expense (577) (438)
Net fee income 8 3,497 2,956
Trading income 9 1,330 885
Net income/(expense) from financial instruments designated at fair value 10 899 (32)
Dividend income 11 47 60
Net earned insurance premiums 12 7,846 7,783
Other operating income 13 845 798
Total operating income 26,158 23,246
Net insurance claims incurred and movement in policyholders’ liabilities 14 (8,077) (7,014)
Net operating income before loan impairment charges and other credit risk provisions 18,081 16,232
Loan impairment charges and other credit risk provisions 15 (264) (618)
Net operating income 17,817 15,614
Employee compensation and benefits (2,694) (2,281)
General and administrative expenses (2,214) (1,976)
Depreciation of premises, plant and equipment (323) (280)
Amortisation of intangible assets (10) (9)
Total operating expenses 16 (5,241) (4,546)
Operating profit 12,576 11,068
Profit on disposal of fixed assets and financial investments 20 843 477
Net surplus on property revaluation 21 321 1,313
Share of profits from associates 655 500
Profit before tax 14,395 13,358
Tax expense 22 (2,049) (1,795)
Profit for the year 12,346 11,563
Profit attributable to shareholders 12,038 11,342
Profit attributable to minority interests 308 221
12,346 11,563
Dividends 25 9,942 9,942
(Figures in HK$)
Earnings per share 24 6.30 5.93
Dividends per share 25 5.20 5.20
The notes on pages 94 to 196 form part of these financial statements.
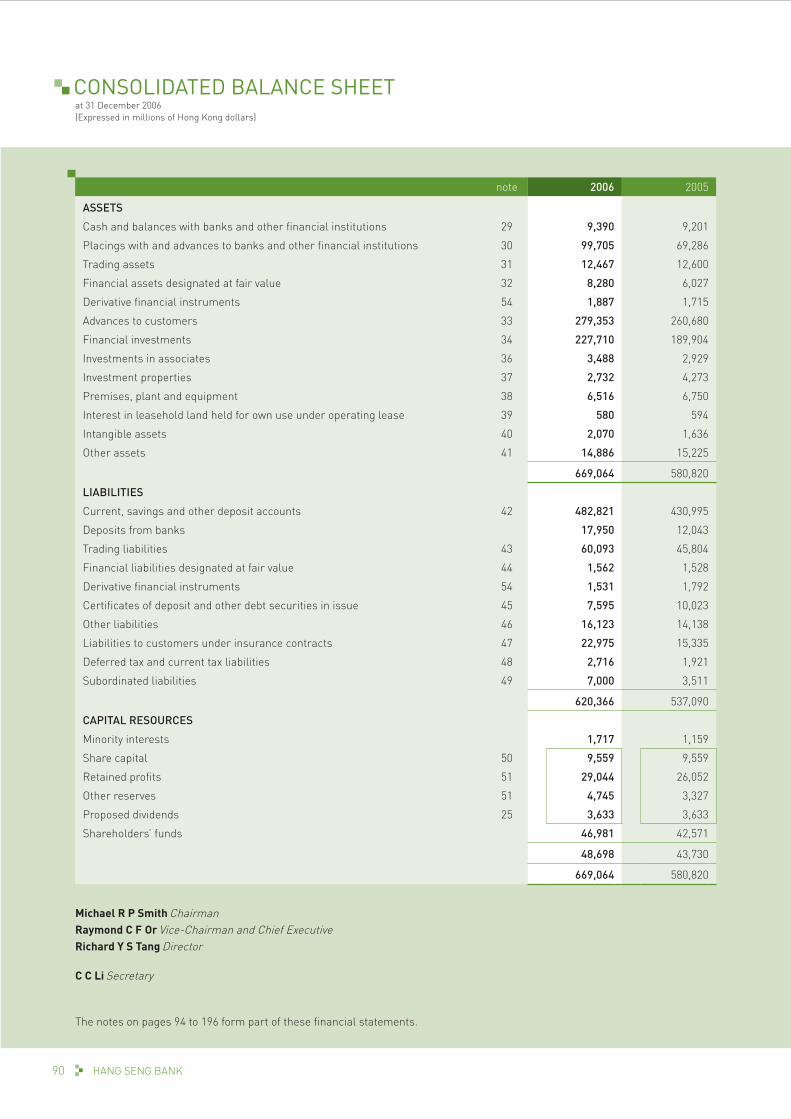
HANG SENG BANK90
at 31 December 2006(Expressed in millions of Hong Kong dollars)
CONSOLIDATED BALANCE SHEET
note 2006 2005
ASSETS
Cash and balances with banks and other financial institutions 29 9,390 9,201
Placings with and advances to banks and other financial institutions 30 99,705 69,286
Trading assets 31 12,467 12,600
Financial assets designated at fair value 32 8,280 6,027
Derivative financial instruments 54 1,887 1,715
Advances to customers 33 279,353 260,680
Financial investments 34 227,710 189,904
Investments in associates 36 3,488 2,929
Investment properties 37 2,732 4,273
Premises, plant and equipment 38 6,516 6,750
Interest in leasehold land held for own use under operating lease 39 580 594
Intangible assets 40 2,070 1,636
Other assets 41 14,886 15,225
669,064 580,820
LIABILITIES
Current, savings and other deposit accounts 42 482,821 430,995
Deposits from banks 17,950 12,043
Trading liabilities 43 60,093 45,804
Financial liabilities designated at fair value 44 1,562 1,528
Derivative financial instruments 54 1,531 1,792
Certificates of deposit and other debt securities in issue 45 7,595 10,023
Other liabilities 46 16,123 14,138
Liabilities to customers under insurance contracts 47 22,975 15,335
Deferred tax and current tax liabilities 48 2,716 1,921
Subordinated liabilities 49 7,000 3,511
620,366 537,090
CAPITAL RESOURCES
Minority interests 1,717 1,159
Share capital 50 9,559 9,559
Retained profits 51 29,044 26,052
Other reserves 51 4,745 3,327
Proposed dividends 25 3,633 3,633
Shareholders’ funds 46,981 42,571
48,698 43,730
669,064 580,820
Michael R P Smith ChairmanRaymond C F Or Vice-Chairman and Chief ExecutiveRichard Y S Tang Director
C C Li Secretary
The notes on pages 94 to 196 form part of these financial statements.

91ANNUAL REPORT 2006
at 31 December 2006(Expressed in millions of Hong Kong dollars)
BALANCE SHEET
note 2006 2005
ASSETS
Cash and balances with banks and other financial institutions 29 9,360 9,173
Placings with and advances to banks and other financial institutions 30 80,679 46,520
Trading assets 31 10,778 9,153
Financial assets designated at fair value 32 1,595 1,647
Derivative financial instruments 54 1,787 1,623
Advances to customers 33 244,235 215,110
Amounts due from subsidiaries 92,601 93,261
Financial investments 34 162,422 142,120
Investments in subsidiaries 35 2,357 2,104
Investments in associates 36 1,634 1,634
Investment properties 37 1,557 2,644
Premises, plant and equipment 38 4,219 4,798
Interest in leasehold land held for own use under operating lease 39 580 594
Intangible assets 40 143 71
Other assets 41 13,456 13,836
627,403 544,288
LIABILITIES
Current, savings and other deposit accounts 42 478,712 421,518
Deposits from banks 17,680 12,043
Trading liabilities 43 60,093 45,804
Financial liabilities designated at fair value 44 987 967
Derivative financial instruments 54 1,520 1,771
Certificates of deposit and other debt securities in issue 45 7,623 10,060
Amounts due to subsidiaries 1,720 1,433
Other liabilities 46 17,051 15,112
Deferred tax and current tax liabilities 48 1,998 1,303
Subordinated liabilities 49 7,000 3,511
594,384 513,522
CAPITAL RESOURCES
Share capital 50 9,559 9,559
Retained profits 51 17,281 15,562
Other reserves 51 2,546 2,012
Proposed dividends 25 3,633 3,633
Shareholders’ funds 33,019 30,766
627,403 544,288
Michael R P Smith ChairmanRaymond C F Or Vice-Chairman and Chief ExecutiveRichard Y S Tang Director
C C Li Secretary
The notes on pages 94 to 196 form part of these financial statements.

HANG SENG BANK92
for the year ended 31 December 2006(Expressed in millions of Hong Kong dollars)
CONSOLIDATED STATEMENT OF RECOGNISED INCOMEAND EXPENSE
2006 2005
Unrealised surplus on revaluation of premises, net of tax 519 863
Tax on realisation of revaluation surplus on disposal of premises 106 9
Available-for-sale investments reserve, net of tax:
– fair value changes taken to equity 1,232 (1,237)
– fair value changes transferred to income statement
– on impairment 12 –
– on hedged items 21 249
– on disposal (325) (487)
Cash flow hedges reserve, net of tax:
– fair value changes taken to equity (179) (524)
– fair value changes transferred to income statement 442 32
Actuarial gains on defined benefit plans, net of tax 218 158
Exchange differences on translation of financial statements of overseas branches, subsidiaries and associates 184 50
Net income/(expense) recognised directly in equity 2,230 (887)
Profit for the year 12,346 11,563
Total recognised income and expense for the year 14,576 10,676
Attributable to shareholders 14,268 10,455
Attributable to minority interests 308 221
14,576 10,676

93ANNUAL REPORT 2006
for the year ended 31 December 2006(Expressed in millions of Hong Kong dollars)
CONSOLIDATED CASH FLOW STATEMENT
note 2006 2005
Net cash inflow from operating activities 53(a) 53,541 26,840
Cash flows from investing activities
Dividends received from associates 33 75
Purchase of available-for-sale investments (101,258) (48,780)
Purchase of held-to-maturity debt securities (351) (190)
Proceeds from sale or redemption of available-for-sale investments 69,279 21,888
Proceeds from sale or redemption of held-to-maturity debt securities 38 33
Purchase of fixed assets and intangible assets (379) (167)
Proceeds from sale of fixed assets and assets held for sale 3,130 186
Interest received from available-for-sale investments 6,557 4,495
Dividends received from available-for-sale investments 45 58
Net cash outflow from investing activities (22,906) (22,402)
Cash flows from financing activities
Dividends paid (9,942) (9,942)
Interest paid for subordinated liabilities (332) (58)
Proceeds from subordinated liabilities 3,489 4,478
Net cash outflow from financing activities (6,785) (5,522)
Increase/(decrease) in cash and cash equivalents 23,850 (1,084)
Cash and cash equivalents at 1 January 65,513 67,051
Effect of foreign exchange rate changes 912 (454)
Cash and cash equivalents at 31 December 53(b) 90,275 65,513
The notes on pages 94 to 196 form part of these financial statements.

for the year ended 31 December 2006(Figures expressed in millions of Hong Kong dollars unless otherwise indicated)
NOTES TO THE FINANCIAL STATEMENTS
HANG SENG BANK94
1 Basis Of Preparation(a) The consolidated financial statements comprise the statements of Hang Seng Bank Limited (“the Bank”) and all its subsidiaries made up to 31 December. The consolidated financial statements include the attributable share of the results and reserves of associates, based on the financial statements made up to dates not earlier than three months prior to 31 December. All significant intra-group transactions have been eliminated on consolidation. The Bank and its subsidiaries and associates are collectively referred as “the Group”.
(b) These financial statements have been prepared in accordance with all applicable Hong Kong Financial Reporting Standards (HKFRSs), which is a collective term that includes all applicable individual Hong Kong Financial Reporting Standards, Hong Kong Accounting Standards (HKASs), and interpretations (Ints) issued by the Hong Kong Institute of Certified Public Accountants (HKICPA), accounting principles generally accepted in Hong Kong and the requirements of the Hong Kong Companies Ordinance. These financial statements also comply with the module on “Financial Disclosure by Locally Incorporated Authorised Institutions” under the Supervisory Policy Manual and the supplemental guidance issued by the Hong Kong Monetary Authority. In addition, these financial statements comply with the applicable disclosure provisions of the Rules Governing the Listing of Securities on The Stock Exchange of Hong Kong Limited. A summary of the principal accounting policies adopted by the Group is set out in note 3.
The HKICPA has issued certain new and revised HKFRSs that are first effective or available for early adoption for the current accounting period of the Group and the Bank. Note 4 provides information on the changes in accounting policies resulting from initial application of these developments to the extent that they are relevant to the Group for the current and prior accounting periods reflected in these financial statements.
(c) The measurement basis used in the preparation of the financial statements is historical cost except that the following assets and liabilities are stated at fair value as explained in the accounting policies set out below:
– financial instruments classified as trading, designated at fair value and available-for-sale (see note 3(g));
– investment property (see note 3(r));
– other leasehold land and buildings, for which the fair values cannot be allocated reliably between the land and buildings elements at the inception of the lease and the entire lease is therefore classified as a finance lease (see note 3(s));
– buildings held for own use which are situated on leasehold land, where the fair value of the building could be measured separately from the fair value of the leasehold interest in the land at the inception of the lease (see note 3(s)); and
– liabilities for share-based payment arrangements (see note 3(y)).
(d) The preparation of financial statements in conformity with HKFRSs requires management to make judgements, estimates and assumptions that affect the application of policies and reported amounts of assets and liabilities, income and expenses. The estimates and associated assumptions are based on historical experience and various other factors that are believed to be reasonable under the circumstances, the results of which form the basis of making the judgements about carrying values of assets and liabilities that are not readily apparent from other sources. Actual results may differ from these estimates. In this regard, management believes that the critical accounting policies where judgement is necessarily applied are those which relate to goodwill impairment, loan impairment, valuation of financial instruments, and estimated employee retirement benefit costs of defined benefit schemes. The Group believes that the assumptions that have been made are appropriate and that the financial statements therefore present the financial position and results fairly, in all material respects.
The estimates and underlying assumptions are reviewed on an ongoing basis. Revisions to accounting estimates are recognised in the period in which the estimate is revised if the revision affects only that period, or in the period of the revision and future periods if the revision affects both current and future periods.
Judgements made by management in the application of HKFRSs that have significant effect on the financial statements and estimates with a significant risk of material adjustment in next year are discussed in note 5.
2 Nature Of BusinessThe Group is engaged primarily in the provision of banking and related financial services.

95ANNUAL REPORT 2006
3 Principal Accounting Policies(a) Interest income and expenseInterest income and expense for all interest-bearing financial instruments are recognised in “Interest income” and “Interest expense” respectively in the income statement using the effective interest rates of the financial assets or financial liabilities to which they relate.
The effective interest rate is the rate that exactly discounts estimated future cash payments or receipts through the expected life of the financial asset or financial liability or, where appropriate, a shorter period, to the net carrying amount of the financial asset or financial liability. When calculating the effective interest rate, the Group estimates cash flows considering all contractual terms of the financial instrument but not future credit losses. The calculation includes all amounts paid or received by the Group that are an integral part of the effective interest rate, including transaction costs and all other premiums or discounts.
For impaired loans, the accrual of interest income based on the original terms of the loan is discounted to arrive at the net present value of impaired loans. Subsequent increase of such net present value of impaired loans due to the passage of time is recognised as interest income.
(b) Non-interest income(i) Fee incomeThe Group earns fee income from a diverse range of services it provides to its customers. Fee income is accounted for as follows:
– if the income is earned on the execution of a significant act, it is recognised as revenue when the significant act has been completed (for example, fees arising from negotiating, or participating in the negotiation of, a transaction for a third party, such as the arrangement for the acquisition of shares or other securities);
– if the income is earned as services are provided, it is recognised as revenue as the services are provided (for example, asset management, portfolio and other management advisory and service fees); and
– if the income is an integral part of the effective interest rate of a financial instrument, it is recognised as an adjustment to the effective interest rate (for example, loan commitment fees) and reported in “Interest income” (see note 3(a)).
(ii) Rental income from operating leaseRental income received under an operating lease is recognised in “Other operating income” in equal instalments over the accounting periods covered by the lease term. Lease incentives granted are recognised in the income statement as an integral part of the aggregate net lease payments receivable. Contingent rentals receivable are recognised as income in the accounting period in which they are earned.
(iii) Dividend incomeDividend income is recognised when the right to receive payment is established. This is the ex-dividend date for equity securities.
(iv) Trading incomeTrading income comprises all gains and losses from changes in the fair value of financial assets and financial liabilities held for trading and dividend income from equities held for trading. Gains or losses arising from changes in fair value of derivatives are recognised in “Trading income” to the extent as described in the accounting policy set out in notes 3(h) and (i). Gains and losses on foreign exchange trading and other transactions are also reported as “Trading income” except for those gains and losses on translation of foreign currencies recognised in foreign exchange reserve in accordance with the accounting policy set out in note 3(z).
(v) Net income from financial instruments designated at fair valueNet income from financial instruments designated at fair value comprises all gains and losses from changes in the fair value of financial assets/liabilities designated at fair value and dividends arising on those financial instruments and the changes in fair value of the derivatives managed in conjunction with the financial assets and liabilities designated at fair value.
(c) Segment ReportingSegmental information is presented in respect of business and geographical segments. Business by customer group information, which is more relevant to the Group in making operating and financial decisions, is chosen as the primary reporting format.
NOTES TO THE FINANCIAL STATEMENTS (continued)
HANG SENG BANK96
3 Principal Accounting Policies (continued)(d) Cash and cash equivalentsFor the purpose of the cash flow statement, cash and cash equivalents include highly liquid investments that are readily convertible into known amounts of cash and which are subject to an insignificant risk of change in value. Such investments are normally those with less than three months’ maturity from the date of acquisition. Cash and cash equivalents include cash and balances at central banks, treasury bills and other eligible bills, loans and advances to banks, and certificates of deposit.
(e) Loans and advances to banks and customersLoans and advances to banks and customers include loans and advances originated or acquired by the Group, which have not been classified either as held for trading or designated at fair value. Loans and advances are recognised when cash is advanced to borrowers. They are initially recorded at fair value plus any directly attributable transaction costs and are subsequently measured at amortised cost using the effective interest rate method, less impairment allowances.
(f) Loan impairmentThe Group will recognise losses for impaired loans promptly where there is objective evidence that impairment of a loan or portfolio of loans has occurred. Impairment allowances are assessed either individually for individually significant loans or collectively for loan portfolios with similar credit risk characteristics.
(i) Individually assessed loansAt each balance sheet date, the Group assesses on a case-by-case basis whether there is any objective evidence that a loan is impaired. This procedure is applied to all accounts that are considered individually significant. In determining impairment losses on individually assessed loans, the following factors are considered:
– the Group’s aggregate exposure to the borrower;
– the viability of the borrower’s business model and capability to trade successfully out of financial difficulties and generate cash flow to service their debt obligations;
– the amount and timing of expected receipts and recoveries;
– the likely dividend available on liquidation or bankruptcy;
– the extent of other creditors’ commitments ranking ahead of, or pari passu with, the Group and the likelihood of other creditors continuing to support the borrower;
– the complexity of determining the aggregate amount and ranking of all creditor claims and the extent to which legal and insurance uncertainties are evident;
– the realisable value of collateral (or other credit mitigants) and likelihood of successful repossession;
– the likely deduction of any costs involved in recovery of amounts outstanding;
– the ability of the borrower to obtain and make payments in the relevant foreign currency if loans are not in local currency; and
– where available, the secondary market price for the debt.
Impairment allowances of an individually assessed loan are measured as the difference between the carrying value and the present value of estimated future cash flows discounted at the original effective interest rate of the individual loan. Any loss is charged in the income statement. The carrying amount of impaired loans on the balance sheet is reduced through the use of an allowance account.
(ii) Collectively assessed loansImpairment allowances are calculated on a collective basis for the following:
– in respect of losses which have been incurred but have not yet been identified as loans subject to individual assessment for impairment (see section (i)); and
– for homogeneous groups of loans that are not considered individually significant.

97ANNUAL REPORT 2006
3 Principal Accounting Policies (continued)(f) Loan impairment (continued)
(ii) Collectively assessed loans (continued)Incurred but not yet identified impairmentWhere loans have been individually assessed and no evidence of loss has been identified individually, these loans are grouped together on the basis of similar credit risk characteristics for the purpose of calculating a collective impairment allowance. This allowance covers loans that are impaired at the balance sheet date but which will not be individually identified as such until some time in the future. The collective impairment allowance is determined after taking into account:
– historical loss experience in portfolios of similar risk characteristics (for example, by industry sector, loan grade or product);
– the estimated period between a loss occurring and that loss being identified and evidenced by the establishment of an allowance against the loss on an individual loan; and
– management’s judgement as to whether the current economic and credit conditions are such that the actual level of inherent losses is likely to be greater or less than that suggested by historical experience.
Homogeneous groups of loansPortfolios of small homogeneous loans are collectively assessed using roll rate or historical loss rate methodologies.
(iii) Loan write-offsLoans (and the related impairment allowance accounts) are normally written off, either partially or in full, when there is no realistic prospect of recovery of these amounts and, for collateralised loans, when the proceeds from the realisation of security have been received.
(iv) Reversals of impairmentIf, in a subsequent period, the amount of an impairment loss decreases and the decrease can be related objectively to an event occurring after the impairment was recognised, the previously recognised impairment loss is reversed to the extent it is now excessive by reducing the loan impairment allowance account. The amount of any reversal is recognised in the income statement.
(v) Repossessed assetsNon-financial assets acquired in exchange for loans in order to achieve an orderly realisation are reported under “Assets held for sale”. The asset acquired is recorded at the lower of its fair value less costs to sell and the carrying amount of the loan, net of impairment allowance amounts, at the date of exchange. No depreciation is provided in respect of assets held for sale. Any subsequent write-down of the acquired asset to fair value less costs to sell is recorded as an impairment loss and included in the income statement. Any subsequent increase in the fair value less costs to sell, to the extent this does not exceed the cumulative impairment loss, is recognised in the income statement.
Financial assets acquired in exchange for loans are classified and reported in accordance with the relevant accounting policies.
(g) Financial instrumentsOther than loans and advances to banks and customers, the Group classifies its financial instruments into the following categories at inception, depending on the purpose for which the assets were acquired or the liabilities were incurred.
(i) Trading assets and trading liabilitiesFinancial instruments and short positions thereof which have been acquired or incurred principally for the purpose of selling or repurchasing in the near term, or are part of a portfolio of identified financial instruments that are managed together and for which there is evidence of a recent actual pattern of short-term profit-taking, are classified as held-for-trading. Trading liabilities also include customer deposits and certificates of deposit with embedded options or other derivatives, the market risk of which was managed in the trading book. Trading assets and liabilities are recognised initially at fair value with transaction costs taken to the income statement, and are subsequently remeasured at fair value. All subsequent gains and losses from changes in the fair value of these assets and liabilities and dividends, are recognised in the income statement within “Trading income” as they arise. Upon disposal or repurchase, the difference between the net sale proceeds or the net payment and the carrying value is included in the income statement.

NOTES TO THE FINANCIAL STATEMENTS (continued)
HANG SENG BANK98
3 Principal Accounting Policies (continued)(g) Financial instruments (continued)
(ii) Financial instruments designated at fair valueA financial instrument is classified in this category if it meets any one of the criteria set out below, and is so designated by management. The Group may designate financial instruments at fair value where the designation:
– eliminates or significantly reduces a measurement or recognition inconsistency that would otherwise arise from measuring financial assets or financial liabilities or recognising the gains and losses on them on different bases. Under this criterion, the main classes of financial instruments designated by the Group are :
Long-term debt issues – The interest payable on certain fixed rate long-term debt securities in issue and subordinated liabilities has been matched with the interest on “receive fixed/pay variable” interest rate swaps as part of a documented interest rate risk management strategy.
Fixed rate bonds and related derivatives for economic hedge – The interest receivable on certain fixed rate bonds has been matched with the interest on “receive variable/pay fixed” interest rate swaps as part of a documented interest rate risk management strategy.
An accounting mismatch would arise if the long-term debt issues and fixed rate bonds were accounted for at amortised cost because the related derivatives are measured at fair value with changes in the fair value taken through the income statement. By designating the long-term debt issues and fixed rate bonds at fair value, their movement in the fair value will be recorded in the income statement.
– applies to a group of financial assets, financial liabilities or both that is managed and its performance evaluated on a fair value basis, in accordance with a documented risk management or investment strategy, and where information about that group of financial instruments is provided internally on that basis to key management personnel. Under this criterion, certain liabilities under investment contracts and financial assets held to meet liabilities under insurance and investment contracts are the main class of financial instrument so designated. The Group has documented risk management and investment strategies designed to manage such assets at fair value, taking into consideration the relationship of assets to liabilities in a way that mitigates market risks. Reports are provided to management on the fair value of the assets. Fair value measurement is also consistent with the regulatory reporting requirements under the appropriate regulations for these insurance operations.
– relates to financial instruments containing one or more embedded derivatives that significantly modify the cash flows resulting from those financial instruments.
Financial assets and financial liabilities so designated are recognised initially at fair value, with transaction costs taken directly to the income statement, and are subsequently remeasured at fair value. This designation, once made, is irrevocable in respect of the financial instruments to which it is made.
Gains and losses from changes in the fair value of such assets and liabilities and dividends are recognised in the income statement as they arise, within “Net income from financial instruments designated at fair value”. This includes the amount of change, during the period and cumulatively, in the fair value of designated financial liabilities and loans and receivables that is attributable to changes in their credit risk, i.e. the amount of change in fair value that is not attributable to changes in market interest rates. Gains and losses arising from changes in the fair value of derivatives that are managed in conjunction with financial assets or financial liabilities designated at fair value are also included in “Net income from financial instruments designated at fair value”.
(iii) Available-for-sale financial assets and held-to-maturity investmentsFinancial instruments intended to be held on a continuing basis are classified as available-for-sale, unless they are designated at fair value (see note 3(g)(ii)) or classified as held-to-maturity.
Available-for-sale financial assets are initially measured at fair value plus direct and incremental transaction costs. They are subsequently remeasured at fair value. Changes in fair value are recognised in equity until the securities are either sold or impaired. On the sale of available-for-sale securities, cumulative gains or losses previously recognised in equity are recognised through the income statement within “Profit and loss on disposal of fixed assets and financial investments”.

99ANNUAL REPORT 2006
3 Principal Accounting Policies (continued)(g) Financial instruments (continued)
(iii) Available-for-sale financial assets and held-to-maturity investments (continued)Held-to-maturity investments are non-derivative financial assets with fixed or determinable payments and fixed maturities that the Group has the positive intention and ability to hold until maturity. Held-to-maturity investments are initially recorded at fair value plus any directly attributable transaction costs, and are subsequently measured at amortised cost using the effective interest rate method, less any impairment allowances.
(h) Derivative financial instruments Derivative financial instruments (“derivatives”) are initially recognised at fair value and carried as assets when the fair value is positive and as liabilities when the fair value is negative.
In the normal course of business, the fair value of a derivative on initial recognition is considered to be the transaction price (i.e. the fair value of the consideration given or received). However, in certain circumstances the fair value of an instrument will be evidenced by comparison with other observable current market transactions in the same instrument (i.e. without modification or repackaging) or based on a valuation technique whose variables include only data from observable markets, including interest rate yield curves, option volatilities and currency rates. When such evidence exists and results in a value which is different from the transaction price, the group recognises a trading profit or loss on inception of the derivative. If observable market data are not available, the initial change in fair value indicated by the valuation model, but based on unobservable inputs, is not recognised immediately in the income statement but is recognised over the life of the transaction on an appropriate basis, or recognised in the income statement when the inputs become observable, or when the transaction matures or is closed out.
Certain derivatives embedded in other financial instruments, such as the conversion option in a convertible bond, are treated as separate derivatives when their economic characteristics and risks are not clearly and closely related to those of the host contract, the terms of the embedded derivatives are the same as those of a stand-alone derivative, and the combined contract is not designated at fair value. These embedded derivatives are measured at fair value with changes in the fair value recognised in “Trading income”.
Derivative assets and liabilities on different transactions are only netted if the transactions are with the same counterparty, a legal right of set-off exists, and the cash flows are intended to be settled on a net basis.
The method of recognising the resulting fair value gains or losses depends on whether the derivative is held for trading, or is designated as a hedging instrument, and if so, the nature of the risk being hedged.
(i) Hedge accountingThe Group designates certain derivatives as either (i) hedges of the change in fair value of recognised assets or liabilities or firm commitments (“fair value hedge”); (ii) hedges of highly probable future cash flows attributable to a recognised asset or liability, or a forecast transaction (“cash flow hedges”). Hedge accounting is applied to derivatives designated as hedging instruments in a fair value or cash flow hedges provided certain criteria are met.
It is the Group’s policy to document, at the inception of a hedging relationship, the relationship between the hedging instruments and hedged items, as well as its risk management objective and strategy for undertaking the hedge. Such policies also require documentation of the assessment, both at hedge inception and on an ongoing basis, of whether the derivatives that are used in hedging transactions are highly effective in offsetting changes in fair values or cash flows of hedged items attributable to the hedged risks.
(i) Fair value hedgeChanges in the fair value of derivatives that are designated and qualified as fair value hedging instruments are recorded in the income statement within “Trading income”, together with changes in the fair value of the asset or liability or group thereof that are attributable to the hedged risk.
If the hedging relationship no longer meets the criteria for hedge accounting, the adjustment to the carrying amount of a hedged item is amortised to the income statement based on a recalculated effective interest rate over the residual period to maturity.
NOTES TO THE FINANCIAL STATEMENTS (continued)
HANG SENG BANK100
3 Principal Accounting Policies (continued)(i) Hedge accounting (continued)
(ii) Cash flow hedgesThe effective portion of changes in the fair value of derivatives that are designated and qualified as cash flow hedges are recognised in equity. Any gain or loss relating to an ineffective portion is recognised immediately in the income statement within “Trading income”.
For cash flow hedges of a recognised asset or liability, the associated cumulative gain or loss is recycled from equity and recognised in the income statement in the same periods during which the hedged cash flow affect profit and loss.
When a hedging instrument expires or is sold, or when a hedge no longer meets the criteria for hedge accounting, any cumulative gain or loss existing in equity at that time remains in equity until the forecast transaction is ultimately recognised in the income statement. When a forecast transaction is no longer expected to occur, the cumulative gain or loss that was reported in equity is immediately transferred to the income statement.
(iii) Hedge effectiveness testingIn order to qualify for hedge accounting, the Group carries out prospective effectiveness testing to demonstrate that it expects the hedge to be highly effective at the inception of the hedge and throughout its life. Actual effectiveness (retrospective effectiveness)
is also demonstrated on an ongoing basis.
The documentation of each hedging relationship sets out how the effectiveness of the hedge is assessed. The method the Group adopts for assessing hedge effectiveness will depend on its risk management strategy.
For fair value hedge relationships, the Group utilises the cumulative dollar offset method as effectiveness testing methodology. For cash flow hedge relationships, the Group utilises the change in variable cash flow method or capacity test or the cumulative dollar offset method using the hypothetical derivative approach.
For prospective effectiveness, the hedging instrument is expected to be highly effective in achieving offsetting changes in fair value or cash flows attributable to the hedged risk during the period for which the hedge is designated. For actual effectiveness, the change in fair value or cash flows must offset each other in the range of 80 per cent to 125 per cent for the hedge to be deemed effective.
All gains and losses from changes in the fair value of any derivatives held for trading and those that do not qualify for hedge accounting are recognised immediately in the income statement and reported in “Trading income”. For derivative contracts which are used with financial instruments designated at fair value, the gains and losses are reported in “Net income from financial instruments designated at fair value”.
(j) Sale and repurchase agreementsWhere securities are sold subject to commitment to repurchase them at a pre-determined price, they remain on the balance sheet and a liability is recorded in respect of the consideration received in “Deposits from banks” where the counterparty is a bank, or in “Current, savings and other deposit accounts” where the counterparty is a non-bank. Conversely, securities purchased under analogous commitments to resell are not recognised on the balance sheet and the consideration paid is recorded in “Placings with and advances to banks and other financial institutions” where the counterparty is a bank, or in “Advance to customers” where the counterparty is a non-bank. The difference between the sale and repurchase price is treated as interest and recognised over the life of the agreement.
(k) Offsetting financial instrumentsFinancial assets and liabilities are offset and the net amount reported in the balance sheet when there is a legally enforceable right to offset the recognised amounts and there is an intention to settle on a net basis, or realise the asset and settle the liability simultaneously.
(l) Application of trade date accounting Except for loans and advances and deposits, all financial assets, liabilities and instruments are accounted for on trade date basis.

101ANNUAL REPORT 2006
3 Principal Accounting Policies (continued)(m) Derecognition of financial assets and liabilitiesFinancial assets are derecognised when the rights to receive cash flows from the assets have expired; or where the Group has transferred its contractual rights to receive the cash flows of the financial assets and has transferred substantially all the risks and rewards of ownership; or where control is not retained. Financial liabilities are derecognised when they are extinguished, i.e. when the obligation is discharged or cancelled or expires.
(n) Determination of fair valueThe fair value of financial instruments is based on their quoted market prices at the balance sheet date, or date close to balance sheet date, without any deduction for estimated future selling costs. Financial assets are priced at current bid prices, while financial liabilities are priced at current asking prices unless the position is immaterial or the bid and offer spread is small. In such case, mid rate will be applied for both long and short positions.
If a quoted market price is not available on a recognised stock exchange or from a broker/dealer for non-exchange-traded financial instruments, the fair value of the instrument is estimated using valuation techniques, including use of recentarm’s-length market transactions, reference to the current fair value of another instrument that is substantially the same, discounted cash flow techniques, option pricing models or any other valuation technique that provides a reliable estimate of prices obtained in actual market transactions.
Where discounted cash flow techniques are used, estimated future cash flows are based on management’s best estimates, and the discount rate used is a market rate at the balance sheet date applicable for an instrument with similar terms and conditions. Where other pricing models are used, inputs are based on market data at the balance sheet date. Fair values for unquoted equity investments are estimated, if possible, using applicable price/earnings ratios for similar listed companies adjusted to reflect the specific circumstances of the issuer.
Investments in other unlisted open-ended investment funds are recorded at the net asset value per share as reported by the managers of such funds.
(o) SubsidiariesA subsidiary is a corporate entity in which the Group, directly or indirectly, holds more than half of the issued share capital or controls more than half of the voting power or controls the composition of the board of directors, or a non-corporate entity the Group otherwise controls, directly or indirectly, by way of having the power to govern its financial and operating policies so that the Group obtains benefits from these activities.
A subsidiary is fully consolidated into the consolidated financial statements from the date that control commences until the date that control ceases.
In the Bank’s balance sheet, an investment in subsidiary is stated at cost less impairment allowances.
(p) AssociatesAn associate is an entity over which the Group or the Bank has the ability to significantly influence, but not control over its management, including participation in the financial and operating policy decision.
An investment in an associate is accounted for in the consolidated financial statements under the equity method and is initially recorded at cost and adjusted thereafter for the post acquisition change in the Group’s share of the associate’s net assets. The consolidated income statement includes the Group’s share of the post-acquisition, post tax results of the associate for the year, together with any impairment loss on goodwill relating to the investment in associate recognised for the year.
Unrealised gains on transactions between the Group and its associate are eliminated to the extent of the Group’s interest in the associate. Unrealised losses are also eliminated to the extent of the Group’s interest in the associate unless the transaction provides evidence of an impairment of the asset transferred.
In the Bank’s balance sheet, investment in associate is stated at cost less impairment allowances.
NOTES TO THE FINANCIAL STATEMENTS (continued)
HANG SENG BANK102
3 Principal Accounting Policies (continued)(q) Goodwill and intangible assets(i) Goodwill arises on business combinations, including the acquisition of subsidiaries or associates when the cost of acquisition exceeds the fair value of the Group’s share of the identifiable assets, liabilities and contingent liabilities acquired and is reported in the consolidated balance sheet. Goodwill on acquisitions of associates is included in “Investments in associates”. Goodwill is stated at cost less any accumulated impairment losses, which are charged to the income statement. Goodwill is allocated to cash-generating units and is tested for impairment annually by comparing the present value of the expected future cash flows from a business with the carrying value of its net assets, including attributable goodwill.
Any excess of the Group’s interest in the fair value of the identifiable assets, liabilities and contingent liabilities of an acquired business over the cost to acquire is recognised immediately in the income statement.
At the date of disposal of a business, attributable goodwill is included in the Group’s share of net assets in the calculation of the gain or loss on disposal.
(ii) Intangible assets include the value of in-force long-term assurance business, acquired software licences and capitalised development costs of computer software programmes. The value of in-force long-term assurance business is stated at a valuation determined annually in consultation with independent actuaries using the methodology as described in note 3(ac). Computer software acquired is stated at cost less amortisation and impairment allowances. Amortisation of computer software is charged to the income statement over its useful life. Costs incurred in the development phase of a project to produce application software for internal use are capitalised and amortised over the software’s estimated useful life, usually five years. A periodic review is performed on intangible assets to confirm that there has been no impairment.
(r) Investment propertyInvestment properties are land and/or buildings which are owned and/or held under a leasehold interest to earn rental income and/or for capital appreciation. These include land held for a currently undetermined future use.
Investment properties are stated in the balance sheet at fair value. Any gain or loss arising from a change in fair value is recognised in the income statement.
(s) Premises, plant and equipment(i) The following properties held for own use are stated in the balance sheet at their revalued amount, being their fair value at the date of the revaluation less any subsequent accumulated depreciation:
– land held under operating leases and buildings thereon, where the fair value of the leasehold interest in the land and buildings cannot be measured separately at the inception of the lease and the building is not clearly held under an operating lease; and
– buildings held for own use which are situated on leasehold land, where the fair value of the building could be measured separately from the fair value of the leasehold interest in the land at the inception of the lease.
Revaluations are performed by professionally qualified valuers with sufficient regularity to ensure that the carrying amount of these assets does not differ materially from that which would be determined using fair value at the balance sheet date.
Surpluses arising on revaluation, are credited firstly to the income statement to the extent of any deficits arising on revaluation previously charged to the income statement in respect of the same property, and are thereafter taken to “Premises revaluation reserve”. Deficits arising on revaluation, are firstly set off against any previous revaluation surpluses included in the “Premises revaluation reserve” in respect of the same property, and are thereafter to the income statement.
Depreciation is calculated to write-off the valuation of the property over their estimated useful lives as follows:
– freehold land is not depreciated;
– leasehold land is depreciated over the unexpired terms of the leases; and
– buildings and improvements thereto are depreciated at the greater of 2 per cent per annum on the straight-line basis or over the unexpired terms of the leases.
103ANNUAL REPORT 2006
3 Principal Accounting Policies (continued)(s) Premises, plant and equipment (continued)On revaluation of the property, depreciation accumulated during the year will be eliminated. Depreciation charged on revaluation surplus of the properties is transferred from “Premises revaluation reserve” to “Retained profits”.
On disposal of the property, the profit and loss is calculated as the difference between the net sales proceeds and the net carrying amount and recognised in the income statement. Surpluses relating to the property disposed of included in the “Premises revaluation reserve” are transferred as movements in reserves to “Retained profits”.
(ii) Furniture, plant and other equipment, is stated at cost less depreciation calculated on the straight-line basis to write off the assets over their estimated useful lives, which are generally between 3 and 10 years. On disposal, the profit and loss is calculated as the difference between the net sales proceeds and the net carrying amount.
Premises, plant and equipment are subject to review for impairment if there are events or changes in circumstances that indicate that the carrying amount may not be recoverable.
(t) Interest in leasehold land held for own use under operating leaseLeasehold interest in the land held for own use is accounted for as being held under an operating lease where the fair value of the interest in any buildings situated on the leasehold land could be measured separately from the fair value of the leasehold interest in land at the time the lease was first entered into by the Group. The interest in leasehold land is stated at cost in the balance sheet and is amortised to the income statement on a straight-line basis over the remaining lease term.
(u) Finance and operating leasesLeases which transfer substantially all the risks and rewards of ownership to the lessees are classified as finance leases. Leases which do not transfer substantially all the risks and rewards of ownership to the lessees are classified as operating leases, with the exceptions of land and building held under a leasehold interest as set out in notes 3(r) & 3(s).
(i) Finance leasesWhere the Group is a lessor under finance leases, an amount representing the net investment in the lease is included in the balance sheet as loans and advances to customers. Hire purchase contracts having the characteristics of a finance lease are accounted for in the same manner as finance leases. Impairment allowances are accounted for in accordance with the accounting policies set out in note 3(f).
Where the Group acquires the use of assets under finance leases, the amount representing the fair value of the leased asset, or, if lower, the present value of the minimum payments of such assets is included in fixed assets and the corresponding liabilities, net of finance charges, are recorded as obligations under finance leases. Depreciation is provided at rates which write off the cost or valuation of the assets over the term of the relevant lease or, where it is likely the Group will obtain ownership of the asset, the life of the asset, as set out in note 3(s). Impairment allowances are accounted for in accordance with the accounting policy as set out in note 3(v). Finance charges implicit in the lease payments are charged to the income statement over the period of the leases so as to produce an approximately constant periodic rate of charge on the remaining balance of the obligations for each accounting period. Contingent rentals are written off as an expense of the accounting period in which they are incurred.
(ii) Operating leasesWhere the Group leases out assets under operating leases, the assets are included in the balance sheet according to their nature and, where applicable. Rental revenue arising from operating lease is recognised in accordance with the Group’s revenue recognition policies as set out in note 3(b)(ii).
(v) Impairment of assetsThe carrying amount of the Group’s assets are reviewed at each balance sheet date to determine whether there is objective evidence of impairment. If any such evidence exists, the carrying amount is reduced to the estimated recoverable amount by means of a charge to the income statement.
The accounting policies on impairment losses on loans and receivables and goodwill are set out in notes 3(f) and 3(q) respectively.
NOTES TO THE FINANCIAL STATEMENTS (continued)
HANG SENG BANK104
3 Principal Accounting Policies (continued)(v) Impairment of assets (continued)
(i) Held-to-maturity investmentsFor held-to-maturity investments, the impairment loss is measured as the difference between the asset’s carrying amount and the present value of estimated future cash flows discounted at the financial asset’s original effective interest rate (i.e. the effective interest rate computed at initial recognition of these assets) on an individual basis.
If in a subsequent period the amount of an impairment loss decreases and the decrease can be linked objectively to an event occurring after the impairment loss was recognised, the impairment loss is reversed through the income statement. The reversal of impairment is limited to the asset’s carrying amount that would have been determined had no impairment loss been recognised in prior years.
(ii) Available-for-sale financial assetsWhen there is objective evidence that an available-for-sale financial asset is impaired, the cumulative loss that had been recognised directly in equity is removed from equity and is recognised in the income statement. The amount of the cumulative loss that is recognised in the income statement is the difference between the acquisition cost (net of any principal repayment and amortisation) and current fair value, less any impairment loss on that asset previously recognised in income statement.
For unquoted available-for-sale equity securities that are carried at cost, the impairment loss is measured as the difference between the carrying amount of the financial asset and the present value of estimated future cash flows discounted at the current market rate of return for a similar financial asset.
Impairment losses in respect of available-for-sale debt securities are reversed if the subsequent increase in fair value can be objectively related to an event occurring after the impairment loss was recognised. Reversals of impairment losses in such circumstances are recognised in the income statement.
Impairment losses recognised in the income statement in respect of available-for-sale equity securities are not reversed through the income statement. Any subsequent increase in the fair value of such assets is recognised directly in equity.
(iii) Other assetsInternal and external sources of information are reviewed at each balance sheet date to identify indications that the following types of assets may be impaired or an impairment loss previously recognised no longer exists or may have decreased:
– premises and equipment (other than properties carried at revalued amounts);
– pre-paid interests in leasehold land classified as “Interest in leasehold land held for own use under operating lease”;
– investments in subsidiaries and associates; and
– intangible assets.
If any such indication exists, the asset’s recoverable amount is estimated and impairment losses recognised.
Calculation of recoverable amountThe recoverable amount of an asset is the greater of its net selling price and value in use. In assessing value in use, the estimated future cash flows are discounted to their present value using a pre-tax discount rate that reflects current market assessments of the time value of money and the risks specific to the assets. Where an asset does not generate cash inflows largely independent of those from other assets, the recoverable amount is determined for the smallest group of assets that generates cash inflows independently (i.e. a cash-generating unit).
Recognition of impairment lossesAn impairment loss is recognised in the income statement whenever the carrying amount of an asset, or the cash-generating unit to which it belongs, exceeds its recoverable amount. Impairment losses recognised in respect of cash-generating units are allocated first to reduce the carrying amount of any goodwill allocated to the cash-generating unit (or group of units) and then, to reduce the carrying amount of the other assets in the unit (or group of units) on a pro rata basis, except that the carrying value of an asset will not be reduced below its individual fair value less costs to sell, or value in use, if determinable.

105ANNUAL REPORT 2006
3 Principal Accounting Policies (continued)(v) Impairment of assets (continued)
(iii) Other assets (continued)
Reversals of impairment lossesIn respect of assets other than goodwill, an impairment loss is reversed if there has been a favourable change in the estimates used to determine the recoverable amount. An impairment loss in respect of goodwill is not reversed.
A reversal of impairment losses is limited to the asset’s carrying amount that would have been determined had no impairment loss been recognised in prior years. Reversals of impairment losses are credited to the income statement in the year in which the reversals are recognised.
(w) Income taxIncome tax for the year comprises current tax and movements in deferred tax assets and liabilities. Current tax and movements in deferred tax assets and liabilities are recognised in the income statement except to the extent that they relate to items recognised directly in equity, in which case they are recognised in equity. Current tax balances and deferred tax balances, and movements therein, are presented separately from each other and are not offset.
Current tax is the expected tax payable on the taxable profits for the year, using tax rates enacted or substantively enacted at the balance sheet date, and any adjustment to tax payable in respect of previous years. Current tax assets and liabilities are settled on an individual taxable entity basis.
Deferred tax assets and liabilities arise from deductible and taxable temporary differences respectively, being the differences between the carrying amounts of assets and liabilities for financial reporting purpose and their tax bases. Deferred tax assets also arise from unused tax losses and unused tax credits.
Deferred tax liabilities are generally recognised for all taxable temporary differences. Deferred tax assets are recognised to the extent that it is probable that taxable profits will be available, against which deductible temporary differences can be utilised.
Deferred tax is calculated using the tax rates that are expected to apply in the periods in which the assets will be realised or the liabilities settled. Deferred tax assets and liabilities are not discounted. Deferred tax assets and liabilities are offset when they arise in the same tax reporting group and relate to income taxes levied by the same taxation authority, and when a legal right to offset exists in the entity.
The carrying amount of deferred tax assets/liabilities is reviewed at each balance sheet date and is reduced to the extent that it is no longer probable that sufficient taxable profit will be available to allow the related tax benefit to be utilised.
(x) Employee benefits(i) Salaries, annual bonuses, paid annual leave, leave passage and the cost to the Group of non-monetary benefits are accrued in the year in which the associated services are rendered by the employees. Provision is made in respect of paid leave entitlement accumulated during the year, which can be carried forward into future periods for compensated absence or payment in lieu if the employee leaves employment.
(ii) The Group provides retirement benefits for staff members and operates defined benefit and defined contribution schemes and participates in mandatory provident fund schemes in accordance with the relevant laws and regulations.
The retirement benefit costs of defined benefit schemes charged to the income statement are determined by calculating the current service cost, interest cost and expected return on scheme assets in accordance with a set of actuarial assumptions. Any actuarial gains and losses are fully recognised in shareholders’ equity and presented in the Statement of Recognised Income and Expense in the period in which they arise.
The Group’s net obligation in respect of defined benefit schemes is calculated separately for each scheme by estimating the amount of future benefit that employees have earned in return for their service in the current and prior years; that benefit is discounted to determine the present value, and the fair value of any scheme assets is deducted. The discount rate is the yield at the balance sheet date on high quality corporate bonds that have maturity dates approximating the terms of the Group’s obligation. The calculation is performed by a qualified actuary using the Projected Unit Credit Method.

NOTES TO THE FINANCIAL STATEMENTS (continued)
HANG SENG BANK106
3 Principal Accounting Policies (continued)(x) Employee benefits (continued)
Where the calculation of the Group’s net obligation results in a negative amount, the asset recognised is limited to the present value of any future refunds from the scheme or reductions in future contributions to the scheme less past service cost.
The retirement benefit costs of defined contribution schemes and mandatory provident fund schemes are the contributions made in accordance with the relative scheme rules and are charged to the income statement of the year.
(y) Equity compensation plansThe Group grants shares and options on shares on HSBC Holdings plc to certain employees under various vesting conditions.
For the grant of shares as discretionary bonuses, the Group has the obligation to acquire HSBC Holdings plc shares to deliver to the employees upon vesting and is expensed over the vesting period which, in this case, is the period from the date the bonus is announced until the award vests. The Group’s liability is measured at fair value at each reporting date. The changes in fair value are recognised as an expense in each period.
For share options granted to employees of the group directly by HSBC Holdings plc, the compensation expense to be spread over the vesting period is determined by reference to the fair value of the options on grant date, and the impact of any non-market vesting conditions such as option lapses. The expense is recognised over the vesting period. As no charge has been made by HSBC Holdings plc for the grants of options, the corresponding amount is credited to “Other reserves” under shareholders’ equity.
(z) Translation of foreign currenciesForeign currency transactions during the year are translated at the foreign exchange rates ruling at the transaction dates. Monetary assets and liabilities denominated in foreign currencies are translated at the foreign exchange rates ruling at the balance sheet date. Exchange gains and losses are recognised in the income statement. Non-monetary assets and liabilities that are measured in terms of historical cost in a foreign currency are translated using the foreign exchange rates ruling at the transaction dates. Non-monetary assets and liabilities denominated in foreign currencies that are stated at fair value are translated using the foreign exchange rates ruling at the dates the fair value was determined.
Exchange differences arising from the re-translation of opening foreign currency net investments and the related cost of hedging, if any, and exchange differences arising from re-translation of the result for the year from the average rate to the exchange rate ruling at the year-end, are accounted for in a separate foreign exchange reserve in equity. Exchange differences on a monetary item that is part of a net investment in a foreign operation are recognised in the income statement of separate subsidiary financial statements. In the consolidated financial statements, these exchange differences are recognised in the foreign exchange reserve.
(aa) ProvisionsProvisions are recognised when it is probable that an outflow of economic benefits will be required to settle a present legal or constructive obligation as a result of past events and a reliable estimate can be made as to the amount of the obligation.
(ab) Financial guarantees Financial guarantees are contracts that require the Group to make specified payments to reimburse the holder for a loss it incurs because a specified debtor fails to make payment when due in accordance with the terms of the loans or debt instrument.
Financial guarantee liabilities are initially recognised at their fair value, and the initial fair value is amortised over the life of the financial guarantee. The guarantee liability is subsequently carried at the higher of this amortised amount and the present value of any expected payment (when a payment under the guarantee has become probable). Financial guarantees are included within other liabilities.
(ac) Insurance contractsThrough its insurance subsidiaries, the Group issues contracts to customers that contain insurance risk, financial risk or a combination thereof. An insurance contract may also transfer financial risk, but is accounted for as an insurance contract if the insurance risk is significant.

107ANNUAL REPORT 2006
3 Principal Accounting Policies (continued)(ac) Insurance contracts (continued)A contract issued by the Group that transfers financial risk, without significant insurance risk, is classified as an investment contract, and is accounted for as a financial instrument. The financial assets held by the Group for the purpose of meeting liabilities under insurance and investment contracts are classified and accounted for based on their classification as set out in notes 3(d) to 3(i).
Insurance contracts are accounted for as follows:
Net earned insurance premiumsGross insurance premiums for general insurance business are accounted for in the period in which the amount is determined, which is generally the period in which the risk commences. The proportion of premiums written in the accounting year relating to the period of risk after the balance sheet date is carried forward as a provision for unearned premium and is calculated on a daily pro rata basis.
Premiums for life assurance are accounted for when receivable, except in unit-linked business where premiums are accounted for when liabilities are recognised.
Reinsurance premiums, netted by the reinsurers’ share of provision for unearned premiums, are accounted for in the same accounting year as the premiums for the direct insurance to which they relate.
Claims and reinsurance recoveriesGross insurance claims for general insurance business include paid claims and movements in outstanding claims reserves. Full provision for outstanding claims is made for the estimated cost of all claims notified but not settled at the balance sheet date, and claims incurred but not reported by that date. Provision is also made for the estimated cost of servicing claims notified but not settled at the balance sheet date, reduced by estimates of salvage and subrogation recoveries, and to meet expenses on claims incurred but not reported. Reinsurance recoveries are assessed in a manner similar to the assessment of provision for outstanding claims.
Gross insurance claims for life assurance reflect the total cost of claims arising during the year, including policyholder cash dividend payment upon policy anniversary. The technical reserves for non-linked liabilities (long-term business provision) are calculated based on actuarial principles. The technical reserves for linked liabilities are at least the element of any surrender or transfer value which is calculated by reference to the relevant fund or funds or index.
Reinsurance recoveries are accounted for in the same period as the related claims.
Deferred acquisition costsThe deferred acquisition costs related to insurance contract, such as initial commission, are amortised over the period in which the related revenues are earned.
Value of long-term insurance businessA value is placed on insurance contracts that are classified as long-term assurance business, and are in force at the balance sheet date.
The value of the in-force long-term assurance business is determined by discounting future earnings expected to emerge from business currently in force, using appropriate assumptions in assessing factors such as future mortality, lapse rates and levels of expenses and a risk discount rate that reflects the risk premium attributable to the respective long-term insurance business. Movements in the value of in-force long-term assurance business are included in other operating income on a pre-tax basis. The value of in-force long-term insurance business is reported under “Intangible assets” in the balance sheet.
(ad) Investment contractsCustomer liabilities under unit-linked investment contracts are measured at fair value and reported under “Financial liabilities designated at fair value”. The linked financial assets are measured at fair value and the movements in fair value are recognised in the income statement in “Net income from financial instruments designated at fair value”.

NOTES TO THE FINANCIAL STATEMENTS (continued)
HANG SENG BANK108
3 Principal Accounting Policies (continued)(ad) Investment contracts (continued)
Premiums receivable and amounts withdrawn are accounted for as increases or decreases in the liability recorded in respect of investment contracts.
Investment management fee receivables are recognised in the income statement over the period of the provision of the investment management services.
The incremental costs directly related to the acquisition of new investment contracts or renewing existing investment contracts are capitalised and amortised over the period the investment management services are provided.
(ae) Debt securities in issue and subordinated liabilitiesDebt securities in issue and subordinated liabilities are measured at amortised cost using the effective interest rate method, and are reported under “Debt securities in issue” or “Subordinated liabilities”, except for those issued for trading or designated at fair value, which are carried at fair value and reported under the “Trading liabilities” and “Financial liabilities designated at fair value” in the balance sheet.
(af) Related partiesFor the purposes of these financial statements, parties are considered to be related to the Group if the Group has the ability, directly or indirectly, to control the party or exercise significant influence over the party in making financial and operating decisions, or vice versa, or where the Group and the party are subject to common control or common significant influence. Related parties may be individuals (being members of key management personnel, significant shareholders and/or their close family members) or other entities which are under the significant influence of related parties of the Group and post employment benefit scheme. Key management personnel are those persons having authority and responsibility for planning, directing and controlling the activities of the Bank and its holding companies, directly or indirectly, including any directors (whether executive or otherwise) and Executive Committee members of the Bank and its holding companies.
4 Changes In Accounting PoliciesThe Group has made the following changes in accounting policies in accordance with existing HKFRSs and on adoption of new HKFRSs issued by the HKICPA which became effective or available for early adoption for the current accounting period.
Change in presentation – Hong Kong Accounting Standard 1 “Presentation of Financial Statements”
With effect from 2006 reporting, interest income and expense from trading financial assets and liabilities and financial instruments designated at fair value are reported under “Net interest income” instead of “Net trading income” and “Net income from financial instruments designated at fair value” respectively as in the previous year. The change has been made principally to match the interest expense arising from trading liabilities with the interest income from non-trading assets. This also facilitates the comparison of the Group’s net interest income and net interest margin with peer banks in Hong Kong.
Comparative figures have been reclassified to conform with the current year’s presentation as follows:
Figures in HK$m
2005(as previously
reported)Effect of change*
2005(as restated)
Interest income 19,029 684 19,713
Interest expense (7,961) (956) (8,917)
Net interest income 11,068 (272) 10,796
Trading income 579 306 885
Net income/(expense) from financial instruments designated at fair value 2 (34) (32)
* Increase/(decrease) in the profit for the year.

109ANNUAL REPORT 2006
4 Changes In Accounting Policies (continued)For HSBC Group reporting, interest income and interest expense arising from financial assets and financial liabilities held for trading are reported as “Net trading income” and arising from financial instruments designated at fair value through profit and loss as “Net income from financial instruments designated at fair value” (other than for debt securities in issue and subordinated liabilities, together with the derivatives managed in conjunction with them).
Amendments to Hong Kong Accounting Standard 39 (“HKAS 39”) and Hong Kong Financial Reporting Standard 4 “Financial Instruments: Recognition and Measurement and Insurance Contracts – Financial Guarantee Contracts”
In prior years, financial guarantee contracts were accounted for under HKAS 37 “Provisions, Contingent Liabilities and Contingent Assets” as contingent liabilities and were disclosed as off-balance sheet items.
With effect from 1 January 2006 and in accordance with the above amendments, financial guarantee contracts issued are recognised as financial liabilities and reported under “Other liabilities”. Details of the accounting policy on “Financial guarantees” is set out in note 3(ab) above.
Financial liabilities recorded under “Other liabilities” at 31 December 2006 amounted to HK$4 million. No restatement of comparative figures was made as the amounts were immaterial.
Hong Kong Financial Reporting Standard 7 (“HKFRS 7”) “Financial Instruments: Disclosures”
The Group has adopted HKFRS 7 prior to its required application date of 1 January 2007. The adoption of HKFRS 7 impacted the type and amount of disclosures made in the financial statements, but had no impact on the reported profits or financial position of the Group. In accordance with the transitional requirements of HKFRS 7, the Group has provided full comparative information.
5 Accounting Estimates And JudgementsKey sources of estimation uncertainty and critical judgements in applying the Group’s accounting policies which have significant effect on the financial statements are set out below.
(a) Key sources of estimation uncertaintyImpairment allowances on loans and advancesThe Group periodically reviews its loan portfolios to assess whether impairment allowances exist. In determining whether impairment allowances should be recorded in the income statement, the Group makes judgements as to whether there is any observable data indicating that there is a measurable decrease in the estimated future cash flows from a portfolio of loans before the decrease can be identified with an individual loan in that portfolio. This evidence may include observable data indicating that there has been an adverse change in the payment status of borrowers in a group, or national or local economic conditions that correlate with defaults on assets in the group. Management uses estimates based on historical loss experience for assets with credit risk characteristics and objective evidence of impairment similar to those in the portfolio when scheduling its future cash flows. The methodology and assumptions used for estimating both the amount and timing of future cash flows are reviewed regularly to reduce any differences between loss estimates and actual loss experience.
(b) Critical accounting judgements in applying the Group’s accounting policies(i) Impairment of available-for-sale financial assetsFor available-for-sale financial assets, a significant or prolonged decline in fair value below cost is considered to be objective evidence of impairment. Judgement is required when determining whether a decline in fair value has been significant or prolonged. In making this judgement, the historical data on market volatility as well as the price of the specific investment are taken into account. The Group also takes into account other factors, such as industry and sector performance and financial information regarding the issuer/investee.
(ii) Held-to-maturity investmentsNon-derivative financial assets with fixed or determinable payments and fixed maturity are classified as held-to-maturity investments if the Group has the intention and ability to hold them until maturity. In evaluating whether the requirements to classify a financial asset as held-to-maturity are met, management make significant judgements. Failure in correctly assessing the Group’s intention and ability to hold specific investments until maturity may result in reclassification of the whole portfolio as available-for-sale.
NOTES TO THE FINANCIAL STATEMENTS (continued)
HANG SENG BANK110
5 Accounting Estimates And Judgements (continued)(b) Critical accounting judgements in applying the Group’s accounting policies (continued)
(iii) Income taxesDetermining income tax provisions involves judgement on the future tax treatment of certain transactions. The Group carefully evaluates tax implications of transactions and tax provisions are set up accordingly. The tax treatment of such transactions is reconsidered periodically to take into account all changes in tax legislations.
6. Possible Impact Of Amendments, New Standards And Interpretations Issued But Not Yet Effective For The Year Ended 31 December 2006The HKICPA has issued an amendment to HKAS 1 “Presentation of financial statements: capital disclosures” and the Hong Kong Monetary Authority has recommended additional disclosures which are not yet effective for the accounting year ended 31 December 2006. The Group has not adopted these changes in the financial statements.
7 Interest Income/Interest Expense(a) Interest income
2006 2005restated
Interest income arising from:
– financial assets that are not at fair value through profit and loss 28,639 19,029
– trading assets 529 623
– financial assets designated at fair value 94 61
29,262 19,713
of which:
– interest income from listed investments 326 246
– interest income from unlisted investments 9,851 6,772
– interest income from impaired financial assets 26 20
(b) Interest expense
2006 2005restated
Interest expense arising from:
– financial liabilities that are not at fair value through profit and loss 14,950 7,961
– trading liabilities 2,568 929
– financial liabilities designated at fair value 50 27
17,568 8,917
of which:
– interest expense from debt securities in issue maturing after five years 62 126
– interest expense from customer accounts maturing after five years 31 17
– interest expense from subordinated liabilities 332 58
With effect from 2006 (and as restated for 2005), interest income and interest expense for all interest-bearing financial instruments are reported in “Interest income” and “Interest expense” respectively in the income statement. The change from the HSBC Group presentation described below has been made principally to match the interest expense arising from trading liabilities with the interest income from non-trading assets. This facilitates the comparison of the Group’s net interest income and net interest margin with peer banks in Hong Kong.
111ANNUAL REPORT 2006
7 Interest Income/Interest Expense (continued)(b) Interest expense (continued)
The HSBC Group reports interest income and interest expense arising from financial assets and financial liabilities held for trading as “Net trading income” and arising from financial instruments designated at fair value through profit and loss as “Net income from financial instruments designated at fair value” (other than for debt securities in issue and subordinated liabilities, together with derivatives managed in conjunction with them).
8 Net Fee Income
2006 2005restated
– stockbroking and related services 805 493
– retail investment products and funds under management 891 916
– insurance 108 116
– account services 274 225
– private banking 336 174
– remittances 161 141
– cards 860 705
– credit facilities 111 117
– trade services 380 375
– other 148 132
Fee income 4,074 3,394
Fee expense (577) (438)
3,497 2,956
of which:
Net fee income, other than amounts included in determining the effective interest rate, arising from financial assets or financial liabilities that are not held for trading nor designated at fair value 1,320 1,162
– Fee income 1,615 1,421
– Fee expense (295) (259)
Net fee income on trust and other fiduciary activities where the Group holds or invests on behalf of its customers 540 388
– Fee income 641 466
– Fee expense (101) (78)
9 Trading Income
2006 2005restated
Trading income:
– foreign exchange 1,178 785
– securities, derivatives and other trading activities 152 100
1,330 885

NOTES TO THE FINANCIAL STATEMENTS (continued)
HANG SENG BANK112
10 Net Income/(Expense) From Financial Instruments Designated At Fair Value
2006 2005restated
Net income/(expense) on assets designated at fair value which back insurance and investment contracts 910 (25)
Net change in fair value of other financial instruments designated at fair value (11) (7)
899 (32)
of which dividend income from:
– listed investments 33 22
– unlisted investments – 3
33 25
11 Dividend Income
2006 2005
Dividend income:
– listed investments 37 48
– unlisted investments 10 12
47 60
12 Net Earned Insurance Premiums
2006Non-life
insurance
Life insurance
(non-linked)
Life insurance
(linked) Total
Gross written premiums 373 7,549 4 7,926
Movement in unearned premiums 26 – – 26
Gross earned premiums 399 7,549 4 7,952
Gross written premiums ceded to reinsurers (78) (19) – (97)
Reinsurers’ share of movement in unearned premiums (9) – – (9)
Reinsurers’ share of gross earned premiums (87) (19) – (106)
Net earned insurance premiums 312 7,530 4 7,846
2005 (restated)Non-life
insurance
Life insurance
(non-linked)
Life insurance
(linked) Total
Gross written premiums 392 7,492 5 7,889
Movement in unearned premiums 19 – – 19
Gross earned premiums 411 7,492 5 7,908
Gross written premiums ceded to reinsurers (103) (14) – (117)
Reinsurers’ share of movement in unearned premiums (8) – – (8)
Reinsurers’ share of gross earned premiums (111) (14) – (125)
Net earned insurance premiums 300 7,478 5 7,783

113ANNUAL REPORT 2006
13 Other Operating Income
2006 2005
Rental income from investment properties 186 207
Movement in present value of in-force long-term insurance business 363 316
Other 296 275
845 798
14 Net Insurance Claims Incurred And Movement In Policyholders’ Liabilities
2006Non-life
insurance
Life insurance
(non-linked)
Life insurance
(linked) Total
Claims, benefits and surrenders paid 105 990 24 1,119
Movement in provisions (16) 6,990 1 6,975
Gross claims incurred and movement in policyholders’ liabilities 89 7,980 25 8,094
Reinsurers’ share of claims, benefits and surrenders paid (14) (7) – (21)
Reinsurers’ share of movement in provisions 6 (2) – 4
Reinsurers’ share of claims incurred and movement in policyholders’ liabilities (8) (9) – (17)
Net insurance claims incurred and movement in policyholders’ liabilities 81 7,971 25 8,077
2005Non-life
insurance
Life insurance
(non-linked)
Life insurance
(linked) Total
Claims, benefits and surrenders paid 107 569 17 693
Movement in provisions (9) 6,357 (6) 6,342
Gross claims incurred and movement in policyholders’ liabilities 98 6,926 11 7,035
Reinsurers’ share of claims, benefits and surrenders paid (11) (8) – (19)
Reinsurers’ share of movement in provisions (2) – – (2)
Reinsurers’ share of claims incurred and movement in policyholders’ liabilities (13) (8) – (21)
Net insurance claims incurred and movement in policyholders’ liabilities 85 6,918 11 7,014
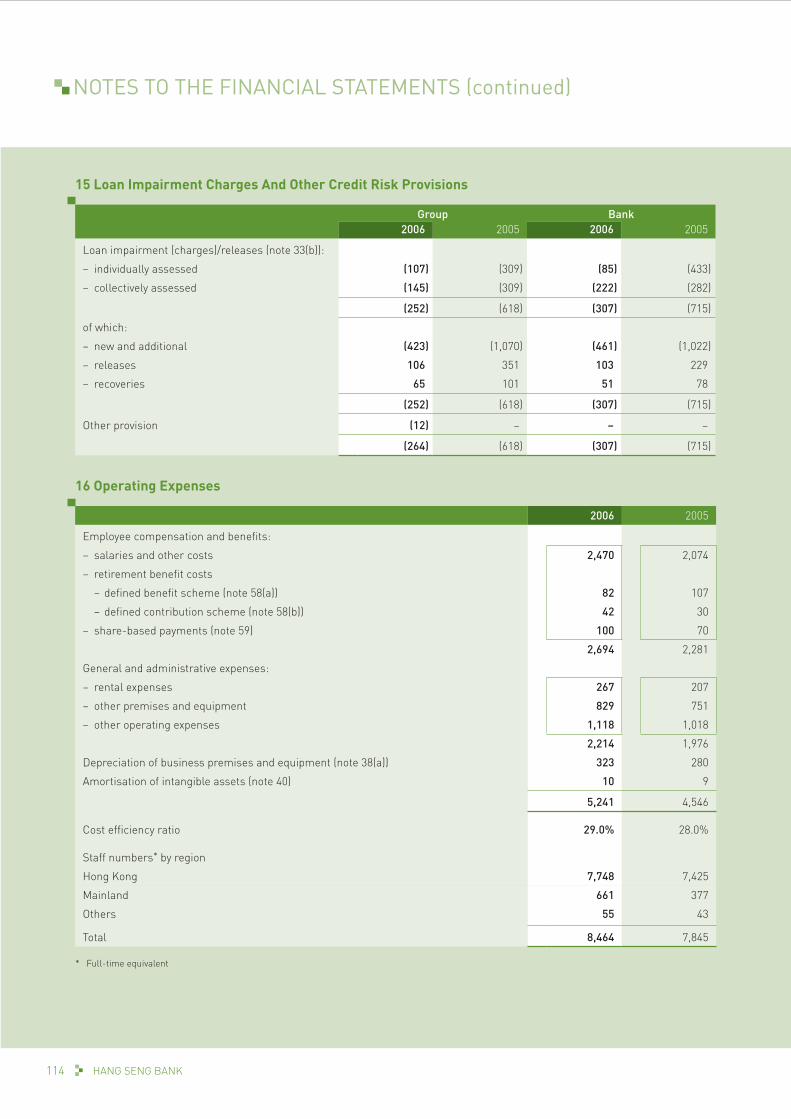
NOTES TO THE FINANCIAL STATEMENTS (continued)
HANG SENG BANK114
15 Loan Impairment Charges And Other Credit Risk Provisions
Group Bank2006 2005 2006 2005
Loan impairment (charges)/releases (note 33(b)):
– individually assessed (107) (309) (85) (433)
– collectively assessed (145) (309) (222) (282)
(252) (618) (307) (715)
of which:
– new and additional (423) (1,070) (461) (1,022)
– releases 106 351 103 229
– recoveries 65 101 51 78
(252) (618) (307) (715)
Other provision (12) – – –
(264) (618) (307) (715)
16 Operating Expenses
2006 2005
Employee compensation and benefits:
– salaries and other costs 2,470 2,074
– retirement benefit costs
– defined benefit scheme (note 58(a)) 82 107
– defined contribution scheme (note 58(b)) 42 30
– share-based payments (note 59) 100 70
2,694 2,281
General and administrative expenses:
– rental expenses 267 207
– other premises and equipment 829 751
– other operating expenses 1,118 1,018
2,214 1,976
Depreciation of business premises and equipment (note 38(a)) 323 280
Amortisation of intangible assets (note 40) 10 9
5,241 4,546
Cost efficiency ratio 29.0% 28.0%
Staff numbers* by region
Hong Kong 7,748 7,425
Mainland 661 377
Others 55 43
Total 8,464 7,845
* Full-time equivalent

115ANNUAL REPORT 2006
17 The Emoluments Of The Five Highest Paid Individuals(i) The aggregate emoluments
2006 2005
Salaries, allowances and benefits in kind 19 14
Retirement scheme contributions 2 2
Discretionary bonuses 6 6
Share-based payments 2 2
29 24
(ii) The numbers of the five highest paid individuals whose emoluments fell within the following bands were:
HK$
2006Number of Individuals
2005Number of Individuals
3,500,001 – 4,000,000 1 1
4,000,001 – 4,500,000 – 2
4,500,001 – 5,000,000 2 –
5,500,001 – 6,000,000 1 2
10,500,001 – 11,000,000 1 –
5 5
The emoluments of the five highest paid individuals set out above include the emoluments of three (2005: three) Executive Directors. Their respective directors’ emoluments are included in note 18.

NOTES TO THE FINANCIAL STATEMENTS (continued)
HANG SENG BANK116
18 Directors’ EmolumentsThe emoluments of the Directors of the Bank calculated in accordance with section 161 of the Hong Kong Companies Ordinance were:
Fees’000
Salaries, allowances
and benefits in kind
’000
Pension and pension
contribution ’000
(3)Discretionary
bonuses’000
Share-based
payments’000
(4)Total2006’000
Total2005’000
Executive Directors
Mr Raymond C F Or 150(1) 5,940 794 3,641 – 10,525 3,464
Mr Vincent H C Cheng (Ceased to be Vice-Chairman and Chief Executive on 25 May 05) – – – – – – 5,968
Mr W K Mok (Retired on 1 Jan 06) – – – – – – 5,762
Mr Joseph C Y Poon 150 3,380 329 1,696 – 5,555 3,605
Mr Patrick K W Chan 150 3,061 314 502 929 4,956 273
Non-Executive Directors
Mr M R P Smith 230(1) – – – – 230 139
Mr D G Eldon (Retired on 21 Apr 05) – – – – – – 61
Mr S J Glass (Resigned on 24 Mar 06) 38(1) – – – – 38 125
Mr Edgar David Ancona (Appointed on 4 Apr 06) 50(1) – – – – 50 –
Mr John C C Chan (2) 210 – – – – 210 163
Dr Y T Cheng (2) 150 – – – – 150 125
Dr Marvin K T Cheung (2) 230 – – – – 230 195
Mr Jenkin Hui (2) 190 – – – – 190 151
Mr Peter T C Lee (2) 190 – – – – 190 151
Dr Eric K C Li (2) 270 – – – – 270 225
Dr Vincent H S Lo 150 – – – – 150 125
Dr David W K Sin (2) 150 – – – – 150 125
Mr Richard Y S Tang (2) 230 – – – – 230 195
Mr Peter T S Wong 150(1) – – – – 150 76
Past Directors – – 2,101 – – 2,101 2,077
2,688 12,381 3,538 5,839 929 25,375 23,005
2005 2,315 12,101 3,216 4,336 1,037
Notes:
(1) Fees receivable as a Director of Hang Seng Bank Limited were surrendered to The Hongkong and Shanghai Banking Corporation Limited in accordance with the HSBC Group’s internal policy.
(2) Independent Non-Executive Director.
(3) The aggregate amount of pensions received by the past Directors of the Bank under the relevant pension schemes amounted to HK$2.101 million in 2006. The Bank made contributions during 2006 into the pension schemes of which the Bank’s past Directors are among their members. The contributions serve to maintain the funding positions of these schemes in respect of liabilities to all scheme members, including but not limited to the past Directors. The amount of contribution attributable to any specific scheme member is not determinable.
(4) These represent the estimated fair value of share option granted to certain directors under the HSBC Group share option plan and the fair value of restricted share and performance share under the HSBC Group share plan, which is measured according to the Group’s accounting policies for share-
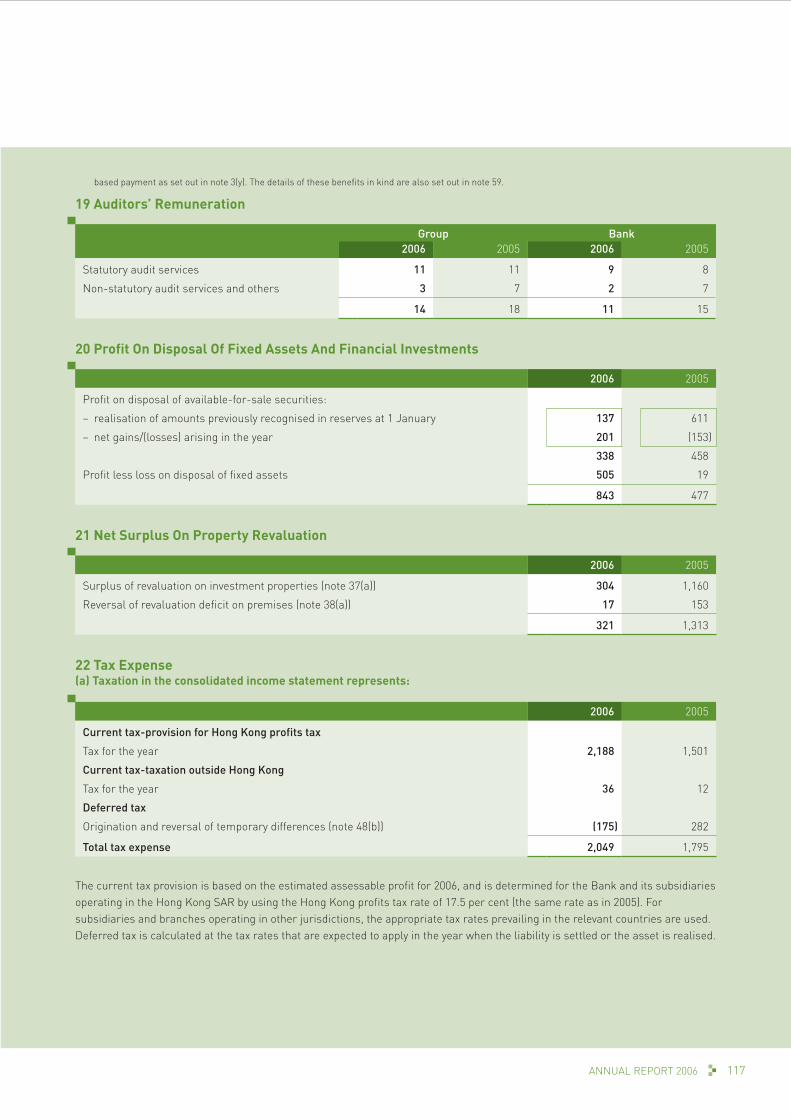
117ANNUAL REPORT 2006
based payment as set out in note 3(y). The details of these benefits in kind are also set out in note 59.
19 Auditors’ Remuneration
Group Bank2006 2005 2006 2005
Statutory audit services 11 11 9 8
Non-statutory audit services and others 3 7 2 7
14 18 11 15
20 Profit On Disposal Of Fixed Assets And Financial Investments
2006 2005
Profit on disposal of available-for-sale securities:
– realisation of amounts previously recognised in reserves at 1 January 137 611
– net gains/(losses) arising in the year 201 (153)
338 458
Profit less loss on disposal of fixed assets 505 19
843 477
21 Net Surplus On Property Revaluation
2006 2005
Surplus of revaluation on investment properties (note 37(a)) 304 1,160
Reversal of revaluation deficit on premises (note 38(a)) 17 153
321 1,313
22 Tax Expense(a) Taxation in the consolidated income statement represents:
2006 2005
Current tax-provision for Hong Kong profits tax
Tax for the year 2,188 1,501
Current tax-taxation outside Hong Kong
Tax for the year 36 12
Deferred tax
Origination and reversal of temporary differences (note 48(b)) (175) 282
Total tax expense 2,049 1,795
The current tax provision is based on the estimated assessable profit for 2006, and is determined for the Bank and its subsidiaries operating in the Hong Kong SAR by using the Hong Kong profits tax rate of 17.5 per cent (the same rate as in 2005). For subsidiaries and branches operating in other jurisdictions, the appropriate tax rates prevailing in the relevant countries are used. Deferred tax is calculated at the tax rates that are expected to apply in the year when the liability is settled or the asset is realised.

NOTES TO THE FINANCIAL STATEMENTS (continued)
HANG SENG BANK118
22 Tax Expense (continued)(b) Reconciliation between taxation charge and accounting profit at applicable tax rates :
2006 2005
Profit before tax 14,395 13,358
Notional tax on profit before tax, calculated at Hong Kong tax rate of 17.5% (2005: 17.5%) 2,519 2,338
Tax effect of:
– different tax rates in other countries/areas (182) (291)
– non-taxable income and non-deductible expenses (162) (160)
– share of results of associates (114) (88)
– others (12) (4)
Actual charge for taxation 2,049 1,795
23 Profit Attributable To ShareholdersOf the profit attributable to shareholders, HK$10,806 million (2005: HK$10,080 million) has been dealt with in the financial statements of the Bank.
Reconciliation of the above amount to the Bank’s profit for the year:
2006 2005
Amount of consolidated profit attributable to shareholders dealt with in the Bank’s financial statements 10,035 9,423
Dividends declared during the year by subsidiaries from retained profits 771 657
The Bank’s profit for the year (note 51) 10,806 10,080
24 Earnings Per ShareThe calculation of earnings per share for 2006 is based on earnings of HK$12,038 million (HK$11,342 million in 2005) and on the weighted average number of ordinary shares in issue of 1,911,842,736 shares (unchanged from 2005).

119ANNUAL REPORT 2006
25 Dividends Per Share(a) Dividends attributable to the year
2006 2005per share
HK$HK$ million per share
HK$HK$ million
First interim 1.10 2,103 1.10 2,103
Second interim 1.10 2,103 1.10 2,103
Third interim 1.10 2,103 1.10 2,103
Fourth interim 1.90 3,633 1.90 3,633
5.20 9,942 5.20 9,942
(b) Dividends attributable to the previous year, approved and paid during the year:
2006 2005
Fourth interim dividend in respect of the previous year, approved and paid during the year, of HK$1.90 per share (2005: HK$1.90 per share) 3,633 3,633
26 Segmental AnalysisSegmental information is presented in respect of business and geographical segments. Business by customer group information, which is more relevant to the Group in making operating and financial decisions, is chosen as the primary reporting format.
For the purpose of segmental analysis, the allocation of revenue reflects the benefits of capital and other funding resources allocated to the customer groups or geographical segments by way of internal capital allocation and funds transfer pricing mechanisms. Cost allocation is based on the direct costs incurred by the respective customer groups and apportionment of management overheads. Rental charges at market rate for usage of premises are reflected as inter-segment income for the “Other” customer group and inter-segment expenses for the respective customer groups.
(a) By customer groupThe Group’s business comprises five customer groups. Personal Financial Services provides banking (including deposits, credit cards, mortgages and other retail lending) and wealth management services (including private banking, investment and insurance) to personal customers. Commercial Banking manages middle market and smaller corporate relationships and specialises in trade-related financial services. Corporate Banking handles relationships with large corporate and institutional customers. Treasury engages in balance sheet management and proprietary trading. Treasury also manages the funding and liquidity positions of the Group and other market risk positions arising from banking activities. “Other” mainly represents management of shareholders’ funds and investments in premises, investment properties and equity shares.
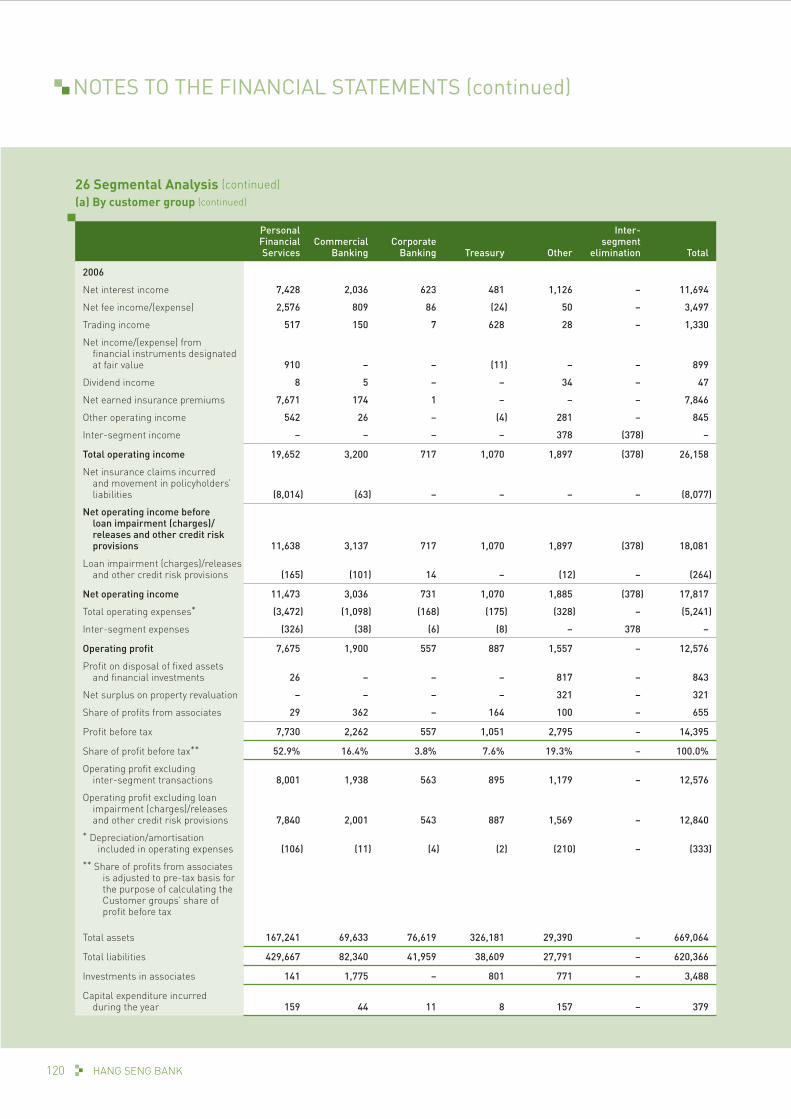
NOTES TO THE FINANCIAL STATEMENTS (continued)
HANG SENG BANK120
26 Segmental Analysis (continued)(a) By customer group (continued)
Personal Financial Services
Commercial Banking
Corporate Banking Treasury Other
Inter-segment
elimination Total
2006
Net interest income 7,428 2,036 623 481 1,126 – 11,694
Net fee income/(expense) 2,576 809 86 (24) 50 – 3,497
Trading income 517 150 7 628 28 – 1,330
Net income/(expense) from financial instruments designated at fair value 910 – – (11) – – 899
Dividend income 8 5 – – 34 – 47
Net earned insurance premiums 7,671 174 1 – – – 7,846
Other operating income 542 26 – (4) 281 – 845
Inter-segment income – – – – 378 (378) –
Total operating income 19,652 3,200 717 1,070 1,897 (378) 26,158
Net insurance claims incurred and movement in policyholders’ liabilities (8,014) (63) – – – – (8,077)
Net operating income before loan impairment (charges)/ releases and other credit risk provisions 11,638 3,137 717 1,070 1,897 (378) 18,081
Loan impairment (charges)/releases and other credit risk provisions (165) (101) 14 – (12) – (264)
Net operating income 11,473 3,036 731 1,070 1,885 (378) 17,817
Total operating expenses* (3,472) (1,098) (168) (175) (328) – (5,241)
Inter-segment expenses (326) (38) (6) (8) – 378 –
Operating profit 7,675 1,900 557 887 1,557 – 12,576
Profit on disposal of fixed assets and financial investments 26 – – – 817 – 843
Net surplus on property revaluation – – – – 321 – 321
Share of profits from associates 29 362 – 164 100 – 655
Profit before tax 7,730 2,262 557 1,051 2,795 – 14,395
Share of profit before tax** 52.9% 16.4% 3.8% 7.6% 19.3% – 100.0%
Operating profit excluding inter-segment transactions 8,001 1,938 563 895 1,179 – 12,576
Operating profit excluding loan impairment (charges)/releases and other credit risk provisions 7,840 2,001 543 887 1,569 – 12,840
* Depreciation/amortisation included in operating expenses (106) (11) (4) (2) (210) – (333)
** Share of profits from associates is adjusted to pre-tax basis for the purpose of calculating the Customer groups’ share of profit before tax
Total assets 167,241 69,633 76,619 326,181 29,390 – 669,064
Total liabilities 429,667 82,340 41,959 38,609 27,791 – 620,366
Investments in associates 141 1,775 – 801 771 – 3,488
Capital expenditure incurred during the year 159 44 11 8 157 – 379

121ANNUAL REPORT 2006
26 Segmental Analysis (continued)(a) By customer group (continued)
Personal Financial Services
Commercial Banking
Corporate Banking Treasury Other
Inter-segment
elimination Total
2005 (restated)
Net interest income 7,092 1,587 612 995 510 – 10,796
Net fee income/(expense) 2,136 713 79 (21) 49 – 2,956
Trading income 367 134 6 378 – – 885
Net income/(expense) from financial instruments designated at fair value (25) – – (7) – – (32)
Dividend income 5 5 – – 50 – 60
Net earned insurance premiums 7,607 176 – – – – 7,783
Other operating income 562 25 4 – 207 – 798
Inter-segment income – – – – 308 (308) –
Total operating income 17,744 2,640 701 1,345 1,124 (308) 23,246
Net insurance claims incurred and movement in policyholders’ liabilities (6,964) (50) – – – – (7,014)
Net operating income before loan impairment (charges)/ releases and other credit risk provisions 10,780 2,590 701 1,345 1,124 (308) 16,232
Loan impairment (charges)/ releases and other credit risk provisions 232 (803) (47) – – – (618)
Net operating income 11,012 1,787 654 1,345 1,124 (308) 15,614
Total operating expenses* (3,086) (903) (142) (157) (258) – (4,546)
Inter-segment expenses (258) (40 ) (5) (5) – 308 –
Operating profit 7,668 844 507 1,183 866 – 11,068
Profit on disposal of fixed assets and financial investments – – – (217) 694 – 477
Net surplus on property revaluation – – – – 1,313 – 1,313
Share of profits from associates 18 234 – 106 142 – 500
Profit before tax 7,686 1,078 507 1,072 3,015 – 13,358
Share of profit before tax** 56.8% 8.8% 3.7% 8.3% 22.4% – 100.0%
Operating profit excluding inter-segment transactions 7,926 884 512 1,188 558 – 11,068
Operating profit excluding loan impairment (charges)/releases and other credit risk provisions 7,436 1,647 554 1,183 866 – 11,686
* Depreciation/amortisation included in operating expenses (103) (13) (3) (2) (168) – (289)
** Share of profits from associates is adjusted to pre-tax basis for the purpose of calculating the Customer groups’ share of profit before tax
Total assets 152,086 54,319 77,514 266,645 30,256 – 580,820
Total liabilities 372,941 77,249 31,672 33,541 21,687 – 537,090
Investments in associates 116 1,454 – 657 702 – 2,929
Capital expenditure incurred during the year 107 20 7 2 95 – 231

NOTES TO THE FINANCIAL STATEMENTS (continued)
HANG SENG BANK122
26 Segmental Analysis (continued)(b) By geographical regionThe geographical regions in this analysis are classified by the location of the principal operations of the subsidiary companies or, in the case of the Bank itself, by the location of the branches responsible for reporting the results or advancing the funds.
2006 2005% %
Total operating income
– Hong Kong 24,449 93 21,377 92
– Americas 1,295 5 1,644 7
– Mainland and other 414 2 225 1
26,158 100 23,246 100
Profit before tax
– Hong Kong 12,380 86 11,253 84
– Americas 1,262 9 1,614 12
– Mainland and other 753 5 491 4
14,395 100 13,358 100
Capital expenditure incurred during the year
– Hong Kong 335 88 206 89
– Americas – – – –
– Mainland and other 44 12 25 11
379 100 231 100
Total assets
– Hong Kong 573,067 86 497,406 86
– Americas 65,997 10 60,845 10
– Mainland and other 30,000 4 22,569 4
669,064 100 580,820 100
Total liabilities
– Hong Kong 603,636 97 520,260 97
– Americas 4,180 1 9,395 2
– Mainland and other 12,550 2 7,435 1
620,366 100 537,090 100
Contingent liabilities and commitments
– Hong Kong 165,541 95 137,536 97
– Americas – – – –
– Mainland and other 8,701 5 3,973 3
174,242 100 141,509 100

123ANNUAL REPORT 2006
27 Analysis Of Assets And Liabilities By Remaining MaturityThe maturity analysis is based on the remaining period at the balance sheet date to the contractual maturity date in accordance with the guideline issued by the Hong Kong Monetary Authority.
Group
Repayable
on demand
Three months or
less but not on
demand
Three months to
one year
One year to five years
Over five years Trading
No contractual
maturity Total
2006
Assets
Cash and balances with banks and other financial institutions 9,390 – – – – – – 9,390
Placings with and advances to banks and other financial institutions 16,529 82,200 976 – – – – 99,705
Trading assets – – – – – 12,467 – 12,467
Financial assets designated at fair value – 136 400 1,256 2,557 – 3,931 8,280
Derivative financial instruments – 166 146 153 48 1,374 – 1,887
Advances to customers 17,087 34,868 39,736 87,768 99,894 – – 279,353
Financial investments – 22,703 51,385 134,981 16,601 – 2,040 227,710
Investments in associates – – – – – – 3,488 3,488
Investment properties – – – – – – 2,732 2,732
Premises, plant and equipment – – – – – – 6,516 6,516
Interest in leasehold land held for own use under operating lease – – – – – – 580 580
Intangible assets – – – – – – 2,070 2,070
Other assets 6,304 5,694 1,500 262 10 – 1,116 14,886
49,310 145,767 94,143 224,420 119,110 13,841 22,473 669,064
Liabilities
Current, savings and other deposit accounts 290,463 182,885 8,497 976 – – – 482,821
Deposits from banks 2,797 14,032 1,121 – – – – 17,950
Trading liabilities – – – – – 60,093 – 60,093
Financial liabilities designated at fair value 81 – – 996 – – 485 1,562
Derivative financial instruments – 7 101 98 11 1,314 – 1,531
Certificates of deposit and other debt securities in issue – 74 866 6,655 – – – 7,595
Other liabilities 6,486 8,577 468 120 143 – 329 16,123
Liabilities to customers under insurance contracts – – – – – – 22,975 22,975
Deferred tax and current tax liabilities – 481 747 – – – 1,488 2,716
Subordinated liabilities – – – 7,000 – – – 7,000
299,827 206,056 11,800 15,845 154 61,407 25,277 620,366

NOTES TO THE FINANCIAL STATEMENTS (continued)
HANG SENG BANK124
27 Analysis Of Assets And Liabilities By Remaining Maturity (continued)
Group
Repayable on demand
Three months or
less but not on
demand
Three months to
one year
One yearto five years
Over five years Trading
No contractual
maturity Total
2005
Assets
Cash and balances with banks and other financial institutions 9,201 – – – – – – 9,201
Placings with and advances to banks and other financial institutions 11,824 52,661 4,597 204 – – – 69,286
Trading assets – – – – – 12,600 – 12,600
Financial assets designated at fair value – 52 113 1,601 2,262 – 1,999 6,027
Derivative financial instruments – 106 105 218 25 1,261 – 1,715
Advances to customers 14,330 26,348 33,457 91,279 95,266 – – 260,680
Financial investments – 14,214 35,010 126,831 12,528 – 1,321 189,904
Investments in associates – – – – – – 2,929 2,929
Investment properties – – – – – – 4,273 4,273
Premises, plant and equipment – – – – – – 6,750 6,750
Interest in leasehold land held for own use under operating lease – – – – – – 594 594
Intangible assets – – – – – – 1,636 1,636
Other assets 8,589 4,589 1,360 28 6 – 653 15,225
43,944 97,970 74,642 220,161 110,087 13,861 20,155 580,820
Liabilities
Current, savings and other deposit accounts 233,907 190,206 5,916 966 – – – 430,995
Deposits from banks 1,664 10,370 9 – – – – 12,043
Trading liabilities – – – – – 45,804 – 45,804
Financial liabilities designated at fair value 26 – – – 994 – 508 1,528
Derivative financial instruments – 22 81 318 36 1,335 – 1,792
Certificates of deposit and other debt securities in issue – 233 1,952 7,788 50 – – 10,023
Other liabilities 6,706 6,661 442 48 99 – 182 14,138
Liabilities to customers under insurance contracts – – – – – – 15,335 15,335
Deferred tax and current tax liabilities 370 2 78 – – – 1,471 1,921
Subordinated liabilities – – – – 3,511 – – 3,511
242,673 207,494 8,478 9,120 4,690 47,139 17,496 537,090

125ANNUAL REPORT 2006
27 Analysis Of Assets And Liabilities By Remaining Maturity (continued)
Bank
Repayable on demand
Three months or
less but not on
demand
Three months to
one year
One year to five years
Over five years Trading
No contractual
maturity Total
2006
Assets
Cash and balances with banks and other financial institutions 9,360 – – – – – – 9,360
Placings with and advances to banks and other financial institutions 14,810 65,049 820 – – – – 80,679
Trading assets – – – – – 10,778 – 10,778
Financial assets designated at fair value – 91 299 1,048 150 – 7 1,595
Derivative financial instruments – 154 122 95 48 1,368 – 1,787
Advances to customers 16,788 33,890 37,351 76,073 80,133 – – 244,235
Amounts due from subsidiaries 59,231 33,370 – – – – – 92,601
Financial investments – 16,703 43,447 98,166 4,028 – 78 162,422
Investments in subsidiaries – – – – – – 2,357 2,357
Investments in associates – – – – – – 1,634 1,634
Investment properties – – – – – – 1,557 1,557
Premises, plant and equipment – – – – – – 4,219 4,219
Interest in leasehold land held for own use under operating lease – – – – – – 580 580
Intangible assets – – – – – – 143 143
Other assets 6,264 5,206 1,061 1 – – 924 13,456
106,453 154,463 83,100 175,383 84,359 12,146 11,499 627,403
Liabilities
Current, savings and other deposit accounts 289,779 179,497 8,473 963 – – – 478,712
Deposits from banks 2,527 14,032 1,121 – – – – 17,680
Trading liabilities – – – – – 60,093 – 60,093
Financial liabilities designated at fair value – – – 996 – – (9) 987
Derivative financial instruments – 4 95 97 11 1,313 – 1,520
Certificates of deposit and other debt securities in issue – 74 866 6,683 – – – 7,623
Amounts due to subsidiaries 664 1,056 – – – – – 1,720
Other liabilities 6,517 8,515 434 91 44 – 1,450 17,051
Deferred tax and current tax liabilities – 347 843 – – – 808 1,998
Subordinated liabilities – – – 7,000 – – – 7,000
299,487 203,525 11,832 15,830 55 61,406 2,249 594,384
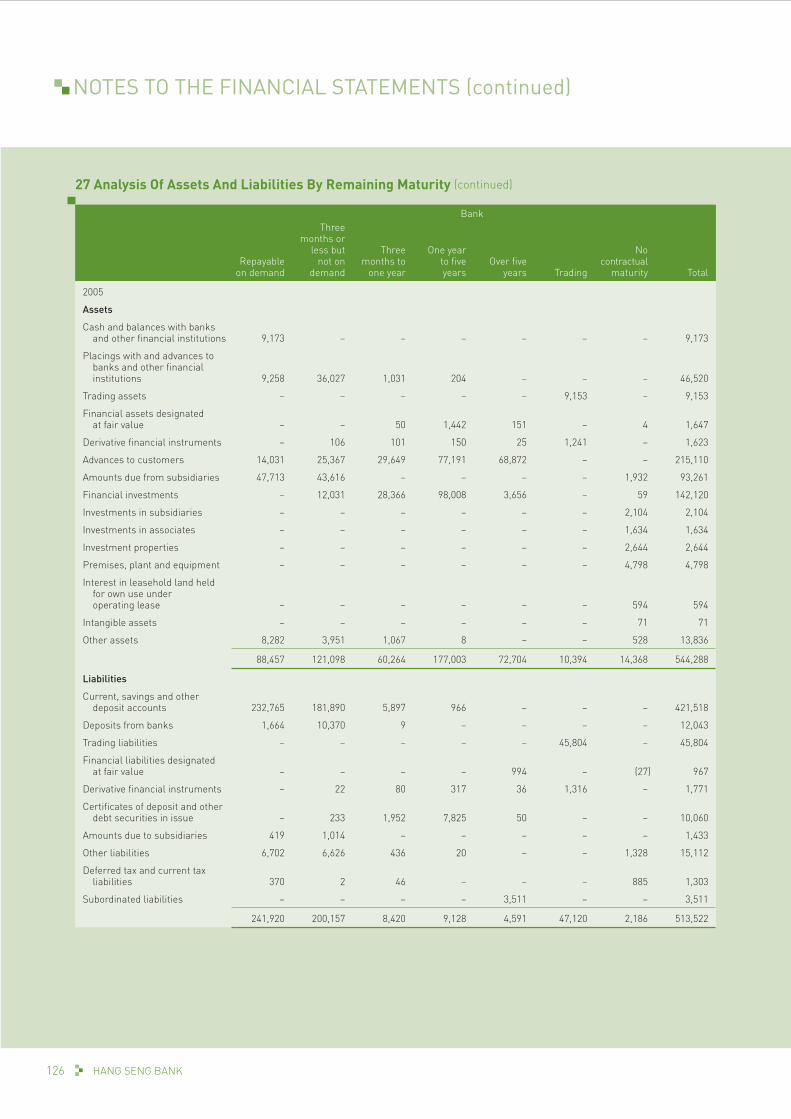
NOTES TO THE FINANCIAL STATEMENTS (continued)
HANG SENG BANK126
27 Analysis Of Assets And Liabilities By Remaining Maturity (continued)
Bank
Repayable on demand
Three months or
less but not on
demand
Three months to
one year
One yearto five years
Over five years Trading
No contractual
maturity Total
2005
Assets
Cash and balances with banks and other financial institutions 9,173 – – – – – – 9,173
Placings with and advances to banks and other financial institutions 9,258 36,027 1,031 204 – – – 46,520
Trading assets – – – – – 9,153 – 9,153
Financial assets designated at fair value – – 50 1,442 151 – 4 1,647
Derivative financial instruments – 106 101 150 25 1,241 – 1,623
Advances to customers 14,031 25,367 29,649 77,191 68,872 – – 215,110
Amounts due from subsidiaries 47,713 43,616 – – – – 1,932 93,261
Financial investments – 12,031 28,366 98,008 3,656 – 59 142,120
Investments in subsidiaries – – – – – – 2,104 2,104
Investments in associates – – – – – – 1,634 1,634
Investment properties – – – – – – 2,644 2,644
Premises, plant and equipment – – – – – – 4,798 4,798
Interest in leasehold land held for own use under operating lease – – – – – – 594 594
Intangible assets – – – – – – 71 71
Other assets 8,282 3,951 1,067 8 – – 528 13,836
88,457 121,098 60,264 177,003 72,704 10,394 14,368 544,288
Liabilities
Current, savings and other deposit accounts 232,765 181,890 5,897 966 – – – 421,518
Deposits from banks 1,664 10,370 9 – – – – 12,043
Trading liabilities – – – – – 45,804 – 45,804
Financial liabilities designated at fair value – – – – 994 – (27) 967
Derivative financial instruments – 22 80 317 36 1,316 – 1,771
Certificates of deposit and other debt securities in issue – 233 1,952 7,825 50 – – 10,060
Amounts due to subsidiaries 419 1,014 – – – – – 1,433
Other liabilities 6,702 6,626 436 20 – – 1,328 15,112
Deferred tax and current tax liabilities 370 2 46 – – – 885 1,303
Subordinated liabilities – – – – 3,511 – – 3,511
241,920 200,157 8,420 9,128 4,591 47,120 2,186 513,522

127ANNUAL REPORT 2006
28 Accounting ClassificationsThe table below sets out the Group’s classification of financial assets and liabilities:
TradingDesignated
at fair value
Available-for-sale/hedging
Held-to-maturity
Loans and receivables
Other amortised
cost Total
2006
Cash and balances with banks and other financial institutions – – – – – 9,390 9,390
Placings with and advances to banks and other financial institutions – – – – 99,705 – 99,705
Derivative financial instruments 1,374 – 513 – – – 1,887
Advances to customers 59 – – – 279,353 – 279,412
Investment securities 12,408 8,280 211,573 16,137 – – 248,398
Acceptances and endorsements – – – – – 2,855 2,855
Total financial assets 13,841 8,280 212,086 16,137 379,058 12,245 641,647
Non-financial assets 27,417
Total assets 669,064
Current, savings and other deposit accounts 35,066 – – – – 482,821 517,887
Deposits from banks – – – – – 17,950 17,950
Derivative financial instruments 1,314 – 217 – – – 1,531
Certificates of deposit and other debt securities in issue 14,821 – – – – 7,595 22,416
Other financial liabilities 10,206 – – – – – 10,206
Subordinated liabilities – 987 – – – 7,000 7,987
Liabilities to customers under investment contracts – 575 – – – – 575
Acceptances and endorsements – – – – – 2,855 2,855
Total financial liabilities 61,407 1,562 217 – – 518,221 581,407
Non-financial liabilities 38,959
Total liabilities 620,366

NOTES TO THE FINANCIAL STATEMENTS (continued)
HANG SENG BANK128
28 Accounting Classifications (continued)
TradingDesignated at fair value
Available-for-sale/hedging
Held-to-maturity
Loans and receivables
Other amortised
cost Total
2005
Cash and balances with banks and other financial institutions – – – – – 9,201 9,201
Placings with and advances to banks and other financial institutions – – – – 69,286 – 69,286
Derivative financial instruments 1,261 – 454 – – – 1,715
Advances to customers – – – – 260,680 – 260,680
Investment securities 12,600 6,027 179,173 10,731 – – 208,531
Acceptances and endorsements – – – – – 2,371 2,371
Total financial assets 13,861 6,027 179,627 10,731 329,966 11,572 551,784
Non-financial assets 29,036
Total assets 580,820
Current, savings and other deposit accounts 24,422 – – – – 430,995 455,417
Deposits from banks – – – – – 12,043 12,043
Derivative financial instruments 1,335 – 457 – – – 1,792
Certificates of deposit and other debt securities in issue 13,616 – – – – 10,023 23,639
Other financial liabilities 7,766 – – – – – 7,766
Subordinated liabilities – 967 – – – 3,511 4,478
Liabilities to customers under investment contracts – 561 – – – – 561
Acceptances and endorsements – – – – – 2,371 2,371
Total financial liabilities 47,139 1,528 457 – – 458,943 508,067
Non-financial liabilities 29,023
Total liabilities 537,090
29 Cash and balances with banks and other financial institutions
Group Bank2006 2005 2006 2005
Cash in hand 4,920 4,772 4,920 4,772
Balances with central banks 357 303 357 303
Balances with banks and other financial institutions 4,113 4,126 4,083 4,098
9,390 9,201 9,360 9,173

129ANNUAL REPORT 2006
30 Placings With And Advances To Banks And Other Financial Institutions
Group Bank2006 2005 2006 2005
Placings with and advances to banks and other financial institutions maturing within one month 75,722 54,338 59,880 38,054
Placings with and advances to banks and other financial institutions maturing after one month 23,983 14,948 20,799 8,466
99,705 69,286 80,679 46,520
31 Trading Assets
Group Bank2006 2005 2006 2005
Treasury bills 6,071 2,594 6,071 2,594
Certificates of deposit 212 538 212 453
Other debt securities 6,109 9,440 4,420 6,078
Debt securities 12,392 12,572 10,703 9,125
Equity shares 16 28 16 28
Total trading securities 12,408 12,600 10,719 9,153
Loans and advances to customers* 59 – 59 –
Total trading assets 12,467 12,600 10,778 9,153
Debt securities:
– listed in Hong Kong 2,839 767 2,839 767
– listed outside Hong Kong 269 – 269 –
3,108 767 3,108 767
– unlisted 9,284 11,805 7,595 8,358
12,392 12,572 10,703 9,125
Equity shares:
– listed in Hong Kong 16 17 16 17
– unlisted – 11 – 11
16 28 16 28
Total trading securities 12,408 12,600 10,719 9,153
Debt securities
Issued by public bodies:
– central governments and central banks 8,969 5,625 8,969 5,488
– other public sector entities 926 1,489 375 653
9,895 7,114 9,344 6,141
Issued by other bodies:
– banks and other financial institutions 1,555 2,836 600 1,172
– corporate entities 942 2,622 759 1,812
2,497 5,458 1,359 2,984
12,392 12,572 10,703 9,125
Equity shares
Issued by corporate entities 16 28 16 28
Total trading securities 12,408 12,600 10,719 9,153
* These represent amounts receivable from counterparties on trading transactions not yet settled.

NOTES TO THE FINANCIAL STATEMENTS (continued)
HANG SENG BANK130
32 Financial Assets Designated At Fair Value
Group Bank2006 2005 2006 2005
Certificates of deposit 232 194 90 88
Other debt securities 4,587 4,075 1,505 1,559
Debt securities 4,819 4,269 1,595 1,647
Equity shares 3,461 1,758 – –
8,280 6,027 1,595 1,647
Debt securities:
– listed in Hong Kong 359 100 350 99
– listed outside Hong Kong 31 22 – –
390 122 350 99
– unlisted 4,429 4,147 1,245 1,548
4,819 4,269 1,595 1,647
Equity shares:
– listed in Hong Kong 1,202 732 – –
– listed outside Hong Kong 1,300 979 – –
2,502 1,711 – –
– unlisted 959 47 – –
3,461 1,758 – –
8,280 6,027 1,595 1,647
Debt securities
Issued by public bodies:
– central governments and central banks 870 865 856 854
– other public sector entities 285 295 236 241
1,155 1,160 1,092 1,095
Issued by other bodies:
– banks and other financial institutions 3,535 2,937 411 409
– corporate entities 129 172 92 143
3,664 3,109 503 552
4,819 4,269 1,595 1,647
Equity shares
Issued by corporate entities 3,461 1,758 – –
8,280 6,027 1,595 1,647

131ANNUAL REPORT 2006
33 Advances To Customers(a) Advances to customers
Group Bank2006 2005 2006 2005
Gross advances to customers 280,277 261,714 245,071 215,982
Less:
Loan impairment allowances:
– individually assessed (406) (524) (332) (453)
– collectively assessed (518) (510) (504) (419)
279,353 260,680 244,235 215,110
Included in advances to customers are:
– trade bills 3,907 3,024 3,907 3,024
– loan impairment allowances (16) (14) (16) (14)
3,891 3,010 3,891 3,010
Total loan impairment allowances as a percentage of gross advances to customers are as follows:
Group Bank2006
%2005
%2006
%2005
%
Loan impairment allowances:
– individually assessed 0.15 0.20 0.14 0.21
– collectively assessed 0.18 0.19 0.20 0.19
Total loan impairment allowances 0.33 0.39 0.34 0.40
(b) Loan impairment allowances against advances to customers
GroupIndividually
assessedCollectively
assessed Total
2006
At 1 January 524 510 1,034
Amounts written off (224) (177) (401)
Recoveries of advances written off in previous years 25 40 65
New impairment allowances charged to income statement (note 15) 238 185 423
Impairment allowances released to income statement (note 15) (131) (40) (171)
Unwind of discount of loan impairment allowances recognised as “interest income” (26) – (26)
At 31 December 406 518 924
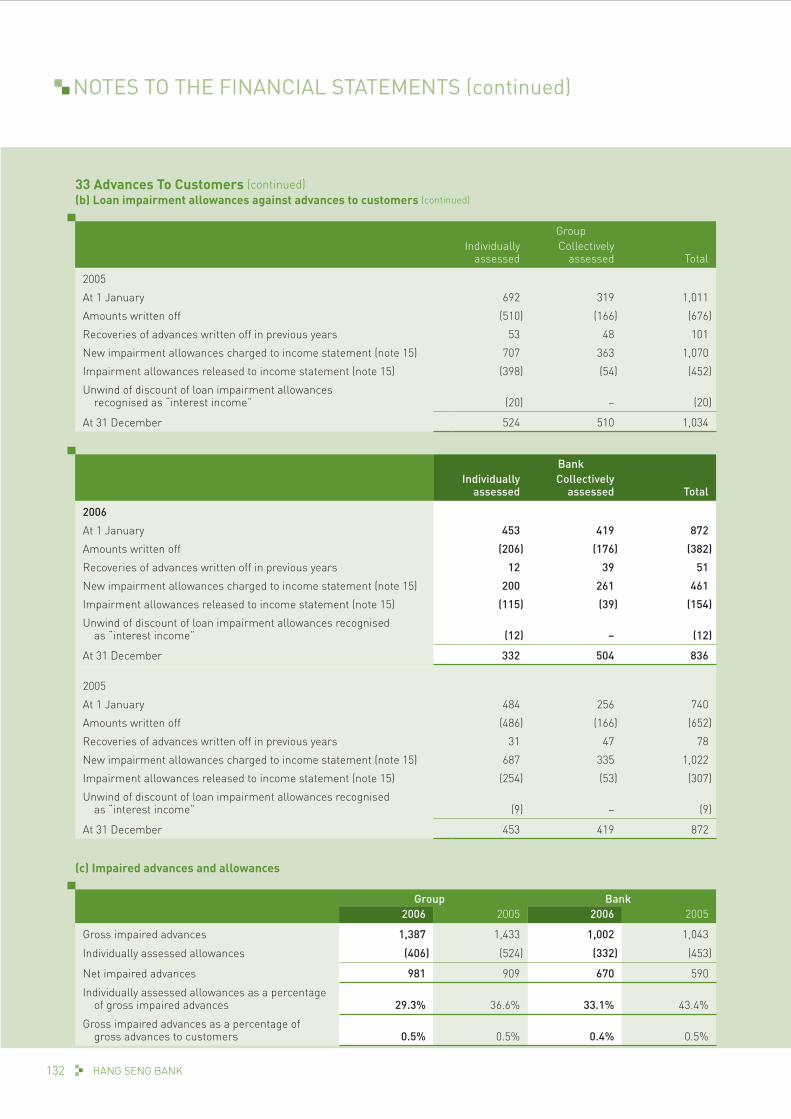
NOTES TO THE FINANCIAL STATEMENTS (continued)
HANG SENG BANK132
33 Advances To Customers (continued)(b) Loan impairment allowances against advances to customers (continued)
GroupIndividually
assessedCollectively
assessed Total
2005
At 1 January 692 319 1,011
Amounts written off (510) (166) (676)
Recoveries of advances written off in previous years 53 48 101
New impairment allowances charged to income statement (note 15) 707 363 1,070
Impairment allowances released to income statement (note 15) (398) (54) (452)
Unwind of discount of loan impairment allowances recognised as “interest income” (20) – (20)
At 31 December 524 510 1,034
BankIndividually
assessedCollectively
assessed Total
2006
At 1 January 453 419 872
Amounts written off (206) (176) (382)
Recoveries of advances written off in previous years 12 39 51
New impairment allowances charged to income statement (note 15) 200 261 461
Impairment allowances released to income statement (note 15) (115) (39) (154)
Unwind of discount of loan impairment allowances recognised as “interest income” (12) – (12)
At 31 December 332 504 836
2005
At 1 January 484 256 740
Amounts written off (486) (166) (652)
Recoveries of advances written off in previous years 31 47 78
New impairment allowances charged to income statement (note 15) 687 335 1,022
Impairment allowances released to income statement (note 15) (254) (53) (307)
Unwind of discount of loan impairment allowances recognised as “interest income” (9) – (9)
At 31 December 453 419 872
(c) Impaired advances and allowances
Group Bank2006 2005 2006 2005
Gross impaired advances 1,387 1,433 1,002 1,043
Individually assessed allowances (406) (524) (332) (453)
Net impaired advances 981 909 670 590
Individually assessed allowances as a percentage of gross impaired advances 29.3% 36.6% 33.1% 43.4%
Gross impaired advances as a percentage of gross advances to customers 0.5% 0.5% 0.4% 0.5%

133ANNUAL REPORT 2006
33 Advances To Customers (continued)(d) Overdue advancesAdvances to customers that are more than three months overdue and their expression as a percentage of gross advances to customers are as follows:
Group Bank2006 % %
Gross advances to customers which have been overdue with respect to either principal or interest for periods of:
– six months or less but over three months 504 0.2 260 0.1
– one year or less but over six months 263 0.1 195 0.1
– over one year 173 – 157 –
940 0.3 612 0.2
Group Bank2005 % %
Gross advances to customers which have been overdue with respect to either principal or interest for periods of:
– six months or less but over three months 482 0.2 216 0.1
– one year or less but over six months 211 0.1 162 0.1
– over one year 169 – 163 0.1
862 0.3 541 0.3
Advances with a specific repayment date are classified as overdue when the principal or interest is overdue and remains unpaid at year-end. Advances repayable by regular instalments are treated as overdue when an instalment payment is overdue and remains unpaid at year-end. Advances repayable on demand are classified as overdue either when a demand for repayment has been served on the borrower but repayment has not been made in accordance with the demand notice, or when the advances have remained continuously outside the approved limit advised to the borrower for more than the overdue period in question.
(e) Rescheduled advancesRescheduled advances and their expression as a percentage of gross advances to customers are as follows:
Group Bank% %
2006 357 0.1 212 0.1
2005 361 0.1 176 0.1
Rescheduled advances are those that have been rescheduled or renegotiated for reasons related to the borrower’s financial difficulties. This will normally involve the granting of concessionary terms and resetting the overdue account to non-overdue status. A rescheduled advance will continue to be disclosed as such unless the debt has been performing in accordance with the rescheduled terms for a period of six to twelve months. Rescheduled advances that have been overdue for more than three months under the rescheduled terms are reported as overdue advances to customers.
(f) Segmental analysis of advances to customers by geographical areaAdvances to customers by geographical area are classified according to the location of the counterparties after taking into account the transfer of risk. In general, risk transfer applies when an advance is guaranteed by a party located in an area which is different from that of the counterparty. At 31 December 2006, over 90 per cent of the Group’s advances to customers, including related impaired advances and overdue advances, were classified under Hong Kong (a position unchanged from that at31 December 2005).
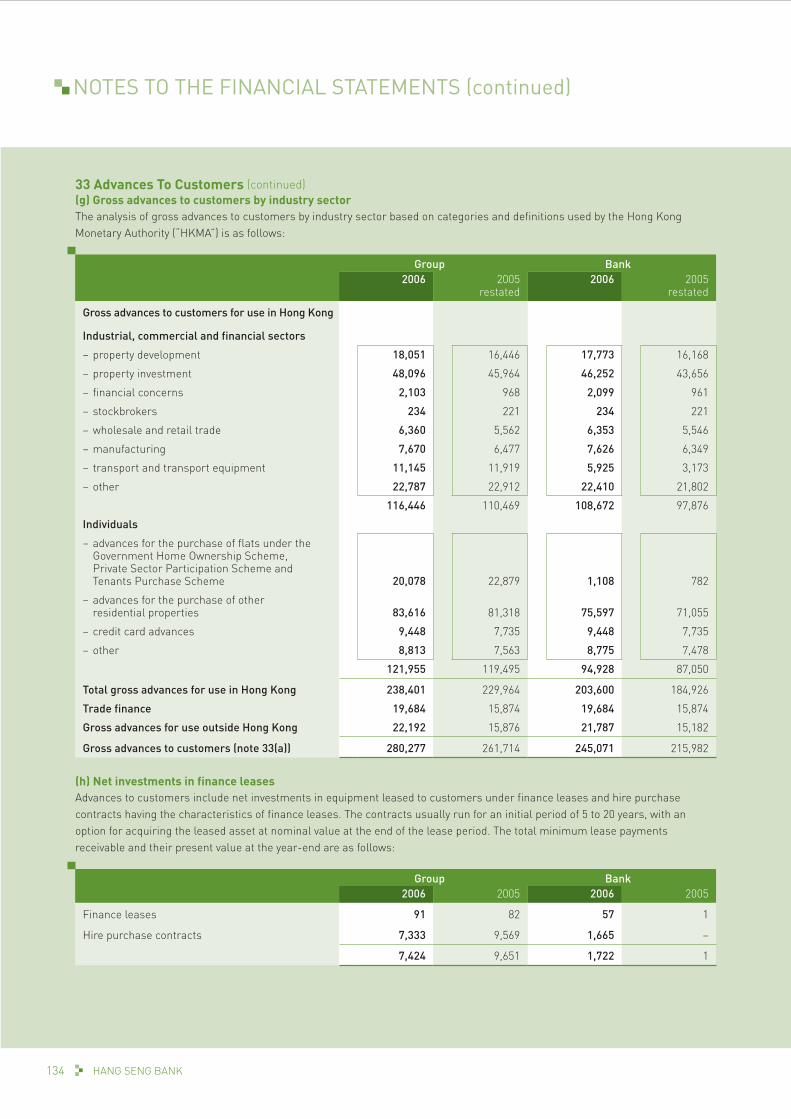
NOTES TO THE FINANCIAL STATEMENTS (continued)
HANG SENG BANK134
33 Advances To Customers (continued)(g) Gross advances to customers by industry sectorThe analysis of gross advances to customers by industry sector based on categories and definitions used by the Hong Kong Monetary Authority (“HKMA”) is as follows:
Group Bank2006 2005
restated2006 2005
restated
Gross advances to customers for use in Hong Kong
Industrial, commercial and financial sectors
– property development 18,051 16,446 17,773 16,168
– property investment 48,096 45,964 46,252 43,656
– financial concerns 2,103 968 2,099 961
– stockbrokers 234 221 234 221
– wholesale and retail trade 6,360 5,562 6,353 5,546
– manufacturing 7,670 6,477 7,626 6,349
– transport and transport equipment 11,145 11,919 5,925 3,173
– other 22,787 22,912 22,410 21,802
116,446 110,469 108,672 97,876
Individuals
– advances for the purchase of flats under theGovernment Home Ownership Scheme,Private Sector Participation Scheme andTenants Purchase Scheme 20,078 22,879 1,108 782
– advances for the purchase of otherresidential properties 83,616 81,318 75,597 71,055
– credit card advances 9,448 7,735 9,448 7,735
– other 8,813 7,563 8,775 7,478
121,955 119,495 94,928 87,050
Total gross advances for use in Hong Kong 238,401 229,964 203,600 184,926
Trade finance 19,684 15,874 19,684 15,874
Gross advances for use outside Hong Kong 22,192 15,876 21,787 15,182
Gross advances to customers (note 33(a)) 280,277 261,714 245,071 215,982
(h) Net investments in finance leasesAdvances to customers include net investments in equipment leased to customers under finance leases and hire purchase contracts having the characteristics of finance leases. The contracts usually run for an initial period of 5 to 20 years, with an option for acquiring the leased asset at nominal value at the end of the lease period. The total minimum lease payments receivable and their present value at the year-end are as follows:
Group Bank2006 2005 2006 2005
Finance leases 91 82 57 1
Hire purchase contracts 7,333 9,569 1,665 –
7,424 9,651 1,722 1

135ANNUAL REPORT 2006
33 Advances To Customers (continued)(h) Net investments in finance leases (continued)
GroupPresent value of
minimum lease
payments receivable
Interest income
relating to future
periods
Total minimum
lease payments receivable
2006
Amounts receivable:
– within one year 705 345 1,050
– after one year but within five years 1,775 1,082 2,857
– after five years 4,966 2,266 7,232
7,446 3,693 11,139
Loans impairment allowances (22)
Net investments in finance leases and hire purchase contracts 7,424
2005
Amounts receivable:
– within one year 808 451 1,259
– after one year but within five years 2,283 1,485 3,768
– after five years 6,591 2,624 9,215
9,682 4,560 14,242
Loans impairment allowances (31)
Net investments in finance leases and hire purchase contracts 9,651
BankPresent value of
minimum lease
payments receivable
Interest income
relating to future
periods
Total minimum
lease payments receivable
2006
Amounts receivable:
– within one year 231 69 300
– after one year but within five years 561 166 727
– after five years 933 663 1,596
1,725 898 2,623
Loans impairment allowances (3)
Net investments in finance leases and hire purchase contracts 1,722
2005
Amounts receivable:
– after one year but within five years 1 – 1
1 – 1
Loans impairment allowances –
Net investments in finance leases and hire purchase contracts 1

NOTES TO THE FINANCIAL STATEMENTS (continued)
HANG SENG BANK136
34 Financial Investments
Group Bank2006 2005 2006 2005
Available-for-sale at fair value:
– debt securities 209,463 177,813 162,308 142,067
– equity shares 2,110 1,360 114 53
Held-to-maturity debt securities at amortised cost 16,137 10,731 – –
227,710 189,904 162,422 142,120
Fair value of held-to-maturity debt securities 16,551 10,778 – –
Treasury bills 1,088 4,816 1,088 4,816
Certificates of deposit 25,020 27,048 17,440 23,118
Other debt securities 199,492 156,680 143,780 114,133
Debt securities 225,600 188,544 162,308 142,067
Equity shares 2,110 1,360 114 53
227,710 189,904 162,422 142,120
Debt securities:
– listed in Hong Kong 3,759 3,008 3,701 2,967
– listed outside Hong Kong 1,914 1,947 838 836
5,673 4,955 4,539 3,803
– unlisted 219,927 183,589 157,769 138,264
225,600 188,544 162,308 142,067
Equity shares:
– listed in Hong Kong 1,702 1,049 7 –
– listed outside Hong Kong 150 186 99 –
1,852 1,235 106 –
– unlisted 258 125 8 53
2,110 1,360 114 53
227,710 189,904 162,422 142,120
Fair value of listed financial investments 7,538 6,209 4,645 3,803
Debt securities
Issued by public bodies:
– central governments and central banks 8,321 15,981 7,530 15,030
– other public sector entities 7,044 8,667 6,354 7,010
15,365 24,648 13,884 22,040
Issued by other bodies:
– banks and other financial institutions 192,751 149,557 136,291 109,405
– corporate entities 17,484 14,339 12,133 10,622
210,235 163,896 148,424 120,027
225,600 188,544 162,308 142,067
Equity shares
Issued by corporate entities 2,110 1,360 114 53
227,710 189,904 162,422 142,120

137ANNUAL REPORT 2006
35 Investments In SubsidiariesThe principal subsidiaries of the Bank are:
Name of companyPlace ofincorporation Principal activities Issued equity capital
Hang Seng Finance Limited Hong Kong SAR Lending HK$1,000,000,000
Hang Seng Credit Limited Hong Kong SAR Lending HK$200,000,000
Hang Seng Bank (Bahamas) Limited Bahamas Banking US$1,000,000
Hang Seng Finance (Bahamas) Limited Bahamas Finance US$5,000
Hang Seng Bank (Trustee) Limited Hong Kong SAR Trustee service HK$3,000,000
Hang Seng (Nominee) Limited Hong Kong SAR Nominee service HK$100,000
Hang Seng Life Limited Hong Kong SAR Retirement benefits and life assurance
HK$970,000,000
Hang Seng Insurance Company Limited Hong Kong SAR General insurance HK$84,184,570
Hang Seng Asset Management Pte Ltd Singapore Fund management SG$2,000,000
Hang Seng Investment Management Limited Hong Kong SAR Fund management HK$10,000,000
Haseba Investment Company Limited Hong Kong SAR Investment holding HK$6,000
Hang Seng Securities Limited Hong Kong SAR Stockbroking HK$26,000,000
Yan Nin Development Company Limited Hong Kong SAR Investment holding HK$100,000
HSI Services Limited Hong Kong SAR Compilation and dissemination of the Hang Seng share index
HK$10,000
Hang Seng Real Estate Management Limited Hong Kong SAR Property management HK$10,000
All the above companies are wholly-owned subsidiaries except for Hang Seng Life Limited in which the Bank holds 50 per cent of its shareholding and controls the composition of its board of directors. All subsidiaries are held directly by the Bank except for HSI Services Limited. The principal places of operation are the same as the places of incorporation.
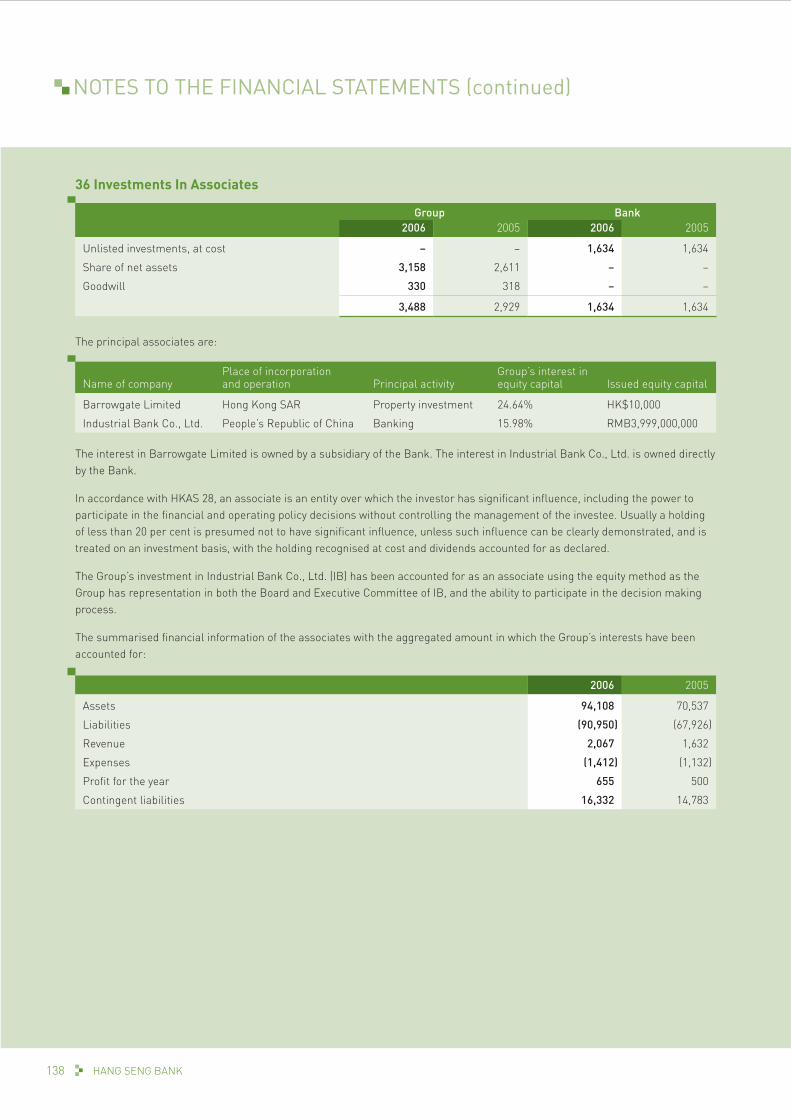
NOTES TO THE FINANCIAL STATEMENTS (continued)
HANG SENG BANK138
36 Investments In Associates
Group Bank2006 2005 2006 2005
Unlisted investments, at cost – – 1,634 1,634
Share of net assets 3,158 2,611 – –
Goodwill 330 318 – –
3,488 2,929 1,634 1,634
The principal associates are:
Name of companyPlace of incorporation and operation Principal activity
Group’s interest in equity capital Issued equity capital
Barrowgate Limited Hong Kong SAR Property investment 24.64% HK$10,000
Industrial Bank Co., Ltd. People’s Republic of China Banking 15.98% RMB3,999,000,000
The interest in Barrowgate Limited is owned by a subsidiary of the Bank. The interest in Industrial Bank Co., Ltd. is owned directly by the Bank.
In accordance with HKAS 28, an associate is an entity over which the investor has significant influence, including the power to participate in the financial and operating policy decisions without controlling the management of the investee. Usually a holding of less than 20 per cent is presumed not to have significant influence, unless such influence can be clearly demonstrated, and is treated on an investment basis, with the holding recognised at cost and dividends accounted for as declared.
The Group’s investment in Industrial Bank Co., Ltd. (IB) has been accounted for as an associate using the equity method as the Group has representation in both the Board and Executive Committee of IB, and the ability to participate in the decision making process.
The summarised financial information of the associates with the aggregated amount in which the Group’s interests have been accounted for:
2006 2005
Assets 94,108 70,537
Liabilities (90,950) (67,926)
Revenue 2,067 1,632
Expenses (1,412) (1,132)
Profit for the year 655 500
Contingent liabilities 16,332 14,783

139ANNUAL REPORT 2006
37 Investment PropertiesThe Group’s investment properties are stated at fair value as valued by independent professional valuer on at least an annual basis. The most recent valuation was performed by DTZ Debenham Tie Leung Limited, at 30 September 2006, who confirmed that there had been no material change in valuation at 31 December 2006. The valuation was carried out by qualified persons who are members of the Hong Kong Institute of Surveyors. The basis of the valuation for investment properties was open market value.
(a) Movement of investment properties
Group Bank2006 2005 2006 2005
At 1 January 4,273 3,383 2,644 2,046
Disposals (1,539) (116) (1,169) (95)
Surplus on revaluation credited to income statement (note 21) 304 1,160 127 802
Transfer to assets held for sale (355) – (83) –
Transfer from/(to) premises (note 38(a)) 49 (154) 38 (109)
At 31 December 2,732 4,273 1,557 2,644
Leaseholds
Held in Hong Kong
– long leases (over 50 years unexpired) 1,079 2,442 469 1,536
– medium leases (10 to 50 years unexpired) 1,652 1,830 1,087 1,107
Held outside Hong Kong
– medium leases (10 to 50 years unexpired) 1 1 1 1
2,732 4,273 1,557 2,644
(b) The Group leases out investment properties under operating leases. The leases typically run for an initial period of 2 years, and may contain an option to renew the lease after that date at which time all terms are renegotiated. None of the leases includes contingent rentals.
The direct operating expenses arising from investment properties were HK$29 million in 2006. (2005: HK$27 million). Of this amount, HK$26 million (2005: HK$25 million) was the direct operating expenses from investment properties that generated rental income.
The Group’s total future minimum lease payments receivable under non-cancellable operating leases are as follows:
Group Bank2006 2005 2006 2005
Less than one year 111 175 58 119
Five years or less but over one year 52 77 22 57
163 252 80 176

NOTES TO THE FINANCIAL STATEMENTS (continued)
HANG SENG BANK140
38 Premises, Plant And EquipmentThe Group’s premises were revalued by DTZ Debenham Tie Leung Limited, an independent professional valuer, at 30 September 2006, who confirmed that there had been no material change in valuation at 31 December 2006. The valuations were carried out by qualified persons who are members of the Hong Kong Institute of Surveyors. The basis of the valuation of premises was open market value for existing use.
(a) Movement of premises, plant and equipment
Group
PremisesPlant and
equipment Total
2006
Cost or valuation:
At 1 January 6,348 2,694 9,042
Exchange adjustments 3 4 7
Additions – 269 269
Disposals (683) (73) (756)
Elimination of accumulated depreciation on revalued premises (143) – (143)
Surplus on revaluation:
– credited to premises revaluation reserve 629 – 629
– credited to income statement (note 21) 17 – 17
Transfer to assets held for sale (100) – (100)
Transfer to investment property (note 37(a)) (49) – (49)
At 31 December 6,022 2,894 8,916
Accumulated depreciation:
At 1 January – (2,292) (2,292)
Exchange adjustments – (2) (2)
Charge for the year (note 16) (145) (178) (323)
Written off on disposal 2 72 74
Elimination of accumulated depreciation on revalued premises 143 – 143
At 31 December – (2,400) (2,400)
Net book value at 31 December 6,022 494 6,516

141ANNUAL REPORT 2006
38 Premises, Plant And Equipment (continued)(a) Movement of premises, plant and equipment (continued)
Group
PremisesPlant and
equipment Total
2005
Cost or valuation:
At 1 January 5,162 2,638 7,800
Exchange adjustments 2 2 4
Additions – 167 167
Disposals (49) (113) (162)
Elimination of accumulated depreciation on revalued premises (120) – (120)
Surplus on revaluation:
– credited to premises revaluation reserve 1,046 – 1,046
– credited to income statement (note 21) 153 – 153
Transfer from investment property (note 37(a)) 154 – 154
At 31 December 6,348 2,694 9,042
Accumulated depreciation:
At 1 January – (2,242) (2,242)
Charge for the year (note 16) (120) (160) (280)
Written off on disposal – 110 110
Elimination of accumulated depreciation on revalued premises 120 – 120
At 31 December – (2,292) (2,292)
Net book value at 31 December 6,348 402 6,750

NOTES TO THE FINANCIAL STATEMENTS (continued)
HANG SENG BANK142
38 Premises, Plant And Equipment (continued)(a) Movement of premises, plant and equipment (continued)
Bank
PremisesPlant and
equipment Total
2006
Cost or valuation:
At 1 January 4,398 2,670 7,068
Exchange adjustments 3 4 7
Additions – 267 267
Disposals (683) (72) (755)
Elimination of accumulated depreciation on revalued premises (98) – (98)
Surplus on revaluation:
– credited to premises revaluation reserve 208 – 208
– credited to income statement 12 – 12
Transfer to assets held for sale (74) – (74)
Transfer to investment property (note 37(a)) (38) – (38)
At 31 December 3,728 2,869 6,597
Accumulated depreciation:
At 1 January – (2,270) (2,270)
Exchange adjustments – (2) (2)
Charge for the year (100) (177) (277)
Written off on disposal 2 71 73
Elimination of accumulated depreciation on revalued premises 98 – 98
At 31 December – (2,378) (2,378)
Net book value at 31 December 3,728 491 4,219

143ANNUAL REPORT 2006
38 Premises, Plant And Equipment (continued)(a) Movement of premises, plant and equipment (continued)
Bank
PremisesPlant and
equipment Total
2005
Cost or valuation:
At 1 January 3,620 2,615 6,235
Exchange adjustments 2 2 4
Additions – 166 166
Disposals (49) (113) (162)
Elimination of accumulated depreciation on revalued premises (83) – (83)
Surplus on revaluation:
– credited to premises revaluation reserve 788 – 788
– credited to income statement 11 – 11
Transfer from investment property (note 37(a)) 109 – 109
At 31 December 4,398 2,670 7,068
Accumulated depreciation:
At 1 January – (2,222) (2,222)
Charge for the year (83) (158) (241)
Written off on disposal – 110 110
Elimination of accumulated depreciation on revalued premises 83 – 83
At 31 December – (2,270) (2,270)
Net book value at 31 December 4,398 400 4,798
(b) Terms of leaseThe net book value of premises comprises:
Group Bank2006 2005 2006 2005
Leaseholds
Held in Hong Kong:
– long leases (over 50 years unexpired) 1,284 1,984 653 1,339
– medium leases (10 to 50 years unexpired) 4,663 4,293 3,000 2,988
Held outside Hong Kong:
– long leases (over 50 years unexpired) 4 3 4 3
– medium leases (10 to 50 years unexpired) 71 68 71 68
6,022 6,348 3,728 4,398
(c) The carrying amount of all premises which have been stated in the balance sheet would have been as follows had they been stated at cost less accumulated depreciation:
Group Bank2006 2005 2006 2005
Cost less accumulated depreciation at 31 December 2,019 2,181 955 1,098

NOTES TO THE FINANCIAL STATEMENTS (continued)
HANG SENG BANK144
39 Interest In Leasehold Land Held For Own Use Under Operating LeaseThe Group’s interest in leasehold land held for own use is accounted for as operating lease. The lease is a medium term lease with 10 to 50 years unexpired and the net book value is as follows:
Group Bank2006 2005 2006 2005
At 1 January 594 609 594 609
Amortisation of prepaid operating lease payment (14) (15) (14) (15)
At 31 December 580 594 580 594
40 Intangible Assets
Group Bank2006 2005 2006 2005
Present value of in-force long-term insurance business 1,927 1,565 – –
Internally developed software 129 56 129 56
Acquired software 14 15 14 15
2,070 1,636 143 71
(a) Movement of present value of in-force long-term insurance business
Group2006 2005
At 1 January 1,565 1,249
Addition from current year new business 516 521
Movement from in-force business (163) (150)
Other movement 9 (55)
At 31 December 1,927 1,565
The key assumptions used in the computation of present value of in-force long-term insurance business (“PVIF”) are as follows:
2006 2005
Risk free rate 3.73% 4.19%
Risk discount rate 11.0% 11.0%
Expenses inflation 3.0% 3.0%
Average lapse rate:
– 1st year 5.0% 5.0%
– 2nd year onwards 2.0% 2.0%

145ANNUAL REPORT 2006
40 Intangible Assets (continued)(a) Movement of present value of in-force long-term insurance business (continued)
The following table shows the sensitivity of PVIF valuation to change in individual assumptions at balance sheet dates:
2006 2005
+100 basis points shift in risk-free rate 495 304
-100 basis points shift in risk-free rate (537) (338)
+100 basis points shift in risk discount rate (81) (60)
-100 basis points shift in risk discount rate 89 66
+100 basis points shift in expenses inflation (8) (7)
-100 basis points shift in expenses inflation 8 6
+100 basis points shift in lapse rate 371 202
-100 basis points shift in lapse rate (393) (211)
(b) Movement of internally developed application software and acquired software
Group Bank2006 2005 2006 2005
Cost:
At 1 January 164 103 164 103
Additions 110 64 110 64
Disposals (30) (3) (30) (3)
At 31 December 244 164 244 164
Accumulated amortisation:
At 1 January (93) (86) (93) (86)
Charge for the year (note 16) (10) (9) (10) (9)
Written off on disposals 2 2 2 2
At 31 December (101) (93) (101) (93)
Net book value at 31 December 143 71 143 71
41 Other Assets
Group Bank2006 2005 2006 2005
Items in the course of collection from other banks 6,036 8,068 6,036 8,068
Prepayments and accrued income 3,520 3,016 2,823 2,383
Deferred tax assets (note 48) 1 9 – –
Assets held for sale* 256 216 165 110
Acceptances and endorsements 2,855 2,371 2,855 2,371
Other accounts 2,218 1,545 1,577 904
14,886 15,225 13,456 13,836
* The accumulated income recognised directly in equity relating to assets held for sale for 2006 was HK$57 million (2005: nil).

NOTES TO THE FINANCIAL STATEMENTS (continued)
HANG SENG BANK146
42 Current, Savings And Other Deposit Accounts
Group Bank2006 2005 2006 2005
Current, savings and other deposit accounts:
– as stated in balance sheet 482,821 430,995 478,712 421,518
– structured deposits reported as trading liabilities (note 43) 35,066 24,422 35,066 24,422
517,887 455,417 513,778 445,940
By type:
– demand and current accounts 29,594 27,248 29,594 27,248
– savings accounts 223,255 188,839 223,255 188,839
– time and other deposits 265,038 239,330 260,929 229,853
517,887 455,417 513,778 445,940
43 Trading Liabilities
Group Bank2006 2005 2006 2005
Structured certificates of deposit and other debt securities in issue (note 45) 14,821 13,616 14,821 13,616
Structured deposits (note 42) 35,066 24,422 35,066 24,422
Short positions in securities and other 10,206 7,766 10,206 7,766
60,093 45,804 60,093 45,804
44 Financial Liabilities Designated At Fair Value
Group Bank2006 2005 2006 2005
4.125% callable fixed rate subordinated notes 987 967 987 967
Liabilities to customers under investment contracts 575 561 – –
1,562 1,528 987 967
At 31 December 2006, the difference between the carrying amount and the contractual amount of subordinated notes payable at maturity amounted to HK$13 million (2005: HK$33 million) and the accumulated amount of the change in fair value attributable to change in credit risk was HK$0.4 million (same as 2005).

147ANNUAL REPORT 2006
45 Certificates Of Deposit And Other Debt Securities In Issue
Group Bank2006 2005 2006 2005
Certificates of deposit and other debt securities in issue:
– as stated in balance sheet 7,595 10,023 7,623 10,060
– structured certificates of deposit andother debt securities in issue reportedas trading liabilities (note 43) 14,821 13,616 14,821 13,616
22,416 23,639 22,444 23,676
By type:
– certificates of deposit in issue 18,075 22,525 18,103 22,562
– other debt securities in issue 4,341 1,114 4,341 1,114
22,416 23,639 22,444 23,676
46 Other Liabilities
Group Bank2006 2005 2006 2005
Items in the course of transmission to other banks 6,469 6,517 6,469 6,517
Accruals 2,641 1,653 2,520 1,572
Acceptances and endorsements 2,855 2,371 2,855 2,371
Other 4,158 3,597 5,207 4,652
16,123 14,138 17,051 15,112
47 Liabilities To Customers Under Insurance Contracts
Group2006
Group2005
Gross Reinsurance Net Gross Reinsurance Net
Non-life insurance
Unearned premiums 177 (39) 138 174 (47) 127
Notified claims 147 (22) 125 156 (23) 133
Claims incurred but not reported 43 (11) 32 58 (17) 41
Other 39 (1) 38 34 (77) (43)
406 (73) 333 422 (164) 258
Policyholders’ liabilities
Life (non-linked) 22,382 (2) 22,380 14,727 (1) 14,726
Life (linked) 187 – 187 186 – 186
22,569 (2) 22,567 14,913 (1) 14,912
22,975 (75) 22,900 15,335 (165) 15,170

NOTES TO THE FINANCIAL STATEMENTS (continued)
HANG SENG BANK148
47 Liabilities To Customers Under Insurance Contracts (continued)The movement of liabilities under insurance contracts was as follows:
(a) Non-life insurance
GroupGross Reinsurance Net
2006
Unearned premiums
At 1 January 174 (47) 127
Gross written premiums 373 (78) 295
Gross earned premiums (399) 87 (312)
Exchange and other movements 29 (1) 28
At 31 December 177 (39) 138
Notified and incurred but not reported claims
At 1 January
– notified claims 156 (23) 133
– claims incurred but not reported 58 (17) 41
214 (40) 174
Claims paid (104) 14 (90)
Claims incurred 90 (7) 83
Exchange and other movements (10) – (10)
(24) 7 (17)
At 31 December
– notified claims 147 (22) 125
– claims incurred but not reported 43 (11) 32
190 (33) 157
Other 39 (1) 38
406 (73) 333

149ANNUAL REPORT 2006
47 Liabilities To Customers Under Insurance Contracts (continued)(a) Non-life insurance (continued)
GroupGross Reinsurance Net
2005
Unearned premiums
At 1 January 199 (55) 144
Gross written premiums 392 (103) 289
Gross earned premiums (411) 111 (300)
Exchange and other movements (6) – (6)
At 31 December 174 (47) 127
Notified and incurred but not reported claims
At 1 January
– notified claims 162 (21) 141
– claims incurred but not reported 62 (19) 43
224 (40) 184
Claims paid (107) (11) (118)
Claims incurred 98 9 107
Exchange and other movements (1) 2 1
(10) – (10)
At 31 December
– notified claims 156 (23) 133
– claims incurred but not reported 58 (17) 41
214 (40) 174
Other 34 (77) (43)
422 (164) 258
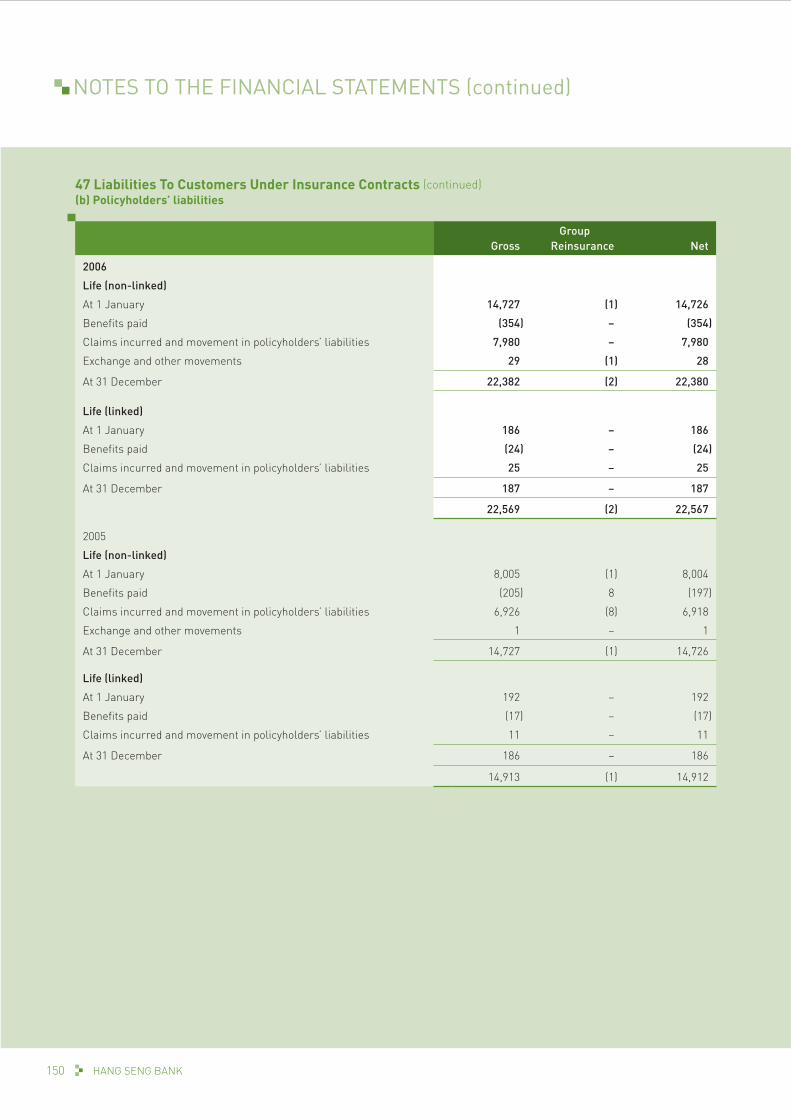
NOTES TO THE FINANCIAL STATEMENTS (continued)
HANG SENG BANK150
47 Liabilities To Customers Under Insurance Contracts (continued)(b) Policyholders’ liabilities
GroupGross Reinsurance Net
2006
Life (non-linked)
At 1 January 14,727 (1) 14,726
Benefits paid (354) – (354)
Claims incurred and movement in policyholders’ liabilities 7,980 – 7,980
Exchange and other movements 29 (1) 28
At 31 December 22,382 (2) 22,380
Life (linked)
At 1 January 186 – 186
Benefits paid (24) – (24)
Claims incurred and movement in policyholders’ liabilities 25 – 25
At 31 December 187 – 187
22,569 (2) 22,567
2005
Life (non-linked)
At 1 January 8,005 (1) 8,004
Benefits paid (205) 8 (197)
Claims incurred and movement in policyholders’ liabilities 6,926 (8) 6,918
Exchange and other movements 1 – 1
At 31 December 14,727 (1) 14,726
Life (linked)
At 1 January 192 – 192
Benefits paid (17) – (17)
Claims incurred and movement in policyholders’ liabilities 11 – 11
At 31 December 186 – 186
14,913 (1) 14,912
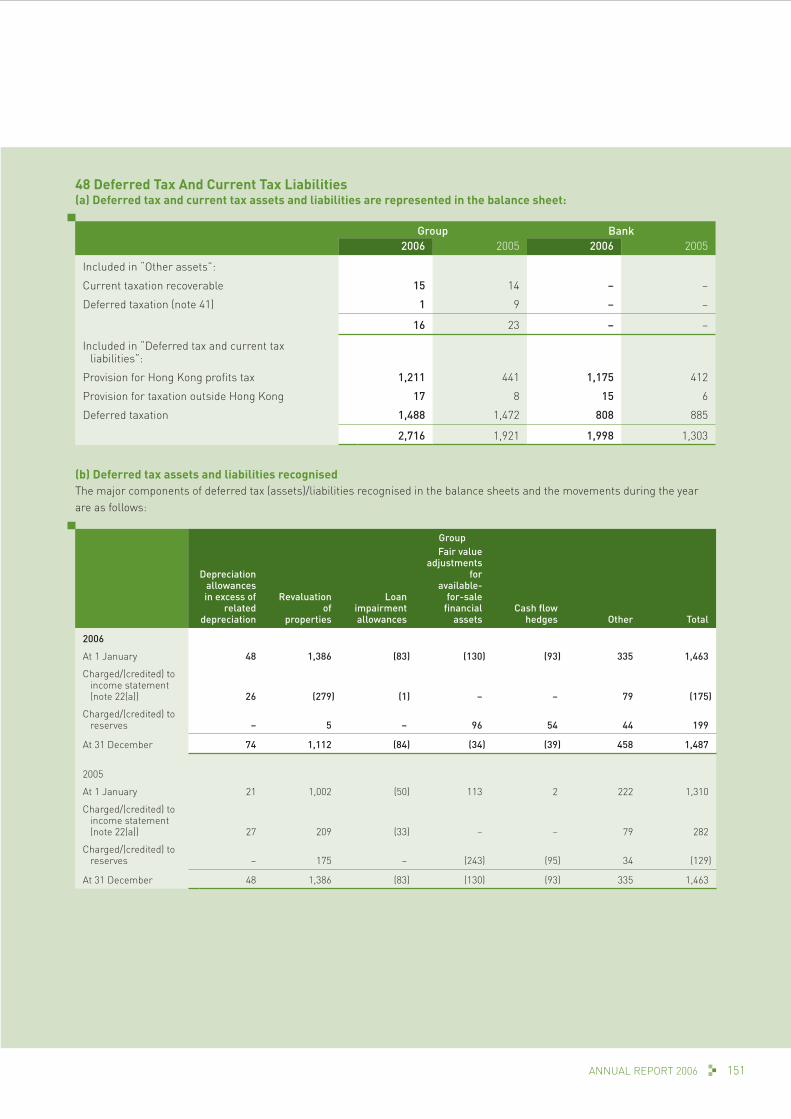
151ANNUAL REPORT 2006
48 Deferred Tax And Current Tax Liabilities(a) Deferred tax and current tax assets and liabilities are represented in the balance sheet:
Group Bank2006 2005 2006 2005
Included in “Other assets”:
Current taxation recoverable 15 14 – –
Deferred taxation (note 41) 1 9 – –
16 23 – –
Included in “Deferred tax and current tax liabilities”:
Provision for Hong Kong profits tax 1,211 441 1,175 412
Provision for taxation outside Hong Kong 17 8 15 6
Deferred taxation 1,488 1,472 808 885
2,716 1,921 1,998 1,303
(b) Deferred tax assets and liabilities recognisedThe major components of deferred tax (assets)/liabilities recognised in the balance sheets and the movements during the year are as follows:
Group
Depreciation allowances in excess of
related depreciation
Revaluation of
properties
Loan impairment allowances
Fair value adjustments
for available-
for-sale financial
assetsCash flow
hedges Other Total
2006
At 1 January 48 1,386 (83) (130) (93) 335 1,463
Charged/(credited) to income statement (note 22(a)) 26 (279) (1) – – 79 (175)
Charged/(credited) to reserves – 5 – 96 54 44 199
At 31 December 74 1,112 (84) (34) (39) 458 1,487
2005
At 1 January 21 1,002 (50) 113 2 222 1,310
Charged/(credited) to income statement (note 22(a)) 27 209 (33) – – 79 282
Charged/(credited) to reserves – 175 – (243) (95) 34 (129)
At 31 December 48 1,386 (83) (130) (93) 335 1,463
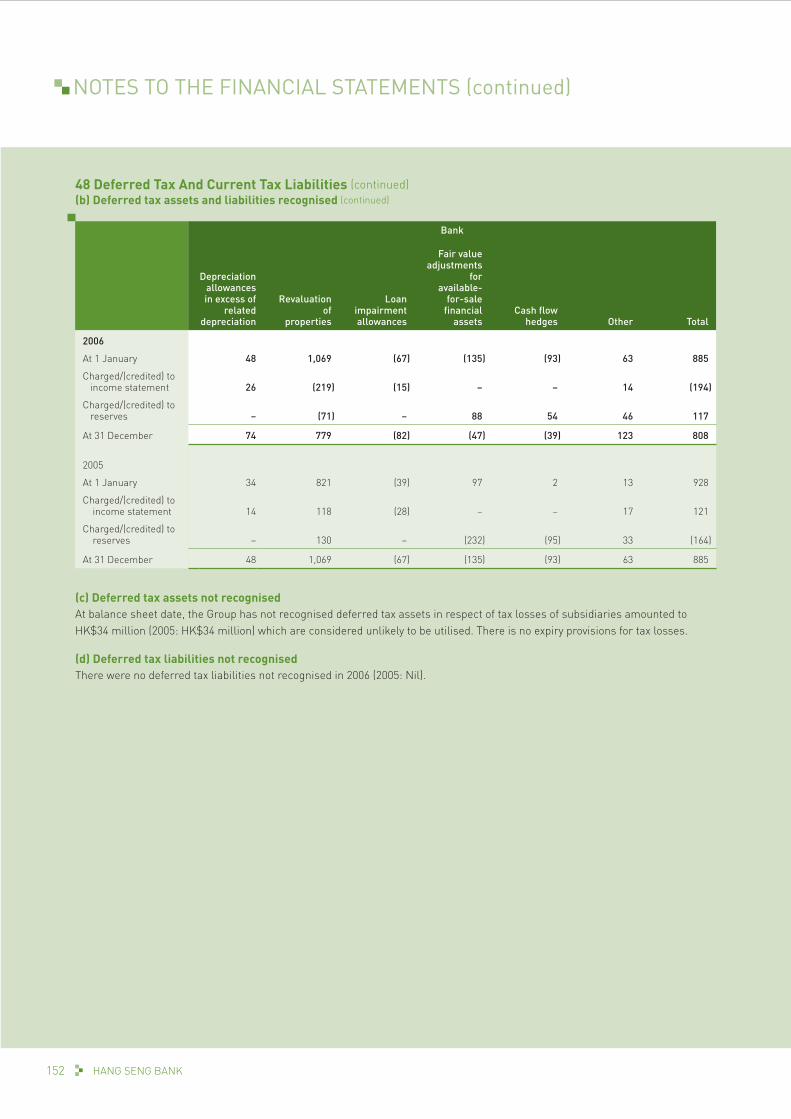
NOTES TO THE FINANCIAL STATEMENTS (continued)
HANG SENG BANK152
48 Deferred Tax And Current Tax Liabilities (continued)(b) Deferred tax assets and liabilities recognised (continued)
Bank
Depreciation allowances in excess of
related depreciation
Revaluation of
properties
Loan impairment allowances
Fair value adjustments
for available-
for-sale financial
assetsCash flow
hedges Other Total
2006
At 1 January 48 1,069 (67) (135) (93) 63 885
Charged/(credited) to income statement 26 (219) (15) – – 14 (194)
Charged/(credited) to reserves – (71) – 88 54 46 117
At 31 December 74 779 (82) (47) (39) 123 808
2005
At 1 January 34 821 (39) 97 2 13 928
Charged/(credited) to income statement 14 118 (28) – – 17 121
Charged/(credited) to reserves – 130 – (232) (95) 33 (164)
At 31 December 48 1,069 (67) (135) (93) 63 885
(c) Deferred tax assets not recognisedAt balance sheet date, the Group has not recognised deferred tax assets in respect of tax losses of subsidiaries amounted to HK$34 million (2005: HK$34 million) which are considered unlikely to be utilised. There is no expiry provisions for tax losses.
(d) Deferred tax liabilities not recognisedThere were no deferred tax liabilities not recognised in 2006 (2005: Nil).

153ANNUAL REPORT 2006
49 Subordinated Liabilities
Group Bank2006 2005 2006 2005
Nominal value Description
Amount owed to third parties
HK$1,500 million Callable floating rate subordinated notes due June 2015 (1) 1,496 1,495 1,496 1,495
HK$1,000 million 4.125% callable fixed rate subordinated notes due June 2015 (2) 987 967 987 967
US$450 million Callable floating rate subordinated notes due July 2016 (3) 3,483 – 3,483 –
Amount owed to HSBC Group undertakings
US$260 million Callable floating rate subordinated loan debt due December 2015 (4) 2,021 2,016 2,021 2,016
7,987 4,478 7,987 4,478
Representing:
– measured at amortised cost 7,000 3,511 7,000 3,511
– designated at fair value (note 44) 987 967 987 967
7,987 4,478 7,987 4,478
The above subordinated notes and loan each carries a one-time call option exercisable by the Group on a day falling five years plus one day after the relevant date of issue/drawdown.
(1) Interest rate at three-month HIBOR plus 0.35 per cent, payable quarterly, to the call option date. Thereafter, it will be reset to three-month HIBOR plus 0.85 per cent, payable quarterly.
(2) Interest rate at 4.125 per cent per annum, payable semi-annually, to the call option date. Thereafter, it will be reset to three-month HIBOR plus 0.825 per cent, payable quarterly.
(3) Interest rate at three-month US dollar LIBOR plus 0.30 per cent, payable quarterly, to the call option date. Thereafter, it will be reset to three-month US dollar LIBOR plus 0.80 per cent, payable quarterly.
(4) Interest rate at three-month US dollar LIBOR plus 0.31 per cent, payable quarterly, to the call option date. Thereafter, it will be reset to three-month US dollar LIBOR plus 0.81 per cent, payable quarterly.
50 Share CapitalAuthorised:The authorised share capital of the Bank is HK$11,000 million (2005: HK$11,000 million) divided into 2,200 million shares (2005: 2,200 million shares) of HK$5 each.
2006 2005
Issued and fully paid:
1,911,842,736 shares (2005: 1,911,842,736 shares) of HK$5 each 9,559 9,559
During the year, the Bank made no repurchase of its own shares (2005: Nil).

NOTES TO THE FINANCIAL STATEMENTS (continued)
HANG SENG BANK154
51 Reserves
Group Bank Associates
2006Retained profits 29,044 17,281 1,719Premises revaluation reserve 3,491 2,486 –Cash flow hedges reserve (220) (192) –Available-for-sale investments reserve 923 (165) 10Capital redemption reserve 99 99 –Other reserves 452 318 125
Total reserves 33,789 19,827 1,854Retained profitsAt 1 January 26,052 15,562 1,097Exchange and other adjustments 1 – –Profit attributable to shareholders 12,038 10,806 655Dividends (9,942) (9,942) (33)Transfer from premises revaluation reserve:– depreciation on revaluation surplus 77 61 –– realisation of revaluation surplus on disposal of premises 600 576 –Actuarial gains on defined benefit plans 218 218 –
At 31 December 29,044 17,281 1,719Premises revaluation reserve, net of taxAt 1 January 3,543 2,844 –Unrealised surplus on revaluation 519 171 –Transfer to retained profits:– depreciation on revaluation surplus (77) (61) –– realisation of revaluation surplus on disposal of premises (494) (468) –
At 31 December 3,491 2,486 –Cash flow hedges reserve, net of taxAt 1 January (483) (446) –Amounts recognised in equity during the year (179) (162) –Amounts removed from equity and included
in the income statement for the year 442 416 –
At 31 December (220) (192) –Available-for-sale investments reserve, net of taxAt 1 January (17) (635) 167Amounts recognised in equity during the year 1,232 510 (157)Transfer to income statement:– on impairment 12 – –– change in fair value of hedged items 21 24 –– on disposal (325) (64) –
At 31 December 923 (165) 10Capital redemption reserveAt 1 January and 31 December 99 99 –Other reservesAt 1 January 185 150 31Foreign exchange reserve 183 84 94Share options granted by ultimate holding company to the Group’s
employees 84 84 –
At 31 December 452 318 125
Total reserves at 31 December 33,789 19,827 1,854

155ANNUAL REPORT 2006
51 Reserves (continued)
Group Bank Associates
2005 (restated)Retained profits 26,052 15,562 1,097Premises revaluation reserve 3,543 2,844 –Cash flow hedges reserve (483) (446) –Available-for-sale investments reserve (17) (635) 167Capital redemption reserve 99 99 –Other reserves 185 150 31
Total reserves 29,379 17,574 1,295Retained profitsAt 1 January 24,389 15,169 672Exchange and other adjustments (2) – –Profit attributable to shareholders 11,342 10,080 500Dividends (9,942) (9,942) (75)Transfer from premises revaluation reserve:– depreciation on revaluation surplus 58 48 –– realisation of revaluation surplus on disposal of premises 49 49 –Actuarial gains on defined benefit plans 158 158 –
At 31 December 26,052 15,562 1,097Premises revaluation reserve, net of taxAt 1 January 2,778 2,281 –Unrealised surplus on revaluation 863 651 –Transfer to retained profits:– depreciation on revaluation surplus (58) (48) –– realisation of revaluation surplus on disposal of premises (40) (40) –
At 31 December 3,543 2,844 –Cash flow hedges reserve, net of taxAt 1 January 9 9 –Amounts recognised in equity during the year (524) (496) –Amounts removed from equity and included
in the income statement for the year 32 41 –
At 31 December (483) (446) –Available-for-sale investments reserve, net of taxAt 1 January 1,458 456 –Amounts recognised in equity during the year (1,237) (1,509) 167Transfer to income statement:– change in fair value of hedged items 249 245 –– on disposal (487) 173 –
At 31 December (17) (635) 167Capital redemption reserveAt 1 January and 31 December 99 99 –Other reservesAt 1 January 69 66 –Foreign exchange reserve 50 20 31Share options granted by ultimate holding company to the Group’s
employees 64 64 –Others 2 – –
At 31 December 185 150 31
Total reserves at 31 December 29,379 17,574 1,295

NOTES TO THE FINANCIAL STATEMENTS (continued)
HANG SENG BANK156
51 Reserves (continued)“Premises revaluation reserve”, “Cash flow hedges reserve”, “Available-for-sale investments reserve”, “Capital redemption reserve” and “Other reserves” do not represent realised profits and are not available for distribution.
The Bank and its banking subsidiaries operate under regulatory jurisdictions which require the maintenance of minimum capital adequacy ratios and which could therefore potentially restrict the amount of retained profits which can be distributed to shareholders.
In accordance with the HKMA guideline “Impact of the New Hong Kong Accounting Standards on Authorised Institutions’ Capital Base and Regulatory Reporting”, the Group has earmarked a “regulatory reserve” from retained profits of HK$518 million (2005: HK$510 million). This regulatory reserve is included as tier 2 capital together with the collective impairment allowances for the calculation of the Group’s capital adequacy ratios as disclosed in note 52.
52 Capital Adequacy RatiosThe Group’s capital adequacy ratios adjusted for market risk at 31 December, calculated in accordance with the guideline “Maintenance of Adequate Capital Against Market Risk” issued by the Hong Kong Monetary Authority, are as follows:
2006 2005
Adjusted total capital ratio 13.6% 12.8%
Adjusted tier 1 capital ratio 10.7% 10.4%
The Group’s capital adequacy ratios at 31 December, calculated in accordance with the Third Schedule of the Hong Kong Banking Ordinance, are as follows:
2006 2005
Total capital ratio 13.6% 12.8%
Tier 1 capital ratio 10.7% 10.4%

157ANNUAL REPORT 2006
53 Reconciliation Of Cash Flow Statement(a) Reconciliation of operating profit to net cash flow from operating activities
2006 2005restated
Operating profit 12,576 11,068
Net interest income (11,694) (10,796)
Dividend income (47) (60)
Loan impairment charges and other credit risk provisions 264 618
Depreciation 323 280
Amortisation of intangible assets 10 9
Amortisation of available-for-sale investments (532) 12
Amortisation of held-to-maturity debt securities 2 –
Advances written off net of recoveries (336) (575)
Interest received 22,232 14,262
Interest paid (16,693) (8,399)
Operating profit before changes in working capital 6,105 6,419
Change in treasury bills and certificates of deposit with original maturity more than three months 5,077 8,113
Change in placings with and advances to banks maturing after one month (9,035) 2,534
Change in trading assets 4,252 3,983
Change in financial assets designated at fair value (56) 1,060
Change in derivative financial instruments (433) (395)
Change in advances to customers (18,589) (8,857)
Change in other assets (6,427) (11,929)
Change in financial liabilities designated at fair value 20 –
Change in current, savings and other deposit accounts 51,826 (9,189)
Change in deposits from banks 5,637 110
Change in trading liabilities 14,289 29,263
Change in certificates of deposit and other debt securities in issue (2,428) (2,589)
Change in other liabilities 8,458 9,423
Elimination of exchange differences and other non-cash items (3,707) 315
Cash generated from operating activities 54,989 28,261
Taxation paid (1,448) (1,421)
Net cash inflow from operating activities 53,541 26,840
(b) Analysis of the balances of cash and cash equivalents
2006 2005
Cash and balances with banks and other financial institutions 9,390 9,201
Placings with and advances to banks and other financial institutions maturing within one month 74,072 53,294
Treasury bills 5,158 3,018
Certificates of deposit 1,655 –
90,275 65,513
The balances of cash and cash equivalents included cash balances with central banks and financial institutions that are subject to exchange control and regulatory restrictions, amounting to HK$3,718 million at 31 December 2006 (2005: HK$2,911 million).

NOTES TO THE FINANCIAL STATEMENTS (continued)
HANG SENG BANK158
54 Contingent Liabilities, Commitments And Derivatives
Group
Contract amount
Credit equivalent
amount
Risk-weighted
amount
2006
Contingent liabilities:
Guarantees 4,150 3,877 3,679
Commitments:
Documentary credits and short-term trade-related transactions 8,717 1,745 1,738
Undrawn formal standby facilities, credit lines and other commitments to lend:
– under one year 142,463 – –
– one year and over 18,719 9,360 8,696
Other 193 193 193
170,092 11,298 10,627
Exchange rate contracts:
Spot and forward foreign exchange 267,822 2,715 591
Other exchange rate contracts 64,377 499 110
332,199 3,214 701
Interest rate contracts:
Interest rate swaps 162,969 1,376 295
Other interest rate contracts 2,350 2 –
165,319 1,378 295
Other derivative contracts 5,668 382 90
2005
Contingent liabilities:
Guarantees 4,133 3,907 3,131
Commitments:
Documentary credits and short-term trade-related transactions 7,402 1,480 1,480
Undrawn formal standby facilities, credit lines and other commitments to lend:
– under one year 109,369 – –
– one year and over 20,385 10,193 9,158
Other 220 220 220
137,376 11,893 10,858
Exchange rate contracts:
Spot and forward foreign exchange 188,088 1,426 333
Other exchange rate contracts 15,176 193 48
203,264 1,619 381
Interest rate contracts:
Interest rate swaps 161,083 1,472 308
Other interest rate contracts 4,255 20 4
165,338 1,492 312
Other derivative contracts 1,194 86 17

159ANNUAL REPORT 2006
54 Contingent Liabilities, Commitments And Derivatives (continued)
Bank
Contract amount
Credit equivalent
amount
Risk-weighted
amount
2006
Contingent liabilities:
Guarantees 4,554 4,281 4,083
Commitments:
Documentary credits and short-term trade-related transactions 8,717 1,745 1,738
Undrawn formal standby facilities, credit lines and other commitments to lend:
– under one year 141,902 – –
– one year and over 18,539 9,270 8,606
Other 50 50 50
169,208 11,065 10,394
Exchange rate contracts:
Spot and forward foreign exchange 270,972 2,747 607
Other exchange rate contracts 64,377 499 110
335,349 3,246 717
Interest rate contracts:
Interest rate swaps 155,225 1,260 272
Other interest rate contracts 2,350 2 –
157,575 1,262 272
Other derivative contracts 5,668 382 90
2005
Contingent liabilities:
Guarantees 4,533 4,308 3,531
Commitments:
Documentary credits and short-term trade-related transactions 7,402 1,480 1,480
Undrawn formal standby facilities, credit lines and other commitments to lend:
– under one year 109,089 – –
– one year and over 20,205 10,103 9,068
Other 44 44 44
136,740 11,627 10,592
Exchange rate contracts:
Spot and forward foreign exchange 191,433 1,459 349
Other exchange rate contracts 15,176 193 48
206,609 1,652 397
Interest rate contracts:
Interest rate swaps 151,982 1,343 282
Other interest rate contracts 4,255 20 4
156,237 1,363 286
Other derivative contracts 1,194 86 17

NOTES TO THE FINANCIAL STATEMENTS (continued)
HANG SENG BANK160
54 Contingent Liabilities, Commitments And Derivatives (continued)The tables above give the nominal contract, credit equivalent and risk-weighted amounts of off-balance sheet transactions. The credit equivalent amounts are calculated for the purposes of deriving the risk-weighted amounts. These are assessed in accordance with the Third Schedule of the Hong Kong Banking Ordinance (“the Third Schedule”) on capital adequacy and depend on the status of the counterparty and the maturity characteristics. The risk weights used range from 0 per cent to 100 per cent for contingent liabilities and commitments, and from 0 per cent to 50 per cent for exchange rate, interest rate and other derivative contracts.
In accordance with the Third Schedule, contingent liabilities and commitments are credit-related instruments that include acceptances and endorsements, letters of credit, guarantees and commitments to extend credit. The risk involved is essentially the same as the credit risk involved in extending loan facilities to customers. These transactions are, therefore, subject to the same credit origination, portfolio maintenance and collateral requirements as for customers applying for loans. As the facilities may expire without being drawn upon, the total of the contract amounts is not representative of future liquidity requirements.
In accordance with HKAS 39, acceptances and endorsements are recognised on the balance sheet in “Other assets” and “Other liabilities”. These acceptances and endorsements are included in the capital adequacy calculation as contingencies in accordance with the Third Schedule.
Derivative financial instruments arise from futures, forward, swap and option transactions undertaken in the foreign exchange, interest rate and equity markets. The contract amounts of these instruments indicate the volume of transactions outstanding at the balance sheet date and do not represent amounts at risk. The credit equivalent amount of these instruments is measured as the sum of positive marked-to-market values and the potential future credit exposure in accordance with the Third Schedule.
Derivative financial instruments are held for trading or designated as either fair value hedge or cash flow hedges. The following table shows the nominal contract amounts and marked-to-market value of assets and liabilities by each class of derivatives.
Group2006 2005
Trading Hedging Trading Hedging
Contract amounts:
Interest rate contracts 105,001 60,318 102,233 63,105
Exchange rate contracts 332,199 – 203,264 –
Other derivative contracts 5,668 – 1,194 –
442,868 60,318 306,691 63,105
Derivative assets:
Interest rate contracts 435 513 481 454
Exchange rate contracts 866 – 776 –
Other derivative contracts 73 – 4 –
1,374 513 1,261 454
Derivative liabilities:
Interest rate contracts 573 217 998 457
Exchange rate contracts 722 – 310 –
Other derivative contracts 19 – 27 –
1,314 217 1,335 457

161ANNUAL REPORT 2006
54 Contingent Liabilities, Commitments And Derivatives (continued)
Bank2006 2005
Trading Hedging Trading Hedging
Contract amounts:
Interest rate contracts 103,302 54,273 98,774 57,463
Exchange rate contracts 335,349 – 206,609 –
Other derivative contracts 5,668 – 1,194 –
444,319 54,273 306,577 57,463
Derivative assets:
Interest rate contracts 429 419 462 381
Exchange rate contracts 866 – 776 –
Other derivative contracts 73 – 4 –
1,368 419 1,242 381
Derivative liabilities:
Interest rate contracts 563 216 978 456
Exchange rate contracts 722 – 310 –
Other derivative contracts 19 – 27 –
1,304 216 1,315 456
The above derivative assets and liabilities, being the positive or negative marked-to-market value of the respective derivative contracts, represent gross replacement costs, as none of these contracts are subject to any bilateral netting arrangements.
55 Assets Pledged As Security For LiabilitiesAt 31 December 2006, liabilities of the Group and the Bank amounting to HK$10,651 million (2005: HK$7,858 million) were secured by the deposit of assets, including assets subject to sale and repurchase arrangements. The amounts of assets pledged by the Group and the Bank to secure these liabilities was HK$11,412 million (2005: HK$7,997 million) and mainly comprised items included in “Trading assets” and “Financial investments”.
56 Capital Commitments
Group Bank2006 2005 2006 2005
Expenditure authorised and contracted for 141 113 141 111
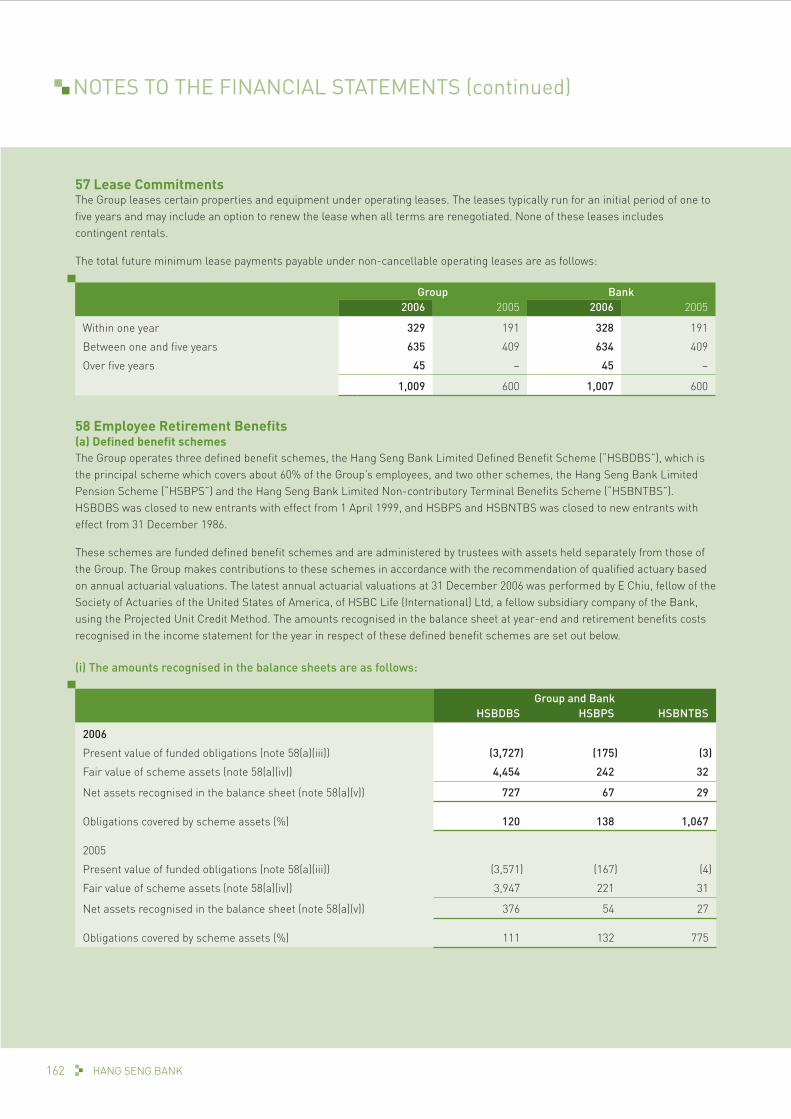
NOTES TO THE FINANCIAL STATEMENTS (continued)
HANG SENG BANK162
57 Lease CommitmentsThe Group leases certain properties and equipment under operating leases. The leases typically run for an initial period of one to five years and may include an option to renew the lease when all terms are renegotiated. None of these leases includes contingent rentals.
The total future minimum lease payments payable under non-cancellable operating leases are as follows:
Group Bank2006 2005 2006 2005
Within one year 329 191 328 191
Between one and five years 635 409 634 409
Over five years 45 – 45 –
1,009 600 1,007 600
58 Employee Retirement Benefits(a) Defined benefit schemesThe Group operates three defined benefit schemes, the Hang Seng Bank Limited Defined Benefit Scheme (“HSBDBS”), which is the principal scheme which covers about 60% of the Group’s employees, and two other schemes, the Hang Seng Bank Limited Pension Scheme (“HSBPS”) and the Hang Seng Bank Limited Non-contributory Terminal Benefits Scheme (“HSBNTBS”). HSBDBS was closed to new entrants with effect from 1 April 1999, and HSBPS and HSBNTBS was closed to new entrants with effect from 31 December 1986.
These schemes are funded defined benefit schemes and are administered by trustees with assets held separately from those of the Group. The Group makes contributions to these schemes in accordance with the recommendation of qualified actuary based on annual actuarial valuations. The latest annual actuarial valuations at 31 December 2006 was performed by E Chiu, fellow of the Society of Actuaries of the United States of America, of HSBC Life (International) Ltd, a fellow subsidiary company of the Bank, using the Projected Unit Credit Method. The amounts recognised in the balance sheet at year-end and retirement benefits costs recognised in the income statement for the year in respect of these defined benefit schemes are set out below.
(i) The amounts recognised in the balance sheets are as follows:
Group and BankHSBDBS HSBPS HSBNTBS
2006
Present value of funded obligations (note 58(a)(iii)) (3,727) (175) (3)
Fair value of scheme assets (note 58(a)(iv)) 4,454 242 32
Net assets recognised in the balance sheet (note 58(a)(v)) 727 67 29
Obligations covered by scheme assets (%) 120 138 1,067
2005
Present value of funded obligations (note 58(a)(iii)) (3,571) (167) (4)
Fair value of scheme assets (note 58(a)(iv)) 3,947 221 31
Net assets recognised in the balance sheet (note 58(a)(v)) 376 54 27
Obligations covered by scheme assets (%) 111 132 775

163ANNUAL REPORT 2006
58 Employee Retirement Benefits (continued)(a) Defined benefit schemes (continued)
(ii) The composition of the scheme assets are as follows:
Group and BankHSBDBS HSBPS HSBNTBS
2006
Equity 2,312 36 –
Bonds 1,880 169 –
Certificates of deposit issued by the Bank 4 – –
Ordinary shares issued by ultimate holding company 66 – –
Other 192 37 32
4,454 242 32
2005
Equity 1,639 32 –
Bonds 1,776 157 –
Ordinary shares issued by ultimate holding company 168 – –
Other 364 32 31
3,947 221 31
(iii) Change in the present value of scheme obligations
Group and BankHSBDBS HSBPS HSBNTBS
2006
At 1 January 3,571 167 4
Current service cost 172 – –
Interest cost 150 7 –
Actuarial losses 132 16 1
Benefits paid (298) (15) (2)
At 31 December 3,727 175 3
2005
At 1 January 3,663 182 4
Current service cost 187 1 –
Interest cost 148 7 –
Actuarial (gains)/losses (118) (6) 1
Benefits paid (309) (17) (1)
At 31 December 3,571 167 4
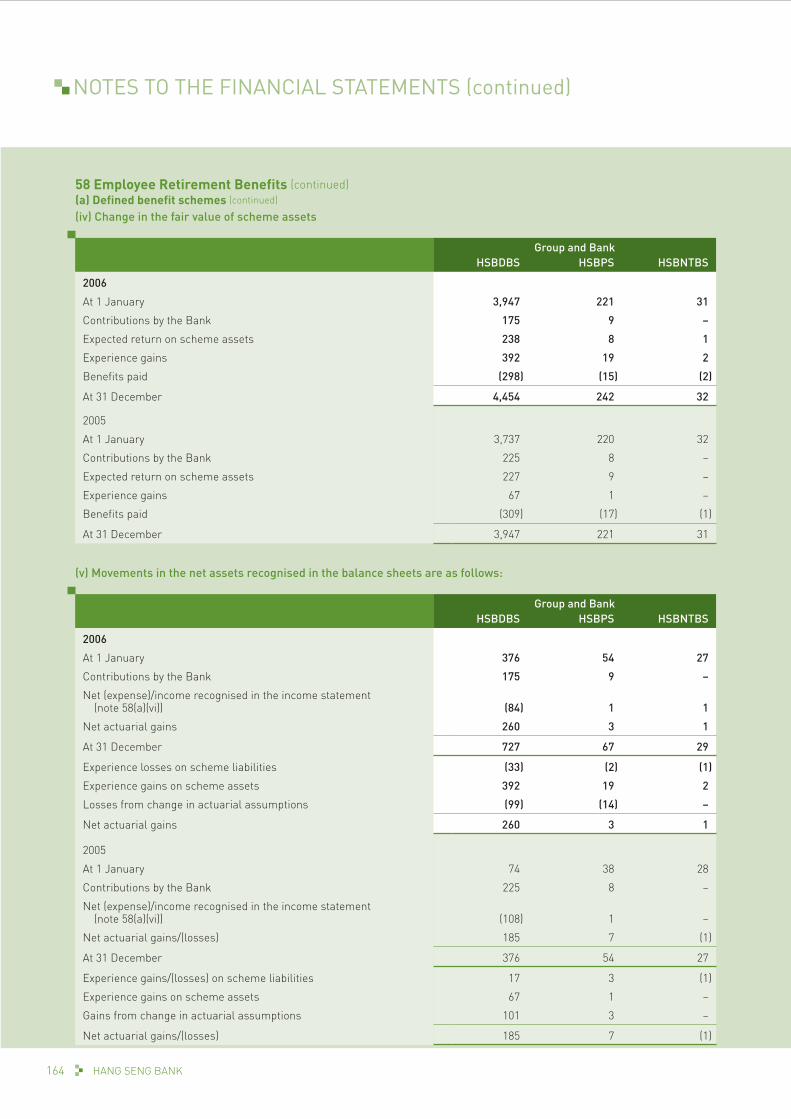
NOTES TO THE FINANCIAL STATEMENTS (continued)
HANG SENG BANK164
58 Employee Retirement Benefits (continued)(a) Defined benefit schemes (continued)
(iv) Change in the fair value of scheme assets
Group and BankHSBDBS HSBPS HSBNTBS
2006
At 1 January 3,947 221 31
Contributions by the Bank 175 9 –
Expected return on scheme assets 238 8 1
Experience gains 392 19 2
Benefits paid (298) (15) (2)
At 31 December 4,454 242 32
2005
At 1 January 3,737 220 32
Contributions by the Bank 225 8 –
Expected return on scheme assets 227 9 –
Experience gains 67 1 –
Benefits paid (309) (17) (1)
At 31 December 3,947 221 31
(v) Movements in the net assets recognised in the balance sheets are as follows:
Group and BankHSBDBS HSBPS HSBNTBS
2006
At 1 January 376 54 27
Contributions by the Bank 175 9 –
Net (expense)/income recognised in the income statement (note 58(a)(vi)) (84) 1 1
Net actuarial gains 260 3 1
At 31 December 727 67 29
Experience losses on scheme liabilities (33) (2) (1)
Experience gains on scheme assets 392 19 2
Losses from change in actuarial assumptions (99) (14) –
Net actuarial gains 260 3 1
2005
At 1 January 74 38 28
Contributions by the Bank 225 8 –
Net (expense)/income recognised in the income statement (note 58(a)(vi)) (108) 1 –
Net actuarial gains/(losses) 185 7 (1)
At 31 December 376 54 27
Experience gains/(losses) on scheme liabilities 17 3 (1)
Experience gains on scheme assets 67 1 –
Gains from change in actuarial assumptions 101 3 –
Net actuarial gains/(losses) 185 7 (1)
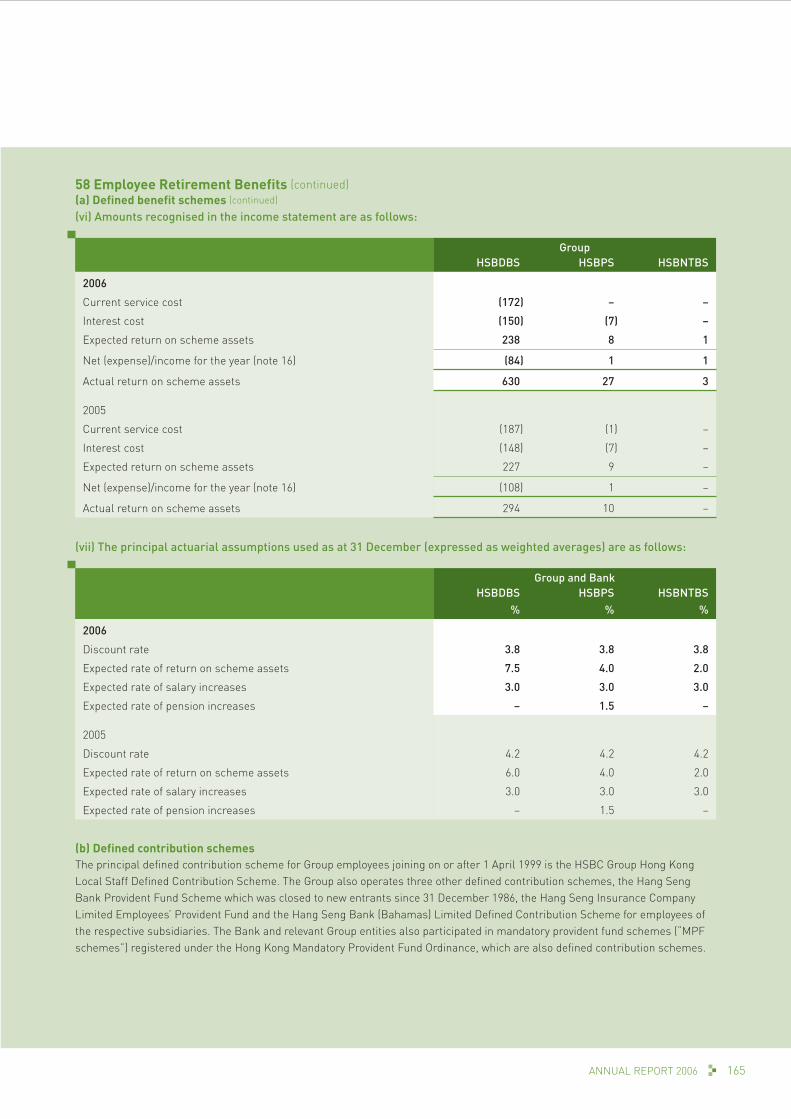
165ANNUAL REPORT 2006
58 Employee Retirement Benefits (continued)(a) Defined benefit schemes (continued)
(vi) Amounts recognised in the income statement are as follows:
GroupHSBDBS HSBPS HSBNTBS
2006
Current service cost (172) – –
Interest cost (150) (7) –
Expected return on scheme assets 238 8 1
Net (expense)/income for the year (note 16) (84) 1 1
Actual return on scheme assets 630 27 3
2005
Current service cost (187) (1) –
Interest cost (148) (7) –
Expected return on scheme assets 227 9 –
Net (expense)/income for the year (note 16) (108) 1 –
Actual return on scheme assets 294 10 –
(vii) The principal actuarial assumptions used as at 31 December (expressed as weighted averages) are as follows:
Group and BankHSBDBS HSBPS HSBNTBS
% % %
2006
Discount rate 3.8 3.8 3.8
Expected rate of return on scheme assets 7.5 4.0 2.0
Expected rate of salary increases 3.0 3.0 3.0
Expected rate of pension increases – 1.5 –
2005
Discount rate 4.2 4.2 4.2
Expected rate of return on scheme assets 6.0 4.0 2.0
Expected rate of salary increases 3.0 3.0 3.0
Expected rate of pension increases – 1.5 –
(b) Defined contribution schemesThe principal defined contribution scheme for Group employees joining on or after 1 April 1999 is the HSBC Group Hong Kong Local Staff Defined Contribution Scheme. The Group also operates three other defined contribution schemes, the Hang Seng Bank Provident Fund Scheme which was closed to new entrants since 31 December 1986, the Hang Seng Insurance Company Limited Employees’ Provident Fund and the Hang Seng Bank (Bahamas) Limited Defined Contribution Scheme for employees of the respective subsidiaries. The Bank and relevant Group entities also participated in mandatory provident fund schemes (“MPF schemes”) registered under the Hong Kong Mandatory Provident Fund Ordinance, which are also defined contribution schemes.

NOTES TO THE FINANCIAL STATEMENTS (continued)
HANG SENG BANK166
58 Employee Retirement Benefits (continued)(b) Defined contribution schemes (continued)Contributions made in accordance with the relevant scheme rules to these defined contribution schemes (including MPF schemes) are charged to the income statement as below:
2006 2005
Amounts charged to the income statement (note 16) 42 30
59 Share-Based PaymentsThe Group participated in various share compensation plans operated by the HSBC Group for acquiring of HSBC Holdings plc shares. They are the Savings-Related Share Option Plan, Executive/Group Share Option Plan and Restricted Share Plan/Performance Share Awards/Achievement Share Awards. Analysis of the movement in the number of share options and exercise price of these plans is set out below.
(a) Savings-Related Share Option PlanThe Savings-Related Share Option Plan invites eligible employees to enter into savings contracts to save Hong Kong dollar equivalent of up to £250 per month, with the option to use the savings to acquire shares. The options are exercisable within six months following between the first and fifth anniversaries of the commencement of the savings contract depending on conditions set at grant. The exercise price is at a 20 per cent discount to the market value at the date of grant.
(i) Movements in the number of share options held by employees are as follows:
2006 2005Weighted
average exercise
price£
Number(’000)
Weighted average exercise
price£
Number(’000)
At 1 January 6.10 5,566 5.93 5,671
Granted in the year 7.49 1,701 6.68 1,551
Exercised in the year 5.42 (1,865) 6.07 (1,301)
Lapsed in the year 6.10 (377) 5.93 (355)
At 31 December 6.78 5,025 6.10 5,566
Amounts charged to the income statement (note 16) 53 44
Options vested at 31 December 8 –
(ii) Details of share options granted during the year:
2006 2005
Exercise periodExercise price
£Number
(’000)Number
(’000)
1 Aug 2007 to 31 Jan 2008 7.49 411 –
1 Aug 2008 to 31 Jan 2009 6.68 – 1,234
1 Aug 2009 to 31 Jan 2010 7.49 1,072 –
1 Aug 2010 to 31 Jan 2011 6.68 – 317
1 Aug 2011 to 31 Jan 2012 7.49 218 –
1,701 1,551
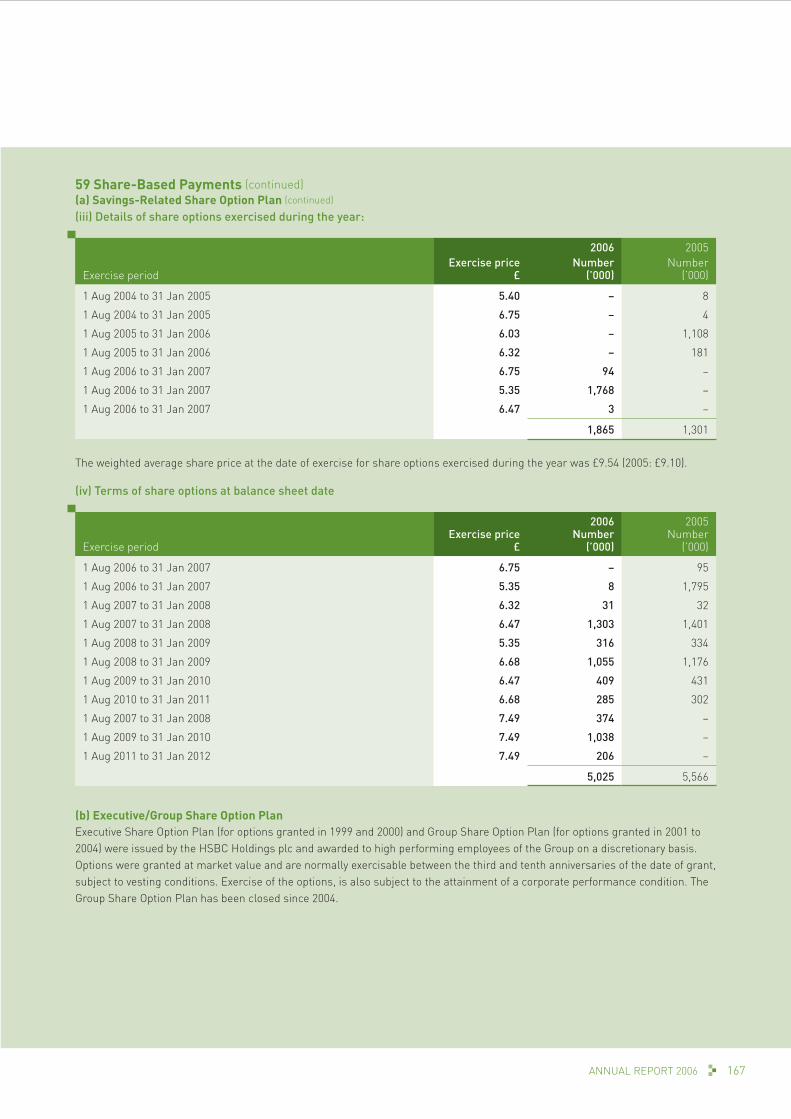
167ANNUAL REPORT 2006
59 Share-Based Payments (continued)(a) Savings-Related Share Option Plan (continued)
(iii) Details of share options exercised during the year:
2006 2005
Exercise periodExercise price
£Number
(’000)Number
(’000)
1 Aug 2004 to 31 Jan 2005 5.40 – 8
1 Aug 2004 to 31 Jan 2005 6.75 – 4
1 Aug 2005 to 31 Jan 2006 6.03 – 1,108
1 Aug 2005 to 31 Jan 2006 6.32 – 181
1 Aug 2006 to 31 Jan 2007 6.75 94 –
1 Aug 2006 to 31 Jan 2007 5.35 1,768 –
1 Aug 2006 to 31 Jan 2007 6.47 3 –
1,865 1,301
The weighted average share price at the date of exercise for share options exercised during the year was £9.54 (2005: £9.10).
(iv) Terms of share options at balance sheet date
Exercise periodExercise price
£
2006Number
(’000)
2005Number
(’000)
1 Aug 2006 to 31 Jan 2007 6.75 – 95
1 Aug 2006 to 31 Jan 2007 5.35 8 1,795
1 Aug 2007 to 31 Jan 2008 6.32 31 32
1 Aug 2007 to 31 Jan 2008 6.47 1,303 1,401
1 Aug 2008 to 31 Jan 2009 5.35 316 334
1 Aug 2008 to 31 Jan 2009 6.68 1,055 1,176
1 Aug 2009 to 31 Jan 2010 6.47 409 431
1 Aug 2010 to 31 Jan 2011 6.68 285 302
1 Aug 2007 to 31 Jan 2008 7.49 374 –
1 Aug 2009 to 31 Jan 2010 7.49 1,038 –
1 Aug 2011 to 31 Jan 2012 7.49 206 –
5,025 5,566
(b) Executive/Group Share Option PlanExecutive Share Option Plan (for options granted in 1999 and 2000) and Group Share Option Plan (for options granted in 2001 to 2004) were issued by the HSBC Holdings plc and awarded to high performing employees of the Group on a discretionary basis. Options were granted at market value and are normally exercisable between the third and tenth anniversaries of the date of grant, subject to vesting conditions. Exercise of the options, is also subject to the attainment of a corporate performance condition. The Group Share Option Plan has been closed since 2004.

NOTES TO THE FINANCIAL STATEMENTS (continued)
HANG SENG BANK168
59 Share-Based Payments (continued)(b) Executive/Group Share Option Plan (continued)
(i) Movements in the number of share options held by employees are as follows:
2006 2005Weighted
average exercise
price£
Number(’000)
Weighted average exercise
price£
Number(’000)
At 1 January 7.80 5,031 7.76 5,935
Exercised in the year 7.63 (1,450) 7.45 (617)
Lapsed in the year 7.80 (116) 7.76 (287)
At 31 December 7.86 3,465 7.80 5,031
Amounts charged to the income statement (note 16) 31 20
Options vested at 31 December 2,378 2,803
(ii) Details of share options exercised during the year:
2006 2005
Exercise periodExercise price
£Number
(’000)Number
(’000)
1 Apr 1999 to 31 Mar 2006 3.33 – 9
24 Mar 2000 to 23 Apr 2007 5.02 7 –
16 Mar 2001 to 15 Mar 2008 6.28 – 8
29 Mar 2002 to 28 Mar 2009 6.38 195 213
3 Apr 2003 to 2 Apr 2010 7.46 197 131
23 Apr 2004 to 22 Apr 2011 8.71 325 105
7 May 2005 to 6 May 2012 8.41 315 151
2 May 2006 to 1 May 2013 6.91 410 –
30 Apr 2007 to 29 Apr 2017 8.28 1 –
1,450 617
The weighted average share price at the date of exercise for share options exercised during the year was £9.59 (2005: £8.89).
(iii) Terms of share options at balance sheet date
2006 2005
Exercise periodExercise price
£Number
(’000)Number
(’000)
24 Mar 2000 to 23 Apr 2007 5.02 – 8
29 Mar 2002 to 28 Mar 2009 6.38 349 544
3 Apr 2003 to 2 Apr 2010 7.46 318 516
23 Apr 2004 to 22 Apr 2011 8.71 567 896
7 May 2005 to 6 May 2012 8.41 524 839
2 May 2006 to 1 May 2013 6.91 620 1,047
30 Apr 2007 to 29 Apr 2017 8.28 1,087 1,181
3,465 5,031

169ANNUAL REPORT 2006
59 Share-Based Payments (continued)(c) Calculation of fair valueThe recognition of compensation cost of share option is based on the fair value of the options on grant date. The calculation of the fair value of HSBC share option is centrally managed by HSBC Holdings plc. Fair values of share options, measured at the date of grant of the options are calculated using a binomial lattice model methodology that is based on the underlying assumptions of the Black-Scholes model. The expected life of options depends on the behaviour of option holders, which is incorporated into the option model consistent with historic observable data. The fair values calculated are inherently subjective and uncertain due to the assumptions made and the limitations of the model used.
The significant weighted average assumptions used to estimate the fair value of the options granted in 2006 are as follows:
1–year Savings-Related
Share Option Plan
3–year Savings-Related
Share Option Plan
5–year Savings-Related
Share Option Plan
Risk-free interest rate (%) 4.7 4.8 4.7
Expected life (years) 1 3 5
Expected volatility (%) 17 17 17
The risk-free rate was determined from the UK gilts yield curve for Savings Related Share Option Plan. Expected life is not a single input parameter but a function of various behavioural assumptions. Expected volatility is estimated by considering both historic average share price volatility and implied volatility derived from traded options over HSBC shares of similar maturity to those of the employee options. Expected dividend yield was based on historic levels of dividend growth.
(d) Restricted Share Plan/Performance Share Awards/Achievement Share AwardsRestricted shares, which operated from 1996 to 2004, were granted with vesting criteria subject to attaining the HSBC Group targets. Since 2005, performance share awards are made to the Group’s most senior executives taking into account individual performance in the year. The share awards are divided into two criteria for testing attainment against pre-determined benchmarking. One half is subject to a Total Shareholder Return measure and the other half of the award is subject to an Earnings Per Share target. Shares will be released after three years to the extent that the performance conditions are satisfied. These awards are forfeited in total if the minimum criteria are failed to meet.
Achievement shares were launched in 2005 and are awarded to eligible employees after taking into account of the employee’s performance in the year. Shares are awarded without corporate performance conditions and are released to employees after three years provided the employees have remained employed by the Group for this period. The fair value of the shares awarded is charged to the income statement as share compensation cost over the period from issue date to release date.
2006Number
(’000)
2005Number
(’000)
At 1 January 350 459
Additions during the year 88 141
Released in the year (47) (48)
Lapsed in the year (89) (202)
At 31 December 302 350
Amounts charged to the income statement (note 16) 16 6
The closing price of the HSBC Holdings plc share at 31 December 2006 was £9.31 (2005: £9.33).
The weighted average remaining vesting period as at 31 December 2006 was 1.76 years (2005: 2.10 years).

NOTES TO THE FINANCIAL STATEMENTS (continued)
HANG SENG BANK170
60 Material Related-Party Transactions(a) Immediate holding company and fellow subsidiary companiesIn 2006, the Group entered into transactions with its immediate holding company and fellow subsidiary companies in the ordinary course of its interbank activities including the acceptance and placement of interbank deposits, correspondent banking transactions, off-balance sheet transactions and the provision of other banking and financial services. The activities were priced at the relevant market rates at the time of the transactions.
The Group used the IT service of, and shared an automated teller machine network with, its immediate holding company. The Group also shared certain IT projects with and used certain processing services of fellow subsidiaries on a cost recovery basis. The Group maintained a staff retirement benefit scheme for which a fellow subsidiary company acts as insurer and administrator. A fellow subsidiary company was appointed as fund manager to manage the Group’s investment portfolios. The Bank acted as agent for the marketing of Mandatory Provident Fund products and the distribution of retail investment funds for two fellow subsidiary companies. The premiums, commissions and other fees on these transactions are determined on an arm’s length basis.
The aggregate amount of income and expenses arising from these transactions during the year, the balances of amounts due to and from the relevant related parties, and the total contract sum of off-balance sheet transactions at the year-end are as follows:
GroupImmediate holding
company and its subsidiaries Fellow subsidiaries Associates2006 2005 2006 2005 2006 2005
Interest income 131 159 67 8 7 3
Interest expense (466) (208) (34) (38) (10) (1)
Other operating income/(expense) 52 44 (4) (3) – –
Operating expenses (580) (633) (282) (127) (11) (10)
Amounts due from:
Cash and balances with banks and other financial institutions 133 46 1,532 672 8 1
Placings with and advances to banks and other financial institutions 730 2,785 3,843 710 146 78
Trading assets – 50 – – – –
Derivative financial instruments 151 101 43 44 – –
Financial assets designatedat fair value 2,842 2,299 – – – –
Advances to customers – – – – 233 233
Financial investments 1,023 1,135 – – – –
Other assets 64 27 15 2 3 –
4,943 6,443 5,433 1,428 390 312
Amounts due to:
Current, savings and other deposit accounts 92 41 107 126 21 14
Deposits from banks 5,422 4,972 302 164 563 –
Derivative financial instruments 238 411 95 77 – –
Subordinated liabilities 2,022 2,016 – – – –
Other liabilities 348 286 125 75 – –
8,122 7,726 629 442 584 14
Derivative contracts:
Contract amount 39,443 35,364 14,078 12,308 – –
Credit equivalent amount 615 355 107 106 – –
Risk-weighted amount 123 71 21 21 – –

171ANNUAL REPORT 2006
60 Material Related-Party Transactions (continued)(a) Immediate holding company and fellow subsidiary companies (continued)
BankImmediate holding
company and its subsidiaries Fellow subsidiaries Subsidiaries Associates2006 2005 2006 2005 2006 2005 2006 2005
Amounts due from:
Cash and balances with banks and other financial institutions 114 30 1,532 671 – – 8 1
Placings with and advances to banks and other financial institutions – 1,909 3,843 710 – – 146 78
Trading assets – 50 – – – – – –
Derivative financial instruments 151 101 39 24 – – – –
Financial assets designated at fair value – – – – – – – –
Advances to customers – – – – – – – –
Amounts due from subsidiaries – – – – 92,601 93,261 – –
Financial investments 220 325 – – – – – –
Other assets 49 13 6 1 – – 3 –
534 2,428 5,420 1,406 92,601 93,261 157 79
Amounts due to:
Current, savings and other deposit accounts 92 41 107 126 – – 21 14
Deposits from banks 5,422 4,972 302 164 – – 563 –
Derivative financial instruments 238 411 85 58 – – – –
Subordinated liabilities 2,022 2,016 – – – – – –
Amounts due to subsidiaries – – – – 1,720 1,433 – –
Other liabilities 321 269 123 74 – – – –
8,095 7,709 617 422 1,720 1,433 584 14
Derivative contracts:
Contract amount 39,443 35,364 12,379 8,848 – – – –
Credit equivalent amount 615 355 101 73 – – – –
Risk-weighted amount 123 71 20 15 – – – –
(b) Key management personnel remunerationRemuneration for key management personnel, including amounts paid to the Bank’s directors as disclosed in note 18 and highest paid employees as disclosed in note 17, is as follows:
Group Bank2006 2005
restated2006 2005
restated
Employee benefits 28 22 28 22
Post-employment benefits 4 4 4 4
Equity compensation benefits 2 2 2 2
34 28 34 28

NOTES TO THE FINANCIAL STATEMENTS (continued)
HANG SENG BANK172
60 Material Related-Party Transactions (continued)(c) Material transactions with key management personnelDuring the year, the Group provided credit facilities to and accepted deposits from key management personnel of the Bank and its holding companies, their close family members and companies controlled or significantly influenced by them. The credit facilities extended and deposit taken were provided in the ordinary course of business and on substantially the same terms as for comparable transactions with persons of a similar standing or, where applicable, with other employees.
Material transactions conducted with key management personnel of the Bank and its holding companies and parties related to them are as follows:
Group Bank2006 2005 2006 2005
restated
Interest received 565 440 522 387
Interest paid 163 90 163 90
Fees and exchange income received 16 18 16 18
Loans and advances 14,123 13,166 13,673 11,725
Deposits 4,038 3,830 4,038 3,830
Undrawn commitments 6,435 6,130 6,435 6,130
Maximum aggregate amount of loans and advances during the year 20,153 19,599 18,713 17,903
(d) Loans to officersLoans to officers of the Bank disclosed pursuant to section 161B of the Hong Kong Companies Ordinance are as follows:
Group Bank2006 2005 2006 2005
Aggregate amount of relevant transactions outstanding at 31 December 80 61 80 61
Maximum aggregate amount of relevant transactions during the year 150 107 150 107
(e) AssociatesThe Group maintains a shareholders’ loan to an associate. The balance at 31 December 2006 was HK$233 million (2005: HK$233 million).
The Bank has entered into Technical Support and Assistance Agreement with Industrial Bank Co., Ltd (IB) to provide technical support and assistance in relation to various banking operations and businesses of IB. The Bank has also assisted IB in managing and growing the credit card business, and provided support in the issuance of dual-logo credit cards.
(f) Ultimate holding companyThe Group participates in various share option plans operated by HSBC Holdings plc whereby share options of HSBC Holdings plc are granted to employees of the Group. The fair value of these share options on grant date is recognised as an expense and spread over the vesting period, the corresponding amount is credited to “Other reserves”. The balance of this reserve as at 31 December 2006 amounted to HK$214 million (2005: HK$130 million).

173ANNUAL REPORT 2006
61 Financial Risk ManagementThis section presents information about the Group’s management and control of risks, in particular, those associated with itsuse of financial instruments (“financial risks”). Major types of financial risks the Group exposed to include credit, liquidity and market risks.
The Group’s risk management policy is designed to identify and analyse risks, to set appropriate risk limits and to monitor these risks and limits continually by means of reliable and up-to-date management information systems. The Group’s risk management policies and major control limits are approved by the Board of Directors and they are monitored and reviewed regularly by the Executive Committee and Audit Committee.
(a) Credit riskCredit risk is the risk that financial loss arises from the failure of a customer or counterparty to meet its obligations under a contract. It arises principally from lending, trade finance, treasury and leasing businesses. The Group has dedicated standards, policies and procedures in place to control and monitor risk from all such activities.
The Credit Risk Management (CRM) function is mandated to provide centralised management of credit risk through:
– formulating credit policies on approval process, post disbursement monitoring, recovery process and large exposure;
– issuing guidelines on lending to specified market sectors, industries and products; the acceptability of specific classes of collateral or risk mitigations and valuation parameters for collateral;
– undertaking an independent review and objective assessment of credit risk for all commercial non-bank credit facilities in excess of designated amount prior to the facilities being committed to customers;
– controlling exposures to selected industries, counterparties, countries and portfolio types etc by setting limits;
– maintaining and developing credit risk rating/facility grading process to categorize exposures and facilitate focused management;
– reporting to senior executives and various committees on aspects of the Group loan portfolio;
– managing and directing credit-related systems initiatives; and
– providing advice and guidance to business units on various credit-related issues.
Impairment loan management and recoveryThe Group undertakes ongoing credit analysis and monitoring at several levels. Special attention is paid to problem loans. Loans impairment allowances are made promptly where necessary and be consistent with established guidelines. Recovery units are established by the Group to provide the customers with intensive support in order to maximise recoveries of doubtful debts. Management regularly performs an assessment of the adequacy of the established impairment provisions by conducting a detailed review of the loan portfolio, comparing performance and delinquency statistics against historical trends and undertaking an assessment of current economic conditions.
Risk rating frameworkCurrently, the Group’s risk rating framework consisted of seven facility grades, taking into account the risk of default and the availability of security or other credit risk mitigation. A more sophisticated risk rating framework on counterparty credit risk based on default probability and loss estimates and comprising up to 22 categories, is being progressively implemented across the Group on parallel basis. The rating methodology of this framework is based upon a wide range of financial analytics. The new approach will allow a more granular analysis of risk and trends.

NOTES TO THE FINANCIAL STATEMENTS (continued)
HANG SENG BANK174
61 Financial Risk Management (continued)(a) Credit risk (continued)
Collateral and other credit enhancementsThe Group has implemented guidelines on the acceptability of specific classes of collateral or credit risk mitigation, and determined the valuation parameters. Such parameters are established prudently and are reviewed regularly in light of changing market environment and empirical evidence. Security structures and legal covenants are subject to regular review to ensure that they continue to fulfill their intended purpose and remain in line with local market practice. While collateral is an important mitigant to credit risk, it is the Group’s policy to establish that loans are within the customer’s capacity to repay rather than to rely excessively on security. Facilities may be granted on unsecured basis depending on the customer’s standing and the type of product. The principal collateral types are as follows:
– in the personal sector, charges over the properties, securities, investment funds and deposits;
– in the commercial and industrial sector, charges over business assets such as properties, stock, debtors, investment funds, deposits and machinery;
– in the commercial real estate sector, charges over the properties being financed.
Collateral held as security for financial assets other than loans and advances is determined by the nature of the instrument. Debt securities, treasury and other eligible bills are generally unsecured with the exception of asset backed securities and similar instruments, which are secured by pools of financial assets.
Settlement riskSettlement risk arises where a payment in cash, securities or equities is made in the expectation of a corresponding receipt in cash, securities or equities. Daily Settlement Limits are established to cover the settlement risk arising from the Group’s trading transactions on any single day. Settlement risk on many transactions, particularly those involving securities and equities, is substantially mitigated when effected via Assured Payment Systems, or on a delivery versus payment basis.
The ISDA Master Agreement is the Group’s preferred agreement for documenting derivative activities. It provides the contractual framework that a full range of over-the-counter (“OTC”) products is conducted and contractually binds both parties to apply close-out netting across all outstanding transactions covered by an agreement, if either party defaults or following otherpre-agreed termination events.
Concentration of credit riskConcentration of credit risk exists when changes in geographic, economic or industry factors similarly affect groups of counterparties whose aggregate credit exposure is material in relation to the Group’s total exposures. The Group’s portfolio of financial instrument is diversified along geographic, industry and product sectors. Analysis of geographical concentration of the Group’s assets is disclosed in note 26 and credit risk concentration of respective financial assets is disclosed in notes 31 to 34.
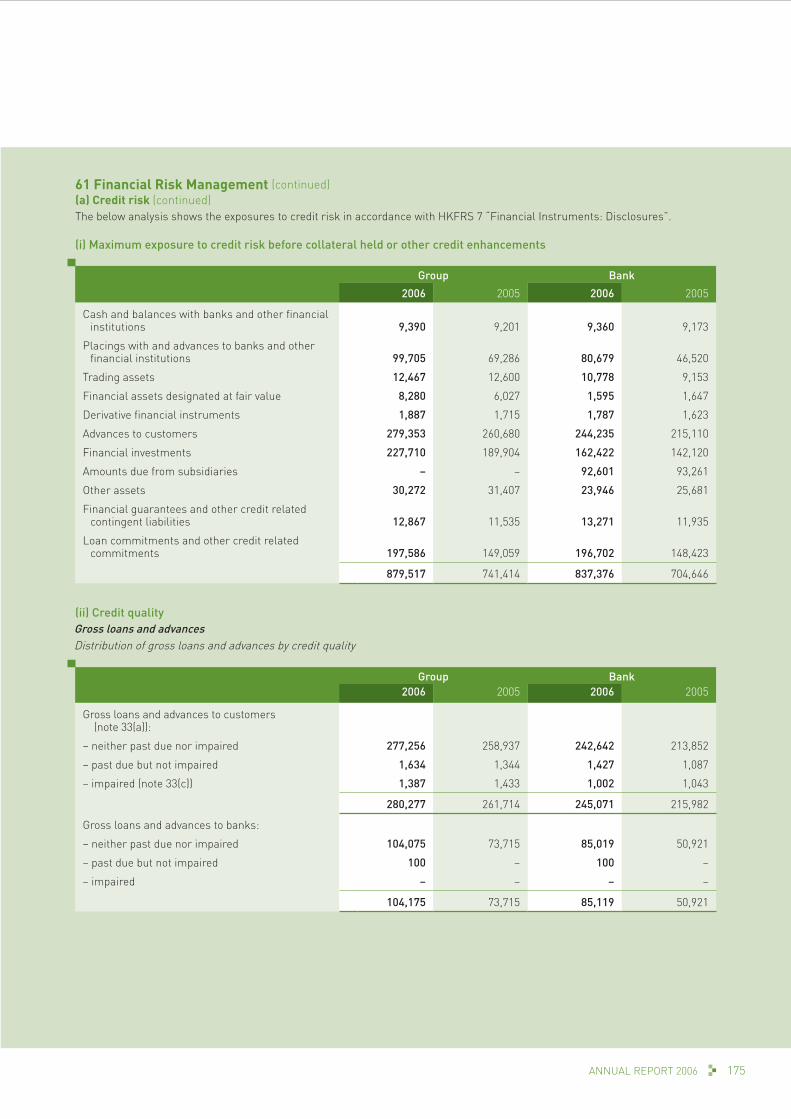
175ANNUAL REPORT 2006
61 Financial Risk Management (continued)(a) Credit risk (continued)The below analysis shows the exposures to credit risk in accordance with HKFRS 7 “Financial Instruments: Disclosures”.
(i) Maximum exposure to credit risk before collateral held or other credit enhancements
Group Bank
2006 2005 2006 2005
Cash and balances with banks and other financial institutions 9,390 9,201 9,360 9,173
Placings with and advances to banks and other financial institutions 99,705 69,286 80,679 46,520
Trading assets 12,467 12,600 10,778 9,153
Financial assets designated at fair value 8,280 6,027 1,595 1,647
Derivative financial instruments 1,887 1,715 1,787 1,623
Advances to customers 279,353 260,680 244,235 215,110
Financial investments 227,710 189,904 162,422 142,120
Amounts due from subsidiaries – – 92,601 93,261
Other assets 30,272 31,407 23,946 25,681
Financial guarantees and other credit related contingent liabilities 12,867 11,535 13,271 11,935
Loan commitments and other credit related commitments 197,586 149,059 196,702 148,423
879,517 741,414 837,376 704,646
(ii) Credit qualityGross loans and advancesDistribution of gross loans and advances by credit quality
Group Bank2006 2005 2006 2005
Gross loans and advances to customers (note 33(a)):
– neither past due nor impaired 277,256 258,937 242,642 213,852
– past due but not impaired 1,634 1,344 1,427 1,087
– impaired (note 33(c)) 1,387 1,433 1,002 1,043
280,277 261,714 245,071 215,982
Gross loans and advances to banks:
– neither past due nor impaired 104,075 73,715 85,019 50,921
– past due but not impaired 100 – 100 –
– impaired – – – –
104,175 73,715 85,119 50,921
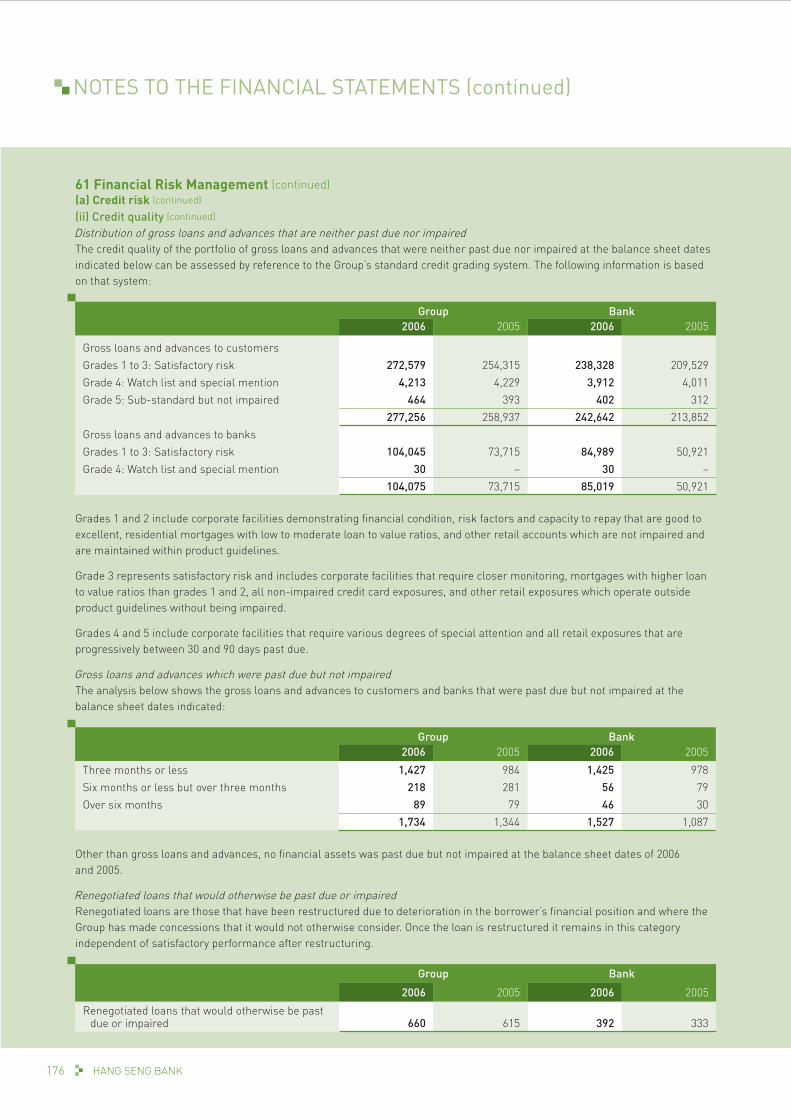
NOTES TO THE FINANCIAL STATEMENTS (continued)
HANG SENG BANK176
61 Financial Risk Management (continued)(a) Credit risk (continued)
(ii) Credit quality (continued)
Distribution of gross loans and advances that are neither past due nor impairedThe credit quality of the portfolio of gross loans and advances that were neither past due nor impaired at the balance sheet dates indicated below can be assessed by reference to the Group’s standard credit grading system. The following information is based on that system:
Group Bank2006 2005 2006 2005
Gross loans and advances to customers
Grades 1 to 3: Satisfactory risk 272,579 254,315 238,328 209,529
Grade 4: Watch list and special mention 4,213 4,229 3,912 4,011
Grade 5: Sub-standard but not impaired 464 393 402 312
277,256 258,937 242,642 213,852
Gross loans and advances to banks
Grades 1 to 3: Satisfactory risk 104,045 73,715 84,989 50,921
Grade 4: Watch list and special mention 30 – 30 –
104,075 73,715 85,019 50,921
Grades 1 and 2 include corporate facilities demonstrating financial condition, risk factors and capacity to repay that are good to excellent, residential mortgages with low to moderate loan to value ratios, and other retail accounts which are not impaired and are maintained within product guidelines.
Grade 3 represents satisfactory risk and includes corporate facilities that require closer monitoring, mortgages with higher loan to value ratios than grades 1 and 2, all non-impaired credit card exposures, and other retail exposures which operate outside product guidelines without being impaired.
Grades 4 and 5 include corporate facilities that require various degrees of special attention and all retail exposures that are progressively between 30 and 90 days past due.
Gross loans and advances which were past due but not impairedThe analysis below shows the gross loans and advances to customers and banks that were past due but not impaired at the balance sheet dates indicated:
Group Bank2006 2005 2006 2005
Three months or less 1,427 984 1,425 978
Six months or less but over three months 218 281 56 79
Over six months 89 79 46 30
1,734 1,344 1,527 1,087
Other than gross loans and advances, no financial assets was past due but not impaired at the balance sheet dates of 2006and 2005.
Renegotiated loans that would otherwise be past due or impairedRenegotiated loans are those that have been restructured due to deterioration in the borrower’s financial position and where the Group has made concessions that it would not otherwise consider. Once the loan is restructured it remains in this category independent of satisfactory performance after restructuring.
Group Bank
2006 2005 2006 2005
Renegotiated loans that would otherwise be past due or impaired 660 615 392 333

177ANNUAL REPORT 2006
61 Financial Risk Management (continued)(a) Credit risk (continued)
(ii) Credit quality (continued)
Debt securitiesFinancial investments by rating agency designationThe following table presents an analysis of financial securities, other than loans, by rating agency designation at the balance sheet dates, based on Standard and Poor’s ratings or their equivalent to the respective issues of the financial securities. If major rating agencies have different ratings for the same debt securities, the securities are reported against the lower rating. In the absence of such issue ratings, the ratings designated for the issuers are reported.
GroupTreasury
billsDebt
securities Total
At 31 December 2006
AAA 40 21,091 21,131
AA- to AA+ 6,807 101,260 108,067
A- to A+ 312 101,932 102,244
Lower than A- – 6,366 6,366
Unrated – 5,003 5,003
7,159 235,652 242,811
of which issued by:
– central governments and central banks 7,159 11,001 18,160
– other public sector entities – 8,255 8,255
– banks and other financial institutions – 197,841 197,841
– corporate entities – 18,555 18,555
7,159 235,652 242,811
of which classified as:
– trading assets 6,071 6,321 12,392
– financial assets designated at fair value – 4,819 4,819
– available-for-sale debt securities 1,088 208,375 209,463
– held-to-maturity debt securities – 16,137 16,137
7,159 235,652 242,811
At 31 December 2005
AAA 37 26,204 26,241
AA– to AA+ – 83,855 83,855
A- to A+ 7,373 78,873 86,246
Lower than A- – 6,462 6,462
Unrated – 2,581 2,581
7,410 197,975 205,385
of which issued by:
– central governments and central banks 7,410 15,061 22,471
– other public sector entities – 10,451 10,451
– banks and other financial institutions – 155,330 155,330
– corporate entities – 17,133 17,133
7,410 197,975 205,385
of which classified as:
– trading assets 2,594 9,978 12,572
– financial assets designated at fair value – 4,269 4,269
– available-for-sale debt securities 4,816 172,997 177,813
– held-to-maturity debt securities – 10,731 10,731
7,410 197,975 205,385
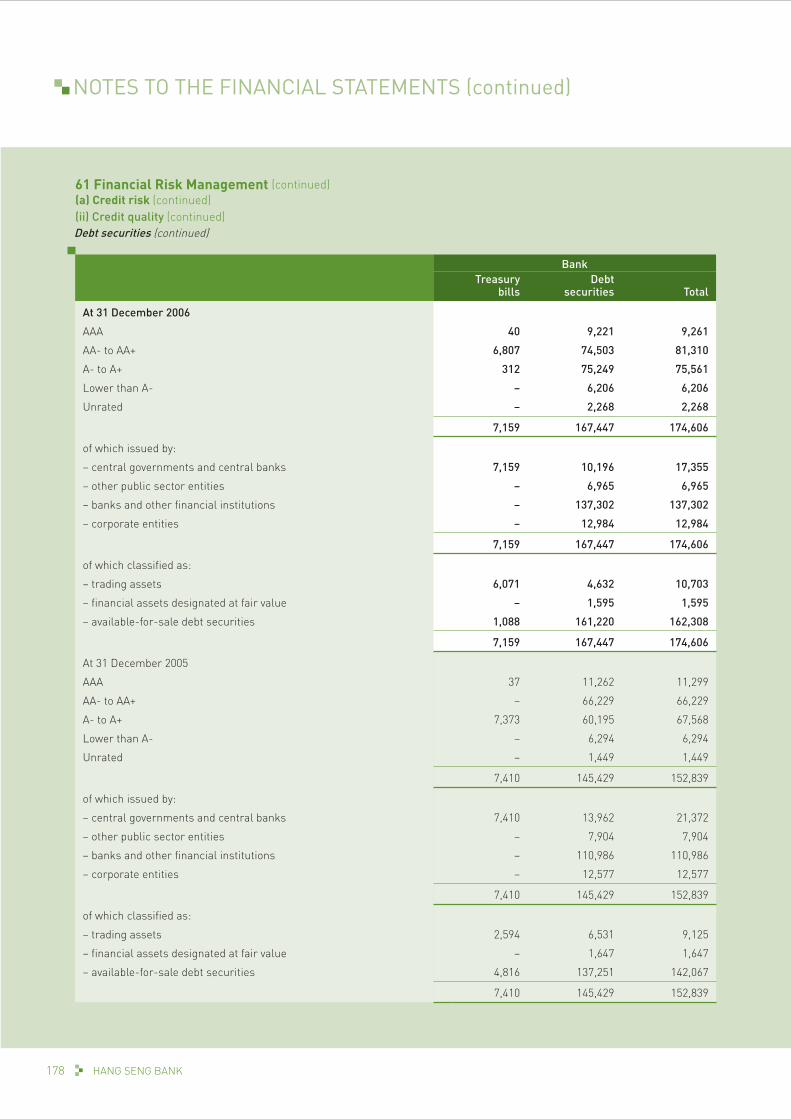
NOTES TO THE FINANCIAL STATEMENTS (continued)
HANG SENG BANK178
61 Financial Risk Management (continued)(a) Credit risk (continued)(ii) Credit quality (continued)Debt securities (continued)
BankTreasury
billsDebt
securities Total
At 31 December 2006
AAA 40 9,221 9,261
AA- to AA+ 6,807 74,503 81,310
A- to A+ 312 75,249 75,561
Lower than A- – 6,206 6,206
Unrated – 2,268 2,268
7,159 167,447 174,606
of which issued by:
– central governments and central banks 7,159 10,196 17,355
– other public sector entities – 6,965 6,965
– banks and other financial institutions – 137,302 137,302
– corporate entities – 12,984 12,984
7,159 167,447 174,606
of which classified as:
– trading assets 6,071 4,632 10,703
– financial assets designated at fair value – 1,595 1,595
– available-for-sale debt securities 1,088 161,220 162,308
7,159 167,447 174,606
At 31 December 2005
AAA 37 11,262 11,299
AA- to AA+ – 66,229 66,229
A- to A+ 7,373 60,195 67,568
Lower than A- – 6,294 6,294
Unrated – 1,449 1,449
7,410 145,429 152,839
of which issued by:
– central governments and central banks 7,410 13,962 21,372
– other public sector entities – 7,904 7,904
– banks and other financial institutions – 110,986 110,986
– corporate entities – 12,577 12,577
7,410 145,429 152,839
of which classified as:
– trading assets 2,594 6,531 9,125
– financial assets designated at fair value – 1,647 1,647
– available-for-sale debt securities 4,816 137,251 142,067
7,410 145,429 152,839

179ANNUAL REPORT 2006
61 Financial Risk Management (continued)(a) Credit risk (continued)(iii) Collateral and other credit enhancements obtainedDuring the years indicated, the Group obtained assets by taking possession of collateral held as security, or calling other credit enhancement, as follows:
Group BankNature of assets 2006 2005 2006 2005
Residential properties 156 179 72 75
Commercial and industrial properties 2 2 2 –
Others 17 35 17 35
175 216 91 110
(b) Liquidity riskLiquidity management is essential to ensure the Group has the ability to meet its obligations as they fall due. It is the Group’s policy to maintain a strong liquidity position by properly managing the liquidity structure of its assets, liabilities and commitments so that cash flows are appropriately balanced and all funding obligations are comfortably met.
The Group has established policies and procedures to monitor and control its liquidity position on a daily basis by adopting a cash flow management approach. The approach seeks to forecast committed cash inflows and outflows of the business and results in a daily net funding requirements which indicates the refinancing needs for any given day within the scope of the forecast conditions. Stress scenarios analysis for normal business conditions, an institution-specific crisis and a general market crisis are also conducted on a regular basis. The Group always maintains a stock of high quality liquid assets to ensure the availability of sufficient cash flow to meet its financial commitments, including customer deposits on maturity and undrawn facilities, over a specified future period. The liquidity management process is monitored by the Asset and Liability Management Committee (“ALCO”) and is reported to the Executive Committee and the Board of Directors.
The average liquidity ratio for the year, calculated in accordance with the Fourth Schedule of the Hong Kong Banking Ordinance, is as follows:
Group2006 2005
The Bank and its major banking subsidiaries 51.9% 45.1%

NOTES TO THE FINANCIAL STATEMENTS (continued)
HANG SENG BANK180
61 Financial Risk Management (continued)(b) Liquidity risk (continued)The following table gives the cash-flow projection of the Group’s financial liabilities including interest payable and undrawn commitments at balance sheet date based on the dates of their contractual payment obligations. Interest payable in respect of term financial liabilities are reported based on contractual interest payment date. Financial liabilities repayable on demand (such as savings and current deposits) including interest accrued up to balance sheet date are reported under the column “repayable on demand”. Liabilities in trading portfolios are not included in this analysis as they are typically held for short periods of time.
Group
Repayable on demand
Three months or
less but not on demand
Three months to
one yearOne year to
five yearsOver five
years
At 31 December 2006
Current, savings and other deposit accounts 291,042 183,800 8,638 1,067 –
Deposits from banks 2,799 14,094 1,155 – –
Financial liabilities designated at fair value 81 10 31 1,103 494
Derivative financial instruments – 391 1,169 1,307 299
Certificates of deposit and other debt securities in issue – 195 1,047 7,099 –
Other financial liabilities 157 3,338 270 – –
Subordinated liabilities – 93 278 8,201 –
Loan commitments and other credit related commitments 1,823 32,716 22,086 110,429 20
295,902 234,637 34,674 129,206 813
At 31 December 2005
Current, savings and other deposit accounts 234,016 191,034 5,986 1,048 –
Deposits from banks 1,674 10,392 9 – –
Financial liabilities designated at fair value 26 10 31 1,186 535
Derivative financial instruments – 299 1,579 2,225 426
Certificates of deposit and other debt securities in issue – 379 2,120 8,476 51
Other financial liabilities 120 2,676 208 – –
Subordinated liabilities – 39 118 4,179 –
Loan commitments and other credit related commitments 3,273 23,758 9,654 98,151 13
239,109 228,587 19,705 115,265 1,025
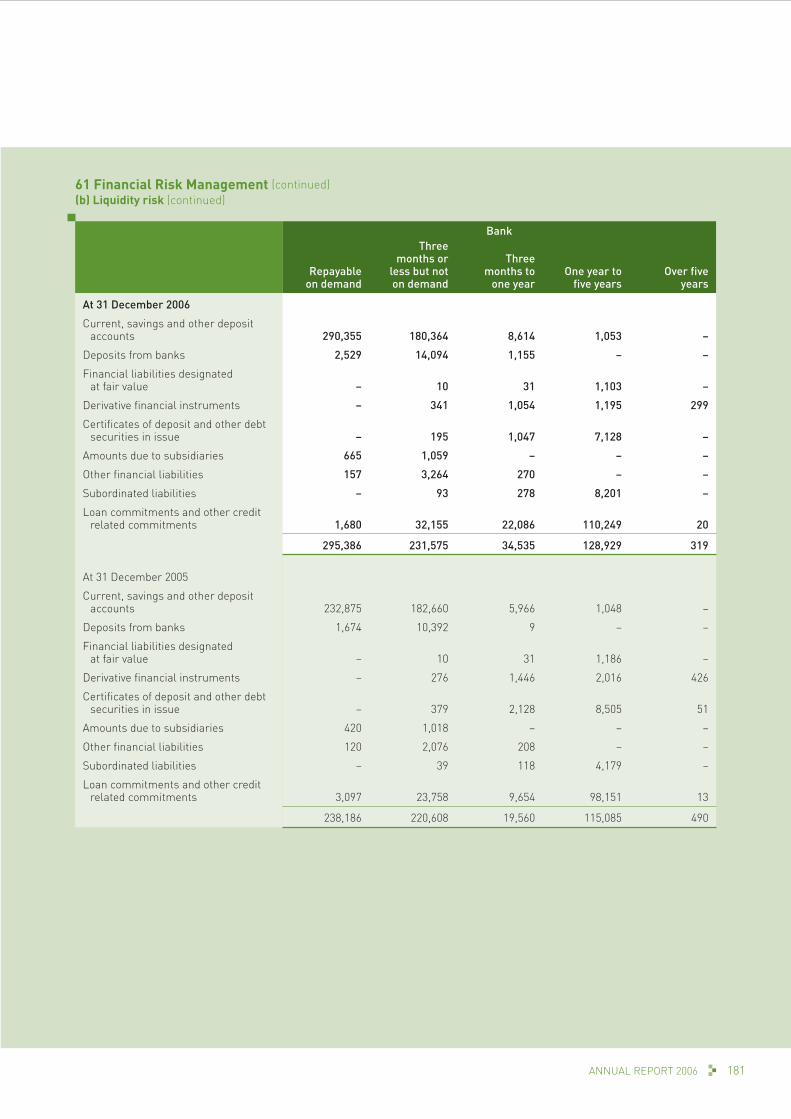
181ANNUAL REPORT 2006
61 Financial Risk Management (continued)(b) Liquidity risk (continued)
Bank
Repayable on demand
Three months or
less but not on demand
Three months to
one year One year to
five yearsOver five
years
At 31 December 2006
Current, savings and other deposit accounts 290,355 180,364 8,614 1,053 –
Deposits from banks 2,529 14,094 1,155 – –
Financial liabilities designated at fair value – 10 31 1,103 –
Derivative financial instruments – 341 1,054 1,195 299
Certificates of deposit and other debt securities in issue – 195 1,047 7,128 –
Amounts due to subsidiaries 665 1,059 – – –
Other financial liabilities 157 3,264 270 – –
Subordinated liabilities – 93 278 8,201 –
Loan commitments and other credit related commitments 1,680 32,155 22,086 110,249 20
295,386 231,575 34,535 128,929 319
At 31 December 2005
Current, savings and other deposit accounts 232,875 182,660 5,966 1,048 –
Deposits from banks 1,674 10,392 9 – –
Financial liabilities designated at fair value – 10 31 1,186 –
Derivative financial instruments – 276 1,446 2,016 426
Certificates of deposit and other debt securities in issue – 379 2,128 8,505 51
Amounts due to subsidiaries 420 1,018 – – –
Other financial liabilities 120 2,076 208 – –
Subordinated liabilities – 39 118 4,179 –
Loan commitments and other credit related commitments 3,097 23,758 9,654 98,151 13
238,186 220,608 19,560 115,085 490

NOTES TO THE FINANCIAL STATEMENTS (continued)
HANG SENG BANK182
61 Financial Risk Management (continued)(c) Market risk managementMarket risk is the risk that foreign exchange rates, interest rates, equity and commodity prices and indices will move and result in profits or losses for the Group. The objective of the Group’s market risk management is to manage and control market risk exposures in order to optimise return on risk while maintaining a market profile consistent with the Group’s status as a premier provider of financial products and services.
The Group separates exposures to market risk into either trading or non-trading portfolios. Trading portfolios include those positions arising from market-making, proprietary position-taking and other marked-to-market positions so designated.Non-trading portfolios primarily arise from the effective interest rate management of the Group’s retail and commercial banking assets and liabilities.
The management of market risk is principally undertaken in Treasury using risk limits approved by the Board of Directors. Limits are set for each portfolio, product and risk type, with market liquidity being a principal factor in determining the level of limits set. The Group has dedicated standards, policies and procedures in place to control and monitor the market risk. An independent market risk control function is responsible for measuring market risk exposures, monitoring and reporting these exposures against the prescribed limits on a daily basis. The market risks which arise on each business are assessed and transferred to either Treasury for management, or to separate books managed under the supervision of ALCO.
Value at risk (“VAR”)One of the principal tools used by the Group to monitor and limit market risk exposure is VAR. The Group has obtained approval from the HKMA to use its VAR model for calculation of market risk capital charge.
VAR is a technique which estimates the potential losses that could occur on risk positions taken due to movements in market rates and prices over a specified time horizon and to a given level of confidence. In line with the HSBC Group, the Group has changed its VAR calculation from a variance/co-variance (“VCV”) basis to historical simulation (“HS”) basis with effect from 3 May 2005. HS uses scenarios derived from historical market rates and takes account of the relationships between different markets and rates, for example, interest rates and foreign exchange rates. Movements in market prices are calculated by reference to market data from the last two years. The assumed holding period is a one-day period with a 99 per cent level of confidence, reflecting the way the risk positions are managed.
Although a valuable guide to risk, VAR should always be viewed in the context of its limitations. For example:
– the use of historical data as a proxy for estimating future events may not encompass all potential events, particularly those which are extreme in nature;
– the use of a one-day holding period assumes that all positions can be liquidated or hedged in one day. This may not fully reflect the market risk arising at times of severe illiquidity, when a one-day holding period may be insufficient to liquidate or hedge all positions fully;
– the use of a 99 per cent confidence level, by definition, does not take into account losses that might occur beyond this level of confidence; and
– VAR is calculated on the basis of exposures outstanding at the close of business and therefore does not necessarily reflect intra-day exposures.
The Group recognises these limitations by augmenting its VAR limits with other position and sensitivity limit structures. Additionally, the Group applies a wide range of stress testing, both on individual portfolios and on the Group’s consolidated positions. The Group’s stress-testing regime provides senior management with an assessment of the financial impact of identified extreme events on the market risk exposures of the Group.

183ANNUAL REPORT 2006
61 Financial Risk Management (continued)(c) Market risk management (continued)
The Group’s VAR, both trading and non-trading, for all interest rate risk and foreign exchange risk positions and on individual risk portfolios during 2006 and 2005 are shown in the table below. The VAR figures for 2005 are based on four months VCV and eight months’ HS.
Value at risk
At 31 December
2006
Minimum during the
year
Maximum during the
yearAverage for
the year
VAR for all interest rate risk and foreign exchange risk 42 29 119 64
VAR for foreign exchange risk (trading) 2 1 16 5
VAR for interest rate risk
– trading 4 3 16 8
– non-trading 45 35 123 68
At 31 December
2005
Minimum during the
year
Maximum during the
yearAverage for
the year
VAR for all interest rate risk and foreign exchange risk 113 111 264 181
VAR for foreign exchange risk (trading) 3 – 6 2
VAR for interest rate risk
– trading 3 1 21 4
– non-trading 118 117 260 180
Month
1 2 3 4 5 6 7 8 9 10 11 120
350
200
250
300
150
100
50
HK$m
Value at Risk for 2006
1 2 3 4 5 6 7 8 9 10 11 12
Value at Risk for 2005
150
100
350
200
250
300
50
0
HK$m
Month
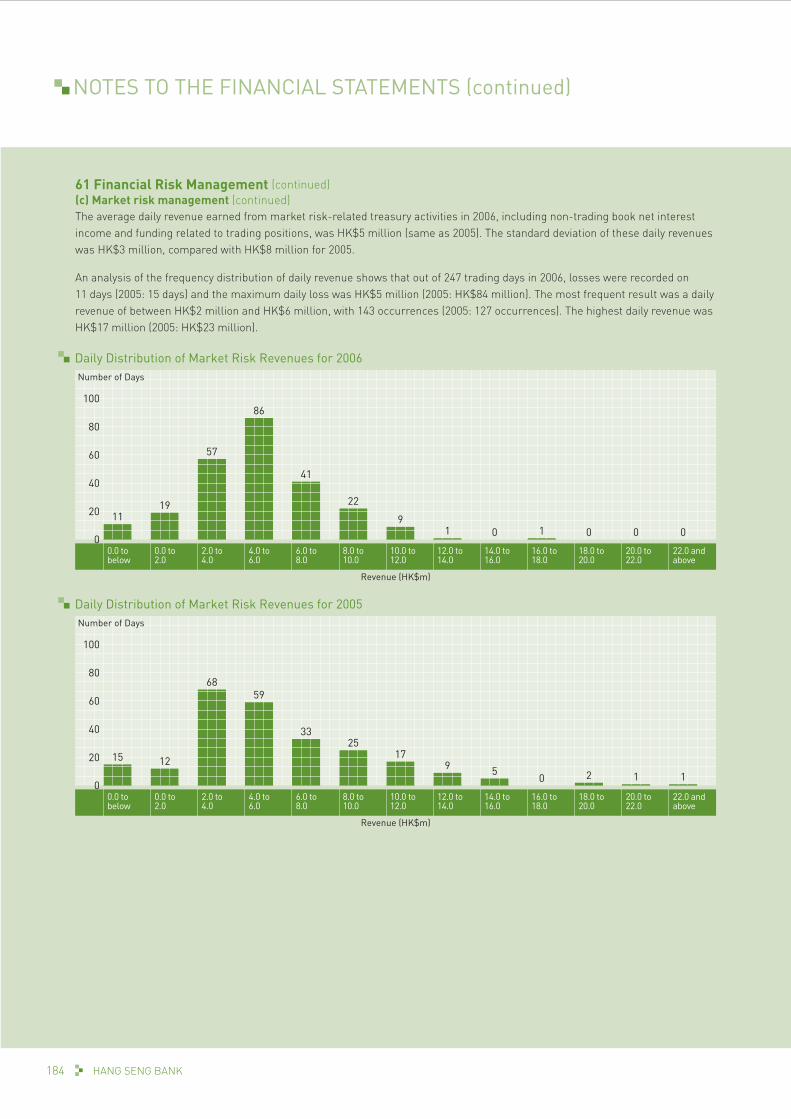
NOTES TO THE FINANCIAL STATEMENTS (continued)
HANG SENG BANK184
61 Financial Risk Management (continued)(c) Market risk management (continued)The average daily revenue earned from market risk-related treasury activities in 2006, including non-trading book net interest income and funding related to trading positions, was HK$5 million (same as 2005). The standard deviation of these daily revenues was HK$3 million, compared with HK$8 million for 2005.
An analysis of the frequency distribution of daily revenue shows that out of 247 trading days in 2006, losses were recorded on 11 days (2005: 15 days) and the maximum daily loss was HK$5 million (2005: HK$84 million). The most frequent result was a daily revenue of between HK$2 million and HK$6 million, with 143 occurrences (2005: 127 occurrences). The highest daily revenue was HK$17 million (2005: HK$23 million).
0.0 tobelow
0.0 to2.0
2.0 to4.0
4.0 to6.0
6.0 to8.0
8.0 to10.0
10.0 to12.0
12.0 to14.0
14.0 to16.0
16.0 to18.0
18.0 to20.0
20.0 to22.0
22.0 andabove
Daily Distribution of Market Risk Revenues for 2006
Revenue (HK$m)
1119
57
86
41
22
91 1 00 0 0
0
Number of Days
100
80
60
40
20
0.0 tobelow
0.0 to2.0
2.0 to4.0
4.0 to6.0
6.0 to8.0
8.0 to10.0
10.0 to12.0
12.0 to14.0
14.0 to16.0
16.0 to18.0
18.0 to20.0
20.0 to22.0
22.0 andabove
Daily Distribution of Market Risk Revenues for 2005Number of Days
100
80
60
40
20 15 12
6859
3325
179 5
0 2 1 10
Revenue (HK$m)
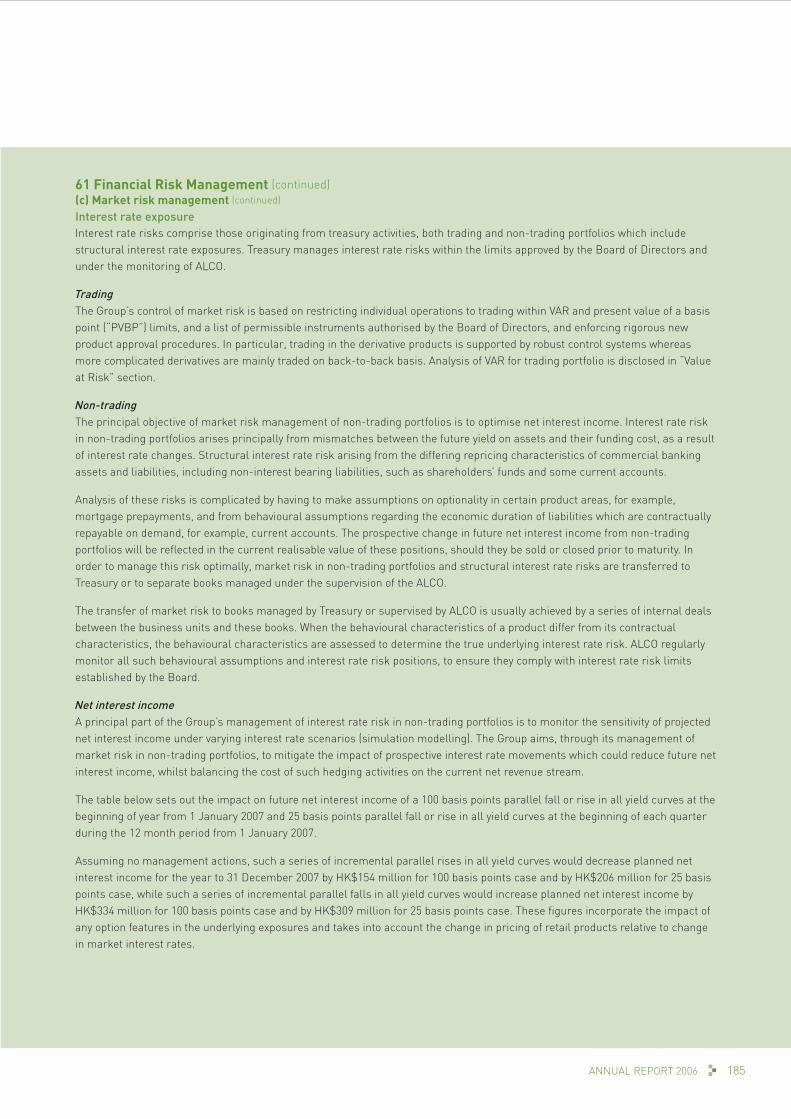
185ANNUAL REPORT 2006
61 Financial Risk Management (continued)(c) Market risk management (continued)
Interest rate exposureInterest rate risks comprise those originating from treasury activities, both trading and non-trading portfolios which include structural interest rate exposures. Treasury manages interest rate risks within the limits approved by the Board of Directors and under the monitoring of ALCO.
TradingThe Group’s control of market risk is based on restricting individual operations to trading within VAR and present value of a basis point (“PVBP”) limits, and a list of permissible instruments authorised by the Board of Directors, and enforcing rigorous new product approval procedures. In particular, trading in the derivative products is supported by robust control systems whereas more complicated derivatives are mainly traded on back-to-back basis. Analysis of VAR for trading portfolio is disclosed in “Value at Risk” section.
Non-tradingThe principal objective of market risk management of non-trading portfolios is to optimise net interest income. Interest rate risk in non-trading portfolios arises principally from mismatches between the future yield on assets and their funding cost, as a result of interest rate changes. Structural interest rate risk arising from the differing repricing characteristics of commercial banking assets and liabilities, including non-interest bearing liabilities, such as shareholders’ funds and some current accounts.
Analysis of these risks is complicated by having to make assumptions on optionality in certain product areas, for example, mortgage prepayments, and from behavioural assumptions regarding the economic duration of liabilities which are contractually repayable on demand, for example, current accounts. The prospective change in future net interest income from non-trading portfolios will be reflected in the current realisable value of these positions, should they be sold or closed prior to maturity. In order to manage this risk optimally, market risk in non-trading portfolios and structural interest rate risks are transferred to Treasury or to separate books managed under the supervision of the ALCO.
The transfer of market risk to books managed by Treasury or supervised by ALCO is usually achieved by a series of internal deals between the business units and these books. When the behavioural characteristics of a product differ from its contractual characteristics, the behavioural characteristics are assessed to determine the true underlying interest rate risk. ALCO regularly monitor all such behavioural assumptions and interest rate risk positions, to ensure they comply with interest rate risk limits established by the Board.
Net interest incomeA principal part of the Group’s management of interest rate risk in non-trading portfolios is to monitor the sensitivity of projected net interest income under varying interest rate scenarios (simulation modelling). The Group aims, through its management of market risk in non-trading portfolios, to mitigate the impact of prospective interest rate movements which could reduce future net interest income, whilst balancing the cost of such hedging activities on the current net revenue stream.
The table below sets out the impact on future net interest income of a 100 basis points parallel fall or rise in all yield curves at the beginning of year from 1 January 2007 and 25 basis points parallel fall or rise in all yield curves at the beginning of each quarter during the 12 month period from 1 January 2007.
Assuming no management actions, such a series of incremental parallel rises in all yield curves would decrease planned net interest income for the year to 31 December 2007 by HK$154 million for 100 basis points case and by HK$206 million for 25 basis points case, while such a series of incremental parallel falls in all yield curves would increase planned net interest income by HK$334 million for 100 basis points case and by HK$309 million for 25 basis points case. These figures incorporate the impact of any option features in the underlying exposures and takes into account the change in pricing of retail products relative to change in market interest rates.
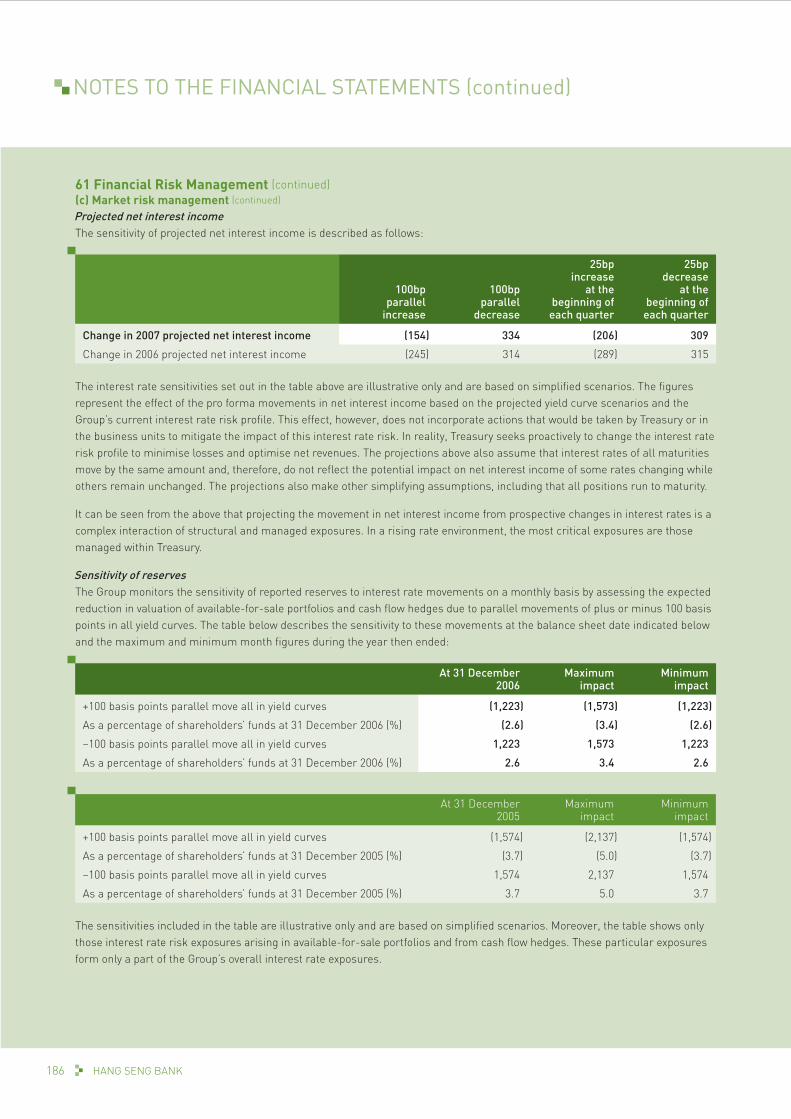
NOTES TO THE FINANCIAL STATEMENTS (continued)
HANG SENG BANK186
61 Financial Risk Management (continued)(c) Market risk management (continued)
Projected net interest incomeThe sensitivity of projected net interest income is described as follows:
100bp parallel
increase
100bp parallel
decrease
25bp increase
at the beginning of each quarter
25bp decrease
at the beginning of each quarter
Change in 2007 projected net interest income (154) 334 (206) 309
Change in 2006 projected net interest income (245) 314 (289) 315
The interest rate sensitivities set out in the table above are illustrative only and are based on simplified scenarios. The figures represent the effect of the pro forma movements in net interest income based on the projected yield curve scenarios and the Group’s current interest rate risk profile. This effect, however, does not incorporate actions that would be taken by Treasury or in the business units to mitigate the impact of this interest rate risk. In reality, Treasury seeks proactively to change the interest rate risk profile to minimise losses and optimise net revenues. The projections above also assume that interest rates of all maturities move by the same amount and, therefore, do not reflect the potential impact on net interest income of some rates changing while others remain unchanged. The projections also make other simplifying assumptions, including that all positions run to maturity.
It can be seen from the above that projecting the movement in net interest income from prospective changes in interest rates is a complex interaction of structural and managed exposures. In a rising rate environment, the most critical exposures are those managed within Treasury.
Sensitivity of reservesThe Group monitors the sensitivity of reported reserves to interest rate movements on a monthly basis by assessing the expected reduction in valuation of available-for-sale portfolios and cash flow hedges due to parallel movements of plus or minus 100 basis points in all yield curves. The table below describes the sensitivity to these movements at the balance sheet date indicated below and the maximum and minimum month figures during the year then ended:
At 31 December 2006
Maximum impact
Minimum impact
+100 basis points parallel move all in yield curves (1,223) (1,573) (1,223)
As a percentage of shareholders’ funds at 31 December 2006 (%) (2.6) (3.4) (2.6)
–100 basis points parallel move all in yield curves 1,223 1,573 1,223
As a percentage of shareholders’ funds at 31 December 2006 (%) 2.6 3.4 2.6
At 31 December 2005
Maximum impact
Minimum impact
+100 basis points parallel move all in yield curves (1,574) (2,137) (1,574)
As a percentage of shareholders’ funds at 31 December 2005 (%) (3.7) (5.0) (3.7)
–100 basis points parallel move all in yield curves 1,574 2,137 1,574
As a percentage of shareholders’ funds at 31 December 2005 (%) 3.7 5.0 3.7
The sensitivities included in the table are illustrative only and are based on simplified scenarios. Moreover, the table shows only those interest rate risk exposures arising in available-for-sale portfolios and from cash flow hedges. These particular exposures form only a part of the Group’s overall interest rate exposures.
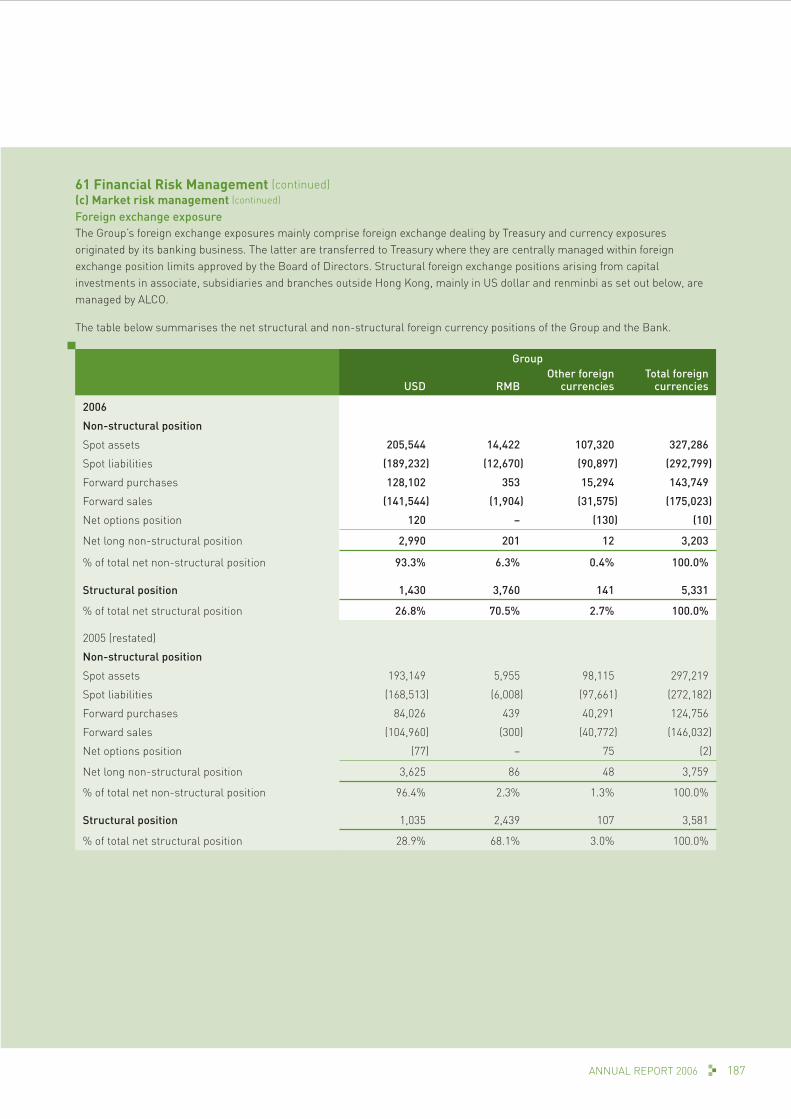
187ANNUAL REPORT 2006
61 Financial Risk Management (continued)(c) Market risk management (continued)
Foreign exchange exposureThe Group’s foreign exchange exposures mainly comprise foreign exchange dealing by Treasury and currency exposures originated by its banking business. The latter are transferred to Treasury where they are centrally managed within foreign exchange position limits approved by the Board of Directors. Structural foreign exchange positions arising from capital investments in associate, subsidiaries and branches outside Hong Kong, mainly in US dollar and renminbi as set out below, are managed by ALCO.
The table below summarises the net structural and non-structural foreign currency positions of the Group and the Bank.
Group
USD RMBOther foreign
currenciesTotal foreign
currencies
2006
Non-structural position
Spot assets 205,544 14,422 107,320 327,286
Spot liabilities (189,232) (12,670) (90,897) (292,799)
Forward purchases 128,102 353 15,294 143,749
Forward sales (141,544) (1,904) (31,575) (175,023)
Net options position 120 – (130) (10)
Net long non-structural position 2,990 201 12 3,203
% of total net non-structural position 93.3% 6.3% 0.4% 100.0%
Structural position 1,430 3,760 141 5,331
% of total net structural position 26.8% 70.5% 2.7% 100.0%
2005 (restated)
Non-structural position
Spot assets 193,149 5,955 98,115 297,219
Spot liabilities (168,513) (6,008) (97,661) (272,182)
Forward purchases 84,026 439 40,291 124,756
Forward sales (104,960) (300) (40,772) (146,032)
Net options position (77) – 75 (2)
Net long non-structural position 3,625 86 48 3,759
% of total net non-structural position 96.4% 2.3% 1.3% 100.0%
Structural position 1,035 2,439 107 3,581
% of total net structural position 28.9% 68.1% 3.0% 100.0%

NOTES TO THE FINANCIAL STATEMENTS (continued)
HANG SENG BANK188
61 Financial Risk Management (continued)(c) Market risk management (continued)Foreign exchange exposure (continued)
Bank
USD RMBOther foreign
currenciesTotal foreign
currencies
2006
Non-structural position
Spot assets 171,565 14,422 69,454 255,441
Spot liabilities (155,253) (12,670) (53,031) (220,954)
Forward purchases 128,102 353 15,294 143,749
Forward sales (141,544) (1,904) (31,575) (175,023)
Net options position 120 – (130) (10)
Net long non-structural position 2,990 201 12 3,203
% of total net non-structural position 93.3% 6.3% 0.4% 100.0%
Structural position 1,430 2,784 141 4,355
% of total net structural position 32.8% 63.9% 3.3% 100.0%
2005
Non-structural position
Spot assets 153,467 5,955 63,853 223,275
Spot liabilities (128,831) (6,008) (63,399) (198,238)
Forward purchases 84,026 439 40,291 124,756
Forward sales (104,960) (300) (40,772) (146,032)
Net options position (77) – 75 (2)
Net long non-structural position 3,625 86 48 3,759
% of total net non-structural position 96.4% 2.3% 1.3% 100.0%
Structural position 1,035 2,043 107 3,185
% of total net structural position 32.5% 64.1% 3.4% 100.0%
Equities exposureThe Group’s equities exposure in 2006 is mainly in long-term equity investments which are reported as “Financial investments” set out in note 34. Equities held for trading purpose are included under “Trading assets” set out in note 31. These are subject to trading limit and risk management control procedures and other market risk regime.
(d) Insurance underwriting riskInsurance riskThrough its insurance subsidiaries, the Group offers comprehensive insurance products, including life and non-life insurance, to both personal and commercial customers. These insurance operating subsidiaries are subject to the supervision of the Office of the Commissioner of Insurance (“Insurance Commissioner”) and are required to observe the relevant compliance requirements stipulated by the Insurance Commissioner.
The Group manages its insurance risks through the application of sound underwriting, reinsurance, risk management and claims procedures as discussed below. There are well established claims procedures handled by professional department independent of underwriting. Reserves are prudently maintained for claims and policyholders’ liabilities in accordance with the policies and procedures set out in note 3(ac) in page 106. Present value of in-force long-term insurance business (PVIF) is calculated using prudent actuarial assumptions set out in note 40(a) in page 144. The sensitivity of the PVIF valuation to changes in individual assumptions is also exhibited therein.

189ANNUAL REPORT 2006
61 Financial Risk Management (continued)(d) Insurance underwriting risk (continued)
Insurance risk (continued)Insurance business is also exposed to financial risks if the proceeds from the financial assets are not sufficient to fund the obligations arising from insurance and investment contracts. The insurance business manages financial risk through asset and liability management, prudent investment guidelines and market risk management techniques of the Group.
Life Insurance businessLife insurance contracts include endowments, pensions and term assurance. The Group assesses and monitors the life insurance risk exposures for both individual types of risks insured and overall risks by using internal risk measurement models, sensitivity analysis, scenario analyses and stress testing.
Underwriting strategyThe Group’s overall approach to life insurance risk is to maintain a good diversification to ensure a balanced portfolio and is based on a large portfolio of similar risks over a number of years to reduce the variability of the outcome.
The following gives an assessment of the life’s main products and the ways in which it manages the associated risks:
Long-term insurance contracts – non-linked productsLong-term non-linked insurance contracts provide guaranteed death benefit with a fixed level of premium determined at the time of policy issue. For insurance products with a savings element, guaranteed surrender and maturity benefits are usually provided.
To manage the insurance risk arisen from such contracts, the Group has the complete contractual discretion on the bonuses declared and maintained a smooth dividend scale based on long-term rate of return. Annual review is performed to assess whether the current dividend scale is supportable taken into account the overall experience on investment, claims, operating expense and lapse. On the other hand, investment risks are managed through matching assets and liabilities. Investment strategies are set to ensure sufficient investment return to satisfy policyholders’ reasonable expectations. Mortality risks are managed through reinsurance and proper underwriting.
Long-term insurance contracts – unit-linked productsLong-term unit-linked insurance contracts provide policyholders life insurance protection with direct investment in a variety of funds. Premiums received are deposited into the chosen fund after deduction of a premium fee. Other charges for the cost of insurance and administration will be deducted from the funds accumulated. For long-term unit-linked insurance contracts, the policyholders bear the market risk on the linked assets and liabilities. However, the Group assumes reputational risk for any undue market risk taken by policyholders. In this regards, the Group will ensure that the policyholders’ exposure to market risk is consistent with that of the market. Claims and expenses are reviewed regularly to ensure current charges are sufficient to cover the costs.
Long-term investment contractsThe Group underwrites retirement fund business which is classified as investment contracts. Like the insurance contracts, investment contracts comprise of non-linked return guaranteed products and unit-linked products.
For non-linked return guaranteed products, the Group provides an investment return guarantee on these retirement funds. Guaranteed risks are managed through investment in good quality fixed rate bonds. Investment strategy is set with the objective of providing return that is sufficient to meet at least the minimum guarantee.
For unit-linked products, the Group manages the relative risk similar to long-term unit-linked insurance contracts.
Reinsurance strategyThe Group reinsures a portion of the risks it underwrites in order to control its exposures to losses and protect capital resources. The Group buys a combination of proportionate and non-proportionate reinsurance to reduce the retained sum assured. The Group also utilises a reinsurance agreement with non-affiliated reinsurers to control its exposure to losses resulting from catastrophe. To minimize the credit risk arisen from reinsurance, only a number of professional companies meeting credit rating standard are selected.

NOTES TO THE FINANCIAL STATEMENTS (continued)
HANG SENG BANK190
61 Financial risk management (continued)(d) Insurance underwriting risk (continued)Life Insurance business (continued)Concentration of insurance risksConcentration of risk may arise where a particular event or series of events could impact heavily on the Group’s liabilities. Such concentrations may arise from a single contract or through a small number of related contracts, and relate to circumstances where significant liabilities could arise. The Group mitigates such risk through reinsurance. To determine the concentration of insurance risk and the reinsurance coverage required, scenario analyses are performed to investigate the potential financial impact on the Group.
Non-life insurance businessNon-life insurance contracts include mainly fire property damage, accident property damage, marine cargo, motor, accident and health, employees’ compensation/employers’ liability and general liability.
Underwriting strategyThe Group manages the underwriting risk to ensure that the risks are well diversified in terms of type and amount of risk and industry. The Group focuses on underwriting business in Hong Kong and most of its business is solicited by the Bank which act as an insurance agent. An underwriting strategy is prepared and reviewed annually and it sets out the classes of business and the territories in which the business is to be written, the industry sectors and the target customers which the Group is prepared to underwrite.
Reinsurance strategyTo increase the underwriting capacity and to mitigate the Group’s exposure, reinsurance arrangements were specially made for each class of business thereby limiting the Group’s liabilities to an optimal level according to the underwriting results of the relevant covers. The reinsurance arrangements include excess of loss, catastrophe coverage, treaty and facultative reinsurance.
Concentration of insurance risksWithin the insurance process, concentrations of risks may arise where a particular event or a series of events could impact heavily the Group’s liabilities. Such concentrations may arise from the occurrence of a catastrophe affecting a number of insurance contracts. Most of the insurance contracts are annually renewable and the Group has the right to refuse renewal or to change the terms and conditions of contracts at renewal.
For property damage business, there is the potential risk of concentration arising from the provision of insurance coverage to policyholders in the same location. Catastrophic losses are protected by reinsurance. For accident and health business, potential accumulations of personal accident risks are mitigated by the purchase of catastrophe reinsurance. For motor insurance business, reinsurance protection has been arranged where necessary to avoid excessive exposure to large losses, particularly those relating to personal injury claims. For marine cargo business, reinsurance is arranged with the Group’s net exposure per risk per vessel at a particular automatic gross acceptance level. For employees’ compensation/employers’ liability, catastrophic losses are protected by reinsurance.
62 Use Of DerivativesDerivatives are financial contracts whose value and characteristics are derived from underlying assets, exchange and interest rates, and indices. Derivative instruments are subject to both credit risk and market risk. The credit risk relating to a derivative contract is principally the replacement cost of the contract when it has a positive mark-to-market value and the estimated potential future change in value over the residual maturity of the contract. The nominal value of the contracts does not represent the amount of the Group’s exposure to credit risk. All activities relating to derivatives are subject to the same credit approval and monitoring procedures used for other credit transactions. Details of the nominal value, fair value and credit risk-weighted amounts of derivatives are set out in note 54. Market risk from derivative positions is controlled individually and in combination with on-balance sheet market risk positions within the Group’s market risk limits regime as described in note 61(c).
The Group transacts derivatives for three primary purposes: to create risk management solutions for clients, for proprietary trading purposes, and to manage and hedge its own risks. For accounting purposes, derivative instruments are classified as either held for trading or hedging.
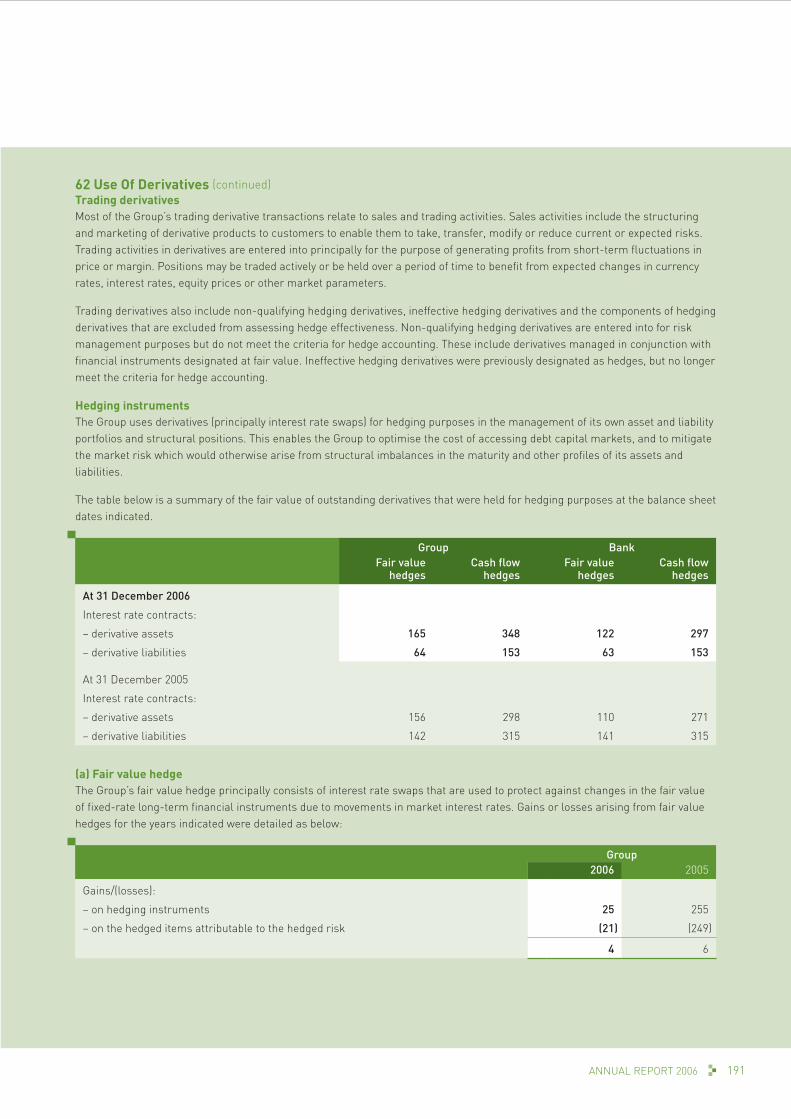
191ANNUAL REPORT 2006
62 Use Of Derivatives (continued)Trading derivativesMost of the Group’s trading derivative transactions relate to sales and trading activities. Sales activities include the structuring and marketing of derivative products to customers to enable them to take, transfer, modify or reduce current or expected risks. Trading activities in derivatives are entered into principally for the purpose of generating profits from short-term fluctuations in price or margin. Positions may be traded actively or be held over a period of time to benefit from expected changes in currency rates, interest rates, equity prices or other market parameters.
Trading derivatives also include non-qualifying hedging derivatives, ineffective hedging derivatives and the components of hedging derivatives that are excluded from assessing hedge effectiveness. Non-qualifying hedging derivatives are entered into for risk management purposes but do not meet the criteria for hedge accounting. These include derivatives managed in conjunction with financial instruments designated at fair value. Ineffective hedging derivatives were previously designated as hedges, but no longer meet the criteria for hedge accounting.
Hedging instrumentsThe Group uses derivatives (principally interest rate swaps) for hedging purposes in the management of its own asset and liability portfolios and structural positions. This enables the Group to optimise the cost of accessing debt capital markets, and to mitigate the market risk which would otherwise arise from structural imbalances in the maturity and other profiles of its assets and liabilities.
The table below is a summary of the fair value of outstanding derivatives that were held for hedging purposes at the balance sheet dates indicated.
Group BankFair value
hedgesCash flow
hedgesFair value
hedgesCash flow
hedges
At 31 December 2006
Interest rate contracts:
– derivative assets 165 348 122 297
– derivative liabilities 64 153 63 153
At 31 December 2005
Interest rate contracts:
– derivative assets 156 298 110 271
– derivative liabilities 142 315 141 315
(a) Fair value hedgeThe Group’s fair value hedge principally consists of interest rate swaps that are used to protect against changes in the fair value of fixed-rate long-term financial instruments due to movements in market interest rates. Gains or losses arising from fair value hedges for the years indicated were detailed as below:
Group2006 2005
Gains/(losses):
– on hedging instruments 25 255
– on the hedged items attributable to the hedged risk (21) (249)
4 6

NOTES TO THE FINANCIAL STATEMENTS (continued)
HANG SENG BANK192
62 Use Of Derivatives (continued)(b) Cash flow hedgesThe Group is exposed to variability in future interest cash flows on non-trading assets and liabilities which bear interest at variable rates or which are expected to be re-funded or reinvested in the future. The amounts and timing of future cash flows, representing both principal and interest flows, are projected for each portfolio for financial assets and liabilities on the basis of their contractual terms and other relevant factors, including estimates of prepayments and defaults. The aggregate principal balances and interest cash flows across all portfolios over time form the basis for identifying gains and losses on the effective portions of derivatives designated as cash flow hedges of forecast transactions.
The gains and losses on ineffective portions of cash flow hedges derivatives recognised in the income statement were as follows:
Group2006 2005
Gains/(losses) on ineffective portions of cash flow hedges (3) –
The schedules of forecast principal balances on which the expected interest cash flows associated with derivatives that are cash flow hedges were as follows:
GroupThree
months or less
Three months to
one year One year to
five years
At 31 December 2006
Cash inflows from assets 45,825 40,102 12,240
Cash outflows from liabilities – – –
Net cash inflows 45,825 40,102 12,240
At 31 December 2005
Cash inflows from assets 45,745 95,763 91,573
Cash outflows from liabilities – – –
Net cash inflows 45,745 95,763 91,573
BankThree
months or less
Three months to
one yearOne year to
five years
At 31 December 2006
Cash inflows from assets 42,396 37,170 10,848
Cash outflows from liabilities – – –
Net cash inflows 42,396 37,170 10,848
At 31 December 2005
Cash inflows from assets 43,019 87,961 79,129
Cash outflows from liabilities – – –
Net cash inflows 43,019 87,961 79,129

193ANNUAL REPORT 2006
62 Use Of Derivatives (continued)Hedge effectiveness testingIn order to qualify for hedge accounting, the Group carries out prospective effectiveness testing to demonstrate that it expects the hedge to be highly effective at the inception of the hedge and throughout its life. Actual effectiveness (retrospective effectiveness) is also demonstrated on an ongoing basis.
The documentation of each hedging relationship sets out how the effectiveness of the hedge is assessed. The method the Group adopts for assessing hedge effectiveness will depend on its risk management strategy.
For fair value hedge relationships, the Group utilises the cumulative dollar offset method as effectiveness testing methodology. For cash flow hedge relationships, the Group utilises the change in variable cash flow method or capacity test or the cumulative dollar offset method using the hypothetical derivative approach.
For prospective effectiveness, the hedging instrument is expected to be highly effective in achieving offsetting changes in fair value or cash flows attributable to the hedged risk during the year for which the hedge is designated. For actual effectiveness, the change in fair value or cash flows must offset each other in the range of 80 per cent to 125 per cent for the hedge to be deemed effective.
63 Fair Value Of Financial Instruments(a) Determination of fair valueFair value estimates are generally subjective in nature, and are made as of a specific point in time based on the characteristics of the financial instruments and relevant market information. Where available, the most suitable measure for fair value is the quoted market price. In the absence of organised secondary markets for most financial instruments, and in particular for loans, deposits and unlisted derivatives, direct market prices are not available, the fair value of such instruments is therefore calculated on the basis of well-established valuation techniques using current market parameters. In particular, the fair value is a theoretical value applicable at a given reporting date, and hence can only be used as an indicator of the value realisable in a future sale.
All valuation models are validated before they are used as a basis for financial reporting, by qualified personnel independent of the area that created the mode. Wherever possible, the Group compares valuations derived from models with quoted prices of similar financial instruments, and with actual values when realised, in order to further validate and calibrate the models. These techniques involve uncertainties and are significantly affected by the assumptions used and judgement made regarding risk characteristics of various financial instruments, discount rates, estimates of future cash flows, future expected loss experiences and other factors.
The methods and significant assumptions applied in determining the fair value of financial instruments are set out in note 3(n).

NOTES TO THE FINANCIAL STATEMENTS (continued)
HANG SENG BANK194
63 Fair Value of Financial Instruments (continued)(b) Fair valueAll financial instruments are stated at fair value or carried at amounts not materially different from their fair values as at31 December 2006 and 2005 except as follows:
Group2006 2005
Carrying amount Fair value
Carrying amount Fair value
Financial Assets
Placings with and advances to banks andother financial institutions 99,705 99,705 69,286 69,284
Advances to customers 279,353 281,856 260,680 260,139
Held-to-maturity debt securities 16,137 16,551 10,731 10,778
Financial Liabilities
Current, savings and other deposit accounts 482,821 482,804 430,995 430,944
Deposits from banks 17,950 17,950 12,043 12,043
Certificates of deposit and other debt securities in issue 7,595 7,448 10,023 9,825
Subordinated liabilities 7,000 7,008 3,511 3,547
Bank2006 2005
Carrying amount Fair value
Carrying amount Fair value
Financial Assets
Placings with and advances to banks andother financial institutions 80,679 80,679 46,520 46,518
Advances to customers 244,235 246,741 215,110 214,791
Financial Liabilities
Current, savings and other deposit accounts 478,712 478,694 421,518 421,467
Deposits from banks 17,680 17,680 12,043 12,043
Certificates of deposit and other debt securities in issue 7,623 7,477 10,060 9,864
Subordinated liabilities 7,000 7,008 3,511 3,547

195ANNUAL REPORT 2006
64 Cross-Border ClaimsCross-border claims include receivables, loans and advances, balances due from banks, holdings of certificates of deposit, bills, promissory notes, commercial paper and other negotiable debt instruments, as well as accrued interest and overdue interest on these assets. Claims are classified according to the location of the counterparties after taking into account the transfer of risk. For a claim guaranteed by a party situated in a country different from the counterparty, the risk will be transferred to the country of the guarantor. For a claim on the branch of a bank or other financial institution, the risk will be transferred to the country where its head office is situated. Claims on individual countries or areas, after risk transfer, amounting to 10 per cent or more of the aggregate cross-border claims are shown as follows:
Banks and other financial
institutions
Sovereign and public
sector entities Other Total
At 31 December 2006
Asia-Pacific excluding Hong Kong:
– Australia 33,724 – 1,355 35,079
– Other 49,686 1,247 9,677 60,610
83,410 1,247 11,032 95,689
The Americas:
– United States 25,998 1,451 9,114 36,563
– Other 18,800 3,482 6,837 29,119
44,798 4,933 15,951 65,682
Western Europe:
– United Kingdom 38,203 – 9,619 47,822
– Other 101,805 590 4,165 106,560
140,008 590 13,784 154,382
At 31 December 2005
Asia-Pacific excluding Hong Kong:
– Australia 23,961 144 712 24,817
– Other 38,140 1,447 6,882 46,469
62,101 1,591 7,594 71,286
The Americas:
– United States 13,163 1,709 6,575 21,447
– Other 16,248 4,727 5,814 26,789
29,411 6,436 12,389 48,236
Western Europe:
– United Kingdom 23,008 – 7,842 30,850
– Other 81,089 1,430 6,207 88,726
104,097 1,430 14,049 119,576

NOTES TO THE FINANCIAL STATEMENTS (continued)
HANG SENG BANK196
65 Comparative FiguresCertain comparative figures have been reclassified to conform with the current year’s presentation.
66 Non-Adjusting Post Balance Sheet EventOn 5 February 2007, Industrial Bank Co., Ltd. (“Industrial Bank” ), an associate of the Bank, issued 1,001 million new shares for a total consideration of RMB15,996 million. The Bank did not subscribe for any additional shares and, as a result, its interest in the equity of Industrial Bank decreased from 15.98 per cent to 12.78 per cent. While the Bank’s interest has reduced, the assets of Industrial Bank have substantially increased as a result of this issue. Consequently, it is expected that this transaction would result in an increase of about RMB1.5 billion in the Group’s share of the underlying net assets of Industrial Bank.
The decrease of the Bank’s interest in the equity of Industrial Bank does not affect the influence that the Bank has over this associate, as there has been no change in the composition of major shareholders in Industrial Bank or in the Bank’s representation in the Industrial Bank’s Board of Directors or Executive Committee. The Bank will continue to have the power to participate in the financial and operating policy decisions of Industrial Bank, and its investment will continue to be accounted for using the equity method.
67 Parent And Ultimate Holding CompanyThe parent and ultimate holding companies of the Bank are The Hongkong and Shanghai Banking Corporation Limited (incorporated in Hong Kong) and HSBC Holdings plc (incorporated in England) respectively.
68 Approval Of Financial StatementsThe financial statements were approved and authorised for issue by the Board of Directors on 5 March 2007.

197ANNUAL REPORT 2006
INDEPENDENT AUDITOR’S REPORT
INDEPENDENT AUDITOR’S REPORT TO THE SHAREHOLDERS OF HANG SENG BANK LIMITED(Incorporated in Hong Kong with limited liability)
We have audited the consolidated financial statements of Hang Seng Bank Limited (“the Bank”) set out on pages 89 to 196, which comprise the consolidated and the Bank balance sheets as at 31 December 2006, and the consolidated income statement, the consolidated statement of recognised income and expense and the consolidated cash flow statement for the year then ended, and a summary of significant accounting policies and other explanatory notes.
DIRECTORS’ RESPONSIBILITY FOR THE FINANCIAL STATEMENTSThe directors of the Bank are responsible for the preparation and the true and fair presentation of these financial statements in accordance with Hong Kong Financial Reporting Standards issued by the Hong Kong Institute of Certified Public Accountants and the Hong Kong Companies Ordinance. This responsibility includes designing, implementing and maintaining internal control relevant to the preparation and the true and fair presentation of financial statements that are free from material misstatement, whether due to fraud or error; selecting and applying appropriate accounting policies; and making accounting estimates that are reasonable in the circumstances.
AUDITOR’S RESPONSIBILITYOur responsibility is to express an opinion on these financial statements based on our audit. This report is made solely to you, as a body, in accordance with section 141 of the Hong Kong Companies Ordinance, and for no other purpose. We do not assume responsibility towards or accept liability to any other person for the contents of this report.
We conducted our audit in accordance with Hong Kong Standards on Auditing issued by the Hong Kong Institute of Certified Public Accountants. Those standards require that we comply with ethical requirements and plan and perform the audit to obtain reasonable assurance as to whether the financial statements are free from material misstatement.
An audit involves performing procedures to obtain audit evidence about the amounts and disclosures in the financial statements. The procedures selected depend on the auditor’s judgement, including the assessment of the risks of material misstatement of the financial statements, whether due to fraud or error. In making those risk assessments, the auditor considers internal control relevant to the entity’s preparation and true and fair presentation of the financial statements in order to design audit procedures that are appropriate in the circumstances, but not for the purpose of expressing an opinion on the effectiveness of the entity’s internal control. An audit also includes evaluating the appropriateness of accounting policies used and the reasonableness of accounting estimates made by the directors, as well as evaluating the overall presentation of the financial statements.
We believe that the audit evidence we have obtained is sufficient and appropriate to provide a basis for our audit opinion.
OPINIONIn our opinion, the consolidated financial statements give a true and fair view of the state of affairs of the Bank and of the Group as at 31 December 2006 and of the Group’s profit and cash flows for the year then ended in accordance with Hong Kong Financial Reporting Standards and have been properly prepared in accordance with the Hong Kong Companies Ordinance.
KPMGCertified Public Accountants
8th Floor, Prince’s Building10 Chater RoadCentral, Hong Kong
5 March 2007

ANALYSIS OF SHAREHOLDERS
HANG SENG BANK198
Shareholders Shares of HK$5 each
At 31 December 2006 NumberPercentage
of totalNumber in
millionsPercentage
of total
Number of shares held
1 – 500 6,319 30.82 1.6 0.08
501 – 2,000 6,741 32.88 8.3 0.43
2,001 – 5,000 3,594 17.53 12.3 0.64
5,001 – 20,000 2,914 14.22 29.6 1.55
20,001 – 50,000 597 2.91 18.5 0.97
50,001 – 100,000 173 0.84 12.6 0.66
100,001 – 200,000 89 0.44 12.6 0.66
Over 200,000 74 0.36 1,816.3 95.01
20,501 100.00 1,911.8 100.00
Geographical Distribution
Hong Kong 20,092 98.00 1,908.6 99.83
Malaysia 88 0.42 0.7 0.03
Singapore 52 0.25 1.0 0.05
Macau 40 0.20 0.2 0.01
Canada 64 0.31 0.3 0.02
United Kingdom 44 0.22 0.1 0.00
United States of America 44 0.22 0.3 0.02
Australia 45 0.22 0.3 0.02
Others 32 0.16 0.3 0.02
20,501 100.00 1,911.8 100.00
SUBSIDIARIES*
199ANNUAL REPORT 2006
Bankers Alliance Insurance Company Limited
Beautiful Fountain Investment Company Limited
Everlasting International Limited
Fulcher Enterprises Company Limited
Full Wealth Investment Limited
Hang Che Lee Company, Limited (In members’ voluntary liquidation)
Hang Seng Asset Management Pte Ltd
Hang Seng Bank (Bahamas) Limited
Hang Seng Bank (Trustee) Limited
Hang Seng Bank Trustee (Bahamas) Limited
Hang Seng Bank Trustee International Limited
Hang Seng Bullion Company Limited
Hang Seng Credit Limited
Hang Seng Credit (Bahamas) Limited
Hang Seng Data Services Limited
Hang Seng Finance Limited
Hang Seng Finance (Bahamas) Limited
Hang Seng Financial Information Limited
Hang Seng Futures Limited
Hang Seng Insurance Company Limited
Hang Seng Insurance (Bahamas) Limited
Hang Seng Investment Management Limited
Hang Seng Investment Services Limited
Hang Seng Life Limited
Hang Seng (Nominee) Limited
Hang Seng Real Estate Management Limited
Hang Seng Security Management Limited
Hang Seng Securities Limited
Haseba Investment Company Limited
Hayden Lake Limited
High Time Investments Limited
HSI International Limited
HSI Services Limited
Imenson Limited
Mightyway Investments Limited
Perpetual Publicity Limited
Silver Jubilee Limited
Wide Cheer Investment Limited (In members’ voluntary liquidation)
Yan Nin Development Company Limited
* As defined in Section 2 of Hong Kong Companies Ordinance.
CORPORATE INFORMATION AND CALENDAR
HANG SENG BANK200
Corporate Information
Honorary Senior Advisor to the BankThe Honourable Lee Quo-Wei GBM, JP
Board Of Directors
ChairmanMichael R P Smith OBE
Vice-ChairmanRaymond C F Or JP
DirectorsEdgar D Ancona
John C C Chan GBS, JP
Patrick K W Chan
Y T Cheng DPMS, DBA(Hon), LLD(Hon), DSSc(Hon)
Marvin K T Cheung DBA(Hon), SBS, OBE, JP
Jenkin Hui
Peter T C Lee JP
Eric K C Li FCPA(Practising), GBS, OBE, JP
Vincent H S Lo GBS, JP
Joseph C Y Poon
David W K Sin DSSc(Hon)
Richard Y S Tang MBA, BBS, JP
Peter T S Wong JP
SecretaryC C Li
Registered Office83 Des Voeux Road Central, Hong Kong
Telephone: (852) 2198 1111
Facsimile: (852) 2868 4047
Telex: 73311 73323
SWIFT: HASE HK HH
Website: http://www.hangseng.com
Stock CodeThe Stock Exchange of Hong Kong Limited: 11
RegistrarsComputershare Hong Kong Investor Services Limited
46th Floor, Hopewell Centre,
183 Queen’s Road East, Wanchai, Hong Kong
Depository*
The Bank of New York
American Depositary Receipts
Investor Services
P.O. Box 11258
Church Street Station
New York, NY 10286-1258, USA
Telephone: 1-212-815-3700
Toll free (domestic): 1-888-269-2377
Website: http://www.stockbny.com
Email: [email protected]
* The Bank offers investors in the United States a Sponsored Level-1 American Depositary Receipts Programme through The Bank ofNew York.
Annual Report 2006The Annual Report 2006 in both English and Chinese isnow available in printed form and on the Bank’s website: http://www.hangseng.com.
Shareholders who:
A) received this Annual Report 2006 by electronic means and wish to receive a printed copy; or
B) received this Annual Report 2006 in either English or Chinese and wish to receive a printed copy of the other language version,
may send a notice in writing to the Bank’s Registrars:
Computershare Hong Kong Investor Services Limited
Rooms 1806-7, 18th Floor, Hopewell Centre
183 Queen’s Road East
Wanchai, Hong Kong
Facsimile: (852) 2529 6087
Email: [email protected]
Shareholders who have chosen to receive this Annual Report 2006 by electronic means through the Bank’s website and who, for any reason, have difficulty in receiving or gaining access to this Annual Report 2006, may submit a written request to the Bank’s Registrars, Computershare Hong Kong Investor Services Limited, and be sent this Annual Report 2006 in printed form free of charge.
Shareholders may change their choice of language or means of receipt of the Bank’s future corporate communications at any time, free of charge, by completing and sending to the Bank’s Registrars, Computershare Hong Kong Investor Services Limited, a change request form which can be obtained from the Bank’s Registrars.

Calendar
2006 Full Year Results
Announcement date 5 March 2007
2006 Fourth Interim Dividend*
Announcement date 5 March 2007
Book close and record date 20 March 2007
Payment date 30 March 2007
2006 Annual Report
posted to shareholders by early April 2007
Annual General Meeting
to be held on 2 May 2007
2007 Half Year Results
Announcement date 30 July 2007
2007 Interim Report
posted to shareholders in late August 2007
Proposed dates for 2007:
2007 First Interim Dividend
Announcement date 3 May 2007
Book close and record date 22 May 2007
Payment date 5 June 2007
2007 Second Interim Dividend
Announcement date 30 July 2007
Book close and record date 21 August 2007
Payment date 30 August 2007
2007 Third Interim Dividend
Announcement date 5 November 2007
Book close and record date 27 November 2007
Payment date 11 December 2007
2007 Full Year Results
Announcement date 3 March 2008
2007 Fourth Interim Dividend
Announcement date 3 March 2008
Book close and record date 18 March 2008
Payment date 28 March 2008
* The Register of Shareholders of the Bank will be closed on Tuesday,20 March 2007, during which no transfer of shares can be registered. To qualify for the fourth interim dividend, all transfers, accompanied by the relevant share certificates, must be lodged with the Bank’s Registrars, Computershare Hong Kong Investor Services Limited, Shops 1712-1716, 17th Floor, Hopewell Centre, 183 Queen’s Road East, Wanchai, Hong Kong, for registration not later than 4:30 pm on Monday, 19 March 2007. The fourth interim dividend will be payable on Friday, 30 March 2007 to shareholders on the Register of Shareholders of the Bank on Tuesday, 20 March 2007.
© Hang Seng Bank Limited 2007
Concept and design: YELLOW CREATIVE (HK) LIMITED
Principal photography: Graham Uden
Printed by Asia One Printing on Magno Satin paper using soy-based inks. With the cover board made in The Netherlands and the text paper made in Austria, Magno Satin comprises 80% virgin fibre (from well-managed forestry sources) and 20% pre-consumer waste (mill broke). Pulps used are totally chlorine-free.
���� ���� ��� ��� ���� ��� ��� ��� �������� ���� ����
����� ���
���������������
����
��������� ��!""#
���$