
HAME508: Making Capital Investment Decisions - Amazon S3
70
Copyright © 2012 eCornell. All rights reserved. All other copyrights, trademarks, trade names, and logos are the sole property of their respective owners. 1 HAME508: Making Capital Investment Decisions
-
Upload
khangminh22 -
Category
Documents
-
view
1 -
download
0
Transcript of HAME508: Making Capital Investment Decisions - Amazon S3

Copyright © 2012 eCornell. All rights reserved. All other copyrights, trademarks, trade names, and logos are the sole property of their respective owners. 1
HAME508: Making Capital Investment Decisions

Copyright © 2012 eCornell. All rights reserved. All other copyrights, trademarks, trade names, and logos are the sole property of their respective owners. 2
This course includes
Five self-check quizzes
One action plan
One course project
Several discussions, of which you
must participate in two
Completing all of the coursework should take
about five to seven hours.
What you'll learn
How value is created in a business.
How capital budgeting rules provide
a framework for making project
investment decisions.
The ways that net present value,
internal rate of return and other
financial metrics give insight into the
business.
What you'll need
One of the following:
Hewlett-Packard 12C
Texas Instruments BA II Plus
Texas Instruments BA II Plus app
for iPhone and iPad
Course Description
The key to financial success for any business is in choosing the right projects to pursue at the right time, for the right price
and with the right financing structure. Your role as a manager includes participating in decisions about which projects

Copyright © 2012 eCornell. All rights reserved. All other copyrights, trademarks, trade names, and logos are the sole property of their respective owners. 3
make sense for the company and are likely to return a profit. To fill that role effectively, you are going to need some basic
understanding of the capital budgeting decision rules.
There are six basic rules you need to be able to apply: net present value, internal rate of return, payback period,
discounted payback period, profitability index, and equivalent annual cost. Each of these will give you a different
perspective on the potential projects under consideration at your organization. Non-financial managers need to be
conversant in how each of these tools works so that you can sit at the table when decisions are being made and
offer your valuable insight and expertise.
Working through the examples in this course using both a financial calculator and popular spreadsheet applications will
help you practice applying the tools and strategies, and will set you up to make project decisions that lead to growth and
profitability.
Steven Carvell Professor and Associate Dean for Academic Affairs, School of Hotel Administration, Cornell University
has taught finance courses at Cornell University since 1986. Professor Carvell is the co-author of Steven Carvell In the
(Prentice-Hall, Inc. Strebel, Paul and Steven Carvell, 1988). Carvell has worked for professionalShadows of Wall Street
money managers in applied strategy in the equity market and served as a consultant to the Presidential Commission on
the 1987 stock market crash. Professor Carvell has conducted numerous specialized Executive Education seminars for
some of the largest hotel companies in the world. Carvell holds a Ph.D. from the State University of New York,
Binghamton.
Scott Gibson Zollinger Professor of Finance, Mason School of Business, College of William and Mary
is the Zollinger Professor of Finance at the College of William and Mary Mason School of Business andScott Gibson
previously held academic appointments at Cornell University and the University of Minnesota. He holds a B.S. and Ph.D.

Copyright © 2012 eCornell. All rights reserved. All other copyrights, trademarks, trade names, and logos are the sole property of their respective owners. 4
in Finance from Boston College. Prior to his academic career, he worked as an analyst with Fidelity Investments and as a
credit team leader serving Fortune 500 clientele with HSBC Bank. He's won outstanding teaching awards on numerous
occasions, including being named an outstanding faculty member in .BusinessWeek Guide to the Best Business Schools
His finance research has appeared in top academic journals and has been featured in the financial press, including the
, , , , , and .Wall Street Journal Financial Times New York Times Barron's Businessweek Bloomberg
Start Your Course

Copyright © 2012 eCornell. All rights reserved. All other copyrights, trademarks, trade names, and logos are the sole property of their respective owners. 5
Module Introduction: Capital Budgeting Rules
Copyright © 2012 eCornell. All rights reserved. All other copyrights, trademarks, trade names, and logos are the sole property of their respective owners. 6
Tool: Calculators and Spreadsheets
Download the Tool
Professor Gibson's Quick guide to using the HP12C
emulator for Apple devices TA BI II Plus
for Apple devices HP 12C
emulator for Android HP 12C
emulator online HP 12C
as a financial calculator Using MS Excel
Calculator tutorials
In addition to teaching you the methodology of TVM (time value of money), this course teaches the key strokes for two
financial calculators: the HP 12C and the TI BA II Plus. Financial calculators are not the same as scientific calculators or
standard calculators. Financial calculators include all of the following five functions:
: term N
: Present value PV
: interest rate i
: Future value FV
: PaymentPmt
Calculators that do not have these five functions will not be able to compute time value of money solutions other than
algebraically, which is much harder. Also note that other financial calculators may not use the same keystrokes to perform
calculations as the two recommended for this course. If you do not have one of the two recommended calculators, you
can download an emulator to your mobile device. You can also perform these calculations in Excel by following the
instructions via the link above.
The HP 12C Calculator
The HP 12C is HP's longest- and best-selling product, in continual production since its introduction in 1981. The HP 12C is
one of only two calculators permitted on (and the TI BA II Plus is the other).Chartered Financial Analyst Program exams
You may buy the actual HP 12C calculator, or you can buy an HP 12C or App. There are several versions ofiOS Android
the HP 12C:
The Classic Gold HP 12C uses only reverse Polish notation* (RPN).
The Platinum HP 12C allows the user to choose either RPN or algebraic notation (AN) mode. ("Normal" calculators
you're familiar with are based on AN, so the Platinum HP 12C in AN mode might be easiest for you.)
The Limited Edition 25 Anniversary HP 12C Platinum edition allows user to choose either RPN or AN mode. HPth
claims it has a high-quality keyboard similar to the keyboard of the original 1980's Classic Gold HP-12C.
The Limited Edition 30 Anniversary HP 12C edition uses only RPN. HP, again, claims a high-quality keyboard.th

Copyright © 2012 eCornell. All rights reserved. All other copyrights, trademarks, trade names, and logos are the sole property of their respective owners. 7
You'll be able to solve most problems in this course much quicker using the HP 12C or another financial calculator than by
using Excel.
The TI BA II Plus Calculator
To find out more about the TI BA II Calculator, visit the .Texas Instruments website
*The "Polish" in reverse Polish notation refers to the nationality of logician , who invented Polish notation in the 1920s. Polish notation isJan ukasiewicz
parentheses-free and the inspiration for the idea of the recursive stack, a last-in, first-out computer memory store. Studies show that RPN calculators
are superior to AN calculators in terms of speed and accuracy of operation. However, as noted above, you'll likely be up and running faster with
Platinum HP 12C in the familiar AN mode.

Copyright © 2012 eCornell. All rights reserved. All other copyrights, trademarks, trade names, and logos are the sole property of their respective owners. 8
Read: A Difficult Choice
Key Points
A capital budgeting decision rule should consider all
of the project's cash flows, the time value of money,
and lead to the correct decision when choosing
projects
Case Study Big Red Trucking
The CEO of Big Red Trucking is pondering a number of projects proposed by several of his key advisors.
The Manager of Southeastern U.S. Operations submitted a plan to launch a new fleet of refrigerated trucks to
expand relationships with several food distributors in her region.
The Manager of Northeastern U.S. Operations suggests an aggressive geographic expansion of Big Red's truck
services into Southeastern Canada.
The Human Resources Director recommends a significant upgrade of health care benefits that she thinks can
better attract and retain truck drivers.
The Marketing Director proposes a costly new marketing campaign that she believes will bring in significant new
business.
All of the above are examples of capital budgeting projects. The CEO, who comes from a technical mechanical
engineering background, wonders what criteria he should use to decide which projects to accept and which to reject.
Moreover, the CEO is concerned about whether there will be sufficient capital to fund all of the projects deemed
worthwhile. If Big Red can't fund them all, how does he decide which projects to pursue now and which to delay?
Rules Overview
Capital budgeting is the process by which a firm decides which long-term investments to make. Capital budgeting
projects-that is, potential long-term investments-are expected to generate cash flows over several years. The decision to
accept or reject a capital budgeting project depends on an analysis of the cash flows generated by the project and its cost.

Copyright © 2012 eCornell. All rights reserved. All other copyrights, trademarks, trade names, and logos are the sole property of their respective owners. 9
Capital budgeting rules include and , which we cover in this course.accounting rules finance rules
A capital budgeting decision rule should:
Consider all of the project's cash flows
Consider the time value of money (the fact that the value of money may depend entirely on when it is received)
Always lead to the correct decision when choosing among mutually exclusive projects

Copyright © 2012 eCornell. All rights reserved. All other copyrights, trademarks, trade names, and logos are the sole property of their respective owners. 10
Read: Meet the Rules
Key Points
Accounting Rules
: Return on Assets-net income over total ROA
assets
: Return on Equity-net income over total ROE
assets based on book value of the equity
investment
: Earnings per Share-net income divided by the EPS
number of shares outstanding
Finance Rules
: Net Present Value-present value of cash NPV
flows, discounted at the hurdle rate, less the initial
cost
: Internal Rate of Return-break-even rate of IRR
return on net present value dollars
: Payback Period-number of years required to PBP
recover the initial investment
: Discounted Payback Period-number of DPBP
years required to recover the initial investment
taking into account the time value of money
: Profitability Index-net present value of the future PI
cash flows divided by initial investment
: Equivalent Annual Cost-comparison of assets EAC
by calculating annuity value
Accounting rules are used by firms to report accurately on their financial status.
The most commonly used rules are return on assets (ROA) and return on equity (ROE). These rules have some uses
when evaluating operating performance, but they should not be used to evaluate capital budgeting projects. There are a
number of reasons that these measures can be problematic.
First, as shown in the list on the right of this page, these rules depend on net income. While net income is one measure of

Copyright © 2012 eCornell. All rights reserved. All other copyrights, trademarks, trade names, and logos are the sole property of their respective owners. 11
annual value creation, it may introduce problems when used in the evaluation of capital projects. To properly evaluate a
project, it's important to determine the project's cash flows over its entire operating horizon and then discount those cash
flows back to the present. Net income does not provide a complete cash flow picture and cannot be used as a substitute
for cash flows. For this reason, using ROA and ROE as performance measures in a capital budgeting analysis would be
inappropriate.
Second, both ROA and ROE use book values (of assets and of equity, respectively). Book values do not represent market
values, and these values change over time. For example, as an asset ages, its book value declines with depreciation.
That means that the number used in the denominator of the ROA measure will decline (with depreciation) over time,
resulting in a lower ROA when the asset is newer and a higher assessed asset performance as it ages. The asset is not
necessarily generating more value as it ages, but its ratio of income to book value is rising over time. Furthermore, the low
ROA early on may lead you to reject what is a perfectly good investment. In making a sound decision, we need to assess
the asset over its entire life, not one year at a time.
Finally, when a company uses measures like ROA and ROE, it produces incentives for managers to engage in activities
that might make them look good but do so at the owner's expense. An example of this occurred when a manager at a
major copier manufacturer sold off many of her division's assets and then leased them back again. Why? Doing so
lowered the book value of her division's assets and made its ROA appear high. The sale of the assets was not motivated
by the belief that it was the best move for the company, only that it would make the ROA look good and therefore make
the manager look good. That was not the right incentive, and ROA was not the right measure!
In summary, these accounting rules provide specific information that, in general, is not appropriate for use in capital
budgeting decisions of the kind examined in this course.
Finance Rules
The finance rules (see list at right) help firms report consistently and accurately on their financial status. As surveys have
shown year after year, NPV and IRR are the two most popular decision rules used in the business world. Payback period
and discounted payback period are commonly used, too, especially if there is a desire for fast capital turnover. The
profitability index and equivalent annual cost are used only under special circumstances.

Copyright © 2012 eCornell. All rights reserved. All other copyrights, trademarks, trade names, and logos are the sole property of their respective owners. 12
Read: Creating Value
Key Points
Value is created when the present value of the
discounted cash flows from the project exceeds the
cost of the project
Finding the appropriate measurement device to
ensure that your company invests only in projects
that create value is critical to its long-term financial
success
It doesn't matter whether you manufacture automobiles or computers, own and operate hotels, or manage an Internet
company. Wealth or value must The objective of the firm is the same: to create value and maximize the owner's long-run wealth.
be created by every business in order for it to provide a reasonable return on the capital it employs. The business of
business is making money.
What are the consequences of NOT making money,
and why is making money so important anyway?
Consider the following scenario:
In the process of getting started, Company X
acquired substantial outstanding debt and
equity-this was quite normal. The company's
investors, who consented to bear considerable
risk by putting their money in the company's
hands, had the normal expectation that they
would be compensated. Company X was
therefore expected to generate sufficient value
each year to reward those investors; however,
the company failed to do so. As a result, stock
and bond prices declined and the investors lost
confidence. They were not happy!
Soon the company found it difficult to raise new
funds: the markets were aware of its inability to

Copyright © 2012 eCornell. All rights reserved. All other copyrights, trademarks, trade names, and logos are the sole property of their respective owners. 13
generate value. Finally, because the company
consistently failed to generate value for its capital
holders, it fell into financial distress and ceased
to exist as a viable economic entity.
To avoid a scenario such as the one described (right), companies must generate sufficient value for their owners. Value is
created in a business when that business identifies and invests in a particular kind of project: one that will produce a return
on investment exceeding the amount required to satisfy the sources of capital for the project. In other words, value is
created when the present value of the discounted cash flows from the project exceeds the cost of the project. Remember:
value creation is the single most important financial objective of a company. Therefore, finding the appropriate
measurement device to ensure that your company invests only in projects that create value is critical to its long-term
financial success.
Cash Flows versus Accounting Income
Value is created each year as the company produces cash flows sufficient to pay off obligations to its capital sources and
to grow and reinvest. We use cash flows to measure annual value creation because cash flows represent the addition of
cash to the business as a result of one or more projects' operations over the year.
You might ask, Why not use income as a measure of value creation? Though it is true that income can be used as a
measure of value creation over time, there are problems with this approach. For instance, income can include expenses
such as depreciation. Depreciation is a practice by which a business can recover (or write off) the value of a project over
its assumed useful life. It is not an annual cash flow-the only true cash outflow for an investment occurs at the time of the
asset's purchase. Since income is reduced by depreciation, income cannot be said to be a measure of the flow of cash to
and from the business. In finance, we want a measure that includes only these flows.

Copyright © 2012 eCornell. All rights reserved. All other copyrights, trademarks, trade names, and logos are the sole property of their respective owners. 14
Read: Hurdle Rates and Opportunity Costs
Key Points
The hurdle rate represents the minimum return
required by a project in order to create value for the
company
Risks and opportunity cost are considered in the
hurdle rate
Consider a simple balance sheet:
Assets = Debt + Equity
From the finance perspective, this relationship implies that every dollar of assets obtained by the business must be
financed by one of the two main sources of capital: debt or equity. Intuitively, what capital budgeting rules do is take into
consideration the sources of capital and the required returns from those sources of capital to evaluate the worthiness of an
investment.
Assets Liabilities
Short-term assets Short-term liabilities
Long-term assets Debt
Equity
When a company assesses the worth of a project, it uses capital budgeting rules to determine whether the project will
create value. The project cash flows are discounted back to the present, using a rate called the "hurdle rate." This rate is
well named! The hurdle rate is the rate of return that a project must exceed, or hurdle over, in order to pass as acceptable.
If the project cannot earn a return in excess of the hurdle rate that has been assigned to it, then that project is judged as
incapable of generating sufficient value, and it will not be undertaken.
The hurdle rate represents the minimum required return that must be achieved by a project in order for that project to
create value for the company. The project's risk profile determines the rate that would reasonably compensate the
company or the investors who provide the capital. Higher hurdle rates are assigned to projects with higher risk, and lower
hurdle rates are assigned to projects with lower risk, in recognition of the level of return required by the company. In this
way, the hurdle rate reflects the opportunity cost of the capital employed by the company when it purchases the assets
involved in the project's investment.
In practice, there are a number of qualitative decisions that are made in estimating the hurdle rate. This is where the art of

Copyright © 2012 eCornell. All rights reserved. All other copyrights, trademarks, trade names, and logos are the sole property of their respective owners. 15
financial analysis comes in! These qualitative decisions are discussed in detail in another financial course from eCornell
on the topic of risk, return, and the cost of capital.
The opportunity cost of the funds used to invest in the project is a reflection of the next-best-alternative use of the money.
Remember: the money available for this project could be invested elsewhere; if it were possible to get a higher return
given a similar level of risk, that would be preferable.
We use the hurdle rate as the interest rate in our time value of money calculations and assessments of each project.
Copyright © 2012 eCornell. All rights reserved. All other copyrights, trademarks, trade names, and logos are the sole property of their respective owners. 16
Module Wrap-up: Capital Budgeting Rules
As a non-financial manager, you must be able to collaborate with the finance team in your organization to add value to the
company and create a positive cash flow. In this module, you examined an introduction to capital budget rules. You
identified the six main capital budgeting rules: net present value (NPV), internal rate of return (IRR), payback period
(PBP), discounted payback period (DPBP), profitability index (PI), and equivalent annual cost (EAC). You saw that these
are the rules that will help you decide which projects to do or not do, which initiatives to fund, and how your management
team can work together toward the shared goal of making good capital investment decisions.

Copyright © 2012 eCornell. All rights reserved. All other copyrights, trademarks, trade names, and logos are the sole property of their respective owners. 17
Module Introduction: Net Present Value

Copyright © 2012 eCornell. All rights reserved. All other copyrights, trademarks, trade names, and logos are the sole property of their respective owners. 18
Read: Big Red Value
Case Study Big Red
The management team at Big Red Trucking faces a challenge. The company currently provides trucking and storage
services to Northeastern clientele. The management team at Big Red is considering an expansion of its geographic
coverage into Midwestern U.S. markets.
Exploring opportunities other than building from scratch, Big Red has identified a privately held acquisition target, MidWest
Transportation. MidWest's asking price of $535 million appears to be nonnegotiable. MidWest's business is a virtual
carbon copy of Big Red's business. Big Red, therefore, plans to value MidWest's cash flows using its own hurdle rate,
which is 13%. MidWest's cash flows for the next three years are projected in the time line to the right. Thereafter, the cash
flows are projected to grow at a rate of 3% per year in perpetuity.
Big Red's CEO will ask his whole team to evaluate whether or not they should acquire MidWest at the asking price. In
addition, he decides to ask his college roommate (who is now a professor of finance) for an opinion. The professor's first
question is, What's the NPV? The CEO admits he has no idea.

Copyright © 2012 eCornell. All rights reserved. All other copyrights, trademarks, trade names, and logos are the sole property of their respective owners. 19
1.
2.
3.
Read: Get to Know NPV
Key Points
The NPV is found by calculating the present value
of its cash flows, discounting that amount by the
hurdle rate, and subtracting the initial investment to
get the final result.
If the final result is positive, the NPV rule says the
project can go forward.
If the result is negative, the project should not go
forward.
Net present value (NPV) is one of two widely used finance rules in practice today. When a project is being considered for
development, decision makers can look to the NPV for some indication of the strength of the project plan (evaluated in
terms of the wealth that is going to be created by the project). The NPV is found by calculating the present value of its
cash flows, discounting that amount by the hurdle rate, and subtracting the initial investment to get the final result. If the
final result is positive, the NPV rule says the project can go forward. If the result is negative, the project should not go
forward.
To find the NPV for a project:
Forecast the future cash flows, taking into account the amount and timing of each.
Use the hurdle rate to discount the future cash flows.
Subtract the initial investment from the value of the discounted cash flows.
When the final value is found, the project decision can be made. The NPV rule recommends projects with a positive net.
Pros and Cons of the NPV
When using NPV for investment decisions, it's
important to note that the hurdle rate is only an
estimate. The uncertainty inherent in that rate
translates to an uncertainty in the NPV and therefore
in your decision.
Another drawback to using NPV is that the NPV
result is in dollars (or in some monetary unit).
Large-scale projects will have NPVs that are wildly
different from NPVs for small-scale projects. When
using NPV, the scale of the project must be taken into
Copyright © 2012 eCornell. All rights reserved. All other copyrights, trademarks, trade names, and logos are the sole property of their respective owners. 20
account. (You'll find that this is not the case with
IRR.)
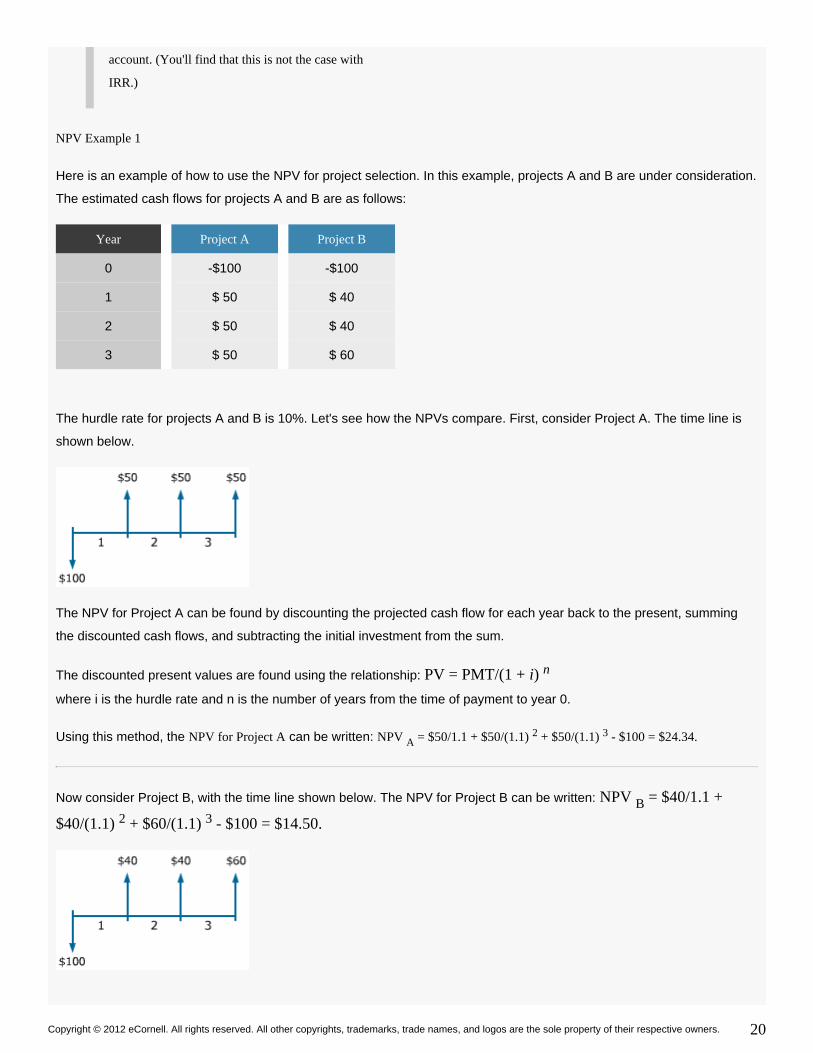
NPV Example 1
Here is an example of how to use the NPV for project selection. In this example, projects A and B are under consideration.
The estimated cash flows for projects A and B are as follows:
Year Project A Project B
0 -$100 -$100
1 $ 50 $ 40
2 $ 50 $ 40
3 $ 50 $ 60
The hurdle rate for projects A and B is 10%. Let's see how the NPVs compare. First, consider Project A. The time line is
shown below.
The NPV for Project A can be found by discounting the projected cash flow for each year back to the present, summing
the discounted cash flows, and subtracting the initial investment from the sum.
The discounted present values are found using the relationship: PV = PMT/(1 + ) i n
where is the hurdle rate and is the number of years from the time of payment to year 0.i n
Using this method, the can be written: NPV for Project A NPV = $50/1.1 + $50/(1.1) + $50/(1.1) - $100 = $24.34.A2 3
Now consider Project B, with the time line shown below. The NPV for Project B can be written: NPV = $40/1.1 +B
$40/(1.1) + $60/(1.1) - $100 = $14.50.2 3

Copyright © 2012 eCornell. All rights reserved. All other copyrights, trademarks, trade names, and logos are the sole property of their respective owners. 21
If projects A and B are independent, then these NPV results indicate that it is possible to go forward with both projects
because both projects will create value for the owners of the business. If, however, projects A and B are mutually
exclusive, Project A is the correct choice because A creates the greater value, according to the NPV.
Learn how to use your financial calculator to find the net present values for Project A and Project B in "CalculateNote:
NPV - Fixed Cash Flows."
NPV Example 2
Now consider what happens to the NPV if the hurdle rate increases. Once again, projects A and B are under
consideration. The estimated cash flows for projects A and B are (again) as follows:
Year Project A Project B
0 -$100 -$100
1 $ 50 $ 40
2 $ 50 $ 40
3 $ 50 $ 60
This time, the hurdle rate for projects A and B is 20%.
The NPVs for projects A and B are:
NPV = $50/1.2 + $50/(1.2) + $50/(1.2) - $100 = 5.33A2 3
NPV = $40/1.2 + $40/(1.2) + $60/(1.2) - $100 = -4.17.B2 3
This time, Project B does not look like a good choice. The NPV rule would not recommend that it be approved.
Notice that when the hurdle rate goes up, the NPV of the project goes down. This is because the rate appears in the
denominator of the present value equation. Investors who set hurdle rates high are more demanding-a higher rate means
more projects won't make it over the hurdle.

Copyright © 2012 eCornell. All rights reserved. All other copyrights, trademarks, trade names, and logos are the sole property of their respective owners. 22
Activity: Calculate NPV - Fixed Cash Flows
Let's say that you must decide whether to approve Project A or Project B. You want to use NPV to decide. How will you
find the NPV using your financial calculator? Under certain circumstances (that is, when the cash flows are fixed) the
problem can be approached as though it were a simple annuity, and the calculator can be used to find the present value of
that annuity. Once the present value is found, the initial investment can be subtracted easily to get the net present value.
Calculate NPV - Fixed Cash Flows for Project A
Project A requires an initial investment of $100. The projected cash flows for years 1, 2, and 3 are fixed: $50 per year. The hurdle rate for
this project is 10%. What is the NPV for Project A? The time line to the right shows that all the cash flows for Project A are of the same
value (they are fixed). Follow the steps below to calculate the NPV for this project using the above method.
Find the present value of Project A
HP 12C TI BA II Plus
The present value calculated for Project A is equal to an investment of $124.34. Your calculator presents this as a Result:
negative number because we have treated the problem as an annuity calculation. To continue now with a net present
value calculation, remember that the present value "investment" is really a present value of positive cash flows, so it is
positive: $124.34. Subtracting the initial investment of $100.00 yields $24.34, a positive number. The NPV rule
recommends that the project be accepted.
There is a more intuitive way to think about how to handle the calculated present value in this context. For instance, you
can think about $124.34 as the investment amount required to generate the specified cash flows in an account that earns
10% interest annually (the hurdle rate). Then, in the final step of the analysis, you compare this interest-earning option to
the option of accepting Project A. If you compare the investment required for the interest-earning account to the initial
investment required for Project A, you find that Project A requires a smaller investment for the same cash flows. It's a
better value.
Either way you think about it, the NPV rule recommends that Project A be approved.
Calculate NPV - Fixed Cash Flows for Project B

Copyright © 2012 eCornell. All rights reserved. All other copyrights, trademarks, trade names, and logos are the sole property of their respective owners. 23
Now try the calculation for Project B, assuming the same hurdle rate. See the time line for the project to the right. For
Project A, the cash flows were fixed, so we solved the NPV problem as though it were an annuity problem. But the cash
flows for Project B are not fixed. Now what?
For Project B, it is possible to employ a "trick" to make the cash flows fixed. Note that the cash flows for years 1 and 2 are
already the same: $40. The cash flow of $60 for year 3 can be rewritten as a cash flow of $40 plus a final (future) value of
$20. (The future value for Project A was 0):
This approach allows us to treat this as an annuity problem, in which an initial investment is made at a particular interest
rate, cash flows are paid out, and an additional amount (the future value) is available in the final year. Follow the steps
below to calculate the present value calculation for Project B.
Find the present value of Project B
HP 12C TI BA II Plus
The present value is $114.50. The initial investment required for Project B is $100, so the net present value is Result:
$14.50. The net present value is positive (or, alternatively, the investment for an interest-earning account is greater than
the investment required for Project B). The NPV rule recommends that Project B be approved.
Note that if the $60 cash flow had appeared in year 1 or year 2, it would not have been possible to employ the trick of
assigning $20 to the future value. This is possible only in year 3.
What about this NPV button on my calculator?
You may have noticed that there is an NPV button on your calculator. That button can be used to solve problems like the
ones presented here, but we prefer the method presented above. If you're curious about the NPV button and how it is

Copyright © 2012 eCornell. All rights reserved. All other copyrights, trademarks, trade names, and logos are the sole property of their respective owners. 24
used, click to download the reference sheets listed below.
Download NPV Reference for HP calculator
Download NPV Reference for TI calculator
If your calculator produces a different answer, you may have to change your "payments per year" settings.Note to TI users:
See the guide for help with this.TI BA II PLUS Calculator Basics
Calculator photos: Courtesy of Hewlett-Packard Development Company, L.P., and Texas Instruments Incorporated.

Copyright © 2012 eCornell. All rights reserved. All other copyrights, trademarks, trade names, and logos are the sole property of their respective owners. 25
Watch: Terminal Infinite Cash Flows

Copyright © 2012 eCornell. All rights reserved. All other copyrights, trademarks, trade names, and logos are the sole property of their respective owners. 26
1.
2.
Activity: Net Present Value
Download the Tool
.Capital Budgeting Rules Overview Chart template
You will complete this Capital Budgeting Rules Overview Chart project as you progress through the course materials. By
the time you reach the end of the course, you will have developed an overview chart of the Capital Budgeting Rules that
you can print for future reference.You will not be required to submit this chart for grading, but can use it for your own
professional development.
Now that you have learned about , you can complete the row in your chart.Net Present Value NPV
To complete this activity:
Download and open the Capital Budgeting Rules Overview Chart
Add the following information to the NPV row:
Describe how to calculate NPV in your own words (do not just copy/paste from theHow to Calculate/Create:
course)
In one sentence, describe a scenario where you would use NPV to assess a capital project inWhen to use:
your own words (do not just copy/paste from the course)

Copyright © 2012 eCornell. All rights reserved. All other copyrights, trademarks, trade names, and logos are the sole property of their respective owners. 27
Module Wrap-up: Net Present Value
In this module, you defined net present value (NPV) as the sum of the present values of incoming and outgoing cash flows
over a period of time. You identified the importance of adding to the incremental value of the organization by calculating
NPV and determining whether it's positive or negative, and how that affects capital investment decisions. You also
examined the importance of the contributions that non-financial managers make in terms of the expertise and insight they
offer when capital investment decisions are being discussed.

Copyright © 2012 eCornell. All rights reserved. All other copyrights, trademarks, trade names, and logos are the sole property of their respective owners. 28
Module Introduction: Internal Rate of Return

Copyright © 2012 eCornell. All rights reserved. All other copyrights, trademarks, trade names, and logos are the sole property of their respective owners. 29
Read: Get to Know the Internal Rate of Return (IRR)
Key Points
To find the IRR for a project:
1. Forecast the amount and timing of the cash
flows.
2. Using the formula for net present value, set the
net present value to 0 and solve for the discount
rate (the sole unknown).
The internal rate of return (IRR) is a way to evaluate the cost of a project. IRR is the discount rate at which the NPV will be
0; that is, the rate that equates the present value of a project's cash outflows to the present value of its cash inflows. If the
IRR is greater than the hurdle rate, the investors will earn more than they require. Thus, when the IRR is greater than the
hurdle rate, accept the project.
Case Study Big Red
The acquisition of MidWest
Transportation, where MidWest's
asking price is $535 million
A five-year contract with Standard
Refining to distribute refined oil
products, where the cost of trucking
equipment and terminal upgrades
that are required to service the
Standard contract is $140 million
(in $ Millions)Cash Flows (in $ Millions)Cash Flows
Big Red Trucking is considering two separate deals as shown. Big Red's CEO is not sure which option to pursue, so he

Copyright © 2012 eCornell. All rights reserved. All other copyrights, trademarks, trade names, and logos are the sole property of their respective owners. 30
1.
2.
asks his director of finance. She advises that they examine the internal rate of return. The appropriate hurdle rate to apply
to the cash flows for both potential projects is 13 percent. Can you find the IRR for these projects?
Calculate IRR
To find the IRR for a project:
Forecast the amount and timing of the cash flows.
Using the formula for net present value, set the net present value to 0 and solve for the discount rate (the sole
unknown). This is usually done using a financial calculator or spreadsheet program.
Compare the calculated IRR to the hurdle rate. If the IRR is greater than the hurdle rate, the IRR rule recommends that
you go ahead with the project.
IRR Example: Project A
Let's see how IRR can be used for project selection. Consider Project A. This project is also evaluated in the previous
pages on NPV. Will you get the same result with IRR? The estimated cash flows and timeline for Project A are shown
here. The hurdle rate has been estimated to be 10 percent.
The IRR can be found by setting the expression for the NPV to 0.
NPV = 50/(1 + IRR) + 50/(1 + IRR) + 50/(1 + IRR) - 100 = 02 3
It's true, this expression would be difficult to solve with a pencil and paper, but it is possible to solve for IRRNow what?
numerically using the HP or TI calculator or using a spreadsheet program. Refer to "Calculate IRR - Fixed Cash Flows" to
see how this might be done. Whatever method you use to solve it, you'll find that Because 23.38 is greaterIRR = 23.38.
than 10 (the estimated hurdle rate), the IRR rule recommends that this project be accepted.
Year Project A
0 -$100
1 $ 50
2 $ 50
3 $ 50
IRR Example: Projects X and Z

Copyright © 2012 eCornell. All rights reserved. All other copyrights, trademarks, trade names, and logos are the sole property of their respective owners. 31
Project X Project Z
NPV at 10% $1 million $1 million
IRR 10.5% 17.3%
You have estimated the hurdle rate to be 10 percent for the following two mutually exclusive projects as shown here.
Suppose that you have some uncertainty about your estimate of the hurdle rate. As a corporate manager, are you more
comfortable taking on project X or Z? Most managers would be more comfortable taking Project Z. Remember that hurdle
rates are an estimate. If you don't have faith in that estimate, and if the NPVs do not differentiate one project from another,
rely on the IRR rule.
Pros and Cons of IRR
What's appealing to managers about the IRR is that it calculates the return on all monies invested in the project, giving a
more complete financial view than is afforded by the NPV. Another nice benefit of working with the IRR is that it is
independent of the hurdle rate. So if the hurdle rate increases, that increase has no effect on the IRR for the project.
IRR has drawbacks, however. Because the IRR represents the rate of return on the investment over its life span, it
contains an assumption that money is reinvested at the internal rate of return. This might not be the best assumption.
NPV, on the other hand, assumes that money is reinvested at the discount rate identified at the outset. (Note that
reinvesting at other rates is covered in a later course from eCornell on risk, return, and the cost of capital.)
Pitfalls inherent in using the IRR rule in capital budgeting decisions include:
• The IRR rule does not differentiate between whether you are getting the rate or paying the rate.
• The IRR approach does not handle mutually exclusive projects.
• The IRR calculation may result in multiple answers or no answers at all, whereas NPV always results in just one.
In the following pages, find out what these statements mean and how they come into play.

Copyright © 2012 eCornell. All rights reserved. All other copyrights, trademarks, trade names, and logos are the sole property of their respective owners. 32
Watch: The Art of IRR for Non-financial Managers
Non-financial managers can support sound financial decisions within their organization by adding their specialized
expertise and industry or product knowledge into an informed discussion of IRR, as Professors Carvell and Gibson
explain.

Copyright © 2012 eCornell. All rights reserved. All other copyrights, trademarks, trade names, and logos are the sole property of their respective owners. 33
Activity: Calculate IRR - Fixed Cash Flows
You must decide whether to approve Project A or Project B. You want to use IRR to decide. How will you find the IRR
using your financial calculator? Under certain circumstances-that is, when the cash flows are fixed-the problem can be
approached as though it were a simple annuity (many annuity problems are solved in the first course, Mastering the Time
Value of Money), and the calculator can be used to find the rate associated with that annuity.
Can this method can be used to find the net present value for Project A? The time line shown here indicates that the cash
flows for Project A are fixed. This demonstration shows how a financial calculator can be used to find the internal rate of
return for Project A.
Find the internal rate of return for Project A
HP 12C TI BA II Plus
Recall that the hurdle rate for Project A is 10%. The IRR is 23.38%. So, the IRR for Project A is greater than the Result:
hurdle rate and the IRR rule recommends that Project A be approved.
Now try the calculation for Project B assuming the same hurdle rate. The time line for this project is shown here. For
Project A, the cash flows were fixed, so we solved the IRR problem as though it were an annuity problem. But the cash
flows for Project B are not fixed. Now what?

Copyright © 2012 eCornell. All rights reserved. All other copyrights, trademarks, trade names, and logos are the sole property of their respective owners. 34
For Project B, it is possible to employ a "trick" to make the cash flows fixed. Note that the cash flows for years 1 and 2 are
already the same: $40. The cash flow of $60 for year 3 can be rewritten as a cash flow of $40 plus a final (future) value of
$20. (The future value for Project A was 0.) See the time line to the right. This approach allows us to treat this as an
annuity problem in which an initial investment is made at a particular interest rate, cash flows are paid out, and an
additional amount (the future value) is available in the final year.
Find the internal rate of return for Project B
HP 12C TI BA II Plus
Remember that the hurdle rate for Project B is 10%. The internal rate of return is 17.50%. The IRR for Project B is greater,
so the IRR rule recommends that Project B be approved. Note that if the $60 cash flow had appeared in year 1 or year 2,
it would not have been possible to employ the trick of assigning $20 to the future value. This is possible only in year 3.
What about this IRR button on my calculator?
You may have noticed that there is an IRR button on your calculator. That button can be used to solve problems like the
ones presented here, though we prefer the method presented above. If you're curious about the IRR button and how it is
used, click to download the reference sheets listed below.
Download IRR Reference for HP calculator
Download IRR Reference for TI calculator
If your calculator produces a different answer, you may have to change your "payments per year" settings.Note to TI users:
See the guide for help with this.TI BA II Plus Calculator Basics
Calculator photos: Courtesy of Hewlett-Packard Development Company, L.P., and Texas Instruments Incorporated.

Copyright © 2012 eCornell. All rights reserved. All other copyrights, trademarks, trade names, and logos are the sole property of their respective owners. 35
Read: Best Guess IRR
Key Points
Your financial calculator or spreadsheet program
finds the IRR solution using an iterative process. It
takes guesses at the IRR until it finds the right one.
Finding the IRR can be a very difficult undertaking. For instance, how do you find the IRR when a terminal value is
involved?
Let's use the Big Red Trucking scenario as context for an investigation into how this is done.
Case Study Big Red Trucking
(in $ Millions)Cash Flows
Recall that Big Red has identified a privately held acquisition target, MidWest Transportation. MidWest's asking price of
$535 million appears to be nonnegotiable. Given that MidWest's business is a virtual carbon copy of Big Red's business,
Big Red plans to value MidWest's cash flows using its own hurdle, which is 13%. MidWest's cash flows for the next three
years are projected as shown.
Thereafter, the cash flows are projected to grow at a rate of 3% per year in perpetuity. What is the IRR for the potential
acquisition of MidWest Transportation?
Set the net present value to 0 and solve for the rate. In
this instance, the result is the following mathematical
expression where TV is the year-2 terminal value that2
captures the value of the year-3 cash flow and all
subsequent cash flows:
$535 = [ $60 / (1+IRR) ] + [ ( $70 + TV ) / (1+IRR) ]22
Recall that the terminal value can be found using the
present value of a growing perpetuity formula. So we
can write the year-2 terminal value this way, where $75
million is the year-3 cash flow, 0.03 (or 3%) is the
growth rate, and the IRR is the unknown discount rate
for which we are solving:
TV = $75 / IRR-0.032

Copyright © 2012 eCornell. All rights reserved. All other copyrights, trademarks, trade names, and logos are the sole property of their respective owners. 36
Put the expression for the terminal value into the IRR
equation and get:
$535 = [ $60 / (1+IRR) ] + [ $70 + ( $75 / IRR-0.03) ] /
(1+IRR) ]2
We have one equation and the IRR as the unknown, so we know that there must be a solution. But how do we find it?
Your financial calculator or spreadsheet program finds the solution using an iterative process. It takes guesses at the IRR
until it finds the right one. To see how this iterative process works, suppose that we start with an IRR guess of The 15%.
present value of MidWest's future cash flows using a 15% discount rate is:
= [ $60 / (1+ ) ] + [ $70+ ( $75 / -0.03) / (1+ ) ]$577.69 0.15 0.15 0.15 2
Since $577.69 million is more than $535 million, the IRR must be higher than 15%. (Recall that the present value
decreases as the discount rate increases.) Let's try a guess of The present value of MidWest's future cash flows 16%.
using a 16% discount rate is $532.49 million.
= [ $60 / (1+ ) ] + [ $70 + ( $75 / -0.03) / (1+ ) ]$532.49 0.16 0.16 0.16 2
The $532.49 present value using a 16% discount rate is slightly below the $535 acquisition price. So we know that the IRR
is slightly less than 16%.
Now imagine a series of guesses, leading to a final solution. In this case, the guesses lead to a solution of 15.94%. This is
the discount rate that results in a present value of $535 million. In practice, complicated problems such as this one can be
solved using an advanced function in Excel. And how will Excel solve for IRR?
Take a guess!

Copyright © 2012 eCornell. All rights reserved. All other copyrights, trademarks, trade names, and logos are the sole property of their respective owners. 37
Watch: Borrowing/Lending IRR Pitfall
One pitfall of using the IRR rule in capital budgeting decisions is that IRR does not distinguish between borrowing and
lending rates. In order to understand what is meant by this, consider Project C and Project D.
Year Project C Project D
0 -$10,000 $10,000
1 $12,000 -$12,000
The table to the right shows the estimated cash flows for projects C and D as discussed by Professor Gibson above. The
hurdle rate for these projects is 15%. What are the IRRs for projects C and D? These rates can be calculated by setting
the NPV to 0 and discounting the cash flows:
-10,000 + 12,000/(1 + IRR ) = 0C
10,000 - 12,000/(1 + IRR ) = 0D
IRR = IRR = 0.20 or 20%C D
Both IRRs are greater than the hurdle rate. According to the IRR rule, you should undertake both Project C and Project D.
What are the NPVs for Project C and Project D? These values can be found by discounting the cash flows and subtracting
the initial investment.
NPV = -10,000 + 12,000/1.15 = $434.78C
NPV = 10,000 - 12,000/1.15 = -$434.78D
Aha! According to the NPV rule, Project D should be undertaken. What's going on? not
This is an illustration of one of the pitfalls of using IRR. The IRR calculation does not differentiate between a rate being
earned and a rate being paid. This critical distinction is revealed, however, by the NPV.

Copyright © 2012 eCornell. All rights reserved. All other copyrights, trademarks, trade names, and logos are the sole property of their respective owners. 38
Watch: Mutually Exclusive Projects Pitfall-Size of Investment
Differences in scale and timing can cause problems with the IRR. Before you use IRR in a capital budgeting decision,
consider the possible pitfalls of the particular approach.
Let's look at an evaluation of two projects (left) with different initial investments. If the projects are mutually exclusive,
which project should be accepted according to the IRR rule? Project E looks like the best choice-but is it? Take a look at
the NPVs for these projects. According to the NPVs, Project F is the best choice. Why aren't the methods in agreement?
To understand why the NPV and IRR answers disagree, consider the following question: Would you rather give away $1
today and be repaid $2 tomorrow, or give away $100 today and be repaid $150 tomorrow? Using your common sense,
which is the better deal? Why?
Without thinking about NPVs or IRRs, you would probably choose to make $50 on the transaction, not $1. But the IRR rule
would recommend that you take the $1 deal because it's a 100% return; the $50 option provides just a 50% return. An
NPV analysis, on the other hand, would reflect the greater value of the $50 option. Using the NPV rule, you would choose
to make $50.

Copyright © 2012 eCornell. All rights reserved. All other copyrights, trademarks, trade names, and logos are the sole property of their respective owners. 39
Because NPV is sensitive to the scale of the investments in projects E and F, it shows that Project F will do better. The
IRR's lack of sensitivity to scale is one of its pitfalls.
Copyright © 2012 eCornell. All rights reserved. All other copyrights, trademarks, trade names, and logos are the sole property of their respective owners. 40
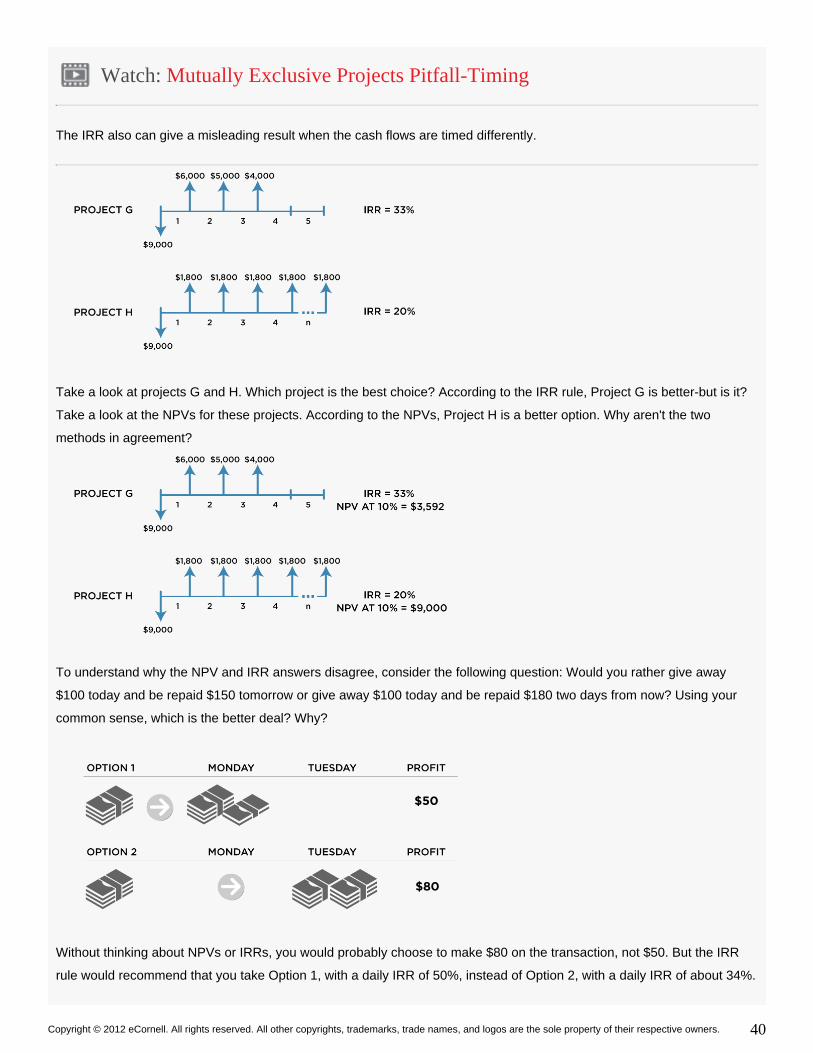
Watch: Mutually Exclusive Projects Pitfall-Timing
The IRR also can give a misleading result when the cash flows are timed differently.
Take a look at projects G and H. Which project is the best choice? According to the IRR rule, Project G is better-but is it?
Take a look at the NPVs for these projects. According to the NPVs, Project H is a better option. Why aren't the two
methods in agreement?
To understand why the NPV and IRR answers disagree, consider the following question: Would you rather give away
$100 today and be repaid $150 tomorrow or give away $100 today and be repaid $180 two days from now? Using your
common sense, which is the better deal? Why?
Without thinking about NPVs or IRRs, you would probably choose to make $80 on the transaction, not $50. But the IRR
rule would recommend that you take Option 1, with a daily IRR of 50%, instead of Option 2, with a daily IRR of about 34%.

Copyright © 2012 eCornell. All rights reserved. All other copyrights, trademarks, trade names, and logos are the sole property of their respective owners. 41
The IRR rule does not account for the fact that you would earn 34% for twice as long, making Option 2 the better choice.
An NPV analysis, on the other hand, would account for the different timing and recommend the $80 option. Because NPV
handles the different timing for projects G and H, it shows that Project H will do better. The IRR does not, and that is one
of its pitfalls. You have seen how differences in scale and timing can cause problems with the IRR. Before you use IRR in
a capital budgeting division, consider the possible pitfalls of the particular approach.

Copyright © 2012 eCornell. All rights reserved. All other copyrights, trademarks, trade names, and logos are the sole property of their respective owners. 42
Watch: Multiple IRR Pitfall
Problems can arise in using IRR when there is a sign change in the project cash flows. Multiple IRRs result when there is
a sign change from the minus to plus to minus, or from plus to minus to plus.
Look at the example to the left. Note the sign change in the cash flows.
To find the IRR, set the NPV to 0. YIKES! This looks rather imposing! If you recall back to your high school algebra
lessons, this is a quadratic equation. When you solve it by hand, this particular equation yields two results. Whenever
there is more than one possible solution, there is no way of knowing which solution is the IRR. To make matters worse,
calculators and computer programs don't "know" that there are two; they stop searching when they find one solution.
When we encounter multiple IRRs, we need to look to another approach. The NPV for this project is -$1,934, so the
project should not be accepted.
Before you use IRR in capital budgeting decisions, be aware of possible pitfalls. The IRR calculation may result in multiple
answers. NPV, on the other hand, always results in just one. For this reason, it's a good idea to consider both methods.

Copyright © 2012 eCornell. All rights reserved. All other copyrights, trademarks, trade names, and logos are the sole property of their respective owners. 43
1.
2.
Activity: Internal Rate of Return
Now that you have learned about the , you can complete the row in your chart.Internal Rate of Return IRR
To complete this activity:
Open the Capital Budgeting Rules Overview Chart template you downloaded
Add the following information to the IRR row:
Describe how to calculate IRR in your own words (do not just copy/paste from theHow to Calculate/Create:
course)
In one sentence, describe a scenario where you would use IRR to assess a capital project inWhen to use:
your own words (do not just copy/paste from the course)
You will complete this course project as you progress through the course materials. By the time you reach the
end of the course, you will have developed an overview chart of the Capital Budgeting Rules that you can print for
future reference. You will not be required to submit this chart for grading, but can use it for your own professional
development.

Copyright © 2012 eCornell. All rights reserved. All other copyrights, trademarks, trade names, and logos are the sole property of their respective owners. 44
Module Wrap-up: Internal Rate of Return
In this module, you defined the internal rate of return (IRR). You examined its importance relative to being able to figure
out a project's viability. You examined some of its challenges, or limitations, and identified two of its key benefits for
non-financial managers: it doesn't rely on a hurdle rate the way NPV does, and it's stated in terms of percentages, which
can be intuitively understood by many people whose expertise lies outside of finance.

Copyright © 2012 eCornell. All rights reserved. All other copyrights, trademarks, trade names, and logos are the sole property of their respective owners. 45
Module Introduction: Payback Period

Copyright © 2012 eCornell. All rights reserved. All other copyrights, trademarks, trade names, and logos are the sole property of their respective owners. 46
Read: Get to Know PBP
Key Points
To find the PBP for a project:
1. Forecast the amount and timing of the cash flows
2. Determine the acceptable maximum payback
period
3. Sum the consecutive cash flows to find the year
when the project is paid back
The payback period (PBP) is the expected number of years required to recover a project's initial investment. PBP is an
appropriate rule to use when there is a concern for fast capital turnover.
Case Study Big Red Trucking
Members of the management team at Big Red Trucking face a new challenge. Can you help them? Recall that Big Red
Trucking is considering two separate deals: the acquisition of MidWest Transportation and a five-year contract with
Standard Refining to distribute refined oil products.
The project future cash flows are shown here.
(in $ Millions)Cash Flows (in $ Millions)Cash Flows
The CEO still has not decided which option to pursue. But a business analyst who sat next to the CEO on a flight to
Orlando last week insisted that a payback calculation would give the definitive answer. Now the CEO is unsure. Should he
try this new approach? Will the payback calculation yield a result different from what was found with NPV and IRR?

Copyright © 2012 eCornell. All rights reserved. All other copyrights, trademarks, trade names, and logos are the sole property of their respective owners. 47
Calculate PBP
To find the PBP for a project:
1. Forecast the amount and timing of the cash flows.
2. Determine the maximum payback period acceptable to you.
3. Sum the consecutive cash flows to find the year at which the project is paid back.
Using this method, accept the project if the payback period is less than or equal to the maximum payback period
acceptable to you.
Payback Period Example 1
Q R S T
CF0 -$5,000 -$5,000 -$5,000 -$5,000
CF1 0 $2,500 $2,500 $2,000
CF2 $5,000 $2,500 $2,500 $2,000
CF3 0 0 $2,500 $2,000
PBP 2 2 2 2.5
NPV at
10%-$868 -$661 $1,217 -$2.6
Projects Q, R, S, and T are being considered for development. The cash flows for these projects are shown for years 0
through 3.
Each project begins with an investment of $5,000. Subsequent cash flows vary, with projects Q and R having lives of 2
years and projects S and T having lives of 3 years. It is easy to see at what year the initial investment has been paid back
for projects Q, R, and S: these projects have positive cash flows totaling exactly $5,000 by year 2. Project T, on the other
hand, has positive cash flows totaling $4,000 by year 2 and has $6,000 by the end of year 3. The fraction of year 3
needed to reach payback is estimated by
Portion of year 3 = cash required / total cash flow
$1,000/$2,000 = 0.5.
Fifty percent of year 3 plus year 1 and year 2 is the total time for payback: 2.5 years.
If the maximum payback period was determined to be one year, none of these projects would be acceptable. If, on the
other hand, the payback period could be as long as three years, all the projects would be acceptable.
Payback Period Example 2

Copyright © 2012 eCornell. All rights reserved. All other copyrights, trademarks, trade names, and logos are the sole property of their respective owners. 48
Yearly
cash flow
($M)
Cumulative
cash flow
($M)
Year 0 -535.0 -535.0
Year 1 60.0 -475.0
Year 2 70.0 -405.0
Year 3 75.0 -330.0
Year 4 77.3 -252.7
Year 5 79.6 -173.2
Year 6 82.0 -91.2
Year 7 84.4 -6.8
Year 8 86.9 80.1
Let's go back once again to the Big Red Trucking example. Recall that Big Red is considering an expansion of its
geographic coverage into Midwestern U.S. markets and has identified MidWest Transportation as a potential acquisition
target. The projected future cash flows associated with the potential MidWest acquisition are as follows:
To find the payback period, we calculate how long it takes-without taking into consideration the time value of money-to
make back the initial $535 million acquisition price. At the end of year 1, we'll make back $60 million, so we'll be $475
million short of our initial investment. In year 2, we'll make back another $70 million, leaving us $405 million short. We can
continue summing the cash flows in the same way, arriving at cumulative cash flows as shown in this table:
We see payback is achieved sometime between year 7 and year 8. To find the precise payback period, we take the $6.8
million that still needs to be paid back at the end of year 7 and divide by the year 8 cash flow of $86.9 million:
Payback Period = 7 + 6.8/86.9 = 7.1 years.
The time required to pay back the initial investment is 7.1 years.
Pros and Cons of Payback Period
One weakness of the payback period approach is that it does not take into account the time value of money. In addition,
the calculation does not take into account any cash flows that occur after payback is achieved.

Copyright © 2012 eCornell. All rights reserved. All other copyrights, trademarks, trade names, and logos are the sole property of their respective owners. 49
Watch: Using PBP
Textbooks are often critical of payback period, as our faculty point out, but in practice it may be a useful tool. Notice
Professor Gibson's comments regarding payback period as being particularly helpful for startup companies. Why do you
think the payback period tool's usefulness may be minimized in some standard classroom texts?

Copyright © 2012 eCornell. All rights reserved. All other copyrights, trademarks, trade names, and logos are the sole property of their respective owners. 50
1.
2.
3.
4.
Read: Get to Know DPBP
Key Points
To find the DPBP for a project:
1. Forecast the amount and timing of the project cash flows
2. Determine the acceptable maximum payback period
3. Calculate the discounted value (or present value) of each of the project's future cash flows using the hurdle rate
4. Sum the consecutive discounted cash flows to find the year when the project is paid back
The discounted payback period (DPBP) is the expected number of years required to equate a project's discounted future
cash flows to its initial investment. Discounted payback period differs from payback period (PBP) in that DPBP takes into
account the time value of money.
Case Study Big Red Trucking
Time to check in with Big Red Trucking. Big Red's CEO just received an email from the business analyst who sat next to
him on the flight to Orlando last week. He realized he meant to say "discounted payback period." If the CEO called on you
to discount the payback period, would you know how?
Calculate the DPBP
To find the DPBP for a project:
Forecast the amount and timing of the project cash flows.
Determine the maximum payback period acceptable to you.
Calculate the discounted value (or present value) of each of the project's future cash flows using the hurdle rate.
Sum the consecutive discounted cash flows to find the year at which the project is paid back.
A project is accepted if the discounted payback period is less than or equal to the maximum payback period acceptable to
you.
Discounted Payback Period Example 1
Q R S T
CF0 -$5,000 -$5,000 -$5,000 -$5,000
CF1 0 $2,500 $2,500 $2,000
CF2 $5,000 $2,500 $2,500 $2,000
CF3 0 0 $2,500 $2,000
PBP 2 2 2 2.5
NPV at 10% -$868 -$661 $1,217 -$3

Copyright © 2012 eCornell. All rights reserved. All other copyrights, trademarks, trade names, and logos are the sole property of their respective owners. 51
Consider again projects Q through T, evaluated previously using payback period. This time, we'll find the discounted cash
flows using the 10% hurdle rate and recalculate the payback period using the discounted cash flows. To find the
discounted cash flows:
DCF = CF / (1+ ) n n i n
where n = number of years and i = 10% (the hurdle rate). Using this method, the discounted cash flows are easily
calculated. For instance, the discounted cash flows for Project Q are:
DCF (Q) = 01
DCF (Q) = $5,000/ (1+0.10) = $4,13222
DCF (Q) = 03
Since the sum of these cash flows is negative, we know the project is not paid back in three years. In fact, if we take into
account the time value of money, we see that we never make back the initial $5,000 investment.
Q R S T
CF0 -$5,000 -$5,000 -$5,000 -$5,000
DCF1 0 $2,273 $2,273 $1,818
DCF2 $4,132 $2,066 $2,066 $1,653
DCF3 0 0 $1,878 $1,503
DPBP -- -- 2.4 --
NPV at 10% -$868 -$661 $1,217 -$3
The discounted cash flows and the discounted payback periods for the projects that are paid back are shown to the left.
Only Project S is paid back in under three years using this method. Notice that $4,339 is recovered in the first two years,
with the remaining $661 recovered in the third year. Again, to find the portion of year 3 needed to reach payback, the
amount needed is divided by the total cash flow: 661/1,878 = 0.4 years. The total time until payback is 2.4 years.
Projects Q, R, and T never pay back when we account for the time value of money.
Using the discounted cash flows, the payback periods are longer for these projects! Now a maximum length of three years
for the payback period is sufficient for project S only; Q, R, and T would not be accepted. The advantage of discounted
payback period over payback period is that, with discounted payback period, we will never accept a negative NPV
project-it would never pay back.
Discounted Payback Period Example 2
Yearly
CF
($M)
DCF
($M)
Cumulative
DCF
($M)
Year 0 -535.0 -535.0 -535.0

Copyright © 2012 eCornell. All rights reserved. All other copyrights, trademarks, trade names, and logos are the sole property of their respective owners. 52
Year 1 60.0 53.1 -481.9
Year 2 70.0 54.8 -427.1
Year 3 75.0 52.0 -375.1
Year 4 77.3 47.4 -327.7
Year 5 79.6 43.2 -284.5
Year 6 82.0 39.4 -245.1
Year 7 84.4 35.9 -209.2
Year 8 86.9 32.7 -176.5
Year 9 89.6 29.8 -146.7
Year 10 92.2 27.2 -119.6
Year 11 95.0 24.8 -94.8
Year 12 97.9 22.6 -72.2
Year 13 100.8 20.6 -51.6
Year 14 103.8 18.8 -32.9
Year 15 106.9 17.1 -15.8
Year 16 110.1 15.6 -0.2
Year 17 113.4 14.2 14.0
Let's return to the MidWest acquisition example. The yearly cash flows for that project are given in the second column of
the table shown here. These cash flows are now discounted at 13%, resulting in the discounted cash flows in column
three. Column four keeps a running total of the cash flows by year, making it easy to find the approximate payback point.
Note that discounted payback is achieved sometime between year 16 and year 17 (as opposed to the payback period
calculated earlier in this topic, which was found to be between year 7 and year 8). The fraction of year 17 that is required
for payback is equal to $0.2 million divided by $14.2 million. Therefore,
Discounted Payback Period = 16 + 0.2/14.2 = 16.0 years.
(The fraction of year 17 is negligible.) The discounted payback period is 16 years.
Pros and Cons of DPBP
The discounted payback period provides an advantage over the straight payback period in that it does take into account
the time value of money. However, neither payback method takes into consideration any cash flows occurring after the
payback.

Copyright © 2012 eCornell. All rights reserved. All other copyrights, trademarks, trade names, and logos are the sole property of their respective owners. 53
1.
2.
Activity: Payback Period
Now that you have learned about , you can complete the row in your chart.Payback Period PBP
To complete this activity:
Open the Capital Budgeting Rules Overview Chart template you downloaded
Add the following information to the PBP row:
Describe how to calculate PBP in your own words (do not just copy/paste from theHow to Calculate/Create:
course)
In one sentence, describe a scenario where you would use PBP to assess a capital project inWhen to use:
your own words (do not just copy/paste from the course)
You will complete this course project as you progress through the course materials. By the time you reach the
end of the course, you will have developed an overview chart of the Capital Budgeting Rules that you can print for
future reference.You will not be required to submit this chart for grading, but can use it for your own professional
development.

Copyright © 2012 eCornell. All rights reserved. All other copyrights, trademarks, trade names, and logos are the sole property of their respective owners. 54
Module Wrap-up: Payback Period
In this module, you heard from Professor Carvell that it's not enough for a company to get paid back; a company has to
add value in order to be successful. You examined payback period (PBP), which our faculty described as one of the
simplest and most direct things to calculate, but as such a simple and intuitive tool, it has clear limitations. You also
defined discounted payback period, which uses discounted cash flow.

Copyright © 2012 eCornell. All rights reserved. All other copyrights, trademarks, trade names, and logos are the sole property of their respective owners. 55
Module Introduction: Profitability Index and Equivalent Annual Cost

Copyright © 2012 eCornell. All rights reserved. All other copyrights, trademarks, trade names, and logos are the sole property of their respective owners. 56
1.
2.
3.
Read: Get to Know Probability Index (PI)
Key Points
To find the profitability index for a project:
1. Forecast the amount and timing of the cash flows
2. Using the estimated hurdle rate, find the net
present value of the future cash flows
3. Divide the net present value of the future cash
flows by the initial investment
The profitability index (PI) is the net present value of future cash flows divided by the initial investment. The profitability
index approach presents what is known as a constrained optimization problem, where the constraint is cash (it could be
any limited resource). Modifications of the profitability index can be useful when any resource is limited. For example, the
resource could be floor space in a manufacturing plant, gates at an airport, or the hours available from an employee who
performs a specialized task.
Case Study Big Red Trucking
There's a new development at Big Red Trucking. Big Red is still considering two separate deals: the acquisition of
MidWest Transportation and five-year contract with Standard Refining to distribute refined oil products. The CEO had a
dentist appointment yesterday. While sitting in the waiting room, he read an article about a successful CEO who made a
particularly fortunate business decision last year using the "profitability index." Today Big Red's CEO tells the director of
the finance this story and asks her to find the profitability index of their own competing projects. She decides that rather
than argue she'll just do it.
Can you find the profitability index for these competing projects?
Calculate the Profitability Index
To find the profitability index for a project:
Forecast the amount and timing of the cash flows.
Using the estimated hurdle rate, find the net present value of the future cash flows.
Divide the net present value of the future cash flows by the initial investment.
If the profitability index is greater than 0, accept the project. For multiple projects, rank the projects by their profitability
indexes and accept them in order until you've exhausted the funds available or have run out of projects with a PI greater
than 0.
Profitability Index Example 1

Copyright © 2012 eCornell. All rights reserved. All other copyrights, trademarks, trade names, and logos are the sole property of their respective owners. 57
Micron Inc. has $15 million to invest in projects L, M, N, O, and P. Here is the initial investment and the present value of
the project cash flows for each project:
L M N O P
Initial investment ($M) 4 7 4 3 4
PV of future cash flows
($M)5 12 6 4 7
Which projects should Micron invest in? Use the profitability index to make this decision.
First, calculate the net present value for each project. To find the net present value, subtract the initial investment from the
present value:
NPV of future cash flows
($M)1 5 2 1 3
Now find the profitability index, which is the net present value divided by the initial investment:
PI = NPV/Investment 0.25 0.71 0.50 0.33 0.75
According to the profitability indexes, which projects should Micron take? All of them! All the PIs are greater than 0, so all
projects are acceptable. If these projects are not mutually exclusive, they should be accepted in this order: P, M, N, O, L.

Copyright © 2012 eCornell. All rights reserved. All other copyrights, trademarks, trade names, and logos are the sole property of their respective owners. 58
1.
2.
Read: Get to Know Equivalent Annual Cost (EAC)
Key Points
To find the EAC for an asset:
1. Forecast the amount and timing of the cash flows
2. Use the estimated hurdle rate and life span to
calculate the present value of the asset's cash flows
3. Sum the present value of the cash flows and the
initial investment for a total present value
4. Calculate the annuity payment for the asset
based on its total present value and life span
Case Study Big Red Trucking
At Big Red, everyone on the management team is tired of thinking about whether or not to acquire MidWest
Transportation. They are actually relieved to be asked to consider a truck purchase. Is this another opportunity to use NPV
and IRR? No, this decision requires a whole new approach: equivalent annual cost (EAC).
In circumstances where two or more assets are being considered as options for one necessary purchase, the EAC
provides an annual annuity value for each asset, allowing those assets to be more easily compared. This is a different sort
of tool from NPV or IRR. Here's why:
The projects we've looked at so far have been investments such as new business ventures and new equipment. These
projects were expected to realize positive cash flows as a result of the initial investment. But it is possible to make an
investment with no expectation of positive cash flows in the future, for instance the replacement of necessary equipment in
a facility or the addition of new equipment that is required. In these circumstances, there will be no positive cash flows
associated with doing the project. An initial cash outflow is required, as is a stream of costs to operate the equipment or
provide required services over the life of the project. NPV and IRR analyses will not be effective in evaluating these
projects since, by their nature, the projects will yield negative values for the NPVs and no solutions for the IRR equations.
The appropriate method to use for these projects is EAC.
The EAC involves using many of the techniques we have already discussed in this course but applies them in a specific
way, toward a specific kind of solution. The uses of EAC include planning for continuous replacement, calculating how
often to replace machinery, and assessing additional costs/benefits associated with replacing one machine with another
machine (perhaps with a different life span).
Calculate the EAC
To find the EAC for an asset:
Forecast the amount and timing of the cash flows.

Copyright © 2012 eCornell. All rights reserved. All other copyrights, trademarks, trade names, and logos are the sole property of their respective owners. 59
2.
3.
4.
Use the estimated hurdle rate and life span to calculate the present value of the asset's cash flows.
Sum the present value of the cash flows and the initial investment for a total present value.
Calculate the annuity payment for the asset based on its total present value and life span.
EAC Example 1
A B
0 $15 $10
1 $ 4 $ 6
2 $ 4 $ 6
3 $ 4 $ 0
Acme Fabricators is considering two alternative machines for its manufacturing facility. The output from the two machines
is identical; however, Machine A will run for three years and Machine B will run for only two years. The purchase,
installation, and operating costs for each machine are shown here.
Comparison of the two machines is made difficult by the fact that they have different life spans. EAC will make the
comparison straightforward.
To find the EACs for the two machines, first find the present value of the sum of the initial investment required (purchase
price) and yearly expenses for the life of the machine. The present values for the two machines are at left.
A B
PV at 10% $24.95 $20.41
The EAC for Machine A is found by calculating the payment amount required for an annuity of $24.95 in three years.
$24.95 = EAC [1/0.1 - 1/0.1(1.1) ]3
EAC = $10.03
Likewise, the EAC for Machine B is found by calculating the payment amount required for an annuity of $20.41 in two
years:
$20.41 = EAC [1/0.1 - 1/0.1(1.1) ]2
EAC = $11.76
Now it's possible to see that Machine A is actually the better investment, with a lower equivalent annual cost (in spite of a
higher purchase price).

Copyright © 2012 eCornell. All rights reserved. All other copyrights, trademarks, trade names, and logos are the sole property of their respective owners. 60
Handy EAC Reference
The next time you need to calculate an EAC, will you remember how to do it? Though the individual steps of the process
may be easy, putting the whole thing together may require some guidance. Here are two printable worksheets you can
download and keep on hand.
Download EAC worksheet for HP calculator
Download EAC worksheet for TI calculator

Copyright © 2012 eCornell. All rights reserved. All other copyrights, trademarks, trade names, and logos are the sole property of their respective owners. 61
Watch: An EAC Decision

Copyright © 2012 eCornell. All rights reserved. All other copyrights, trademarks, trade names, and logos are the sole property of their respective owners. 62
1.
2.
Activity: PI and EAC
Now that you have learned about , you can complete those rows in your chart.PI and EAC
To complete this activity:
Open the Capital Budgeting Rules Overview Chart template you downloaded
Add the following information to the PI and EAC rows:
Describe how to calculate PI and EAC in your own words (do not just copy/pasteHow to Calculate/Create:
from the course)
In one sentence each, describe a scenario where you would use PI and EAC to assess aWhen to use:
capital project in your own words (do not just copy/paste from the course)
When you have completed this chart, you will have developed an overview of the Capital Budgeting Rules that you can
print for future reference. You will not be required to submit this chart for grading, but can use it for your own professional
development.

Copyright © 2012 eCornell. All rights reserved. All other copyrights, trademarks, trade names, and logos are the sole property of their respective owners. 63
Watch: Empire Building
In this video, Professor Gibson talks about the concept of "empire building," meaning that it's human nature to try to
expand the scope of our responsibility, authority, projects, and results. As a manager, you may be given a capital budget
to circumscribe the limitations of your new projects. You may have to figure out which projects and initiatives are the best
use of those company funds. As Professors Carvell and Gibson explain, the profitability index and equivalent annual cost
may be helpful tools for you to use.

Copyright © 2012 eCornell. All rights reserved. All other copyrights, trademarks, trade names, and logos are the sole property of their respective owners. 64
Watch: All the Tools

Copyright © 2012 eCornell. All rights reserved. All other copyrights, trademarks, trade names, and logos are the sole property of their respective owners. 65
Module Wrap-up: Profitability Index and Equivalent Annual Cost
In this module, you defined two key capital budgeting rules: profitability index and equivalent annual cost. You saw that
profitability index is a tool that can help you figure out how much value will be earned per dollar of invested cost. You also
explored the ways that you can use equivalent annual cost to determine the most cost effective way to accomplish a
needed job by comparing a variety of solutions.

Copyright © 2012 eCornell. All rights reserved. All other copyrights, trademarks, trade names, and logos are the sole property of their respective owners. 66
Read: Thank You and Farewell
Congratulations on completing . We hope that you now feel completely comfortableMaking Capital Investment Decisions
making the decisions about capital investment that will best position your firm for success. We hope that the material
covered has met your expectations and prepared you to perform more effectively. From all of us at Cornell University and
eCornell, thank you for participating in this course.
Sincerely,
Professor Steve Carvell Professor Scott Gibson

Copyright © 2012 eCornell. All rights reserved. All other copyrights, trademarks, trade names, and logos are the sole property of their respective owners. 67
Stay Connected

Copyright © 2012 eCornell. All rights reserved. All other copyrights, trademarks, trade names, and logos are the sole property of their respective owners. 68
Glossary
annuity
A series of equal payments made over a finite number of periods. The equal stream of cash flows can either
be paid out, as in the case of a mortgage payment, or received, as in the case of a retirement annuity.
capital budgeting rules
A capital budgeting decision rule must consider all of the project's cash flows, must consider the time value
of money, and must always lead to the correct decision when choosing among mutually exclusive projects.
Capital budgeting rules include accounting rules and finance rules.
cash flow
The cash amount paid out or received over a period of time.
discounted payback period (DPBP)
The expected number of years required to recover a project's initial investment, calculated by taking into
account the time value of money.
earnings per share (EPS)
The portion of a company's profit allocated to each outstanding share of common stock. The figure is
calculated after paying taxes and after paying preferred shareholders and bondholders.
equity
Ownership interest possessed by shareholders in a corporation-stock as opposed to bonds.
equivalent annual cost (EAC)
The equivalent annual cost allows a comparison of assets by calculating an annuity value for each asset. In
circumstances where two or more assets are being considered as options for one necessary purchase, the
EAC provides an annual annuity value for each asset, allowing those assets to be more easily compared.
financial calculator
A calculator that has financial functions such as the time value of money keys: [n], [i], [PV], [PMT], and [FV].
hurdle rate
The minimum required return that must be achieved by a project in order for that project to create value for
the company. The hurdle rate is aptly named in that it must be exceeded, or "hurdled" over.
internal rate of return (IRR)

Copyright © 2012 eCornell. All rights reserved. All other copyrights, trademarks, trade names, and logos are the sole property of their respective owners. 69
The breakeven rate of return on net present value dollars. It is a discount rate that sets the NPV to 0.
mutually exclusive
Two or more things are said to be mutually exclusive when they are related in a way that each excludes or
precludes the other.
net present value (NPV)
The present value of a project's cash flows, discounted at the hurdle rate, minus the initial cost of the
investment. NPV represents the addition to the value of the business that is created by taking on the new
project.
opportunity cost
The opportunity cost associated with the investment of funds in a particular project is calculated based on
the value that would be generated by the best alternative use of those funds.
payback period (PBP)
The expected number of years required to recover a project's initial investment.
perpetuity
A series of equal payments made at a fixed interval forever (in perpetuity).
perpetuity, growing
A series of payments that grow at a constant rate over a fixed interval in perpetuity. A growing perpetuity
differs from a simple perpetuity in that the payments grow at a constant rate rather than remaining the same.
profitability index (PI)
The net present value of a project's future cash flows divided by the initial project investment.
return on assets (ROA)
The net income over total assets, or the income return earned on the book value of assets in place.
return on equity (ROE)
This is similar to ROA but is based on the book value of the equity investment. Like ROA, this is an annual
rate of return.

Copyright © 2012 eCornell. All rights reserved. All other copyrights, trademarks, trade names, and logos are the sole property of their respective owners. 70