Th; t*g"t .lb",pl"ti"" .f th" p.oject is 2022. However, due - DFCCIL
Upload
khangminh22Category
view
1download
0

H
F
G
E
CA
B

GE
NE
RA
LU
TIL
ITIE
SR
EC
& P
AR
KS
DE
VE
LO
PM
EN
TC
OR
PO
RA
TE
FIN
AN
CE
ST
AT
IST
ICS
TR
AN
SIT
&
EM
ER
GE
NC
Y
INTRODUCTORY SECTION PAGEIntroduction i-iv
AwardforOutstandingAchievementinAnnualFinancialReporting v
MessagefromtheChair vi
BoardofDirectors viii-ix
BoardStrategicPriorities x-xi
OrganizationalChart xii
MessagefromtheChiefAdministrativeOfficer xiii
RDNDepartmentsandServices xiv
DepartmentalHighlights xv-li
MessagefromtheDirectorofFinance lii-liv
FINANCIAL STATEMENT SECTION Management’sResponsibility 1
Auditor’sReport 2
ConsolidatedStatementOfFinancialPosition 3
ConsolidatedStatementOfOperationsAndAccumulatedSurplus 4
ConsolidatedStatementOfChangeInNetFinancialAssets 5
ConsolidatedStatementOfCashFlows 6
NotesToConsolidatedFinancialStatements 7-24
Table of Contents
R E G I O N A L D I S T R I C T O F N A N A I M O 2 0 1 8 A N N U A L R E P O R T

SUPPLEMENTARY FINANCIAL STATEMENTS - PAGESUPPORTING SCHEDULESConsolidatedScheduleOfRevenuesAndExpensesBySegment-Notes 25
ConsolidatedScheduleOfRevenuesAndExpensesBySegment 26
ConsolidatedScheduleOfTangibleCapitalAssets 27
ScheduleOfLong-TermDebt-SummaryByFunction 28
ScheduleOfLong-TermDebt-Detailed 29-31
ScheduleOfStatutoryReserveFundActivitiesAndFundBalances 32-33
ScheduleOfDevelopmentCostChargesFundBalances 34
ScheduleOfReceiptsAndDisbursements-GasTaxRevenueTransferPrograms 35
ScheduleOfGeneralRevenueFundRevenueAndExpenses 36
SUPPLEMENTARY FINANCIAL STATEMENTS - GENERAL REVENUE FUND DIVISIONAL SUMMARIES CorporateServices-ScheduleOfRevenuesAndExpenses
ACorporateServicesOverall 37
Strategic&CommunityDevelopment-SchedulesOfRevenuesAndExpenses
BStrategic&CommunityDevelopmentOverall 38
B-1BylawEnforcement 39
Regional&CommunityUtilities-SchedulesOfRevenuesAndExpenses
CRegional&CommunityUtilitiesOverall 40
C-1WastewaterManagement 41
C-2WaterSupplyManagement 42
C-3SewerageCollection 43
C-4StreetLighting 44
Recreation&ParksServices-SchedulesOfRevenuesAndExpenses
DRecreation&ParksOverall 45
D-1CommunityParks 46
Transportation&EmergencyServices-SchedulesOfRevenuesAndExpenses
ETransportation&EmergencyServicesOverall 47
E-1PublicSafetySystems 48
E-2FireDepartments 49
FINANCIAL AND OPERATIONAL STATISTICS SECTION RevenuesAndExpenseTrends2014-2018 50
2018RevenuesAndExpenseDistribution 51
SummaryOfStatementOfFinancialPosition2014-2018 52
ReserveAndDCCBalances2014-2018 52
Revenues,Expenses,AccumulatedAndAnnualSurplus2014-2018 53
TaxContributionsByParticipatingArea2014-2018 53-54
2018TaxRevenuesByFunction 55
TangibleAssetAcquisition2014-2018 55
ElectoralAreaConstructionActivity2014-2018 56
Wastewater-PopulationAndFlow2013-2018 57
TransitRidership2012-2018 58
SolidWasteManagement:AnnualTonnesVsPopulation2014-2018 59
LongTermDebtSummary2014-2018 60
TotalPropertyAssessmentsNetTaxableValues2014-2018 61
R E G I O N A L D I S T R I C T O F N A N A I M O 2 0 1 8 A N N U A L R E P O R T
GE
NE
RA
LU
TIL
ITIE
SR
EC
& P
AR
KS
DE
VE
LO
PM
EN
TC
OR
PO
RA
TE
FIN
AN
CE
ST
AT
IST
ICS
TR
AN
SIT
&
EM
ER
GE
NC
Y

R E G I O N A L D I S T R I C T O F N A N A I M O 2 0 1 8 A N N U A L R E P O R T i
IntroductionThisAnnualReportprovidesreaderswithan
overviewofthefinancialresultsforthe2018Fiscal
Year,aswellastheresultsoftherangeofRDN’s
servicescarriedoutunderthedirectionoftheBoard
incompliancewiththeBoardStrategicPlanandthe
adoptedfinancialplan.
ThisAnnualReportisdividedintothreesections
forconvenience:
INTRODUCTORY SECTION: IntroducestheBoardofDirectors,outlinesthe
structureoftheorganization,describesthe
RegionalDistrictofNanaimo,andhighlights2018
departmentalaccomplishments.
FINANCIAL STATEMENTS SECTION: Containsthe2018auditedconsolidatedfinancial
statements,notestothefinancialstatements,
statementregardingmanagement’sresponsibility
forthefinancialstatementsandtheIndependent
Auditor’sReportfortheRegionalDistrict.This
sectionalsocontainsschedulesshowingfinancial
activitiesinmoredetail,includingreservefund
transactions,overalloperatingrevenuesand
expensesandstatementsofrevenuesandexpenses
forindividualservicesprovidedbytheRegional
District.Thepresentationofresultsinthesupporting
schedulesconformstotherequirementsoftheLocal
GovernmentActforRegionalDistrictstoaccountfor
revenuesandexpensesattheservicelevel.
FINANCIAL AND OPERATIONAL STATISTICS SECTION: Containsanumberofstatisticalsummariesaboutthe
RegionalDistrictaswellasgraphicrepresentationsof
currentandhistoricoperatingresults.
R E G I O N A L D I S T R I C T O F N A N A I M O 2 0 1 8 A N N U A L R E P O R T
GE
NE
RA
L
i

R E G I O N A L D I S T R I C T O F N A N A I M O 2 0 1 8 A N N U A L R E P O R Tii
GE
NE
RA
LU
TIL
ITIE
SR
EC
& P
AR
KS
DE
VE
LO
PM
EN
TC
OR
PO
RA
TE
FIN
AN
CE
ST
AT
IST
ICS
TR
AN
SIT
&
EM
ER
GE
NC
Y
H
F
G
E
CA
B
Bowser
Parksville
CedarExtension
CoombsNanoose Bay
Lantzville
Nanaimo
Gabriola Island
Qualicum Bay
Qualicum Beach
TheRegionalDistrictofNanaimoisoneof29
regionalgovernmentsinBritishColumbia.Regional
DistrictsaregovernedbyaBoardofDirectors
whosemembersareappointedfrommember
municipalities’councilsandelectedfromthe
Region’sElectoralAreas.
TheRegionalDistrictofNanaimoissituatedwithin
thetraditionalterritoryofseveralFirstNations,
includingthreethathavevillagesandother
landsundertheirjurisdictionwithintheregion:
Snuneymuxw,Snaw-Naw-AsandQualicumFirst
Nation.TheBoardrecognizestherichcultural
historyoftheregion’sFirstNationsandiscommitted
todevelopingpositiveworkingrelationshipstothe
benefitofallresidentsoftheregion.
Asalocalgovernment,theRegionalDistrict
ofNanaimoisaregionalfederationoffour
municipalitiesandsevenelectoralareas.
ThefourmunicipalitiesaretheCity of Nanaimo,the
City of Parksville,theTown of Qualicum Beach,and
theDistrict of Lantzville.
THE ELECTORAL AREAS ARE:A: Cedar,SouthWellington,YellowPoint,Cassidy
B: Gabriola,DeCourcy,MudgeIslands
C: Extension,NanaimoLakes,EastWellington,
PleasantValley
E: NanooseBayF: Coombs,Hilliers,Errington,WhiskeyCreek,
Meadowood
G: FrenchCreek,SanPareil,LittleQualicumH: Bowser,QualicumBay,DeepBay
RegionalDistrictsareBC’swayofensuringthat
allBritishColumbianshaveaccesstonecessary
services,regardlessofwheretheylive.
TheRDNhasaworkforceof299fullandparttime
staff,withanother151temporaryandcasual
employees.Withthisstaff,theRDNprovidesand
coordinatesarangeofserviceswithinmember
municipalitiesandunincorporatedelectoralareas.
Intermsoffinancialscale,theRDNranksthird
intotalexpensesafterMetroVancouverandthe
CapitalRegionalDistrict.
REGIONAL DISTRICT OF NANAIMO
Who We Are

R E G I O N A L D I S T R I C T O F N A N A I M O 2 0 1 8 A N N U A L R E P O R T iii
REGIONAL DISTRICT OF NANAIMO
At A Glance
3,127SQUARE KILOMETERS
47.2YEARS IS THE AVERAGE AGE
2.2IS THE AVERAGE
HOUSEHOLD SIZE
THE RDN GREW BY
6.2%BETWEEN 2011 - 2016. THAT’S
9,124PEOPLE.
DEMOGRAPHICS BY AGE & GENDER
155,698
13.6%60.0%23.7%2.7%
12.1%60.3%23.6%4.0%
FASTEST GROWING REGIONAL DISTRICT IN BCWITH A POPULATION OF
REGIONAL DISTRICT OF NANAIMO POPULATION GROWTH 1986-2016
GE
NE
RA
LU
TIL
ITIE
SR
EC
& P
AR
KS
DE
VE
LO
PM
EN
TC
OR
PO
RA
TE
FIN
AN
CE
ST
AT
IST
ICS
TR
AN
SIT
&
EM
ER
GE
NC
YG
EN
ER
AL
0-14 YEARS
15-64 YEARS
65-84 YEARS
85+ YEARS
7th

R E G I O N A L D I S T R I C T O F N A N A I M O 2 0 1 8 A N N U A L R E P O R Tiv
GE
NE
RA
LU
TIL
ITIE
SR
EC
& P
AR
KS
DE
VE
LO
PM
EN
TC
OR
PO
RA
TE
FIN
AN
CE
ST
AT
IST
ICS
TR
AN
SIT
&
EM
ER
GE
NC
Y
Who We Are ThefollowingtableshowstheRDN’sroleasalocal
governmentserviceprovidercomparedtothatofits
Membermunicipalities.
WastewaterTreatment
SewerCollection
WaterServices
StreetLighting
SolidWasteDisposal
SolidWasteCollection
andRecycling
Recreation
RegionalParks
CommunityParks
PublicTransit
EmergencyPreparedness
FireandRescueServices
CommunityPlanning
RegionalGrowth
Management
EconomicDevelopment
BuildingInspection
BylawEnforcement
GeneralGovernment
Administration
SERVICEREGIONAL OR SUB-REGIONAL
(providedbytheRDNtoa
combinationofmembers)
MUNICIPAL(providedbymunicipalities
totheirresidents)
PROVIDED BY RDN TO ELECTORAL
AREAS ONLY
R E G I O N A L D I S T R I C T O F N A N A I M O 2 0 1 8 A N N U A L R E P O R T v
GE
NE
RA
LU
TIL
ITIE
SR
EC
& P
AR
KS
DE
VE
LO
PM
EN
TC
OR
PO
RA
TE
FIN
AN
CE
ST
AT
IST
ICS
TR
AN
SIT
&
EM
ER
GE
NC
YAW
ARD
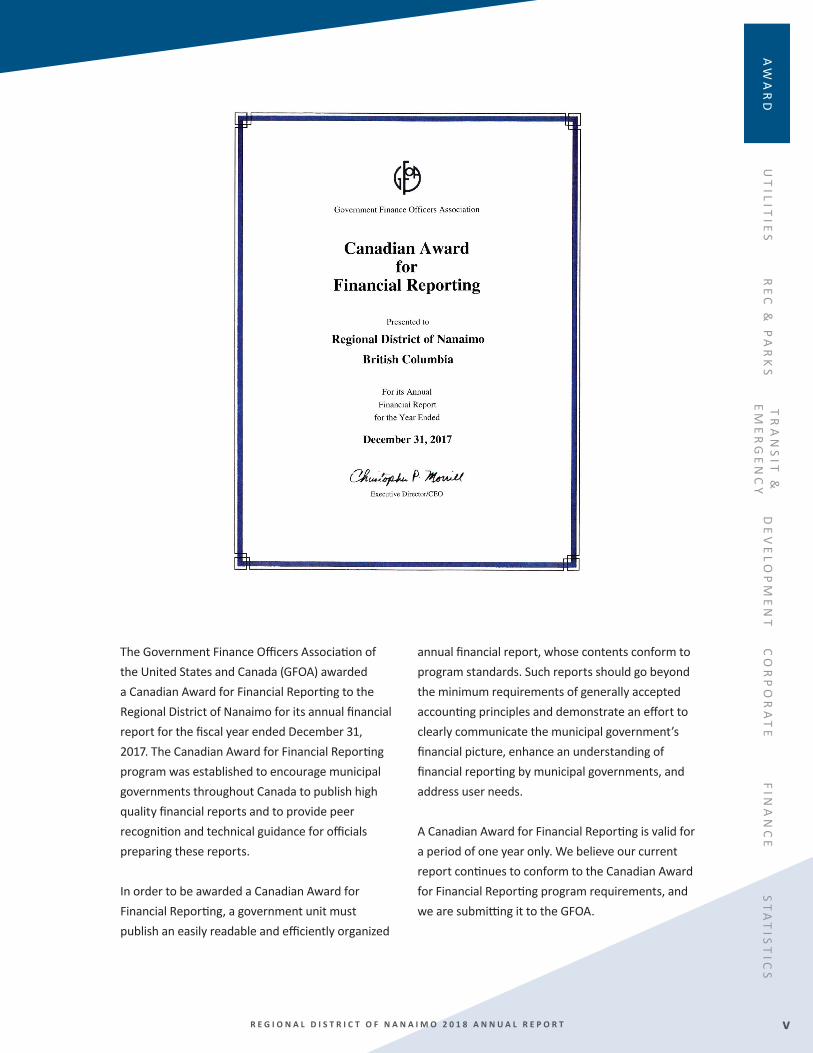
TheGovernmentFinanceOfficersAssociationof
theUnitedStatesandCanada(GFOA)awarded
aCanadianAwardforFinancialReportingtothe
RegionalDistrictofNanaimoforitsannualfinancial
reportforthefiscalyearendedDecember31,
2017.TheCanadianAwardforFinancialReporting
programwasestablishedtoencouragemunicipal
governmentsthroughoutCanadatopublishhigh
qualityfinancialreportsandtoprovidepeer
recognitionandtechnicalguidanceforofficials
preparingthesereports.
InordertobeawardedaCanadianAwardfor
FinancialReporting,agovernmentunitmust
publishaneasilyreadableandefficientlyorganized
annualfinancialreport,whosecontentsconformto
programstandards.Suchreportsshouldgobeyond
theminimumrequirementsofgenerallyaccepted
accountingprinciplesanddemonstrateaneffortto
clearlycommunicatethemunicipalgovernment’s
financialpicture,enhanceanunderstandingof
financialreportingbymunicipalgovernments,and
addressuserneeds.
ACanadianAwardforFinancialReportingisvalidfor
aperiodofoneyearonly.Webelieveourcurrent
reportcontinuestoconformtotheCanadianAward
forFinancialReportingprogramrequirements,and
wearesubmittingittotheGFOA.

R E G I O N A L D I S T R I C T O F N A N A I M O 2 0 1 8 A N N U A L R E P O R Tvi
IanTh
orpe
,Cha
ir
Region
alDistricto
fNan
aimo,
BoardofDire
ctors
CHAIR
IamhonouredtohavebeenchosentobetheChair
fortheRegionalDistrictofNanaimo.Theyear2018
wasoneofcontinuedgrowthandsuccessaswell
astransitionandchangeattheRegionalDistrictof
Nanaimo.Themostsignificantchangecameasa
resultofthe2018localgovernmentelection.We
thanked15ofour19departingBoardmembersfor
theiryearsofleadership,timeandenergy.Ournew
Boardhasalreadybeenhardatworkdeveloping
anewstrategicplanandlookingforwardtothe
nextfour-yeartermofgreataccomplishmentsand
enhancedpublicengagement.
A FEW HIGHLIGHTS FROM 2018 INCLUDED: • TheBoardapprovedarenewedSolidWaste
ManagementPlanincreasingourtarget
diversionratefrom68%to90%by2027,in
supportofbeingcontinuedgloballeaders.
• Kickoffofthe10YearActionPlan
ImplementationReviewfortheDrinking
Water&WatershedProtectionProgram,after
greatsuccessesinimprovingwaterscience,
education,outreachandpolicysupportforour
entireregionforthelast10years.
• FirstinBCtolaunchtheNextRidereal-timebus
locationtechnologyforallconventionalRDN
Transitbusestoallowresidentsofallagesand
abilitiesamoreaccessiblewaytouseour
transitservices.
Akeyelementofourfutureinvolvesensuringthat
weproperlyplanforreplacementofourassets
toensurelongtermsustainabilityinourRegion,
whichwasfacilitatedinpartbyFederalGasTax
Fundgrants.Amajorfocusof2018involvedthe
developmentofanAssetManagementProgram,
whichwillcontinueintofutureyears.
WewereproudtounveilworksofartbylocalFirst
Nationsartists,whichareprominentlydisplayedin
ourBoardMeetingRoom.Wewanttohonourand
acknowledgetheSnuneymuxw,Snaw-Naw-Asand
QualicumFirstNations.OurBoardwillcontinueto
workcloselywithourFirstNationspartners.
OnbehalfoftheRegionalBoard,Ihopeyoufind
our2018AnnualReportahelpfulandinteresting
reminderofwhatweaccomplishedtogetherinthe
pastyear.Thereportprovidesadetaileddescription
oftheRegionalDistrictofNanaimo’sstrongfinancial
positionandrecentprojectsandinitiatives.Our
currentBoardislookingforwardtotheyearahead
andintendstoworkhardforallRDNresidents.We
hopetoseesignificantinvolvementfrommany
membersofourcommunitiesacrosstheRegionand
wishtothankeveryonewhovolunteerswithusin
thedeliveryofservices.
Message From The ChairU
TIL
ITIE
SR
EC
& P
AR
KS
DE
VE
LO
PM
EN
TC
OR
PO
RA
TE
FIN
AN
CE
ST
AT
IST
ICS
TR
AN
SIT
&
EM
ER
GE
NC
Y

R E G I O N A L D I S T R I C T O F N A N A I M O 2 0 1 8 A N N U A L R E P O R T vii

R E G I O N A L D I S T R I C T O F N A N A I M O 2 0 1 8 A N N U A L R E P O R Tviii
BO
AR
D
Board of DirectorsBOARD STRUCTUREAnelectedBoardof19Directorsgovernsthe
RegionalDistrictofNanaimo.Onedirectoriselected
totheBoardfromeachofthesevenElectoralAreas
A,B,C,E,F,G,andH.Eightdirectorsareappointed
fromtheCityofNanaimomunicipalCouncil,two
directorsareappointedfromtheCityofParksville
municipalCouncilandonedirectorisappointed
fromeachoftheremainingmembermunicipal
Councils:theDistrictofLantzvilleandtheTownof
QualicumBeach.
TheRegionalDistrictofNanaimoBoardofDirectors
waselectedtoofficeforthefouryeartermfrom
January1,2019toDecember31,2022.TheBoard
anditsStandingCommitteesmeetregularlyto
governtheaffairsoftheDistrictandtoestablish
localbylawsandpublicpolicy.Boardmembersalso
directavarietyofadditionalcommitteesforkey
servicesthroughouttheregion.
KEITH WILSONElectoralAreaA
LEANNE SALTERElectoralAreaF
VANESSA CRAIGElectoralAreaB
CLARKE GOURLAYElectoralAreaG
MAUREEN YOUNGElectoralAreaC
STUART MCLEANElectoralAreaH
BOB ROGERSElectoralAreaE
UT
ILIT
IES
RE
C &
PA
RK
SD
EV
EL
OP
ME
NT
CO
RP
OR
AT
EF
INA
NC
ES
TA
TIS
TIC
ST
RA
NS
IT &
E
ME
RG
EN
CY

R E G I O N A L D I S T R I C T O F N A N A I M O 2 0 1 8 A N N U A L R E P O R T ix
GE
NE
RA
LU
TIL
ITIE
SR
EC
& P
AR
KS
DE
VE
LO
PM
EN
TC
OR
PO
RA
TE
FIN
AN
CE
ST
AT
IST
ICS
TR
AN
SIT
&
EM
ER
GE
NC
YB
OA
RD
TYLER BROWNCityofNanaimo
IAN THORPECityofNanaimo
EDMAYNECityofParksville
BENGESELBRACHTCityofNanaimo
LEONARDKROGCityofNanaimo
ADAMFRASCityofParksville
ERINHEMMENSCityofNanaimo
SHERYLARMSTRONGCityofNanaimo
BRIANWIESETownofQualicumBeach
JIMTURLEYCityofNanaimo
MARKSWAINDistrictofLantzville
DONBONNERCityofNanaimo

R E G I O N A L D I S T R I C T O F N A N A I M O 2 0 1 8 A N N U A L R E P O R Tx
PR
IOR
ITIE
S
Board Strategic PrioritiesAsanelectionyear,2018wasthefinalyearof
thetermfortheRDNBoardofDirectors,and
thereforethefinalyeartoimplementthepresent
BoardStrategicPlan.TheBoardStrategicPlan
identifiesfivestrategicprioritiesforthecurrent
termofoffice:Focus on Governance, Focus on
Service and Organizational Excellence, Focus on
Relationships, Focus on Economic Health and Focus
on the Environment.Theseprioritiesrepresentthe
overarchingthemesforthe2016–2020periodand
highlightimportantissuesthattouchallaspectsof
theRDN’swork.Integraltothesestrategicpriorities
isthevisionthat:Our Region is environmentally,
socially, and economically healthy, resilient and
adaptable to change. Residents of the Region meet
their needs without compromising the ability of
future residents to do the same.
1. FOCUS ON GOVERNANCE:TheRDNwillcooperateandadvocateasa
Regionwhilerecognizingtheuniquenessof
eachcommunity.
• Wewilldevelopourgovernancestructureto
reflectouruniquemunicipal/electoralarea
demographics.
• Wewillcreateanelectoralareacaucusto
enhanceregionalgovernance.
• WewillreviewourBoardcompositionasour
communitychangesandgrows.
2. FOCUS ON SERVICE AND ORGANIZATIONAL EXCELLENCE:TheRDNwilldeliverefficient,effectiveand
economicallyviableservicesthatmeettheneeds
oftheRegion.TheRDNwillfocusonorganizational
excellenceinallaspectsofourdailyactionsand
servicedeliverytoourcustomers.
• Weviewouremergencyservicesascore
elementsofcommunitysafety.
• Wewillfundinfrastructureinsupportofour
coreservicesemployinganasset
managementfocus.
• Asweinvestinregionalservices,welookatboth
costsandbenefits–theRDNwillbeeffective
andefficient.
• Werecognizecommunitymobilityand
recreationalamenitiesascoreservices.
• Werecognizeandplanfortheimpactofour
agingpopulation.
• Wewilladvocatefortransitimprovementsand
activetransportation.
• Wewillensureourprocessesareas
easytoworkwithaspossible.
ANNUALSTRATEGIC
PLANREVIEW
REPORT ONSTRATEGIC
PLANPRIORITIES
MEASURESTRATEGIC
PLANPROCESS
ACTIONSTO
SUPPORTPLAN
STRATEGICPLAN
REVIEWWORKSHOP
UT
ILIT
IES
RE
C &
PA
RK
SD
EV
EL
OP
ME
NT
CO
RP
OR
AT
EF
INA
NC
ES
TA
TIS
TIC
ST
RA
NS
IT &
E
ME
RG
EN
CY

R E G I O N A L D I S T R I C T O F N A N A I M O 2 0 1 8 A N N U A L R E P O R T xi
GE
NE
RA
LU
TIL
ITIE
SR
EC
& P
AR
KS
DE
VE
LO
PM
EN
TC
OR
PO
RA
TE
FIN
AN
CE
ST
AT
IST
ICS
TR
AN
SIT
&
EM
ER
GE
NC
YP
RIO
RIT
IES
4.FOCUS ON ECONOMIC HEALTH:TheRDNwilllookatallouractivitiesthroughan
economiclens.
• Wewillsupportourtraditionalindustries:
forestry,tourism,manufacturing,fishing,
knowledge-basedandtechnology-
basedindustries.
• Werecognizetheimportanceofwaterin
supportingoureconomicand
environmentalhealth.
• Wewillfostereconomicdevelopment.
• Weseeeco-tourismasakeyeconomic
opportunityinourRegion.
• Werecognizetheimportanceofagriculture
andaquacultureinourRegion.
FOCUS ON THE ENVIRONMENT:TheRDNrecognizesthatahealthyenvironmentiskeytoeconomicdevelopment
andahealthycommunity.
5. • Wewillprepareforandmitigate
theimpactofenvironmentalevents.
• Wewillincludeconservationof
resourcesasaplanningfactor.
• Wewillhaveastrongfocus
onprotectingandenhancingour
environmentinalldecisions.
• Wewillevaluateairqualityand
climateimpactsasfactorsinour
infrastructureandservicesplanning.
3. FOCUS ON RELATIONSHIPS:TheRDNwillcontinuetodevelopandencourage
meaningfulrelationships.
• WevalueourFirstNationsrelationshipsandwill
integratetheirinputinfutureplanningand
servicedelivery.
• Wewillfocusonimprovedtwo-way
communicationwithintheRegionalDistrictand
withourcommunities.
• Werecognizeallvolunteersasanessential
componentofservicedelivery.Wewillsupport
therecruitmentandretentionofvolunteers.
• Welookforopportunitiestopartnerwithother
branchesofgovernment/communitygroupsto
advocateforourRegion.
• Wewillfacilitate/advocateforissuesoutsideof
ourjurisdiction.

R E G I O N A L D I S T R I C T O F N A N A I M O 2 0 1 8 A N N U A L R E P O R Txii
ORG.CHART
Organizational Chart
THECOMMUNITY
BOARD OF DIREC TORS
Phyllis Carlyle CHIEFADMINISTRATIVEOFFICER
Delcy Wells GENERALMANAGER,
CORPORATE SERVICES
Geof f Garbut t GENERALMANAGER,
STRATEGIC AND
COMMUNIT Y DEVELOPMENT
Tom Osborne GENERALMANAGER,
RECREATION AND
PARKS SERVICES
Randy Alexander GENERALMANAGER,
REGIONAL AND
COMMUNIT Y UTILITIES
Daniel Pearce DIRECTOR,
TRANSPORTATION AND
EMERGENCY SERVICES
UT
ILIT
IES
RE
C &
PA
RK
SD
EV
EL
OP
ME
NT
CO
RP
OR
AT
EF
INA
NC
ES
TA
TIS
TIC
ST
RA
NS
IT &
E
ME
RG
EN
CY

R E G I O N A L D I S T R I C T O F N A N A I M O 2 0 1 8 A N N U A L R E P O R T xiii
Message From The Chief Administrative Officer
GE
NE
RA
LU
TIL
ITIE
SR
EC
& P
AR
KS
DE
VE
LO
PM
EN
TC
OR
PO
RA
TE
FIN
AN
CE
ST
AT
IST
ICS
TR
AN
SIT
&
EM
ER
GE
NC
YA
DM
IN
PhyllisCarlyle,
ChiefA
dministrati
veOfficer
In2018,theRegionalDistrictofNanaimo(RDN)
hascontinuedtoseegrowthandsuccessunderthe
visionsetbytheBoardofDirectorsStrategicPlan.
ThisAnnualReportprovidesinformationonthe
achievementoftheBoard’sobjectives.Through
strongfiscalstewardship,theRDNhaslimited
propertytaxincreaseswhileprovidingsignificant
improvementinourservicesanddeliveredmajor
infrastructureprojects.
OurRegionalGrowthStrategysetstheframework
foroursuccessasthepopulationcontinuesto
growtoapproximately160,000.Thevalueof
constructionintheElectoralAreasalonewas$125
million.Alargethankyoumustbeextendedtothe
over500RDNstafffortheirexpertiseandsupport
workingonbehalfofresidentsinthisgreatregion.
Fromansweringquestionsonthephoneoratthe
countertosharinginformationandlisteningto
concernsandeverythinginbetween,ourstaffis
greatlyappreciated.Duringanumberofemergency
events,ourskilledanddedicatedstaffprovided
valuablesupportandinformationtoresidentsin
challengingtimes.Wearealsofortunatetohave
over1,000volunteersthatassistwithemergency
events,RDNcommittees,initiativesandday-to-day
operationsthataresoimportanttothewell-being
ofourcommunities.Thankyouforyourtime,
energyandcontinuedcare.
Forthesecondyearinarow,ourAnnualReport
receivedtheCanadianAwardforFinancialReporting
fromtheGovernmentFinanceOfficersAssociation
in2018.Anotherjobwelldone.
AsweoperationalizetheBoard’svisionandgoals
fortheregionintheyearsahead,staffarelooking
forwardtoprovidingcontinuedinnovativeand
excellentservice.TheRegionalBoardandstaffare
workingcollaborativelytofurtherenhancethelevel
ofservicethatourresidentsrelyonfromtheRDN.

R E G I O N A L D I S T R I C T O F N A N A I M O 2 0 1 8 A N N U A L R E P O R Txiv
DE
PA
RT
ME
NT
S
RDN Departments & ServicesREGIONAL AND COMMUNITY UTILITIES• WastewaterTreatmentPlanning,
ManagementandOperations
• Water,SewerandStreetLighting-
LocalServices
• DrinkingWaterandWatershedProtection
• SolidWasteDisposalManagement,
Planning,CollectionandRecycling
RECREATION AND PARKS SERVICES• RecreationProgramming
• OceansidePlaceMultiplexArena
• RavensongAquaticCentre
• RegionalParksandTrails
• CommunityParks
TRANSPORTATION AND EMERGENCY SERVICES• ConventionalBusOperations
• HandyDartBusOperations
• TransitPlanning,FleetMaintenance
andManagement
• EmergencyPreparednessCoordination
• FireServicesAdministration
STRATEGIC AND COMMUNITY DEVELOPMENT• CurrentPlanning–Subdivision,Zoningand
DevelopmentApplications
• LongRangePlanning–RegionalGrowthand
OfficialCommunityPlans,Energyand
Sustainability
• EconomicDevelopment
• BuildingPermitsandInspections
• BylawEnforcement
CORPORATE SERVICES• GeneralGovernmentAdministration
• CorporateCommunications
• InformationTechnologyandMapping
• HumanResources
• ElectoralAreasAdministration
• AccountingServices
• FinancialReporting
• Procurement
• NanaimoRegionalHospitalDistrict
UT
ILIT
IES
RE
C &
PA
RK
SD
EV
EL
OP
ME
NT
CO
RP
OR
AT
EF
INA
NC
ES
TA
TIS
TIC
ST
RA
NS
IT &
E
ME
RG
EN
CY

R E G I O N A L D I S T R I C T O F N A N A I M O 2 0 1 8 A N N U A L R E P O R T xvR E G I O N A L D I S T R I C T O F N A N A I M O 2 0 1 8 A N N U A L R E P O R T xv
UT
ILIT
IES
Regional & Community UtilitiesRandy Alexander,GeneralManager
Sean De Pol,Director,Water&WastewaterServices
Larry Gardner,Manager,SolidWasteServices
Murray Walters,Manager,WaterServices
Duncan Taylor,Manager,EngineeringServices
TheRegionalandCommunityUtilities
Departmentcoordinatesthedeliveryofday-
to-dayservicesrequiredforcommunityliving
includingwastewater,water,solidwaste
management,andengineeringservices.
WASTEWATER SERVICESoverseesandoperatesassetsownedbytheRegionalDistrict
includingfourwastewatertreatmentfacilities,
22pumpstationsandtwoseptagereceiving
sitesbetweenQualicumBeachandtheDuke
Pointpeninsula.Thesefacilitiestreatwastewater
fromapproximately124,800residents.
WATER SERVICESoperates,maintains,
andmanagesassetsinwaterandutilities
outsideoftheregion’sincorporatedareas
includingwatersystems,watertreatment,
sewercollectionsystems,andrainwater
management.Inaddition,thedepartment
administersprogramsfordrinking
waterandwatershedprotection.
SOLID WASTE SERVICESisresponsibleforplanning,regulatingandoperatingsolidwaste
disposalfacilitiesaswellasprogramsforthe
collection,recyclinganddiversionofsolidwaste.
ENGINEERING SERVICESprovidesengineeringsupporttootherRDN
departmentsmainlyrelatedtoproject
managementofmajorcapitalprojects.

R E G I O N A L D I S T R I C T O F N A N A I M O 2 0 1 8 A N N U A L R E P O R Txvi
GE
NE
RA
LU
TIL
ITIE
SR
EC
& P
AR
KS
DE
VE
LO
PM
EN
TC
OR
PO
RA
TE
FIN
AN
CE
ST
AT
IST
ICS
TR
AN
SIT
&
EM
ER
GE
NC
Y
WastewaterServices
TheGreater Nanaimo Pollution Control Centre
isaprimarywastewatertreatmentplantlocated
onHammondBayRoadintheCityofNanaimo.It
isthelargestofthefourfacilitiesoperatedbythe
RegionalDistrict,servingpropertieswithintheCity
ofNanaimo,portionsoftheDistrictofLantzvilleand
someSnuneymuxwFirstNationslands. In total, this facility treats wastewater from about
95,900 residents.
Thesecondlargestwastewatertreatmentfacility
withintheRegionalDistrictislocatedonLeeRoad
inFrenchCreek(ElectoralAreaG).TheFrench Creek
Pollution Control Centreisasecondarytreatment
plantservingapopulationofabout27,500
peoplelivinginFrenchCreek,theCityofParksville,theTownofQualicumBeachandsmallerareas
northofQualicum(Surfside)andsouthofParksville
(PacificShores).
TheNanoose Bay Pollution Control Centrein
ElectoralAreaE(Fairwinds)isaprimarytreatment
plantservingabout1,475 residents.
Asmallsecondarytreatmentplantislocatedinthe
DukePointIndustrialParkatthesouthernendofthe
CityofNanaimo.TheDuke Point Pollution Control
Centretreatswastewaterfromtheindustrialpark
andfromabout37 propertieslocatedintheCedarVillageCentre(ElectoralAreaA).
HIGHLIGHTS FOR 2018 INCLUDE:
• WellingtonNorthShorelineInterceptorRepairs
• GNPCCConcreteCoatingforSedimentation
andGritTanks
• RoofRepairsatGNPCCandChaseRiver
pumpstation
• OutfallDiffuserCleaningFCPCC
• Qualicuminterceptormanholereplacement
• Yamburyinterceptorbeachprotectionproject
• Centrifuge#1VFDreplacement
• GNPCCoutfallReceivingEnvironment
Monitoring(2ndyearof3-yearstudy)
• BiosolidsSiteOptimizationStudy
• BayAvenuepreliminarydesign
• FCPCCexpansionpreliminarydesignstudy
AlloftheRegionalDistrict’swastewatertreatment
facilitieshaveexcellentoperatingresults–
consistentlymeetingdischargepermitlevels
assignedbytheprovincialandfederalgovernments.
KEY INITIATIVES FOR 2019 INCLUDE:
• CompletionofSecondaryTreatmentUpgrade
at GNPCC
• ChaseRiverforcemainreplacement
• ReceivingEnvironmentMonitoring
(finalyearof3-yearstudy)
• GensetAdditionandOdourControlat
WellingtonPumpStationDesign
• GNPCCWasteGasFlareUpgrade
(EngineeringStudyandConstruction)
• ElectricalPolicyCreationforGNPCC
• ISO14001:2015SurveillanceAudit
• QualicumInterceptorManholeReplacement
Studies(EngineeringDesign&Permitting)
• FCPCCStage4ExpansionProjectandOdour
ControlUpgradesDetailedDesign
SecondaryTreatmentUpgradeatGreater
NanaimoPollutionControlCentre

R E G I O N A L D I S T R I C T O F N A N A I M O 2 0 1 8 A N N U A L R E P O R T xvii
GE
NE
RA
LU
TIL
ITIE
SR
EC
& P
AR
KS
DE
VE
LO
PM
EN
TC
OR
PO
RA
TE
FIN
AN
CE
ST
AT
IST
ICS
TR
AN
SIT
&
EM
ER
GE
NC
Y
Majorupgradesarescheduledforthethreelarger
facilitiesoverthenexttenyears.Suchprojects
includeexpansionoftheFrenchCreekplantandthe
provisionofsecondarytreatmentattheNanaimo
andNanooseplants.Constructionisunderwayon
thesecondarytreatmentupgradeoftheNanaimo
plant.Developmentcostchargebylawsforallthree
areasareinplacetohelppayforfuturetreatment
capacityrequirements.
COMMUNITY SEWER SYSTEMSSewercollectionsystemsarelocatedinElectoral
AreasA(CedarVillage),E(Fairwinds/PacificShores)
andG(FrenchCreek/BarclayCrescent/Surfside).
SewageisconveyedtotheDukePointplantin
ElectoralAreaA,theNanooseBay(Fairwinds)
treatmentplantinElectoralAreaEandtheFrench
CreektreatmentplantinElectoralAreaG.
TheRDNcompletedanagreementin2015toextend
sewerservicestoSnuneymuxwFirstNationslands.
Sewagefromthesepropertieswillbeconveyedto
theNanaimoplant.
LIQUID WASTE MANAGEMENT PLANTheMinisterofEnvironmentapprovedtheRDN’s
LiquidWasteManagementPlanAmendmentin
October2014.TheplanrepresentstheRDN’slong
termstrategyforwastewatermanagementand
treatment.Thereviewinvolvedabroadrange
ofstakeholderswhoparticipatedinevaluating
wastewatertreatmentoptions,facilityupgrades,
regulatoryandeducationalprograms,and
operationalgoals.Bybalancingenvironmental,
economic,operationalandsocialconsiderations,
wastewatermanagementplanningcontributesto
thesustainabilityandlivabilityoftheregion.The
RDNisnowimplementingtheplan.Secondary
treatmentupgradesattheNanaimo(scheduled
completionby2019)andNanoose(completionby
2023)plantsandreplacementoftheNanaimoplant
outfall(completedin2016)areamongprojects
embeddedintheplan.Moreinformationisposted
at www.rdn.bc.ca/liquid-waste-management-plan.
SEPTICSMARTPrivateonsite(e.g.septic)systemsprovide
wastewatertreatmenttopropertiesnotconnected
tocommunitysewer.TheSepticSmarteducation
programwaslaunchedin2008tohelpresidents
recognizetheimportanceofmonitoringand
maintainingtheirsepticsystemsandtohelpreduce
thenumberoffailingonsitesystemsintheregion.
Todate,nearly1,500residentshaveattended
SepticSmartworkshopsacrosstheregion.
Since2014,thisprogramhasalsogivenresidents
rebatestohelpthemmaintaintheirsepticsystems.
Getmoreinformationatwww.SepticSmart.ca.
$166,000REBATES SINCE INCEPTION

R E G I O N A L D I S T R I C T O F N A N A I M O 2 0 1 8 A N N U A L R E P O R Txviii
GE
NE
RA
LU
TIL
ITIE
SR
EC
& P
AR
KS
DE
VE
LO
PM
EN
TC
OR
PO
RA
TE
FIN
AN
CE
ST
AT
IST
ICS
TR
AN
SIT
&
EM
ER
GE
NC
Y
ENVIRONMENTAL MANAGEMENT SYSTEM Since2005,theWastewaterServicesDepartment
hasbeenISO14001certifiedforexcellencein
environmentalmanagement.TheISOstandardisan
internationallyrecognizedprotocolthatfocuseson
anintegratedsystemsapproachtoensurefacilities
areoperatedsafelyandeffectively.Tomaintainits
certification,thedepartmentisauditedannuallyfor
compliancewiththeISO14001standard.
BIOSOLIDSBiosolidsarenutrient-rich,humus-likematerialsthat
areproducedthroughthewastewatertreatment
process.TheRegionalDistrict’swastewaterfacilities
producedapproximately1,340 dry tonnes of
biosolidsin2018.TheRDNmanagesbiosolidsin
aforestfertilizationprogramoperatedbySYLVIS
Environmentalwhichmeetstheconditionsofthe
ProvincialOrganicMatterRecyclingRegulation.In
2017,theRDNsignedalanduseagreementwith
TimberWestandashareduseagreementwith
theNanaimoMountainBikeClubtocontinuethe
forestfertilizationprogram.Thisuseofbiosolidsis
economicallyandenvironmentallysustainableand
providesessentialnutrientssafelybacktothenatural
environment.Visitwww.rdn.bc.ca/biosolidstolearn
moreaboutourawardwinningbiosolidsprogram.
SOURCE CONTROLSourcecontrolmeansreducingthelevelof
contaminantsandtheamountofwastewater
flowingtothetreatmentplants.Preventing
pollutionfromenteringthetreatmentsystems
reducesthefrequencyandcostofupgradesand
improvesthequalityofeffluentandbiosolids.
WastewaterServicescollaborateswithother
departmentsandmunicipalitiestoenhancesource
controlandprotectthehealthandsafetyofthe
environment,thepublic,theemployees,andthe
integrityofthewastewatercollectionand
treatmentinfrastructure.
BENCHMARKINGTheWastewaterServicesDepartmentparticipates
intheNationalWaterandWastewaterBenchmarking
Initiative.ThisinitiativeisapartnershipofCanadian
municipalitiesandRegionalDistrictswhomeasure,
trackandreportontheoperationoftheirfacilities.
Throughconsultationandworkshops,participants
identifybestpracticestocontinuallyimprovefacility
performanceandcosteffectiveness.
WaterServices
UTILITIESTheWaterServicesdepartmentiscomprisedof:
• Onemanager
• Eightprovincially-certified(EOCP)water
systemoperators
• Oneprojectengineer
• Twoengineeringtechnologists/technicians

R E G I O N A L D I S T R I C T O F N A N A I M O 2 0 1 8 A N N U A L R E P O R T xix
GE
NE
RA
LU
TIL
ITIE
SR
EC
& P
AR
KS
DE
VE
LO
PM
EN
TC
OR
PO
RA
TE
FIN
AN
CE
ST
AT
IST
ICS
TR
AN
SIT
&
EM
ER
GE
NC
Y
HIGHLIGHTS FOR 2018 INCLUDE:
• CompletionoftheUVDisinfectionsysteminthe
SanPareilcommunitywatersystem
• ReplacementofwatermainsintheAnchorWay
areaoftheNanoosePeninsula
• ConstructionunderwayonthenewNanoose
BayPeninsulaPumpstation,acriticalelement
oftheEnglishmanRiverWaterService
• CompletionofSCADAplanningstudyforall
communitywatersystems
• ReviewedRDNWaterSystemsprogressagainst
the2013WaterConservationPlantargets–on
tracktomeettargetsacrossallsystems
(observed31%decreaseinwateruseper
connectionsince2004)
KEY INITIATIVES FOR 2019 INCLUDE:
• ReplaceWestBay#3WellinNanooseBay.
• FinalizeSCADAimplementationplan.
• Completeconditionassessmentandlongterm
capitalplanningupdateforallcommunitywater
systemsintheregion.
• CompleteandcommissiontheNanooseBay
PeninsulaPumpStation.
• ImplementaCrossConnectionControlProgram.
• InstallastandbygeneratorattheNanooseBay
WaterTreatmentPlant.
• ReplacewatermainsinNanooseBay
(year5ofa$2.6millionprogramto
replaceoldinfrastructure).
• Drillandcommissionanewgroundwaterwellin
WhiskeyCreekcommunitywatersystem.
• UpdatetheWaterConservationPlanforRDN’s
communitywatersystems.
DRINKING WATER & WATERSHED PROTECTIONTheDrinkingWaterandWatershedProtection
(DWWP)Service(www.dwwp.ca)carriesout
initiativesintendedtoincreasetheknowledgebase
forwaterresourcestohelpprotectsurfaceand
groundwaterresourcesacrosstheregion.
HIGHLIGHTS FOR 2018 INCLUDE:
• Completionofathird-party10-year
implementationreviewoftheDWWP
ActionPlan.
• Analyzedandreportedonsurfacewaterquality
datatrendsobservedoverthepast7yearsof
theCommunityWatershedMonitoring
Networkinacomprehensivereviewthat
includedstreamflow,climateandlanduse.
continuedonfollowingpage...
9COMMUNITY
WATER TREATMENT & DISTRIBUTION
SYSTEMS
3REGIONAL PARK WATER SYSTEMS
6SEWER COLLECTION
SYSTEMS2RAINWATER
MANAGEMENT SYSTEMS 7
STREETLIGHT SERVICE AREAS

R E G I O N A L D I S T R I C T O F N A N A I M O 2 0 1 8 A N N U A L R E P O R Txx
GE
NE
RA
LU
TIL
ITIE
SR
EC
& P
AR
KS
DE
VE
LO
PM
EN
TC
OR
PO
RA
TE
FIN
AN
CE
ST
AT
IST
ICS
TR
AN
SIT
&
EM
ER
GE
NC
Y
• Offeredregion-widerebateprogramsfor
rainwaterharvesting,wellprotection,well
watertesting,efficientoutdoorirrigation
systemsandsoilimprovements.
• TeamWaterSmartprovidedworkshops,field
trips,andcommunitydisplaystoassist
residentsinprotectingandconservingour
waterresources.
KEY INITIATIVES FOR 2019 INCLUDE:
• Inadditiontocontinuingworkinallprogram
areasofeducation,scienceandplanning
support,amajorinitiativeoftheDWWPteam
in2019willbetoformallyupdateitsstrategic
ActionPlantoguideitsfocusandactivitiesfor
thenexttenyears.
ARROWSMITH WATER SERVICE (AWS) AND ENGLISHMAN RIVER WATER SERVICE (ERWS)TheRDN,theCityofParksville,andtheTownof
QualicumBeacharemembersintheAWSjoint
venturewhichoperatestheArrowsmithDam
intheupperEnglishmanRiverwatershed.This
wasestablishedtosupportthefisheriesinthe
EnglishmanRiverandtoprovideasecure,long-term
supplyofsurfacewaterforthetwomunicipalities,
aswellasElectoralAreasE(NanooseBay)andG
(FrenchCreek).
Sincethattime,onlytheCityofParksvilleandRDN
ElectoralAreaE(NanooseBay)havemaintainedan
interestinutilizingthiswatersource.Currently,the
CityofParksvilleusesthiswaterinthesummer,and
providesittotheRDN,toaugmentthegroundwater
supplyinbothareas.Theturbidityinthewater
precludesitsuseatothertimesduringtheyear.To
allowtheuseofthiswateronayear-roundbasis,
asecondjointventureknownastheEnglishman
RiverWaterService(ERWS)hasbeenestablished
betweentheCityofParksvilleandtheRDN
(ElectoralAreaE,NanooseBay)toconstructariver
waterintakeandwatertreatmentfacilityatacost
ofabout$28million.
Commissioningofthenewfacilitiesisexpectedin
late2019.ThiswaterwillflowtoElectoralAreaE
(NanooseBay)viathesoon-to-be-commissioned
NanooseBayPeninsulaPumpStation.
ArrowsmithWaterServiceReservoir

R E G I O N A L D I S T R I C T O F N A N A I M O 2 0 1 8 A N N U A L R E P O R T xxi
GE
NE
RA
LU
TIL
ITIE
SR
EC
& P
AR
KS
DE
VE
LO
PM
EN
TC
OR
PO
RA
TE
FIN
AN
CE
ST
AT
IST
ICS
TR
AN
SIT
&
EM
ER
GE
NC
Y
SolidWasteManagement
SolidWasteplans,policies,programsandfacility
managementareguidedbyaProvincialMinistryof
EnvironmentapprovedSolidWasteManagement
Plan(SWMP).ThefirstSWMPwaspreparedin1988
andwaslastamendedin2009.Theplanreflectsa
longtermvisionofhowtheRegionalDistrictwill
promoteZeroWasteandmanageresidual
wastedisposal.
TheSWMPwasapprovedbytheRegionalBoardfor
approvalinthethirdquarterof2018.
TheRDN’scurrentdiversionisapproximately68%
andapercapitadisposal(landfilled)rateof347
kgperyearisoneoflowestwithinthedeveloped
nationsoftheworld.TheSWMPproposesafurther
increaseinwastediversionwithanambitious
targetof90%overthenext10years.TheSWMPis
currentlywiththeBCMinisterofEnvironmentand
ClimateChangeforapproval.
POLICY AND INTER-JURISDICTIONAL LIAISONSolidWasteServicesstaffcontinuetobeactively
involvedwithanumberofindustrybased
organizations.Theseincludehavingmemberships
with,andinsomecasessittingontheBoards
of,theRecyclingCouncilofBC,theCoastWaste
ManagementAssociation,SolidWasteAssociation
ofNorthAmerica,theAssociationofVancouver
IslandCoastalCommunities,theNationalZero
WasteCouncil,andtheBCProductStewardship
Council.Involvementwiththeseassociationshelps
todevelopandinfluencepoliciestoimprovewaste
diversionandtoincreasetheeffectivenessoflocal
governmentinsustainablymanagingsolidwaste.
59,403 TONNES DISPOSED
13,872 TONNES DIVERTED(RECYCLED,COMPOSTEDORREUSED)

R E G I O N A L D I S T R I C T O F N A N A I M O 2 0 1 8 A N N U A L R E P O R Txxii
GE
NE
RA
LU
TIL
ITIE
SR
EC
& P
AR
KS
DE
VE
LO
PM
EN
TC
OR
PO
RA
TE
FIN
AN
CE
ST
AT
IST
ICS
TR
AN
SIT
&
EM
ER
GE
NC
Y
HIGHLIGHTS FOR 2018 INCLUDE:
School Education
Contract for Zero Waste Education for
gradesK-7SeptembertoDecember
Waste Stream Management Licensing
15 Licensed Facilities2PendingLicensesunderreview
Illegal Dumping
48 tonnesofillegallydumped
materialrecovered&disposed
38CommunityCleanUps
Curbside Collection
Servicefor28,949 householdsforgarbage,recyclingandorganicsforallElectoralAreas,
TownofQualicumBeach,CityofParksville,
andDistrictofLantzville
Zero Waste Communication
Regularcommunicationwithresidentsonrecycling,
compostandwhatgoeswhereviaSocialMedia,
theRDNCurbsideApp,Newslettersand
GetInvolved
KEY INITIATIVES FOR 2019 INCLUDE:
Non-Stewarded Household Hazardous Waste
• RDNwillexploreoptionsforfurtherexpansion
ofcollectionofnon-stewardedresidential
householdhazardouswaste,whichmayinclude
hostingdrop-offeventsorcontractingwitha
serviceprovidertoacceptthematerials.
Expanded Construction and Demolition
Waste Management
• RDNwillimproveandreintroduceeducation
andcommunicationsregardingConstruction
andDemolitionwasteintheregion.
New and Updated Solid Waste Bylaws
• RDNisplanningtoupdatethedefinitionsand
formatoftwoexistingsolidwastemanagement
bylawstoprovideclearerinterpretationand
allowforstrongerenforcementinthefuture.
DependentonapprovaloftheSWMP,theRDNwill
startconsultationonnewregulatorytoolstoassist
withmandatorywastesourceseparation,waste
haulerlicensinganddisposalleviesandreduced
tippingfeesforlicensedhaulers.
GARBAGERECYCLING ORGANICS

R E G I O N A L D I S T R I C T O F N A N A I M O 2 0 1 8 A N N U A L R E P O R T xxiii
GE
NE
RA
LU
TIL
ITIE
SR
EC
& P
AR
KS
DE
VE
LO
PM
EN
TC
OR
PO
RA
TE
FIN
AN
CE
ST
AT
IST
ICS
TR
AN
SIT
&
EM
ER
GE
NC
Y
EngineeringServices
TheEngineeringServicesDepartmentwasformed
in2017withintheRCU.Thedepartmentprovides
engineeringsupporttoRegionalandCommunity
UtilitiesandTransportationandEmergencyServices
withafocusonprojectmanagementofmajor
capitalprojects.
HIGHLIGHTS FOR 2018 INCLUDE:
• Projectmanagementoftheconstructionphase
oftheGreaterNanaimoPollutionControl
CentreSecondaryTreatmentUpgrade.
• PreliminaryEngineeringoftheFrenchCreek
PollutionControlCentreStageIVExpansionand
OdourControlUpgrades.
• EngineeringoftheSeablushFirewaterTank
inNanoose.
KEY INITIATIVES FOR 2019 INCLUDE:
• SubstantialcompletionoftheGreater
NanaimoPollutionControlCentre
SecondaryTreatmentUpgrade.
• ChaseRiverForcemainReplacement
EngineeringandConstruction.
• DetailedEngineeringoftheFrenchCreek
PollutionControlCentreStageIVExpansionand
OdourControlUpgrades.
• ProcessselectionfortheNanooseBay
PollutionControlCentreUpgradeto
SecondaryTreatment.
• BayAvenuePumpStationUpgrade
DetailedEngineering.
• PreliminaryEngineeringfortheGeneratorand
OdourControlUpgradeattheWellington
PumpStation.
• PreliminaryEngineeringfortheGeneratorand
UVDisinfectionSystemUpgradeattheDuke
PointPollutionControlCentre.
COLLABORATIVE PROJECTS:
Chase River Forcemain Replacement
AstheChaseRiverforcemainreplacementislocated
beneathasectionofHaliburtonstreet,requiring
excavationoftheroadway,anopportunitywas
identifiedtopartnerwiththeCityofNanaimo(CoN)
tocoordinateCoNwatermainreplacementandroad
upgradesalongthisstretchofHaliburtonStreet.
Combiningtheseactivitiesintoonecoordinated
constructionprojectallowstheRDNandCoNto
reduceoverallcostanddisruptiontothetaxpayer
bycoordinatingengineering,procurementand
constructionresources.
French Creek Odour Mapping Project
Inordertoincreaseourunderstandingofthe
sourcesofodoursandthedispersioninthe
FrenchCreekarea,theRDNhaspartnered
withtheVancouverIslandUniversity’sApplied
EnvironmentalResearchLaboratoriestoidentify
sourcesandmapthedistributionofodorous
compoundsintheFrenchCreekarea.Thisdatawill
becollectedutilizingVIU’sstateoftheartMobile
MassSpectrometryLaboratory.Informationfrom
thisstudywillassistwiththeengineeringofthe
upgradetotheodourcontrolsystemattheFrench
CreekPollutionControlCentre.
FrenchCreekPollutionControl
CentreStageIVUpgrade

R E G I O N A L D I S T R I C T O F N A N A I M O 2 0 1 8 A N N U A L R E P O R Txxiv R E G I O N A L D I S T R I C T O F N A N A I M O 2 0 1 8 A N N U A L R E P O R Txxiv
Recreation & ParksTom Osborne,GeneralManager
Dean Banman,Manager,RecreationServices
Wendy Marshall,Manager,ParksServices
TheRecreation and Parks Departmentis
responsibleforcreatingandcoordinatingrecreation
programs,operatingrecreationfacilities,and
acquiring,managingandplanningthedevelopment
ofregionalandcommunityparklands.The
membersoftheRegionalDistrictcollaborateina
varietyofcreativewaystoprovidetheirresidents
withhighqualityrecreationalopportunities.
TheRegionalDistrictownsandoperatestwo
recreationfacilities:Oceanside Place,amultiplex/
twinsheetarenalocatedinParksville,andthe
Ravensong Aquatic CentreinQualicumBeach.
Bothfacilitiesprovideresidentswithhighquality
amenitiestoutilizeintheimportantpursuit
ofactiveandhealthyliving.Thefournorthern
ElectoralAreasalsocontributefundingtothe
maintenanceandoperationsofmunicipalsports
fields.TheRegionalDistrictstaffschedulesports
fielduseonbehalfofSchoolDistrict68(Qualicum),
CityofParksvilleandTownofQualicumBeach.
RE
C &
PA
RK
S

R E G I O N A L D I S T R I C T O F N A N A I M O 2 0 1 8 A N N U A L R E P O R T xxv
RecreationServices
TheOceansideRecreationServicesDivision
providesthemajorityofrecreationprogramsfor
allagesinareassuchassummerprogramming,
afterschooldrop-ingymtimes,adultprograms,
participationincommunityspecialevents,preschool
andchildrecreationopportunitiesaswellas
youthprogramminginthearea.Thedivisionalso
supplementsadditionalcommunityrecreation
programminginElectoralAreasFandH.
ThroughRecreationServices,theRDNprovides
fundingtotheGabriolaRecreationSocietyfor
theirmanagementofrecreationopportunitieson
GabriolaIsland.InElectoralAreaA(Cedar/Yellow
Point/Cassidy),grantfundingopportunitiesand
theownershipoftheCedarHeritageCentreare
coordinatedthroughtheElectoralArea’sParks,
RecreationandCultureCommission.
ResidentsinElectoralAreasAandBalsofund
localsouthernrecreationservicesspecifictotheir
communities.Additionally,theyparticipateinfunding
withElectoralAreaCandtheDistrictofLantzvillefor
regionallysignificantrecreationfacilitiesandsports
fieldslocatedintheCityofNanaimo.
Thedepartmentcontinuestopayparticular
attentiontoyouthleadershipdevelopment,assisting
peoplewithdisabilitiesandfamilieswithlower
incomesinattaininghealthyactivelifestyles.
HIGHLIGHTS IN 2018 INCLUDE:
The2019-2029OceansideRecreationServices
MasterPlanwascompletedandapprovedasa
guidingdocumentbytheRDNBoard.TheMaster
PlanwillprovideguidanceintheRDN’srole
andresponsibilitiesinrecreationservicesand
approachestorecreationinfrastructureforthe
communitiesofOceanside.
GE
NE
RA
LU
TIL
ITIE
SR
EC
& P
AR
KS
DE
VE
LO
PM
EN
TC
OR
PO
RA
TE
FIN
AN
CE
ST
AT
IST
ICS
TR
AN
SIT
&
EM
ER
GE
NC
Y
7,300REGISTR ATIONS FOR
ADULT, YOUTH, CHILDREN &
PRESCHOOL PROGR AMS
28,000TOTAL AT TENDANCE FOR
RECREATION PROGRAMS
45 COMMUNIT Y RECRE ATION
PROJEC T S SUPPORTED WITH OVER
$67,000IN GR ANT FUNDING
21,000HOUR S OF SPORT S FIELD &
COURT BOOKINGS
FINANCIAL A SSISTANCE
PROGR AM PROVIDED 170
HOUSEHOLDS CLOSE TO
$31,000 IN FREE ACCESS TO RDN
RECRE ATION SERVICES &
925HOUR S OF SUPPORT FOR
INCLUSION SERVICES
300PROGRAM OPPORTUNITIES

R E G I O N A L D I S T R I C T O F N A N A I M O 2 0 1 8 A N N U A L R E P O R Txxvi
KEY INITIATIVES IN 2019 INCLUDE:
• Completionofthedesignandfeasibilityreport
ontheMeadowoodCommunityRecreation
Centreconstruction.
• Advancementofprojectsidentifiedinthe
OceansideRecreationServicesMasterPlanand
prioritizedbytheOceansideServices
CommitteeandRDNBoard.
• Completionofoveronemilliondollarsin
infrastructureprojectsatOceansidePlaceand
RavensongAquaticCentre.
• Completionofarecreationopportunities
assessmentforolderadults.
• Reviewandupdateonthefeesandcharges
bylawsforOceansidePlaceandRavensong
AquaticCentre.
RavensongAquaticCentre
RavensongAquaticCentreislocatednexttothe
CivicCentreintheTownofQualicumBeach.The
swimmingpoolwasconstructedin1994/1995and
underwentamajorexteriorretrofitandequipment
upgradein2010/2011.
OceansidePlace
Themultiplexarenafacilityopenedin2003andis
attachedtoWembleyCentreatthenorthendofthe
CityofParksvilleonHighway19A.
OceansidePlacehousestwoNHLregulationsized
icesheetsnamedafterlocalhockeyheroHowie
MeekerandiceskatingathleteVictorKraatz.One
ofthemoreuniqueaspectsofthefacilityisthe
circularicesheet/multi-usedryfloorspacenamed
OceansidePond.OceansidePlace,withitsthree
icesheets/dryfloormulti-usespaceandopen-air
atmosphere,isapopularattractionforresidentsof
Oceansideaswellasvisitorstothearea.Thefacility
hostsmanyspecialcommunityeventssuchashigh
schoolgraduationceremonies,homeshows,large
sportcompetitionsandtradeshowstonameafew.
Multipurposerooms,ameetingroom,aconcession,
skateshopandthemainofficefortheRecreation
Servicessectionofthedepartmentareallcentrally
locatedatOceansidePlace.
100,100AT TENDANCE AT
PUBLIC SESSIONS
8,000+HOUR S OF
FACIL IT Y USAGE
20,500 ATTENDANCE AT
PROGRAMS
19,800 ATTENDANCE AT
PUBLIC SESSIONS
RavensongAquaticCentre2018Usage
OceansidePlace2018Usage
GE
NE
RA
LU
TIL
ITIE
SR
EC
& P
AR
KS
DE
VE
LO
PM
EN
TC
OR
PO
RA
TE
FIN
AN
CE
ST
AT
IST
ICS
TR
AN
SIT
&
EM
ER
GE
NC
Y

R E G I O N A L D I S T R I C T O F N A N A I M O 2 0 1 8 A N N U A L R E P O R T xxvii
CommunityParks
EachElectoralAreasupportsthepurchase,
developmentandmaintenanceofneighbourhood
parksthroughanindividualCommunityParks
budget.TheRegionalDistrictobtainsmuchof
itsneighbourhoodparklandthroughdedications
duringthesubdivisionapprovalprocessbutitmay
alsoacceptcashinlieuandpurchaselandthatis
desirabletothecommunity.
Inrecentyears,somecommunityparkshavebeen
developedtoahigherlevelincluding:
• CedarSkatepark(ElectoralAreaA),
• HuxleyPark(ElectoralAreaB),
• ExtensionMinersPark(ElectoralAreaC),
• MeadowDrivePark(ElectoralAreaC),
• MeadowoodWay(ElectoralAreaF),and
• HenryMorganCommunityPark
(ElectoralAreaH).
OtherpopularcommunityparksincludeRollo
McClaysportsfieldandJoyceLockwoodonGabriola
Island,Brickyard(ElectoralAreaE),andErrington
Park(ElectoralAreaF).
HIGHLIGHTS FOR 2018 INCLUDE:
• ParklandincreasedinElectoralAreaBduetoa
densityexchangethatresultedin136.8haof
newcommunityparklandforGabriola.The
landsareadjacenttothe707CommunityPark
andCoatsMarshRegionalPark.
• ThefirstphaseofconstructionatDunsmuir
CommunityPark(ElectoralAreaH)was
completed.Thisincludedanewsportscourt
forbasketball,pickleballandballhockey,
regradinganddrainingthesiteandanew
parkinglot.
• TheupgradeatDriftwoodBeachAccesswas
completed(ElectoralAreaA)andincludeda
trailandsetofstairstothebeach.
• TheconceptdesignfortheErrington
CommunityPark(ElectoralAreaF)was
undertakenandopenhousesheldfor
communityinput.
• GoatswereusedatBlueWaterCommunity
Park(ElectoralAreaG)toclearinvasiveplants.
202COMMUNIT Y
PARK S
748HEC TARES OF L AND
(MOS T OF THEM IN A NATUR AL S TATE)
HuxleyCommunityPark(ElectoralAreaB)
openingceremony
GE
NE
RA
LU
TIL
ITIE
SR
EC
& P
AR
KS
DE
VE
LO
PM
EN
TC
OR
PO
RA
TE
FIN
AN
CE
ST
AT
IST
ICS
TR
AN
SIT
&
EM
ER
GE
NC
Y

R E G I O N A L D I S T R I C T O F N A N A I M O 2 0 1 8 A N N U A L R E P O R Txxviii
KEY INITIATIVES IN 2019 INCLUDE:
• VillageWayPlanning(ElectoralAreaB)
• LittleQualicumHallUpgrades(ElectoralAreaG)
• PlanningforJackBagley(ElectoralAreaE)
• PlanninganddevelopmentofStoneLake
(ElectoralAreaE)
• PlanningforRiversEdgePlaySpace
(ElectoralAreaG)
RegionalPark&Trails
Since2005,theRegionalParksandTrailsplanhas
guidedtheacquisitionandoperationofregional
parklands.TheRegionalParksandTrailsSelect
Committeewillreviewthe2005planin2019/2020
andthenadvisetheRegionalBoardonupdatesthat
reflectwherewehavebeenandouraspirationsfor
parksandtrailsinthefuture.
OurtrailnetworkincludesaportionoftheTrans
CanadaTrailsouthoftheCityofNanaimo,the
MordenCollieryRegionalTrailinElectoralArea
A,theTopBridgeTrailontheoutskirtsoftheCity
ofParksville,thehistoricArrowsmithCPRTrailin
ElectoralAreasCandF,theLighthouseCountry
TrailinElectoralAreaHandtheCoombsto
ParksvilleRailTrail.
TheRegionalParkssystemincludes12parks,two
ofwhicharecampgrounds(oneatHorneLakein
ElectoralAreaHandasecondatDescansoBayon
GabriolaIsland).
HIGHLIGHTS FOR 2018 INCLUDE:
• PlanningwascompletedfortheMountBenson
parkinglotandtheprojecttendered.
ConstructionwillbecompletebyJune2019.
• Anewparkinglotandtrailconnectionwas
completedatTimberlandsRoadforTheGreat
Trail(formerlytheTransCanadaTrail).Grant
fundingintheamountof$30,000was
receivedfromtheRuralDividendsProgram
forthisproject.
• AtBensonCreekFalls,planswerefinalizedfor
facilitiestoaccessthefallsandforacrossing
overBensonCreek.
• Planswerecompletedforabridgereplacement
overtheriverinLittleQualicumRiverRegional
Parkwithconstructionplannedfor2020.
• AgriculturalLandCommissionapprovalwas
receivedfortheproposedbridgecrossingat
NanaimoRiveralongtheMordenColliery
RegionalTrail.Detailedplanningandadditional
approvalsareneededbeforeconstruction
canbegin.
• ThecabinatCoatsMarshRegionalParkwas
removedandthearealefttoreverttomeadow.2,072HEC TARES OF L AND
REGIONAL PARK S & TR AIL S SYS TEM
78KILOME TRES
OF TR AIL S
DunsmuirCommunityPark
(ElectoralAreaH)
GE
NE
RA
LU
TIL
ITIE
SR
EC
& P
AR
KS
DE
VE
LO
PM
EN
TC
OR
PO
RA
TE
FIN
AN
CE
ST
AT
IST
ICS
TR
AN
SIT
&
EM
ER
GE
NC
Y

R E G I O N A L D I S T R I C T O F N A N A I M O 2 0 1 8 A N N U A L R E P O R T xxix
KEY INITIATIVES IN 2019 INCLUDE:
• InitiationoftheParksandTrailsStrategicPlan
• Constructionoftheparkinglotfor
MountBenson
• DesignandapprovalsfortheNanaimo
RiverBridgefortheMordenCollieryTrail
• WaterlineinstallationatMoorecroft
RegionalPark
Parksareacquiredandfinancedinmanyways.
Overtheyears,theRegionalDistricthaspartnered
withTheNatureTrustofBC,DucksUnlimitedand
theNanaimoAreaLandTrust,aswellassecured
Provinciallandgrantsanddedicationsoflandunder
developmentproposals.
MountBensonRegionalParknew
parkinglotconstructionproject
GE
NE
RA
LU
TIL
ITIE
SR
EC
& P
AR
KS
DE
VE
LO
PM
EN
TC
OR
PO
RA
TE
FIN
AN
CE
ST
AT
IST
ICS
TR
AN
SIT
&
EM
ER
GE
NC
Y
MoorecroftRegionalPark

R E G I O N A L D I S T R I C T O F N A N A I M O 2 0 1 8 A N N U A L R E P O R Txxx R E G I O N A L D I S T R I C T O F N A N A I M O 2 0 1 8 A N N U A L R E P O R Txxx
Transit & EmergencyDaniel Pearce, Director
Darren Marshall, Manager,TransitOperations
Catherine Morrison,Manager,
EmergencyServices
TheTransportation and Emergency
Services Departmentoverseesavariety
oftransitoptionsavailabletoresidents
andadministratestheemergencyservices
andprogramsthatkeeppeoplesafe.
Transportation Servicesisresponsiblefor
theplanninganddeliveryofconventional
andcustom(handyDART)transitwithin
theRegionalDistrictofNanaimo.
Emergency ServicesoverseestheEmergency
Programthatmakesprovisionsforthecommunity
intheeventofanyemergencysuchasflooding,
forestfires,orothercatastrophesthatcouldimpact
residents.TheDepartmentalsooverseestheFire
Servicesfunctionwhichisprimarilyresponsible
forfireandrescueservicesintheregion.
TR
AN
SIT
&
EM
ER
GE
NC
Y

R E G I O N A L D I S T R I C T O F N A N A I M O 2 0 1 8 A N N U A L R E P O R T xxxi
TransportationServices
Transitservicesarepaidforbytaxpayersinthe
CityofNanaimo,theDistrictofLantzville,theCity
ofParksville,theTownofQualicumBeach,and
ElectoralAreasA,E,GandH.
ElectoralAreasB,CandFdonotcurrentlyhave
conventionaltransitservicewithintheirareasand,
asaresult,donotcontributethroughpropertytaxes
forconventionaltransitservice–however,residents
inthoseareascanaccessthetransitsystemby
commutingtoanearbycentre.ElectoralAreaB
maintainsalocalizedcommunitybusservice.
Fundingfortransportationservicescomesfroma
combinationoflocalpropertytaxes,transitfares
andpartnershipfundingfromBCTransit.Whilethe
fundingoftransitservicesiscomplex,theservice
itselfisseamlesslyintegrated,providingconnections
togetpeopletowork,educationalinstitutions,
medicalappointmentsandrecreationalfacilities
betweenDeepBayandCedar.
In2014,theTransitdepartment,inconjunction
withBCTransit,completeda25-yearTransitplan
titledthe‘RDNTransitFuturePlan’whichprioritizes
transitinvestmentsandprovidesanimplementation
strategytotransformtoday’snetworkintothe
envisionedfuturenetwork.Theplanforecaststhata
fleetof160busesand400,000servicehourswillbe
requiredtooperatetransitservicesby2039.
CONVENTIONAL TRANSIT
THE RDN TRANSIT SYSTEM OPERATES
AND MAINTAINS:
Conventionaltransitservicerunsseven(7)days
perweekfrom6:00amto12:00amonweekdays
withmodifiedhoursonweekendsandstatutory
holidays.In2018,thesystemprovidedanestimated
3.1 million rides–theprojectionfor2019is3.3
million rides.
HIGHLIGHTS FROM 2018 INCLUDE:
• NextRide,realtimebuslocator,uses
AutomaticVehicleLocation(AVL).
• Attendanceatover12publicevents.
• Howtoridethebustrainingforseniors
andstudents.
• HostedtheBCTransitAnnualConference
inParksville.
• PoetryinTransitinpartnershipwiththe
CityofNanaimo.
GE
NE
RA
LU
TIL
ITIE
SR
EC
& P
AR
KS
DE
VE
LO
PM
EN
TC
OR
PO
RA
TE
FIN
AN
CE
ST
AT
IST
ICS
TR
AN
SIT
&
EM
ER
GE
NC
Y
52CONVENTIONAL NEW FLYER
COMPRESSED NATUR AL
GA S (CNG) BUSES
4ARBOC COMMUNIT Y
DIESEL BUSES
124,000OPERATING HOURS OF
SERVICE ANNUALLY

R E G I O N A L D I S T R I C T O F N A N A I M O 2 0 1 8 A N N U A L R E P O R Txxxii
• SouthNanaimoLocalAreaServicePlan
providedsevenpublicengagementsessions
andanonlinesurveytohearfromthepublicon
theproposedservicechanges.
• Implementedfive(5)RoadSupportAgentswho
respondtoon-roadincidentsandprovide
assistancetotransitdriversandpassengers.
• InpartnershipwithBCTransitandtheCity
ofNanaimo,theRDNappliedforgrantfunding
toupgradethreeexchangesinNanaimo,i.e.,
NorthNanaimo,CountryClubandDowntown
NanaimoExchanges.
KEY INITIATIVES FOR 2019 INCLUDE:
• InJanuary2019,theconventionaltransit
systemimplementedanexpansionof
5,000 annual service hours to Route #40 VIU Express. Thisexpansionwillassistin accommodatingthehighvolumeofridership
currentlyexperiencedonthe#40VIUExpress.
Thisrouteservesasamajorrunforresidents,
studentsandvisitorstoVIUandmajor
destinationswithinNanaimo.
• TheSouthNanaimoLocalAreaTransitPlanis
expectedtobecompletedbysummer2019.
Thisplanwilloutlinesoutherntransitpriorities
forthenextseven(7)years.
• TheNorthRDNTransitPlanwillbeinitiated
inthefallof2019.Publicengagementswill
reviewthenorthernroutestructures,
frequencies,infrastructureandcommunity
planstoalignthenextseven(7)yearswith
theTransitFuturePlanandareagrowthand
development.
• InpartnershipwithBCTransitandwithfunding
fromtheFederalGovernment,wewillbe
seekingproposalstoreplacethecurrentGFI
FareboxestoaddFarePaymentTechnology.
Thisnewtechnologywillallowcustomersthe
optiontopaywithcash,mag-stripe(swipe)or
NFC(tapwithamobiledevice).
TheimportanceoflinkingVancouverIsland
communitiestogetherbyinter-regionaltransit,as
wellasothermodesoftransportation,iscrucial
forVancouverIsland’seconomicgrowth.TheRDN
putforwardaresolutiontotheAVICCrequesting
thattheProvincecreateaVancouverIslandMaster
TransportationPlanthatincludesinter-regional
transitsolutions.Thisresolutionwasendorsedby
AVICCandwillbeincludedintheUBCMrequested
resolutionsattheannual2019conference.
GE
NE
RA
LU
TIL
ITIE
SR
EC
& P
AR
KS
DE
VE
LO
PM
EN
TC
OR
PO
RA
TE
FIN
AN
CE
ST
AT
IST
ICS
TR
AN
SIT
&
EM
ER
GE
NC
Y

R E G I O N A L D I S T R I C T O F N A N A I M O 2 0 1 8 A N N U A L R E P O R T xxxiii
CUSTOM TRANSIT (HANDYDART) TheCustomTransitservicehasafleetof14ARBOC
lowflooraccessiblelightdutybusesoffering
maximumflexibilitytopersonswithdisabilities.
Intheregion,90%ofcustomtransithoursare
providedtocustomerswholiveintheCityof
Nanaimo,DistrictofLantzvilleandElectoralAreasA
(Cedar)andC(PleasantValley).Customtransitisalso
providedforresidentsinElectoralAreasG(French
Creek),E(Nanoose),CityofParksvilleandTownof
QualicumBeach.Customtransitserviceisavailable
onSaturdaysandSundaysinthesouthernpartofthe
region–mainlywithintheCityofNanaimo.
HIGHLIGHTS FROM 2018 INCLUDE:
• Staffundertookpublicconsultationsto
highlighttheavailabilityoftheCustomTransit
service.Specifically,staffwenttogrouphomes,
not-for-profitsandbusinessesthroughoutthe
RDN,Nanaimo,ParksvilleandLantzville
promotingCustomTransit.Thispublic
engagementprocessresultedintheadditionof
weekdayeveningserviceforhandyDART.
KEY INITIATIVES FOR 2019 INCLUDE:
• ImplementtheCustomCancelationPolicy.
• ReviewtherevisedCustomTransitPolicy.
• Internalreviewofdispatchsoftwaretocreate
furtherefficiencies.
EmergencyServices
RDNEmergencyServicesprimarilysupportstwokey
areasofresponsibilityfortheregionincludingthe
EmergencyProgramandFireServices.
EMERGENCY PROGRAMTheRegionalDistrictofNanaimo’sEmergency
Programfocusesondevelopingandimplementing
emergencymanagementstrategiesandpractices
formitigation,preparedness,response,and
recoveryfromemergenciesanddisastersthat
impactresidentsandcommunitiesintheregion.
Theprogrampromotesawarenessandtraining
inemergencypreparednessfortheRDNas
anorganization,trainingandcoordinationof
emergencyprogramvolunteers,andpromoting
personal,neighbourhoodandorganizational
emergencypreparednessthroughouttheRegional
DistrictofNanaimo.
GE
NE
RA
LU
TIL
ITIE
SR
EC
& P
AR
KS
DE
VE
LO
PM
EN
TC
OR
PO
RA
TE
FIN
AN
CE
ST
AT
IST
ICS
TR
AN
SIT
&
EM
ER
GE
NC
Y
68,000
25,317
RIDES
(2019 IS PROJEC TED AT 69,000 RIDES)
HOUR S OF SERVICE

R E G I O N A L D I S T R I C T O F N A N A I M O 2 0 1 8 A N N U A L R E P O R Txxxiv
HIGHLIGHTS FROM 2018 INCLUDE:
• ThedevelopmentofamobileEmergency
SupportServices(ESS)trailerthatcanbesetup
anywheretosupportresidentsdisplacedfrom
theirhomes.
• EnhancementstotheRDNEmergency
OperationsCentrereadinesswithadditions
toourcommunications,GIS,andfieldreporting
capabilities.
• TheNationalDisasterMitigationProgram
(NDMP)regionalfloodriskassessmentproject
toenablefuturemitigationmeasures.
• Publiceducationactivitiesincludingthe
EmergencyPreparednessExpo,Emergency
PreparednessWeek,FarmersMarkets,
communitydisplaysandotherevents.
• ThecreationofaNeighbourhoodEmergency
PreparednessProgram(NEPP)handbook,Get
InvolvedRDNpageaswellasfacilitated
workshopsandmeetingstoencourageNEPP
engagement.
• PromotionoftheConnectRocketEmergency
NotificationSystemwithagrowthof500%
from2017.
• EOCtrainingandexercisesforstaffincluding
PolicyGrouptrainingandtabletopexercises.
• RenewedagreementswithReceptionCentre
sitesandlivestockshelteringsitestosupport
preparedness,responseandrecoveryefforts
duringanemergencyordisaster.
• Recruitment,trainingandappreciationevents
forESSandEmergencyCommunicationTeam
volunteers.
In2019,theEmergencyProgramwillbefocusing
onanumberofprojectsinadditiontoitsongoing
emergencypreparednessprograms,including:
• EmergencyPlanandEmergencyMeasures
bylawreviewandupdate.
• EvacuationRoutePlanningforAreaE,
Snaw-Naw-AsFirstNationsandtheDistrict
ofLantzville.
• FireSmarttrainingforFireDepartment
membersandresidentsincludingFireSmart
homeassessments.
• EOCactivationreadinesswithtrainingand
exercisesandtheadditionofanEmergency
CommunicationsTrailer.
• Communityoutreachwiththeemergency
preparednessexpo,preparednessevents,social
mediaandpublicengagementplatforms.
• Continuousimprovementofgenerator
maintenanceandinstallationprogramfor
receptioncentresandbusinesscontinuity.
• ESSdevelopmentandrecruitmentincluding
emergencysupplieragreements.
• ApplyingforUBCMCommunityEmergency
PreparednessFundgrantstosupportupdates
totheCommunityWildfirePreparednessPlans.
AspartoftheEmergencyProgramandin
collaborationwithTransportationServices,an
additionalareaofresponsibilityincludesthe
managementoftwowharvesonGabriolaIsland
forusebyfirstrespondersformedicalevacuations
andotherrelatedneeds.Oneofthesewharves
issituatedinDescansoBayadjacenttotheferry
terminalandtheotherisGreen’sLandingWharf,
whichisavitalemergencyandtransportationlink
withMudgeIsland.
GE
NE
RA
LU
TIL
ITIE
SR
EC
& P
AR
KS
DE
VE
LO
PM
EN
TC
OR
PO
RA
TE
FIN
AN
CE
ST
AT
IST
ICS
TR
AN
SIT
&
EM
ER
GE
NC
Y

R E G I O N A L D I S T R I C T O F N A N A I M O 2 0 1 8 A N N U A L R E P O R T xxxv
FIRE SERVICESTheRegionalDistrictisprimarilyresponsibleforfire
andrescueservicesprovidedbysixvolunteerfire
departments,including:
Extension ElectoralAreaC
NanooseBay ElectoralAreasE,F,G
Errington ElectoralAreasF,G
Coombs-Hilliers ElectoralAreaF
Dashwood ElectoralAreasF,G,H
BowHornBay ElectoralAreaH
TheRegionalDistrictalsomaintainsfireprotection
agreementswiththeCityofNanaimoforEast
Wellington/PleasantValley(ElectoralAreaC),the
CityofParksvilleandTownofQualicumBeachfor
FrenchCreek/SanPareil(ElectoralAreaG)and
theCranberryFireDistrictforCassidy/Spruston/
TimberlandsRoad(ElectoralAreasAandC).
ThevolunteerfiredepartmentswithintheRDN’s
jurisdictioncontinuetobeoperatedthrough
agreementswithlocalsocietiesforthefireservice
area.Thesocietiesmanagetheoperationofthefire
departmentandworkwiththeRDNonmaintaining
andupdatingbuildingsandequipmentwhenneeded.
In2016,theRegionalDistrictcompletedareview
ofruralfireservicedelivery.Thereviewidentified
numerousrecommendationstoimprovetheRDN’s
managementoffireserviceswithintheregion.
Mostfireserviceareasdonothavefirehydrantsand
dependontankersandabovegroundwatertank
installationstosupplywaterforfiresuppression.
MutualAidandAutomaticAidAgreements
providecross-jurisdictionalsupportforadditional
equipmentandwaterresourceswhenneeded.In
someareas,whenwatercanbesuppliedtoacertain
capacity,thefiredepartmentshaveSuperiorShuttle
Tendercertification,benefittingresidentsthrough
enablinglowerfireinsuranceratessimilartoif
hydrantswereavailablenearby.
Regulatoryrequirementsfortrainingandsafety
standardswithinthefireservicehavedramatically
growninrecentyears.Thesechangeshaveplaced
increasingresponsibilityuponthefiredepartments,
localsocieties,andtheRDNtoeffectivelyresource
andmanagefireservices.Asaresult,costs
associatedwithfireserviceshaveincreasedforall
departmentsintheregion,likethemajorityoffire
departmentsacrosstheprovince.Inlate2016,the
RDNaddedafull-timeFireServicesCoordinator
toassistandsupporttheRDNVolunteerFire
Departmentsintheseresponsibilitiesandto
implementtherecommendationsoftheFire
Servicesreview.
GE
NE
RA
LU
TIL
ITIE
SR
EC
& P
AR
KS
DE
VE
LO
PM
EN
TC
OR
PO
RA
TE
FIN
AN
CE
ST
AT
IST
ICS
TR
AN
SIT
&
EM
ER
GE
NC
Y

R E G I O N A L D I S T R I C T O F N A N A I M O 2 0 1 8 A N N U A L R E P O R Txxxvi
HIGHLIGHTS FROM 2018 INCLUDE:
• FormalizedregularRegionalFireChiefsmeetings.
• CompletionofstandardizedOperational
Guidelinesforthesix(6)RDNFireDepartments.
• Identificationofsitesforalternatewater
sourcestoareasofNanooseBay.
• CommencedtheprojecttoreplacetheCoombs
FireDepartmentwatertank.
• FinalizedtheRDNFireDepartmentOperational
Health&Safetyprogramthatmeetsregulatory
requirements.
• Coordinatedwithlocalfiredepartments
regardingpurchasingnewfiretrucks.
• Coordinatedwithseveralfiredepartmentsfor
capitalplanningforfuturefirehallupgrades.
KEY INITIATIVES FOR 2019 INCLUDE:
• InstallationofawaterstoragetankinNanoose
Bayandidentificationoffuturesiteswitha
reviewofoptionstofundandstreamlinewater
tankinstallations.
• ContinuetheprojectwiththeDashwoodFire
Departmentforthereplacementofthe
Dashwoodmainfirehall.
• Supporttheprojecttodevelopalong-range
planforgovernance,structureand
administrationoftheRDNFireServices.
• CompletephasetwooftheCoombswatertank
replacementwhichincludesupgradestothe
mainelectricalsystem.
• CollaboratewithStrategicPlanningwithrespect
toWildfireUrbanInterfacemitigationplanning.
• ReviewtheimplicationsofthenewFireSafety
Actanddevelopaprocesstocomplywithnew
requirements.
• ReviewoptionstostandardizeFireDepartment
membercompensation.
• Developrecruitment,retentionandrecognition
programforFireDepartmentvolunteers.
GE
NE
RA
LU
TIL
ITIE
SR
EC
& P
AR
KS
DE
VE
LO
PM
EN
TC
OR
PO
RA
TE
FIN
AN
CE
ST
AT
IST
ICS
TR
AN
SIT
&
EM
ER
GE
NC
Y

R E G I O N A L D I S T R I C T O F N A N A I M O 2 0 1 8 A N N U A L R E P O R T xxxviiR E G I O N A L D I S T R I C T O F N A N A I M O 2 0 1 8 A N N U A L R E P O R T xxxvii
Strategic & Community Development
TheStrategic and Community Development
Departmentoverseesarangeoffunctionsthat
ensurebothshortandlong-termdevelopment
occursresponsiblyandconsistentlywithin
theRegionalDistrictofNanaimo.
Current Planningisresponsibleforthereviewand
processingofalldevelopmentrelatedapplications
withinsixoftheElectoralAreas(A,C,E,F,G
andH)andprovidesadvicetotheBoardandits
committeeswithrespecttoplanningrelatedissues.
PlanninganddevelopmentforElectoralAreaB
isoverseenbytheIslandsTrust.Thedepartment
respondstoinquiriesfromthegeneralpublic,
externalagenciesanddevelopersregarding
applicationandevaluationprocesses,policiesand
procedures.CurrentPlanningalsoprovidesadvice
andadministrativesupporttotheBoardofVariance
andtheAgriculturalAdvisoryCommittee.
Long Range Planningcoordinatesthereviewand
implementationofOfficialCommunityPlansforthe
ElectoralAreasandtheRegionalGrowthStrategy,which
istheguidingmasterplanningdocumentforthewhole
RegionalDistrict.LongRangePlanningalsocoordinates
communityandcorporatesustainabilityinitiatives.
Building and Bylaw Servicessupportsandenhances
thehighqualityoflifeenjoyedbyresidentsofthe
RDN.Building Inspectionadvisesontheissuingof
buildingpermitsandinspectsconstructionwithin
theElectoralAreasoftheRegionalDistrict.The
departmentalsoprovidesbuildingpermitand
inspectionservicesundercontracttotheDistrict
ofLantzville.Bylaw Servicesstaffrespondtonoise,
nuisanceandarangeoflandusecomplaintsaswell
asconcernsregardingdangerousdogsatlargein
theElectoralAreasandtheDistrictofLantzville.
Strategic Initiativesiscomprisedofthreekey
functions:StrategicInitiatives,Intergovernmental
LiaisonandAssetManagement.Theseareas
governcorporatestrategicplanningbothinternally
andwithexternalagenciesandFirstNations,and
ensuretheorganizedplanning,maintenance,
andreplacementoftheregion’sassetbase.
DE
VE
LO
PM
EN
T
Geoff Garbutt, GeneralManager
Paul Thompson, Manager,CurrentPlanning
Kim Fowler, Manager,LongRange
Planning,EnergyandSustainability
Tom Armet,Manager,BuildingandBylawServices
Chris Midgley, Manager,Strategic
InitiativesandAssetManagement

R E G I O N A L D I S T R I C T O F N A N A I M O 2 0 1 8 A N N U A L R E P O R Txxxviii
GE
NE
RA
LU
TIL
ITIE
SR
EC
& P
AR
KS
DE
VE
LO
PM
EN
TC
OR
PO
RA
TE
FIN
AN
CE
ST
AT
IST
ICS
TR
AN
SIT
&
EM
ER
GE
NC
Y
CurrentPlanning
In2018,thedepartmentprocessedthefollowing
developmentapplications:
Thedepartmentcontinuestoprovideaccurate
informationinatimelymannertotheBoardandthe
generalpublicandtocompleteapplicationswithin
establishedprocessingtimelines.
KEY INITIATIVES IN 2019 INCLUDE:
• SubdivisionServicingBylawreview.
• TargetedBylaw500review.
• SignBylawreview.
LongRangePlanning
TheRegionalGrowthStrategy(RGS)containsthe
visionformaintainingtheregion’squalityoflife
andincludesgoalsandpoliciesregardingwhere
toencourageurbandevelopmentandatthesame
timeprotectthenaturalenvironment.Themost
recentversionoftheRGSisfoundinBylawNo.
1615,whichwasadoptedbytheRegionalBoardin
November2011.
HIGHLIGHTS FOR 2018 INCLUDE:
• AnnualprogressreportonRGSimplementation.
• Completionofdevelopmentpermitarea
consolidationandstreamliningproject.
• ParticipationintheOceansideHealthand
WellnessNetwork.
• Completionofpublicationofresourceson
housingandagriculture.
• CompletionofPhase1ofCoastal
FloodplainMaps.
KEY INITIATIVES OVER THE NEXT THREE
YEARS INCLUDE:
• InitiatingareviewoftheRegional
GrowthStrategy.
• Continuetoassistcoastalcommunitiesin
preparingforchangingsealevels.
• InitiatingareviewoftheElectoralAreaFOCP.
• Advancinghousingaffordabilityintheregion.
2018
2018
2018
2018
2018
2017
2017
2017
2017
2017
REZONING/OCP
AGRICULTUR AL L AND
RESERVE
SUBDIVIS ION
L IQUOR / C ANNABIS
L ICENSE
DE VELOPMENT
PERMIT/VARIANCE
BOARD OF VARIANCE
APPE AL
12
11
29
5
95
17
10
5
25
104
16
2018

R E G I O N A L D I S T R I C T O F N A N A I M O 2 0 1 8 A N N U A L R E P O R T xxxix
GE
NE
RA
LU
TIL
ITIE
SR
EC
& P
AR
KS
DE
VE
LO
PM
EN
TC
OR
PO
RA
TE
FIN
AN
CE
ST
AT
IST
ICS
TR
AN
SIT
&
EM
ER
GE
NC
Y
ENERGY AND SUSTAINABILITY EnergyandSustainabilitytransitionedintothe
responsibilitiesofLongRangePlanningin2016.
Theroleistocoordinateinitiativesthatenhance
communityandcorporatesustainabilitybytaking
strategicapproachestoclimatechange,energy
managementandcommunityself-sufficiency.
HIGHLIGHTS FOR 2018 INCLUDE:
• Continueddeliveryofthesuccessfulgreen
buildingincentiveprogramandworkshop
series,with$36,600 in incentivesprovided toresidentsoverthecourseoftheyear.
• HostedtwoBCEnergyStepCodeeventsfor
localgovernmentstaffandelectedofficials.
KEY INITIATIVES IN 2019 INCLUDE:
• SupporttransitiontotheBCEnergyStepCode.
• Continueddeliveryofthegreenbuilding
incentiveprogramandworkshopseries.
ECONOMIC DEVELOPMENTIn2017,theRegionalDistrictofNanaimoentered
intoanagreementwiththeGabriolaIslandChamber
ofCommercetoprovideEconomicDevelopment
forElectoralAreaB.Theagreementprovides
$65,000peryeartotheChamberandrunsuntil
March31,2020.
TheDistrict69membersadministertheNorthern
CommunityEconomicDevelopmentProgram,
allocating$50,000in2018towardeconomic
developmentprojectsinElectoralAreasE,F,G
andH,andthecommunitiesofParksvilleand
QualicumBeach.
Projectsandorganizationssupportedthroughthe
NorthernCommunityEconomicDevelopment
programin2018were:
• FamiliarizationTour-LighthouseCountry
BusinessAssociation.
• DeepBayInfoBooth-LighthouseCountry
BusinessAssociation.
• SocialMediaNinja-QualicumBeachChamber
ofCommerce.
• BrantViewingPlatform-QualicumBeach
StreamkeepersSociety.
• MidIslandTechForumStrategy-Parksvilleand
DistrictChamberofCommerce.
• LocalEntrepreneurshipAcceleratorProgram-
CommunityFuturesCentralIsland.
• TechSavvyTalk&LeadersRoundtable-
InnovationIslandTechnologyAssociation.
• BladeRunners-CentralVancouverIslandJob
OpportunitiesBuildingSociety.
KEY INITIATIVES IN 2019 INCLUDE:
• ContinuedadministrationofNorthernand
SouthernEconomicDevelopmentServices.
• Reviewpossibilityofcreatingaregional
economicdevelopmentservice.

R E G I O N A L D I S T R I C T O F N A N A I M O 2 0 1 8 A N N U A L R E P O R Txl
GE
NE
RA
LU
TIL
ITIE
SR
EC
& P
AR
KS
DE
VE
LO
PM
EN
TC
OR
PO
RA
TE
FIN
AN
CE
ST
AT
IST
ICS
TR
AN
SIT
&
EM
ER
GE
NC
Y
Building&BylawServices
BUILDING INSPECTION
ConstructionintheRegionalDistrict’sElectoral
Areasconsistsmostlyofsingle-familydwellings,
withasmallnumberofmulti-family,commercial
andindustrialprojects.
Thedevelopmentclimatecontinuedtobequite
robustin2018.
KEY INITIATIVES IN 2019 INCLUDE:
• PublicrolloutofOn-LinePortalforbuilding
permitapplicationsandinspectionscheduling.
• BuildingBylawreview.
• Enhancementofinternalpermitapproval
processesutilizingelectronicplansreviews.
Thedepartment’swebpageprovidesinformation
onpermitrequirements,owner-builderlinks,zoning
andrelatedinformationthatassistsinstreamlining
thepermitapplicationprocess.Thepubliccanalso
accessbuildingpermitstatisticsonlineandsubmit
somedocumentsbyemail,reducingtheneedto
mailorpersonallydeliverpermitdocumentation.
BYLAW ENFORCEMENTTheinvestigationofRegionalDistrictbylaw
contraventionscanbecomplexandoftenrequires
stafftoassumeacoordinatingrolewithother
agenciessuchastheRCMP,AgriculturalLand
Commission,andFederalFisheriesandConservation
Officers.Topromotepositiveworkingrelationships
withtheseagencies,BylawEnforcementstaff
regularlyparticipateininter-agencytrainingand
meetings.BylawEnforcementstaffalsoprovide
supporttotheRegionalDistrict’sEmergency
Program.
BylawEnforcementcomplaintscontinuetoincrease
yearafteryear,keepingBylawEnforcementofficers
busywithsometimescomplicatedandtime
consuminginvestigations.
KEY INITIATIVES IN 2019 INCLUDE:
• IntroductionofBylawNoticeticketingbylaw.
• ImplementationofaBylawDispute
AdjudicationsSystem.
• Overallbylawenforcementservicesreview.
TheBylawServicescomponentoftheRegional
District’swebsiteincludescomprehensive
informationonRegionalDistrictregulationsand
allowsthepublictosubmitcomplaintsonline.
857
$1.7M
21% INCRE A SE FROM 2017
7% INCRE A SE FROM 2017
$129.8M
BUILDING PERMIT APPLIC ATIONS
CONSTRUC TION VALUE
OF PERMIT S
IN PERMIT RE VENUES

R E G I O N A L D I S T R I C T O F N A N A I M O 2 0 1 8 A N N U A L R E P O R T xli
GE
NE
RA
LU
TIL
ITIE
SR
EC
& P
AR
KS
DE
VE
LO
PM
EN
TC
OR
PO
RA
TE
FIN
AN
CE
ST
AT
IST
ICS
TR
AN
SIT
&
EM
ER
GE
NC
Y
StrategicInitiativesandAssetManagement
TheStrategicInitiativesDepartmentiscomprised
ofthreekeyfunctions:StrategicInitiatives,
IntergovernmentalLiaisonandAssetManagement.
Thepurposeofthedepartmentistodevelop,
coordinateandimplementplans,policiesand
programsassociatedwithcorporatestrategic
planning,operationalmonitoringandreporting,
organizationaldevelopment,corporateasset
management,andintergovernmentalrelations,
includingFirstNationsengagement.
STRATEGIC INITIATIVESHIGHLIGHTS FROM 2018 INCLUDE:
• CompletedtheRDN’sAnnualOperational
Report,whichlinksannualdepartmentalwork
plansandthe5-yearFinancialPlanwiththe
BoardStrategicPlan.
• Coordinatedtheannualreviewandupdateof
theBoardStrategicPlan.
• ContinuedanongoingOrganizational
Developmentprogramwithsessionsfocusedon
communication,leadershipandinnovation.
KEY INITIATIVES IN 2019 INCLUDE:
• AdoptionofanewBoardStrategicPlan,
followingtheelectionofalargelynewRDN
BoardofDirectors.
• CompletionofanewAnnualOperational
Reportaligningthe2019workprogramtoa
newStrategicPlan.
INTERGOVERNMENTAL LIAISONTheIntergovernmentalLiaisonfunctionassists
RDNStaffandDirectorswithcoordinationoftheir
activitieswithexternalgovernmentsandagencies
andFirstNations.
HIGHLIGHTS FROM 2018 INCLUDE:
• UnveiledfourartpiecesintheRDNMain
AdministrationBuildingaspartofCoastalFirst
NationsArtProject.
• SupportedBoardinvolvementinAVICC,UBCM
andFCMconferences.
• Coordinatedministerialmeetingswith
Ministersandseniorbureaucratswithinthe
ProvincialGovernment.
• AssistedstaffacrosstheorganizationwithFirst
Nationsengagementactivities.
KEY INITIATIVES IN 2019 INCLUDE:
• AdvancingProtocol,Cooperation,andServicing
AgreementswithQualicum,Snaw-Naw-Asand
SnuneymuxwFirstNations.
continuedonfollowingpage...
75%INCRE A SE IN REPORTING OF
BYL AW COMPL AINT ISSUES OVER
THE PA ST 5 YE AR S
560INDIVIDUAL COMPL AINT S
INVESTIGATED
WORK CONTINUES ON THE
IMPLEMENTATION OF A
BYL AW DISPUTE
ADJUDIC ATIONS SYSTEM.

R E G I O N A L D I S T R I C T O F N A N A I M O 2 0 1 8 A N N U A L R E P O R Txlii
GE
NE
RA
LU
TIL
ITIE
SR
EC
& P
AR
KS
DE
VE
LO
PM
EN
TC
OR
PO
RA
TE
FIN
AN
CE
ST
AT
IST
ICS
TR
AN
SIT
&
EM
ER
GE
NC
Y
• Supportingdepartmentalengagementwith
FirstNations.
• Completionofamulti-yearFirstNations
EngagementStrategyorientedaroundtheTruth
andReconciliationCommission’sCallstoAction.
• FacilitatingdialoguebetweenRDNDirectors
andProvincialministries,particularlythe
MinistryofTransportationandInfrastructure.
ASSET MANAGEMENTTheobjectiveoftheRDN’sCorporateAsset
ManagementProgramistoestablishconsistent
organization-widepracticesforplanning,managing
andreplacinginfrastructureassetstoensure
ongoingandeffectiveservicedelivery,employinga
fulllifecycleapproach.
HIGHLIGHTS FOR 2018 INCLUDE:
• CompletionoftheRDNsfirstorganization-wide
assetmanagementreviewandimplementation
report,outliningthefullreplacementvalue
andprojectedreplacementdatesof
infrastructureassetsforallrelevantservicesin
theRDN.
• Acomparisonofannualcapitalinvestmentto
annuallifecyclereplacementcostsonaservice-
by-servicebasis.
• Establishedacommonconditionassessment
regimefortheorganization.
KEY INITIATIVE FOR 2019:
• Initiateamajor,provinciallyfunded
ReplacementCostStudyforRDNassets.

R E G I O N A L D I S T R I C T O F N A N A I M O 2 0 1 8 A N N U A L R E P O R T xliii
CO
RP
OR
AT
E
R E G I O N A L D I S T R I C T O F N A N A I M O 2 0 1 8 A N N U A L R E P O R T xliii
Corporate Services
TheCorporateServicesDepartmentliaiseswith
citizens,externalagencies,staffofthemember
municipalitiesandotherRegionalDistrict
stafftostrengthenandsupporttheregional
federation.CorporateServicesisoftenthefirst
pointofcontactforcitizensseekinginformation
andassistancefromtheRegionalDistrict.
CorporateServicesisoneofthemostdiverseservice
departmentsintheRegionalDistrict.Itoverseesand
coordinatesthelegislativebusinessoftheRegional
Districtandensurestheefficientfunctioningofthe
districtofficesviaeachoftheseserviceareas:
• AdministrativeServices
• CorporateCommunications
• HumanResources
• InformationTechnology
• GeographicInformationServices
• Finance
Delcy Wells, General ManagerJeannie Bradburne, Director, FinanceJacquie Hill, Manager, Administrative ServicesGary Jurasek, Manager, Information ServicesJim Tait, Manager, Human ResourcesChristina Gray/Lisa Moilanen,
Communications Coordinator

R E G I O N A L D I S T R I C T O F N A N A I M O 2 0 1 8 A N N U A L R E P O R Txliv
GE
NE
RA
LU
TIL
ITIE
SR
EC
& P
AR
KS
DE
VE
LO
PM
EN
TC
OR
PO
RA
TE
FIN
AN
CE
ST
AT
IST
ICS
TR
AN
SIT
&
EM
ER
GE
NC
Y
AdministrativeServices
AdministrativeServicesprovidesgeneralsupport
totheBoard,overseespreparationofBoard
andCommitteeagendasandminutes,manages
allaspectsofreferendums,electorapproval
andgeneralelections,andcoordinatesrecords
managementincludingbylawsandagreements.
AdministrativeServicesalsoprocessesapplications
forSpecialEventPermitsandrequestsmadeunder
theFreedomofInformationandProtectionof
PrivacyAct.
HIGHLIGHTS FROM 2018 INCLUDE:
• Completedtheimplementationofcloud-
basedmeetingmanagementsoftwareacross
theorganization.Thisautomatesand
streamlinesthecompletemeetingcycleand
enables‘paperless’meetingsandagendas.
• PublicresourcesregardingFreedomof
Informationrequestsweredeveloped
andenhanced.Thisincludedtheprovisionof
acomprehensivelistofrecordsthatare
routinelyaccessiblewithoutaformalrequest
whichisavailableontheRegionalDistrict
websitetoinformandassistthepublic.
• Conductedapetitionprocesstoextendthe
boundariesoftheDashwoodFireProtection
ServiceAreatoincludeadditionalproperties.
• Conductedthe2018generallocalelections.
KEY INITIATIVES FOR 2019 INCLUDE:
• ConductinganAlternativeApprovalProcess
toobtainelectorapprovalfortheDashwood
FireHallServiceEstablishmentandLoan
AuthorizationBylawsforconstructionofa
newFireHall.
• Conductingapetitionprocessforexpansionof
theSanPareilWaterServiceAreaandrelated
capitalborrowingforthosepetitioningtojoin
theservice.
• Conductingapetitionprocesstoextendthe
boundariesoftheBowHornBayFireProtection
ServiceAreatoincludeadditionalproperties.
CorporateCommunications
TheCommunicationsDepartmentdevelopsand
supportscommunicationsstrategiesandoversees
productionofcorporatepublicationsandnews
releases.Communicationsalsomanagesconsistent
useoftheRDNbrand,overseestheeffective
useandcontinuousgrowthofwebbasedtools
includingallRDNsocialmedia,onlineengagement
platformsandtheintranet.Communicationsisthe
keyliaisonwithlocalmediaandworkscloselywith
communicationsstaffatotherlevelsofgovernment
andpartneragencies.
HIGHLIGHTS FROM 2018 INCLUDE:
• Improved,consistentuseofsocialmediato
shareinformationwithresidents,particularly
duringactiveEmergencyOperationsCentres.
• Publishedmonthlynewspaperadsinthreelocal
paperstosharetimelyandrelevantinformation
onRDNprojects,initiativesand
communityevents.

R E G I O N A L D I S T R I C T O F N A N A I M O 2 0 1 8 A N N U A L R E P O R T xlv
GE
NE
RA
LU
TIL
ITIE
SR
EC
& P
AR
KS
DE
VE
LO
PM
EN
TC
OR
PO
RA
TE
FIN
AN
CE
ST
AT
IST
ICS
TR
AN
SIT
&
EM
ER
GE
NC
Y
• Createdconsistentbrandedadvertising
templatesforstafftouseforallnewspaper
adstoassistresidentsinlearningmoreabout
RDNprojectsandinitiatives.
• ContinuedgrowthanduseofGetInvolved
RDN,https://www.getinvolved.rdn.ca/ an
onlineengagementtooltocomplementin-
personengagementopportunities,ina
continuedefforttoshareinformationwith
residents.
KEY INITIATIVES FOR 2019 INCLUDE:
• HiringofanEngagementCoordinatorto
provideadditionalsupporttostaffon
communityengagement,socialmediaand
internalengagement.
• Revisionofthecommunicationand
engagementpoliciesanddevelopmentof
anengagementstrategy/workbooktoensure
consistentunderstanding,expectationsanduse.
HumanResources
TheHumanResourcesteamisresponsible
forprovidinginnovativeandprogressiveHR
leadershipinamannerthatpositivelyinfluences
theengagement,developmentandproductivityof
ouremployeesacrosstheorganization.Targeted
serviceareasincluderecruitmentandselection,
labourrelations,health,safetyandwellness,
corporatetrainingandcompensationandbenefits.
HIGHLIGHTS FROM 2018 INCLUDE:
• Successfullynegotiatedanew3-yearcontract
withCUPEtoensurethecontinuationof
effectiveservicedeliveryforthecommunity.
• Providedenhancedleadershipandgreater
emphasisonthedevelopmentand
implementationofacomprehensive
OccupationalHealthandSafetyProgram.
KEY INITIATIVES FOR 2019 INCLUDE:
• ImplementationofaRecruitmentCandidate
ManagementSystemtostreamlineworkflows
andimprovetheexperienceforprospective
applicantsinterestedinestablishingacareer
withtheRDN.
• Conductacurrentconditionassessmentof
knownhazardousmaterialsanddevelop
updatedworkproceduresthatalignwithhealth
andsafetyprioritiesfortheorganization.
InformationTechnology(IT)&GeographicInformationServices(GIS)
TheITandGISdepartmentoverseesandprovides
technologyandtelecommunicationssupportin
additiontodeliveringgeographicinformation
services.InformationtechnologyandGISservices
areprovidedregionallyfromthecorporatehead
office.Thedepartmentcontinuallystrivesto
ensureuninterruptedservicetoRDNapplications
andtoincreaseorganizationalefficiencythrough
technologyimprovementswithafocusonhelping
departmentsachievetheirworkplanobjectives.
TheRegionalDistrictITlandscape:
27 FACIL IT IES WITH
COMPUTING RESOURCES
327 PER SONAL
COMPUTER S
40 APPLIC ATION
SERVER S
9 FACIL IT Y IP PHONE SYSTEMS,
VOICE-MAIL AND REL ATED
PERIPHER AL EQUIPMENT
INCLUDING PDA S,
CELLPHONES AND TABLE T S.

R E G I O N A L D I S T R I C T O F N A N A I M O 2 0 1 8 A N N U A L R E P O R Txlvi
GE
NE
RA
LU
TIL
ITIE
SR
EC
& P
AR
KS
DE
VE
LO
PM
EN
TC
OR
PO
RA
TE
FIN
AN
CE
ST
AT
IST
ICS
TR
AN
SIT
&
EM
ER
GE
NC
Y
Technologyisacriticalorganizationalsupport
elementassistingalldepartmentsinachievingtheir
businessgoalsandobjectives.
IT HIGHLIGHTS FOR 2018 INCLUDE:
• Deployedanewserverclustertoincrease
applicationserverperformance.
• Implementedanewdisasterrecoveryclusterat
OceansidePlacetoenhancebusinesscontinuity.
• UpgradedIPPhonesystemsattworemotesites.
• Designedandimplementedanewstaff
Intranetsystem.
• Deployedanonlineportalforbuilding
inspectionandbylawservices.
KEY IT INITIATIVES FOR 2019 INCLUDE:
• Upgradethedatastorageplatformatour
disasterrecoverysite.
• Upgradeheadofficewirelessinfrastructureto
accommodateincreasedwirelessdevices.
• Upgradesurveillanceserverhardware.
• Deploynewserverhardwareatmultiple
remotesites.
• Implementnewserversforsolidwaste
collectionservices.
• ImplementnewredundantVPNcontrollersfor
remotesiteconnectivity.
• CompletetheupgradeofPCstoWindows10.
• Implementwebstreamingforboardmeetings.
• Replace5IPphonesystemsatremotesites.
• CompleteanewRFPformobiletelecom
servicesandanewRFPforthedeliveryof
hardwareandtechnicalservices.
• PartnerwithRDNdepartmentstodevelopa
corporatestrategyforSCADA,CCTVand
security.
TheRDN’smappingapplicationsprovidedby
ourGISdepartmentallowcitizens,property
developersandrealestateagentstofindproperty
informationon-lineattheirconvenience.The
GISdepartmentisalsotakingamoreactiverole
inofferingspatialinformationtointernalusers
designedtoenablequeriesformatchingparcels
toservices.Thisinformationisalsovaluablefor
landuseandstrategicplanning.Arecentreview
oftheGISdepartmentofferedrecommendations
onefficienciesthatthedepartmentcontinuesto
implement.
GIS HIGHLIGHTS FOR 2018 INCLUDE:
• CreatedApplicationsforUtilitiesProperty
InformationLookup,ElectionVoting,
ElectionResults,andFireProtectionLookup.
• Re-establishedTopologyfornumerous
GISlayers.
• MaintainedParcelFabriclayersinformation
intheWebmap.
• DevelopedaRegionalParks&Trails
InteractiveGuide.
• Added2018AirphototoWebmap.
• Parks&TrailsFinder–updatesonGISPortal.
ITEquipmentusedtostorethegrowing
volumesofRDNdata.

R E G I O N A L D I S T R I C T O F N A N A I M O 2 0 1 8 A N N U A L R E P O R T xlvii
GE
NE
RA
LU
TIL
ITIE
SR
EC
& P
AR
KS
DE
VE
LO
PM
EN
TC
OR
PO
RA
TE
FIN
AN
CE
ST
AT
IST
ICS
TR
AN
SIT
&
EM
ER
GE
NC
Y
KEY GIS INITIATIVES FOR 2019 INCLUDE:
• DevelopmentofGISstandardsguidelines.
• CreateadraftGISstrategyandroadmap.
• ImplementGoecortexWebMapSolution.
• AddSeaLevelRisedatafromconsultantto
thewebmap.
• MapunmappedRDNparktrails.
RDNemployeesequippedtomapa
regionalparktrail.

R E G I O N A L D I S T R I C T O F N A N A I M O 2 0 1 8 A N N U A L R E P O R Txlviii R E G I O N A L D I S T R I C T O F N A N A I M O 2 0 1 8 A N N U A L R E P O R Txlviii
Finance Services
FinancialServicesiscomposedofafourteen
memberteamthatdevelopsfinancialmanagement
policies,performsfinancialforecastingservices,
meetsallfinancialregulationandlegislative
requirementsfortheRegionalDistrict,supports
procurementandmaintainsaccounting
systemsnecessarytoassistdepartmentsin
achievingcapitalandoperationaltargets.
FIN
AN
CE
Jeannie Bradburne, Director
Tiffany Moore, Manager,AccountingServices
Manvir Manhas, Manager,CapitalAccountingandFinancialReporting
Kurtis Felker,Manager,Purchasing

R E G I O N A L D I S T R I C T O F N A N A I M O 2 0 1 8 A N N U A L R E P O R T xlix
GE
NE
RA
LU
TIL
ITIE
SR
EC
& P
AR
KS
DE
VE
LO
PM
EN
TC
OR
PO
RA
TE
FIN
AN
CE
ST
AT
IST
ICS
TR
AN
SIT
&
EM
ER
GE
NC
Y
AccountingServices
Thisfunctionreliesontechnologytoachieveits
goalofprovidingaccurateandtimelyinformation
tostaffandthepublic.Customerscangoonline
throughtheWebCustomerServicesAccessPointto
viewtheiraccounttransactions.Asanexampleof
howtechnologyhashelpedthedepartment,82% of account payments are received electronically, eliminatingtheneedforcustomerstomakeatrip
toouroffices.Ourgoalistocontinuetoincrease
electronicpaymentsandtoincreasethenumberof
customersreceivingemaildeliveryoftheirinvoices
by0.5%peryear.
FinancialReporting
Staffinthisfunctioncoordinateandprepare
theRegionalDistrict’sfive-yearfinancialplan,
theauditedfinancialstatementsandtheannual
financialreport.Thefinancialplanquantifiescurrent
yearworkplansandforecastsactivitiesforthenext
fiveyears.Thereare106 service areaswithintheRDNeachwithitsowntaxrequisitionandbudget.
Section374and375oftheLocalGovernmentAct
requirethattheRDNcompleteafive-yearfinancial
planandconductapublicparticipationprocess.The
financialplanbylawmustbeadoptedbyMarch31st
eachyear.OnMarch27,2018theBoardadopted
the2018-2022FinancialPlanaspartofitsfinancial
planningprocess.The2018budgetprocessincluded
increasedpublicengagementwiththereleaseof
RDNBudgetTalksontheGetInvolvedRDNplatform.
AdditionalbudgetinformationandaQ&Afor
residentswasmadeavailableontheGetInvolved
RDNplatform.
The2018-2022FinancialPlanincludes:
18,500UTIL IT Y ACCOUNT S
23,700CUSTOMER S INVOICED
ANNUALLY
19,000VENDOR S INVOICES
ANNUALLY
621T4S E ACH YE AR & PAYROLL
SERVICES FOR ALL RDN
EMPLOYEES
$91M
OPER ATIONAL SPENDING
$73MC APITAL SPENDING
FUNDING SOURCES:
• TA XES
• USER FEES
• GR ANT S
• BORROWING
• TR ANSFER S FROM
RESERVES

R E G I O N A L D I S T R I C T O F N A N A I M O 2 0 1 8 A N N U A L R E P O R Tl
Thefulltextofthefinancialplanandtheannual
reportareavailableontheRegionalDistrict’s
websiteatwww.rdn.bc.ca.
Procurement
ThisfunctionsupportsprocurementintheRDNof
goods,servicesandconstruction.
FINANCIAL SERVICES HIGHLIGHTS FOR
2018 INCLUDE:
• ReceivedtheGovernmentFinanceOfficers
Association’sCanadianAwardforFinancial
ReportingfortheAnnualReportfortheYear
EndedDecember31,2017.
• ModernizedtheDirectorremunerationprocess
makingitmoreeffectiveandefficient.
• RegionalDistrictofNanaimoandNanaimo
RegionalHospitalDistrict2018auditedfinancial
statementscompletedwithacleanaudit
opinionprovidedbyMNPLLP.
• 2018to2022FinancialPlanbylawswere
completedfortheRegionalDistrictofNanaimo
andNanaimoRegionalHospitalDistrict.
• Allstatutoryreportingrequirementsand
deadlinesweremetforprovinciallegislation
andGasTaxagreements.
• Increasedpublicengagementforthe2019-2023
FinancialPlan.
KEY INITIATIVES FOR 2019 INCLUDE:
• ImplementanewPurchasingPolicy.
• ConductareviewoftheCommunityWorks
FundProgram.
• CollaboratewithBuildingInspectiononthe
OnlinePortalProject,implementinganonline
paymentssystemsocustomershavethe
optiontopayforpermitsusingtheircreditcard.
• ImprovetheprocessforhandyDartticketsales
byimplementingprocedurestoallowforpoint
ofsalecashieringinthetransitbuilding.
GE
NE
RA
LU
TIL
ITIE
SR
EC
& P
AR
KS
DE
VE
LO
PM
EN
TC
OR
PO
RA
TE
FIN
AN
CE
ST
AT
IST
ICS
TR
AN
SIT
&
EM
ER
GE
NC
Y
58
TENDER S/REQUEST S
FOR PROPOSAL S
RDNBudgetTalksonline
engagementtool

R E G I O N A L D I S T R I C T O F N A N A I M O 2 0 1 8 A N N U A L R E P O R T li
GE
NE
RA
LU
TIL
ITIE
SR
EC
& P
AR
KS
DE
VE
LO
PM
EN
TC
OR
PO
RA
TE
FIN
AN
CE
ST
AT
IST
ICS
TR
AN
SIT
&
EM
ER
GE
NC
Y
NANAIMO REGIONAL HOSPITAL DISTRICTTheNanaimoRegionalHospitalDistrict(NRHD)
sharesthesameboundaries,directorsand
administrativestaffastheRegionalDistrictof
Nanaimo.TheNRHDprovidescapitalfundingfor
thesedesignatedhealthcarefacilities:
• NanaimoRegionalGeneralHospital
• DufferinLodge
• EagleParkLodge
• TrilliumLodge
• OceansideHealthCentre
Capitalfundingiscost-sharedwiththeprovince
ona60/40basiswiththeNRHD’sportionbeing
40percent.IslandHealthisresponsiblefor
deliveringhealthcareservicesonVancouver
Island.IslandHealthpoolsbothProvincialand
NRHDfunding,alongwithothersourcessuchas
foundations,tomaintain,improveandbuildhealth
carefacilities.
ThefinancedepartmentadministerstheNRHD
includingthepreparationoffive-yearfinancialplans,
managingtheaccountingsystemsandpreparation
offinancialstatementsaswellascoordinatingthe
fundingfortheNRHD’scapitalprojects.

R E G I O N A L D I S T R I C T O F N A N A I M O 2 0 1 8 A N N U A L R E P O R Tlii
IampleasedtopresenttheAnnualFinancial
ReportfortheRegionalDistrictofNanaimo
(RDN)fortheyearendedDecember31,2018.
Thisreportincludestheauditor’sreport,the
2018consolidatedfinancialstatements,and
supplementaryinformationfortheRDN.
Theconsolidatedfinancialstatementsfortheyear
endedDecember31,2018werepreparedbythe
RDN’sstaffinaccordancewithgenerallyaccepted
accountingprinciplesforlocalgovernments,as
recommendedbythePublicSectorAccounting
Board(PSAB)oftheCharteredProfessional
AccountantsofCanada,andhavebeenappliedona
basisconsistentwiththatoftheprecedingyear.
TheNotestotheConsolidatedFinancialStatements
areanintegralpartoftheRDN’sfinancial
informationand,assuch,Iencourageyoutoread
themthoroughly.ThenotesdescribetheRDN’s
accountingpoliciesandprovidefulldisclosureof
themoresignificantfinancialstatementitems,
commitments,andcontingencies.
TheRDNmaintainsasystemofinternalaccounting
controlsdesignedtosafeguardtheassetsofthe
RDNandtoprovidereliablefinancialinformation.
Weconfirmandtestthesesystemsonacyclical
basisbycontractedauditservices.
TheRDN’sindependentauditors,MNPLLP,havebeen
engagedtoexpressanopinionastowhetherthese
financialstatementspresentfairly,inallmaterial
respects,theRDN’sfinancialposition,financial
activities,andcashflowinaccordancewithCanadian
generallyacceptedaccountingprinciples.MNPLLP
hasbeengivenunrestrictedaccesstoallfinancial
andotherrecordsoftheRDN.Theiropinion,which
follows,isbasedonproceduresthattheyconsider
sufficienttosupporttheirauditopinion.
FINANCIAL OVERVIEWTheRDNcurrentlyoperates106services,eachwith
theirownrevenueandexpenses.Residentsofthe
sevenelectoralareasandfourmunicipalitiesonly
payfortheservicesthattheyareparticipantsin.
Servicesincludesuchthingsasgeneralgovernment
administration,bylawenforcement,planningand
developmentservices,buildinginspection,fire
protectionandemergencyresponseplanning,public
transportation,parksandrecreation,watersupply
andsewagecollection,wastewaterdisposal,solid
wastecollectionanddisposal,andstreetlighting.
Message From The Director of Finance
GE
NE
RA
LU
TIL
ITIE
SR
EC
& P
AR
KS
DE
VE
LO
PM
EN
TC
OR
PO
RA
TE
FIN
AN
CE
ST
AT
IST
ICS
TR
AN
SIT
&
EM
ER
GE
NC
Y

R E G I O N A L D I S T R I C T O F N A N A I M O 2 0 1 8 A N N U A L R E P O R T liii
TheRDN’soverallfinancialpositioncontinuesto
improve.In2018,therewasa$22.0milliondollar
increasetotheyear-endaccumulatedsurplus
balance(2018:$272.1million;2017:$250.1million).
Thiswasinpartdrivenbythetimingofreceiving
capitalgrants.
TheRDN’snetfinancialassetbalanceatDecember
31,2018was$22.7million,adecreaseof$14.3
millionoverthe2017year-endbalance(2017:
$37.0million).Cashusedtowardstheacquisitionof
TangibleCapitalAssetsdrovethisdecrease.
TheRDN’snon-financialassets,predominantly
comprisedofTangibleCapitalAssets,shows
anincreaseof$36.3millionmainlyduetothe
NanaimoPollutionControlCentreinfrastructure
investment.ThenetbookvalueoftheTangible
CapitalAssetstotaled$247.4millionatDecember
31,2018.Thisamountrepresentstheremaining
valueofthehistoricalcostoftheRDN’sinvestment
ininfrastructure,facilitiesandothercapitalassets
overtime.
Revenuestotaled$100.2millionin2018,whichis
a$13.4millionincreaseoverthe$86.8millionin
2017.Thiswasattributedtoanincreaseoftaxation
of$2.1million,operatingrevenuesof$0.9million,
governmenttransfersandgrantsof$5.1million,
developercontributionsof$3.0million,other
incomeof$1.1million,investmentincomeof$0.8
million,andpaymentsinlieuoftaxesof$0.4million.
RESERVESTheRDN’sreservebalancedecreasedfrom$65.1
millionto$57.4million,adecreaseof$7.7million.
ThemainuseofreservesoccurredintheSouthern
CommunityWastewaterservice,where$17.4million
wasusedmainlyfortheNanaimoPollutionControl
CentreSecondaryTreatmentProject.
FINANCIAL OUTLOOKFinancialhealthforagovernmentismeasured
bysustainability,vulnerability,andflexibilityin
thecontextoftheoveralleconomicandfinancial
environment.TheRegionalDistrictremainsin
soundfinancialhealthwithgoodbalancesofassets
toliabilitiesandliquidcashreservessufficientto
meetannualcostsand,intheunlikelyevent,an
emergency.AnongoingchallengetotheRDNisthe
continuedriseinconstructioncostsgiventheneed
tofinancesignificantinfrastructureprojectsover
thecomingyearsandtoimproveservicessuchas
recreationfacilitiesandtransitwithinthemeansof
arelativelyhighproportionoffixedincomefamilies.
GE
NE
RA
LU
TIL
ITIE
SR
EC
& P
AR
KS
DE
VE
LO
PM
EN
TC
OR
PO
RA
TE
FIN
AN
CE
ST
AT
IST
ICS
TR
AN
SIT
&
EM
ER
GE
NC
Y

R E G I O N A L D I S T R I C T O F N A N A I M O 2 0 1 8 A N N U A L R E P O R Tliv
TheRDN’smainexposuretorisksanduncertainties
arisesfromvariablesoutsideofitscontrol.
Theseincludeeconomicfactorssuchasinflation,
populationgrowthanddemographics,unexpected
shocksfromearthquakes,forestfires,floods,
interestrateanddollarvaluefluctuationsand
changestoprovincialandfederalprogramsand
legislation.Provincialandfederalchangesin
legislationthatimpactpropertytaxationorthe
water,wastewater,andsolidwasteregulatory
frameworkcanhaveasignificanteffectonRDN
finances.Welldefined,accessibleandstablefederal
andprovincialinfrastructurefundingprogramsmay
alsobeanalternatesourceoffundingforcapital
therebyreducingfutureborrowingrequirements.
AlthoughtheRDNisunabletodirectlycontrolthese
variables,riskmitigationisincorporatedinour
plans.Long-termassetmanagementplans,theuse
ofreservefundstooffsetfutureborrowingcosts,
andthecontinuedpursuitofgrantfundingwill
assistinmanagingtheserisks.Useoffinancialand
regulatorypolicythatsupportstheRDNStrategic
Plangoalstodevelopanenvironmentally,socially,
andeconomicallyhealthyareathatisadaptable
tochange,willhelptoimprovetheregion’s
attractivenesstoinvestorsandwillcontributeto
ourresidents’abilitytomeettheirneedswithout
compromisingtheabilityoffutureresidentstodo
thesame.
Inconclusion,Iwouldliketothankallofthe
staff,andtheFinanceDepartmentemployees
inparticular,fortheirdiligenceandsupportin
managingthefinancialaffairsoftheRDN.
Sincerely,
JeannieBradburne,CPA,CGA,MBA
DirectorofFinance
May3,2019
GE
NE
RA
LU
TIL
ITIE
SR
EC
& P
AR
KS
DE
VE
LO
PM
EN
TC
OR
PO
RA
TE
FIN
AN
CE
ST
AT
IST
ICS
TR
AN
SIT
&
EM
ER
GE
NC
Y

REGIONAL DISTRICT OF NANAIMO 2018 ANNUAL REPORT
1
To the Members of the Board of the Regional District
of Nanaimo:
This statement is provided to clarify and outline the roles and responsibilities of the management team, the elected Board of Directors and the independent auditors in relation to the preparation and review of the Regional District of Nanaimo's annual financial results.
Management is responsible for the preparation and presentation of the accompanying consolidated financial statements, including responsibility for significant accounting judgments and estimates in accordance with Canadian public sector accounting standards. This responsibility includes selecting appropriate accounting principles and methods and making decisions affecting the measurement of transactions in which objective judgment is required.
In discharging its responsibilities for the integrity and fairness of the consolidated financial statements, management designs and maintains the necessary accounting systems and related internal controls to provide reasonable assurance that transactions are authorized, assets are safeguarded and financial records are properly maintained to provide reliable
information for the preparation of financial statements.
The Regional Board of Directors is composed entirely of Directors who are neither management nor employees of the Regional District. The Board is responsible for overseeing management in the performance of its financial reporting responsibilities and for delegating the authority for approval of the consolidated financial statements. The Board fulfils these responsibilities by reviewing the financial information prepared by management and discussing relevant matters with management. The Board is also responsible for recommending the appointment of the Regional District's external auditors. The external auditors have full and free access to the Board and management to discuss their audit findings.
MNP LLP, an independent firm of Chartered Professional Accountants, has been appointed by the Regional Board of Directors to audit the consolidated financial statements and report to them; their report follows.
April 23, 2019
Director of Finance
FINANCIAL STATEMENTS
MANAGEMENT’S RESPONSIBILITY

Independent Auditor’s Report
Suite 400, MNP Place 345 Wallace Street, Nanaimo, British Columbia, V9R 5B6, Phone: (250) 753-8251
To the Members of the Board of the Regional District of Nanaimo:
Opinion We have audited the consolidated financial statements of the Regional District of Nanaimo (the "Regional District"), which comprise the consolidated statement of financial position as at December 31, 2018, and the consolidated statements of operations and accumulated surplus, changes in net financial assets and cash flows and related schedules on pages 25 to 34 for the year then ended, and notes to the consolidated financial statements, including a summary of significant accounting policies. In our opinion, the accompanying consolidated financial statements present fairly, in all material respects, the consolidated financial position of the Regional District as at December 31, 2018, and the results of its consolidated operations and its consolidated cash flows for the year then ended in accordance with Canadian public sector accounting standards. Basis for Opinion We conducted our audit in accordance with Canadian generally accepted auditing standards. Our responsibilities under those standards are further described in the Auditor’s Responsibilities for the Audit of the Consolidated Financial Statements section of our report. We are independent of the Regional District in accordance with the ethical requirements that are relevant to our audit of the consolidated financial statements in Canada, and we have fulfilled our other ethical responsibilities in accordance with these requirements. We believe that the audit evidence we have obtained is sufficient and appropriate to provide a basis for our opinion. Other Matter The supplementary information on pages 35 to 49 have been presented for purposes of additional analysis and are unaudited. We do not express an opinion on these schedules because our examination did not extend to the detailed information therein. Responsibilities of Management and Those Charged with Governance for the Consolidated Financial Statements Management is responsible for the preparation and fair presentation of the consolidated financial statements in accordance with Canadian public sector accounting standards, and for such internal control as management determines is necessary to enable the preparation of consolidated financial statements that are free from material misstatement, whether due to fraud or error. In preparing the consolidated financial statements, management is responsible for assessing the Regional District’s ability to continue as a going concern, disclosing, as applicable, matters related to going concern and using the going concern basis of accounting unless management either intends to liquidate the Regional District or to cease operations, or has no realistic alternative but to do so. Those charged with governance are responsible for overseeing the Regional District’s financial reporting process. Auditor's Responsibilities for the Audit of the Consolidated Financial Statements Our objectives are to obtain reasonable assurance about whether the consolidated financial statements as a whole are free from material misstatement, whether due to fraud or error, and to issue an auditor's report that includes our opinion. Reasonable assurance is a high level of assurance, but is not a guarantee that an audit conducted in accordance with Canadian generally accepted auditing standards will always detect a material misstatement when it exists. Misstatements can arise from fraud or error and are considered material if, individually or in the aggregate, they could reasonably be expected to influence the economic decisions of users taken on the basis of these consolidated financial statements. As part of an audit in accordance with Canadian generally accepted auditing standards, we exercise professional judgment and maintain professional skepticism throughout the audit. We also:
• Identify and assess the risks of material misstatement of the consolidated financial statements, whether due to fraud or error, design and perform audit procedures responsive to those risks, and obtain audit evidence that is sufficient and appropriate to provide a basis for our opinion. The risk of not detecting a material misstatement resulting from fraud is higher than for one resulting from error, as fraud may involve collusion, forgery, intentional omissions, misrepresentations, or the override of internal control

• Obtain an understanding of internal control relevant to the audit in order to design audit procedures that are appropriate in the circumstances, but not for the purpose of expressing an opinion on the effectiveness of the Regional District’s internal control.
• Evaluate the appropriateness of accounting policies used and the reasonableness of accounting estimates and related disclosures made by management.
• Conclude on the appropriateness of management's use of the going concern basis of accounting and, based on the audit evidence obtained, whether a material uncertainty exists related to events or conditions that may cast significant doubt on the Regional District’s ability to continue as a going concern. If we conclude that a material uncertainty exists, we are required to draw attention in our auditor's report to the related disclosures in the consolidated financial statements or, if such disclosures are inadequate, to modify our opinion. Our conclusions are based on the audit evidence obtained up to the date of our auditor's report. However, future events or conditions may cause the Regional District to cease to continue as a going concern.
• Evaluate the overall presentation, structure and content of the consolidated financial statements, including the disclosures, and whether the consolidated financial statements represent the underlying transactions and events in a manner that achieves fair presentation.
• Obtain sufficient appropriate audit evidence regarding the financial information of the entities or business activities within the Regional District to express an opinion on the consolidated financial statements. We are responsible for the direction, supervision and performance of the group audit. We remain solely responsible for our audit opinion.
We communicate with those charged with governance regarding, among other matters, the planned scope and timing of the audit and significant audit findings, including any significant deficiencies in internal control that we identify during our audit. Nanaimo, British Columbia
May 14, 2019 Chartered Professional Accountants

REGIONAL DISTRICT OF NANAIMO
CONSOLIDATED STATEMENT OF FINANCIAL POSITION
AS AT DECEMBER 31, 2018
2018 2017
Financial Assets
Cash and cash equivalents (Note 2) 72,294,954$ 84,180,386$
Portfolio investments (Note 4) 38,958,504 34,193,566
Accounts receivable (Note 3) 9,191,113 8,925,705
Other jurisdictions debt receivable (Note 12) 63,393,569 60,630,952
Other assets (Note 5) 25,578 579,903
183,863,718 188,510,512
Financial Liabilities
Accounts payable (Note 7) 11,641,834 7,534,004
Other liabilities (Note 8) 4,417,209 4,433,281
Unfunded liabilities (Note 9) 17,343,908 15,088,181
Deferred revenue (Note 10) 28,026,410 28,663,666
Short-term loans (Note 6) 644,128 277,473 Long-term debt (Note 11) 99,074,842 95,489,278
161,148,331 151,485,883
Net Financial Assets 22,715,387$ 37,024,629$
Non-financial Assets
Tangible capital assets (Note 13) 247,356,919 211,111,824
Inventories 48,131 47,831
Prepaid expenses 1,988,931 1,896,230
249,393,981 213,055,885
Accumulated Surplus (Note 15) 272,109,368$ 250,080,514$
Contingent Liabilities (Note 21)
Commitments (Note 27)
APPROVED:
Jeannie Bradburne, CPA, CGA, MBA
Director of Finance
The accompanying notes are an integral part of these consolidated financial statments
- 3 -

REGIONAL DISTRICT OF NANAIMO
CONSOLIDATED STATEMENT OF OPERATIONS AND ACCUMULATED SURPLUS
FOR THE YEAR ENDED DECEMBER 31, 2018
Budget 2018 2017
(Note 17)
Revenue
Property taxes 50,174,213$ 50,174,213$ 48,026,015$
Operating revenues 23,294,734 25,622,661 24,712,090
Government transfers and grants (Note 14) 20,085,544 14,361,310 9,287,684
Developer contributions 6,415,610 5,523,891 2,535,951
Other income 1,920,309 2,270,728 1,111,434
Portfolio investment income 75,000 782,014 527,288
Other investment income 75,000 891,472 367,376
Payments in lieu of taxes 149,290 595,566 197,398
102,189,700 100,221,855 86,765,236
Expenses
General Government 3,484,094 3,944,873 3,761,080
Strategic and Community Development 4,746,014 3,654,080 3,304,814
Wastewater and Solid Waste Management 21,623,141 26,522,152 26,217,493
Water, Sewer, and Street lighting 4,985,648 5,709,202 5,566,153
Public Transportation 20,838,947 21,272,863 19,601,485
Protective Services 5,816,894 5,833,445 5,471,779
Parks, Recreation, and Culture 11,031,605 11,256,386 11,438,820
72,526,343 78,193,001 75,361,624
Surplus for the year 29,663,357$ 22,028,854$ 11,403,612$
Accumulated surplus, Beginning of the year250,080,514 250,080,514 238,676,902
Accumulated surplus, End of the year (Note 15) 279,743,871$ 272,109,368$ 250,080,514$
The accompanying notes are an integral part of these consolidated financial statements
- 4 -

REGIONAL DISTRICT OF NANAIMO
CONSOLIDATED STATEMENT OF CHANGE IN NET FINANCIAL ASSETS
FOR THE YEAR ENDED DECEMBER 31, 2018
Budget 2018 2017
(Note 17)
Surplus for the year 29,663,357$ 22,028,854$ 11,403,612$
Acquisition of tangible capital assets (72,943,091) (43,667,027) (20,700,693)
Amortization of tangible capital assets - 7,335,406 7,216,168
Proceeds on disposal of tangible capital assets - 37,082 444,701
Loss on disposal of tangible capital assets - 49,444 155,258
Change in prepaid expenses - (92,701) (481,462)
Change in inventories - (300) (4,432)
Decrease in Net Financial Assets (43,279,734) (14,309,242) (1,966,848)
Net Financial Assets, Beginning of the year 37,024,629 37,024,629 38,991,477
Net Financial Assets, End of the year (Pg. 3) (6,255,105)$ 22,715,387$ 37,024,629$
The accompanying notes are an integral part of these consolidated financial statements
- 5 -

REGIONAL DISTRICT OF NANAIMO
CONSOLIDATED STATEMENT OF CASH FLOWS
FOR THE YEAR ENDED DECEMBER 31, 2018
2018 2017
Operating Transactions
Surplus for the year 22,028,854$ 11,403,612$
Non-cash items included in surplus
Amortization of tangible capital assets 7,335,406 7,216,168
Contributed tangible capital assets - (2,266,000)
Loss on disposal of tangible capital assets 49,444 155,258
Debt actuarial adjustments (401,611) (347,372)
Change in non-cash working capital balances related to operations
Increase in accounts receivable (265,408) (2,779,902)
(Decrease) Increase in other assets 554,325 (485,674)
Increase in accounts payable 4,107,831 1,239,534
(Decrease) Increase in deferred revenues (637,256) 7,926,583
Decrease in other liabilities (16,072) (96,573)
Increase in prepaid expenses (92,701) (481,462)
Increase in inventory (300) (4,432)
Increase in unfunded liabilities 2,255,727 2,290,730
Cash provided by operating transactions 34,918,239 23,770,470
Capital Transactions
Acquisition of tangible capital assets (43,667,027) (18,434,693)
Proceeds on disposal of tangible capital assets 37,082 444,701
Cash used in capital transactions (43,629,945) (17,989,992)
Investment Transactions
Cash provided by (used in) investment transactions (4,764,938) (2,633,826)
Financing Transactions
Short and long-term debt issued 3,325,512 16,779,875
Repayment of short and long-term debt (1,734,300) (1,172,801)
Cash provided by financing transactions 1,591,212 15,607,074
Net change in cash and cash equivalents (11,885,432) 18,753,726
Cash and cash equivalents, Beginning of the year 84,180,386 65,426,660
Cash and cash equivalents, End of the year (Pg. 3) (Note 2) 72,294,954$ 84,180,386$
The accompanying notes are an integral part of these consolidated financial statements
- 6 -

REGIONAL DISTRICT OF NANAIMO NOTES TO CONSOLIDATED FINANCIAL STATEMENTS for the year ended December 31, 2018
- 7 -
The Regional District was incorporated in 1967 under the provisions of the British Columbia Municipal Act. Its principal activities are the provision of district wide local government services to the residents of seven electoral areas and four municipalities within its boundaries. These services include general government administration, bylaw enforcement, planning and development services, building inspection, fire protection and emergency response planning, public transportation, parks and recreation, water supply and sewage collection, wastewater disposal, solid waste collection and disposal, and street lighting. 1. SIGNIFICANT ACCOUNTING POLICIES
(a) Principles of Consolidation The Regional District follows Canadian public sector accounting standards issued by the Public Sector
Accounting Board (PSAB) of CPA Canada. Consolidated financial statements have been prepared in accordance with the recommendations of the
Public Sector Accounting Board (PSAB). The consolidated financial statements include the activities related to all funds belonging to the one economic entity of the Regional District. In accordance with those standards, inter-departmental and inter-fund transactions have been removed to ensure financial activities are recorded on a gross basis. The consolidated financial statements have been prepared on a going concern basis. The consolidated financial statements include the Regional District of Nanaimo’s proportionate share of the Arrowsmith Water Service (a joint venture agreement with the City of Parksville and Town of Qualicum Beach) and the Englishman River Water Service (a joint venture agreement with the City of Parksville). The Regional District’s share of the joint ventures is accounted for on a proportionate basis as follows:
Arrowsmith Water Service 22.4% Englishman River Water Service 26.0%
Any inter-entity transactions are eliminated on consolidation.
(b) Cash and cash equivalents Cash equivalents are carried at cost and have a maturity period of less than three months. (c) Portfolio investments Portfolio investments are carried at cost less any amortized premium and have a maturity period of
greater than one year. It is the intention of the Regional District to hold these instruments to maturity. Any premium has been amortized on a straight-line basis using the earlier of the date of maturity or call date.
(d) Non-Financial Assets i. Tangible capital assets
Tangible capital assets are physical assets that are to be used on a continuing basis, are not for sale in the ordinary course of operations and have useful economic lives extending beyond a single year. Section 3150 of Public Sector Accounting Handbook requires governments to record and amortize the assets over their estimated useful lives. Tangible capital assets are reported at historical cost and include assets financed through operating budgets, short-term and long-term debt, and leases. Tangible capital assets, when acquired, are recorded at cost which includes all amounts that are directly attributable to the acquisition, construction, development or betterment of the asset.

REGIONAL DISTRICT OF NANAIMO NOTES TO CONSOLIDATED FINANCIAL STATEMENTS for the year ended December 31, 2018
- 8 -
1. SIGNIFICANT ACCOUNTING POLICIES (CONTINUED) The cost of the tangible capital asset less any estimated residual value is amortized on a straight-line basis over estimated useful lives as follows:
In the year of acquisition and in the year of disposal, amortization is recorded as half of the annual
expense for that year. Assets under construction are not amortized until the asset is available for productive use.
ii. Contributions of tangible capital assets
Tangible capital assets received as contributions (examples are parklands as a result of subdivision, donated land and infrastructure built by property developers which is transferred to the Regional District) are recorded as assets and revenues at their fair value at the date of receipt.
iii. Inventories
Inventories held for consumption are recorded at the lower of cost and replacement cost. (e) Debt servicing cost Interest is recorded on an accrual basis. (f) Financial Instruments Financial instruments consist of cash and cash equivalents, accounts receivable, portfolio investments,
other jurisdictions debt receivable, short-term loans, accounts payable, other liabilities and long-term debt. Unless otherwise noted, it is management's opinion that the Regional District is not exposed to significant interest, currency or credit risk arising from these financial instruments.
Asset Category Useful Life Range
(years)
Land n/a
Land Improvements 15 - 50 Building 20 - 50
Equipment, Furniture & Vehicles 5 - 20
Engineering Structures Water 25 - 75 Sewer 45 - 75
Wastewater 30 - 75
Solid Waste 20 - 50
Transportation 20 - 50

REGIONAL DISTRICT OF NANAIMO NOTES TO CONSOLIDATED FINANCIAL STATEMENTS for the year ended December 31, 2018
- 9 -
1. SIGNIFICANT ACCOUNTING POLICIES (CONTINUED)
(g) Revenue recognition Revenues are recorded on an accrual basis and are recognized in the period in which they are earned.
Property tax revenues and payments in lieu are recognized as revenue when levied. Operating revenues such as user fees, tipping fees, garbage, and recycling collection fees are recognized when charged to the customer, when amounts are measurable and when collectability is reasonably assured. Interest on investments is recorded when earned on an accrual basis. Development cost contributions are recorded as deferred revenues when received and recognized as revenue in the year in which the associated expenses are incurred. Donations of tangible assets are recognized as revenue on the date of receipt. Other revenues are recognized as revenue when amounts can be reasonably estimated and collectability is reasonably assured.
The Regional District recognizes a government transfer as revenue when the transfer is authorized
and all eligibility criteria, if any, have been met. A government transfer with stipulations giving rise to an obligation that meets the definition of a liability is recognized as a liability. In such circumstances, the Regional District recognizes revenue as the liability is settled. Transfers of non-depreciable assets are recognized in revenue when received or receivable.
(h) Expense recognition Operating expenses are recorded on an accrual basis. Expenses under the accrual basis are recognized
as they are incurred and measurable based on receipt of goods and services and/or the creation of a legal obligation to pay.
Estimates of employee future benefits are recorded as expenses in the year they are earned. Landfill
closure and post closure costs are recognized as costs as landfill capacity is used. (i) Contingent liabilities Contingent liabilities are recognized in accordance with PS 3300, which requires that an estimate be
recorded when it is likely that a future event will confirm that a liability has been incurred by the financial statement date and that the amount can be reasonably estimated.
(j) Use of Estimates
The preparation of financial statements in conformity with Canadian public sector accounting standards requires management to make estimates and assumptions that affect the reported amounts of assets and liabilities and the disclosure of contingent assets and liabilities at the date of the financial statements, as well as the reported amounts of revenues and expenses during the reporting period. Significant areas requiring management estimates are the determination of employee retirement benefits, landfill closure and post closure liabilities, likelihood of collection of accounts receivable, useful lives of tangible capital assets and provisions for contingencies. Liabilities for contaminated sites are estimated based on the best information available regarding potentially contaminated sites that the Regional District is responsible for. Actual results may vary from those estimates and adjustments will be reported in operations as they become known. Changes to the underlying assumptions and estimates or legislative changes in the near term could have a material impact on the provisions recognized.

REGIONAL DISTRICT OF NANAIMO NOTES TO CONSOLIDATED FINANCIAL STATEMENTS for the year ended December 31, 2018
- 10 -
1. SIGNIFICANT ACCOUNTING POLICIES (CONTINUED)
(k) Liability for contaminated sites L
A liability for remediation of a contaminated site is recognized at the best estimate of the amount required to remediate the contaminated site when contamination exceeding an environmental standard exists, the Regional District is either directly responsible or accepts responsibility, it is expected that future economic benefits will be given up, and a reasonable estimate of the amount is determinable. The best estimate of the liability includes all costs directly attributable to remediation activities and is reduced by expected net recoveries based on information available at December 31, 2018. At each financial reporting date, the Regional District reviews the carrying amount of the liability. Any revisions required to the amount previously recognized is accounted for in the period revisions are made. The Regional District continues to recognize the liability until it is settled or otherwise extinguished. Disbursements made to settle the liability are deducted from the reported liability when they are made.
(l) Adoption of new accounting pronouncements
PS 2200 Related Party Disclosures
Effective January 1, 2018, the Regional District adopted the recommendations relating to PS 2200 Related Party Disclosures, as set out in the CPA Canada public sector accounting standards. Pursuant to the recommendations, the change was applied prospectively, and prior periods have not been restated.
This new Section defines a related party and establishes disclosures required for related party transactions. Disclosure of information about related party transactions and the relationship underlying them is required when they have occurred at a value different from that which would have been arrived at if the parties were unrelated, and they have, or could have, a material financial effect on the financial statements. There was no material impact on the consolidated financial statements of adopting the new Section.
PS 3210 Assets Effective January 1, 2018, the Regional District adopted the recommendations relating to PS 3210 Assets, as set out in the CPA Canada Public Sector Accounting Handbook. Pursuant to the recommendations, the change was applied prospectively, and prior periods have not been restated. The new Section provides guidance for applying the definition of assets set out in PS 1000 Financial Statement Concepts. The main features of this standard are as follows:
Assets are defined as economic resources controlled by a government as a result of past transactions or events and from which future economic benefits are expected to be obtained.
Economic resources can arise from such events as agreements, contracts, other government’s legislation, the government’s own legislation, and voluntary contributions.
The public is often the beneficiary of goods and services provided by a public sector entity. Such assets benefit public sector entities as they assist in achieving the entity’s primary objective of providing public goods and services.
A public sector entity’s ability to regulate an economic resource does not, in and of itself, constitute control of an asset if the interest extends only to the regulatory use of the economic resource and does not include the ability to control access to future economic benefits.

REGIONAL DISTRICT OF NANAIMO NOTES TO CONSOLIDATED FINANCIAL STATEMENTS for the year ended December 31, 2018
- 11 -
1. SIGNIFICANT ACCOUNTING POLICIES (CONTINUED) A public sector entity acting as a trustee on behalf of beneficiaries specified in an agreement or
statute is merely administering the assets, and does not control the assets, as future economic benefits flow to the beneficiaries. An economic resource may meet the definition of an asset but would not be recognized if there is no appropriate basis for measurement and a reasonable estimate cannot be made, or if another Handbook Section prohibits its recognition. Information about assets not recognized should be disclosed in the notes. There was no material impact on the consolidated financial statements of adopting the new Section.
PS 3320 Contingent Assets Effective January 1, 2018, the Regional District adopted the recommendations relating to PS 3320 Contingent Assets, as set out in the CPA Canada Public Sector Accounting Handbook. Pursuant to the recommendations, the change was applied prospectively, and prior periods have not been restated. The new Section establishes disclosure standards on contingent assets. The main features of this Standard are as follows: Contingent assets are possible assets arising from existing conditions or situations involving uncertainty. That uncertainty will ultimately be resolved when one or more future events not wholly within the public sector entity's control occurs or fails to occur. Resolution of the uncertainty will confirm the existence or non-existence of an asset. Passing legislation that has retroactive application after the financial statement date cannot create an existing condition or situation at the financial statement date. Elected or public sector entity officials announcing public sector entity intentions after the financial statement date cannot create an existing condition or situation at the financial statement date. Disclosures should include existence, nature, and extent of contingent assets, as well as the reasons for any non-disclosure of extent, and the basis for any estimates of extent made. When a reasonable estimate can be made, disclosure should include a best estimate and a range of possible amounts (or a narrower range of more likely amounts), unless such a disclosure would have an adverse impact on the outcome. There was no material impact on the consolidated financial statements of adopting the new Section.
PS 3380 Contractual Rights Effective January 1, 2018, the Regional District adopted the recommendations relating to PS 3380 Contractual Rights, as set out in the CPA Canada Public Sector Accounting Handbook. Pursuant to the recommendations, the change was applied prospectively, and prior periods have not been restated. This new Section establishes disclosure standards on contractual rights and does not include contractual rights to exchange assets where revenue does not arise. The main features of this Standard are as follows:

REGIONAL DISTRICT OF NANAIMO NOTES TO CONSOLIDATED FINANCIAL STATEMENTS for the year ended December 31, 2018
- 12 -
1. SIGNIFICANT ACCOUNTING POLICIES (CONTINUED)
Contractual rights are rights to economic resources arising from contracts or agreements that will result in both an asset and revenue in the future. Until a transaction or event occurs under a contract or agreement, an entity only has a contractual right to an economic resource. Once the entity has received an asset, it no longer has a contractual right. Contractual rights are distinct from contingent assets as there is no uncertainty related to the existence of the contractual right. Disclosures should include descriptions about nature, extent, and timing. There was no material impact on the consolidated financial statements of adopting the new Section.
PS 3430 Restructuring Transactions In June 2015, new PS 3430 Restructuring Transactions was included in the CPA Canada Public Sector Accounting Handbook (PSA HB). The new Section establishes disclosure standards on restructuring transactions. The main features of this Standard are as follows: A restructuring transaction is defined separately from an acquisition. The key distinction between the two is the absence of an exchange of consideration in a restructuring transaction. A restructuring transaction is defined as a transfer of an integrated set of assets and/or liabilities, together with related program or operating responsibilities that does not involve an exchange of consideration. Individual assets and liabilities transferred in a restructuring transaction are derecognized by the transferor at their carrying amount and recognized by the recipient at their carrying amount with applicable adjustments.
The increase in net assets or net liabilities resulting from recognition and derecognition of individual assets and liabilities received from all transferors, and transferred to all recipients in a restructuring transaction, is recognized as revenue or as an expense. Restructuring-related costs are recognized as expenses when incurred. Individual assets and liabilities received in a restructuring transaction are initially classified based on the accounting policies and circumstances of the recipient at the restructuring date. The financial position and results of operations prior to the restructuring date are not restated. Disclosure of information about the transferred assets, liabilities and related operations prior to the restructuring date by the recipient is encouraged but not required. The Section is effective for new restructuring transactions that occur in fiscal periods beginning on or after April 1, 2018. Earlier adoption is permitted. The Regional District does not expect application of the new Standard to have a material effect on the consolidated financial statements.

REGIONAL DISTRICT OF NANAIMO NOTES TO CONSOLIDATED FINANCIAL STATEMENTS for the year ended December 31, 2018
- 13 -
1. SIGNIFICANT ACCOUNTING POLICIES (CONTINUED)
PS 3420 Inter-entity Transactions Effective January 1, 2018, the Regional District adopted the recommendations relating to PS 3420 Inter-entity Transactions, as set out in the CPA Canada public sector accounting standards. Pursuant to the recommendations, the change was applied prospectively, and prior periods have not been restated. The new Section establishes standards on how to account for and report transactions between public sector entities that comprise a government’s reporting entity from both a provider and recipient perspective. The main features of the new Section are:
i. Under a policy of cost allocation, revenues and expenses are recognized on a gross basis. ii. Transactions are measured at the carrying amount, except in specific circumstances.
iii. A recipient may choose to recognize unallocated costs for the provision of goods and services and measure them at the carrying amount, fair value or other amount dictated by policy, accountability structure or budget practice.
iv. The transfer of an asset or liability for nominal or no consideration is measured by the provider at the carrying amount and by the recipient at the carrying amount or fair value.
v. Inter-entity transactions are considered in conjunction with PS 2200 Related Party Disclosures.
There was no material impact on the consolidated financial statements of adopting the new Section.
2. CASH AND CASH EQUIVALENTS
Cash and cash equivalents are comprised of cash on hand, cash on deposit at financial institutions and investments held in the Municipal Finance Authority of British Columbia investment funds.
3. ACCOUNTS RECEIVABLE
2018 2017
Cash $ 34,224,626 $ 46,711,631
Cash equivalents 38,070,328 37,468,755
$ 72,294,954 $ 84,180,386
2018 2017
Province of British Columbia $ 268,731 $ 314,588
Government of Canada 2,128,518 971,278
Regional and local governments 955,112 654,769
BC Transit Annual Operating Agreement 2,800,997 1,001,008
Accrued investment interest 196,322 240,029
Developer DCC instalments/contributions 243,000 2,834,716
Other trade receivables 2,598,433 2,909,317
$ 9,191,113 $ 8,925,705

REGIONAL DISTRICT OF NANAIMO NOTES TO CONSOLIDATED FINANCIAL STATEMENTS for the year ended December 31, 2018
- 14 -
4. PORTFOLIO INVESTMENTS
5. OTHER ASSETS
2018 2017
Investments at cost less amortized premium $ 38,958,504 $ 34,193,566
As at December 31, 2018, the following investments were held by the Regional District:
Investment Amortized
Purchase
Price
Accrued
Interest
Total Book
Value
Market Value
at December
31, 2018
BNS 2.81% deposit note $ 5,180,568 $ 1,595 $ 5,182,164 $ 5,180,568
TD 2.39% deposit note 5,089,488 51,655 5,141,142 5,089,488
CCCU 2.85% deposit note 3,174,293 744 3,106,039 3,174,293
BMO 3.14% coupon note 3,000,000 13,678 3,013,678 2,999,788
AGROVE 2.45% deposit note 2,966,649 41,220 3,007,869 3,007,869
TD 1.50% extendible note 2,500,000 9,247 2,509,247 2,395,122
BMO 1.85% extendible note 2,802,000 9,089 2,811,089 2,767,308
BMO 1.60% extendible note 2,050,000 6,580 2,056,580 2,004,987
BMO 2.15% extendible note 2,000,000 1,849 2,001,849 1,927,961
TD 2.00% extendible note 2,000,000 15,995 2,015,995 1,973,961
BMO 2.50% extendible note 2,000,000 7,123 2,007,123 1,990,709
BMO 2.00% extendible note 1,515,000 7,397 1,522,397 1,504,556
TD 2.00% extendible note 1,500,000 7,775 1,507,775 1,490,801
CONEXUS 2.85% deposit note 995,000 7,847 1,002,847 1,002,847
CONEXUS 2.85% deposit note 995,000 7,458 1,002,458 1,002,458
CONEXUS 2.85% deposit note 995,000 7,070 1,002,070 1,002,070
TD 1.00% deposit note 195,506 - 195,506 195,506 $ 38,958,504 $ 196,322 $ 39,085,828 $ 38,710,293
2018 2017
Investments at cost less amortized premium $ 38,958,504 $ 34,193,566
As at December 31, 2018, the following investments were held by the Regional District:
Investment Amortized
Purchase
Price
Accrued
Interest
Total Book
Value
Market Value
at December
31, 2018
BNS 2.81% deposit note $ 5,180,568 $ 1,595 $ 5,182,164 $ 5,180,568
TD 2.39% deposit note 5,089,488 51,655 5,141,142 5,141,142
CCCU 2.85% deposit note 3,174,293 744 3,175,036 3,174,293
BMO 3.14% coupon note 3,000,000 13,678 3,013,678 2,999,788
AGROVE 2.45% deposit note 2,966,649 41,220 3,007,869 3,007,869
TD 1.50% extendible note 2,500,000 9,247 2,509,247 2,395,122
BMO 1.85% extendible note 2,802,000 9,089 2,811,089 2,767,308
BMO 1.60% extendible note 2,050,000 6,580 2,056,580 2,004,987
BMO 2.15% extendible note 2,000,000 1,849 2,001,849 1,927,961
TD 2.00% extendible note 2,000,000 15,995 2,015,995 1,973,961
BMO 2.50% extendible note 2,000,000 7,123 2,007,123 1,990,709
BMO 2.00% extendible note 1,515,000 7,397 1,522,397 1,504,556
TD 2.00% extendible note 1,500,000 7,775 1,507,775 1,490,801
CONEXUS 2.85% deposit note 995,000 7,847 1,002,847 1,002,847
CONEXUS 2.85% deposit note 995,000 7,458 1,002,458 1,002,458
CONEXUS 2.85% deposit note 995,000 7,070 1,002,070 1,002,070
TD 1.00% deposit note 195,506 - 195,506 195,365 $ 38,958,504 $ 196,322 $ 39,154,826 $ 38,761,806
2018 2017
Security deposits for building or development permit applications $ 25,578 $ 579,903

REGIONAL DISTRICT OF NANAIMO NOTES TO CONSOLIDATED FINANCIAL STATEMENTS for the year ended December 31, 2018
- 15 -
6. SHORT-TERM LOANS
During 2018, the Regional District entered into one additional short-term loan agreement totalling $475,000 with the Municipal Finance Authority. In 2018, principal payments of $108,345 were made. The maturity dates of the loans range between 1 to 5 years. The interest rates for these loans are variable, which at December 31 was 2.79%.
7. ACCOUNTS PAYABLE
8. OTHER LIABILITIES
2018 2017
Compactor $ - $ 43,121
Land - Community Parks EA B 112,800 150,400
Trailer and Kubota 3,676 8,952
Land - Community Parks EA F 60,000 75,000
Fire Trucks - Errington Volunteer Fire Department 467,652 - $ 644,128 $ 277,473
Short-term loan payments for the next five years are:
2019 2020 2021 2022 2023 TOTAL
$146,930 $145,645 $148,004 112,797 $90,752 $644,128
2018 2017
Payable to Federal Government $ 222,731 $ 198,935
Payable to Provincial Government 831,091 785,638
Payable to other local governments 159,037 1,119,919
Trade and other payables 10,428,975 5,429,512
$ 11,641,834 $ 7,534,004
2018 2017
Wages and benefits payable $ 1,738,230 $ 1,711,006
Retirement benefits payable - see note 9(a) i 2,051,001 2,243,138
Permit deposits 627,978 479,137 $ 4,417,209 $ 4,433,281

REGIONAL DISTRICT OF NANAIMO NOTES TO CONSOLIDATED FINANCIAL STATEMENTS for the year ended December 31, 2018
- 16 -
9. UNFUNDED LIABILITIES
Unfunded liabilities represent the estimated amount of cumulative future expenses required to meet obligations which result from current operations. These liabilities are related to contractual employment obligations and landfill operations which are governed by Provincial statute. Special reserves which have been set aside to meet those obligations are described below.
(a) Employee Benefits i. Retirement Benefits - The Regional District provides vested sick leave benefits to its
employees who retire where they can qualify for a one time payout of up to 60 days of their accumulated unused sick leave. The amount recorded for these benefits is based on an actuarial evaluation done by an independent firm using a projected benefit actuarial valuation method prorated on service. The actuarial valuation was calculated at December 31, 2018.
The accrued post-employment benefits are as follows:
The significant actuarial assumptions adopted in measuring the Regional District’s post-employment
benefits are as follows:
ii. Other – Includes vacation pay adjustments and statutory and other benefits provided for in the collective agreement and which are paid in the normal course of business in the following year. The vacation pay liability at December 31, 2018 is $128,143 (2017, $109,294). The statutory benefits liability at December 31, 2018 is $198,329 (2017, $144,842).
(b) Landfill Closure and Post Closure Maintenance Costs
In accordance with PS 3270, liabilities with respect to permanently closing and monitoring a landfill are incurred as landfill capacity is used. Landfill Closure costs include placing a permanent cover over the face of the landfill. Post Closure Maintenance costs include landfill gas monitoring, leachate collection system operation and general site maintenance for a period of 200 years after the landfill is permanently closed.
2018 2017
Balance, beginning of year $ 1,797,849 $ 1,777,474
Current service costs 161,076 149,400
Benefits paid (178,123) (156,899)
Interest cost 50,011 54,096
Amortization of Net Actuarial Loss/ (Gain) (25,592) (26,222)
Balance, end of year $ 1,805,221 $ 1,797,849
2018 2017
Discount Rate 3.30% 2.90%
Expected Inflation Rate and Wage & Salary Increases 2.50% 2.50%
Retirement benefits payable 2018 2017
Balance reported in Note 8 $ 2,051,001 $ 2,243,138
Consolidation adjustment for actuarial valuation (245,780) (445,289)
Accrued benefit balance, end of year $ 1,805,221 $ 1,797,849
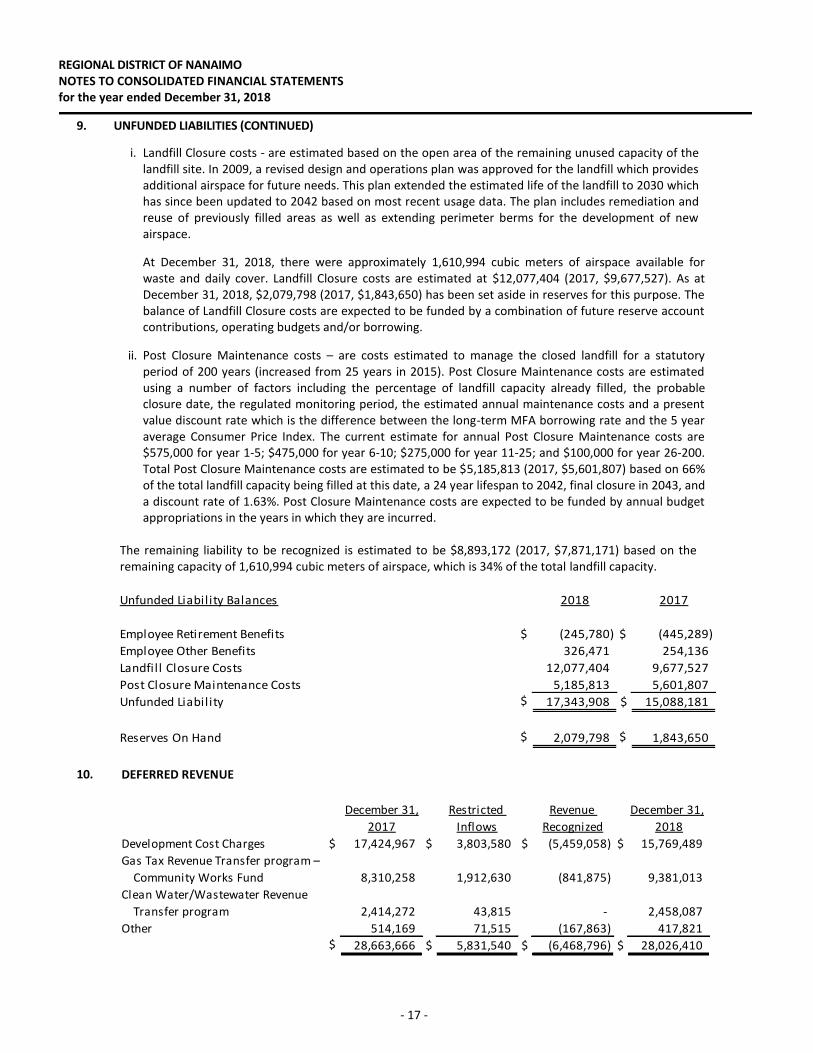
REGIONAL DISTRICT OF NANAIMO NOTES TO CONSOLIDATED FINANCIAL STATEMENTS for the year ended December 31, 2018
- 17 -
10. DEFERRED REVENUE
Unfunded Liability Balances 2018 2017
Employee Retirement Benefits $ (245,780) $ (445,289)
Employee Other Benefits 326,471 254,136
Landfill Closure Costs 12,077,404 9,677,527
Post Closure Maintenance Costs 5,185,813 5,601,807
Unfunded Liability $ 17,343,908 $ 15,088,181
Reserves On Hand $ 2,079,798 $ 1,843,650
December 31, Restricted Revenue December 31,
2017 Inflows Recognized 2018
Development Cost Charges $ 17,424,967 $ 3,803,580 $ (5,459,058) $ 15,769,489
Gas Tax Revenue Transfer program –
Community Works Fund 8,310,258 1,912,630 (841,875) 9,381,013
Clean Water/Wastewater Revenue
Transfer program 2,414,272 43,815 - 2,458,087
Other 514,169 71,515 (167,863) 417,821 $ 28,663,666 $ 5,831,540 $ (6,468,796) $ 28,026,410
9. UNFUNDED LIABILITIES (CONTINUED)
i. Landfill Closure costs - are estimated based on the open area of the remaining unused capacity of the landfill site. In 2009, a revised design and operations plan was approved for the landfill which provides additional airspace for future needs. This plan extended the estimated life of the landfill to 2030 which has since been updated to 2042 based on most recent usage data. The plan includes remediation and reuse of previously filled areas as well as extending perimeter berms for the development of new airspace.
At December 31, 2018, there were approximately 1,610,994 cubic meters of airspace available for
waste and daily cover. Landfill Closure costs are estimated at $12,077,404 (2017, $9,677,527). As at December 31, 2018, $2,079,798 (2017, $1,843,650) has been set aside in reserves for this purpose. The balance of Landfill Closure costs are expected to be funded by a combination of future reserve account contributions, operating budgets and/or borrowing.
ii. Post Closure Maintenance costs – are costs estimated to manage the closed landfill for a statutory
period of 200 years (increased from 25 years in 2015). Post Closure Maintenance costs are estimated using a number of factors including the percentage of landfill capacity already filled, the probable closure date, the regulated monitoring period, the estimated annual maintenance costs and a present value discount rate which is the difference between the long-term MFA borrowing rate and the 5 year average Consumer Price Index. The current estimate for annual Post Closure Maintenance costs are $575,000 for year 1-5; $475,000 for year 6-10; $275,000 for year 11-25; and $100,000 for year 26-200. Total Post Closure Maintenance costs are estimated to be $5,185,813 (2017, $5,601,807) based on 66% of the total landfill capacity being filled at this date, a 24 year lifespan to 2042, final closure in 2043, and a discount rate of 1.63%. Post Closure Maintenance costs are expected to be funded by annual budget appropriations in the years in which they are incurred.
The remaining liability to be recognized is estimated to be $8,893,172 (2017, $7,871,171) based on the remaining capacity of 1,610,994 cubic meters of airspace, which is 34% of the total landfill capacity.

REGIONAL DISTRICT OF NANAIMO NOTES TO CONSOLIDATED FINANCIAL STATEMENTS for the year ended December 31, 2018
- 18 -
10. DEFERRED REVENUE (CONTINUED)
Development Cost Charges - are amounts collected or payable as a result of new subdivision or building developments under the authority of Section 559 of the Local Government Act. The purpose of Section 559 is to collect funds for infrastructure which will be built as a result of population growth. Development Cost Charge bylaws have been enacted for the future expansion of wastewater treatment facilities, sewer, water and a bulk water system.
Community Works Fund - is a component of the federal government's “Investing in Canada Program” which was established to transfer a portion of gas tax revenues to local governments to address infrastructure deficits. Additional information on the Regional District of Nanaimo’s use of the Community Works Fund grants is included in the schedule on Pg. 35.
11. LONG-TERM DEBT
Debt is recorded and payable in Canadian dollars. It is the current policy of the Municipal Finance Authority to secure debt repayable only in Canadian dollars.
Details of long-term debt, including debt issue numbers, maturity dates, interest rates and outstanding amounts, are summarized in the Schedule of Long-Term Debt on pages 28 to 31.
Payments of principal on issued debt of the Regional District, not including member municipalities, for the next
five years are:
12. OTHER JURISDICTIONS DEBT RECEIVABLE Pursuant to the Local Government Act, the Regional District acts as the agency through which its member
municipalities and other jurisdictions borrow funds from the Municipal Finance Authority. The annual cost of servicing this debt is recovered entirely from the borrowing jurisdiction. However, the Regional District is joint and severally liable for this debt in the event of default.
2018 2017
Long-Term debt - Regional District services $ 35,681,273 $ 34,858,326
Vancouver Island Regional Library 14,363,594 14,785,940
Member municipalities 49,029,975 45,845,012
Total Long-Term Debt $ 99,074,842 $ 95,489,278
2019 2020 2021 2022 2023 Thereafter TOTAL
$2,038,970 $2,034,934 $2,035,047 $1,966,777 $1,963,871 $25,641,674 $35,681,273
2018 2017
Town of Qualicum Beach $ 3,240,555 $ 3,703,491
City of Parksville 4,837,242 1,258,210
City of Nanaimo 40,952,178 40,883,311
Vancouver Island Regional Library 14,363,594 14,785,940 $ 63,393,569 $ 60,630,952

REGIONAL DISTRICT OF NANAIMO NOTES TO CONSOLIDATED FINANCIAL STATEMENTS for the year ended December 31, 2018
- 19 -
13. TANGIBLE CAPITAL ASSETS
The Consolidated Schedule of Tangible Capital Assets (Pg. 27) provides details of acquisitions, disposals and amortization for the year.
14. GOVERNMENT TRANSFERS AND GRANTS
Net Book Value 2018 2017
Land $ 43,190,799 $ 42,610,826
Land improvements 10,896,759 11,191,795
Buildings 30,387,874 31,821,555
Engineered structures 94,203,199 97,312,780
Equipment, furniture and vehicles 10,870,848 8,415,197
Assets under construction 57,807,440 19,759,671 $ 247,356,919 $ 211,111,824
2018 2017
Federal Government
Operating transfers $ 349,023 $ 924,166
Capital transfers 7,133,951 1,560,519
$ 7,482,974 $ 2,484,685
Provincial Government
Operating transfers $ 6,374,154 $ 5,940,806
Capital transfers 504,182 862,193
$ 6,878,336 $ 6,802,999
Total Government Transfers and Grants $ 14,361,310 $ 9,287,684

REGIONAL DISTRICT OF NANAIMO NOTES TO CONSOLIDATED FINANCIAL STATEMENTS for the year ended December 31, 2018
- 20 -
15. ACCUMULATED SURPLUS The financial operations of the Regional District are divided into three funds: capital fund, general revenue fund and
reserve fund. For accounting purposes, each fund is treated as a separate entity. General Revenue Fund – represents the accumulated operating surplus of the Regional District which has not otherwise been allocated by the Board as reserves for special purposes. Capital Fund – represents amounts which have been expended by or returned to the General Revenue Fund or a Reserve Fund for the acquisition of tangible capital assets and includes related debt and refunds of debenture debt sinking fund surpluses. Reserves - represents that portion of the accumulated operating surplus that has been set aside to fund future expenses. It includes both statutory reserves created by bylaw under the authority of the Local Government Act and reserve accounts, which may be used by the Board without legislative restrictions.
The Accumulated Surplus consists of individual fund surpluses (deficits) and reserves as follows:
2018 2017
Unappropriated Surplus (Page 36) 13,053,647 12,297,424
Appropriated Surplus
Reserve for future expenditures 4,863,180 3,906,208
Landfil l closure 2,079,798 1,843,650
Property insurance deductible-fire departments 31,588 31,010
Liability insurance deductible 156,041 153,187
Regional Sustainability Initiatives 12,693 12,467
Dashwood Fire 10,144 453
San Pareil Boundary Amendment 10,263 10,097
Regional parks and trails donations 69,462 57,921
Vehicle fleet replacement (various departments) 553,235 1,007,139
20,840,051 19,319,556
Net investment in Tangible capital assets (Note 16) 211,031,519 175,976,025
Capital Fund advances 171,261 4,779,379
Unfunded liabilities (17,343,908) (15,088,181)
214,698,923 184,986,779
Restricted Reserve Funds (Page 33) 57,410,445 65,093,735
Accumulated Surplus (Page 3) $ 272,109,368 $ 250,080,514

REGIONAL DISTRICT OF NANAIMO NOTES TO CONSOLIDATED FINANCIAL STATEMENTS for the year ended December 31, 2018
- 21 -
16. NET INVESTMENT IN TANGIBLE CAPITAL ASSETS Net investment in tangible capital assets represents the historic cost of capital expenses less debt obligations
incurred to purchase and develop the infrastructure.
17. BUDGET FIGURES Budget figures represent the Financial Plan Bylaw adopted by the Board on March 27, 2018. The financial plan
includes capital expenses but does not include amortization expense. The financial plan forms the basis for taxation and fees and charges rates which may be required for a particular year. The following reconciliation of the budgeted “Surplus for the year” shown on Pg. 4 is provided to show which items must be added or removed to reflect to the budgeted financial plan values which are shown compared to actual expenses on Pg. 36 (General Revenue Fund Schedule of Revenue and Expenses).
18. MUNICIPAL FINANCE AUTHORITY RESERVE DEPOSITS The Regional District secures its long-term borrowing through the Municipal Finance Authority. As a condition
of these borrowings, a portion of the debenture proceeds are retained by the Authority as a debt reserve fund. As at December 31, 2018, the Regional District had debt reserve funds of $545,125 (2017, $535,176).
2018 2017
Tangible capital assets (Pg. 3) $ 247,356,919 $ 211,111,824
Short-term loans (Pg. 3) (644,128) (277,473)
Long-term debt - Regional District only (Note 11) (35,681,273) (34,858,326)
Net investment in Tangible capital assets (Note 15) $ 211,031,519 $ 175,976,025
2018 Budget
Budgeted Surplus for the year (Pg. 4) $ 29,663,357
Add:
Transfers from reserves 37,241,862
Proceeds of borrowing 15,119,726
Prior year operating surplus 12,146,812
Less:
Capital expenses (72,943,091)
Prior Year consolidation adjustments
Debt principal repayments/actuarial adjustments
Budgeted principal payments $ 4,958,635
Add: Actuarial Adjustments 401,611
Less: Principal payments for member municipalities (3,188,064) (2,172,182)
Transfer to reserves (10,433,016)
Consolidated Budgeted Surplus, per Regional District of Nanaimo Financial Plan Bylaw No. 1771 (Pg. 36) $ 8,623,468

REGIONAL DISTRICT OF NANAIMO NOTES TO CONSOLIDATED FINANCIAL STATEMENTS for the year ended December 31, 2018
- 22 -
19. NORTH ISLAND 9-1-1 CORPORATION A 9-1-1 emergency call answering service is provided by the North Island 9-1-1 Corporation, which is owned by
the Regional Districts of Comox Valley, Strathcona, Mount Waddington, Alberni Clayoquot, Nanaimo, and Powell River. The shares in the corporation are owned as follows:
Alberni Clayoquot 3 shares Comox Valley 6 shares Strathcona 4 shares Mount Waddington 1 share Nanaimo 5 shares Powell River 2 shares
The Regional District’s investment in shares of the North Island 9-1-1 Corporation is recorded at cost as it does
not fall under the definition of a government partnership (PS 3060.06). The Regional District's share of the corporation is equal to 23.8% and the degree of control is proportionate to the ownership share. As no benefits are expected from the ownership, it has not been accounted for as an equity investment.
20. PENSION LIABILITY The Regional District of Nanaimo and its employees contribute to the Municipal Pension Plan (a jointly trusteed
pension plan). The board of trustees, representing plan members and employers, is responsible for administering the plan, including investment of assets and administration of benefits. The plan is a multi-employer contributory pension plan. Basic pension benefits are based on a formula. As at December 31, 2018, the plan has about 197,000 active members and approximately 95,000 retired members. Active members include approximately 39,000 contributors from the local governments.
Every three years, an actuarial valuation is performed to assess the financial position of the plan and the
adequacy of plan funding. The actuary determines an appropriate combined employer and member contribution rate to fund the plan. The actuary’s calculated contribution rate is based on the entry-age normal cost method, which produces the long-term rate of member and employer contributions sufficient to provide benefits for average future entrants to the plan. This rate may be adjusted for the amortization of any actuarial funding surplus and will be adjusted for the amortization of any unfunded actuarial liability. The most recent valuation for the Municipal Pension Plan was at December 31, 2015, indicated a $2.224 billion funding surplus for basic pension benefits on a going concern basis. As a result of the 2015 basic account actuarial valuation surplus and pursuant to the joint trustee agreement, $1.927 billion was transferred to the rate stabilization account and $297 million of the surplus ensured the required contribution rates remained unchanged. The Regional District of Nanaimo paid $2,175,914 (2017, $2,036,380) for employer contributions to the Plan in fiscal 2018.
2018 2017
Employer Portion
$ 2,175,914 $ 2,036,380
Employee Portion 1,921,741 1,782,863
$ 4,097,655 $ 3,819,243
21. CONTINGENT LIABILITIES Contingent liabilities are recognized by the Regional District in accordance with PS 3300.15. As at December 31,
2018, there were outstanding claims against the Regional District, however, no liability has been accrued because amounts are undeterminable and the likelihood of the Regional District having to make payment is uncertain.

REGIONAL DISTRICT OF NANAIMO NOTES TO CONSOLIDATED FINANCIAL STATEMENTS for the year ended December 31, 2018
- 23 -
22. ENVIRONMENTAL REGULATIONS The Regional District is subject to environmental regulations which apply to a number of its operations. These
regulations may require future expenses to meet applicable standards and subject the Regional District to possible penalties for violations. Amounts required to meet these obligations will be charged to operations when incurred and/or when they can be reasonably estimated.
23. EXPENSES BY OBJECT
24. ARROWSMITH WATER SERVICE AND ENGLISHMAN RIVER WATER SERVICE JOINT VENTURES
The Arrowsmith Water Service (AWS) was formed in 1996 as a joint venture between the Regional District of Nanaimo, the City of Parksville and the Town of Qualicum Beach. The AWS was established to develop a bulk water supply available to the participants in the service and to construct the Arrowsmith Dam as a first step in that development as well as to provide for protection of the fisheries habitat of the Englishman River. The Englishman River Water Service (ERWS) is a joint venture between the City of Parksville and the Regional District of Nanaimo, formed to secure a bulk water supply from the Englishman River. This regional partnership supplements existing well supply sources owned and operated by the City of Parksville and Nanoose Bay Peninsula Water Service Area. The ERWS development plan includes a new river water supply intake, new water treatment plant and distribution system.
Financial results and budget for the joint ventures are consolidated in the Regional District of Nanaimo’s financial statements proportionately based on the joint venture agreements: 22.4% of the Arrowsmith Water Service and 26% of the Englishman River Water Service. The following table summarizes the financial statements of the two joint ventures.
Budget 2018 2017
Operating goods and services $ 36,984,174 $ 33,994,163 $ 34,053,190
Wages and benefits 34,034,730 33,100,265 30,547,859
Debt interest 1,507,439 1,507,439 1,253,676
Amortization expense - 7,335,406 7,216,168
Unfunded expenditures (Note 9) - 2,255,728 2,290,731
Total Expenditures by Object $ 72,526,343 $ 78,193,001 $ 75,361,624
Englishman
Arrowsmith River Water
Water Service Service
2018 2018
Financial assets $ 369,630 $ 3,127,772
Non-financial assets 6,457,416 33,855,482
Accumulated surplus 6,827,046 36,983,254
Revenues
Joint venturer contributions $ 110,087 $ 6,341,942
Capital grant - 4,492,229
110,087 10,834,171
Expenses
Operating 80,087 16,708
Annual surplus (deficit) $ 30,000 $ 10,817,463

REGIONAL DISTRICT OF NANAIMO NOTES TO CONSOLIDATED FINANCIAL STATEMENTS for the year ended December 31, 2018
- 24 -
25. CONTAMINATED SITES At the reporting date, only one site was identified as potentially contaminated due to past industrial use at
this site and on the neighbouring property; these findings remain unchanged from the December 31, 2015 year end. For this site there is insufficient information to determine whether contamination exceeding the relevant environmental standard is likely to exist, or whether remediation is required. The future cost and responsibility for remediation of this site is not currently determinable.
26. SUBSEQUENT EVENTS On March 26, 2019, the decision was made to discontinue the Bowser Village Centre Sewer Servicing project. The RDN was awarded a joint Federal and Provincial Clean Water and Wastewater Fund of up to $7.6 million, with $2.4 million being received in 2017. Development Cost Charges towards the project in the amount of $2.6 million were received in 2018. Project funding will be returned in 2019, and the design cost of $0.3 million will be written off.
27. COMMITMENTS As at December 31, 2018, the regional district had the following significant commitments:
NAC Constructors Ltd. – for the Greater Nanaimo Pollution Control Centre Secondary Treatment Upgrade. Scheduled for completion in 2019, this project has a remaining commitment of $26,974,439. Circular Waste British Columbia Inc. – for the Solid Waste Organics Processing Agreement. This 20-year agreement, which expires December 7, 2038, provides for a minimum payment of $1,350,000 in the first year and is adjusted for inflation in each of the subsequent years.
28. COMPARATIVE FIGURES Certain comparative figures have been reclassified to conform to the presentation adopted in the current year.

R E G I O N A L D I S T R I C T O F N A N A I M O 2 0 1 8 A N N U A L R E P O R Tlvi

REGIONAL DISTRICT OF NANAIMO 2018 ANNUAL REPORT
SUPPORTING SCHEDULES

Parks, Recreation, and Culture includes operations and development of community and regional parks, provision of
recreation programming, operation of a multiplex arena and aquatic centre and includes some services provided by
agreement with municipalities within the Regional District of Nanaimo. Detailed revenue and expenditure information
on parks, recreation & culture services is found on Schedules D and D-1, Pgs. 45-46 of this report.
Water, Sewer, and Street lighting includes neighbourhood water supply, sewage collection systems and street lights.
Only taxpayers within these areas pay for the service. Detailed revenue and expenditure information on these services
can be found on Schedules C-2, C-3 and C-4 (Pgs. 42-44) of this report.
Public Transportation includes conventional and HandyDart bus service. Public transit services are available to the City of
Nanaimo, City of Parksville, Town of Qualicum Beach, Electoral Area G and portions of Electoral Areas A, E and C.
Detailed revenue and expenditure information on transportation services is found on Schedule E, Pg. 47 of this report.
Protective Services includes volunteer and contract fire protection services, emergency planning, bylaw enforcement and
the Regional District’s participation in E911 services. Detailed revenue and expenditure information on protective
services is found on Schedules E-1 and E-2, Pgs. 48-49 of this report.
REGIONAL DISTRICT OF NANAIMOCONSOLIDATED SCHEDULE OF REVENUE AND EXPENSES BY SEGMENT
as at December 31, 2018
Wastewater and Solid Waste includes sewage treatment plants and solid waste disposal activities, including programs for
garbage collection and recycling. The Regional District operates two treatment plants in both the northern and southern
portions of the Regional District. A solid waste landfill and transfer station are funded at a regional level, with garbage
collection & recycling services provided in areas outside of the City of Nanaimo. Detailed revenue and expenditure
information on wastewater treatment plants is found on Schedule C-1, Pg. 41 of this report. Detailed revenue and
expenditure information on solid waste management is found on Schedule C, Pg. 40.
PS2700 requires that governments define and disclose additional information related to its activities, by segment.
Regional Districts are required by the Local Government Act to charge or allocate all expenses directly or reasonably
attributable to a service, to that service. The information in these financial statements conforms in all respects to the
requirements of the Local Government Act.
For the purposes of PS2700 the segmented information above corresponds to the classification of expenses shown on
the Consolidated Statement of Operations. The expense classifications on the Consolidated Statement of Operations
represent the major activities provided by the Regional District of Nanaimo.
General Government includes overall administration, legislative services including elections and feasibility studies. These
services are paid for by multiple member jurisdictions of the Regional District and affect most taxpayers residing in the
Regional District of Nanaimo. Schedule A on Pg. 37 of this report provides additional details with respect to revenues and
expenditures for services falling under General Government.
Strategic and Community Development includes community and regional land use planning, house numbering and
building inspection. Planning & Development services are largely paid for by Electoral Areas of the Regional District of
Nanaimo. Schedules B and B-1 on Pgs. 38-39 of this report provide additional details with respect to revenues and
expenditures for each of these services.
The following activities are included in the segments shown on Pg. 26:
See notes to consolidated financial statements
- 25 -

General
Government
Strategic &
Community
Development
Wastewater &
Solid Waste
Water, Sewer &
Street lighting
Public
Transportation
Protective
Services
Parks,
Recreation &
Culture 2018 Total 2017 Total Revenues
Property taxes 2,376,586$ 2,171,638$ 13,430,531$ 4,935,455$ 10,416,051$ 6,004,615$ 10,839,337$ 50,174,213$ 48,026,015$ Operating revenues 20,327 1,845,475 15,160,038 1,600,257 5,048,285 164,835 1,783,444 25,622,661 24,712,090 Government transfers and grants 372,860 213,120 6,363,901 1,047,056 5,954,301 103,608 306,464 14,361,310 9,287,684 Developer contributions - - 5,483,168 8,420 - - 32,303 5,523,891 2,535,951 Other income 437,756 10,236 1,027,829 270,276 40,190 297,099 187,342 2,270,728 1,111,434 Investment income 510,553 18,621 729,912 102,206 77,526 69,298 165,370 1,673,486 894,664 Payment in lieu of taxes 83,394 10,259 252,297 75 207,555 14,627 27,359 595,566 197,398
3,801,476 4,269,349 42,447,676 7,963,745 21,743,908 6,654,082 13,341,619 100,221,855 86,765,236
ExpensesOperating goods & services (956,104) 1,114,740 13,333,708 2,832,857 8,214,479 4,313,773 5,140,710 33,994,163 34,053,190 Wages and benefits 4,272,380 2,522,710 6,510,088 1,641,133 12,714,225 804,544 4,635,185 33,100,265 30,547,859 Debt interest - - 577,372 352,848 - 170,713 406,506 1,507,439 1,253,676 Amortization expense 356,751 16,631 4,117,101 882,363 344,159 544,416 1,073,985 7,335,406 7,216,168 Unfunded expenses 271,845 - 1,983,883 - - - - 2,255,728 2,290,731
3,944,872 3,654,081 26,522,152 5,709,201 21,272,863 5,833,446 11,256,386 78,193,001 75,361,624
Surplus (deficit) for the year (143,396)$ 615,268$ 15,925,524$ 2,254,544$ 471,045$ 820,636$ 2,085,233$ 22,028,854$ 11,403,612$
General
Government
Strategic &
Community
Development
Wastewater &
Solid Waste
Water, Sewer &
Street lighting
Public
Transportation
Protective
Services
Parks,
Recreation &
Culture 2017 Total 2016 TotalRevenues
Property taxes 1,848,448$ 2,279,592$ 13,257,879$ 4,721,047$ 10,059,399$ 5,389,851$ 10,469,799$ 48,026,015$ 45,498,181$ Operating revenues - 1,658,064 14,832,546 1,533,423 4,613,062 320,412 1,754,583 24,712,090 22,975,645 Government transfers and grants 490,057 109,992 732,834 1,317,404 5,647,224 - 990,173 9,287,684 15,735,117 Developer contributions 130,718 - 96,142 33,891 - - 2,275,200 2,535,951 4,853,756 Other income 199,659 11,865 345,991 191,922 17,003 256,459 88,535 1,111,434 923,198 Investment income 301,018 8,561 378,402 49,206 39,026 38,410 80,041 894,664 949,436 Payment in lieu of taxes 77,470 5,876 51,372 66 43,306 12,375 6,933 197,398 319,413
3,047,370 4,073,950 29,695,166 7,846,959 20,419,020 6,017,507 15,665,264 86,765,236 91,254,746
ExpensesOperating goods & services (992,070) 1,101,648 13,676,468 2,843,012 8,611,633 4,107,260 5,548,349 34,053,190 31,956,377 Wages and benefits 4,197,736 2,184,435 5,979,112 1,531,255 10,645,741 688,353 4,478,117 30,547,859 29,012,116 Debt interest - - 368,630 310,292 - 168,065 406,689 1,253,676 1,018,253 Amortization expense 352,495 18,731 4,105,471 881,594 344,111 508,101 1,005,665 7,216,168 6,846,859 Unfunded expenses 202,919 - 2,087,812 - - - - 2,290,731 230,538
3,761,080 3,304,814 26,217,493 5,566,153 19,601,485 5,471,779 11,438,820 75,361,624 69,064,143
Surplus (deficit) for the year (713,710)$ 769,136$ 3,477,673$ 2,280,806$ 817,535$ 545,728$ 4,226,444$ 11,403,612$ 22,190,603$
CONSOLIDATED SCHEDULE OF REVENUE AND EXPENSES BY SEGMENTas at December 31, 2017
REGIONAL DISTRICT OF NANAIMOCONSOLIDATED SCHEDULE OF REVENUE AND EXPENSES BY SEGMENT
as at December 31, 2018
REGIONAL DISTRICT OF NANAIMO
See notes to consolidated financial statements
- 26 -

Land Land Buildings Engineered Equipment, Assets Under Total TotalImprovements Structures Furniture & Construction 2018 2017
Vehicles
COSTBalance, beginning of year 42,610,826$ 13,679,456$ 52,033,552$ 160,320,668$ 24,574,562$ 19,759,671$ 312,978,735$ 293,099,822$ Add:
Additions 579,973 127,498 146,854 691,107 3,992,275 38,129,320 43,667,027 20,700,693 Less:
Disposals - - - - 357,506 81,551 439,057 821,780
Balance, end of year 43,190,799 13,806,954 52,180,406 161,011,775 28,209,331 57,807,440 356,206,705 312,978,735
ACCUMULATED AMORTIZATIONBalance, beginning of year -$ 2,487,661$ 20,211,997$ 63,007,888$ 16,159,365$ -$ 101,866,911 94,872,562$ Add:
Amortization - 422,534 1,580,535 3,800,688 1,531,649 - 7,335,406 7,216,168 Less:
Accumulated amortization - - - - 352,531 - 352,531 221,819 on disposals
Balance, end of year - 2,910,195 21,792,532 66,808,576 17,338,483 - 108,849,786 101,866,911
NET BOOK VALUE OF TANGIBLECAPITAL ASSETS 43,190,799$ 10,896,759$ 30,387,874$ 94,203,199$ 10,870,848$ 57,807,440$ 247,356,919$ 211,111,824$
REGIONAL DISTRICT OF NANAIMOCONSOLIDATED SCHEDULE OF TANGIBLE CAPITAL ASSETS
AS AT DECEMBER 31, 2018
See notes to consolidated financial statements
- 27 -

2014 2015 2016 2017 2018REGIONAL DISTRICT
RAVENSONG AQUATIC CENTRE 313,224 - - - $ -
OCEANSIDE PLACE ARENA 3,954,686 3,580,996 3,192,358 2,788,175 2,367,824
REGIONAL PARKS 1,984,688 1,912,964 1,838,371 1,760,795 1,680,115
COMMUNITY PARKS 310,004 285,373 259,679 232,873 204,906
WASTEWATER MANAGEMENT 5,000,000 19,813,921 19,064,025
FIRE PROTECTION 4,352,441 4,160,535 4,189,644 3,994,473 3,791,669
SEWER SERVICES 1,822,604 1,956,994 1,848,406 1,735,515 1,618,149
WATER SUPPLY SERVICES 2,891,369 2,587,690 3,176,528 4,532,574 6,954,583
VANCOUVER ISLAND REGIONAL LIBRARY 15,957,989 15,582,525 15,192,042 14,785,940 14,363,594
TOTAL REGIONAL DISTRICT 31,587,005 30,067,078 34,697,031 49,644,266 50,044,866
MEMBER MUNICIPALITIES 52,213,097 53,520,830 49,751,819 45,845,012 49,029,976
TOTAL LONG-TERM DEBT (Pg. 3) 83,800,102 83,587,908 84,448,850 95,489,278 $ 99,074,842
REGIONAL DISTRICT OF NANAIMO
LONG-TERM DEBT SUMMARY BY FUNCTION
DECEMBER 31, 2018
See notes to consolidated financial statements
- 28 -

REGIONAL DISTRICT OF NANAIMOSCHEDULE OF LONG-TERM DEBT
DECEMBER 31, 2018
BYLAW MATURITY INTEREST ORIGINAL 2018 DEBT 2017 DEBT
FUNCTION ISSUER FUNDS NUMBER DATE RATE VALUE O/S O/S
OCEANSIDE PLACE ARENA
MFA 97 CDN 1365 Apr 19,2023 4.830 6,470,646 2,367,824 2,788,175
TOTAL OCEANSIDE PLACE ARENA 6,470,646 2,367,824 2,788,175
REGIONAL PARKS
MFA 126 CDN 1629 Sep 26,2033 3.850 2,053,653 1,680,115 1,760,795
TOTAL REGIONAL PARKS 2,053,653 1,680,115 1,760,795
COMMUNITY PARKS
ELECTORAL AREA B
MFA 78 CDN 1299 Dec 03, 2022 2.250 100,000 28,454 34,741
MFA 79 CDN 1303 Jun 03, 2023 5.250 80,000 27,793 32,583
MFA 81 CDN 1304 Apr 22, 2024 4.900 80,000 32,583 37,145
MFA 93 CDN 1305 Apr 06, 2025 5.100 80,000 32,676 36,891
MFA 97 CDN 1306 Apr 19, 2026 4.660 80,000 39,633 43,768
MFA 101 CDN 1307 Apr 11, 2027 2.250 80,000 43,768 47,745
TOTAL COMMUNITY PARKS 500,000 204,906 232,873
FIRE PROTECTION SERVICES
MEADOWOOD FIRE
MFA 110 CDN 1587 Apr 08, 2030 4.500 1,773,410 1,224,664 1,303,033
NANAIMO RIVER FIRE
MFA 99 CDN 1488 Apr 19,2027 4.430 20,761 10,285 11,358
NANOOSE BAY FIRE
MFA 130 CDN 1617 Oct 14, 2034 3.000 2,790,000 2,392,136 2,497,528
COOMBS-HILLIERS FIRE
MFA 139 CDN 1538 Oct 5, 2026 2.100 200,000 164,584 182,554
TOTAL FIRE PROTECTION SERVICES 4,784,171 3,791,669 3,994,473
SEWER SERVICES
BARCLAY CRESCENT SEWER
MFA 102 CDN 1486 Dec 01, 2027 4.820 895,781 490,086 534,615
CEDAR SEWER
MFA 106 CDN 1571 Oct 13, 2029 4.130 926,180 597,026 639,592
MFA 106 CDN 1572 Oct 13, 2029 4.130 27,200 17,533 18,784
MFA 106 CDN 1573 Oct 13, 2029 4.130 108,800 70,134 75,134
MFA 106 CDN 1574 Oct 13, 2029 4.130 61,200 39,450 42,263
MFA 110 CDN 1584 Apr 08, 2030 4.500 232,286 160,410 170,675
MFA 117 CDN 1626 Oct 12, 2031 3.250 51,620 37,928 40,122
1,407,286 922,481 986,570
HAWTHORNE RISE SEWER
MFA 131 CDN 1696 Apr 8, 2035 2.200 173,300 154,265 160,829
REID ROAD SEWER
MFA 133 CDN 1709 Oct 2, 2035 2.750 57,650 51,318 53,501
TOTAL SEWER SERVICES 2,534,017$ 1,618,149$ 1,735,515$
See notes to consolidated financial statements
- 29 -

BYLAW MATURITY INTEREST ORIGINAL 2018 DEBT 2017 DEBT
FUNCTION ISSUER FUNDS NUMBER DATE RATE VALUE O/S O/S
WATER - SAN PAREIL
MFA 81 CDN 1367 Apr 22, 2019 4.900 89,476 8,210 16,029
MFA 97 CDN 1395 Apr 19, 2021 4.660 40,000 9,984 13,059
MFA 106 CDN 1395 Oct 13, 2024 4.130 94,439 44,526 50,981
MFA 117 CDN 1395 Oct 12, 2026 3.250 49,056 29,706 32,806
272,971 92,426 112,875
WATER - SAN PAREIL FIRE IMPROVEMENTS
MFA 127 CDN 1689 Apr 07, 2034 3.300 1,114,600 955,654 997,758
1,114,600 955,654 997,758
WATER - DRIFTWOOD
MFA 80 CDN 1301 Oct 03, 2023 4.900 100,614 34,954 40,979
100,614 34,954 40,979
WATER - MELROSE TERRACE
MFA 103 CDN 1539 Apr 23, 2018 4.650 14,349 - 1,701
14,349 - 1,701
BULK WATER - FRENCH CREEK
MFA 69 CDN 1127 Sep 24, 2018 4.650 503,655 - 38,490
503,655 - 38,490
BULK WATER - NANOOSE
MFA 69 CDN 1128 Sep 24, 2018 4.650 864,095 - 66,035
MFA 74 CDN 1226 Jun 01, 2021 5.900 2,195,223 479,701 624,621
MFA 80 CDN 1239 Oct 03, 2023 4.900 176,295 61,246 71,802
MFA 142 CDN 1242 Oct 04, 2037 3.150 168,875 162,590 168,875
MFA 142 CDN 1244 Oct 04, 2037 3.150 1,476,000 1,421,070 1,476,000
MFA 146 CDN 1243 Sep 19, 2038 3.200 2,536,370 2,536,370 -
MFA 146 CDN 1245 Sep 19, 2038 3.200 314,142 314,142 -
7,731,000 4,975,119 2,407,333
NANOOSE BAY PENINSULA WATER
MFA 139 CDN 1723 Oct 05, 2036 2.100 350,000 323,558 336,975
MFA 139 CDN 1750 Oct 05, 2036 2.100 557,200 515,105 536,463
907,200 838,663 873,438
WESTURNE HEIGHTS
MFA 142 CDN 1720 Oct 04, 2037 3.150 60,000 57,767 60,000
60,000 57,767 60,000
TOTAL WATER SUPPLY MANAGEMENT 10,704,389 6,954,583 4,532,574
WASTEWATER SERVICES
SOUTHERN COMMUNITY WASTEWATER
MFA 139 CDN 1742 Oct 05, 2036 2.100 5,000,000 4,622,261 4,813,921
MFA 142 CDN 1762 Oct 04, 2037 3.150 15,000,000 14,441,764 15,000,000
TOTAL WASTWATER MANAGEMENT 20,000,000 19,064,025 19,813,921
DEBT HELD FOR OTHER JURISDICTIONS
VANCOUVER ISLAND REGIONAL LIBRARY
MFA 117 CDN 1634 Oct 12, 2041 3.250 8,000,000 6,873,381 7,053,867
MFA 126 CDN 1674 Sep 26, 2038 3.850 8,610,000 7,490,213 7,732,073
TOTAL - VANCOUVER ISLAND REGIONAL LIBRARY 16,610,000$ 14,363,594$ 14,785,940$
TOTAL LONG-TERM DEBT - REGIONAL DISTRICT 63,656,876$ 50,044,866$ 49,644,266$
REGIONAL DISTRICT OF NANAIMOSCHEDULE OF LONG-TERM DEBT
DECEMBER 31, 2018
See notes to consolidated financial statements
- 30 -

BYLAW MATURITY INTEREST ORIGINAL 2018 DEBT 2017 DEBT
FUNCTION ISSUER FUNDS NUMBER DATE RATE VALUE O/S O/S
CITY OF PARKSVILLE
MFA 68 CDN 1109 Mar 24, 2018 4.650 1,200,000 - 91,706
MFA 69 CDN 1129 Sep 24, 2018 4.650 1,970,000 - 150,550
MFA 74 CDN 1227 Jun 01, 2021 5.900 290,000 63,371 82,516
MFA 75 CDN 1238 Dec 01, 2021 5.690 1,050,000 229,446 298,763
MFA 78 CDN 1283 Dec 03, 2022 2.250 765,000 217,670 265,767
MFA 93 CDN 1420 Apr 06, 2025 5.100 800,000 326,755 368,908
MFA 145 CDN 1745 Apr 23, 2043 3.150 4,000,000 4,000,000 -
TOTAL CITY OF PARKSVILLE 10,075,000 4,837,242 1,258,210
TOWN OF QUALICUM BEACH
MFA 136 CDN 1729 Nov 30, 2025 2.750 4,629,364 3,240,555 3,703,491
TOTAL TOWN OF QUALICUM BEACH 4,629,364 3,240,555 3,703,491
CITY OF NANAIMO
MFA 72 CDN 1197 Jun 01, 2020 6.450 4,500,000 658,564 966,732
MFA 73 CDN 1219 Dec 01, 2020 6.360 4,100,000 600,025 880,801
MFA 99 CDN 1489 Oct 19, 2026 4.430 15,000,000 7,431,107 8,206,571
MFA 101 CDN 1489 Apr 11, 2027 2.250 15,000,000 8,206,571 8,952,209
MFA 102 CDN 1530 Dec 01, 2027 2.250 3,750,000 2,051,643 2,238,052
MFA 126 CDN 1688 Sep 26, 2033 3.850 13,300,000 10,880,868 11,403,371
MFA 127 CDN 1694 Apr 07, 2034 3.300 9,200,000 7,888,046 8,235,575
MFA 146 CDN 1774 Sep 19, 2038 3.200 3,235,354 3,235,354 -
TOTAL CITY OF NANAIMO 68,085,354 40,952,179 40,883,311
TOTAL LONG-TERM DEBT - MEMBER MUNICIPALITIES 82,789,718$ 49,029,976$ 45,845,012$
TOTAL LONG-TERM DEBT 146,446,594$ 99,074,842$ 95,489,278$
REGIONAL DISTRICT OF NANAIMO
DECEMBER 31, 2018SCHEDULE OF LONG-TERM DEBT
See notes to consolidated financial statements
- 31 -

Balance
December 31,
2017
Interest
Income
Contributions
by Developers
& Others
MFA surplus
and refunds
Contributions
from/(to)
Operating Fund
Transfers to
Capital Funds
Feasibility,
legal & other
costs or
transfers
Balance
December 31,
2018
2018 ACTIVITYFeasibility Studies 173,429$ - - - 16,240 - - 189,669$ Administration Information Systems/Building 2,287,506$ 43,201 - - 182,945 (97,010) - 2,416,642$ Local Government Elections 54,611$ 1,017 - - - - - 55,628$ Regional Growth Strategy 159,973$ 3,430 - - 50,000 - - 213,403$ Building Inspection 345,095$ 7,329 - 100,000 - - 452,424$ Community Planning 312,593$ 6,387 - - (15,000) - - 303,980$ Carbon Action Revenue Incentive Program 404,174$ 8,445 101,643 - (11,840) - 502,422$ Carbon Neutral 54,066$ 1,007 - - - - 55,073$ Hazardous Properties -$ 244 27,058 27,302$
3,791,447$ 71,060$ 101,643$ -$ 349,403$ 97,010-$ -$ 4,216,543$
Wastewater & Solid Waste ManagementSolid Waste Management 2,635,516$ 58,577 - - 1,341,430 (83,625) - 3,951,898$ Solid Waste Collection & Recycling 427,219$ 8,911 - - 100,000 - - 536,130$ Nanoose Wastewater 1,036,786$ 20,216 - - 176,000 - - 1,233,002$ Northern Community Wastewater 11,948,795$ 243,615 24,110 - 2,382,379 (41,534) - 14,557,365$ Southern Community Wastewater 23,208,330$ 358,149 - - 2,125,000 (17,402,114) - 8,289,365$ Duke Point Wastewater 215,991$ 4,295 - - 30,000 - - 250,286$
39,472,637$ 693,763 24,110 - 6,154,809 (17,527,273) - 28,818,046$
Water, Sewer & Street lightingSurfside Sewer 8,054$ 268 - - 15,000 - 23,322$ Pacific Shores Sewer 54,506$ 1,087 - - 8,000 - - 63,593$ French Creek Sewer 490,493$ 9,345 8,420 - - 508,258$ Cedar Sewer Collection 86,975$ 1,980 - - 40,000 - - 128,955$ Barclay Cres Sewer 5,014$ 39 10,000 15,053$ Cedar Estates Stormwater 22,803$ 470 - - 5,000 - - 28,273$ Englishman River Stormwater 26,300$ 544 - - 6,000 - - 32,844$ French Creek Water 188,769$ 3,525 - - 10,000 (13,220) - 189,074$ Madrona Water 215,021$ 4,006 - - - - - 219,027$ Surfside Water 3,511$ 11 - - 17,850 - - 21,372$ Decourcey Water 18,328$ 360 - - 3,000 - - 21,688$ Melrose Water 11,202$ 241 - - 6,196 - - 17,639$ Nanoose Bay Peninsula Water 780,975$ 16,195 - - 200,000 (10,777) - 986,393$ Nanoose Bay Water 66,699$ 1,243 - - - - - 67,942$ Englishman River Water 290,072$ 5,720 - - 35,000 - - 330,792$ San Pareil Water 27,817$ 1,147 - - 70,000 - - 98,964$ Whiskey Creek Water 39,825$ 1,019 - - 25,000 (8,900) - 56,944$ Nanoose AWS Bulk Water 1,804,870$ 38,025 - 734,964 (299,489) - 2,278,370$
RESERVE ACCOUNT ACTIVITY - 2018SCHEDULE OF STATUTORY RESERVE FUND ACTIVITY AND FUND BALANCES
AS AT DECEMBER 31, 2018
See notes to consolidated financial statements
- 32 -

Balance
December 31,
2017
Interest
Income
Contributions
by Developers
& Others
MFA surplus
and refunds
Contributions
from/(to)
Operating Fund
Transfers to
Capital Funds
Feasibility,
legal & other
costs or
transfers
Balance
December 31,
2018
RESERVE ACCOUNT ACTIVITY - 2018SCHEDULE OF STATUTORY RESERVE FUND ACTIVITY AND FUND BALANCES
AS AT DECEMBER 31, 2018
French Creek AWS Bulk Water 805,517$ 13,985 - (35,379) - 784,123$ Westurne Heights Water -$ 55 8,000 8,055$ Drinking Water/Watershed Protection 45,500$ 1,073 - - 25,000 - - 71,573$ Englishman River Street lighting 8,346$ 133 - - 500 - - 8,979$ Fairwinds Street lighting 34,684$ 664 - - 2,000 - - 37,348$ Morningstar Street lighting 10,693$ 181 - - (3,700) - - 7,174$ Rural EA E & G Street lighting 13,016$ 237 - - (1,000) - - 12,253$
5,058,990$ 101,553 8,420 - 1,181,431 (332,386) - 6,018,008$
Public TransportationTransit 3,736,425$ 73,441 - 550,000 (14,271) - 4,345,595$ Descanso Bay Emergency Wharf 14,532$ 264 - - - - 14,796$ Green's Landing Wharf 203,762$ 3,821 207,583$
3,954,719$ 77,526 - - 550,000 (14,271) - 4,567,974$
Protective ServicesCoombs Hilliers Fire 711,814$ 11,947 - - 351,456 (383,867) - 691,350$ Errington Fire 831,902$ 4,720 - - 160,570 (807,675) - 189,517$ Extension Fire 574,723$ 11,009 - - 52,273 - - 638,005$ Nanoose Fire 323,786$ 6,622 - - 193,022 (62,273) - 461,157$ Dashwood Fire 499,730$ 10,016 30,000 - 269,936 (193,489) - 616,193$ Bow Horn Bay Fire 411,142$ 8,112 - - 54,186 - - 473,440$ Nanaimo River Fire 155,909$ 3,052 - - 16,160 - - 175,121$ Cassidy Waterloo Fire 268,995$ 5,667 - - 98,162 (15,096) - 357,728$ Emergency Planning 93,191$ 2,133 - - 45,000 (4,543) - 135,781$ Bylaw Enforcement 122,396$ 2,172 - - 17,210 - - 141,778$ District 68 911 Service 129,866$ 2,346 - - - (11,636) - 120,576$
4,123,454$ 67,796 30,000 - 1,257,975 (1,478,579) - 4,000,646$
Parks, Recreation & CultureArea A Recreation & Culture 615,088$ 13,033 - - 175,000 - - 803,121$ Area B Recreation 61,807$ 1,260 - 12,000 - - 75,067$ Extension Recreation 35,671$ 659 - - - - (453) 35,877$ Community Parks 906,102$ 17,503 - 102,000 (90,087) - 935,518$ Regional Parks Capital 3,606,871$ 62,901 - - 751,214 (689,543) - 3,731,443$ Regional Parks Development 70,286$ 2,210 - - 30,000 - - 102,496$ Recreation & Culture 1,738,478$ 36,677 - - 738,400 (129,464) - 2,384,091$ Parkland Acquisition 1,658,185$ 31,127 32,303 - 1,721,615$
8,692,488$ 165,370 32,303 - 1,808,614 (909,094) (453) 9,789,228$
TOTAL ALL RESERVE FUNDS 65,093,735$ 1,177,068 196,476 - 11,302,232 (20,358,613) (453) 57,410,445$
See notes to consolidated financial statements
- 33 -

Northern Southern BulkWastewater Wastewater Water Sewer Total Total
2013 ACTIVITY DCCs DCCs DCCs DCCs 2018 2017(1) (2) (3) (4)
ASSETS:
Due from Revenue Fund 10,900,332$ 768,866$ 800,757$ 3,140,467$ 15,610,422$ 17,302,376$
Developer Installments Receivable - 159,067 - - 159,067 122,591
DEFERRED REVENUE BALANCE (Note 10) 10,900,332 927,933 800,757 3,140,467 15,769,489 17,424,967
ACTIVITY:Balance, Beginning of the year 9,042,500 4,585,287 776,135 3,021,045 17,424,967 12,070,854 Add:
Contribution by developers & others 1,754,564 1,674,811 10,048 $62,860.72 3,502,284 5,255,743 Interest earned 180,480 49,682 14,573 56,561 301,296 127,503
Less: Transfer DCCs to Revenue Fund (77,213) (5,381,845) - (5,459,058) (29,133)
BALANCE, End of the year 10,900,331$ 927,935$ 800,756$ 3,140,467$ 15,769,489$ 17,424,967$
(1) Northern Wastewater DCC collection areas include the City of Parksville, Town of Qualicum Beach, portions of Electoral Area G and portions of Electoral Area E.
(2) Southern Wastewater DCC collection areas include the City of Nanaimo and the District of Lantzville.
(3) Bulk Water service areas have been established in the French Creek area of Electoral Area G and the Nanoose Bay Peninsula in Electoral Area E.
(4) Sewer DCC collection area includes properties in Electoral Area A (Cedar) and G (French Creek).
SCHEDULE OF DEVELOPMENT COST CHARGES RESERVE ACCOUNT BALANCES-DEC 31, 2018
REGIONAL DISTRICT OF NANAIMO
See notes to consolidated financial statements
- 34 -

COMMUNITY OTHERWORKS GAS TAX TOTAL TOTAL
PROGRAM2 PROGRAMS3 2018 2017
Opening balance of unspent (spent) funds 8,310,258$ -$ 8,310,258$ 6,130,430$
Add:Amount received during the year 1,756,237 5,100,000 6,856,237 3,698,687 Interest earned 156,393 - 156,393 67,153
Less:Amount spent on projects (Notes 2 & 3) (841,875) (6,000,000) (6,841,875) (1,586,012)
Closing balance of unspent (spent) funds 9,381,013$ (900,000)$ 8,481,013$ 8,310,258$
(see note 10) (see note 3)Notes to Schedule:
1. Gas Tax Revenue Transfer Programs
2. Community Works Program 2018 Activity
3. Other Gas Tax Programs 2018 Activity
Year Total Approved Grant Amount AmountApproved Project value Grant Expended Received
to date to date
Regionally Significant Strategic Priorities Fund
Greater Nanaimo Pollution Control Centre -
Secondary Treatment Upgrade 2018 78,979,127 6,000,000 6,000,000 5,100,000
Total Other Gas Tax Program Activity 78,979,127$ 6,000,000$ 6,000,000$ 5,100,000$
Project
REGIONAL DISTRICT OF NANAIMO
SCHEDULE OF RECEIPTS AND DISBURSEMENTSGAS TAX REVENUE TRANSFER PROGRAMS
DECEMBER 31, 2018(UNAUDITED)
The Regional District applied $153,000 towards park and trail projects at Huxley Community Park, E&N Regional Trail, the
Gabriola Village Trail, and Dunsmuir Community Park. In addition, $41,000 was expended on recreation facilities, $81,000 on
water system infrastructure, and $296,000 on wastewater facilities. $256,000 was spent on capital upgrades at the following
Community Halls: Lighthouse; Nanoose Place; Rollo Senior Centre, Little Qualicum and Cedar. As well, $10,000 was applied
towards the purchase of a new Gabriola Community Bus.
The Government of Canada, through the Union of BC Municipalities (UBCM), transfers Gas Tax Revenue funds to local
governments in British Columbia. The use of funding is established by agreements between the local government and the
UBCM. Funding may be used towards public transit, disaster mitigation, recreational, water, wastewater and solid waste
infrastructure and asset management or capacity building projects, as specified in the agreements.
Under this portion of the program, expenditures are reimbursed on a claims made basis. In 2018, the following projects were
completed during the year:
See notes to consolidated financial statements
- 35 -

Strategic & Regional & Recreation TransportationCorporate Community Community & Parks & Emergency Actual Budget ActualServices Development Utilities Services Services 2018 2018 2017
(Schedule A) (Schedule B) (Schedule C) (Schedule D) (Schedule E )REVENUES
Tax requisition 4,560,777$ 2,401,480$ 19,395,804$ 10,839,337$ 16,168,924$ 53,366,322$ 53,366,322$ 50,044,837$ Government transfers & grants 372,860 213,120 7,410,957 306,464 6,057,909 14,361,310 20,088,044 9,287,684 Payments in lieu of taxes 83,394 11,164 252,372 27,359 221,277 595,566 146,790 197,398 Investment income 446,104 - - - - 446,104 150,000 269,174 Operating revenues 20,327 1,980,976 7,549,347 1,783,444 5,077,619 16,411,713 15,755,723 15,757,906 Disposal fees - - 9,228,498 - - 9,228,498 8,200,000 9,183,048 Other revenues 10,969,052 1,278,267 33,854,291 1,301,022 4,132,964 51,535,596 73,189,006 28,556,125
16,452,514 5,885,007 77,691,269 14,257,626 31,658,693 145,945,109 170,895,885 113,296,172
EXPENSESGeneral administration 196,549 398,616 1,819,837 616,361 1,528,510 4,559,873 4,733,549 4,366,160 Professional fees 343,673 446,791 994,132 130,111 143,950 2,058,657 3,306,734 1,655,189 Community grants 116,340 - - - - 116,340 131,940 730,367 Legislative 745,940 - - 8 - 745,948 769,731 462,439 Program costs - 188,612 150,656 669,533 20,793 1,029,594 1,417,666 1,091,895 Vehicle and Equip operating 225,625 88,567 2,036,679 163,918 5,106,578 7,621,367 7,499,288 7,016,525 Building operating 404,015 37,313 1,516,463 712,070 467,067 3,136,928 3,329,755 3,122,063 Other operating 1,295,795 679,591 10,733,341 978,541 3,704,036 17,391,304 18,708,613 16,041,217 Wages & benefits 4,272,380 2,804,880 8,151,221 4,635,185 13,236,599 33,100,265 34,034,730 30,547,859 Capital expenses 355,653 40,736 40,262,602 1,406,406 1,962,390 44,027,787 72,943,091 19,314,823
7,955,970 4,685,106 65,664,931 9,312,133 26,169,923 113,788,063 146,875,097 84,348,537
OPERATING SURPLUS 8,496,544 1,199,901 12,026,338 4,945,493 5,488,770 32,157,046 24,020,788 28,947,635
Debt retirement - interest 2,593,741 - 930,220 406,506 170,713 4,101,180 4,778,205 4,260,584 - principal 3,188,060 - 1,138,218 417,350 178,738 4,922,366 4,958,634 4,376,812 Reserve contributions 357,218 756,055 9,190,573 2,667,561 2,091,162 15,062,569 10,433,016 12,657,542 Transfers to other govts 2,455,444 70,000 - 1,780,274 3,008,990 7,314,708 7,374,277 7,518,341
8,594,463 826,055 11,259,011 5,271,691 5,449,603 31,400,823 27,544,132 28,813,279 CURRENT YEAR
SURPLUS (DEFICIT) (97,919) 373,846 767,327 (326,198) 39,167 756,223 (3,523,344) 134,356
Prior year's surplus applied 1,144,342 1,713,657 5,474,439 1,721,590 2,243,396 12,297,424 12,146,812 12,163,068
NET OPERATING SURPLUS 1,046,423$ 2,087,503$ 6,241,766$ 1,395,392$ 2,282,563$ 13,053,647$ 8,623,468$ 12,297,424$
(UNAUDITED)
REGIONAL DISTRICT OF NANAIMOGENERAL REVENUE FUND
SCHEDULE OF REVENUE AND EXPENSESas at December 31, 2018
See notes to consolidated financial statements
- 36 -

Schedule A
Electoral Regional House Feasibility Municipal Community Actual Budget ActualAdministration Areas Library Numbering Studies Debt Transfers Works Projects 2018 2018 2017
REVENUESTax requisition 1,804,372$ 509,214$ 2,162,291$ 21,900$ 63,000$ -$ -$ 4,560,777$ 4,560,777$ 3,918,988$ Government transfers & grants 50,000 60,000 - - - - 262,860 372,860 212,500 490,057 Payments in lieu of taxes 83,394 - - - - - - 83,394 48,435 77,470 Investment income 446,104 - - - - - - 446,104 150,000 269,174 Operating revenues 20,327 - - - - - - 20,327 20,327 19,720 Other revenues 4,927,497 258,614 940,869 - 1,140 4,840,932 - 10,969,052 11,892,444 11,431,909
7,331,694 827,828 3,103,160 21,900 64,140 4,840,932 262,860 16,452,514 16,884,483 16,207,318
EXPENSESGeneral administration 129,094 65,955 - 1,500 - - - 196,549 231,893 169,290 Professional fees 307,351 12,871 - - 19,845 - 3,606 343,673 426,576 395,762 Community grants 116,340 - - - - - - 116,340 131,940 730,367 Legislative 436,945 308,995 - - - - - 745,940 768,231 462,429 Vehicle & Equip operating 223,495 2,130 - - - - - 225,625 236,051 207,630 Building operating 384,440 19,575 - - - - - 404,015 341,303 364,668 Other operating 1,033,125 242,270 - 20,400 - - - 1,295,795 1,469,367 607,128 Wages & benefits 4,024,353 248,027 - - - - - 4,272,380 4,466,200 4,197,736 Capital expenses 350,713 4,940 - - - - - 355,653 926,450 203,738
7,005,856 904,763 - 21,900 19,845 - 3,606 7,955,970 8,998,011 7,338,748
OPERATING SURPLUS 325,838 (76,935) 3,103,160 - 44,295 4,840,932 259,254 8,496,544 7,886,472 8,868,570
Debt retirement - interest - 591,485 - - 2,002,256 - 2,593,741 2,966,469 3,006,908 - principal - 349,384 - - 2,838,676 - 3,188,060 3,188,064 3,187,012 Reserve contributions 319,778 1,195 - - 36,245 - - 357,218 209,770 468,243 Transfers to other govts/orgs 33,900 - 2,162,292 - - - 259,252 2,455,444 2,296,191 2,431,027
353,678 1,195 3,103,161 - 36,245 4,840,932 259,252 8,594,463 8,660,494 9,093,190 CURRENT YEAR
SURPLUS (DEFICIT) (27,840) (78,130) (1) - 8,050 - 2 (97,919) (774,022) (224,620)
Prior year's surplus applied 942,928 212,633 - - (11,219) - - 1,144,342 1,144,342 1,368,962
ENDING SURPLUS (DEFICIT) 915,088$ 134,503$ (1)$ -$ (3,169)$ -$ 2$ 1,046,423$ 370,320$ 1,144,342$
(UNAUDITED)
REGIONAL DISTRICT OF NANAIMOCORPORATE SERVICES
SCHEDULE OF REVENUE AND EXPENSES BY SERVICEas at December 31, 2018
- 37 -

Schedule B
Regional VIHA Economic EconomicCommunity Growth Health Network Strategic Development Development Building Bylaw Actual Budget Actual
Planning Management Funding Initiatives Southern Northern Inspection Enforcement 2018 2018 2017(Schedule B-1)
REVENUESTax requisition 1,625,045$ 433,857$ -$ -$ 65,000$ 25,836$ -$ 251,742$ 2,401,480$ 2,401,480$ 2,517,251$ Government transfers & grants - 143,115 50,087 9,918 - - 10,000 - 213,120 354,695 109,992 Payments in lieu of taxes 4,788 5,471 - - - - - 905 11,164 - 5,921 Operating revenues 195,438 - - - - - 1,650,037 135,501 1,980,976 1,988,692 1,981,875 Other revenues 137,159 130,588 - 450,631 127,847 27,075 68,580 336,387 1,278,267 1,089,749 378,178
1,962,430 713,031 50,087 460,549 192,847 52,911 1,728,617 724,535 5,885,007 5,834,616 4,993,217
EXPENSESGeneral administration 298,981 34,053 - 4,920 - - 43,517 17,145 398,616 436,114 354,202 Professional fees 132,937 150,920 45,169 53,752 - - 52,520 11,493 446,791 863,830 156,653 Program costs - 14,742 - - - 50,000 28,330 95,540 188,612 415,150 344,018 Vehicle and Equip operating 39,713 7,477 - - - - 29,584 11,793 88,567 77,831 83,571 Building operating 37,313 - - - - - - - 37,313 40,813 37,313 Other operating 154,351 32,323 4,919 29,636 - 1,016 246,425 210,921 679,591 846,469 609,066 Wages & benefits 1,077,592 355,456 - 231,586 - - 858,076 282,170 2,804,880 3,254,433 2,447,100 Capital expenses 5,522 - - - - - 4,494 30,720 40,736 11,700 29,510
1,746,409 594,971 50,088 319,894 - 51,016 1,262,946 659,782 4,685,106 5,946,340 4,061,433
OPERATING SURPLUS(DEFICIT) 216,021 118,060 (1) 140,655 192,847 1,895 465,671 64,753 1,199,901 (111,724) 931,784
Reserve contributions 226,556 130,163 - 116,000 127,847 - 110,221 45,268 756,055 246,643 298,000 Transfers to other govts/orgs - 5,000 - - 65,000 - - - 70,000 245,542 233,764
226,556 135,163 - 116,000 192,847 - 110,221 45,268 826,055 492,185 531,764 CURRENT YEAR
SURPLUS (DEFICIT) (10,535) (17,103) (1) 24,655 - 1,895 355,450 19,485 373,846 (603,909) 400,020
Prior year's surplus applied 432,458 174,493 1 - - - 1,027,602 79,103 1,713,657 1,713,657 1,313,637
ENDING SURPLUS 421,923$ 157,390$ -$ 24,655$ -$ 1,895$ 1,383,052$ 98,588$ 2,087,503$ 1,109,748$ 1,713,657$
(UNAUDITED)
REGIONAL DISTRICT OF NANAIMOSTRATEGIC & COMMUNITY DEVELOPMENT
SCHEDULE OF REVENUE AND EXPENSES BY SERVICEas at December 31, 2018
- 38 -

Schedule B-1
Enforcement NuisanceAdministration Area Area Area Properties Area Area Area Area Area Actual Budget Actual
A,B,C &
Lantzville F E,G&H A B C E G 2018 2018 2017
REVENUESTax requisition - $68,832 $18,969 $87,463 $34,376 $9,543 $9,958 $5,002 $8,253 $9,346 251,742$ 251,742$ 259,159$ Payments in lieu of taxes - - - - - - 905 - - - 905 - 45 Permit fees 306,913 - - - - - - - - - 306,913 367,247 281,963 Operating revenues 10,347 2,050 - 9,652 109,415 - - 4,037 - - 135,501 324,677 323,811 Other revenues 29,474 - - - - - - - - - 29,474 - -
346,734 70,882 18,969 97,115 143,791 9,543 10,863 9,039 8,253 9,346 724,535 943,666 864,978
EXPENSESGeneral administration - 4,787 1,404 6,816 1,266 582 582 569 569 570 17,145 17,645 16,830 Professional fees 2,581 2,461 - 20 1,237 - - - - 5,194 11,493 20,330 3,843 Program costs - - - - 95,540 - - - - - 95,540 300,000 269,199 Vehicle and Equip operating 11,793 - - - - - - - - - 11,793 9,050 11,021 Building operating - - - - - - - - - - - - - Other operating 18,471 48,381 14,264 76,857 15,360 7,600 7,563 7,474 7,475 7,476 210,921 263,658 214,455 Wages & benefits 282,170 - - - - - - - - - 282,170 330,219 262,665 Capital expenses 30,720 - - - - - - - - - 30,720 - 4,843
345,735 55,629 15,668 83,693 113,403 8,182 8,145 8,043 8,044 13,240 659,782 940,902 782,856
OPERATING SURPLUS(DEFICIT) 999 15,253 3,301 13,422 30,388 1,361 2,718 996 209 (3,894) 64,753 2,764 82,122
Reserve contributions 1,000 4,000 2,000 6,500 28,768 - 3,000 - - - 45,268 39,768 20,000
1,000 4,000 2,000 6,500 28,768 - 3,000 - - - 45,268 39,768 20,000 CURRENT YEAR
SURPLUS (DEFICIT) (1) 11,253 1,301 6,922 1,620 1,361 (282) 996 209 (3,894) 19,485 (37,004) 62,122
Prior year's surplus applied (2) 9,165 9,654 8,241 40,106 1,817 3,411 1,498 1,838 3,375 79,103 79,103 16,981
ENDING SURPLUS (DEFICIT) (3)$ 20,418$ 10,955$ 15,163$ 41,726$ 3,178$ 3,129$ 2,494$ 2,047$ (519)$ 98,588$ 42,099$ 79,103$
Animal Control Noise Control
REGIONAL DISTRICT OF NANAIMOSTRATEGIC & COMMUNITY DEVELOPMENT
BYLAW ENFORCEMENTSCHEDULE OF REVENUE AND EXPENSES BY SERVICE
as at December 31, 2018(UNAUDITED)
- 39 -

Schedule C
REGIONAL DISTRICT OF NANAIMOREGIONAL & COMMUNITY UTILITIES
SCHEDULE OF REVENUE AND EXPENSES BY SERVICEas at December 31, 2018
(UNAUDITED)
Community Water Solid GarbageWorks Fund Wastewater Supply Sewerage Street Waste Collection/ Actual Budget Actual
RCU Management Management Collection Lighting Management Recycling 2018 2018 2017(Sch C-1) (Sch C-2) (Sch C-3) (Sch C-4)
REVENUESTax requisition -$ 13,629,217$ 3,063,081$ 1,779,854$ 92,520$ 831,132$ -$ 19,395,804$ 19,395,804$ 17,978,926$ Government transfers & grants 335,080 6,028,821 1,046,520 - 536 - - 7,410,957 11,753,360 2,050,238 Payments in lieu of taxes - 243,169 - - 75 9,128 - 252,372 12,270 51,438 Operating revenues - 978,822 1,030,487 569,770 - 186,611 4,783,657 7,549,347 7,048,075 7,361,847 Disposal fees - - - - - 9,228,498 - 9,228,498 8,200,000 9,183,048 Other revenues - 28,459,920 3,102,589 3,802 5,200 2,273,986 8,794 33,854,291 49,088,624 14,080,737
335,080 49,339,949 8,242,677 2,353,426 98,331 12,529,355 4,792,451 77,691,269 95,498,133 50,706,234
EXPENSESGeneral administration - 612,497 214,956 64,438 1,375 585,845 340,726 1,819,837 1,878,852 1,757,390 Professional fees 3,979 335,374 139,251 13,218 - 483,449 18,861 994,132 1,312,178 893,587 Program costs - 61,870 88,786 - - - - 150,656 161,700 148,092 Vehicle and Equip operating - 901,917 124,628 77,957 - 931,307 870 2,036,679 1,771,181 1,836,606 Building operating - 1,063,523 202,028 66,096 - 182,135 2,681 1,516,463 1,693,087 1,491,156 Facility operating 10 1,948,840 498,594 1,237,908 98,416 2,769,194 4,180,379 10,733,341 11,320,559 10,170,616 Wages & benefits - 3,031,085 1,268,515 371,658 960 3,291,282 187,721 8,151,221 8,530,242 7,510,367 Capital expenses 331,091 34,548,129 3,947,368 22,730 - 1,412,860 424 40,262,602 60,608,469 17,277,174
335,080 42,503,235 6,484,126 1,854,005 100,751 9,656,072 4,731,662 65,664,931 87,276,268 41,084,988
OPERATING SURPLUS - 6,836,714 1,758,551 499,421 (2,420) 2,873,283 60,789 12,026,338 8,221,865 9,621,246
Debt retirement - interest - 577,187 268,769 84,079 - 185 - 930,220 1,215,182 678,922 - principal - 744,314 265,274 85,508 - 43,122 - 1,138,218 1,138,351 599,209 Reserve contributions - 4,849,874 1,348,176 317,750 3,000 2,568,940 102,833 9,190,573 6,963,004 7,378,743
- 6,171,375 1,882,219 487,337 3,000 2,612,247 102,833 11,259,011 9,316,537 8,656,874 CURRENT YEAR
SURPLUS (DEFICIT) - 665,339 (123,668) 12,084 (5,420) 261,036 (42,044) 767,327 (1,094,672) 964,372
Prior year's surplus applied 2,239,788 892,443 553,079 9,217 1,485,406 294,506 5,474,439 5,323,827 4,510,067
ENDING SURPLUS -$ 2,905,127$ 768,775$ 565,163$ 3,797$ 1,746,442$ 252,462$ 6,241,766$ 4,229,155$ 5,474,439$
- 40 -

Schedule C-1
REGIONAL & COMMUNITY UTILITIESWASTEWATER MANAGEMENT
SCHEDULE OF REVENUE AND EXPENSES BY SERVICEas at December 31, 2018
(UNAUDITED)
WastewaterManagement Duke Southern Northern Actual Budget Actual
Plan Point Community Community 2018 2018 2017
REVENUESTax requisition 175,168$ 238,254$ 8,006,795$ 5,209,000$ 13,629,217$ 13,629,217$ 12,535,269$ Government transfers & grants - - 6,011,510 17,311 6,028,821 9,035,606 561,617 Payments in lieu of taxes 2,488 - 229,225 11,456 243,169 5,470 49,717 Operating revenues 70,181 13,732 512,490 382,419 978,822 768,350 895,789 Other revenues 500 48,479 28,049,635 361,306 28,459,920 40,297,697 10,268,581
248,337 300,465 42,809,655 5,981,492 49,339,949 63,736,340 24,310,973
EXPENSESGeneral administration 18,421 20,313 352,371 221,392 612,497 634,703 562,435 Professional fees 28,537 10,323 222,260 74,254 335,374 416,169 472,460 Program costs 61,870 - - - 61,870 68,000 50,171 Vehicle and Equip operating 210 41,160 481,146 379,401 901,917 925,855 877,782 Building operating - 17,056 702,155 344,312 1,063,523 1,177,597 1,047,847 Facility operating 8,683 71,535 1,287,166 581,456 1,948,840 2,026,118 1,782,143 Wages & benefits 139,139 104,811 1,751,182 1,035,953 3,031,085 3,204,573 2,773,245 Capital expenses 686 16,490 34,026,896 504,057 34,548,129 49,475,043 12,023,743
257,546 281,688 38,823,176 3,140,825 42,503,235 57,928,058 19,589,826
OPERATING SURPLUS (9,209) 18,777 3,986,479 2,840,667 6,836,714 5,808,282 4,721,147
Debt retirement - interest - - 577,187 - 577,187 835,722 366,927 - principal - - 744,314 - 744,314 744,314 186,079 Reserve contributions 2,833 33,460 2,266,824 2,546,757 4,849,874 4,443,904 4,564,576
2,833 33,460 3,588,325 2,546,757 6,171,375 6,023,940 5,117,582 CURRENT YEAR
SURPLUS (DEFICIT) (12,042) (14,683) 398,154 293,910 665,339 (215,658) (396,435)
Prior year's surplus applied 216,591 161,617 784,235 1,077,345 2,239,788 2,239,788 2,636,223
ENDING SURPLUS 204,549$ 146,934$ 1,182,389$ 1,371,255$ 2,905,127$ 2,024,130$ 2,239,788$
REGIONAL DISTRICT OF NANAIMO
- 41 -

Schedule C-2
San Drinking French Whiskey San Pareil Englishman Melrose Nanoose Water Westurne Nanoose French Creek Actual Budget Actual
Surfside Creek Creek Driftwood Decourcey Pareil Fire River Place Peninsula Protection Heights Bulk Water Bulk Water 2018 2018 2017
REVENUESTax requisition 15,956$ 85,030$ 99,794$ 5,458$ 9,005$ 140,154$ 73,935$ 39,482$ 23,740$ 948,144$ 514,711$ 20,260$ 1,083,092$ 4,320$ 3,063,081$ 3,063,081$ 2,958,493$ Government transfers & grants 5,000 25,000 - - - 334,457 - - - - - - 682,063 - 1,046,520 2,215,504 1,316,599 Operating revenues 13,557 57,625 13,389 - 1,106 89,686 277 82,430 3,206 765,213 1,589 2,409 - - 1,030,487 909,124 1,122,900 Other revenues 14,974 13,974 9,676 - 9 1,545 - 264 300 409,978 - 45 2,589,409 62,415 3,102,589 5,784,744 2,191,748
49,487 181,629 122,859 5,458 10,120 565,842 74,212 122,176 27,246 2,123,335 516,300 22,714 4,354,564 66,735 8,242,677 11,972,453 7,589,740
EXPENSESGeneral administration 1,899 10,420 7,465 - 488 12,906 - 6,933 1,984 117,757 43,822 821 9,319 1,142 214,956 228,063 224,455 Professional fees 2,101 4,863 1,821 - 75 4,178 - 4,609 408 47,576 72,311 29 1,280 - 139,251 362,059 127,698 Program costs - - - - - - - - - - 88,786 - - - 88,786 93,700 97,921 Vehicle and Equip operating 3,287 8,920 7,703 - 105 9,013 - 3,798 2,870 78,470 1,602 2,163 6,688 9 124,628 114,615 146,641 Building operating 998 7,231 13,624 - 736 3,933 - 4,534 1,197 148,862 2,500 609 17,804 - 202,028 235,678 197,587 Facility operating 4,453 32,069 22,801 - 3,683 35,739 - 19,250 9,495 305,131 33,109 2,301 23,892 6,671 498,594 555,636 548,791 Wages & benefits 10,420 63,850 33,645 - 1,262 77,492 - 42,007 7,504 660,553 286,037 4,565 68,731 12,449 1,268,515 1,372,709 1,180,911 Capital expenses 6,972 39,274 9,455 - 21 335,735 - 693 4,285 317,223 1,135 75 3,232,352 148 3,947,368 7,992,097 3,468,425
30,130 166,627 96,514 - 6,370 478,996 - 81,824 27,743 1,675,572 529,302 10,563 3,360,066 20,419 6,484,126 10,954,557 5,992,429
OPERATING SURPLUS (DEFICIT) 19,357 15,002 26,345 5,458 3,750 86,846 74,212 40,352 (497) 447,763 (13,002) 12,151 994,498 46,316 1,758,551 1,017,896 1,597,311
Debt retirement - interest - - 976 2,525 - 8,342 36,782 - 207 22,609 - 1,889 178,307 17,132 268,769 272,201 205,084 - principal - - - 3,043 - 13,310 37,430 - 1,195 33,762 - 2,233 159,069 15,232 265,274 265,274 201,825 Reserve contributions 17,850 10,000 45,000 - 5,500 70,000 50,000 6,196 346,025 57,853 8,000 718,293 13,459 1,348,176 884,895 900,720
17,850 10,000 45,976 5,568 5,500 91,652 74,212 50,000 7,598 402,396 57,853 12,122 1,055,669 45,823 1,882,219 1,422,370 1,307,629 CURRENT YEAR
SURPLUS (DEFICIT) 1,507 5,002 (19,631) (110) (1,750) (4,806) - (9,648) (8,095) 45,367 (70,855) 29 (61,171) 493 (123,668) (404,474) 289,682
Prior year's surplus (deficit) 2,845 21,468 35,018 - 5,077 52,920 - 44,615 18,840 381,726 200,963 7,154 120,565 1,252 892,443 741,831 602,761
ENDING SURPLUS (DEFICIT) 4,352$ 26,470$ 15,387$ (110)$ 3,327$ 48,114$ -$ 34,967$ 10,745$ 427,093$ 130,108$ 7,183$ 59,394$ 1,745$ 768,775$ 337,357$ 892,443$
as at December 31, 2018(UNAUDITED)
REGIONAL DISTRICT OF NANAIMOREGIONAL & COMMUNITY UTILITIES
WATER SUPPLY MANAGEMENTSCHEDULE OF REVENUE AND EXPENSES BY SERVICE
- 42 -

Schedule C-3
Englishman CedarPacific French River Estates Barclay Hawthorne Reid Rd Actual Budget ActualShores Surfside Cedar Creek Fairwinds Stormwater Stormwater Cr Rise Debt Debt 2018 2018 2017
REVENUESTax requisition 73,469$ 22,715$ 135,404$ 747,620$ 608,034$ 5,216$ 4,820$ 169,011$ 9,941$ 3,624$ 1,779,854$ 1,779,854$ 1,673,839$ Operating revenues - 5,748 65,061 341,936 98,576 - - 58,449 - - 569,770 549,594 575,649 Other revenues 208 45 98 2,214 947 - - 290 - - 3,802 38,410 20,610
73,677 28,508 200,563 1,091,770 707,557 5,216 4,820 227,750 9,941 3,624 2,353,426 2,367,858 2,270,098
EXPENSESGeneral administration 1,592 482 2,457 19,008 37,305 200 168 3,226 - - 64,438 68,951 70,065 Professional fees 65 14 41 7,686 5,287 - - 125 - - 13,218 27,250 8,541 Vehicle and Equip operating 900 200 4,686 13,250 57,209 - - 1,712 - - 77,957 77,978 67,006 Building operating 811 32 5,144 12,452 45,316 - - 2,341 - - 66,096 76,583 75,383 Facility operating 52,232 16,038 44,889 877,771 135,728 905 - 110,345 - - 1,237,908 1,313,619 1,178,167 Wages & benefits 10,438 2,149 6,617 154,103 176,297 1,100 1,100 19,854 - - 371,658 401,896 349,384 Capital expenses 172 35 6,108 2,537 13,550 - - 328 - - 22,730 201,683 29,107
66,210 18,950 69,942 1,086,807 470,692 2,205 1,268 137,931 - - 1,854,005 2,167,960 1,777,653
OPERATING SURPLUS (DEFICIT) 7,467 9,558 130,621 4,963 236,865 3,011 3,552 89,819 9,941 3,624 499,421 199,898 492,445
Debt retirement - interest - - 58,526 - - - - 20,155 3,813 1,585 84,079 107,101 105,208 - principal - - 47,259 - - - - 30,082 6,128 2,039 85,508 85,509 85,508 Reserve contributions 8,000 15,000 40,000 - 216,000 6,000 5,000 27,750 - - 317,750 182,975 165,625
8,000 15,000 145,785 - 216,000 6,000 5,000 77,987 9,941 3,624 487,337 375,585 356,341 CURRENT YEAR
SURPLUS (DEFICIT) (533) (5,442) (15,164) 4,963 20,865 (2,989) (1,448) 11,832 - - 12,084 (175,687) 136,104
Prior year's surplus (deficit) 11,812 16,286 63,483 6,896 409,732 5,945 4,956 33,969 - - 553,079 553,079 416,975
ENDING SURPLUS (DEFICIT) 11,279$ 10,844$ 48,319$ 11,859$ 430,597$ 2,956$ 3,508$ 45,801$ -$ -$ 565,163$ 377,392$ 553,079$
(UNAUDITED)
REGIONAL DISTRICT OF NANAIMOREGIONAL & COMMUNITY UTILITIES
SEWERAGE COLLECTION SCHEDULE OF REVENUE AND EXPENSES BY SERVICE
as at December 31, 2018
- 43 -

Schedule C-4
French Creek Englishman Rural Highway Highway Actual Budget ActualSandpiper Fairwinds Village Morningstar River EA E&G #4 Intersections 2018 2018 2017
REVENUESTax requisition 14,079$ 23,500$ 9,043$ 16,708$ 6,330$ 17,017$ 4,244$ 1,599$ 92,520$ 92,520$ 88,715$ Government transfers & grants - - - - - - 536 536 536 871 Payments in lieu of taxes 75 75 - Other revenues - - - 4,200 - 1,000 - - 5,200 17,200 2,500
14,079 23,575 9,043 20,908 6,330 18,017 4,244 2,135 98,331 110,256 92,086
EXPENSESGeneral administration 175 175 175 175 175 175 175 150 1,375 1,375 1,375 Professional fees - - - - - - - - - 13,000 - Facility operating 14,156 20,751 13,171 20,226 5,878 17,483 3,866 2,885 98,416 90,409 86,071 Wages & Benefits 120 120 120 120 120 120 120 120 960 960 960
14,451 21,046 13,466 20,521 6,173 17,778 4,161 3,155 100,751 105,744 88,406
OPERATING SURPLUS (DEFICIT) (372) 2,529 (4,423) 387 157 239 83 (1,020) (2,420) 4,512 3,680
Reserve contributions - 2,000 - 500 500 - - - 3,000 6,500 5,000
- 2,000 - 500 500 - - - 3,000 7,500 5,000 CURRENT YEAR
SURPLUS (DEFICIT) (372) 529 (4,423) (113) (343) 239 83 (1,020) (5,420) (2,988) (1,320)
Prior year's surplus applied 2,020 1,815 203 1,223 1,223 165 186 2,382 9,217 9,217 10,537
ENDING SURPLUS 1,648$ 2,344$ (4,220)$ 1,110$ 880$ 404$ 269$ 1,362$ 3,797$ 6,229$ 9,217$
as at December 31, 2018(UNAUDITED)
REGIONAL DISTRICT OF NANAIMOREGIONAL & COMMUNITY UTILITIES
STREET LIGHTINGSCHEDULE OF REVENUE AND EXPENSES BY SERVICE
- 44 -

Schedule D
Northern Ravensong Gabriola Southern Community Regional Community Community Oceanside Aquatic Area A Island Community Works Fund Actual Budget Actual
Parks Parks Recreation Place Centre Recreation Recreation Recreation Rec & Parks 2018 2018 2017
(Schedule D-1)REVENUES
Tax requisition 2,355,325$ 1,308,176$ 1,600,047$ 1,973,597$ 1,990,032$ 202,792$ 123,690$ 1,285,678$ -$ 10,839,337$ 10,839,337$ 10,469,799$ Government transfers & grants 45,881 127,395 72,497 2,125 500 - - - 58,066 306,464 968,022 990,173 Payments in lieu of taxes 25,375 343 - - - - 499 1,142 - 27,359 1,150 6,933 Operating revenues 18,948 1,129 435,606 613,910 713,851 - - - - 1,783,444 2,011,647 1,754,583 Other revenues 952,743 111,307 44,394 104,990 87,529 - 59 - - 1,301,022 3,944,636 446,950
3,398,272 1,548,350 2,152,544 2,694,622 2,791,912 202,792 124,248 1,286,820 58,066 14,257,626 17,764,792 13,668,438
EXPENSESGeneral administration 96,653 78,367 112,582 144,438 170,192 9,871 2,458 1,800 - 616,361 629,460 638,629 Professional fees 38,260 45,133 17,224 4,815 12,657 4,824 2,933 - 4,265 130,111 402,300 174,228 Legislative - - - 4 4 - - - - 8 1,500 10 Program costs - - 544,634 47,476 74,262 3,161 - - - 669,533 712,316 599,785 Vehicle and Equip operating 23,148 38,173 16,501 58,552 27,411 59 74 - - 163,918 175,846 153,713 Building operating 50,519 22,065 12,855 319,031 264,468 10,070 - 33,062 - 712,070 754,602 730,935 Other operating 353,869 291,222 96,527 76,920 148,963 3,330 1,658 6,052 - 978,541 1,284,255 931,968 Wages & benefits 690,500 601,481 727,090 1,112,730 1,454,382 27,553 21,449 - - 4,635,185 4,864,776 4,478,117 Capital expenses 798,195 271,089 45,454 160,869 86,877 61 60 - 43,801 1,406,406 5,334,770 1,172,737
2,051,144 1,347,530 1,572,867 1,924,835 2,239,216 58,929 28,632 40,914 48,066 9,312,133 14,159,825 8,880,122
OPERATING SURPLUS(DEFICIT) 1,347,128 200,820 579,677 769,787 552,696 143,863 95,616 1,245,906 10,000 4,945,493 3,604,967 4,788,316
Debt retirement - interest 79,139 14,835 - 312,532 - - - - - 406,506 419,387 406,689 - principal 71,657 72,641 - 273,052 - - - - - 417,350 416,450 419,201 Reserve contributions 1,191,847 168,000 196,532 277,291 543,482 278,409 12,000 - - 2,667,561 1,751,834 1,893,147 Transfers to other govts/orgs 47,000 12,000 384,641 - - - 82,161 1,244,472 10,000 1,780,274 1,804,742 2,073,473
1,389,643 267,476 581,173 862,875 543,482 278,409 94,161 1,244,472 10,000 5,271,691 4,392,413 4,792,510 CURRENT YEAR
SURPLUS (DEFICIT) (42,515) (66,656) (1,496) (93,088) 9,214 (134,546) 1,455 1,434 - (326,198) (787,446) (4,194)
Prior year's surplus applied 534,037 411,449 62,114 223,606 292,169 159,455 13,782 24,978 - 1,721,590 1,721,590 1,725,784
ENDING SURPLUS 491,522$ 344,793$ 60,618$ 130,518$ 301,383$ 24,909$ 15,237$ 26,412$ -$ 1,395,392$ 934,144$ 1,721,590$
(UNAUDITED)
REGIONAL DISTRICT OF NANAIMORECREATION & PARKS SERVICES
SCHEDULE OF REVENUE AND EXPENSES BY SERVICEas at December 31, 2018
- 45 -

Schedule D-1
Electoral Electoral Electoral Electoral Electoral Electoral Electoral Electoral Actual Budget ActualArea A Area B Area C Area C (D) Area E Area F Area G Area H 2018 2018 2017
REVENUESTax requisition 212,384$ 282,160$ 71,559$ 91,473$ 149,126$ 168,739$ 144,350$ 188,385$ 1,308,176$ 1,308,176$ 1,245,439$ Government transfers & grants - - - - - 27,395 - 100,000 127,395 120,887 324,370 Payments in lieu of taxes - - - - - - - 343 343 - 976
Operating revenues - 184 42 42 409 84 284 84 1,129 117,923 281,250 Permit fees & other 114 - - 59 - 19,257 91,877 111,307 - -
212,498 282,344 71,601 91,515 149,594 196,218 163,891 380,689 1,548,350 1,546,986 1,852,035
EXPENSESGeneral administration 13,179 13,111 4,078 5,042 9,591 10,600 10,497 12,269 78,367 86,256 95,391 Professional fees 6,062 7,431 2,081 6,910 4,263 13,665 968 3,753 45,133 93,500 24,266 Vehicle and Equip operating 7,704 3,769 1,886 1,886 11,620 3,769 3,769 3,770 38,173 38,562 38,770 Building operating 2,644 4,379 1,228 1,228 3,598 2,550 3,842 2,596 22,065 20,306 17,498 Other operating 48,084 61,468 5,900 16,070 32,159 44,401 41,179 41,961 291,222 384,745 239,404 Wages & benefits 85,918 85,912 42,981 42,981 85,921 85,921 85,922 85,925 601,481 635,626 574,796 Capital expenses 42,041 251 126 126 310 27,646 8,461 192,128 271,089 303,591 612,012
205,632 176,321 58,280 74,243 147,462 188,552 154,638 342,402 1,347,530 1,562,586 1,602,137
OPERATING SURPLUS(DEFICIT) 6,866 106,023 13,321 17,272 2,132 7,666 9,253 38,287 200,820 (15,600) 249,898
Debt retirement - interest 10 13,433 5 5 10 1,352 10 10 14,835 17,714 15,003 - principal 370 55,421 185 185 370 15,370 370 370 72,641 72,093 74,514 Reserve contributions 25,000 21,500 10,000 50,000 20,000 12,000 - 29,500 168,000 112,000 47,000 Transfers to other govts/orgs 12,000 - - - - - - - 12,000 12,000 52,000
37,380 90,354 10,190 50,190 20,380 28,722 380 29,880 267,476 213,807 188,517 CURRENT YEAR
SURPLUS (DEFICIT) (30,514) 15,669 3,131 (32,918) (18,248) (21,056) 8,873 8,407 (66,656) (229,407) 61,381
Prior year's surplus applied 62,237 64,557 48,663 56,784 33,036 64,511 13,570 68,091 411,449 411,449 350,068
ENDING SURPLUS 31,723$ 80,226$ 51,794$ 23,866$ 14,788$ 43,455$ 22,443$ 76,498$ 344,793$ 182,042$ 411,449$
as at December 31, 2018(UNAUDITED)
REGIONAL DISTRICT OF NANAIMORECREATION & PARKS SERVICES
COMMUNITY PARKSSCHEDULE OF REVENUE AND EXPENSES BY SERVICE
- 46 -

Schedule E
Area B Public Safety EmergencyEmergency Southern Northern Gabriola Gabriola & Fire Planning & Community Actual Budget Actual
Wharf Community Community Transit Cont'n Taxi Saver Protection Search & Rescue Justice 2018 2018 2017
(Schedule E-1/E-2)REVENUES
Tax requisition 6,891$ 9,087,442$ 1,181,386$ 136,000$ 4,332$ 5,236,133$ 397,694$ 119,046$ 16,168,924$ 16,168,924$ 15,159,873$ Government transfers & grants - 5,385,162 569,139 - - - 103,608 - 6,057,909 6,799,467 5,647,224 Payments in lieu of taxes - 207,555 - - - 12,671 1,051 - 221,277 84,935 55,636 Operating revenues - 4,725,667 322,618 - - - 29,334 - 5,077,619 4,686,982 4,639,881 Other revenues - 1,892,701 - - - 2,193,180 20,660 26,423 4,132,964 7,173,553 2,218,351
- - 6,891 21,298,527 2,073,143 136,000 4,332 7,441,984 552,347 145,469 31,658,693 34,913,861 27,720,965
EXPENSESGeneral administration 500 1,107,990 103,644 5,800 440 276,827 33,059 250 1,528,510 1,557,230 1,446,649 Professional fees - 23,458 - - - 36,118 84,374 - 143,950 301,850 34,959 Program costs 20,793 20,793 128,500 - Vehicle and Equip operating - 4,822,516 - - - 273,235 10,827 - 5,106,578 5,238,379 4,735,005 Building operating - 321,974 - - - 121,028 24,065 - 467,067 499,950 497,991 Other operating 6,065 2,163,080 841,171 - - 651,133 42,587 - 3,704,036 3,787,963 3,722,439 Wages & benefits - 11,660,980 1,053,245 - - 309,590 212,784 - 13,236,599 12,919,079 11,914,539 Capital expenses - 182,106 - - - 1,757,072 23,212 - 1,962,390 6,061,702 631,664
6,565 20,282,104 1,998,060 5,800 440 3,425,003 451,701 250 26,169,923 30,494,653 22,983,246
OPERATING SURPLUS(DEFICIT) 326 1,016,423 75,083 130,200 3,892 4,016,981 100,646 145,219 5,488,770 4,419,208 4,737,719
Debt retirement - interest - - - - - 170,713 - - 170,713 177,167 168,065
- principal - - - - - 178,738 - - 178,738 215,769 171,390 Reserve contributions - 965,693 - - - 1,067,873 57,596 - 2,091,162 1,261,765 2,619,409 Transfers to other govts/orgs - - - 130,200 4,242 2,680,015 61,975 132,558 3,008,990 3,027,802 2,780,077
- 965,693 - 130,200 4,242 4,097,339 119,571 132,558 5,449,603 4,682,503 5,738,941 CURRENT YEAR
SURPLUS (DEFICIT) 326 50,730 75,083 - (350) (80,358) (18,925) 12,661 39,167 (263,295) (1,001,222)
Prior year's surplus applied 1,905 1,474,390 534,814 - 4,108 165,923 62,256 - 2,243,396 2,243,396 3,244,618
ENDING SURPLUS 2,231$ 1,525,120$ 609,897$ -$ 3,758$ 85,565$ 43,331$ 12,661$ 2,282,563$ 1,980,101$ 2,243,396$
Public Transportation
(UNAUDITED)
REGIONAL DISTRICT OF NANAIMOTRANSPORTATION & EMERGENCY SERVICES
SCHEDULE OF REVENUE AND EXPENSES BY SERVICEas at December 31, 2018
- 47 -

Schedule E-1
District 68 District 69 Actual Budget ActualE911 E911 2018 2018 2017
REVENUESTax requisition 158,937$ 667,725$ 826,662$ 826,662$ 791,557$ Other revenues 11,636 - 11,636 - 7,984
170,573 667,725 838,298 826,662 799,541
EXPENSESGeneral administration 10,000 12,500 22,500 22,500 17,500 Vehicle and Equip operating 6,463 - 6,463 9,450 26,023 Other operating 9,733 6,500 16,233 16,500 15,034 Capital expenses 11,636 - 11,636 - 7,984
37,832 19,000 56,832 48,450 66,541
OPERATING SURPLUS(DEFICIT) 132,741 648,725 781,466 778,212 733,000
Transfers to other govts/orgs 132,628 667,725 800,353 800,725 762,033
132,628 667,725 800,353 800,725 762,033 CURRENT YEAR
SURPLUS (DEFICIT) 113 (19,000) (18,887) (22,513) (29,033)
Prior year's surplus (deficit) 8,907 29,410 38,317 38,317 67,350
ENDING SURPLUS 9,020$ 10,410$ 19,430$ 15,804$ 38,317$
as at December 31, 2018(UNAUDITED)
REGIONAL DISTRICT OF NANAIMOTRANSPORTATION & EMERGENCY SERVICES
PUBLIC SAFETY SYSTEMSSCHEDULE OF REVENUE AND EXPENSES BY SERVICE
- 48 -

Schedule E-2
Fire Services Coombs Nanaimo French Bow Horn Cassidy Actual Budget ActualAdmin Hilliers Errington Nanoose Dashwood Meadowood Extension River Creek Parksville Bay Waterloo Wellington 2018 2018 2017
REVENUESTax requisition -$ 535,639$ 641,503$ 858,055$ 638,410$ 139,458$ 175,173$ 17,792$ 659,511$ 111,551$ 374,290$ 173,402$ 84,687$ 4,409,471$ 4,409,471$ 3,801,233$ Payments in lieu of taxes - - - 11,593 869 - - - 209 - - - - 12,671 11,800 12,126 Other revenues 253,222 464,742 1,287,675 66,553 89,727 - - - - - 4,529 15,096 - 2,181,544 3,710,985 676,569
253,222 1,000,381 1,929,178 936,201 729,006 139,458 175,173 17,792 659,720 111,551 378,819 188,498 84,687 6,603,686 8,132,256 4,489,928
EXPENSESGeneral administration 2,398 28,778 24,250 85,952 21,528 100 8,001 575 39,846 10,399 18,130 10,545 3,825 254,327 255,429 170,046 Professional fees 34,821 1,297 - - - - - - - - - - - 36,118 74,350 4,170 Vehicle and Equip operating 2,039 120,917 9,026 50,484 13,454 - 33,679 - - - 10,772 26,401 - 266,772 255,660 205,877 Building operating - 20,286 4,194 30,349 24,713 - 32,476 - - - 6,090 2,920 - 121,028 153,219 127,085 Other operating 2,714 147,891 1,885 294,429 28,033 - 48,744 - 99,313 - 598 8,024 3,269 634,900 647,327 618,146 Wages & benefits 176,783 131,543 - 1,264 - - - - - - - - - 309,590 313,249 223,485 Capital expenses - 284,077 1,287,675 94,126 64,462 - - - - - - 15,096 - 1,745,436 3,486,202 319,844
218,755 734,789 1,327,030 556,604 152,190 100 122,900 575 139,159 10,399 35,590 62,986 7,094 3,368,171 5,185,436 1,668,653
OPERATING SURPLUS 34,467 265,592 602,148 379,597 576,816 139,358 52,273 17,217 520,561 101,152 343,229 125,512 77,593 3,235,515 2,946,820 2,821,275
Debt retirement - interest - 4,200 2,647 83,700 - 79,803 - 363 - - - - - 170,713 177,167 168,065 - principal - 17,446 7,348 93,693 - 59,554 - 697 - - - - - 178,738 215,769 171,390 Reserve contributions 31,000 251,666 202,755 211,162 150,509 - 52,273 16,160 - - 54,186 98,162 - 1,067,873 759,424 886,358 Transfers to other govts/orgs - - 389,398 - 426,307 - - - 511,028 135,258 289,042 53,450 75,179 1,879,662 1,879,683 1,712,724
31,000 273,312 602,148 388,555 576,816 139,357 52,273 17,220 511,028 135,258 343,228 151,612 75,179 3,296,986 3,032,043 2,938,537 CURRENT YEAR
SURPLUS (DEFICIT) 3,467 (7,720) - (8,958) - 1 - (3) 9,533 (34,106) 1 (26,100) 2,414 (61,471) (85,223) (117,262)
Prior year's surplus (deficit) - 27,902 (1) 8,958 - - 1 4 14,005 38,045 - 36,315 2,377 127,606 127,606 244,868
ENDING SURPLUS (DEFICIT) 3,467$ 20,182$ (1)$ -$ -$ 1$ 1$ 1$ 23,538$ 3,939$ 1$ 10,215$ 4,791$ 66,135$ 42,383$ 127,606$
(UNAUDITED)
REGIONAL DISTRICT OF NANAIMOTRANSPORTATION & EMERGENCY SERVICES
FIRE DEPARTMENTSSCHEDULE OF REVENUE AND EXPENSES BY SERVICE
as at December 31, 2018
- 49 -

REGIONAL DISTRICT OF NANAIMO 2018 ANNUAL REPORT
$33,994,163
50
$0
$20,000,000
$40,000,000
$60,000,000
$80,000,000
$100,000,000
$120,000,000
2014 2015 2016 2017 2018
Operating Revenues: $25,622,661
Grant Revenues: $14,956,876
Developer Contributions: $5,523,891
Interest & Other Income: $3,944,214
Total 2018 Revenue: $100,221,855
Property Tax: $50,174,213
FINANCIAL AND OPERATIONAL STATISTICS REVENUES: TREND 2014‐2018
EXPENSES BY OBJECT: 2014‐2018
Operating goods & services:
Wages & Benefits: $33,100,265
Amortization expense: $7,335,406
Debt interest: $1,507,439
Other: $2,255,728
Total 2018 Expenses: $78,193,001
2018 Revenues
2018 Expenses
$0
$20,000,000
$40,000,000
$60,000,000
$80,000,000
2014 2015 2016 2017 2018

REGIONAL DISTRICT OF NANAIMO 2018 ANNUAL REPORT
51
Taxation50.1%
Operating & other grants14.3%
Grants in lieu0.6%
Sale of services25.6%
Developer contributions
5.5%
Other3.9%
2018 CONSOLIDATED REVENUES
General Government5.0%
Strategic & Community Development
4.7%
Wastewater & Solid Waste33.9%
Water, Sewer & Street lighting
7.3%
Public Transportation 27.2%
Protective Services7.5%
Parks, Recreation & Culture14.4%
2018 CONSOLIDATED EXPENSES
2018 REVENUES AND EXPENSES DISTRIBUTION

REGIONAL DISTRICT OF NANAIMO 2018 ANNUAL REPORT
52
$0
$50,000,000
$100,000,000
$150,000,000
$200,000,000
$250,000,000
$300,000,000
2014 2015 2016 2017 2018
Financial Assets Liabilities Non‐Financial Assets Accumulated Surplus
$0
$10,000,000
$20,000,000
$30,000,000
$40,000,000
$50,000,000
$60,000,000
$70,000,000
2014 2015 2016 2017 2018
2014 2015 2016 2017 2018
Financial Assets $154,634,442 $164,902,749 $168,170,292 $188,510,512 $183,863,718
Liabilities 124,116,520 127,487,908 130,895,058 151,485,883 161,148,331
Net Financial Assets 30,517,922 37,414,841 37,275,234 37,024,629 22,715,387
Non‐Financial Assets 176,978,321 179,071,458 199,685,425 213,055,885 249,393,981
Accumulated Surplus
207,496,243 216,486,299 236,960,659 250,080,514 272,109,368
SUMMARY OF STATEMENT OF FINANCIAL POSITION – 2014‐2018
RESERVES AND DCC BALANCES – 2014‐2018
Statutory Reserves DCC Reserves Deferred Revenue

REGIONAL DISTRICT OF NANAIMO 2018 ANNUAL REPORT
2014
2015
2016
2017
2018
Accumulated Surplus $272,109,368
53
$0
$20,000,000
$40,000,000
$60,000,000
$80,000,000
$100,000,000
$120,000,000
2014 2015 2016 2017 2018
2014 2015 2016 2017 2018
Annual Surplus $6,740,146 $8,990,056 $20,474,360 $11,403,612 $22,028,854
Jurisdiction 2014 2015 2016 2017 2018 2018 % of Total
Area A $1,483,770 $1,556,027 $1,598,599 $1,630,793 $1,649,664 3%
Area B $799,418 $857,843 $958,957 $1,073,310 $1,140,925 2%
Area C $807,517 $880,532 $974,651 $971,410 $977,558 2%
Area E $1,378,078 $1,410,769 $1,435,608 $1,606,813 $1,619,034 3%
Area F $1,529,604 $1,625,299 $1,677,355 $1,710,352 $1,756,848 3%
Area G $2,021,204 $2,102,409 $2,199,115 $2,286,619 $2,344,099 5%
Area H $1,265,711 $1,294,188 $1,304,327 $1,318,749 $1,355,347 3%
REVENUES, EXPENSES, ACCUMULATED & ANNUAL SURPLUS – 2014‐2018
Revenues
Expenses
Surplus
TAX CONTRIBUTION BY PARTICIPATING AREA – 2014‐2018

REGIONAL DISTRICT OF NANAIMO 2018 ANNUAL REPORT
Area A3%
Area B2%
Area C2% Area E
3%Area F3%
Area G5%
Area H3%
City of Nanaimo41%
District of Lantzville2%
City of Parksville11%
Town of Qualicum Beach7%
Local & defined SA18%
54
T AX CONTRIBUTIBY PA TAX CONTRIBUTION BY PARTICIPATING AREA ‐ 2013‐2017 ING AREA ‐ 2013‐2017
Jurisdiction 2014 2015 2016 2017 2018 2018 % of Total
The City of Nanaimo
$14,992,530 $16,239,802 $17,363,556 $18,466,407 $20,411,923 41%
District of Lantzville
$723,919 $770,865 $806,401 $813,348 $804,238 2%
City of Parksville
$4,519,632 $4,825,137 $5,062,663 $5,280,491 $5,306,525 11%
Town of Qualicum Beach
$3,216,054 $3,371,322 $3,477,959 $3,536,137 $3,600,189 7%
Local and Defined Services Areas
$7,617,745 $8,169,371 $8,638,990 $9,331,586 $9,207,863 18%
Total Taxation $40,355,182 $43,103,564 $45,498,181 $48,026,015 $50,174,213 100%
TAX CONTRIBUTIONS BY PARTICIPATING AREA – 2014‐2018 (cont’d)

REGIONAL DISTRICT OF NANAIMO 2018 ANNUAL REPORT
General Government4.7%
Strategic & Community Development
4.3%
Wastewater & Solid Waste26.8%
Water, Sewer & Street Lighting9.8%Public Transportation
20.8%
Protective Services12.0%
Parks, Recreation & Culture21.6%
55
Capital Expenditures by Department
2014 2015 2016 2017 2018
Corporate Services $234,817 $215,181 $249,445 $170,702 $271,109
Strategic & Community Development
$9,143 $20,603 $36,098 $26,518 $39,262
Regional & Community Utilities
$5,745,918 $736,311 $21,163,083 $16,732,151 $40,090,159
Recreation & Parks $986,978 $6,837,629 $4,931,059 $3,094,432 $1,385,423
Transportation & Emergency Services
$749,462 $813,789 $895,944 $676,890 $1,881,074
TOTAL $7,726,318 $8,623,513 $27,275,629 $20,700,693 $43,667,027
2018 TAX REVENUES BY FUNCTION
TANGIBLE ASSET ACQUISITION – 2014‐2018

REGIONAL DISTRICT OF NANAIMO 2018 ANNUAL REPORT
0.00% 5.00% 10.00% 15.00% 20.00% 25.00% 30.00% 35.00% 40.00%
EA A: 14% of 2018 permits; 10% of 2018 permit values.
EA B: 12% of 2018 permits; 8% of 2018 permit values.
EA C: 8% of 2018 permits; 6% of 2018 permit values.
EA E: 18% of 2018 permits; 37% of 2018 permit values.
EA H: 12% of 2018 permits; 9% of 2018 permit values.
District of Lantzville: 6% of 2018 permits; 3% of 2018 permit values.
56
2014 2015 2016 2017 2018
Area A Building Permits Issued ‐ (Actual #) 81 84 81 111 103
Building Permit Values ‐ ($000’s) $7,243 $16,356 $9,455 $14,778 $13,428
Area B Building Permits Issued ‐ (Actual #) 89 87 72 86 87
Building Permit Values ‐ ($000’s) $8,765 $7,906 $7,349 $10,152 $10,969
Area C Building Permits Issued ‐ (Actual #) 51 36 41 40 54
Building Permit Values ‐ ($000’s) $18,182 $9,825 $5,519 $8,589 $7,189
Area E Building Permits Issued ‐ (Actual #) 87 108 116 138 123
Building Permit Values ‐ ($000’s) $18,743 $14,609 $24,536 $28,475 $47,214
Area F Building Permits Issued ‐ (Actual #) 67 79 82 109 94
Building Permit Values ‐ ($000’s) $9,207 $12,539 $13,958 $18,787 $18,585
Area G Building Permits Issued ‐ (Actual #) 127 116 101 119 109
Building Permit Values ‐ ($000’s) $17,545 $21,056 $15,686 $26,497 $16,671
Area H Building Permits Issued ‐ (Actual #) 47 43 74 54 84
Building Permit Values ‐ ($000’s) $7,124 $5,789 $12,296 $10,486 $11,440
Lantz. Building Permits Issued ‐ (Actual #) 40 41 33
31
42
Building Permit Values ‐ ($000’s) $5,011 $3,770 $4,858 $4,065 $4,345
Total Total Building Permits Issued
589 594 600 688 696
Total Building Permit Value $83,463 $86,863 $93,657 $121,829 $129,841
Percent of RDN Permit Value in 2018
Percent of RDN Permits Issued in 2018
2018 ELECTORAL AREA BUILDING PERMITS AND PERMIT VALUE (% BY AREA)
ELECTORAL AREA CONSTRUCTION ACTIVITY (incl. Lantzville) – 2014‐2018
EA F: 14% of 2018 permits; 14% of 2018 permit values.
EA G: 16% of 2018 permits; 13% of 2018 permit values.

REGIONAL DISTRICT OF NANAIMO 2018 ANNUAL REPORT
Population
57
Northern Community Sewerage Service Area (Parksville, Qualicum Beach, Electoral Areas E and G)
Note: At present, flows are generated from the City of Parksville, the Town of Qualicum Beach and sewer collection areas within Electoral Areas E & G. Electoral Areas E (portion), F, G (portion) and H dispose of septic tank waste at the plant.
Southern Community Sewerage Service Area (Nanaimo and Lantzville)
Note: At present, direct flows are generated from the City of Nanaimo and the District of Lantzville, which began connecting properties to the plant in 2008.
20,000
21,000
22,000
23,000
24,000
25,000
26,000
27,000
28,000
3,000,000
3,200,000
3,400,000
3,600,000
3,800,000
4,000,000
4,200,000
2013 2014 2015 2016 2017 2018
Population
m3 Flow
Population
70,000
75,000
80,000
85,000
90,000
95,000
100,000
0
2,000,000
4,000,000
6,000,000
8,000,000
10,000,000
12,000,000
14,000,000
2013 2014 2015 2016 2017 2018
m3 Flow
Population
WASTEWATER TREATMENT – NORTHERN COMMUNITY
WASTEWATER TREATMENT – SOUTHERN COMMUNITY
Population vs Sewage effluent flow ‐ French Creek Pollution Control Centre
Population vs Sewage effluent flow – Geater Nanaimo Pollution Control Centre

REGIONAL DISTRICT OF NANAIMO 2018 ANNUAL REPORT
58
2,748,089 2,731,126 2,712,3082,814,599
3,077,000
3,387,038
0
500,000
1,000,000
1,500,000
2,000,000
2,500,000
3,000,000
3,500,000
2012/13 2013/14 2014/15 2015/16 2016/17 2017/18
67,491
58,457
67,555 68,768
67,900 68,084
52,000
54,000
56,000
58,000
60,000
62,000
64,000
66,000
68,000
70,000
2012/13 2013/14 2014/15 2015/16 2016/17 2017/18
HandyDART SYSTEM ‐ PASSENGERS CARRIED
TRANSIT RIDERSHIP – CONVENTIONAL TRANSIT SYSTEM
TRANSIT RIDERSHIP – CUSTOM HandyDART TRANSIT SYSTEM
CONVENTIONAL TRANSIT SYSTEM – PASSENGERS CARRIED

REGIONAL DISTRICT OF NANAIMO 2018 ANNUAL REPORT
59
146,000
148,000
150,000
152,000
154,000
156,000
158,000
160,000
162,000
164,000
0
10,000
20,000
30,000
40,000
50,000
60,000
70,000
80,000
2014 2015 2016 2017 2018
Population
tonnes
Solid Waste Recyclables Population estimates
398.13
363.49
398.05
423.61
433.17
320.00
340.00
360.00
380.00
400.00
420.00
440.00
2014 2015 2016 2017 2018
Kg
SOLID WASTE MANAGEMENT
Solid Waste Annual Tonnages vs. Population 2014 ‐ 2018
Solid Waste and Recyclables – Kilograms per Capita 2014 ‐ 2018

REGIONAL DISTRICT OF NANAIMO 2018 ANNUAL REPORT
60
Legal Debt Limit – N/A
$0
$10,000,000
$20,000,000
$30,000,000
$40,000,000
$50,000,000
$60,000,000
$70,000,000
$80,000,000
$90,000,000
$100,000,000
2014 2015 2016 2017 2018
Outstanding Debt By Year
OtherJurisdictions Debt
Regional DistrictService Area Debt
$550 $541 $534
$593 $609
$480
$500
$520
$540
$560
$580
$600
$620
2014 2015 2016 2017 2018
LONG TERM DEBT SUMMARY – 2014‐2018
Total Outstanding Debt Per Capita 2014 ‐ 2018

REGIONAL DISTRICT OF NANAIMO 2018 ANNUAL REPORT
61
2014 2015 2016 2017 2018
City of Nanaimo
Land 6,133,061,991 6,294,963,680 6,545,041,856 7,870,774,850 9,286,838,097
Improvements 6,502,146,030 6,702,464,270 7,149,016,461 7,866,468,034 9,002,694,977
12,635,208,021 12,997,427,950 13,694,058,317 15,737,242,614 18,289,533,074
District of Lantzville
Land 399,980,980 398,883,009 445,178,640 515,524,055 618,560,685
Improvements 306,014,900 308,042,250 316,986,875 329,245,275 374,764,400
705,995,880 706,925,259 762,165,515 844,769,330 993,325,085
City of Parksville
Land 1,161,497,891 1,197,905,493 1,267,350,044 1,408,652,070 1,662,036,318
Improvements 975,108,569 984,902,169 1,034,465,650 1,172,271,177 1,389,980,969
2,136,606,460 2,182,807,662 2,301,815,694 2,580,923,247 3,052,017,287
Town of Qualicum Beach
Land 1,017,321,841 1,047,763,542 1,085,172,126 1,236,928,535 1,495,885,438
Improvements 828,803,564 860,481,461 929,802,708 1,047,989,120 1,176,516,288
1,846,125,405 1,908,245,003 2,014,974,834 2,284,917,655 2,672,401,726
Area A
Land 576,733,692 550,601,886 553,676,115 613,283,723 723,615,121
Improvements 510,479,198 514,365,148 536,312,187 574,899,162 695,322,973
1,087,212,890 1,064,967,034 1,089,988,302 1,188,182,885 1,418,938,094
Area B
Land 679,171,259 653,170,122 628,581,218 698,375,988 793,763,146
Improvements 436,167,535 443,553,676 481,155,869 497,969,076 579,505,976
1,115,338,794 1,096,723,798 1,109,737,087 1,196,345,064 1,373,269,122
Area C
Land 354,607,391 373,879,734 401,194,695 435,268,051 523,977,716
Improvements 243,838,372 249,919,463 268,775,744 300,281,998 351,308,336
598,445,763 623,799,197 669,970,439 735,550,049 875,286,052
Area E
Land 922,997,481 936,505,978 952,950,255 1,101,191,823 1,321,098,160
Improvements 803,074,703 802,839,998 859,000,333 946,707,574 1,125,037,662
1,726,072,184 1,739,345,976 1,811,950,588 2,047,899,397 2,446,135,822
Area F
Land 437,090,317 480,025,867 455,230,717 486,815,057 576,328,468
Improvements 494,453,607 520,082,393 565,652,426 649,799,198 791,786,273
931,543,924 1,000,108,260 1,020,883,143 1,136,614,255 1,368,114,741
Area G
Land 798,701,799 806,701,391 853,017,767 942,399,196 1,087,774,943
Improvements 674,193,000 695,824,397 761,024,743 871,308,383 1,020,848,685
1,472,894,799 1,502,525,788 1,614,042,510 1,813,707,579 2,108,623,628
Area H
Land 528,161,615 537,986,327 537,943,860 580,058,194 735,994,464
Improvements 343,755,771 354,282,707 395,701,980 456,061,900 538,255,049
871,917,386 892,269,034 933,645,840 1,036,120,094 1,274,249,513
TOTAL MUNICIPAL 17,323,935,766 17,795,405,874 18,773,014,360 21,447,852,846 25,007,277,172
TOTAL ELECTORAL AREAS 7,803,425,740
7,919,739,087 8,250,217,909
9,154,419,323 10,864,616,972
TOTAL ALL 25,127,361,506 25,715,144,961 27,023,232,269 30,602,272,169 35,871,894,144
TOTAL PROPERTY ASSESSMENTS NET TAXABLE VALUES (2014‐2018)


Copyright © 2022 FDOKUMEN