Ho ЭРr` H¥${f AZwg§YmZ g§сWmZ - ICAR-CIARI
284
-
Upload
khangminh22 -
Category
Documents
-
view
1 -
download
0
Transcript of Ho ЭРr` H¥${f AZwg§YmZ g§сWmZ - ICAR-CIARI


ANNUANNUANNUANNUANNUAL REPORAL REPORAL REPORAL REPORAL REPORTTTTT2009 - 202009 - 202009 - 202009 - 202009 - 201111100000
Central Agricultural Research InstitutePort Blair – 744 101, Andaman & Nicobar Islands
Ho ÝÐr` H¥${f AZwg§YmZ g§ñWmZnmoQ>© ãbo`a - 744 101, A§S>_mZ Am¡a {ZH$mo~ma Ûrn

CARI Annual Report 2009-2010
ii
© Director, CARI, Port Blair
Published Director, CARI, Port Blair
Chief Editor Dr. R.C. Srivastava
Sectional Editors
Natural Resource Management Dr. S.K. AmbastHorticulture & Forestry Dr. D.R. SinghField Crops Dr. Krishna KumarAnimal Science Dr. A. KunduFish & Fisheries Science Dr. S. DamroySocial Science Dr. Ajmer Singh KunduGeneral Section Dr. S.K. Zamir Ahmed
Hindi Translation Dr. S.K. Verma
Layout, Graphics & Cover Design Dr. M. BalakrishnanDr. S.K. Zamir Ahmed
Type setting Mrs Rina Saha
Photography Shri K. Ali Akbar
Overall Compilation & Editing Dr. S.K. Zamir AhmedIncharge PMC Cell
Printed at M/s Capital Business Service & ConsultancyB-51, Sahid Nagar, Bhubaneswar-751 007E-mail : [email protected]
All rights are reserved. No part of this book shall be reproduced or transmitted in any form by print,microfilm or any other means without written permission of the Director, CARI, Port Blair.

CARIAnnual Report 2009-2010
iii


CARIAnnual Report 2009-2010
v


CARIAnnual Report 2009-2010
vii
C O N T E N T S
1. Preface by Director Page No.1.1 Hindi ix
1.2 English xi
2. Executive Summary xiii
2.1 Bilingual xiii
3. Introduction 1
3.1 Mandate 1
3.2 Organisational Set up 1
3.3 Organogram 2
3.4 Vision 3
3.5 Thrust Areas for XI Plan 3
3.6 New Research Initiatives 4
3.7 Staff Position 5
3.8 Budget Utilization 5
4. Research Programmes 6
4.1 Natural Resource Management 7
4.2 Horticulture and Forestry 32
4.3 Field Crops 73
4.4 Animal Science 122
4.5 Fisheries Science 150
4.6 Social Science 176
4.7 Krishi Vigyan Kendra 188
5. Technologies Assessed and Transferred 194
6. Information on Other Sections 195
6.1 Library 195
6.2 Planning, Monitoring and Coordination Cell 195
6.3 Computer Cell 196
6.4 Sub-Distributed Information Centre 197
6.5 Estate Section 199
6.6 RTI,ITMU, Rajbhasha Implementation cell 200
6.7 Post Graduate Students Cell 201
7. Awards and Recognition 206
8. Ongoing Research Projects 208

CARI Annual Report 2009-2010
viii
8.1 Externally funded 208
8.2 Institute funded 211
9. Publication 215
10. Peer Recognition to Director 226
10.1 Management & Guidance of R and D & Extension 228
11. Participation of Scientist in Conferences/ Seminars/ Symposia/ Meetings 233
12. Human Resource Development for Stakeholders 238
13. Round up of Institute Activities 243
14. Linkages and Collaboration 245
15. Distinguished Dignitaries 246
16. Personnel 249
17. Committees of the Institute 251
18. New Entrants/ Transfer/ Promotion/ Retirement 253
19. Weather Parameters 254

CARIAnnual Report 2009-2010
ix
Am_wI_wPo H|$ÝÐr` H¥${f AZwg§YmZ g§ñWmZ H$s df© 2009-10 H$s dm{f©H$ [anmoQ>© àñVwV H$aVo hþE hf© H$m
AZw d hmo ahm h¡ Ÿ& `h df© h_mao {bE ~hþV go Jd© ^ao jUm| H$mo g§Omo o hþE ~hþV hr `mXJma df©
ahm Ÿ& h_mao {bE 3 {gVå~a 2009 H$m {XZ ñd{U©_ {XZ Wm O~ _hm_{h_ S>m°.E.nr.Oo. AãXwb
H$bm_, nyd© amï´>n{V VWm AmYw{ZH$ maV Ho$ _mJ©Xe©H$ h_mao g§ñWmZ _| nYmao Ÿ& CÝhm|Zo h_mao g^r
d¡km{ZH$m| Ho$ gmW hr gmW nmoQ>© ãbo a _| pñWV AÝ` g§ñWmZm| Ho$ g_ñV d¡km{ZH$m| Ho$ gmW {dMmam|
H$m AmXmZ àXmZ {H$`m Ÿ& CÝhm|Zo h_mar AZwg§YmZ d àgma J{V{d{Y`m| _| ~hþV hr é{M {XImB©
Am¡a h_| Am¡a A{YH$ H$m © H$aZo Ho$ {bE àmoËgm{hV {H$`m Ÿ& Xygam C„mgnyU© {XZ 26 \$adar 2010 H$mo Wm O~ h_mao g§ñWmZ
Ûmam àmoÚmo{JH$s` ghm`Vm àmá nm§M {H$gmZm| H$mo _mZZr` lr eaX ndma Or Ûmam gå_m{ZV {H$`m J`m VWm CZH$s g\$bVm H$s
JmWm H$mo H¥${f _§Ìmb` Ûmam àH$m{eV hmd}ñQ> Am°\$ hmon Zm_H$ H$m°\$s Q>o~b ~wH$ _| gpå_{bV {H$`m J`m {Og_o nyao ^maV df©
Ho$ 101 {H$gmZm| H$s g\$bVm H$s JmWm H$m C„oI {H$`m J`m h¡ Ÿ& h Ho$.H¥$.AZw.g§. H$s àmoÚmo{J{H$`m| H$s {H$gmZm| Ho$ IoVm| VH$
nhÿ±M H$m n[aUm_ h¡ Ÿ&
Ûrnr` H¥${f Ho$ {d{^Þ KQ>H$m| Ho$ {bE Zr{V`m| H$m {dH$mg H$aZo Ho$ CÔoí` Ho$ gmW OwbmB© 2009 _| EH$ {dk _§S>b gÌ H$m
Am`moOZ {H$`m J`m {OgH$m efve®eesæ[ "A§S>_mZ {ZH$mo~ma Ûrn g_yh Ho$ {bE Ob Zr{V' Zm_H$ XñVmdoO Ho$ én _| gm_Zo Am`m Ÿ&
Bg XñVmdoO H$mo d¥hX én _| gamhm J`m Am¡a A§S>_mZ {ZH$mo~ma àemgZ Zo BgHo$ AÜ``Z d Bg Zr{V H$mo H$m`m©pÝdV H$aZo Ho$
{bE EH$ H$m ©~b H$m ^r JR>Z {H$`m Ÿ& BgHo$ A{V[aº$ Ob òmoVm| Ho$ {dH$mg hoVw h_mar àmoÚmo{JH$s Ho$ AmYma na A§S>_mZ
{ZH$mo~ma àemgZ Zo Zm[a`b Ho$ ~JrMm| H$mo qgMmB© CnbãY H$amZo Ho$ {bE én o 64.5 bmI H$s EH$ nm`bQ> n[a`moOZm H$s r
ñdrH¥${V àXmZ H$s Ÿ&
Bg Ad{Y Ho$ Xm¡amZ CÎmar d _Ü` A§S>_mZ Ho$ {XJbrnwa _| Zm~mS>© Ûmam {dV nmo{fV EH$ ~{hJ©_ H|$ÝÐ H$s r ñWmnZm H$s J`r Ÿ&
Bg H|$ÝÐ Ûmam CÎmar d _Ü` A§S>_mZ Ho$ {H$gmZm| Ho$ gmW h_mam àgma V§Ì Am¡a A{YH$ _O~yV hþAm h¡ Ÿ& h_Zo X{jUr Ûrn g_yh
Ho$ {H$gmZmo Ho$ gmW ^r AnZo g§~§Ym| H$mo _O~yV {H$`m h¡ Ÿ& gwZm_r Ho$ níMmV CËnÞ hþE H¥${f n[aÑí` H$m AÜ``Z H$aZo VWm
AZwg§YmZ d {dH$mg {H$ g§ mdZmAm| H$mo VbmeZo Ho$ {bE _¢Zo OZdar 2010 _| ^maV df© Ho$ gwXya X{jUr N>moa H$ån~¡b ~o H$m
Xm¡am {H$`m Ÿ& X{jUr Ûrn g_yh H$s {d{^Þ H¥${f CËnmXm| H$s _m§J H$mo nyam H$aZo Ho$ {bE Bg Ûrn H$mo EH$ "àmoS>ŠgZ h~' Ho$ én
_| {dH${gV {H$`m Om gH$Vm h¡ Ÿ& AmZo dmbo dfm} _| Ho$.H¥$.AZw.g§. Bg {Xem _| _hËdnyU© H$X_ CR>mZo dmbm h¡ VWm AJbo nm§M
dfm] _| Ho$ån~ob ~o H$mo {ZH$mo~ma Am¡a ZZH$m¡S>r Ûrn g_yh Ho$ {bE "EJ«rH$ëMab àmoS>ŠgZ h~' Ho$ ê$n _| {dH${gV {H$`m
Om oJm Ÿ&
CARI Annual Report 2009-2010
x
_¢ _mZZr` S>m°. _§Jbm am`, nyd© g{Md, H¥${f AZwg§YmZ d {ejm {d^mJ Ed§ nyd© _hm{ZXoeH$, ^m.H¥$.AZw.n. Am¡a S>m°. Eg.
A`ßnZ, g{Md, H¥${f AZwg§YmZ d {ejm {d^mJ Ed§ _hm{ZXoeH$, ^m.H¥$.AZw.n. Ho$ à{V Am^ma àH$Q> H$aZm Mmhÿ±Jm {OZHo$
{Za§Va _mJ©Xe©Z Am¡a àmoËgmhZ go hr h_ CÞ{V Ho$ nW na AJ«ga hþE h¡ Ÿ& _mZZr` S>m°. EM.nr. qgh, Cn _hm{ZXoeH$
(~mJmZr) h_oem go hr h_mao àoaUm òmoV aho h¡ Am¡a o g^r CnbpãY`m§ CZHo$ Hw$eb ZoV¥Ëd Ho$ H$maU hr àmá hmo gH$s h¡ Ÿ& _¢
à^mdr ZoV¥Ëd d g_W©Z Ho$ {bE CZH$m YÝ`dmX H$aZm Mmhÿ±Jm Ÿ& _¡§ S>m°. Eg.Eg. _Ja, AÜ`j, AZwg§YmZ gbmhH$ma g{_{V
d g_ñV g{_{V gXñ`m| H$m ^r Am^mar hÿ± {OÝhm|Zo Bg CnH«$_ H$mo nyam H$aZo _| AnZm ^anya g_W©Z {X`m Ÿ& _¢ S>m°. C_oe
lrdmñVd, ghm`H$ _hm{ZXoeH$ (~mJmZr-2) H$m ^r Am^mar h±y {OZH$m gh`moJ h_| {Za§Va àmá hmoVm ahm Ÿ&
_¢ _mZZr` bo. OZab (AdH$me àmá) yn|Ð qgh, CnamÁ`nmb, A§S>_mZ {ZH$mo~ma Ûrn g_yh Am¡a lr {ddoH$ ao, _w»` g{Md,
A§S>_mZ {ZH$mo~ma àemgZ H$m ^r Am^mar hÿ± {OÝhm|Zo h_oem hr h_| àmoËgm{hV {H$`m Am¡a AnZm g_W©Z {X`m Ÿ& CÝhm|Zo h_mar
J{V{d{Y`m| _| Jhar é{M br, h_ CZHo$ Am^mar h¡ Ÿ& h_ A§S>_mZ {ZH$mo~ma àemgZ Ho$ g^r A{YH$m[a`m| H$m YÝ`dmX H$aVo
h¡ {OÝhm|Zo h_oem hr h_| gh`moJ àXmZ {H$`m Ÿ& A§V _| _¢ H¡$ar n[adma Ho$ g^r gXñ`m| H$m Am^mar hÿ± {OÝhm|Zo g§ñWmZ Ho$ CÔoí`m|
H$mo nyam H$aZo Ho$ {bE df© ^a H$S>m n[al_ {H$`m VWm g\$bVm Ho$ nW na AJ«ga hþE Ÿ&
O` {H$gmZ & O` qhX Ÿ&
a_oe M§Ð lrdmñVd{ZXoeH$
_B©, 2010
nmoQ>© ãbo a

CARIAnnual Report 2009-2010
xi
It is my privilege to present annual report of Central Agricultural Research
Institute, Port Blair for year 2009-10. The year has been a memorable year
with many proud moments to cherish. The golden moment was 3rd
September, 2009 when the institute hosted Dr. A.P.J. Abdul Kalam former
President of India and a visionary of modern India. He interacted with our
scientists as well as scientists of fellow scientific organizations of city. He
showed keen interest in our activities and motivated us to achieve big.
Another cherished day was 26th February, 2010 when five farmers
technologically supported by CARI were honoured by Hon'ble Shri Sharad Pawar, Union Minister
of Agriculture on their inclusion in 101 success stories of farmers of all over the country in 'Harvest
of Hope' a Coffee Table Book brought by Ministry. It was indeed a great honour for five island
farmers to be among 101 from all over country. It was triumph of CARI technologies in the field.
Continuing our effort to develop policies for different components of island agriculture, a brain
storming session was conducted in July, 2009 and outcome was a document on Water Policy for
A & N Islands. This document has been widely appreciated and A & N Administration has
formed a working group to study it and suggest ways to implement it. Further based on our
technology for water resource development, A & N Administration has sanctioned a pilot project
at a cost of Rs. 64.5 lakh for providing irrigation to a coconut plantation.
During the report year, an Out Reach Centre was established at Diglipur in North & Middle
Andaman District with financial support from NABARD. This center has strengthened our
extension network with farmers of this northern district. We have also strengthened our link
with southern group of islands. In January, 2010, I visited Campbell Bay which is the southern
most part of India to study the agricultural scenario post tsunami and explore the research and
development agenda for post permanent shelter period. It has a potential to be developed as a
production hub for different agricultural products to fulfill the need of islands of Southern group.
During the coming years CARI is likely to take lead in this direction and hope that within next
few years the Campbell Bay will be developed as 'Agricultural Production Hub’ for Nicobar and
Nancowry group of Islands.
I express my sincere gratitude to Hon'ble Dr. Mangala Rai, Former Secretary, DARE & DG ICAR
and Hon'ble Dr. S. Ayappan, Secretary, DARE & DG ICAR for their constant guidance and
encouragement. Hon'ble Dr. H.P. Singh, DDG (Hort.) has been our source of inspiration and all
the achievements have been possible only due to his able leadership. I express my sincere thanks
for providing an effective leadership and support. I am grateful to Dr. S.S. Magar, Chairman,
PREFACE

CARI Annual Report 2009-2010
xii
Research Advisory Committee and all members of RAC for their unflinching support in our
endeavors. I shall also thank Dr. Umesh Srivastava ADG (Hort. II) for his support.
I am grateful to Hon'ble Lt. Gen. (Retd.) Bhopinder Singh, Lt. Governor, A & N Islands and Shri
Vivek Rae, Chief Secretary, A & N Administration for their encouragement, and support. They
have shown keen interest in our activities and we thank them for their support. I am thankful to
officers of A & N Administration, for their support & cooperation in our activities. Lastly but not
least I am thankful to all member of CARI family who have worked hard for whole year to achieve
our goals and go beyond normal call of duty.
Jai Kisan, Jai Hind.
May, 2010 R.C. SrivastavaPort Blair Director

CARIAnnual Report 2009-2010
xiii
H$m ©H$mar gmam§eEXECUTIVE SUMMARY
àmH¥${VH$ g§gmYZ à~§YZNatural RNatural RNatural RNatural RNatural Resouresouresouresouresource Managementce Managementce Managementce Managementce Management
Imao nmZr na AmYm[aV g_o{H$V H¥${f àUmbr _| ~ÎmI EH$ _hÎmdnyU© KQ>H$ Ho$ ê$n _| g_m{hV H$s Om gH$Vr h¢ Š`m|{H$O~ Imao nmZr H$s g§mÐVm 15 nr.nr.Q>r. VH$ ~T>mB© JB© V~ r H$moB© _¥Ë w Xa Zht XoIr JB© Ÿ& g§mÐVm H$s {d{^Þ AdñWmAm|_| ^r EH$, Xmo d VrZ gámh Ho$ A§Vamb na Xoh^ma _| H$moB© {deof A§Va Zht XoIm J`m Ÿ& N>h gm¡ dJ© _rQ>a Ho$ Vmbm~joÌ\$b go ~ÎmI KQ>H$ Ûmam Mma _hrZm| _| AÊS>m| H$s {~H«$s Ûmam ê$n o Mma hOma H$s àm{á g§ d h¡ Ÿ&
In brackish water based integrated farming system, ducks can serve as an important componentas no mortality was observed when introduced gradually to saline water of differentconcentrations up to 15 ppt. The body weight recorded at different week intervals do notpronounce much difference in different concentration of salinity for a period of one, two andthree weeks interval. A return of Rs 4000/- from 600 m2 pond area can be obtained from theduck component within four months through sale of eggs.
nhmS>r OJhm| _| gyú_ {gMm§Bª V§Ì H$m {S>OmBZ ~ZmZo Ho$ {bE nmaån[aH$ ygVh gd}jU VWm AmH$mer` VarH$m| O¡go [a_moQ>g|qgJ Ed§ Or.AmB©.Eg. Am{X H$m à`moJ H$aVo hþE EH$ ZE VarHo$ H$m {dH$mg {H$`m J`m Vm{H$ ~Zm o JE Ob òmoVm| H$mg\$bVmnyd©H$ Cn`moJ {H$`m Om gHo$ Ÿ&
A new procedure using conventional topographic survey and spatial tools i.e. remote sensingand GIS for design of micro-irrigation system in undulated terrains has been developed for
efficient utilization of created water resources.
A oX N>Vm| `m ßbmpñQ>H$ _ëM go ~Zo gãOr joÌm| go ^ao OmZo dmbo bmB§S> Vmbm~ Ho$ Cn wº$ AmH$ma H$m {S>OmBZ H$aZo Ho${bE Ob g§VwbZ {d{Y H$m à`moJ {H$`m J`m Ÿ& Xg _| go AmR> dfmo± _| ewîH$ H$mb _| nMmg dJ© _rQ>a N>V joÌ\$b go bmB§S>Vmbm~ _| BH$R²>R>m {H$E JE dfm©Ob go 361 KZ _rQ>a j_Vm dmbo Vmbm~ go IW/CPE AZwnmV 0.5 Ho$ gmW EH$ hOmadJ© _rQ>a Ho$ joÌ _| bJm o JE Zm[a`b Ho$ 18 nm¡Ym| m 322 KZ _rQ>a j_Vm dmbo Vmbm~ go gwnmar Ho$ 160 nm¡Ym| H$mo nyaH${g§MmB© Xr Om gH$Vr h¡ Ÿ& EH$ hOma dJ© _rQ>a Ho$ ßbmpñQ>H$ _ëM joÌ\$b Ho$ dfm©Ob H$mo 290 KZ _rQ>a j_Vm dmboVmbm~ _| EH${ÌV H$aHo$ IW/CPE AZwnmV 0.5 Ûmam 2778 {e_bm {_M© Ho$ nm¡Ym| H$mo qg{MV {H$`m Om gH$Vm h¡ Ÿ&
Water balance approach was used to design the optimal size of lined tank fed from impermeablerooftop or plastic mulched vegetable area. In case of 50 m2 rooftop area to harvest rainwaterin lined tank, 361 cu m and 322 cu m capacity tank can provide supplemental irrigation atIW/CPE ratio 0.5 to 18 coconut plants or 160 arecanut plants in 1000 m2 in 8 out of 10 yearsduring the dry period. In case of plastic mulched area of 1000 m2 to harvest rainwater, 290 cum capacity tank can provide supplemental irrigation at IW/CPE ratio 0.5 in the same areawith 2778 capsicum plants.
CARI Annual Report 2009-2010
xiv
à`moJm| Ûmam kmV hþAm h¡ {H$ d_uH$ånmoñQ>> Ho$ gmW Zm[a`b H$s ygr Ho$ {_lU H$m à`moJ H$aHo$ {_Q²>Q>r H$s AåbVm H$mog§Vw{bV aIm Om gH$Vm h¡ Ÿ& H$_ {Zdoe dmbo H¥${f V§Ì _| bmBq_J Ho$ d¡H$pënH$ òmoVm| H$mo nhMmZZo Ho$ {bE Am¡a A{YH$AÜ``Z H$s Amdí`H$Vm h¡ Ÿ&
Experimental results have indicated that coconut husk along with vermi-compost can be usedas potential material for managing acid soil. Further study is needed to identify the alternative
sources of liming in low input agricultural system.
AZwg§YmZ àjoÌ n[apñW{V`m| _| b§~r g_`md{Y dmbr àOm{V a§OrV Zo 3.57 Q>Z/ho. H$s CnO Xr h¡ Omo {H$ dfm©YmZ (3.4
Q>Z/ho.) Ho$ bJ^J ~am~a h¡, gm{dÌr (2.85 Q>Z/ho.) VWm Jm`Ìr (2.3 Q>Z/ho.) H$s CnO Bggo H$_ Wr O~{H$ BgH$sVwbZm _| _mÜ`_ g_`md{Y dmbr àOm{V VmB©Mw§J goZ y Zo 2.05 Q>Z/ho. H$s CnO Xr h¡ Ÿ& IoV n[apñW{V`m| _| r Bg O¡gmhr PwH$md XoIZo _| Am`m Ÿ&
Long duration rice variety Ranjit recorded higher grain yield of 3.57 t ha-1 though at par with
Varshadhan (3.4 t ha-1) followed by Savitri (2.85 t ha-1) and Gayatri (2.3 t ha-1) as compared to
medium duration Taichung Sen Yu (2.05 t ha-1) at on station condition. Similar trend has beenobserved at on farm condition.
Va _m¡g_ _| Zm[a`b Ho$ ~JrMo _| ImZo dmbr _y§J\$br Ho$ ~rO H$m CËnmXZ bm^H$mar ê$n _| {H$`m Om gH$Vm h¡ Ÿ&ICGS76 `m TG37A àOm{V _| Á`mXm _mÌm _| ~rO H$s CnO Ho$ {bE Jmo~a H$s ImX H$m 10 Q>Z/ho. H$s Xa go à`moJ{H$`m OmZm Cn wº$ nm`m J`m h¡ Ÿ& Xg df© go A{YH$ nwamZo ~JrMo H$s Anojm ZE ~JrMo _| {Jar H$s CnO bJ^J 62%
A{YH$ nmB© Om gH$Vr h¡ Ÿ& {H$gmZ {Jar H$mo ~rO Ho$ {bE ~oMH$a AnZr Am` H$mo 19% VH$ ~T>m gH$Vo h¢ Ÿ&
Seed production of table purpose groundnut can be taken up profitably in coconut plantation
during wet season. Application of 10 t ha-1 of FYM with ICGS76 or TG37A variety is found
suitable for higher kernel seed yield. Around 62% higher kernel seed yield can be obtained in
younger plantations than old plantations (>10 years). Farmers can increase their net incomeby 19%, if selling kernels as seed instead of pods for seed.
FPARP n[a`moOZm _| {H$gmZm| Ho$ IoVm| _| Mm¡S>r Š`mar d Z{bH$m nÕ{V Ho$ àXe©Zm| _| `h nm`m J`m {H$ Š`m[a`m| _|gpãO`m| {H$ IoVr H$aZo na ½`mah _hrZm| _| ê$n o 67091 go ê$n o 89000 H$s Hw$b àm{á g§ d hþ r Omo {H$ {H$gmZ Ûmam{H$E JE \$gb à~§YZ na {Z ©a Wr Ÿ&
In case of broad bed and furrow system demonstrated in farmers fields under FPARP project,the net returns from vegetable cultivation in beds ranged from Rs 67091 to as high as Rs 89000/ha in 11 months depending on the crop management by the farmers.
dfm© H$s {dî`dmUr {H$E JE d XO© {H$E JE AmH$S>m| Ho$ gË`mnZ go h kmV hþAm {H$ _mZgyZ níMmV _m¡g_ _| BZ XmoZm|_| Am¡gVZ 53.7% g_mZVm Wr O~{H$ _mZgyZ Ho$ Xm¡amZ `h _mÌ 23.4% Wr Ÿ&

CARIAnnual Report 2009-2010
xv
Verification of forecasted and observed values of rainfall revealed that on an average forecastedand observed values of rainfall are matching to the tune of 53.7 % during post monsoon periodwhile it is only 23.4 % for monsoon period.
~mJmZr d dm{ZH$sHorticulture & Forestry
ñWmZr` gpãO`m| Ho$ ê$nmË_H$ {ddaU VWm nmofH$Vm àmo\$mBb H$m {dH$mg {H$`m J`m Ÿ& g|Q´>o„m E{e`m{Q>H$m, gm¡amongA§S>amoJmæZg Am¡a A_a¡ÝWg Q´>mB©H$ba _| Hw$b {ZYm©[aV g§ajH$ VËd {OZ_o gyú_ nmofH$ VËd VWm E§Q>rAmŠgrS>|Q> `m¡{JH$^r gpå_{bV h¡ H$s _mÌm à{V B©H$mB© ImÚ nXmW© _| gdm©{YH$ Wr Ÿ&
Morphological descriptors and nutritional profile of indigenous vegetables has been developed.Total estimated protective elements including micronutrient and antioxidant compounds inper unit edible portion were highest in Centella asiatica, Sauropus androgynus and Amaranthustricolor.
nmobrhmD$g n[apñW{V`m| _| Q>_mQ>a H$s AH$m© AZÝ`m (1.67 {H$J«m./nm¡Ym), AH$m© {dH$mg (1.59 {H$J«m./nm¡Ym) VWmDARL-3 (1.43 {H$J«m./nm¡Ym) {H$ñ_m| H$m àXe©Z AÀN>m ahm Ÿ&
Tomato cv. Arka Ananya (1.67kg/plant), Arka Vikash (1.59kg/plant) and DARL-3 (1.43kg/
plant) performed well in polyhouse condition.
bmo{~`m H$s AH$m© J[a_m, H$mer H§$MZ Am¡a 09/ COPBVAR 4, S>m°brH$g ~rZ H$s IIVR SEM-II, ñdU© CËH¥$ï> Am¡aIIVR SEM-186, \«|$M ~rZ H$s AH$m© AZyn, H§$Q>|S>a Am¡a DWD FB-57 Am¡a g§H$a {^ÝS>r H$s 09/OKHYB-10, 09/
OKHYB-9 VWm 09/OKHYB-2 {H$ñ_m| Zo AÀN>m àXe©Z {H$`m Ÿ&
Cowpea cv. Arka Garima, Kashi Kanchan and 09/COPBVAR 4, Dolichos bean cv. IIVR SEM-11, Swarna Utkrist and IIVR SEM-186, French bean cv. Arka Anoop, Contender and DWD FB-
57 and Okra hybrids 09/OKHYB-10, 09/OKHYB-9 and 09/OKHYB-2 were found promising.
Amby H$s Hw$\$ar gy m© Zm_H$ àOm{V Ûrnr` n[apñW{V`m| Ho$ {bE g~go Cn wº$ nmB© JB© Ÿ&
Potato cv. Kufri Surya was found suitable in Island conditions.
H§$X \$gbm| Ho$ O_©ßbmÁ_ nyb _| nm§M ZE EŠgog§g² H$mo gpå_{bV H$aZo Ho$ gmW Hw$b 36 EŠgog§g² H$m à~§YZ {H$`m Omahm h¡ Ÿ&
With addition of five new accessions in all 36 accessions are being maintained at the germplasm
pool of tuber crops.
nmobrhmD$g n[apñW{V`m| _| Oa~oam H$s OwS>r {H$ñ_ _| gdm©{YH$ ao âbmoaoQ> XO© {H$E JE O~{H$ _{ZOoëg {H$ñ_ _| EH$_m¡g_ _| gdm©{YH$ \y$b nmE JE Ÿ&

CARI Annual Report 2009-2010
xvi
Under polyhouse, maximum number of ray florets was recorded in Gerbera cv. Judy whilemaximum number of flowers/season was observed in cv. Manizales.
ê$nmË_H$ JwUm| Ho$ AmYma na Am_ ~JrMm| Ho$ _w»` amoJOZH$ H$moboQ>moQ>mB©H$_ _¡pÝO\o$ar H$mo Xmo g_yhm| gr. _¡pÝO\o$ar-I Am¡a gr._¡pÝO\o$ar-II _| {d^º$ {H$`m J`m h¡ Ÿ&
Based on morphological characteristics Colletotrichum mangiferae a major pathogen in mangoorchards was grouped into C. mangiferae-I and C. mangiferae-II.
Q´>mB©H$moS>_m© AmB©gmoboQ²>g Ûmam amoJOZH$m| H$s d¥{Õ _| gr. _¡pÝO\o$ar-I Am¡a gr. _m¡pÝO\o$ar-II H$m BpÝh{~gZ à{VeVH«$_e… 47.1 go 60.0% d 46.1 go 60.0% Wm Ÿ&
The percent inhibition of mycelial growth of pathogens by Trichoderma isolates was rangedfrom 47.1 to 60.0% (C. mangiferae I) and 46.1 to 60.0% (C. mangiferae II).
gwnmar H$s H¡$ar-{gboŠgZ-I go A{YH$V_ 6.1 {H$J«m. N>mbr à{V d¥j àmá H$s JB© Ÿ&
Arecanut selection (CARI-selection-1) produced maximum chali weight/tree (6.1kg).
Ebo \$gb àUmbr _| N>Q>mB© ~m`mo_mg Ho$ 10 Q>Z/ho. go Mm¡bmB© XmZo H$s A{YH$V_ CnO 770 {H$J«m./ho. àmá H$s JB© Omo{H$ 2.5 Q>Z/ho. N>Q>mB© ~m`mo_mg go àmá H$s JB© CnO (624 {H$J«m./ho.) go gmW©H$ én go A{YH$ Wr Ÿ&
The highest grain yield of Grain Amaranthus (770 kg ha-1) was recorded with the incorporationof 10 t ha-1 pruned biomass in the alley cropping system which was significantly higher thanyield obtained with incorporation of 2.5 t ha -1 (624 kg ha-1).
Ho$.H¥$.AZw.g§. _| ñWmZr` d _w»` y{_ go EH${ÌV O¡Q>mo\$m VWm nm|Jo{_`m {nÞmQ>m H$s {H$ñ_m| go ~JrMo H$s ñWmnZm H$s JB© Ÿ&
Seed orchard for Jatropha species and Pongamia pinnata was developed from local and mainlandcollections at CARI.
Iwbr pñW{V`m| _| KmgnmV H$m CËnmXZ 88.6 Q>Z/ho. Wm Omo {H$ H¡$Zmonr Ho$ _Ü` (79.9 Q>Z/ho.) d H¡$Zmonr Ho$ ZrMo (69.6
Q>Z/ho.) go gmW©H$ én go A{YH$ Wm Ÿ&
Herbage yield in open condition (88.6 t ha-1) was significantly higher than between canopy
(79.9 t ha-1) and under canopy (69.6 t ha-1).
g^r Kmgm| go KmgnmV H$m CËnmXZ 60 {H$J«m. ZmB©Q´>moOZ / ho. Ho$ à`moJ go 95.2 Q>Z/ho. àmá {H$`m J`m Omo {H$ 40 {H$J«m.ZmB©Q´>moOZ/ho. Ho$ à`moJ go àmá 87.9 Q>Z/ho. CËnmXZ go gmW©H$ én go A{YH$ Wm Ÿ&
The highest herbage production from all grasses was recorded with 60 kg N ha-1 (95.2 t ha-1)
which was significantly higher than 40kg N ha-1 (87.9 t ha-1) irrespective of canopy and grasses.
Hw$b nm°br{\$Zmob H$s A{YH$V_ _mÌm _mo[aS>m OrZmoQ>B©n TRA-2 (300 {_J«m./100 J«m.) Am¡a EÝWmogm`{ZZ H$s A{YH$V__mÌm (91.8 {_J«m./100 J«m.) JGH-I _| XO© H$s JB© Ÿ&

CARIAnnual Report 2009-2010
xvii
The highest total polyphenol was recorded in Morinda genotype TRA-2 (300mg/100g) and
anthocynin in JGH-1 (91.8mg/100g).
joÌr` \$gb|Field CrField CrField CrField CrField Cropsopsopsopsops
Ho$.H¥$.AZw.g§. Zo A§S>_mZ {ZH$mo~ma Ûrn g_yh H$s ñQ>oQ> grS> g~ H$_oQ>r Ho$ _mÜ`_ go YmZ H$s nm§M àOm{V`m§ [abrO H$s Ÿ&BZ_| go Xmo àOm{V`m§ {deof én go VQ>r` bdUVm wº$ n[apñW{V`m| Ho$ {bE {dH${gV H$s J`r Wr O~{H$ AÝ` VrZgm_mÝ` _¥Xm Ho$ {bE h¢ Ÿ& o g~ àOm{V`m§ erW ãbmB©Q>, ~r.Eb.~r., br\$ ñnmoQ>, VZm N>oXH$ VWm bmoqOJ Ho$ à{VghZerb h¢ Ÿ&
CARI released five rice varieties through State Seed Sub Committee for A & N Islands. Out ofthese, two varieties were specially developed for coastal salinity conditions and other threefor normal soils. All these selections are tolerant to sheath blight, BLB, leaf spot, stem borer
and lodging.
E.AmB©.gr.Ama.nr. narjUm| Ho$ A§VJ©V ~hþV AJoVr YmZ H$s gm¡ {XZ n[an¹$Vm dmbr ANR-I Zm_H$ bmB©Z _yë`m§H$ZhoVw V¡ ma h¡ Ÿ& h dfm© AmYm[aV {ZMbr y{_ H$s n[apñW{V`m| _| CJmB© OmZo dmbr bKw H$X H$mR>r (90-100 go_r.) H$r,à^mdr H$„m| (7 go 8 à{V nm¡Ym) dmbr, AÀN>r no{ZH$b bå~mB© (25 go_r.) dmbr, _Ü`_ _moQ>o XmZo dmbr d 4.0 go 4.5
Q>Z/ho. CnO XoZo dmbr àOm{V h¡ Ÿ&
A very early rice line (ANR-1) with 100 days maturity is ready for evaluation under AICRPtrials. It is short stature (90-100 cm), effective tiller (7 to 8 per plant), good panicle length (25cm), medium bold grain with 4.0 to 4.5 ha-1 yield under rainfed lowland condition. It is toleranceto sheath blight, leaf spot, bacterial light and lodging.
gmV \$gbm| Ho$ Mma gm¡ nMhÎma OrZm|Q>mB©n AWm©V YmZ (375), _y§J (15), MZm (10), _¸$m (11), bmo{~`m (4) Am¡a{Vb (60) H$m g§J«h {H$`m J`m Ÿ&
Four hundred seventy five genotypes of seven crops viz. rice (375), green gram (15), blackgram (10), maize (11), cowpea (4) and sesame (60) were collected/procured.
YmZ H$s AJoVr VWm _Ü`_ AJoVr EH$ gm¡ {Vamgr bmB©Zm| H$m _yë`m§H$Z {ZMbr y{_ _| {H$`m J`m Ÿ& H$aOmV-3 (6.66 Q>Zho.), IR-78555-3-2-2-2 (5.69 Q>Z/ho.) Am¡a IR-78581-12-3-2-2 (5.40 Q>Z/ho.) AmemOZH$ nmB© JB© Ÿ&
One hundred eighty three early and medium early lowland rice lines were evaluated in thereplicated trials. Karjat-3 (6.66 ha-1), IR-78555-3-2-2-2 (5.69 ha-1) and IR-78581-12-3-2-2 (5.40ha-1) found promising.
YmZ H$s {ZÝ`mZdo bdU ghZerb bmB©Zm| H$m 4-5dSm-1 B©.gr. Am¡a 8.7 nr.EM. dmbr _¥Xm _| _yë`m§H$Z {H$`m J`m Ÿ&IR-759418-7B-21-3, IR 7646-B-B-10-1-1-1 VWm CSR 28 àOm{V 4.34 Q>Z/ho. CnO Ho$ gmW g~go A{YH$AmemOZH$ nmB© JB© Ÿ&

CARI Annual Report 2009-2010
xviii
Ninety nine salt tolerant rice lines were evaluated under soil having EC 4-5 dSm-1 and pH 8.7.The lines IR-759418-7B-21-3, IR 7646-B-B-10-1-1-1 along with check variety CSR 28 were foundmost promising with yield of 4.34 ha-1 each.
dfm© AmYm[aV n[apñW{V`m| _| YmZ Ho$ nm§M g§H$am| H$m _yë`m§H$Z {H$`m J`m Ÿ& SPH-168 H$s CnO gdm©{YH$ (5.30 Q>Z/ho.) nmB© JB© Ÿ&
Five rice hybrids were evaluated under rainfed conditions. The highest yield were recordedfor SPH-168 (5.30 ha-1).
ewîH$ _m¡g_ (OZdar go _mM©) Ho$ Xm¡amZ _y§J H$s gmobh VWm CX© H$s nÝÐh bmB©Zm| H$m ñWmZr` àOm{V`m| Ho$ gmW _yë`m§H$Z{H$`m J`m Ÿ&
Sixteen promising lines of green gram and 15 lines of black gram along with local check varietieswere evaluated during dry season (January to March).
YmZ H$m 101 {H$J«m., {Vb H$m 3 {H$J«m. Am¡a _y§J H$m 5 {H$J«m. ~rO VWm Hw$b 109 {H$J«m. àOZH$ ~rO CËnÞ {H$`m J`m Ÿ&
Total 109 kg breeder seed of rice (101 kg), sesame (3 kg) and green gram (5 kg) were produced.
dfm© AmYm[aV {ZMbr y{_ H$s n[apñW{V`m| _| YmZ H$s b§~r Ad{Y H$s Mm¡hÎma {H$ñ_m|/CÞV bmB©Zm| H$m g§J«hU Am¡a_yë`m§H$Z {H$`m J`m Ÿ& A{YH$V_ CnO OJ~ÝYw (4.49 Q>Z/ho.), MTU-2067 (4.39 Q>Z/ho.) Am¡a MTU-1075
(4.32 Q>Z/ho.) go àmá H$s J`r Ÿ&
Seventy four long duration rice cultivars/improved lines were collected and evaluated underrainfed lowland condition. The maximum yield was recorded for Jagabandhu (4.49 ha-1), MTU-2067 (4.39 ha-1) and MTU-1075 (4.32 ha-1).
gm_mÝ` IoV n[apñW{V`m| _| YmZ H$s VrZ gm¡ {nMhÎma bmB©Zm| H$mo _w»` ~r_m[a`m| Am¡a H$sS>o _H$moS>m| Ho$ à{V naIm J`m{OZ_o go CZVrg bmB©Zm| H$mo ~r_m[a`m| Am¡a H$sS>o _H$moS>mo§ Ho$ à{V ghZerb nm`m J`m Ÿ&
Three hundred and seventy five lines of rice were screened against major disease and insectsunder natural field condition, out of which twenty nine lines were found tolerance to insectsand diseases.
dfm© AmYm[aV {ZMbr y{_ H$s n[apñW{V`m| _| YmZ Ho$ {d{^Þ n[anŠdVm g_yhm| _| 103 bmB©Zm| _| J§Yr ~J Ho$ AmH«$_UHo$ H$maU CnO na à^md H$m AÜ``Z {H$`m J`m Ÿ& J§Yr ~J H$m A{YH$V_ AmH«$_U Xoa go nH$Zo dmbr bmBZm| _| VWmCgHo$ ~mX _Ü`_ Ad{Y H$s bmBZm| _| nm`m J`m naÝVw h ~hþV AJoVr, AJoVr d _Ü`_ AJoVr bmB©Zm| _| ~hþV H$_ Wm Ÿ&AÜ``Z go kmV hþAm {H$ AJoVr d _Ü`_ AJoVr bmB©Zm| H$s Anojm _Ü`_ VWm Xoa go nH$Zo dmbr bmBZm| _| CnO õmg44-49% VH$ Wm Ÿ&
Yield loss was studied due to Gundhi bug incidence in 103 lines of rice different maturitygroups under rainfed low land condition. The maximum Gundhi bug incidence was recorded

CARIAnnual Report 2009-2010
xix
in late maturing lines followed by medium duration, but it was very low in very early, earlyand medium early lines. The study reveals that there was 44-49% yield reduction in mediumand late duration liens as compared to early and medium early.
O§Jbr Om_wZ Ho$ 23 {d{^Þ Z_yZm| _| AmZwd§er` g_mZVm H$m nVm bJmZo Ho$ {bE 20 Ama.E.nr.S>r. Am¡a 30
AmB©.Eg.Eg.Ama. _mH©$g© H$m à`moJ {H$`m J`m Ÿ& O§Jbr Om_wZ Ho$ g^r Z_yZm| _| Ama.E.nr.S>r. àmB©_a Ûmam 67%
g_mZVm VWm AmB©.Eg.Eg.Ama. àmB©_a Ûmam 44% g_mZVm S>oÝS>amoJ«m_ Ûmam {d o{XV H$s J`r Ÿ&
20 RAPD and 30 ISSR markers were used to infer genetic similarity among 23 different samplesof wild Jamun. The dendrogram differentiate all the samples of wild Jamun at 67 % similaritywith RAPD primers and 44 % similarity with ISSR primers.
PCR-RELP _| gmV {d{^Þ aopñQ´>H$gZ E§OmB_m| H$m à`moJ H$aHo$ Ho$bm Am¡a YmZ Ho$ amB©Omoñ\$s`a go AmB©gmoboQ> {H$E JEHw$b 43 PGP OrdmUw AmB©gmoboQ²>g H$m {M•rH$aU {H$`m J`m Ÿ& 16s rRNA OrZ grŠd|[g§J Am¡a ãbmñQ> g_mZVm ImoOgo BZ AmBgmoboQ²>g H$mo ~o{gbg Am¡a gyS>mo_moZmg àOm{V H$m nm`m J`m Ÿ&
A total of 43 PGP bacterial isolates from banana and rice rhizosphere were characterized byPCR-RFLP using 7 different restriction enzyme. 16s rRNA gene sequencing and BLASTsimilarity search identified these isolates as Bacillus sp. and Pseudomonas sp.
PCR-RFLP _| VrZ {d{^Þ aopñQ´>H$gZ E§OmB_m| H$m à`moJ H$aHo$ Q´>mB©H$moS>_m© àOm{V Ho$ 15 E§Q>mJmo{ZgQ> AmB©gmoboQ²>g H$m{M•rH$aU {H$`m J`m Ÿ& rRNA OrZ grŠd|qgJ Am¡a ãbmñQ> g_mZVm ImoO go BZ AmB©gmoboQ²>g H$mo Q>mB©H$moS>_m© Amodm{bñnmoa_,Q´>mB©H$moS>_m© {d[aS>r Am¡a Q´>mB©H$moS>_m© h{O© mZ_ Ho$ én _| {M{•V {H$`m J`m Ÿ&
15 antagonistic isolates of Trichoderma sp. were characterized by PCR-RFLP using 3 differentrestriction enzyme. rRNA gene sequencing and BLAST similarity search result identified theseisolates as Trichoderma ovalisporum, Trichoderma viride and Trichoderma harzianum.
Xg \$adar Am¡a Xg _mM© H$mo bJmB© JB© Q>_mQ>a H$s XmoZm| {H$ñ_m| Eg-22 Am¡a nygm é~r VWm {_M© H$s Ho$-2 {H$ñ_ _|_waPmZ amoJ na A{YH$ gmno{jH$ AmЩVm H$m à^md nS>m Ÿ& {_M© Ho$ nÎmr _wS>Z amoJ _| VrZ H$maH$m| O¡go A{YH$V_ dÝ wZV_ Vmn_mZ d dfm© {XZm| H$s g§»`m H$m amoJ Ho$ {dH${gV hmoZo na nƒrg OZdar, nƒrg \$adar Am¡a Xg _mM© H$moamo{nV H$s J`r \$gb na gmW©H$ à^md nS>m Ÿ& nƒrg \$adar Am¡a Xg _mM© _| A{YH$V_ Vmn_mZ H$m [aJ«ogZ H$mo{\${g |Q>_mZ, Xg _mM© Ho$ {bE dfm© {XZm| H$s g§»`m VWm nƒrg OZdar Ho$ {bE Ý wZV_ Vmn_mZ gmW©H$ nm`m J`m Ÿ&
High relative humidity influenced wilt in tomato in February 10th and March 10th plantedcrops of both varieties S-22 & Pusa Ruby of tomato as well as chilly (K2). In the case of chillyleaf curl- 3 factors viz., maximum and minimum stemperature & rainy day (RD) was significantinfluencing disease development on January 25th, February 25th & March 10th planted crops. InFebruary 25th & March 10th the regression co-efficient value of maximum temperature & rainydays for March 10 th and January 25 th minimum temperature was found significant.

CARI Annual Report 2009-2010
xx
Q>_mQ>a _| amoJ _| à{VeV H$_r d CnO ~T>mZo Ho$ {bE gñ` {H«$`mAm|, O¡d {Z §ÌH$ EO|Q>m| Am¡a \$\y§$Xr ZmeH$ Ho$ {_bo Owbo_moS²> yb H$mo g~go A{YH$ à^mdr nm`m J`m Ÿ& n[aUm_m| go `h ^r kmV hþAm {H$ J¡a hmoñQ> \$gb Ho$ gmW \$gb MH«$ VWmQ>_mQ>a H$s \$gb Ho$ gmW ~_m© Y{Z o H$s IoVr H$aZo go amoJ {Z §ÌU _| ghm`Vm hþB© Am¡a Q>_mQ>a H$s CnO r A{YH$ àmá hþB© Ÿ&
Module consists of combination of cultural practices, biocontrol agents and fungicides weremost effective in percent reduction of disease incidence and increasing yield of tomato. Theresults also suggested that crop rotation with non host crop and intercropping with Burmadhania with tomato resulted into improved disease control and yield of tomato.
Q>_mQ>a _| amoJ à~§YZ hoVw {H$E JE {H$gmZ Ho$ IoV na narjUm| go `h kmV hþAm {H$ g^r nm§M {H$gmZm| Ho$ IoVm| _| Q>_mQ>a_| OrdmUw _waPmZ, nÎmr _wS>Z, VZm JbZ Am¡a \w$go[a`b _waPmZ amoJ H$s KQ>ZmAmo _| à{VeV H$_r bmZo Ho$ {bE ~rOCnMma+H$mna AmoŠgrŠbmoamB©S> _| nm¡Y H$m Sw>~mZm+Jmo~a H$s ImX Am¡a Zr_ H$s Ibr (5.0 {H$J«m./dJ© _rQ>a) Ho$ gmWThe-CARI-5 H$m _¥Xm _| {_bmZm + Zr_ Ho$ Vob (2%) Ho$ Xmo {N>S>H$md H$mo g~go A{YH$ à^mdr nm`m J`m Ÿ&
OFT trial on disease management of tomato revealed that seed treatment + seedling dip withcopper oxychloride + Soil application of Th-CARI-5 along with FYM and neem cake (5.0 Kg/m2) + two sprays of neem oil (2 %) was found most effective in percent reduction in diseaseincidences of bacterial wilt, leaf curl, basal stem rot and fusarial wilt of tomato in all fivefarmer’s field.
Q´>mB©H$moS>_m© Ho$ Mm¡Xh AmB©gmoboQ²>g H$m H$mbr {_M© _| \w$Q> amoQ> amoJ Am¡a EÝWaŠZmoO ~r_mar n¡Xm H$aZo dmbo nr.H¡$n{ggrAm¡a gr. H¡$n{ggr Ho$ {déÕ {Û H$ëMa narjU ×mam _yë`m§H$Z {H$`m J`m Ÿ& nr. H¡$n{ggr Ho$ {bE A{YH$V_ à{VeV{ZfoY Tv-CARI-27 Ûmam XO© {H$`m J`m O~{H$ gr. H¡$n{ggr Tv-CARI-27 Ûmam gdm©{YH$ n¡am{gQ>mBÁS> {H$`m J`m Ÿ&
Fourteen isolates of Trichoderma isolates were evaluated against P. capsici and C. capsici causingfoot rot and anthracnose disease in Black pepper by dual culture test and highest percentinhibition of P. capsici was recorded with Tv-CARI-27 whereas C. capsici was most parasitizedwith Tv-CARI-27.
Q´>mB©H$moS>_m© Ho$ Mm¡Xh AmB©gmoboQ²>g H$m nr. H¡$n{ggr Am¡a gr. H¡$n{ggr Ho$ {déÕ Zm°Z dmoboQ>m{`b E§Q>r~m`mo{Q>H$ CËnmXZÛmam _yë`m§H$Z {H$`m J`m Ÿ& nr. H¡$n{ggr Am¡a gr. H¡$n{ggr Ho$ {déÕ H«$_e… Tv-CARI-26 Am¡a Tv-CARI-33 H$moà^mdr nm`m J`m Ÿ&
Fourteen isolates of Trichoderma isolates were evaluated against P. capsici and C. capsici byproduction of non-volatile antibiotics and Tv-CARI-26 and Tv-CARI-33 were found mosteffective against P. capsici and C. capsici, respectively.
~¡{dgQ>rZ, gm\$ Am¡a {H«$bmŠñ`b JmoëS> Zm_H$ \$\y§$Xr ZmeH$m| H$mo gr. H¡$n{ggr H$s Anojm nr. H¡$n{ggr Ho$ {déÕà^mdr nm`m J`m O~{H$ _¡ÝH$moO¡~ Am¡a grAmogr nr. H¡$n{ggr Ho$ à{VeV {ZfoY _| g~go H$_ LC
50 _mZ Ho$ gmW g~go
A{YH$ à^mdr Wo Ÿ&

CARIAnnual Report 2009-2010
xxi
The fungicides Bavistin, Saaf and Krilaxyl Gold were more effective against C. capsici than P.capsici whereas Mancozeb and COC were more effective in percent inhibition of P. capsici withlowest LC50 value.
nr. H¡$n{ggr Am¡a gr. H¡$n{ggr H$m A{YH$V_ à{VeV {ZfoY VrZ à{VeV Zr_ Vob Ho$ gmW XO© {H$`m J`m Am¡a BgHo$~mX H$a§O Vob Am¡a ~_m© Y{Z`m gËd Ho$ gmW Ÿ&
Highest percent inhibition of P. capsici and C. capsici was recorded with Neem oil at 3% followedby Kranj oil and extracts of Burma dhania.
Th-CARI-37, Tv-CARI-32 Am¡a Th-CARI-27 AmB©gmoboQ> H$mna AmoŠgrŠbmoamB©S>, _¡ÝH$moO¡~ Am¡a {H«$bmŠg`bJmoëS> Ho$ gmW g~go A{YH$ g§JV Wo Ÿ&
The isolates Th-CARI-37, Tv-CARI-32 and Th-CARI-27 were most compatible with Copperoxychloride, Mancozeb, Moximate and Krilaxyl Gold.
H$mbr {_M© Ho$ \w$Q> amoQ> Ho$ {déÕ Q´>mB©H$moS>_m© àOm{V Ho$ J«rZ hm°Cg _| {H$E JE _yë`m§H$Z go kmV hþAm {H$ Th-CARI-33
g~go A{YH$ Cn wº$ nm`m J`m VWm Bggo ~r_mar H$s KQ>Zm _| 63.9% H$s H$_r AmB© Ÿ& BgHo$ níMmV Tv-CARI-32,
Tv-CARI-14, Tv-CARI-16 VWm Tv-CARI-27 H$mo nm`m J`m {Og_o \w$Q> amoQ> H$s ~r_mar H$s KQ>Zm _| 42.6% H$sH$_r AmB© Ÿ&
Green house evaluation of Trichoderma spp against Foot rot of Black pepper revealed that theisolate Th-CARI-33 was most effective with 63.9% reduction in disease incidence, followed byTv-CARI-32, Tv-CARI-14, Tv-CARI-16 and the isolate Th-CARI-27 was noted with leastreduction in disease incidence of foot rot (42.6%).
H$mbr {_M© Ho$ \w$Q> amoQ> Ho$ {déÕ \$\y§$Xr ZmeH$ Ho$ J«rZ hm°Cg _| {H$E JE _yë`m§H$Z go kmV hþAm {H$ H$mbr {_M© Ho$ \w$Q>amoQ> H$mo X~mZo _| _¥Xm S>aopÝM¨J Am¡a ~moS>m°Šg {_lU H$m nÝÐh {XZm| Ho$ A§Vamb na {N>S>H$md g~go A{YH$ à^mdr nm`mJ`m {Oggo ~r_mar H$s KQ>Zm _| 96.0% H$s H$_r AmB© Ÿ& BgHo$ níMmV H$mna AmoŠgrŠbmoamBS> d _¡ÝH$moO¡~ go H«$_e…88.8 d 75.6% H$s H$_r AmB© Ÿ&
Green house evaluation of fungicides against Foot rot of Black pepper revealed that the soildrenching and spray of Bordeux mixture at 15 days interval was found very effective insuppression of foot rot of Black pepper with 96.0% reduction in disease incidence followed byCopper oxychloride (88.8%), Mancozeb (75.6%).
nmoby ~rQ>b Ho$ {bE g_o{H$V H$sQ> à~§YZ go kmV hþAm {H$ H$mbr {_M© _| XmZo H$mo g~go H$_ à{VeV hm{Z VWm A{YH$V_CnO AÝ` _moS> wëg H$s Anojm Cg g_o{H$V _moS²> yb _| XO© H$s JB© {Og_o H$m§Q> N>m§Q>, Zr_ H$s Ibr H$m _¥Xm _| Cn`moJAm¡a Zr_~mZ H$m n{V`m| na {N>S>H$md Am¡a {ŠdZmë\$mog CnMma (3.13%) Wm Ÿ&
IPM module for Pollu Beetle showed that lowest percent berry damage and highest yield ofBlack pepper was recorded in integrated module with pruning, soil application of neem cake

CARI Annual Report 2009-2010
xxii
and foliar spray of Neembaan and Quinalphos treatment (3.13%) as compared to other modulestested.
\$b _ŠIr (~¡ŠQ´>mgoam Hw$Hw$a{~Q>r) Ho$ {bE à`moJembm AdñWmAm| _| à{VamoYH$ {H«$`m H$m narjU {H$`m J`m Ÿ& narjU{H$E JE N>h nm¡Ym| _| go gmB±OmB©{O`_ Eamo_¡{Q>H$_, E_mo__ EŠ y{bEQ>_ Am¡a _mo[a¨S>m {gQ´>r\$mo{b`m H$mo \$b _ŠIr Ho${déÕ g~go A{YH$ à^mdr nm`m J`m Ÿ& BZH$s LC
50 H«$_e… 8.83, 10.67 Am¡a 10.85% nmB© J`r Ÿ&
To test repellency action against fruit fly, Bactrocera cucurbitae under laboratory conditions.Out of 6 plants tested, Syzygium aromaticum, Amomum aculeatum and Morinda citrifolia werefound effective against fruit fly as LC50 (median lethal concentration) was 8.83, 10.67 and10.85%, respectively.
q^S>r Ho$ VZm d \$b N>oXH$ Ho$ {bE {dH${gV {H$E JE g_o{H$V _moS²> yb, {Og_o gñ`, m§{ÌH$ Am¡a O¡d H$sQ> Zmer à~§YZ{H«$`mAm| H$m g_mdoe {H$`m J`m Wm Ÿ& Bg g_o{H$V _moS²> yb _| {H$gmZ H$s nÕ{V (7.31%) H$s Anojm N>oXH$ H$s H$_KQ>ZmE± (5.64%) {_br VWm Mmbrg à{VeV A{YH$ CnO XO© H$s JB© Ÿ&
Integrated module developed for okra shoot and fruit borer combining cultural, mechanicaland bio-pesticides management practices had less incidence of borer (5.64%) as comparedto farmer practice (7.31%). Fourty percent higher yield was recoded in integrated module ascompared to farmers practice.
Zrb d h¡ìbmoH$ Ûrnm| go EH${ÌV {H$E JE Añgr AmBgmoboQ²>g H$mo O¡d{Z §ÌH$ Am¡a nrOrnr JwUm| hoVw H$S>mB© go naIZo na27 AmBgmoboQ²>g H$m M`Z {H$`m J`m Ÿ& g~go A{YH$ g§»`m _| ~¡{gbg àOm{V nmB© JB© Ÿ& Q´>mB©H$moS>_m© H$s ~mah àOm{V`m|H$m AÜ``Z {H$`m J`m {OZ_o Q>r. BarZo{g`_, Q>r. Amodobrñnmoa_, Q>r. Eñnoarb_ Am¡a Q>r. ~«o{dH$mo_n¡H$Q>_ H$s ^maV _|`h g~go nhbr [anmoQ>© h¡ Ÿ&
The rigorous screening of the 80 isolates from Neil & Havelock Islands for biocontrol andPGP attributes finally led to the selection of 27 isolates. The dominating organism was Bacillussp. Twelve Trichoderma spp were studied in that T. erinaceum, T. ovalisporum, T. asperellum andT. brevicompactum are the first report from India. Twenty one Colletotrichum spp were studiedfor morphological and molecular level suggests that the variation in Colletrotrichum was morein A & N Islands.
gãgQ´>oQ> ñQ>r_ narjUm| go `h kmV hþAm {H$ Ádma Ho$ XmZm| H$mo ~rg {_ZQ> VH$ ^mn XoZo go Voahd| {XZ g~go A{YH$H$dH$Omb d¥{Õ (12.0 go_r.) nmB© JB© O~{H$ YmZ Ho$ M¡\$s XmZm| _| h 9.0 go_r., Ho$bm Am¡a gwnmar nÎmr _| 8.5 go_r.,Johÿ± XmZo _| 8.3 go_r., YmZ Ho$ ygo Am¡a XmZo _| 8.0 go_r. nmB© JB© Ÿ& g~go H$_ d¥{Õ (7.7 go_r.) gyIo Zm[a`b H$s ygr_| nmB© JB© Ÿ& {d{^Þ narjUm| Ho$ _Ü` Vrg go n¡Vmbrg {_ZQ> VH$ mn Ûmam CnMma H$aZo na r H$dH$Omb _| H$moB© gmW©H$d¥{Õ XoIZo H$mo Zht {_br Ÿ&
Substrates steamed experiment revealed that 20 minutes steaming had highest mycelial growthat 13th day in sorghum grain (12.0 cm) followed by rice grain (chaffy) (9.0 cm), banana and

CARIAnnual Report 2009-2010
xxiii
arecanut leaf (8.5 cm), wheat grain (8.3 cm), paddy straw and rice grain (8.0 cm) and leastgrowth was observed in dry coconut husk (7.7 cm). In 30 and 45 minutes steaming timingsnon significant mycelial growth was obtained among treatments.
gd}jU Am§H$S>m| go kmV {H$ BZ Ûrnm| _| Zm[a`b, Am`b nm_, ~¢JZ, d Q>_mQ>a H¥§$VH$ J{V{d{Y`m| Ûmam à^m{dV h¡ Ÿ&BgH$s _ma H«$_e… 8-26, 40-50, 5-46 Am¡a 8-34 à{VeV nmB© JB© Ÿ&
Survey data revealed that coconut, oil palm, brinjal and tomato are seriously affected by rodentinfestations. It ranged from 8-26, 40-50, 5-46 and 8-34 percent respectively in the Islands.
new {dkmZAnimal Science
H$mbr, g\o$X Am¡a yar {ZH$mo~mar _w{J© m| H$m ~mahd| gámh _| Xoh ma Ho$ AmYma na M`Z {H$`m J`m Ÿ& BZ_| d`ñH$Vm H$sAm w H«$_e… 22.21 Am¡a 22 gámh Wr VWm nMmg {XZm| H$m A§S>m CËnmXZ H«$_e… 18, 25 Am¡a 22 A§S>o à{V njr Wm Ÿ&
Black, White and Brown Nicobari Fowl were selected on the basis of 12th week body weight. TheAge at sexual maturity of Black, White and Brown Nicobari fowls were 22, 21 and 22 weeksrespectively and the respective 50 days egg production were 18, 25 and 22 eggs per bird.
dZamOm _w{J© m| H$m Xoh ^ma hoVw _yë`m§H$Z {H$`m J`m Ÿ& dZamOm _w[J© m| H$m N>h d Xg gámh na Xoh ^ma H«$_e… 431.53
Am¡a 924.35 J«m_ Wm Ÿ&
Vanaraja birds were procured and evaluated for body weight. The average 6th and 10th weekbody weight of Vanaraja birds were 431.53 and 924.35 g respectively.
ILI 80 d yar {ZH$mo~mar _wJu H$s g§H$a _w{J© m± AÝ` g§H$a _w{J© m| H$s Anojm ~ohVa A§S>m XoZo dmbr {gÕ hþ r Ÿ& H$mbr{ZH$mo~mar d H$mbr amoH$ H$s g§H$a _w{J© m± AÝ` g§H$a _w{J© m| H$s Anojm {ÛH$mOr _w{J© mo± Ho$ én _| AÀN>r {gÕ hþ r Ÿ&
The ILI 80 x Brown Nicobari crossbred showed better than all other crosses as good layersand Black Nicobari x Black Rock cross showed as dual purpose as compared to other crosses.
no{H$Z Am¡a Mmam-M_obr g§H$a ~ÎmI AÝ` Xygao g§H$am| go ~ohVa h¡ VWm BZH$m Cn`moJ _m§g hoVw {H$`m Om gH$Vm h¡ Ÿ&
The Pekin and Chara-Chembelli crossbred was better than all other crosses and may be usedas meat purpose duck.
bmO© ìhmBQ> `mH©$em`a gyAam| H$s àOZZ j_Vm àXe©Z go kmV hþAm {H$ Aa~r, YmZ H$s ygr `m YmZ/Johÿ± Ho$ Qy>Q>o XmZm|Ûmam ~Zm o JE XmZo H$s Anojm _¸$m AmYm[aV XmZm A{YH$ Cn wº$ h¡ Ÿ&
Reproductive performances of Large White Yorkshire pigs revealed that maize based dietwas found the best when compared with the ration consist of colocasia, rice bran or brokenrice /wheat based diet.

CARI Annual Report 2009-2010
xxiv
gwAam| _| nrR> na MT>r hþ r dgm H$s _moQ>mB© Ho$ AëQ´>mgmoZmoJ«m{\$H$ narjU go `h kmV hþAm {H$ N>moQ>o d ì`ñH$ gwAam| _|BgH$s _moQ>mB© H«$_e… 19.00 Am¡a 33.17 {__r. Wr Ÿ& `h ^r ~Vm`m J`m {H$ N>moQ>o d ì`ñH$ gwAam| _| dgm O_m hmoZo H$sà{H«$`m _| gmW©H$ én go A§Va h¡ Ÿ& Bg {d{Y H$m à`moJ Xoer VWm {dXoer gwAam| H$s dgm VWm _m§gno{e`m| H$s JwUdÎmmOmZZo _| {H$`m Om gH$Vm h¡ Ÿ&
Ultrasonographic evaluation of back fat thickness was observed to be 19.00 and 33.17 mm inyoung and adult pigs respectively. It is suggested that the process of fat deposition in youngand adult pigs varies significantly and this method is found to be useful in characterizing thefat and muscle of indigenous and exotic pigs.
H$ma {ZH$mo~ma _| gwAam| Ho$ nmofU _mZ ñVa go kmV hþAm {H$ XwY {nbmZo dmbr _mXmE§ àmoQ>rZ D$Om© Hw$nmofU (PEM) qgS´>mo_go J«{gV Wr {OgHo$ H$maU CZH$s àOZZ j_Vm na ~wam à^md hþAm Ÿ&
Nutritional status of pigs at Car Nicobar showed that nursing sows were suffering from severeprotein energy malnutrition (PEM) syndrome resulting in poor reproductive performance.
_mo[a¨S>m {gQ´>r\$mo{b`m nÎmr Am¡a \$b Ho$ Šbmoamo\$m_© Am¡a EgrQ>moZ _| ~Zm o JE gËd H$s eëgQ>mo{Z`m gmoboZo{g oa_ Ho$ Xmo{d{^Þ {dëJZm| RSN 6 Am¡a RSN 12 Ho$ {déÕ OrdmUwamoYr J{V{d{Y nmB© JB© Ÿ& A{YH$Va OrdmUw amo{Y`m| H$s Anojm_mo[a¨S>m {gQ´>r\$mo{b`m Ho$ gËd H$mo A{YH$ Cn`moJr nm`m J`m Ÿ& BgH$m Cn`moJ nm¡Ym| Ho$ amëgQ>mo{Z`m Ho$ g§H«$_U Ho$ CnMmahoVw ^r {H$`m Om gH$Vm h¡ Ÿ&
The chloroform and acetone extract of Morinda citrifolia leaf and fruit produced antibacterialactivity against two different isolates of Ralstonia solanacearum; RSN 6 and RSN 12. The potentialof the Morinda citrifolia extracts was found much better than most of the antibiotics and thesame may be useful against the treatment of Ralstonia infection in plants.
_mo[a¨S>m {gQ´>r\$mo{b`m \$b H$m gËd Jm` H$mo 100 {_br. à{V{XZ H$s Xa go {nbmZo na WZ¡bm amoJ go J«ñV Jm`m| Ho$ XyYH$s nr.EM., H§$S>ŠQ>r{dQ>r Am¡a OrdmUw ^ma _| H$_r XO© H$s JB© Ÿ&
Feeding of Morinda citrifolia fruit juice @ 100 ml daily to cattle reduces the pH, conductivity,and microbial load in the milk of mastitis affected cow.
_mo[a¨S>m {gQ´>r\$mo{b`m Ho$ gyIo \$b Ho$ XmZm| Ûmam ~rg à{VeV VH$ XmZm à{VñWm{nV H$aZo na ^r OmnmZr ~Q>oa _| nm§Mgámh H$s Am w VH$ Xoh ^ma d¥{Õ Am¡a AÀN>r E\$.gr.Ama. XoIr JB© Ÿ&
Replacement of 20% concentrate feed with dried fruit granules of Morinda citrifolia enhancedthe body weight gain in Japanese quail and better FCR at 5th week of age.
AëQ´>mgmoZmoJ«m{\$H$ narjU Ho$ EH$ n[aîH¥$V VarHo$ _| nmZr H$s Zm§X H$m à`moJ H$aVo hþE Jm` Ho$ WZ Ho$ earaaMZmË_H$ JwUm|H$mo gm\$ gm\$ XoIm J`m Wm CZH$m Zmn ^r {b`m J`m Ÿ&
A modified method for ultrasonographic examination using water bath allowed clearvisualization and measurement (sonometry) of teat anatomical characteristics in cows.

CARIAnnual Report 2009-2010
xxv
~H$ar _| OÝ_ Ho$ g_` ~ƒm| Ho$ g§JR>Z go kmV hþAm {H$ gm_mÝ` én go _o_Zo EH$b m wJb én _| n¡Xm hþE Ÿ& EH$b _o_Zm|Ho$ n¡Xm hmoZo H$s Xa 53.33 à{VeV Wr O~{H$ wJb _o_Zo 46.66 à{VeV H$s Xa go n¡Xm hþE Ÿ& EH$b d wJb én _| n¡XmhþE _o_Zm| H$m OÝ_ ^ma H«$_e… 1.60 ± 0.14 Am¡a 1.48 ± 0.14 Wm Ÿ& Za _| H$maH$g CnO (50.13 ± 1.18) _mXr H$sH$maH$g B©ëS> (41.36 ± 0.98 go gmW©H$ én go (p<0.01) A{YH$ Wr Ÿ&
Composition of birth in goats revealed that the usual number of kids born at one time variedfrom single to twins, of which percentage of singles (53.33) were more frequent than twins(46.66). The overall birth weight of kids born as single and twins was 1.48±0.14 and 1.60±0.14respectively. The carcass yield was significantly (p<0.01) higher in males (50.13±1.18) thanfemales (41.36±0.98).
Xoer ~H$[a`m| _| _mBH«$mogoQ>obmBQ> {díboofU go `h kmV hþAm {H$ nÝÐh {d{^Þ bmogmB© _| Hw$b nMmg àH$ma Ho$ OrZmoQ>mBnhmoVo h¡ Ÿ& OrZmoQ>mBn H$s g§»`m (MAF70; SRCRSP3) 1 d 6 (SRCRSP15) Ho$ ~rM ahr Ÿ& Q>oaogm ~H$ar Ho$ à^mdrE{bëg (Ne) H$s g§»`m 2 go 6.98 Ho$ ~rM VWm Xoer ~H$ar _| 2 go 4.31 Ho$ ~rM ahr Ÿ& Q>oaogm d A§S>_mZr ~H$ar Ho$ {bEFIS H$m _mZ F$UmË_H$ Wm Omo Bg ~mV H$m ÚmoVH$ h¡ {H$ BZ ~H$[a`m| _| AÝV…àOZZ Zm hmoH$a ~mˆ àOZZ hþAm Ÿ& Q>oaogmd A§S>_mZr ~H$ar _| _moS> {gâQ> Q>oñQ> Ûmam Oo{Z{Q>H$ ~moQ>bZoH$ n[ab{jV hþ r Am¡a BZ XmZm| àOm{V`m| Ho$ BZ grQy>/EŠggrQy> g§ajU na Am¡a A{YH$ Ü`mZ XoZo H$s Amdí`H$Vm h¡ Ÿ&
Microsatellite analysis of indigenous goats revealed that a total of 50 genotypes were observedacross the 15 loci. The number of genotype varied between (MAF70; SRCRSP3) 1 and 6(SRCRSP15). The effective number of alleles (Ne) varied from 2 to 6.98 in Teressa goat and 2 to4.31 in local goats. All the values of FIS obtained for the Teressa and Andaman local goatswere negative which is suggestive of no inbreeding within the populations and the animalswere outbred. The mode-shift test indicated the genetic bottleneck in Teressa and AndamanLocal goats and needs greater attention towards in situ/ex situ conservation.
BZ Ûrnm| Ho$ Xoer àOm{V Ho$ gyAam| Ho$ IyZ H$mo EH${ÌV H$a CZH$s Om±M H$s JB© Am¡a _mBH«$mogoQ>obmBQ> _mH©$a Ho$ Mma Z_yZm|H$m à`moJ H$aHo$ gyAa Ho$ S>r.EZ.E. Ho$ Epåßb{\$Ho$gZ Ho$ {bE nr.gr.Ama. àmoQ>moH$mb H$m _mZH$sH$aU {H$`m J`m Ÿ&
Blood samples from newly identified indigenous breed of pigs of these islands were collectedand PCR protocol was standardized for amplification of pig DNA using 4 set of microsatellitemarkers.
_Ëñ` {dkmZFisheries Science
A§S>_mZ Ho$ g§a{jV nmZr _| J«wng© H$s qnOS>m IoVr H$s J`r Ÿ& O~ 201.73 ± 27.57 {__r. AmH$ma VWm 90.06 ± 41.40
J«m. dOZ dmbr J«wng© H$mo qnOS>o _| aIm J`m Vmo N>h _hrZm| _| 79.17% ~T>dma d 96.81% Or{dVm XO© H$s J`r Ÿ&CÎmamoÎma H$ëMa narjUm| go `h kmV hþAm {H$ C{MV nmofU Ûmam J«wng© _| ñdOm{V^jU H$mo amoH$m Om gH$Vm h¡ Ÿ&

CARI Annual Report 2009-2010
xxvi
Cage culture of groupers was done in protected waters in Andaman. The grouper stocked atthe size of 201.73 ± 27.57 mm and weight 90.06 ± 41.40 g recorded a growth of 79.17% in sixmonths with 96.81% survival. Successive culture experiments suggested that the cannibalismin the groupers can be checked by resorting to proper feeding.
H¡$Q> {\$e bmdm© {dH$mg BH$mB© H$m {dH$mg {H$`m J`m {Og_| {Z §{ÌV n[apñW{V`m| _| _mJwa àOZZ H$admH$a 60 à{VeVOr{dV g\$bVmnyd©H$ àmá H$s J`r Ÿ& EH$ _m_bo _| {Z §{ÌV n[apñW{V`m| _| Šbm[a`mg ~Q>amH$g H$m àmH¥${VH$ àOZZH$am`m J`m {Og_o Za _N>br H$s ~{b ^r Zht XoZr nS>r Ÿ& `Ú{n _mJwa àOZZ àmoÚmo{JH$s _| n[aîH$aU àJ{V na h¡ Ÿ&
The cat fish larval development unit has been developed wherein breeding of magur has beencarried out successfully with a survival of 60% under controlled condition. There was aninstance of natural breeding of Clarias batrachus in controlled condition where the male wasnot sacrificed. However, refinement of the magur breeding is underway.
Šbm[a`mg ~Q>amH$g _| bdU ghZerbVm AÜ``Z ^r {H$`m J`m Vm{H$ BZH$mo hëHo$ bdUr` joÌm| _| ^r nmbo OmZo H$sg§ mdZmAm| H$m nVm bJm`m Om gHo$ Ÿ& `h XoIm J`m {H$ _N>{b`m| H$s ~T>dma 0 nr.nr.Q>r. bdUVm na AÀN>r hþ r Ÿ&_mJwa H$s _¥Ë w Xa 8 nr.nr.Q>r. bdUVm na gdm©{YH$ Wr (16.7%) Ÿ& O¡damgm`{ZH$ _mZH$m| Ho$ AÜ``Z go h nVm Mbm{H$ 8 nr.nr.Q>r. bdUVm na A{YH$Va _mZH$ O¡go EñH$mo{~©H$ Aåb, é{Ya ½bwH$mog VWm H¥$V ½bmBH$moOZ H$_ hmo JE Ÿ&
Salinity tolerance study was also conducted in Clarias batrachus to explore the possibility ofculturing them in slightly saline areas. It was observed that fishes grow better at 0 ppt salinity.Mortality rate of magur was highest at 8 ppt salinity (16.7%). Studies on biochemical parametersrevealed that most of the parameters like ascorbic acid, blood glucose and liver glycogenlevels were reduced drastically at 8ppt.
S>oåeob _N>br (àoåZg ~m`mHw$boQ>g) H$mo O§Jbr AdñWm go EH${ÌV {H$`m J`m VWm àOZZ OmoS>m ~ZmZo Ho$ {bE ñ\w$Q>Zembm_| XemZwHw${bZ {H$`m J`m Ÿ& _N>br H$m nH$S> AdñWm _| g\$bVmnyd©H$ àOZZ H$am`m J`m VWm «yU {dH$mg H$s A§S>o goh¡pÀbJ VH$ H$s AdñWm H$m [aH$mo{S>ªJ {H$`m J`m VWm \$moQ>moJ«m\$s H$s J`r Ÿ& ñ\w$Q>Z Ho$ níMmV bmdm© (3.724 ± 0.05 go_r.)AÀN>o V¡amH$ Wo VWm `moH$ AdeofU (12-24 K§Q>o) Ho$ níMmV CÝhm|Zo amoQ>r\$g© H$mo ImZm Amaå^ H$a {X`m Ÿ&
The damsel fish, Premnas biaculeatus was collected from wild and acclimatized in the hatcheryfor forming breeding pairs. The fish has been successfully bred in captivity and details ofembryonic development from egg to hatchlings were recorded and photographed. The larvae(3.724 ±0.05 cm) after hatching were active swimmers and started feeding on rotifers afteryolk absorption (12-24 hr.).
ZmoW© ~o Am¡a nw§Jr ~mby _| CnpñWV g_wÐr ñn§O H$s O¡d {d{dYVm H$m XñVmdoOrH$aU {H$`m J`m Ÿ& nw§Jr ~mby go EH${ÌV{H$E JE Mma ñn§Om| O¡go {gao„m ñ`mWmo\$moam, AmogrZo{n`m g¡{OQ>o[a`m, ßbmH$moa{Vg àOm{V d _moZ§Mmoam àOm{V H$mAÜ``Z {d{^Þ Mw{ZÝXm amoJOZH$ OrdmUwAm| Ho$ {déÕ OrdmUw amoYr JwUm| Ho$ {bE {H$`m J`m Ÿ& àma§{^H$ JwUmË_H$ {ÛH$ëMa Añgo go kmV hþAm {H$ AmogrZo{n`m g¡{OQ>o[a`m VWm _moZ§Mmoam àOm{V H$s OrdmUwamoYr J{V{d{Y`m§ _w»` én go

CARIAnnual Report 2009-2010
xxvii
hmoñQ> _oQ>m~mobmB©Q> Ho$ H$maU Wr Ÿ& {gao„m ñ`mWmo\$moam VWm ßbmH$moa{Vg àOm{V _| 75 à{VeV g§~Y OrdmUwAm| Zo Mw{ZÝXmamoJZH$m| Ho$ à{V gmW©H$ (nr < 0.05) OrdmUwamoYr J{V{d{Y àX{e©V H$s Ÿ&
The biodiversity of marine sponges from North Bay and Pongi Baalu has been documented.
Four sponges collected from Pongibaalu viz., Crella cyathophora, Oceanapia sagittaria, Plakortis
sp and Monanchora sp were studied for their antimicrobial properties against selected
pathogenic bacteria. Preliminary qualitative dual culture assay revealed that in case of Oceanapia
sagittaria and Monanchora sp, the antimicrobial activity was primarily due to the host
metabolites. In Crella cyathophora and Plakortis sp., over 75% of the associated bacteria exhibitedsignificant (P<0.05) antimicrobial activity against the selected pathogens.
{ZH$mo~ma Ûrn g_yh _| _m¡g_ n[adV©Z go CËnÞ hþE IVam| Ho$ _yë`m§H$Z hoVw H$ma {ZH$mo~ma H$m {d{^Þ _mZH$m| O¡go g_wÐgVh go D§$MmB©, g_wÐ Vb _| 0.3 go 0.5 _rQ>a H$s Ano{jV d¥{Õ, _¥Xm JwUdÎmm/Jhao VWm y Cn`moJ Am{X na AmYm[aVH¥${f Agwajm _mZ{MÌ ~Zm`m J`m Ÿ& `h nm`m J`m {H$ H$ma {ZH$mo~ma _| bJ^J 20 à{VeV joÌ\$b {dídì`m{n _m¡g_n[adV©Z Ho$ H$maU n¡Xm hmoZo dmbo IVam| Ho$ à{V A{YH$ go ~hþV A{YH$ Agwa{jV h¡ Ÿ&
In order to assess the threats due to climate change in Nicobar group of Islands, agricultural
vulnerability map of Car Nicobar was prepared based on multiple parameters viz., elevation
above mean sea level, estimated sea level rise of 0.3-0.5m, soil quality/depth and land use
pattern. It was observed that about 20% of the area in Car Nicobar has high to very highvulnerability to climate change as predicted globally.
A§S>_mZ {ZH$mo~ma Ûrn g_yh H$s _y§Jm MQ²>Q>mZm| VWm H$ÀN> dZñn{V H$s O¡d {d{dYVm H$m XñVmdoOrH$aU {H$`m J`m VWmA§S>_mZ {ZH$mo~ma Ûrn g_yh H$s H$ÀN> dZñn{V`m| H$mo nhMmZZo Ho$ {bE EH$ joÌ _mJ©X{e©H$m H$m r àH$meZ {H$`m J`m Ÿ&
The coral reef biodiversity and mangrove biodiversity of the A&N Islands were documentedand a field guide for the identification of mangroves of A&N Islands has been published.
gm_m{OH$ {dkmZSocial Science
gpãO`m| Ho$ _yë`m| Ho$ CÎmma MT>md Ho$ H$maUm| H$mo ~Vm nmZm H$m\$s _w{eH$b Wm Ÿ& Ûrndmgr \$adar go Aà¡b Ho$ _Ü`Cn wº$ _mÌ _| A{YH$Va gpãO`m§ CJmVo h¢ Ÿ& {dnUZ gw{dYmE± {OZ_o n[adhZ VWm erVJ¥h H$s gw{dYm ^r gpå_{bV h¢H$m ~hþV hr H$_ {dH$mg hþAm h¡ Ÿ& \y$bm| VWm gpãO`m| H$s ~mOma gyMZm Ho$ {ÛVr` òmoVm| H$m XñVmdoOrH$aU ^br-^m§{VZht {H$`m h¡ &
Prices of vegetables depict very unpredictable behaviour. Islanders produce most of vegetablesin sufficient quantity from February to April. Market infrastructure including transportationand cold storage facilities are poorly developed. Secondary sources of market informationabout flowers and vegetables are not well documented.

CARI Annual Report 2009-2010
xxviii
A§S>_mZ {ZH$mo~ma Ûrn g_yh _| {d{^Þ n[apñW{V{H$`m| _| CJmB© OmZo dmbr YmZ H$s {H$ñ_m| go gå~§{YV gyMZmAm| H$m~m`mo{Q>H$ d E~m`mo{Q>H$ _mZH$m| Ho$ gmW g§J«h {H$`m J`m Ÿ& _m°S>b H$m {dH$mg H$aZo Ho$ {bE EH${ÌV gyMZmAm| H$m narjUAm{Q>©{\${g`b Ý yab ZoQ>dH©$ (E.EZ.EZ.) Ûmam {H$`m J`m Ÿ&
Compiled the available information on rice varieties grown in different ecologies of A & NIslands along with biotic and abiotic parameters. All the compiled information has been testedusing Artificial Neural Network (ANN) for developing model.
ImS>r Ûrnm| _| nmB© OmZo dmbr Mmam \$gbm| go gå~§{YV Am§H$S>m| H$m g§J«h {H$`m J`m VWm BgH$m Zm_ FIRBI aIm J`m Ÿ&
Data base developed for Fodder Information Resources of Bay Islands and is named as FIRBI.
~H$ar nmbZ, d¡H$pënH$ Or{dH$monmO©Z Ho$ én _| A{YH$Va gXñ`m| H$s ng§X Wm naÝVw Bg ì`dgm` H$mo bm^Xm`H$ T>§J goAmaå^ H$aZo _| à_wI H${R>ZmB© Wr àË oH$ BH$mB© H$mo Ano{jV g§»`m _| _o_Zm| H$s AZwßbãYVm Ÿ&
Goat farming was the choice of the maximum group members as an alternate livelihood optionbut the problem was of non-availability of desired number of kids per unit to start the businessin a profitable manner.
CÎma VWm _Ü` A§S>_mZ {Obo Ho$ {XJbrnwa Ho$ Ho$abmnwa_ J«m_ _| OwbmB© 2009 _| Zm~mS>© H$s ghm`Vm go Mma dfm] Ho$ {bEEH$ ~{hJ©_ Ho$§Ð H$s ñWmnZm H$s JB© Ÿ& Cg joÌ _| H¥${f VWm g§~Õ joÌm| _| àmoÚmo{JH$s` hñVm§VaU hoVw àmoÚmo{JH$s`àXe©Z, CÚ{_Vm à{ejU VWm {H$gmZ _obo Ho$ Xm¡amZ àXe©Z «_U Am{X Am`mo{OV {H$E JE Ÿ&
An Out Reach Centre (ORC) was established with the support of NABARD for a period of 4years from July, 2009 at Keralapuram village of Diglipur in North & Middle Andaman District.Technological demonstration, skill training and exposure visit during Kisan Mela were takenup with a view to transfer the technology in agriculture and allied field in that area.
H¥${f {dkmZ H|$ÐKrishi Vigyan Kendra
H¥${f VWm g§~Õ joÌm| _| {hñgoXmam| Ho$ bm^ hoVw BŠ`mdZ à{ejU H$m ©H«$_ Am`mo{OV {H$E JE {OZ_o 1078 bm^m{W© m|Zo ^mJ {b`m Ÿ& A{J«_ n§{º$ àXe©Z Ûmam àmoÚmo{JH$s` àXe©Zm| Ho$ A{V[aº$ IoV na narjU {d{Y Ûmam ^r Mw{ZÝXmàmoÚmo{J{H$`m| H$m {H$gmZm| Ho$ IoVm| _| _yë`m§H$Z {H$`m J`m Ÿ& {d{^Þ àgma {d{Y`m± O¡go àXe©Zr, IoV {Xdg, H¥$fH$
«_U, Q>obr{dOZ àXe©Z, A{^`mZ, Z¡Xm{ZH$ «_U, d¡km{ZH$ H¥$fH$ _ob-{_bmn, ao{S>`mo ~mVMrV, {H$gmZ _obm Am{XH$m à`moJ àmoÚmo{J{H$`m| H$mo bmoH${à` H$aZo _| {H$`m J`m Ÿ&
Fifty one training programmes covering 1078 beneficiaries were taken up in agriculture andallied fields for the benefit of the stakeholders. Beside technological demonstration throughFront Line Demonstration (FLD) and assessment through On Farm Trial (OFT) in selectedtechnologies were conducted in the farmers' field. Different extension tools like exhibition,field days, farmers visit, TV shows, campaign, diagnostic visit, Scientist farmers interaction,radio talks, Kisan Mela were used to popularize the technologies.

CARIAnnual Report 2009-2010
1
INTRODUCTIONORGANIZATION
Realizing the importance of island agriculture to meet the requirement of local population
and tourists, Indian Council of Agricultural Research (ICAR) established Central
Agricultural Research Institute, Port Blair on June 23rd, 1978 by merging different regional
research stations of ICAR institutes located in islands. The ultimate aim of CARI is the
developments of island agricultural production technologies which utilizes the strengths
of the island and convert the constraints in opportunities, without causing any ill effect
to the fragile ecosystem of the island.
MANDATE
To provide a research base to improve the productivity of important
agri-horticulture, livestock and fisheries of A & N islands through
adaptive and basic research for attaining economic self-sufficiency.
To develop appropriate plans for conservation of natural resources and
their sustainable use.
To standardize technologies for animal health coverage and livestock
production.
To standardize techniques for capture and culture fisheries including
coastal aquaculture.
First line transfer of technology and training to the relevant State
Departments.
ORGANISATIONAL SET UP
Administration of the institute rests with the Director, who receives support from both
research divisions and administration. The Research Advisory Committee (RAC), Institute
Management Committee (IMC) and Institute Research Council (IRC) reviews and monitor
the research programmes and facilitates to identify new research thrust areas for the Institute.
To accomplish the mandate, the research activities are organized under five divisions namely,
Natural Resource Management, Horticulture & Forestry, Field Crops, Fisheries Science,
Animal Science and one Social Science Section.

CARI Annual Report 2009-2010
2

CARIAnnual Report 2009-2010
3
VISION
As the island level food security is not achievable, Panchayat level food requirementshould be estimated and food production planning should be tailored to provide locallevel food security with town area being served by food import from mainland.
Reorientation of agricultural production system to provide local level food securityand to meet the demand of perishable products, viz. milk, egg, meat, fish, fruits,vegetables and flowers with specific reference to demand of booming tourism industry.
Making the isolation as our strength, conversion of spices cultivation in an organicfarming with a decoratively packaged Andaman brand organic spices being marketed.
Development of suitable production to consumption level chain involving SHGs andretailers/ armed forces / processors.
Biodiversity richness of the island should be preserved and exploited for national benefit.
Proper rain water management technology to create micro level water resources toincrease irrigated area from present 1% to a significant level.
Making CARI a model for NARS of other small island nations
THRUST AREAS FOR XI PLAN
Conservation and management of natural resources.
Intensification and diversification of the rice based integrated cropping system byincluding vegetables, pulses and oilseeds through land modification, moistureconservation and supplementary irrigation.
Development of technology for water resource development through rain watermanagement and its efficient utilization for diverse cropping system.
Production technology for vegetable crops for increasing productivity.
Improving the varietal productivity of plantation and horticultural crop based systemsthrough intercropping of spices, vegetables, fodder etc. as well as irrigation from rainwater harvesting system.
Development of fish-poultry-crop farming system for fresh and brackish water.
Improving the productivity of cattle, goat, pig, poultry and aquaculture by crossbreeding, health care and nutrition.

CARI Annual Report 2009-2010
4
Frontier research for knowledge and increased productivity.
Undertaking basic / strategic research for generating knowledge of applied significance.
High value agriculture with special reference to vegetables and protected cultivationof high value crops.
Minimizing post harvest losses and maximizing value through appropriatetechnological intervention.
Integrated management of existing insect, weeds and abiotic stresses with specialreference to salinity.
Production technology for inputs and their optimal utilization in organic farming.
Transfer of technology and socio-economic impact analysis.
Identification of appropriate technological options for rehabilitation of tsunami affectedfarming community.
NEW RESEARCH INITIATIVES
Introduction of table purpose rabi groundnut alongwith seed production facility duringkharif.
Evaluation of existing long duration paddy varieties(160-170 days) as well as breedingprogram for new strains to take advantage of long rainy season and adding foddercomponent in pre and post paddy to enhance the cropping intensity to 300% underrainfed conditions.
Rain water management technology for water resource development at hill top andvalleys.
Fodder cultivation on hill slopes through grasses and fodder trees both as sole andintercrops.
Intensification of work on mushroom cultivation, flowers, banana, papaya, pineappleand off season mango.
Evaluation of tropical potato varieties both TPS and tuber at Diglipur (North Andaman).
Integrated farming system in fresh and brackish water areas.
Induced breeding of cat fish and development of hatchery.
Technology of captive breeding of ornamental fishes.
Introduction of buffalos and management practices for indigenous cattle.
Low cost and alternate feed for poultry.

CARIAnnual Report 2009-2010
5
Protected cultivation for high value crops and their value addition.
Identification of technology package for farmers of different socio-economic background.
Germplasm collection of minor fruits viz. Rambutan, Durian, Mangosteen, WildCashew, West Indian Cherry etc.
Production technology including IPM & varietal evaluation of beans, okra, brinjal &tomato.
Cage culture of groupers in creeks and bays to enhance livelihood options.
Pulses & oilseed breeding programme.
Round the year fodder production including making hay & silage and its impact oncattle production & productivity.
STAFF POSITION
BUDGET UTILIZATION DURING 2009-2010
Head of Account Plan (In Lakhs) Non Plan (In Lakhs)
Particulars RE 2009-10 Expt. 2009-10 RE 2009-10 Expt. 2009-10
Establishment Charges - - 919.38 919.37
Travelling Allowances 14.00 13.97 9.18 9.18
Other charges 115.00 115.19 103.87 103.87
Equipment 118.00 118.20 - -
Library 16.00 16.00 - -
Works 133.00 132.60 26.74 26.74
HRD 4.00 4.00 - -
Total 400.00 399.96 1059.17 1059.16
Sl. No. Category Sanctioned Filled
1. Scientific 56+1 35+1
2. Technical 43 35
3. Administrative 29 26
4. Supporting 78 71

CARI Annual Report 2009-2010
6

CARIAnnual Report 2009-2010
7

CARI Annual Report 2009-2010
8
essential nutrients such as carbon, nitrogenand phosphorus in the aquatic environmentwhich stimulated the growth of natural food.Feed given to ducks were also partiallyutilized by the fish as while washing the shedapproximately 10-20 % (23-30 g/day) duckfeed was lost. This feed can be directlyconsumed by fish which provide the nutrientand promotes fish growth. The egg-layingKhaki Campbell produced more than 60 kgof manure / duck (on wet basis). Themoisture content of duck excreta was 56.6%having the 1.8% Ca content.
R.C. Srivastava, N. Ravisankar,S. Ghoshal Chaudhuri, Shrawan Singh,Abhay Kumar Singh, Subhash Chand andGrinson George
During the year, experiments on fresh andbrackish water based integrated farmingsystem was carried out at on station conditionwith an objective to identify, characterize andoptimize the crop, animal, poultry and fishcomponents for fresh (Plate 1) and brackish(Plate 2) water based farming system.
Fresh water based IFS
Evaluation of crops : French bean wasevaluated during the dry season using the waterfrom the pond for estimation of yield,economics and water productivity. On anaverage, yield of 6060 kg /ha was recorded withwater productivity of Rs 22.60 /m3 (Table 1).
Integration of duckery : Khaki Campbellducks integrated under freshwater recordedan average body weight of 1654 g and 1720 gof weight at 24th and 32nd week of agerespectively. The duck droppings wentdirectly into the pond, which in turn provided
Plate 1. Evaluation of french bean for waterproductivity and integration of ducks under
fresh water system
Development of Fresh and Brackish Water Based Integrated Farming System(IFS) in Bay Islands
Table 1. Yield, economics and water productivityof French bean
Parameters Value
Yield 6060 kg/ha
Gross returns Rs 72720 /ha
Net returns Rs 52 720 /ha
B:C ratio 2.64
Water productivity 2.60 kg/m3
Rs 22.60 /m3

CARIAnnual Report 2009-2010
9
Brackish Water based IFS
Evaluation of adaptation of ducklings inbrackish water
Experiment on adaptaton of ducklings robrackish water has been conducted at KVKcomplex, Sippighat for assesment ofadaptation rate of ducklings under brackishwater to assess their survivability and otherproduction performances. Initially 3 weeksold 18 ducklings were put under the singlecompartment under brooding phasetogether for a period of two weeks. Later 6ducklings each shifted to three differentcompartment for assessing the performancein different concentrations of brackish wateri.e. 5, 10 and 15 ppt for one, two and threeweeks period.
Three pits measuring sizes of 1.5 m x 1 m x 1m were dug adjacent to the compartments.The pits were lined by silpaulin material inorder to hold the brackish water throughoutthe trial period. All the ducklings of threedifferent compartments were exposed tofreshwater for one week and from 3rd weekonwards were put under brackish water invarying concentrations. In the first pit, theducklings were exposed to 5, 10 and 15 pptconcentrations for one week period in eachconcentration. In the second pit, theducklings were exposed to 5, 10 and 15 pptfor 2 weeks period each, while in the thirdweek, the ducklings were exposed to 5, 10and 15 ppt for 3 weeks period. The bodyweight of the duckling at the end of eachperiod were recorded to assess anyabnormalities to the ducklings due tobrackish water. The ducklings were providedfreshwater ad-libitum for drinking purposethrough rain water harvesting. Theducklings were allowed for an average of 8
to 10 hours in different concentration inbrackish water up to 6th week and later thisrestriction was removed till the end of trial.Feeding to the ducks was given inside thecompartments to avoid the wastage of feed.The different production performancesmainly the growth performance, chances ofany diarrhoea features throughout the trialperiod, mortality pattern and the age atsexual maturity (ASM) and weight at sexualmaturity (WASM) were recorded preciselyto ascertain the adaptability of duck underbrackish water conditions.
Initially, ducks were very reluctant to moveto brackish water for 3 to 4 days. Noinfection in eyes and diarrhoea wasobserved. The body weight recorded atdifferent week intervals do not pronouncemuch difference in different concentrationof salinity for one, two and three weeksperiod. No mortality was observed whenbirds were gradually put in water withincreased salinity.
After 12th week, the ducks were shifted tofarmer's field and released directly inbrackish water. No mortality of the birds wasrecorded due to introduction of ducks inbrackish water. Under on farm conditions,the birds were given freshwater for drinkingand feed includes the kitchen waste, branand the fishmeal. The sexual maturityattained at the age of 152 days and theweight at sexual maturity recorded to thetune of 1521±52.80 g. A total of 805 numberof eggs worth Rs 4025/- were recorded in aperiod of 4 months having a stock of 12female ducks (Table 2).

CARI Annual Report 2009-2010
10
Plate 2. Experimental set up of evaluation of adaptation of ducklings to brackish waterand ducklings in 10 ppt brackish water
It can be concluded that ducks can serve asone of the important components underbrackish water based farming system as nomortality was observed when birds weregradually released with increasing salinity.The body weight recorded at different weekintervals do not pronounce much difference
in different concentration of salinity for a
period of one, two and three weeks interval.
A return of Rs 4000/- from 600 m2 pond area
can be obtained within four months through
sale of eggs from brackish water based
farming system.
Table: 2. Production performances of ducks under brackish water
Parameters One week in Brackish water ( from 4th – 12th weeks)fresh water
One week Two weeks Three weekseach in each in each in
5, 10, 15 ppt 5, 10, 15 ppt 5, 10, 15 ppt
Average body weight 194.5±27.33 - - -at 3rd weeks (g/bird)
Average body weight - 321.6±20.4 345.0± 19.7 356.6±24.4at 6th weeks (g/bird)
Average body weight - 585.0±19.7 623.3±16.3 640.0±20.0at 10th weeks (g/bird)
Average body weight - 673.6±36.7 720.0±20.9 762.5±18.9at 12th weeks (g/bird)
Initial mortality (0-2 weeks) 2 no’s
Diarrhoeal complications, if any Nil
Mortality (3- 12th weeks) Nil
ASM (Age at sexual maturity) 152 days
WASM (Average Weight 1521±52.80at Sexual Maturity (g)

CARIAnnual Report 2009-2010
11
were generated for different blocks ofplantation and vegetable crops of theGaracharma farm in the Kajunallahwatershed. The elevation contours weresuperimposed on remotely sensed image ofIKONOS data to determine the requiredhydraulic heads and layout for differentblocks considering type of plantation crop,their water requirement and water source.The elevation contours for Old MeteorologyStation block and the superimposed elevationcontour on satellite image are shown inFig.1(a-b). The plantation and vegetable crop
Fig.1. (a) Elevation contours and (b) satellite image with superimposed elevation contours for OldMeteorology Station block in the Kaju Nallah watershed
S.K. Ambast , R.C. Sr ivastava,T. Subramani, Babulal Meena andSubhash Chand
During the year, a new procedure, usingconventional topographic survey and spatialtools i.e. remote sensing and GIS, for designof micro irrigation system in undulatedterrains has been developed for efficientutilization of created water resources in theKaju Nallah watershed through rechargestructure cum well system. For this, initiallytopographic survey was conducted usingtotal survey station and elevation contours
Planning, Augmentation and Efficient Utilization of Water Resourcesin Kaju Nallah Watershed

CARI Annual Report 2009-2010
12
area (about 10.2 ha) in the Garacharma farmhas been divided into five blocks and theinstallation of micro irrigation system hasbeen made for all the blocks (Plate 3).
In order to establish the rainfall runoff
relationship for different combination of
landuse, area, topography and rainstorms,
electronic water level recorders have been
installed to record the water levels at three
gauging stations of the Kaju Nallah (Plate 4).
The analysis of the data is in progress.
R.C. Srivastava, S.K. Ambast and
B.K. Nanda
During the year, water balance approach
was used to design the optimal size of lined
tank fed from impermeable rooftop or plastic
mulched vegetable area. The daily water
balance used for rainwater harvesting in the
lined tank to supplement irrigation to the
cropped area during dry period is given
below:
Plate 3. Installation of micro sprinkler for brinjal and inline drippers for pineapple inOld Meteorology Station block of Garacharma farm, CARI
Plate 4. Electronic water level recorder at check dam and recorded water levels
Studies on Effective Storage of Water in Ponds

CARIAnnual Report 2009-2010
13
Vwi = Vw(i-1) - Vwsi + Vwri (1)
Vwri = (Ri x AIS) + (Ri x Rds x V) - Vwsi - {E x 0.7 x Rds x Vw(i-1)/1000} (2)
where Vwi is the volume of water in the tankon the ith day; Vw(i-1) is the volume of waterin the tank on the (i-1)th day; Vwsi is the vol-ume of water spent on ith day; Vwri is thevolume of water received in the tank on ith
day; Ri is the rainfall on the ith day (mm); AIS
is the impermeable surface area (sqm); Rds
is the ratio of tank depth to surface area; E isthe open pan evaporation (mm) and V is thedesigned tank volume (litres). Vwsi can be de-termined by considering the irrigation inter-val as 2 days and taking the conditional ap-proach as follows:
Vwsi = 0, If {Ri + R (i-1) + R(i-2)} e” 3E (3)
and Vwsi = N x S2 x [3E – {Ri + R (i-1) +R(i-2)}] x Riw , if {Ri + R (i-1) + R(i-2)} < 3E (4)
where N is the number of plants; S is thespacing of plants (m); R(i-1) is the rainfall onthe (i-1)th day (mm); R(i-2) is the rainfall onthe (i-2)nd day (mm) and Riw is the IW/CPEratio.
It is assumed that tank will be at full capacityat the beginning of the dry period (15th Dec.)and the tank will not be empty during thedry period (up to 30th April). Accordingly,the optimal size of the tank was determinedto satisfy the imposed conditions. Historicalrainfall and open pan evaporation data for24 years were used in a time series to estimatethe required water volume for a croppedarea. Intermittent rainfall events during thedry period have been considered for storagein the lined tank. These data were used toget required volume of water at differentprobability levels. The estimated requiredwater volume was used as the volume ofwater available in the beginning of the dryperiod for that year to check the number of
days tank remain dry to find the optimal
tank size. In this study, the impermeable
rooftop area has been taken as 50 sq m to
supplement irrigation in 1000 sq m area
(18 coconut/160 arecanut) and plastic
mulched area is taken as 1000 sq m to
supplement irrigation in the same area
(2778 capsicum plants).
In case of 50 sq m rooftop area to harvest
rainwater in lined tank and supplement
irrigation in 1000 sq m to 18 coconut plants,
it was found that 9 years, 7 years and 5
years (out of 24 years) are deficit years at
60%, 70% and 80% probability level,
respectively when tank volume is taken as
required volumes for each year. The result
indicated that 181, 288 and 361 cu m
capacity tank can provide supplemental
irrigation in 8 out of 10 years with IW/CPE
ratio of 0.25, 0.4 and 0.5 (Fig.2) respectively
during the dry period.

CARI Annual Report 2009-2010
14
In case of 50 sq m rooftop area to harvest
rainwater in lined tank and supplement
irrigation in 1000 sq m to 160 arecanut pants,
it was found that at 80% probability level for
different IW/CPE ratios, the irrigation system
can provide requisite supplemental irrigation
during dry period. Accordingly, for 0.25, 0.4
and 0.5 IW/CPE ratio 161, 258 and 322 cu m
tank capacity, respectively can provide
supplemental irrigation to 160 arecanut
plants with only four years of failure.
In case of plastic mulched area of 1000 sq m
to harvest rainwater and to provide
supplemental irrigation in the same area
with 2778 capsicum plants, it was found that
130, 224 and 290 cu m capacity tank are the
optimal size to provide irrigation at IW/CPE
ratio of 0.25, 0.4 and 0.5, respectively with
only four years of failure.
Further to facilitate gravity fed irrigation sys-tem to minimise energy requirement, an out-let system was made at the bottom of the
Evaluation of Soil Management Techniques in Problem Soils ofSouth Andaman
T.P. Swarnam, S. Ghoshal Chaudhuri,B.L. Meena and R.C. Srivastava
A confirmatory field trial was conductedbased on encouraging results observed in potexperiments with five treatments viz.,control, coconut husk, compost, coconuthusk + compost and lime. The experimentwas carried out in RBD in the plots of 16 m2
Plate 5. Outlet for gravity fed irrigation systeminside the reinforced plastered lined tank
Fig.2. Water volume left in the tank before onsetof rainy season for IW/CPE ratio 0.4
(Negative values means that the tank was dry)
lined tank to the terraces for providing grav-ity fed irrigation system (Plate 5).
during 2009-10. The coconut husk andcompost were applied at the rate of 12 t ha-1
and lime as per lime requirement of the soil.The soil of the experimental site was acidic(pH 5.4) and medium in available nutrientcontents. The pH of coconut husk andcompost used in the study was 6.3 and 6.8,respectively. The soil pH measurements were

CARIAnnual Report 2009-2010
15
made at 15 days interval and are shown inFig.3. It has been observed that theapplication of lime markedly improved thesoil pH from 5.5 to 7.5. Soil pH increasedsharply and stabilized at around 7.0 - 7.3during the observation period.
compost. The decrease in pH towards theend is mainly due to nitrification of N.However in coconut husk treated plots, pHhas increased only after 45 days ofapplication and it steadily increased from 5.6to 6.4 indicating an increase of 12% over theperiod. This time lag before pH increasemight be due to consumption of protonsduring microbial decomposition. The relativeliming effect at the end of the experimentfor different treatments were coconut husk+ compost (50%) > coconut husk (44%) >compost (12%) indicating the potential ofcoconut husk in acid amelioration as it is50% as effective as that of lime when appliedin combination with compost. As theexperiment had shown the potential forusing coconut husk for managing acid soil,its impact on nutrient availability and use ofother organic sources like vermicompost,poultry manure will be taken up and studiedfurther as alternative sources of liming in lowinput agricultural system.
Besides lime, there was a slight increase inpH (2%) in compost treated plots within 15days of application and it has increased upto 5% after 90 days, and then decreased to3.5% at the end of the experiment. Theincrease in soil pH is mainly due to initialhigh pH (6.8) and, Ca2+ and Mg2+ content of
Effect of Vermicompost on Nutrient Dynamics and Yield of Vegetable Crop
A.Velmurugan, N. Ravisankar, T. P.Swarnam and R.C.Srivastava
Vermicompost is a finely derived organicmaterial, broken down by interactionsbetween earthworms and microorganismsin a mesophilic process to produce stabilizedorganic materials with high porosity, waterholding capacity and low C: N ratio whichcontains nutrients such as N, P, K, Ca andMg in readily available forms. Several
experiments have demonstrated the presenceof plant growth regulating substances suchas humic acid and plant growth hormoneslike auxins, gibberellins and cytokinins invermicompost which are responsible forincreased germination, growth and yield ofplants. However, its nutrient release patternin different soils, environment and impacton growth and yield of vegetable crop is lessstudied. In Andaman Islands vegetable
Fig.3. Effect of amendments on soil pH

CARI Annual Report 2009-2010
16
production is constrained by timelyavailability and high cost of inorganicfertilizers. On the other hand organicmaterials are available in plenty which canbe used as a source of plant nutrient byvermicomposting. Keeping above points inview, this study has been initiated with theobjectives (i) to study the nutrient releasepattern in vermicompost applied soil (ii) tostudy the effect of vermicompost on soilphysical, chemical and biological propertiesand (iii) to compare and quantify the effectof vermicompost on growth and yield ofvegetable crop.
An experiment has been laid out atBloomsdale research farm of CARI during
post monsoon season (D/S: 15th February
2010) to study the effect of application of
vermicompost alone and in combination
with inorganic fertilizer on growth and
yield of Okra (Plate 6). The experiment
was designed in RBD with 12 treatments
and three replications. The soils of the
experimental site are sandy clay loam in
texture, slightly acidic (6.0), non saline
(EC 0.02 dSm-1), medium organic carbon
(0.65%), nitrogen (298 kg ha-1), low in
P2O5 (10.1 kg ha-1), and low in K2O (167
kg ha-1) content. The observations on
plant height (40 DAS) and yield are given
in Table 3.
Table 3. Effect of different sources of nutrients on plant height and yield of Okra
Treatments Details Plant height Yield(40 DAS) (cm) (t/ha)
T1 Control 14.2 4.07
T2 100% of N through VC 19.4 7.61
T3 75% of N through VC 14.9 7.25
T4 50% of N through VC 16.2 4.98
T5 100% of N through VC + PM(50:50 ratio) 21.7 6.97
T6 75% of N through VC + PM(50:50 ratio) 20.6 7.13
T7 50% of N through VC + PM(50:50 ratio) 14.6 4.64
T8 100% of N through Inorganic N 28.6 9.35
T9 50% of N through Inorganic N 27.7 7.05
T10 100% of N through Inorganic N + VC @50:50 20.9 8.39
T11 75% of N through Inorganic N + VC @50:50 27.0 7.94
T12 50% of N through Inorganic N + VC @50:50 20.1 6.89
SEd 2.96 0.61
CD (0.05) 6.15 1.37
P & K by SSP and MOP; DAS = Days after sowing , VC = vermicompost ; PM = poultry manure,Recommended dose of fertilizer (NPK) : 120, 70 and 60 kg ha-1

CARIAnnual Report 2009-2010
17
The observations made at 40 days aftersowing showed that application of 100 %recommended dose of N through urea (T8)recorded highest plant height of 28.6 cmwhich is at par with application of 50 % ofrecommended dose of N by urea (T9) and75% of recommended dose of N suppliedthrough urea and vermicompost at 50:50
ratio (T11). The plant height is low in T10 dueto water logging at early stages. This clearlyindicated that for early growth anddevelopment, readily available form ofnutrients are essential. This will help to copewith slight water logging due to excess oruntimely rain which is expected in Andamancondition.
Plate 6. A view of experimental plot at Bloomsdale research farm, CARI
Among the treatments, application of 100%N through inorganic (T8) recorded higheryield which is at par with the application of100% N through inorganic + VC @ 50:50(T10) indicating a possibility of replacementof inorganic N by 50% throughvermicompost. In general, at all the levelsof N (100, 75 and 50% of recommendeddose) the yield is highest in inorganic source
of N followed by inorganic + vermicompost,
vermicompost alone and vermicompost +
poultry manure. Application of 100% of N
through VC + PM @ 50:50 (T5) gave lower
yield than at 75% (T6) possibly due to
heating and toxic effect of poultry manure
at higher doses. The lowest yield is observed
in control which is at par with T4 and T7.
Effect of Nutrient Levels and Irrigation on Arecanut Yield and Soil FertilityA.Velmurugan, T. Subramani, S.K.Ambastand R.C.Srivastava
In A&N Islands, productivity of arecanutremains low due to very less or no fertilizerapplication, low soil fertility, soil erosion and
rapid depletion of soil moisture during thedry season. In order to improve the yield ofarecanut, it is important to address theseproduction constraints properly. The yieldcan be improved by supplying adequate

CARI Annual Report 2009-2010
18
amount of nutrients through proper sourceand supplemental irrigation during the dryseason. Further, nutrients should be appliedin synchrony with crop demand duringpost-monsoon season for better utilization.
In view of this a field experiment has beeninitiated from November 2009 onwards in theplantation block of Garacharma farm of CARIin split plot design to study the effect offertilizer levels, irrigation and their interactionon soil fertility and arecanut yield (Plate 7).Check basins were laid around each palm tofacilitate fertilizer and irrigation treatments.Three levels of irrigation treatments based onIW/CPE ratio viz., control (I0), 0.50 (I1) and0.75 (I2) were imposed in the main plots. Inthe sub plots five levels of fertilizer treatmentsviz., Control (N0), 100 % of N, P, K throughinorganic (N1), 50 % of N, P, K throughinorganic (N2), 100 % of N through VC :Inorganic @50:50 (N3) and 50 % of N throughV.C : Inorganic @50:50 (N4) were given. Therecommended dose of fertilizers is 100 g N,
40 g P2O5 and 140 g K2O per tree/year. Theirrigation treatment was applied only duringdry season (February to May) and nutrients
in three split doses.
The soil at the start of the experiment is slightlyacidic (pH 5.2) in reaction, low in EC (0.2 dSm-
1) and are sandy loam to loam in texture. Theexperimental soil contain high organic carbon(2.2 %), low in phosphorus (7 kg/ha) and
potash (75 kg/hg). The initial results showedno significant difference in height and girthof trees among different treatments.
However, it is observed from the flowershedding that number of flowers retained perbunch in the irrigation treatments are higher
than control. This is expected to results inthe higher yield of nuts in the irrigated palms.Other yield parameters will be estimated
after the monsoon season and theexperiment is in progress.
Plate 7. A view of the experimental site atGaracharma farm, CARI
S.K. Ambast, T. Subramani, N. Ravisankarand S. Ghoshal Chaudhuri
Broad bed and furrow system (BBF) system,one of the land manipulation techniques for
Salt, Water and Nutrient Dynamics in Broad Bed and Furrow System
crop diversification in low-lying waterloggedmono-cropped paddy lands, has beenevaluated extensively for increase incropping intensity, productivity and

CARIAnnual Report 2009-2010
19
economics in normal areas. Considering itsprospect and potential in saline waterloggedareas, a study on salt, water and nutrientdynamics in BBF system in normal and salinewaterlogged areas has been initiated. BBFsystem in normal area of a farmer atBadmashpahar and at Bloomsdale researchfarm has been selected whereas for salinearea, two farmers fields in Chouldari hasbeen selected. The soil samples have beencollected up to 1 m depth at an interval of25 cm once in a month up to December 2009and later at 15 days interval for determiningsoil moisture content and salinity in selectedBBF systems (Plate 8). In Chouldari, the soilsare clay loam in texture on the surface (upto 30 cm) and clay at deeper depth up to 1m (taxonomically classified as Fluventic
Sulfagvents, saline phase). The measured soilsalinity in the selected BBF systems is givenin Table 4. Soil EC2 values were convertedto ECe using standard methodology. It hasbeen observed in normal area that the soilsalinity was within the acceptable limit tillMarch and in general remained static. Insaline area (C1), soil salinity has shownincreasing trend in sub-surface due tocapillary rise during dry season. However,in case of C2 salinity reduced because ofwaterlogging during wet season andsubsequent flushing/leaching of salts due todrainage. The drainage of water isresponsible for decreased pH observed inMarch because of oxidation process andleaching of salts. The experiment is inprogress.
Location Depth(cm) Oct., 2009 Mar, 2010
pH2 (-) ECe (dSm-1) pH2 (-) ECe (dSm-1)
B1(Normal area) 0-25 5.1 2.2 5.4 2.025-50 5.5 2.0 5.2 1.850-75 5.5 2.0 5.2 1.6
75-100 5.2 1.8 5.3 1.6B2(Normal area) 0-25 6.3 2.0 6.2 2.0
25-50 7.4 1.8 5.2 2.050-75 6.8 2.7 6.2 2.0
75-100 6.5 2.4 6.4 1.8C1(Saline area) 0-25 4.2 4.8 4.7 4.7
25-50 4.9 4.5 4.8 5.450-75 4.3 4.1 4.8 4.8
75-100 5.7 4.9 4.5 4.1C2(Saline area) 0-25 6.2 5.4 5.1 2.0
25-50 6.0 4.0 4.9 2.250-75 5.8 5.2 4.6 2.9
75-100 6.4 4.9 4.7 3.6
Table 4. Average pH and salinity of soil in selected BBF systems
Location of BBF: B1- Bloomsdale; B2 - Badmashpahar; C1- Chouldari (Madhu); C2 Chouldari (Sri Singh)

CARI Annual Report 2009-2010
20
Plate 8. Soil sampling in broad bed and furrow system in saline waterlogged area
T. Subramani, S. Ghoshal Chaudhuri,S.K. Ambast, Babulal Meena, SubhashChand, S.K. Zamir Ahmed and S.K. Verma
Productivity enhancement of rice throughuse of long duration varieties and adoptionof improved management practices duringmonsoon season (Jun-Dec, 2009).
During the year, high yielding long durationrice varieties viz., Ranjit (155-160 days), Savitri(145 days) Varshadhan (160 days) and Gayatri(160 days) along with Taichung sen Yu and
C14-8, as local check, were evaluated atresearch farm and farmer’s field during 2009to utilize the available growing period to themaximum extent under island ecosystem.
In the Bloomsdale research farm (Plate 9),long duration rice variety Ranjit recordedhigher grain yield of 3.57 t ha-1 and at parwith Varshadhan (3.4 t ha-1) followed bySavitri (2.85 t ha-1) and Gayathri (2.30 tha-1) as compared to medium durationTaichung sen Yu (2.05 t ha-1). The higher
Effect of Supplemental Irrigation on Crop Yield and Water Use Efficiency inRice Based Cropping system of A&N Islands
Table 5. Growth and yield attributes of rice varieties in Bloomsdale Research Farm
Varieties Height DMP at harvest Ear bearing No. of filled 1000 grain(cm) (kg/ha) tillers/ hill grains/ hill weight (g)
Ranjit 130 7558 15.48 726 23.52Savitri 127 6707 13.19 666 23.86Varshadhan 180 7820 14.22 677 27.47Gayatri 134 6064 13.74 618 25.47TSY 117 5653 11.44 551 27.06SEd 5.20 334 0.75 17 0.63CD (P=0.05) 11.33 726 1.64 36.4 1.38

CARIAnnual Report 2009-2010
21
yield of Ranjit and Varshadhan could beattributed to its better growth and yieldattributes over other varieties (Table 5 and6). Similarly in the farmer’s field (Plate 10),long duration varieties producedsignificantly higher grain yield (Ranjit:2.94 t ha-1; Varshadhan: 2.83 t ha-1; Savitri:2.52 t ha-1; Gayatri: 2.5 t ha-1) than C 14-8
(2.1 t ha-1) in spite of minimal managementpractices adopted by the farmer (Table 7).The increased yield of long durationvarieties over the local checks under on-station and on-farm conditions hasresulted in increased gross and net incomeper hectare and in turn resulted in higherB: C ratio (Table 7 and 8).
Table 7. Growth and yield attributes of rice varieties in farmer's field
Varieties Height DMP at Ear bearing No. of filled 1000 grain(cm) harvest (kg/ha) tillers/ hill grains/hill weight (g)
Ranjit 129 6707 15.23 569 22.96Savitri 125 6374 12.92 488 22.82Varshadhan 178 6969 13.64 436 26.57Gayatri 131 6105 12.79 416 24.62TSY 153 5635 12.47 388 25.86SEd 4.35 178 0.54 22 0.53CD (P=0.05) 9.50 387 1.17 48 1.16
Table 8. Growth and yield attributes of rice varieties in farmer's field
Varieties Grain yield Straw yield Gross income Net income B:C(kg/ha) (kg/ha) (Rs/ha) (Rs/ha) ratio
Ranjit 2943 3833 28849 13649 1.90Savitri 2520 3724 25144 9944 1.65Varshadhan 2832 4224 28296 13096 1.86Gayatri 2496 3625 24841 9641 1.63C 14-8 2107 3469 21379 6179 1.41SEd 171 167 - - -
CD (P=0.05) 373 364 - - -
Table 6. Yield and economics of rice varieties in Bloomsdale Research Farm
Varieties Grain yield Straw yield Gross income Net income B: C(kg/ha) (kg/ha) (Rs/ha) (Rs/ha) ratio
Ranjit 3570 3983 34328 19128 2.26Savitri 2845 3867 28050 12850 1.85Varshadhan 3432 4388 33560 18360 2.21Gayatri 2300 3764 23314 8114 1.53TSY 2050 3603 21028 5828 1.38SEd 227 175 - - -
CD (P=0.05) 494 381 - - -

CARI Annual Report 2009-2010
22
Plate 9. Long duration rice varieties at Bloomsdale farm
Plate 10. Long duration rice varieties at farmer's field
N. Ravisankar, M. Balakrishnan, S.Ghoshal Chaudhuri, S.K. Ambast, R. C.Srivastava and N. Bommayasamy
During the year, three experiments wereconducted in order to address the potentialof seed production of table purposegroundnut varieties with application ofdifferent levels of farm yard manure (FYM)levels under coconut plantations during wet
season and to standardize the package ofpractices for dry season especially onirrigation, mulching and nutrientmanagement.
Evaluation of table purpose groundnut forseed production in coconut plantations
On Station : Experiment was conductedduring wet season of 2009 at Sippighat farm(Plate 11). Two varieties viz., ICGS 76 and
Standardization of Package of Practices for Table Purpose (HPS)Groundnut in Andamans

CARIAnnual Report 2009-2010
23
TG 37A with three levels of farm yardmanure (10, 15, 20 t/ha) was evaluated infactorial randomized block design (FRBD)with four replications in more than 10 yearold coconut plantation having the spacingof 7.5 m between rows. Growth, yieldattributes and pod yield were recorded andeconomics & energetics were calculated asper standard procedures.
Height of plants did not differ significantlybetween varieties (Table 9). Number of pods/plant, 100 pod weight, Number of kernels/plant and 100 kernel weight weresignificantly influenced by either FYMapplication or varieties. Though the numberof pods/plant was higher in TG37A variety,100 pod weight was significantly higher inICGS76. Shelling percent did not differsignificantly among the treatment. Pod yield,kernel seed yield and economics weresignificantly influenced by FYM applicationand varieties. TG37A recorded significantly
higher pod and kernel seed yield (1652 and858 kg ha-1 respectively) compared to ICGS76 (1245 and 740 kg ha-1). Application of 10t FYM/ha registered higher pod and kernelseed yield in both the varieties (Table 10).Haulm yield also followed the similar trend.Net returns and B:C ratio was significantlyhigher with 10 t of FYM/ha application toboth the varieties (ICGS76 and TG37A).Higher net returns and B: C ratio might bedue to higher kernel seed yield combinedwith low cost of cultivation owing toapplication of less quantity of farm yardmanure. Comparison of net returns and B:Cratio in terms of pod and kernel seed yieldindicates that around 45- 55% increase inreturns due to sale of kernels for seed insteadof pods for seed. This is mainly due toincreased value of kernels over pods. Energyratio and specific energy was higher under10 t FYM/ha with either ICGS76 or TG37Avariety which is mainly due to increased
Table 9. Influence of varieties and FYM levels on growth and yield attributes of table purpose groundnutfor seed production in Coconut plantations
Treatments Plant No. of 100 No. of 100 Shellingheight pods/ pod kernels kernel %(cm) plant weight (g) /plant weight (g)
ICGS 76 + FYM @ 10 t/ha 53.8 8.6 99.8 9.0 51.9 53.8ICGS 76 + FYM @ 15 t/ha 53.9 10.5 95.2 10.8 52.7 54.9ICGS 76 + FYM @ 20 t/ha 58.5 6.3 124.7 7.0 100.2 66.3TG 37A + FYM @ 10 t/ha 61.9 11.0 100.6 10.8 54.6 51.5TG 37A + FYM @ 15 t/ha 67.0 10.0 78.4 10.5 58.2 56.7TG 37A + FYM @ 20 t/ha 59.1 11.3 88.9 11.0 43.8 47.4
SEd 6.8 1.6 8.2 1.4 10.3 8.3
CD (P=0.05) NS 3.4 17.5 3.0 22.1 NS

CARI Annual Report 2009-2010
24
Cost of Pods : Rs 30/kg, Cost of kernel seed : Rs 75/kg , Cost of haulms: Rs 1/kg
Table 10. Influence of varieties and FYM levels on seed yield and economics of table purposegroundnut for seed production in Coconut plantations
Treatments Pod Kernel Haulm Net returns (Rs/ha) B:C ratioyield seed yield yield Pod + Kernel + Pod + Kernel +
(kg/ha) (kg/ha) (kg/ha) haulm haulm haulm haulm
ICGS 76 + FYM @ 10 t/ha 1444 773 10611 30934 42545 1.34 1.64ICGS 76 + FYM @ 15 t/ha 1222 688 9722 20879 32780 0.82 1.15ICGS 76 + FYM @ 20 t/ha 1069 759 8056 12129 33942 0.43 1.09TG 37A + FYM @ 10 t/ha 1778 918 12639 42962 55457 1.87 2.13TG 37A + FYM @ 15 t/ha 1597 898 11528 33934 50399 1.33 1.77TG 37A + FYM @ 20 t/ha 1583 758 10417 29907 36259 1.07 1.17
SEd 145 79 1433 6933 8340 0.18 0.30
CD (P=0.05) 307 166 3054 14776 17773 0.39 0.65
output energy by way of higher pod andhaulm yield.
On an average, the light intensity of 42500lux was recorded during flowering stage (45-55 DAS) in the plantations of more than 10years age. Pod yield was highly influencedby the light availability (Fig.4). ThoughTG37A recorded higher pod yield undercoconut plantations, ICGS76 also performedequally better in terms of pod yield.
Plate 11. General view of the on station experiment on seed production of table purpose groundnut incoconut plantation and pods at the time of harvesting
Fig. 4. Influence of light availability on pod yield oftable purpose groundnut in coconut plantations

CARIAnnual Report 2009-2010
25
On Farm : On farm evaluation of seedproduction experiment on table purposegroundnut under coconut plantations werecarried out at six farmers' field in Calicutvillage (Plate 12). Among six farmers, twofarmers intercropped groundnut in more than10 years old open coconut plantations whileothers planted in 1-2 year old plantations.Higher pod yield (2156 kg ha-1) and kernelseed yield (1587 kg ha-1) was recorded with1-2 year old plantations compared to morethan 10 years old plantations which is mainlydue to availability of more light in youngplantations (Table 11). An increase of around62% kernel seed yield is observed in youngplantations compared to old plantations. Onan average, net returns of Rs. 57,730/ha canbe obtained from one ha area of coconutplantations through seed production of tablepurpose groundnut during wet season.
Around 19% higher net returns can beobtained by farmers by selling kernels as seedinstead of pods as seed. On station and onfarm experiments exhibited similar trend(Fig.5) in terms of pod, kernel seed yield andnet returns in more than 10 years oldplantations.
Fig. 5. Comparison of yield and net returns of onstation and on farm for seed production of table
purpose groundnut
Table 11. Yield and economics of table purpose groundnut for seed production in coconut plantationsat Calicut village
Name of the farmer Age of Pod Kernel Haulm Gross Net return Net return soldplantation yield seed yield yield returns sold as pods kernels for
(years) (kg/ha) (kg/ha) (kg/ha) (Rs/ha) (Rs/ha) seed (Rs/ha)
Mr.Pacchamuthu >10 1000 740 6400 41400 18390 21212
Mr.C.Alagumalai >10 1633 1214 10753 67920 44910 52500
Mean - 1317 977 8577 54660 31650 36856
Mr. K. Palsamy 1-2 2752 2034 14400 110720 87710 110203
Mr.K.Ismail 1-2 2150 1653 13200 88450 65440 83764
Mr. Chinnathami 1-2 1982 1445 11300 80682 57672 66939
Mr.Sivalingam 1-2 1738 1215 12200 73013 50003 53512
Mean - 2156 1587 12775 88216 65206 78605
* Cost of Pods: Rs 35/kg, Cost of kernel seed: Rs 75/kg , Cost of haulms: Rs 1/kg** Cost of cultivation for pods & kernels of general use: Rs 23010/ha, Cost of cultivation for seed kernel: Rs
25000/ha

CARI Annual Report 2009-2010
26
Evaluation of irrigation and mulchingpractices for table purpose groundnut(Confirmatory trial)
A confirmatory experiment is in progress toevaluate irrigation and mulching practicesfor table purpose groundnut during dryseason of 2009-10 at field crops experimentalresearch farm, Bloomsdale. The soil wassandy loam with pH 6.1, 0.74 % organic C,medium in available N, P and K. Theexperiment was conducted in split plotdesign with irrigation treatments (Noirrigation, one irrigation at pegging, twoirrigation at life and pegging, three irrigationat life, flowering and pegging and fourirrigation at life, flowering, pegging and poddevelopment stages) in main plot andmulching treatments (Paddy straw, Banana,Gliricidia and No mulch) in sub plot withthree replications. The period coincidingwith critical stages viz., life, flowering,pegging and pod development stages are 3,45–50, 50-55 and 65–85 DAS respectively.Mulching treatment was imposed on 45DAS. The experiment is in progress.
Plate 12. View of intercropped groundnut in 1-2 year old plantation and visit ofAgricultural Officers to on farm experiment
Evaluation of nutrient managementpractices for table purpose groundnut
An experiment is in progress to evaluatenutrient management practices for tablepurpose groundnut during dry season of2009-10 at field crops experimental researchfarm, Bloomsdale. The experiment wasconducted in split plot design with organicmanures (Farm yard manure @ 12.5 t/ha,poultry manure @ 5 t/ha, vermicompost @ 5t/ha, No organic manure) in main plot andsulpher sources (No sulpher, sulpher throughgypsum and sulpher through single superphosphate) in sub plot with three replications.The experiment is in progress.
It can be concluded that, seed production oftable purpose groundnut can be taken upprofitably during wet season in coconutplantations. Applications of 10 t of FYM ha-1
with ICGS76 or TG37A variety are foundsuitable for higher kernel seed yield. Around62% higher kernel seed yield can be obtainedin younger plantations than old plantations.The net income can be raised by 19% by sellingkernels as seed instead of pods for seed.

CARIAnnual Report 2009-2010
27
T. Subramani, S.K. Ambast, N. Ravisankar,S. Bhagat and R.C. Srivastava
An experimental setup was developed forcarrying the study on effect of irrigationregimes on yield and water use efficiencyof capsicum under protected cultivationstructure (Plate 13). Drip irrigation systemwas installed to control the water supplyin capsicum. Six fertigation tanks of 100liter capacities were included to impose thenutrient treatments. Four irrigationtreatments based on IW/CPE ratio of 0.75through surface irrigation (I0), and 0.25(I1), 0.50 (I2), 0.75 (I3) through dripirrigation with five replications in RBDhave been laid. Open pan evaporimeterwas installed near to the polyhouse so as
to give irrigation on the basis of panevaporation values.
Water pumped through 2.0 HP motor wasconveyed to fertilizer tanks fixed at 1.5 mheight after filtering through screen filter.From the fertilizer tanks, laterals of 16 mmsize were taken off and water goes to rootzone of the crops through gravity flow (lowpressure drip system). From the laterals, microtubes were taken on both the sides. Dripperswith a flow rate of 2 lph have been used.
Capsicum Hybrid ‘Indra’ was transplanted.The spacing of the capsicum was kept at 60cm x 60 cm as was optimized in an earlierproject under protected cultivation structure.The yield of Capsicum is being recorded. Theexperiment is in progress.
Water and Nutrient Management in Capsicum through Drip System underProtected Cultivation
Fig.6. Layout of drip fertigation system inprotected cultivation structure
Plate13. Experimental setup for waternutrient study in protected cultivation

CARI Annual Report 2009-2010
28
in 11 farmer’s field under FarmersParticipatory Action Research Programme(FPARP) during the year. The demonstrationhave been carried out in six villages namelyCalicut, Macchapahar, Indiranagar,Chouldari, Badmaspahar and Hazaribaghin South Andaman and two villages namelyNetajinagar and R.K.Pur in Little AndamanIsland. In general, all the farmers weresatisfied with the technology for thewaterlogged conditions in which they wereneither cultivating any crop nor used for anyother purpose earlier. All the farmers areinterested on vegetable cultivation on the
R.C. Srivastava, S.K. Ambast, N.Ravisankar, S. Jeyakumar, Kamal Sarmaand S.K. Zamir Ahmed
Farmers Participatory Action ResearchProgramme (FPARP) was initiated todemonstrate the four technologies namelytank-well system, micro-irrigation system,pond based integrated farming system andcrop diversification through broad bed andfurrow system (Plate 14). All the technologiesare being demonstrated in South Andaman,Little Andaman, Havelock and Neil Islandsin 48 farmers field. The on station testedtechnology of BBF has been demonstrated
Farmers Participatory Action Research Programme
Plate 14. Demonstrations on (a) tank-well system (b) pond based IFS system, (c) growing of vegetablesand (d) vegetable on slope of bed and trailing in pandal over furrows in BBF system

CARIAnnual Report 2009-2010
29
beds and only fish culture in the furrows.
Since vegetables are costlier in the Islands
during monsoon season, all the farmers are
concentrating only on vegetables on the beds.
The commonly grown vegetables are okra,
brinjal, chillies, bitter gourd, amaranthus,
radish, pumpkin. The net returns from
vegetable cultivation in beds ranged from Rs
67091 to as high as Rs 89000 /ha in 11
months depending on the management of
crop (Table 12). All the farmers released
fingerlings in their furrows. The fish in the
furrows are yet to be harvested. No one is
ready to go for cultivation of rice in furrows
due to high cost involved in transplanting
and harvesting of rice in furrows. Few
farmers have adopted their innovative
utilization of area of BBF.
One farmer in Little Andaman islands did
sowing of bitter gourd and bottle gourd
on the slopes of beds and made machan
over furrows thus saving a space of beds
for other vegetables besides utilizing the
vertical space of furrow. Machan over fur-
row also provides shade to fishes in fur-
rows whenever there is high temperature.
The other farmer in Indiranagar grown
okra as first crop in beds. He planted cow-
pea near to okra when it is in maturity
and trailed over stalk of okra thus saved
cost of preparation of land and labour
cost for putting sticks to cowpea.Around
75 % of the farmers are willing to extend
their area under BBF in waterlogged ar-
eas. In the villages, where in the technol-
ogy was demonstrated, many farmers are
willing to adopt the technology provided
partial financial support is given as the
making cost of BBF is Rs 50000 to 65000/
ha using excavator.
* Income from fish not included
Table 12. Net income from BBF system in farmers field under FPARP demonstration
Farmer Net income before After adoption of BBFadoption of BBF Net income* Duration
(Rs/ha) (Rs/ha) (months)
D.N. Madhu, Chouldari 5000 67091 11
Kasinath Saha, Port Mout 7500 72544 11
Muthaiah, Indiranagar 7500 89000 11
Hamza, Calicut 5500 29660 6
Karunanidhi, Calicut - 22996 6
Rajan Garami, Little Andaman - 33410 6
Rupasi Biswas, Little Andaman - 36500 6

CARI Annual Report 2009-2010
30
R.C. Srivastava, S.K. Ambast, N.
Ravisankar, T.V.R.S. Sharma, Ajanta Birah,
Krishna Kumar, D.R. Singh, M. Sankaran,
A. Kundu, S. Jeyakumar, S. Dam Roy,
Kamal Sarma, Subhash Chand, M.
Balakrishnan and S.K. Zamir Ahmed
Integrated Agromet Advisory Service unithas rendered its effective services throughAgromet Advisory Bulletin (AAB). Onreceipt of forecast from RegionalMeteorological Centre, IndiaMeteorological Department, Kolkata, AABare prepared on every Tuesday forAndaman district and Friday for Nicobardistrict. During the year, 46 bulletins wereissued for Andaman district while 25 wereissued for Nicobar district. The bulletinswere regularly published in the DailyTelgrams and Dweep samachar. It is alsobroadcasted in Doordarshan and All IndiaRadio. Altogether 50 farmers have beenidentified from various islands for
collecting the feed back on the effectivenessof Agro Advisory services.
Verification of forecasted and observed valuesof rainfall was carried out for premonsoon,monsoon and post monsoon period (Table 13).The results reveal that on an average forecastedand observed values of rainfall are matchingto the tune of 53.7 % during post monsoonperiod while it is only 23.4 % for monsoonperiod. First day forecast and observed valuesare matching to the tune of 75 % during postmonsoon period. The per cent correctness ofsecond, third, fourth and fifth day forecast areless compared to first day.
Out of 13 days of first day forecast for Apr –May, 2009, only 7 days of observed valueand forecast value is same (53.8 %) and inthe other days observed value was lower thanforecast value. Out of 36 days of first dayforecast for Jun. – Nov. 2009, only 7 days ofobserved value and forecast value ismatching (19.4%) (Fig.7). Out of 32 days of
Integrated Agromet Advisory Services
Forecast/day Pre monsoon Monsoon Post monsoon Mean(Apr-May, 09) (Jun-Nov, 09) (Dec 09 - Mar 10)
First day 53.8 19.4 75.0 49.4
Second day 16.0 22.5 50.0 29.5
Third day 33.3 30.0 56.2 39.8
Fourth day 25.0 20.0 46.8 30.6
Fifth day 0.0 25.0 40.6 21.8
Mean 25.6 23.4 53.7 34.2
Table 13. Per cent correctness of forecasted and observed values of rainfall during pre monsoon,monsoon and post monsoon period (difference of with in 10 mm is considered as correct)

CARIAnnual Report 2009-2010
31
first day forecast for Dec. 09 – Mar. 2010,
observed value and forecast value is same
for 24 days (75 %) (Fig.8). Observed value
was lower than the forecast value for the
remaining period.
Economic Impact: In the dry season, farmers
used to raise the vegetable seedlings in the
open conditions. During 2009, the forecast
indicated heavy rain during the next 5 days
and farmers were advised to raise the seedlingswith pandal system (Machan) to protect from
rain. This led to saving in cost of seeds to thetune of Rs 1500/ha for those farmers who haveadopted the practice published from AAB.Similarly, timely advice to farmers based onrainfall forecast saved two irrigations tovegetable crops during dry season. Wet poultrylitter is problem during monsoon season dueto high rainfall and relative humidity. Afteradvisory, a farmer placed the 250 watts bulbin his poultry unit and saved 50 birds. Otherswho have not used the bulb, mortality rate washigher due to coccidiosis.
Fig.7. Verification of first day rainfall (mm) forecast for monsoon period (Jun-Nov, 2009)
Fig.8. Verification of first day rainfall (mm) forecast for post monsoon period (Dec-Mar, 2010)

CARI Annual Report 2009-2010
32

CARIAnnual Report 2009-2010
33
in Portulaca oleracea (21.18%) followed by
Alternanthera philoxeroides (15.25%), Colocasia
esculenta (13.5%) and Centella asiatica (13.26%).
The lowest acid insoluble ash content was
recorded in Colocasia leaves (0.32%) and
Momordica dioica fruits (0.33%) while it was
highest in Centella asiatica (3.24%) which
reflects its low digestibility. Highest crude fat
content was recorded in Enhydra fluctuans
(4.17%) followed by Colocasia esculenta (3.73%)
on dry weight basis. However, it was low in
Amaranthus tricolor (0.26%) and Centella
asiatica (0.66%). Most of leafy vegetables are
rich in crude protein which ranged from
8.38% to 26.56% on dry matter basis with
higher contents in Oxalis corniculata,
Alternanthera philoxeroides, Ipomea aquatica,
Colocasia esculenta and Enhydra flactuans.
Shrawan Singh, D. R. Singh, V. B. Pandey,M. Balakrishnan, S. K. Zamir Ahmed, L. B.Singh and R. C. Srivastava
A germplasm block was created at CARI with71 collections in thirteen different vegetablesfrom Bay Islands and local knowledge aboutthese vegetables was also documented (Plate1). The morphological descriptors for localcollections of Momordica cochinchinensis, Oxaliscorniculata, Colocasia esculenta, Centella asiatica,Capsicum spp., Ipomea aquatica, Enhydrusflactuans, Portulaca oleracea and Sauropusandrogynus have been prepared.
The proximate analysis (Table 1) of tenindigenous vegetables from A & N Islandsrevealed that the moisture content ofvegetables ranged between 83.43 to 94.78percent. Maximum ash content was recorded
Collection, Conservation, Characterization and Documentation of IndigenousVegetables of Andaman & Nicobar Islands
Table 1. Proximate analysis of the traditional vegetables of A & N Islands
Sl. Local Vegetable Moisture Ash Acid Crude CrudeNo. content ( %) insoluble fat protein
(%) ash (%) (%) (%)
1. Colocasia esculenta 92.4 13.5 0.32 3.73 20.44
2. Momordica dioica 90.87 7.42 0.33 2.57 2.75
3. Portulaca oleracea 94.78 21.18 0.6 2.51 21.8
4. Enhydra fluctuans 86.34 10.4 1.1 4.17 19.44
5. Eryngium foetida 86.57 10.21 1.76 1.95 8.38
6. Amaranthus tricolor 83.78 7.64 0.85 0.26 5.94
7. Ipomea aquatica 91.76 1.2 1.89 1.75 22.4
8. Alternanthera philoxeroides 87.19 15.25 1.89 1.03 23.63
9. Centella asiatica 83.43 13.26 3.24 0.66 13.7
10. Oxalis corniculata 88.0 5.78 1.2 1.87 26.56

CARI Annual Report 2009-2010
34
Through micronutrient analysis (Table 2),highest phosphorus content was recorded inIpomea aquatica (75mg/100g) and Portulacaoleracea (74mg/100g), potassium in Momordicadioica (65mg/100g), Mn in Centella asiatica(54.5mg/100g), Cu in Sauropus androgynous(768.7mg/100g) and Portulaca oleracea(658.63mg/100g), Na in Portulaca oleracea(515.9mg/100g), Ca in Centella asiatica(1900mg/100g), Fe in Portulaca oleracea(237.3mg/100g), Mg in Amaranthus tricolor(738.1mg/100g) and Co in Colocasia esculenta(2.58mg/100g). High Ca content consideredas negative factor in leafy vegetables forhealth point of view. The lowest Ca contentwas recorded in Portulaca oleracea (24.3mg/100g) and Amaranthus tricolor (26.2mg/100g).
Great variability was observed for fruits,number of seeds per fruit, fruit cavity,mesocarp and aril content in local collectionsof Momordica cochinchinensis (Lour.) Spreng.from bay islands.
Analysis of antioxidant content in thesetraditional vegetables revealed maximumtotal carotenoid content in Momordicacochinchinensis seed membrane (1120µg/100ml) which was significantly higher thancarotenoid content in leaves of Amaranthustricolor (79.81µg/100ml). In terms of ascorbicacid, Sauropus androgynus reported high
amount of ascorbic acid (314.3mg/100g)followed by Centella asiatica (255.7mg/100g).High amount of total polyphenol content wasrecorded in Oxalis caniculata (1400mg/100g)and Portulaca oleracea (1260mg/100g). Thehighest total anthocyanin content (83.49mg/100g) was recorded in Colocasia esculenta andSauropus androgynus. Total chlorophyllcontent was high in Sauropus androgynus(45.60µg/100ml) followed by Eryngium foetida(44.31µg/100ml).
The highest amount of total micronutrientscontent in local vegetables was recorded inCentella asiatica followed by Amaranthus andSauropus androgynus. Portulaca oleracea,Colocasia and Enhydra factuans also containshigh amount of micronutrients per unit ofedible portion (Fig. 1).
Centella asiatica Sauropus androgynous Colocasia esculenta Enhydra fluctuans
Fig. 1. Total estimated micronutrient content(mg/100g) in selected traditional
indigenous vegetables from bay Islands.

CARIAnnual Report 2009-2010
35
Plate 1. Selected indigenous vegetables in Bay Islands
Portulaca oleracea Ipomea aquatica Alternanthera philoxeroides Oxalis corniculata
Eryngium foetida Piper longum Capsicum spp Momordica cochinchinensis
Table 2. Average nutrient composition of selected indigenous vegetables in Andaman and NicobarIslands (dry weight basis)
Sl. Micronutrient content (mg/100g)
No. Local vegetables P Ca Mn Cu Na Zn Co Fe Mg
1. Centella asiatica 60.73 58.4 1900.1 54.5 17.7 239.1 45.3 1.34 178.8 579.0
2. Colocasia esculenta 64.87 57 998.5 32.8 20.7 242.8 41.7 2.89 268.8 185.2
3. Ipomea aquatica 61.19 75.01 92.5 33.1 5.2 247.2 15.6 2.08 61.3 61.2
4. Eryngium foetida 58.4 43 350.0 10.5 441.4 121.6 3.7 1.5 105.8 88.4
5. Amaranthus tricolor 17.6 62.1 26.2 16.6) 722.5 416.5 23.9 0.84 208.5 738.1
6. Portulaca oleracea 63.22 74.2 24.3 29.5 747.4 515.9 2.7 1.6 237.3 332.7
7. Alternanthera philoxeroides 61.2 44.1 337.1 31.4 7.6 215.4 16.4 0.7 103.5 586.5
8. Enhydra fluctuans 48.95 48.3 645.5 11.5 248.6 121.5 24.0 2.7 128.8 463.4
9. Oxalis corniculata 48.5 11.2 450.5 25.3 734.3 287.9 1.6 1.64 186.8 24.1
10. Momordica cochinchinensis 61.2 38 9.92 13.29 703.58 196.7 8.68 - 181.1 205.5
11. Sauropus androgynus 45.7 61.2 84.4 25.6 768.7 306.3 5.9 - 212.5 664.9

CARI Annual Report 2009-2010
36
Shrawan Singh, D. R. Singh, V. B. Pandeyand Bijay Nanda
Four varieties of capsicum viz. Indra,Bamby, Orobelle and California Wonderwere evaluated for crop geometric studiesin polyhouse. Only initial two harvests wererecorded for two cultivars Indra (4 fruits/plant) and California Wonder (3.2 fruits/plant). After this, the crop was damageddue to heavy incidence of bacterial wilt andmites. Thereafter, a plan was formulated tominimize bacterial wilt incidence with threemeasures viz. soil solarization, crop rotationwith Brassica spp. and use of antagonisticagents. After soil solarization radish was
taken to rotate the crop sequence. Secondtrial in polyhouse was conducted with 11varieties of tomato and highest yield wasrecorded from Arka Ananya (1.67kg/plant)followed by Arka Vikash (1.59kg/plant)and DARL-3(1.43kg/plant). The highestbacterial wilt incidence was recorded inDARL-3 (70.0%), BT-1 (45.3%) and ArkaAnanya (45.5%). The high susceptibility ofthese resistant genotypes in presentexperiment might be due to heavy load ofpathogen, presence of different races ofRalstonia solanacearum in soil or existence ofcomplex factors with pathogen favouringclimate inside polyhouse (Table 3).
Standardization of Technologies for Protected Cultivation of Vegetable Cropsunder Bay Island Conditions
Table 3. Performance of tomato cultivars under polyhouse conditions
Entries Wilt Plant Fruit Avg. No. of Yield/incidence height girth fruit Fruits/ Plant
(%) (cm) (cm) weight (g) plant (kg)
BT 317 56.67 74.80 12.49 41.74 24.02 1.01CO-3 68.87 72.16 12.24 33.10 22.82 0.96BT-1 45.53 74.67 12.27 49.83 22.47 0.70VR-35 62.23 71.43 12.56 46.94 21.62 0.99VTG-106 65.53 81.81 14.11 58.84 21.52 0.81DVRT-2 62.23 89.24 12.00 30.86 22.37 0.86BMZ 21 53.33 104.52 12.36 47.00 21.27 0.85PAU 2372 65.57 116.35 13.37 44.87 20.52 0.61Arka Ananya 45.57 115.19 11.49 36.77 31.37 1.67DARL-3 70.00 120.57 10.65 21.94 29.23 1.43Arka Vikash 61.10 112.61 14.96 62.87 22.30 1.59SE(m) 3.31 4.87 0.46 8.17 0.61 7.41
C.D (0.05%) 9.85 14.47 1.36 24.28 1.83 0.22
C.V. 9.47 8.98 6.28 32.80 4.51 12.31

CARIAnnual Report 2009-2010
37
Shrawan Singh, D. R. Singh and V. B.Pandey
Under AICRP (Vegetable Crops) 109 entrieswere tested in 16 trials with seven differentvegetable crops in 2009-10. In cowpea ArkaGarima (3.27 t/ha), Kashi Kanchan (3.02 t/
ha) and 09/COPBVAR 4 (2.68 t/ha) entriesperformed well (Table 4). The yield ofcowpea was low due to heavy rains in cropgrowing season i.e. June-September. Out of15 entries of dolichos bean IIVR SEM-11(7.02 t/ha), Swarna Utkrist (5.85 t/ha) and
All India Coordinated Research Project (Vegetable Crops)
Table 4. Performance of cowpea entries
Entries Plant Days to 50% Fruit Fruit Avg. no. of Green podheight (cm) flowering weight (g) length (cm) fruits/ 5 plants yield (t/ha)
COPBVAR 2 52.7 43.0 9.8 16.0 57.3 2.34COPBVAR 3 50.1 42.8 8.3 26.0 57.8 2.25COPBVAR 4 55.4 42.0 8.7 23.8 65.3 2.68COPBVAR 5 58.7 43.5 7.1 16.3 60.8 2.21Kashi Kanchan 103.7 43.3 8.8 22.5 72.0 3.02Arka Garima 51.3 48.8 12.9 21.0 75.0 3.27SE(±) 2.4 0.4 0.3 0.7 2.1 0.17C.D (0.05%) 7.4 1.2 1.0 2.0 6.4 0.52CV 7.81 1.81 6.98 6.25 6.51 13.01
Table 5. Performance of Dolichos bean entries
Entry Plant Days to 50% Pod No. of Green podheight (cm) flowering length (cm) pod/plant yield (t/ha)
08/DOLPOVAR/1 196.3 68.3 6.9 35.3 3.4808/DOLPOVAR/2 225.0 70.0 7.0 25.0 3.1008/DOLPOVAR/3 243.3 70.3 7.0 36.0 3.6908/DOLPOVAR/4 243.3 68.0 6.0 32.7 2.6308/DOLPOVAR/5 208.3 75.7 6.3 46.0 4.8808/DOLPOVAR/6 190.0 79.7 6.9 38.3 4.5908/DOLPOVAR/7 175.0 78.7 6.0 33.3 3.3608/DOLPOVAR/8 158.3 81.0 6.7 38.0 4.14Swarna Utkrishta 149.3 84.0 6.6 76.0 5.85Ankur Goldy 66.7 39.0 9.9 32.0 4.26IS-1 233.3 83.3 11.9 40.0 3.92IS-2 198.3 104.7 9.7 44.0 5.18IIVR-Sem-11 128.3 74.7 10.2 82.7 7.00IIVR- Sem-186 165.0 67.0 10.7 64.3 5.34ZDL-79-1 185.0 95.7 7.0 29.3 3.09SE(±) 7.1 1.7 0.4 4.3 0.18C.D (0.05%) 20.5 5.1 1.2 12.5 0.53CV 6.62 3.95 8.77 17.04 7.34

CARI Annual Report 2009-2010
38
IIVR SEM-186 (5.34 t/ha) were foundpromising in Islands (Table 5). Amongfrench bean entries Arka Anoop (8.02 t/ha),Contender (7.68 t/ha) and DWD FB-57(6.19t/ha) performed well. Chilli entries JCA 283(17.2 t/ha) and SH KC-12 (15.82 t/ha) from2008-09 trial and ACS-06-2(23.58 t/ha),ACS-06-01 (23.04 t/ha) and 09CHVAR-8
(21.87 t/ha) from 2009-10 trial were foundpromising in dry season (Table 6). Three bestperforming hybrids of okra in rainy seasonwere 09/OKHYB-10 (7.05 t/ha), 09/OKHYB-9 (6.83 t/ha) and 09/OKHYB-2(6.26 t/ha). The tomato trial was damagedcompletely due to bacterial wilt while brinjalvarietal evaluation trial is under progress.
Table 6. Performance of chilli entries
Entries Plant Weight of No. of Fruit Fruit Green fruitheight (cm) 10 fruits (g) fruits/plant Length (cm) Girth (cm) yield (t/ha)
LCA334 35.0 56.5 36.0 9.9 3.8 18.59PC2062 49.0 31.4 36.7 9.2 3.5 10.52KA 2 34.0 48.5 35.0 10.2 3.2 12.41LCA 206 35.0 33.6 42.7 7.1 3.1 14.96CCH-0-1 51.3 31.1 45.2 7.8 2.8 13.98ACS-06-1 48.3 34.1 71.0 7.4 3.1 22.42ACS-06-2 63.7 32.9 70.0 5.3 3.7 23.0909CHVAR-1 60.3 26.3 23.2 5.8 3.0 6.1009CHVAR-2 60.7 30.6 45.7 6.6 3.2 15.6709CHVAR-3 45.3 30.5 70.0 5.2 2.9 21.4509CHVAR-4 49.0 28.2 66.7 5.9 3.4 18.4209CHVAR-5 61.0 29.0 46.7 6.1 2.5 13.3209CHVAR-6 75.0 31.5 40.7 7.2 3.3 13.0009CHVAR-7 71.7 33.0 32.7 6.4 3.4 10.2609CHVAR-8 77.3 38.3 56.7 10.3 3.5 21.67SE(±) 5.4 3.5 5.0 0.7 0.2 0.99C.D (0.05%) 15.6 10.2 14.3 2.1 0.5 2.85CV 18.22 17.07 19.90 16.61 9.83 12.03
Development of Agro Techniques for Potato in Bay IslandsM. Sankaran, Shrawan Singh, V.B.Pandey, T. Subramani and S. Bhagat
A confirmatory trial for potato cv. KufriSurya was conducted with local check KufriJyothi at Diglipur, North Andaman in
randomized block design (Plate 2). It was
observed that Kufri Surya outperformed the
check for most of growth and yield
parameters viz. plant height (64.8 cm), plantspread (31.89 cm), number of branches/plant

CARIAnnual Report 2009-2010
39
(3.31), number of tubers/ plant (7.82g),weight of tuber/plant (267.48), tuber length(10.84 cm) and tuber yield (10.69 t/ha) (Table7). However, disease at late stage of the cropand rains during the period of crop harvesti.e. January and February months have
damaged the crop. Therefore, proper time ofsowing for potato will be standardized incoming year. The consistent performance ofKufri Surya favours its further considerationfor conducting experiment for developingagro-techniques on potato production.
Plate 2. Potato cv. Kufri Surya at farmers field
Table 7. Growth and yield attributes of potato cultivars
Cultivers Plant Plant No. of No. of Weight of Tuber Length Girth of Yield ofheight Spread branches tuber one tuber weight / of tuber tuber tuber(cm) (cm) / plant /plant (gm) plant (gm) (cm) (cm) t/ha
Kufri Surya 64.80 31.89 3.31 7.82 34.24 267.40 10.84 5.34 10.69
Kufri Jyoti 50.86 22.07 2.77 3.93 23.35 88.76 5.52 5.02 3.56
SE(m) 3.61 0.82 0.24 0.30 0.75 4.06 0.27 0.23 0.29
C.D (0.05%) 11.24 2.54 0.73 0.93 2.34 12.63 0.84 0.72 0.89
C.V. 22.49 10.89 27.89 18.40 9.40 8.21 11.85 16.05 14.46
Shrawan Singh, V. Damodarn,M. Sankaran, D.R. Singh and R.C. Srivastava
Germplasm collection trips were conductedin Hut Bay, Car Nicobar and NorthAndaman Islands. Colocasia accessions
All India Coordinated Research Project (Tuber Crops)
were collected from Middle Andaman, LittleAndaman and Car Niobar while Dioscoreabulbifera germplasm was collected from LittleAndaman. New accessions collected were ofGreater yam (1), Colocasia (3) and Aerial

CARI Annual Report 2009-2010
40
yam (1) which are being multiplied inGermplasm Block at CARI. With additionof these five new accessions a total of 36genotypes of tuber crops are beingmaintained in the germplasm pool (Table8). Presentation with complete descriptorshas been made for release of two varietiesof Sweet Potato (CARI-SP-1 and CARI SP-
2) (Plate 3) for releasing at state level. Fielddemonstrations were conducted atfarmer’s field in South Andaman andNorth Andaman in 2009-10. Threethousand cuttings of sweet potato and 150kg yam planting materials of elephant footwere distributed to 25 farmers in April2009.
Plate 3. Sweet potato varieties ( CARI SP - 1, CARI SP - 2)
Crop No. of accessions New collections Total germplasmexisted added available
Sweet potato 6 - 6
Greater yam 12 1 13
Colocasia 4 3 7
Cassava 3 - 3
Elephant foot yam 2 - 2
Coleus 1 - 1
Arrow root 1 - 1
Xanthosoma 2 - 2
Dioscorea bulbifera - 1 1
Total 31 5 36
Table 8. Germplasm of tuber crops maintained under AICRP on tuber crops

CARIAnnual Report 2009-2010
41
R. Sudha and V.B. Pandey
Rose
The varietal evaluation trial (Plate 4) on rosewas continued in 2009. Second yearobservations showed that maximum plantheight was recorded in Movie Star (96.03cm)while minimum in Tineka (37.33cm). Maximumdays taken to flowering were recorded in GrandGala (70.77). Flower stalk length was maximum
in First Red (16.37 cm) but no. of buds /plantwas highest in Biyanka (3.67) (Table 9).
Gerbera
Varietal evaluation trial of gerbera (Plate 4)was continued for second year underprotected condition. Evaluation was done onthe basis of plant spread, number of leaves/plant, number of sucker/plant, flowerdiameter, stalk length, number of ray florets
Standardization of Technology for Production of Quality Flowers under IslandEcosystem
Table 9. Performance of rose varieties under protected condition
Cultivars Plant Days Stalk No. of Flower Flower No. ofheight taken to length bud/ /plant diameter petals/(cm) flowering (cm) plant /season (cm) flower
Ravel 87.33 68.67 5.90 3.33 14.30 4.57 14.27
First red 67.80 59.77 16.37 2.67 24.53 3.87 13.87
Biyanka 57.93 57.00 8.87 3.67 17.43 5.07 21.40
Movie star 96.03 53.33 15.53 3.00 31.17 3.40 16.67
Tineka 37.33 44.67 12.17 2.67 32.47 5.50 19.83
Noblese 51.43 60.83 11.87 1.67 12.10 3.10 26.33
Grand Gala 43.20 70.77 15.70 2.33 15.20 3.70 17.43
SE(m) 3.52 2.13 0.32 0.47 1.40 0.43 1.01
C.D(0.05%) 10.95 6.64 0.99 1.46 4.35 1.33 3.14
C.V. 9.67 6.23 4.46 29.39 11.49 17.76 9.42

CARI Annual Report 2009-2010
42
and number of flower/plant /season. Themaximum plant spread was found in varietyMarinilla followed by Gaalileo and Lorca.Loriana produced maximum number of suckerper plant which was at par with Manizales andSonata. The largest size of flower was observed
in Galileo followed by Palmira and Loriana.Longest stalk length was found in Palmira. Themaximum number of ray florets was observedin Judy followed by Figaro and Manizales whilemaximum flowers/season recorded inManizales (Table 10).
Plate 4. Rose and Gerbera under polyhouse condition
Table 10. Performance of gerbera varieties under protected condition
Varieties Plant No of No of Flower Stalk No of No. ofspread leaves sucker/ diameter length ray flower/
(cm) per plant plant (cm) (cm) florets plant/ season
Marinilla 70.10 17.20 3.52 8.53 60.17 152.00 8.67Pia 65.27 13.67 2.52 8.90 55.33 194.67 24.67Province 60.67 17.50 3.72 10.13 54.33 212.33 19.67Antonio 63.50 16.00 2.45 10.40 51.00 222.67 7.67Villssar 66.67 14.33 2.32 10.47 51.67 145.00 19.00Ravel 62.50 20.33 3.17 10.53 52.67 212.00 14.67Lorca 69.07 12.33 2.42 8.67 44.00 222.00 11.67Galileo 69.30 15.07 3.02 13.23 55.73 223.00 21.00Loriana 67.63 10.33 4.05 11.00 51.67 151.33 25.33Teresa 64.57 15.40 2.65 10.07 52.67 151.67 12.33Judy 64.27 23.67 2.77 10.47 44.50 329.33 5.67Manizales 62.63 25.67 3.98 10.60 44.33 224.00 35.00Figaro 66.07 13.80 2.70 9.80 47.33 225.33 6.00Sonata 64.83 30.03 3.92 10.27 53.67 196.00 30.00Palmira 55.17 14.33 2.05 11.23 70.60 224.00 10.33SE(m) 1.79 2.30 0.15 0.48 2.35 5.02 1.34C.D(0.05%) 5.22 6.69 0.45 1.40 6.83 14.62 3.91C.V. 4.80 22.98 8.86 8.10 7.72 4.23 13.85

CARIAnnual Report 2009-2010
43
D.R. Singh, M. Sankaran, R. Sudha,S. Bhaghat and V. Damodaran
The mango clones planted at CARI wereevaluated for its morphological charactersviz., plant height, number of branches andflowering (Table 11). The maximum plantheight and number of branches wererecorded in B1 clone (4.07m, 19) followed
by KL 2 (3.39 m, 18.5) where as minimumheight was recorded in ML 7 (1.4 m). Theflowering was observed only in four clonesviz. ML 9, M 2, KL 2 and B 1 but there wasno fruit setting. This variable floweringpattern of mango clones may be due to theirdifferent genetic sources and/or lack ofpollination.
Collection, Conservation and Molecular Characterization of Early FloweringOpen Pollinated Mango Clones of Bay Islands
Table 11. Vegetative and flowering parameters of mango OP clones
Sl. No Name of the clone Plant height (cm) No. of branches Flowering
1 KL 1 212.5 15.0 No2 KL 2 339.0 18.5 Flowering3 B1 407.5 19.0 Flowering
CL 1 158.0 6.0 No5 CL 2 160.0 6.0 No6 ML 8 170.0 7.5 No7 ML 9 295.0 12.0 Flowering8 ML 10 289.0 19.0 No9 ML 6 145.0 4.5 No10 ML 7 140.0 6.0 No11 ML 3 214.0 14.0 No12 ML 4 330.0 13.5 No13 ML 5 317.5 18.0 No14 GL 4 185.0 10.0 No15 M 1 307.5 13.5 No16 M 2 304.5 16.5 Flowering17 GL 1 259.0 7. 0 No18 GL 2 235.0 7.5 No19 GL 3 200.0 11.5 No20 GL 4 185 10.0 No
SEd 86.73 1.86 -CD(0.05%) 181.55 3.89 -
CV% 35.38 15.85 -
*Mean values are given in parentheses.

CARI Annual Report 2009-2010
44
Isolation of and identification of pathogen
During pathological inspection of mangoorchard it was found that most of the treeswere severely affected by leaf spot withtypical round to irregular light brownspots. These spots subsequently changedinto dark brown with short hole in centreand covered entire leaf which becomesbrittle and curled upward. The infectedleaf samples were symptomaticallyidentified as anthracnose disease. Thepathogen was also confirmed asColletotrichum mangiferae throughpathogenesis test with koch’s postulatemethod. Based on the morphologicalcharacteristics, all isolates were groupedinto two i.e. C. mangiferae-I and C.mangiferae-II
Evaluation of Trichoderma spp. against C.mangiferae-I and C. mangiferae-II
In vitro inhibition of two isolates Colletotricummangeferae by Trichoderma was reported withdual culture test. The percent inhibition ofmycelial growth of pathogens by Trichodermaisolates ranged from 47.1 to 60.0% (C.mangiferae-I) and 46.1 to 60.0% (C.mangiferae- II). The highest percent inhibition
of C. mangiferae I was recorded with Th-CARI-20 followed by Th-CARI-25 and Tv-CARI-33 which were most effective insuppression of pathogen growth. In the non-volatile inhibitors test, the isolate Tv-CARI-14 was most effective in suppression ofmycelial growth of C. mangiferae-I (78.0%)at 10% concentrations followed by Tv-CARI-14. At similar concentration, Tv-CARI-33was most effective in percent inhibition ofC. mangiferae -II.
In vitro efficacy of some fungicides againstC. mangiferae-I and C. mangiferae-II
The in vitro evaluation of eight fungicideswas done against both pathogens by poisonfood technique. The test fungicides wereCalixin, Diphenoconazole, Saaf, Copperoxychloride, Bavistin, Mancozeb, Kavachand Krilaxyl Gold. Among the fungicides,Diphenoconazole was most effective insuppression of mycelial growth of bothpathogens with lowest LC50 value followedby Bavistin, Calixin, Saaf, Krilaxyl Gold,Mancozeb, Kavach and Copper oxychloridewith highest LC50 value for both pathogens.Thus, some of these fungicides can beincluded in integrated disease managementprogram for effective management ofanthracnose disease in mango.
Standardization of Agrotechnique for Organic Black Pepper Cultivationin A & N Islands
I.Jaisankar, Krishna Kumar and S. Bhagat
An experiment was laid out in randomizedblock design with four replications tostandardize the organic source of nutrients
for organic cultivation of black pepper andcoconut under coconut based intercroppingsystem (Plate 5). The treatments comprisedVermicompost + Biopotash (T1), reco-

CARIAnnual Report 2009-2010
45
Plate.5 Black pepper on Gliricidia standards asintercrop of coconut garden
mmended dose of NPK (T2), Vermicompost(T3), Gliricidia leaf manure (T4) and Control(T5). The organic sources were estimated tosupply the recommended dose of NPK toblack pepper (100:40:140 g/ vine) andcoconut (500:320:1200 g/tree), respectively.The observations recorded on the growth andyield parameters of black pepper arepresented in table 12. The highest yield ofblack pepper was recorded with (331kg ha-1)followed by T1(300 kg ha-1). This may be dueto the quick release of nutrients from theinorganic sources as compared to organicsources. Among the organic sources the yieldof black pepper was in the order ofVermicompost + Biopotash > Vermicompost> Gliricidia leaf manure > control. In anotherexperiment along with the organic sources ofnutrients different sprayings as per thetreatments (Table 13) were given to blackpepper to control the incidence of foot rot andwilt disease which is the severe constraint inblack pepper cultivation. The result revealed
that application of recommended dose ofNPK through inorganic and spraying of blackpepper with 1%Bordeaux mixture recordedthe highest yield (435.2 kg ha-1) followed byVermicompost+Biopotash+Bordeauxmixture (386.6 kg ha-1) with the lowest incontrol. In general the efficacy of sprayingson the growth and yield of black pepper wasin the order of 1% Bordeaux mixture > Neemleaf decoction > Pseudomonas.
Table 12. Effect of organic & inorganic nutrients on the growth and yield of Black Pepper
Treatments No. of No. of Total Berries wt/ Berries wt/ Totalvines/1m fruiting spikelet Spikelet Spikelet yield
height branches /tree wt fresh(g) wt dry(g) (Kg/ha)
Vermicompost+Bio Potash 14.0 95.0 201.0 15.0 4.1 299.9
NPK 15.5 101.8 206.8 15.5 4.4 331.1
Vermicompost 10.5 81.0 141.3 13.3 4.1 208.2
Gliricidia leaf 9.0 67.0 120.5 11.0 3.7 162.3
Control 5.0 44.0 93.0 9.0 3.1 103.2
SEd 0.9 1.1 1.3 0.9 0.1 4.2
CD(0.05%) 1.9 2.5 2.9 2.0 0.2 9.1
CV% 11.3 2.1 1.2 9.9 3.5 2.7

CARI Annual Report 2009-2010
46
Table 13. Effect of organic and inorganic nutrients along with spray formulations on the growth andyield of Black pepper
Treatments* No. of No. of Total Fresh Dry Totalvines/ fruiting spikelet spikelet spikelet yield1m ht branches /tree wt (g) wt (g) (Kg/ha)
Vermicompost+BP +NLD(T1) 13.0 99.0 203.0 16.0 4.5 335.3Vermicompost+BP+BM(T2) 18.0 101.7 211.0 21.0 5.0 386.6Vermicompost+BP+ Pseudomonas (T3) 11.7 93.3 199.0 15.0 3.9 282.5NPK+NLD(T4) 16.0 104.7 211.3 20.0 4.9 377.0NPK+BM (T5) 19.0 109.0 216.0 24.0 5.5 435.2NPK+Pseudomonas (T6) 15.0 101.0 203.7 19.0 4.4 323.8Vermicompost+NLD (T7) 13.0 86.0 146.3 14.3 3.8 200.5Vermicompost+BM(T8) 15.0 88.7 156.7 18.0 4.1 233.8Vermicompost+Pseudomonas(T9) 11.0 81.7 139.3 11.0 3.0 152.2Gliricidia leaf+NLD (T10) 11.0 66.0 123.7 13.3 3.8 171.0Gliricidia leaf+BM(T11) 11.0 69.7 141.3 14.0 3.4 176.7Gliricidia leaf+Pseudomonas (T12) 8.0 59.0 112.3 10.0 2.9 117.3Control (T13) 8.0 40.0 97.0 10.0 2.9 102.4SEd 1.2 1.3 1.9 1.0 0.2 12.0CD(0.05%) 2.4 2.6 4.0 2.1 0.3 24.8CV% 10.9 1.9 1.4 7.9 4.4 5.8
*BP- Biopotash; NLD-Neem Leaf decoction; BM-Bordeaux Mixture
Improvement of Coconut and Arecanut
D.R. Singh, V. Damodaran, M. Sankaran,I. Jaisankar and R.C. Srivastava
The continuous evaluation of 24 PacificOcean Islands collection (exotic) and sixindigenous accessions from Nicobar Islandmaintained at WCGC, Sipighat resulted inselection of four dwarf cultivars for tendernut and ornamental purpose and the selectedvarieties were submitted for state varietyrelease committee.
Inter-se-mating/selfing in coconut
Inter- se- mating and selfing was carried out
in the selected accessions from the 24 exoticgermplasm and 6 indigenous accessionsfrom Nicobar Islands. The inter-se-mating/selfing work was initiated during the secondweek of October, 2009 and a total of 4485female flowers were pollinated.
Despatch of pollinated seed coconut toCPCRI, Kasaragod
A total of 482 seed coconuts harvested fromprevious year crosses have been sent toCPCRI, Kasaragod via PPQS, Chennai.However during the subsequent harvest

CARIAnnual Report 2009-2010
47
about 190 seed nuts will be sent. Apart from
the above a total of 1345 open pollinated seed
nuts from Acc. No.5, 8, 18, 22 and dwarf
palms of CARI have been sent to CPCRI,
Kasaragod.
Exploration for collection of Coconut
germplasm from South Andaman District
A germplasm exploration trip was
undertaken in collaboration with CPCRI,
Kasaragod for collection of coconut
germplasm accessions from South
Andaman. The exploration resulted in
identification and collection of 18 accessions
including three dwarf types and a makapuno
type. The makapuno type with soft endosperm
is first report of collection from the A&N
Islands. One set of the seed nut samples of
germplasm collected have been sown in
nursery for evaluation at CARI, Port Blair.
Evaluation of newly released coconut
varieties and hybrids in different agro-
climatic regions
As approved in the AICRP (Palms), the
performance of newly released coconut varieties
Table 14. Performance of high yielding Arecanut local selection (CARI - Sel - 1)
Characters CARI – Mangala Samrudhi Calicut SEd CD CVSel- 1 35 (P=0.05)
Plant height(m) 7.18 6.47 7.47 8.81 NS - -
Plant girth (cm) 47.6 48.4 53.6 49.2 NS - -
No. of scar in l mt 9.2 9.4 8.2 8.6 NS - -
Inter nodal distance (cm) 11.4 11.6 12.6 13.4 NS - -
No. of leaves in the crown 9.8 9.8 10.0 9.8 NS - -
Length of leaf(cm) 185.8 219.0 242.0 183.4 8.8 19.2 6.7
Width of leaf (cm) 80.4 81.6 87.0 82.2 NS - -
No of bunches/tree 6.6 6.4 5.8 7.4 0.4 0.8 8.5
Average no. of nuts/ bunch 94.0 81.7 82.0 86.0 NS - -
Total no. of nuts/tree 620 523 476 636 51.8 112.8 14.5
Bunch weight (Kg) 5.98 5.46 4.62 4.76 NS - -
Avg. fresh fruit weight (g) 61.9 65.2 60.7 42.8 2.4 5.2 6.5
Avg. dry fruit weight (g) 23.5 24.8 22.0 18.3 0.81 1.77 5.79
Length of fruit (cm) 5.8 6.2 5.9 6.0 NS - -
Girth of fruit (cm) 15.6 16.0 18.9 14.3 0.04 0.09 0.45
Husk weight (g) 10.6 12.8 11.1 8.6 1.00 2.18 14.67
Chali weight (g) 9.8 8.5 9.6 7.6 NS - -
Girth of Chali (cm) 9.9 8.1 9.3 8.0 0.2 0.4 3.2
Length of Chali (cm) 1.9 2.6 2.4 2.6 0.1 0.2 6.1Husk/ nut ratio % 45.1 51.6 50.5 46.9 NS - -

CARI Annual Report 2009-2010
48
and hybrids have to be evaluated in different
agro-climatic regions. Accordingly 30 selfed
seed nuts each of Kera Keralam variety from
Thanjavur, Konkan Bhatye Coconut
Hybrid-1, Kera Bastar and Kahikuchi
Hybrid-1 received from Regional Coconut
Research Station, Ratnagiri were sown in
the nursery during August, 09 and March,
2010 respectively. The overall germination
percentage of Kera Keralam variety was
56.7%, and the number of days taken forgermination ranged from 69 to 149 days.
Arecanut local selection
The high yielding Arecanut selection (CARI-Sel-1) made from the local population ofArecanut grown in Garacharma farm andKVK, CARI has recorded maximumnumber of nuts/ bunch (94) compared toMangala and Samrudhi and it has alsorecorded higher chali weight (9.8 g) ascompared to the check variety Mangla. Thebrief description of the arecanut newselection (CARI - Sel - 1) and it’s comparisonwith the other cultivable varieties in theIslands are as detailed in table 14.
Plate 6.(i) Andaman Micro Talltree crown view
(ii) Macapuna nut cross section (ii) Cross section view ofarecanut vertices
Role of Alley Cropping System in Nutrient Conservation (nutrient build up+ protection of fine soil particles from erosion) and Selection of SuitableCrop Sequence for the Cropping System for the Andaman Islands
I.Jaisankar and T.P.Swarnam
An experiment was conducted inrandomized block design with 5 treatmentsand 4 replications to evaluate theperformance of grain amaranthus in alleycropping system during the post monsoonperiod. The treatments comprised of
incorporation of gliricidia pruned leafbiomass @ 2.5, 5, 7.5 and 10 t ha-1 along withcontrol. The growth and yield attributingparameters were significantly influenced bythe gliricidia leaf biomass incorporation at45 DAS and at harvest stage in grainamaranthus. The highest yield (770.2kg ha-1)

CARIAnnual Report 2009-2010
49
was recorded with the incorporation of 10 tha-1 pruned biomass in the alley croppingsystem followed by incorporation of 7.5 t ha-1
which recorded a yield of 763.2 t ha-1.However, both the treatments were on parwith each other and significantly higher ascompared to incorporation of 2.5 t ha-1 andno incorporation (control). This indicatesthat application of 7.5 t ha-1 gliricidia prunedleaf biomass in the alley cropping system isoptimum to achieve higher yield of grainamaranthus (Table 15). Soil analysis before
planting and after harvest of the croprevealed that there was appreciable increasein the available N, P and K content of thesoil from the initial level. The increase inavailable nitrogen ranged from 7.9 to 11.2kg ha-1 while the increase in phosphorusranged from 1.1 to 3.1 kg ha-1 and thepotassium ranged from 3 to 10.2 kg ha-1. Thismight be due to the fact that gliricidia beinga N fixing legume tree and as such itsincorporation of pruned biomass which ondecomposition might have increased the
Table 16. Effect of Gliricidia leaf biomass on the total NPK content of the soil (kg ha-1)
Treatments Nutrient content before planting Nutrient content at harvest
N P K N P K
T1: Control 151.9 9.8 86.4 158.0 11.7 93.0
T2: Gliricidia leaves (2.5 t ha-1) 168.7 11.0 133.4 178.1 12.6 136.4
T3: Gliricidia leaves (5t ha-1) 185.5 12.7 169.4 195.7 15.8 173.0
T4: Gliricidia leaves (7.5 t ha-1) 199.5 15.2 175.8 210.8 16.3 186.0
T5: Gliricidia leaves (10 t ha-1) 253.5 16.9 196.4 263.3 18.9 202.6
CV% 8.8 7.7 32.9 7.7 5.6 33.7
SEd 10.6 0.7 31.7 9.8 0.6 33.7
CD (P=0.05%) 22.6 1.6 67.3 20.9 1.3 71.4
Table 15. Effect of Gliricidia pruned leaf biomass on growth and yield of grain amaranthus
Treatments Plant Collar Shoot dry Root dry Dry Grainheight diameter weight weight matter Yield(cm) (cm) (g/plant) (g/plant) (g/plant) (kg/ha)
T1: Control 87.5 1.4 16.8 2.9 21.8 468.7
T2: Gliricidia leaves (2.5 t ha-1) 88.1 1.6 19.8 2.9 22.8 623.9
T3: Gliricidia leaves (5 t ha-1) 111.5 1.6 20.9 3.1 24.0 695.2
T4: Gliricidia leaves (7.5 t ha-1) 113.5 1.8 21.8 3.2 25.0 763.2
T5: Gliricidia leaves (10 t ha-1) 114.2 1.8 22.3 3.3 25.6 770.2
SEd 0.4 0.01 0.1 0.04 0.1 27.1
CD (P=0.05%) 0.9 0.03 0.2 0.08 0.2 59.2

CARI Annual Report 2009-2010
50
available N in soil and duringdecomposition the production of organicacids and consequent release of P fixingions increases the available P content of thesoil. Incorporation of 7.5 t ha-1 gliricidiapruned biomass in the alley system
registered the maximum increase in
I. Jaisankar, Israr Ahmad and SomeshwarBhagat
An exploration survey was undertaken andidentified high yielding plus trees of Jatrophaand Pongamia in different locations ofAndaman Islands and the seed materialswere collected from the selected plus treesfor evaluating variability in seed and growthcharacters. Significant trait differences wereobserved in the parameters such as seeds,seed morphology, growth characters, plantheight, and fruiting and flowering ratio(Table 17). The Jatropha species collectedfrom different part of the Island were plantedon 8th of October 2009 on CARI Garacharmafarm (Plate 7, Table 18). J. podagrica startedflowering as well as fruiting in the month ofJanuary 2010 and J. multifida startedflowering in the month of February 2010 andstarted fruiting in the month of April 2010.J.gossypifolia started flowering in the monthof April 2010. The branches development intwo species of Jatropha especially in case ofJ.gossypifolia and J. curcas were observedduring the month of April 2010.
In South and Middle Andaman, Jatrophaspecies namely J. curcas (50%) were foundmore when compared to other species suchas J. gossypifolia (20%) J. Podogirica (10%)and J. multifida (10%), covering the land fromwet to dry in the island J. curcas generallygrown as live fence and also observed inwaste land and in the same area J.gossypifolia were also observed. J. multifidawas very rarely seen in some houses asornamental plant. Pongamia pinnata (20%)was mostly found in seashore and Tsunamiaffected areas of South, Middle and NorthAndaman Districts of Andaman. Selectionof plus trees were under taken as per theNOVOD board instructions. In SouthAndaman four candidate plus trees ofJatropha curcas, one for J. multifida and twofor J. gossypifolia (Plate 8) were selectedfrom Jirkatang, Beachdera and Mazarpahad and J. curcas from Farargunj,Chouldari for J. multifida and Sippighat andGaracharma for J. gossypifolia. The tree ofJ. curcas was about 3 - 5 m in height withsmooth grey bark sprout readily and growsrapidly which makes it suitable for fencing.
Germplasm Collection, Evaluation and Identification of High YieldingGenotypes of Jatropha and Karanja and their Multiplication in Bay Islands.
available soil N and K (11.2 and 10.2 kg
ha-1). However, incorporation of 10 t ha-1
gliricidia leaf pruning registered the
increase in available NPK content of the
soil to the tune of 9.8 kg, 2 kg and 6.2 kg
ha-1, respectively (Table 16).

CARIAnnual Report 2009-2010
51
The leaves developed from it were green topale green, broad and usually simple 3-5lobed. J. curcas is formed in the leaf axel;flowers are formed terminally, individuallywith female flowers usually slightly larger
and occur in the hot seasons. J. curcas seedsresemble castor in seed shape, ovoid oblongand black in colour.
J. multifida or coral plant is a shrub or smalltree with a single trunk, a loose, spreading
Table 17. Growth and yield parameters of Jatropha curcas
Site data Location Plant Basal No. No. of 100 100 Huskheight girth of fruit/ Pod Seed weight
(m) (cm) branch bunch wt. (g) wt.(g) /100 pod
Jirkatang 5m, N110 50’12.2’’ 2 30 2 6 321 256.4 134.5 E0920 39’15.2’’
Beachdera 34m, N110 55’35.9’’ 2 22 2 4 273.3 199.2 74.1 E092039’01.8’’
Farargunj 71m, N110 43’22.6’’ 6 36 2 6 335 276.4 58.6 E092039’15.8’’
Shaitankari 63m, N110 43’14.8’’ 2.5 18 3 4 250.8 190.4 60.4 E092040’05.0’’
Namunagar 33m, N110 40’20.3’’ 3.5 26 3 3 - - - E092040’54.1’’
Sholbay 18m, N11042’53" 3 4.5 2 4 190.9 131.4 59.5 E092043’00’’
Manarghat 3m, N11041’06.0’’ 3 4 4 3 310 216.4 93.6 E092042’34’’
Tirur 8m, N11043’05.1’’ 2.5 30 2 3 289.6 183.8 105.8 E092036’.47.2’’
Chidiyatapu N11033’43.6’’ 15 28 2 5 276.2 153.9 122.3E092043’16.09
Jatropha Species Avg. plant Avg. basal Avg. no. Avg.no. Avg. no.ht(cm) girth (cm) of leaves of flower of fruit
J.curcas Diglipur Accession1 24.10 8.6 8 - -
J. multifida 29 4.73 8.3 1 -
J. gossypifolia 30.76 7.6 12 - -
J. podagrica 8.43 14.3 7 2 3
J. curcas 18.9 9.60 11 - -
Table 18. Growth and flowering parameters of Jatropha spp. at five months after planting (Garacharma farm)

CARI Annual Report 2009-2010
52
Plate 7. Candidate plus tree of Jatropha curcas
Plate 8. Candidate plus tree of Jatropha multipada and jatropha gossypifolia

CARIAnnual Report 2009-2010
53
crown and a typical height in cultivation of6-10 ft (1.8-3.1 m), although it can grow upto 20 ft (6.1 m) tall. The very distinctive leavesare large, growing up to 12 in (30.5 cm) wide.They are cut deeply into 7-11 narrow lobeswith the margins of each lobe themselvesdissected into narrow pointed segments. Theyare dark green above and whitish beneath.The flowers are bright coral red and borne inflat topped clusters on long stalks held highabove the foliage. Coral plant blooms on andoff all year long, and especially during hotweather. Most euphorbs have a milky sap thatflows from broken stems, but that of coralplant looks more like cloudy water (Table 19).
J. multiflora fresh pod weight was 17.03g anddry pod weight 0.45g while fresh and dry
weights of seeds were 2.58g and 0.54g,respectively. The inflorescence in J. podagricaproduces brightly coloured orange-redflowers on short pedicels. J. podagrica flowersround the year in favourable environment,especially in the warmer months. J. Podagricaproduces a roundish seed pods or fruits areset freely after flowering, start off a lovelyfresh green and turn blackish brown whenmatured. Seeds will self sown easily onsuitable soil. The seeds become mature whenthe capsule changes from green to yellow,after two months of fruit setting. Fruitdevelopment takes place approximately 90days after flowering. Flowering and fruitingoccur on the same plant throughout thefruiting season from February to November.
Table 19. Growth and yield parameters of Jatropha multifida
Site data Plant DBH/ Basal No. of No. of fruiting No. ofheight (m) girth(cm) branches bunches pods/bunch
Minnie bay 3.2 12 2 1 3
New Manglutan 13m, 2 14 4 1 2N11033’39’ E092038’45.9’’
Chouldari 6m, 2 15 2 8 4N11038’04.5’’ E092040’04.9’’
Table 20. Growth and yield parameters of Jatropha gossypifolio
Site data Location Plant Basal No. of No. of Fruits/height (cm) girth(cm) branch flowers/ bunch bunch
Laxmi nagar 22m , N110 42’13.2’’ 0.75 5 2 - -E092040’35.3’
Barm nagari 9m, N110 41’37.5’’ 1.5 11 3 2 -E092040’49.1’’
Calicut 63 m , N11035’ 4 2 2 -E092042’’ 1
Sippighat 15m, N110 36’00.6’’ 1.0 5 3 80 50E092041’01.7’’

CARI Annual Report 2009-2010
54
Each fruit bears three seeds of 2 – 3 cm longand 1-1.5cm thickness. J. gossypifolia foundwas 0.5-2 m tall shrub, with deep-reddishbrown stem and branches. The leaves are 5-11 x 6-13 cm 3-5 lobed, crimson red. J.gossypifolia produces flowers with brightcoral red and borne in flat-topped clusterson long stalks held high above the foliage.Capsules of J. gossypifolia are of 0.8 -1.7 cmlong, 3 lobed, smooth, glabrous and 1 - 3 cmthickness (Table 20).
Pongamia pinnata
Two plus trees were identified in NewWandoor (Plate 9) and Chidyatapu (Plate 9a,b & c). The observation made on theirfruiting and flowering pattern, the pod size,shape and number of seeds in candidate plustree revealed that girth of the trees ranged
from 62 and 79 cm while the pod size rangedfrom 6x 3.1cm and 6x3.7 cm. Seed sizeranged from 2.2x1.9 cm to 2.1x1.7 cmrespectively. The weight of hundred podsfrom each tree was taken which was 1.341kgwhile the weight of hundred seeds was 0.396kg. In Havelock two plus trees wereidentified. The observations recorded in thetree at Vijaynagar village of Havelockrevealed the girth of tree as 152 cm with podsize of 8x3.7 cm, seed size measuring 2.5x2cm, and hundred pods weighed 775.5g withweight of hundred seeds of 359.29g. Anothertree was observed near Radhanagar beacharea, Havelock with a girth of 57 cm. Thesize of the pods was 7x3 cm and the seedsize was 2.5x1.6 cm. Weight of hundred podsand seeds were taken which measured1.715kg and 0. 581 kg, respectively.
Plate 9. Candidate plus tree of Pongamia pinnata in Wandoor
Plate 9(a-b). Candidate plus tree of Pongamia pinnata in Chidyatapu; (c) Establishment of Jatrophaspecies at Garacharma farm
(a) (b) (c)

CARIAnnual Report 2009-2010
55
I.Jaisankar T.P.Swarnam S.Jeyakumar
M.Sankaran and N.C.Choudhuri
To evaluate the yield of three fodder grasses
viz. Para (G1), Guinea (G2) and Ischaemum
rugosum (G3) under the four indigenous
fodder trees i.e. Mussanda macrophylla (T1),
Trema tomentosa (T2), Ficus spp. (T3),
Euphorbia sp. (T4) and open (T5) under natural
forest system, an experiment was laid out in
randomized block design with four
replications at Garacharma farm (Plate 10).
The observations on the growth parameters
of fodder trees and grasses grown under the
fodder trees, the influence of light on the
yield of grasses and soil parameters at the
initial as well as after one year of the
experiment were estimated. The result
revealed that the growth parameters viz,
height, DBH and number of branches of the
fodder trees considerably increased from the
initial level (Table 21). The height of the
fodder grasses and number of tillers were
significantly influenced by the fodder tree
canopies. The overall performance of all the
three fodder grasses was superior under the
canopy of Trema tomentosa tree in which the
average height of the grasses (135.7 cm) and
number of tillers (14.3) were higher followed
by Ficus sp. Among the grasses, growth
performance of para and guinea grasses were
significantly higher under the tree canopies
as compared to Ischaemum rugosum (Table
22). Maximum forage yield was recorded
under Trema tomentaosa (104 t ha-1) followed
by Ficus sp. whereas the least forage yield
was recorded in open situation (96.2 t ha-1)
among the grasses maximum forage yield
was attributed by guinea grass (130 t ha-1)
followed by para grass (121.7 t ha-1) while
least forage yield was recorded from
Ischemum rugosum (46 t ha-1). However, the
interaction effect of fodder trees and fodder
grasses were non-significant. Among the
grasses Guniea grass performed better under
the tree canopy by recording the forage yield
of 131 t ha-1 as compared to open condition.
This might be due to the shade under the
tree (46800 candles compared to 49000
candles in open condition) promoted the
vegetative growth of guinea grass. It was
observed that there was a significant
reduction in the soil N, P and K after one
year of the experiment from the initial level.
In general the reduction in N ranged from
1.67 to 2.95 kg ha-1, P ranged from 0.58 to
1.59 kg ha-1 and K ranged from 0.67 to 1.83
kg ha-1 (Table 23). However, among the
fodder trees reduction in N (3.5 kg ha-1), P
(1.59 kg ha-1) and K (1.83 kg ha-1) was
maximum in Euphorbia sp., Treama tomentosa
and Mussanda macrophylla, respectively.
Among the fodder grasses the reduction in N
Identification, Evaluation and Development of Silvipastoral System for BayIsland Condition

CARI Annual Report 2009-2010
56
and K (3.1 and 1.7 kg ha-1) was higher under
paragrass whereas the highest reduction in P
(1.25 kg ha-1) was observed under Ischaemum
rugosum. All the grasses recorded higher yield
under fodder trees compared to open
conditions. In general the available soil N, P
and K had reduced to the tune of 3 to 6 kg
under various grasses and trees. Among the
grasses guinea found to be better under fodder
trees compared to other grasses.
Table 21. Growth parameters of fodder trees
Treatments Initial After one year
Height(m) DBH(cm) No. of branches Height(m) DBH(cm) No. of branches
T1 6.8 4.4 4.8 7.6 4.7 5.5
T2 5.2 5.5 2.8 6.2 5.9 4.0
T3 6.9 7.2 5.0 7.9 7.4 6.0
T4 5.4 8.8 8.3 6.4 8.9 8.8
Mean 6.1 6.4 5.2 7.0 6.7 6.1
SEd 0.8 0.3 0.6 0.7 0.3 0.6
CD(P=0.05) NS 0.6 1.4 NS 0.6 1.3
CV% 17.6 5.6 16.5 14.4 5.4 13.6
Table 22. Effect of fodder trees on the growth parameters of fodder grasses (Average of five cuttings)
Treat Height of the grass(cm) Number of tillers Yield t ha-1
ments
G1 G2 G3 Mean G1 G2 G3 Mean G1 G2 G3 Mean
T1 150.2 149.9 71.9 124.0 16.8 15.5 9.1 13.8 119.1 131.4 46.1 98.9
T2 167.2 155.2 84.7 135.7 17.8 15.8 9.3 14.3 128.1 131.1 47.9 104.1
T3 163.9 150.9 80.2 131.7 16.8 16.0 8.9 13.9 125.4 124.7 46.9 99.0
T4 164.5 147.1 77.8 129.8 14.8 15.3 8.9 13.0 115.8 132.5 46.6 98.2
T5 98.1 134.0 54.7 95.6 10.5 9.2 5.9 8.5 120.3 124.6 43.7 96.2
Mean 148.8 147.4 73.8 123.2 15.3 14.3 8.4 12.7 121.8 130.0 46.1 99.3
CV=4.13% CV=8.28% CV=5.61%
SEd CD(P=0.05) SEd CD(P=0.05) SEd CD(P=0.05)
Tree (T) 2.3 4.7 0.5 1.0 2.4 4.9
Grass(G) 1.8 3.6 0.4 0.8 1.9 3.8
TG 4.0 8.1 0.9 1.7 Interaction NS

CARIAnnual Report 2009-2010
57
Table 23. Influence of fodder trees and grasses on the soil NPK status (kg ha-1)
Treatments Initial status of nutrients Nutrients after one yearN P K N P K
T1 182.3 14.2 98.3 179.7 13.1 96.5T2 179.4 16.4 82.6 177.0 14.9 81.3T3 181.9 15.6 102.3 178.9 15.0 101.6T4 182.8 15.2 84.9 179.3 14.5 83.5T5 194.4 15.9 86.3 192.8 14.8 85.4SEd 7.0 1.2 12.2 6.5 1.2 11.8CD(P=0.05) 14.2 2.4 24.6 13.2 2.4 23.9G1 188.1 14.6 90.9 185.0 13.7 89.2G2 175.8 15.3 95.3 173.0 14.4 94.4G3 188.7 16.6 86.5 186.6 15.3 85.5SEd 5.5 0.9 9.4 5.1 0.9 9.2CD(P=0.05) 11.0 1. 9 19.1 10.2 1.8 18.5CV(%) 9.1 21.3 32.9 8.7 22.27 32.8
Plate 10. Establishment of fodder tree based silvipasture system at Garacharma farm
Silvi-pasture System : Effect of Fertilizer and Cutting on Net PrimaryProduction (herbage production) in Humid Tropical Climate of Andamans
I.Jaisankar, S.K.Verma and V. Damodaran
Coconut based silvipasture system (Plate 11)was established with the fodder grasses likehybrid napier (Panicum purpurium), para(Brachiaria mutica) and guinea grasses(Panicum maximum) under coconut plantation(>25yr old) spacing of the grasses was 50 x50cm. Coconut trees were planted at 7.5 x 7.5m distance. These grasses were fertilized with
different doses of nitrogen: 20kg ha-1, 40kg ha-1 and 60kg ha-1 at three locations: under thetree canopy, between the tree canopy andopen (without tree). The experiment was laidout in randomized block design with threereplications for estimation of the potential ofgrasses under palm trees. The observations aremade on the basis of selected tillers forevaluating seasonal growth rate of fodder

CARI Annual Report 2009-2010
58
grasses, time and intensity of pruning of foddergrasses to standardize the optimum leaf forageproduction of the silvipasture system. Theseasonal growth rate of the fodder grassesshowed more or less same pattern of previoustwo years result. The result revealed that in allthe three grasses the percent cover of leaf washighest in the month of May (Stem Leaf Ratioof Para is 0.39, Guinea is 0.37, and HybridNapier is 0.31) and declined with thesucceeding months (fig. 3).
This may be due to the luxurious growth offodder grass with the onset of monsoon.However the least leaf production wasobserved in the month of April (Stem Leaf Ratioof Para is 5.92, Guinea is 6.23, and HybridNapier is 6.98). There is no significantdifference in herbage production among thegrasses though Para grass recordednumerically higher herbage production (80.9t ha-1). Among the nitrogen levels, applicationof 60 kg N ha-1 recorded 95.2 t ha-1 of herbageproduction which was significantly highercompared to 40kg N ha-1 irrespective of canopyand grasses. Growing of the grasses in opencondition led to significantly higher herbageproduction of 88.6 t ha-1 compared to between
Fig.3. Stem/leaf cover ratio in different grassesunder coconut trees
Plate 11. Established Silvipasture system at Sippighat Farm
canopy (79.9 t ha-1) and under canopy (69.6 tha-1). It is found that application of 40kg Nha-1 was sufficient to produce maximumherbage of 105.0 t ha-1 under open conditionwhile under canopy and between canopyapplications of 60 kg N ha-1 recordedsignificantly higher herbage production. Thismight be due to utilization of the nutrients bythe trees and grasses. Among the grassesguinea grass performed better under canopywhere as para grass performed much betterbetween canopy (Table 24). This might be dueto the availability of low light under thecanopy (28000 candles) which favored theluxurious growth of guinea grass since it isshade tolerant and performs well under thediffused light.

CARIAnnual Report 2009-2010
59
Tab
le 2
4. H
erb
age
pro
du
ctio
n (t
ha-1
) un
der
coc
onu
t tre
e ca
nop
ies
Gra
sses
Un
der
can
opy
Bet
wee
n c
anop
yO
pen
con
dit
ion
Nit
roge
n (k
g h
a -1)
Nit
roge
n (k
g h
a -1)
Nit
roge
n (k
g h
a -1)
Gra
nd
2040
60C
ontr
olM
ean
2040
60C
ontr
olM
ean
2040
60C
ontr
olM
ean
mea
n
Hyb
rid
nap
ier
62.2
70.6
85.6
49.1
66.9
69.5
74.5
103.
849
.974
.410
4.7
108.
410
7.5
63.8
96.1
79.1
Par
a gr
ass
73.4
74. 7
78.5
56.5
70. 8
84.5
97.5
103.
954
.285
.199
.110
1.9
95.1
50.8
86.7
80.9
Gu
inea
gra
ss68
.470
.491
.554
.271
.174
. 988
.595
.962
.880
.581
.210
4.9
95.1
50.8
83.0
78.2
Mea
n68
.071
.985
.253
.369
.676
.386
.810
1.2
55.6
79.9
95.0
105.
099
.355
.288
.679
.4
CV
%=8
.05
SEd
CD
(P=0
.05)
Gra
ss(g
)1.
5N
S
Fer
tiliz
er(f
)1.
83.
5
Sit
uat
ion(
s)1.
53.
0
fs3.
06.
1
gs
2.6
5.2
gfs
5.3
10.5
Und
er c
anop
y lu
x=28
000
cand
les;
bet
wee
n ca
nop
y lu
x= 3
7000
can
dle
s; c
ontr
ol c
ond
itio
n lu
x= 4
9000
can
dle
s;P
and
K =
80
and
120
kg a
-1

CARI Annual Report 2009-2010
60
D.R. Singh and R. Sudha
Minor fruits germplasm block wasestablished at Garacharma farm of CentralAgricultural Research Institute, Port Blairwith Mangosteen (6 nos.), Durian (6 nos.),Rambutan (10 nos.), Avocado (10 nos.),Longan (6 nos.), Sweet Tamarind (20 nos.),Litchi (8 nos.), West Indian Cherry (8 nos.)and Custard Apple (9 nos.) for evaluatingthe growth of the minor fruit trees at fieldcondition. Ten underutilized fruits wereanalysed for their antioxidant compoundssuch as total polyphenols, anthocyanins,carotenoids and tannins content. All fruitspecies were harvested at ripe and unripestages and stored at -200C before analysis.Fruit was thawed at room temperature andpulp was used for analysis.
The total polyphenols content wasdetermined by the Folin–Ciocalteu methodand expressed as mg Gallic acid /100g.Malphigia glabra had the highestpolyphenolic content (355.74 ± 4.29)followed by Mangifera andamanica (311.19 ±2.88), Morinda citrifolia L. (290.40 ± 3.94),Syzygium aquem (285.80 ± 2.50), Anonasquamosa L.(229.10 ± 1.34), Averrhoacarambola (176.25 ± 2.88), Averrhoa billimbiL.(164.92 ± 1.41) , Dilenia indica (152.91 ±1.77), Anona muricata L.(147.71 ± 1.49) , Ficusracemosa L.( 133.46 ± 2.24). The totalanthocyanin content of the food wasestimated by the pH-differential methodusing two buffer systems – potassium
chloride buffer, pH 1.0 (0.025 M) andsodium acetate buffer, pH 4.5 (0.4 M) andexpressed as mg C3G/100g. Malphigia glabrahad the highest anthocyanin content (91.31± 2.64) followed by Mangifera andamanica(91.14 ± 1.92), Morinda citrifolia L. (84.45 ±1.53), Syzygium aquem (75.93 ± 2.51), Anonasquamosa L. (62.19 ± 1.80), Averrhoa carambola(56.95 ± 2.41), Averrhoa billimbi L. (47.36 ±1.27), Dilenia indica (41.67 ± 2.96), Anonamuricata L. (37.40 ± 2.16) and Ficus racemosaL. (36.43 ± 2.82). Carotenoid estimation wasdone by Sukran et al., (1997) and expressedas µg/ml. Malphigia glabra had the highestanthocyanin content (109.16 ± 2.28)followed by Mangifera andamanica (84.21 ±1.39), Morinda citrifolia L. (75.46 ± 0.90),Syzygium aquem (71.17 ± 2.26), Anonasquamosa L. ( 58.62 ± 1.06), Averrhoacarambola (49.68 ± 1.36), Averrhoa billimbi L.(47.04 ± 2.38) , Dilenia indica (42.88 ± 3.58),Anona muricata L. (33.65 ± 2.07) and Ficusracemosa L. ( 36.34 ± 3.14). The total tannincontent was estimated by to the modifiedmethod of (AOAC, 1970). Malpigia glabrahad the highest anthocyanin content (24.39± 1.81) followed by Mangifera andamanica(22.68 ± 0.98), Morinda citrifolia L. (21.69 ±2.15), Syzygium aquem (18.55 ± 1.09), Anonasquamosa L. (18.02 ±1.74), Averrhoa carambola(9.54 ± 0.74), Averrhoa billimbi L. (3.09 ±1.37), Dilenia indica (3.86 ± 0.87), Anonamuricata L. (3.67 ± 1.25) and Ficus racemosaL.(2.69 ± 1.27).
National Network Project on Underutilized Fruits

CARIAnnual Report 2009-2010
61
It is the first time that polyphenolic,anthocyanin, carotenoid and tannincontents of Mangifera andamanica, Anonasquamosa, Averrhoa carambola, Averrhoabillimbi L., and Dilenia indica have been
Technological Innovations for Commercial Exploitation of Morinda citrifoliaas a Livelihood for Island Farmers (NMPB)
estimated. In comparison with some otherstudies we can point out that polyphenoliccontents of Malpigia glabra, Morinda citrifoliaL., Syzygium aquem, Anona muricata L, andFicus racemosa L. is higher.
D.R. Singh, R.C. Srivastava, Jai Sunder,Subhash Chand, Krishna Kumar, AjantaBirah and Shrawan Singh
Standardization of plant geometry
Three different treatments viz. removal ofall branches except 3 pairs of branchesfrom lower end (T1), removal of allbranches except 4 pairs of branches fromlower end (T2) while treatment T3 isremoval of all branches except 5 pairs ofbranches from same were designed. T3 gavegood results in most of the parameters i.e.,height of plant, no. of primary, secondaryand tertiary branches, length of Internodeson primary and tertiary branches, no. ofinternodes on secondary and tertiarybranches and leaf area meter. The growthin control plant was also found good inrespect of plant height and leaf area meter.In terms of fruit size T2 gave good resultscompare to all others in fruit girth onprimary branches and both fruit lengthand girth on secondary branches.Maximum yield was found in treatment T2
(2.66 Kg/ quarter) and also good in T3
(3.15 Kg/quarter).
Standardization of plant canopyarchitecture
An experiment was laid out to standardize
the plant canopy architecture viz. alternate
removal of branches (T1); alternate
removal of branches + removal of main
stem tip (T2); removal of main stem tip only
(T3); removal of main stem tip + cutting of
50% of each leaf (T4); removal of main stem
tip + cutting of tip of each branch (T5); one
consequence cutting (T6). The result
revealed that in terms of average number
of fruits (14.25 and 11) and average
quarterly yield (2.04 kg and 1.69 kg) per
plant were higher in T1 and T2 compared to
others. T2 was found best treatment in terms
of plant spread, fruit size on primary and
secondary branches and number of tertiary
branches with higher number of internodes.
T1 also gave very good result for average
total fruit numbers, fruits on primary and
number of secondary branches and fruit
size. Till about 2 years of plantation T1 and
T2 are performing better in terms of numberof fruits and yield.

CARI Annual Report 2009-2010
62
Influence of spacing on growth and yield
of Morinda citrifolia
After two years of transplanting theobservation revealed that, spacing hasinfluence on the growth and production
parameters of Morinda citrifolia. The initialobservation indicated that the 3 x 3mspacing supporting good growth and
production qualities followed by 4 x 4m ascompared to 2 x 2m, 1.5 x 1.5m and 1 x 1mspacing. The fruit yield was calculated to be
18.8 kg per annum in 3x3m spacing followedby 9.1, 8.9, 7.3 and 3.6 kg per plant perannum in 4x4, 2x2, 1.5x1.5 and 1x1 m
spacing, respectively. The average fruitweight and fruit number per plant alsoshowed similar trend.
Evaluation of bush type accessions of
Morinda citrifolia
Studies revealed that after 1 year 10 month
of planting accession TRA-1 recorded higheraverage plant height (263.5 cm) with stemdiameter (6.88 cm) than TRA – 2 with
average plant height (247.25 cm) and stemdiameter (5.93 cm). The maximum height ofthe plant in TRA-1 was 301 cm and the
lowest 200 cm. The highest basal stem girthwas 28.6 cm and the lowest was 18.54 cmin TRA-1. The maximum height of the plant
in TRA-2 was 260 cm and the lowest 235cm. Highest basal stem girth was 19.78 cmand the lowest was 16.96 cm in TRA-2. Fruit
yield was also recorded higher in TRA-1 thanTRA-2. Hence, it may be concluded that at
the age of 1 year 10 months TRA 1 was
superior to TRA 2 in both growth and yield
parameters.
Evaluation of Morinda citrifolia as intercrop
under arecanut and coconut plantations
The observation revealed that, in
intercropping with arecanut, plant attained
an average height of 131 cm with 3.52 cm
basal diameter in about 1 year 7 months of
planting. The average number of auxiliary
leaves was 9.71, number of primary
branches 14.3, number of leaves in primary
branch 142, number of internodes in
primary branch was 6.95 with a length of
3.22 cm. The average number of fruits per
primary branch was found to be 1.6.
Average number of secondary branch was
found to be 5.57 with 35.52 leaves. Number
of internode was 4.19 with a length of 3.07
cm. The average number of fruits per
secondary branch was found to be 1.42.
Under coconut plantation, there was no
significant effect of different doses of NPK
in the production and growth parameters
of the Noni plantation within one year after
the initiation of the experiment. The
observation revealed that the plant attained
an average height of 193 cm with 18.9 cm
basal girth in 2 years 6 months of planting.
Number of auxiliary leaf was 6.92, number
of primary branch 8.17, number of leaves
in primary branch 84, number of internodes
in primary branch were 7.93 with a length
of 4.5 cm. The average number of fruits per

CARIAnnual Report 2009-2010
63
primary branch was found to be 1.84.
Average number of secondary branch was
found to be 1.82 with 8.16 leaves. Number
of internodes was 1.71 with a length of 7.15
cm. The average number of fruits per
secondary branch was found to be 1.43. The
results revealed that Noni can be
successfully intercropped in arecanut and
coconut plantation.
Estimation of Phenolic and anthocyanin
content in different accessions of Morinda
citrifolia
Eleven accessions of Morinda citrifolia fruits
have been evaluated for Phenolic and
Anthocyanin content. The results showed
that, TRA-2 is the best accession having the
highest amounts of phenolics (300mg/
100gm), while JGH-1 contains higher
amount of anthocyanin (91.8mg/100gm).
Diagnosis and management of diseases
occurring on Morinda citrifolia (Noni) in
Andaman & Nicobar Islands
Infected samples (leaves, fruits, stems and
roots) were collected from five locations of
South Andaman i.e. Mundapahad,
Kodiyaghat, Rangachang, Burmanallah,
Garacharma Farm and CARI Campus. The
pathogens associated with infected Noni
plant parts viz., stem, root and leaf
samples were collected for the isolation
(Plate 15). Disease incidence and severity
of different disease were also recorded
from July to September, 2009 in all the
location surveyed. From the collected
samples fungal pathogens were isolated.
The fungal isolates were then purified by
adopting single hyphal tip method and
maintained on PDA slants for further
studies. A total of 17 fungal isolates were
isolated, purified and maintained. All the
17 fungal isolates were studied for their
colony radius, growth pattern (Plate 16)
and form, aspersoria, shape, size and
colour of spores (Plate 17). Identification
was made by comparing the
characteristics of fungi following Charlie
et al., (2001) and Deacon (1998). Among
the 17 isolates 11 were identified as
Colletotrichum gloeosporiodes, 2 species of
Xylaria, and each isolates of Lasiodiplodia
theobromae , Daldinia eschscholz i i ,
Pesta lot iops is theae and Geomyces
pannorum based on morphological and
cultural characters. To prove Koch’s
postulates the fungal isolates associated
with anthracnose symptoms were tested
for their pathogenicity on the leaves of
Noni (Morinda citrifolia) by adopting pin-
prick and cel i te in jury method and
inoculated with conidial suspension (106
conidia/ml) prepared from 7 day old
culture on PDA. The fungal isolate MC1
showed symptoms on host . The
inoculated plants were maintained
under greenhouse by providing proper
humidity and irrigation.

CARI Annual Report 2009-2010
64
Plate 15. Symptoms associated with Morinda citrifolia (Noni)
Leaf spot Blight Stem blight
Shot hole Fruit rot
Plate 16. Cultural variations of pathogens studied
Plate 17. Morphological variations of pathogens

CARIAnnual Report 2009-2010
65
Molecular characterization and diversityanalysis
DNA was isolated using SDS method andthen amplified with fungal universalprimers ITSI and ITS4 (White et al., 1990)and obtained PCR products of about 600bp (Plate 18). Samples were sent for directsequencing for further identification anddiversity analysis through RFLP with Hinf-I, which showed distinct variation betweenthe isolates (Plate 19).
A total of 17 fungal pathogens weresequenced for 18S ribosomal RNA gene,partial sequence; internal transcribed spacer1, 5.8S ribosomal RNA gene, and internaltranscribed spacer 2, complete sequence; and28S ribosomal RNA gene, partial sequence.BLAST analysis revealed that nine speciesof Colletotrichum gloeosporioides, 2 species ofXylaria, and an each isolates of Lasiodiplodiatheobromae, Daldinia eschscholzii,Pestalotiopsis theae and Geomyces pannorum .
Plate 18. PCR amplification of ITS regions of Colletotrichum spp. Lane M1-M17, MC4,MC2(I), MC(I),MC2(3), MC9, MC12(II), MC13, MC14(I), MC14(II), MC15, MC16(I), MC16(II), MC6,
MC8, MC2(4), MC17 and MC19 Lane M, 100bp ladder
Plate 19. Restriction profile of ITS amplicon with HinfI Lane M1-M17. MC4,MC2(I), MC(I), MC2(3),MC9, MC12(II), MC13, MC14(I), MC14(II), MC15, MC16(I), MC16(II), MC6, MC8,
MC2(4), MC17 and MC19 Lane M, 100bp ladder.

CARI Annual Report 2009-2010
66
Effect of Morinda citrifolia extracts againstRalstonia solanacearum (bacterial wilt)
The methanol leaf extract, fruit extract andseed extract of Morinda citrifolia was testedagainst Ralstonia solanacearum (bacterial wilt)
by agar diffusion method. The test microorganisms were seeded into Mueller Hintonagar by spread plate method 10µl (106conidia/ml). The zone of inhibition was more in fruitextract compared to others (Plate 20).
Identification of pests of Morinda citrifolia
An extensive field survey was carried out toidentify the pests of Noni (M. citrifolia L.) indifferent locations of south, middle and northAndaman. Five pests, three types of ants andtwo types of sucking pests have been reportedfor the first time. The major pests includedthree species of ants, black ant, Camponotuscompressus Fabricius , Technomyrmex albipes(Smith), Anoplolepis gracilipes (Smith) (Plate21). Damage by ants to agriculturalcommodities is usually indirect. Mealybugsand scale insects secrete honeydew, whichattracts ants. Among sucking pests,passionvine mealybug, Planococcus minor(Maskell) (Pseudococcidae: Hemiptera) andscale insect, Coccus sp. (Coccidae) were alsoobserved as significant pest of Morindacitrifolia (Plate 22). There was difference inlevel of incidence of these insect pests like,ants (10- 40%), mealy bugs (2-5%), scaleinsects (5-20%), lepidopteran pest (10-30%).
Plate 20. Zone of inhibition
Field surveys were conducted in farmer’sfield as well as research farms and it wasfound that plants in the natural habitat weremore resistant to pests attack than in theresearch farms.
Growth inhibitory activities of Morindacitrifolia
A study was conducted to assess thebiological activity of aqueous leaf extract ofNoni (Morinda citrifolia) against Spodoptera
litura under laboratory conditions (Plate 23).This study was conducted by using ‘leaf dipmethod’. Leaf extracts of M. citrifolia inhibitedthe growth and development of S. litura andaffected the larval and pupal survival andadult emergence in a dose-dependentmanner. Ninety percent of the larvae of S.
litura died due to M. citrifolia intoxication,hence the larval population could not reachthe crucial late instar stage, which is actuallyresponsible for crop damage.

CARIAnnual Report 2009-2010
67
Consequently, the survival of the test insect wasreduced (11.89% in 7% concentration), whereasin control it was as high as 76.5%. Larval growthindex and total development index of the testinsect were drastically reduced 1.10 and 0.28in Morinda citrifolia intoxication (7%concentration) whereas in control it was as highas 5.20 and 2.70 respectively. The leaf extractsof this plant also affected the fecundity andfertility of the test insect adversely as there was
no chance of the future generation. The results
revealed that M. citrifolia possess the insecticidal
and juvenomimetic properties against S. litura,as total growth and development was reducedwhich will ultimately affect the futuregeneration of the test insect. The study revealsthat aqueous leaf extracts of Morinda citrifoliacan potentially be used as eco friendly bio-pesticide to control the devastating damagecaused by Spodoptera litura.
Plate 21 : (a) Noni (Morinda citrifolia L.) tree, (b) Yellow crazy ant (Anoplolepis gracilipes (Smith), (c) blackant, Camponotus compressus Fabricius (d) Passionvine mealybug, Planococcus minor (Maskell)
A B
C D
Plate 22 : (a) Scale insects, Coccus hesperidus (b) Damage of unidentified lepidopteran pest(c) Adult lepidopteran pest
A B C

CARI Annual Report 2009-2010
68
Plate 23: (a) Larvae of Spodoptera litura, (b) Aquous leaf extract of Morinda citrifolia(c) Laboratory experiment on Spodoptera litura (d) Spodoptera larva
A B
C D
Effect of feeding of Morinda citrifolia fruitjuice on growth and productionperformance of poultry
The Morinda citrifolia ripened fruit wascrushed to prepare/extract crude fruit juice.The crude juice was used for feeding poultry.A total of 125 Nicobari fowl (brown, blackand white) were used for the experiment.The birds were divided into 5 subgroupswith 25 birds in each group. Group I:Morinda supplementation @ 0.5 ml/bird/day; Group II: Morinda supplement @ 0.75ml/bird/day; Group III: Morinda
supplement @ 1.0 ml/bird/day; Group IV:Morinda supplement @ 1.5 ml/bird/day;Control: normal ration only. All the birdswere maintained under standard deep littersystem of rearing and fed with normal chickration. Chick starter ration was given till 4th
week of age, then grower ration was giventill 12th week of age and finally layer rationwas given after 13th week onwards. Theresult revealed that in the male bird attainedhigher body weight in group IV bird atdifferent week interval till 5th month of agecompared to other groups. The overall

CARIAnnual Report 2009-2010
69
results revealed a higher body weight gainin group fed with 1.5 ml of Morinda juice(1830±89.22 g) at the end of 5 month.Followed by control, group II, III and I. Inthe female bird the higher body weight wasrecorded in the group I (1366.66±134.15 g)followed by other groups. The effect ofMorinda on the birds showed that the bodyweight increased with the increase in theconcentration of Morinda feeding atdifferent week of age. Overall result revealedhigher body weight in the birds givenMorinda 1.5 ml per bird per day. The FCRat 2nd month was best in the control groupcompared to other group. At the end of 3rd
month the best FCR was observed in thegroup IV. The age at sexual maturity wasearlier in group II (171 days) followed bycontrol (180 days), group I (185 days) andgroup III (192 days). The weight at sexualmaturity of male was highest in group IVfollowed by control, group II, III and Irespectively. The body weight of female washigher in group I, followed by control, groupII, group IV and group III respectively. Nosignificant effect on mortality pattern wasobserved however, in the Morinda fed groupthe mortality was less than the controlgroup. The egg production performance forthe first six week of production was betterin group III followed by II, I and control. Theresult showed that the feeding of Morindajuice influenced the egg production in thebirds. The average initial egg weight was32.5 g, 34.4 g, 30 g and 37.5 g in the group I,II, III and control respectively. The average
egg weight at 3rd week of production wasbetter in group III (40 g) compared to othergroup of eggs.
Studies on carcass quality parameters ofNicobari fowl fed with differentconcentration of Morinda citrifolia fruit
A study was undertaken to assess thecarcass quality of Nicobari fowl (White,Brown, and Black) fed with differentconcentration of Morinda citrifolia fruit juice.The results revealed that the Morinda juicehas influence in the carcass quality andpercentage of carcass weight. Among thedifferent birds Black Nicoabri performedbetter with higher body weight gain andcarcass quality compared to white andbrown Nicoabri fowl.
Studies on humoral and cell mediatedimmune response in the Nicoabri fowl fedwith different concentration of Morindacitrifolia fruit juice
Study was conducted to assess the immuneenhancer (Plate 24) effect of crude juiceextracted from fruit of Morinda citrifolia inpoultry. The birds were divided into fivegroups and fed with Morinda citrifolia fruitjuice @ 0.5ml, 0.75 ml, 1.0 ml, 1.5 ml per birdper day daily while group V was kept ascontrol. The birds were maintained underdeep litter system & throughout theexperiment no medication and additionalsupplements were fed except the normalbasal ration. To assess the humoral immuneresponse, the haem agglutination test (HAT)was conducted with GRBC in the

CARI Annual Report 2009-2010
70
experimental birds. The humoral immuneresponse in the group I, II and III was lesscompared to the control birds at 1 weekPI, however at the end of 2nd week groupIV birds showed higher titer than theother group of birds. The antibody titerwas obtained till the end of 3rd week.Higher T cell response was observed in the
Plate 24. Haem-agglutination and CMI tests
group II (2.8±0.02), followed by III(2.28±0.38), IV (1.64±0.21), control(1.37±0.18) and group I (1.27±0.17).Compared to the humoral immuneresponse, the CMI was found betterwhich indicated that the Morinda citrifoliainduces the CMI better than the humoralimmune response.
Study on the microbial load and pH ofMorinda citrifolia fruit in different days ofstorage at room temperature
Morinda citrifolia fruit were stored at roomtemperature for 30 days to study the changein pH, microbial load and physicalappearance of fruit. The fruits wereexamined regularly at an interval of 5 daysfor 30 days period. The microbial count (bothbacterial and fungal count) of matured andripe fruits increased with increasing days ofstorage (Plate 25). The bacterial and fungalcount reached peak at 25 days of storage inmatured and ripe fruits. The bacterial loadvaried between 1.29 x10³ to 19.01 x10³ in thematured fruit. However, the bacterial countwas recorded less in ripe fruit with bacterial
count ranging from 2.3x10³ to 16.6x10³
bacteria per gram of fruit which might bedue to lower pH of the ripe fruits comparedto matured fruits. The pH in the maturedfruit at 20 and 25 days was 4.5 while in theripe fruit it was 3.5. In both stages i.e. ripeand mature the pH varied from 3 to 4.5. Thephysical parameters of the fruit remainedalmost unchanged till the 10th day of storagein case of mature fruits while with the ripefruits the physical parameters did not showmuch difference till the 5th day of storage.Thus, it was revealed that the fruits were ingood physical condition and were with lessmicrobial load within 10 days of harvest. Thebacterial count in mature fruits with fullstalk and shoulder stalk were observed to

CARIAnnual Report 2009-2010
71
increase with increase in storage period.Significantly, the fungal count was nil inaforesaid days in fruits with full stalk andshoulder stalk. The pH in the fruit with fullstalk varied from 3.55 to 4.65, while in case
D.R. Singh and R.C. Srivastava
Rectification of the claim of Morindatrimera in Andaman and Nicobar Islands
The samples collected from different partsof the islands have been studied intensivelyand its reconfirmation revealed that the sofar reported Morinda trimera in these Islandsmay be a variety of Morinda citrifolia i.e. smallvariety of Morinda citrifolia. Hence, the claimof presence of Morinda trimera in Andamanand Nicobar Islands has been rectified andso far no plant or tree of Morinda trimera hasbeen seen or reported in Andaman andNicobar Islands.
Nutritional profile of different accessionsof Morinda citrifolia (Noni) fruits
The study was conducted to investigatenutritional profile of Morinda citrifolia (Noni)
Collection, Conservation, Characterization and Identification of SuperiorClones of Morinda Citrifolia (WNRF)
of fruit with shoulder stalk similar patternwas observed however the pH was slightlyless than the fruit with full stalk. The totalbacterial count was less in fruit with shoulderstalk compared to the full stalk fruit.
Plate 25. Colonial morphology of different bacterial and fungal growth
fruits collected from different accessions ofAndaman and Nicobar Islands. The ascorbicacid, protein, total soluble solids, crude fibre,fat, and free sugar were investigated in thestudied accessions of Noni fruits. Ascorbicacid contents were highest in the AHD-1 (127mg/100g) while lowest in ABH-1 (90 mg/100g) accessions. Among the presentlyinvestigated accessions MEM-1 (5.5%) hasbeen identified as rich source of crudeprotein. Although the TSS value found to behighest in ABH-1 (9.8ºBrix) and the lowestvalue was found in the fruits of MAN-1(7.3ºBrix). While the MEM-1 and ABH-1(9.970.4% and 9.870.4%) contains highestconcentration of crude fibre and AHD-1,JGH-1 had the lowest levels (8.340% and8.564%). Although the maximumconcentration of fat was determined in the

CARI Annual Report 2009-2010
72
fruits of MAN-1 (0.24) accessions, the lowestconcentration was found in the fruits ofABH-1 (0.11) accessions. Free sugars werefound maximum in ABH-1 (12.98 g/l) andlowest in JGH-1(11.73 g/l).
Evaluation of growth parameter of graftedplants
A total of 14 uniform grafted plants wereselected to study the growth parameters. The
grafted plants were planted in the field on06.07.2009 for evaluation of different growthand production parameters. It was foundthat age of primary branch initiation afterplanting averaged about 140 days and firstflowering after planting was observed on 129days which took further two days for fruitsetting. The average days taken for maturity(Green mature) from date of flowering wasfound to be 92 days in the grafted plants.

CARIAnnual Report 2009-2010
73

CARI Annual Report 2009-2010
74
T.V.R.S. Sharma, P.K. Singh, N. Ravisankarand Krishna Kumar
Germplasm introduction/collection
Four hundred seventy five genotypes of sixcrops viz. rice, green gram, black gram,maize, cowpea and sesame were collected/procured from different parts of India andother countries during 2009-10 (Table 1).
Rice trialsNational trials (DRR)
Five All India Coordinated VarietalImprovement Trials of Rice (IVT 1, AVT 2,NASASN 1 and Hybrid 1) were conductedduring Kharif season in rainfed low landconditions. Under these trials 98 improvedlines were evaluated for yield and itsattributing characters.
International trials (IRRI)
Three international rice trials received fromIRRI were conducted during Kharif season.Under these trials total 183 improved lineswere evaluated for yield and its attributingcharacters.
Evaluation of early and medium earlylowland rice lines
One hundred eighty three early and mediumearly lowland rice lines were evaluated in
the randomised block design with three
replications in two trials. The crop was
transplanted in 3.5 m2 plots at the spacing
of 20x10 cm with fertilizers (NPK) @ 90:60:40
kg/ha. Out of these best performing 14 lines
were selected for further evaluation and
improvement (Table 2). The top performing
cultivars were KARJAT-3 (6.66 t/ha)
followed by IR-78555-3-2-2-2 (5.69 t/ha) andIR-78581-12-3-2-2 (5.40 t/ha).
Improving the Quality and Productivity of Rice Based Cropping System
Table 1. Germplasm collected/procured during 2009-10
Sl. No. Crops No. of genotypes Source
1. Rice 375 IRRI, Philippines, DRR, Hyderabad, CRRI, Cuttack,Andhra Pradesh, Tamil Nadu and A & N Islands
2. Green gram 15 Indian Institute of Pulse Research, Kanpur, UP and A & NIslands
3. Black gram 10 Indian Institute of Pulse Research, Kanpur, UP and A & NIslands
4. Maize 11 Vivekananda Parvatiya Krishi Anusandhan Sansthan,Almora, Uttara Khand
5. Cowpea 04 Collected from different parts of A & N Islands
6. Sesame 60 All India Coordinated Research Project on Sesame andNiger, JNKV, Jabalpur, MP
Total 475

CARIAnnual Report 2009-2010
75
Tab
le 2
. Per
form
ance
of e
arly
an
d m
ediu
m e
arly
low
lan
d ri
ce li
nes
Lin
esD
ays
toP
lan
tN
o. o
fG
rain
s/P
anic
le10
00 s
eed
Har
vest
Yie
ldfl
ower
ing
hei
ght (
cm)
till
ers/
Pla
nt
pan
icle
len
gth
(cm
)w
eigh
t (g)
ind
ext/
ha
IR 7
8029
-34-
1-3-
192
.67
112.
077.
5871
.77
24.6
719
.07
33.2
44.
53
IR 7
8555
-3-2
-2-2
94.0
011
6.67
9.60
67.4
724
.67
21.3
137
.91
5.69
IR 6
486
.67
106.
337.
9249
.97
25.6
722
.39
34.9
94.
40
UP
R 1
201-
1-20
-194
.67
108.
005.
9655
.00
22.8
025
.00
32.3
24.
05
IR 6
9716
-87-
1-3-
1-3
94.0
010
3.20
8.44
53.3
324
.60
19.6
838
.66
5.02
KA
RJA
T-3
92.6
710
1.13
7.29
70.7
025
.40
20.0
541
.36
6.66
IR 2
094
.67
109.
008.
1780
.47
23.6
719
.81
27.6
35.
24
IR 8
0411
-B-2
8-4
86.6
710
9.00
7.65
60.9
721
.93
23.3
834
.34
4.07
NC
492
96.0
012
2.40
7.33
31.7
726
.53
23.4
318
.61
4.20
IR 7
8581
-12-
3-2-
298
.33
113.
608.
9248
.80
24.8
024
.24
31.9
95.
40
IR 7
8585
-64-
2-4-
397
.67
109.
008.
5335
.83
24.9
327
.96
32.4
24.
67
IR 3
2809
-26-
3-3
94.6
710
5.53
7.34
54.0
724
.20
23.2
342
.27
5.05
IR 7
9216
-8-2
-3-1
95.6
710
8.20
9.15
51.4
325
.07
23.3
536
.52
4.97
IR 7
3546
-20-
2-2-
2-2
96.3
311
5.87
7.15
84.8
724
.53
18.3
726
.93
4.31
CA
RI D
han-
2 (c
heck
)82
.00
111.
936.
0151
.80
24.6
025
.17
31.5
13.
19
Mea
n93
.11
110.
137.
8057
.88
24.5
422
.43
33.3
84.
76
C.D
.3.
008.
361.
9122
.66
1.50
3.94
6.39
1.37
SE(m
)1.
032.
870.
667.
780.
511.
352.
200.
47
C.V
.1.
924.
5114
.59
23.2
93.
6310
.46
11.3
917
.05

CARI Annual Report 2009-2010
76
Evaluation of soil stress tolerance lines ofrice
Ninety nine salt tolerant rice lines wereevaluated in the randomised block designwith three replications in different three trialswith standard spacing 20 x 10 cm andfertilizer dose (90:60:40). The soil EC wasbetween 4-5 dSm-1 and pH 8.0. Bestperforming 13 lines were selected for furtherevaluation and improvement (Table 3). Themaximum yield was recorded 4.34 t/ha for
two lines IR-759418-7B-21-3, IR 7646-B-B-
10-1-1-1 along with check variety CSR 28.
Varietal evaluation of rice hybrids under
rainfed low land condition
Five rice hybrids were evaluated under
rainfed conditions in replication trials. The
highest yield were recorded for SPH-168
(5.30 t/ha) (Table 4) followed by Suman
(5.16 t/ha) and check variety CARI Dhan-5 (5.05 t/ha) (Plate 1).
Table 3. Performance of rice lines in saline effected soils
Lines DF PH (cm) DM No. of Panicle Yieldtillers/ Plant length (cm) t/ha
IR 71897-3R-1-1-2 95.00 94.50 137.00 10.00 22.70 4.17
IR 59418-7B-21-3 80.00 79.98 136.00 7.85 21.50 4.34
IR 68144-2B-2-2-3-2 75.00 67.90 131.00 12.90 19.30 3.27
IR 72593-B-13-3-3-1 82.50 89.90 135.00 9.40 21.65 4.09
IR 72593-B-3-2-3-3 82.50 87.30 136.00 9.60 22.30 3.67
IR 71895-3R-60-3-1 81.00 73.90 133.00 8.60 21.10 3.34
IR 7646-B-B-10-1-1-1 80.00 99.10 135.50 13.60 21.75 4.34
IR 63731-1-1-3-3-2 85.00 80.50 134.50 11.10 19.90 3.80
IR 72579-B-2R-1-3-2 80.00 84.70 134.50 11.95 21.40 4.13
IR 77674-3B-8-2-2-14-2-AJY 3 85.00 86.20 130.00 7.70 22.40 3.00
CSR-90IR-2 77.50 103.30 132.00 8.60 23.80 4.00
IR 4527-2B-2-2B-1-1 82.50 92.30 135.50 10.45 22.90 3.63
IR 55179-3B-11-3 92.50 91.40 140.00 8.50 21.50 4.00
CSR 28 (check) 82.50 101.20 136.00 9.00 23.60 4.34
Mean 82.93 88.01 134.71 9.95 21.84 3.86
C.D. 5.31 9.46 2.70 4.06 2.24 1.64
SE(m) 1.72 3.06 0.87 1.31 0.73 0.53

CARIAnnual Report 2009-2010
77
Evaluation and improvement of pulses inrabi season.
Green gram
Sixteen improved lines of green gram alongwith local check were evaluated during dryseason (January to March) in a replicatedtrial (Table 5). Observations were recordedfor yield and its attributing characters. Themaximum yield were recorded for ANM-11(1.83 t/ha) followed by ANM-5 (1.66 t/ha)and ANM-8 (1.63 t/ha) (Plate 2 a & b).
Table 4. Performance of rice hybrids under rainfed low land conditions
Hybrids Days Plant Days Panicle No. Yieldto 50% height to length of (t/ha)
flowering (cm) maturity (cm) tillers/m2
Parvati 97.00 113.33 136.00 25.47 237.67 4.79
Shivani 101.33 116.07 136.00 23.87 160.67 4.50
Annapurna 90.33 115.27 135.33 27.20 204.33 4.75
SPH-168 91.67 113.67 138.00 27.33 215.00 5.30
Suman 102.33 99.07 136.67 22.60 269.67 5.16
CARI Dhan 5 105.00 115.25 145.00 23.00 240.00 5.05
Mean 97.94 112.11 138.00 24.91 214.56 4.93
SE(m) 1.25 2.59 0.84 0.65 9.73 0.26
CD 3.98 8.25 2.69 2.07 31.04 0.84
Table 5. Performance of green gram cultivars
Lines Days Plant No. of Days No. of Pod Yieldto height branches to pods/ length (t/ha)
flowering (cm) /plant maturity plant (cm)ANM1 37 35.80 1.90 60 88.50 8.82 1.08ANM3 37 31.60 1.20 60 62.00 7.84 1.22ANM5 39 38.30 2.20 60 68.00 7.84 1.66ANM6 35 35.60 2.00 60 82.50 8.76 1.42ANM8 31 40.90 1.60 53 65.00 8.41 1.63ANM9 37 35.80 1.70 60 62.50 9.33 1.43ANM10 32 36.30 1.30 56 77.50 7.28 1.01ANM11 39 50.60 1.00 59 62.50 9.83 1.83ANM12 40 51.90 2.70 59 71.00 7.73 1.44RM9-121 32 32.50 1.50 56 46.50 8.25 1.06
Plate1. Best performing rice hybrid SPH 168

CARI Annual Report 2009-2010
78
Black gram
Fifteen improved lines of black gram wereevaluated with local check (Table 6). Crop wassown in the month of January and observationswere recorded for yield and attributingcharacters. Variety IPU-94-1, IPU-02-43 ANDTU-40 were found most promising with averageyield of 1.89, 1.72 and 1.66 t/ha respectively.
Breeder Seed production
Breeder seed production was undertaken fordifferent varieties of rice, sesame and greengram. Total 109 kg breeder seed of rice(101kg), sesame (3 kg) and green gram (5kg) were produced (Plate 3 a & b).
Plate 2. (a) Varietal evaluation of Green gram and (b) best performing line ANM-5
Plate 3. (a) Varietal evaluation of black gram and (b) best performing line IPU-94-1
RM9-122 31 33.00 1.00 53 52.00 8.79 1.32RM9-123 35 48.80 1.20 59 64.00 7.53 1.24RM9-126 31 36.30 1.00 53 55.50 7.20 0.95RM9-128 33 39.20 1.90 56 74.00 7.54 1.31RM9-134 37 37.00 1.80 59 82.50 7.05 1.52RM9-136 31 35.70 1.00 53 58.00 7.59 0.95Local Check 31 38.60 1.90 53 80.00 7.75 1.39Mean 34 38.70 1.58 57 67.76 8.09 1.35C.D. 2.95 15.47 1.64 3.54 28.38 0.45 0.58SE(m) 0.98 5.12 0.54 1.17 9.38 0.15 0.19C.V. 4.02 18.69 48.33 2.91 19.59 2.61 20.11

CARIAnnual Report 2009-2010
79
P.K. Singh, T.V.R.S. Sharma, KrishnaKumar and Ajanta Birah
Collection and evaluation of long durationrice germplasm
Seventy four long duration rice cultivars/improved lines were collected from coastalregions of India and A & N Islands andevaluated under transplanted condition. Bestperforming 14 genotypes were selected forfurther evaluation and improvement(Table7). The highest yield were recorded for
Jagbandhu (4.49 t/ha) followed by MTU-2067 (4.39 t/ha) and MTU-1075 (4.32 t/ha)(Plate 4 a& b).
Evaluation of rice lines for disease andinsect pests resistance
Three hundred and seventy five lines of ricewere screened for major diseases (sheath blight,bacterial leaf blight, and brown spot) andinsects (gundhi bug, stem borer, leaf folder andbrown plant hopper) under Bay Islandsconditions. Twenty nine lines were foundtolerant to insects and diseases (Table 8).
Table 6. Performance of black gram cultivars
Lines Days to Plant No. of Days to No. of Pod Yieldflowering height branches maturity pods/plant length (t/ha)
(cm) /plant (cm)
RU-175 43 32.60 1.90 77 18.20 4.25 1.27RU-9-177 52 49.25 1.70 77 6.90 5.17 0.67RU-9-178 43 39.10 3.20 77 14.40 4.72 1.16RU-9-179 46 28.04 2.90 77 21.10 4.37 1.50RU-9-182 40 37.35 2.00 77 10.90 4.78 0.61RU-9-183 47 45.20 3.40 77 27.10 4.81 1.50TU-40 41 43.50 3.50 80 28.70 4.78 1.72TU-17-14 43 37.58 2.50 80 21.30 4.92 1.26CBG-703 48 44.05 2.60 80 17.50 5.09 1.24CBG-647 41 45.10 3.20 76 42.90 5.29 1.04IPU-02-43 43 31.98 3.65 75 26.70 4.57 1.66IPU-94-1 43 33.80 3.00 75 21.30 4.55 1.89NDU-1 48 33.86 3.00 75 32.20 4.32 1.21Pant-31 42 26.90 2.80 75 16.00 4.79 1.04Shecher-3 43 27.10 1.40 75 12.50 4.56 0.79Local check 45 43.58 3.40 75 11.70 4.97 0.79Mean 44 37.44 2.76 77 20.59 4.75 1.21C.D. 3.47 23.26 2.24 0.76 23.78 0.53 0.43SE(m) 1.14 7.65 0.74 0.25 7.82 0.17 0.37C.V. 3.67 28.89 37.68 0.46 53.71 5.19 43.26
Genetic Improvement of Long Duration Rice for Andaman and Nicobar Islands

CARI Annual Report 2009-2010
80
Plate 4. (a) Varietal evaluation of long duration rice and (b) best performing line Jagbandhu
Table 7. Performance rainfed long duration rice cultivars
Lines DF PH Tillers Grains/ Panicle GL GW L:W Harvest yield(cm) /Plant panicle length (cm) (cm) index t/ha
(cm) %
TU-2067 127.67 99.93 7.28 114.67 24.47 8.38 1.94 2.10 39.61 9
MTU-1061 133.33 111.13 6.61 95.53 22.80 8.32 2.04 2.12 19.65 4.07
MTU-1075 127.33 103.67 5.15 206.40 23.07 8.24 1.92 2.64 22.24 4.32
Savitri 130.67 103.13 7.46 120.60 23.20 7.61 2.13 2.06 32.35 3.07
Ramchand 127.33 130.13 6.97 87.07 23.33 9.18 2.17 4.32 26.11 3.56
Jagbandhu 126.67 140.13 4.87 112.13 27.33 7.97 2.13 4.08 29.32 4.49
Pratikshya 115.67 113.80 5.49 138.27 25.47 8.42 1.98 4.29 25.64 3.40
Jaganath 121.33 99.60 9.08 122.13 22.00 7.66 1.94 3.57 29.47 3.77
Mahanadi 121.33 117.60 8.02 129.27 22.80 8.07 2.15 4.22 19.73 3.98
Upahar 127.00 142.53 5.98 61.00 23.87 8.73 2.01 3.74 16.18 4.10
Kanchan 132.67 139.60 6.01 170.73 25.47 7.90 1.89 4.26 27.63 4.03
Prachi 127.67 110.13 8.05 140.53 24.80 8.37 2.10 3.94 37.49 3.98
Swarna(3) 128.00 117.87 4.94 107.00 22.93 8.03 2.12 3.75 27.33 3.80
Utpala 125.33 140.93 6.40 121.40 26.07 8.97 2.64 4.34 30.54 3.47
CARI Dhan-5 115.00 129.40 7.94 154.93 25.07 8.23 2.06 4.17 31.86 4.00
Mean 125.80 119.97 6.68 125.44 24.18 8.27 2.08 3.57 27.68 3.90
CD 3.51 9.71 2.29 22.10 1.81 0.44 0.25 0.26 9.99 0.45
SE (m) 1.71 4.71 1.11 10.74 0.88 0.21 0.12 0.13 5.07 6.42
CV 1.66 4.81 20.41 10.48 4.46 3.15 7.12 4.34 7.74 16.11

CARIAnnual Report 2009-2010
81
Table 8. Lines tolerant to disease and insect pests
Varieties Diseases Insects
Brown BLB BL Sh B Gundhi Stem Leaf BPHSpot Bug borer folder
BPT-5204 1 - - - 1 1 1 -
MTU2067 - - - 1 - - - -
BPT-1768 1 - - - - - 1 -
T-90 1 - - - - - 1 -
MTU1061 - - - - 1 - 1 -
Savitri - - - 1 1 1 1 -
Versha - - - - - - 1 -
Utkal Prabha - - - - 1 1 1 -
PLA1100 - - - - 1 1 1 -
CRI1014 - 1 - 1 - 1 1 -
Moti - - - - 1 1 1 -
Hanseswari - - - - - 1 1 -
Urbashi - - - - 1 1 1 -
Monica - - - - 1 1 1 -
Dharitri - 1 - - 1 1 1 -
Panidhan - - - - - 1 1 -
Shemapuri - 1 - - - 1 1 -
MTU4870 - 1 - - 1 1 1 -
Pratibha - 1 - - - 1 1 -
Tulshi - 1 - 1 1 - 1 -
Shrirag - 1 - - - 1 1 -
CB-07-105 - 1 - 1 1 1 1 -
CB-05-022 - 1 - - 1 1 1 -
Vedagiri - 1 - - - 1 1 -
Tikamma - 1 - - - 1 1 -
BPT-2270 - 1 - - - 1 1 -
Jagbandhu - 1 - - 1 1 1 -
Indravati - 1 - - 1 1 1 -
Rolagullu kull - 1 - - - 1 1 -

CARI Annual Report 2009-2010
82
Yield loss due to Gundhi bug incidence indifferent maturity group rice cultivars
An experiment was conducted to study theyield loss due to Gundhi bug incidence in 103lines of rice of different maturity groupsunder rainfed low land condition. Themaximum Gundhi bug incidence wasrecorded in late maturing lines followed bymedium duration, but it was very low in veryearly, early and medium early lines (Fig 1).The data reveals that there was 44-49% yieldreduction in medium and late duration linesas compared to early and medium early.Therefore, present findings suggest that earlyand medium early duration varieties couldmaximize the rice yield.
Very early rice line (ANR-1) ready for
AICRIP trials
A very early line ANR-1 suitable for earlytransplanting under rainfed condition of
coastal areas has been developed by selectionfrom IRRI germplasm. It is short stature 90-
100 cm, effective tiller per plant 7 to 8, paniclelength 25 cm and matures in 90-100 days.Grains are medium bold and gives 4.0 to 4.5
t/ha yield. It is tolerant to sheath blight, leaffolder, brown spot, BLB and lodging (Plate 5).
Plate 5. Field view of rice line ANR- 1
Fig.1. Yield loss due to Gundhi bug incidence in different maturity group rice cultivars

CARIAnnual Report 2009-2010
83
T.V.R.S. Sharma, Asit B. Mandal, R.C.Srivastava and P.K. Singh
Institute released five rice varieties throughState Seed Sub Committee for Andaman andNicober Islands. Out of these, two varietieswere specially developed for coastal salinityconditions and other three for normal soils.The saline tolerant lines were developedthrough somoclonal variation, created fromcultivar Pokkali of Kerala. Other three wereselections from INGER trials of IRRI and theirtesting for decade. All these selections are
tolerant to sheath blight, BLB, leaf spot, stem
borer and lodging which are common biotic
and abiotic stress of the Islands (Table 9 &Plate
6 a - d).
Bacterial wilt resistant brinjal variety
(CARI Brinjal 1)
A bacterial wilt resistant line ‘CARI Brinjal
1’ developed by CARI have been sent to
Brinjal Bacterial Wilt IET Trials under All
India Coordinated Research Project-
Vegetable 2009 (Table 10 and Plate 7 a, b).
Table 9. Important Characters of Released Rice Varieties
Name Parentage Days Plant Panicle Yield
of height length
maturity (cm) (cm) (t/ha.)
C.A.R.I Dhan-1 Selection from IRRI germplasm 120 114 24 4.5
C.A.R.I Dhan-2 Selection from IRRI germplasm 121 120 25 5 to 5.5
C.A.R.I Dhan-3 Selection from IRRI germplasm 120 115 25 5.1 to 5.5
C.A.R.I Dhan-4* Somoclonal selection from Pokkali 123 120 25 3.1 to 3.3
C.A.R.I Dhan-5* Somoclonal selection from Pokkali 150 123 24 4.4 to 4.7
Rice Varieties Release by CARI
Plate 6. (a) CARI Dhan-1, (b) CARI Dhan-2,

CARI Annual Report 2009-2010
84
(c) CARI Dhan-3 and (d) CARI Dhan-5
Plate 7 a. Bacterial wilt resistant line CARIBrinjal 1
Plate 7 b. Field visit by Project CoordinatorAICRP Vegetable
Islands and two samples were collected frommainland (Table 11). DNA was isolated fromfresh young leaves by CTAB method. PCRamplification has been done with 20 RAPD(Table 12) and 30 ISSR primers (Table.13).PCR products were resolved on 1% agarosegel (Plate 8 & 9). The 0/1 matrix was usedto calculate similarity as Jaccard coefficient
Table 10. Ancillary observations of bacterial wilt resistant brinjal line ‘CARI Brinjal 1’
Variety Plant Days Fruits Average Yield Fruit Fruit Score Fruitheight to first /plant fruit t/ha colour shape Bacterial and(cm) flowering weight(g) wilt shoot
borer
CARI Brinjal 1 75 70 5-7 170 20-25 Green Oblong 1 3
Israr Ahmad, TVRS Sharma, KrishnaKumar, S. Bhagat and D.R. Singh
Molecular characterization of importantunderutilized wild fruit crops (Syzygiumclaviflorum) of A & N Islands
Twenty one different samples of wild Jamunwere collected from Andaman and Nicobar
Molecular Characterization of Economically Important Flora and Microbes ofAndaman and Nicobar Islands

CARIAnnual Report 2009-2010
85
using SIMQUAL subroutine in similarityroutine. The resultant similarity matrix wasemployed to construct dendrogram UPGMAto infer genetic relationship. The dendrogramcould differentiate all the samples of wildjamun at 67 % similarity with RAPD primersand 44 % similarity with ISSR primers.Dendrogram could be divided into five majorclusters (Fig 2). Cluster one contains samplesWJ 1, WJ 2, WJ 3, WJ 4, WJ 5, WJ 8, WJ 9, WJ10 and WJ 11 at 87 % similarity. Cluster twocontains samples WJ 7, WJ 12, WJ 13 and WJ14 at 83 % similarity. Cluster three containssamples WJ 16, WJ 17, WJ 18, WJ 19, WJ 20and WJ 21 at 81 % similarity. Cluster fourcontains samples WJ 22 and WJ 23 at 73 %similarity. Cluster five contains samples WJ6 and WJ 15 at 67 % similarity. Dendrogramcould be divided into five clusters (Fig. 3).Cluster one contains samples of WJ 1, WJ 4,WJ 11 and WJ 14 at 81 % similarity. Cluster
two contains samples WJ 2, WJ 3, WJ 5, WJ6, WJ 7, WJ 8, WJ 9 and WJ 10 at 78 %similarity. Cluster three contains samples ofWJ 16, WJ 12 and WJ 13 at 76 % similarity.Cluster four contains samples of WJ 21, WJ18, WJ 17 and WJ 19 at 70 % similarity.Cluster five contains samples of WJ 15, WJ20, WJ 22 and WJ 23 at 44 % similarity.
Molecular characterization of PlantGrowth promoting Bacillus sp.
Soil sample were collected from rhizospheresoil of banana grown at Bloomsdale farm ofCARI. Bacteria were isolated from soilsample by serial dilution. Based on themorphological and biochemicalcharacterization for plant growth promotion23 isolates were grown in nutrient broth at25o C for 24 hours and total genomic DNAwas extracted. Primers PA(5’AGAGTTTGATCCTGGCTCAG3’) and PH
Table 11. Wild Jamun samples collected from A & N Islands and Bangalore
Sample code Location Sample code Location
WJ 1 Gandhi park WJ 13 Chauldari farm
WJ 2 Police line WJ 14 Havelock
WJ 3 VKV School WJ 15 Car Nicobar
WJ 4 Dollygunj WJ 16 Bambooflat
WJ 5 Chauldari basti WJ 17 Mount harriet
WJ 6 Portmoot WJ 18 Chidiyatapu
WJ 7 CARI Mandir WJ 19 Wandoor
WJ 8 Ferrargunj WJ 20 Manpur
WJ 9 CARI field WJ 21 Maccapahad
WJ 10 CARI Lab WJ 22 GKVK, Bangalore
WJ 11 Carbinscove WJ 23 National Park, Bangalore
WJ 12 Tusnabad

CARI Annual Report 2009-2010
86
Table 13. ISSR Primer used for DNAamplification
ISSR Sequence (5’-3’) Tm o CPrimerNo.
7 AGAGAGAGAGAGAGAGT 48.98 AGAGAGAGAGAGAGAGC 51.39 AGAGAGAGAGAGAGAGG 51.310 GAGAGAGAGAGAGAGAT 49.811 GAGAGAGAGAGAGAGAC 51.312 GAGAGAGAGAGAGAGAA 48.913 CTCTCTCTCTCTCTCTT 48.918 CACACACACACACACAG 51.320 GTGTGTGTGTGTGTGTC 51.322 TCTCTCTCTCTCTCTCA 48.923 TCTCTCTCTCTCTCTCC 51.324 TCTCTCTCTCTCTCTCG 51.325 ACACACACACACACACT 49.828 TGTGTGTGTGTGTGTGA 49.8
Plate 8. PCR profile of wild jamun using RAPD Primer OPA 5
Plate 9. PCR profile of wild jamun using ISSR Primer 13
Table 12. RAPD Primers used for DNA amplification
Primer Sequence (5-3) % GC
OPA2 TGCCGAGCTG 70
OPA4 AATCGGGCTG 60
OPA5 AGGGGTCTTG 60
OPA7 GAAACGGGTG 60
OPA9 GGGTAACGCC 70
OPE1 CCCAAGGTCC 70
OPE2 GGTGCGGGAA 70
OPF 1 ACGGATCCTG 60
OPF2 GAGGATCCCT 60
OPF3 CCTGATCACC 60
OPF5 CCGAATTCCC 60
OPX3 TGGCGCAGTG 70

CARIAnnual Report 2009-2010
87
Fig. 3. Dendrogram constructed for 23 samples of wild jamun by ISSR primers
Fig. 2. Dendrogram constructed for 23 samples of wild jamun by RAPD primers

CARI Annual Report 2009-2010
88
(5’AAGGAGGTGATCCAGCCGCA3’) wereused to amplify a fragment of 16s rRNA gene.1.5 kb PCR amplified product from all the 23isolates were subjected to restriction digestionby 7 different restriction endonuclease (RE)(Msp I, Hae-III, Hinf-1, EcoR1, Hind-III, Taq-I,Sau-3A) and resolved on 1% agarose gel(Plate 10). All the genotypes were scored forpresence and absence of the RFLP bands andthe data were entered into a binary matrixas discrete variables. The 0/1 matrix wasused to calculate similarity as Jaccardcoefficient. The resultant similarity matrixwas employed to construct dendrogram
using UPGMA to infer genetic relationship.
Dendrogram showed that at 18 % similarityall the isolates are randomly distributed (Fig.4). Dendrogram can be clearly divided intofour different clusters. Cluster one containsisolates B 1, B 3, B 4, B 5 and B 7 at 43 %similarity. Cluster two contains isolates B 2,B 8, B 9, B 19, B 20, and B 22 at 34 %similarity. Cluster three contains isolates ofB 10, B 11, B 15 at 48 % similarity. Clusterfour contains isolates B 12, B 13, B 14, B 6,and B 16 at 18 % similarity. Sequensing andBLAST analysis of 16s rDNA sequencesrevealed the presence of three species ofBaciillus (B. pumilus, B. megaterium, B. subtilis)and one species of Panibacillus.
Palte 10. Restriction pattern of 16srDNA after digestion with Msp-I. M is marker DNA.
Fig. 4. Dendrogram constructed for 23 bacterial isolates based on the PCR-RFLP profiles of 16srDNA regions.

CARIAnnual Report 2009-2010
89
Molecular characterization of plant growth
promoting Pseudomonas sp.
Bacteria were isolated from rhizosphere soil
of rice rhizosphere collected from
Bloomsdales farm of CARI. Based on the
morphological and biochemical
characterization for plant growth promotion,
20 isolates were grown in nutrient broth at
25o C for 24 hours and total genomic DNA was
extracted. Primers PA
(5’AGAGTTTGATCCTGGCTCAG3’) and PH
(5’AAGGAGGTGATCCAGCCGCA3’) were
used to amplify a fragment of 16s rRNA gene.
1.5 kb PCR product from all the 20 isolates
were subjected to restriction digestion by 4
different restriction endonuclease (Msp I,
Hae-III,, EcoR1 and Hind-III) and resolved
over 1 % agarose gel (Plate 11). All the
genotypes were scored for presence and
absence of the RFLP bands and data were
entered into a binary matrix as discrete
variables. The 0/1 matrix was used to
calculate similarity as Jaccard coefficient. The
resultant similarity matrix was employed to
construct dendrogram using UPGMA to infer
genetic relationship. Dendrogram (Fig. 5)
showed that at 59 % similarity all the isolates
are randomly distributed and could be divided
into 5 different clusters. The dendrogram could
be divided into five different clusters with
similarity ranging from 59 % to 82 %. Cluster
one contains isolates HMI 1, HMI 18, HMI 20,
HMI 22, HMI 25 and HMI 26 at 67 % similarity.
Cluster two contains isolates HMI 10, HMI 13,
HMI 24 and HMI 27 at 70 % similarity. Cluster
three contains isolates HMI 2, HMI 4, HMI 5,
HMI 6, HMI 14, and HMI 16 at 66.5 %
similarity. Cluster four contain single isolate
of HMI 19. Cluster five contains isolates HMI
7, HMI 17 and HMI 21 at 66.5 % similarity.
16s rDNA sequensing and BLAST result
showed that most of these isolates were from
Pseudomonas putida, Pseudomonas strutzi and
Pseudomonas montelli.
Plate 11. Restriction pattern of 16srDNA after digestion with Hinf-I. M is marker DNA

CARI Annual Report 2009-2010
90
Fig. 5. Dendrogram constructed for 20 bacterial isolates based on the PCR-RFLP profiles of 16s rDNA regions
Molecular characterization ofTrichoderma sp.
Fifteen isolates of Trichoderma available inculture collection were assessed for diversityby PCR-RFLP. Trichoderma isolates weregrown in Potato Dextrose Broth (PDB) for 5days and total genomic DNA was extractedby SDS method. Primer ITS1 (5’-TCCGTAGGTGAACCTGCGG-3’) and ITS4(5’- TCCTCCGCTTATTGATATGC -3’) wereused to amplify a fragment of rRNA gene.600 bp PCR amplified fragment from all the15 isolates were subjected to restrictiondigestion by 3 different restrictionendonuclease (RE) (Eco R1, Hinf II and Hae
III,) These digestion mixture were resolvedover 1 % Agarose gel (Plate 12.). All thegenotypes were scored for presence and
absence of the RFLP bands and the data wereentered into a binary matrix as discretevariables. The 0/1 matrix was used tocalculate similarity as Jaccard coefficient. Theresultant similarity matrix was employed toconstruct dendrogram using UPGMA toinfer genetic relationship. Dendrogramshowed that at 14 % similarity all theTrichoderma isolates are randomly distributed(Fig. 6.). Dendrogram can be clearly dividedinto three different clusters. Cluster onecontains isolates F1, F2, F3, F4, F5 and B6 at34 % similarity. Cluster two contains isolatesF7, F8, F9, F10, and F11 at 32 % similarity.Cluster three contains isolates of F12, F13,F14 and F15 at 35 % similarity. Sequensingand BLAST result showed that most of theseisolates were from Hypocrea lixii,Trichoderma ovalisporum, Trichoderma virideand Trichoderma harzianum.

CARIAnnual Report 2009-2010
91
Plate 12. Restriction pattern of rDNA after digestion with Hae-III.
Fig. 6. Dendrogram constructed for 15 isolates of Trichoderma based on PCR-RFLP.

CARI Annual Report 2009-2010
92
Krishna Kumar and M. Balakrishnan
Field trials were conducted at GaracharmaFarm to study the role of weather variableson development of tomato and chillidiseases. The trials were conducted inrandomized block design with threereplications. Sowing was done at fifteen daysinterval starting from 25th January, 10th
February, 25th February and 10th March.Weather parameters were recorded fromAutomatic Weather Station of CARI forMaximum and minimum temperatures,minimum and maximum relative humidity(RH), rainfall and number of rainy days.Correlation and Multiple regression analysis
were done to determine the role of weathervariables with disease. The data of weatherparameters and wilt incidence was analyzedby multiple regression formulate equation.Regression Co-efficient value (R2) of Max RHwas positive and found significant in case oftomato wilt at Feb 10th and Mar 10th plantedcrops of both varieties (S-22 & Pusa Ruby) oftomato as well as chilly (K2). In the case ofchilly leaf curl- 3 factors viz., Max and Min.tem & Rainy day (RD) was significant at Jan.25th, Feb. 25th & Mar. 10th. In Feb. 25th & Mar.10th the regression co-efficient value of Maxtemp. & RD for Mar. 10th in the case of Jan.25th Min. temp. was found significant.
Someshwar Bhagat, Ajanta Birah, KrishnaKumar, M. Sankaran and Israr Ahmad
Evaluation of Trichoderma spp. againstP. capsici and C. capsici
Fourteen isolates of Trichoderma isolates wereevaluated against P. capsici and C. capsicicausing foot rot and anthracnose disease inBlack Pepper by dual culture test andproduction of non-volatile antibiotics. Theresults revealed that all isolates ofTrichoderma significantly inhibited the radialmycelial growth of both pathogens ascompared to control. Highest percentinhibition of P. capsici was recorded with Tv-CARI-27 (60.7%) followed by Th-CARI-37,
Tv-CARI-21, Tv-CARI-32 and the isolate Th-
CARI-31 was least effective with only 46.3%
growth inhibition. Similarly, Highest percent
inhibition of C. capsici was noted with Tv-
CARI-27 followed by Th-CARI-37, Th-
CARI-31, Tv-CARI-31, Tv-CARI-28, Tv-
CARI-32 and the isolates Tv-CARI-21 and
Th-CARI-35 were recorded with lowest
percent inhibition (53.1%) of C. capsici.
The scanning results indicated that the
pathogens viz., P. capsici and C. capsici were
significantly inhibited by all Trichoderma
isolates by production of non-volatile
Assessment of crop losses and epidemiology of major vegetable diseases ofSouth Andaman
Integrated Disease and Pest Management of Black Pepper in Andaman andNicobar Islands

CARIAnnual Report 2009-2010
93
inhibitors at 5 and 10% concentrations.Among the antagonists, Tv-CARI-26 wasmost effective in suppression of mycelialgrowth of P. capsici followed by Tv-CARI-27,Tv-CARI-28, Th-CARI-40 and Th-CARI-33was noted with lowest percent inhibition. Incase of C. capsici, highest (63.1 and 73.8 %)growth inhibition was recorded with Tv-CARI-33 by production of non-volatileinhibitors at 5 and 10 % concentrations. Theother promising isolates were Th-CARI-37,Th-CARI-31, Tv-CARI-27, Th-CARI-40 andTv-CARI-31 in their ability to suppress themycelial growth of C. capsici.
Evaluation of fungicides against P. capsiciand C. capsici
For evaluation of fungicides against P. capsiciand C. capsici, poison food technique wasused. Nine fungicides, viz., Saaf, Copperoxychloride, Mancozeb, and Krilaxyl Goldwere evaluated at five differentconcentrations as per their rate of application.The concentrations of 10 ppm, 15 ppm, 20ppm, 25 ppm and 30 ppm ( Bavistin andSaaf), 50 ppm, 75 ppm, 100 ppm125 ppmand 150 ppm (Mancozeb and Krilaxyl Gold)was added into the melted PDA medium justbefore plating into the petri plate. Mycelialplug (5 mm) of both pathogen wasinoculated in the centre of fungitoxicatedPDA medium, incubated for 7 days at 28 ±1ºC. All fungicides significantly inhibitedboth pathogens except Bavistin which wasnot effective against P. capsici. Among thefungicides Bavistin, Saaf and Krilaxyl Goldwere more effective against C. capsici than
P. capsici whereas Mancozeb and COC weremore effective in percent inhibition of P.capsici with lowest LC50 value. Furthermore,the mixture of Metalaxyl + Mancozeb(Krilaxyl), Carbendazim + Mancozeb (Saaf)and COC were found more effective insuppression of growth of both pathogen C.capsici and P. capsici than the Carbendazim(Bavistin) and Mancozeb alone. So, thesefungicides can be suitably included inintegrated disease management modules foreffective management of both foot rot andanthracnose diseases in Black pepper.
Evaluation of botanicals against C. capsiciand P. capsici
Three botanicals namely, Neem oil, Nranj oiland extract of Burma dhania were evaluatedagainst C. capsici and P. capsici. The threedifferent concentrations, i.e. 1%, 2% and 3%were used for Neem and Kranj oil andaqueous extracts of extract of Burma dhania(methanol extract). For achieving requiredconcentration of botanicals, required volumeof liquid was added to melted PDA mediumjust before plating into the petri plate. Theresult revealed that all botanicals have theability to suppress the test pathogens (Fig.7).The percent inhibition of pathogens wasincreased with increase in theirconcentrations. The P. capsici was moreinhibited than C. capsici regardless ofbotanicals tested. Highest percent inhibitionof P capsici and C. capsici was recorded withneem oil at 3% followed by Kranj oil andextracts of Burma dhania. The methanolextract of Burma dhania was also found

CARI Annual Report 2009-2010
94
effective in suppression both pathogens.These three botanical can be used foreffective disease management of C. capsiciand P. capsici in Black Pepper but its
efficacy needs to be validated under in vivoand field condition they may loose theirefficacy in the presence of rainfall andsunshine.
Compatibility of Trichoderma spp. withsome fungicides
The mechanism of actions of biocontrol fungiand fungicides are different and both areused for disease management. So, if these arecompatible with each other they can beapplied simultaneously based on theirsuitability. Compatibility of biocontrol agent,Trichoderma spp. with some fungicides wereevaluated to develop an integrated diseasemanagement module. Four fungicides, viz.,Blitox, Moximate, Krilaxyl Gold andMancozeb which are most commonly usedfor the control of diseases caused byPhytophthora spp. For all fungicides, 50 ppm,100 ppm and 200 ppm concentrations wereadded to the melted PDA medium just before
Series 1 - 1%, series 2 - 2% and series 3 - 3% in case of neem and Kranj oil; Series 1 - Methanol extract,series 2 - Ethanol extract and series 3 - Aqous extract in case of Burma dhania extract.
plating into the Petri plate. The mycelial plugof all isolates of Trichoderma were centrallyinoculated and incubated for 7 days at 28 ±1º C. The radial mycelial growth of testantagonists was measured and percentageinhibition of Trichoderma isolates by therespective fungicides was calculated byfollowing formula:
100C
TCI ×−=
Where, I = Per cent inhibition of growth
C = Mycelial growth in control plate
T = Mycelial growth in test plate
The results presented in table 14 revealedthat all isolates of Trichoderma werecompatible at lower concentration i.e.50 ppm
Fig. 7. Effect of botanicals against C. capsici and P. capsici.

CARIAnnual Report 2009-2010
95
and approximately 50 % inhibition ofTrichoderma isolates by Blitox were recodedat highest concentration (200 ppm). Theisolates Th-CARI-37, Tv-CARI-32 and Th-CARI-27 were most compatible with nogrowth inhibition at 50 ppm concentration.These thee isolates of Trichoderma werealso most compatible to Moximate withapprox. 3.0% growth inhibition at 50 ppm(Table 15), however maximum growthinhibition of antagonists was recordedwith Th-CARI-40 (59.3%).
It is evident from the table 16 that all Tricho-derma isolates were compatible at lower con-centrations with very less percent inhibition.Among the isolates, Th-CARI-37, Tv-CARI-32 and Th-CARI-27 consistently performedwell against Krilaxyl Gold with very less per-cent inhibition, whereas the isolate Th-CARI-34 was inhibited upto 60.0% at 200 ppm.
Mancozeb was found compatible with all iso-lates of Trichoderma with maximum growthat lowest concentrations and the isolates Th-CARI-37 and Tv-CARI-32 were found
Table 14. Compatibility of Trichoderma spp. with Blitox
Isolates 200 ppm 100 ppm 50 ppm
Radial % Radial % Radial %mycelial Inhibition mycelial Inhibition mycelial Inhibition
growth (mm)* growth (mm)* growth (mm)*
Th-CARI-34 40.0 55.6 62.0 31.1 77.4 14.0
Th-CARI-31 44.0 51.1 66.0 26.7 82.0 8.9
Th-CARI-37 55.0 38.9 76.6 14.9 90.0 0.0
Th-CARI-33 41.5 53.9 62.8 30.2 78.6 12.7
Tv-CARI-21 43.5 51.7 64.0 28.9 79.1 12.1
Tv-CARI-33 45.5 49.4 67.0 25.6 83.3 7.4
Tv-CARI-27 57.0 36.7 79.0 12.2 88.5 0.0
Tv-CARI-28 48.8 45.8 68.0 24.4 84.0 6.7
Tv-CARI-26 38.2 57.6 60.5 32.8 75.8 15.8
Th-CARI-35 40.2 55.3 64.0 28.9 79.2 12.0
Th-CARI-40 36.6 59.3 59.0 34.4 73.2 18.7
Tv-CARI-31 41.6 53.8 65.4 27.3 80.0 11.1
Th-CARI-39 37.7 58.1 59.9 33.4 77.0 14.4
Tv-CARI-32 58.2 35.3 85.0 5.6 90.0 0.0
Control 90.0 - 90.0 - 90.0 -
SEm 0.7642 - 0.5983 - 0.8221 -
CD (0.05) 1.5426 - 1.2077 - 1.6594 -
*Means of 3 replications

CARI Annual Report 2009-2010
96
*Means of 3 replications
Table 15. Compatibility of Trichoderma spp. with Moximate
Isolates 200 ppm 100 ppm 50 ppmRadial % Radial % Radial %
mycelial Inhibition mycelial Inhibition mycelial Inhibitiongrowth (mm)* growth (mm)* growth (mm)*
Th-CARI-34 47.0 47.8 67.7 24.8 78.0 13.3Th-CARI-31 55.0 38.9 65.0 27.8 75.0 16.7Th-CARI-37 56.0 37.8 75.0 16.7 87.0 3.3Th-CARI-33 49.0 45.6 70.0 22.2 82.0 8.9Tv-CARI-21 44.0 51.1 64.0 28.9 75.0 16.7Tv-CARI-33 43.0 52.2 62.8 30.2 73.0 18.9Tv-CARI-27 55.0 38.9 75.6 16.0 86.6 3.8Tv-CARI-28 42.0 53.3 63.0 30.0 74.0 17.8Tv-CARI-26 40.0 55.6 61.5 31.7 72.0 20.0Th-CARI-35 45.0 50.0 68.0 24.4 77.5 13.9Th-CARI-40 47.0 47.8 70.0 22.2 81.0 10.0Tv-CARI-31 40.0 55.6 64.4 28.4 75.0 16.7Th-CARI-39 38.0 57.6 60.0 33.3 71.0 21.1Tv-CARI-32 54.0 40.0 76.0 15.6 87.0 3.3Control 90.0 - 90.0 - 90.0 -SEm 0.8165 - 0.8190 0.7824 -CD (0.05) 1.6481 - 1.6532 1.5793 -
Table 16. Compatibility of Trichoderma spp. with Krilaxyl Gold
Isolates 200 ppm 100 ppm 50 ppm
Radial % Radial % Radial %mycelial Inhibition mycelial Inhibition mycelial Inhibition
growth (mm)* growth (mm)* growth (mm)*Th-CARI-34 36.0 60.0 64.4 28.4 75.0 16.7Th-CARI-31 38.0 57.8 57.0 36.7 78.0 13.3Th-CARI-37 50.0 44.4 75.2 16.4 86.0 4.4Th-CARI-33 38.0 57.8 58.0 35.6 70.4 21.8Tv-CARI-21 49.0 45.6 71.0 21.1 83.0 7.8Tv-CARI-33 47.0 47.8 66.0 26.7 78.0 13.3Tv-CARI-27 50.0 44.4 74.0 17.8 86.5 3.9Tv-CARI-28 45.0 50.0 64.4 28.4 73.0 18.9Tv-CARI-26 42.2 53.1 61.0 32.2 72.0 20.0Th-CARI-35 41.0 54.4 59.0 34.4 70.0 22.2Th-CARI-40 38.0 57.8 58.2 35.3 67.8 24.7Tv-CARI-31 40.0 55.6 60.5 32.8 72.0 20.0Th-CARI-39 39.0 56.7 58.0 35.6 68.0 24.4Tv-CARI-32 52.0 42.2 76.0 15.6 86.0 4.4Control 90.0 - 90.0 - 90.0 -SEm 0.8499 - 0.8002 - 0.7964 -CD (0.05) 1.7156 - 1.6152 - 1.6076 -
*Means of 3 replications

CARIAnnual Report 2009-2010
97
100.0% growth at 50 ppm concentration(Table 17). The isolates Th-CARI-37 and Tv-CARI-32 were recorded with most compat-ible with Mancozeb whereas the isolate Th-
CARI-35 was noted with least compatible
with 55.6% growth inhibition. The other iso-
lates of Trichoderma were found with inter-mediate effect. Thus these four fungicidesare very much suited to integrate withbiocontrol fungus Trichoderma spp. for the
management of foot rot and anthracnose
disease in Black Pepper.
Green house evaluation of Trichodermaspp against Foot rot of Black Pepper
The efficacy of Trichoderma isolates wereevaluated against foot rot of Black Pepperunder green house condition. The ten bestisolates of Trichoderma were mass multipliedin PDB medium for 15 days, grinded andmixed under cyclomixer and mixed withtalc powder in 1:2 ratio so that finalconcentration of Trichoderma propagules
ascertained at 1010 cfu/g of powder. Theformulated product was mixed well rottenfarm yard manure and neem cake (1:100:10)and incubated for 21 days under shade andassured moisture at near to field capacity.Thus the Trichoderma enriched FYM wasobtained and mixed with the potting mixturewhere black pepper cuttings supposed toplanted. The cuttings of Black Pepper weredipped into the suspension of Trichoderma
Table 17. Compatibility of Trichoderma spp. with Mancozeb
Isolates 200 ppm 100 ppm 50 ppm
Radial % Radial % Radial %mycelial Inhibition mycelial Inhibition mycelial Inhibition
growth (mm) growth (mm) growth (mm)
Th-CARI-34 52.0 42.2 74.4 17.3 84.0 6.7Th-CARI-31 52.2 42.0 70.0 22.2 80.0 11.1Th-CARI-37 58.6 34.9 83.5 7.2 90.0 0.0Th-CARI-33 51.2 43.1 73.0 18.9 82.0 8.9Tv-CARI-21 54.0 40.0 74.4 17.3 83.0 7.8Tv-CARI-33 47.7 47.0 67.0 25.6 78.0 13.3Tv-CARI-27 47.0 47.8 66.2 26.4 76.0 15.6Tv-CARI-28 45.0 50.0 65.0 27.8 75.0 16.7Tv-CARI-26 43.0 52.2 64.6 28.2 75.0 16.7Th-CARI-35 40.0 55.6 59.2 34.2 70.0 22.2Th-CARI-40 46.0 48.9 70.0 22.2 80.0 11.1Tv-CARI-31 48.0 46.7 75.0 16.7 84.0 6.7Th-CARI-39 52.0 42.2 71.0 21.1 82.0 8.9Tv-CARI-32 59.0 34.4 84.4 6.2 90.0 0.0Control 90.0 - 90.0 - 90.0 -SEm 0.8487 - 0.8641 - 0.8165 -CD (0.05) 1.7132 - 1.7442 - 1.6481 -
*Means of 3 replications

CARI Annual Report 2009-2010
98
(1010 cfu/g) for 1 hr and planted into theearthen pot. The moisture holding capacityof soil was maintained at nearly fieldcapacity by adding irrigation water as perrequirement. The inoculum load (104cfu/ml)of P. capsici was added to the soil mixture justbefore planting of Black Pepper cuttings. Theappearance of foot rot disease was observedand recorded at 15 days intervals upto 90days. The percent reduction in disease (footrot) due to Trichoderma application wascalculated by subtracting the diseaseincidence (treated pot) from control pot anddivided by disease incidence in control potand expressed as percent.
All isolates of Trichoderma significantlyreduced the disease incidence in Black Pepperseedlings as compare to control. But theisolate Th-CARI-33 was most effective with63.9% reduction in disease incidence,followed by Tv-CARI-32, Tv-CARI-14, Tv-CARI-16 and the isolate Th-CARI-27 wasnoted with least reduction in diseaseincidence of foot rot (42.6%). Thus the nativebiocontrol agent, Trichoderma spp. cansuitably used for successful management offoot rot disease in the Bay Islands and theycan also be integrated with different IDMmodules for the management of diseases inBlack Pepper.
Green house evaluation of fungicidesagainst Foot rot of Black Pepper
Three fungicides, Copper oxychloride (soildrenching + foliar spray), Mancozeb (soildrenching + foliar spray), Metalaxyl R (foliar
spray) and Bordeux mixture (soil drenching
+ foliar spray) were evaluated against foot
rot of Black Pepper under green house
condition. The soil drenching and spray of
Bordeux mixture at 15 days interval was
found very effective in suppression of foot
rot of Black pepper with 96.0% reduction
in disease incidence, followed by Copper
oxychloride (88.8%), Mancozeb (75.6%)
and least control of foot rot was recorded
with Metalaxyl R (72.5%).
IPM module for Pollu Beetle
Pollu Beetle is a major pest of Black pepper
causing considerable loss in berry yield.
Presence of numerous small holes on the
surface of the tender leaves is a characteristic
early symptom of the occurrence of the pest
population in the plantation. Female beetles
lay eggs on tender berries. The eggs hatch in
3-8 days into minute creamy-white grubs.
The grubs bore into the berries and feed on
the internal contents and make them hollow.
Infested berries turn pale yellow initially and
later, black, and crumble when pressed by
hand. The feeding activity of beetles results
in the formation of black sunken patches on
the tender shoots and spikes and small
irregular circular holes on the surface of the
tender leaves. With the onset of monsoon
showers, they resume their normal feeding
and breeding activities. The pest infestation
is higher in the plantation during
September-October and is very severe in
shaded areas of the plantation (Table 18).

CARIAnnual Report 2009-2010
99
The results presented in (Table 19) revealedthat all the treatments have significantlyreduced berry damage in 1st to 3rd picking ofberries of Black Pepper as compare tountreated check. However, lowest percentberry damage was recorded in T2 treatment(3.13%) followed by T1 (8.58%) and T3
(14.78%). The maximum increase in yield(222.29%) was also noted with integrated
module (T2), followed by bio-intensive(80.70%) and farmer practice (29.22%). Theintegration of Neem cake as soil applicationand alternate foliar spray of Neembaan andQuinalphos is helpful in reducing breedingefficiency as well as direct killing of adultbeetle in the foliar region and therebypopulation of pollu beetle reduced beloweconomic threshold level.
*Mix sticker @0.5ml/lt during the foliar spray
Table 18. Details of IMP module for Pollu Beetle
Modules Integrated pest management practice
Biointensive module Pruning of branches of the treesNeem cake application @ 250g/vine Foliarspray of 0.5 per cent neem formulation (Neembaan) from July onwards at 21days interval
Integrated module Pruning of branches of the treesNeem cake application @ 250g/vine Alternatefoliar spray of 0.5 per cent neem formulation (Neembaan) and 0.5 per centQuinalphos from July onwards at 21 days interval
Farmers practice Foliar spray of 0.2 per cent Cypermethrin or Deltamethrin
Check Control
Table 19. Evaluation of pest management modules against Pollu beetle Longitarsusnigripennis M.
Modules Picking wise berry damage (%) Yield % increase in
1st 2nd 3rd Mean (kg/ha) yield over control
T1(Biointensive) 9.67 7.33 8.76 8.58 385.50 80.70
(18.05) (15.68) (17.16) (16.95)
T2(Integrated) 5.12 2.40 1.89 3.13 687.56 222.29
(13.05) (8.91) (7.71) (10.14)
T3 (Farmer Practice) 14.56 13.45 16.33 14.78 275.67 29.22
(22.38) (21.47) (23.81) (22.55)
T4(Check) 16.72 14.54 17.33 16.19 213.33 —
(24.12) (22.38) (24.58) (23.66)
SEm 0.60 0.20 0.39 0.50 4.35
CD (P=0.05) 1.36 0.46 0.89 1.15 9.84
CV(%) 7.50 3.10 5.03 6.75 1.58
Figures in parentheses are arcsin transformed values

CARI Annual Report 2009-2010
100
indirect control of foliar diseases by their
growth promoting activities, rhizosphere
colonization and induced resistance in host
plants. The inclusion of neem cake in this
module as soil application was due to its
antimicrobial activities and supports the
growth and development of bio-control
agents when it is applied along with well
rotten FYM. The details of treatment
schedules are as follows (Table 20).
The results presented in Table 21 revealedthat all the treatments have significantly re-duced percent reduction of disease inci-dences in tomato as compared to untreatedcontrol. But T10 treatment was most effec-tive in reduction of disease incidences in to-
mato except bacterial wilt followed by T11,
T12, T11 and T9. Treatment T10 was also re-corded with highest yield (275.5 Q/ha) andT3 was least effective in percent reduction ofdisease incidence of all diseases and lowestyield (165 Q/ha).The results suggested that
Table 20. Treatment schedules
T1 Seed treatment with Tv-CARI-3 @10 g/Kg of seedT2 Seed treatment with Th-CARI-5 @10 g/Kg of seedT3 Seed treatment with Tv-CARI-5 @10 g/Kg of seedT4 Seed treatment with Psf-CARI-1@10 g/Kg of seedT5 T1 + Seedling dip with Tv-CARI-3 @10 g/L of water + Soil application of Tv-CARI-3 enriched
FYM and neem cake (1:100:10 ratio)@ 5.0 Kg/m2
T6 T2 + Seedling dip with Th-CARI-5 @10 g/L of + Soil application of Th-CARI-5 enriched FYMand neem cake (1:100:10 ratio)@ 5.0 Kg/m2
T7 T3 + Seedling dip with Tv-CARI-5 @10 g/L of water + Soil application of Tv-CARI-5 enrichedFYM and neem cake (1:100:10 ratio)@ 5.0 Kg/m2
T8 T4 + Seedling dip with Psf-CARI-1 @10 g/L of water + Soil application of Psf-CARI-1 enrichedFYM and neem cake (1:100:10 ratio)@ 5.0 Kg/m2
T9 T5 + Two sprays of neem oil (2%)T10 T6 + Two sprays of neem oil (2%)T11 T7 + Two sprays of neem oil (2%)T12 T8 + Two sprays of neem oil (2%)T13 Control
Someshwar Bhagat and Krishna Kumar
This project aimed to develop integrateddisease management modules for tomatounder Island ecosystem of Bay Islands.
Module-I: Combination of bioagents, neemcake and neem seed oil
The basic idea behind the IDM module I, isthe exploitation of some promising biocontrolagents which have already been proved tocontrol many soil borne diseases directly and
Development of IDM modules for Tomato

CARIAnnual Report 2009-2010
101
the combination of seed treatment + seed-ling dip + soil application of biocontrol agentswere more effective than seed or seedling orsoil treatment alone with respect to their
ability to reduce the disease incidence. So,these biocontrol agents can suitably incor-porated into any IDM modules for the man-agement of disease complex of tomato.
Module-II: Integration of biocontrol agentsand fungicides
Use of chemical pesticides is the mostcommon practice for the management ofplant diseases. But indiscriminate use ofchemical pesticides are not only causingpollution to the soil and water ecosystem butalso leading to development of resistanceamong various pathogens against chemicalpesticides. The rationale behind the IDMmodule-II is to challenge the plant pathogenswith relatively low dose of test fungicides,which weaken the strength of pathogen andsubsequent application of biocontrol agents
will facilitate rapid colonization thesebioagents in the rhizosphere region of rootsand thereby direct killing of pathogens bylysis or competition for nutrient and space(Table 22).
It is evident from Table 23 that Carbendazimand Krilaxyl Gold were not effective againstboth bacterial wilt and leaf curl of tomato.But all three fungicides were very effectiveagainst basal stem rot and fusarial wilt. Theintegration of bioagents with thesefungicides improved their efficacy in percentreduction of disease incidences andcorresponding increased yield in tomato. T7
Table 21. Evaluation of bioagents and neem products against disease complex of tomato
Treatments % Reduction of disease incidence Yield % increase
Bacterial wilt Leaf curl Basal stem rot Fusarial wilt (q/ha) in yield
T1 16.4 f 21.9 f 15.8 e 24.2 e 195.0 g 30.0T2 22.5 e 25.1 d 19.8 d 29.2 d 200.0 e 33.3T3 14.6 f 19.9 f 13.4 ef 22.0 f 192.0 h 28.0T4 20.0 e 20.5 f 14.0 ef 22.5 f 189.0 i 26.0T5 48.1 c 22.5 e 54.2 b 65.2 b 202.5 f 35.0T6 55.5 b 26.0 d 59.6 a 75.0 a 213.9 d 42.6T7 45.2 d 20.3 f 52.0 bc 63.4 bc 206.5 e 37.7T8 58.0 a 20.8 f 50.0 c 65.0 b 200.0 f 33.3T9 46.0 d 51.0 b 52.9 bc 64.0 b 220.0 c 46.7T10 56.0 b 58.5 a 60.8 a 75.8 a 227.5 a 51.7T11 55.0 b 54.5 b 55.0 b 66.0 b 221.8 b 47.9T12 58.2 a 50.0 c 51.0 c 61.7 c 216.0 b 44.0T13 0.0 0.0 0.0 0.0 150.0j -
The letter indicating same letter was significantly not differed as per DMRT test (0.05%)

CARI Annual Report 2009-2010
102
treatment i.e. Seed treatment + Seedling dipwith COC + Soil application of Th-CARI-5along with FYM and neem cake (5.0 Kg/m2)+ Two sprays of neem oil (2 %), wasrecorded with highest percent reduction in
incidence of all diseases (86.0% bacterialwilt, 56.2% leaf curl, 76.4% basal stem rotand 74.8% fusarial wilt) and increase in yield(106.7%) followed by T1, T9, T8, T13, T4 andthe treatment T2 was recorded least effective
Table 22. Treatment schedules
T1 : Seed treatment + Seedling dip + Soil drenching with Copper oxychloride @ 2 g/Kg ofseed and 2 g/L of water
T2 : Seed treatment + Seedling dip + Soil drenching with Carbendazim @ 2 g/Kg of seedand 2 g/L of water
T3 : Seed treatment + Seedling dip + Soil drenching with Krilaxyl @2 g/Kg of seed and 2g/L of water
T4 : Seed treatment + Seedling dip with Th-CARI-5 @10 g/L of water for half an hour +Soil application of Th-CARI-5 along with FYM and neem cake (5.0 Kg/m2)
T5 : Seed treatment + Seedling dip with Tv-CARI-3 @10 g/L of water for half an hour +Soil application of Tv-CARI-3 along with FYM and neem cake (5.0 Kg/m2)
T6 : Seed treatment + Seedling dip with Psf-1 @10 g/L of water for half an hour + Soilapplication of Psf-CARI-1 along with FYM and neem cake (5.0 Kg/m2)
T7 : Seed treatment + Seedling dip with COC + Soil application of Th-CARI-5 along withFYM and neem cake (5.0 Kg/m2) + Two sprays of neem oil (2 %)
T8 : Seed treatment + Seedling dip with COC + Soil application of Tv-CARI-3 along withFYM and neem cake (5.0 Kg/m2) + Two sprays of neem oil (2 %)
T9 : Seed treatment + Seedling dip with COC + Soil application of Psf-CARI-1 along withFYM and neem cake (5.0 Kg/m2) + Two sprays of neem oil (2 %)
T10 : Seed treatment + Seedling dip with Carbendazim + Soil application of Th-CARI-5along with FYM and neem cake (5.0 Kg/m2) + Two sprays of neem oil (2 %)
T11 : Seed treatment + Seedling dip with Carbendazim + Soil application of Tv-CARI-3along with FYM and neem cake (5.0 Kg/m2) + Two sprays of neem oil (2 %)
T12 : Seed treatment + Seedling dip with Carbendazim + Soil application of Psf-CARI-1along with FYM and neem cake (5.0 Kg/m2) + Two sprays of neem oil (2 %)
T13 : Seed treatment + Seedling dip with Krilaxyl + Soil application of Th-CARI-5 alongwith FYM and neem cake (5.0 Kg/m2) + Two sprays of neem oil (2 %)
T14 : Seed treatment + Seedling dip with Krilaxyl + Soil application of Tv-CARI-3 alongwith FYM and neem cake (5.0 Kg/m2) + Two sprays of neem oil (2 %)
T15 : Seed treatment + Seedling dip with Krilaxyl + Soil application of Psf-CARI-1 alongwith FYM and neem cake (5.0 Kg/m2) + Two sprays of neem oil (2 %)
T16 : Control

CARIAnnual Report 2009-2010
103
in percent reduction in disease index andyield increase (35.3%). Thus it seems thatintegration of biocontrol agents with suitable
fungicides at relatively low concentrationscan become best option as compare to eitherof biocontrol agent or fungicides alone.
Module- III: Combination of culturalpractices, biocontrol agents and fungicides
The rationale behind the integrated approachof disease management in tomato is thateither use of cultural practices, biocontrolagents and fungicides alone is not effectivein suppression of disease complexes oftomato. So, integration of these threecomponents seems to be more effective inmanagement of diseases in tomato becauseeach component expected to have synergisticeffect in disease management process. Theintegration of cultural practices, botanicaland biocontrol agents not only helpful in
suppression of disease complexes in tomatobut also reduce the requirement of chemicalpesticides (Table 24).
It is evident from the Fig. 8 that all thetreatments significantly reduced theincidence of disease complex in tomato ascompare to control. But the combination ofbiocontrol agents, fungicide and botanicalsin different method of delivery system wasproved superior when the seedlings weretransplanted directly in the main fieldwithout disturbing the root system ascompared to uprooting of seedlings andsubsequent transplantation in the main field.
Table 23. Integrated effects of biocontrol agents and fungicides against disease complex of tomato
Treatments % Reduction of disease incidence Yield % increase
Bacterial wilt Leaf curl Basal stem rot Fusarial wilt (q/ha) in yield
T1 84.9b 0.0 75.3ab 73.6b 256.0a 70.7T2 0.0 0.0 72.5bc 68.4cd 203.0h 35.3T3 0.0 0.0 76.0a 76.0a 214.0g 42.7T4 55.6de 55.4a 65.6f 60.0g 210.0 b 40.0T5 41.6e 52.1b 60.0g 56.8h 220.0f 46.7T6 63.4c 48.5 58.2gh 53.0i 224.0f 49.3T7 86.0ab 56.2a 76.4a 74.8b 263.0a 75.3T8 84.0b 52.6b 73.2b 65.0e 248.0b 65.3T9 87.5a 49.0c 62.9de 62.0f 254.0ab 69.3T10 57.0d 56.0a 76.0a 70.0c 233.0c 55.3T11 42.2e 53.0b 74.1b 62.3f 226.6e 51.1T12 65.0c 49.3c 60.0d 60.5g 221.0d 47.3T13 57.8d 55.5a 77.0a 70.1c 236.6b 57.7T14 43.0e 52.7b 74.0b 64.0e 232.2d 54.8T15 65.0c 48.6c 63.2d 60.5g 229.5d 53.0T16 0.0 0.0 0.0 0.0 150.0i 0.0

CARI Annual Report 2009-2010
104
The treatment T2 was most effective inpercent reduction of disease incidence andcorresponding yield increase of tomato,followed by T3, T4 and T1. The results also
suggested that crop rotation with non hostcrop and intercropping with Burma Dhaniawith tomato resulted into improved diseasecontrol and yield of tomato.
OFT trial on disease management ofTomato
The on farm trial on disease management oftomato by integration biocontrol agents,botanicals and fungicides were carried outin five farmer’s field of South Andaman within an area of 100 m2 each (Table 25). Theplant protection measures in tomato andother vegetables used by respective farmers
was noted and analyzed. The best threetreatments with lowest disease incidences oftomato were chosen for on farm trial in fivefarmer’s field. The data on disease incidence ofbacterial wilt, leaf curl, and basal stem rot andfusarial wilt was recorded 7 days aftertransplanting and repeated at 15 days intervals.The percent reduction in disease incidence ofeach disease was calculated by the formula:
Table 24. Treatment schedules for tomato
T1 Seedlings raised in nursery beds and transplanted in main field + Th-CARI-5 + Psf-CARI-1 +Copper oxychloride + Mixture of FYM and neem cake + Neem oil
T2 Seedlings raised in plastic cup and direct transplanting + Th-CARI-5 + Psf-CARI-1 + Copperoxychloride + Mixture of FYM and neem cake + Neem oil
T3 Crop rotation with sorghum + Th-CARI-5 + Psf-CARI-1 + Copper oxychloride + Mixture ofFYM and neem cake + Neem oil
T4 Intercropping with Burma Dhania + Th-CARI-5 + Psf-CARI-1 + Copper oxychloride + Mixtureof FYM and neem cake + Neem oil
T5 Control (seedlings raised in nursery bed and transplanted in main field)
Fig. 8. Integrated effect of cultural practices, biocontrol agents and fungicideagainst disease complex of tomato

CARIAnnual Report 2009-2010
105
(Disease incidence in control plot) - (Disease incidence in treated plot) %RDI = (Disease incidence in control plot) Where, % RDI is % reduction in disease incidence
Fig. 9 Integrated disease management of Tomato
The treatment schedules of best three treat-ments are as follows:
The results presented in Fig. 9 revealed thatall treatments have significantly reduced thedisease incidence of all diseases studied ascompared to farmers practice. But T1 wasfound most effective in percent reduction indisease incidences of bacterial wilt, leaf curl,basal stem rot and fusarial wilt of tomato in
all five farmer’s field followed by T2, T3 andT4 (Farmer practice) was least effective withlowest %RDI and increase in yield. Thepresent result indicated that though therewas lower % RDI of all diseases in farmer’sfield and increase in yield as compared to ourexperimental result but there was significanthigher % RDI and increase in yield of tomatoas compared to farmer practice.
Table 25. Treatment schedules
T1 Seed treatment + Seedling dip with COC + Soil application of Th-CARI-5 along with FYM and
neem cake (5.0 Kg/m2) + Two sprays of neem oil (2 %)
T2 Seed treatment + Seedling dip with COC + Soil application of Tv-CARI-3 along with FYM and
neem cake (5.0 Kg/m2) + Two sprays of neem oil (2 %)
T3 Seed treatment + Seedling dip with COC + Soil application of Psf-CARI-1 along with FYM and
neem cake (5.0 Kg/m2) + Two sprays of neem oil (2 %)
T4 Farmers practice
T5 Control

CARI Annual Report 2009-2010
106
Ajanta Birah, Shrawan Singh, SubhashChand, Krishna Kumar and SomeshwarBhagat
In these Islands, tropical and humid climateoffers congenial environment for spread andmultiplication of insect-pests of varied origin.Keeping this in view of alarming pestproblems, the present study has beenplanned to develop the eco-friendlysustainable vegetable IPM modules inAndaman to combat against notorious pests.
A. Laboratory evaluation of plant extracts
The melon fruit fly, Bactrocera cucurbitae(Coquillett) (Diptera: Tephritidae) is a majorpest of cucurbitaceous vegetables. It prefersto infest young, green, soft-skinned fruits.This pest inserts the eggs 2 to 4 mm deep inthe fruit tissues, and the maggots feed insidethe fruit. Pupation occurs in the soil at 0.5 to
15 cm below the soil surface. It has been
reported to cause 15-85% loss in
cucurbitaceous vegetables. In-vitro study was
conducted to evaluate aqueous extracts of
different plants for their repellency action
against fruit fly. Out of tested plant species,
Syzygium aromaticum, Amomum aculeatum and
Morinda citrifolia were found effective against
fruit fly in which mortality ranged from 5.77
to 71.76, 4.13 to 80.45 and 13.22 to 70.23%
and LC50 was recorded 8.83, 10.67 and 10.85%,
respectively. Whereas, Annona squamosa,
Pongamia glabra and Gliricidia spp had showed
lower mortality range between 12.80 to 73.84,
3.13 to 57.03 and 5.53 to 62.11% and LC50
was 15.99, 21.61 and 31.97%, respectively
(Table 26, Fig. 10, Plate 13 ).
B. Field evaluation of pest managementmodules
Okra (Abelmoschus esculentus Moench)commonly called as bhendi or ladies
Development of Ecofriendly IPM Modules for Okra and Cucurbits in Andaman
df: degree of freedom, ÷ 2 : chi square, LC50 : median lethal concentration
Table 26. Regression equation and LC50 values of aqueous plant extracts against fruit fly,Bactrocera dorsalis
SL. Plant extracts Heterogeneity Regression LC50 Fiducial
No. df x2 equation value(%) limits
1. Syzygium aromaticum 6 2.197 y=3.562 +1.519x 8.834 6.43- 12.13
2. Amomum aculeatum 6 0.824 y=1.845 +3.068x 10.670 9.22 - 12.34
3. Morinda citrifolia 6 1.958 y=2.886 +2.041x 10.850 8.62 - 13.64
4. Annona squamosa 6 2.782 y=2.200 +2.325x 15.999 13.19 -19.39
5. Pongamia glabra 6 0.503 y=1.013 +2.987x 21.610 17.85 -26.15
6. Gliricidia spp. 6 2.939 y=0.058 +3.283x 31.978 27.48 - 37.2

CARIAnnual Report 2009-2010
107
finger has special status in Island inproviding nutrition among the variedvegetables. The yield and quality of okrais hampered severely due to outbreak ofvarious insect pests. Shoot and fruitborer, Earias vittella is ubiquitous andmajor obstacle for okra production inthese is lands. Keeping in view, thepresent study was undertaken toevaluate different pest managementmodules against okra shoot and fruitborer in field conditions. Field trials wereconducted on okra (cv-Arka Anamika) toevaluate pest management modules.
The trial was laid in Randomized Block
Design with four treatments (modules)
replicated four times including control.
All the agronomic pract ices were
followed for raising the crop in this
location. The details of all the treatments
(modules) are presented in table 27. The
incidence of fruit borer was calculated
on the basis of weight of damaged fruits.
Data recorded on the incidence of jassid
population and okra shoot and fruit
borer and fruit yield were presented intables 28-29 and Plate 14.
DAS : Days after sowing* Sticker mixed @0.5ml/lt during the foliar spray of insecticidals and botanical formulations
Table 27. Details of different integrated pest management practices adopted for the okra field trial
Name of Module Details of treatment
M1– Biointensive Neem cake application @ 250 kg/ha at the time of sowingSowing of maize at
the borders as barrier crop for conservation of natural enemiesWeekly
clipping of infested shoot & fruit Erection of pheromone trap @ 100traps/ha
for mass trappingFoliar spray of neem formulation (Neembaan) @ 30ml/lt
at 45 DASFoliar spray of aqueous leaf extracts of cloves (Syzygium aromaticum)
@ 250g/lt at 60 DASFoliar spray of Karanj oil @ 30 ml/lt at 75 DAS
M2- Integrated Seed treatment with imidacloprid @ 5 g/kg seed a day before sowing Sowing
of maize at the borders as barrier crop for conservation of natural
enemiesWeekly clipping of infested shoot & fruit Erection of pheromone trap
@ 100traps/ha for mass trappingFoliar spray of neem formulation
(Neembaan) @ 30 ml/lt at 45 DASFoliar spray of Spinosad 45 SC @0.5ml/lt
at 60 DASFoliar spray of Karanj oil @ 30 ml/lt at 75 DAS
M3- Farmers practice Foliar spray of endosulfan @ 2 ml/lt at 45 DASFoliar spray of cypermethrin
@ 1.5 ml/lt at 60 DASFoliar spray of deltamethrin @ 1.5 ml/lt at 75 DAS
M4 - control Control

CARI Annual Report 2009-2010
108
Tab
le 2
8. E
valu
atio
n o
f pes
t man
agem
ent m
odu
les
agai
nst
Jass
id p
opu
lati
on in
ok
ra
Mod
ule
sA
vera
ge n
um
ber
of J
assi
d n
ymp
h a
nd
ad
ult
wh
itef
ly p
er le
afFr
uit
%25
DA
S35
DA
S45
DA
S55
DA
S65
DA
S75
DA
SP
oole
d o
ver p
erio
ds
yiel
din
crea
se (q
/ha)
in y
ield
JW
JW
JW
JW
JW
JW
JW
over
cont
rol
M1
1.02
3.33
4.33
4.35
5.52
4.33
6.91
7.93
2.85
11.7
04.
985.
374.
276.
1797
.12
33.9
6M
21.
512.
353.
194.
254.
102.
553.
307.
043.
3311
.31
4.50
7.22
3.32
5.79
119.
6965
.08
M3
2.31
3.75
4.31
4.57
7.55
4.77
5.65
8.38
6.16
13.0
05.
858.
205.
317.
1190
.77
25.2
0M
42.
504.
887.
799.
778.
657.
7713
.33
13.5
013
.92
14.6
314
.54
13.7
710
.12
10.7
272
.50
—S
Em
0.06
0.03
0.08
0.05
0.38
0.06
0.06
0.14
0.01
0.32
0.12
0.05
0.05
0.05
1.17
CD
0.15
0.08
0.20
0.13
0.85
0.15
0.14
0.31
0.03
0.74
0.27
0.12
0.13
0.12
2.65
(P=
0.05
)C
V (%
)5.
131.
482.
591.
438.
331.
961.
272.
150.
373.
682.
280.
891.
421.
051.
75
DA
S : D
ays
afte
r so
win
g, J
: Ja
ssid
, W :
whi
tefl
y
DA
S : D
ays
afte
r sow
ing,
J : J
assi
d, W
: w
hite
fly
Tab
le 2
9. E
valu
atio
n o
f pes
t man
agem
ent m
odu
les
agai
nst
sh
oot a
nd
fru
it b
orer
an
d y
ield
of o
kra
Mod
ule
sP
ick
ing
wis
e fr
uit
dam
age
(%)
Frui
t%
in
crea
se
1st2n
d3rd
4th5th
6th7th
8thM
ean
yiel
d in
yie
ld(q
/ha)
ove
r con
trol
M1
1.13
9.20
9.33
9.25
9.93
4.53
6.33
5.25
6.87
97.1
233
.96
(6.0
2)(1
7.66
)(1
7.76
)(1
7.66
)(1
8.34
)(1
2.25
)(1
4.54
)(1
3.18
)(1
5.12
)M
22.
105.
656.
574.
952.
3310
.11
9.25
4.13
5.64
119.
6965
.08
(8.3
3)(1
3.69
)(1
4.77
)(1
2.79
)(8
.72)
(18.
53)
(17.
66)
(11.
68)
(13.
69)
M3
2.33
6.95
11.8
55.
9310
.73
11.1
43.
995.
537.
3190
.77
25.2
0(8
.72)
(15.
23)
(20.
09)
(14.
06)
(19.
09)
(19.
46)
(11.
39)
(13.
56)
(15.
68)
M4
10.9
314
.54
13.2
516
.25
21.3
321
.59
17.5
919
.32
16.8
572
.50
—(1
9.28
)(2
2.38
)(2
1.30
)(2
3.73
)(2
7.49
)(2
7.63
)(2
4.73
)(2
6.06
)(2
4.2)
SEd
0.42
0.09
0.33
0.79
0.95
1.29
0.15
0.11
0.06
1.17
CD
(P=
0.05
)0.
960.
200.
751.
802.
152.
920.
340.
250.
142.
65C
V(%
)5.
620.
752.
546.
617.
309.
621.
241.
000.
521.
75
Figu
res
in p
aren
thes
es a
re a
rcsi
n tr
ansf
orm
ed v
alu
es

CARIAnnual Report 2009-2010
109
(i) Incidence of sucking pests
The data presented in table 4 revealed thatthere was a significant lower jassidpopulation in all the modules as comparedto control (M4) (10.12 jassids/leaf) inperiodical observations (Plate 9). The pooleddata revealed that integrated module (M2)and bio-intensive module (M1) recordedsignificantly lower jassid population (3.32jassids/leaf, 4.27 jassids/leaf) than farmerspractices (M3) (5.31 jassids/leaf). The datarevealed that there was a significant lowerwhitefly population in all the modules ascompared to control (M4) (10.72 whitefly/leaf) in periodical observations. The data onpooled over periods revealed that integratedmodule (M2) recorded significantly lowerwhitefly population (5.79 whitefly/leaf) ascompared to bio-intensive module (M1) (6.17whitefly/leaf) and farmers practices (M3)(7.11 whitefly/leaf).
(ii) Incidence of borer pests
It is revealed from the data that the fruitdamage by borer was significantly lower inall the modules as compared to control at eachpicking as well as in pooled analysis. Therewas significant increase in the total yield ofokra fruits due to protection of crop withdifferent management modules. The datapooled over picking indicated that integratedmodule (M2) recorded significant lower fruitdamage than other modules. The maximumfruit yield (119.69q/ha) was realized in M2
followed by bio-intensive module M1 (97.12q/ha). The yield in untreated control plots wasrecorded 72.50q/ha. Thereby percent increase
over control was 65.08% and 33.96% in M2
and M1 modules, respectively. No phytotoxiceffect due to any treatment could be noticedduring the entire crop season.
The results revealed that different types ofmanagement practices have significantlyreduced jassid, whitefly population andshoot and fruit borer damage than untreatedcontrol in okra. Integrated module (M3)which included seed treatment withimidacloprid @ 5 g/kg seed a day beforesowing + sowing of maize at the borders asbarrier crop + weekly clipping of infestedshoots and fruits + erection of pheromonetrap @ 100traps/ha for mass trapping +foliar spray of neem formulation(Neembaan) @ 30 ml/lt, spinosad 45 SC @0.5ml/lt and karanj oil @ 30 ml/lt at 45, 60and 75 days after sowing, respectively. Inthis module, less incidence of shoot and fruitborer (5.63%) and more fruit yield (119.69q/ha) was recorded as compared to untreatedcontrol (16.85% incidence of shoot and fruitborer and fruit yield 72.50q/ha). Theintegrated management emphasizes theimportance of both chemical and botanicalpesticides for pest suppression in agriculturalsystems. Such compounds can be used in thepest management strategy to achieve thedesired control. By incorporating thesemanagement practices, application ofsynthetic insecticides can be reduced to aminimum possible level. Such an approachposes a lower risk to people, wildlife and theenvironment while simultaneouslyprotecting economic interests amongfarmers.

CARI Annual Report 2009-2010
110
Fig.9. In-vitro evaluation of aqueous plant extracts on fruit fly Bactrocera cucurbitae

CARIAnnual Report 2009-2010
111
(c) (d)
(a) (b)
Plate 13. In-vitro evaluation of plant extracts, (a) fruit flies, Bactrocera cucurbitae in rearing cage,(b) aqueous plant extracts, (c) fruit flies in treatments, (d) fruit flies in untreated control
(a) (b)

CARI Annual Report 2009-2010
112
(e) (f)
(c) (d)
Plate 14. Field view of evaluation of pest management modules, (a-c) field view in different stages,(d) jassid population on field, (e) larva of okra shoot and fruit borer, (f) pupa of shoot and fruit borer.
Krishna Kumar, Someshwar Bhagat andAjanta Birah
Sorghum grain, wheat grain, rice grain(Chaffy), rice grain, paddy straw, drybanana leaf, dry arecanut leaf and drycoconut husk were evaluated in vitro toselect best substrate for spawn production.The results of pooled data of the experimentshowed that all the substrate steamed for
different timings (20, 30, 45 min) hadconsiderable mycelial growth. Substratessteamed for 20 min showed highest mycelialgrowth at 13th day in sorghum grain (12.0cm) followed by rice grain (chaffy) (9.0 cm),banana and arecanut leaf (8.5 cm), wheatgrain (8.3 cm), paddy straw and rice grain(8.0 cm) and least growth was observed indry coconut husk (7.7 cm) (Table 30).
Standardization of Production and Protection Technology of TropicalMushrooms

CARIAnnual Report 2009-2010
113
Mycelial growth in 30 min steamedsubstrates was low as compared to 20 minsteaming. Under 30 minutes of substratesteaming mycelial growth was higher inbanana leaf (11.0 cm) followed by sorghum(10.0 cm) and in rest of the cases it was lessthan 10.0 cm in all treatments though it hadlower growth rate in 20 min steaming. Itmight be due to increase in steaming timingsof substrate as it would have gained lot ofmoisture resulted in low mycelial growth. Incase of 45 min steaming similar trend ofmycelial growth was also observed insorghum grain (11.2 cm) at 13th day of spawn
run followed by wheat grain (11.1 cm) andin rest of the treatments it was less than 10cm mycelial growth.
Spawn prepared by steaming at three tim-ings were also tested for their quality andbreakability as color and compactness hasmajor criteria for quality spawn production.Table 31 and Plate 15 revealed that sorghumgrain and paddy straw had the efficiency tocolonize the mycelia and devoid of the pig-ments. In all the steaming timings sorghumgrain and paddy straw, banana leaf andarecanut leaf was best whereas it had bestquality of spawn.
Table 31. Summary of spawn quality assessment of Pleurotus florida prepared after steaming 20, 30,and 45 min steaming on different locally available substrate
Treatments Colour of spawn Pigmentation Colonization Grading of spawn
Sorghum grain White No pigmentation **** N Wheat grain Creamy white Yellow *** N Rice grain Light yellowish white Yellow *** ES Rice grain Chaffy) White Yellow *** ES Paddy straw White No pigmentation **** ES Dry banana leaf Brownish No pigmentation *** ES Dry arecanut leaf Brownish No pigmentation *** ESDry coconut husk Dirty white No pigmentation ** ES
* Poor, ** Medium *** Good, **** ExcellentN: Normal mycelial growth, ES: Easy segregation, VES: Very Easy segregation
Table 30. Effect of steaming of sustarte on growth of Pleurotus florida
Treatments Mycelial growth (cm)
20 minute 30 minute 45 minute
Sorghum grain 12.7 10.0 11.2Wheat grain 8.3 8.5 11.1Rice grain 8 8 8.1Rice grain (Chaffy) 9 5 7.6Paddy straw 8 8.5 8.7Dry banana leaf 8.5 11 7.5Dry arecanut leaf 8.5 8.5 8.5Dry coconut husk 7.7 9 8.5Mean 8.8 8.6 8.9SEm 1.88 0.68 0.88CD (P=0.05) 1.88 1.44 1.88

CARI Annual Report 2009-2010
114
Plate 15. A-H. Mycelial growth of P. florida on different substrates. A - Sorghum grain,B - Wheat grain,C- Rice grain,D - Rice grain (Chaffy),E - Paddy straw, F - Dry banana leaf,G - Dry
arecanut leaf and H - Dry coconut husk
Krishna Kumar and Someshwar Bhagat
Eighty bacterial isolates from Neil andHavelock Islands were studied for theirantagonistic and Plant Growth Promoting(PGP) properties, among 15% and 43.7%isolates showed antagonism againstSclerotium rolfsii and C. capsici and 42.5%and 74.4% of the isolates showed ability toproduce siderophore and phosphatesolubilization respectively, 21.2% isolateswere able to produce more than 15 µg/mlIAA. Potential antagonistic and PGP isolateswere further identified based oncarbohydrate utilization pattern usingMicrobial Identification System (BIOLOG).Identified as Bacillus subtilis (6), B. pumilus(5), B. megaterium (3), B. cereus (3), B.
lichiniformis (1), Staphylococcus spp (3),Enterobacter cloacae (2), Pseudomonas spp (2)and Alcaligenes faecalis (1). Restrictionenzymes MspI (Plate 16) and HaeIII revealeddistinct molecular diversity among variousisolates (Fig 11). Bam HI, Eco RI and Pst I didnot show any diversity among the isolates.A total of 206 isolates from South AndamanIsland were characterized for their hydrolyticenzymes, plant growth promoting propertiesand antagonism. It was found to be positivefor protease (67.5%), cellulase (56.8%),siderophore (31.5%), IAA production(27.7%), PO4 solubilization (18.4%) HCNproduction (4.0%) and potential antagonisticactivity against list of pathogens like
Macrophomina sp (2.9%), Rhizoctonia solani
Exploration of Plant Pathogenic and Antagonistic Microbial ResourcesAssociated with Vegetable and Spice crops of Andaman and Nicobar Islands

CARIAnnual Report 2009-2010
115
(15.1%), S. rolfsii (4.9%) and Pythium
aphanidermatum (2.9%) respectively (Plate
17). Twelve isolates of Trichoderma from
rhizosphere soils of spice crops were
characterized for their morphological,
antagonistic and molecular studies.
Sequencing of all twelve isolates revealed that
four species viz., T. erinaceum, T. ovalisporum,
T. asperellum and T. brevicompactum are the
first report from India (Plate 18, 18a). Forty-
two isolates of Trichoderma spp isolated from
South Andaman villages were screened for
their antagonistic activity against
Macrophomina sp, Rhizoctonia solani, S. rolfsii
and Pythium aphanidermatum respectively.
In vitro screening of rhizosphere Trichoderma
spp against S. rolfsii, Macrophomina sp, P.
aphanidermatum and R. solani showed that
overall the results showed that the
proportion of isolates with antagonisticactivities was highest for the S. rolfsii
followed by R. solani, Macrophomina sp and
P. aphanidermatum respectively (Plate 19).
Twenty-one Colletotrichum spp isolated from
leaf and fruits were characterized for cultural
morphological, molecular and sequencing.
Results showed that cultural and
morphological variation occurred in all
isolates but sequencing revealed most of the
isolates were Colletotrichum gloeosporioides.
ITS-RFLP studies also showed minor
variations among the isolates. A total of 43
sequences were submitted to NCBI which
includes 12 Trichoderma spp (GQ426033-44),
13 Colletotrichum spp (GU222366-78) and 18
bacterial sequences (GU250810-27). In the
reported period a total of 21 bacterial and
fungal microorganisms were submitted to
NBAIM and initiated work on the isolation
and characterization of microbial
populations in the Mud volcano and other
extreme environments (Plate 20).
M B1 B2 B3 B4 B5 B6 B7 B8 B9 B10 B11 B12 B13 B14

CARI Annual Report 2009-2010
116
Plate 16. Restriction profile of 16S rDNA amplicon with MspI Lane B1-B27. PfL9, PfS2, C21, C22, C19, PfR1,BB18, PfR8, BS1, PfR5, C20, PfR2, BL5, BG3, BL6, PfS1, BS2, BR5, BL7, PfG1, BR4, BL4, BL1, BR4, BL4, BL1, BR7,
BG6, PfL7 and BB14 Lane M, 100bp ladder
M B15 B16 B17 B18 B19 B20 B21 B22 B23 B24 B25 B26 B27
Fig. 11. Dendrogram showing the similarity co-efficient of potential isolates based ARDRA analysisusing HaeIII and MspI restriction Enzymes

CARIAnnual Report 2009-2010
117
Plate 17. e. IAA production f. Macrophomina spp g. P. aphanidermatum h. S. rolfsiiAntagonistic activity shown by rhizosphere bacteria
Plate 17. a. Protease b. PO4 solubilization c. Siderophore d. HCN production
Plate 18 a T. asperellum T. brevicompactum
Plate 18. T. ovalisporum T. erinaceum

CARI Annual Report 2009-2010
118
Macrophomina sp P. aphanidermatum
R. solani S. rolfsii
Plate 19. Antagonistic activity of Trichoderma isolates
Plate 20. Mud volcal Antagonistic activity by Mud volcano isolates

CARIAnnual Report 2009-2010
119
Ajanta Birah
Rodents are largest group of mammals in
Andaman Islands represented by 15 species,
although detailed information about these
is lacking. The impact of rodents is significant
in terms of agriculture through crop and
commodity loss and in public health.
Surveillance and population ecology of
Rodent pests
Survey and surveillance activities were
undertaken with an objective to understand
species composition and damage potential
in different locations. Surveys for rodent
activity were conducted in different locations
namely Manglutan, Minniebay,
Meethakhari, Calicut, Gupta Para,
Baramanala, Wandoor and Telrabad of
South Andaman district. The data collected
from South Andaman district indicated that
8 to 26 percent of coconut palms are infested
with rodents (Plate 21). Looking at the
economic angle, such infestation rate directly
affects the economic returns for the farmers.
Typically rat damage to coconuts consists of
a single hole of approximately 65 x 40 mm
usually found near the nut’s point of
attachment. As rats are unable to penetrate
mature or nearly mature coconuts, damage
takes place in the palm crown. The rat after
gnawing the husk consumes the inner
contents including the soft-shell of the nut.
After gnawing the husk, they consume the
inner contents. The damaged nut may fall
on the ground in 2-6 days or even up to 15-
20 days of rodent attack.
Damage in term of percent damaged fruit
in case of vegetables viz. brinjal and tomato
was recorded. The survey data revealed the
predominance of Rattus species followed by
squirrel in South Andaman region. In case
of brinjal, the damage per cent ranged from
5.76 to 46.59, whereas it was 8.26 to 33.89%
in tomato, respectively. Rodents damages oil
palm at seedling, flowering and immature
and mature fruit stages. A study conducted
in Little Andaman indicated rodent activity
on all palms frequenting from adjoining
forest area or from the nests made on the
fronds. The total area under oil palm
plantation is 1593ha. An extensive survey
in two different locations of Little Andaman
was carried out to assess the rodent
infestation in oil palm cropping system. The
palms infestation ranged from 40 to 50
percent indicating the intensity of their
problem.
All India Network Project on Rodent Control

CARI Annual Report 2009-2010
120
(a) (b)
(c) (d)
(e) (f)

CARIAnnual Report 2009-2010
121
Plate 21. Economic loss caused by rodents
(g) (h)
(i)
(a) Coconut damaged by rodents,(b) Breeding sites of rodents,(c) Rodent pest situation in oil palm plantations of Little Andaman(d) Breeding nests of rodents on oil palm,(e) Oil palm damaged by rodents, (f) Tomato damaged by rodents,(g) Brinjal damage,(h) Rat in cage,(i) Preserved specimen of rat.

CARI Annual Report 2009-2010
122

CARIAnnual Report 2009-2010
123
A. Kundu, Arun Kumar De, Jai Sunder,M.S. Kundu, S. Jeyakumar and S.K.Verma
Comparative performance evaluation ofBlack, White and Brown varieties ofNicobari fowl
With an aim to improve the Nicobari fowls
by crossing with other exotic breeds/strains
such as Vanaraja birds, the selection of three
varieties of Nicobari fowls (Brown, Black and
White) were initiated. One hundred and sixty
five number of Nicobari fowl chicks were
reared just after hatching under deep litter
system and their growth performance at
different weeks (at 4th, 8th and 12th week of
age) were recorded. The body weight of Black
varieties Nicobari fowl was observed
significantly (p<0.05) higher at 4th, 8th and
12th week of age than the other two varieties
viz. Brown and White (Table 1). Male and
female of White and Brown Nicobari fowl
differed significantly (p<0.05) at 4th, 8th and
12th week of age. The male and female of
Black Nicobari fowl differed significantly
(p<0.01) at 12th week of age only.
Differences in body weight between male
and female were highest in Brown followed
by White followed by Black Nicobari fowl in
all the weeks of measurement (Table 2). The
difference may be due to the genetic varia-
tion of the different strains.
Improvement of Nicobari Fowl for Meat and Egg
Table 1. The body weight of the preselected population of Nicobari fowls
Type 4th week body weight 8th week body weight 12th week body weight
Male Female Male Female Male Female
Black 181.29±7.26 170.56±6.26a 434.75±13.96a 419.88±11.26a 882.5±25.55a 790.50±20.80a
(n=40) (n=40) (n=38) (n=39) (n=38) (n=38)
White 167.29±11.06 132.28±5.84b 402.75±14.2ab 348.44±8.13b 789.31±24.9ab 639.67±14.55b
(n=22) (n=31) (n=21) (n=31) (n=21) (n=31)
Brown 148.33±10.36 112.08±11.62b 371.88±17.65b 297.64±18.08c 782.06±29.03b 585.00±28.93b
(n=17) (n=15) (n=16) (n=15) (n=16) (n=15)
*Values having different superscripts in the same column differ significantly (p<0.05)
Type of Differences in body weight (g)
strains between male and female
4th week 8th week 12th week
Black 10.73 14.87 92
White 35.01 54.31 149.64
Brown 36.25 74.24 197.06
Table 2. Differences in body weight be-tween male and female in different weeks

CARI Annual Report 2009-2010
124
Plate 2. PreselectedWhite Nicobari fowl
Plate3.PreselectedBrown Nicobari fowl
Plate1. PreselectedBlack Nicobari
Selection of Nicobari fowl
Selection of Nicobari fowl was done on thebasis of 12th week body weight. Out of 159numbers of birds, 85 birds were selected. Thenumbers of selected varieties were 39 for
Black, 30 for White and 16 for Brown. Thereproductive performances of the selectedvarieties (female) of Black, White and BrownNicobari fowl have been given in plate 4, 5and 6.
Plate 5. Selected White NicobariASM- 21 weeks
50 days egg production 25/bird
Plate 6. Selected BrownNicobari
ASM- 22 weeks50 days egg production
22/bird
Plate 4. Selected Black NicobariASM- 22 weeks
50 days egg production18/bird
Performance evaluation of Vanaraja
poultry birds
With an aim to utilize the Vanaraja chicks
for crossing with Nicobari fowls and
production of improved varieties/strains,
one hundred Vanaraja chicks of 1 week old
were procured from Department of Animal
Husbandry and Veterinary services, PortBlair. The Vanaraja chicks were reared underdeep litter system providing standard Plate 7. Flock of Vanaraja Birds

CARIAnnual Report 2009-2010
125
managemental conditions. The body weight(g) of Vanaraja birds at 6th and 10th week ofage were recorded as 431.53 and 924.35
respectively. The preliminary study showedmore mortality in Vanaraja (15%) thanNicobari fowl (6%).
A.Kundu, T.Sujatha, S. Jeyakumar and
Jai Sunder
Development and Comparative evaluationof performance of various synthetic crossesof Nicobari fowl
To improve growth rate, survivability
and further improvement in egg
production, the various crosses of
Nicobari fowl were produced and
evaluated under intensive management
condition. The results are given in table
3. Subjective scoring index on the basis
of 6 point scale of various performance
traits of the crosses revealed that Black
Nicobari X Black Rock cross score highest
(47) followed by Black Rock x Black
Nicobari (39) , Black Rock X White
Nicobari (34), White Nicobari X Black
rock (30), ILI80 X Brown Nicobari (23)
and Brown Nicobari X ILI80 (19).
The growth performance of pure and
crossbred ducklings
Eight different genotypes of day old
ducklings of Andaman local- Chara-
Chembell i (CC) (mixed population) ,
Khaki Campbell(KC),Pekin (P) and its
various crosses viz PxP, PxCC, PxKC,
KCxKC, KCxCC, CCxCC, CCxP, and
CCxKC., were produced from the
existing parent stocks of CC, KC and P .
Their growth performance was
evaluated.
The Subjective scoring index on the
basis of 8 point scale of various growth
performance traits (growth rate, feed
utilization, survivability, performance
index and production number) of the
c r o s s e s r e v e a l e d t h a t P x C C s c o r e d
highest (43) followed by KCXCC (37),
P x K C ( 3 6 ) , C C x P ( 3 4 ) a n d C C x K C
( 2 2 ) . T h e p u r e P X P , K C X K C a n d
C C X C C s c o r e d 5 2 , 3 7 a n d 1 9
respectively. Hence the cross of Pekin
and Chara-Chembel l i crossbred did
better than all other crosses other than
pure Pekin and may be used as meat
purpose duck.
Improvement, Evaluation and Propagation of Indigenous Nicobari Fowl andDucks and Dissemination of Technology in Tsunami Affected Area

CARI Annual Report 2009-2010
126
Table 3. Performance of various crosses of Nicobari fowl
Traits Brown ILI80 X Black Black Black White Remarks
Nicobari Brown Rock Nicobari X Rock Nicobari
X ILI80 Nicobari x Black Black Rock X White X Black
Nicobari Nicobari rock
Hatch wt 32.48±1.23c 32.43±1.12c 38.38±1.47a 36.86±.10a 36.1±1.00ab 33.24±1.18bc CD (0.01) = 4.34,
CD (0.05) =
3.31, CV=15.67
B.Wt at 8 229.52±12.59 231.23±10.07 235.05±16.71 249.1±7.69 241±8.63 233.35±10.60 NS,CV 22.92
week
B.Wt at 690.5±26.41c 691.17±34.82c 982.11±23.57a 886.31±29.19ab 788.56±38.33bc 707.87±45.53c CD(0.01)=130.62
20th wk CD 0.05) = 98.70,
CV=17.24
WASM (g) 1148±25.33bc 1193.19±32.84b 1741.27±65.11a 1589.58±87.75a 1208.38±44.33b 1018.33±37.91c CD(0.01)=204.78,
CD (0.05) =
154.43,CV = 14.44
ASM (days) 187±2a 170±4b 161±2c 155±2c 172±3b 160±3c CD(0.01)=9.455
CD (0.05) = 7.11
CV=5.63
Annual Egg 196±5b 226±6a 176±6d 180±4cd 190±4bc 192±4bc CD(0.01)=18.43
production CD (0.05) =13.91
(nos.) CV=5.63
Average egg 47.4±1.21c 49.1±0.51c 52.5±0.97ab 53.1±0.83a 50±0.86bc 48.2±1.00 CD (0.01) 3.434,
weight(g) CD(0.05) =
2.596, CV=9.92
Total 6 9 8 4 5 6
mortality %
(0-72Wks)
FCR (kg 2.67 2.74 2.52 2.31 2.59 2.5
feed/dozen
egg)

CARIAnnual Report 2009-2010
127
M.S. Kundu, A. Kundu, Jai Sunder,S. Jeyakumar and S.K. Verma
Comparison of reproductive performancesunder different types of feedingmanagement
The reproductive performances werecompared under different types of feedingmanagement system. A total numbers of 16gilts of 5 months old were divided in to 3groups. There were 5 gilts in first two groupswhereas in third group the number of giltswas six. The compositions of ration were ricebran and colocasia leaves as a sole feed(Control). In treatment 1 (T1) 50 percent of thecontrol diet were replaced by the brokenrice/ broken wheat. In treatment 2(T2)ration was made up of maize, wheat, and
coconut cake and rice bran. The experimentwas continued till all the gilts farrowed andsubsequent weaning of the new born. Themean value of different reproductiveparameters and various litter traits ofdifferent categories of feeing systempresented in table 4.
The age at puberty, age at first conception andage at first furrowing was found significantlybetter in T2 compared to T1 and control group.This may be due to the better availability of thenutrient from the maize based diet. The proteinand energy ratio also plays important role forbetter assimilation of the nutrient. Moreoverthe colocasia based diets contain the oxalatewhich may prevent the assimilation of thenutrient specially the calcium.
Productivity Enhancement of Pigs Under Island Ecosystem
Table 4. Reproductive traits of Large white Yorkshire breeds of pigs under differenttypes of feeding
Parameters Control T1 T2
Age at puberty (days) 299.6 ± 6.11c 260.00 ± 4.76b 221.67 ±3.99a
Age at first conception (days) 340.2 ± 7.42 c 292.40 ± 6.60 b 245.50 ±3.94a
Age at first farrowing (days) 452.4 ± 7.57 c 404.80 ± 7.80 b 357.00± 4.07 a
Litter size at birth (nos) 5.6 ± 0.68NS 6.00 ± 0.71 NS 6.17 ±0.48 NS
Total litter weight at birth (kg) 5.32 ± 0.74 NS 5.90 ± 0.72 NS 7.26 ±0.87 NS
Individual litter weight at birth (Kg) 0.96 ± 0.09 NS 1.00 ±0.09 NS 1.18± 0.12 NS
Litter size at weaning (nos) 3.80 ± 0.58 NS 5.20 ± 0.58 NS 5.17 ±0.48 NS
Litter weight at weaning (Kg) 23.04 ± 3.99 NS 28.85 ± 1.41 NS 30.46 ±1.98 NS
Individual litter weight at weaning (Kg) 6.01± 0.19 NS 5.79 ± 0.62 NS 6.11± 0.60 NS
Weaning percentage 67.33 ± 3.36 NS 84.33 ± 6.74 NS 84.7± 5.51 NS
Values (in the same row) with different superscripts differ significantly (p<0.01).

CARI Annual Report 2009-2010
128
Ultrasonographic characterization of Backfat and loin eye muscle depth in LargeWhite Yorkshire pigs
Measurement of subcutaneous adipose tissueis used in decision making during pigproduction for optimal growth, for longevityin gilts and for quality control and carcassclassification. The aim of the present studywas to standardize the technique ofultrasonograhic evaluation of back fatthickness and to assess its status in growingand adult pig. A total of six adult and tengrower pigs were monitored for Sonographicobservation revealed that there were 2 to 3 fatlayers in swine. The edge of the outer aspectof outer fat layer and skin is difficult toseparate. Differentiation here is based on thetissue structure, which for skin, is moreuniform than outer layer. The middle layer iscomposed of uniform hypoechoic tissue,producing few internal reflections. It has asharp boundary with the overlying outer andthe underlying inner fat layer. This layercontains a series of internal hyperechoiclinear structures together with hypoechoictissue. Being hyperechoic it contrasts wellwith middle fat layer and also with the
hypoechoic muscle fibers beneath. Its linearstriations result in sharp edges, L3 is thusreadily differentiated from adjacent tissues.Loin muscle showed hypoechoic withhyperechoic intramuscular fat (marbling)with sharp boundry of hyperechoic rib bones.Ultrasonographic evaluation of back fatthickness (mean) found to be 19.00 and 33.17mm in young and adult pigs respectively.Young pig showed less back fat thickness andlayers and loin eye muscle depth than adultpig. The growing pigs were under the processof fat deposition and adult breeding pigshowed distinctive fat layers and larger eyemuscle depth indicating static process in fatdeposition. It is suggested that this methodfound to be useful in characterizing the fat andmuscle of indigenous and exotic pigs. Real-time ultrasound data might be useful inblocking/selecting pigs prior to allocation toexperimental treatment in growth trials, andserial measures appear promising as atechnique for monitoring composition ofgrowth in the desi/indigenous, crossbred andpure breed pig under various nutritional andmanagement conditions.
Plate 8. Illustration of area to be traced formeasurement of Back fat thickness and loin eye
area (longissimus dorsi) muscle
Plate 9. Ultrasonogram showing different layersof back fat and depth of of area to be traced formeasurement of Back fat thickness and loin eye
area (longissimus dorsi)

CARIAnnual Report 2009-2010
129
M. S. Kundu, A. Kundu, S.Jeyakumar,Subhash Chand, S.K. Zamir Ahmed andP.Balakrishan
Study of the nutritional status of the pigsat Carnicobar
Four feed materials (i.e Pandanus, Coconut,Bread fruit and Nicobari Aloo) mostly usedto feed the pigs were collected from Nicobarand their proximate principles wereestimated (Table 5). The nutrient requirementand availability was calculated based on theavailable data (Table 6). It was noticed thatthese feed materials are able to supply the90% of the energy requirement for thepregnant sows but the nursing sows couldnot able to meet its energy requirement from
Plate 10. Nursing sow with severe PEM
these feeds and it is only 42 percent of theirenergy needs. The protein requirement seemsto be very poor. Calculated values of proteinrequirement and supply show that there aresevere shortage of protein requirements andare in the range of 16-35% of the requirement.
Table 6. Nutrient requirement and their availability
Types of Requirement Available
Animal DM Protein Energy DM Protein Energy
(Kg) (g) (K Cal) (Kg) (g) (K Cal)
Grower (20-35Kg) 1.7 272 5610 2.2 80(29%) 4500 (80.21%)
Adult (Male) 110-180 Kg 2.5 350 8250 3.3 100 (28.57%) 6000 (72%)
Pregnant Sow (110-160Kg) 2 280 6600 2.8 100(35%) 6000 (90.90%)
Nursing Sow (140-200Kg) 5 750 16,500 6 120(16%) 7000(42%)
Study of the Feasibility and Convergence on Subsistence Pig Rearing toCommercial Pig Farming Inclusive of its Process
Table 5. Proximate principles of feed materials
Type of feed Moisture Ash Silica
Pandanus 70.98 ± 0.46 1.96 ± 0.06 1.06 ± 0.35
Coconut 34.99 ± 0.86 1.98 ± 0.05 0.31 ± 0.12
Nicobari Aloo 31.01± 0.85 3.95 ± 0.27 0.21 ± 0.03
Bread Fruits 33.79 ± 0.98 2.98 ± 0.27 0.31 ± 0.06

CARI Annual Report 2009-2010
130
The nursing sows are the worst affected. The
sows are suffering from severe Protein Energy
Malnutrition (PEM) Sows do not come to next
heat till the litters are sucking and normally
it is around 3 months.
Study of the breeding behaviour of sows
Normally the sows farrow in the jungle. At
least 15 days prior to expected farrrowing sow
prepare its nest for farrowing. There the sows
farrow and remain for quite some time. Then
they come to the owner’s house for feed. The
feed materials available to the nursing sows
are deficient both in terms of protein and
energy. During this time the body reserve is
used for production of milk to feed the piglets.
Ultimately the sows suffer from severe PEM
resulting in delay to post farrowing heat
leading to increasing the farrowing intervals.
The productivity of the sows decreased
substantially.
Creation of awareness among the changeagents
Pig farming is an integral part of the Nicobari
society. Herd size of the pigs is an indication
of richness of a person in the society. Still the
pig farming in the Nicobari society is in the
primitive stage. It is very difficult to
introduce the new ideas for rearing pigs in
the Nicobari society. After lot of persuasions
and interaction with the youth a few youth
were willing to interact with the team of
scientist of CARI to get the ideas about
scientific pig rearing. Accordingly a training
programme on “Scientific Pig rearing &
conservation of indigenous pig germplasm”
was organized at Car Nicobar. All together
11 change agents participated in the training
programme. They were given the ideas on
the importance of balance nutrition, care and
management of piglets and selection of boar
among the existing stock.
Study on the selection procedure of boar
at Car Nicobar
Normally they do not follow the norms to
select the boar for breeding purpose. Vigorous
and active male pigs are castrated for better
meat purpose. Breeding boars are maintained
without proper selection. Lack of knowledge
often leads to negative selection. More over
the healthy and more vigorous piglets are
castrated to make them docile and to keep
the pigs nearer to the house.
Plate 11. Imparting training in interactive modeto the change agents at Car Nicobar

CARIAnnual Report 2009-2010
131
Jai Sunder, D.R. Singh and A. Kundu
The in-vitro antibacterial activity of Morinda
citrifolia extracts was tested against two
different isolates of Ralstonia solanacearum,
causative agent of bacterial wilt in solanaceous
plants. The effect of feeding of Morinda
citrifolia in the milk quality and mastitis was
assessed in the dairy cows.
Antibacterial activity of Morinda citrifolia
against Ralstonia solanacearum
The Morinda citrifolia leaf and fruits were
collected, dried and grounded. The dried
samples were mixed with solvents viz.
chloroform and acetone and kept at room
temperature for 2-3 days with stirring in
between. The samples were filtered through
Whatman filter paper no. 43 and the extracts
were used as crude extract and kept at -200C
for further use.
The antibacterial activity of the extracts was
assayed by using disc diffusion method.
Standard disc of 6 mm diameter were
prepared and sterilized for disc diffusion
assay. Two different bacterial isolates of
Ralstonia solanacearum collected from the
Division of Field Crops were used for the
antibacterial assay. About 20 ìl of 10-3 dilutions
of bacterial cultures were poured over the
Nutrient Agar plate surface. Then the filter
paper discs soaked with different extracts
were placed on the surface of the agar and
allowed to dry. Standard antibiotics discs
(octadisc, Himedia) were used as positive
control while the solvents were used as
negative control. The plates were incubated
at room temperature for overnight and the
zone of inhibition was recorded with the
Himedia antibiotic scale.
Antibiotic sensitivity profile of
Ralstonia sp.
The results of the antibiotic sensitivity test
revealed that 41.17% of the antibiotics
produced absolute resistant against RSN 6 and
RSN 12 isolates. The average zone of inhibition
of 13.06±3.04 mm and 12.59±2.93 mm were
produced against RSN 6 and RSN 12 isolates
respectively (Table 7). The maximum zone of
inhibition of 33 mm was produced against both
the isolate. Almost similar type of inhibitory
activity was obtained with respect to 17
standard broad spectrum antibiotics (Plate
12).The best zone of inhibition was obtained
with ciprofloxacin (33 mm).
Evaluation of Therapeutic and Immunomodulatory Properties of MorindaCitrifolia in Poultry

CARI Annual Report 2009-2010
132
Plate 12. Zone of inhibition of RSN6 and RSN 12 isolates against different antibiotics
Table 7. Zone of inhibition against antibiotics
Sl.No. Antibiotics Concentration (µg) Zone of inhibition (mm)
RSN6 RSN12
1 Ampicillin 10 µg 0 02 Cephalothin 30 µg 0 03 Chloramphenicol 30 µg 17 194 Ciprofloxacin 10 µg 33 295 Clindamycin 2 µg 0 06 Colistin 10 µg 0 07 Co-trimazole 25 µg 25 188 Erythromycin 15 µg 23 229 Gentamycin 10 µg 24 2210 Gentamycin 10 µg 21 1911 Nitrofurantonin 300 µg 10 012 Ofloxacin 1 µg 30 3213 Oxacillin 1 µg 0 014 Penicillin-G 10 units 0 1115 Streptomycin 10 µg 12 1216 Tetracyclin 30 µg 27 3017 Vancomycin 30 µg 0 0
Average 13.06±3.04 12.59±2.93

CARIAnnual Report 2009-2010
133
Antibacterial activity of leaf extract
The leaf acetone extract produced 24 mmzone of inhibition against RSN 6 and 23 mmagainst RSN 12 isolate. An average of 23.5mm zone of inhibition was obtained againstboth the Ralstonia which is much better thanmost of the antibiotics. The leaf chloroformextracts produced 26 and 22 mm zone ofinhibition against RSN6 and RSN 12 isolate.The average zone of inhibition was more inthe chloroform extracts than the acetoneextracts; however, no significant differencewas obtained with both the extracts. Boththe extracts showed more activity against theRSN 6 isolate compared to the RSN 12 isolate.
Antibacterial activity of fruit extracts
The fruit acetone extract produced 14 mmzone of inhibition against RSN 6 and 19 mmagainst RSN 12 isolate. An average of 16.5 mmzone of inhibition was obtained against boththe Ralstonia. The fruit chloroform extractsproduced 15 and 17 mm zone of inhibitionagainst RSN 6 and RSN 12 isolate. The averagezone of inhibition was more in the acetoneextract than the chloroform extract. However,no significant difference was observed withboth the extracts. Both the extracts showedmore activity against the RSN 12 isolatecompared to the RSN 6 isolate (Fig. 1).
Comparison of antibacterial activity ofsolvent extracts with Antibiotics
The antibacterial activity of the leaf and fruitextracts of Morinda citrifolia was 58.82% morethan the antibiotics against the RSN 6 isolate
Fig. 1. Antibacterial activity of solvent extractsagainst RSN6 & RSN 12
of Ralstonia solanacearum. (Table 8). Only 7antibiotics produced more inhibitory activitythan the morinda fruit and leaf extracts. Thebest inhibitory activity was produced indescending order by leaf chloroform (28 mm),leaf acetone (24 mm), fruit chloroform (15 mm)and fruit acetone (14mm) respectively againstRSN 6 isolate. The difference of averageinhibitory activity against the standardantibiotics was more in leaf chloroform (12.94mm), followed by leaf acetone (6.82 mm), fruitchloroform (1.94 mm) and fruit acetone (0.94mm) against RSN 6 isolate.
The inhibitory activity of the fruit and leafextracts against RSN 12 showed that 70.59 %of antibiotics showed less inhibitory activitythan the fruit and leaf extracts of the Morindacitrifolia (Table 9). Only 5 antibioticsproduced more inhibitory activity than thefruit and leaf extracts. The difference ofinhibitory activity against the standardantibiotics was more in leaf acetone (10.41mm) followed by leaf chloroform (9.41mm)fruit acetone (6.41 mm) and fruit chloroform(4.41 mm) against RSN 12 isolate.

CARI Annual Report 2009-2010
134
Table 8. Difference of zone of inhibition with the standard antibiotics
Antibiotics RSN 6
Leaf Fruit Fruit Leaf
acetone acetone Chloroform chloroform Average
Ampicillin 24 14 15 26 19.75
Cephalothin 24 14 15 26 19.75
Chloramphenicol 7 -3 -2 9 2.75
Ciprofloxacin -9 -19 -18 -7 -13.25
Clindamycin 24 14 15 26 19.75
Colistin 24 14 15 26 19.75
Co-trimazole -1 -11 -10 1 -5.25
Erythromycin 2 -9 -8 3 -3
Gentamycin 0 -10 -9 2 -4.25
Gentamycin 3 -7 -6 5 -1.25
Nitrofurantonin 14 4 5 16 9.75
Ofloxacin -6 -16 -15 -4 -10.25
Oxacillin 0 14 15 26 13.75
Penicillin-G 0 14 15 26 13.75
Streptomycin 12 2 3 14 7.75
Tetracyclin -2 -13 -12 -1 -7
Vancomycin 0 14 15 26 13.75
Average 6.82 0.94 1.94 12.94
% Inhibition more 76.47 52.94 52.94 82.35
than the extract
Overall, the best inhibitory activity wasproduced by leaf chloroform and the leastactivity was produced by fruit chloroform(Fig. 2). The inhibitory activity was more inRSN 12 compared to RSN 6. The resultrevealed that both the extracts have producedinhibitory activity against the Ralstonia sppand the same could be used to extractantibacterial activity against the Ralstoniaspp. The potential of the Morinda citrifolia
extracts was found much better than mostof the antibiotics and the same may be usefulagainst the Ralstonia solanacearum.
Effect of Feeding of Morinda citrifolia Juiceto cattle
Morinda citrifolia fruit juice was fed to dairycow @ 100 ml orally daily. A total of 8 adultdairy cows were selected to feed the morindajuice. The effect on daily milk yield, milk pH,

CARIAnnual Report 2009-2010
135
Table 9: Difference of zone of inhibition with the standard antibiotics
Antibiotics RSN 12
Leaf Fruit Fruit Leaf
acetone acetone Chloroform chloroform Average
Ampicillin 23 19 17 22 20.25
Cephalothin 23 19 17 22 20.25
Chloramphenicol 4 0 -2 3 1.25
Ciprofloxacin -6 -10 -12 -7 -8.75
Clindamycin 23 19 17 22 20.25
Colistin 23 19 17 22 20.25
Co-trimazole 5 1 -1 4 2.25
Erythromycin 1 -3 -5 0 -1.75
Gentamycin 1 -3 -5 0 -1.75
Gentamycin 4 0 -2 3 1.25
Nitrofurantonin 23 19 17 22 20.25
Ofloxacin -9 -13 -15 -10 -11.75
Oxacillin 23 19 17 22 20.25
Penicillin-G 12 8 6 11 9.25
Streptomycin 11 7 5 10 8.25
Tetracyclin -7 -11 -13 -8 -9.75
Vancomycin 23 19 17 22 20.25
Average 10.41 6.41 4.41 9.41
% Inhibition more 82.35 70.59 52.94 82.35
than the extract
conductivity, bacterial load, proteinconcentration and effect on treatment ofmastitis was observed over a period of 3months. The animals were fed with morindajuice for 1 month and data of two monthspost feeding were collected and analyzed.The conductivity decreased from 5.5 mho toless than 5.0 mho. The total bacterial countin the mastitis milk was also decreased from5.13x108 to 3.54x10⁸ bacteria. The microbial Fig. 2. Antibacterial activity against RSN 6 & RSN 12

CARI Annual Report 2009-2010
136
load in the mastitis affected right teat wasfound more than the other teat. The microbialload in the right teat was 4.19 x 10⁸ (Fig. 3).
The protein concentration in the normal cow’smilk varied from 21 to 33 µg/ml. In themastitis affected cow’s milk the concentrationvaried from 31.5 to 54 µg/ml. The morindafeeding decreased the protein concentrationin the mastitis milk from 40.83 µg/ml to 20.41µg/ml in 3 weeks period (Fig. 4).
The incidence of mastitis was confirmed bythe change in pH towards higher side andincrease in the conductivity and +ve result
Fig. 3. Microbial load in the mastitis milk
with the CMT. Out of the 11 cows, 3 animalsshowed variation in the pH, +ve to CMT andchange in conductivity. The pattern of themastitis in the different teat of the cowsuggested that the incidence was high in theright rear teat compared to other teat. ThepH varied from 6.7-7.5 in the right rear teat.The feeding of morinda juice to all the mastitisaffected cow showed that the pH of the milkdecreased from 7.0 to 6.6 in all the animals.Among the normal cow no change wasobserved in the pH of cow’s milk with respectto different teat of the cow.
Fig. 4. Protein concentration (µg/ml) in themastitis milk
Jai Sunder, D.R. Singh, S.K. Verma,
A.Kundu and R. C. Srivastava
Feeding of Morinda citrifolia fruit as feedto Japanese quail
An experiment was conducted to study the
feeding of Morinda citrifolia fruit as a feed for
Japanese quail. Three different rations of
quail was prepared by replacing 20%
concentrate feed with Morinda citrifolia dried
fruit granules, 20% with dried azolla
granules and 20% with Morinda fruit and
azolla combinedly. The feed were fed to three
different groups of Japanese quail while one
group was kept as control. The observations
viz. body weight, mortality and feed
conversion were recorded and FCR was
calculated. The FCR at the end of first week
Potential of Morinda citrifolia Fruit as Feed for Livestock and Poultry

CARIAnnual Report 2009-2010
137
of age was lowest in the birds fed with
combination of Morinda and azolla feed (Table
10). At 2nd week of age the best FCR was
observed in the group fed with morinda.
However at 3rd and 4th week of age the FCR
was best in the control group compared to the
other group of birds. The body weight at first
week was highest in the birds fed with
combination of Morinda and azolla feed (Table
11). At 2nd and 3rd week highest body weight
was observed in the birds fed with morinda
feed. However, at the end of 4th week highest
body weight was observed in the control birds
compared to other birds. The body weight at
the end of 5th week was highest in the morinda
fed group. Best FCR was obtained in the birds
of morinda group. The mortality was high in
all the groups during the first four days of age,
however, no mortality was observed after the
2nd week in all the groups.
Table 10. Body weight at different week interval (g)
Week Control Morinda (20% Azolla ( 20% Morinda +azollareplacement ) replacement) ( 20% replacement )
1 15±2.03 19.875±2.68 23.2±1.74 23.25±1.25
2 31.33±3.85 38.16±4.51 33±3.21 32.75±2.69
3 48.4±4.79 57.2±6.76 45.6±3.31 41.33±3.08
4 76.8±6.46 71.6±10.16 66.4±5.07 61.16±2.88
5 106.8±6.65 109.4±7.22 97.2±6.34 97.33±3.04
Table 11. Feed conversion ratio at different week interval
Week Control Morinda (20% Azolla ( 20% Morinda +azollareplacement ) replacement) ( 20% replacement )
1 6.13 5.42 4.94 4.23
2 4.25 3.67 6.67 7.54
3 4.19 5.26 7.27 10.53
4 4.47 7.73 4.86 6.05
5 4.62 3.98 4.48 4.88
Average 4.73 4.38 5.64 6.19

CARI Annual Report 2009-2010
138
S.K. Verma, M.S. Kundu, Subhash Chand,Jai Sunder, I. Jaisankar and Abhay Singh
A total of 35 farm families consisting of 20from North and 15 from South Andamanregion were surveyed for characterization oflivestock production sub-system andassessment of critical nutritional gap in BayIslands. During sample survey, it was foundthat most of the farmers were having smallto medium land holdings. Average landholding was in the range of 0.13 to 2.26 ha-1
family in respect of paddy field and 0.5 to1.0 ha-1 family for plantation crops. Most ofthe farmers were operating mixed farmingsystem comprising of crops, livestock,plantation and horticultural crops. In NorthAndaman, most of the farmers had paddyland and they were engaged in vegetablecultivation along with plantation crops.
Livestock compositions are mostly cattle, goat
and every house hold reared ducks. However
in South Andaman area rearing of chicken
is more prevalent rather than ducks.
Dry Matter requirement of the cows are
mostly met through open grazing during dry
season and in wet season were from the green
grass. After harvesting of paddy the dry
matter requirement is met with the paddy
straw. Only the lactating animals are
supplied with the concentrate feed. However
due to lack of proper knowledge the
concentrate mixture normally observed
deficient with so many nutrients mostly
micro nutrients. In this way the ration of the
cows were observed deficient with micro
nutrients as well as protein leading to low
productivity of the animals.
Characterization of Livestock Production Sub System and Assessment of CriticalNutritional Gap in Bay Islands
Feasibility Evaluation of Growing Fodder During Pre Paddy and Post PaddyPeriod under Rainfed Conditions
S.K. Verma, R.C. Srivastava, T. Subramaniand B.K. Nanda
Farmers of Andaman and Nicobar group ofIslands face severe shortage of green and dryfodder for their livestock round the year asvery little area is under cultivable fodder. Dueto this fact the productivity of the animalsare very poor. Cultivable area is very limited.Therefore the options left are either to utilize
the existing cultivable land judiciously toproduce fodder during that period when nocrop is there in fields or to utilize the landunder coconut and arecanut gardens andnearer to fish ponds. Hybrid napier cuttingsand rooted slips were transplanted on thebank of fish pond. The fodder grass has beenestablished well and producing biomass evenduring dry period. Besides this, Hybrid

CARIAnnual Report 2009-2010
139
napier fodder was transplanted on the ridgesand terrace risers of vegetable block. The grasshas been established well and due to thickgrass canopy, the risers were stabilized verysoon and the soil erosion was checked. Toutilize the space available between twoMorinda plants Hybrid napier and guineagrass were transplanted as Morindaintercrop. Hybrid napier gave an yield of 110q/ha while guinea grass produced 78.4 q/ha (Table 12).
As the cultivable land is meager thereforeconcept of growing pre paddy and postpaddy fodder was exercised. A trial wasconducted to study the feasibility of growingcoix as post paddy fodder crop. The crop wassown on 16th February 2009 and harvestedon 19th May 2009 (92 days). Coix produced
40.26 q/ ha and 77.05 q/ha biomass in highland and low land respectively. As the lowland had more moisture therefore theproduction was more in low land ascompared to high land. In another trial coixsown in the field on 16th November 2009produced a biomass of 70 q/ha.
Possibility of growing fodder crops as prepaddy fodder was also explored. Four cropswere sown on 28th April 2009 at BloomsdaleFarm in five replications and harvested on04th July 2009 after 67 DAS. Coix producedmaximum biomass (85 q/ ha) followed byRicebean (83.2 q/ha), Cowpea (73.9 q/ha),Maize (44.3 q/ha). It is concluded that foddercrops may be taken as pre and post paddycrops successfully to augment the foddersupply to the livestock.
Table 12. Economics of post paddy fodder cultivation
Crops Seed Price of Yield Paddy Paddy Profit
required seed (Rs. (t/ ha) straw straw (Rs./ha)
(kg/ha) 26/kg) eq yield eq price
(t/ha) @ Rs. 5.25
per kg
Coix (High land) 15 390 4.03 1.34 7046 6656
Coix (Low land) 15 390 7.71 2.57 13482 13092

CARI Annual Report 2009-2010
140
S. Jeyakumar, A. Kundu, M.S. Kundu, JaiSunder, T. Sujatha, S.K. Verma, SubhashChand, M. Balakrishnan and R.C.Srivastava
Productive and reproductive performanceof dairy cows
Lactation performance (April 09-March10)of cows showed that mean no. of cows onlactation per month was 9.5±1.03. Meanmonthly production of milk, monthlyproduction of milk per cow and wet average(average daily milk yield of a cow) in lit. was1355.35±139.20, 305.79±82.94 and 4.79±1.95respectively (fig 5). Peak yield of adult(multiparous cows) was significantly (p<0.01)higher (8.05±0.76) than heifers (primiparous)(5.38±0.37). However there was nosignificant difference observed on days toreach peak yield between multi andprimiparous cows. However the overallperformance of the herd was improved thanprevious years. Birth weights (kg) of male
and female calves were 24.58 ± 2.9 and 20.23± 1.2 respectively. Age at first calving was3.82±0.2 years in crossbred heifers.
Sonometric characteristics of crossbredbovine teat
Udder health and teat parameters are im-portant for application of machine milkingoperation, hygienic milk production and fortaking preventive measures against mastitis.Our previous study showed that ultrasonog-raphy is considered as a valuable non-inva-sive research tool to study the physiopathol-ogy of the bovine udder and teat. In thepresent study the 56 teats of fourteen lactat-ing cross bred cows (n=14) were examinedby brightness mode (B-mode) ultrasonogra-phy. A real time B mode portable ultrasoundscanner [SA-600V (Medison Co.Ltd, Korea)]fitted with a 7.5 MHz linear array triple fre-quency transducer was used for scanning.The sonographic image of interest was fixed
Fig 5. Total milk production and wet average ofcrossbred cows Plate 13. Sonometry of cow's teat
Enhancement and Sustainable Dairy Cattle and Buffalo Production inBay Islands

CARIAnnual Report 2009-2010
141
by using the freeze mode and characteris-tics and measurements were recorded. Inlactating cows, the teat sinus, teat cisternand gland cistern were imaged by waterbath method. Ultrasonographic examina-tion using water bath method allowed clearvisualization and measurement(sonometry) of teat anatomical character-istics viz. connective tissue thickness at
sphincter muscle, teat canal length, diam-eter, teat end, mid and base width, teat wallthickness, teat cistern width and length(Table 13 ). Hence, the present findings sug-gest that the water bath based ultrasonog-raphy proves to be a valuable diagnosticmethodology and provides an accurate fea-tures and estimation of bovine teat char-acteristics.
Gut micro flora and its antibiotic sensitivitypattern in calves
A total of 23 faecal samples were collectedfrom calves (4 months old) and screened forisolation and identification of the bacterialflora. A total of 29 bacterial isolates have beenisolated and identified and the all bacteriabelong to Gram –ve type. E.coli and theEnterobacter spp. were the most commonisolates of the faecal microflora. The new
bacteria identified from the faecal swab wereCedecea spp and Pantoea spp. The antibioticresistant ability against the five commonantibiotics revealed that all the antibioticswere effective against the bacterial isolates.The bacteria showed absolute sensitivity togentamicn, ciprofloxacin and penicillin G.However the field isolates showed higherresistant pattern against commonly availableantibiotic which could be due to prolongedor indiscriminate usage.
Table 13. Sonometric characteristics (overall mean±se) of teats of crossbred cows
Teat parameters (in mm) Right Fore Left Fore Right Hind Left Hind
(n=14) (n=14) (n=14) (n=14)
Teat length 45.00 ± 2.3 44.71 ± 2.3 44.71 ± 2.4 42.57 ± 1.9
Connective tissue thickness 9.33 ± 0.3 8.14 ± 0.6 8.64 ± 0.4 9.00 ± 0.6
Teat canal length 11.17 ± 0.4 10.71 ± 0.5 11.21 ± 0.5 10.14 ± 0.4
Teat canal width 2.00 ± 0.0 2.00 ± 0.0 2.07 ± 0.1 1.93 ± 0.1
Teat cistern length 39.33 ± 1.3 37.57 ± 2.3 34.57 ± 2.3 35.57 ± 2.5
Teat cistern width 11.67 ± 1.2 12.57 ± 0.9 11.93 ± 0.8 10.36 ± 1.0
Teat wall thickness 6.50 ± 0.2 6.66 ± 0.2 6.66 ± 0.2 6.75 ± 0.3
Teat base (top) width 27.50 ± 1.0 29.21 ± 1.1 27.70 ± 1.3 29.57 ± 1.1
Teat mid width 23.50 ± 0.9 25.14 ± 1.0 23.79 ± 0.9 25.21 ± 1.0
Teat end width 17.00 ± 1.3 16.21 ± 0.8 15.64 ± 0.8 15.71 ± 0.8

CARI Annual Report 2009-2010
142
of Agriculture, Govt. of India. This is asignificant achievement of CARI towardsboosting islands dairy industry.
Animal and agricultural wastemanagement through Vermicomposttechnology
The availability of nutrients in the islands at
farmers’ field is a major constraint to theenhancement of productivity. To evaluatefeasibility of meeting nutrient requirement ofinstitute farms from vegetative waste andanimal waste, a pilot project has beeninitiated to convert all the dung andagricultural wastes produced in the institutein vermicompost. With this in aim, avermicompost unit has been established. Ithelps in both way- cleaning of the campusesin one way and on the other hand a valuablevermicompost product is produced.
The unit comprises of three tanks with aproposed handling of 9900 kg of bio residues,7200 kg dung and 900 kg of glyricidia andwith annual expected production of 96 T.This eco-friendly system will be efficient inhandling the animals and agricultural wasteand would yield huge quantity of organicfertilizer to the crops of CARI farms. Inaddition to utilization of bio waste theunwanted bushes/weeds available in theexperimental plots, farm area, and institutecampus are cleared regularly to maintain
cleanliness and improve the yield of crops.
Plate 15. Clearing of bushes/weeds and collection of plantation waste
Plate 14. Distribution of crossbred germplasm
Distribution of crossbred cattle germplasmto the farmers towards augmentation ofdairy production in the islands
For the first time by the institute and underthis project, Division of Animal Science, CARIhas distributed 17 crossbred dairy cattle to thefarmers of these islands through the NationalCooperative Union of India (NCUI), Ministry

CARIAnnual Report 2009-2010
143
Plate 17. Chaffing of bushes/weeds and plantation waste for quick composting
Plate 16. Transport of bushes/weeds and plantation waste from farm premises
Plate 19. Vermicompost unit, pit and vermicomposting in progress
Plate 18. Collection system of animal waste (dung) and farmyard manure for composting

CARI Annual Report 2009-2010
144
S. Jeyakumar, Jai Sunder, M.S. Kundu,A.Kundu, S. K. Verma, M. Balakrishnan,Subhash Chand, S.K. Zamir Ahmed andR. C. Srivastava
Productive and reproductiveperformance of goats
A total number of 15 kidding wererecorded during the period of study.Composition of birth (Fig. 6 ) revealed thatthe usual number of kids born at one timevaried from single to twins, of whichpercentage of singles (53.33) were morefrequent than twins (46.66).The overallbirth weight of kids born as single andtwins was 1.48±0.14 and 1.60±0.14respectively. Mean birth weight of maleand female kid was 1.63±0.14 and1.46±0.15 respectively. However, therewas no significant difference observedbetween male and female kids. Dam
weight at birth was 25.41±0.78 kg.
Plate 20. Goat meat market in Port BlairFig. 6. Composition of birth and birth weight ofkids
Carcass yield characteristics of 4 male and8 female goats were studied. The carcassyield was significantly (p<0.01) higher inmales (50.13±1.18) than females(41.36±0.98). However no significantdifference was observed on head, leg, skin,pluck, blood, liver, spleen, stomach andintestine of male and female carcass.
Goat meat production and marketing
channels in islands
The goat meat production andconsumption pattern varies with theisland and the ethnic group. The numberof goats slaughtered in a year was 11, 000(2004 – 05) and the average yield of meatper goat was 11.52 kg. The average yieldof goat meat was higher in Andaman thanthe national average (9.28 kg). Studies onmarketing system and channels revealedthat there is existence of 6 channels in
meat goat production to consumption in
the islands (Fig. 7).
Productivity Enhancement of Goats in Bay Islands

CARIAnnual Report 2009-2010
145
Fig. 7. Marketing channels of goat meat production to consumers
Plate 24. Antibiotic sensitivity pattern
Identification of gut microbes and itsantibiotic sensitivity pattern in kids
Out of 17 goat kid faecal samples a total of
19 bacteria have been isolated. The majority
of the organisms were gram positive (94.73
%) than gram negative (5.26%). Majority of
the isolates were E.coli (16) and Salmonella
spp. (3). The resistance pattern of the isolates
showed that majority of the isolates is
sensitive to antibiotics.

CARI Annual Report 2009-2010
146
S. Jeyakumar, Jai Sunder, A. Kundu and V.Thiagarajan
Genotype number and frequency
Genotyping of each locus was carried outafter scoring the alleles from the gel. A totalof 50 genotypes were observed across the 15loci. The number of genotype varied between(MAF70; SRCRSP3) 1 and 6 (SRCRSP15).The observed number of alleles (No), effectivenumber of alleles (Ne), observedheterozygosity (Ho), expected heterozygosity(He) and F-statistics (FIS) value are given in
table 14 & 15. The effective number of alleles(Ne) varied from 2 to 6.98 in Teressa goatand 2 to 4.31 in local goats.
F-Statistics
FIS, FIT and FIT values were calculated andheterozygosity deficiency at each locus usingFSTAT software (Wier and Cockerham,1984). All the values of FIS obtained for theTeressa and Andaman local goats werenegative which is suggestive of no inbreedingwithin the populations and the animals wereoutbred.
Conservation and Phenotypic and Molecular Characterization of IndigenousGoats of Andaman and Nicobar Islands
Table 14. Measures of genetic variation across microsatellite loci in Teressa goat
Loci Size range Teressa Goat
No (Ne) Ho(He) FIS
SRCRJSP5 110-139 4.0(3.44) 1.0(0.72) -0.398
MAF70 132-182 2.0(2.00) 1.0(0.51) -1
SRCRSP23 145-177 2.0(2.00) 1.0(0.51) -1
OarFCB48 64-86 2.0(2.00) 1.0(0.51) -1
INRA023 116-136 3.0(2.60) 1.0(0.63) -0.61
SRCRSP9 120-130 3.0(2.60) 1.0(0.61) -0.67
OarAE54 102-136 4.0(3.52) 1.0(0.73) -0.379
INRA063 107-141 2.0(2.00) 1.0(0.51) -1
SRCRSP7 180-300 2.0(2.00) 1.0(0.51) -1
SRCRSP15 176-397 5.0(4.67) 0.75(0.80) 0.064
ETH10 220-357 5.0(4.41) 1.0(0.79) -0.277
INRABERN185 396-790 6.0(5.17) 0.79(0.82) 0.04
BM6444 108-255 5.0(4.95) 0.96(0.79) -0.225
P19(DYA) 211-290 4.0(3.63) 1.0(0.74) -0.363
TCRVB6 191-509 8.0(6.98) 1.0(0.87) -0.149

CARIAnnual Report 2009-2010
147
Bottleneck analysis
Populations that have experienced a recentreduction in their effective population sizeexhibit a corrective reduction of the allelenumbers and heterozygosity (He) atpolymorphic loci. But the allele numbers isreduced faster than the heterozygosity. Thus,in a recently bottlenecked population, theobserved heterozygosity is higher than theexpected equilibrium heterozygosity, whichis computed from the observed number ofalleles, under assumption of a constantpopulation size.
The data were subjected to statistical analysisto test for heterozygosity excess. Three testsviz. Sign-rank test, standardized differencestest and Wilcoxon test utilized in each of thethree models of mutations, IAM, SMM andTPM revealed a significant heterozygosityexcess for both goat populations rejecting thenull hypothesis of mutation drift equilibrium.The mode-shift test indicated the geneticbottleneck in Teressa and Andaman Localgoats, which is depicted in Fig. 8 and 9.
A total of 50 genotypes were observed acrossthe 15 loci. The number of genotype varied
Table 15. Measures of genetic variation across microsatellite loci in Andaman Local goats
Loci Size range Andaman Local Goat
No (Ne) Ho(He) FIS
SRCRJSP5 254-643 2.0 (2.00) 1.0 (0.51) -1
MAF70 132-182 2.0 (2.00) 1.0 (0.51) -1
SRCRSP23 101-165 2.0 (2.00) 1.0 (0.51) -1
OarFCB48 210-291 4.0 (3.81) 1.0 (0.75) -0.342
INRA023 178-310 3.0 (2.67) 1.0 (0.64) -0.59
SRCRSP9 144-656 5.0 (4.31) 1.0 (0.78) -0.286
OarAE54 80-131 2.0 (1.98) 0.9 (0.50) -0.806
INRA063 176-278 3.0 (2.72) 0.92 (0.65) -0.438
SRCRSP7 102-186 4.0 (3.81) 1.0 (0.75) -0.342
SRCRSP15 132-173 3.0 (2.66) 1.0 (0.63) -0.592
ETH10 107-128 2.0 (2.00) 1.0 (0.51) -1
INRABERN185 142-191 3.0 (2.63) 1.0 (0.64) -0.591
BM6444 118-183 3.0 (2.67) 1.0 (0.64) -0.59
P19(DYA) 145-243 4.0 (3.81) 1.0 (0.75) -0.342
TCRVB6 269-398 2.0 (2.00) 1.0 (0.51) -1
No = Observed number of alleles, Ne = Effective number of alleles, Ho = Observed heterozygosity, He= Expected heterozygosity, FIS = F-Statistics value

CARI Annual Report 2009-2010
148
between (MAF70; SRCRSP3) 1 and 6(SRCRSP15). The Observed number of alle-les (No), effective number of alleles (Ne), ob-served heterozygosity (Ho) Expected het-erozygosity (He) and F-statistics (FIS) wereanalyzed. The effective number of alleles (Ne)varied from 2 to 6.98 in Teressa goat and 2to 4.31 in local goats. All the values of FISobtained for the Teressa and Andaman lo-cal goats were negative which is suggestiveof no inbreeding within the populations andthe animals were outbred. The mode-shift test
indicated the genetic bottleneck in Teressaand Andaman Local goats and needs greaterattention towards in situ/ex situ conservation.It is concluded that the Andaman Local Goatand Teressa goats are considered as an in-digenous goat breed / germplasm belongingto this island territory. The information elu-cidated through the present study would beuseful for the formulation of effective con-servation strategies for sustainable mainte-nance and identification of quantitative traitloci for marker-assisted selection.
Arun Kumar De, M.S.Kundu, S. Jeyakumar,Jai Sunder, A. Kundu and S.K. Verma
Standardization of protocol of PCR(Polymerase Chain Reaction) foramplification of genomic DNA usingmicrosatellite primers of pig
Blood samples were collected from pigsmaintained in our institute farm as well as
from native pigs of farmer’s field. Bloodsamples were also collected from pigs of anewly identified breed in these islands. Thebreed is mostly available at Baratang andMayabander area of Andaman & NicobarIslands. Phenotypically they have uniquecharacters with long shiny backwardlycurved bristles and long tail for both malesand females. The adult weight is about 65 Kg
Molecular Characterization of Indigenous Pigs of Bay Island byMicrosatellite Markers
Fig. 8. Mode shift graph of Teressa goat Fig. 9. Mode shift graph of Andaman Local goat

CARIAnnual Report 2009-2010
149
for male and 60 Kg for female. They are muchmore docile and lazy than western pigs. Theage at first farrowing is about 300 days withlitter size about 7-8. They are maintaining a goodhealth with low plane of nutrition. DNA wasisolated by standard procedure of phenol/chloroform method. PCR protocol wasstandardized for four set of FAO recommendedmicrosatellite primers. Each 25 µl reactionconsisted of DNA (100 ng), primers (50 ng each),dNTPS (50 mM each), 2.5 µl of 10 X buffer andTaq DNA polymerage (0.75 unit) (Table 16).Plate 22. Newly identified pigs
Table 16. Set of FAO recommended microsatellite primers standardized for PCR protocol
Primer sequence Annealing temp.(0C)
Foreward-
ATAGACATTATGTCCGTTGCTGAG 62
Reverse-
GAACTTTCACATCCCTAAGGTCGT
Foreward-
TCCTTCCCTCCTGGTAACTA 58
Reverse-
GCACTTCCTGATTCTGGGTA
Foreward-
AGTGGTCTCTCTCCCTCTGCT 62
Reverse-
CCTTCAACCTTTGAGCAAGAAC
Foreward-
CCAAGACTGCCTTGTAGGTGAATA 58
Reverse-GCTATCAAGTATTGTACCATTAGG

CARI Annual Report 2009-2010
150

CARIAnnual Report 2009-2010
151
S. Dam Roy, P. Krishnan, Kamal Sarma,Grinson George, S. Murugesan and BennyVarghese
Andaman and Nicobar islands situated inBay of Bengal have numerous bays, creeks,lagoons and islets with varying depths anddifferent substrate which are suitable for cageculture. This project was conceived with anobjective of designing cages suitable for
protected bays and evaluating the feasibilityof culture of groupers in Andaman.
Four cages of 5x4x3m each were fabricatedusing wooden frames and made afloat using24 empty barrels (Plate 1). Two anchors of50kg were used to anchor them at Minnie Bay.The net webbing procured from CIFA,Bubaneshwar were fit in the mainframe andtied to the vertical supports.
Plate 1. A view of the cages
Grouper belonging to Cephalopholis sp. (C.
argus, C. minieta, C. boenex and C. milliaris)
and Epinephelus sp (E. merra, E. fasciatus and
E. longispitis) were caught from North Bay
& Chunnapatta offshore area. 210 fishes of
162.1 ±26.95 mm length and 62.11±32.18 g
weight were stocked in two cages each
measuring 5x4x2m. They were fed everyday
with low value fishes like Sardinella sp. at 5%
of body weight. The net webbings of the
cages were scrubbed at fortnightly intervals
to maintain water flow. The growth was
recorded after 4 months and a 67% increase
in weight was observed with about 90%
survival. In the creek area, high turbidity and
intense fouling were the major issues which
necessitated frequent cleaning of the net
webbing and the frames.
Cage Culture of Commercially Important Marine and Brackishwater Fishesin Protected Bays & Creeks of Andaman

CARI Annual Report 2009-2010
152
Plate 2. Sampling work underway in the cages
The water quality parameters of the cages weremonitored regularly and it was found thatdissolved oxygen (4.0-5.0 ppm), salinity (30-34ppt), pH (7.8-8.1) and alkalinity (120-135ppm)were within the acceptable limits for fish culture.
After the first sampling (Plate 2), the net cageswere damaged by the crabs resulting ininadvertent loss of the fishes. The cages weresubsequently shifted further away from theshore where the depth below the cage duringthe lowest low tide was 4 m. About 150 fishesbelong to the same species were collectedafresh and stocked in the cage. The averageinitial length and weight of the fishes were201.7±27.57 mm and 90.06±41.40 g
respectively. The fishes were fed with chickenoffal and trash fish @ 5% of body weight.Sampling was conducted at quarterlyintervals. The fishes recorded a growth of34.04% in three months with 98% survival.The culture lasted for a period of six monthsand the fishes reached 268.43±33.56 mm inlength and 161.36±52.64g in weight,registering a growth of 79.17% with 96.81%survival. These successive cultureexperiments suggested that the cannibalismin the groupers can be checked by resortingto proper feeding and the fishes can besuccessfully cultured in cages in the protectedbays and creeks in Andaman.
C.S. Chaturvedi, S. Dam Roy, Kamal Sarma,Grinson George and Benny Varghese
The Indian Magur, Clarias batrachus ishighly priced, delicious, nutritious and apreferred fish for consumption throughout
the country. It breeds once in a year instagnant waters during monsoon. Secondarysexual characters are generally moreprominent during breeding season.Interestingly magur are found in the paddy
Production of Commercially Important Cat Fishes: Clarias Batrachus (IndianMagur) and Heteropneustes Fossilis (Singhi) in Andaman and Nicobar Islands

CARIAnnual Report 2009-2010
153
fields and freshwater ponds of Andamans.Some of the airbreathing fishes like magur,singhi and climbing perches were introducedby the migrants of A&N Islands. Theobjective of the project was to standardizethe breeding technique of air-breathing fisheslike Clarias batrachus and Heteropneustesfossilis in the island condition. Initially thebrood fishes were collected from the localmarket and villages.
Broodstock of C. batrachus & H. fossilis werereared in outdoor cemented tanks (8x3x1m)wherein black soil base of 7.5-10.0 cmthickness was provided. The brooders werefed with boiled egg and also fish meal andprawn powder in a ratio of 1:1 @ 5 % of theirbody weight. The condition of brood fisheswas examined periodically. During the year,24 sets were selected for hypophysationtechnique and 90% of the fishes bredsuccessfully. A total of 10,432 cat fish spawnswere produced and reared in indoor hatcherysystem developed in the institute for thispurpose. The magur spawn were reared for
12-15 days in indoor hatchery system. Thespawn were stocked in the indoor hatcheryat a density of 2000-3000/m2. The depthof water in rearing tanks was maintainedas 6-8 inches. The catfish spawn were fedfrom the 5th day onwards with mixed feedhaving 30% protein, after the absorptionof yolk sac. During rearing period, propershelter was provided for the magur fry. Frywere fed ad libitum.
The cat fish larval development unitconsisted of a spawn rearing unit (circulartank of 1m diameter) and a fry rearing unit(3x1x1 m). The spawn rearing unit is basedon a flow-through system, consisting of 20troughs (30 cm dia and 8 cm height),arranged in two rows and interlinked to eachother. The full system is mounted on aplatform and connected to aeration and awater source during operation. Using thisunit, a survival of 60% was obtained undercontrolled conditions. There was an instanceof natural breeding of C. batrachus in
Removal of testis, magur Magur hatchlings

CARI Annual Report 2009-2010
154
Fertilized eggs of magur Fingerlings of magur
Supply of magur fingerlings
Plate 3. Activities in the Catfish hatchery
controlled condition where the male was notsacrificed. However, refinement of the magurbreeding is underway. The fingerlings weretransferred to the grow-out tank (8x3x1 m)and fed with mixed feed @ 5%. About 4,000seeds were distributed to private fishfarmers at the rate of Re. 1 per seed. Thelarval stages and fingerlings of magur areshown in Plate 3.
Apart from breeding, a polycultureexperiment was attempted with four species
viz., catla, rohu, and magur in cemented
pond (8x3x1m) under semi intensive
management. The fingerlings were stocked
@ 5/m2. The fishes were fed with rice bran
and mustard oil cake (1:1) @ 3% of their
body weight. The average size of catla, rohu
and magur were 142mm, 112mm and 130
mm respectively while the weight was 31g,
12.4g and 20g respectively. The culture isunder progress.
Naturally bred magur fry

CARIAnnual Report 2009-2010
155
Kamal Sarma, S. Dam Roy, GrinsonGeorge, C. S. Chaturvedi, Benny Vargheseand S. Murugesan
Objective of the project is to study thevariability of water quality parameters inAndaman waters and implication ofvariability on organism level. Analysis ofwater quality parameters were done fromsix different sites viz. Chatam, Phoenix jetty,brackishwater potential site of Sippighat,mangrove site of Sippighat, coral reef site atWandoor and North Wandoor of the southAndaman. Different important water quality
parameters like water temperature, primaryproductivity, dissolved oxygen, pH, carbondioxide, salinity, alkalinity, phosphate andnitrate were estimated from April 2009 to Feb.2010. In Phoenix jetty low DO level and highalkalinity, nitrate and phosphate levels wereobserved. This might be due to the dischargeof sewage in that area. Gross productivity, netprimary productivity and respirationrequirement were 372.5 - 401.3, 160.67 -176.3and 15.07 -15.3 mg C/m3/h respectively.
To generate data on effect of pollution on theaquatic organisms, a comparative study was
Table 1. Variations in the water quality parameters from two different ecosystems
No. Parameters January 2010 February 2010 March 2010
North Phoenix North Phoenix North PhoenixWandoor Jetty Wandoor Jetty Wandoor Jetty
(unpolluted) (polluted) (unpolluted) (polluted) (unpolluted) polluted)
1. Temperature (0C) 29 31.066 31 30.85 31 31.5
2. DO ( mg/ L) 4.8 2.08 5.2 2.4 4.4 3.2
3. DO% 79.1 73.79 83.8 78.05 75.7 77.04
4. pH 8.4 8.436 8.35 8.388 8.35 8.48
5. Salinity ( g/ L) 33.71 31.235 32.99 31.45 33.35 31.915
6. Turbidity ( NTU) 20.4 21.52 18.2 21.4 20.8 24.37
7. Alkalinity ( mg/ L) 116 145 108 142 130 142
8. CO2 ( mg/ L) nil 4.0 nil nil nil nil
9. Nitrite ( mg/L) 0.0060 0.0138 0.0075 0.0127 0.0063 0.0115
10. Nitrate ( mg/L) 0.17 1.00 0.42 0.58 0.33 0.67
11. Phosphate (mg/L) 0.03 0.20 0.06 0.07 0.03 0.05
Temporal and Spatial Variability of Water Quality Parameters and MineralProfile of Waters of Andaman and their Impact on Shellfishes and Finfishes

CARI Annual Report 2009-2010
156
conducted on oysters present in polluted(Phoenix jetty) and unpolluted water bodies(North Wandoor). Average length, weight,meat yield of the oyster sample collectedfrom North Wandoor sample were relativelyhigher compared to Phoenix jetty sample.Glycogen and ascorbic acid concentrationwas higher in North Wandoor samplecompared to Phoenix jetty (Table 1). Therewas no significant difference in theparameters recorded in three dry monthsstarting from Jan. to Mar. 2010. To record
the enzymatic activity acetylcholine esteraseand alkaline phosphate enzyme activity,two important enzymatic biomarkers forenvironmental studies were estimatedbetween two places. It was observed thatboth the enzymes were relatively less activein oysters collected from Phoenix jettysample compared to the North Wandoorsample. However there were not manyvariations observed in proximatecomposition of oysters between twodifferent places (Table 2).
Table 2. Biological biochemical parameters of Crassostrea rivularis collected fromtwo different ecosystems
1* on dry weight basis2* μg ascorbic acid / g of wet tissue3* mg glycogen/g of wet tissue4∗ μ moles of acetyl choline hydrolyzed /mg
protein/minute at 370C5* n moles of paranitrophenol released/ mg
protein/ minute at 370C
Parameters North Wandoor Phoenix jetty
Biological parametersLength ( cm) 11.757±0.31 7.213 ±0.28Weight ( g 205.16 ±12.91 62.8452 ±3.03Min. & Maximum Length ( cm) 9.5 - 13.3 5.88 -9.1Min. & Maximum weight ( g) 113.89 - 331.48 42.101- 92.715Average meat yield 9.846±1.11 3.85±0.30Shell yield (%) 95.612±1.04 94.065±1.04Meat yield (%) 4.388±1.04 5.935±1.55Proximate composition
Moisture (%) 80.25±1.25 77.81±1.92Fat (%) 1* 15.38±0.56 13.53±0.57Protein (%)1* 57.73±0.39 58.41±1.55Ash (%)1* 11.72 ± 0.68 10.69 ± 0.35Biochemical parameters
Ascorbic acid in liver2* 159.44 ±16.84 92.56 ±10.01Glycogen content in liver3* 0.51±0.02 0.14±0.01Acetylcholine esterase activity in gill4* 0.023±0.003 0.019± 0.002Alkaline Phosphatase activity in gill5* 25.609 ±2.86 13.827 ±2.041

CARIAnnual Report 2009-2010
157
S. Dam Roy, Kamal Sarma, GrinsonGeorge and P. Krishnan
Groupers, belonging to the family Serranidae,
are chiefly marine fishes of tropical and warm
areas while some are found in fresh and
brackishwater areas also. The subfamilies
that are included in Family Serranidae are
Epinephelinae and Anthinae. They include the
Table 3. Region wise landing of Groupers and Snappers
Region Places studied Groupers Snappers Period
Aethaloperca rogaa Aprion virescens Jun 09-Cephalopholis argus Lutjanus argentimaculatus Feb 10
South Junglighat, C. miniata L.boharAndaman Chatham, C. sonnerati L. gibbus
Dugnabad, Epinephelus malabaricus L. lunulatusPanighat, E. tauvina L. malabaricusGuptapara, E. caeruleopunctatus L. erythropterusWandoor, E. bleekeri L. deccusatusNeil Island, E. aerolatus L. russelliHavelock E. fuscoguttatus L. madrasBaratang , E. flavocaeruleus L. fulviflammaHut Bay E. fasciatus Variola louti
E. areolatusE. merra
Middle Kadamtala , Cephalopholis miniata Lutjanus gibbus May-Andaman Rangat, Epinephelus malabaricus L. bohar Jun 09
Betapur (RRO) E. tauvina L. argentimaculatusE. aerolatus L. fulvusE. fasciatus
North Mayabunder, Cephalopholis miniata Lutjanus bohar Nov-Andaman Panighat, C. argus L. argentimaculatus Dec 09
Kalighat, C. sonnerati L. malabaricusDurgapur, Epinephelus tauvina L. gibbus
E. malabaricus L. deccusatusE. caeruleopunctatus L. fulvusE. fuscoguttatus
Nicobar Car Nicobar, Epinephelus tauvina Lutjanus bohar June –group Kamorta, E. malabaricus L. gibbusL. fulvus July 09Islands Katchal, E. aerolatus L. malabaricus
Terressa, E. fuscoguttatusCampbell Bay, E. fasciatus
Aethaloperca rogaa
Distribution, Abundance and Stock Assessment of Groupers and Snappersof Andaman Waters

CARI Annual Report 2009-2010
158
worlds’ most important food fishes and some
are strikingly beautiful and coloured. They
are carnivores in feeding habit and are
oviparous and protogynus. Snappers are also
important food fishes in our region, which
are noted for the species diversity rather than
the abundance. Snappers are found in the
shallow inshore waters, inhabiting in therocky and coral reef areas, where they areusually caught on hand-lines and traps. Thecommon genera under this group are Aprion,Gymnocaesio, Aphareus, Lipochellus,
Pristipomoides, Symphysanodon, Caesio,Glabrilutjanus, Macolor, Pinjalo, Lutjannus,Paracaesio, Apsilus. The common groupersand snappers landed in A&N islands areshown in Plate 4.
A survey was carried out on various landingcenters situated at North, Middle and SouthAndaman and the Nicobar group of Islandsto study the availability of grouper andsnappers at various landing centers. Theoccurrence of different groupers and
snappers in the daily catch of the fishermen
Table 4. Morphometric data of commercially important species of Grouper and Snap-pers in A&N Islands
Name of the species Length (cm)* Weight (kg)*
Cephalopholis miniata 49.91 ± 2.57 1.64 ± 0.20
C. argus 43.87 ±3.70 1.32 ± 0.25
Epinephelus fasciatus 51.66 ± 2.46 1.32 ± 0.07
E. caeruleopunctatus 36.72 ± 0.37 1.29 ± 0.05
E. fuscoguttatus 80.65 ± 1.17 5.56 ± 0.17
E. merra 54.06 ± 1.86 1.98 ± 0.11
E. malabaricus 54.44 ± 0.71 2.17 ± 0.06
E. tauvina 38.51 ± 2.52 1.61 ± 0.37
E. bleekeri 40.82 ± 3.00 1.22 ± 0.23
Lutjanus erythropterus 36.35 ± 0.12 1.23 ± 0.01
L. deccusatus 25.58 ± 0.80 0.32 ± 0.04
L. gibbus 35.50 ± 1.56 0.96 ± 0.05
L. lunulatus 37.45 ± 0.71 1.14 ± 0.05
L. madras 51.79 ± 0.60 1.43 ± 0.04
L. quinquelineatus 23.77 ± 0.56 0.23 ± 0.01
L. bohar 43.60 ± 0.84 0.98 ± 0.05
Variola louti 74.00 ± 3.12 4.62 ± 0.53
* Mean ± Standard Error

CARIAnnual Report 2009-2010
159
were recorded (Table 3). The craft and gearused for catching these important varietiesvaried from place to place but gill net andhook & line were found to the predominantgears used for catching these fishes. Theaverage length and weight of the
commercially important groupers andsnappers landed in the Islands aresummarized in Table 4. A comprehensivestudy on the food and feeding habit of thefishes and their distribution in relation tothe productivity of the waters is underway.
Plate 4. Groupers and Snappers landed in A&N Islands
Epinephelus macrospilos (Bleeker) Cephalopholis sonnerati (Valenciennes)
Epinephelus flavocaeruleus (Lacepede) Epinephelus areolatus (Forsskal)
Lutjanus argentimaculatus (Forsskal) Lutjanus gibbus (Forsskal)
Lutjanus fulvus (Schneider) Lutjanus bohar (Forsskal)

CARI Annual Report 2009-2010
160
Grinson George, S. Dam Roy, C.S.Chaturvedi, Kamal Sarma, S. Murugesanand Benny Varghese
Andaman waters are rich in marine
ornamental fish resources. Damsel fishes are
the priced ornamental fishes, living in
association with sea anemone in the coral reef
areas. This project has been taken up with
the initial objectives to survey the damsel fish
resources. Line Intercept Transect (LIT)
method was adopted for successful
estimation of ornamental fish resources of the
islands. In the present study, the substratum
preference and distribution of anemone
fishes were estimated from 10 transects at
three selected sites (disturbed, semi disturbed
and undisturbed) in the North Bay island.
Out of the whole substratum more than 52%
was constituted by corals (Fig. 1). Among the
fauna, total of 80.9% was constituted by
fishes with anemone fishes representing
about 7.5%. Anemones constituted about
3.2% of the fauna in the study area (Fig.2).
The ratio between the anemone fishes and
anemone was almost similar in all transects.
However, availability of anemone (7.9%) and
anemone fishes (15.6%) were much higher
in undisturbed areas compared to semi-
disturbed and disturbed area.
Development of ornamental brood stock for
breeding purpose is a major objective of this
project. Amphiprion alkallopsis, A. ephippium
and Premnas biaculeatus are collected from
wild and maintained in the hatchery for
development of suitable breeding pair by
simulating natural conditions. After
maintaining the fishes for a month P.
biaculeatus responded positively and 5
Fig. 1. Percentage distribution of differentsubstratum recorded during the transect survey
Fig. 2. Distribution of anemone fishes and otherliving organisms recorded during the transectsurvey from different locations off North Bay
Broodstock Development and Breeding of Damsel Fishes

CARIAnnual Report 2009-2010
161
Just after spawning showingparental care
4 cell stage Gastrulation (24hr)
Blood circulation started (72hr) Rudimentary gut cavity andPectoral fin visible ( 96 hr)
vertebrate column, eye, pericardialcavity clearly distinctive (48hr)
breeding pairs were formed. Out of these
pairs one pair spawned in the 5th month.
The eggs of P. biaculeatus are adhesive in
nature, capsule shaped and yolk mass
occupying three fourth of the egg. Both the
parents were engaged in egg tending
activities and males were more pronounced
from 5th day onwards. Average size of the
egg was 1.705±0.02 mm. The first cell
division was observed within 40-60 min
after fertilization. Subsequently the cell
division was going on rapidly and eggs
hatched out in 6½ days (152-159hr) after
fertilization. Details of embryonic
development from egg to hatchling were
recorded and photographed. The larvae
(3.724 ±0.05 cm) after hatching were active
swimmers and started feeding on rotifers
after yolk absorption (12-24 hr). Continuous
illumination was provided to the larvae.
Some of the important development stages
are given in Plate 5.

CARI Annual Report 2009-2010
162
Eggs more or less opaque.Twisting movement became
more vigorous (152hr)
After yolk absorption. Melanophoreintensity increased ( 12 hr after hatching)
Body twisting movement wasmore (120 hr).Gut cavity &
gill arches were clearly visible
Plate 5. Development stages of Premnas biaculeatus
P. Krishnan, S. Dam Roy, Kamal Sarma,S. Murugesan and Jai Sundar
Marine sponges were being exploited for arange of commercial products from cushionto inner pad of the helmets till the discoveryand wide use of synthetic sponges in 1950s.However, apart from this physicalapplication, of late they are globally realizedas candidate organisms for explorationunder drug from sea projects. About 8000sponge species have been described globallyagainst the estimated 15,000 species. InIndia, so far only 486 species of sponges havebeen identified, of which about 15% are fromAndaman. Considering the paucity of studieson the sponge biodiversity in Andaman andtheir significance in nutrient cycling,maintaining reef health and as potentialproducers of future drugs, the presentinvestigation was initiated to document the
marine sponge resources in the coastal watersof North Bay and Pongi Baalu in SouthAndaman. The sponges were identifiedtaking assistance from Zoological Survey ofIndia, Port Blair (Plate 6).
The antimicrobial activity of the host vis-à-vis the associated bacteria was characterizedfor Ircinia sp, a marine sponge collected fromNorth Bay. The total heterotrophic bacterialcount associated with Ircinia sp was foundto be 5.8x10⁶ cfu cm-2. About 70 bacterialstrains belonging to three differentmorphotypes were isolated and wereassigned to Vibrio sp., Aeromonas sp., Bacillussp., Corynebacterium sp., Pseudomonas sp.,Streptococcus sp., Enterococcus sp., Neisseriasp., Veillonella sp., Citrobacter sp. andKlebsiella sp., based on their morphological,physiological and biochemical properties.The bacteria which were specifically
Characterization of the Role of Associated Bacteria in the Bioactivity ofMarine Sponges from Andaman

CARIAnnual Report 2009-2010
163
Diacarnu sp Crella cyathophora Chalinula nematifera
Stylissa carteri Monanchora arbuscula Cliona sp
Ircinia strobilina Liosina paradoxa Ecionemia acervus
Carteriospongia foliascens Plakortis sp Oceanapia sagittaria
Plate 6. Sponges collected from North Bay and Pongi Baalu

CARI Annual Report 2009-2010
164
associated with the sponge were obtained byexcluding the isolates with similarcharacteristics and also those present insurrounding water samples. 28 such isolateswere found which were subsequentlyscreened for their antimicrobial activityagainst selected pathogens viz., Aeromonashydrophila (AH), Bacillus subtilis (BS),Enterococcus durans (ED), Streptococcus lentus(SL), Klebsiella pneumoniae (KP) and Rolstoniasolanacearum (RS) using disc diffusion assay.The results of primary screening based ontheir ability to resist host metabolitessuggested that these isolates were not free-living and essentially associated with thesponges. The antibacterial activity of thesponge extract was also measured similarly.
Of the selected sponge surface associatedbacterial isolates, 26 (92.86%) were found tohave the antibacterial activity or in otherwords produce antibiotics. The antimicrobialactivity of the sponge-associated bacterialisolates was more pronounced against grampositive bacteria (41.54%) than gram
negative bacteria (12.82%). Of the totalbacterial isolates tested, 66.67% were foundto have antimicrobial properties rangingfrom broad spectrum to species specific.There was significant (P<0.05) difference inthe nature of inhibitory activity of theantibiotics produced by different bacterialisolates. While 24 isolates (92.31%) bacterialisolates obtained from Ircinia sp. showedsignificant inhibitory activity againstEnterococcus durans, none of the isolates waseffective against Streptococcus thermophilus,Klebsiella pneumonia and Ralstoniasolanacearum. The results of the antibacterialactivity of the sponge extract and isolatesobtained from Ircinia sp. are depicted in Fig.3. One of the isolates, I12 which wasidentified as Lysinibacillus fusiformis based onDNA sequence homology of 16S rDNA gene,inhibited Aeromonas hydrophila with about120% of the efficiency of erythromycin.
Four sponges collected from Pongibaalu viz.,Crella cyathophora, Oceanapia sagittaria,Plakortis sp. and Monanchora sp. are being
Fig. 4. Percentage the bacteria associated withselected marine sponges showing various levels
of inhibitory efficiencyFig. 3. Inhibitory efficiency of the extracts from
Ircinia sp and its associated bacteria

CARIAnnual Report 2009-2010
165
studied. Altogether over 200 sponge
associated bacteria have been purified from
them, which were assigned to Neisseria
villonella, Micrococcus sp., Staphylococcus sp.,
Clostridium sp., Corynebacterium sp., Bacillus
sp., Pseudomonas sp., Enterobacteria sp.,
Lactobacillus sp., Vibrio sp., Aeromonas
salmonicida, Mycobacterium smagmatis,
Sterptococcus pneumonia and Streptococcus
mitis based on their morphological,
physiological and biochemical properties.
A preliminary qualitative dual culture assay
revealed that in case of Oceanapia sagittaria
and Monanchora sp, the antimicrobial activity
was primarily due to the host metabolites.
In Crella cyathophora and Plakortis sp., over
75% of the associated bacteria exhibited
significant (P<0.05) antimicrobial activity
against the selected pathogens (Fig. 4). The
quantitative analysis of the antimicrobial
property of these sponge associated bacteria
is underway.
P. Krishnan, S. Dam Roy, S.K. Ambast,A. Velmurugan, S. Jeyakumar, SubhashChand and S.K. Zamir Ahmed
The Nicobar group of islands faceenvironmental and socio-economic pressuresexacerbated by global climate change. Recentscientific evidences indicate that climatechange will increase the frequency andintensity of extreme events in the decades tocome. The present project is conceived withthe objective of identifying the vulnerablesectors and structures in Nicobar Group ofIslands due to Climate Change and tosuggest the location-specific adaptationstrategies to minimize the impact of ClimateChange.
Secondary data from the A&NAdministration were obtained with respectto the meteorological parameters,demographic particulars and productivity in
the agricultural sector. Extensive field surveyswere conducted at Car Nicobar, theheadquarters of the Nicobar District andseries of consultations were held withdifferent stakeholders. Shuttle RadarTopography Mission (SRTM) maps ofNicobar group of islands (30m) wereobtained from the online resources and digitalelevation maps (DEM) were prepared usingArcGIS software (Plate 7). Soil samplescollected from different locations across theislands were analysed following standardprotocols and the data overlaid on the GISplatform to get the soil map of the islands.Land-use maps were prepared based on thestandard criteria laid by National RemoteSensing Agency (NRSA) using IRS-P6 (LISSIII). Adaptive capacity of the islands - thepotential of the system to adjust to actual orexpect climate stress or to cope up with theconsequences- is being worked out based on
Assessment of threats due to Climate Change in Nicobar Group of Islandsand Development of Adaptation Strategies

CARI Annual Report 2009-2010
166
various socio-economic attributes,biophysical factors, infrastructural facilitiesand technological abilities using the methodsof Tata Energy Research Institute (TERI) asa template.
There are 22 islands in the Nicobar districtof which 12 are inhabited having a total areaof about 1976 km2. The DEM of the districtindicate that among the Nicobar Islands,Trinket and Chowra have over 15% of thetotal land area with an elevation less than10m above mean sea level (MSL) and are thussignificantly vulnerable to sea level riseassociated with global climate change (Fig.5).It was observed that about 70% and 93% ofthe total land area in Car Nicobar and GreatNicobar have an elevation >20m above MSLrespectively. The DEM data taken togetherwith the population density of differentislands (Fig. 6) in the Nicobar district showedthat Chowra is the most densely populated
Plate 7. Digital Elevation Maps of Selected Islands in Nicobar District(Courtesy: ISRO Regional Remote Sensing Centre - Central, Nagpur)
island which has a vast expanse of its landarea with low elevation above MSL.
A critical review of the agriculturalproduction data revealed that the major cropin the Nicobar group of islands wereplantation crops followed by root crops andfruits (Fig. 7).Though Nicobar districtaccounted for over 60% of the total area ofthe union territory under plantation crops,its contribution to total production ofplantation crops is just 32%, whichcorroborates the wide gulf between theproduction and potential. The islands dependon external sources entirely for theirrequirements of cereals, pulses and oilseeds.An analysis of the temporal data of the fishlandings from the region showed that thedistrict’s contribution to the total UTs fishproduction has been insignificant(1.82±0.12%) (Fig. 8). The scenario of thelivestock population except that of nicobari

CARIAnnual Report 2009-2010
167
pigs, was no different from the other alliedsectors.
The typical feature of the pattern of coconutplantations in Car Nicobar warrantedspecific corrections to be incorporated in thepreparation of land-use map. About 60% ofthe island is under dense forest mixed withplantation crops while there are denseplantation crops in 23% of the island area(Fig.9). The soil map of the island (Plate 8)
showed that a vast expanse of area has finesandy loam. Since coconut is the mostimportant crop in the island, the island wasclassified based on the soil quality and depthwith respect to the extent of suitability forcoconut cultivation. It was found that as perthe standard criteria, about 2% of the areawas highly suitable for coconut cultivation,56% moderately suitable and 35% marginallysuitable (Fig.10).
Fig. 5. Areas with different elevation asdetermined from the DEMs prepared from SRTM
data of inhabited islands in Nicobar District
Fig. 6. Population density of inhabited islands inNicobar District
Fig. 7. Percentage contribution of Nicobar Islandsto the Total area and production of various crops
of A&N Islands
Fig. 8. Fish landings from different districts ofA&N Islands as percentage of total fish landings

CARI Annual Report 2009-2010
168
Plate 8. Digital Maps of soil resources and vulnerability to climate change for Car Nicobar
The agricultural vulnerability map of CarNicobar was prepared based on multipleparameters viz., elevation above MSL,estimated sea level rise of 0.3-0.5m, soilquality/depth and land-use pattern. It isobserved that about 20% of the area in Car
Nicobar has high to very high vulnerabilityto climate change as predicted globally.Construction of soil resource, land use, andvulnerability maps and determination ofthe adaptive capacity for all the inhabitedislands in Nicobar District are underway.
Fig. 10. Soil suitability for coconut cultivation inCar Nicobar
Fig. 9. Land cover/ land-use pattern inCar Nicobar

CARIAnnual Report 2009-2010
169
sp., Fungia sp., Ctenactis sp., Cycloseries sp.,
Herpolitha sp., Galaxea sp., Pectinia sp.,
Lobophyllia sp., Symphyllia sp., Merulina sp.,
Leptoria sp., Oulophyllia sp., Montastrea sp.,
Diplostrea sp., Leptostrea sp., Cyphastrea sp.,
Euphyllia sp., Turbinaria sp.
In the RJMNP reef, Porites sp., Acropora sp.,Favites sp. account for more than 75% of thecorals (Fig.12). The other species includeSeriatopora sp., Stylophora sp., Astreopora sp.,Psammocora sp., Pavona sp., Leptoseries sp.,Gardineroseris sp., Coeloseris sp., Pachyserissp., Fungia sp., Ctenactis sp., Herpolitha sp.,
S. Dam Roy, Grinson George andP. Krishnan
Corals and mangroves form the twoimportant coastal ecosystems which have anindirect livelihood relation with the fishersand farmers in the Islands. Extensive fieldsurveys of these ecosystems were conductedacross the Islands in this project. The extentof reef cover, different components ofsubstrate, live coral percentage and thedominant species were recorded periodicallyfrom the selected sites for comparing withthe spectral signatures in satellite images.Hydrographical parameters were alsomonitored regularly and correlated with theecological changes in the reef environment.
Studies on Coral Reefs
Two Marine Protected Areas (MPAs) inAndaman and few reefs in Nicobar groupof Islands were surveyed extensively. TheMPAs were a) Mahathma Gandhi MarineNational Park Wandoor which included JollyBuoy Island, Tarmugli Island and BoatIsland; b) Rani Jhansi Marine National Parkwhich included Havelock Island, Dolphinjetty, Elephant Beach, and Radha Nagarbeach. In Nicobar Islands, sites around CarNicobar were surveyed.
In the MGMNP reef, Porites sp., Acropora sp.,Echinophora sp. account for more than 60%of the corals (Fig.11). The other species in-clude Stylophora sp., Astreopora sp., Pavonasp., Leptoseries sp.,Gardineroseris sp.,Coeloseris
Costal Zone Studies
Fig.12. Percent cover of corals in Rani JhansiMarine National Park, Havelock
Fig.11. Percent cover of Mahatma Gandhi MarineNational Park, Wandoor

CARI Annual Report 2009-2010
170
Galaxea sp., Pectinia sp., Merulina sp.,Plerogyra sp., Oulophyllia sp., Montastrea sp.,Leptostrea sp., Cyphastrea sp., Echinopora sp.,Euphyllia sp., Turbinarea sp., Helleopora sp.,Millepora sp.
Studies on Mangrove biodiversity
The mangroves were studied in different sitesof Andaman and Nicobar Islands byquadrant survey. The major survey sitesincluded Carbyn’s Cove, Minnie Bay, ShoalBay, Sipighat, Sipighat Junction, Dhanikari,Chouldari, Luha barrick, Wandoor, Beednabad, Barmanalla, Chidiatappu, Havelock,Neil Island and Baratang in South Andaman;Kadamtala, Porlobjig creek, Yerrata, RangatBay and Betapur–RRO in Middle Andaman;Mayabunder, Dhanapur, Karmatang,Austin Creek, Kalighat Creek, Ariel Bay,Durgapur and Basataka in North Andaman;Hut Bay, Harbinder Bay, Butler Bay andDugong creek in Little Andaman; CarNicobar, Kamorta, Katchal, Terressa, MagarNallah, Donghi Nallah and Gandhi Nagarin Nicobar Group of Islands.
According to the earlier report the diversityof mangrove in Andaman and Nicobar
Islands was 34 true mangrove speciesbelonging to 17 genera, 10 orders and 13families (though without comprehensivedistribution account, description ofvegetative characters and in situphotographs). Among them, 28 species under15 genera have been identified during ourstudy period. Rhizophora sp., Bruguuieragymnorrhiza and Ceriops tagal are thepredominant mangrove species in the islands(Fig. 13).It is noted that the Acrosticum sp.and Flegellaria sp. are commonly found in themangrove areas with significant distribution.
Fig.13. Percentage distribution of differentMangroves species of A&N Islands
Grinson George, S. Dam Roy and KamalSarma
Surface chlorophyll and Sea SurfaceTemperature (SST) is quite often correlatedwith the availability of fish, especially thepelagic resources. Many pelagic species are
known to concentrate at current boundaries
particularly in areas with sharp horizontal
temperature gradients. Chlorophyll and SST
images show common gradients due to inverse
correlation between these two parameters and
hence considered as the most important tools
Potential Fishing Zone Validation in Andaman Sea

CARIAnnual Report 2009-2010
171
in depicting Potential Fishing Zones (PFZ). TheSeaWiFS Ocean colour and SST of IndianOcean and model output of mixed layerdepth/wind speed are given in Plate 9&10respectively.
PFZ disseminations are usually intimatedthrough fax and email by INCOIS (Plate 11).Validation was preformed for each PFZadvisory and inferences were drawn after thevalidations. The team could improve theunderstanding of Andaman Sea for thesustainable development of marine fisheryresources and thereby improving thelivelihood of coastal people. The issuesrelated to PFZ data utilization in theIslands included the remoteness of
predicted zones from the traditionalfishing grounds and inaccessibility due tocurrent patterns.
Electronic Display Boards were installedsuccessfully at Junglighat, Rangat and Hutbay in collaboration with INCOIS and thedirectorate of fisheries. This improves in thefaster dissemination of PFZ advisoriesgenerated at INCOIS. The EDBs provideocean state forecasts, wind speed, tsunamiwarning and related information for theadvantage of fishermen.
A critical analysis of the fish landings at thePFZ area and non-PFZ area revealed thatPFZ data-guided fishing increases fish
landings up to three folds (Table 5).
Plate 9. Sea WiFS Ocean Colour and SST of the Indian Ocean Region used for PFZ forecast
Plate 10. Model output of mixed layer depth, wind speed and direction for PFZ prediction

CARI Annual Report 2009-2010
172
Table 5. Summary of results on the interventions under PFZ project
No. Lat-Long. of Name of Avg. catch (kg) Craft & Major catches
Prediction the Place PFZ Non-PFZ Gear
of PFZ area area used
1 7 06 29.21 N Kabra Pt 150 100 Gill net, Mullet, Chanos sp., Jack fish,
93 29 58.81 E Hook & Sardinella sp, Rasterelliger sp,
line Carangoides sp, Epinephelus sp,
Tuna sp, Siganus sp., Scarus sp.,
2. 7 06 29.21 N Kabra Pt 200 150 Gill net, Sweetlips, Goat fish, Leiognothus
93 29 58.81 E Hook & splendeus, flat fish, Sea bass,
line Lethrinus sp., Hilsha ilisha,
Anodontostoma sp., elabps,
megaleps, shark, snappers, Ray
fish, hemirampus, eel, Lutjanus
sp. Sphyraena sp. etc.
3 13 17 47.71 N Mayabunder 100 50 Gill net, Sardinella sp., Rasterelliger
93 10 17.07 E hook & sp,Mullet, Carangoides sp,
line Siganus sp.,Lutjanus sp.,
Epinephelus sp, Shark
4 13 20 23.82 N Diglipur 75 30 Gill net Liza sp., Rastrelliger sp.,
93 09 22.36 E Hook & Sardinella sp., Anodontostoma
line sp., Carangoides sp., Decapterus
sp., Gerres sp., Toxotes jaculatrix,
Epinepheleus tauvina,
Epinepheleus malabaricus,
Epinepheleus caeruleopunctatus,
Alectis indicus, Trachyurus sp.,
Lutjanus sp., and Atule mate
5 13 27 09.73 N Landfall 150 40 Gill net Sardinella sp., Rasterelliger sp,
93 10 56.15 E light and Hook Epinepheleus sp., Groupers,
House & Line Snappers, Carangoid sp

CARIAnnual Report 2009-2010
173
Plate 11. A sample of PFZ advisory as disseminated and PFZ map of Andaman by INCOIS
S. Dam Roy, Alok Saxena, P. Krishnan andGrinson George
Project Co-ordinator: R.C. Srivastava
Andaman and Nicobar Islands are jottedwith a number of creeks fringed with lush-green mangroves. The mangroves act asnursery ground for a wide range of aquaticflora and fauna in the interface of terrestrialand marine ecosystem and thus ensuring
food security. They are of great importance
to the islands as natural sea defence. The
project was conceived in order to explore the
possibility of using the mangrove ecosystem
as a livelihood option for the residents of the
coastal fisherman. The proposal also helps
in the protection of the mangrove forests
which otherwise are exploited for other
agricultural purpose.
Development of Mangrove Based Agro Aqua Farming for Restoration ofMangrove Ecosystem and Livelihood Through Community Farming inAndaman Islands

CARI Annual Report 2009-2010
174
A survey was conducted on the different
mangrove stands in South Andaman with
respect to the species distribution and soil and
water quality in order to determine the
suitability of site for establishing a tide-fed
pond adjacent to mangroves. It was found
that in the survey sites viz., Manjeri and
Wandoor, the dominant specie were Bruguiera
gymnorhiza, Rhizophora apiculata and Acanthus
illicifolis. Considering the issues in taking up
civil works in areas adjacent to mangroves
and the parallel activities of the development
departments in the selected areas, a
demonstration farm was developed adjacent
to the creek in Sippighat within the
Brackishwater Farm complex of CARI. The
model has two ponds with provision for water
exchange according to tide level and a
mangrove nursery bordering the ponds. Two
ponds measuring 15x20m in size and the
creek side were strengthened with boulders.
A make-shift nursery has been established
in the farm area (Plate 12). About 600
mangrove wildlings of Bruguiera
gymnorrhiza, Rhizophora apiculata, Acanthus
ilicifolius collected from the nearby Sippighat,
Guptapara and Manjery forest areas, and 100
Rhizophora saplings obtained from the forest
department were planted at 30cm distance
covering the whole make-shift nursery area.
The pond preparation has been completed
and tiger shrimp seeds would be stocked in
the ensuing period.
A pilot study was conducted in two areas in
South Andaman viz., Sippighat and
Wandoor, to study the socio-economic status
of the local populace inhabiting adjacent to
the mangroves. Altogether 26 families in
Sippghat and 31 families in Wandoor were
covered in the study. Most of the inhabitants
in Sippighat were found to be engaged in
private business or jobs while a majority of
the people living adjacent to the mangroves
in Wandoor were engaged in fishing related
activities. The study revealed that the
mangrove has an intrinsic role to play in the
livelihood of these people as a source for fire
wood, timber, etc and also as potential
fishing grounds. The awareness on the
importance of the mangroves among the
Plate 12. Mangrove make-shift nursery established under the project

CARIAnnual Report 2009-2010
175
people was reasonably good with majority
of them recognizing the importance of
mangroves as for natural defense, flood
control, scenic beauty, etc.
As a part of the project, awareness camps
have been conducted for the school children
and teachers in collaboration with CP
Ramaswamy Environment Foundadation,
Chennai, in order to sensitize the local
inhabitants on the importance of sustainableutilization of the mangroves. Trainingprogrammes have been conducted for thebenefit of the farmers in the areas ofbrackishwater aquaculture and value addedfish production.

CARI Annual Report 2009-2010
176

CARIAnnual Report 2009-2010
177
Subhash Chand, D.R. Singh,R.C. Srivastava and Sharwan Singh
The data on prices of different vegetables,market channels involved, market marginswere collected from Port Blair, Bathu Bastiand Golghar markets from producers, sellersand consumers. Analysis of price behaviorof vegetables in A&N Islands was carried outduring 2009-10. The prices of vegetablesshowed volatile behaviour and they weredirectly affected with the mainland marketprices. There was big gap betweenproducer's price and consumer's price inthese islands in the vegetable market. Mainlythree market channels producer to consumer,Producer to Retailer to consumer andProducer to whole seller to retailer toconsumer were identified in these islands.The analysis of distribution of vegetable areasin different Islands revealed that mainproduction hubs are Diglipur and RangatIslands. The total area is about 3800 ha.under vegetables in different islands i.e.
Diglipur (1468.08 ha) followed by Rangat
(1000 ha) and South Andaman (700 ha).
Inter Islands price variations for
vegetables:
The data on vegetables' price variations were
collected from Port Blair, Diglipur and Niel
Island markets. As is evident from the table 1,
at Port Blair market, prices of vegetable were
higher as compared to Diglipur and Niel
Islands due to the fact that Port Blair being
urban area with high population concentration
is the consumption centre where as Diglipur
and Niel islands are the production centres
having poor market infrastructure. In case of
Potato and Onion, it was reverse because these
vegetables are mainly imported from mainland
and Port Blair being the importing centre,
receive these vegetables first and incur less
transportation cost.
An Economic Analysis of Floriculture and Vegetables Potential in Andamanand Nicobar Islands
Table 1. Inter Islands price variations for vegetables
Name of vegetables Market price at different Islands (Rs/kg)
Port Blair Diglipur Neil
Tomato 15- 40 10-50 5-45
Okra 10-25 8-20 7-15
Brinjal 10-30 8-20 8-15
Cauliflower 30-60 15-70 25-65
Cabbage 25-40 15-50 20-45
Potato 15-30 20-40 20-35
Onion 20-40 25-50 25-45

CARI Annual Report 2009-2010
178
The prices of almost all vegetables in Port Blairmarket start falling in December month andremain low up to March which again startsrising. This all depends upon localavailability.
Vegetables price variation in Port Blair andMainland
It is evident from table 2 that there was a bigdifference in the prices of different vegetablespaid by the consumer in Port Blair and mainlands. The price for all the vegetables in PortBlair market was higher as compared toChennai, Kolkata and Delhi market. Theseislands mainly depend on the supply ofvegetables from Kolkata and Chennai. The
prices of vegetables were much lower in these
markets than Port Blair. It was found that in
Port Blair market prices were high in the
range of 43 to 127 percent for brinjal, 25 to
233 percent for capsicum, 389 percent for
cauliflower and 567 to 700 percent higher in
the case of cabbage. Similar trend was notice
in the case of onion, tomato and potato also.
Thus, to reduce the consumer price for
vegetables, the vegetables have to be
cultivated locally. Therefore, introduction of
improved varieties, protected cultivation and
improvement in market infrastructure may
help overcome the problem.
S.K. Zamir Ahmed, Subhash Chand,M. Balakrishnan and R.C. Srivastava
The scenario of credit linkage of SHGs inNorth & Middle Andaman (having men &
women and mixed group ) & Nicobar District(women group only) accounts for 26and11.59 percent respectively which is veryless as compared to the South Andaman
Identifying Livelihood Options and Training Needs Compatible to Self HelpGroups to Fructify these Options
Table 2. Comparison of Vegetables price variation in Port Blair and Main Lands
Vegetable Price variation of vegetables (Rs.)
Port Blair Chennai Kolkata Delhi
Tomato 15- 40 05-11.7 06-14 4.5-11.5
Brinjal 10-25 07-11 04-15 04-14
Onion 15-30 03-13 05-16 04-08
Potato 15-30 07-11 06-16 04-12
Capsicum 25-100 20-30 20-35 25-40
Cauliflower 30-60 07-14 6.5-15.5 03-12.5
Cabbage 20-40 03-05 04-06 04-06

CARIAnnual Report 2009-2010
179
District (36.0%) .The saving & credit linkage
relationship of the selected six leading self
help group promoting agencies (SHGPA)
revealed that National Cooperative Union
of India had the maximum credit linkage i.e.
50.81 percent followed by Yuva Sakthi
(38.94%), Unnati (33.75%), CARE India
(33.16%), SURABI (22.33%) and ACANI
(21.65%) respectively. A total of 50 samples
were randomly selected from these six
leading SHGPA working at Diglipur, Rangat,
Mayabunder & Campbell which revealed
that maximum of the respondents in the
groups were young but not enterprising, had
middle level of education and practiced non
agriculture occupation i.e. petty income
generating activities (IGP) mainly due to lack
of proper information on the profitable
livelihood options in agriculture & allied fields.
They could earn an annual income to the
range of Rs. 20,000 to Rs. 50,000. The strength
of members of the groups was 10.48 which
was apt for better coordination and group
dynamism. They were having low level of
economic motivation, scientific orientation
and medium level of risk orientation and
innovativeness. Further the average loan
amount with the credit linked SHGs were in
the tune of 0.36 to 0.95 lakhs which was
although enough to start any self employment
enterprise in agriculture & allied fields but not
enough to sustain the business (Table 3).
Goat farming was the choice of the maximum
group members as it was very lucrative with
assured market but the problems faced was
non-availability of desired number of kids per
unit to start the business in a profitable
manner (Table 4).
Table 4. Training needs & alternative live-lihood options identified
Training PreferenceRanking
Goat Farming IVegetable cultivation IIFloriculture IIIPoultry Farming IVPiggery VMushroom cultivation VI
Table 3. Average loan per credit linked SHG
Agency Saving Mobilized Bank Loan Average Loan / SHG
(in Lac Rs) (in Lac Rs) (in Lac Rs)
CARE INDIA 125.68 46.13 0.36
ACANI 91.02 41.79 0.45
NCUI 281.01 267.27 0.95
YUVASAKTHI 83.55 48.86 0.58
SURABI 17.48 9.42 0.53
UNNATI 7.22 4.24 0.59

CARI Annual Report 2009-2010
180
R. C. Srivastava & S. K. Zamir Ahmed
Under the Farmers Technology TransferFund (FTTF) of NABARD, CARI establishedan Out Reach Centre (ORC) for a period 4years from July, 2009 at Keralapuram villageof Diglipur in North & Middle AndamanDistrict, with an objective to serve thefarmers of the area leading to integratedagricultural and socio economicdevelopment of the villagers and the clusterof the villages as a whole. For the periodbased on the PRA, need based technologicalbackstopping in the mode of training,technological demonstration and extensionactivities were planned and executed.
Training
Seven trainings for the stakeholders wereconducted in agricultural and allied fieldswherein 237 farmers got trained and 686trainee days were utilized. Beside one eachof Kisan Gosthi and Technological back
stopping in agricultural and allied field wereconducted the wherein a total of 145beneficiaries representing from nine villagesparticipated and benefited.
Technological Demonstration
During the rabi season twenty seventechnological demonstrations in farmers fieldwith seven crops namely Green Gram var.K851 (03), Black Gram var. Tel Kalai local(09), Cauliflower var. White Marble(03) andKimaya(01), Cabbage var. BC76 (02), Chillivar. Flame Hot (02), Tomato var. LakshmiNP 5005 (03), Okra var. US-7136 (02) andPotato var. Kufri Jyothi & Kufri Surya (01)were taken up in Keralapuram, SubhashGram, Sita Nagar, R. K, Gram, V.S. Pally,Rabindra Pally, Khudirampur and DeshBandhu Gram of Diglipur Panchayat . Thearea of demonstration ranged from 0.01 To0.40 ha covering a total area of 4.45 ha. Theperformance of the interventions along with
Establishment of Out Reach Centre at Diglipur, North & MiddleAndaman District

CARIAnnual Report 2009-2010
181
its maximum, minimum and percentageincrease of yield over the local check (evenafter the receipt of 224.08 mm of rainfall (4
rainy days) in the month of January 2010 i.ethe harvest period of most of the crop) ismanifested in the Table 5.
Table 5. Performance of Technological Demonstration (Rabi Crops) in Farmer's Field
Crops Variety Area of Demons- Yield (q/ha) Local check %
Demons- tration / Yield (q/ha.) increase
tration (Nos) in yield
(in ha.) Min. Max. Mean Variety Yield
Chilli Flame 0.042 02 87.5 112.5 100 Fair 85.51 16.94
hot bomb
Cabbage BC 76 0.15 02 437.5 462.5 450 Blue 420.00 7.14
bandies
Cauliflower White 0.105 03 362.5 462.5 400 Karuna 320.00 19.07
Marble
Kimaya 0.042 01 393.75 - 394 Karuna 360.00 9.4
Okra US-7136 0.05 02 50.00 62.5 56 Arun 42.00 33.3
Tomato Lakshmi 0.14 03 125.00 156.25 140 Karan 110.00 27.27
NP 5005
Green gram K851 0.3 03 5.31 6.9 5.93 Local 4.25 41.17
Black gram Tel Kalai 3.6 09 6.25 15.62 11 Jhad 08.00 39.52
local Kalai
Potato K. Surya 0.01 01 - - 81.25 Local 20.00 306.2
K. Jyoti 0.01 01 - - 18.75 Local 8.00 134.37
Total 4.45 27
Extension Activities
Exposure visit
For the first time a group of thirty six farmersi.e. 31 male and 5 females from 10 differentvillages of Diglipur under the aegis of ORC,attended Kisan Mela on the theme “Livestock and Poultry Farming for DecentLivelihood” from 8th to 11th February, 2010at CARI, Port Blair. During the period theyattended Kisan Gosti, Kullah Manch ,
Farmers quiz and training at KVK.Knowledge through video films onIntegrated Farming System, Poultry Farming,Broad Bed and Furrow System, GoatFarming, Pig Farming and others were alsoimparted. The farmers got address their fieldproblems addressed and were happy by thequick response by the team of scientists. Fewfarmers also shared their experiences
during the session.

CARI Annual Report 2009-2010
182
Field Visit(s) by the Scientist /Experts
Fifty six (56) visits were made to farmers
field to monitor the incidence of disease
in pulses , germinat ion of potato ,
performance of tomato, chi l l i ,
cauliflower and selection of farmers,
youth for imparting knowledge and skill
level training.
Farmers visit to ORC
One hundred and sixty eight (168) farmers
visited ORC with the purpose to read the
technical bulletin, to get knowledge on PoP
on pulses and other crops, discussed on pest
and disease management in brinjal, ongoing
training programmes from R.K. Gram , V.S.
Pally, Subhash Gram, Khudirampur, Aerial
Bay, Sita Nagar and Keralapuram villages.
A Telephonic Advisory Service was
started on 6th February 2010
During the reporting period up to 31st Mach,
seven farmers approached the Scientists of
host institute over phone on the problems
faced on the crop viz., banana, ginger,
pulses, brinjal, cucumber and coconut from
three villages.
M.Balakrishnan, N.Ravisankar, SubhashChand, R.C.Srivastava, S.K Zamir Ahmed,Krishna Kumar and T.V.R.S. Sharma
The aim of this study is to investigate theimportant factors that influence riceproduction, especially the differenttreatments and different method, and alsoto understand the potential of ANN inforecasting task of rice yield The observationsof different treatments such as rice varietalsspectrum in the different islands, weather
parameters, yield components, soilparameters and pest and disease index forthe period of 31 years from 1971 have beencollected from the basic records ofexperimental field of Central AgriculturalResearch Institute and developmentaldepartments, Port Blair. In order to assess thedependability, weather and crop data frombasic records were subjected to co efficientof variation analyses. Field data related torice production were subjected to construct
Development of Artificial Neural Networks (ANN) Based Forecasting Modelfor Studying Varieties Diversity, Yield snd Production in Prominent RiceCultivars of Bay Islands

CARIAnnual Report 2009-2010
183
training set and testing set for ANN learningprocess. The architecture of the ANN chosenfor study consists of three layers viz., an inputlayer, a hidden layer, and an output layerinvolving a multi- layer feed forwardnetwork with a single hidden layer. Theactivation function used both in hidden layersand the output layer is a nonlinear function,where as the input layer, no activationfunction is used since no computation isinvolved in the input layer. Information flowsform one layer to other layer layer in feedforward manner. The weights of the variousconnections in the neural network are initiallychosen randomly. Then the weighted sumof the inputs is calculated for each processingneuron.
ANN’s of each model were trained andtested. Each ANN was trained until the MeanSquare Error (MSE) decreases and reaches0.01 or the number of iteration exceeds10,000 when the training session stops. TheMSE is the summation of the square of thedifference between the desired and actualoutputs of the network for the entire trainingpattern. Then the testing set will be presentedto the trained ANN in order to determine theaccuracy of the forecast.
N.B: MSE = ½ Σ (E (p)-X (p)) 2
Where ‘E (p)’ is the desired output and ‘X (p)’is the actual outputs.
The forecast outputs trace the actualproduction very well for all levels of rice yieldsin those years used in the experiment. It canbe concluded that the ANN has high
potential for the application of Rice yieldforecast. The training set and testing set arecreated according to inputs of ANN model.Training set such as rice varietals spectrumin the different islands, weather parameters(month wise, Week wise and year wise),yield components, soil parameters and pestand disease index and yield which wasselected according to structure of model. Itwas observed that data set for theexperiment contains wide variation of riceyield, which will help in evaluation ofpotential of the ANN in forecasting rice yield.
Preliminary ANN model for phase Icomprising one variety (C14-8) of SouthAndaman is presented in Fig. 1 ( Weatherparameters with yield which using weekly,Monthly and Yearwise weather) whichindicates the predicted yield coming muchcloser to actual values wather withmonthwise,weather. However, theestimated ANN model needs to be testedwith more data sets.
On the basis of the ANN model, results ofthe experiment, it is observed by chi-square
Fig. 1. ANN model for prediction of rice yield forC14-8(Actual and Forecast)

CARI Annual Report 2009-2010
184
(÷2) test that there is interdependencybetween the actual and expected yield.Since the computed values of ÷2=0.99 isless than the table value of ÷2 21.666, for
9 degrees of freedom at 1 per cent level ofsignificance there is no significantdifference between the actual yield andexpected yield.
M. Balakrishnan, S.K.Verma, S.Jeyakumar,N. Ravisankar, A.Kundu, Subhash Chand,S. K. Zamir Ahmed and R. C. Srivastava
The Andaman and Nicobar Islands comprise
chain of more islands in addition to a number
of islets and rock outcrops in the Bay of
Bengal. Perishable commodities, such as
vegetables fruits and animal products (milk,
meat and egg) have to be procured from
mainland India and are always in short
supply. In the livestock sector, the major
constraints are less population, poor
germplasm and poor productivity due to
shortage of feed and fodder resources. The
dairy animals especially the local cows and
buffaloes yield on an average 1.5 and 2.0 l/
day of milk, respectively. The reasons for this
low productivity are ‘desi’ or non-descript
breeds; local climatic factors conducive for
disease and parasites and above all there is
lack of assured round the year availability of
fodder in ample quantities. However there
are about 112 species of fodders have been
documented in A & N Islands. Before
chalking out the possible strategies and plans,
information on current status of local
grasslands and pastures; local natural
resources including vegetation, soil, land and
climate; inherent constraints of geographical
remoteness, geological past, socio-economic
setup, weather elements all must be born in
mind. The present attempt is to summarize
all such related information at one place, so
as to facilitate planning processes. Based on
the empirical observations on the
performance of various types of exotic and
indigenous fodder resources, under local
rainfed conditions over last many years, a
comprehensive fodder information resources
database has been designed and developed.
The details regarding various aspects of
fodder resources regarding their family,
habitats, crop, rainfall period, distribution
area, climate and scientific names
management practices etc. were collected
and documented. This database design is user
friendly and provides all the information
about fodder resources for the end user viz.
research, academic, development and
administrative departments. Primary and
secondary data about the fodder resources
of Andaman and Nicobar group of Islands
were collected through survey under various
projects (Fig. 2 - 8).
Development of Database on Fodder Resources and Waste Land in BayIslands

CARIAnnual Report 2009-2010
185
Fig 2. General Information about A & N Islands
Fig 4. Management practices
Fig 6. Waste land of Andaman & Nicobar Islands
Fig 7. Waste land information
Fig-3. Database design
Fig 5. Hindi informations

CARI Annual Report 2009-2010
186
Fig: 8. Database of fodder resources
The database aimed at developing thewebsite fodder Resources of Andaman andNicobar Islands which would provide itsusers good quality and ample informationregarding the fodder resources of theseislands. The database was designed inMySQL at the blackened and the interfacewas created using adobe dream weaver inHTML. The webpage interface wasinteractive and was designed keeping generalpublic in mind for easy access of their desireddata. The database was very rich and up-to-date with information from latest Island wisestatistical census and other data from CARland development department.
The collected data has been entered indefinite format. Tables & templates werecreated using MS access and HTMLrespectively.
Development of database and layout
The database development was aimed atdeveloping the website - FIRBI - FodderInformation Resources of Bay Islands. The
website will prove to be a databank of fodderresources of these islands and will containinformation like general information, family,habitats, crop, rainfall period, distributionarea, climate, scientific names andmanagement practices. The FIRBI website willprovide the administrator to create users withpermissions to access the data of theirrespective area of work. The website istargeted to a wide range of user whichincludes department of Animal Husbandryand Veterinary Services, policy makers,Scientists and public (Fig. 9 & 10).
Fig: 9. Main Page of the fodder resources
Fig:10 . Database of fodder resources (English)

CARIAnnual Report 2009-2010
187
Database developed for fodder Resources ofA & N Islands has the main page whichcomprises links to general information,statistics of A &N Islands and fodderresources (Fig. 11).
The fodder database is rich in information. Itcomprises of general information about A &N Islands, fields for fodders. Once logged on,the user will get access to the entire databaseregarding different fodder resources in theseislands. The database page provides generalinformation, fodder resource informationresearch and publication. The fodderresource information page is divided intoseven categories namely general feature of
the islands, status of grassing lands, foddertree, constraints to fodder, managements,references and improved fodder crops. Eachof these categories comprises of links tofodder belonging within each category whichwill take the user to the well furnisheddatabase which has been developed PHPprogramming.
It is needless to state that fodder resourcesplay an essential role in agriculturaleconomy. The future improvement anddevelopment of fodder for agriculture isdependent upon the availability of geneticvariation, which is its principal resource.When compared to Indian mainland, verylimited variety of fodder is found in theseislands. We need to conserve andsimultaneously exploit this potentialresource in a sustained manner to meet outthe Islands demand. This database design isuser friendly and provides all the informationabout fodder resources for the end user viz.research, academic, development andadministrative departments. This databasecan be updated on a regular basis, so that itwould provide current status about thefodder resources.
M. Balakrishnan
The main mission of the BioinformaticsCentre, CARI is to create the awarenessabout bioinformatics and its applications tothe islanders and develop databases onBiodiversity of Andaman & Nicobar Islands,
which would provide information totaxonomists, ecologists, biodiversitymanagement specialists, policy makers,planners & related entrepreneurs to store,manage, and exchange electronicallypublished scientific information in standard
Fig:11. Database of fodder resources (Hindi)
Establishment of Sub- Distributed Information Centre (DBT)

CARI Annual Report 2009-2010
188
format. It also serves as an active site for
bioinformatics research and development in
the remote union territory of Andaman and
Nicobar Islands. The following activities have
been carried out during the year.
Developed Software/Tools on :
BioSAT : Biological Sequence
Analysis Tools
PathoSys: Plant Disease resist
information systems.
RNA Secondary Structure
Prediction Tool
Database on Algae resources and
Coral reef Fish has been developed.
In silico protein modeling of
translational elongation factor 1-Alpha
of phytophthora palmivora and docking
studies by Benzimidazoles compound
model has been developed.
Docking Studies of 5 Zanamivir
analogues over the enzyme
neuramindase from H1N1 avaian
Influenza virus in the Treatment of
Avian Flu.
Updated and maintained the existing
databases of bioinformatics centre.
Developed website for Bioinformatics
Centre which is updated regularly
CARI Website has been developed/
updated with the help of Dream
weaver and ASP.Net
Guided students for project works in
the discipline of M.Sc (Bioinformatics),
M.Sc (Biotechnology) and B.E./B.
Tech.
Krishi Vigyan KendraTraining
Fifty one training programmes for the benefit
of practicing farmers, rural youths and
extension functionaries were conducted
wherein 1078 beneficiaries (683 Male and
395 Female) in agriculture and allied
disciplines got benefited. 13 numbers of Front
Line Demonstration (FLD) in agriculture and
allied disciplines covering paddy, maize,
black gram, green gram, ground nut, sweet
potato, duck, turkey, pig, composite fish
culture, integrated fish farming, brackish
water shrimp culture and cat fish culture
were conducted. 5 numbers of On Farm Trial
(OFT) at farmers field were conducted to
assess and refine the selected technology on
agriculture and allied fields. Integrated
farming system both in fresh water and
brackish water has been introduced under
cost effective farming system for decent
livelihood. Different extension tools like
exhibition, field days, farmers visit, TV shows,
campaign, diagnostic visit, Scientist farmers
interaction, radio talks, Kisan Mela were
used to popularize the technologies.
Summary of training programmes is
presented in table 6.

CARIAnnual Report 2009-2010
189
Front Line Demonstrations (FLD)
On Integrated Nutrient Managementfor Paddy were conducted in fivefarmers field of Guptapara, Memyo,Indiranagar, Badmaspahar andBrindavan villages of South Andaman.The results indicate an average yieldof 3.88t/ha, which was 25.16percentage higher over the localvariety.
Demonstration on Paddy variety ofMLT-10 was conducted in two farmer’sfield at Guptapara and Memyo village
of South Andaman. Result indicatedthat maximum of 4.47t/ha wasrecorded in farmers field with anaverage yield of 4.26t/ha which was15.1 % higher than local check.
FLD on Maize (Shakti) was conductedin five farmer’s field at Namunagar,Shoal Bay, Guptapara andIndiranagar. Average yield of 3.72t/ha was recorded which was 18.5 %higher than local check.
Groundnut variety ICGS 76 wasdemonstrated in six farmers’ field atCalicut village, in 10-12 years old
Table 6. Training programmes
Thematic Area Training Participants
Male Female Total
Practicing Farmers/ Farm women
Crop production 8 116 64 180
Horticulture 7 120 27 147
Livestock Production and Management 6 70 68 138
Agrl. Engineering 6 73 18 91
Fisheries 5 86 43 129
Home Science 2 3 42 45
Rural Youth
Crop production 3 40 27 67
Horticulture 3 37 29 66
Livestock Production and Management 1 12 7 19
Agrl. Engineering 2 41 1 42
Fisheries 2 42 4 46
Home Science 2 0 50 50
Extension Personnel
Crop production 2 27 6 33
Livestock Production and Management 1 8 7 15
Fisheries 1 8 2 10
TOTAL 51 683 395 1078

CARI Annual Report 2009-2010
190
coconut as well as 1-2 years oldcoconut plantation. The lowest yield of1,000 kg/ha was recorded in 10-12years old, whereas the highest yield of2,750 kg/ ha was obtained in youngerplantation of 1-2 years old.
FLD on pulses viz. Black gram (ADT 3)and Green gram (CO 6) have beendemonstrated in farmers field atGuptapara, Manglutan, Ograbraj,Ferrar Gunj and Shoal bay villages ofSouth Andaman. An average yield of6.34 q/ ha and 7.40 q/ha was recordedin Black gram and Green gramrespectively.
FLD on Sweet Potato with varietyCARI SP-I and CARI, SP-II were takenup in South Andaman villages, i.e.Namunaghar, Chouldari and Memyo.CARI SP-I performed better and gavea yield of 21.01 t/ha followed by CARISP-II 19.91t/ha over the local checkBidhan jaganath 13.4t/ha.
Three demonstrations on duck farmingwere conducted at Guptapara,Wandoor and Chouldari with 60 nos.Khaki Campbell ducks. The ducksrecorded higher egg productions of 245eggs/year over the local check 160eggs/year.
One demonstration on Pig farmingwas conducted at Memyo village with4 piglets wherein the pigs attained anaverage body weight of 78 kg/animalover the local check of 68 kg/animal.
One demonstration on Turkey (broadbreasted white) was conducted atNamunaghar village with 20 birds. Thebirds attained average 7.5 kg/ bird in20th week of age.
Five demonstrations on composite fishculture were conducted in fiveirrigation ponds (0.08 ha each) withstocking ratio of 3:4 : 3 (Catla, Rohuand Mrigal). The average yield was145 kg over the local check of 88 kg.
On Farm Trials (OFT)
OFT on Evaluation of high yieldinglong duration paddy varieties duringwet season was conducted inrandomized block design with 6replications. The results revealed thatamong the four varieties tested. Rootdry weight of Ranjit was recordedsignificant (13.5g/hill), which was onpar with Savitri (13.3g/hill). Highernumber of productive tillers of 18.9tillers/hill and 103 no. of filled grainsper panicle was registered in Ranjitvariet followed by Savitri whichrecorded 15.1 and 96.4 productivetillers per hill and no. of filled grainsper panicle respectively. No significantdifference was recorded in test grainweight. Ranjit registered significantlyhigher grain yield of 4013 kg/ha whichwas no par with Savitri (3907 kg/ha)followed by Varsha (3574 kg/ha). Thelowest grain yield of 2207 kg/ha wasrecorded in C 14-8.

CARIAnnual Report 2009-2010
191
An experiment on System of Rice
Intensification (C14-8) was conducted
during wet season at Ferrar Gunj
block. The trial was laid out in
randomized Black design with seven
replications at Brindaban and Ferrar
Gunj villages of South Andaman.
Maximum number of 20.7 productive
tillers/hill was obtained with SRI
method, which was significantly
superior than that of 20 x 15 cm. While,
significantly the lowest number of 14
productive tillers/hill was observed
under farmer’s method of planting.
Panicle weight (2.86 g), numbers of
grains/panicle (98) were registered
higher at the spacing of 25 x 25 cm in
SRI method. The difference in test grain
weight was not significant due to
method of planting. Significantly
higher grain (2850 kg/ha) and straw
yield (7555 kg/ha) was recorded with
SRI planting followed by
recommended practice of 20 x 15 cm.
SRI method of planting led to 13.1 %
and 30.7 % higher yield than other
method of planting.
OFT on evaluation of disease resistance
high yielding varieties of okra was
conducted at farmers field using three
varieties namely Pusa Sawani, Arka
Anamika and Prabhani Kranti. The
Arka Anamika recorded highest yield
of 69.8t/ha followed by Prabhani
Kranti (62.9 t/ha).
OFT on evaluation of improved poultry
strain under backyard poultry
production system with local desi bird,
Vanraja, Nicorock and Nishibari was
conducted in Chouldari and
Namunagarh. The body weight
recorded at maturity revealed higher
in Vanaraja (2900.00 ± 34.79) followed
in Nicorock (1483.83 ± 22.72) and
lowest recorded in desi bird (1275.87 ±
24.91). The highest annual egg
production recorded was 164.00 ± 0.40
in case of Nishibari birds followed by
141.58 ± 0.28 in Nicorock and the
lowest in desi birds 89.75 ± 0.46.
OFT on evaluation of growth
performance of Indian Major Carp
was conducted with four technical
options viz. Farmers practice (no
feeding), organic (lime + cow dung),
organic + inorganic (lime + cow dung
+ SSP) and feed + lime + cow dung +
SSP. Highest yield was recorded (347
g) at the age of 90 days in technical
option 4 (feed + lime + cow dung + SSP)
followed by 258 g in technical option 3
(lime + cow dung + SSP). Lowest yield
of 144 g recorded in technical option1(no feeding).

CARI Annual Report 2009-2010
192
Extension activitiesExtension activities undertaken during the year is presented in table 7.Table 7. Extension activities
Extension Activities No. Farmers Extension Total
Officials
M F T M F T M F T
Field Day 06 62 51 113 - - - 62 51 113
Kisan Mela 01 - - 2000 - - - - - 2000
Kisan Ghosthi 03 185 65 250 - - - 185 65 250
Exhibition 03 Many
Film Show 35 Many
Method Demonstrations 08 90 70 160 - - - 90 70 160
Farmers Seminar 03 40 25 65 - - - 40 25 65
Workshop 02 20 12 32 - - - 20 12 32
Group meetings 32 48 450 498 - - - 48 450 498
Lectures delivered as 25 250 72 322 - - - 250 72 322
resource persons
Newspaper coverage 15 Published in Daily Telegram, News Paper, Port Blair
Radio talks 05 Broadcasted in All India Radio, Port Blair
TV talks 06 Telecasted in Doordarshan, Port Blair
Extension Literature 11 210 125 335 - - - 210 125 335
Advisory Services 32 30 75 105 - - - 30 75 105
Scientific visit to 95 310 152 462 - - - 310 152 462
farmers field
Farmers visit to KVK 63 167 137 304 - - - 167 137 304
Diagnostic visits 67 157 95 252 - - - 157 95 252
Self Help Group 34 16 331 347 - - - 16 331 347
Conveners meetings

CARIAnnual Report 2009-2010
193
Linkages & Collaboration with other departments
KVK has developed effective linkage with development departments of A & N Administrationand other organization. Table 8 presents a summary of linkage and collaboration.
Sl. Title Date of Broadcast Resource person
No.
1. Kali Mirchee Se Adhik Utpadan Kyse 13th July 2009 L.B. Singh
2. Bakriyo Ki Pramukh Beemariya Va Prabandhan 18th August, 2009 N.C. Choudhuri
3. Deepon ke liye machliyon ki upyukt kismain 19th February, 2010 Nagesh Ram
Radio talk
Door Darshan talk
Sl. Title Date of Broadcast Resource person
No.
1. Barish ke mausam mein Amruth ke Bageche kee 29th August, 2009 L.B. Singh
dekhbal
2. Sapota cultivation in Islands 7th September ,2009 L.B. Singh
3. Intercropping of Fruit Crops 26th February, 2010 L.B. Singh
Table 8. Summary of linkage and collaboration.
Name of organization Nature of linkage
Department of Agriculture, A & N Administration Training and supply of seedlings
Department of AH & VS, A & N Administration Training & inputs distribution
Department of Fisheries, A & N Administration Training & fingerling distribution
A & N Cooperative Bank, SHG Promotion & financial assistance
NABARD, Port Blair Formation of projects, SHGs & farmers club
NRSE, Dept. of Electricity, A & N Administration Non-Conventional energy resources
Lead Bank SHG promotion & financial assistance
CIPMC, Port Blair IPM management
NCUI, Port Blair Training and field advisory
NGOs (ADRA, ACANI, WBVH) Training

CARI Annual Report 2009-2010
194
The technologies generated at the instituewere assessed for its performance by thescientists in participatory mode and basedon the location, need, preference and feedback it was transferred to the target groupsthrough the ATIC, Krishi Vigyan Kendraand Out Reach Centre of the Institute. Theprogressive farmers, NGOs and the linedepartment have played a vital role intransmission of the below mentionedtechnologies among the target groups (bothtribal and non-tribal) of the Island eco-system in all three districts of SouthAndaman, North & Middle Andaman andNicobar.
Natural Resource Management
Recharge structure cum well system forproviding water during dry period
Reinforced plastered silpauline lining intanks for rainwater storage and itsrecycling
Seed production of table purposegroundnut in coconut plantationsduring wet season and package ofpractices for ICGS 76 variety in ricefallows.
Four technological interventions i.e.Tank-well system, BBF, IFS and micro-irrigation system.
Long duration tall varieties i.e. Ranjit,Varshadhan, Savitri and Gayatri forlow lying areas.
Field Crops
Five rice varieties: two ( CARI Dhan 4
& 5 ) for coastal salinity conditions and
other three for normal soils ( CARI
Dhan 1,2 & 3 ).
IDM modules of tomato
Use of non-chemicals measures for the
management of vegetable crop pests
Horticulture & Forestry
Technology for establishment of Hi-
Tech Nursery.
Production technology for indigenous
orchids, Anthurium, Marigold and
Gladiolus
Animal Science
Improved Nicobari crosses (Nicorock
and Nishibari) for backyard farming.
Azolla as a feed supplement for Quail
and Duck.
Ultrasonography as a tool to
characterize the ovarian follicle in
poultry.
Social Science
Development of Micro business
modules of 14 technologies in
agriculture & allied fields.
TECHNOLOGIES ASSESSED AND TRANSFERRED

CARIAnnual Report 2009-2010
195
INFORMATION ON OTHER SECTIONS
Library
The institute has a well organized library
which plays an important role as centre for
literature and information related to the
institute’s mandate in these islands. It serves
and fulfils the need of the scientists of this
institute as well as research workers and
students from local research and educational
institutes. It has the facilities for on and off
line information retrieval, networking,
automation-computers and other
accessories. The library has been enrichedwith 5444 books, 2518 other publication and2455 bound volumes in addition to journalsby subscription, gratis, on exchange basisand technical books. Extensive collection ofresource materials in agriculture and alliedfields, special collection of islands relatedbooks and publications along withreprographic facility has given it a primeimportance in these islands. Internet servicesvia VSAT connection is also available foreasy access to these informations.
Planning, Monitoring and CoordinationCell
The Planning, Monitoring & CoordinationCell (PMCC) serves as a vital link betweenthe Institute, Council (ICAR), Government,Semi-Government, NGOs, other R & Dorganization and A & N Administration inaddition to providing information on variousresearch, development, extension andhuman resource development activities to
these agencies. The cell co-ordinated theconduct of the Institute ResearchCommittee meeting (IRC) from 17th to 21st
August, 2009 wherein a total of fifty ongoingprojects, eleven new projects and oneconcept note totaling sixty two werepresented followed by feed back wherein thehouse opined that the conduct of IRC in aparticipatory mode was very helpful asevery scientists could get enough time and

CARI Annual Report 2009-2010
196
opportunity to present their researchfinding. Further Mini IRC was alsoconducted on 4th November, 2009 toaccommodate new projects of the newlyjoined scientists.
Beside compilation of institute reports, it alsofacilitates publishing of research articles,technical bulletins, folders, books, newsletterand proceedings of the workshop,symposium and seminars and coordinatesto showcase the achievement of the instituteboth at island and National level. Presentlythe cell has a repository of RPFs along withthe Annual Report, bulletins, folders, booksand other related publication for readyreference to the visiting VIPs from Mainland& Island.
Activities under taken is mentionedbelow:
Institute Website made bilingual.
Internet and e-mail connectivity to allScientists / Officers .
VSAT of 512 Kbps for browsing anddownloading information.
Web page creation, updation andmaintenance.
Computer upkeep, up-gradation andtraining to Institute personnel.
Data compilation and statisticalanalysis.
Providing visual aids for differentprogrammes.
Procurement , installation and verifyingquality control of personal computer .
Maintenance of networking, DAMAVSAT.
Intranet maintenance and updation.
Providing Individual email ids for allScientists / officers .
PERMISNET - Personal ManagementInformation System Network (Monthlyand quarterly updating of personalrecords of all the staff of CARI has beencarried out through online).
Intelligent Reporting System (Quarterlyupdation of data and uploadingregularly).
Procurement of softwares, cartridgesetc.
Maintenance of all the computers andits accessories.
Downloading the circulars and otherinformation from ICAR website.
Computer Cell / ARIS Cell
The Agricultural Research InformationSystem (ARIS) envisages providing onlineinterconnectivity between the differentResearch Institutes, National Centres andState Agricultural Universities.

CARIAnnual Report 2009-2010
197
Website Updated
Institute bilingual website is updatedregularly.
Updating of the CARI website (http://cari.res.in) was done regularly bypublishing the latest Institute progressin terms of research, technologiesdeveloped, tender notifications,recruitment notifications and otherinformation.
Intranet of CARI (http://server:8080/carionline) was updated regularly.
Workshop / Training Organized
One day awareness workshop on“Consortium of eResources inAgriculture –Cera” was held at CARI,on 22nd December, 2009 for theScientists and Technical Officers,wherein 48 participated.
One day training on SYSTAT wasconducted on 27th July for the Scientistsand Technical Officers by CranesSoftware International Limited,Bangalore , wherein 18 participated.
R-governance office automationsoftware training was imparted to theScientist, Technical and theAdministrative staff in batches from8th October to 26th March.
Sub Distributed Information Centre
The Bioinformatics Centre, CARI is focusedon providing quality consultancy services inthe field of website, software development,database maintaining and manpowertraining. It is contributing as an active sitefor bioinformatics research and
development in these islands. This centrecan assist any progressive organization andinstitute in developing, integrating andmaintaining valuable biological data so thatit can be accessible in a safe and comfortablemanner.
The Centre has actively carried out thefollowing activities viz:
Development of databases for onlineand CD ROM on Algae Resources ,Coral Reef Resources, Web basedBioSAT: Sequence Analysis Tools andPhyto Pathosys , RNA Secondarystructure Prediction Softwares .
Organised 21st Annual BTISnetCoordinators meeting on 3rd & 4th
February, at Port Blair.
Guided M.Sc students for undertakingproject works in the discipline of M.Sc(Bioinformatics)
Developed three Proteins homologymodeling from medicinal plants andmicro organisms.

CARI Annual Report 2009-2010
198
Data Base Developed
Modelled Proteins Structures in InsilicoApproach
For Acetylglutamate Kinase Enzyme ofLeptospira interrogans
For HIV-I Protease Enzyme
For TEF-1 Protein of Phytopthorapalmivora
Software /Tools Developed
BioSAT: Biological Sequence Analysis ToolsPhytopathosys Software
Coral Reef Biodiversity of North Bay IslandsAlgae Resources in A & N Islands
RNA Secondary Structure Prediction Software
Phytopathosys Software

CARIAnnual Report 2009-2010
199
Estate Section
The section also includes workshop and
instrumentation centre. It takes up works
related to infrastructure development for the
institute to support research activities of the
Institute. The section also takes up repair and
maintenance of residential and non-
residential buildings of the Institute. The
power supply plays an important role for
laboratory research works. A 320 KVA
Generator Set is kept as stand by for
restoration of power supply during power
cuts. The water supply system to residential
& non- residential buildings is operated by
the staff of the Estate Section. During dry
spells, water supply is also made through
pumping from wells, ponds, reservoirs to
residential, non-residential, experimental
blocks, livestock and plantation crops.
Infrastructure Development
An amount of Rs.50.71 lakhs under plan and
non-plan has been spent for development of
new infrastructures, repair and maintenance
of the residential and non- residential
building of the institute. The construction of
two R.C.C drop spillways across the Nallah,
one at Sippighat farm and the other one at
Garacharma farm have increased the
impounding capacity of the Nallah on the
upstream side for providing life saving
irrigation to crops during dry spells. A
number of R.C.C. wells of different sizes
have been constructed at Sippighat Farm for
irrigation purpose. A number of dug out
ponds have also been developed in addition
to extension and deepening of existing pond
at Sippighat and Garacharma farm. In
addition to the above, few poly houses/
shade net houses, vermiculture tank unit,
chaff cutter shed, puval and fodder shed,
implement shed etc have been constructed
to facilitate smooth conduct of research
activities by the scientists. Installation of 5HP
pump sets, laying of pipe line and
installation of water tanks have been done
at different locations of the Garacharma
farm area for providing irrigation to
experimental plots through drip & sprinkler
systems. This year also 20 nos. of stalls for
displaying exhibits were constructed
including a big Pandal and a stage for the
Kisan Mela- 2010. The section also acts as
the liaisoning agency for the works executed
by CPWD, Port Blair and Electricity
Department of A & N Administration
Workshop
Re-scheduling of school trips, arrangement
and management of vehicles during XXI All
India BTIS Net Co-ordinator meeting, All
India group meeting on Rodent Control and
Agricultural Ornithology, Kisan Mela and
other major events of the Institute was done.

CARI Annual Report 2009-2010
200
The works related to routine and major repair
of Staff car, Jeep and Swaraj Mazda (bus) was
also completed in stipulated time. The year
saw addition of 2 Jeeps (TATA Sumo &
Bolero) in the fleet of institute vehicle.
Instrumentation Cell
Repairs and maintenance of scientific
equipments and providing uninterrupted
power supply during important meetings
and functions of the Institute was done.
The Estate Section has performed all its
duties with its full efficiency for the smooth
conduct of research works under the able
guidance of the Director.
RTI, ITMU, Rajbhasha Implementation
Cell (RIRIC)
RIRIC started functioning w.e.f. 1st March
2009 at CARI, Port Blair. The matters
related with RTI Act, Institute Technology
Management Unit and Implementation of
Rajbhasha are being dealt by this cell.
During the year, nineteen applications
received under RTI Act 2005 were
addressed. Under ITMU, different
technologies developed by the Institute are
being compiled to develop a database and
to formulate a strategy for their
commercialization in near future.
Under the ageis of Rajbhasha
Implementation Cell, CARI celebrated Hindi
Chetna Month from 14th Sep. to 13th Oct.
wherein various programmes were
organised like Hindi Tankan Pratiyogita,
Hindi Shabdawali Pratiyogita, Hindi Patra
Lekhan Pratiyogita, Hindi Nibandh Lekhan
Pratiyogita, Hindi Tippan Evam Aalekhan
Pratiyogita for Hindi and non Hindi
speaking Staff . The special attraction of
these celebrations was Hindi Sangoshthi on
“Naye Aarthik Paridrashya Me Krishi Evam
Krishi Anusandhan Ki Bhumika” on 23rd
September 2009. Another special event was
Elocution Competition for school children
on “Jalvayu Parivartan: Kaaran, Prabhav
Evam Nivaran Ke Upaay” on 24th
September 2009 wherein six students of
three schools participated. The most
sparkling event was Grameen Mahilaon
Hetu Bhashan Pratiyogita on “Swam
Sahayta Samoohon Se Mahilaon Ka Badalta
Hua Jeevan Estar” on 30th September 2009
wherein eleven rural women belonging to
different Self Help Groups shared their
experiences.
As a part of the month long celebration of
Hindi Chetna Month, CARI organised a
Kavya Gosthi on 6th October, 2009. A total
of 15 poets from the Islands recited their
compilations including Dr. R.C. Srivastava,
Director, CARI on this occasion. The
compilations of the poets were also
broadcasted by AIR, Port Blair on every

CARIAnnual Report 2009-2010
201
Wednesday for the benefit of the radio
listeners of these Islands.
Beside two Hindi workshops were also
organised on 12th October & 16th March to
enhance the skill of the officials in working
knowledge of Hindi and to increase the use
of hindi in day to day work.
The Cell also undertakes timely publication
of weekly issue of Agro Advisory Bulletin
based on weather forecast received from
Meteorological department and functions as
the nodal agency for widespread use of
Hindi language in research, extension and
developmental programmes carried out by
the Institute.
Post Graduate Students Cell
Post Graduate Students cell has been
established to coordinate the dissertation and
project work of the students registered in
different disciplines from various universities
of the mainland. This year a total of 30
students doing master programme in M.Sc.
have registered for dissertation work and 13
students have undertaken summer training
in different disciplines. The facility for
student’s accommodation inside the campus
has been created by converting four type-I
quarter into boys and girls hostel. The
students from different disciplines such as
Microbiology, Bioinformatics, Biotechnology,
Bioinformatics, Marine science etc have
registered for dissertation work under the
guidance of different scientists. The guidelines
for the student’s registration have been
displayed in the Institute website. The
institute is also trying to establish MoU with
the other universities like Bidhan Chandra
Krishi Viswavidyalaya for the Ph.D. scholars
who wants to carry out their research work
at this institute.
The details of the students undertaken
dissertation work during the year is
given below:

CARI Annual Report 2009-2010
202
Students Guided by Scientists for Dissertation
Name of the Degree/ Duration Title of the Project College/ UniversityStudent Course (Month) Work/ Thesis
Dr. Jai Sunder
M. Agni Raj Kamal M.Sc 06 Effect of feeding of Bharathidasan(Biochemistry) M. citrifolia in quality University
characteristics ofcow’s milk
K. Akbar Ali M.Sc 03 Isolation, Identification Jamal Mohammed(Microbiology) and Characterization of College,
gastro intestinal microflora Bharathidasanof cow, poultry and goat of UniversityAndaman
Dr. S. Jeyakumar
M. Motilal B.Tech 03 Molecular Characterization Sastra University(Biotechnology) of Teressa goat using
Microsatellite markers.Krishna Mohith J B.Tech 03 Molecular Characterization Sastra University
(Biotechnology) of Teressa goat usingMicrosatellite markers.
M. Mohammed B.Tech 03 Molecular Characterization Sastra UniversityNiyas (Biotechnology) of Teressa goat using
Microsatellite markers.Sreesujatha R. M M.Sc (Animal 05 Ultrasonograpnic Bharathidasan
Biotechnology) characterization of ovarian Universityfollicular dynamics andstudies on follicle apoptosis(atresia) in Japanese Quail(Coturnix coturnix japonica)
Dr. Arun Kumar De
P. Prakash M.Sc 04 Molecular Characterization Bishop Heber(Biotechnology) of Andaman Local goat College,
using Microsatellite markers. BharathidasanUniversity
P. Saravanan M.Sc 03 Molecular Characterization Srimad Andavan(Biotechnology) of Teressa goat using College,
Microsatellite markers. BharathidasanUniversity
Dr. D. R Singh
B. Prabhakaran M.Sc 06 Genetic diversity analysis Kurinji College,(Biotechnology) of Colocasia esculenta Bharathidasan
collected from different Universitylocations of Andaman andNicobar Islands usingRAPD markers.

CARIAnnual Report 2009-2010
203
N. Palanivel M.Sc 06 Genetic diversity among Bishop Heber(Biotechnology) three varieties of College,
Ocimum sanctum from BharathidasanAndaman Islands using UniversityRAPD markers.
Dr. Ajanta Birah
Ponmani M.Sc 04 Effect of plant lectins on Bishop HeberManimaran (Biotechnology) growth and development College,
of lepidoteran pests. BharathidasanUniversity
Dr.Krishna Kumar
K. Sathya Raj M.Sc 04 Exploration of genetic and St.Joseph College,(Biotechnology) functional diversity of Bharathidasan
antagonistic and plant growth Universitypromoting bacteria isolated from Rhizospheric soil.
Ajitha Krishna M.Sc 03 Pathogenic variability, KSR College, Anna(Biotechnology) Biochemical and Molecular University
Characterization ofRalstonia solanacearumcausing wilt in Solanaceouscrops of Bay Islands.
P. Uthayaraj M.Sc 06 Physiological and Molecular Kurinji College,(Biotechnology) Characterization of Bharathidasan
antagonistic Trichoderma Universityspp isolated from IndianBay Island ecosystem.
G. Venkadesaperumal M.Sc 06 Functional diversity and Bharathidasan(Biotechnology) community structure of University
microorganisms in mudvolcano and lime cave ofAndaman Islands.
Dr. Someshwar Bhagat
K. Bharathi M.Sc 05 Characterization of BharathidasanKannan (Biotechnology) Trichoderma spp from University
Andaman andNicobar Islands.
S. Sundravelu M.Sc Plant 05 Evaluation of some Bharathidasan(Biotechnology) fungicides and biocontrol University
agents against someplant pathogens.
Punitha Tiwari M.Sc 03 Compatibility of Tricoderma Amity University(Biotechnology) spp. with some botanicals
Sh. Israr Ahmad
M. Hamida Nasrin M.Sc 05 Assessment of salt tolerant Bharathidasan(Biotechnology) plant growth promoting University
Rhizobacterial diversityisolated from rice rhizospere

CARI Annual Report 2009-2010
204
in South Andaman.N. Manjubashini M.Sc 05 DNA fingerprinting of Bharathidasan
(Biotechnology) biocontrol isolates of UniversityTrichoderma spp isolatedfrom Andaman andNicobar Islands.
Dr. S. Dam Roy
M. Thiruchelvan M.Sc (Marine 06 Studies on the inhibitory BharathidasanBiotechnology) properties of bacteria University
associated with selectedmarine sponges fromAndaman
S. Prabaharan M.Sc (Marine 06 Characterization of BharathidasanBiotechnology) anti-bacterial activity of University
selected marine spongesfrom Pongibalu,South Andaman
Dr. Kamal Sharma
A. Anand Kumar M.Sc 04 Biochemical parameter Bharathidasan(Marine Science) and nutritional status of University
shell fish, Crassostrearivularis from two differentecosystem of Andaman
S. Ramesh M.Sc 04 A preliminary study on Bharathidasan(Marine Science) abundance of anemone University
fishes in North Bay andmass culture of live foodorganism for their larvalrearing.
N. Manoj Kumar M.Sc 04 Anti microbial properties Bharathidasan(Marine Science) of Oceanapia sagetaria, University
a marine sponge fromAndaman andcharacterization of itsassociated bacteria
Dr. Balakrishnan
S. Sridhar M.Sc 06 Insilico protein modeling Bharathidasan(Bioinformatics) of translational elongation University
factor 1-alpha ofPhytopthora palmivoraand docking studiesby benzimidazolescompounds.
K. Muthuvel M.Sc 06 Dockings studies of BharathidasanPrasath (Bioinformatics) 5 zanamivir analogues University
over the enzymeneuraminidase from H1N1avian influenza virus inthe treatment of avian flu

CARIAnnual Report 2009-2010
205
Students Guided by Scientists for Summer Training
Name of the Student Degree/ Duration College/ UniversityCourse (Month)
Dr. P. Krishnan
Jeeva Priya M.Sc (Marine Biotechnology) 01 Annamalai University
Reena Singh M.Sc (Marine Biotechnology) 01 Annamalai University
R. Shanti M.Sc (Aqua Marine Ecology) 02 Madurai Kamraj University
Dr. S. Dam Roy
Sunil Kumar Sahu M.Sc (Marine Biotechnology) 01 Annamalai University
Dr. Krishna Kumar
Alok Kumar B. Tech (Biotechnology) 01 NIT, Durgapur, West Bengal
Cyril Kurien B. Tech (Biotechnology) 01 NIT, Durgapur, West Bengal
Himanshu Palivoal B. Tech (Biotechnology) 01 NIT, Durgapur, West Bengal
Ravi Pratap Singh B. Tech (Biotechnology) 01 NIT, Durgapur, West Bengal
Mr. Israr Ahmed
Jasmine Kalra M.Sc (Marine Biotechnology) 01 Annamalai University
Yasmin M.Sc (Marine Biotechnology) 01 Annamalai University
Dr. M. Balakrishnan
Bibiyana Kumari Dung M.Sc (Bioinformatics) 01 Karpagam Arts andDung Science College
Dr. S. Jeyakumar
S. Gayathri B.Tech (Biotechnology) 01 Kalasalingam University

CARI Annual Report 2009-2010
206
AWARDS AND RECOGNITION
Scientist Award / Recognition Awarding Agency /
Organization Society
Someshwar Bhagat Best Poster Presentation 5th International Conference onBiopesticides: StakeholdersPerspectives, held at TERI, New Delhifrom 26th to 30th April, 2009.
T.V.R.S. Sharma Lieutenant Governor’s In recognition of his contribution inCommendation Certificate Agriculture Research and Development
in Bay Islands on the occasion ofIndependence Day.
Kanak Lata, Best Poster Presentation Award National Symposium on Noni forSingh, D.R., Empowerment and Prosperity, ChennaiSrivastava, R.C. from 24th to 25th October, 2009. and George, Z.
Ajanta Birah Life Fellow In recognition of her contribution in thepromotion of research in Entomology byThe Entomological Society of India, IARI,New Delhi on September, 2009.
Singh, D.R., Best Poster Presentation Award National Symposium on Noni forShrawan Singh and Empowerment and Prosperity, ChennaiSrivastava, R.C. from 24th to 25th October, 2009.
Singh, D.R., Best Oral Presentation Award National Symposium on Noni forSrivastava, A., Empowerment and Prosperity, 24th toSrivastava, A.K. and 25th October, Chennai.Srivastava, R.C.
S. Jeyakumar, Best Poster Presentation Award Indian Society of Animal Reproduction.A. Kundu, Kuntola Roy, In the International SymposiumJai Sunder, M.S. Expanding the horizons of ReproductiveKundu and technologies for augmenting fertility inR.C.Srivastava. farm and pet animals in the global
scenario, 10th to 12th , December 2009,Veterinary College and ResearchInstitute, Namakkal, T.N.

CARIAnnual Report 2009-2010
207
Shrawan Singh, Best Poster Presentation Award National Seminar on Production System
V.B. Pandey, Singh, D.R., Management in Adverse Conditions for
R.C. Srivastava, Higher Productivity in A & N Islands
V. Damodaran and from 22nd to 24th December, 2009.
I.Jaisankar
C.S. Chaturvedi & Best Poster Award National Symposium on National
S. Dam Roy Seminar on Productivity system
management in adverse condition for
higher productivity in A & N Islands
from 22nd to 24th December, 2009.
Natural Resource First Prize For the best stall in the Kisan Mela
Management Division from 9th to 10th February, 2010.
Arun Kumar De Best Paper Award Indian Dairy Association
from 17th to 19th February, 2010.
Krishna Kumar Distinguished Service Award In recognition of his contribution in Plant
Pathology by BIOVED Research Society,
Allahabad on 20th February, 2010.
Chaudhary N.C., Best Poster Presentation Award In National workshop cum Seminar on
Singh L.B., Singh, A.K., Status and Future Strategies of Horticulture
Damroy S., Srivastava R.C., Development in A&N Islands,
Chand Subhash, CARI, Port Blair.
Lata K. and Damodaran V.
D. R. Singh Outstanding Research World Noni Research Foundation,
Scientist on Noni Chennai, Tamil Nadu.

CARI Annual Report 2009-2010
208
ON GOING RESEARCH PROJECTS 2009-10Externally Funded
Project Title Principal Budget Date of Start/ CompletionInvestigator (lakhs)
Central Sector Scheme-NHM
Centrally sponsored scheme for Mr. I. Jaisankar 5.79 2004 2010Integrated development of Spices
Department of Biotechnology
Development of Mangrove-based Dr. S. Dam Roy 36.00 2008 2011fin/shellfish culture for livelihoodrestora-tion through employ-mentgeneration in Andaman Islands
Cataloguing and conservation of Dr. P. Krishnan 33.82 2010 2013Marine Sponges of Andamanthrough DNA Barcoding
Conservation and phenotypic and Dr. S.P.Yadav 34.07 04/2006 10/2009molecular characterization of Dr. S.Jeyakumarindigenous goat of Andaman and (w.e.f.March 2009)Nicobar Islands
Establishment of Sub-Distributed Dr. M.Balakrishnan 80.89 4/ 2005 3/2012Information Centre
NMPB, New Delhi
Technological innovations for Dr. D. R. Singh 246.00 2008 2011commercial exploitation ofMorinda citrifolia as livelihoodoption for island farmers
MoWR, New Delhi
Farmers Participatory Dr. R.C. Srivastava/ 24.00 04/2008 06/2010Action Research Programme Dr. S.K. Ambast
Integrated Agromet Dr. R.C. Srivastava/ 60.00 04/2008 03/2012Advisory Services Dr. S.K. Ambast
ICAR
All India Network Project on Dr. Ajanta Birah 8.31 02/2009 03/2012Rodent Control

CARIAnnual Report 2009-2010
209
ICAR Mega Seed Project Dr. Pankaj Kumar Singh 39.72 2007 2011
National Network Project on Dr. D. R. Singh 18.82 2008 2011Underutilized Fruits
AICRP on Vegetable Crops Mr. Shrawan Singh - 2008 Continued
AICRP on Tuber Crops Mr. Shrawan Singh - 2008 Continued
Coconut Development Board
Production of Disease Free Elite Dr Krishna Kumar 18.29 03/2010 03/2013Planting Material for Improvingthe Productivity of Coconut inBay Islands
Monitoring and surveillance of Dr. Ajanta Birah 7.01 03/2010 3/2012infestation of pest and disease ofcoconut in Andaman andNicobar Islands
SAC, Ahmedabad
Coastal Zone Studies Dr. S. Dam Roy 17.00 2007 2009
Optical Characterization of Dr. S. Dam Roy 10.55 2010 2013Coral Reef Diversity
NBAIM-ICAR
Application of microorganisms in Dr Krishna Kumar 34.85 10/2006 03/2012Agriculture and allied sectors-Microbial diversity and identification
WNRF, Chennai
Collection, conservation, Dr. D. R. Singh 9.54 2008 2011characterization andidentification of superiorclones of Morinda citrifolia
INCOIS, Hyderabad
Potential Fishing Mr. Grinson George 21.00 2008 2011Validation in Andaman Sea
NOVOD
Germplasm collection, evaluation Mr. I. Jaisankar 20.00 2008 2011and identification of high yieldinggenotypes of Jatropha and Karanjaand their multiplication in Bay Islands

CARI Annual Report 2009-2010
210
IIRS, Derhadun
Assessment of soil Dr. S. Ghoshal 0.66 03/2009 03/2011C pool of A&N Islands Chaudhuri /
Dr. T.P. Swarnam
A & N Administration
Development and Efficient Dr. R.C. Srivastava 69.00 04/2010 03/2013Utilization of Water Resourcesin the Micro Watershed ofHazaribagh Nala
DEPARTMENT OF SCIENCE AND TECHNOLOGY( WOMEN SCIENTIST SCHEME)
Isolation, Identification and Mrs Sumitha 8.50 11/2009 11/2012Characterization of Marine Gopalakrishnan /Actinomycetes from Andaman Dr. Jai SunderCoasts
Enhancement and Sustainable Dr. Kuntola Roy / 13.68 05/2009 05/ 2012Dairy Farming Through Dr. S. JeyakumarReproductive Health care
GEF (World Bank), NAIP
Strategies for sustainable Dr. S.K. Ambast 206.06 10/2009 09/2013management of degraded landand water for enhancinglivelihood in coastal area
NABARD, Port Blair
Establishment of Out Reach Dr. R.C. Srivastava / 79.696 06/ 2009 03/2013Centre at Diglipur, North & Dr. S.K. Zamir AhmedMiddle Andaman District
PDFSR, Modipuram (ICAR)
AICRP on Integrated Dr. N. Ravisankar 85.06 03/2010 03/2012Farming System

CARIAnnual Report 2009-2010
211
Institute Funded
Project Title Principal Investigator
Natural Resource Management
Development on fresh and brackish water based integrated farming Dr. R.C. Srivastava
system (IFS) in Bay Islands
Planning, augmentation and efficient utilization of water resources Dr. S.K. Ambast
in Kaju Nallah watershed
Studies on effective storage of water in ponds Dr. R.C. Srivastava
Natural resources degradation and socio-economic impact of leased Dr. S. Ghoshal Chaudhuri
farming in Andaman
Evaluation of soil management techniques in problem soils of Dr. T.P. Swarnam /
South Andaman Dr. S. Ghoshal Chauduri
Effect of vermicompost on nutrient dynamics and yield of vegetable crop Dr. A. Velmurugan
Effect of nutrient levels and irrigation on arecanut yield and soil fertility
Assessing the impact of pesticide use on soil and water resources of Dr. T.P. Swarnam
intensively vegetable growing areas of Andaman
Salt, water and nutrient dynamics in broad bed and furrow system Dr. S.K. Ambast
Standardization of package of practices for table purpose (HPS) Dr. N. Ravisankar
groundnut in Andaman
Effect of supplemental irrigation on crop yield and water use Dr. T. Subramani
efficiency in rice based cropping system of A&N Islands
Water and nutrient management in capsicum through drip system Dr. T. Subramani
under protected cultivation
Field Crops
Improving the quality and productivity of rice based cropping system Dr. T.V.R.S. Sharma
Genetic improvement of long duration rice for Andaman and Dr. P.K. Singh
Nicobar Islands
Molecular characterization of economically important flora and Mr. Israr Ahmad
microbes of Andaman and Nicobar Islands.
Assessment of crop losses and epidemiology of major vegetable Dr. Krishna Kumar
diseases of South Andaman.

CARI Annual Report 2009-2010
212
Standardization of production and protection technology of tropical Dr. Krishna Kumar
mushrooms
Integrated pest and disease management of Black pepper Dr. Someshwar Bhagat
Development of integrated disease management modules for tomato crop
Development of eco-friendly IPM module for Okra and cucurbits in Dr. Ajanta Birah
Andaman
Horticulture & Forestry
Standardization of micro-propagation techniques for potential orchids Dr. D. R. Singh
and ferns of A & N Islands
Studies on improvement of coconut and arecanut in Andaman and
Nicobar Islands
Collection, conservation and molecular characterization of early
flowering open pollinated mango clones of bay islands
Silvipastural system : Effect of fertilizer and cutting on net primary Mr. I. Jainsakar
production (Herbage production) in humid tropical
climate of bay islands
Standardization of agro technique for organic black pepper cultivation
in Andaman and Nicobar Islands
Identification, evaluation and development of Silvipastoral system for
Bay Island condition
Role of Alley cropping system in nutrient conservation (nutrient build
up + protection of fine soil particles from erosion), and selection of
suitable crop sequence for the cropping system for the Andaman Islands
Standardization of technologies for protected cultivation of vegetable Mr. Shrawan Singh
crops under Andaman & Nicobar conditions
Collection, conservation, characterization and documentation of in
digenous vegetables of Andaman & Nicobar Islands
Development of agro techniques for potato in bay islands Dr. M. Sankaran
Standardization of technology for production of quality flowers Ms. R. Sudha
under island ecosystem

CARIAnnual Report 2009-2010
213
Animal Science
Improvement, evaluation & propagation of indigenous Nicobari fowl and Dr. A.Kundu
ducks and dissemination of technology in Tsunami affected areas.
Improvement of Nicobari fowl for meat and egg production
Productivity enhancement of pigs under island ecosystem Dr. M.S.Kundu
To study the feasibility and convergence on subsistence pig rearing to
commercial pig farming inclusive of its process
Evaluation of therapeutic and immunomodulatory properties of Dr. Jai Sunder
Morinda citrifolia in poultry.
Potential of Morinda citrifolia fruit as feed for livestock and poultry
Characterization of livestock production sub system and assessment of Dr. S.K.Verma
critical nutritional gap in bay Islands.
Evaluation and utilization of azolla as feed supplement for Dr. S.Jeyakumar
backyard poultry in bay island.
Productivity enhancement and sustainable dairy cattle and Buffalo
production in bay islands.
Productivity enhancement of goats in bay islands
Molecular characterization of indigenous pigs of bay island by Dr. Arun Kumar De
microsatellite markers
Fisheries Science
Cage culture of commercially important marine and brackish-water Dr. S. Dam Roy
fishes in protected bays and creeks of Andamans
Stock assessment of grouper and snapper
Breeding and seed production technology of commercially important Dr. C. S. Chaturvedi
cat fishes: Clarius batrachus (Indian Magur) and Heteropneustus fossilis
(Singhi) in A & N Islands
Temporal and spatial variability of water quality parameters and mineral Dr. Kamal Sarma
profile of waters of andaman and their impact on shell fishes and fin fishes
Evaluation of pond lining for pisciculture in saline acidic soils of Andaman
Brood stock development and breeding of damsel fishes Mr. Grinson George

CARI Annual Report 2009-2010
214
Characterization of the role of associated bacteria in the bioactivity of Dr. P. Krishnanmarine sponges from Andaman
Assessment of threats due to climate change in Nicobar group of Islandsand development of adaptation strategies
Social Science
An economic analysis of floriculture and vegetable potential in Dr. Subhash ChandAndaman and Nicobar Islands
Economic valuation of mangroves in Andaman and Nicobar islands
Market and export potential analysis of marine fishery resources inAndaman and Nicobar islands
Identifying livelihood options and training needs compatible to Dr. S.K. Zamir Ahmedself help groups to fructify these options
Development of artificial neural networks (ANN) based forecasting Dr.M.Balakrishnanmodel for studying varieties diversity, yield and production inprominent rice cultivars of bay islands
Development of data base on fodder resources andwaste land in bay islands

CARIAnnual Report 2009-2010
215
PUBLICATIONResearch Article
Balakrishnan, M. and K.Meena (2010). ANNModel for coconut Yield predictionusing optimal Discriminant Planemethod at Bay islands. Indian Journalof Computer Science, Vol.IV, No.1,pp:27-34.
Balakrishnan, M. and R.C Srivastava (2009).Homology modeling and dockingstudies between HIV-1 Protease andBeta Mercapto Ethanol. IUP Journal ofBiotechnology, Vol.III, No.4, pp:7-13.
Balakrishnan, M. and R.C Srivastava (2010).In Silico Analysis of Different GeneExpressions and Phylogenetic Analysisof Corynebacterium Efficiens. IUPJournal of Biotechnology, March, Vol. 4,No. 1, pp: 13-25.
Balakrishnan, M., and R.C Srivastava (2009).Protein structural Modelling ofAcetylgutamate Kinase fromLeptospira Interrogans and dockingstudies of N-Acetyl-L-Glutamate. IUPJournal of Biotechnology, Vol.III, No.3,pp:7-16.
Balakrishnan, M., N. Ravisankar, R.C.Srivastava, S. Jeyakumar and M.Ramachandran, (2009). Database forBiodiversity of Andaman & NicobarIslands. International Journal ofBioinformatics, Vol. 2 (1), pp:1-4.
Balakrishnan, M., N. Ravisankar, T.P.Swarnam and M. Din (2010). Influence
of prickly sesban (Sesbania cannabina)intercropping in wet-seeded rice(Oryzasativa) on productivity, profitability,energetic and nitrogen balance underisland ecosystem. Indian Journal ofAgricultural Sciences, 80(1), pp:21-23.
Balakrishnan, M., N.Ravisankar, R.CSrivastava S.Jeyakumar andM.Ramachandran (2009). Databasefor Biodiversity of Andaman andNicobar Islands. International Journal ofBioinformatics, International Sciencepress, Vol.2, pp:1-4.
Balakrishnan, M., R.C Srivastava andMayank Pokhriyal (2010). Homologymodeling and docking studies betweenHIV-1 protease and carbamic acid.Indian Journal of Biotechnology Vol.9,pp: 96-100.
Balakrishnan, M., S.Jeyakumar, R.C.Srivastava, T. Sujatha, and MayankPokhriyal, (2009). Database designfor Animal Genetic Resources ofAndaman & Nicobar Islands. IndianJournal of Animal Sciences, pp:79 (6) :634-638.
Balakrishnan, M., Srivastava, R.C., andRamachandran, M (2009). In silicoProtein Structural Modeling andActive binding site Evaluation ofStreptococcus pneumoniae. In : NaturePreceding <http://hdl.handle.net/10101/npre.2009.3207.1> (2009).

CARI Annual Report 2009-2010
216
Bhagat, S. and Pan, S. (2009). Comparativeecological behaviour of some pre andpost tsunami isolates of Trichodermaand management of root rot and wiltof chick pea (Cicer arietinum). Journalof Plant Protection Science, 1, pp:34-39.
Bhagat, S. and Pan, S. (2010). Biologicalmanagement of root and collar rot ofFrench bean (Phaseolus vulgaris). IndianJournal of Agricultural Sciences, 42, pp:42-50.
Bhagat, S. and Pan, S. (2010). Cultural andPhenotypic Characterization ofTrichoderma spp from Andaman andNicobar Islands. Journal of Mycologyand Plant Pathology 40, pp: 145-157.
Bhagat, S., Lalchhuanawma, D. and Pan, S.(2009). Studies on Trichoderma spp.from Mizoram and establishment oftheir antagonistic potential againstsome soil borne plant pathogens.Journal of Mycopathological Research,47, pp:169-174.
Birah Ajanta, Kaushik Nutan, Raghuraman,M. and Gupta, G.P. (2009).Antifeedant and Growth InhibitoryEffects of Eucalyptus camaldulensis andCallistemon lanceolatus againstHelicoverpa armigera (Hübner). PesticideResearch Journal, 21 (1), pp : 9-12.
Chatterjee, N., Pal, A.K., Das,T., Delvi, R.,Mohammod, M.S, Kamal Sarma,Mukherjee, R.C., Baruah, K. (2009).Effect of stocking density and journeylength on welfare of rohu (Labeo rohita
Hamilton). Aquaculture Internationa,
DOI 10.1007/s 10499-009-9309-8.
Choudhuri, N. C., Paul, G., Maiti, A. K.,
Kundu, M. S. and Kundu, A. (2009).
Impact of training on poultry farming
and evaluation of improved Nicobari
fowl under intensive and extensive
management systems in Andaman,
India. Livestock Research for Rural
Development. Volume 21,
Dam Roy S. and Grinson George.( 2009).
Marine Resources of Islands; Status
and approaches for sustainable
exploitation / conservation with
special emphasis to Andaman &
Nicobar Islands. J. Animal Science,
80(4), pp: 57-62.
Damodaran, T., Singh, D.R., Kapil Dev,
Balakrishnan, A., Kavino, M. and
Medhi, R.P. (2009). Genetic diversity
analysis among the open pollinated
clones of Mango in A &N Islands using
RAPD markers, Indian J. Hort., 66(1),
pp: 13-17.
Ganeshkumar, B., R. Sendhil, P.Venkatesh,
R. Raja, V. Jayakumar and S.
Jeyakumar (2009). Socio-economic
impact assessment of livelihood
security in agriculture, animal
husbandry and aquaculture on the
tsunami-hit lands of Andaman.
Agricultural Economics Research Review,
Vol.22 pp: 483-494.

CARIAnnual Report 2009-2010
217
Gupta, S.K., Ambast, S.K., Ghoshal
Chaudhuri, S., Singh, Gurbachan,
Raja, R. and Yaduvanshi, N.P.S.
(2009). Water management strategies
for increased productivity on tsunami
affected salty lands of Andaman and
Nicobar Islands. Journal of the Indian
Society of Coastal Agricultural Research,
26(2), pp: 135-140.
Jeyakumar, S., B. Ganesh Kumar, Kuntola
Roy, Jai Sunder and A. Kundu (2009).
Prevalence of parasitic infection in
livestock and poultry in Andamans.
Indian Veterinary Journal, 86, pp: 1178-
1179.
Jeyakumar, S., T. Sujatha and A.Kundu
(2010). Ultrasonographic characteristics
of ovarian follicles in Hen. Indian
Veterinary Journal, 87, pp: 295-296.
Kamal Sarma, Pal, A.K., Sahu N.P.,
Ayyappan, S., Baruah, K. (2009).
Dietary high protein and vitamin C
mitigates endosulfan toxicity in the
spotted murrel, Channa punctatus
(Bloch, 1793). Science of the Total
Environment, doi:10.1016/j.scitotenv.
2009.02.031.
Kamal Sarma, Ravisankar, N., Dam Roy, S.,
Grinson Gerorge and Srivastava, R.C.
(2010). Prospects of fish culture in the
broad bed and furrow system in
Andaman, Environment & Ecology,
28(1), pp: 86-90.
Krishnan, P., Gireesh Babu, P., NeerajKumar, Deepa Bhartiya, Rajendran,K.V. & A. Chaudhari (2009). DNAconstructs expressing long-hairpinRNA (lhRNA) protect Penaeusmonodon from WSSV infection,Vaccine, 27, pp : 3849–3855.
Krishnan, P., Gireesh Babu, P., Rajendran, K.V.Chaudhari, A. (2009). RNAi therapeuticsfor shrimp viral diseases. Diseases ofAquatic Organisms, 86, pp: 263-272.
Kumar Krishna, Madhuri, K., Amaresan, N.,Bhagat, S. and Srivastava, R.C. (2009).A new record of fruit rot of snakegourd from Bay Islands. Journal ofMycology and Plant Pathology, 39,pp:528-29.
Mishra, N.K., Bhagat, S. and Pan, S. (2009). Invitro evaluation of Toxic metabolites offoliar pathogens of guava. Journal ofMycopathological Research, 47, pp: 37-41.
Pawar, S. S., D. Malakar, A. K. De and Y. S.Akshey (2009). Stem cell-likeoutgrowths from in vitro fertilized goatblastocysts. Indian Journal ofExperimental Biology 47, pp: 635-642.
Ravisankar, N., M. Balakrishnan, S. GhoshalChaudhuri, S.K. Ambast, R.C.Srivastava, T. Subrmani and N.Bommayasamy. (2010). Evaluation oftime, method of sowing and varietiesfor table purpose groundnut (Arachishypogaea) under Island ecosystem.Indian Journal of Agricultural Sciences80 (4), pp:299-303.

CARI Annual Report 2009-2010
218
Sherry, P.M. and Chaturvedi, C.S. (2010).Biochemical alteration in Liver &intestine of Teleost Fish Channapunctatus After Lead Exposure.International Journal of Agriculture &
Biological Res., 26(2), pp: 159-164.
Singh, D.R., Srivastava, R.C. and Raja, R.(2009). Morinda citrifolia- a viablealternative for Tsunami affectedagriculture lands. Indian Forester,
133(11), pp: 1470-1476.
Subash Chand, R.C. Srivastava, B.Ganeshkumar, S. Jeyakumar. Z.George and K. Roy, (2009). Marketedsurplus and price spread of milk inBay islands: Microlevel analysis. Indian
Journal of Agricultural Economics,Vol.64:3, pp : 399-400.
Subhash Chand, A. K. Sikka, R. C.Srivastava and Sundarambal(2009) . Constraints Faced byFunctionaries in WatershedManagement: A Case Study. IndianResearch Journal o f ExtensionEducation Vol.9 (2), pp: 68-71.
Subhash Chand, Alok K. Sikka and V.N.Sharda (2009). EnvironmentalImplications of Converting NaturalGrass Land into EucalyptusPlantations in Hydro PowerCatchments in Nilgiris, Tamil Nadu:An Economic Analysis Indian Journalof Agricultural Economics vol. 64(4), pp:618-627.
Subhash chand, R. Raghupathy andM.Madhu (2009). Dynamics ofAgrarian Structure of Nilgiris Districtof Tamil Nadu and its Implications.Indian Journal of Soil and WaterConservation, 37(3), pp : 217-223.
Velmurugan, A., Gopal Krishan, Dadhwal,V.K., Suresh Kumar, Swarnam, T.P.and Saha, S. K. (2009). Harmonizingsoil organic carbon estimates inhistorical and current data. CurrentScience, 97(4), pp: 554-558.
Zamir Ahmed, S.K., R.C. Srivastava and M.Balakrishnan (2010). A Micro-LevelStudy of the Trained and UntrainedFarm Women of Andaman. Indian Res.J. Ext. Edu. 10 (1), January, pp: 117-125.
Popular / Technical Article
Ajmer Singh, Satyavir Singh and AjitSingh Kharub (2009). Kapaas-Gehoon Fasal Paddahati kaSaamaajik evam Aarthik Vishleshan. Bhartiya Krishi Anusandhan Patrika,24 (1), pp: 31 -38.
Ambast, S.K. Srivastava, R.C., Subramani,T. and Chand, Subhash. (2009). Waterresources development in A&N Islands- Technology development. IslandAgriculture, IV(1), pp: 5-7.
Balakrishnan, M., R.C Srivastava andM.Ramachandran (2009). Insilico Drugdesign of Thrombin Inhibitors. BiobytesNewsletter of biotechnology Informationsystems (BTIS). Vol.4, pp:31-36.

CARIAnnual Report 2009-2010
219
Birah Ajanta, S.K. Zamir Ahmed, T.V.R.S.Sharma and R.C. Srivastava (2009).Pesticide : The Tangible Trends – IslandAgriculture Column. The Echo ofIndia, 8th April, p.3
Chaturvedi, C.S., Grinson George and DamRoy, S. (2009). Air-breathing FishCulture & Breeding Technique inAndman Island. (Hindi), NBFGR SilverJubilee, Matsya Lok, pp : 28-31.
Dam Roy S. (2009). Status of Aquaculturein A & N Islands. Fishing Chimes,29(1), pp: 84 – 87.
Dam Roy, S., Asha Jyothi and RizwanaHairun (2009). Andaman AvamNicobar dweep samuha maemangrove jaib vividtha (Hindi).Dweeep Samachar, Port Blair .
Dhruba Malakar, Yogesh S. Akshey, ArunK. De, Manoj K. Jena and Sachin S.Pawar (2010). Somatic cell nucleartransfer for production of clonedoffspring and its applications. DairyPlanner, 6 (4), pp : 10-11.
Jaisankar, I., V. Damodaran, M. Sankaran,D.R. Singh and A.K. Tripati (2009).Production Techniques of Arecanut inBay Islands. The Echo of India, VolII, issue No 182, 1st April, p. 3.
Kamal Sarma, Dam Roy, S., Krishnan, P.,and Murugesan, S. (2010). Tigershrimp brooders of Andaman Waters.Fishing Chimes, 29(10), pp : 19-20.
Kumar, K., Bhagat, S. and Srivastava, R.C.(2010). Andaman va Nicobar DweepSamuh ke Khira Vargiya Phaslon meinLagne Bimariyan va Unka SamekitPrabandhan. Kheti, January.
Malakar, D., Y.S. Akshey, A.K. De and S.S.Pawar (2009). Establishment ofembryonic and adult stem cell and theirapplications. Agrovet Buzz 2 (1), pp :4-12.
Malakar, D., Y.S. Akshey, A.K. De, S. Garg,M.K. Jena, and S.S. Pawar (2009).Cloned Animal Production and itsApplication. Agrovet Buzz 2 (3), pp :32-36.
Sharma, T.V.R.S., Birah Ajanta andSrivastava, R.C. (2009). Improve thecoconut productivity in timelyinterventions in the Bay islands. TheEcho of India, 22nd April.
Singh, D.R., Srivastava, R.C., George, Z. andSikdar, P.K. (2009). The Wonder Plant:Giloe. The Light of Andaman. TheWeekly News Magazine, Port Blair on21st August.
Singh, D.R., Srivastava, R.C., George, Z. andSikdar, P.K. (2009). The MedicinalPlant Giloe (Tinospora cordifolia). TheDaily Telegram, Port Blair on 6th
September.
Singh, H.P., Singh, D.R. and Malhotra, S.R.(2009). Noni for Socio-economicupliftment. Indian Horticulture, 54(6),pp: 1-9.

CARI Annual Report 2009-2010
220
Singh, Shrawan, P. Kalia and S.R. Sharma(2010). Cauliflower genotypesresistant to downy mildew. CruciferaeNewsletter, 29, pp: 39-41
Sudha, R., Singh, D.R. and Srivastava, R.C.(2009). Heliconia – Potential cut flowerfor Bay Islands. The Echo of India, 11th
Feb., p. 3.
Sujatha, T and S. Jeyakumar (2009). Azollaas feed supplement for livestock andbackyard poultry under islandecosystem. Indian Farming.
Yadav, R. K., S. K. Sanwal, P.K. Singh andS.K. Singh (2009). Sada bahar shabjitree tomato. Phal Phool. 7, January-February 2010, pp: 33-34.
Yadav, R. K., S.K., Sanwal, P.K. Singh andS.K. Singh (2009). Tree Bean eakupyogi vrakcha. Phal Phool, 9, May-June, p: 36.
Yogesh S. Akshey, Arun Kumar De andDhruba Malakar (2009). Production ofcloned animals using somatic cells andtheir applications. Everyman’s Science,Vol. XLIV No.1 (April’09-May’09).
Books / Book Chapters/ Folders / Bulletins/Manuals/ Proceedings/ Monograph :
Books
Dam Roy, S., Krishnan, P., George, G.,Kaliyamoorthy, M., and GouthamBarathi, M.P. (2009). Mangroves ofAndaman and Nicobar Islands. CARI,Port Blair, p:65.
Dam Roy, S., Krishnan, P., Grinson-George.,Srivastava, R.C., Kaliyamoorthy, M.,Raghuraman, R., and Sreeraj, C.R.(2009). Reef Biodiversity of North Bay,Andaman. CARI, Port Blair. p144.ISBN: 978-81-909282-1-2.
Riji John, K., Krishnan, P. and GrinsonGeorge (2009). PFGF’s VII AnnualNational Meet 2009- Souvenir,Professional Fisheries GraduatesForum, Mumbai, p:84.
Singh, D.R. R.C.Srivastava and Jai Sunder.Bibliography on Noni (2009).Published by CARI, Port Blair.
Singh, H.P., Singh, D.R. and Srivastava, R.C.(2009). Morinda citrifolia L. The DevineNoni. Published by CARI, Port Blair,p: 241.
Srivastava, R.C. Salam, M.A. Singh, D.R.,Sankaran, M. and Shrawan Singh(2009). Souvenir cum Abstract book onStatus and Future Strategies ofHorticulture Development inAndaman & Nicobar Islands.Published by CARI, Port Blair incollaboration with HVADA, Dept. ofAgrl., A&N Admn., Port Blair, p: 220.
Salam, M.A., Srivastava, R.C., Pandey, G.S.,Singh, D.R., Sharma, T.V.R.S., Kumar,R., Hassan, M.M., Rekha, S.C. andSingh, A. (2010). Souvenir Book onCoconut Based Farming System in A& N Islands .HVADA, ATMA, CARI,Port Blair and CDB, Kochi, p: 174.

CARIAnnual Report 2009-2010
221
Srivastava, R.C., S.K. Zamir Ahmed and S.K.Verma (2009). Sukhcham VayasayaModule (in Hindi) CARI, Port Blair.P:74.
Veena Kumari, K., P. Mohanraj, R.C.Srivastava, S.K. Verma (2009). Bookon Andaman Nicobar Dweep Samuhakee Titliya. Published by CARI, PortBlair, pp: 1-186.
Book Chapters
Balakrishnan, M and R.C.Srivastava (2009).Artificial Neural network and fuzzylogic applications in aquaculture(Eds.akroy &Niranjan Sarangi.)Published by Daya Publisher, NewDelhi, pp: 193-205.
Balakrishnan, M. (2010). Integration ofbioinformatics, computational andSystem Biology. in Proceedings of XXIAll india BTISnet Coordinatorsmeeting . CARI , Port Blair.
Balakrishnan, M., R.C. Srivastava and N.Ravisankar (2009). Coconut yieldprediction through split network withBack propagation Algorithm (Eds: PMGovindakrishnan et al), Central PotatoResearch Institute, Shimla, pp: 26-33.
Dadhwal, V.K. and Velmurugan, A. (2010).Land transformation and itsconsequences in South Asia, In: GlobalEnvironmental Changes in South Asia(Eds. Mitra, A.P. and Sharma, C),Capital publishing company, NewDelhi, pp.125-170.
Dam Roy S., Kamal Sarma, Krishnan, P.,Grinson George, Murugesan, S., andBenny Varghese (2009). Prospects ofCage Culture in Andaman andNicobar Islands. In: Proceedings ofBrainstorming Session onDevelopment of Island Fisheries.CARI,Port Blair, pp: 93-102.
Dam Roy, S., Grinson George (2009).Aquaculture in Andaman: Emergingopportunities under post-tsunamiscenario. In: Proceedings of Brainstorming session on Development ofIsland Fisheries . CARI , Port Blair,pp:53-60.
Dam Roy, S., Krishnan, P. and Grinson-George (2009). Fisheries Professionalsfor Island Fisheries Development – AnUnfulfilled Responsibility. In: PFGF’sVII Annual National Meet (2009).Souvenir, (Eds) Riji John, K., Krishnan,P. and Grinson George, Published byPFGF, Mumbai, pp : 39-42.
Damodaran, T., R.C. Srivastava, N. Ravisankar,S.K. Zamir Ahmed and T.P. Swarnam(2009). Nariyal Kae Chilkae ka Prayogkarkae uchi uthi kyari mae varsh BharSabji Uthpadan ki prodhowki.Sukhcham Vayasaya Module (Hindi).CARI, Port Blair, pp : 10-12.
Jaisankar, I., Singh, D.R. and Damodaran,V. (2009). Nursery Production ForProtected Cultivation Of vegetablesand Flowers. In : Training Manual forPolyhouse Construction, Water

CARI Annual Report 2009-2010
222
Resource Development and Vegetable
Production, organized by: CARI, Port
Blair in collaboration with CEFI
(NGO), Port Blair, pp: 26-28
Jeyakumar, S., Kundu, A., Kundu, M.S.,
Sunder, J. & Verma, S.K. (2009). Bakri
Palan (Sukshm vyavsay module).
CARI, Port Blair, pp : 34-38.
Kamal Sarma, Dam Roy, S., and Krishnan,
P. (2009). Utilization of Tsunami
Affected Land for Shrimp Culture. In:
Proceedings of Brainstorming Session
on Development of Island Fisheries.
CARI , Port Blair, pp: 75-80.
Kundu, M.S, Choudhary N.C., Kundu, A.,
Verma, S.K., Sarma, K.& Dam Roy,
S.(2009). Integrated Brackish water
farming System. In: Training Manual
on Brackish Water Aquaculture in
Andaman. pp: 25-28.
Kundu, M.S., Kundu, A., Jeyakumar, S.,
Sunder, J. & Verma, S.K. (2009). Suar
Palan (Sukshm vyavsay module).
CARI, Port Blair,pp : 39-43. (Chapter
in hindi)
Ravisankar, N., Ambast, S.K., Zamir Ahmed,
S.K. and Srivastava, R.C. (2009).
Kechua khad utpadan. In: Andaman
aur Nicobar Dweep Samuh main
Uttam Jivikoparjan hetu Krishi aur
sambaddh kshetro main Suksham
Vyavsay Module (Eds: R.C. Srivastava
et al.). CARI, Port Blair, pp. 69-74.
Ravisankar, N., M., Din, S.K., Zamir Ahmed,R., Raja, S.K. Ambast, and R.C.Srivastava, (2009). Choudi kyari evamnalika tantra. In: Andaman aurNicobar Dweep Samuh main UttamJivikoparjan hetu Krishi aursambaddh kshetro main SukshamVyavsay Module (Eds: R.C. Srivastavaet al.). CARI, Port Blair, pp: 6-9.
Ravisankar, N., R., Raja, S.K., Zamir Ahmed,S.K. Ambast, and R.C. Srivastava,(2009). Samekit krishi tantra. In:Andaman aur Nicobar Dweep Samuhmain Uttam Jivikoparjan hetu Krishiaur sambaddh kshetro main SukshmaVyavsay Module (Eds: R.C. Srivastavaet al.). CARI, Port Blair, pp: 1-5.
Ravisankar, N., S.K. Ambast, S.K. ZamirAhmed, and R.C. Srivastava (2009).Ketchuwa Khad Utpadan. In:Andaman aur Nicobar Dweep Samuhmain Uttam Jivikoparjan hetu Krishiaur sambaddh kshetro main SukshmaVyavsay Module (Eds: R.C. Srivastavaet al.). CARI, Port Blair, pp : 69-74.
Saira Banu, Singh, Shrawan, Sudha, R.,Singh, D.R. and Ravisankar, N.(2009). Economics of protectedCultivation of Vegetables. In: TrainingManual For Polyhouse Construction,Water Resource Development AndVegetable Production. CARI, PortBlair. pp: 67-71.
Singh, A.K., Kundu, A., Sujatha, T., Kundu,M.S., Sunder, J., Verma, S.K. &

CARIAnnual Report 2009-2010
223
Jeyakumar, S., (2009). Bater Palan,Micro Business module (Sukshamvyavsay module).CARI, Port Blair,pp : 44-58.
S ingh, Shrawan (2009) . Protectedcultivation of tomato. In: Trainingmanual on Polyhouse construction,water resource development andvegetable product ion (Eds .Shrawan Singh et al). CARI, PortBlair, pp: 48-54.
Singh, Shrawan and Singh, D.R. (2009).Construction of farmer friendlystructures for protected cultivation ofvegetables. In: Training manual foroolyhouse construction, water resourcedevelopment and vegetable production.CARI, Port Blair . pp: 7-11.
Singh, Shrawan and V. B. Pandey (2009).Protected cultivation of Capsicum. In:Training manual on polyhouseconstruction, water resourcedevelopment and vegetableproduction (Eds. Shrawan Sing, et al).CARI, Port Blair, pp:55-57.
Singh, Shrawan and V. B. Pandey (2009).Protected cultivation of Cucumber. In:Training manual on Polyhouseconstruction, water resourcedevelopment and vegetableproduction (Eds. Shrawan Singh et al).CARI, Port Blair, pp:59-62.
Singh, Shrawan, Sudha, R., Singh, D.R. andR. C. Srivastava (2009). Polyhouse
Construction, Water ResourceDevelopment and VegetableCultivation. CARI, Port Blair. p: 71.
Subhash Chand, Kamal Sarma, S. Murgesanand S. Dam Roy (2009), Economics ofBrackish water farming. In: Trainingmanual on Brackish waterAquaculture in Andaman. CARI, PortBlair, pp : 44-46.
Subhash Chand, S. Dam Roy, Kamal Sarma(2009). Economics and marketingstrategies for Brackish water fishproduction in A & N islands. In:Training manual on Development ofbetter management practice forintegrated farming system sponsoredby National Fisheries DevelopmentBoard.
Bulletins
Srivastava, R.C. and Ambast, S.K. (2009).Water Policy for Union Territory ofAndaman and Nicobar Islands: AScientific Perspective. CARI, PortBlair, p. 18
Srivastava, R.C. and Ambast, S.K. (2010).Development of Human Resources inAgriculture for A&N Islands andTropical Island Nations: Need, Scopeand Prospect. CARI, Port Blair, p. 20
Birah Ajanta, Tripathi, R.S., Mohan Rao,A.M.K., Kumar Krishna & Srivastava,R.C. (2010). Rodents and theirmanagement in Andaman & NicobarIslands. CARI, Port Blair, p: 12.

CARI Annual Report 2009-2010
224
Folders
Dam Roy, S., Krishnan, P., Kamal Sarma,
Murugesan, & S., Kaliamurthy, M.
(?). Production of Tiger prawn seeds
in a backyard hatchery in Andaman.
CARI, Port Blair.
Jai Sunder, S. Jeyakumar, A. Kundu & R.C.
Srivastava (2009). Bakriyon ki
bimariyan tatha unka bachav. CARI,
Port Blair.
Jai Sunder, S.Jeyakumar, A. Kundu, S.
Tomar & R.C. Srivastava (2009).
Pashuon ko rogon se bachav ke upay.CARI, Port Blair.
Krishi Sandesh by KVK ( Monthly) 2009.CARI, Port Blair
Kumar Krishna, Bhagat, S. and Sharma, A.(2010). Dweep Samuho me OysterMushroom Ki Kheti. CARI, Port Blair.
Sharma, T.V.R.S., Birah Ajanta, Verma S.K.and Srivastava R.C. (2010). DweepSamuho me Nariyal ki Unnat Kheti.CARI, Port Blair.
Zamir Ahmed, S.K. & R.C. Srivastava(2009). Out Reach Centre (ORC),CARI., Port Blair.
In addition to above 106 Papers were presented in the
Conference/ Symposium/ Workshop
Success Stories
Success stories of five farmers technologically supported by CARI has found place among101 farmers selected from all over country for publication in “Harvest of Hope: Coffee TableBook of 101 Success stories documented by Ministry of Agriculture, released on 26th February2010 by Hon’ble Minister of Agriculture, Govt. of India

CARIAnnual Report 2009-2010
225
Sea change, Success story of Land based IFS, Mrs SabitaSingh, Guptapara Village, A & N Islands In Harvest ofhope: A tribute to the farmers of India, Published byMinistry of Agriculture, Government of India, NewDelhi, (Story Number 81).
Furrows for Fantastic Future, Success story of BBFfarmer Mr M. Muthaiah, Indiranagar Village, A & NIslands In Harvest of hope: A tribute to the farmers ofIndia, Published by Ministry of Agriculture, Governmentof India, New Delhi, (Story Number 49).
Symbiotic Success, Success story of IFS farmer Mr P.Pacchamuthu, Calicut Village, A & N Islands InHarvest of hope: A tribute to the farmers of India,Published by Ministry of Agriculture, Government ofIndia, New Delhi, (Story Number 65).
Harvesting Happiness, Success story of Water userAssociation, Mr Kartick Das, Manjery Village, A & NIslands In Harvest of hope: A tribute to the farmers ofIndia, Published by Ministry of Agriculture,Government of India, New Delhi, (Story Number 42).
Integrated Initiative, Success story of IFS farmer Mr A.L.
Swaminathan, Calicut Village, A & N Islands In Harvest
of hope: A tribute to the farmers of India, Published by
Ministry of Agriculture, Government of India, New
Delhi, (Story Number 14).

CARI Annual Report 2009-2010
226
PEER RECOGNITION TO DIRECTOR, DR. R. C. SRIVASTAVA
Award
Fellow Member for the year 2007-08awarded by the Indian Society ofAgricultural Engineers on 28th Jan. 2010.
Selected as Fellow of Institutions ofEngineers, Kolkata.
Special Deliberations
CARI’S mandate, achievement andvision for A & N Islands from 2006 to2009 on Prasar Bharti, A & N Islands.
Climate change & its effect on securityof Andaman & Nicobar Islands on 4th
September 2009 at Seminar on Securityand Development of A & N Islandsorganized by Andaman & NicobarCommand.
Employment opportunities for decentlivelihood and climate change at M.G.College, Mayabunder on 10th
September, 2009.
Effect of Climate Change – Mitigationand Adaptation during EnvironmentalAwareness for teachers jointlyorganized by CPR Foundation, Chennaiand A & N Science & TechnologyCouncil, A & N Administration atDiglipur on 10th September, 2009.
Effect of Climate Change in A & NIslands: A Prelude in the Secretariat ofA & N Administration which waschaired by Shri Vivek Rae, Chief
Secretary and attended by allSecretaries and HoDs of A & N Islands.
Dweepon Me Krishi Ki Chunoutiya VaSambhavnayen on AIR, Port Blair on01.01.2010.
Water harvesting technology for hilltop,mid hills, valleys & its management withspecial reference to island conditions onWorld Water Day on AIR, Port Blair on23.03.2010.
Lead Papers presented
Srivastava, R.C. (2009). Climate changeand Security of the A & N Islands. In :Seminar on Security and Developmentof A & N Islands organized by A & NCommand.
Srivastava, R.C. (2009) Water ResourceDevelopment and Management. In :Rainfed Areas in Annual KVKConference at TNAU, Coimbatore.
Srivastava, R.C. (2010) Rehabilitation ofTsunami Affected Farmers throughIntegrated Agricultural TechnologicalInterventions in Andaman Islands. In :International Workshop on The IndianOcean Tsunami : 5 years later –Assessing the Vulnerability andResilience of Tsunami affected coastalregions conducted by Inter-UniversityResearch Institute Corporation,National Institute for the Humanitiesfrom 1st to 3rd March, 2010 at Singapore.

CARIAnnual Report 2009-2010
227
Srivastava, R.C. (2009). Plant diseasemanagement in island ecosystem-optionsand strategies. In: 5th InternationalConference of Plant Pathology on PlantPathology in Globalised era at IARI,New Delhi on 12th Nov. 2009.
Srivastava, R.C. (2009) IslandAgriculture- Potential, Constraints andThreats from Climatic Change. In :Agriculture Science Congress atSKUAST, Srinagar.
Srivastava, R.C. 2009 Genetic Resourcesof Horticultural Crops in Andaman &Nicobar Islands. In : Agriculture ScienceCongress at SKUAST, Srinagar.
Peer Recognition
Member, UT Coordination Committee,A&N Administration, Port Blair
Member, Society for Science Centre,A&N Islands, Port Blair
Member State Level EnvironmentCouncil, A&N Islands, Port Blair
Member, Executive committee of SOC,Andaman Nature Club, Port Blair
Member, State Board for Wildlife, A&NIslands, Port Blair
Member, Andaman & Nicobar Scienceand Technology Council, A&N Islands,
Port Blair
Member, State Level Sanction
Committee for Rashstriya Krishi Vikas
Yojana, A&N Islands
Member, State Level AdvisoryCommittee for Narrow casting projectunder the scheme mass media supportfor agril. extension, A & N Islands
Member, State Seed Sub-Committeefor Agricultural & HorticulturalCrops, A & N Islands
Member, UT Level Monitoringcommittee to monitor theimplementation of programmerelating to rehabilitation of AnimalHusbandry
Member, State Level WatershedDevelopment Committee underWatershed development Project forrainfed areas in A&N Islands
Member, High Value AgricultureDevelopment Agency for the UT ofA&N Islands
Member, Governing Council ofAndaman & Nicobar Coconut Mission
Member, UT level Task ForceCommittee for A&N Islands
Member, Agriculture TechnologyManagement Agency Governing Bodyof A&N Islands
Participation in important meeting,
symposium and workshop
Brainstorming Meeting on Managementof Horticultural Crop Genetic Resources
held at NBPGR, New Delhi on 21st
April, 2009.

CARI Annual Report 2009-2010
228
Swadesh Prem Jagriti Sangosthi - 2009
held at Mahmada, Pusa,Bihar from
28th to 31st May, 2009.
9th Agricultural Science Congress held
at Srinagar from 22nd to 24th June, 2009.
Chaired, Coordination Committee
meeting on Morinda Project at CDRI,
Lucknow on 25th June, 2009.
ICAR Foundation Day Ceremony andDirector’s conference from 16th to 18th
July, 2009 at ICAR, New Delhi.
Seminar on Security and Developmentof A&N Islands held at Andaman &Nicobar Islands on 4th & 5th September,2009.
Training on Effective Leadership forGood Governance: from 17th-19th
September, 2009 at ManagementDevelopment Institute, Gurgaon.
AICRP meeting on Tuber Crops held atOUAT, Bhubaneswar from 9th - 10th
October, 2009.
Meeting of Institutions of Engineers heldat Kolkata on 21st October, 2009.
4th National Conference on KVK heldat TNAU, Coimbatore on 7th Nov. 2009.
Panel discussion on Online ExaminationSystem held at ASRB, KAB, New Delhion 9th Nov. 2009.
5th International Conference of PlantPathology on Plant Pathology inGlobalised era at IARI, New Delhi on
12th Nov. 2009.
National Children’s Science Congress
Seminar held on 24th Nov. 2009 at Govt.
Girls Sr. Secondary School , Port Blair.
Annual Convention of Indian Society
of Agricultural Engineers held at New
Delhi on 28th -29th January 2010.
Horticulture Divisional Meeting with
Director General, ICAR on 2nd Feb.
2010.
Director’s Conference on 15th & 16th
Feb, 2010 and Interaction
meeting with Vice Chancellors and
Directors held on 17th Feb. 2010 at
ICAR, New Delhi.
International Workshop on The Indian
Ocean Tsunami : 5 years later –
Assessing the Vulnerability and
Resilience of Tsunami affected Coastal
Regions conducted by Inter-University
Research Institute Corporation,
National Institute for the Humanities
from 1st to 3rd March, 2010 at Singapore.
Management & Guidance of Research,
Development and Extension (RDE)
Research
During the IRC meeting held on 17th to 21st
August, 2009 research programs were
reviewed in the light of recommendations of
RAC. Another meeting of IRC was held on
4th November, 2009 to review the newprojects of new scientists and sponsoredprojects. Guided smooth execution of
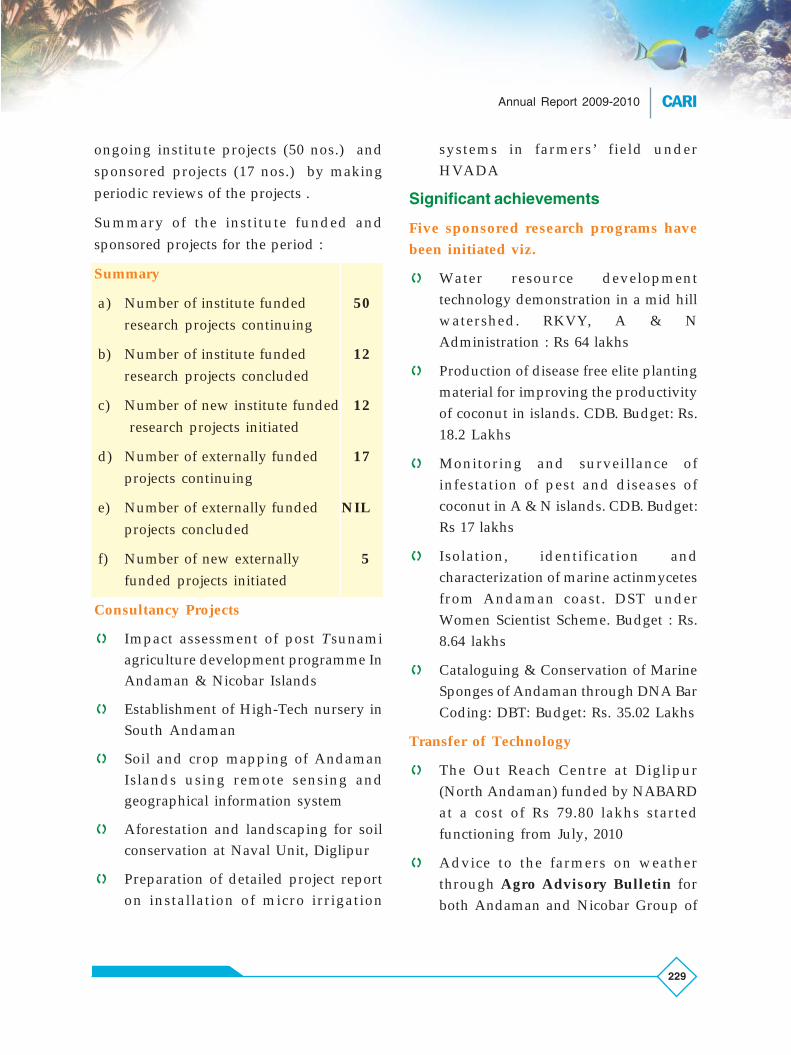
CARIAnnual Report 2009-2010
229
systems in farmers’ field underHVADA
Significant achievements
Five sponsored research programs havebeen initiated viz.
Water resource developmenttechnology demonstration in a mid hillwatershed. RKVY, A & NAdministration : Rs 64 lakhs
Production of disease free elite plantingmaterial for improving the productivityof coconut in islands. CDB. Budget: Rs.18.2 Lakhs
Monitoring and surveillance ofinfestation of pest and diseases ofcoconut in A & N islands. CDB. Budget:Rs 17 lakhs
Isolation, identification andcharacterization of marine actinmycetesfrom Andaman coast. DST underWomen Scientist Scheme. Budget : Rs.8.64 lakhs
Cataloguing & Conservation of MarineSponges of Andaman through DNA BarCoding: DBT: Budget: Rs. 35.02 Lakhs
Transfer of Technology
The Out Reach Centre at Diglipur(North Andaman) funded by NABARDat a cost of Rs 79.80 lakhs startedfunctioning from July, 2010
Advice to the farmers on weatherthrough Agro Advisory Bulletin forboth Andaman and Nicobar Group of
ongoing institute projects (50 nos.) andsponsored projects (17 nos.) by makingperiodic reviews of the projects .
Summary of the institute funded andsponsored projects for the period :
Summary
a) Number of institute funded 50
research projects continuing
b) Number of institute funded 12
research projects concluded
c) Number of new institute funded 12
research projects initiated
d) Number of externally funded 17
projects continuing
e) Number of externally funded NIL
projects concluded
f) Number of new externally 5
funded projects initiated
Consultancy Projects
Impact assessment of post Tsunamiagriculture development programme InAndaman & Nicobar Islands
Establishment of High-Tech nursery inSouth Andaman
Soil and crop mapping of AndamanIslands using remote sensing andgeographical information system
Aforestation and landscaping for soilconservation at Naval Unit, Diglipur
Preparation of detailed project reporton installation of micro irrigation

CARI Annual Report 2009-2010
230
islands is being narrowcast by the AIRand DDK, Port Blair on every Tuesday.The bulletin is also faxed to all RuralKnowledge Centres on same day. It isalso printed by the local newspapers.A campaign for popularizing it waslaunched during the Kisan Mela.
The Agricultural Column launched on23rd June 2008, in the Echo of India anEnglish daily published simultaneouslyfrom Kolkata and Portblair for widerdissemination on technologicalinnovations in agriculture an alliedfields to the islands stakeholders iscontinuing. The newspaper publishesthe column on weekly basis.
KVK, CARI has started publication ofmonthly Newsletter ‘Krishi Sandesh’having agro-advisory for the currentmonth from July, 2009.
CARI has signed an MoU with ShriHari Fabricators, Port Blair tofabricate three farm implements(Copra dryer, Cono weeder andCoconut dehusker) designed anddeveloped by CARI on royalty basis.The institute has received a royalty ofabout Rs. 10000/- in 2009-2010.
Kisan Mela on the theme Pashupalanand Murgipalan se behtar jivikoparjanwas organized on 9th and 10th February,2010. It was inaugurated by Dr. A.K.Singh, DDG (NRM), ICAR. A total of20 stalls representing different divisionsof CARI, line departments of
Administration l ike Agriculture,Animal Husbandry, Fisheries, IINRG,Ranchi, State Bank of India, NGOs,private entrepreneurs and Self HelpGroups were put up showcasing theiractivities for the benefit of thestakeholders viz . , farmers, farmwomen, youths and urban dwellers.The attraction of the Kisan Mela wasthe conduct of “Kisan Sangoshthi” on9th and “Khulla Munch” on 10th
February wherein farmers in largenumber interacted with the scientistsand got their problem addressed. Arecord 1035 farmers and 357 studentsvisited the mela. In addition, urbanpeople from Port Blair city andofficials from department visited thestalls.
KVK conducted 60 regular trainingprograms both on and off campus forfarmers in addition to conduct of 10OFT and 10 FLDs each.
Exposure visit of Bodoland TerritorialCouncil Member & Officer, Kakrajhar,Assam was conducted on 7th to 9th
December, 2009
I along with my scientists visitedCampbell Bay, the Southernmost partof archipelago, and discussed with thefarmers, NGO and officials of linedepartments about agriculture activitiesonce the farmers go back to theirpermanent shelters. A detail plan ofaction is submitted to A & NAdministration.
CARIAnnual Report 2009-2010
231
Development of Research Infrastructure
a) Hatchery shed, air blower room etc. atMarine hill Complex
b) Renovation of five poly houses
c) Renovation of poultry shed, and cattleshed
d) Relaying of another sector of farm atBloomsdale to facilitate largerexperiments
e) Renovation of two orchidarium,
f) One 5 m dia open dug well at Sippighatfarm, one dug well at KVK for creatingirrigation facilities
g) Construction of implement shed, openthreshing floor and covered threshingfloor at Bloomsdale farm
h) Process of construction of two Type V,four Type IV, four Type III has beeninitiated. After vetting of estimate, thefirst installment has been deposited.Construction of Type IV, and Type IIIquarters has started.
i) Process of construction of Guest Houseat Kolkata has been initiated. Istinstallment has been deposited.
j) Process of construction of boundarywall at Bloomsdale and Sippighat farmhas been initiated. After vetting ofestimate, the first installment has beendeposited. Construction has started.
k) Drip and sprinkler irrigation system arebeing installed in all the three farms
l) A 96 tonnes capacity vermicompost unit
has been constructed and it has started
functioning.
m) Equipment worth Rs. 118 lakhs viz NIR,
Gas chromatograph, deep freezer,
PCRs, E-governance software, statistical
software, etc. were purchased. Besides
the HPLC, water purification system,
electrophoresis etc. under different
sponsored projects were also purchased.
n) Foreign journals worth Rs 19 lakhs and
Indian journals worth 2.5 lakhs were
subscribed. Books worth 6 lakhs were
purchased.
Develop & conduct of customized training
programs for stakeholders on various
technologies funded by NGOs and State
agencies
Polyhouse construction, water resource
development and vegetable cultivation
for farmers from 19th to 21st May, 2009
Organic spices cultivation at Diglipur
on 8th & 10th Sept. 2009
Market-led Extension. MANAGE &
CARI, Port Blair, from 4th to 8th
December, 2009
Promotion of agro forestry in backyard
system on 29th & 30th October, 2009
Crop diversification through broad bed
and furrow system from 25th to 29th
August, 2009

CARI Annual Report 2009-2010
232
Organizing Workshops/Seminars/
Conferences
Brain Storming on Natural resource
Management in Island Ecosystem on 7th
& 8th July, 2009
One day workshop on Consortium for
e-Resources in Agriculture (CeRA), Unit
of Simulation and Informatics, IARI,
New Delhi on 22nd October, 2009
National Seminar on Production SystemManagement in Adverse Conditions for
Higher Productivity in A & N Islandson 22nd & 23rd December, 2009
XXI All India BTISNET Coordinators’Meeting on 3rd & 4th February,2010
Panel Discussion on Development ofHuman Resources in Agriculture for A& N Islands and Tropical IslandNations: Need, Scope and Prospect on22nd & 23 rd February, 2010
All India Group Meeting on RodentControl & Agricultural Ornithology on19th - 21st March, 2010

CARIAnnual Report 2009-2010
233
PARTICIPATION OF SCIENTISTS IN CONFERENCES / SEMINARS/ SYMPOSIA/ MEETINGS
Scientists Programme Venue Date / Duration
A. Kundu & Project launching Workshop on CARI, Port Blair 6th April, 09
S.K. Zamir Ahmed Building Sustainable Livelihoodfor the Tsunami affected inGreat Nicobar
Arun Kumar De 86th Foundation Course for NAARM, Hyderabad 21st April- 18th
Agricultural Research Service August, 09
Someshwar Bhagat 5th International Conference on TERI, New Delhi 26th - 30th April, 09.Biopesticides: StakeholdersPerspectives
S.K. Zamir Ahmed Swadesh Prem Jagriti Sangosti 09 Mahmada, Pusa, Bihar. 28th - 31st May, 09
Pankaj Kumar Singh 44th Rice Research Group Meeting DRR Hyderabad, A.P 9th – 12th June, 09Ajanta Birah Interaction meet of scientists of C ISH, Lucknow, UP 10th - 11th June, 09
entomology
S. Ghoshal Natural resource management IIRS, Dehradun 16th – 18th June, 09Chaudhuri using RS and GIS-Decision
Makers course
I. Jaisankar Summer Course on Division of 16th June - 6th July, 09.Non-conventional approaches for Biotechnology,crop improvement in IIHR, Bangalorehorticulture crops
Israr Ahmad 21 days Summer School on IIHR, Bangalore 16th June - 6th July, 09Non-Conventional Approachfor crop improvement inHorticulture Crops
S.K. Ambast National Workshop on IASRI, New Delhi 18th June, 09Remote Sensing and GIS forDecision Support in Agriculture
All Scientists Brainstorming Session on CARI, Port Blair 7th - 8th July,09Natural ResourceManagement for IslandEcosystem
Pankaj Kumar Singh State Seed Sub Committee Meeting Secretariat, A&N 13th July 09Admn., Port Blair
M. Balakrishnan Bioinformatics and its Presidency College, 21st Aug., 09applications in agriculture Chennai

CARI Annual Report 2009-2010
234
National Conference on CPRI, Shimla 24th - 25th Aug., 10Information technology and itsapplications in horticultural Crops
Pankaj Kumar Singh ICAR Seed Project Review Meeting Pusa, New Delhi 24th -25th Aug., 09
D. R. Singh Monitoring committee meeting KAB-II, ICAR 9th Sept., 09of the NMPB project on Morinda
P. Krishnan Open water diver course Dive India (P) Ltd, 17th - 21st Sep., 09Havelock
Ajanta Birah Short duration training programme National Institute 17th - 23rd Sep., 09on rodent pest management of Plant Health
Management,Hyderabad
D. R. Singh X Group Meeting on AICRP on OUAT, Bhubaneswar 9th - 10th Oct., 09Tuber Crops
Subhash Chand Workshop on methodology for NCAP, New Delhi 9th - 11th Oct.,09impact assessment ofagricultural technologies
S. Ghoshal Management development IIM, Lucknow 19th - 23rd October, 09
Chaudhuri programme on priority setting,monitoring and evaluation
All Scientists Consortium for e-Resources in CARI, Port Blair 22nd October, 09Agriculture
A. Kundu XXVI Annual conference Indian Poultry 22nd - 24th Oct., 09and national symposium of Science Association,Indian Poultry Science MumbaiAssociation .
D. R. Singh & Noni Search – 2009: The IV WNRF, Chennai 24th - 25th Oct., 09Jai Sunder National Symposium on
Noni for Empowerment andProsperity.
M. Balakrishnan National Horticulture IIHR, Bangalore 28th - 30th Oct. 09.Biotechnology Seminar
D. R. Singh International Conference on Dr. Premnath 9th - 12th Nov.,09Horticulture, ICH-2009. Agriculture Science
Foundation, Bangalore
R.C. Srivastava, 5th International Conference IARI, New Delhi 10th -13th Nov., 09.
Krishna Kumar and on Plant Pathology inSomeshwar Bhagat Globalized Era

CARIAnnual Report 2009-2010
235
A. Kundu IV WORLD Water fowl - Kerala Agricultural 11th -13th Nov., 09conference 2009 organized Universityby Kerala AgriculturalUniversity in association withWorld’s poultry scienceAssociation-IB
Krishna Kumar Review meeting on microbial NASC, New Delhi 17th Nov., 09diversity and identification ofapplication of micro-organismsin agriculture and alliedsectors (AMMAS)
S.K. Ambast 60th IEC Meeting and 5th Asian Vigyan Bhawan, 9th - 11th Dec., 09Regional Conference of New DelhiICID, organized by CBIP
N. Ravisankar Third annual review meeting IIT, Roorkee 10th - 12th Dec., 09on Integrated Agro MetAdvisory Services (IAAS)
S. Jeyakumar International Symposium, Namakkal, 10th -12th Dec., 09Expanding the horizons Tamil Naduof reproductive technologiesfor augmenting fertility infarm and pet animals inthe global scenario
M.S. Kundu Diversification of Animal Animal Nutrition 17th - 19th Dec., 09Nutrition Research in the Society of India andChanging Scenario National Institute of
Nutrition andPhysiology, Bangalore
A. Velmurugan Mechanization in Horticulture CPCRI, Kasaragod 18th - 19th Dec., 09S. Dam Roy & National Seminar on Indian College of Fisheries, 22nd – 23rd Dec., 09P. Krishnan Marine Fisheries- Sustainability Mangalore, Karnataka
at Cross Roads
All Scientists National Seminar on Production CARI , Port Blair 22nd – 24th Dec., 09System Management in AdverseConditions for HigherProductivity in A&N Islands.
Jai Sunder & CPCSEA Conference New Delhi 15th Jan., 10,S.K. Verma
Shrawan Singh XVIII Group meeting on IIHR, Bangalore 15th -19th, Jan., 10AICRP on Vegetable Crops
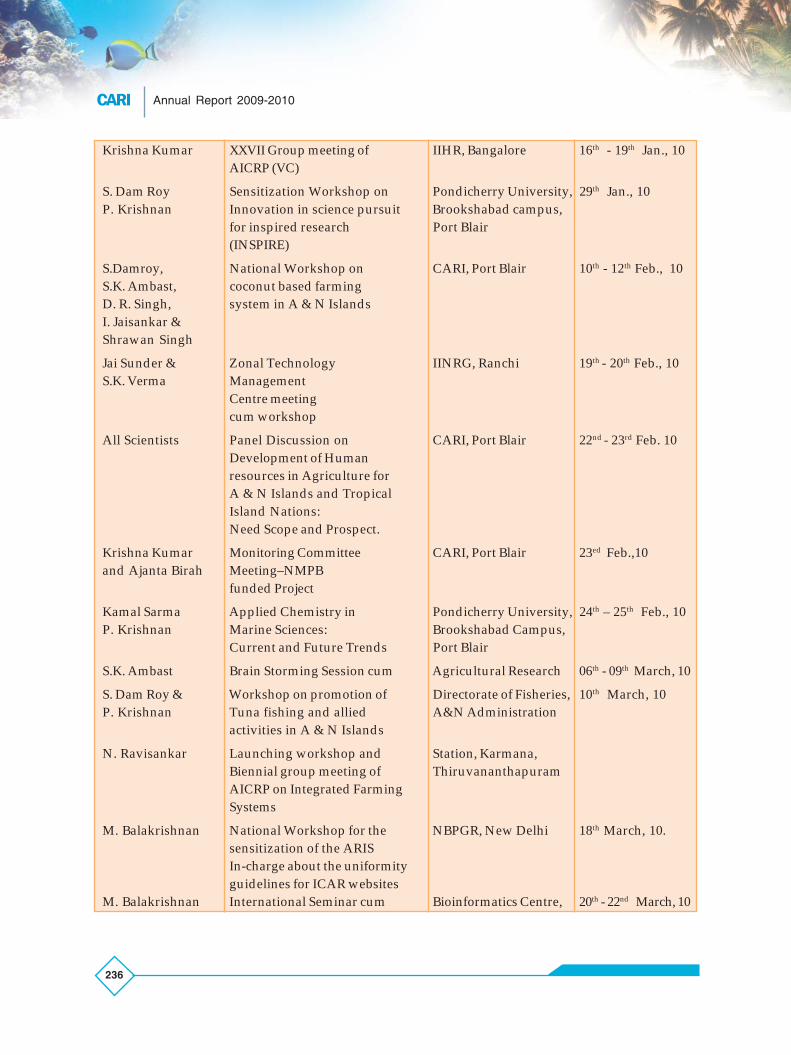
CARI Annual Report 2009-2010
236
Krishna Kumar XXVII Group meeting of IIHR, Bangalore 16th - 19th Jan., 10AICRP (VC)
S. Dam Roy Sensitization Workshop on Pondicherry University, 29th Jan., 10P. Krishnan Innovation in science pursuit Brookshabad campus,
for inspired research Port Blair(INSPIRE)
S.Damroy, National Workshop on CARI, Port Blair 10th - 12th Feb., 10S.K. Ambast, coconut based farmingD. R. Singh, system in A & N IslandsI. Jaisankar &Shrawan Singh
Jai Sunder & Zonal Technology IINRG, Ranchi 19th - 20th Feb., 10S.K. Verma Management
Centre meetingcum workshop
All Scientists Panel Discussion on CARI, Port Blair 22nd - 23rd Feb. 10Development of Humanresources in Agriculture forA & N Islands and TropicalIsland Nations:Need Scope and Prospect.
Krishna Kumar Monitoring Committee CARI, Port Blair 23ed Feb.,10and Ajanta Birah Meeting–NMPB
funded Project
Kamal Sarma Applied Chemistry in Pondicherry University, 24th – 25th Feb., 10P. Krishnan Marine Sciences: Brookshabad Campus,
Current and Future Trends Port Blair
S.K. Ambast Brain Storming Session cum Agricultural Research 06th - 09th March, 10
S. Dam Roy & Workshop on promotion of Directorate of Fisheries, 10th March, 10P. Krishnan Tuna fishing and allied A&N Administration
activities in A & N Islands
N. Ravisankar Launching workshop and Station, Karmana,Biennial group meeting of ThiruvananthapuramAICRP on Integrated FarmingSystems
M. Balakrishnan National Workshop for the NBPGR, New Delhi 18th March, 10.sensitization of the ARISIn-charge about the uniformityguidelines for ICAR websites
M. Balakrishnan International Seminar cum Bioinformatics Centre, 20th - 22nd March, 10

CARIAnnual Report 2009-2010
237
Administrative Staff
training workshop on Molecular Allahabad University,Modeling and Protein-protein Allahabadinteraction and drug design
A.Velmurugan MDP on Prioritization, IIM, Lucknow 22nd - 26th March, 2010Monitoring and Evaluationof research projects
Subhash Chand National Workshop on NCAP, New Delhi 27th March, 10success of growth in Indianagriculture, trend, challengesand progress
S.K. Ambast, NAIP project on Strategies for s Regional Research 28th March, 2010Subhash Chand & ustainable management of Station, CSSRI CanningN. Ravisankar degraded coastal land and water Town, Kolkata
for enhancing livelihood securityof farming communityLaunching workshop of NAIP CSSRI, Canning town, 28th March, 10project Strategies for sustainable West Bengalmanagement of degraded coastal landand water for enhancing livelihoodsecurity of farming communities
Administrative Staff Programme Venue Date / Duration
Abhishek Handling of CAT Cases, New Delhi 26th - 28th Aug., 09
Srivastava Legal Matters & Court
Cases by ISTM
Values in Administration ISTM, New Delhi. 12th - 14th April, 10
R.N. Majumdar Pension & other DWM, 26th – 27th Oct., 09
& Karupaiah retirement benefits Bhubaneshwar
Joseph George, New Pension scheme by NBSSLUP 8th Dec., 09
M. Krishnan, NSDL Regional Station,
& P.K. Roy, Kolkata

CARI Annual Report 2009-2010
238
HUMAN RESOURCE DEVELOPMENT OF STAKEHOLDERS Title Period Participants Type of Venue Conducted by
(No.) Participants
Training
Tuber crops 18th - 24th April,09 20 Farmers CARI CARI & NHMcultivation inAndaman &Nicobar Islands
Polyhouse 19th - 21st May, 09 20 Farmers CARI CARI & CEFI-construction , Internationalwater resources (NGO)development andvegetable cultivation
Operation and 22nd - 24th June, 09 25 Farmers KVK KVK & NRMmaintenance ofpaddy transplanter
Improved agro- 25th - 27th June,09 30 Farmers Ferrargunj KVK & NRMtechniques forPaddy
Mat nursery & 15th – 18th July,09 25 Farmers Diglipur ORC CARI &soil sample NABARDcollection
Duck-cum- 29th – 31st July, 09 38 Farmers Diglipur ORC CARI &fish farming KVK
SRI, cultivation 29th – 31st July,09 50 Farmers & ORC, ORC CARI &of Noni & Duck- Youth Diglipur NABARDcum fish farming
Soil and water 30th July - 1st 25 Farmers KVK KVK & NRMconservation August, 09measures
Crop diversification 25th - 29th 25 Extension KVK NRM & KVKthrough broad bed August, 09 Personneland furrow system
Package and 25th -27th 20 Para CARI KVK, CARIpractice of August,09 veterinarygoat farming staff
Peration and 31st August 25 Farmers KVK KVK & NRMmaintenance of - 4th September,09power tiller
Organic cultivation 8th - 10th 32 Farmers Diglipur ORC CARI,of spices September, 09 NHM &
NABARD

CARIAnnual Report 2009-2010
239
Organic spice 8th – 10th Sep., 09 53 Farmers Diglipur ORC CARI,cultivation NABARD
Spices Board
R-Governance and 12th -16th & 96 All staff of CARI CARIits applications 20th October, 09 CARI
Biopesticide 27th – 29th 25 Farmers/ ATIC KVK, CARIproduction and October, 09 SHGsits applications
POP of scientific 7th - 10th 25 Farmers CARI Animal Sciencepig farming December, 09 Division & KVK
Organic spice 10th - 11th 26 Farmers Hut Bay CARI &cultivation December, 09 NHM
Plantation based 22nd - 24th 24 Farmers Diglipur ORC CARI &cropping system January, 10 NABARD
Brackish water 24th – 27th 30 Farmers Lalpahar FSD, CARI &farming February, 10 KVK
Integrated fish 15th – 17th 10 Farmers KVK FSD, CARI &farming March, 10 KVK
Freshwater 22nd – 24th 16 Farmers KVK FSD, CARI &prawn farming March, 10 KVK
Rodent control 22nd -23rd 25 Farmers Diglipur ORC CARI&in crops March, 10 NABARD
Pig & goat farming 27th- 29th 30 Farmers Diglipur ORC CARI&March, 10 NABARD
Protected 27th- 29th 30 Farmers Diglipur ORC CARI&cultivation of high March, 10 NABARDvalue vegetables
Customized Training
Poly house 19th - 21st 18 Progressive CARI CARI & CEFI-construction, May, 09 farmers Internationalwater resource (NGO)development andvegetable cultivation
Promotion of agro 29th - 31st 30 SHG members CARI CARI & ADRAforestry in backyard October, 09
Market led 4th - 8th 20 Junior level CARI CARI &Extension : Tools December, 09 officers MANAGEto improveagriculturalmarketinginformation network

CARI Annual Report 2009-2010
240
EXTENSION ACTIVITIES
A. Organization of Kisan Mela / Workshop/ Meeting Workshop/ Seminar
National Seminar 22nd - 24th Many Experts, CARI, CARI & HVADA,on production system December, 09 Scientists, Port Blair Dept. ofmanagement in Development Agriculture,adverse conditions officers and A& N Adm.for higher Farmersproductivity inA& N Islands
National Workshop 10th- 12th Many Experts, HVADA, CARI, ATMAon coconut based February, 10 Scientists, Port Blair HVADA, , Dept.farming system in Development of Agriculture,A & N Islands officers and A & N Adm.
Farmers and CDB
XXI All India 3rd – 4th 200 Experts, CARI, DBT, GoI,BTISNet Coordinators February, 10 Scientists Port Blair New Delhimeeting
All India Group 19th – 20th 85 Directors/ CARI, ICAR,Meeting of Rodent March, 10 Professors/ Port Blair New DelhiControl & Ag. ScientistsOrnithology
Exhibition
Kisan Mela on 9th-10th 1392 Farmers , CARI, CARItheme : Livestock February, 10 PRI’s, SHG’s Port Blairand poultry farming & Studentsfor decent livelihood

CARIAnnual Report 2009-2010
241
Other Extension activities
Radio Talks
Title Date of Broadcast Expert
Seed replacement rate and its importance 03.04.2009 N. Ravisankar
Nursery techniques for paddy 03.06.2009 N. Ravisankar
Integrated nutrient and weed management for paddy 28.07.2009 N. Ravisankar
Harvesting and ratoon practices for paddy 28.10.2009 N. Ravisankar
After care and field management for pulses and 18.02.2010 N. Ravisankartable purpose groundnut
Dhan ke pramukh keet va unka prabandhan 20.07.2009 Ajanta Birah
Dweepon main varsh bhar anannas ugayen 06. 04.2009 V.B. Pandey
Hare dhaniye ki kast 03.08.2009 V.B. Pandey
Dweepon main kharbuj ki kheti ki sambhavanayen 08.01.2010 V.B. Pandey
Sabjiyon ki Javik kheti 18.04.2009 Shrawan SinghSarankshit keti - kuchh sujhav 24.12.2009 Shrawan Singh
Battako ki pramukh beeemariya 21.07.2009 A.Kundu
Murgi palan me chhatni ka mahatva 22.12.2009 A.Kundu
Vermicomposting – ek acha Laghu vyavsay 27.07.2009 S.K. ZamirAhmed
Scientific storage of grain 17.12.2009 S.K. ZamirAhmed
Dhan ki kheti me machali palan 30.07.2009 C. S.Chathurvedi
Sarankshit kheti 26.08.2009 D. R. Singh
Garbhavati bakariyo ka prabandhan 03.09.2009 S.Jeyakumar
Bakri palan se adhik labh kaise 25.02.2010 S.Jeyakumar
Krishi utpadan bridhi me biotakneek 19..09.2009 Israr Ahmad
Fasal suraksha me bio takneek 12.02.2010 Israr Ahmad
Kele ke bimariyan avam unke roktham 19.12.2009 SomeshwarBhagat
Swachchh dugdha utpadan – kuch sujhav 31.12.2009 S.K.Verma
Rangeen machaliya ke palan se arthik pragati 05.01.2010 C. S.Chathurvedi
Murgiyon mei IBD 07.01.2010 Jai Sunder
Aarthik samridhi ke liya dairy - kuch sujhav 07.01.2010 M.S.Kundu
Machali palan talabo ka nirman – kuch sujhav 11.01.2010 Kamal Sarma
Andaman aur Nicobar dweep samuho main krishi hetu 18.02.2010 S.K.AmbastJal prabandhan

CARI Annual Report 2009-2010
242
Doordarshan Interview
Title Date of Broadcast Expert
Dhan ke beejo ka rakh -rakhaw 24.09.2008 Krishna Kumar
Phaslo me beej upchar ka mahtava 23.04.2009 Krishna Kumar
CARI dwara vikshit dhan kee unnat kishme 24.09. 2009 Pankaj KumarSingh
Sabjion ke pramukh keet va unka prabandhan 26.11. 2009 Ajanta Birah
Methodology of seed treatment of crop seeds 23.04.2009 SomeshwarBhagat
Cat fish breeding & seed production 07.08. 2009 C. S. Chathurvedi
Main diseases in poultry during rainy seasons 24.07.2009 A.Kundu
Feeding of pigs and its management in island 24.07.2009 M.S Kundufarming system
Integrated nutrient and weed management for paddy 28.07.2009 V. Damodaran
Nursery raising techniques in coconut 03.12.2009 V. Damodaran
Cultural practices for summer season vegetables in 18.02.2010 V. DamodaranA&N Islands
Dweepan keliye dhan ki unnat kisme 09.04.2009 N. Ravisankar
Dhan ki fasal ki dhekbhal 06.08.2009 N. Ravisankar
Contingency plan for managing crops during dry spell 28.08.2009 N. Ravisankar
BBF padhti se sabzi va machali utpadan 11.01.2010 N. Ravisankar
Achche utpadan ke liye mrida prabandhan 24.08.2009 S.K.Ambast
Krishi utpadan badhane ke upay 09.01.2010 S.K.Ambast

CARIAnnual Report 2009-2010
243
ROUND UP OF INSTITUTE ACTIVITIESS. N. Events Date
1. RAC meeting 9th to 10th April 2009
2. Visit of Director and his team to Beodnabad village, South Andaman 22nd May 2009
3. Visit to Diglipur for site selection of ORC 9th to 11th June, 2009
4. 1st PMC meeting for ORC 17th June, 2009
5. 2nd Technical meeting of Technological innovation for commercial 25th to 26th June, 2009exploitation of Morinda Citrifolia as livelihood for Island Farmersfunded by NMPB, New Delhi.
6. Brain Storming on Natural Resource Management in Island Ecosystem. 7th to 8th July, 2009
7. Training to supporting staff for scale upgradation 3rd to 22nd August 2009
8. IRC meeting 17th to 21st August 2009
9. Scientific interaction with Dr. Kalam at CARI, Port Blair 3rd September, 2009
10. Director and Team visit to Diglipur, North Andaman 9th to 12th September 2009
11. IMC Meeting 6th October, 2009
12. Hindi Chetna Month 13th September to 14th
October, 2009
13. Exposure on the role, vision and technological intervention in 30th October, 2009agriculture & allied field for Island by CARI to students ofTagore College, Port Blair
14. Exposure visit of Bodoland Territorial Council Member & Officer, 7th to 9th December, 2009Kakrajhar, Assam
15. National Seminar on production system management in 22nd to 23rd December, 2009adverse conditions for higher productivity in A & N Islands
16. Visit of DDG (Hort.) with Director CARI & IVRI to Baratang & Havelock 24th to 28th Dec, 2009
17. Director and Team visit to Campbell Bay and Nicobar 12th to 14thJanuary,2010
18. IMC Meeting 25th January, 2010
19. XXI All India BTISNET Coordinators’ Meeting 3rd to 4th February,2010
20. 2nd PMC Meeting of ORC 6th February, 2010
21. Kisan Mela 9th to 10th February,2010
22 All India group meeting on Rodent control & Agrl. Ornithology 19th to 20th March, 2010

CARI Annual Report 2009-2010
244
21. Kisan Mela 9th to 10th February,2010
22. Panel Discussion on Development of Human Resources in 22nd to 23 rd February, 2010Agriculture for A & N Islands and Tropical Island Nations :Need, Scope and Prospect.
23. Horticulture Expo 2010 National Conference on Production of 11th to 14th March, 2010Quality Seeds, Planting Materials – Health Management inHorticultural Crops at NASC campus, Pusa, New Delhi
24. R-goverence Training 15th March, 2010
25. Hindi Workshop 16th March, 2010
26. All India Group Meeting on Rodent Control & 19th to 21st March, 2010Agricultural Ornithology
27. Visit of ISTM officials 20th March, 2010
28. Visit of Commander in Chief, A & N Command 23rd March, 2010

CARIAnnual Report 2009-2010
245
LINKAGES AND COLLABORATION
Natural Resource Management
Project Directorate for Farming SystemsResearch (PDFSR), Modipuram
Indian Institute of Remote Sensing,ISRO, Dehradun
Regional Research Station CSSRI,Canning Town, Kolkata, WB
Space Application Centre, ISRO,Ahmedabad
Field Crops
Directorate of Rice Research,Hyderabad
Indian Institute of Pulse Research,Kanpur
Directorate of Oil Seed Research,Jabalpur
Indian Institute of Vegetable Research,Varanasi
National Research Centre forMushroom, Solan
Central Arid Zone Research Institute,Jodhpur
Coconut Development Board, Kochi,Kerala
National Bureau of AgriculturallyImportant Microorganisms, Mau, UP
Dr PDKV, Akola, Maharastra andCARI, Port Blair
RMRC, Port Blair
CIPMC, Port Blair, Ministry of
Agriculture, GOI
Horticulture & Forestry
CDRI, Lucknow, WNRF, Chennai,
NMPB, New Delhi, Spice Board,
Calicut, CPCRI, Kasaragod , IIHR,
Bangalore, Centre for Protected
Cultivation, IARI, New Delhi,
Directorate of Agriculture, A & N
Administration
Fisheries Science
Annamalai University,
Chidambaram, Tamil Nadu,
Bharadhidasan University, Trichy,
Tamil Nadu, Space Application
Centre, Ahmedabad, INCOIS,
Hyderabad, DBT, New Delhi.
Animal Science
DBT, New Delhi, RMRC, ICMR, Port
Blair, ICAR Institutes; IVRI,
PD_ADMAS, CIRG, IGFRI, PDP,
CARI, Izatnagar, DAHVS, A&N
Admn. ,TANUVAS, TNAU, KLDB
Social Science Section
NABARD, Port Blair, Tribal Council,
Nicobar District, ACANI, Lead India,
Prashar Bharati (Akash Vani &
Doordarshan), Port Blair

CARI Annual Report 2009-2010
246
DISTINGUISHED DIGNITARIES
Mr. O.N. Jaiswal, M.C.O., (Retd.), PIB,Port Blair on 6th April, 2009
Mr. Martin, Secretary, Tribal Council,Nicobar on 30th June, 2009
Dr. M.S. Gill, Deputy Director (Project),PDCSR, Modipuram on 7th July, 2009
H.E. Dr. A.P.J. Abdul Kalam, FormerPresident of India on 3rd September,2009
Shri G.R. Chintala, GM, NABARD, PortBlair on 14th September, 2009
Mrs. Manisha Bhatnagar, Dy. Director,ISTM, DOPT, New Delhi on 17th
September, 2009
Shri Sakti Sinha, IAS, PrincipalSecretary (Revenue), A & N Admn. on6th October, 2009
Shri G.C. Saxena, Secretary, Tourism,A & N Admnstration on 6th October,2009
Dr. R.C. Goyal, Pr. Scientist, IASRI,New Delhi on 22nd October, 2009
Dr. K.P. Gore, Regional Head,CSWCRTI, Sunaleda, Korapur on 26th
October, 2009
Dr. H. Chandrasekharan, PI,Consortium for e-Resources inAgriculture (CeRA), Unit of Simulationand Informatics, IARI, New Delhi on22nd October, 2009
Mr. S.S. Choudhury, PCCF, A & NIslands, Port Blair on 7th November,2009
Mr. S. Homchaudhuri, Retd. Jt.Director, Social Welfare, Govt. ofAssam, Guwahati on 7th November,2009
Mrs. Rahil Brahma, ACS Secretary,Agriculture, Bodoland TerritorialCouncil, Kokrajhar, Assam on 7th
December, 2009
Mr. M.R. Basumatary, ExecutiveMember (AGRI), Assam on 7th
December, 2009
Mrs. Rahil Brahma, ACS Secretary,Agriculture, Assam on 7th December,2009
Mr. P.B. Roy, District AgriculturalOfficer, Assam on 7th December, 2009
Mr. J.P. Banerjee, District AgriculturalInformation Office, Assam on 7th
December, 2009
Major General Ajay Kumar Chaturvedi,Chief of Staff, A & N Command on 18th
December, 2009
Dr. H.P. Singh, DDG (Horticulture),ICAR, New Delhi on 24th December,2009
Dr. Mathura Rai, Director, IIVR,Varanasi on 22nd December, 2009

CARIAnnual Report 2009-2010
247
Dr. MM. Anwar, Director, NRCSS,Ajmer on 22nd December, 2009
Dr. Manjit Singh, Director, DMR, Solanon 22nd December, 2009
Dr. S.K. Tandon, ADG (Engg.), ICAR,New Delhi on 22nd December, 2009
Mr. Takashi Kume, Japan on 18th
January, 2010
Lt. Governor, Lt. Gen (Retd.) BhopinderSingh, PVSM, AVSM, Port Blair on 3rd
February, 2010
Dr. T. Madan Mohan, Advisor, DBT,New Delhi on 3rd February, 2010
Dr. Vishwa Mohan Katoch, Secretary,DHR & DG, ICMR, New Delhi on 3rd
February, 2010
Dr. M. Vijayan, Chairman, BTISnet TaskForce on 3rd February, 2010
Dr. Anil Kumar Singh, Deputy DirectorGeneral (NRM), ICAR, New Delhi on8th - 9th February, 2010
Shri Tapan Mandal, IAS, DevelopmentCommissioner, A & N Admn. on 10th
February, 2010
Dr. N.K. Tyagi, Member, ASRB, NewDelhi on 22nd February, 2010.
Shri Vivek Rae, IAS, Chief Secretary, A &N Administration on 22nd February, 2010.
Ms Archana Arora, IAS, PrincipalSecretary (Edu.), A & N Administrationon 22nd February, 2010.
Dr. S.S. Magar, Chairman, RAC, Ex-Vice Chancellor, KKV, Dhapoli,Maharastra on 22nd February, 2010.
Dr. Dilip Kumar, Director & V.C. CIFE,Mumbai, Maharastra on 22nd February,2010
Dr. C.S. Chakrabarti, VC, WBUA & FS,Kolkata, W.B. on 22nd February, 2010
Dr. D.P. Ray, VC, OUAT,Bhubaneswar, Orissa, Dr. P.Thangaraju, VC, TNV & ASU,Chennai, Tamil Nadu on 22nd February,2010
Dr. R.K. Mittal, Assistant DirectorGeneral (Edn.), ICAR, New Delhi on22nd February, 2010
Dr. P. Vijayachari, Director, RegionalMedical Research Centre, Port Blair on19th March, 2010
Dr. T.P. Rajendran, ADG (PP), ICAR,New Delhi on 19th March, 2010
Dr. R.S. Tripathi, Network Coordinator,Rodent Control, CAZRI, Jodhpur,Rajasthan on 19th March, 2010
Dr. V Vasudeva Rao, NetworkCoordinator of AgricultureOrnithology, ANGRAU, Hyderabad on19th March, 2010
Dr. AMK Mohan Rao, RodentSpecialist, NPPTI, Hyderabad on 19th
March, 2010

CARI Annual Report 2009-2010
248
DISTINGUISHED DIGNITARIES

CARIAnnual Report 2009-2010
249
PERSONNEL
Director Dr. R. C. SrivastavaHead / Incharge Divisions / Section
Head, Division of Fish & Fishery Sciences Dr. S. Dam RoyHead, Division of Natural Resource Management Dr. S.K. Ambast
Head Division of Horticulture & Forestry Dr. D.R. SinghHead i/c Division of Field Crops Dr. T.V.R.S. Sharma
Head i/c Division of Animal Science Dr. A. KunduIncharge, Social Science Section Dr. Ajmer Singh
Administrative Officer Shri Abhishek SrivastavaFinance & Accounts Officer Shri Joseph George
Incharge, Planning, Monitoring & Coordination Cell Dr. S.K. Zamir AhmedIncharge, Computer Cell Dr. M. Balakrishnan
Incharge, Library Shri P. GangopadhyayIncharge, Central Instrumentation Facility Dr. Jai Sunder
Incharge, Legal Cell Dr. S.K.Zamir AhmedIncharge, Garacharma Farm Dr. T.V.R.S. Sharma
Incharge, Sippigaht Farm Mr. I. JaisankarIncharge, Bloomsdale Farm Dr. S. Ghoshal ChaudhuriEstate Officer, Estate Section Er. S.L.Paik
Incharge, Guest House Dr. V.B. PandeyAssistant Director, Official Language Smt. Sulochana
Security Officer Shri N.K. PushpControlling Officer, Krishi Vigyan Kendra Dr. Subhash Chand
Co-ordinator, Bioinformatics Centre Dr. M. BalakrishnanIncharge, RIRIC Dr. S.K. Verma
Incharge PG Cell Dr. Jai Sunder
List of Scientific StaffDivision of Natural Resource Management
Dr. S.K. Ambast, Head
Dr. S. Ghoshal Chaudhuri, Principal Scientist (Soil Science: SP&WC)Dr. N. Ravisankar, Senior Scientist (Agronomy)
Dr. A. Velumurugan, Senior Scientist (Soil Science : CF&M)Dr. T.P. Swarnam, Scientist Sr. Scale ( Soil Science : CF&M)

CARI Annual Report 2009-2010
250
Mr. T. Subramani, Scientist (Agronomy)
Dr. Sachchidanand Swain, Scientist (ASPE)
Division Of Field Crops
Dr. T.V.R.S. Sharma, Principal Scientist &Head I/c upto 31st January, 2010
Dr. Krishna Kumar, Senior Scientist (PlantPathology) & Head I/c from 1st January
Dr. Ajanta Birha, Senior Scientist (Agrl.Entomology)
Dr. Pankaj Kumar Singh, Senior Scientist(Plant Breeding)
Dr. Someshwar Bhagat, Scientist (PlantPathology)
Shri Israr Ahmed, Scientist (Biotechnology)
Dr. Naresh Kumar, Scientist (Plant Breeding)
Division of Horticulture & Forestry
Dr. D.R. Singh, Pr. Scientist & Head (May,2009 onward)
Dr. M. Sankaran, Senior Scientist(Horticulture)
Miss R. Sudha, Scientist (Horticulture)
Shri I. Jaisankar, Scientist (Forestry)
Dr. Shrawan Singh, Scientist (Vegetables)
Division of Fish & Fisheries Science
Dr. S. Dam Roy, Head
Dr. Chandra Shekhar Chaturvedi, SeniorScientist (Fish & Fisheries)
Dr. Kamal Sarma, Senior Scientist (Fish &Fisheries)
Dr. P. Krishnan, Scientist (Fish & Fishery)
Shri. Grinson George, Scientist (Fish &Fishery Science)
Division of Animal Science
Dr. A. Kundu, Senior Scientist (LivestockProduction & Management) & I/C Head
Dr. Madhu Sudan Kundu, Sr. Scientist(Animal Nutrition)
Dr. Jai Sunder, Sr. Scientist (VeterinaryMicrobiology)
Dr. S.K. Verma, Scientist Sr. Scale (AnimalNutrition)
Dr. S. Jeyakumar, Scientist Sr. Scale (AnimalReproduction)
Dr. T. Sujatha, Scientist (Poultry Science) onstudy leave
Dr. Arun Kumar De, Scientist (AnimalBiotechnology)
Social Science Section
Dr. Ajmer Singh, Senior Scientist(Agricultural Economics) & Incharge.
Dr. Subhash Chand, Senior Scientist,(Agricultural Economics)
Dr. S.K. Zamir Ahmed, Senior Scientist(Agricultural Extension)
Dr. M. Balakrishnan, Scientist Sr. Scale(Computer Applications)
Krishi Vigyan Kendra
Dr. Subhash Chand, Controlling Officer
Sh. Nagesh Ram, Subject Matter Specialist(Fisheries) & Administrative Head
Mr. L.B. Singh, Subject Matter Specialist(Horticulture)
Dr. Abhay Kr. Singh, Subject MatterSpecialist (Animal Science)
Mr. Bijaya Kr. Nanda, Subject MatterSpecialist (Agrl. Engineering)
Mr. N.C. Choudhuri, T-6 (Animal Science)

CARIAnnual Report 2009-2010
251
COMMITTEES OF THE INSTITUTEResearch Advisory Committee
Dr. S.S. Magar, Ex –Vice Chancellor,KKV, Dapoli -Chairman
Dr. P.N. Jha, Member
Dr. R.P. Awasthi Member
Dr. N. Mourya, MemberEx- Director, IAS
Dr. D.D. Nambudiri, MemberDean Fisheries
Dr. Arun Varma, MemberEx- ADG, ICAR
Dr. Umesh Srivastava, MemberADG(Hort)
Dr. R. C. Srivastava Member
Smti Uma Bharti Non official member
Shri Mohammed Non official memberAzimuddin
Dr. S. Dam Roy Member Secretary
Institute Joint Staff Council
Technical Staff
Shri K. Babu Rao, T-2
Shri Kishore Tete, T-3
Administrative Staff
Shri P.K. Roy, Sr. Clerk
Smt. Florence Toppo, Jr. Steno
Supporting Staff
Shri K. Ali, S.S. Gr.II
Shri Dominic Ekka, S.S. Gr.
Official Side (Nominated by Director)
Dr. S.K. Ambast, HOD, NRM
Dr. S. Dam Roy, HOD, Fisheries Science
Dr. T.V.R.S. Sharma, HoD I/c Field crops
Administrative Officer
Finance & Accounts Officer
Estate Officer
Institute Management Committee
Dr. R.C. Srivastava, Director Chairman
Dr. G.S. Parakash, HoD Member
Dr. S. Dam Roy, HoD Member
Dr. D.Nag, HoD, MemberNIRJAFT, Kolkata
Director of Agriculture, MemberA & N Administration
Director of Horticulture, MemberGovt. of Orissa
Director of Research, MemberBCKVV, W.B.
Smti. Uma Bharati, MemberMohanpura, Port Blair
Shri. Md. Azimuddin, MemberMohanpura, Port Blair
F. A. O., CRIJAF, MemberBarrackpur , W.B
Administrative Officer, Member Secretary CARI, Port Blair
Official Language Implementation Committee
Dr. R.C. Srivastava, Director Chairman
Dr. N. Ravisankar, MemberSr. Scientist
Dr. Jai Sunder, Sr. Scientist Member
Dr. S.K. Zamir Ahmed, MemberSr. Scientist

CARI Annual Report 2009-2010
252
Dr. M. Balakrishnan, MemberScientist (SS)
Shri Abhishek Srivastava, MemberAdmn. Officer
Shri Joseph George, F & AO Member
Shri P. Gangopadhyay, T-6 Member
Shri A.K. Tripathi, T-5 Member
Dr. S.K. Verma, Scientist (SS) Member Secretary
Purchase Advisory Committee
Dr. Jai Sunder, Sr. Scientist Chairman
Dr. N. Ravisankar, Sr. Scientist Member
Dr. P. Krishnan, Scientist Member
Dr. S. Jeyakumar, Scientist (SS) Member
Finance & Accounts Officer Member
Administrative Officer MemberSecretary
Works Committee
Dr. A. Kundu, Pr. Scientist Chairman
Administrative Officer Member
Finance & Accounts Officer Member
Estate Officer Member Secretary
Condemnation Committee
Dr. Jai Sunder, Sr. Scientist Chairman
Administrative Officer Member
Finance & Accounts Officer Member
Estate Officer Member
Asstt. Admn. Officer (Store) Member Secretary
Price Fixation Committee
Dr. A. Kundu, Pr. Scientist Chairman
Dr. Kamal Sarma, Sr. Scientist Member
Dr. M. Shankaran, Sr. Scientist Member
Finance & Accounts Officer Member
Shri A. K. Tripathi, T-5 MemberSecretary

CARIAnnual Report 2009-2010
253
NEW ENTRANTS /TRANSER /PROMOTION
New Entrants
Dr. Arun Kumar De, Scientist (AnimalBiotechnology) joined on 28th August, 2009
Dr. Ajmer Singh joined as SeniorScientist (Agricultural Economics) on 6th
November 2009 upon transfer fromDWR, Karnal
Dr. A. Velumurugan, Senior Scientist,(Soil Science: CF&M) joined on 3rd
October, 2009
Dr. T.P. Swarnam joined as Scientist Sr.Scale (Soil Science : CF&M) on 3rdOctober 2009 upon transfer
Dr. Sachchidanand Swain joined asScientist (Process Engineering) on 15th
March 2010
Dr. Naresh Kumar joined as Scientist(Plant Breeding) on 15th March 2010
Transfer
Dr T. Subramani, Scientist resignedfrom the ARS on 30th January, 2010
Promotion
Dr. D.R. Singh, Principal Scientist,Horticulture & Forestry Division got
promoted to Head, Horticulture &Forestry Division, CARI, Port Blair w.e.f.29th May, 2009
Shri Nehru Ram promoted as JuniorClerk on 30th November, 2009
Shri Emil Lakra promoted as JuniorClerk on 30th November, 2009
Retirement
Shri R. Kondaiah, T-4, Driver retired on30th June, 2009
Dr T.V.R.S. Sharma, Principal Scientistretired on 31st January, 2010
Shri C. Kunjumani, Skilled SupportingStaff retired on 31st January, 2010
Shri Emil Lakra, Junior Clerk retired on28th February, 2010
Left to Heavenly Abode
Late A. Dorairaj, S.S.Gr.I on 14th
October, 2009
Late Ibha Rani, S.S.Gr. I on 23rd January,2010

CARI Annual Report 2009-2010
254
Weather Parameters (2009-10) at CARI, Port Blair(110 36' 35" N, 920 42' 54" E)
Month & Rainfall Rainy Maximum Minimum RH Wind SpeedYear (mm) Days T (oC) T (oC) (%) (KMPH)
April, 09 157.4 11 32.6 25.2 77.9 2.9
May, 09 403.1 19 31.7 25.3 83.7 7.7
June, 09 458.6 18 29.1 24.5 89.1 7.3
July, 09 209.5 15 30.3 25.0 87.4 4.5
Aug., 09 436.6 16 30.1 24.3 89.9 5.8
Sept., 09 408.2 20 30.1 24.5 90.0 5.1
Oct., 09 245.0 13 30.7 23.4 90.8 1.7
Nov.,09 89.2 3 30.1 23.6 85.6 2.8
Dec., 09 61.9 3 29.5 22.1 87.9 4.6
Jan., 10 122.7 4 29.8 17.4 88.3 4.7
Feb., 10 1.2 0 31.1 20.1 82.5 3.8
Mar., 10 30.6 1 32.1 19.7 83.3 5.0