Agency, Social Power, and Embodiment in Women's Solitary ...
ORIGINAL PAPER
Growth and population dynamic model for the non-zooxanthellatetemperate solitary coral Leptopsammia pruvoti (Scleractinia,Dendrophylliidae)
Stefano Goffredo • Erik Caroselli • Guido Mattioli •
Francesco Zaccanti
Received: 13 January 2010 / Accepted: 26 July 2010 / Published online: 5 August 2010
� Springer-Verlag 2010
Abstract In corals where complex life history processes
decoupling age from size (e.g., fragmentation, fusion,
partial colony mortality) are rare or clearly detectable,
individual age may be determined from size, and age-based
growth and population dynamic models may be applied.
One example is the solitary Mediterranean coral Leptop-
sammia pruvoti Lacaze-Duthiers 1897, whose population
size and structure, and growth rates were determined at
Calafuria (43�280N and 10�200E), Ligurian Sea, from
December 2007 to June 2009. Growth rate decreased with
increasing size. The growth curve derived from field
measurements confirmed the one obtained by growth band
analysis. The frequency of individuals decreased expo-
nentially with age, indicating a steady state population.
Turnover time was 2.3 years. Maximum life span was
13 years. Most reproductive output was from intermediate
age classes (6 years), while older individuals ([7 years),
although having higher fecundity, were rare and accounted
for a minority of population reproductive output. In com-
parison with other solitary dendrophylliids, L. pruvoti life
strategy was characterized by a reproduction with r-strat-
egy correlates (high fecundity, short embryo incubation,
small planula size, fast achievement of sexual maturity),
and a rate of demographic renewal occurring halfway along
the r–K continuum (intermediate turnover time and maxi-
mum longevity).
Introduction
Demographic analysis of coral populations may reveal the
extent to which they are under stress and is especially
useful when anthropogenic activities disturb reefs and
threaten the viability of coral populations (Grigg 1984;
Guzner et al. 2007). In addition, the development of res-
toration strategies for damaged or degraded coastal areas
requires information on population turnover (Chadwick-
Furman et al. 2000; Epstein et al. 2001; Goffredo and
Chadwick-Furman 2003).
Studies that quantify life history parameters of sclerac-
tinian corals are few, partly because of the processes of
fragmentation, fusion and partial colony mortality, which
cause corals of similar size to be of widely different ages,
thus distorting the age-size relationships (Hughes and
Jackson 1985; Babcock 1991). The scarce studies on
population dynamics of scleractinian corals were reviewed
around 35 years ago, describing their growth and survi-
vorship (Connell 1973). Since then, demographic processes
have been described for some species in the Southwestern
Atlantic (Lins de Barros and Pires 2006), Pacific (Nozawa
et al. 2008), Red Sea, Caribbean, Great Barrier Reef, and
the Mediterranean (Goffredo et al. 2008 and references
therein). The growth of modular individuals can be mod-
eled through the replication, growth and death of the
modules (Harper 1977), and studies of modular growth
Communicated by J. P. Grassle.
Electronic supplementary material The online version of thisarticle (doi:10.1007/s00227-010-1522-5) contains supplementarymaterial, which is available to authorized users.
S. Goffredo (&) � E. Caroselli � F. Zaccanti
Marine Science Group, Department of Evolutionary
and Experimental Biology, Alma Mater Studiorum-University
of Bologna, Via F. Selmi 3, 40126 Bologna, Italy
e-mail: [email protected]
G. Mattioli
Operative Unit of Radiology and Diagnostics by Images,
Hospital of Porretta Terme, Local Health Enterprise of Bologna,
Via Roma 16, 40046 Porretta Terme, Bologna, Italy
123
Mar Biol (2010) 157:2603–2612
DOI 10.1007/s00227-010-1522-5
have often focused on plasticity of form and the complexity
of both individual colony growth and population dynamics
of modular organisms (Hughes and Jackson 1985; Hughes
1989; Babcock 1991). Due to this complexity, an analysis
of 13 Caribbean coral species used a size-based, rather than
age-based, assessment of population structure (Meesters
et al. 2001), and recently new size-structured models for
coral growth and population dynamics have been proposed
(Artzy-Randrup et al. 2007).
In species in which fragmentation or fusion of individ-
uals are rare, and partial mortality can be recognized by
anomalies in the regular growth pattern, coral age can be
determined (Babcock 1991; Chadwick-Furman et al. 2000).
The growth and dynamics of some modular organisms can
be examined using age-based models applied to colony
morphology (Grigg 1977, 1984; Goffredo and Lasker
2006). In addition, in some solitary corals, age estimates
may be easily obtained from externally visible growth
bands (Chadwick-Furman et al. 2000; Goffredo and
Chadwick-Furman 2003). Growth band analysis has been
widely used to determine the age of colonial scleractinian
and gorgonian corals (Knuston et al. 1972; Logan and
Anderson 1991; Goffredo and Lasker 2006). Thus, growth
and population dynamic models based on age can be
applied to certain coral species to describe demographic
characteristics (Grigg 1984; Ross 1984; Chadwick-Furman
et al. 2000; Goffredo and Chadwick-Furman 2003).
Recently, an age-based Beverton–Holt model provided an
adaptive management approach for regulating an octocoral
fishery for bioactive compounds in the Bahamas, avoiding
long-term characterization of population dynamics which
is rarely feasible (Goffredo and Lasker 2008).
The solitary coral considered in the present study is
typical of species where age-based models can be easily
applied. Leptopsammia pruvoti is an ahermatypic, non-
zooxanthellate and solitary scleractinian coral, which is
distributed in the Mediterranean basin and along the
European Atlantic coast from Portugal to Southern Eng-
land and Ireland (Zibrowius 1980). It is one of the most
common organisms in semi-enclosed rocky habitats, under
overhangs, in caverns and small crevices at 0–70 m depth,
with mean abundances of [104 individuals m-2, i.e.,
[2 kg m-2 of CaCO3 biomass (Goffredo et al. 2007). The
biometry (skeletal density, corallite length, width and
height) of individuals and their abundance are not affected
by sea surface temperature and solar radiation along an
850-km latitudinal gradient in western Italian coasts
(Goffredo et al. 2007). It is a gonochoric internal brooder
(Goffredo et al. 2006). When released, the planulae
(695–1,595 lm in length) are ready to settle and swim by
ciliary movement for 1–20 days (Goffredo et al. 2005).
Evidence of asexual reproduction (either through polyp
budding, fission or asexual production of planulae) has not
been observed (Goffredo et al. 2006, and references
therein). Its genetic structure is characterized by hetero-
zygote deficits at all scales, from patch to populations, with
no significant correlation between genetic differentiation
and geographic distance (Goffredo et al. 2009). Its yellow
color and high abundance make this species attractive to
recreational divers, who represent an important income for
coastal tourist resorts in the Mediterranean (Mundet and
Ribera 2001).
The purpose of this study is to describe the population
dynamics of L. pruvoti in the Eastern Ligurian Sea, by
applying the Beverton and Holt population dynamic model
based on age (Beverton and Holt 1957; Chadwick-Furman
et al. 2000; Goffredo and Lasker 2008). This report com-
pletes the description of life history strategy of this tem-
perate coral in the Mediterranean Sea, together with
previous studies on reproductive biology, environmental
correlates of demographic characteristics and genetic dif-
ferentiation (Goffredo et al. 2005, 2006, 2007, 2009).
Previously obtained data on size structure and reproduction
of this species (Goffredo et al. 2006, 2007) are merged with
the present data for estimating population reproductive
output and larval mortality. The questions addressed in this
study are as follows: (1) Do the growth bands of L. pruvoti
reflect the growth pattern in the field? (2) What is the
growth rate, age structure, mortality rate, turnover time,
maximum life span, yield, reproductive output and larval
mortality of this species at Calafuria? (3) How is the
population abundance, maximum coral size, turnover time,
maximum longevity, fecundity, period of embryo incuba-
tion, planula size and dispersal mode, individual size and
age at sexual maturity of this species compared to other
related corals? While growth band analysis integrates
information on growth throughout the life of individuals
(several years), field growth analysis may be influenced by
the particular environmental conditions during the mea-
surement period. Question number 1 is then particularly
important to check if the two methods give comparable
results (i.e., if the environmental conditions at the time of
field measurement reflect the ones in the previous years),
given their different accuracy (Campana 2001).
Materials and methods
The study population of Leptopsammia pruvoti was located
off the coast of Calafuria (10 km south of Livorno, Italy,
Eastern Ligurian Sea, NW Mediterranean, 43�280N,
10�200E; see Goffredo et al. 2004 for description of study
site). The growth rate of 38 individuals of L. pruvoti,
marked in situ by numbered plastic tags nailed to the rock,
at 16-m depth, was measured from December 2007 to June
2009. The length (L: maximum diameter of the oral disk)
2604 Mar Biol (2010) 157:2603–2612
123
of each marked polyp was measured in situ with calipers
(±0.5 mm) every 3 mo for 0.2–1.5 years (average 1 year).
The period of measurement varied among individuals
because corals that died (8 during the whole study, of
different size) were replaced by others of similar size
during the study. Corals were sampled at depths known to
have high population abundance and at the same depth as
that of previous studies on the reproduction, biometry and
population abundance of this species (Goffredo et al. 2005,
2006, 2007). Three digital thermometers (i-Button
DS1921L-F52, Maxim Integrated Products, Dallas Semi-
conductors) were placed in the experimental field to record
seawater temperature at 2-h intervals during the study
period. Thermometers were replaced every 3 mo to
download data and avoid problems of encrustation and
overgrowth by marine organisms.
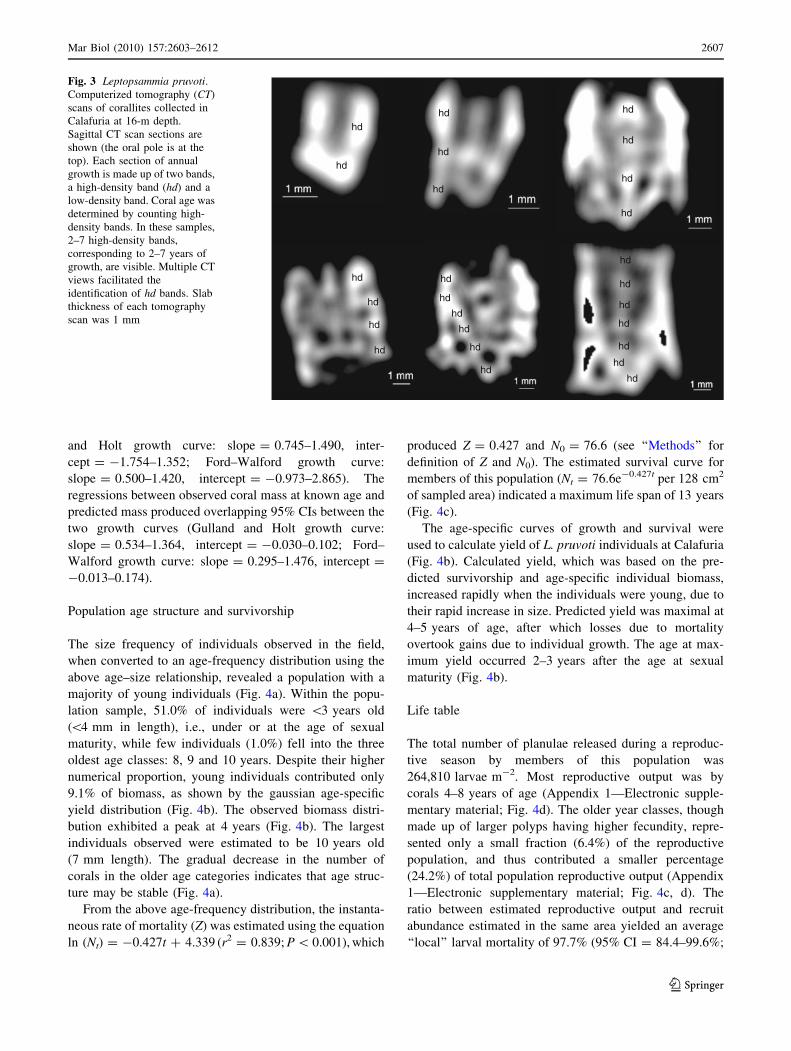
To obtain an additional measure of the relationship
between polyp size and age, for comparison with that
obtained from field measurements of growth rates, the
number of annual growth bands on selected individuals was
counted by means of computerized tomography (CT, after
Logan and Anderson 1991; Goffredo et al. 2004, 2008).
Each CT scan was 1 mm thick and had a resolution of
13,000 dpi. Specimens used in CT measurements (n = 29)
were collected at Calafuria at 16-m depth near the indi-
viduals that were marked for in situ growth measurements.
Coral length and dry skeletal mass (M) were measured
(Goffredo et al. 2007), and age was determined from
growth band counts, based on the pattern in temperate and
semi-temperate corals of deposition of two bands per year,
a high-density band in winter and a low-density band in
summer (Peirano et al. 1999; Goffredo et al. 2004, 2008;
Goffredo and Lasker 2006, 2008).
Growth rates based on both the size–age data from CT,
and the directly observed growth rates, were fit to the Von
Bertalanffy function (Von Bertalanffy 1938):
Lt ¼ L1ð1� e�KtÞ ð1Þ
where Lt is individual length at age t, L? is asymptotic
length (maximum expected length in the population), K is a
growth constant and t is individual age. The parameters L?
and K were determined by applying the ‘‘Gulland and Holt
plot’’ (for field data) and ‘‘Ford–Walford plot’’ (for growth
band data) (see Pauly 1984; Sparre et al. 1989 for the exact
procedure, and Goffredo and Chadwick-Furman 2003;
Goffredo et al. 2004, 2008; Goffredo and Lasker 2006 for
examples of application to corals). Only a single growth
rate summarizing growth over the entire observation period
was used for each coral. All growth rates were normalized
to 1 year.
Population size structure was derived from a 128 cm2
quadrat dataset from Calafuria obtained during previous
work (Goffredo et al. 2007), and age structure was
determined using the von Bertalanffy age-length function
(Eq. 1). The instantaneous rate of mortality (Z) of the
population was determined by an analysis of the age-fre-
quency distribution (see Pauly 1984; Sparre et al. 1989;
Babcock 1991; Chadwick-Furman et al. 2000; Goffredo
and Chadwick-Furman 2003; Goffredo et al. 2004, 2008).
This estimation of mortality rate implies a steady state for
the population, requiring an age structure characterized by
a decreasing ‘‘monotonic’’ pattern with each age class
greater than the next, and it has broadly been used for
colonial and solitary corals (Grigg 1984; Babcock 1991;
Chadwick-Furman et al. 2000; Goffredo and Chadwick-
Furman 2003; Goffredo et al. 2004; Goffredo and Lasker
2008). The instantaneous rate of mortality was then used to
express the numeric reduction of the corals over time
(survivorship curve):
Nt ¼ N0e�Zt ð2Þ
where Nt is the number of individuals at age t, N0 is the
number of individuals at age 0, Z is the instantaneous rate
of mortality and t is individual age measured in years. The
turnover time, equivalent to the mean life span, was cal-
culated as the reciprocal of Z (see Pauly 1984; Goffredo
and Chadwick-Furman 2003; Goffredo et al. 2004). Max-
imum life span was calculated as the age at which \0.5%
of the population was still surviving, based on survival
curves (see Sparre et al. 1989; Chadwick-Furman et al.
2000; Goffredo and Chadwick-Furman 2003).
The age-based length growth curve was converted into a
dry skeletal mass growth curve using the skeletal length–
mass relationship for this species at this site and depth
(Goffredo et al. 2007). Using the Beverton and Holt model
(Beverton and Holt 1957), an age-specific curve expressing
cohort yield in dry skeletal mass was generated using the
growth curve of coral dry skeletal mass and the survivor-
ship curve (i.e., cohort yield at age t = individual dry
skeletal mass at age t 9 survivorship at age t; see Grigg
1984; Chadwick-Furman et al. 2000; Goffredo and Chad-
wick-Furman 2003; Goffredo et al. 2004).
The sex ratio, average fecundity (number of planulae
produced per unit body volume) and percent fertile indi-
viduals in each age class all were derived from previous
work (Goffredo et al. 2006), and planula production in each
age class of L. pruvoti at Calafuria was estimated
(Appendix 1—Electronic supplementary material). Planula
production integrated fecundity (bi), number of individuals
(Xi), sex ratio (SR) and fertility (Fi) in each age class, thus
planula production = bi Xi SR Fi, all estimated from the
population.
Reliability tests for length-age predictions, that is the
Cronbach’s alpha coefficient (Cronbach 1951) and the
Intraclass Correlation Coefficient (Burch 2009), were cal-
culated with SPSS 12.0.
Mar Biol (2010) 157:2603–2612 2605
123
Results
Growth rate and life time growth curve
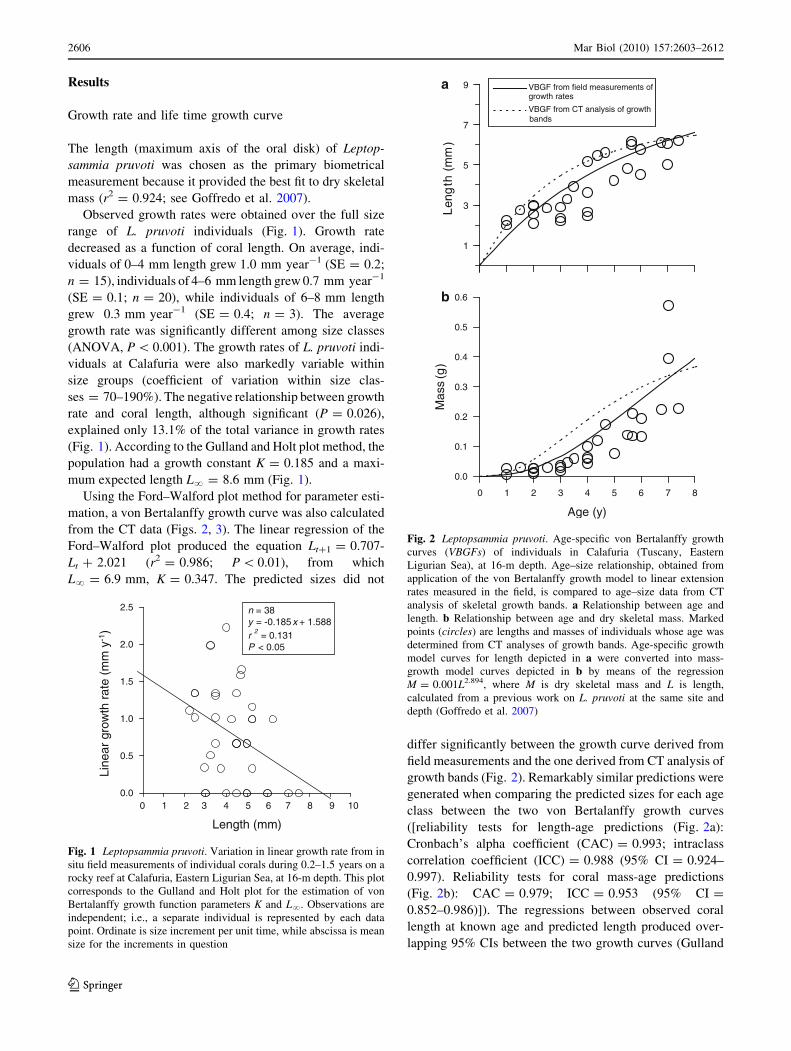
The length (maximum axis of the oral disk) of Leptop-
sammia pruvoti was chosen as the primary biometrical
measurement because it provided the best fit to dry skeletal
mass (r2 = 0.924; see Goffredo et al. 2007).
Observed growth rates were obtained over the full size
range of L. pruvoti individuals (Fig. 1). Growth rate
decreased as a function of coral length. On average, indi-
viduals of 0–4 mm length grew 1.0 mm year-1 (SE = 0.2;
n = 15), individuals of 4–6 mm length grew 0.7 mm year-1
(SE = 0.1; n = 20), while individuals of 6–8 mm length
grew 0.3 mm year-1 (SE = 0.4; n = 3). The average
growth rate was significantly different among size classes
(ANOVA, P \ 0.001). The growth rates of L. pruvoti indi-
viduals at Calafuria were also markedly variable within
size groups (coefficient of variation within size clas-
ses = 70–190%). The negative relationship between growth
rate and coral length, although significant (P = 0.026),
explained only 13.1% of the total variance in growth rates
(Fig. 1). According to the Gulland and Holt plot method, the
population had a growth constant K = 0.185 and a maxi-
mum expected length L? = 8.6 mm (Fig. 1).
Using the Ford–Walford plot method for parameter esti-
mation, a von Bertalanffy growth curve was also calculated
from the CT data (Figs. 2, 3). The linear regression of the
Ford–Walford plot produced the equation Lt?1 = 0.707-
Lt ? 2.021 (r2 = 0.986; P \ 0.01), from which
L? = 6.9 mm, K = 0.347. The predicted sizes did not
differ significantly between the growth curve derived from
field measurements and the one derived from CT analysis of
growth bands (Fig. 2). Remarkably similar predictions were
generated when comparing the predicted sizes for each age
class between the two von Bertalanffy growth curves
([reliability tests for length-age predictions (Fig. 2a):
Cronbach’s alpha coefficient (CAC) = 0.993; intraclass
correlation coefficient (ICC) = 0.988 (95% CI = 0.924–
0.997). Reliability tests for coral mass-age predictions
(Fig. 2b): CAC = 0.979; ICC = 0.953 (95% CI =
0.852–0.986)]). The regressions between observed coral
length at known age and predicted length produced over-
lapping 95% CIs between the two growth curves (Gulland
Line
ar g
row
th r
ate
(mm
y-1
)
Length (mm)
n = 38y = -0.185x + 1.588r 2 = 0.131P < 0.05
0.0
0.5
1.0
1.5
2.0
2.5
0 1 2 3 4 5 6 7 8 9 10
Fig. 1 Leptopsammia pruvoti. Variation in linear growth rate from in
situ field measurements of individual corals during 0.2–1.5 years on a
rocky reef at Calafuria, Eastern Ligurian Sea, at 16-m depth. This plot
corresponds to the Gulland and Holt plot for the estimation of von
Bertalanffy growth function parameters K and L?. Observations are
independent; i.e., a separate individual is represented by each data
point. Ordinate is size increment per unit time, while abscissa is mean
size for the increments in question
Age (y)
Mas
s (g
)L
eng
th (
mm
)
1
3
5
7
9 VBGF from field measurements ofgrowth rates
VBGF from CT analysis of growthbands
0.0
0.1
0.2
0.3
0.4
0.5
0.6
0 1 2 3 4 5 6 7 8
a
b
Fig. 2 Leptopsammia pruvoti. Age-specific von Bertalanffy growth
curves (VBGFs) of individuals in Calafuria (Tuscany, Eastern
Ligurian Sea), at 16-m depth. Age–size relationship, obtained from
application of the von Bertalanffy growth model to linear extension
rates measured in the field, is compared to age–size data from CT
analysis of skeletal growth bands. a Relationship between age and
length. b Relationship between age and dry skeletal mass. Marked
points (circles) are lengths and masses of individuals whose age was
determined from CT analyses of growth bands. Age-specific growth
model curves for length depicted in a were converted into mass-
growth model curves depicted in b by means of the regression
M = 0.001L2.894, where M is dry skeletal mass and L is length,
calculated from a previous work on L. pruvoti at the same site and
depth (Goffredo et al. 2007)
2606 Mar Biol (2010) 157:2603–2612
123
and Holt growth curve: slope = 0.745–1.490, inter-
cept = -1.754–1.352; Ford–Walford growth curve:
slope = 0.500–1.420, intercept = -0.973–2.865). The
regressions between observed coral mass at known age and
predicted mass produced overlapping 95% CIs between the
two growth curves (Gulland and Holt growth curve:
slope = 0.534–1.364, intercept = -0.030–0.102; Ford–
Walford growth curve: slope = 0.295–1.476, intercept =
-0.013–0.174).
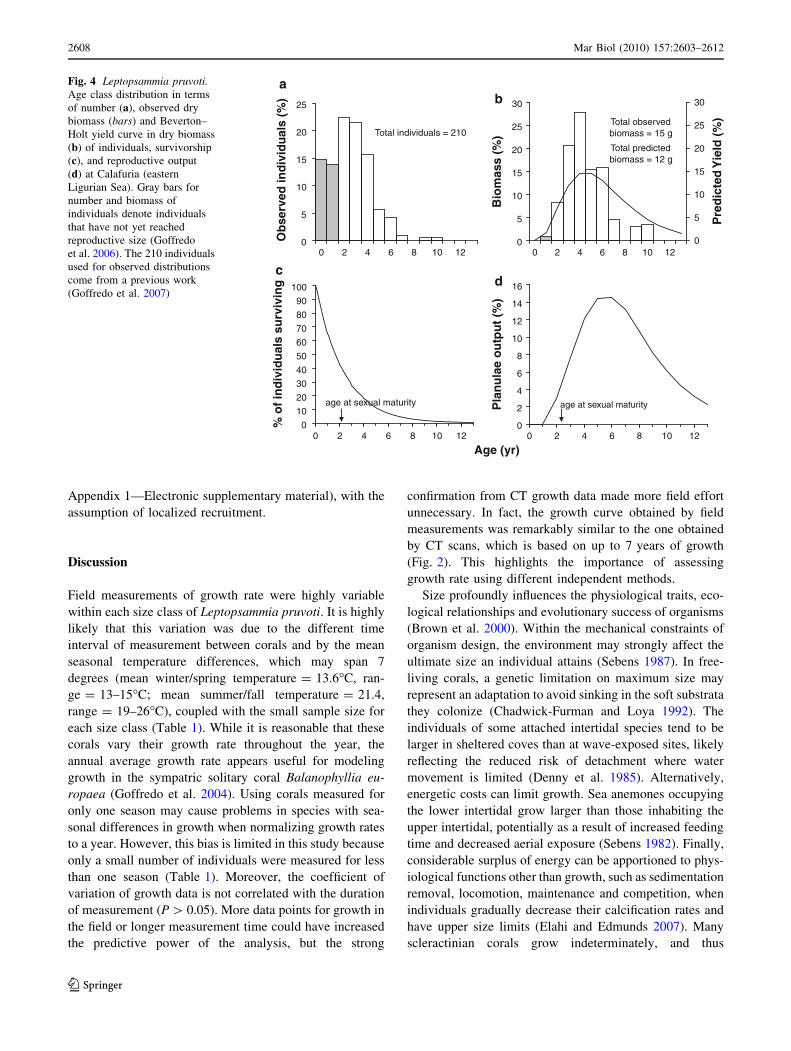
Population age structure and survivorship
The size frequency of individuals observed in the field,
when converted to an age-frequency distribution using the
above age–size relationship, revealed a population with a
majority of young individuals (Fig. 4a). Within the popu-
lation sample, 51.0% of individuals were \3 years old
(\4 mm in length), i.e., under or at the age of sexual
maturity, while few individuals (1.0%) fell into the three
oldest age classes: 8, 9 and 10 years. Despite their higher
numerical proportion, young individuals contributed only
9.1% of biomass, as shown by the gaussian age-specific
yield distribution (Fig. 4b). The observed biomass distri-
bution exhibited a peak at 4 years (Fig. 4b). The largest
individuals observed were estimated to be 10 years old
(7 mm length). The gradual decrease in the number of
corals in the older age categories indicates that age struc-
ture may be stable (Fig. 4a).
From the above age-frequency distribution, the instanta-
neous rate of mortality (Z) was estimated using the equation
ln (Nt) = -0.427t ? 4.339 (r2 = 0.839; P \ 0.001), which
produced Z = 0.427 and N0 = 76.6 (see ‘‘Methods’’ for
definition of Z and N0). The estimated survival curve for
members of this population (Nt = 76.6e-0.427t per 128 cm2
of sampled area) indicated a maximum life span of 13 years
(Fig. 4c).
The age-specific curves of growth and survival were
used to calculate yield of L. pruvoti individuals at Calafuria
(Fig. 4b). Calculated yield, which was based on the pre-
dicted survivorship and age-specific individual biomass,
increased rapidly when the individuals were young, due to
their rapid increase in size. Predicted yield was maximal at
4–5 years of age, after which losses due to mortality
overtook gains due to individual growth. The age at max-
imum yield occurred 2–3 years after the age at sexual
maturity (Fig. 4b).
Life table
The total number of planulae released during a reproduc-
tive season by members of this population was
264,810 larvae m-2. Most reproductive output was by
corals 4–8 years of age (Appendix 1—Electronic supple-
mentary material; Fig. 4d). The older year classes, though
made up of larger polyps having higher fecundity, repre-
sented only a small fraction (6.4%) of the reproductive
population, and thus contributed a smaller percentage
(24.2%) of total population reproductive output (Appendix
1—Electronic supplementary material; Fig. 4c, d). The
ratio between estimated reproductive output and recruit
abundance estimated in the same area yielded an average
‘‘local’’ larval mortality of 97.7% (95% CI = 84.4–99.6%;
hd
hd
hd
hd
hd
hd
hd
hd
hd
hd
hd
hd
hd
hd
hd
hd
hd
hd
hd
hd
hd
hd
hd
hd
hd
hd
Fig. 3 Leptopsammia pruvoti.Computerized tomography (CT)
scans of corallites collected in
Calafuria at 16-m depth.
Sagittal CT scan sections are
shown (the oral pole is at the
top). Each section of annual
growth is made up of two bands,
a high-density band (hd) and a
low-density band. Coral age was
determined by counting high-
density bands. In these samples,
2–7 high-density bands,
corresponding to 2–7 years of
growth, are visible. Multiple CT
views facilitated the
identification of hd bands. Slab
thickness of each tomography
scan was 1 mm
Mar Biol (2010) 157:2603–2612 2607
123
Appendix 1—Electronic supplementary material), with the
assumption of localized recruitment.
Discussion
Field measurements of growth rate were highly variable
within each size class of Leptopsammia pruvoti. It is highly
likely that this variation was due to the different time
interval of measurement between corals and by the mean
seasonal temperature differences, which may span 7
degrees (mean winter/spring temperature = 13.6�C, ran-
ge = 13–15�C; mean summer/fall temperature = 21.4,
range = 19–26�C), coupled with the small sample size for
each size class (Table 1). While it is reasonable that these
corals vary their growth rate throughout the year, the
annual average growth rate appears useful for modeling
growth in the sympatric solitary coral Balanophyllia eu-
ropaea (Goffredo et al. 2004). Using corals measured for
only one season may cause problems in species with sea-
sonal differences in growth when normalizing growth rates
to a year. However, this bias is limited in this study because
only a small number of individuals were measured for less
than one season (Table 1). Moreover, the coefficient of
variation of growth data is not correlated with the duration
of measurement (P [ 0.05). More data points for growth in
the field or longer measurement time could have increased
the predictive power of the analysis, but the strong
confirmation from CT growth data made more field effort
unnecessary. In fact, the growth curve obtained by field
measurements was remarkably similar to the one obtained
by CT scans, which is based on up to 7 years of growth
(Fig. 2). This highlights the importance of assessing
growth rate using different independent methods.
Size profoundly influences the physiological traits, eco-
logical relationships and evolutionary success of organisms
(Brown et al. 2000). Within the mechanical constraints of
organism design, the environment may strongly affect the
ultimate size an individual attains (Sebens 1987). In free-
living corals, a genetic limitation on maximum size may
represent an adaptation to avoid sinking in the soft substrata
they colonize (Chadwick-Furman and Loya 1992). The
individuals of some attached intertidal species tend to be
larger in sheltered coves than at wave-exposed sites, likely
reflecting the reduced risk of detachment where water
movement is limited (Denny et al. 1985). Alternatively,
energetic costs can limit growth. Sea anemones occupying
the lower intertidal grow larger than those inhabiting the
upper intertidal, potentially as a result of increased feeding
time and decreased aerial exposure (Sebens 1982). Finally,
considerable surplus of energy can be apportioned to phys-
iological functions other than growth, such as sedimentation
removal, locomotion, maintenance and competition, when
individuals gradually decrease their calcification rates and
have upper size limits (Elahi and Edmunds 2007). Many
scleractinian corals grow indeterminately, and thus
Age (yr)
Ob
serv
ed in
div
idu
als
(%)
% o
f in
div
idu
als
surv
ivin
g
0
5
10
15
20
25
0
10
20
30
40
50
60
70
80
90
100
age at sexual maturity
c
Total individuals = 210
a
0 2 4 6 8 10 12
0 2 4 6 8 10 12
Bio
mas
s (%
)
0
5
10
15
20
25
30
Pre
dic
ted
Yie
ld (
%)
0
5
10
15
20
25
30
Total observed biomass = 15 g
b
Total predicted biomass = 12 g
0 2 4 6 8 10 12
Pla
nu
lae
ou
tpu
t (%
)
0
2
4
6
8
10
12
14
16
0 2 4 6 8 10 12
age at sexual maturity
d
Fig. 4 Leptopsammia pruvoti.Age class distribution in terms
of number (a), observed dry
biomass (bars) and Beverton–
Holt yield curve in dry biomass
(b) of individuals, survivorship
(c), and reproductive output
(d) at Calafuria (eastern
Ligurian Sea). Gray bars for
number and biomass of
individuals denote individuals
that have not yet reached
reproductive size (Goffredo
et al. 2006). The 210 individuals
used for observed distributions
come from a previous work
(Goffredo et al. 2007)
2608 Mar Biol (2010) 157:2603–2612
123
theoretically have unlimited body size (i.e., even the largest
individuals continue to grow; Hughes and Jackson 1985).
Unlimited growth is possible through the production of
energetically self-sufficient modules, and also because the
energy available for growth or reproduction increases with
increasing colony mass (Buddemeier and Kinzie 1976).
However, some scleractinian corals reduce their growth rate
as they get bigger. Modular scleractinian coral species with
size-dependent growth include branching (Pocillopora spp.;
Grigg and Maragos 1974), massive (Goniastrea aspera;
Sakai 1998) and free-living colonies (i.e., not attached to a
solid substrate in the adult phase, such as Manicina areolata;
Johnson 1992). Several cases of size-dependent modular
growth are also known for octocorals (Cordes et al. 2001;
Bastidas et al. 2004; Goffredo and Lasker 2006). Solitary
scleractinians with size-dependent growth include free-liv-
ing polyps (many species of mushroom corals; Yamashiro
and Nishihira 1998; Chadwick-Furman et al. 2000; Goffredo
and Chadwick-Furman 2003; Knittweis et al. 2009), and
attached polyps such as L. pruvoti (this study), B. europaea
(Goffredo et al. 2004), B. elegans and Paracyathus stearnsii
(Gerrodette 1979). In these species, the determinate growth
could be due to aging or to a preferential allocation to
reproduction of the increased available energy due to larger
mass, without investing further energy on somatic growth.
Temperature is strongly linked to coral biometry,
physiology and demography (Harriott and Banks 2002)
and may significantly affect the maximum size of indi-
viduals in populations (Goffredo et al. 2008). The maxi-
mum individual coral length predicted here by the von
Bertalanffy model (L? = 6.9–8.6 mm) was similar to that
observed in the field at Calafuria (maximum observed
length = 7.3 mm). While the maximum reported length
for L. pruvoti individuals is 17 mm (Zibrowius 1980), a
positive correlation between annual SST in the popula-
tions and coral length has recently been observed
(Goffredo et al. 2007), with the largest corals (13 mm)
measured at Scilla (625 km south of Calafuria and in
warmer waters). A strong positive relationship between
annual SST and coral size also occurs in B. europaea,
another sympatric dendrophylliid coral along the west
coast of Italy (Goffredo et al. 2007).
The age-frequency distribution of individuals [ 2 years
old showed an exponential decrease, with the youngest age
classes probably under-represented, which is typical for
field samples (Grigg 1984; Babcock 1991; Goffredo and
Chadwick-Furman 2003; Goffredo et al. 2004; Goffredo
and Lasker 2008), and is probably due to the difficulty of
seeing the smallest corals (\3 mm long). A population
with constant mortality across age classes and where the
number of recruits equals the total number of deaths in all
age classes is characterized by a negative exponential
decrease in frequency of individuals in each age class and
is considered in steady state (Wetherall et al. 1987). Thus,
the observed gradual decrease in the number of corals in
successive age classes indicates a population in steady
state, in that no age cohorts were missing or over-repre-
sented, as would be the case if a major disturbance event
had recently altered recruitment patterns (Grigg 1977,
1984; Chadwick-Furman et al. 2000; Goffredo and Chad-
wick-Furman 2003; Goffredo et al. 2004; Santangelo et al.
2007; Goffredo and Lasker 2008). In a theoretical popu-
lation at steady state, the coefficient of correlation of the
semi-log regression from which the instantaneous rate of
mortality (Z) is estimated has a value r = -1.000 (Pauly
1984). In L. pruvoti, this was r = -0.916, a value similar
to those calculated for other coral populations reported to
occur in a steady state (r = -0.851 to -0.993; Grigg
1984; Ross 1984; Chadwick-Furman et al. 2000; Goffredo
and Chadwick-Furman 2003; Goffredo et al. 2004; Goff-
redo and Lasker 2008), indicating that our assumption of
steady state for calculating the instantaneous rate of mor-
tality was reasonable. According to population dynamic
models, the instantaneous rate of mortality equals the
inverse of the mean life span of the individuals in a pop-
ulation (turnover time), and hence is equal to their turnover
rate (Pauly 1984; Chadwick-Furman et al. 2000; Goffredo
and Chadwick-Furman 2003; Goffredo et al. 2004).
The turnover time for L. pruvoti at Calafuria was 2.3 years
(calculated as the reciprocal of Z; 95% CI = 1.7–
3.6 years). These estimates appear reasonable and closely
reflect field observations.
Cohort yield of L. pruvoti reached its maximum earlier
than B. europaea at the same locality (age at maximum
yield: for L. pruvoti 4–5 years, this study; for B. europaea
6–7 years, Goffredo et al. 2004). The age-based cohort
yield curve depends on individual rates of mortality and
growth. Leptopsammia pruvoti was characterized by higher
growth and mortality rates compared to B. europaea, both
contributing to the early peak of cohort biomass (L. pruv-
oti: K = 0.185–0.347, Z = 0.427, this study; B. europaea:
K = 0.111–0.126, Z = 0.275; Goffredo et al. 2004). In
other solitary scleractinian corals, the age at maximum
cohort yield ranges from 5 years in Fungia scutaria to
20 years in Heliofungia actiniformis (Chadwick-Furman
Table 1 Number of Leptopsammia pruvoti polyps in each size class
that were measured in the field for the indicated time interval
Size class (mm) Duration of field measurement (mo) Total
0–3 4–6 7–9 10–12 13–15 16–18
0–3 – 3 3 1 – – 7
4–6 1 3 3 5 1 15 28
7–9 – 2 – – – 1 3
Total 1 8 6 6 1 16 38
Mar Biol (2010) 157:2603–2612 2609
123
et al. 2000; Goffredo and Chadwick-Furman 2003; Knit-
tweis et al. 2009).
The estimates of population reproductive parameters
(Goffredo et al. 2005, 2006) enabled us to construct a static
life history table that summarizes the main demographic
parameters in this population. Most of the population
reproductive output came from individuals of 4–8 years
old (65% of planula production), while the age classes with
larger individuals with higher fecundity were too infre-
quent to make a large contribution to reproduction, and
therefore accounted for only a small portion of the overall
reproductive output. On the contrary, in species with
decreasing mortality with increasing size, like colonial
corals, the largest colonies contribute the most to the
reproductive output.
The ratio between larval output and recruit abundance,
estimated in the same population, yielded a local larval
mortality rate of about 98%, assuming local recruitment.
Even though population genetic structure data indicate that
local recruitment is likely in L. pruvoti (Goffredo et al.
2009), larval dispersal may affect our estimates of local
larval mortality. Self-recruitment (settlement at the natal
site) in marine species appears to be more frequent than
previously suspected, and thus populations may be less
open than originally thought (Levin 2006). Our estimated
local larval mortality for L. pruvoti was higher than that
reported for the brooding red octocoral Corallium rubrum
at the same site (Santangelo et al. 2004), and similar to that
reported for the brooding octocorals Muricea californica
and M. fruticosa in California (Grigg 1977). For marine
populations, the number of eggs or larvae required to
produce one reproductive offspring that survives the larval
and early juvenile stage is poorly known (Botsford et al.
2009). In L. pruvoti, according to the life history table, the
percent of individuals reaching sexual maturity was 43%
(95% CI = 31–58%) and the number of larvae needed for
one recruit was 44 (95% CI = 6–234), thus 104 larvae
(95% CI = 10–754) were required to produce one repro-
ductive individual.
The average population abundance of L. pruvoti is
markedly higher than that of other solitary dendrophylliid
corals for which population dynamics and reproductive
biology have been reported, namely B. europaea, endemic
to the Mediterranean Sea, and B. elegans off North
Western America (Appendix 2—Electronic supplementary
material). The higher abundance of L. pruvoti is most
likely due to localized recruitment of a fraction of the
azooxanthellate brooded larvae, which attach to the vault
of crevices near the parent polyps, causing a high rate of
local inbreeding through mating between close relatives
(Goffredo et al. 2009). Even B. elegans has a higher
population abundance compared to B. europaea (Appen-
dix 2—Electronic supplementary material), which is most
likely due to the low dispersal of the azooxanthellate
benthic larvae, which attach to the bottom \ 0.5 m from
the parent polyp (Gerrodette 1981; Fadlallah and Pearse
1982; Fadlallah 1983). On the other hand, the low popu-
lation abundance of B. europaea may be caused by high
dispersal of the zooxanthellate larvae, which have neutral
buoyancy and exhibit swimming and pelagic behavior
(Richmond 1987; Goffredo and Zaccanti 2004; Goffredo
et al. 2004). It should be noted that the dispersal capa-
bilities of the larvae of the three species may be strongly
influenced by their behavior rather than by the symbiotic
condition, since not all zooxanthellate larvae have higher
dispersal than azooxanthellate ones (Ben-David-Zaslow
and Benayahu 1998).
Life history theory predicts that organisms develop
different life history strategies (as a result of trade-offs
among reproduction, growth and survival; Stearns 1989;
Roff 1992) to maximize their fitness under different envi-
ronmental conditions and selective pressures (Pianka 1970;
Stearns 1976, 1989). Concerning reproductive strategies,
the classic r/K-selection theory (Pianka 1970) has often
been used to categorize organisms: r-strategists (also called
opportunistic species) are characterized by high fecundity,
high mortality rates, small size, short generation time and
high dispersal potential; whereas K-strategists usually have
the opposite characteristics. The original theory has been
reviewed and updated in the last 40 years (Stearns 1976,
1989; Roff 1992), and information on the evolution of life
history traits in scleractinians has been recently reviewed
(Baird et al. 2009). The r/K correlates are still widely used
to describe life history strategies and are particularly useful
for groups where life history strategies have rarely been
studied. It appears there are dendrophylliid solitary corals
that have evolved mixed life strategies (Appendix 2—
Electronic supplementary material). B. elegans has demo-
graphic renewal with r-characteristics and reproduction
with K-characteristics; B. europaea has a K-demographic
renewal strategy and reproduction with intermediate char-
acteristics; L. pruvoti has an r-reproductive strategy and
demographic renewal with intermediate characteristics
(Appendix 2—Electronic supplementary material). How-
ever, this comparison should be viewed cautiously, since
the life histories of the three species have been studied at
only one site, and differences may exist between popula-
tions subject to different environmental conditions or
selective pressures.
This study completes the description of the main life
strategy characteristics of the temperate L. pruvoti in the
Calafuria population, together with previous studies on its
reproductive biology and biometry. Further studies of this
species are needed to reveal possible differences in the life
history traits among populations in different environmental
conditions.
2610 Mar Biol (2010) 157:2603–2612
123
Acknowledgments This study was supported by grants from the
Italian Ministry for University, Scientific and Technological
Research; the Scuba Nitrox Safety International; The Association of
Italian Tour Operators, The Project AWARE Foundation, the Min-
istry of Tourism of the Arab Republic of Egypt (funding biodiversity
monitoring projects in the Red Sea and the Mediterranean) and the
Marine and Freshwater Science Group Association. Comments from
Dr. Brian Helmuth and five anonymous reviewers improved manu-
script quality. Elettra Pignotti (Statistical analysis, Rizzoli Ortho-
paedic Institute of Bologna, Italy) provided valuable advice on
statistical treatment of the data; the Scientific Diving School of
Bologna gave logistical support for the dives. Special thanks go to the
divers A. Beccari, L. Bortolazzi, M. Cova and L. Tomesani for their
assistance in the field. The experiments complied with current Italian
laws.
References
Artzy-Randrup Y, Olinky R, Stone L (2007) Size-structured demo-
graphic models of coral populations. J Theor Biol 245:482–497
Babcock RC (1991) Comparative demography of three species of
scleractinian corals using age- and size-dependent classifica-
tions. Ecol Monogr 6:225–244
Baird AH, Guest JR, Willis BL (2009) Systematic and biogeograph-
ical patterns in the reproductive biology of scleractinian corals.
Annu Rev Ecol Evol Syst 40:551–571
Bastidas C, Fabricius KE, Willis BL (2004) Demographic aspects of
the soft coral Sinularia flexibilis leading to local dominance on
coral reefs. Hydrobiologia 530(531):433–441
Beauchamp KA (1993) Gametogenesis, brooding and planulation in
laboratory populations of a temperate scleractinian coral Balan-ophyllia elegans maintained under contrasting photoperiod
regimes. Invert Repr Dev 23:171–182
Ben-David-Zaslow R, Benayahu Y (1998) Competence and longevity
in planulae of several species of soft corals. Mar Ecol Prog Ser
163:235–243
Beverton RJH, Holt SV (1957) On the dynamics of exploited fish
populations. Fish Invest Minist Agric Fish Food (G B) Ser II
19:1–553
Botsford LW, White JW, Coffroth MA, Paris CB, Planes S, Shearer
TL, Thorrold SR, Jones GP (2009) Connectivity and resilience of
coral reef metapopulations in marine protected areas: matching
empirical efforts to predictive needs. Coral Reefs 28:327–337
Brown JH, West GB, Enquist BJ (2000) Scaling in biology: patterns,
processes, causes and consequences. In: Brown JH, Enquist BJ
(eds) Scaling in biology. Oxford University Press, New York,
pp 1–24
Buddemeier RW, Kinzie RA (1976) Coral growth. Oceanogr Mar
Biol Annu Rev 14:183–225
Burch BD (2009) Comparing equal-tail probability and unbiased
confidence intervals for the intraclass correlation coefficient.
Commun Stat Theory Methods 37:3264–3275
Campana SE (2001) Accuracy, precision and quality control in age
determination, including a review of the use and abuse of age
validation methods. J Fish Biol 59:197–242
Chadwick-Furman N, Loya Y (1992) Migration, habitat use, and
competition among mobile corals (Scleractinia: Fungiidae) in the
Gulf of Eilat, Red Sea. Mar Biol 114:617–623
Chadwick-Furman NE, Goffredo S, Loya Y (2000) Growth and
population dynamic model of the reef coral Fungia granulosaKluzinger, 1879 at Eilat, northern Red Sea. J Exp Mar Bio Ecol
249:199–218
Connell JH (1973) Population ecology of reef building corals. In:
Jones OA, Endean R (eds) Biology and geology of coral reefs,
vol II: Biology 1. Academic Press, New York, pp 271–324
Cordes EE, Nybakken JW, VanDykhuizen G (2001) Reproduction
and growth of Anthomastus ritteri (Octocorallia: Alcyonacea)
from Monterey Bay, California, USA. Mar Biol 138:491–501
Cronbach LJ (1951) Coefficient alpha and the internal structure of
tests. Psychometrika 16:297–334
Denny MW, Daniel TL, Koehl MAR (1985) Mechanical limits to size
in wave-swept organisms. Ecol Monogr 55:69–102
Elahi R, Edmunds P (2007) Determinate growth and the scaling of
photosynthetic energy intake in the solitary coral Fungiaconcinna (Verril). J Exp Mar Biol Ecol 349:183–193
Epstein N, Bak RPM, Rinkevich B (2001) Strategies for gardening
denuded coral reef areas: the applicability of using different
types of coral material for reef restoration. Restor Ecol
9:432–442
Fadlallah YH (1983) Population dynamics and life history of a
solitary coral, Balanophyllia elegans, from Central California.
Oecologia 58:200–207
Fadlallah YH, Pearse JS (1982) Sexual reproduction in solitary corals:
overlapping oogenic and brooding cycles, and benthic planulas
in Balanophyllia elegans. Mar Biol 71:223–231
Gerrodette T (1979) Ecological studies of two temperate solitary
corals. Dissertation, University of California
Gerrodette T (1981) Dispersal of the solitary coral Balanophylliaelegans by demersal planular larvae. Ecology 62:611–619
Goffredo S, Chadwick-Furman NE (2003) Comparative demography
of mushroom corals (Scleractinia, Fungiidae) at Eilat, northern
Red Sea. Mar Biol 142:411–418
Goffredo S, Lasker HR (2006) Modular growth of a gorgonian coral
can generate predictable patterns of colony growth. J Exp Mar
Biol Ecol 336:221–229
Goffredo S, Lasker HR (2008) An adaptive management approach to
an octocoral fishery based on the Beverton-Holt model. Coral
Reefs 27:751–761
Goffredo S, Telo T (1998) Hermaphroditism and brooding in the
solitary coral Balanophyllia europaea (Cnidaria, Anthozoa,
Scleractinia). Ital J Zool 65:159–165
Goffredo S, Zaccanti F (2004) Laboratory observations of larval
behavior and metamorphosis in the Mediterranean solitary coral
Balanophyllia europaea (Scleractinia, Dendrophylliidae). Bull
Mar Sci 74:449–458
Goffredo S, Telo T, Scanabissi F (2000) Ultrastructural observations
of the spermatogenesis of the hermaphroditic solitary coral
Balanophyllia europaea (Anthozoa, Scleractinia). Zoomorphol-
ogy 119:231–240
Goffredo S, Arnone S, Zaccanti F (2002) Sexual reproduction in the
Mediterranean solitary coral Balanophyllia europaea (Sclerac-
tinia, Dendrophylliidae). Mar Ecol Prog Ser 229:83–94
Goffredo S, Mattioli G, Zaccanti F (2004) Growth and population
dynamics model of the Mediterranean solitary coral Balano-phyllia europaea (Scleractinia, Dendrophylliidae). Coral Reefs
23:433–443
Goffredo S, Radetic J, Airi V, Zaccanti F (2005) Sexual reproduction
of the solitary sunset cup coral Leptopsammia pruvoti (Sclerac-
tinia, Dendrophylliidae) in the Mediterranean. 1. Morphological
aspects of gametogenesis and ontogenesis. Mar Biol
147:485–495
Goffredo S, Airi V, Radetic J, Zaccanti F (2006) Sexual reproduction
of the solitary sunset cup coral Leptopsammia pruvoti (Sclerac-
tinia, Dendrophylliidae) in the Mediterranean. 2. Quantitative
aspects of the annual reproductive cycle. Mar Biol 148:923–932
Goffredo S, Caroselli E, Pignotti E, Mattioli G, Zaccanti F (2007)
Variation in biometry and population density of solitary corals
Mar Biol (2010) 157:2603–2612 2611
123
with solar radiation and sea surface temperature in the Mediter-
ranean Sea. Mar Biol 152:351–361
Goffredo S, Caroselli E, Mattioli G, Pignotti E, Zaccanti F (2008)
Relationships between growth, population structure and sea
surface temperature in the temperate solitary coral Balanophylliaeuropaea (Scleractinia, Dendrophylliidae). Coral Reefs
27:623–632
Goffredo S, Di Ceglie S, Zaccanti F (2009) Genetic differentiation of
the temperate-subtropical stony coral Leptopsammia pruvoti in
the Mediterranean Sea. Isr J Ecol Evol 55:99–115
Grigg RW (1977) Population dynamics of two gorgonian corals.
Ecology 58:278–290
Grigg RW (1984) Resource management of precious corals: a review
and application to shallow water reef building corals. Mar Ecol
Pubbl Stn Zool Napoli 5:57–74
Grigg RW, Maragos JE (1974) Recolonization of hermatypic corals
on submerged lava flows in Hawaii. Ecology 55:387–395
Guzner B, Novoplansky A, Chadwick NE (2007) Population dynam-
ics of the reef-building coral Acropora hemprichii as an indicator
of reef condition. Mar Ecol Prog Ser 333:143–150
Harper JL (1977) Population biology of plants. Academic Press,
London
Harriott VJ, Banks SA (2002) Latitudinal variation in coral commu-
nities in eastern Australia: a qualitative biophysical model of
factors regulating coral reefs. Coral Reefs 21:83–94
Hughes RN (1989) A functional biology of clonal animals. Chapman
and Hall, New York
Hughes TP, Jackson JBC (1985) Population dynamics and life
histories of foliaceous corals. Ecol Monogr 55:141–166
Johnson KG (1992) Population dynamics of a free-living coral:
recruitment, growth and survivorship of Manicina areolata(Linnaeus) on the Caribbean coast of Panama. J Exp Mar Biol
Ecol 164:171–191
Knittweis L, Jompa J, Richter C, Wolff M (2009) Population
dynamics of the mushroom coral Heliofungia actiniformis in the
Spermonde Archipelago, South Sulawesi, Indonesia. Coral Reefs
28:793–804
Knuston DW, Buddemeier RW, Smith SV (1972) Coral chronome-
ters: seasonal growth bands in reef corals. Science 177:270–272
Lacaze-Duthiers H (1897) Faune du Golfe du Lion. Coralliaires,
Zooanthaires, Sclerodermes. Arch Zool Exp Gen 5:1–249
Levin LA (2006) Recent progress in understanding larval dispersal:
new directions and digressions. Integr Comp Biol 46:282–297
Lins de Barros MM, Pires DO (2006) Colony size-frequency
distributions among different populations of the scleractinian
coral Siderastrea stellata in Southwestern Atlantic: implications
for life history patterns. Braz J Oceanogr 54:213–223
Logan A, Anderson IH (1991) Skeletal extension growth rate
assessment in corals, using CT scan imagery. Bull Mar Sci
49:847–850
Meesters EH, Hilterman M, Kardinaal E, Keetman M, deVries M,
Bak RPM (2001) Colony size-frequency distributions of scle-
ractinian coral populations: spatial and interspecific variation.
Mar Ecol Prog Ser 209:43–54
Mundet L, Ribera L (2001) Characteristics of divers at a Spanish
resort. Tour Manag 22:201–510
Nozawa Y, Tokeshi M, Nojima S (2008) Structure and dynamics of a
high-latitude scleractinian coral community in Amakusa, south-
western Japan. Mar Ecol Prog Ser 358:151–160
Pauly D (1984) Fish population dynamics in tropical waters: a manual
for use with programmable calculators. International Center for
Living Aquatic Resources Management, Manila
Peirano A, Morri C, Bianchi CN (1999) Skeleton growth and density
pattern of the temperate, zooxanthellate scleractinian Cladocoracaespitosa from the Ligurian Sea (NW Mediterranean). Mar
Ecol Prog Ser 185:195–201
Pianka ER (1970) On r- and K- selection. Am Nat 104:592–597
Richmond RH (1987) Energetics, competency, and long-distance
dispersal of planula larvae of the coral Pocillopora damicornis.
Mar Biol 93:527–533
Roff DA (1992) The evolution of life histories: theory and analysis.
Chapman & Hall, New York
Ross MA (1984) A quantitative study of the stony coral fishery in
Cebu, Philippines. Mar Ecol PSZNI 5:75–91
Sakai K (1998) Delayed maturation in the colonial coral Goniastreaaspera (Scleractinia): whole-colony mortality, colony growth
and polyp egg production. Res Popul Ecol (Kyoto) 40:287–292
Santangelo G, Maggi E, Bramanti L, Bongiorni L (2004) Demogra-
phy of the over-exploited Mediterranean red coral (Coralliumrubrum L. 1758). Scientia Marina 68:199–204
Santangelo G, Bramanti L, Iannelli M (2007) Population dynamics
and conservation biology of the over-exploited Mediterranean
red coral. J Theor Biol 244:416–423
Sebens KP (1982) The limits to indeterminate growth: an optimal size
model applied to passive suspension feeders. Ecology 63:209–222
Sebens KP (1987) The ecology of indeterminate growth in animals.
Ann Rev Ecol Syst 18:371–407
Sparre P, Ursin E, Venema SC (1989) Introduction to tropical fish
stock assessment. FAO Fisheries Technical Paper, Rome
Stearns SC (1976) Life-history tactics: a review of the ideas. Q Rev
Biol 51:3–47
Stearns SC (1989) Trade-offs in life-history evolution. Funct Ecol
3:259–268
von Bertalanffy L (1938) A quantitative theory of organic growth
(inquiries on growth laws II). Hum Biol 10:181–213
Wetherall JA, Polovina JJ, Ralston S (1987) Estimating growth and
mortality in steady-state fish stocks from length-frequency data.
In: Pauly D, Morgan GR (eds) Length-based methods in fisheries
research. ICLARM conference proceedings. International Center
for Living Aquatic Resources Management, Manila, and Kuwait
Institute for Scientific Research, Safat, pp 53–74
Yamashiro H, Nishihira M (1998) Experimental study of growth and
asexual reproduction in Diaseris distorta (Michelin, 1843), a
free-living fungiid coral. J Exp Mar Biol Ecol 225:253–267
Zibrowius H (1980) Les scleractiniaires de la Mediterranee et
del’Atlantique nord-oriental. Mem Inst Oceanogr (Monaco)
11:1–284
2612 Mar Biol (2010) 157:2603–2612
123
Copyright © 2022 FDOKUMEN