
Estimating marine resource use by the American crocodile (Crocodylus acutus) in southern Florida
Upload
unesco-iheCategory
view
1download
0
HESSD11, 2719–2757, 2014
Groundwater as anemergency source for
drought mitigation,South Africa
F. E. F. Mussá et al.
Title Page
Abstract Introduction
Conclusions References
Tables Figures
J I
J I
Back Close
Full Screen / Esc
Printer-friendly Version
Interactive Discussion
Discussion
Paper
|D
iscussionP
aper|
Discussion
Paper
|D
iscussionP
aper|
Hydrol. Earth Syst. Sci. Discuss., 11, 2719–2757, 2014www.hydrol-earth-syst-sci-discuss.net/11/2719/2014/doi:10.5194/hessd-11-2719-2014© Author(s) 2014. CC Attribution 3.0 License.
Hydrology and Earth System
Sciences
Open A
ccess
Discussions
This discussion paper is/has been under review for the journal Hydrology and Earth SystemSciences (HESS). Please refer to the corresponding final paper in HESS if available.
Groundwater as an emergency source fordrought mitigation in the Crocodile Rivercatchment, South AfricaF. E. F. Mussá1,2, Y. Zhou1, S. Maskey1, I. Masih1, and S. Uhlenbrook1,3
1UNESCO-IHE, Institute for Water Education, P.O. Box 3015, 2601 DA Delft, the Netherlands2Eduardo Mondlane University, Faculty of Engineering, Av. de Moçambique km 1.5,C. Postal 257, Maputo, Mozambique3Delft University of Technology, Section of Water Resources, P.O. Box 5048,2600 GA Delft, the Netherlands
Received: 31 January 2014 – Accepted: 12 February 2014 – Published: 6 March 2014
Correspondence to: F. E. F. Mussá ([email protected])
Published by Copernicus Publications on behalf of the European Geosciences Union.
2719
HESSD11, 2719–2757, 2014
Groundwater as anemergency source for
drought mitigation,South Africa
F. E. F. Mussá et al.
Title Page
Abstract Introduction
Conclusions References
Tables Figures
J I
J I
Back Close
Full Screen / Esc
Printer-friendly Version
Interactive Discussion
Discussion
Paper
|D
iscussionP
aper|
Discussion
Paper
|D
iscussionP
aper|
Abstract
Global climate change has received much attention worldwide in the scientific as wellas in the political community, indicating that changes in precipitation, extreme droughtsand floods may threaten increasingly many regions. Drought is a natural phenomenonthat may cause social, economical and environmental damages to the society. In this5
study, we assess the drought intensity and severity and the groundwater potential tobe used as a supplement source of water to mitigate drought impacts in the CrocodileRiver catchment, a water-stressed sub-catchment of the Incomati River catchmentin South Africa. The research methodology consists mainly of three parts. First, thespatial and temporal variation of the meteorological and hydrological drought severity10
and intensity over the catchment were evaluated. The Standardized Precipitation Index(SPI) was used to analyse the meteorological drought and the Standardized RunoffIndex (SRI) was used for the hydrological drought. Second, the water deficit in thecatchment during the drought period was computed using a simple water balancemethod. Finally, a groundwater model was constructed in order to assess the feasibility15
of using groundwater as an emergency source for drought impact mitigation. Resultsshow that the meteorological drought severity varies accordingly with the precipitation;the low rainfall areas are more vulnerable to severe meteorological droughts (lower andupper crocodile). Moreover, the most water stressed sub-catchments with high level ofwater uses but limited storage, such as the Kaap located in the middle catchment20
and the Lower Crocodile sub-catchments are those which are more vulnerable tosevere hydrological droughts. The analysis of the potential groundwater use duringdroughts showed that a deficit of 97 Mm3 yr−1 could be supplied from groundwaterwithout considerable adverse impacts on the river base flow and groundwater storage.Abstraction simulations for different scenarios of extremely severe droughts reveal25
that it is possible to use groundwater to cope with the droughts in the catchment.However, local groundwater exploitation in Nelspruit and White River sub-catchmentwill cause large drawdowns (>10 m) and high base flow reduction (>20 %). This case
2720
HESSD11, 2719–2757, 2014
Groundwater as anemergency source for
drought mitigation,South Africa
F. E. F. Mussá et al.
Title Page
Abstract Introduction
Conclusions References
Tables Figures
J I
J I
Back Close
Full Screen / Esc
Printer-friendly Version
Interactive Discussion
Discussion
Paper
|D
iscussionP
aper|
Discussion
Paper
|D
iscussionP
aper|
study shows that conjunctive water management of groundwater and surface waterresources is the necessary to mitigate the impacts of droughts.
1 Introduction
Global climate change is one of the serious environmental challenges which the worldis facing this century (IPCC, 2013). It is related to systematic changes of the entire5
world’s weather and climate patterns beyond the natural variability limits, and increaseddroughts are among the consequences. Drought is a natural phenomenon that maycause serious social, economical and environmental damages, in particular in areaswhere the water resources are already highly utilised. A number of different reactiveand proactive measures on regional or national scale can be used to reduce its impacts.10
These measures include: the use of resilience buildings of rain fed farming system forwater harvesting for supplement irrigation in semi-arid regions (Rockström, 2003); theuse of groundwater, use of storages in mountain rivers where precipitation is higher,and the construction of water distribution and water storage systems (MacDonald,2007); and the artificial groundwater recharge with excess water form wet periods15
and reuse of treated wastewater (Zhou et al., 2011). Along the same lines, Pavelicet al. (2012) proposes to capture the peak flow (surplus of water) during the wet seasonand recharge shallow alluvial aquifers in a distributed manner upstream of the floodprone areas.
The Incomati river catchment is a transboundary river catchment located in20
the south-eastern part of Africa which flows through South Africa, Swazilandand Mozambique and discharges into the Indian Ocean. The river catchment ischaracterised as a semi-arid climate subject to hydrological extremes: severe droughtsand floods. The Crocodile River is one of the most important tributaries of Incomati. Inthe Crocodile catchment, data and knowledge are limited regarding the groundwater25
resources and its potential for use during the drought period. One of the first attemptsto provide maps of sustainable groundwater harvest potential (GHP) was by Baron
2721
HESSD11, 2719–2757, 2014
Groundwater as anemergency source for
drought mitigation,South Africa
F. E. F. Mussá et al.
Title Page
Abstract Introduction
Conclusions References
Tables Figures
J I
J I
Back Close
Full Screen / Esc
Printer-friendly Version
Interactive Discussion
Discussion
Paper
|D
iscussionP
aper|
Discussion
Paper
|D
iscussionP
aper|
et al. (1998), which was based on hydrogeological maps developed by Vegter (1995).The GHP maps cover the whole South Africa and provide a first estimate of themaximum mean annual amount of water that can be abstracted from groundwaterwithout depleting the aquifers. However, the use of these maps for local groundwatermanagement planning is limited due to high uncertainty. The GHP maps were5
updated by Water Systems Management (2001) and DWAF (2006). However, theupdate in the part of the Incomati catchment is largely based on interpolation fromsome experimental data from the surrounding catchments, thus associated with highuncertainty.
Some groundwater studies have been carried out recently in the Incomati catchment.10
Consultec and BKS (2001) quantified groundwater availability in the Incomaticatchment aiming to assess its potential contribution to the total water resources ofthe catchment. Mauritius et al. (2010) made a groundwater potential assessment studyfor the whole Incomati catchment based on the aquifer classifications suggested by(DWAF, 2006). Their study produced maps of the Incomati groundwater availability (in15
terms of low, medium or high water availability) and the average well yield of Incomati,without distinction between wet and dry periods. Some groundwater studies have beendone in the Kruger National Park, a conservation area partly located in the LowerCrocodile (Fundisi et al., 2012; Niekerk et al., 2012; Fischer et al., 2010, 2009; Leylandet al., 2008). So far, many of the groundwater potential assessment studies were20
performed at large scale, but no groundwater potential assessment study has beencarried out in the Crocodile River catchment.
Due to the intense agricultural activity, the Crocodile River catchment is highly waterstressed. The surface water is insufficient to meet the demands especially duringdrought periods. Small scale farmers are the most vulnerable and affected by drought25
hazards. The downstream country Mozambique is also highly affected when droughtsoccur in this catchment because of reduced transboundary flows (van der Zaag andVaz, 2003). In order to mitigate and manage water shortage during droughts, measuresare being taken on the catchment scale. These measures include water transfer from
2722
HESSD11, 2719–2757, 2014
Groundwater as anemergency source for
drought mitigation,South Africa
F. E. F. Mussá et al.
Title Page
Abstract Introduction
Conclusions References
Tables Figures
J I
J I
Back Close
Full Screen / Esc
Printer-friendly Version
Interactive Discussion
Discussion
Paper
|D
iscussionP
aper|
Discussion
Paper
|D
iscussionP
aper|
adjacent catchments (Sabie and Komati) into the Crocodile river catchment, storage inreservoirs, water restrictions to avoid system failure and simple management modelsare being setup to quantify the risks (Mauritius et al., 2010). Although groundwateris used locally, it is not a main component of the actual drought mitigation andmanagement plan. However, groundwater has been considered as a potential source5
to mitigate the impact of droughts and help to meet future increased water demand inthe region (DWA, 2013).
Given the vulnerability of the Crocodile catchment to climate change, the necessityin further expanding agricultural activities and lack of knowledge on groundwateravailability in drought periods, research on drought and the feasibility of using10
groundwater as an emergency source to mitigate its impacts is of great importance.The specific objectives of this study are: (i) classifying spatially the meteorologicaland hydrological droughts in terms of intensity and severity, (ii) assessing the wateravailability vs. demand in the catchment during the drought periods, and (iii) formulatingdrought mitigation strategies by assessing the groundwater availability during drought15
periods.
2 Material and methods
2.1 Study area
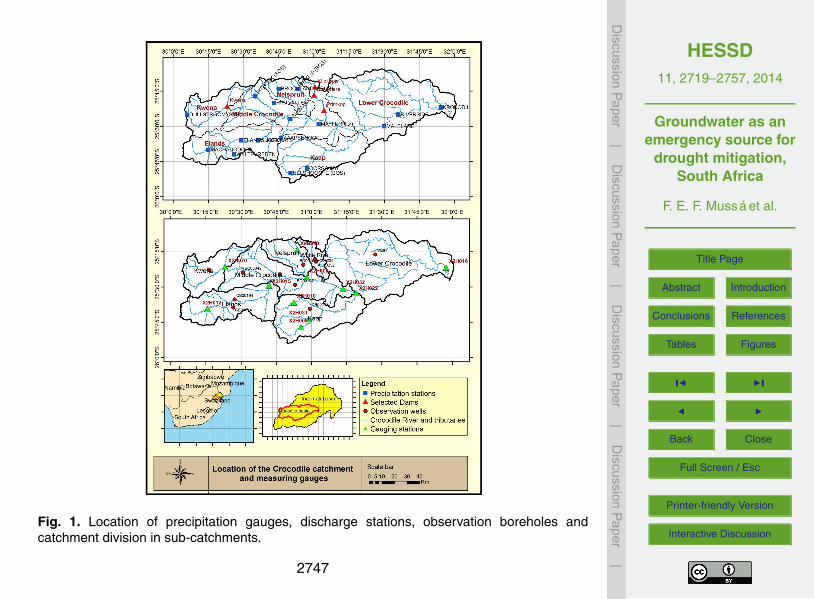
The Crocodile River catchment has an area of around 10 446 km2 and presentsa wide range of elevation varying from around 2030 m in the most upstream part and20
gradually decreasing to 140 m at the outlet (Fig. 1). The main economic activities in thecatchment are agriculture and forestry, with urban development and mining activitiesoccupying a secondary role. According to the Incomati Water Availability AssessmentStudy (DWAF, 2009) the total area of irrigated agriculture and commercial forestry inthe Crocodile catchment was 2452 km2 in 2004 which corresponds to around 61 % of25
the total irrigated area in the whole Incomati catchment.
2723
HESSD11, 2719–2757, 2014
Groundwater as anemergency source for
drought mitigation,South Africa
F. E. F. Mussá et al.
Title Page
Abstract Introduction
Conclusions References
Tables Figures
J I
J I
Back Close
Full Screen / Esc
Printer-friendly Version
Interactive Discussion
Discussion
Paper
|D
iscussionP
aper|
Discussion
Paper
|D
iscussionP
aper|
The catchment is characterised by semi-arid climate with an annual rainfall andpotential evaporation of 850 and 1380 mmyr−1, respectively. The precipitation is highlyseasonal; more than 80 % of the annual rainfall falls during the summer half-yearOctober–March. The precipitation also varies over the catchment, is higher in themiddle part of the catchment where there are mountains and lower in the upstream and5
downstream regions. Potential evaporation decreases from downstream (low altitudes)to upstream (high altitudes).
The geology of the Crocodile catchment is complex. Around 60 % of the totalarea (in the middle and lower regions) consists mainly of granite and gneiss. It ischaracterized in the south by sedimentary rocks (such as arenite) and volcanic rocks10
(mainly lavas) of the Barberton sequence. In the west it is composed of a complexmixture of sedimentary rocks (such as arenite and shale), volcanic (mainly andesite)and dolomitic rocks of the Transvaal sequence. In the east it contains a very small areaof sedimentary rocks (such as shale) and volcanic rocks (mainly basalt and rhyolite) ofthe Karoo sequence. The aquifers of the Crocodile catchment are mostly consisted of15
regolith materials.
2.2 Data sets
Lynch (2003) developed a rainfall database of the South African region with datastarting from around 1900 and ending in 2001. The database consists of daily in-filled precipitation records and data quality control gathered from the three main20
custodians of rainfall data in South Africa which include: SAWS (South Africa WeatherService), SASRI (South Africa Sugarcane Research Institution) and ARC (AgriculturalResearch Council). Additionally, a large number of municipalities, private companiesand individuals in South Africa also contributed with rainfall data to the database. Lynch(2003) computed for each station the percentage of reliability, which represents the25
percentage of observed or original data of the time series.Data from this database was used and from 2001 onwards, data provided only by
SAWS was used. 17 precipitation stations with high percentage of reliability (Table 1)2724

HESSD11, 2719–2757, 2014
Groundwater as anemergency source for
drought mitigation,South Africa
F. E. F. Mussá et al.
Title Page
Abstract Introduction
Conclusions References
Tables Figures
J I
J I
Back Close
Full Screen / Esc
Printer-friendly Version
Interactive Discussion
Discussion
Paper
|D
iscussionP
aper|
Discussion
Paper
|D
iscussionP
aper|
and a good spatial variability (Fig. 1) were selected. The time cover for reliable datacorresponds to the period of 1940 to 2011. Similarly, 11 gauging stations of riverdischarges were selected based on the length of the time series (at least 30 year ofdata), gaps on the time series (Table 1) and spatial variability of the stations (Fig. 1).
The Crocodile catchment has around 320 groundwater wells operated by DWA.5
Around 25 % of the wells do not have any water level measurement. Furthermore, thereis only one water level measurement per year in almost all the wells. Only a few wellshave time series of water levels which covers the period from 2000 onwards. Moreover,not many wells have water level measurements in the severe drought periods and theLower Crocodile is even scarcer in terms of wells and well data. Thus, only 10 wells10
with water level measurements during drought periods were available for the modelcalibration (Fig. 1).
A land use map was acquired from the Department of Water Affairs (DWA) inSouth Africa. Reference evapotranspiration data for each sub-catchment was obtainedfrom the DWA study (DWAF, 2009). Topography data consists of 90×90 m2 Digital15
Elevation Model (DEM) of Shuttle Radar Topography Mission (SRTM) from NASA.Hydrogeological characteristics were obtained from a simplified hydrogeological mapfrom the Council of Geosciences of South Africa (see Fig. 1). Aquifer parameterssuch as layers thickness and hydraulic conductivity are those presented in the WaterResources of South Africa study (WRC, 2005). Due to the lack of data, the values of20
specific yield were assigned to the geological formations based on general knowledgeavailable in literature, for instance, (Nonner, 2010).
2.3 Methods
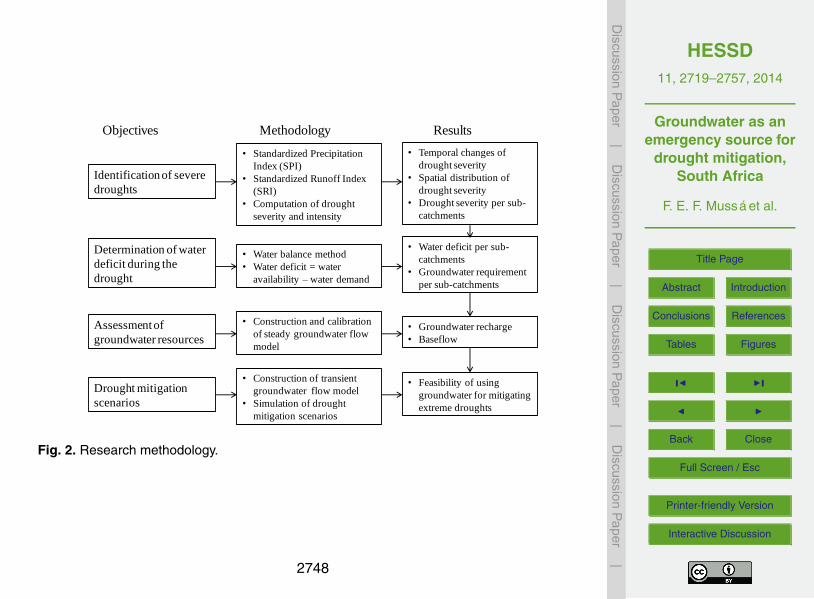
An overview of the methodology used in this study is presented in Fig. 2. Themethodology consists of drought classification, water deficit assessment during25
drought periods, and groundwater modelling for analysing groundwater potential fordrought mitigation.
2725
HESSD11, 2719–2757, 2014
Groundwater as anemergency source for
drought mitigation,South Africa
F. E. F. Mussá et al.
Title Page
Abstract Introduction
Conclusions References
Tables Figures
J I
J I
Back Close
Full Screen / Esc
Printer-friendly Version
Interactive Discussion
Discussion
Paper
|D
iscussionP
aper|
Discussion
Paper
|D
iscussionP
aper|
2.3.1 Drought classification
Droughts can be defined as “a decrease of water availability to substantially below thenormal condition for a certain place and time” (Loucks and Beek, 2005) and are usuallyclassified as meteorological, hydrological and agricultural droughts. In this research,we focus on meteorological and hydrological droughts. Several drought indices can5
be used to identify droughts (Werick et al., 1994; Baykan and Özçelik, 2006; Palmer,1965, 1968; Willeke, 1994; McKee et al., 1993; Shukla and Wood, 2008). Furthermore,droughts can be classified according to its duration, severity and intensity. Droughtduration is the time during which a drought index remains below a certain critical value,whereas drought severity represented as the cumulative of a drought index below10
a critical value within the drought duration and drought intensity as the average ofthe drought index over the drought duration (Mishra and Singh, 2010). Comparisonof the advantages, disadvantages and applicability of the various drought indices hasbeen reported in the literature (Loucks and Beek, 2005; Zargar et al., 2011; Mishra andSingh, 2010; Guttman, 1998; Sims et al., 2002). In this study, we applied the commonly15
used Standardized Precipitation Index (SPI) (McKee et al., 1993) and StandardizedRunoff Index (SRI) (Shukla and Wood, 2008) to analyse meteorological droughts andhydrological droughts, respectively. Both SPI and SRI can be expressed on differenttime scales, e.g. 3, 6 and 12 months. Table 2 shows how an event can be classifiedaccording to the SPI and SRI values.20
First, we calculated SPI for 17 precipitation stations and SRI for 12 discharge stationsfor the period from 1940 to 2011. Then, for each severe drought with SPI or SRIvalues of −1.5 or below, we determined severity and intensity of both meteorologicaland hydrological droughts. A threshold value of −1 (SPI or SRI) was used to definea drought event (beginning and ending of a drought).25
From the drought severity calculated for each rainfall station, we derivedaverage severity of meteorological drought for each sub-catchment based on theThiessen polygons method. The hydrological drought severity for each sub-catchment
2726
HESSD11, 2719–2757, 2014
Groundwater as anemergency source for
drought mitigation,South Africa
F. E. F. Mussá et al.
Title Page
Abstract Introduction
Conclusions References
Tables Figures
J I
J I
Back Close
Full Screen / Esc
Printer-friendly Version
Interactive Discussion
Discussion
Paper
|D
iscussionP
aper|
Discussion
Paper
|D
iscussionP
aper|
corresponds to the drought severity of the discharge station at the outlet of that sub-catchment.
Furthermore, the most severe drought was selected to show the variability of thedrought severity and intensity over the catchment. For this drought, the drought severityand intensity was determined for each precipitation station. Kriging interpolation5
(Matheron, 1963) was used to produce the meteorological drought severity contourmap over the catchment.
2.3.2 Water deficit during drought period
For the water deficit computation, the catchment was divided into 7 main sub-catchments (see Fig. 1). Then, the water deficit per sub-catchment was computed as10
the water availability minus the water requirements. The water deficit was computed forthe most severe drought occurred during 1940 to 2011. Therefore, the water availabilitywas considered to be the natural flow of the river computed by DWAF (2009) minus thestream flow reduction due to the forestry area presented by the same study.
The main water uses in the Crocodile catchment include irrigation, domestic and15
industrial supply, and a minimum transboundary flow, which is the agreed minimumdischarge that has to be released to the Mozambican territory. Irrigation constitutes theprincipal water demand. Domestic and industrial water requirements were obtainedfrom the DWAF (2009) study and the minimum transboundary flow of 0.9 m3 s−1 wasobtained from the Water Use Agreement signed between Mozambique, Swaziland and20
South Africa (TPTC, 2002). Irrigation water requirements were computed based on theFAO’s recommendations (FAO, 1997). The effective precipitation, i.e. the precipitationavailable in the soil for the plants, is one of the necessary components for theirrigation water requirements computation. We computed the effective precipitationbased on a fixed percentage approach (Smith, 1988). It consists of determining the25
80 % probable rainfall (P80) and correcting for possible outfluxes due to runoff andpercolation. As the main focus of this paper is to compute the irrigation requirements for
2727

HESSD11, 2719–2757, 2014
Groundwater as anemergency source for
drought mitigation,South Africa
F. E. F. Mussá et al.
Title Page
Abstract Introduction
Conclusions References
Tables Figures
J I
J I
Back Close
Full Screen / Esc
Printer-friendly Version
Interactive Discussion
Discussion
Paper
|D
iscussionP
aper|
Discussion
Paper
|D
iscussionP
aper|
the worst drought, instead of using the P80, the average observed precipitation duringthe drought period was used which is close to the P70.
2.3.3 Groundwater modelling to develop a drought mitigation strategy
A numerical groundwater model was constructed to assess groundwater potentialduring the drought period and to simulate the impacts of groundwater abstraction on5
the storage, water levels and base flow reduction in the river. The most severe droughtobserved within the study period was selected. The groundwater model is based on thewidely used modelling software MODFLOW (McDonald and Harbaugh, 1983). First,a steady state model was constructed, with the objective of determining the initialconditions for the transient model. Second, a simplified transient natural model was10
built with recharge on a monthly scale representing the average monthly recharge forthe drought period. The model consists of one layer representing the weathered andfractured rocks. A model grid cell of 1×1 km2 was selected, in line with the coursespatial data sets available. The river catchment boundary was defined as the modelboundary, given the fact that the shallow groundwater flow is mainly discharged to the15
rivers in the catchment.Initial values of the recharge to the groundwater from the sub-catchments were
computed by using the Thorntwaite water balance model from the US GeologicalSurvey (McCabe and Markstrom, 2007). The water balance model was calibrated usingthe available river discharge data from several sub-catchments.20
The MODFLOW Evaporation package parameters were determined for each sub-catchment. The evaporation surface is the same as surface elevation of the catchment.An extinction depth of 5 m, the average root depth of pine and eucalypt trees (Alliance,2002), was assigned for the forestry dominated sub-catchments, namely: Nelpsruit,White River, Elands and Kaap sub-catchments; the depth of 2 m, the average root25
depth of grass roots under semi-arid conditions (Murphy, 2010) was assigned forKwena, Middle Crocodile and Lower Crocodile sub-catchments which are mainlycovered by savannas. The reference evaporation obtained from (DWAF, 2009) study is
2728
HESSD11, 2719–2757, 2014
Groundwater as anemergency source for
drought mitigation,South Africa
F. E. F. Mussá et al.
Title Page
Abstract Introduction
Conclusions References
Tables Figures
J I
J I
Back Close
Full Screen / Esc
Printer-friendly Version
Interactive Discussion
Discussion
Paper
|D
iscussionP
aper|
Discussion
Paper
|D
iscussionP
aper|
assigned as the maximum rate of evaporation. The River package was used to simulategroundwater discharges to rivers as base flow. Finally, the model was calibratedmanually to adjust the groundwater recharge using the available observed groundwaterlevels and the river discharges.
2.4 Scenarios using groundwater as an emergency source5
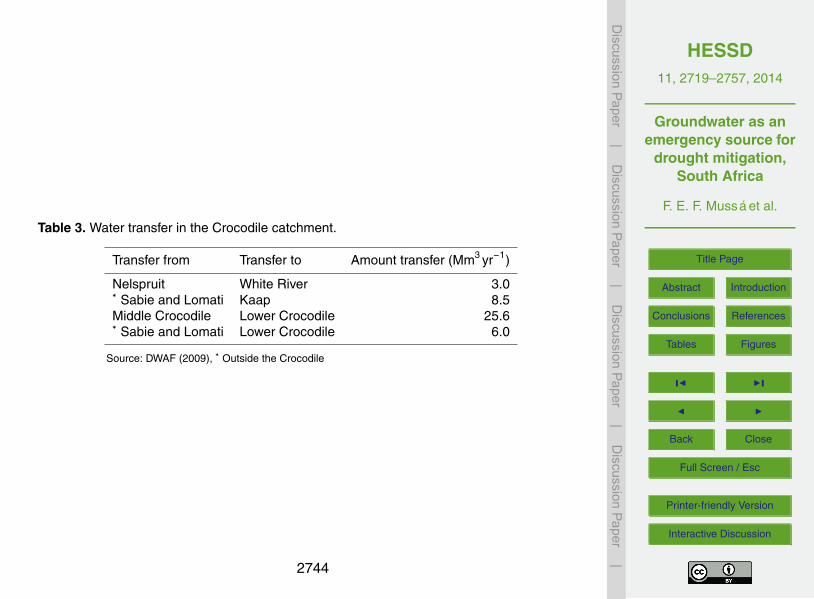
As the objective here is to use the groundwater only as an emergency source, theexisting drought mitigation strategy of the catchment was taken into account for thecomputation of the groundwater abstraction needs. The existing drought mitigationstrategy comprises the storage of surplus water (during the wet season) in damsand water transfers within the catchment and from out of the catchment (Table 3).10
Only the storage of the major dams (storage capacity > 1 Mm3) are considered, whichdrains a large area (> 65 % of the sub-catchment area) were taken into account, Theseareas are Kwena, Klipkopje, Longmere and Primkop dams with full storage capacitiesof 158.9, 11.9, 4.3 and 2 Mm3, respectively.
It was assumed that the surplus water of the wet season will be stored in dams and15
further used in the dry period (useful water surplus – UWS). This useful water surpluswas obtained by subtracting evaporation from the dams from the water surplus andapplying a reduction factor of 0.7 to take into account the losses in the river channel.Thus, for each sub-catchment, the groundwater abstraction need was computed usingequation:20
GWN = WDi −UWS+ Tout − Tin (1)
GWN – groundwater abstraction need (Mm3 yr−1);WDi – initial water deficit (Mm3 yr−1);UWS – useful water surplus (Mm3 yr−1);Tout – transfer out (Mm3 yr−1); and25
Tin – transfer in (Mm3 yr−1).
2729
HESSD11, 2719–2757, 2014
Groundwater as anemergency source for
drought mitigation,South Africa
F. E. F. Mussá et al.
Title Page
Abstract Introduction
Conclusions References
Tables Figures
J I
J I
Back Close
Full Screen / Esc
Printer-friendly Version
Interactive Discussion
Discussion
Paper
|D
iscussionP
aper|
Discussion
Paper
|D
iscussionP
aper|
The water to be abstracted from the groundwater per sub-catchment corresponds tothe groundwater abstraction needs. Based on the amount of groundwater abstractionneeds, a number of wells were placed over the sub-catchments based on thetopography, places near cities and irrigation areas were also a target for the welllocations. Rock formations with higher borehole yield were also used as a criterion5
for the well locations; however, in many cases it was not possible to avoid placingwells in low borehole yield regions as these were found to be the most dominantformation in the sub-catchment, for instance, the White River. Then model simulationswere performed to test whether the amounts of water can be abstracted. Finally, foran extremely severe drought, more severe than the most severe drought registered in10
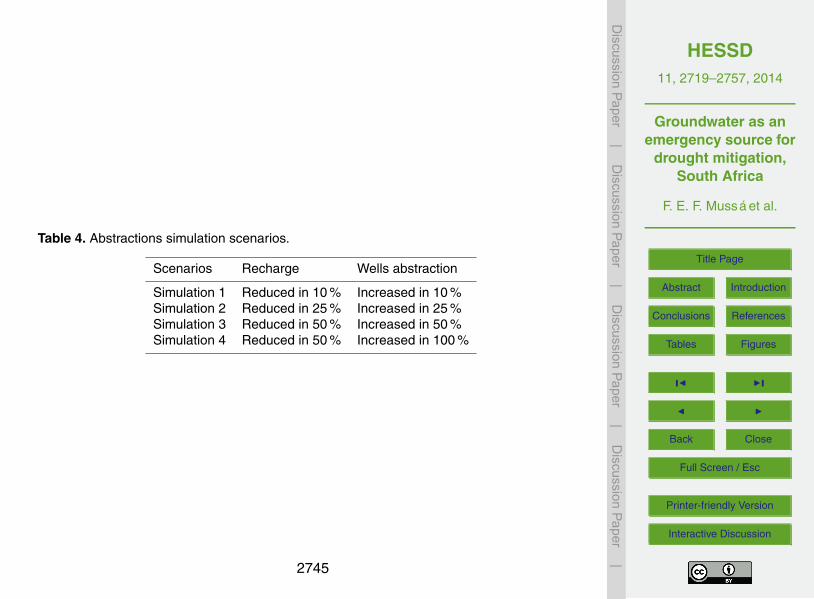
the last 70 year, model simulations were carried out for different scenarios. For sucha severe drought precipitation would be less, consequently recharge would be reducedand water demand would be higher. Therefore, four simulation scenarios (Table 4) wereproposed where baseline recharge (between 1992 and 1995) was reduced and wellabstractions linearly increased. These scenarios of recharge values mimic extremely15
severe drought conditions.
3 Results and discussion
3.1 Results of drought classification
3.1.1 Drought classification over time
The results of the SPI and SRI of 12 month scale indicated that severe droughts20
occurred during 1945, 1951, 1958, 1966, 1970/71, 1978, 1983/84, 1992 to 1995, and2003/04. In other words, in 70 years from 1940 to 2011, 9 severe droughts occurredof which 5 of them occurred before 1975, the middle year of the observations, and 4after 1975. However, the most severe ones occurred after 1975. Results of the drought
2730
HESSD11, 2719–2757, 2014
Groundwater as anemergency source for
drought mitigation,South Africa
F. E. F. Mussá et al.
Title Page
Abstract Introduction
Conclusions References
Tables Figures
J I
J I
Back Close
Full Screen / Esc
Printer-friendly Version
Interactive Discussion
Discussion
Paper
|D
iscussionP
aper|
Discussion
Paper
|D
iscussionP
aper|
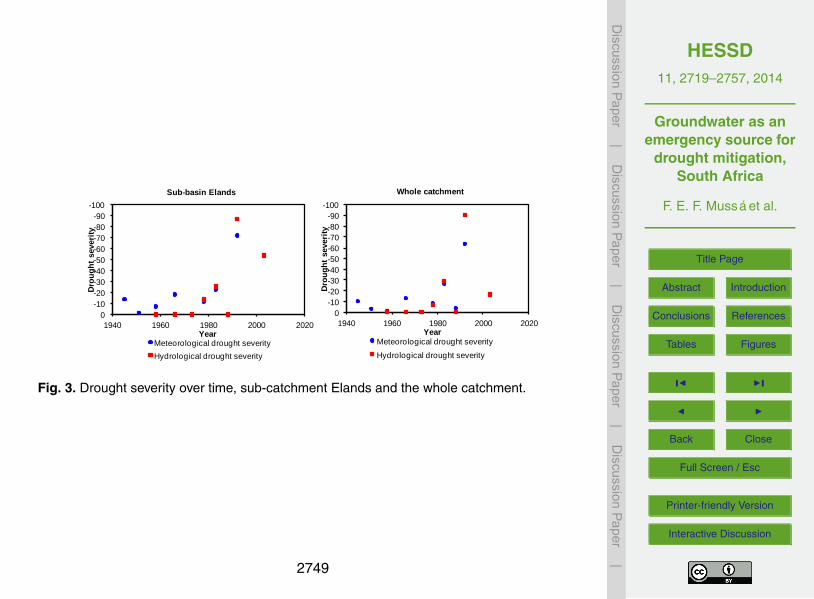
severity for Elands River sub-catchment (station X2H015) and Crocodile catchmentoutlet (X2H016) are shown in Fig. 3 as examples.
The most severe droughts occurred in 1983, from 1992 to 1995 and in 2003/04.These droughts were also noticed in most of South Africa and neighbouringcountries. The most severe one was the 1992–1995 drought, it lasted for around 45
consecutive years with severity of −90 and intensity of −2.02 on the hydrologicaldrought and severity of −65 and intensity of −1.67 on the meteorological drought(Fig. 3). This drought can be classified as severely dry as a meteorological droughtand extremely dry as a hydrological drought. It appears from the graphs that theseverity of meteorological drought (SPI) used to be higher than the severity of the10
hydrological drought (SRI) before 1975. But after 1975 the hydrological drought severityis higher than the meteorological drought severity. This can be explained by theincreasing abstractions of water from the rivers for agricultural, domestic and industrialconsumption.
3.1.2 Drought classification over the catchment15
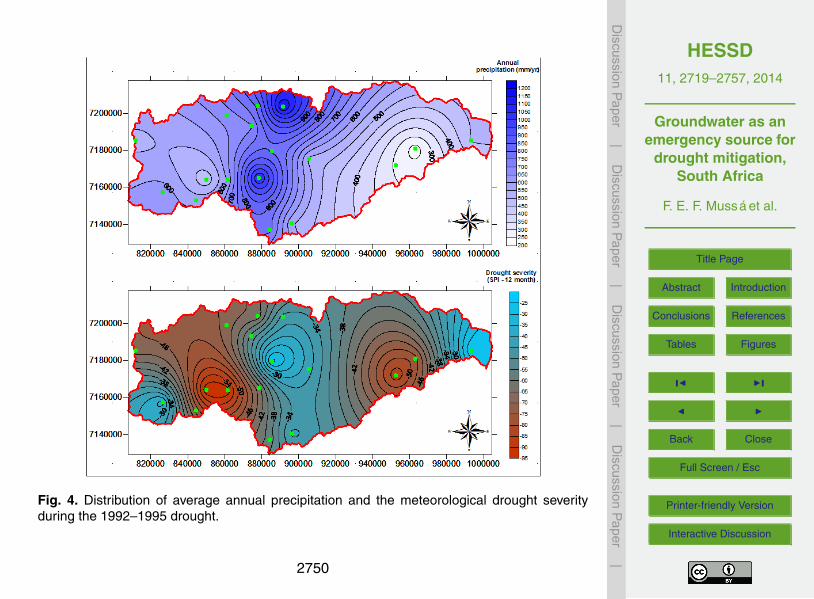
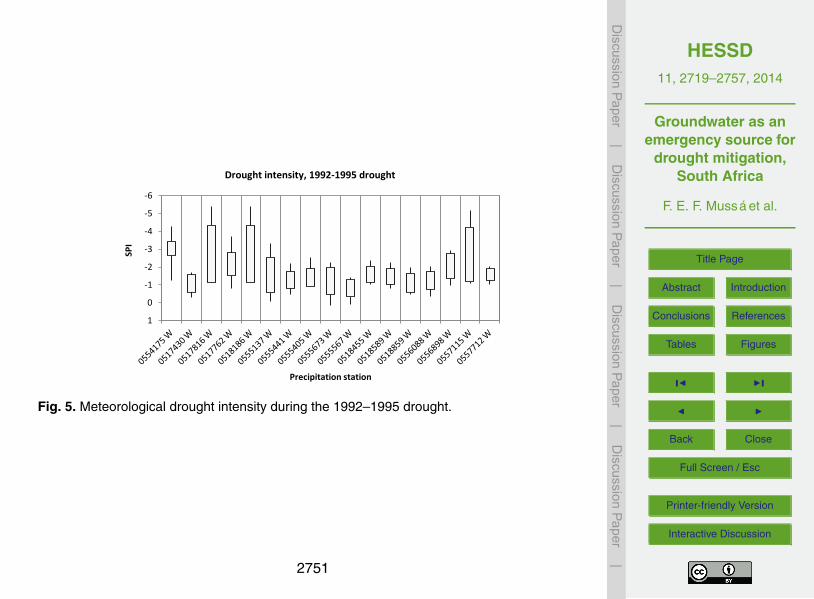
Figure 4 presents the 1992–1995 meteorological drought severity over the Crocodilecatchment. Figure 5 shows the variability of the drought index (SPI) during the droughtduration over the catchment. The plot shows for each station the minimum, maximum,standard deviation and average SPI (drought intensity) during 1992–1995.
The meteorological drought severity follows more or less the same pattern as20
the precipitation (see Fig. 4), where more severe droughts occur in the upstreamand downstream areas of the catchment while the middle part of the catchmentcharacterized by higher precipitation presents low drought severity. Similarly, theupstream and downstream precipitation stations present high variability of the droughtindex reaching very high and very low values of SPI. The maximum value of SPI25
reached in this drought was −5.5 in two stations upstream and one station indownstream. On the other hand, the stations in the middle part of the catchment
2731
HESSD11, 2719–2757, 2014
Groundwater as anemergency source for
drought mitigation,South Africa
F. E. F. Mussá et al.
Title Page
Abstract Introduction
Conclusions References
Tables Figures
J I
J I
Back Close
Full Screen / Esc
Printer-friendly Version
Interactive Discussion
Discussion
Paper
|D
iscussionP
aper|
Discussion
Paper
|D
iscussionP
aper|
present less variability of SPI during the drought duration where the maximum value ofSPI was around −2.5.
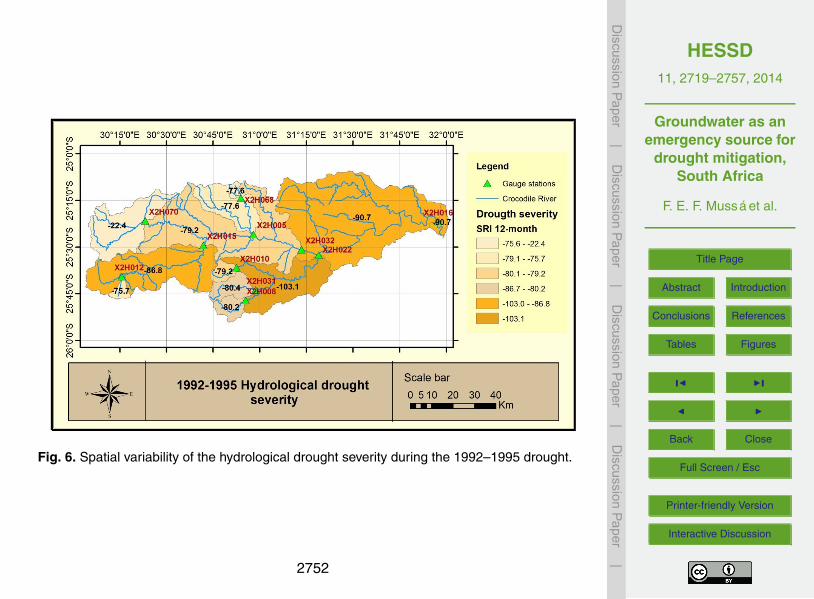
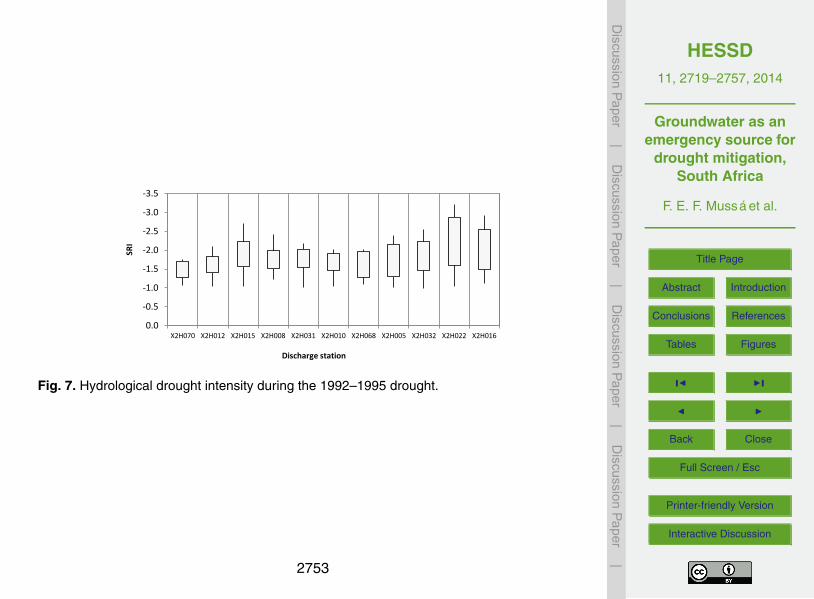
The variation of the hydrological drought severity for each sub-catchment is shownin Fig. 6. Figure 7 shows the variability of the hydrological drought index during thedrought duration over the entire catchment; it follows the same spatial pattern of5
variation as for the meteorological drought intensity presented in Fig. 4.The hydrological drought severity does not depend only on amount of rainfall; it was
also affected by the amount of water that was abstracted from the river. Therefore,sub-catchments with less rainfall and high water requirements are the most affectedby droughts. For instance, the Kaap catchment (gauging station X2H022) and the10
Lower Crocodile catchments (gauging station X2H016), which are located in low rainfallregions and have very high water requirements, are the most vulnerable to droughtsand present high drought severity, −90.7 and −103.1 for the Lower Crocodile and Kaap,respectively. On the other hand, the Kwena sub-catchment is the less affected by thehydrological drought, the hydrological drought severity is around −22.4. It has less15
water requirements, in addition its discharge station (X2H070) is located downstreamof the major dam of the Crocodile River (the Kwena dam). Therefore, the dam’soperation to keep the flows in regulated levels together with the low water requirementscontributes significantly to its low vulnerability to droughts.
The drought severity on the other small upstream catchments, such as stations20
X2H012, X2H008, X2H068 are more dependent on precipitation. On the other hand,the severity on the downstream stations which drain bigger areas (X2H015, X2H022,X2H016) are not only dependent on precipitation, they are highly affected by theincreased water abstraction from the river for irrigation, domestic and industrial use,thus presenting very high values of hydrological drought severity. Accordingly, the most25
upstream discharge stations have less variability on the SRI, and the downstreamstations present high variability of SRI and higher drought intensity. The maximum SRIreached by the most upstream sub-catchments is −2.1 and the maximum SRI reached
2732

HESSD11, 2719–2757, 2014
Groundwater as anemergency source for
drought mitigation,South Africa
F. E. F. Mussá et al.
Title Page
Abstract Introduction
Conclusions References
Tables Figures
J I
J I
Back Close
Full Screen / Esc
Printer-friendly Version
Interactive Discussion
Discussion
Paper
|D
iscussionP
aper|
Discussion
Paper
|D
iscussionP
aper|
by the downstream stations is −3.2. It seems like the sub-catchment water transfersdoes not influence much on the drought severity.
3.2 Water deficit during drought periods
3.2.1 Water deficit
Water deficit was computed for the most severe drought period 1992/95. The total5
irrigated area in the Crocodile River catchment is 466.5 km2 which correspond toaround 4.5 % of the catchment. The main crops are the sugarcane, vegetables andcitrus occupying about 44, 31 and 20 % of the total irrigated area, respectively. Theremaining 5 % is occupied by maize which is mostly cultivated in the upper region.Results of the irrigation water requirements per sub-catchment are presented in10
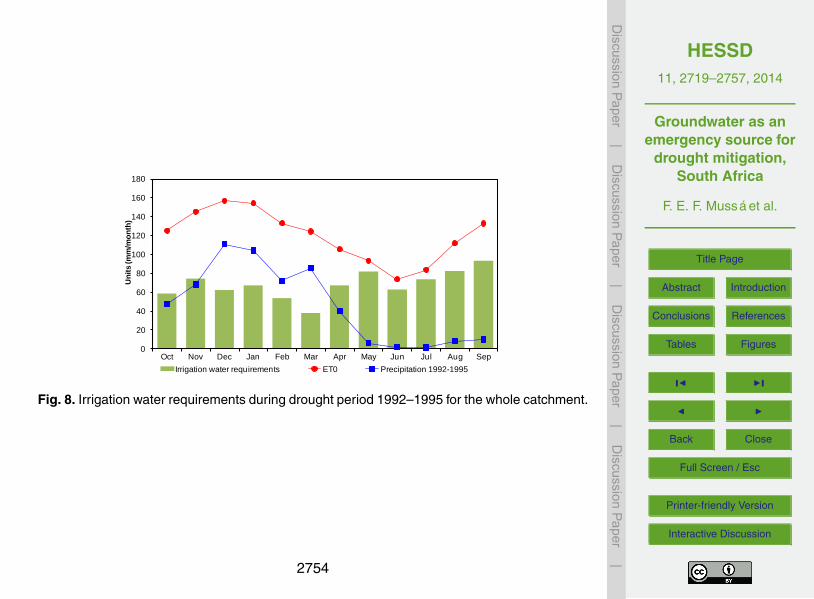
Table 5. The sub-catchment which presents the highest demand in terms of irrigationis the Lower Crocodile; it demands around 50 % of the total irrigation requirementsin the catchment and it is part of the driest area of the catchment. The variation ofthe irrigation water demand over the year (Fig. 8) does not change according to theseason, as it depends on many factors, mainly precipitation, evaporation and crop type.15
The crop factor varies with the crop type, cropping pattern and plant development,for instance, the vegetables are only planted in winter (between March and August)thus requiring water only in this period, while sugar cane exists in the whole yearbut requires more water during the hot season. Therefore, there is no correlation withevaporation or temperature for the total irrigation water demands. However, it can be20
noted that despite the low evaporation between April and September, the averageirrigation water requirement during this period is slightly higher than the irrigationaverage water requirement during October and March. This is mainly due to the lowprecipitation in this period that coincides with the low temperature season.
The annual domestic and industrial water requirements in the Crocodile catchment25
are 95 and 22.4 Mm3 yr−1, respectively, (DWAF, 2009). The Water Use Agreement(TPTC, 2002) signed between Mozambique, South Africa and Swaziland stipulated
2733
HESSD11, 2719–2757, 2014
Groundwater as anemergency source for
drought mitigation,South Africa
F. E. F. Mussá et al.
Title Page
Abstract Introduction
Conclusions References
Tables Figures
J I
J I
Back Close
Full Screen / Esc
Printer-friendly Version
Interactive Discussion
Discussion
Paper
|D
iscussionP
aper|
Discussion
Paper
|D
iscussionP
aper|
that the Incomati River should maintain a minimum flow of 2.6 m3 s−1 average ofa 3 days period in Ressano Garcia (in Mozambique). Thus, they recommended thata minimum of 1.2 m3 s−1 should be maintained by the Crocodile River and 1.4 m3 s−1
should be maintained by the Komati River system. The annual water requirementsfor domestic and industrial supply were distributed equally per month and per sub-5
catchment. The transboundary flow requirement was distributed per sub-catchmentbased on the percent distribution of annual discharge of each sub-catchment andfurther distributed equally per month.
Results of the water deficit computation (Table 5) show that the most stressed sub-catchments are those located in the downstream area where precipitation is lower,10
evapotranspiration is higher and have higher irrigation water demand. The uppercatchments Kwena and Elands did not present any water deficit in this period due tolow water requirements. The total water deficit of the catchment, in the drought period,is estimated to be to 159.8 Mm3 yr−1.
3.2.2 Groundwater abstraction needs15
A water surplus in the wet season of around 57.1 Mm3 yr−1 was obtained for theKwena and White River catchments. Results show that, the use of the existing droughtmitigation plan (see Table 3), roughly, would reduce the water deficit from 159.8 to97 Mm3, a reduction of 40 %. This shows the critical importance of using an additionalsource of water to cope with this hazard – a key role that groundwater resources could20
play. The groundwater requirements for combating drought are listed in Table 5.
3.3 Results of groundwater modelling
Steady-state model application
The calibration of the steady groundwater flow model resulted in a good agreementbetween measured and computed groundwater levels with R2 of 0.96 and Nash25
2734
HESSD11, 2719–2757, 2014
Groundwater as anemergency source for
drought mitigation,South Africa
F. E. F. Mussá et al.
Title Page
Abstract Introduction
Conclusions References
Tables Figures
J I
J I
Back Close
Full Screen / Esc
Printer-friendly Version
Interactive Discussion
Discussion
Paper
|D
iscussionP
aper|
Discussion
Paper
|D
iscussionP
aper|
Sutcliffe efficiency of 0.97. The simulated base flow per sub-catchment fits theobserved base flow. The net recharge represents the actual recharge; it is the rechargefrom precipitation plus the river leakage into the groundwater storage minus theevaporation from the groundwater storage. During the drought period the total netrecharge for the whole catchment was found to be 529 Mm3 yr−1 which correspond to5
50 mmyr−1, around 8 % of the total annual precipitation during the drought. Accordingto the groundwater study which covers the Crocodile area (WRC, 2005), the long termannual average recharge in the Crocodile catchment is around 77.9 mmyr−1 whichcorrespond to 9 % of the long-term average rainfall in the region. Thus, the percentageof recharge from precipitation of this research and the (WRC, 2005) study are very10
close. The difference between simulated and observed flows is on average 0.1 %, andvaries between −0.2 and 1.4 %.
The calculated groundwater level contour lines generally follow the topography of thecatchment. Groundwater level is deeper in the high mountains within the catchmentand shallower in plane areas as the downstream region. The river is mainly fed by the15
aquifer, only in few areas as in the higher mountains the aquifer is fed by the river.Water budget results show that the principal input of water in the groundwater storageis the recharge from precipitation (479.52 Mm3 yr−1). Evaporation from the groundwaterstorage (120.26 Mm3 yr−1) is low compared to the recharge given the fact that thegroundwater table is deep (> 5 m) in many parts of the catchment.20
4 Feasibility of using groundwater as an emergency source
4.1 Use of groundwater in a drought period (1992–1995 drought)
Transient abstraction simulations were performed by assigning well abstraction ratesequal to the groundwater abstraction needs per sub-catchment listed in Table 5.Results show that if 97 Mm3 of water is abstracted per year, then river base flow for25
the whole catchment would reduce only by 3.1 % (16.51 Mm3 yr−1), meaning that it
2735
HESSD11, 2719–2757, 2014
Groundwater as anemergency source for
drought mitigation,South Africa
F. E. F. Mussá et al.
Title Page
Abstract Introduction
Conclusions References
Tables Figures
J I
J I
Back Close
Full Screen / Esc
Printer-friendly Version
Interactive Discussion
Discussion
Paper
|D
iscussionP
aper|
Discussion
Paper
|D
iscussionP
aper|
is possible to use the groundwater as an emergency source for drought mitigation.However, looking at the results in a sub-catchment scale, the most affected sub-catchments in terms of reduction of base flow, as expected, are the drier sub-catchments: White River, Kaap and Lower Crocodile. The most affected is the WhiteRiver with a base flow reduction of 18 %. The other catchments present a base flow5
reduction of around 8 %. However, it is still feasible to abstract water in these sub-catchments. The groundwater levels in Kwena and Elands sub-catchments do notchange because there are no abstractions in these sub-catchments while a maximumwater table drawdown of around 4 m can be observed in the other catchments wherethere are abstractions, except for White River catchment where drawdown reaches10
values of around 20 m.
4.2 Use of groundwater in case of extremely severe drought
Four scenarios of using groundwater in case of extremely severe drought proposedin Table 4 were simulated with the transient groundwater flow model, a model whererecharge varies seasonally. The simulation period was 3 years with monthly stress15
period considering the longest consecutive drought in the history (1992–1995 drought).Model simulation results were analysed for the maximum drawdown and reductionof base flow and compared the natural groundwater flow model, a model whereabstraction wells are not taken into account. For the simulation scenario 1, the baseflow reduction is low, it varies between 2.4 to 8.6 % for the sub-catchments, except in20
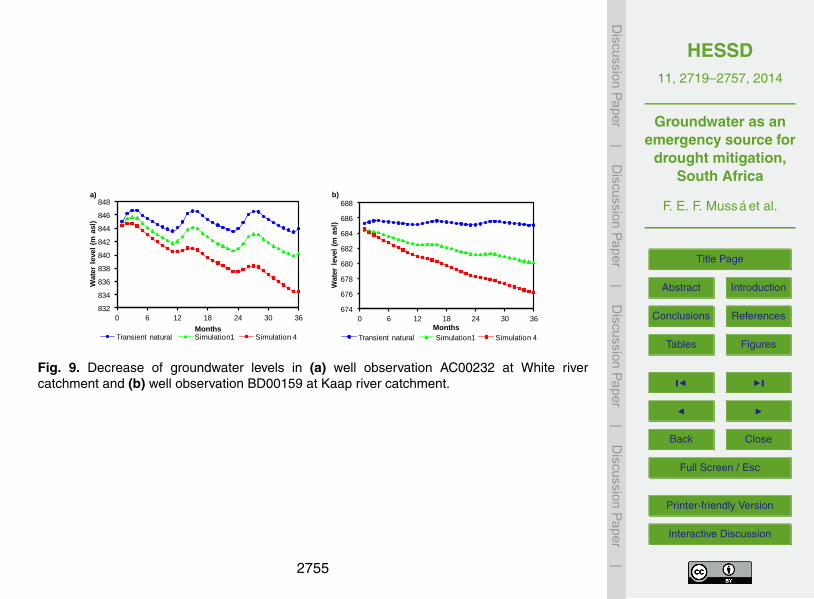
White River where base flow reduction is around 18 %. In the most extreme situation ofsimulation scenario 4, base flow reduction is higher: 12.2, 12.5, 20.1, 11.3 and 21.1 %in Kwena, Elands, Kaap, Middle Crocodile and Lower Crocodile, respectively. And evenmuch higher in the White River and Nelspruit sub-catchments where the base flowreduction is 28.8 and 58.6 %, respectively. Figure 9 shows the decrease of groundwater25
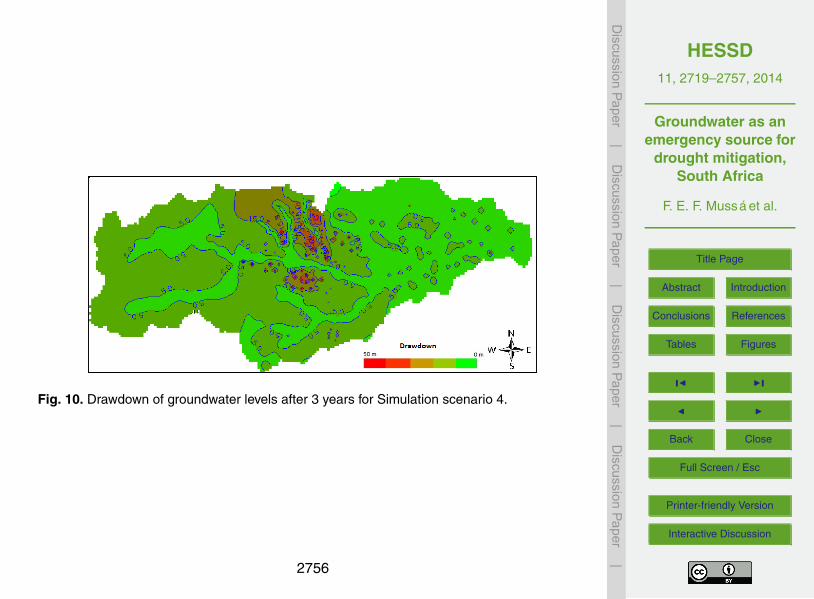
levels for the observation wells located in White River and Kaap catchments asexamples. A maximum drawdown of 1.2, 3.5 and 10 m was observed after 3 yearsin Kwena, Elands and Kaap sub-catchments, respectively, in the simulation scenario 4
2736
HESSD11, 2719–2757, 2014
Groundwater as anemergency source for
drought mitigation,South Africa
F. E. F. Mussá et al.
Title Page
Abstract Introduction
Conclusions References
Tables Figures
J I
J I
Back Close
Full Screen / Esc
Printer-friendly Version
Interactive Discussion
Discussion
Paper
|D
iscussionP
aper|
Discussion
Paper
|D
iscussionP
aper|
(see Fig. 10). However, in sub-catchments White River and Nelspruit the drawdownsare very high, and the worse case is the White River. The drawdowns reach valuesof 28, 36 and 49 m in simulation scenarios 2, 3 and 4, respectively after 3 year ofabstractions. This happens due to the fact that these two sub-catchments are mainlyconstituted by intergranular and fractured aquifer type with low permeability. This high5
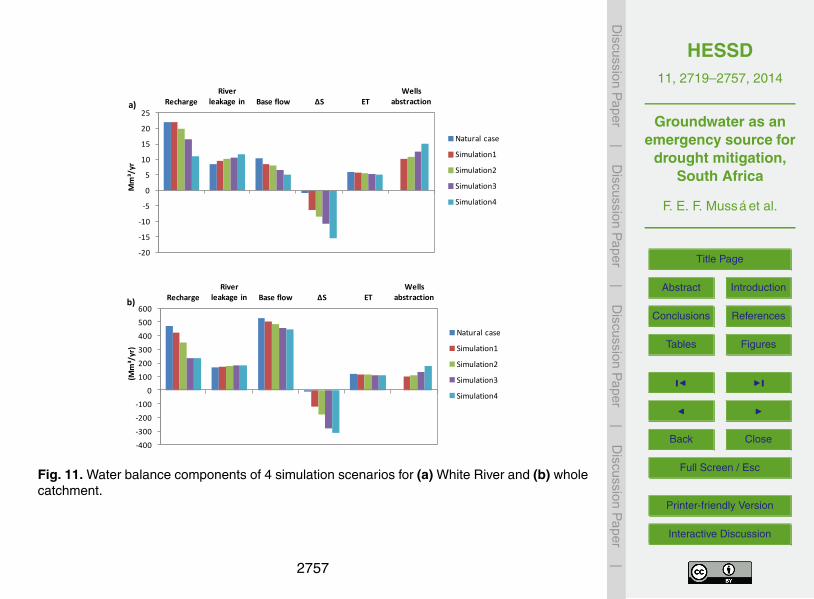
drawdown besides affecting the agricultural activity causes a decrease in the riverflows, thus reducing the water availability to less than 50 % in simulation scenario 4 forthe White River catchment (see Fig. 11). Briefly, results of the abstraction simulationsfor the different scenarios show that in most of the sub-catchments it is possible to usethe groundwater water for drought mitigation in case of extremely severe droughts.10
However, groundwater exploitation in White River and Nelspruit sub-catchments islimited due to very high drawdowns and, consequently, high river flow reduction.
5 Conclusions
Several severe droughts occurred in the Crocodile catchment over more than 70years from 1940 to 2011. In general, it was found that the spatial variability of the15
meteorological drought severity follows the same pattern as the precipitation. Forinstance, the lower and upper catchments characterized by lower precipitation showhigh meteorological drought severity, while the middle catchment characterized byhigh precipitation shows low meteorological drought severity. However, the hydrologicaldrought severity does not follow exactly the same pattern as the metrological drought20
severity, because besides precipitation it is also affected by the human interventionson the catchment. Thus, the hydrological drought severity is higher in the most waterstressed sub-catchments, such as the Kaap and Lower Crocodile and is lower in theless water stressed catchments such as Kwena where the flows are regulated by theKwena dam reducing the severity of droughts. Regarding the drought severity over25
time, it was noted that before 1975’s the meteorological drought severity was higherthan the hydrological drought severity. On the contrary, after 1975’s the hydrological
2737
HESSD11, 2719–2757, 2014
Groundwater as anemergency source for
drought mitigation,South Africa
F. E. F. Mussá et al.
Title Page
Abstract Introduction
Conclusions References
Tables Figures
J I
J I
Back Close
Full Screen / Esc
Printer-friendly Version
Interactive Discussion
Discussion
Paper
|D
iscussionP
aper|
Discussion
Paper
|D
iscussionP
aper|
drought severity is higher than the meteorological drought severity. This shift couldbe due to increased water consumption in the catchment by forestry, irrigation anddomestic use over time.
The water balance study of the catchment shows that the total water deficit duringa severe drought period (such as 1992–1995 drought) amounts up to 159.8 Mm3 yr−1,5
and the most stressed sub-catchments are the Lower Crocodile, Kaap, White River,Nelspruit and Middle Crocodile. Taking into account the existing drought mitigation plan(water storage and inter-basin transfers) this water deficit reduces only by about 40 %to 97 Mm3 yr−1. This shows that it is important to consider the use of groundwater tomitigate the droughts. Groundwater abstraction simulation reveals that it is possible10
to use the groundwater as an emergency source of water to mitigate the droughthazards in the Crocodile River catchment. In general, the Kaap, Middle Crocodile andLower Crocodile sub-catchments are most feasible for groundwater exploitation whilethe groundwater exploitation in Nelspruit and White River catchments is restricted dueto high river flow reduction and high drawdowns.15
This case study demonstrates that conjunctive water management of groundwaterand surface water resources is necessary to mitigate the impacts of droughts. Thisneeds a multi-methods approach including coupled modelling of surface water andgroundwater fluxes, where the detailed geological features of the study area are takeninto account, as well as a long time series of groundwater levels are crucial for the good20
model calibration.
Acknowledgements. We gratefully acknowledge the partial funding for the field researchand paper writing provided through the RISKOMAN and the RISKOMAN-GAM projectsfunded by DGIS/UNESCO-IHE Programmatic Cooperation (DUPC). The additional support forpreparing this manuscript from DEWFORA project which is funded by the Seventh Framework25
Programme for Research and Technological Development (FP7) of the European Union (Grantagreement no: 265454) is also thankfully acknowledged. We are also very grateful to thegroundwater department of DWAF (Department of Water Affairs and Forestry), SAWS (SouthAfrican Weather Service) and ICMA (Incomati Catchment Management Agency) in South Africafor the data provided.30
2738
HESSD11, 2719–2757, 2014
Groundwater as anemergency source for
drought mitigation,South Africa
F. E. F. Mussá et al.
Title Page
Abstract Introduction
Conclusions References
Tables Figures
J I
J I
Back Close
Full Screen / Esc
Printer-friendly Version
Interactive Discussion
Discussion
Paper
|D
iscussionP
aper|
Discussion
Paper
|D
iscussionP
aper|
References
Alliance, T. L.: Longleaf pine root system, available at: http://www.longleafalliance.org/longleaf-pine/physiology/longleaf-pine-roots/?searchterm=pine%20tree, last access:15 December 2012, 2002.
Baron, J., Seward, P., and Seymour, A.: The Groundwater Harvest Potential Map of the Republic5
of South Africa, Department of Water Affairs and Forestry, Pretoria, Gh 3917, 1998.Baykan, N. O. and Özçelik, C.: Management of drought, Water resources management: Risks
and Challenges for the 21st century, E.W. Publications, Turkey, 2006Climate indices: available at: http://icdc.zmaw.de/climate_indices.html?&L=1 (last access:
10 September 2012), 2012.10
DWA: Water Requirements and Availability Reconciliation Strategy for the Mbombela MunicipalArea, Department of Water Affairs, Pretoria, South Africa, 2013.
DWAF: Groundwater Resources Assessment II – Recharge Final Report, Department of WaterAffairs and Forestry, Pretoria, South Africa, 2006.
DWAF: Hydrology of the Crocodile River, PWMA 05/X22/00/1508, Department of Water Affairs15
and Forestry, Pretoria, South Africa, 2009.FAO: FAO Land and Water Bulletin, Rome, 1997.Fischer, S., Witthüser, K., Birke, M., Leyland, R., and Schneider, M.: Regional description of
the groundwater chemistry of the Kruger National Park (KNP) using multivariate statistics,Groundwater Conference 2009, Somerset West, South Africa, 2009.20
Fischer, S., Witthüser, K., Birke, M., Leyland, R., and Schneider, M.: Describing the groundwatersystem of the Kruger National Park (South Africa) on the basis of hydrogeochemical methodsand multivariate statistical algorithms, FH-DGG Tübingen, Schriftenreihe der DeutschenGesellschaft für Geowissenschaften, Germany, 2010..
Fundisi, D., Riddell, E. S., and Lorentz, S. A.: Hydrological Connectivity in Selected Pristine25
Catchments in the Kruger National Park, 16th SANCIAHS National Hydrology SymposiumUniversity of Pretoria, Pretoria, South Africa, 2012.
Guttman, N. B.: Comparing the Palmer Drought Index and the Standardized Precipitation Index,J. Am. Water Resour. As., 34, 113–121, doi:10.1111/j.1752-1688.1998.tb05964.x, 1998.
Leyland, R. C. and Witthüser, K. T.: Regional Description of the Groundwater Chemistry of the30
Kruger National Park, Water Research Commission, Pretoria, South Africa, 2008.
2739

HESSD11, 2719–2757, 2014
Groundwater as anemergency source for
drought mitigation,South Africa
F. E. F. Mussá et al.
Title Page
Abstract Introduction
Conclusions References
Tables Figures
J I
J I
Back Close
Full Screen / Esc
Printer-friendly Version
Interactive Discussion
Discussion
Paper
|D
iscussionP
aper|
Discussion
Paper
|D
iscussionP
aper|
Loucks, D. and Beek, E. v.: Water Resources Systems Planning and Management – anIntroduction to Methods, Models and Aplications, United Nations Educational, Unesco-IHE,Paris, 2005.
Lynch, S. D.: Development of a raster database of annual, monthly and daily rainfallfor Southern Africa, Water Research Commision, Pretoria, South Africa, WRC Report5
1156/1/04, 78 pp., 2003.MacDonald, G. M.: Severe and sustained drought in southern California and the West: present
conditions and insights from the past on causes and impacts, Quatern. Int., 173, 87–100,doi:10.1016/j.quaint.2007.03.012, 2007.
Management, W. S.: Water Resources Situation Assessment: Ground Water Resources of10
South Africa, Department of Water Affairs and Forestry, Pretoria, 2001.Matheron, G.: Principles of geostatistics, Econ. Geol., 58, 1246–1266, 1963.McCabe, G. J. and Markstrom, S. L.: A Monthly Water-Balance Model Driven By a Graphical
User Interface, US Geological Survey open file report 2007-1088, Reston, Virginia, 2007.McDonald, M. G. and Harbaugh, A. W.: A Modular Three-Dimensional Finite Difference15
Groundwater Flow Model, US Geological Survey, Denver, Colorado, 83–875, 1983.McKee, T. B., Doesken, N. J., and Kleist, J.: The relation of drought frequency and duration to
time scales, Eighth Conference on Applied Climatology, Anaheim, California, 1993.Mishra, A. K. and Singh, V. P.: A review of drought concepts, J. Hydrol., 391, 202–216,
doi:10.1016/j.jhydrol.2010.07.012, 2010.20
Murphy, S. R.: Tropical perennial grasses – root depths, growth and water use efficiencyPrimefact, 2010.
Niekerk, A. V., Nel, J., and Riddell, E.: Conceptualizing groundwater distribution over differentspatial and geological scales using electrical resistivity profiles within the Kruger NationalPark, 16th SANCHIAS National Hydrology Symposium University of Pretoria, Pretoria, South25
Africa, 2012.Nonner, J. C.: Introduction to hydrogeology, CRC Press, Taylor and Francis group, Leiden, the
Netherlands, 2010.Palmer, W.: Keeping Track of Crop Moisture Conditions, Nationwide: the New Crop Moisture
Index, Weatherwise 21, 156–161, doi:10.1080/00431672.1968.9932814, 1968.30
Pavelic, P., Srisuk, K., Saraphirom, P., Nadee, S., Pholkern, K., Chusanathas, S., Munyou, S.,Tangsutthinon, T., Intarasut, T., and Smakhtin, V.: Balancing-out floods and droughts:opportunities to utilize floodwater harvesting and groundwater storage for agricultural
2740
HESSD11, 2719–2757, 2014
Groundwater as anemergency source for
drought mitigation,South Africa
F. E. F. Mussá et al.
Title Page
Abstract Introduction
Conclusions References
Tables Figures
J I
J I
Back Close
Full Screen / Esc
Printer-friendly Version
Interactive Discussion
Discussion
Paper
|D
iscussionP
aper|
Discussion
Paper
|D
iscussionP
aper|
development in Thailand, J. Hydrol., 470–471, 55–64, doi:10.1016/j.jhydrol.2012.08.007,2012.
Rockström, J.: Resilience building and water demand management for drought mitigation, Phys.Chem. Earth, 28, 869–877, doi:10.1016/j.pce.2003.08.009, 2003.
Shukla, S. and Wood, A. W.: Use of a standardized runoff index for characterizing hydrologic5
drought, Geophys. Res. Lett., 35, L02405, doi:10.1029/2007gl032487, 2008.Sims, A. P., Niyogi, D. d. S., and Raman, S.: Adopting drought indices for estimating soil
moisture: a North Carolina case study, Geophys. Res. Lett., 29, 24–31, 2002.Tanner, A. and Mauritius, A.: Baseline Evaluation and Scoping Report, Progressive Realisations
of the Incomaputo Agreement (PRIMA), IAAP 3:03C-2010, Moçambique, 2010.10
TPTC: Interim IncoMaputo Water Use Agreement, Tripartite Permanent Technical Committee,South Africa, Mozambique and Swaziland, 2002.
Vegter, J. R.: Groundwater Resources of the Republic of South Africa – Sheet 1 and Sheet 2,Water Res., South Africa, 1995.
Werick, W. J., Willeke, G. E., Guttman, N. B., Hosking, J. R. M., and Wallis, J. R.:15
National drought atlas developed, EOS Trans. Am. Geophys. Union, 75, 89–90,doi:10.1029/94eo00706, 1994.
Willeke, G.: The National Drought Atlas, US Army Corps of Engineers, Water ResourcesSupport Center, Institute for Water Resources, 1994.
WRC: Water Resources of South Africa, K5/1491, Water Research Comission, Pietermar-20
itzburg, 2005.van der Zaag, P. and Vaz, Á. C.: Sharing the Incomati waters: cooperation and competition in
the balance, IWA Publishing 5, 349–368, 2003.Zargar, A., Sadiq, R., Naser, B., and Khan, F. I.: A review of drought indices, Environ. Rev., 19,
333–349, doi:10.1139/a11-013, 2011.25
Zhou, Y., Wang, L., Liu, J., and Ye, C.: Impacts of drought on groundwater depletion in theBeijing Plain, China, in: Climate Change Effects on Groundwater Resources: a GlobalSynthesis of Findings and Recommendations, edited by: Treidel, H., Martin-Bordes, J. L.,and Gurdak, J. J., CRC Press, Hardback, 2011.
2741
HESSD11, 2719–2757, 2014
Groundwater as anemergency source for
drought mitigation,South Africa
F. E. F. Mussá et al.
Title Page
Abstract Introduction
Conclusions References
Tables Figures
J I
J I
Back Close
Full Screen / Esc
Printer-friendly Version
Interactive Discussion
Discussion
Paper
|D
iscussionP
aper|
Discussion
Paper
|D
iscussionP
aper|
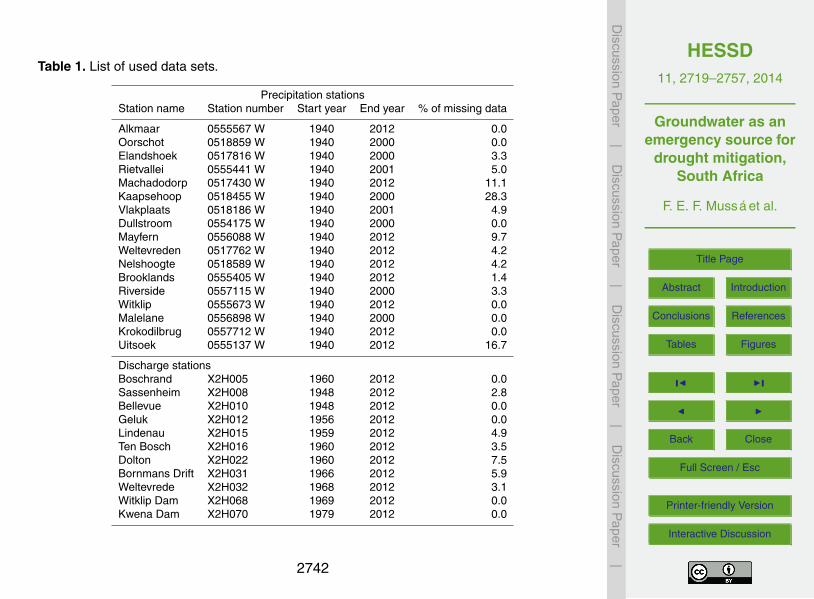
Table 1. List of used data sets.
Precipitation stationsStation name Station number Start year End year % of missing data
Alkmaar 0555567 W 1940 2012 0.0Oorschot 0518859 W 1940 2000 0.0Elandshoek 0517816 W 1940 2000 3.3Rietvallei 0555441 W 1940 2001 5.0Machadodorp 0517430 W 1940 2012 11.1Kaapsehoop 0518455 W 1940 2000 28.3Vlakplaats 0518186 W 1940 2001 4.9Dullstroom 0554175 W 1940 2000 0.0Mayfern 0556088 W 1940 2012 9.7Weltevreden 0517762 W 1940 2012 4.2Nelshoogte 0518589 W 1940 2012 4.2Brooklands 0555405 W 1940 2012 1.4Riverside 0557115 W 1940 2000 3.3Witklip 0555673 W 1940 2012 0.0Malelane 0556898 W 1940 2000 0.0Krokodilbrug 0557712 W 1940 2012 0.0Uitsoek 0555137 W 1940 2012 16.7
Discharge stationsBoschrand X2H005 1960 2012 0.0Sassenheim X2H008 1948 2012 2.8Bellevue X2H010 1948 2012 0.0Geluk X2H012 1956 2012 0.0Lindenau X2H015 1959 2012 4.9Ten Bosch X2H016 1960 2012 3.5Dolton X2H022 1960 2012 7.5Bornmans Drift X2H031 1966 2012 5.9Weltevrede X2H032 1968 2012 3.1Witklip Dam X2H068 1969 2012 0.0Kwena Dam X2H070 1979 2012 0.0
2742

HESSD11, 2719–2757, 2014
Groundwater as anemergency source for
drought mitigation,South Africa
F. E. F. Mussá et al.
Title Page
Abstract Introduction
Conclusions References
Tables Figures
J I
J I
Back Close
Full Screen / Esc
Printer-friendly Version
Interactive Discussion
Discussion
Paper
|D
iscussionP
aper|
Discussion
Paper
|D
iscussionP
aper|
Table 2. SPI or SRI classes.
SPI or SRI range Classification
SPI or SRI≤ −2.0 Extremely dry−2.0 < SPI or SRI≤ −1.5 Severely dry−1.5 < SPI or SRI≤ −1.0 Moderately dry−1.0 < SPI or SRI≤ 1.0 Near normal1.0 < SPI or SRI≤ 1.5 Moderately wet1.5 < SPI or SRI≤ 2.0 Severely wetSPI or SRI≥ 2.0 Extremely wet
Source: Sienz and Jahnke-Bornemann (2012)
2743
HESSD11, 2719–2757, 2014
Groundwater as anemergency source for
drought mitigation,South Africa
F. E. F. Mussá et al.
Title Page
Abstract Introduction
Conclusions References
Tables Figures
J I
J I
Back Close
Full Screen / Esc
Printer-friendly Version
Interactive Discussion
Discussion
Paper
|D
iscussionP
aper|
Discussion
Paper
|D
iscussionP
aper|
Table 3. Water transfer in the Crocodile catchment.
Transfer from Transfer to Amount transfer (Mm3 yr−1)
Nelspruit White River 3.0∗ Sabie and Lomati Kaap 8.5Middle Crocodile Lower Crocodile 25.6∗ Sabie and Lomati Lower Crocodile 6.0
Source: DWAF (2009), ∗ Outside the Crocodile
2744
HESSD11, 2719–2757, 2014
Groundwater as anemergency source for
drought mitigation,South Africa
F. E. F. Mussá et al.
Title Page
Abstract Introduction
Conclusions References
Tables Figures
J I
J I
Back Close
Full Screen / Esc
Printer-friendly Version
Interactive Discussion
Discussion
Paper
|D
iscussionP
aper|
Discussion
Paper
|D
iscussionP
aper|
Table 4. Abstractions simulation scenarios.
Scenarios Recharge Wells abstraction
Simulation 1 Reduced in 10 % Increased in 10 %Simulation 2 Reduced in 25 % Increased in 25 %Simulation 3 Reduced in 50 % Increased in 50 %Simulation 4 Reduced in 50 % Increased in 100 %
2745

HESSD11, 2719–2757, 2014
Groundwater as anemergency source for
drought mitigation,South Africa
F. E. F. Mussá et al.
Title Page
Abstract Introduction
Conclusions References
Tables Figures
J I
J I
Back Close
Full Screen / Esc
Printer-friendly Version
Interactive Discussion
Discussion
Paper
|D
iscussionP
aper|
Discussion
Paper
|D
iscussionP
aper|
Table 5. Irrigation water requirements and water deficit per sub-catchment for the 1992–1995drought.
Sub-catchment Irrigation require-ments (Mm3 yr−1)
Water deficit before apply-ing existing drought mitiga-tion plan (Mm3 yr−1)
GW abstraction needs afterapplying existing droughtmitigation plan (Mm3 yr−1)
Kwena 6.43 0 0Elands 12.47 0 0Nelspruit 22.83 −8.1 11.0White River 17.58 −35.5 27.0Kaap 80.3 −12.8 24.0Middle Crocodile 55.18 −15.4 10.4Lower Crocodile 196.48 −88 24.6Whole catchment 391.27 −159.8 97.0
2746
HESSD11, 2719–2757, 2014
Groundwater as anemergency source for
drought mitigation,South Africa
F. E. F. Mussá et al.
Title Page
Abstract Introduction
Conclusions References
Tables Figures
J I
J I
Back Close
Full Screen / Esc
Printer-friendly Version
Interactive Discussion
Discussion
Paper
|D
iscussionP
aper|
Discussion
Paper
|D
iscussionP
aper|
26
1
Figure 1 Location of precipitation gauges, discharge stations, observation boreholes and catchment 2
division in sub-catchments 3
4
Fig. 1. Location of precipitation gauges, discharge stations, observation boreholes andcatchment division in sub-catchments.
2747
HESSD11, 2719–2757, 2014
Groundwater as anemergency source for
drought mitigation,South Africa
F. E. F. Mussá et al.
Title Page
Abstract Introduction
Conclusions References
Tables Figures
J I
J I
Back Close
Full Screen / Esc
Printer-friendly Version
Interactive Discussion
Discussion
Paper
|D
iscussionP
aper|
Discussion
Paper
|D
iscussionP
aper|
27
1
2
Figure 2 Research methodology 3
4
Objectives Methodology Results
Drought mitigation
scenarios
• Construction of transient
groundwater flow model
• Simulation of drought
mitigation scenarios
• Feasibility of using
groundwater for mitigating
extreme droughts
Assessment of
groundwater resources
• Construction and calibration
of steady groundwater flow
model
• Groundwater recharge
• Baseflow
Determination of water
deficit during the
drought
• Water balance method
• Water deficit = water
availability – water demand
• Water deficit per sub-
catchments
• Groundwater requirement
per sub-catchments
Identification of severe
droughts
• Standardized Precipitation
Index (SPI)
• Standardized Runoff Index
(SRI)
• Computation of drought
severity and intensity
• Temporal changes of
drought severity
• Spatial distribution of
drought severity
• Drought severity per sub-
catchments
Fig. 2. Research methodology.
2748
HESSD11, 2719–2757, 2014
Groundwater as anemergency source for
drought mitigation,South Africa
F. E. F. Mussá et al.
Title Page
Abstract Introduction
Conclusions References
Tables Figures
J I
J I
Back Close
Full Screen / Esc
Printer-friendly Version
Interactive Discussion
Discussion
Paper
|D
iscussionP
aper|
Discussion
Paper
|D
iscussionP
aper|
28
1
Figure 3 Drought severity over time, sub-catchment Elands and the whole catchment 2
-100
-90
-80
-70
-60
-50
-40
-30
-20
-10
0
1940 1960 1980 2000 2020
Dro
ug
ht
severi
ty
Year
Sub-basin Elands
Meteorological drought severity
Hydrological drought severity
-100
-90
-80
-70
-60
-50
-40
-30
-20
-10
0
1940 1960 1980 2000 2020D
rou
gh
t severi
tyYear
Whole catchment
Meteorological drought severity
Hydrological drought severity
Fig. 3. Drought severity over time, sub-catchment Elands and the whole catchment.
2749
HESSD11, 2719–2757, 2014
Groundwater as anemergency source for
drought mitigation,South Africa
F. E. F. Mussá et al.
Title Page
Abstract Introduction
Conclusions References
Tables Figures
J I
J I
Back Close
Full Screen / Esc
Printer-friendly Version
Interactive Discussion
Discussion
Paper
|D
iscussionP
aper|
Discussion
Paper
|D
iscussionP
aper|
29
1
Figure 4 Distribution of the average annual precipitation and the meteorological drought severity during 2
the 1992-1995 drought 3
Fig. 4. Distribution of average annual precipitation and the meteorological drought severityduring the 1992–1995 drought.
2750
HESSD11, 2719–2757, 2014
Groundwater as anemergency source for
drought mitigation,South Africa
F. E. F. Mussá et al.
Title Page
Abstract Introduction
Conclusions References
Tables Figures
J I
J I
Back Close
Full Screen / Esc
Printer-friendly Version
Interactive Discussion
Discussion
Paper
|D
iscussionP
aper|
Discussion
Paper
|D
iscussionP
aper|
30
1
Figure 5 Meteorological drought intensity during the 1992-1995 drought 2
3
Figure 6 Spatial variability of the hydrological drought severity during the 1992-1995 drought 4
5
-6
-5
-4
-3
-2
-1
0
1
SP
I
Precipitation station
Drought intensity, 1992-1995 drought
Fig. 5. Meteorological drought intensity during the 1992–1995 drought.
2751
HESSD11, 2719–2757, 2014
Groundwater as anemergency source for
drought mitigation,South Africa
F. E. F. Mussá et al.
Title Page
Abstract Introduction
Conclusions References
Tables Figures
J I
J I
Back Close
Full Screen / Esc
Printer-friendly Version
Interactive Discussion
Discussion
Paper
|D
iscussionP
aper|
Discussion
Paper
|D
iscussionP
aper|
30
1
Figure 5 Meteorological drought intensity during the 1992-1995 drought 2
3
Figure 6 Spatial variability of the hydrological drought severity during the 1992-1995 drought 4
5
-6
-5
-4
-3
-2
-1
0
1
SP
I Precipitation station
Drought intensity, 1992-1995 drought
Fig. 6. Spatial variability of the hydrological drought severity during the 1992–1995 drought.
2752
HESSD11, 2719–2757, 2014
Groundwater as anemergency source for
drought mitigation,South Africa
F. E. F. Mussá et al.
Title Page
Abstract Introduction
Conclusions References
Tables Figures
J I
J I
Back Close
Full Screen / Esc
Printer-friendly Version
Interactive Discussion
Discussion
Paper
|D
iscussionP
aper|
Discussion
Paper
|D
iscussionP
aper|
31
1
Figure 7 Hydrological drought intensity during the 1992-1995 drought 2
3
Figure 8 Irrigation water requirements during drought period 1992-1995 for the whole catchment 4
5
-3.5
-3.0
-2.5
-2.0
-1.5
-1.0
-0.5
0.0 X2H070 X2H012 X2H015 X2H008 X2H031 X2H010 X2H068 X2H005 X2H032 X2H022 X2H016
SR
I
Discharge station
Drought intensity, 1992-1995 drought
0
20
40
60
80
100
120
140
160
180
Oct Nov Dec Jan Feb Mar Apr May Jun Jul Aug Sep
Un
its (m
m/m
on
th)
Irrigation water requirements ET0 Precipitation 1992-1995
Fig. 7. Hydrological drought intensity during the 1992–1995 drought.
2753
HESSD11, 2719–2757, 2014
Groundwater as anemergency source for
drought mitigation,South Africa
F. E. F. Mussá et al.
Title Page
Abstract Introduction
Conclusions References
Tables Figures
J I
J I
Back Close
Full Screen / Esc
Printer-friendly Version
Interactive Discussion
Discussion
Paper
|D
iscussionP
aper|
Discussion
Paper
|D
iscussionP
aper|
31
1
Figure 7 Hydrological drought intensity during the 1992-1995 drought 2
3
Figure 8 Irrigation water requirements during drought period 1992-1995 for the whole catchment 4
5
-3.5
-3.0
-2.5
-2.0
-1.5
-1.0
-0.5
0.0 X2H070 X2H012 X2H015 X2H008 X2H031 X2H010 X2H068 X2H005 X2H032 X2H022 X2H016
SR
I Discharge station
Drought intensity, 1992-1995 drought
0
20
40
60
80
100
120
140
160
180
Oct Nov Dec Jan Feb Mar Apr May Jun Jul Aug Sep
Un
its (m
m/m
on
th)
Irrigation water requirements ET0 Precipitation 1992-1995
Fig. 8. Irrigation water requirements during drought period 1992–1995 for the whole catchment.
2754
HESSD11, 2719–2757, 2014
Groundwater as anemergency source for
drought mitigation,South Africa
F. E. F. Mussá et al.
Title Page
Abstract Introduction
Conclusions References
Tables Figures
J I
J I
Back Close
Full Screen / Esc
Printer-friendly Version
Interactive Discussion
Discussion
Paper
|D
iscussionP
aper|
Discussion
Paper
|D
iscussionP
aper|
32
1
Figure 9 Decrease of groundwater levels in a) well observation AC00232 at White river catchment and b) 2
well observation BD00159 at Kaap river catchment 3
4
Figure 10 Drawdown of groundwater levels after 3 years for Simulation scenario 4 5
6
832
834
836
838
840
842
844
846
848
0 6 12 18 24 30 36
Wate
r le
vel
(m a
sl)
Months
a)
Transient natural Simulation1 Simulation 4
674
676
678
680
682
684
686
688
0 6 12 18 24 30 36
Wate
r le
vel
(m a
sl)
Months
b)
Transient natural Simulation1 Simulation 4
Fig. 9. Decrease of groundwater levels in (a) well observation AC00232 at White rivercatchment and (b) well observation BD00159 at Kaap river catchment.
2755
HESSD11, 2719–2757, 2014
Groundwater as anemergency source for
drought mitigation,South Africa
F. E. F. Mussá et al.
Title Page
Abstract Introduction
Conclusions References
Tables Figures
J I
J I
Back Close
Full Screen / Esc
Printer-friendly Version
Interactive Discussion
Discussion
Paper
|D
iscussionP
aper|
Discussion
Paper
|D
iscussionP
aper|
32
1
Figure 9 Decrease of groundwater levels in a) well observation AC00232 at White river catchment and b) 2
well observation BD00159 at Kaap river catchment 3
4
Figure 10 Drawdown of groundwater levels after 3 years for Simulation scenario 4 5
6
832
834
836
838
840
842
844
846
848
0 6 12 18 24 30 36W
ate
r le
vel
(m a
sl)
Months
a)
Transient natural Simulation1 Simulation 4
674
676
678
680
682
684
686
688
0 6 12 18 24 30 36
Wate
r le
vel
(m a
sl)
Months
b)
Transient natural Simulation1 Simulation 4
Fig. 10. Drawdown of groundwater levels after 3 years for Simulation scenario 4.
2756
HESSD11, 2719–2757, 2014
Groundwater as anemergency source for
drought mitigation,South Africa
F. E. F. Mussá et al.
Title Page
Abstract Introduction
Conclusions References
Tables Figures
J I
J I
Back Close
Full Screen / Esc
Printer-friendly Version
Interactive Discussion
Discussion
Paper
|D
iscussionP
aper|
Discussion
Paper
|D
iscussionP
aper|
33
1
Figure 11 Water balance components of 4 simulation scenarios for a) White River and b) whole 2
catchment 3
-400
-300
-200
-100
0
100
200
300
400
500
600
Recharge
River leakage in Base flow ΔS ET
Wells abstraction
(Mm
³/yr
)
b)
Natural case
Simulation1
Simulation2
Simulation3
Simulation4
-20
-15
-10
-5
0
5
10
15
20
25
Recharge
River leakage in Base flow ΔS ET
Wells abstraction
Mm
³/yr
a)
Natural case
Simulation1
Simulation2
Simulation3
Simulation4
Fig. 11. Water balance components of 4 simulation scenarios for (a) White River and (b) wholecatchment.
2757
Copyright © 2022 FDOKUMEN