Groundnut Market Value Chain Profile 2020.pdf
33
A PROFILE OF THE SOUTH AFRICAN GROUNDNUT MARKET VALUE CHAIN 2020 Directorate Marketing Tel: 012 319 8456 Private Bag X 15 Fax: 012 319 8131 Arcadia E-mail:[email protected] 0007 www.dalrrd.gov.za
-
Upload
khangminh22 -
Category
Documents
-
view
1 -
download
0
Transcript of Groundnut Market Value Chain Profile 2020.pdf
A PROFILE OF THE SOUTH AFRICAN GROUNDNUT MARKET VALUE CHAIN
2020
Directorate Marketing Tel 012 319 8456 Private Bag X 15 Fax 012 319 8131 Arcadia E-mailPADMdalrrdgovza 0007 wwwdalrrdgovza
2
TABLE OF CONTENTS
1 DESCRIPTION OF THE INDUSTRY 3
11 Producing Areas 4 3 MARKET STRUCTURE 6
21 Domestic Market and Prices 6
22 Exports 8 23 Share Analysis 17
2 4 Imports 18
25 Processing 22 26 Market Value Chain 25
3 Market Intelligence 26
31 Tariffs 26
32 Performance of the groundnut industry 28
4 ACKNOWLEDGEMENTS 33
3
1 DESCRIPTION OF THE INDUSTRY Groundnuts contributed approximately 08 to the gross value of field crops production in 201718
The average annual gross value of groundnuts production for the previous ten years up to 201718
season amounts to approximately R481 541 million Groundnuts can be consumed in an unprocessed
state but they also serve in the economy as raw materials for the manufacturing of various products
These include but not limited to the manufacturing of such products as peanuts peanut butter sweets
and cooking oil The production of groundnuts is highly affected by the costs of production inputs as
well as the demand for groundnuts The contribution of the groundnut industry to the gross value of
agricultural production is summarized in Figure 1 below
Source Statistics and Economic Analysis
The gross value of groundnut production as shown in Figure 1 above was fairly higher during the opening of the season in 200809 This was followed by drastic decline in the gross value of groundnut production between 200910 and 201011 The contribution of the groundnut industry to the gross value of agricultural production depicted various fluctuations throughout the period under analysis The gross value of production has reached the highest level during 201617 mainly as a result of relatively higher levels of production coupled with higher producer prices at the time The contribution of the groundnut industry to the GVP further increased somewhat during 201112 marketing season and this was followed by a slim decline in 201213 Relatively higher gross value of groundnut production was recorded in 201314 season However this was followed by a slight decline in gross value of production during the 201415 season The gross value of groundnut reached the lowest records during the marketing year 201516 followed by the highest gross value attained during the marketing year
100 000
200 000
300 000
400 000
500 000
600 000
700 000
800 000
900 000
2010 2011 2012 2013 2014 2015 2016 2017 2018 2019
GV
P (
R0
00)
Period (Years)
Figure 1 Groundnut gross value of production
4
201617 The period under review closed with a declining gross value of groundnut production in 201718 marketing season
11 Producing Areas
Figure 2 below illustrates the contribution of each province to the total groundnuts production in South Africa The figure clearly shows that the groundnuts are produced mainly in three provinces namely the North West (38 ) Free State (37 ) and Limpopo Province (13 ) Groundnuts are also produced in the Northern Cape Province although the production is lower with 12 of the total production recorded during 201718
Source Statistics and Economic Analysis
Table 1 Groundnut production by provinces
PROVINCE
Production (tons) 201112
Production (tons) 201213
Production (tons) 201314
Production (tons) 201415
Production (tons) 201516
Production (tons) 201617
Production (tons) 201718
Production (tons) 201819
Northern Cape
16900 14000 18200 22700 10000 14000 7000 7000
Free State
21800 16200 15100 21800 29200 34100 21150 21150
Kwazulu-Natal
150 150 90 100 0 0 0 0
Northern Cape13
Free State51
Limpopo18
North West18
Figure 2 Groundnut production by provinces in 201819
5
PROVINCE
Production (tons) 201112
Production (tons) 201213
Production (tons) 201314
Production (tons) 201415
Production (tons) 201516
Production (tons) 201617
Production (tons) 201718
Production (tons) 201819
Limpopo
3350 1500 4110 3250 1440 4800 7350 7350
North West
16800 10000 28500 14450 3320 39150 21500 21500
Gauteng
0 0 0 0 0 0 0 0
Source Statistics and Economic Analysis
Table 1 indicates that during the past eight years Free State Province has been the major producer of groundnuts even though groundnut production in this province has experienced considerable fluctuations during the period under review However during the 201718 marketing season North West Province became the greatest producer of groundnut in South Africa with 21 500 tons followed by the Free State with 21 150 tons Furthermore the North West Province increased its production significantly during 201314 and surpassed both Free State and Northern Capersquos production volumes Notably groundnut production in all the major producing regions has undergone a drastic decline during 201213 season leading to a slight decline in South Africarsquos total groundnuts production Gauteng Province has not recorded any groundnuts production volume from 201011 until 201718 marketing seasons Plantings and production trends of groundnuts from 200809 to 201718 production seasons are as depicted in Figure 3 below
Source Statistics and Economic Analysis
10 000
20 000
30 000
40 000
50 000
60 000
70 000
20 000
40 000
60 000
80 000
100 000
120 000
2010 2011 2012 2013 2014 2015 2016 2017 2018 2019
Are
a P
lan
ted
(H
a)
To
tal P
rod
uct
ion
(T
on
)
Period (Years)
Figure 3 Groundnut production vs area planted
Production Area Planted
6
Figure 3 shows clearly that the production volumes for groundnuts were at the highest levels during the opening on the season in 200809 This was followed by a slight decrease in groundnuts production volumes to the third highest mark during 200910 season During the period under review both total production and area planted for groundnut fluctuated considerably although the area planted has in most cases been more than the total production However the volumes of groundnut production continued to weaken from the year 201011 until 201516 marketing seasons indicating a slight decline in yields This can be attributed to unfavourable weather conditions that appeared on the other hand especially during 201516 marketing season The volumes and area planted for groundnut later increased accordingly during the year 201617 attaining an increase in production of more than 400 as compared to the previous year The period under analysis closed with relatively higher area planted to groundnut and lower volumes during 201718 season
3 MARKET STRUCTURE
21 Domestic Market and Prices
Figure 4 below shows the local production together with consumption of groundnut in South Africa Generally the production and consumption of groundnut fluctuated considerably throughout the period under analysis The figure indicates that the period under analysis opened with higher production of groundnuts way above local consumption suggesting that there was sufficient groundnuts stocks to satisfy the escalating consumption in South Africa in 200809 The figure also indicates that between 200809 and 201112 the production of groundnuts in the local market was slightly above consumption of groundnuts In 20142015 South Africarsquos groundnut production amounted to 70 000 tons which is 17 lower than the previous season This decrease in production occurred despite an increase in area planted from 52 000 hectares to 58 000 hectares mainly due to unfavourable weather conditions Nonetheless the volume of groundnuts production continued to decline dramatically reaching the lowest mark in 201516 This created a deficit of 46 215 tons required to substantiate local consumption as compared to the market situation in 201415 season The decline in production during the year 201516 may be attributed to reduced area planted to groundnut as a result of severe drought conditions experienced during that particular period In 201617 marketing season a record high production of groundnut was achieved above 100 000 tons this was the second highest production of groundnut produced in South Africa after the 200809 season However the period under analysis closed with higher consumption of groundnuts which were slightly above the local production during the 201718 marketing season
7
Source Statistics and Economic Analysis The average producer prices for groundnuts from 200809 to 201718 season are as indicated in Figure 5 below
Source Statistics and Economic Analysis
Figure 5 indicates that producer prices for groundnuts were moderate during the opening season of the period under analysis in 200809 In general the figure shows that on average groundnuts producer prices traded below R8 000ton meanwhile the domestic consumption of groundnut remained fairly stable throughout the period This was followed by a slight decreases in groundnuts producer prices in 200910 which later followed by a gradual increase in groundnuts producer price from 201011 marketing season until the highest price was reached in 201213 season This was mainly driven by
20 000
40 000
60 000
80 000
100 000
120 000
2010 2011 2012 2013 2014 2015 2016 2017 2018 2019
Vo
lum
e (T
on
)
Period (Years)
Figure 4 Local groundnut production vs consumption
Groundnut Production Groundnut Consumption
000
1 00000
2 00000
3 00000
4 00000
5 00000
6 00000
7 00000
8 00000
9 00000
10 00000
2010 2011 2012 2013 2014 2015 2016 2017 2018 2019
Pri
ce (
Rt
on
)
Period (Years)
Figure 5 Groundnut producer prices
8
international price movements which are triggered by increase in demand The figure indicates that the period under analysis closed with slightly higher and stable producer prices above R7 000ton for the production season 201718 The figure shows that from 201011 to 201718 the domestic prices for groundnut increased by 50 from R5 200ton to R7 814ton Figure 6 shows the utilization of groundnuts in South Africa from 200809 to 201718 The figure indicates that locally groundnuts are utilized mainly for manufacturing peanut butter for sales as raw peanuts to the direct market for oil and oilcake and for seed The figure further indicates that groundnut is mainly used for peanut butter and direct market as compared to the use for oil amp oilcake and seed On average 57 517 tons of groundnuts are utilised for the manufacturing of peanut butter and for direct edible market while 2 431 tons of groundnuts are sold for crushing into oil and oilcake in the domestic market and 3 087 tons are directed to the animal feed and seed markets
Source Statistics and Economic Analysis
22 Exports
The volume and value of groundnuts exports from South Africa to the world are summarized in Figure 7 below Figure 7 shows volume and value of groundnuts exports from 2009 to 2018 It is clear from the figure that throughout the period under analysis the quantity of groundnuts exports were consistent with the value of groundnuts exports The period under review opened with somewhat lower volumes and values of groundnuts exports in 2009 On average 14 349 tons were exported at the value of 175419 million The figure further indicates that exports of groundnuts fluctuated considerably over the period under analysis The highest volume of groundnuts exports were recorded in 2010 (29 289 tons) and the lowest was recorded in 2013 (9 023 tons) The period under review closed with an increasing trends for both volume and value of groundnuts exports in 2018
10 000
20 000
30 000
40 000
50 000
60 000
70 000
2010 2011 2012 2013 2014 2015 2016 2017 2018 2019
Vo
lum
e (T
on
)
Marketing Season
Figure 6 Groundnut utilization in the domestic market
Oil and oilcake Peanut butter and direct edible market Seed and unshelled
9
Source Statistics amp Economic Analysis and Quantec Easydata
South Africa imports its groundnuts from countries such as Brazil Argentina China Zambia Malawi India and Nicaragua as shown in Figure 8
Source ITC Trade Map
Figure 8 above shows exporters of groundnuts to the Republic of South Africa during the year 2018 The figure indicates that Brazil became the largest exporter of groundnuts into South African markets followed by Argentina China and Zambia in 2018 During the same year India accounted for about 32 of the total groundnuts imported by South Africa followed by Argentina (31 ) and China and
0
50000
100000
150000
200000
250000
300000
0
5000
10000
15000
20000
25000
30000
35000
2009 2010 2011 2012 2013 2014 2015 2016 2017 2018
Exp
ort
Val
ue
(R0
00)
Exp
ort
Vo
lum
e (0
00 t
on
)
Period (Years)
Figure 7 Volume and value of groundnut exports
Export Quantity (Ton) Export Value (Rand)
Argentina39
Brazil24
Malawi16
China4
India5
Zambia4
Mozambique3
Other5
Figure 8 Exports of groundnut into RSA in 2019
10
Zambia with 17 and 8 respectively India and Malawi contributed the least towards South Africarsquos total groundnut imports in 2018 with 5 and 4 respectively
Source Quantec Easy data
Figure 9 shows the volume of groundnuts exports to various regions in the world The figure indicates that South Africa export groundnuts mainly to Europe Africa and Asia The figure also indicates that on average volumes of groundnuts exports to the Americas are less than 200 tons per year As shown in figure 9 groundnuts exports from South Africa are mainly destined for the markets in Europe Africa and Asia with very minimal exports going to the Americas and Oceania The figure indicates that exports to Europe and Asia are more than those destined to neighbouring countries to South Africa within the African continent which is not surprising as most countries in Africa are involved mostly in primary agricultural production than in processing Generally the volume of groundnuts exports to Europe started lower during the opening of the season in 2009 followed by a dramatic increases until a peak in exports was reached in 2010 Exports to Asia also started on a lower level in 2009 followed by a slight increases to a peak levels in 2009 However in 2015 the volumes of South African groundnuts were destined mainly to the African continent having reached the record highs in exports of more than 14 000 tons The period under review closed with larger volumes of groundnuts exports being destined to Africa followed by Europe and Asia in 2018 which increased by 83 as compared to the previous season Figure 10 shows exports of groundnuts to the European Union from 2009 to 2018 The exports of groundnuts to this region showed fluctuating trends throughout the period under analysis The figure further indicates that the South African groundnuts exports over the period under review were destined mainly to the Netherlands United Kingdom Belgium and Finland Exports of groundnuts to Finland remained minimal throughout the period between 2009 and 2018 The period under analysis closed with decreasing volumes of groundnuts exports from South Africa to the Netherlands although with an increasing exports to Belgium in 2018
2010 2011 2012 2013 2014 2015 2016 2017 2018 2019
Africa 8423 4022 982 2461 3849 15343 8938 3277 5966 8783
Americas 18 396 90 0 0 0 0 0 0 0
Asia 7772 4850 3904 2562 2705 3548 1634 3032 2547 1769
Europe 13280 7312 5532 3856 3164 2605 1781 2916 3211 927
Oceania 162 324 144 144 126 324 72 252 306 271
0
2000
4000
6000
8000
10000
12000
14000
16000
18000
Exp
ort
Vo
lum
e (T
on
s)
Period (Years)
Figure 9 Volume of groundnut exports to various regions
11
Source Quantec Easy data
Figure 11 presents exports of groundnuts to Eastern Asia from 2009 to 2018 The figure indicates that in Eastern Asia South Africa exports groundnuts mainly to Japan The figure further shows that exports of groundnuts to China and Tiwan were very low and erratic during period under review As represented in Figure 11 below exports of groundnuts from South Africa to Eastern Asia have generally decreased from the opening of the marketing season in 2009 until the lowest was attained in 2016 Following the greatest amount of groundnut exports to the Eastern Asia in 2010 groundnuts export to Japan begin to decline from the same period until 2016 However that was followed by a slight increases during the year 2017 until the closer of the season in 2018 mainly because Japan who is the major importer of groundnuts from South Africa in Eastern Asia substituted imports from South Africa with those from Argentina and Brazil
2010 2011 2012 2013 2014 2015 2016 2017 2018 2019
Belgium 79 0 0 0 540 702 1318 2300 2900 877
Finland 288 234 122 79 72 18 0 0 0 0
United Kingdom 2206 531 0 0 286 80 0 175 189 25
Netherlands 8713 5326 5177 3402 2086 1726 445 441 70 0
Germany 1483 733 0 0 0 0 0 0 25 25
0
1000
2000
3000
4000
5000
6000
7000
8000
9000
10000E
xpo
rt V
olu
me
(To
ns)
Period (Years)
Figure 10 Volume of groundnut exports to European Union
12
Source Quantec Easy data
Figure 12 below shows volumes of groundnuts exports to the SADC region from 2009 to 2018 The figure indicates that South Africa exports groundnuts in large quantities to Mozambique and Zimbabwe The exports of groundnuts to Zambia were very low and erratic during the period under analysis The figure further indicates that Angola is also an important market for South African groundnuts even though there were very less groundnuts exports destined to that country throughout the period under review The exports of groundnuts from South Africa to the SADC countries with the exception of Mozambique were very low between the years 2011 and 2014 During the year 2015 greatest amount of South African groundnuts export went to Mozambique followed by Zimbabwe However in 2016 exports of groundnuts to SADC closed lower showing a decreasing trends until the marketing year 2017 The volumes of groundnuts exports to the SADC region closed with an increasing trends and destined mainly to Mozambique during the year 2018
2010 2011 2012 2013 2014 2015 2016 2017 2018 2019
China 0 0 0 0 0 132 0 0 26 8
Hong Kong 0 181 0 0 0 0 0 0 0 0
Japan 6030 4670 3868 2562 2638 3228 1634 2125 2521 1761
Taiwan 0 0 0 0 17 33 0 0 0 0
0
1000
2000
3000
4000
5000
6000
7000E
xpo
rt V
olu
me
(To
ns)
Period (Years)
Figure 11 Volume of groundnut exports to Eastern Asia
13
Source Quantec Easy data
Figure 13 shows exports of groundnuts by province from 2009 to 2018
Source Quantec Easy data
Figure 13 above shows that Gauteng province is the greatest exporter of groundnuts produced in South Africa followed by the Northern Cape and Kwazulu-Natal provinces respectively The figure further indicates that exports from the largest producers North West and Free State provinces were very low throughout the period under analysis and this mainly influenced by lack of necessary marketing infrastructure in those provinces It is also clear that the values of exports from different provinces were fluctuating throughout the period under analysis with those from Mpumalanga and
0
2000
4000
6000
8000
10000
12000
2010 2011 2012 2013 2014 2015 2016 2017 2018 2019
Exp
ort
Vo
lum
e (T
on
s)
Period (Years)
Figure 12 Volume of groundnut exports to SADC region
Angola Mozambique Zambia Zimbabwe
0
20000000
40000000
60000000
80000000
100000000
120000000
140000000
160000000
180000000
2010 2011 2012 2013 2014 2015 2016 2017 2018 2019
Exp
ort
Val
ue
(Ran
ds)
Period (Years)
Figure 13 Value of groundnut exports by provinces
Western Cape Northern Cape Free State KwaZulu-Natal
North West Gauteng Mpumalanga Limpopo
14
Western Cape being at the lowest The 2018 marketing period closed with increasing values of groundnuts exports from the Northern Cape above those from Gauteng and other provinces Figure 14 presents the value of groundnuts exports in Gauteng province from 2009 to 2018 The figure shows that in Gauteng province the City of Tshwane and City of Johannesburg are the major exporters of groundnuts as compared to other district Generally exports of groundnuts from Gauteng province were highly volatile throughout the period under analysis The figure also indicates that Ekurhuleni district also contributes significantly towards Gauteng provincersquos total value of groundnuts exports The contributions of West Rand district towards the total Gauteng provincersquos groundnuts exports were very low and erratic through the period The period under analysis closed with City of Tshwane commanding the greatest share of Gautengrsquos value of groundnuts exports in 2018 although showing a declining trends
Source Quantec Easy data
Figure 15 below indicates the value of groundnut exports from North West province during the period 2009 to 2018 The Figure shows very low and erratic trend with regard to exports of groundnuts from various districts in the province Ngaka Modiri Molema District Municipality was the largest exporter of groundnuts from North West province between 2009 and 2013 followed by Dr Ruth Segomotsi Mompati District However from the year 2014 the exports of groundnuts from Dr Ruth Segomotsi Mompati District emerged and surpassed those from other regions until the closer of the marketing season in 2018 Exports of groundnuts from Dr Kenneth Kaunda district were very low during the opening of the season in 2009 and remained very low for the rest of the period under analysis
0
20000000
40000000
60000000
80000000
100000000
120000000
2010 2011 2012 2013 2014 2015 2016 2017 2018 2019
Exp
ort
Val
ue
(Ran
ds)
Period (Years)
Figure 14 Value of groundnut exports from Gauteng province
Ekurhuleni City of Johannesburg City of Tshwane
15
Source Quantec Easy data
Values of groundnut exports from KwaZulu-Natal Province for the period 2009 to 2018 are shown in Figure 16 below The figure shows the value of groundnuts exports from Kwazulu-Natal during 2009 to 2018 mainly from three districts municipalities The figure indicates that the value of groundnuts export during the period of analysis was highly volatile The figure further shows that eThekwini region commands the greatest value of groundnuts exports from the provinces followed by Umgungundlovu and iLembe regions respectively The province recorded highest values of groundnuts exports during 2010 and 2011 respectively However from the year 2010 values of groundnuts exports from KwaZulu Natal province begin to decline drastically until the lowest exports values were attained in 2018 The period under review closed with decreasing groundnuts exports from KwaZulu-Natal Province in 2018
Source Quantec Easy data
0
2000000
4000000
6000000
8000000
10000000
12000000
14000000
2010 2011 2012 2013 2014 2015 2016 2017 2018 2019
Exp
ort
Val
ue
(Ran
ds)
Period (Years)
Figure 15 Value of groundnut exports from North West province
Bojanala Ngaka Modiri MolemaDr Ruth Segomotsi Mompati Dr Kenneth Kaunda
0
5000000
10000000
15000000
20000000
25000000
30000000
2010 2011 2012 2013 2014 2015 2016 2017 2018 2019
Exp
ort
Val
ue
(Ran
ds)
Period (Years)
Figure 16 Value of groundnut exports from KZN province
UMgungundlovu iLembe eThekwini
16
Source Quantec Easy data
Figure 17 presents value of groundnuts exports from Western Cape during 2009 to 2018The figure shows that the City of Cape Town was the major exporter of groundnuts in Western Cape for a better part of the period under review The figure further indicates that Cape Winelands started exporting only from the year 2010 while Eden district exported only in 2012 The period closed with decreasing groundnuts exports from the province in 2018 originating largely from the City of Cape Town
Source Quantec Easy data
Figure 18 indicates value of groundnuts exports from the Free State province during 2009 to 2018The figure shows that generally Free State is not the major exporter of groundnuts Despite the facts that is
2010 2011 2012 2013 2014 2015 2016 2017 2018 2019
City of Cape Town 39581 63103 519063 118468 251094 464174 130700 335521 207465 231235
West Coast 0 0 0 0 0 0 0 0 330 346
Cape Winelands 45420 6213 25250 677 15391 90000 132004 7258 3320 5378
0
100000
200000
300000
400000
500000
600000E
xpo
rt V
alu
e (R
and
s)
Period (Years)
Figure 17 Value of groundnut exports from Western Cape province
0
2000000
4000000
6000000
8000000
10000000
12000000
14000000
16000000
2010 2011 2012 2013 2014 2015 2016 2017 2018 2019
Exp
ort
Val
ue
(Ran
ds)
Period (Years)
Figure 18 Value of groundut exports from Free State province
Lejweleputswa Thabo Mofutsanyane Fezile Dabi Mangaung
17
one of the largest producer of groundnuts in South Africa Exports of groundnuts in Free State originate only from four districts Lejweleputswa Thabo Mofutsanyane Fezile Dabi and Mangaung From the opening of the marketing season in 2009 until 2013 exports from Free State originated mainly from Mangaung district while Lejweleputswa recorded exports only from the year 2014 The marketing seasons for 2015 and 2016 closed higher with the greatest value of groundnuts exports from Lejweleputswa district attaining the highest exports values for the entire period in 2015 During the year 2017 groundnuts exports from Free State province originated mainly from Fezile Dabi district which recorded the highest values in exports until the closer of the season in 2018
Source Quantec Easy data
Figure 19 indicates values of groundnuts exports from the Northern Cape Province during 2009 to 2018The figure indicates that out of all the districts in Northern Cape only one district (Frances Baard) exports groundnuts The figure further shows that Frances Baard recorded the highest values of groundnuts exports during the closing of the marketing season in 2018 The period under review closed with the record highs value of groundnuts exports from Northern Cape in 2018 about 29 higher compared to the second highest export values attained during 2015 season
23 Share Analysis
Table 2 Contribution of various provinces to South Africarsquos total value of groundnuts export ()
Year 2010 2011 2012 2013 2014 2015 2016 2017 2018 2019
Province
Wester 003 003 003 003 025 014 017 00 01 02
0
20000000
40000000
60000000
80000000
100000000
120000000
2010 2011 2012 2013 2014 2015 2016 2017 2018 2019
Exp
ort
Val
ue
(Ran
ds)
Period (Years)
Figurw 19 Value of groundnut exports from Northern Cape province
Pixley ka Seme Siyanda Frances Baard
18
Year 2010 2011 2012 2013 2014 2015 2016 2017 2018 2019
Province
n Cape Northern Cape
2279 3155 3244 2511 3564 4081 4961 5000 65 245
Free State
283 000 045 470 072 773 328 1000 25 38
Kwazulu-Natal
1075 1125 416 550 505 211 054 300 03 39
North West
000 001 423 303 284 663 1194 800 59 73
Gauteng
6359 5652 5868 6107 5550 3922 2780 3400 19 478
Source Calculated from Quantec Easy data
Table 2 confirms the earlier observation that Gauteng province is the largest contributor towards South Africarsquos total value of groundnuts exports followed by Northern Cape and Kwazulu-Natal provinces The table further shows that the contributions of groundnuts exports from other provinces to the total Gauteng remained minimal throughout the period under review Northern Cape Provincersquos share of groundnuts exports have been increasing since 2009 until 2012 followed by a slight decline in 2013 and an increase in 2014 until the closer of the season in 2018 During the year 2009 Northern Capersquos contribution to South Africarsquos total groundnuts exports was 1421 and this has increased to 50 in 2017 This scenario is not surprising since Northern Cape Province has recently emerged to be one of the biggest producers of groundnuts having accounted for 3564 and 4081 of South Africarsquos total groundnuts production during 2014 and 2015 season The Northern Cape remained the largest contributor to the total South African exports of groundnuts in 2018 commanding 65 in share of exports
2 4 Imports
The quantities and values of groundnuts imports from 2009 to 218 pursue the pattern which is shown in Figure 20 below
19
Source Statistics amp Economic Analysis Quantec Easydata
On average South Africa imports approximately 17 207 tons of groundnuts per annum to the value of about R222 million Figure 20 above shows that groundnut imports fluctuated considerably from the year 2009 until 2018 This occurred as a result of fluctuations in production volumes which were caused by inconsistent weather conditions over the period The period under review opened with lower imports of groundnuts in both value and quantity terms in 2009 However the greatest decline in both imports quantity and value of groundnuts were experienced during the year 2010 were the lowest records in imports were attained The highest quantities of groundnuts were imported during the year 2016 in quantity and value respectively The period under review closed with declining trends in both value and quantity of groundnuts imports during the marketing year 2018 South Africa imports groundnuts from the following regions Europe Asia the Americas and Africa particularly from the SADC region Figure 21 below indicates that over the past ten years South Africa has been importing groundnuts consistently from Africa the Americas and Asia Groundnuts imports from Europe have been low and erratic throughout the period under analysis The major groundnuts import market for South Africa is Africa followed by Asia and the Americas On average South Africa imports about 6 515 tons of groundnuts annually from Africa while imports from Americas and Asia are about 6 993 tons and 3 482 tons per annum respectively
0
100000
200000
300000
400000
500000
600000
700000
800000
900000
0
10000
20000
30000
40000
50000
60000
2010 2011 2012 2013 2014 2015 2016 2017 2018 2019
Imp
ort
Val
ue
(R0
00)
Imp
ort
Qu
anti
ty (
To
n)
Period (Years)
Figure 20 Groundnuts imports from the world
Import Quantity Import Value
20
Source Quantec Easy Data
Figure 22 below shows that on the African Continent South Africa imports groundnuts from the following Countries in the SADC region Malawi Mozambique Zambia Tanzania and Zimbabwe The figure indicates that over the past ten years South Africa has been importing groundnuts consistently from Malawi and Mozambique It is also evident from the figure that groundnuts imports from the SADC region fluctuated considerably over the period under review with the lowest import volumes originating from Zambia Zimbabwe and Tanzania The greatest amount of imports originating from the SADC region and mainly from Mozambique were recorded during the year 2013 as compared to other areas within the SADC region South Africarsquos volume of groundnuts imports from Mozambique declined significantly during the year 2018 with groundnuts imports from Malawi surpassing those from Mozambique and the rest
0
5000
10000
15000
20000
25000
30000
35000
40000
2010 2011 2012 2013 2014 2015 2016 2017 2018 2019
Imp
ort
Vo
lum
e (T
on
)
Period (Years)
Figure 21 Volume of groundnuts imports from various regions
Africa Americas Asia Europe Oceania
21
Source Quantec Easy Data
Source Quantec Easy Data
In Eastern Asia South Africarsquos groundnut imports originate mainly from China with some fractional intermittent imports originating from other Eastern Asian countries such as Japan Figure 23 above shows that volume of groundnut imports from China begin at higher levels during the opening of the season in 2009 before it decreased to lower levels in the year 2013 The period under review closed with imports being 41 higher in 2018 as compared to the imports levels attained in 2017 season originating mainly from China
2010 2011 2012 2013 2014 2015 2016 2017 2018 2019
Malawi 674 5491 3404 2114 794 271 2025 1745 2616 6431
Mozambique 0 952 3554 9117 1579 54 6191 570 181 1233
Tanzania 0 48 2752 416 0 0 0 133 0 114
Zambia 0 0 184 250 1049 314 505 1140 1180 1586
Zimbabwe 0 865 32 30 12 0 0 10 349 110
0100020003000400050006000700080009000
10000Im
po
rts
Vo
lum
e (T
on
)
Period (Years)
Figure 22 Volume of groundnuts imports from SADC region
2010 2011 2012 2013 2014 2015 2016 2017 2018 2019
China 956 745 661 232 283 908 1600 1245 1772 1808
China 0 0 0 0 0 0 0 0 0 40
Japan 36 18 18 36 0 18 0 0 0 0
0
200
400
600
800
1000
1200
1400
1600
1800
2000
Imp
ort
Vo
lum
e (T
on
)
Period (Years)
Figure 23 Volume of groundnuts imports from Eastern Asia
22
Source Quantec Easy Data
Figure 24 shows that South Africarsquos groundnut imports from South America originate mainly from Argentina and Brazil The groundnuts imports volumes from South America started the season lower in 2009 This was followed by a huge decline in imports of groundnuts from South America between the years 2010 and 2014 The volume of groundnuts imports from Brazil were marginally lower throughout the period between 2009 and 2018 seasons The figure further indicates that there were no imports of groundnuts recorded from Brazil between 2009 and 2014 South Africa imported lower volumes of groundnuts from South America during the year 2010 when less than 1000 tons of groundnuts were imported from Argentina It is also clear from the figure that there were no imports of groundnuts from Brazil during the year 2014 while those from Argentina were also lower The highest imports volumes above 25 000 tons from Argentina were recorded during the year 2016 However the period under review closed with a drastic decline in volumes of groundnuts imports from Argentina during the 2018 marketing season with groundnuts imports from Brazil surpassing those from other regions
25 Processing
Groundnuts are a high value crop that can be marketed with little processing but are extremely versatile and can be used in a wide range of products The oil made from them can be used for cooking and they can be used to make peanut butter In South Africa processing facilities mainly belong to various companies that produce a wide range of products These include companies that produce peanuts sweets peanut-butter and cooking oil just to mention few Oil contains high amounts of energy and fat-soluble vitamins (A D E and K) and essential fatty acids The oil content of the kernels is between 45 and 55 The peanuts are prepared for the oil extraction process by being shelled and cleaned Oil production requires some type of press with which to extract the oil from the groundnuts and filtering equipment The alternative uses of groundnuts are detailed in the following diagram (Figure 25)
2010 2011 2012 2013 2014 2015 2016 2017 2018 2019
Argentina 144 0 0 286 260 9465 29797 6670 3484 16199
Paraguay 0 0 0 25 0 0 0 0 0 0
Brazil 0 0 0 0 0 925 5437 1843 3599 9875
0
5000
10000
15000
20000
25000
30000
35000Im
po
rt V
olu
me
(To
n)
Period (Years)
Figure 24 Volume of groundnuts imports from South America
23
As indicated in Figure 25 groundnuts can be used in various ways at different levels within the industry They can be boiled or roasted for immediate consumption or used as raw material of various products in the industry Oil extracted from the groundnut can be used as raw material for manufacturing of soap massage oil for polio patients body shaving and hair creams and fluid diet which is used to physically strengthen patients and to sharpen their appetites before and after operations The oil cake which is by-product of oil extraction process is used to make glue for wood animal feed fertilizers and antibiotics
24
Figure 25 Groundnut Value Chain tree explaining its uses
Source Grain SA and African Groundnut Council
Oil
extraction
Groundnut
Oil
Cooking
oil
Massage oil
Body shave
and hair
creams
PetrolDiesel
Fluid diet
(For
Oil
Cake
Animal
feed
Fertilizer
s
Antibiotics
Glue for
Wood
Groundnut
Shells
Fertilizer
s
Peanuts
Peanut -
Butter
Spread on
Bread Ice
Cream
Products Biscuits
Boiled and
Salted
Soap
25
26 Market Value Chain
Figure 26 Market value chain for groundnuts
Farmers produce groundnuts and after harvesting and drying they grade the groundnut pods at a prescribed moisture level in the kernels After grading the pods are packed in gunny bags The packed groundnuts are then sold to either the local market (processors) or foreign market or they may be stored for on-farm processing and future sales The processed groundnut products are sold in an acceptable form to the consumers
Research and
Biotechnology
Input suppliers
FarmersProducers
Silo Owners
Import and
Export Market
Traders and
Transport
Local Market
Peanut-making
Industry
Other
Processors
Oil industry
RetailWholesale
Consumer
26
3 Market Intelligence
31 Tariffs
The following Table 6 indicates the tariffs that are applied by South Africa to the imports of groundnuts from other countries during the year 2018 South Africa generally applies an import duty of 1000 Ad valorem on imports of groundnuts However imports of groundnuts from member-countries of the following regional structures may enter South Africa free of duty SACU European Union and SADC This is due to free trade agreements that exist between South Africa and abovementioned regional structures Table 6 Tariffs applied by South Africa to groundnut imports
Selected Product description
Tariff regime description Applied Tariff Total ad valorem equivalent tariff (estimated)
Groundnuts not roasted or otherwise cooked 120230
MFN duties (Applied) 1000 1000
Intra SACU rate 000 000
Preferential tariff for European Union Countries
000 000
Preferential tariff for SADC countries
000 000
Source ITC Market Access Map
The following Table 7 indicates the tariffs that are applied by various countries to the exports of groundnuts originating from South Africa in 2019 Table 7 Tariffs applied to South African groundnut exports
Importers Selected product codes
Product description
Trade regime description
Applied tariffs
Total ad valorem equivalent tariff
Belgium 1202 Ground-nuts not roasted
MFN duties (Applied)
000 000
Japan 12023000 Ground-nuts not roasted
MFN duties (Applied)
1000 1000
12024100 Ground-nuts not roasted (in shell)
MFN duties (Applied)
1000 1000
27
Importers Selected product codes
Product description
Trade regime description
Applied tariffs
Total ad valorem equivalent tariff
Mozambique 12024100 Ground-nuts not roasted
MFN duties (Applied)
2000 2000
Preferential tariff for SADC
000 000
Netherlands 12024100 Ground-nuts not roasted
MFN duties (Applied)
000 000
Preferential tariff for South Africa
000 000
New Zealand 12024100
Ground-nuts not roasted
MFN duties (Applied)
000 000
Source ITC Market Access Map
Table 7 above indicates that South Africa does not face any tariff barriers when exporting groundnuts to countries such as Netherlands Belgium Mozambique and Zambia This is mainly due to the fact that some of these countries do not charge any tariffs on imports of groundnuts originating from other countries South Africa enjoys a preferential tariff of 0 ad valorem when exporting groundnuts to Mozambique and Zambia due to the existence of SADC Free Trade Agreement Japanrsquos groundnuts industries are heavily protected by higher import duties that are charged by these countries on imports of groundnuts from elsewhere Japan applies an import duty of 10 Ad Valorem on imports of groundnuts originating from other countries and on imports of groundnuts originating from South Africa
28
32 Performance of the groundnut industry
Figure 27 Competitiveness of supplying countries for SA groundnut imports 2019
Source ITC Trade Map
29
Figure 27 and Table 8 indicate that imports of groundnuts from Brazil and Zambia increased significantly between the years 2017 and 2018 Groundnuts imports from Brazil increased by about 75 in value between the years 2017 and 2018 while those from Zambia increased by 29 in value Table 8 List of supplying markets for the groundnut imported by South Africa in 2019
Exporters
Trade Indicators
Imported value 2019
(USD thousand)
Share in
South Africas imports
()
Imported quantity
2019
Unit value (USDunit)
Imported
growth in value between
2015-2019 (
pa)
Imported growth in quantity between
2015-2019 ( pa)
Imported growth in
value between
2018-2019 (
pa)
World 42071 100 40977 1027
9 11 183
Argentina 18337 436 16173 1134
-8
-10 326
Brazil 11650
277 9875
1180 58
54 161
Malawi 2889 69 6421 450 57 93 330
China 2541 6 1770 1436
11 18 11
India 1972 47 1884 1047
24 23 207
Zambia 1386
33 1586 874 50
50 30
Mozambique 1309 31 1233 1062 42 31 1496
Nicaragua 709 17 625 1134 94 41
Source ITC Trade Map
Table 8 and Figure 28 also show that Brazil is the biggest supplier of groundnuts imported by South Africa in 2018 It is clear from the figure and the table that Brazil accounted for about 295 of the total groundnuts imported by South Africa during the year 2018 The other major exporters of groundnuts to South Africa are Argentina China Zambia and Malawi which account for 286 158 and 74 of South Africarsquos total groundnuts imports respectively South Africa also imports groundnuts from other countries such India USA and Nicaragua
30
Figure 28 Prospects for diversification of suppliers of groundnut imported by South Africa 2019
Source ITC Trade Map
31
Table 9 List of Importing markets for the groundnut exported by South Africa in 2019
Importers
Trade Indicators
Exported value 2018
(USD thousand)
Share in South
Africas exports
()
Exported quantity
2019
Unit value
(USDunit)
Exported growth in
value between
2015-2019 ( pa)
Exported growth in quantity between
2015-2019 ( pa)
Exported growth in
value between 2018-2019 (
pa)
World 10496
100 11700 897 -7
-12
-19
Mozambique 4744 452 7925 599 3 -6
90
Japan 2844 271 1706 1667
-8 -8
-30
Belgium 1327 126 877 1513 13 13
-71
New Zealand 480 46 271 1771 10 12
-15
Eswatini 465
44 399 1165 9 8
253
Lesotho 184 18 126 1460 24
35
232
Zimbabwe 140 13 200 700 -49
-56
-37
Source ITC Trade Map
It is clear from Table 9 and Figure 29 that the main export destinations for groundnuts originating from South Africa in 2018 are Belgium Japan Mozambique Netherlands New Zealand Namibia and Zimbabwe with the greatest volumes being exported to Belgium and Japan In 2018 Belgium alone absorbed 352 of South Africarsquos total groundnut exports followed Japan and Mozambique with 31 and 195 respectively South Africarsquos value of groundnuts exports to the world remained at 0 between the years 2014 and 2018 The figure and the table further show that between the years 2017 and 2018 the value of the South African groundnut exports to the world only increased by 1 while those towards Belgium increased by 30 over the same period Figure 29 further shows that South Africarsquos groundnuts exports to countries such as Botswana Mozambique Japan Netherlands New Zealand Zimbabwe Norway Egypt and United Kingdom have grown at a slow pace compared to these countriesrsquo imports growth from the rest of the world The growth rate of South Africarsquos groundnut exports to countries such as Belgium and Zambia is more than the growth in these countriesrsquo imports from the rest of the world The figure further shows that if South Africa wishes to expand its groundnut export base the prospective markets exist in countries such as Germany Lesotho and Eswatini
32
Figure 29 Prospects for market diversification for Groundnuts (1202) exported by South Africa in 2019
Source ITC Trade Map
33
4 ACKNOWLEDGEMENTS The following organizations are acknowledged Statistics and Economic Analysis Department of Agriculture Forestry and Fisheries Tel (012) 319 8453 Fax (012) 319 8031 wwwdaffgovza Grain South Africa wwwgrainsacoza African Groundnut Council wwwafgroundnutcouncilorg Quantec Easydata POBox 35466 Menlo Park Pretoria 0102 Tel 012 361 5154 Fax 012 348 5874 Website wwwquanteccoza ITC Trade Map Website httpwwwtrademaporg ITC Market Access Map wwwmacmaporg Disclaimer This document and its contents have been compiled by the Department of Agriculture Forestry and Fisheries for the purpose of detailing the groundnut industry Anyone who uses the information as contained in this document does so at hisher own risk The views expressed in this document are those of the Department with regard to the industry unless otherwise stated The Department therefore accepts no liability that can be incurred resulting from the use of this information
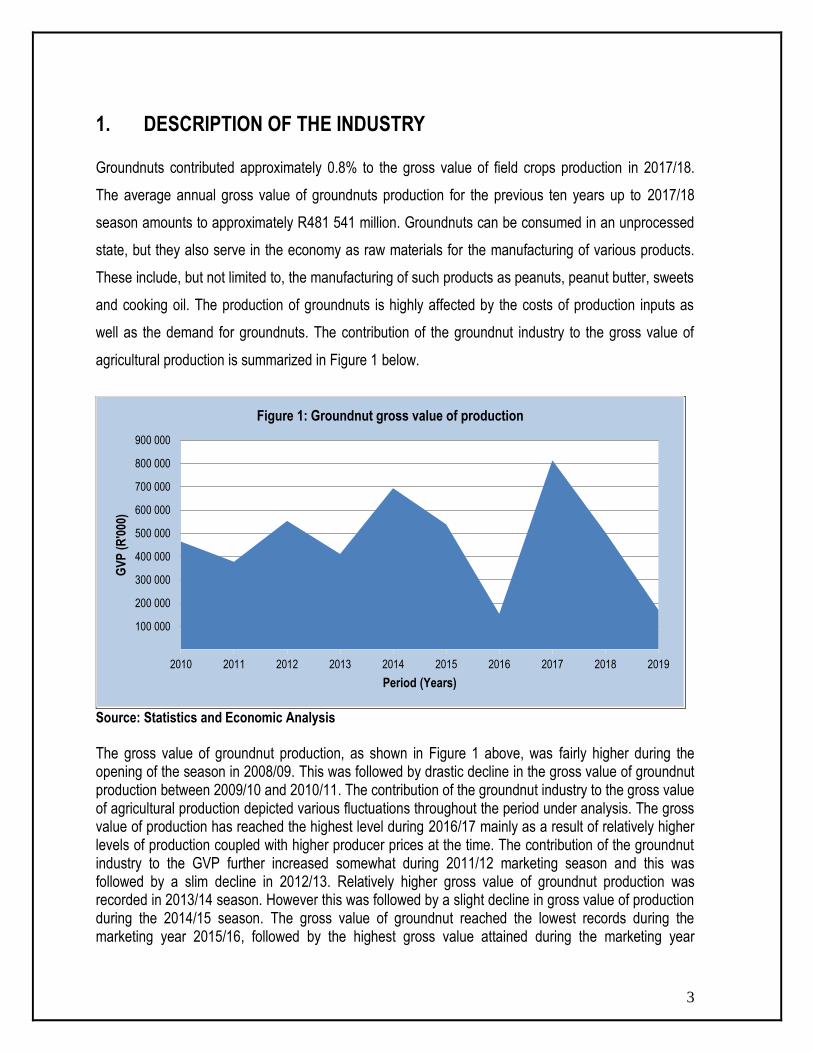
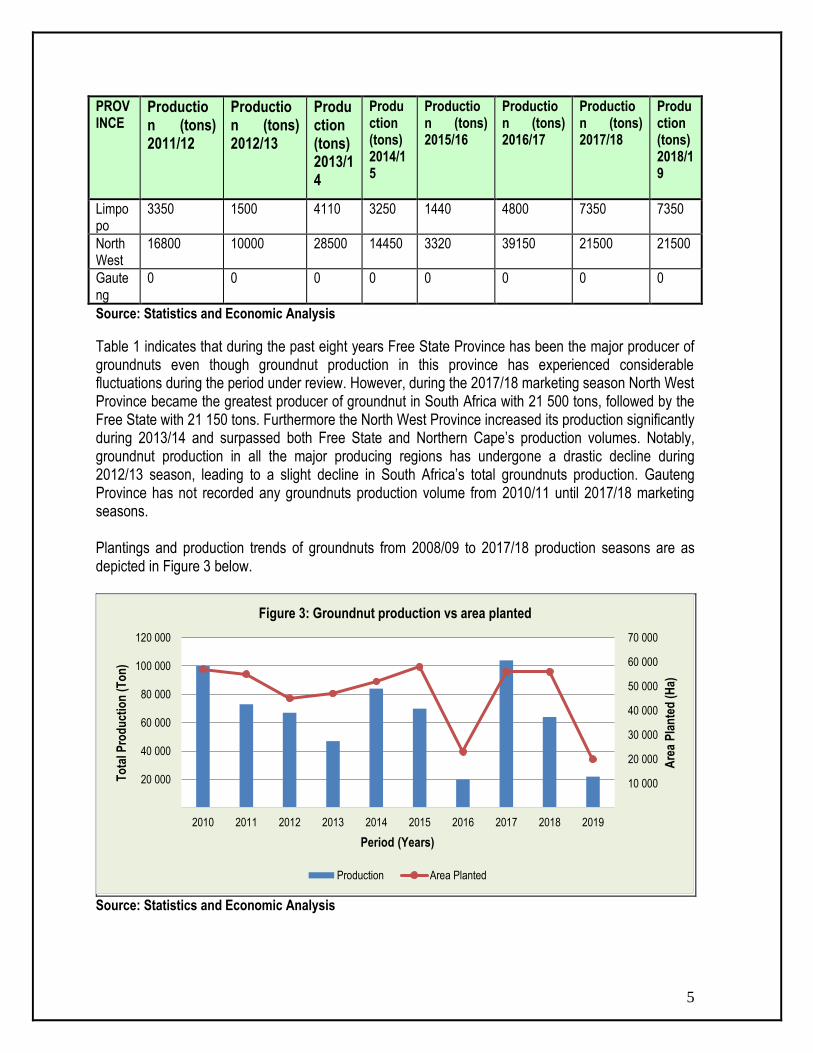
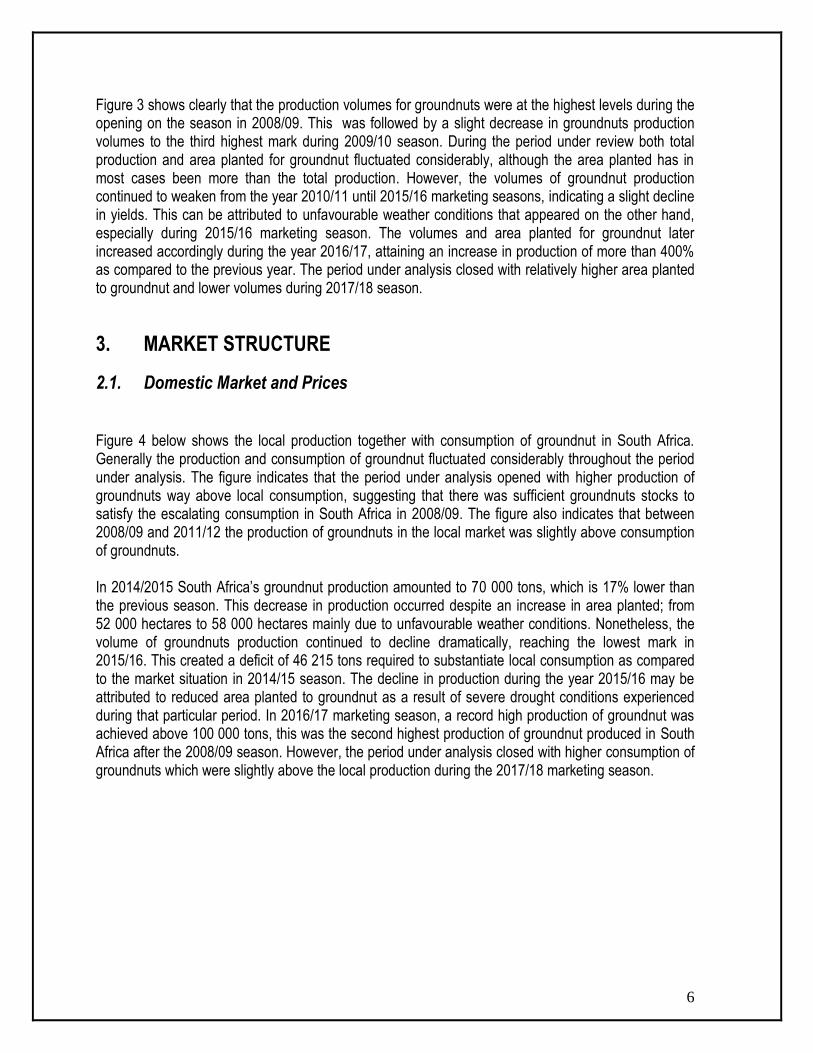
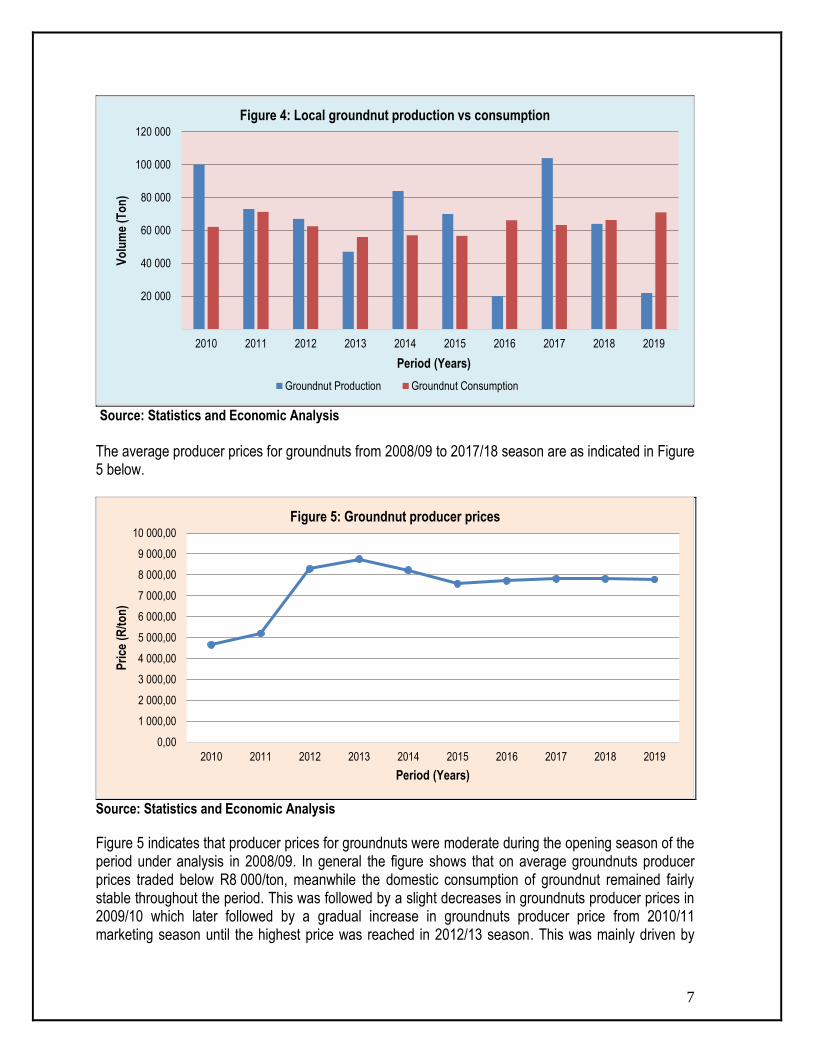
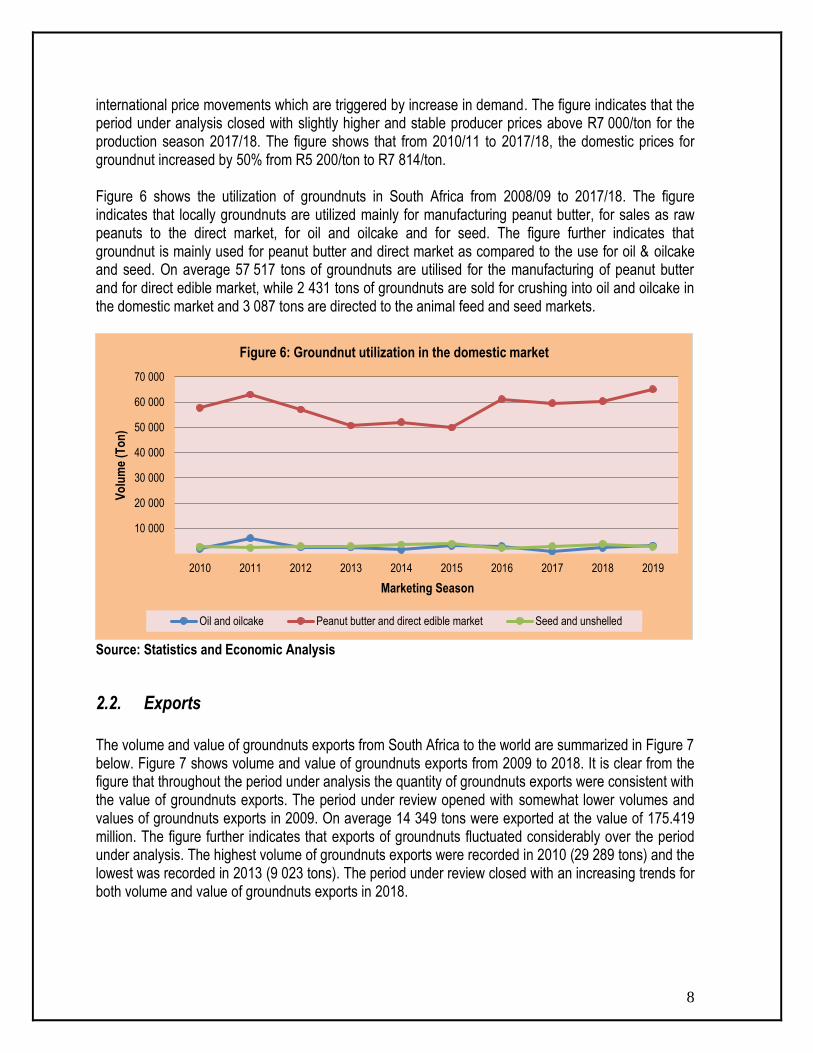
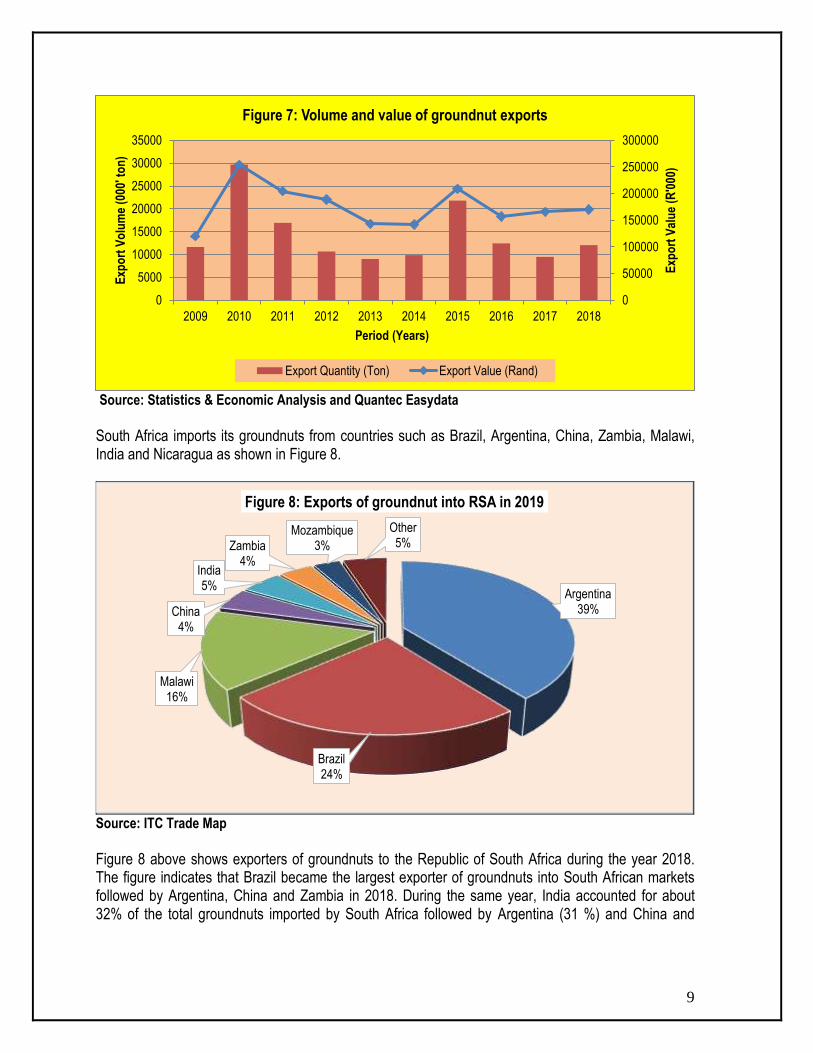
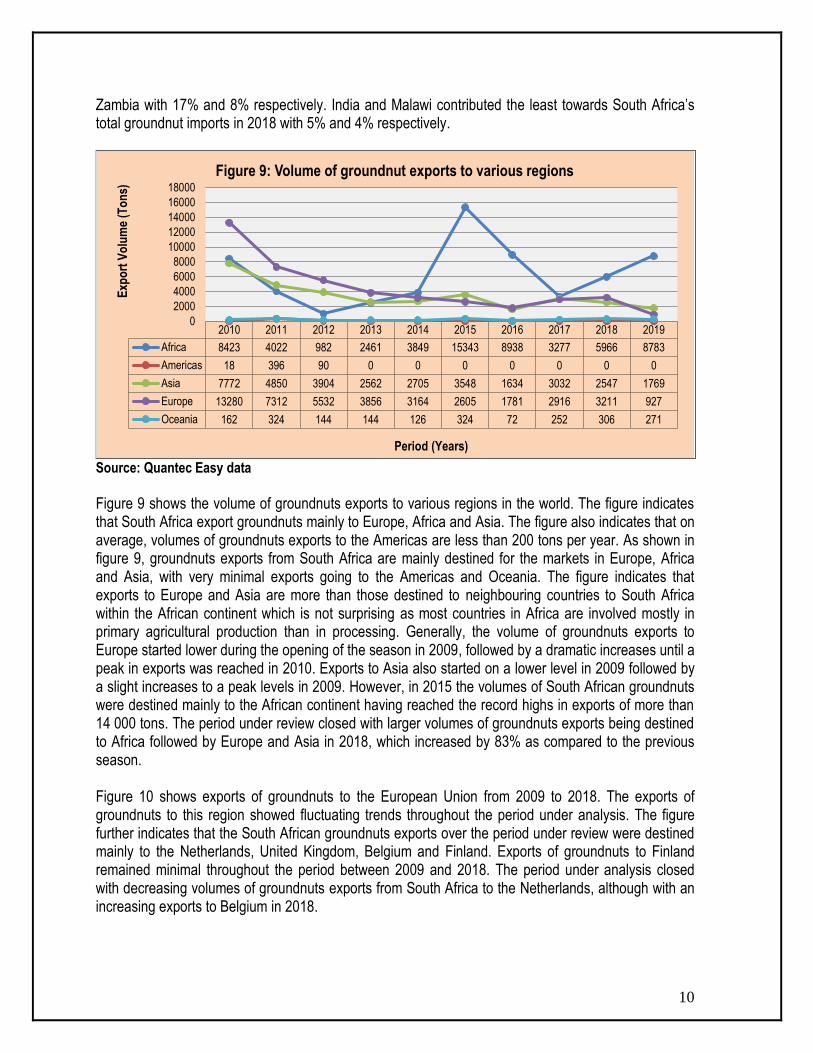
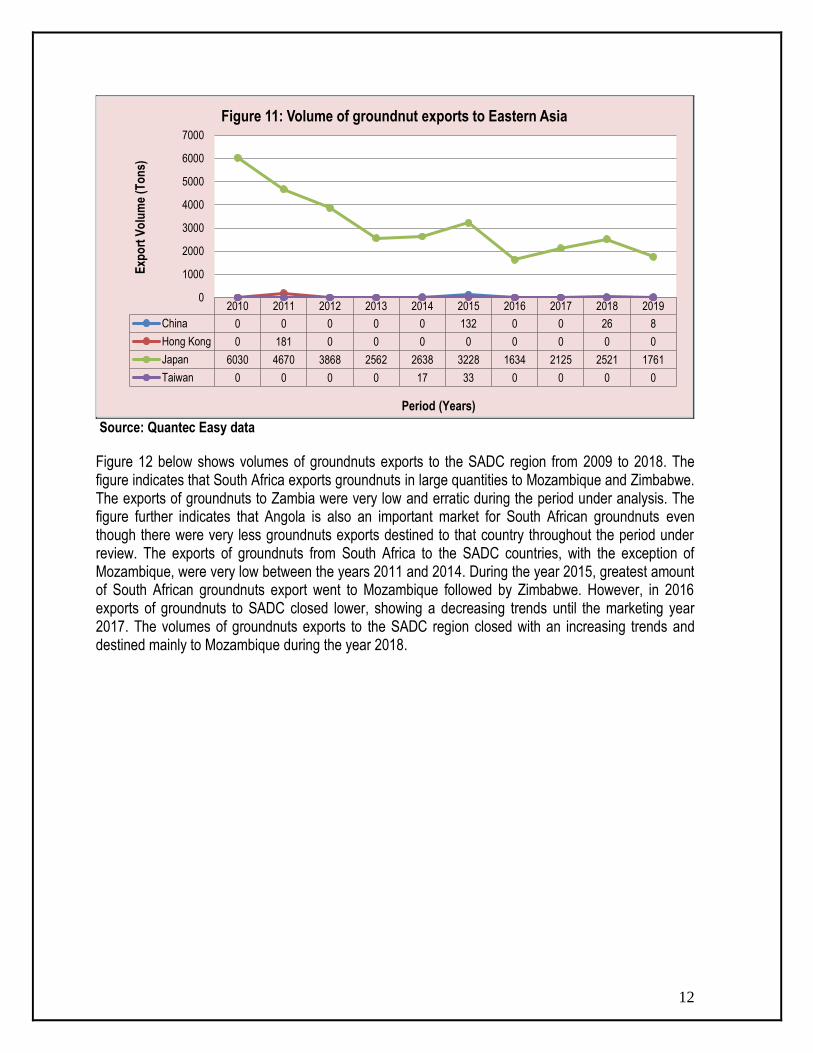
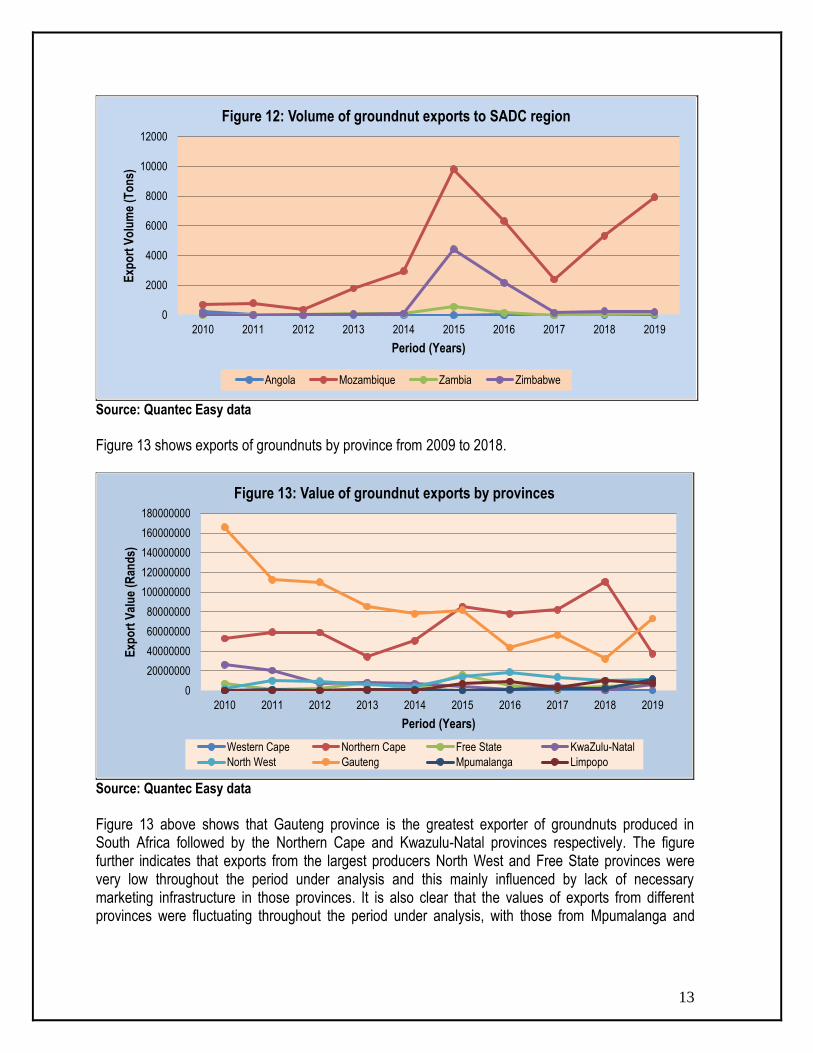
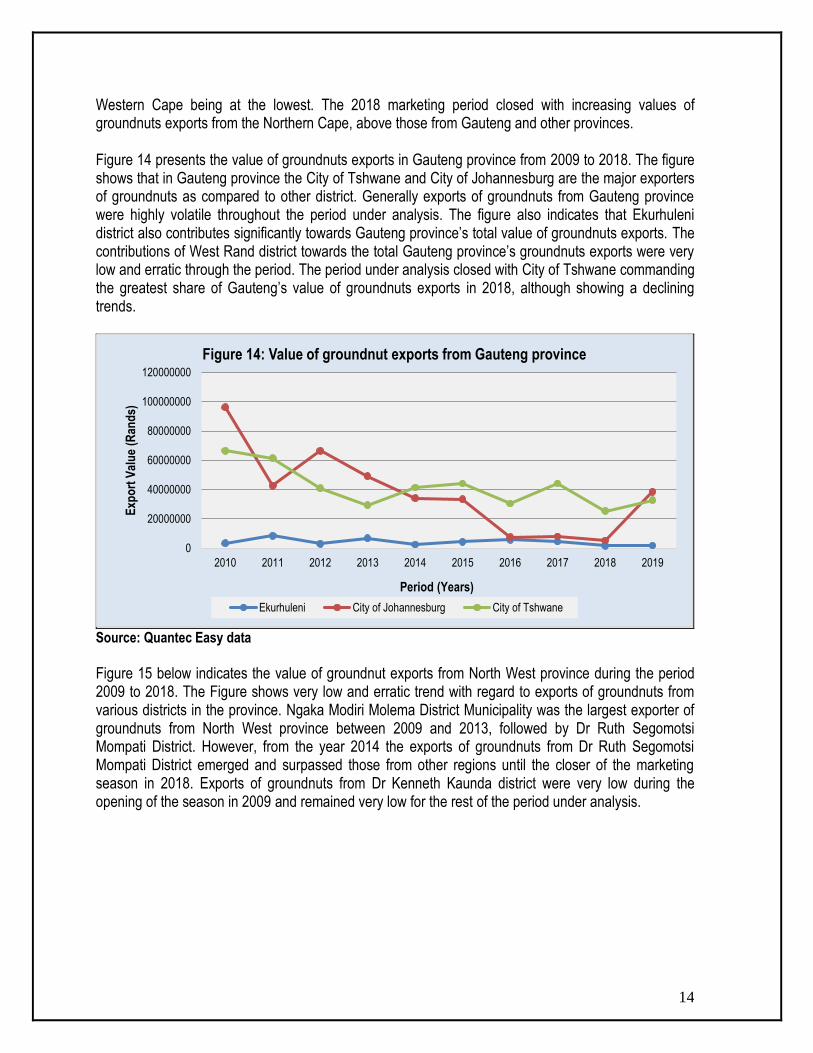
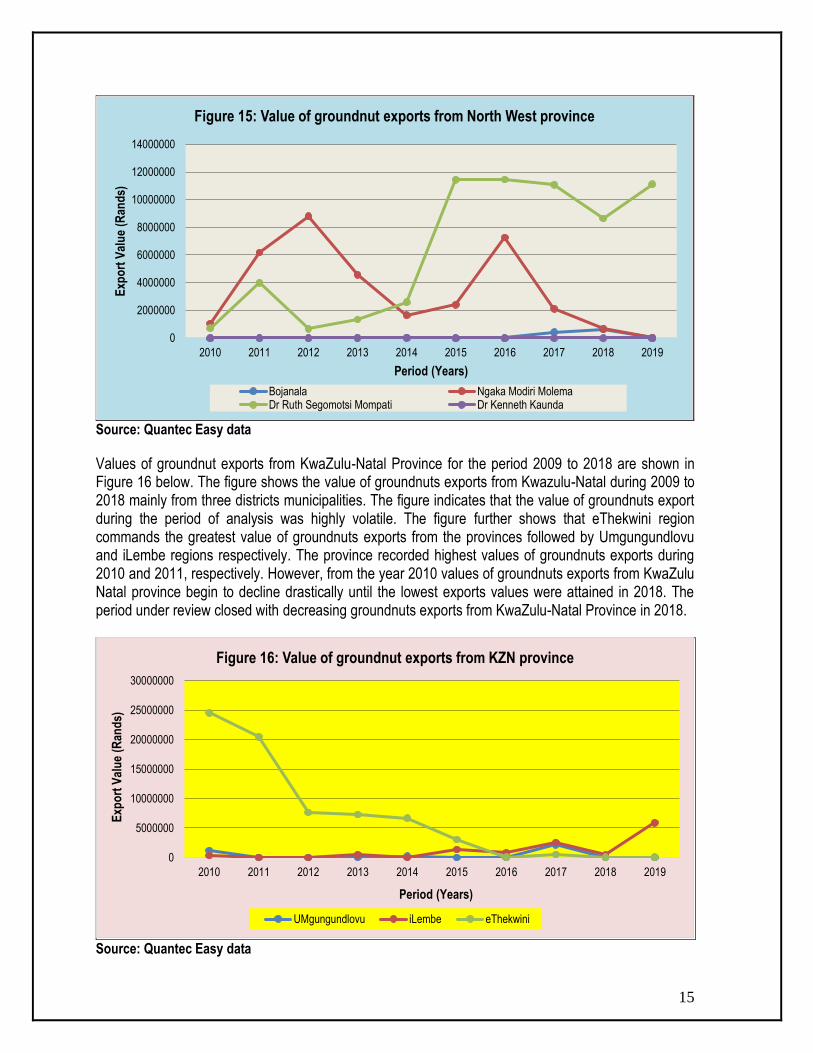
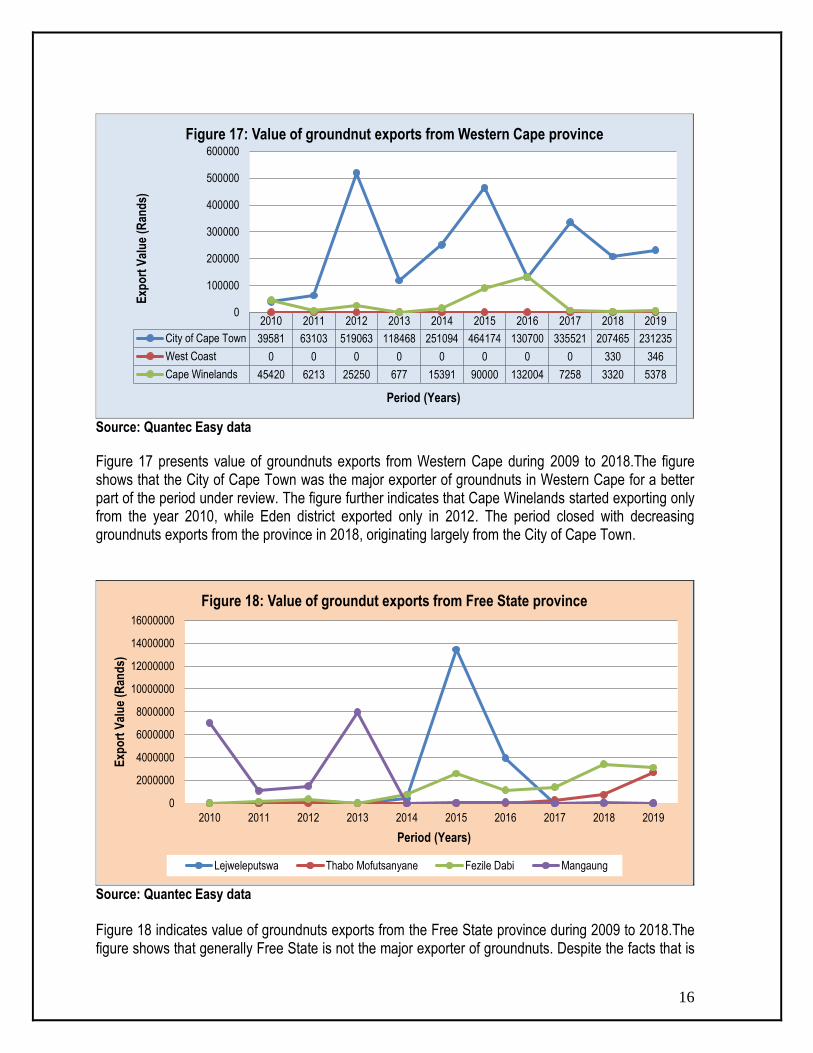
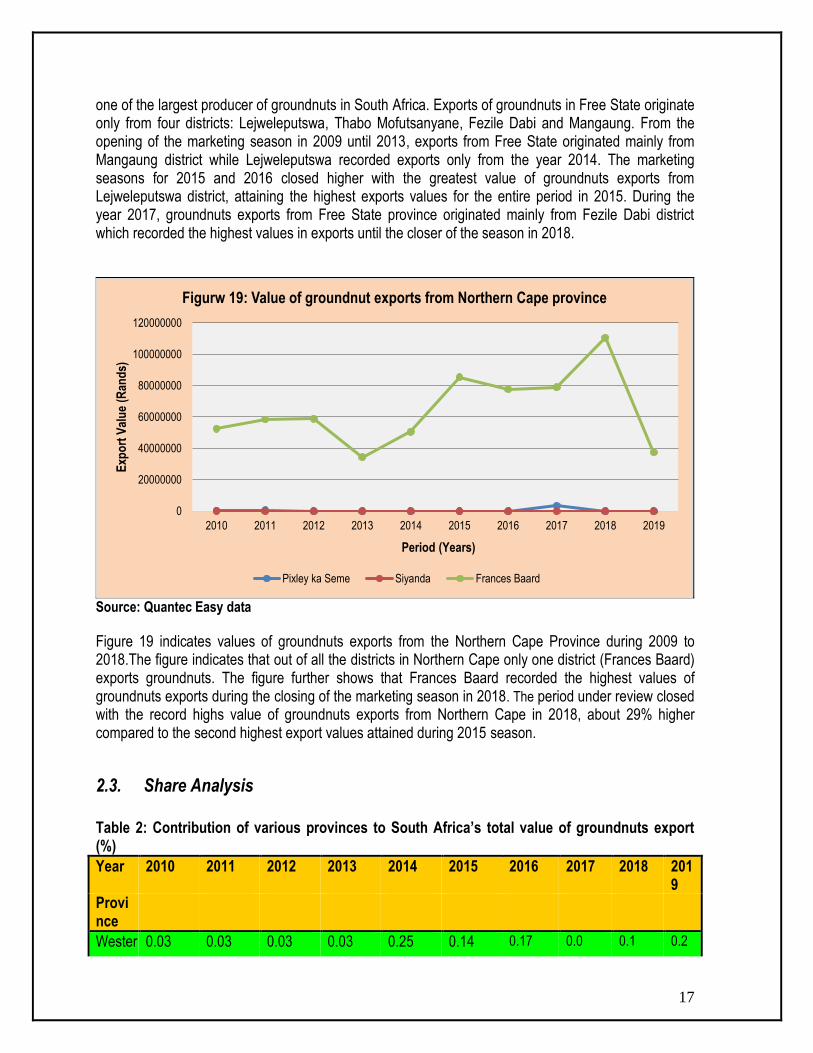
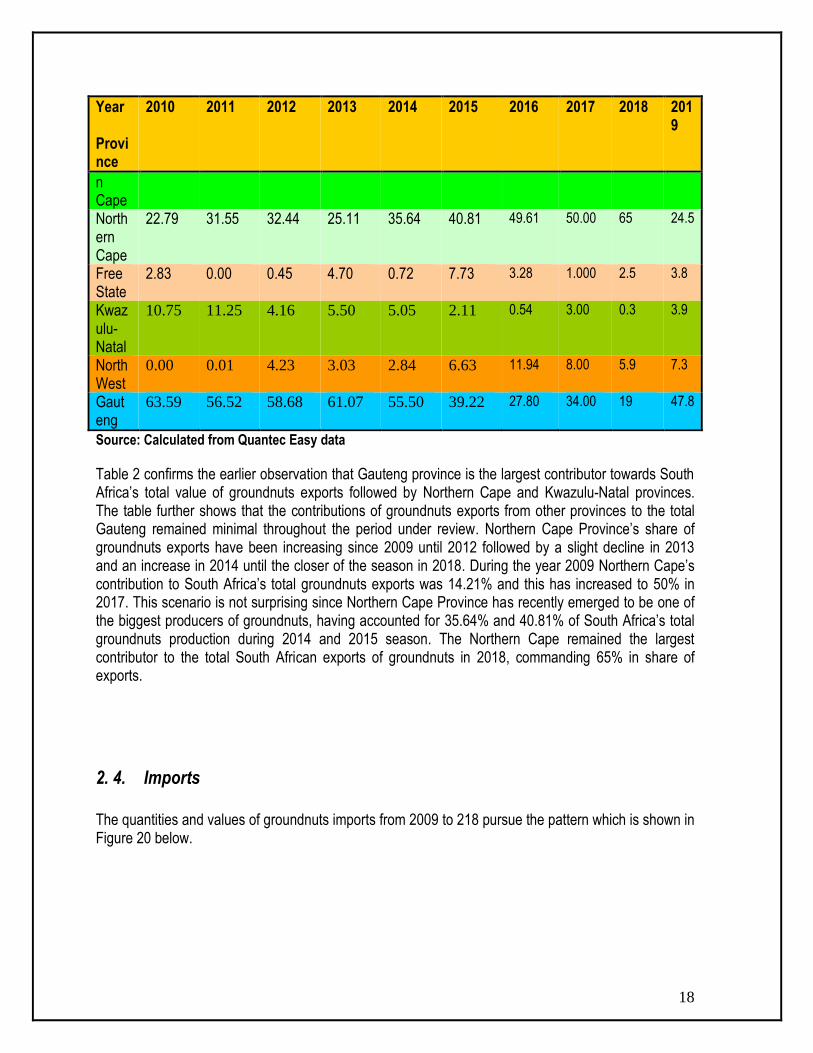
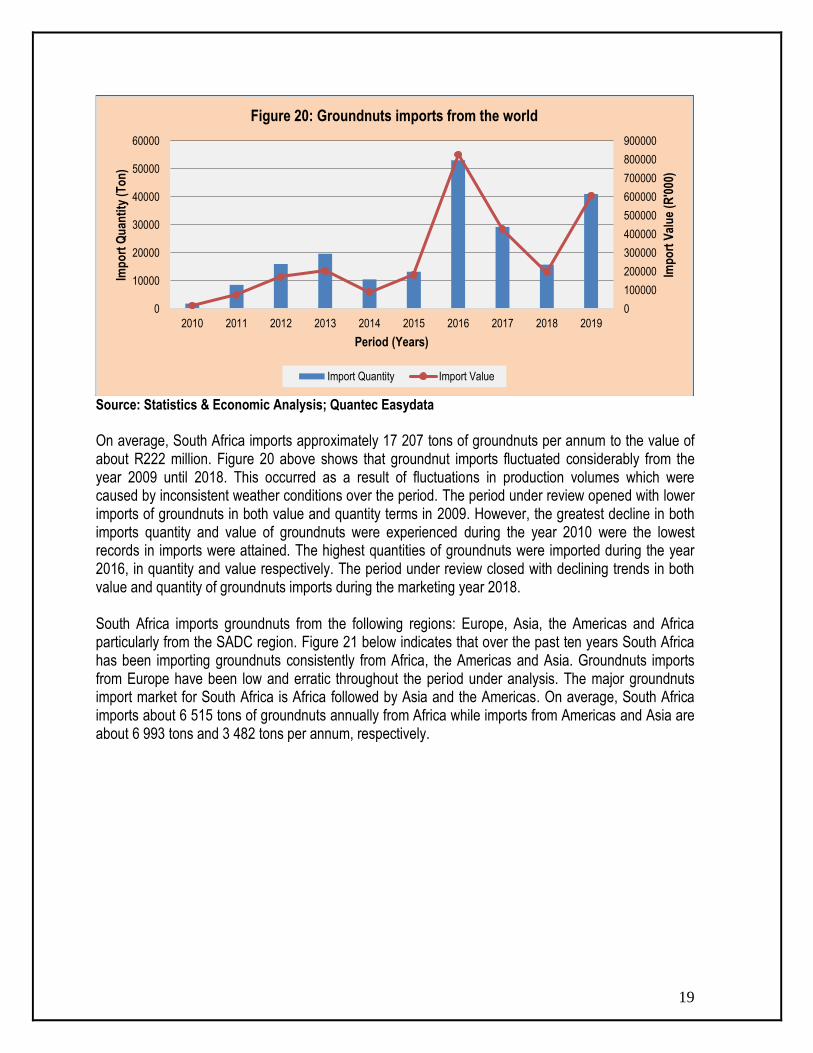
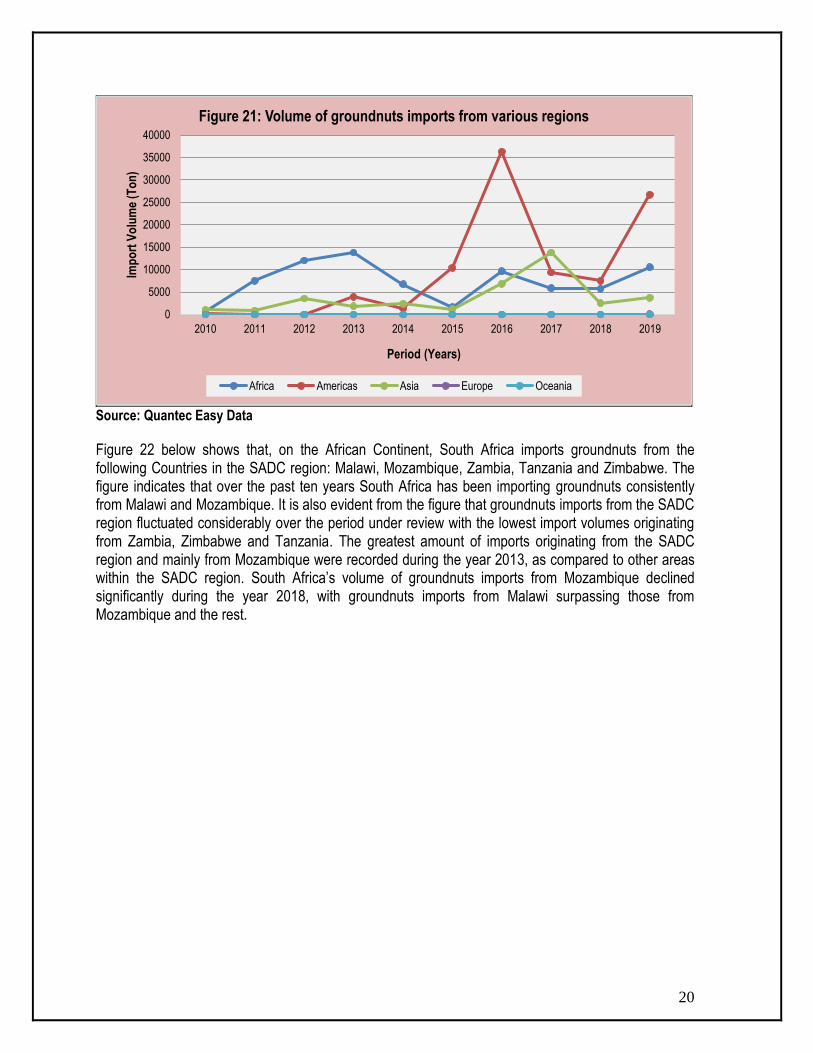
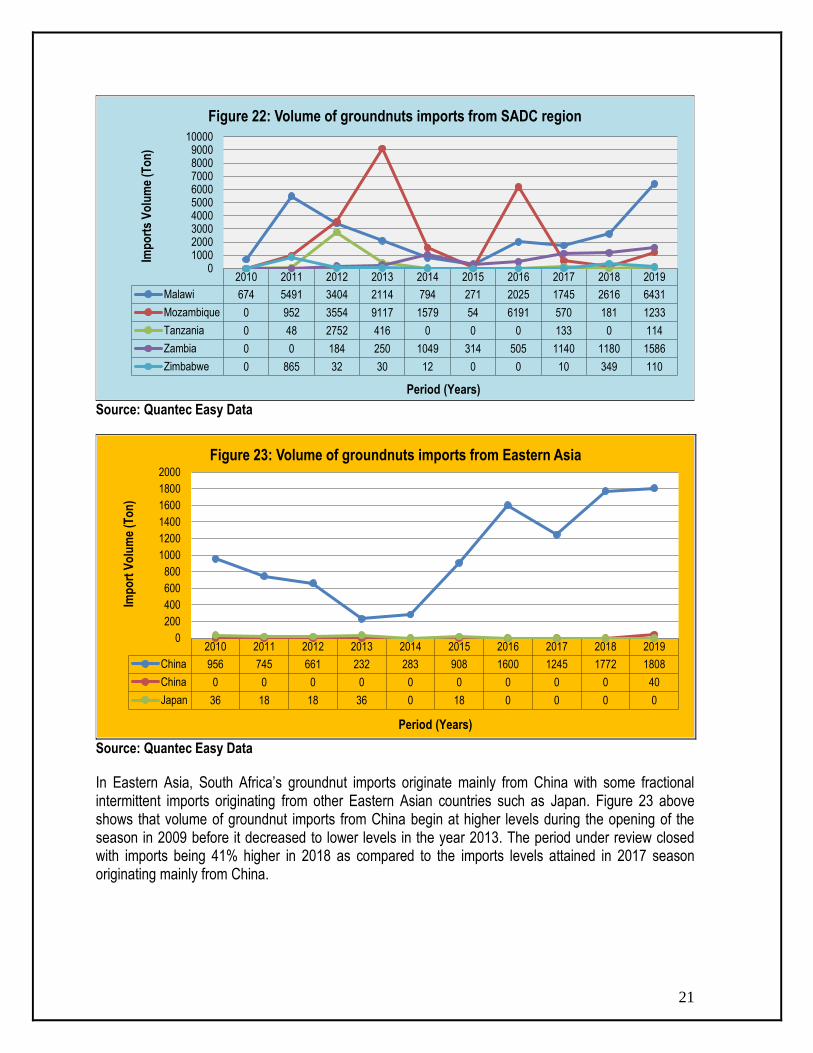
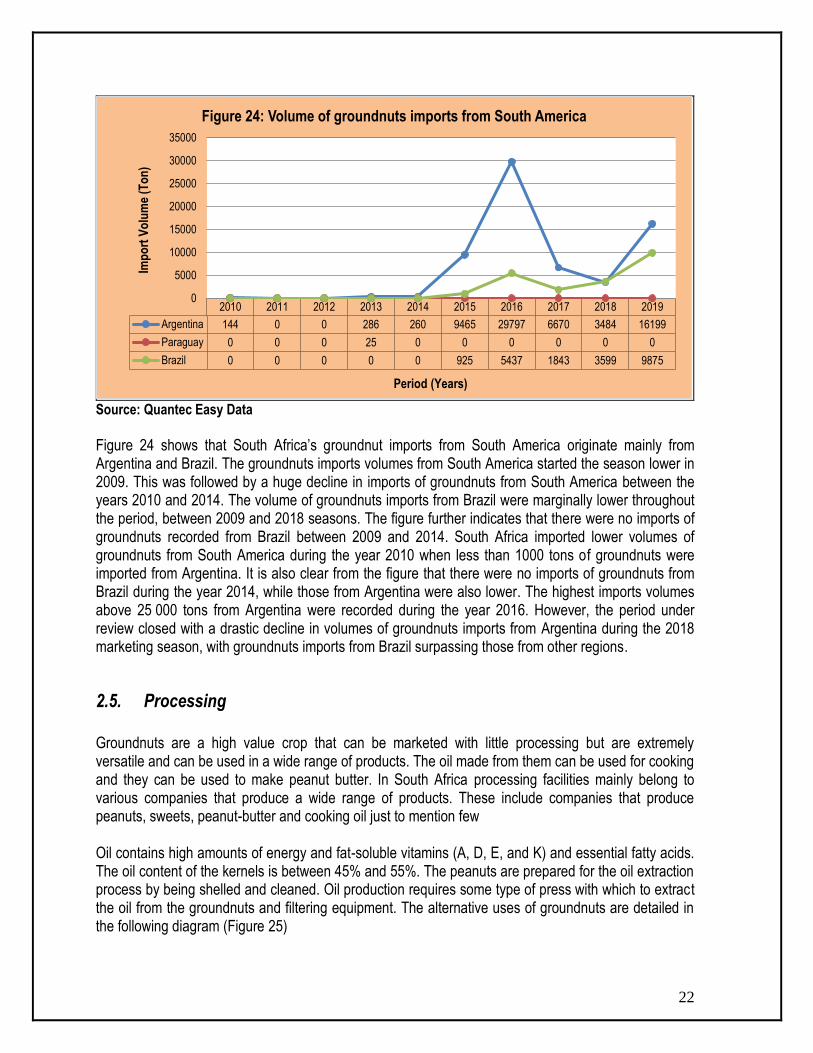
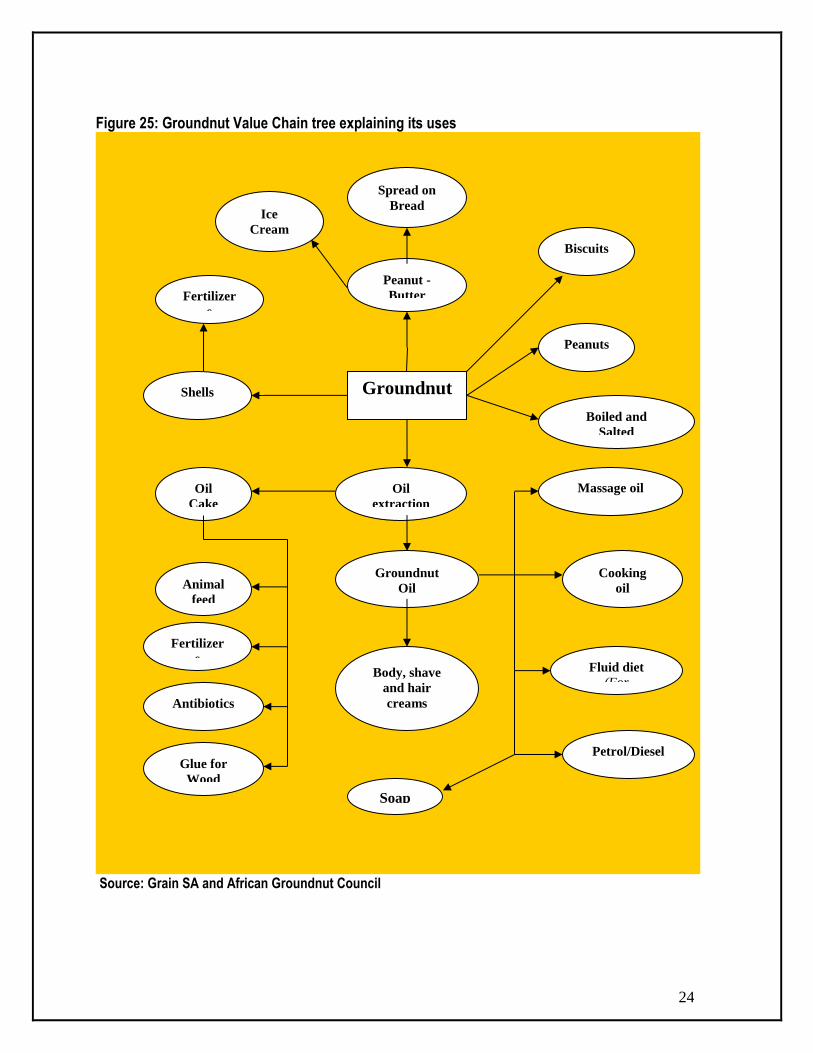
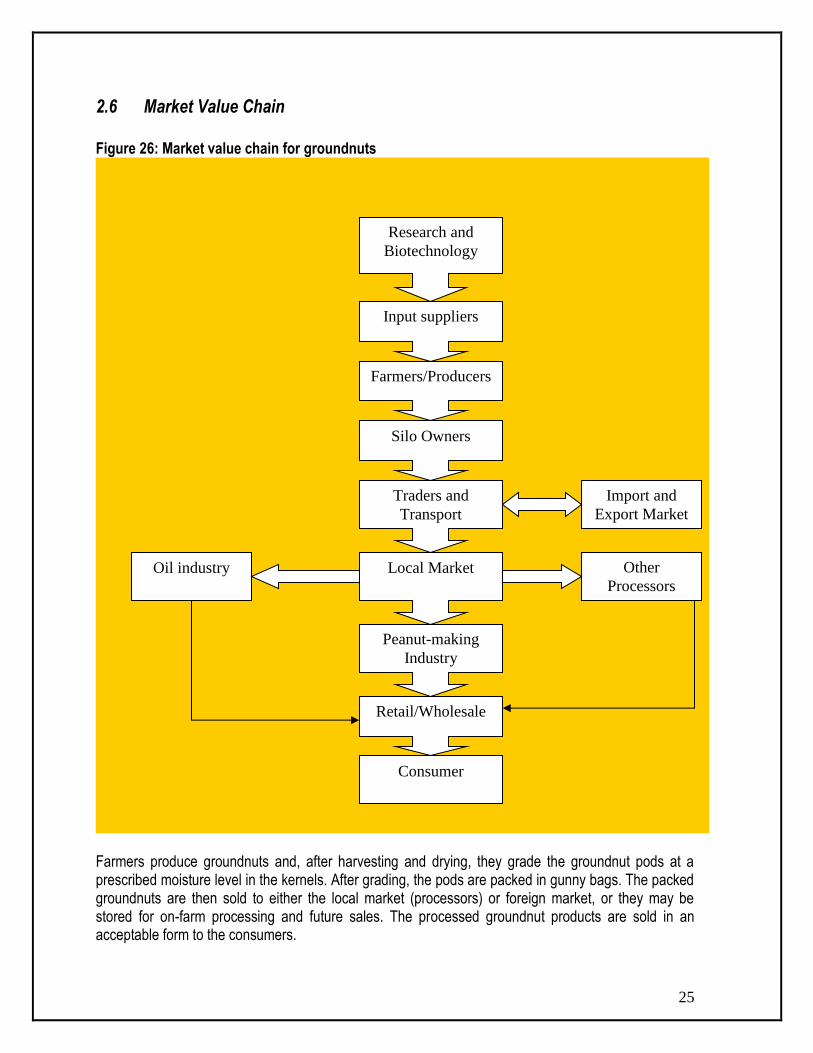
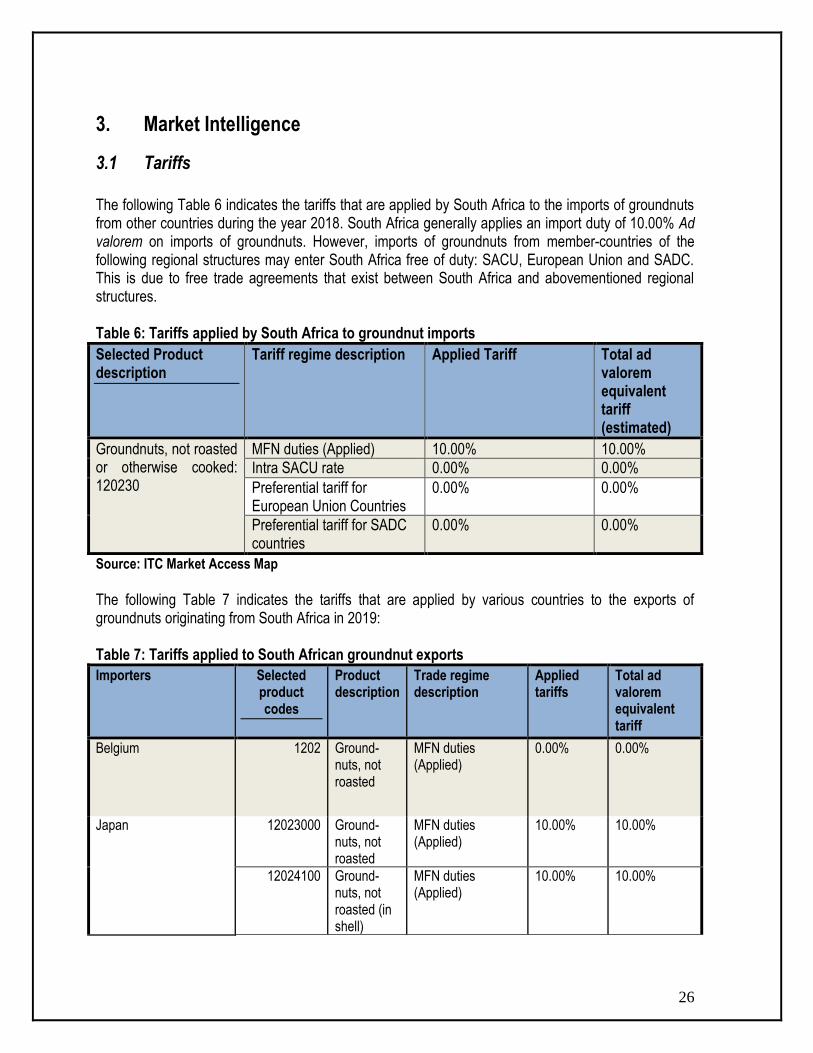
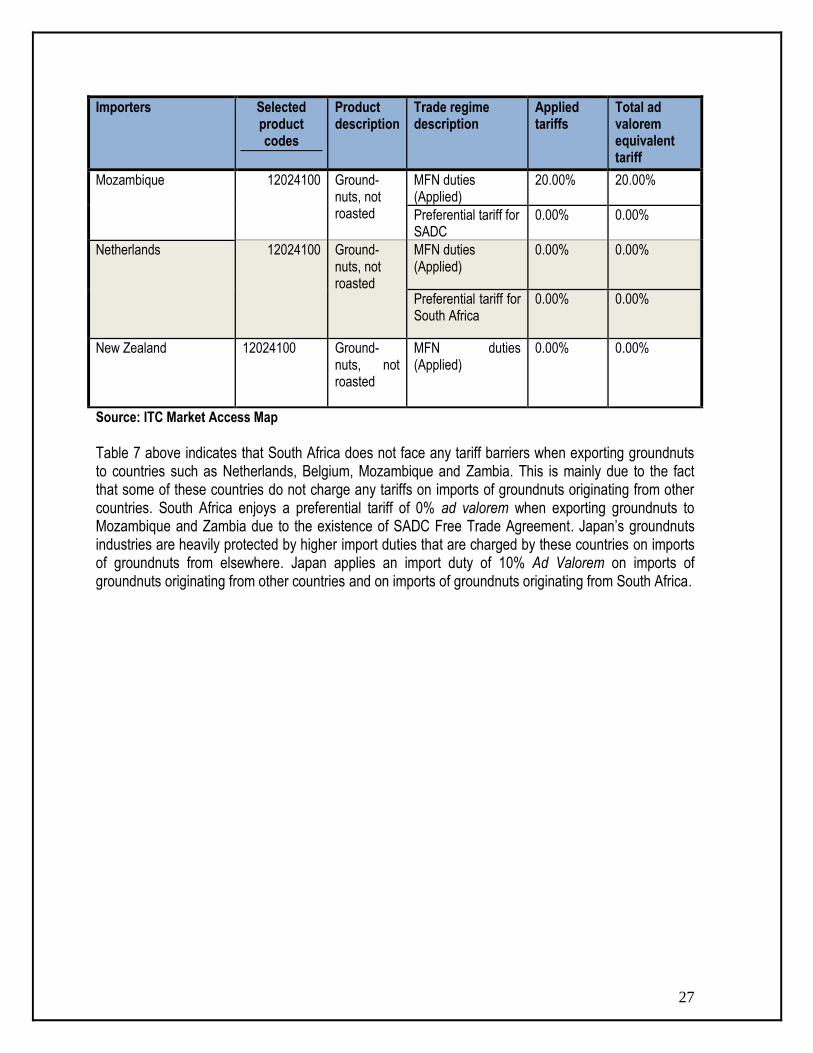
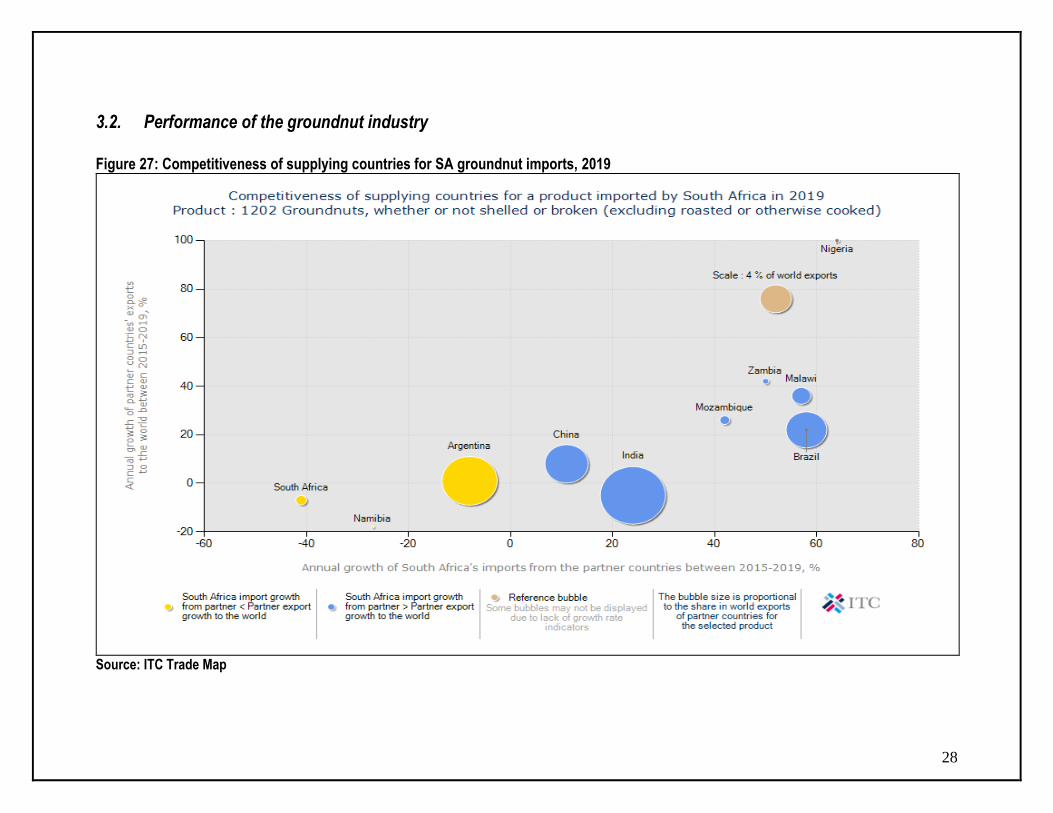
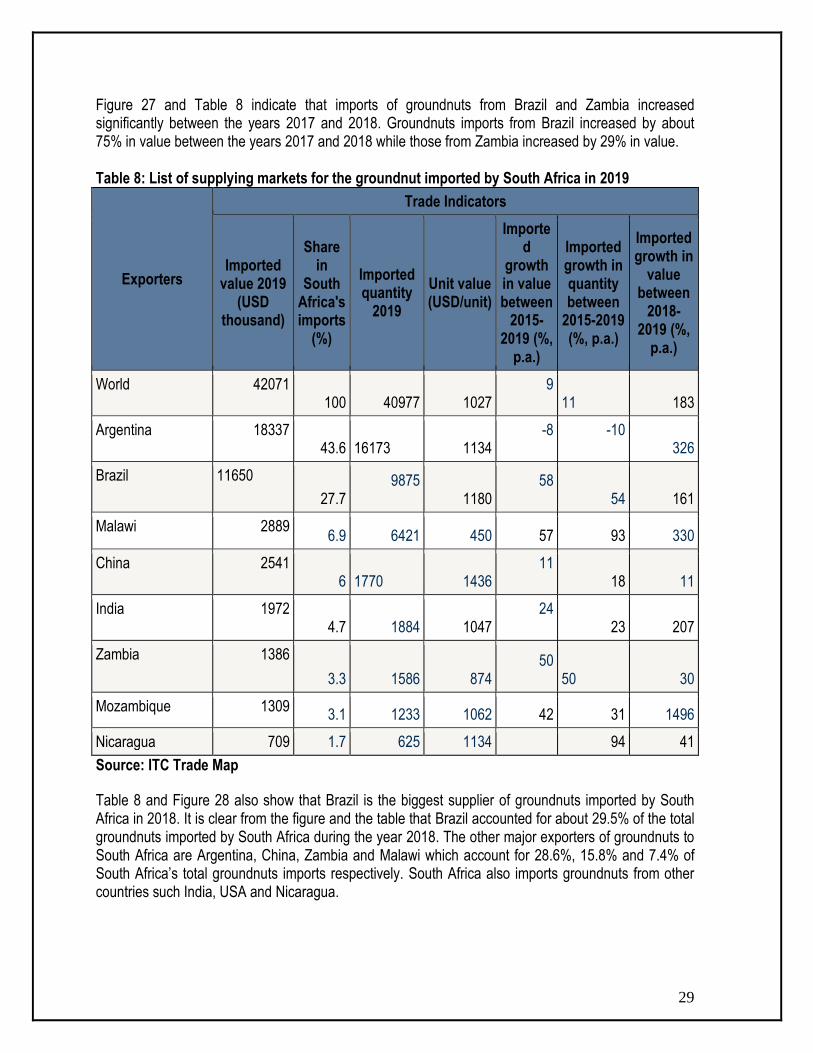
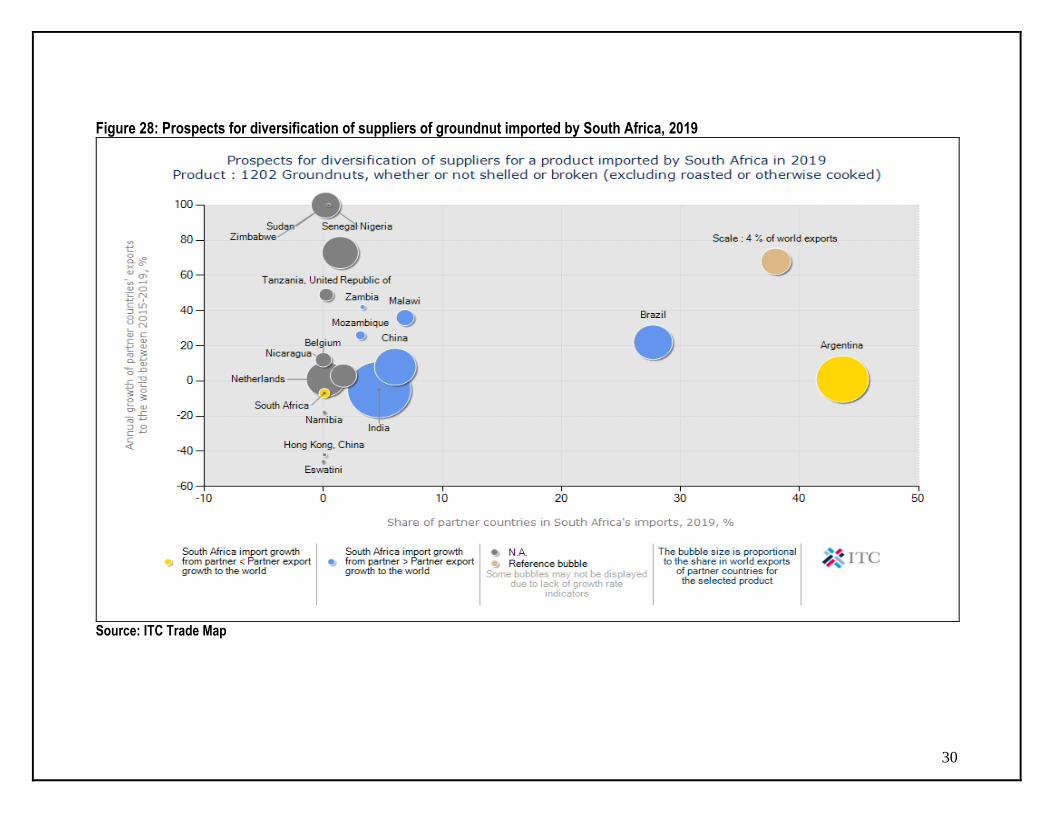
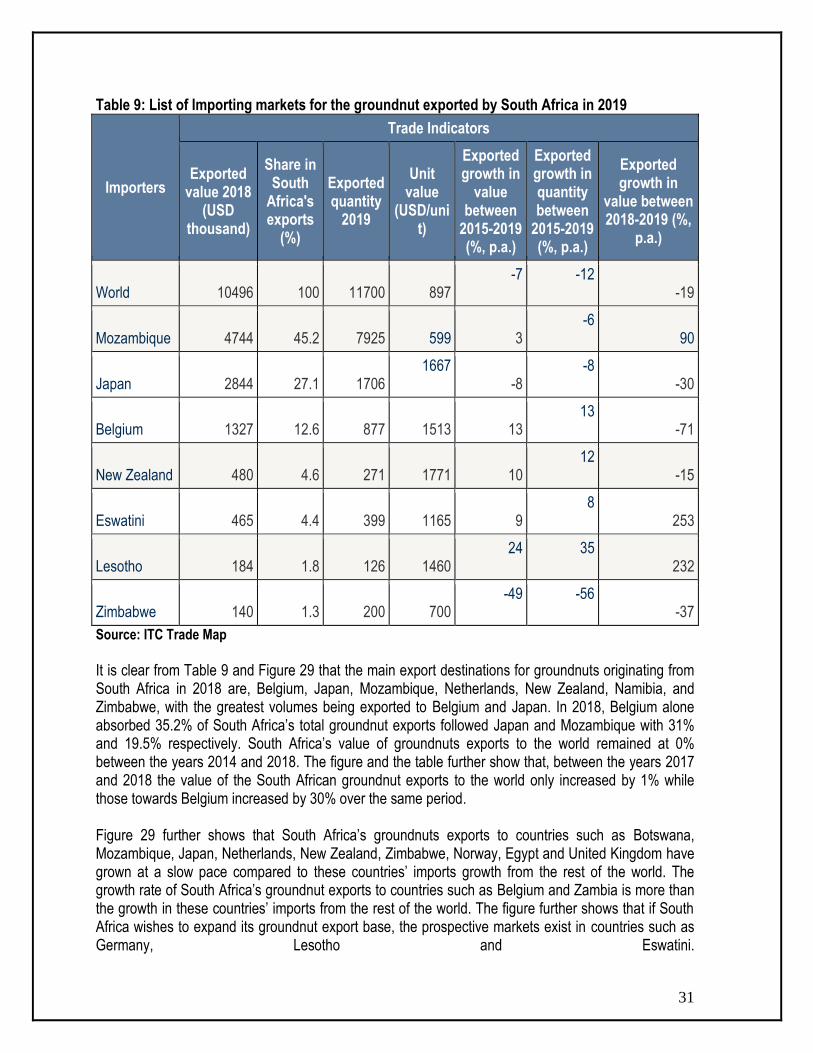
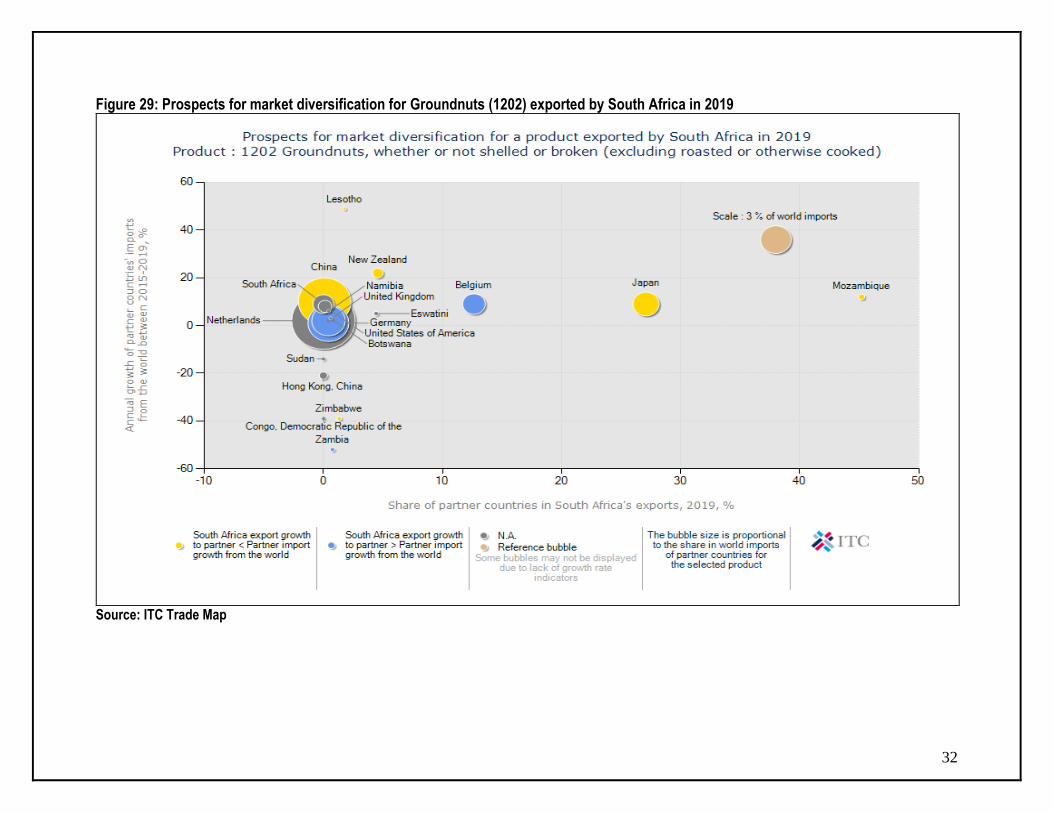