Value Chain
89
Value Chain Management Module: Student Report ERASMUS+ HIGHER EDUCATION – INTERNATIONAL CAPACITY BUILDING PROGRAM Participatory and Integrative Support for Agricultural Initiative August 8-26, 2018 Chiang Mai University, Chiang Mai, Thailand
-
Upload
khangminh22 -
Category
Documents
-
view
3 -
download
0
Transcript of Value Chain
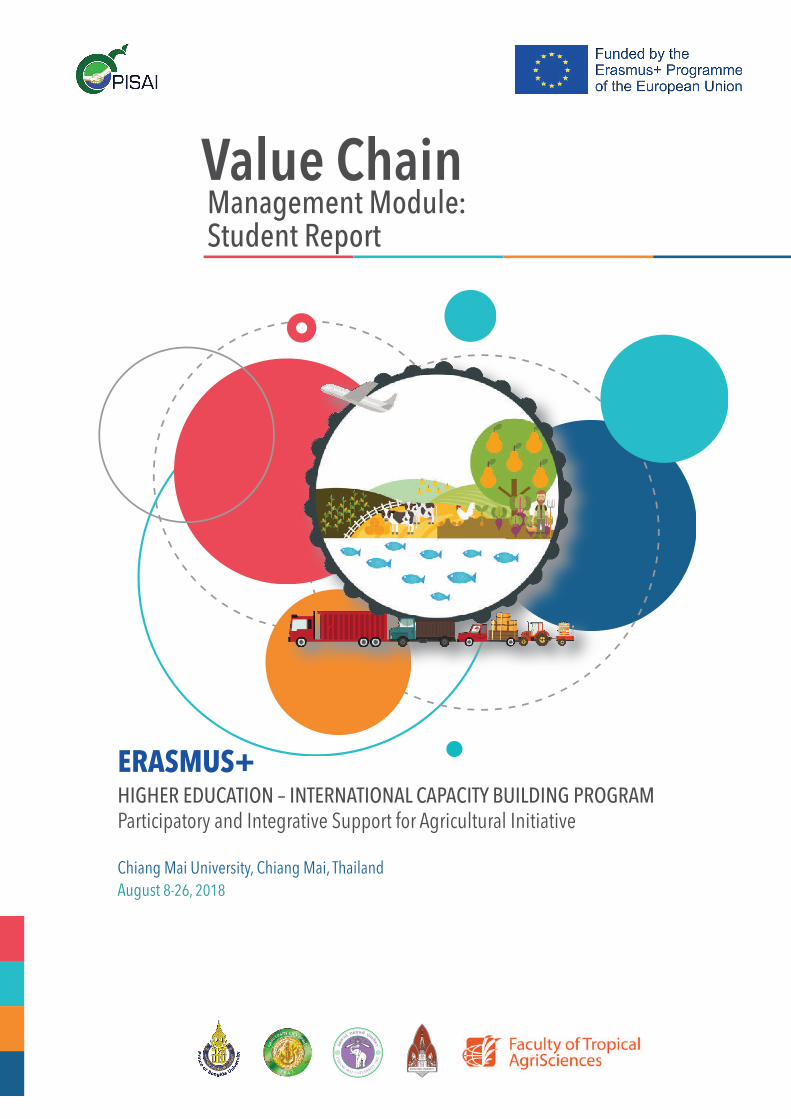
Value Chain Management Module: Student Report
ERASMUS+HIGHER EDUCATION – INTERNATIONAL CAPACITY BUILDING PROGRAMParticipatory and Integrative Support for Agricultural Initiative
August 8-26, 2018Chiang Mai University, Chiang Mai, Thailand
Chilli report

Value chain analysis and customer preferences of chilli peppers in Chiang Mai Province
Wantanee Meeloon1*, Simon Klimuskin2, Niyaporn Khwanket3 & Sanni Toratti4
1Department of Horticulture, Faculty of Agriculture, Khon Kaen University. 2 Department of Waste management, Faculty of Agrobiology, Food and Natural Resources, Czech University of Life Sciences Prague 3Department of Entomology, Faculty of Agriculture, Kasetsart University 4Department of Agriculture, Faculty of Agriculture and Forestry Helsinki University *Corresponding email: [email protected] Abstract This study is divided in two main tasks. First part is focused on providing analysis from summarized data from three subject (producers, sellers and customers) in order to provide precise overview of chilli peppers production and consumption with general knowledge about chilli peppers preferences in Chiang Mai province. In second part are described differences between dry and fresh chilli peppers. Focusing on relationship among farmers. Key words: chilli peppers, chilli production, chilli consumption, chilli preferences, value chain 1. Introduction Chilli peppers (Solanaceae: Capsicum annuum L.) are fruits that are used to give spiciness to food. The level of pungency of a chilli depends on the amount of the compound capsaicin. There are numerous varieties of chilli that differ in appearance and pungency.
For this research we identified the three most commonly sold and used chilli varieties in Chiang Mai Province: bird’s eye chilli, banana pepper and cayenne pepper. Of these varieties, bird’s eye chili has the highest amount of capsaicin, approximately 200,000 Scoville heat units (Gurung et al. 2011). The amount of capsaicin in cayenne pepper is approximately 30,000–50,000 Scoville heat units. The capsaicin content of banana pepper varies among different types, but it is typically lowest of these three types.
In Thailand chilli is commonly sold and used in both fresh and dried form. Dried chilli requires more processing than fresh chilli, but it can also be sold at a higher price.
In this research we characterize the value chain of fresh and dried chilli in the form of case study. Furthermore, we assess customer preferences among the three most commonly sold chilli varieties and preference between fresh and dry chilli in Chiang Mai Province.
1.1 Why this product Chilli is famously an essential part of Thai cooking and according to the Ministry of Public Health the people of Thailand consume five grams of chilli on a daily basis (Athipanyakul and Pak-Uthai 2012). Chilli is also an important source of income especially for small-scale farmers in Thailand. It is worth noticing that the majority of Thailand’s agricultural workforce consists of small-scale farmers (Plianbangchang et al. 2009). The cultural and economic importance of chilli in Thailand make it an interesting produce to study. 1.2 Economic analysis Chilli peppers are fourth most produced crop from vegetable segment in thailand (Johnson et al. 2008). Chilli peppers an important crop of tropical and subtropical countries, cultivated in large areas of Asia, Africa, South, and Central America and southern Europe, the total area under cultivation in the world is about 1.9 million hectares. In Thailand is now under strong tendency to leave conventional practises and transfer to alternative and bio practises (GAP). Although this tendency in case of producing chilli peppers is documented that most of the farmers are still using and overusing pesticides before and after harvesting. Overusing of pesticides outcome to ban from EU on exporting chilli peppers due to pesticides contamination in 2011. Situation was quickly solved because there are documented informations about volume of export in 2012. (FAOSTAT 2012). In last few decades farmers from nothers thailand are switching from subsistence crops to cash crops. In case of small mountain tribes farmers it is estimated that dry chilli is more produced and in bigger cities is prefered fresh chilli cash crops are more more profitable and increasing live standart of farmers due to higher income (Jian 2001). Price for the dry chilli is in range between 1,900-2,700 /Ton and for fresh is it US $ 1,700-2,400 /Ton this price is set by big companies and supermarkets.Yield for dry chilli peppers is stated from year 2016 to be 41177 hg/ha an for fresh chilli 137174 hg/ha. Production of dry and fresh chilli per ha is 379349 and 18388 (FAOSTAT 2016). 1.3 Social analysis There are alarming studies (Kachaiyaphum et al. 2010, Athipanyakul and Pak-Uthai 2012) of the frequent exposure of Thai chilli farmers to pesticides. Pesticides include
insecticides, fungicides and herbicides, and they are used to avoid financial losses of the yield (Thapinta and Hudak 2000). Overuse of pesticides poses the health of the farmers under serious threat. Adoption of Good Agricultural Practices (GAP) could promote safer use of chemicals and also help to reduce pesticide use among farmers (Athipanyakul and Pak-Uthai 2012). Work is thus being done to help chilli farmers adopt GAP in their farming systems. 1.4 Environmental analysis Inappropriate pesticide use in chilli cultivation is a threat not only to human health, but also to the environment (Plianbangchang et al. 2009). Pesticide residues have been found in water and soil all over Thailand (Thapinta and Hudak 2000). Possible ways to reduce excessive pesticide use could be the adoption of Integrated Pest Management (IPM) and ending incentives for the use of pesticides (Plianbangchang et al. 2009).
2. Objectives
a) Summarize information about highly grown crop (chilli peppers) from Thailand b about production, processing and selling.
o Farmers: price/g, yield/ha, varieties, transportation etc. o Sellers: Where do they buy the product? Selling price ? Variety
preferences ? etc.
o Customers: socio-demographic, variety preferences, expenses on product, fresh or dry preferences etc.
b) Connect informations provide analysis for the farmers about product and space to improvement.
c) To describe differences between dry and fresh chilli value chains.
3. Methodology 3.1 Research design
Information for our study were summarized from chilli producers, sellers and consumers via online and printed questionnaires and interview with farmers and sellers. Numbers of respondents are visible in Table 1.

Table 1. Division of survey methods among the respondents.
Type of respondents Sample size (person) Method
Farmers 2 Interview
Sallers 11 Interview
Customers 129 Online and printed questionnaires
Approach: Division of work between Thai and European students Thai students were in charge of interviewing farmers and sellers and European students were in charge of collecting information via translated questionnaires to Thai. 3.2 Data collection The markets were the data was collected from: 1.Muang Mai market (wholesaler) 2.Mae Malai market (local market) 3.Tesco lotus 3.3 Data analysis Microsoft Excel 2010 4. Results 4.1 Farmers’ perspective 4.1.1 Puoangphet organic farm History of Puoangphet organic farm Puoangphet organic farm was founded in 2008 at Thakuong Subdistrict Saraphi District Chiang Mai Province (18° 39'21.7 "N 99° 00'10.4" E). Puoangphet organic farm was established by recommendation of Royal projects staff and then she got a training on organic agriculture form Royal projects. First time she planted some home-grown vegetable around her house and she took cost by her budget. Then she
build wells to prevent some toxic and stay water from irrigation. She plant more than 15 vegetables such as morning glory, wing bean, herb, chardonnay, cucumber, longan, okra, ginger, malabar, mango, lime, sweet potato, grapefruit, gingko and chilli. In addition she processes her product to soap, sweets and Thai desserts. She gets money from her product about 9,000 baht / month. She got GAP (Good Agricultural Practices) certificate from department of Agriculture Thailand Government. Chilli planting and maintenance The three varieties of chilli that she plant are banana pepper, cayenne pepper and bird’s eye chilli. The plot of chillies 1 × 3 meters. She applies organic fertilizer once a week and irrigates with a water sprinkler system once a week.
Harvesting She can harvest one crop for 6 months. Chilli yield is 2-3 kg/month by she harvest chilli peppers in green and red color. Then she packs them in a bag of 1 gram and she sells them 10 baht per pack. She sold the chilli product and another vegetable at the JJ market and she got budget income of 2,000 – 3000 baht per month. 4.1.2 Boonsong organic farm History of Boonsong organic farm Mr. Boonsong worked at the Faculty of Agriculture. He is 32 years old. He sends his products to be sold at AGGIE shop at the Faculty of Agriculture in Chiang Mai University. He used to send his products to Central Kadsuankeaw but he doesn’t have time to send products there anymore. At AGGIE shop, they sell safe products. Product of Boonsong farm such as pakchoi, longan, eggplant, chilli, sunflower, bean, lentil. His income by selling of vegetables is 1,500 baht per week and by selling longan is 1500,000 baht per year. Chilli planting and maintenance Mr. Boonsong plants two varieties of chilli: bird’s eye chilli and cayenne pepper. He plants chillies in a multiple cropping system along with longan and other vegetables. He buys chilli seed from Saraphi district. The area to plant chilli is 0.08 ha. When he plant, the ridge-till 20-30 cm high and he add the manure once per week. He sprays the seedlings with wood vinegar with compost in a ratio of 1:2 were before planting and through the sprinkler system once per week to prevent pest. The sprinkler system irrigates the chillies once a day for 30 minutes.
Harvesting and distribution Farmer collected the fresh chilli, which was ordered by the customer and price depend on Bangkok market. He can harvest one crop for 6 months. Chilli yield is 20 -30 kilograms per month by she harvest chilli peppers in green and red color. And then he pack in a bag of 1 gram per bag. He sold the chilli product and another vegetable at the JJ market and AGGIE shop. He has income from chilli 2,000-3,000 baht per month.
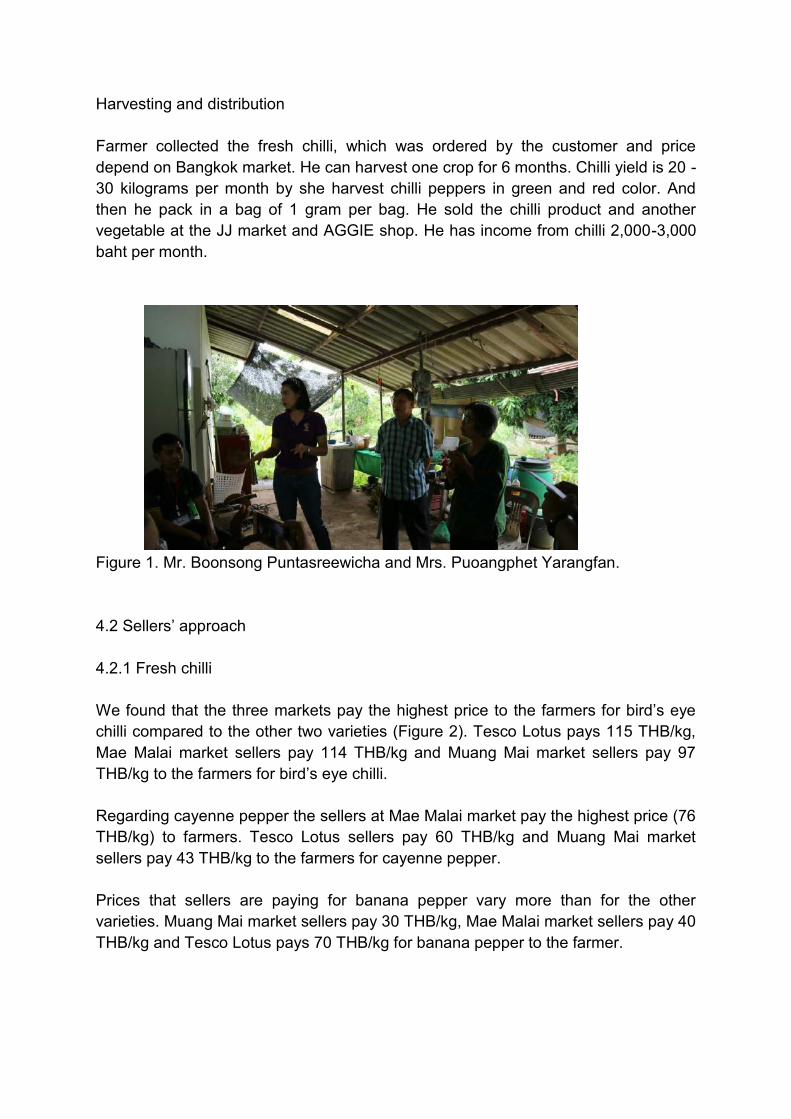
Figure 1. Mr. Boonsong Puntasreewicha and Mrs. Puoangphet Yarangfan.
4.2 Sellers’ approach 4.2.1 Fresh chilli
We found that the three markets pay the highest price to the farmers for bird’s eye chilli compared to the other two varieties (Figure 2). Tesco Lotus pays 115 THB/kg, Mae Malai market sellers pay 114 THB/kg and Muang Mai market sellers pay 97 THB/kg to the farmers for bird’s eye chilli. Regarding cayenne pepper the sellers at Mae Malai market pay the highest price (76 THB/kg) to farmers. Tesco Lotus sellers pay 60 THB/kg and Muang Mai market sellers pay 43 THB/kg to the farmers for cayenne pepper. Prices that sellers are paying for banana pepper vary more than for the other varieties. Muang Mai market sellers pay 30 THB/kg, Mae Malai market sellers pay 40 THB/kg and Tesco Lotus pays 70 THB/kg for banana pepper to the farmer.
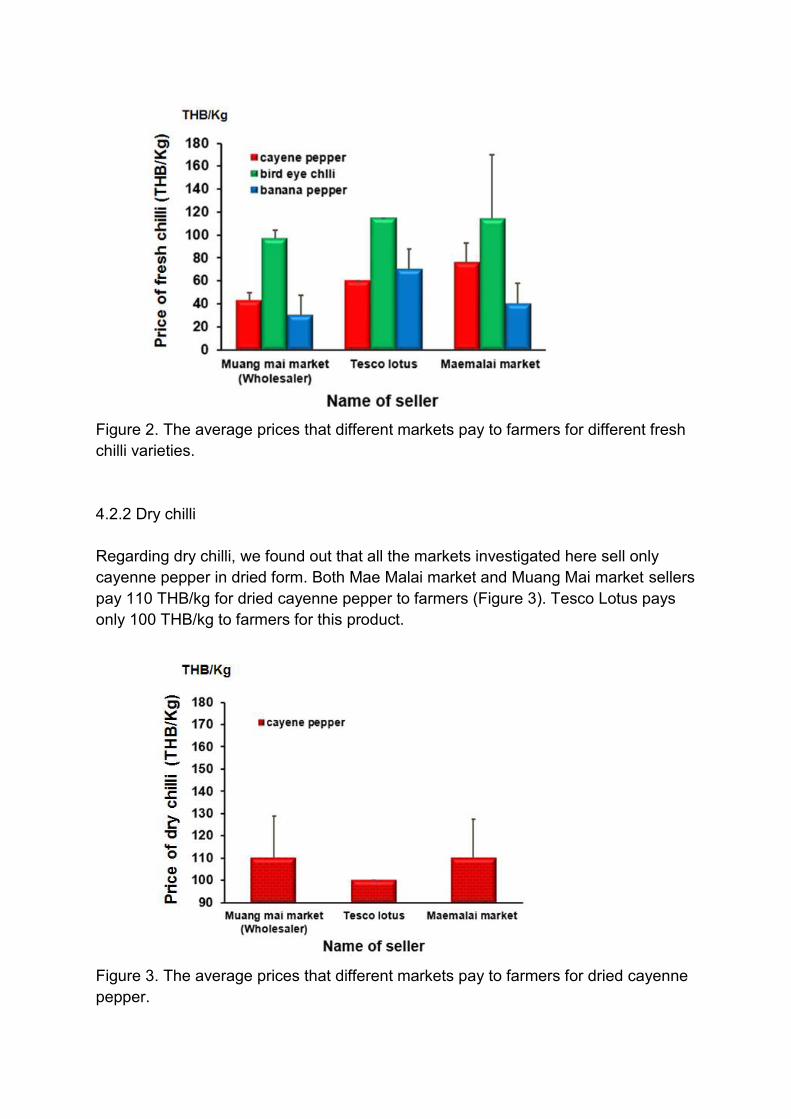
Figure 2. The average prices that different markets pay to farmers for different fresh chilli varieties. 4.2.2 Dry chilli Regarding dry chilli, we found out that all the markets investigated here sell only cayenne pepper in dried form. Both Mae Malai market and Muang Mai market sellers pay 110 THB/kg for dried cayenne pepper to farmers (Figure 3). Tesco Lotus pays only 100 THB/kg to farmers for this product.
Figure 3. The average prices that different markets pay to farmers for dried cayenne pepper.
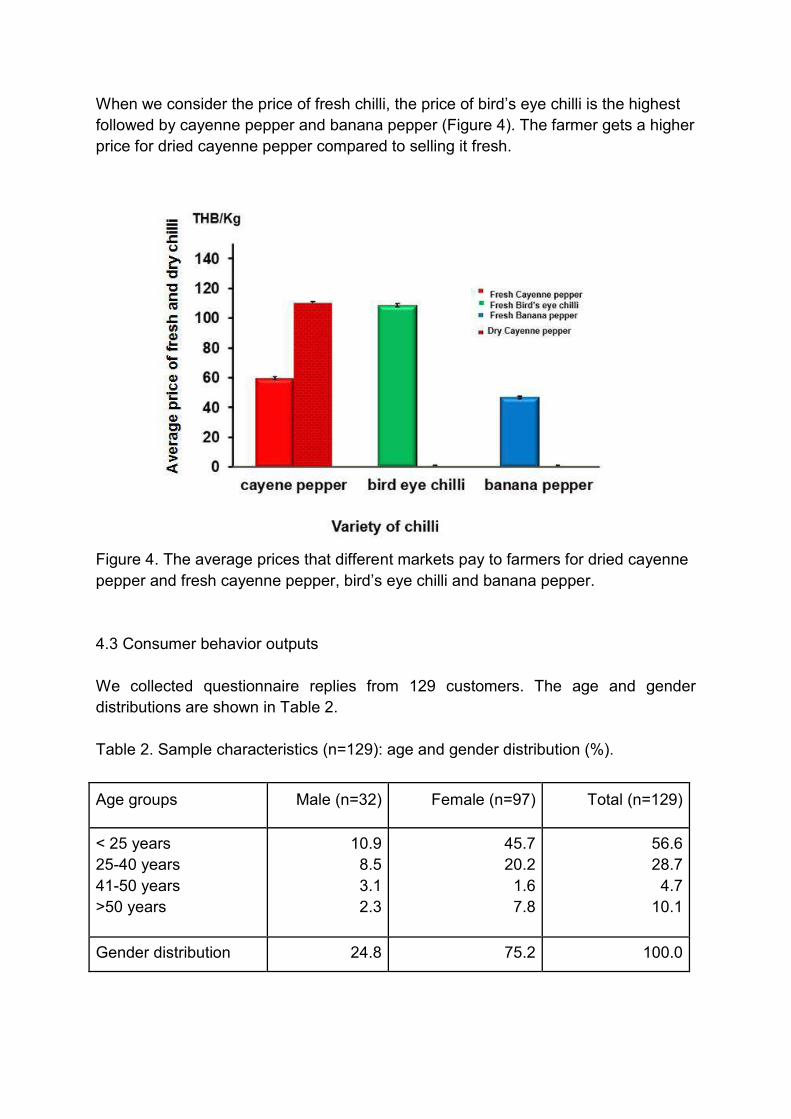
When we consider the price of fresh chilli, the price of bird’s eye chilli is the highest followed by cayenne pepper and banana pepper (Figure 4). The farmer gets a higher price for dried cayenne pepper compared to selling it fresh.
Figure 4. The average prices that different markets pay to farmers for dried cayenne pepper and fresh cayenne pepper, bird’s eye chilli and banana pepper. 4.3 Consumer behavior outputs
We collected questionnaire replies from 129 customers. The age and gender distributions are shown in Table 2.
Table 2. Sample characteristics (n=129): age and gender distribution (%).
Age groups Male (n=32) Female (n=97) Total (n=129)
< 25 years 25-40 years 41-50 years >50 years
10.9 8.5 3.1 2.3
45.7 20.2
1.6 7.8
56.6 28.7
4.7 10.1
Gender distribution 24.8 75.2 100.0
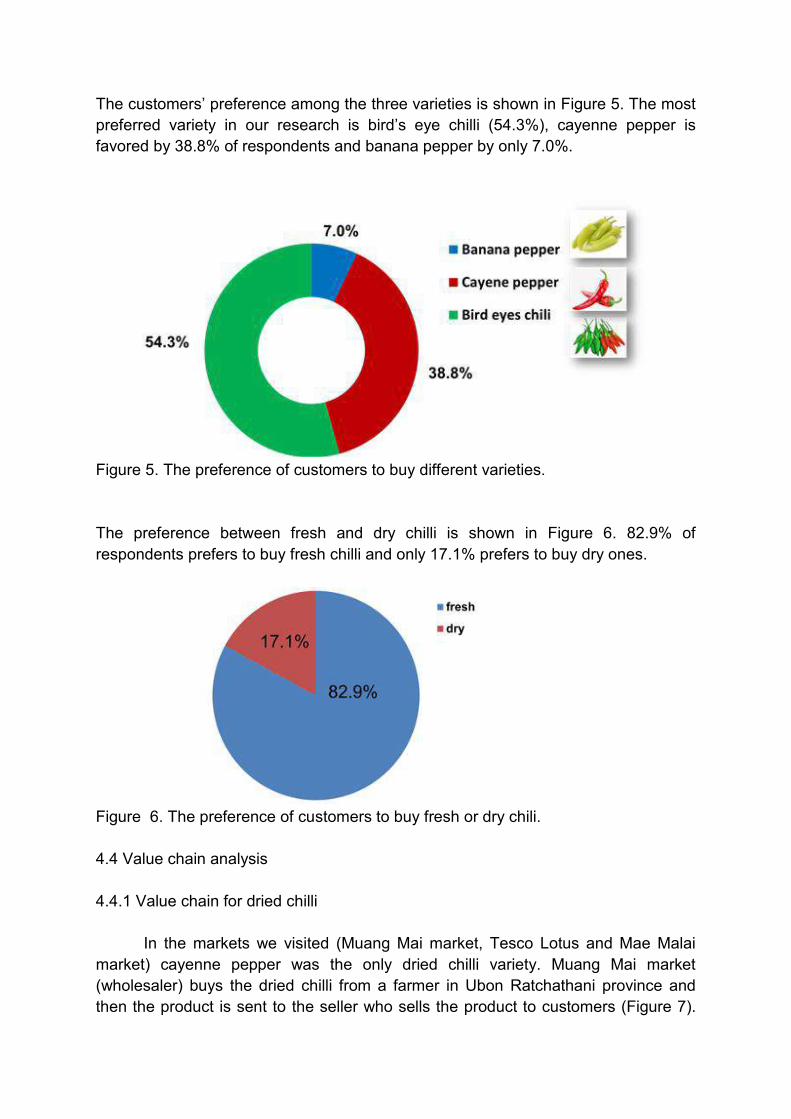
The customers’ preference among the three varieties is shown in Figure 5. The most preferred variety in our research is bird’s eye chilli (54.3%), cayenne pepper is favored by 38.8% of respondents and banana pepper by only 7.0%.
Figure 5. The preference of customers to buy different varieties. The preference between fresh and dry chilli is shown in Figure 6. 82.9% of respondents prefers to buy fresh chilli and only 17.1% prefers to buy dry ones.
Figure 6. The preference of customers to buy fresh or dry chili. 4.4 Value chain analysis 4.4.1 Value chain for dried chilli
In the markets we visited (Muang Mai market, Tesco Lotus and Mae Malai market) cayenne pepper was the only dried chilli variety. Muang Mai market (wholesaler) buys the dried chilli from a farmer in Ubon Ratchathani province and then the product is sent to the seller who sells the product to customers (Figure 7).

Tesco Lotus buys dried chilli from a wholesaler in Bangkok province. Mae Malai market (local market) seller buys the dried chilli from a wholesaler in Muang Mai market.
Figure 7. The Value chain of dried chilli.
4.4.2 Value chain for fresh chilli All the three chilli varieties (bird’s eye chilli, cayenne pepper and banana pepper) were sold fresh on the markets we visited. At Muang Mai market, the seller got the fresh chilli from Chiang Dao district and Chom Thong district in Chiang Mai province and Nan province also and then chilli product were sent to another seller afterward seller sent chilli product to the customer (Figure 8). For Tesco Lotus the value chain is the same as with the dried chilli. In Mae Malai market, they got the fresh chilli from Mae Taeng district, San Sai district in Chiang Mai province and Muang Mai market (wholesaler) and then they sold the product to the customer.
Figure 8. The Value chain of fresh chilli.
5. Discussion From the three most commonly sold varieties, bird’s eye chilli is the one with the highest pungency. It is noteworthy that this was also the most preferred variety among our respondents. This is in accordance with previous results (Ooraikul et al. 2011), that have shown that the people in Northern Thailand prefer chilli with high pungency. In Thailand the production of dried chilli is bigger than that of fresh chilli (FAOSTAT 2016). Yet in our research we found that customers preferred to buy fresh chilli. No larger conclusions can however be drawn from our data due to the limitations of our sample. These were a small sample size and somewhat biased socio-demographic distribution of the respondents. From the two farmers we interviewed, the other one was farming organically and the other one was farming by the good agricultural practices (GAP) system. The interviewed farmers are thus aware of the hazards of pesticide use. This is encouraging, since it has been demonstrated that small-scale farmers in Northern Thailand have been using pesticides inappropriately (Plianbangchang 2009). 6. Conclusions and recommendations From summarized data we can tell that mostly prefered type of chilli pepper in Chiang Mai province is Bird Eyes chilli pepper in fresh form. This type of chilli is also the most expensive one so people are willing to pay more for product the product they want to purchase. From farmers point of view most profitable way is to sell fresh bird eyes chilli concretely to Tesco Lotus which is paying the highest price of 115 THB/kg. Due to the lack of data we are able to compare only prices of cayenne pepper between dry and fresh chilli. Farmers get paid more for dry chilli with highest selling price of 76 THB/kg on Mae Mai market. Differences between fresh and dry chilli are in range of 34-67 THB/kg and higher price is always for dry cayenne chilli. In case of value chain there are no significant differences, highest point of our study is that markets are more open to local small farmers in case of fresh chilli. Only dried variety is cayenne chilli pepper and for the farmers is more profitable to sell dried cayenne pepper because drying is mostly done by sunlight.

7. Our experience What was surprising mostly European students was the willingness of people to cooperate with us and that they were really interested in it. In Czech Republic or Finland is attitude of people on public research more sceptical.

Annexes 1. List of references Athipanyakul, T. & Pak-Uthai, W. 2012. Determinants of Good Agricultural Practices (GAP) adoption in the chili production system in Northeastern Thailand: A case of participatory approach. International Journal of Environmental and Rural Development 3–2: 175–180. Gurung, T., Techawongstien, S., Suriharn, B. & Techawongstien, S. 2011. Growth, yield and capsaicinoid contents of 14 cultivars of hot pepper (Capsicum spp.) at two elevations of Thailand. SABRAO Journal of Breeding and Genetics 43: 130–143. Jian, L. 2001. Development and Tribal Agricultural Economy in a Yao Mountain Village in Northern Thailand. Human Organization, 60(1), 80–94. Johnson, G.I., Weinberger, K., Wu, M.H. 2008. The Vegetable Industry in Tropical Asia: An overview of production and trade, with a focus on Thailand, Indonesia, the Philippines, Vietnam, and India [CD-ROM]. Shanhua, Taiwan: AVRDC – The World Vegetable Center. 56 pp. Kachaiyaphum, P., Howteerakul, N., Sujirarat, D., Siri, S. & Suwannapong, N. 2010. Serum cholinesterase levels of Thai chilli-farm workers exposed to chemical pesticides: Prevalence estimates and associated factors. Journal of Occupational Health 52: 89–98. Ooraikul, S., Siriwong, W., Siripattanakul, S., Chotpantarat, S. & Robson, M. 2011. Risk assessment of organophosphate pesticides for chili consumption from chili farm area, Ubon Ratchathani province, Thailand. Journal of Health Research 25: 141–146. Plianbangchang, P., Jetiyanon, K. & Wittaya-areekul, S. 2009. Pesticide use patterns among small-scale farmers: A case study from Phitsanulok, Thailand. The Southeast Asian Journal of Tropical Medicine and Public Health 40: 401–410. Thapinta, A. & Hudak, P. F. 2000. Pesticide use and residual occurrence in Thailand. Environmental Monitoring and Assessment 60: 103–114.
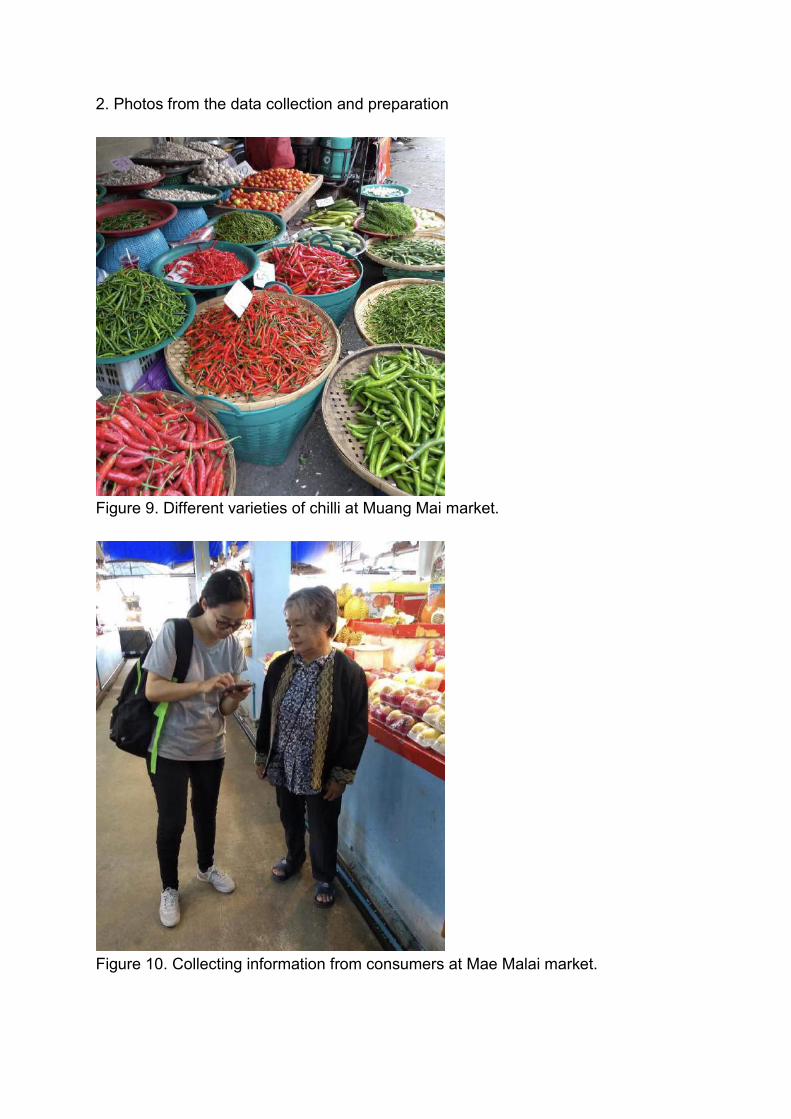
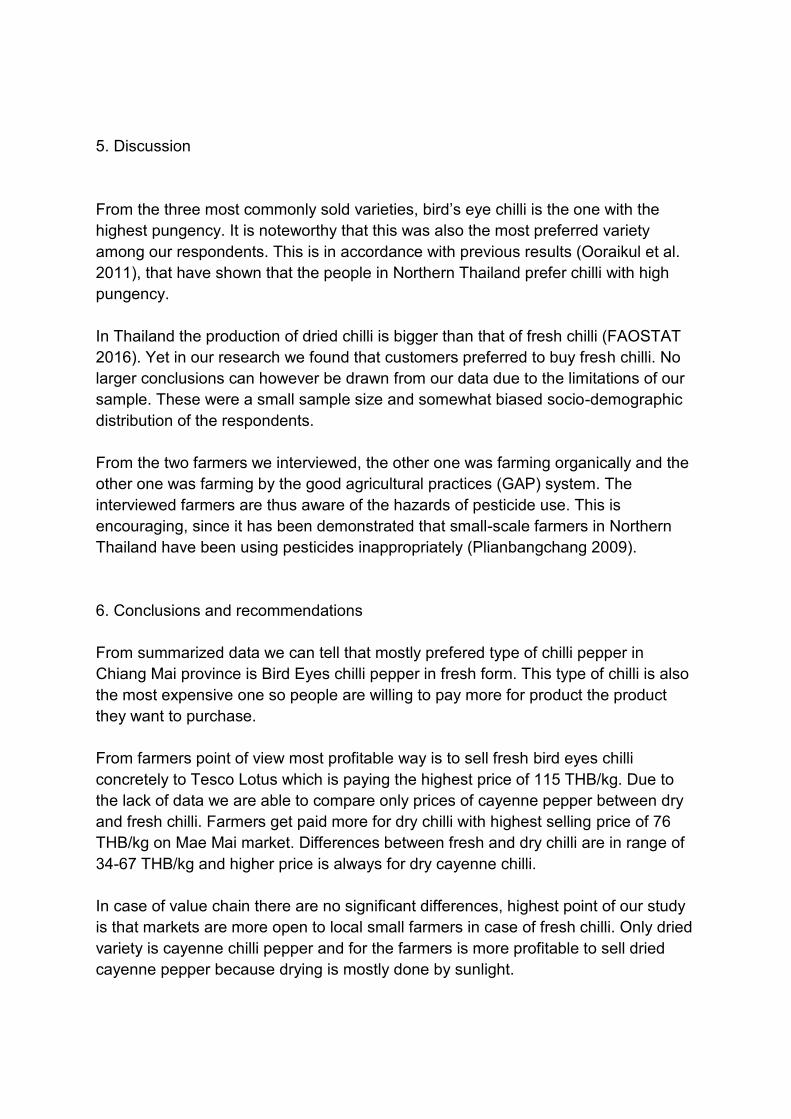
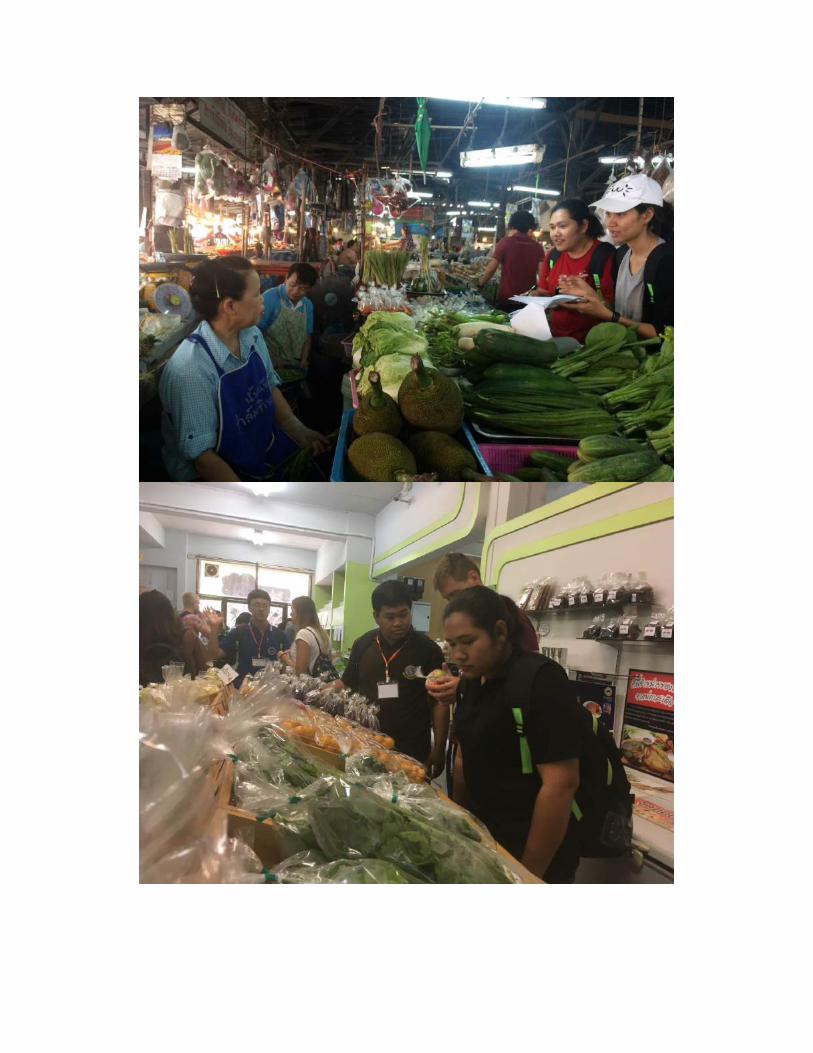
2. Photos from the data collection and preparation
Figure 9. Different varieties of chilli at Muang Mai market.
Figure 10. Collecting information from consumers at Mae Malai market.
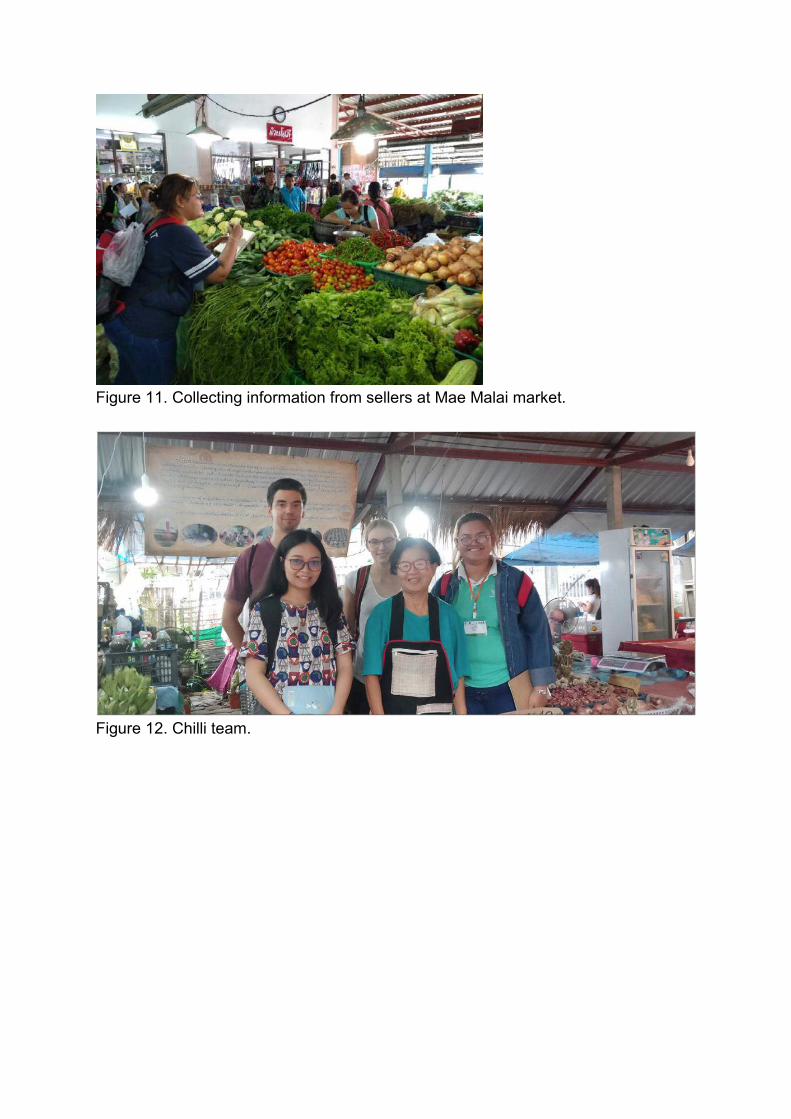
Figure 11. Collecting information from sellers at Mae Malai market.
Figure 12. Chilli team.
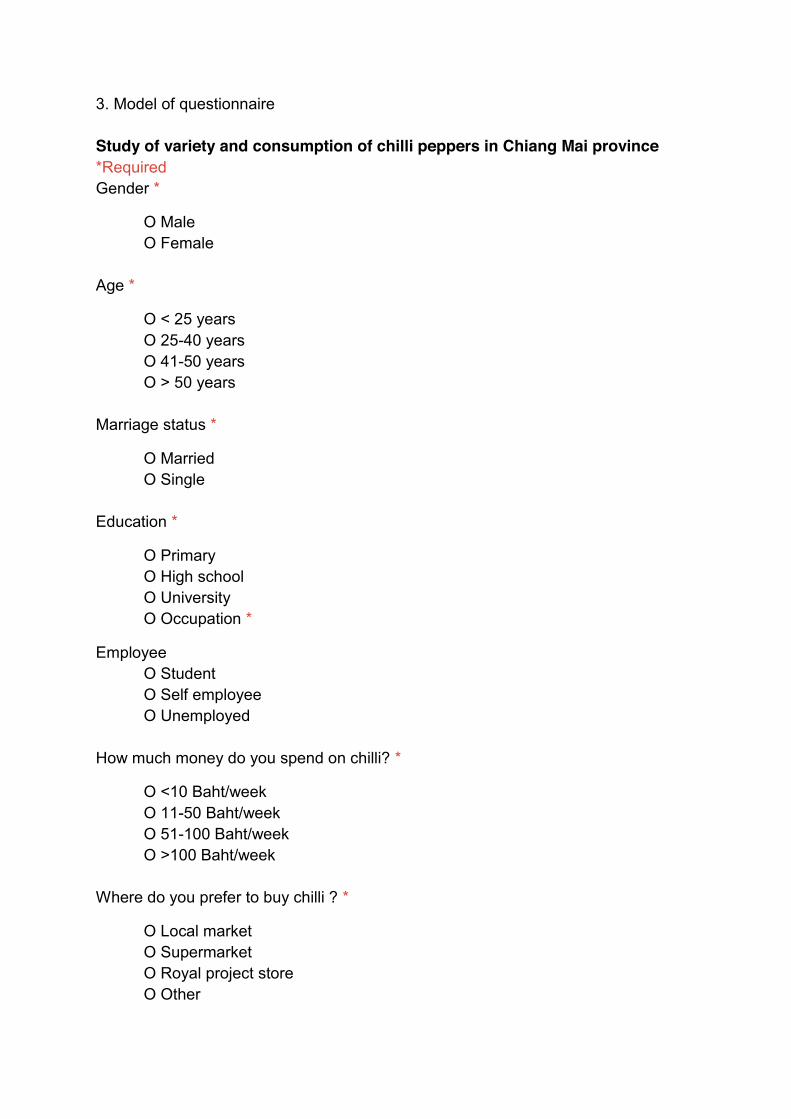
3. Model of questionnaire Study of variety and consumption of chilli peppers in Chiang Mai province *Required Gender *
O Male O Female
Age *
O < 25 years O 25-40 years O 41-50 years O > 50 years
Marriage status *
O Married O Single
Education *
O Primary O High school O University O Occupation *
Employee O Student O Self employee O Unemployed
How much money do you spend on chilli? *
O <10 Baht/week O 11-50 Baht/week O 51-100 Baht/week O >100 Baht/week
Where do you prefer to buy chilli ? *
O Local market O Supermarket O Royal project store O Other
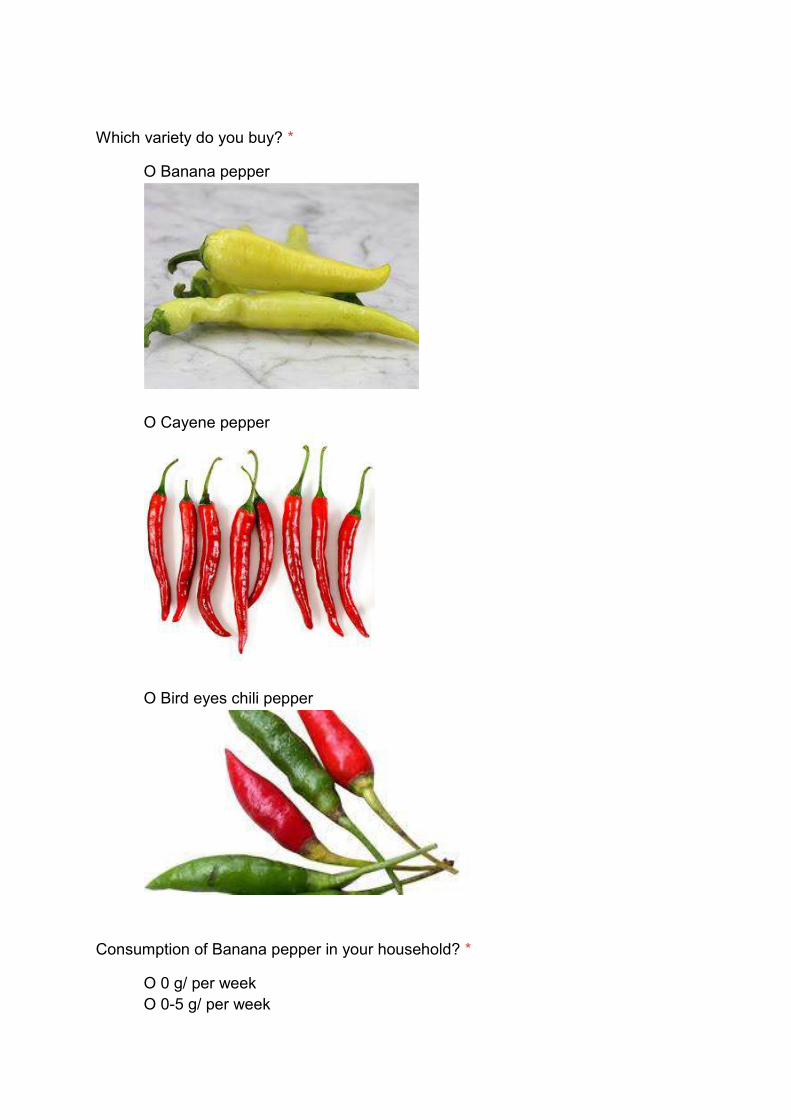
Which variety do you buy? *
O Banana pepper
O Cayene pepper
O Bird eyes chili pepper
Consumption of Banana pepper in your household? *
O 0 g/ per week O 0-5 g/ per week

O >5 g/ per week
Consumption of Cayene pepper in your household? *
O 0 g/ per week O 0-5 g/ per week O >5 g/ per week
Consumption of Bird eye chilli pepper in your household? *
O 0 g/ per week O 0-5 g/ per week O >5 g/ per week
Do you prefer to buy dry or fresh chilli ? *
O Fresh O Dry
Why do you prefer fresh/dry type ? *
O Price O Quality O Color O Storage time O Cooking method O Other
Lettuce report

Intention of customers to pay more to get organic lettuce in Chiang Mai city, Thailand
J. Tulková1, N. Beesa2, W. Klakankhai3, C. Klinpratum4, P. Suebpongsung5, O. Leuner1 and P. Chaloupková1
Czech University of Life Sciences Prague, Czech Republic1, Kasetsart university, Bangkok, Thailand2, Prince of Songkla University, Songkhla, Thailand3, Khon Kean University, Khon
Kean, Thailand4 and Chiang Mai University, Chiang Mai, Thailand5
Abstract
Health issues and environmental concerns have drawn the attention. Organic agriculture could be an alternative to reduce the risk of pesticide residues. The purpose of this study are to know if would customer pay higher price to get product grown at organic farm and what is the most popular type of lettuce for Thai/Foreigner and according to age. The data of lettuce consumption were collected from 10 sellers and 104 consumers. The result showed that the most consumers were willing to spend money more than 70 Thai baths for getting organic lettuce. Green Oak and Red Oak Leave lettuces were the most popular type of lettuce for Thai and foreign customers in a range of age 20-50 years old.
Introduction
Organic agriculture, a worldwide growth industry, can be a profitable, sustainable business for agricultural producers interested in going through the certification process necessary to enter this market. Organics have continued to expand during the last few years, and industry experts are forecasting steady growth of 9 percent or higher (OTA, 2017).
Organic lettuce production is an economically viable alternative for growers, although materials and total costs are higher for organic farming system compared to conventional farming ( Engindeniz and Tuzel, 2006) . In present, farmers have used chemical fertilizers, insecticides and pesticides in large quantities in conventional agricultural production. This has led to increasing problems related to health hazards, and environmental issues ( Sharma
and Singhvi, 2017). If consumers choose to eat safe foods such as organic products, they can reduce the risk of cancer, neurological damage, Parkinson's and other diseases caused by chemical residue (Bonfils, 2011).
This research was established to survey personal data from customers and seller to answer these questions:
1. Would customer pay higher price to get product grown at organic farm?
2. What is the most popular type of lettuce for Thai/Foreigner and according to age?
Material and Methods
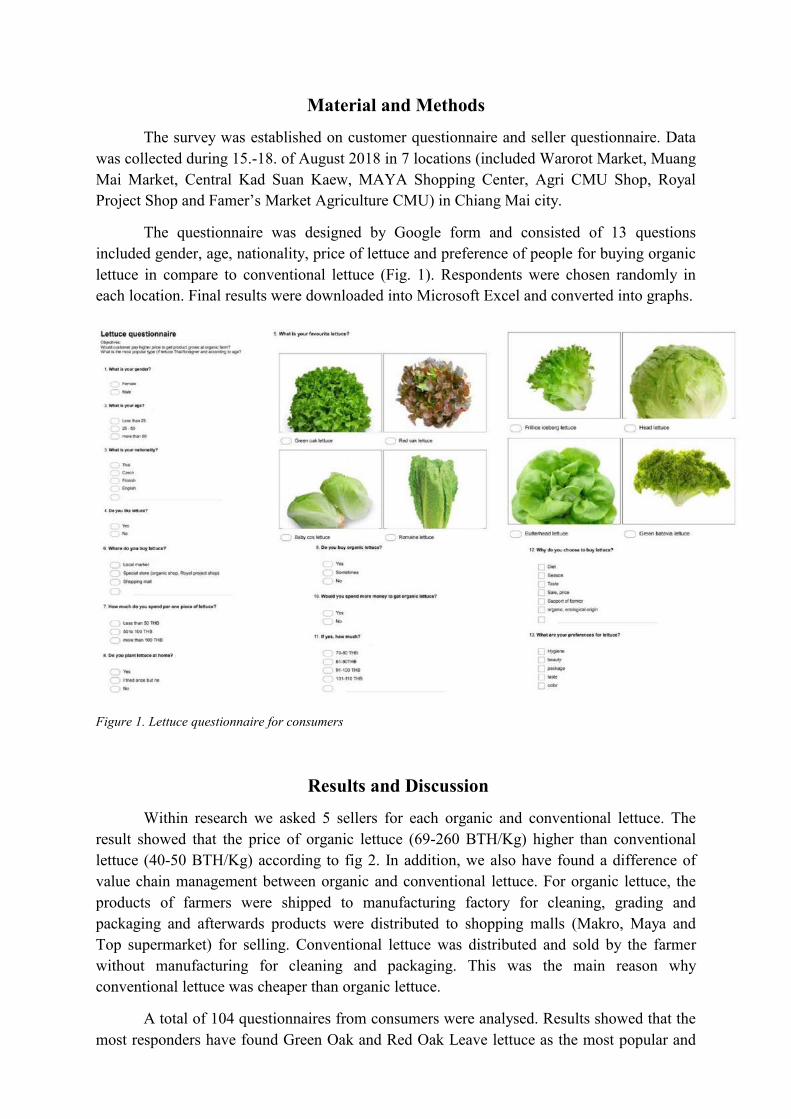
The survey was established on customer questionnaire and seller questionnaire. Data was collected during 15.-18. of August 2018 in 7 locations (included Warorot Market, Muang Mai Market, Central Kad Suan Kaew, MAYA Shopping Center, Agri CMU Shop, Royal Project Shop and Famer’s Market Agriculture CMU) in Chiang Mai city.
The questionnaire was designed by Google form and consisted of 13 questions included gender, age, nationality, price of lettuce and preference of people for buying organic lettuce in compare to conventional lettuce (Fig. 1). Respondents were chosen randomly in each location. Final results were downloaded into Microsoft Excel and converted into graphs.
Figure 1. Lettuce questionnaire for consumers
Results and Discussion
Within research we asked 5 sellers for each organic and conventional lettuce. The result showed that the price of organic lettuce (69-260 BTH/Kg) higher than conventional lettuce (40-50 BTH/Kg) according to fig 2. In addition, we also have found a difference of value chain management between organic and conventional lettuce. For organic lettuce, the products of farmers were shipped to manufacturing factory for cleaning, grading and packaging and afterwards products were distributed to shopping malls (Makro, Maya and Top supermarket) for selling. Conventional lettuce was distributed and sold by the farmer without manufacturing for cleaning and packaging. This was the main reason why conventional lettuce was cheaper than organic lettuce.
A total of 104 questionnaires from consumers were analysed. Results showed that the most responders have found Green Oak and Red Oak Leave lettuce as the most popular and

often bought especially in age group 20-50 years old Thai and foreigners (Fig. 3). These result have been compared to scientific article from Phuket of (Sanchart 2011), what reports that Green Oak Leave lettuce and Red Oak Leave lettuce were the most popular types of lettuce in age range 26-35 years. Therefore this research has been proved.
In preference of buying lettuce prevails intention of diet, healthy lifestyle and also taste (Fig. 4). The majority of responders are willing to spend more money for getting higher quality goods, which is related to the healthy lifestyle. More than half of responded women would spend more than 70 Thai baths for organic lettuce (Fig. 5).
Figure 2. The price of organic and conventional lettuce in each locality.
Figure 3. Preferences in type of lettuce consumed
Conventional lettuces
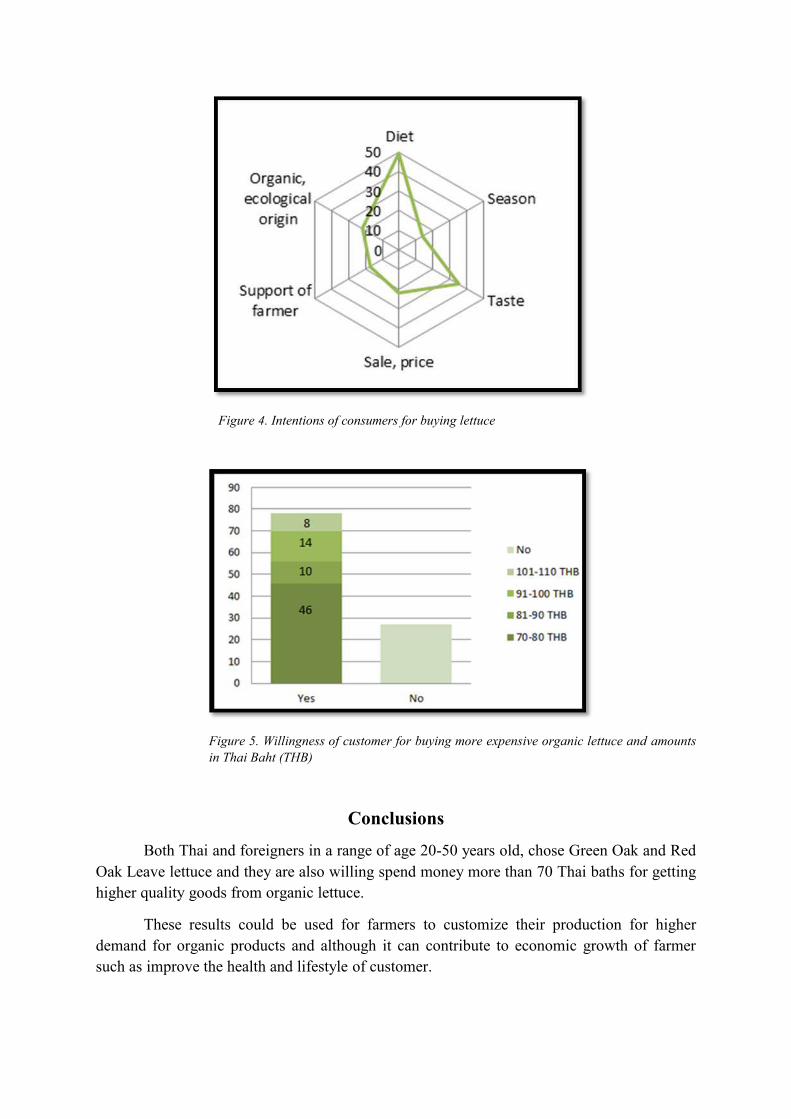
Figure 4. Intentions of consumers for buying lettuce
Figure 5. Willingness of customer for buying more expensive organic lettuce and amounts in Thai Baht (THB)
Conclusions
Both Thai and foreigners in a range of age 20-50 years old, chose Green Oak and Red Oak Leave lettuce and they are also willing spend money more than 70 Thai baths for getting higher quality goods from organic lettuce.
These results could be used for farmers to customize their production for higher demand for organic products and although it can contribute to economic growth of farmer such as improve the health and lifestyle of customer.
Acknowledgement
Authors thank to PISAI Project under the ERASMUS+ Program for supporting finance
References
Bonfils, D. 2011. Organic vs. Nonorganic: What Fruits and Veggies Should You Buy?. ABCnews. Retrieved 23 August 2018.
Engindeniz, S. and Tuzel, Y. 2006. Economic analysis of organic greenhouse lettuce production in Turkey. Scientia Agricola: 285-290.
Organic Production Survey, National Ag Statistics Service (NASS), USDA, 2017.
Sanchart kongbun. 2011. Hydroponics Vegetable Consumption Behavior in Phuket. The 23rd National Graduate Research Conference: 1213-1216.
Sharma, N. and Singhvi, R. 2017. Effects of Chemical Fertilizers and Pesticides on Human Health and Environment: A Review. International Journal of Agriculture, Environment and Biotechnology 10(6): 675-679.
Appendix
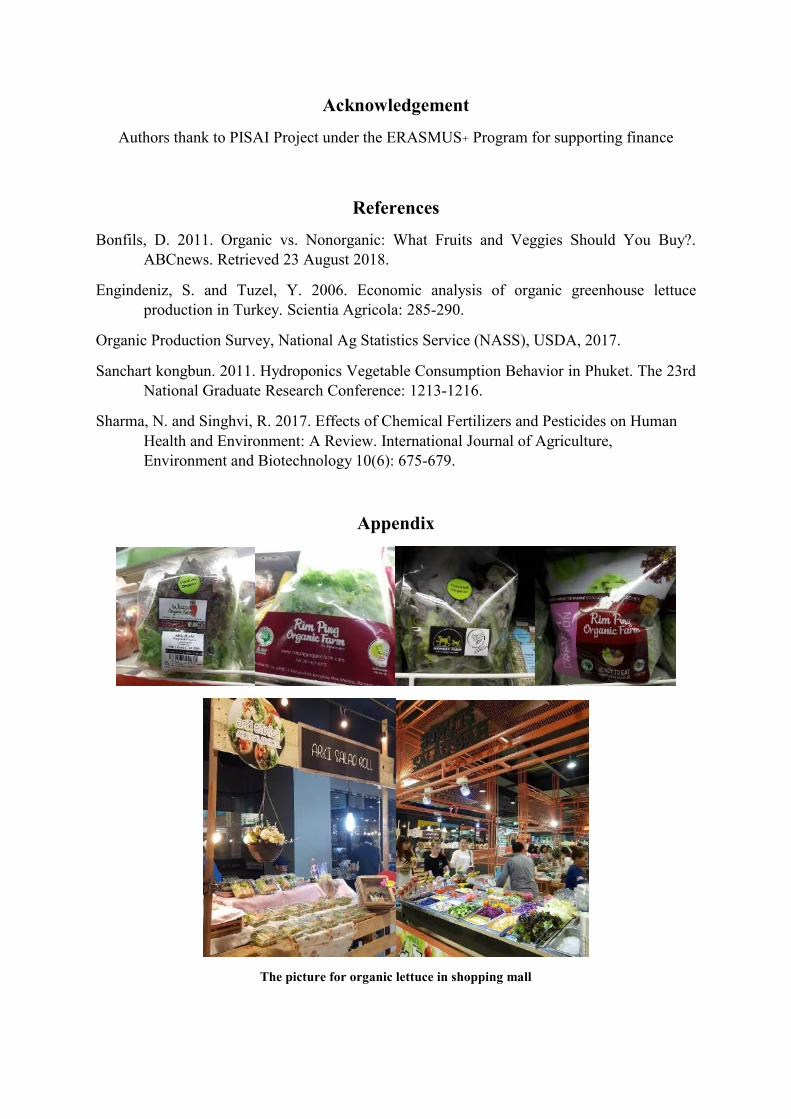
The picture for organic lettuce in shopping mall
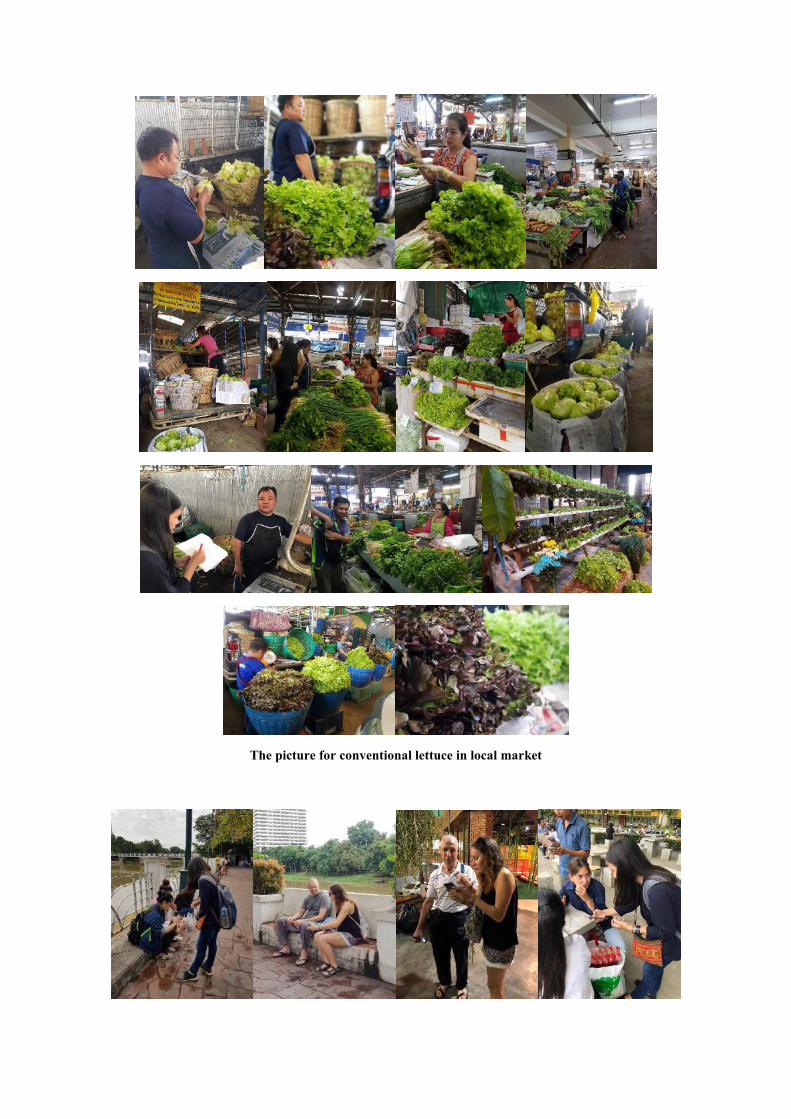
The picture for conventional lettuce in local market
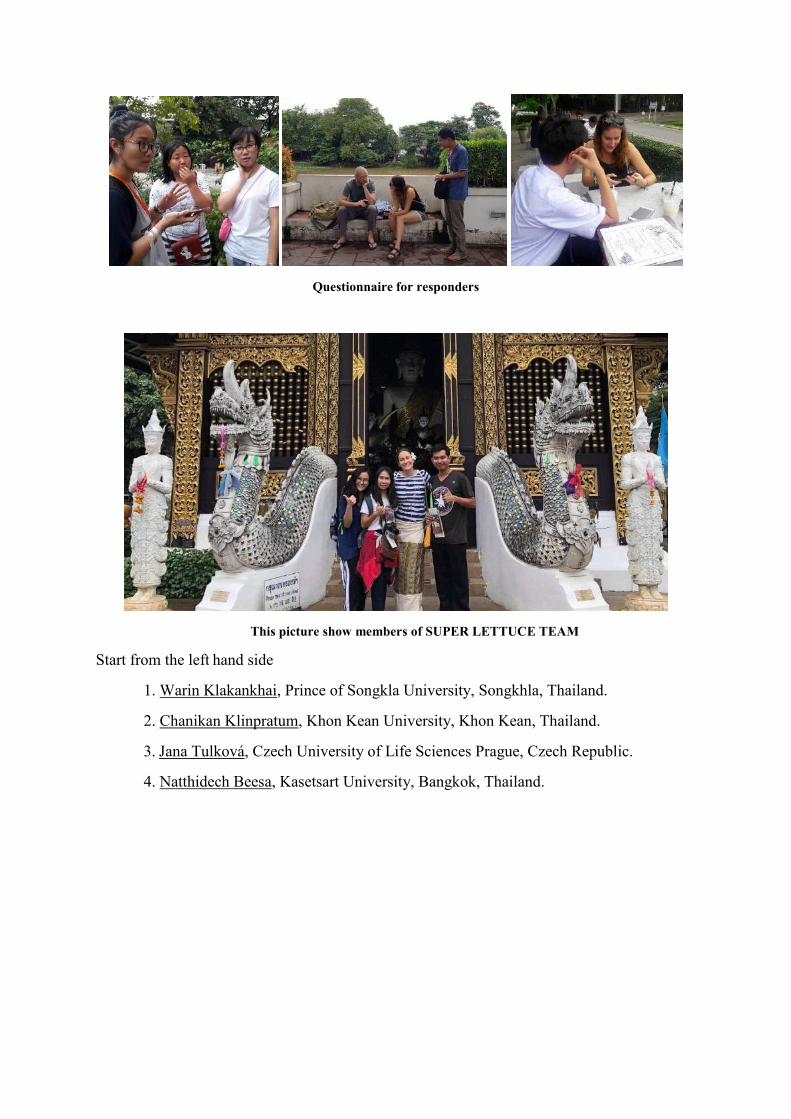
Questionnaire for responders
This picture show members of SUPER LETTUCE TEAM
Start from the left hand side
1. Warin Klakankhai, Prince of Songkla University, Songkhla, Thailand.
2. Chanikan Klinpratum, Khon Kean University, Khon Kean, Thailand.
3. Jana Tulková, Czech University of Life Sciences Prague, Czech Republic.
4. Natthidech Beesa, Kasetsart University, Bangkok, Thailand.

Tomato report
Tomato value chain in Chiang Mai City
Chatnapa Nowat[2], Chattamas Promdach[1], David Zeman[4], Jureeporn Sukhatiphum[2] ,Seksan Duangsingtham[3]
Prince of Songkla University[1], Khon Kaen University[2], Chiang Mai University, [3] Thailand
Czech University Of Life Sciences [4], Czech Republic
Abstract
The report deals with a topic of tomato value chain in Chiang Mai city. The research was conducted via interview with local farmers and sellers and Questionnaires for consumers. The questions asked were on the topics regarding tomato production, marketing, advertisement, logistics, consumer preference and others. The data showed that tomato is very profitable commodity if the farm is properly organized and that consumers Chiang Mai prefer to buy local classic tomatoes from markets and supermarket and knowledge about organic farming is still relatively low.
Key words: tomato, Chiang Mai, consumer preference
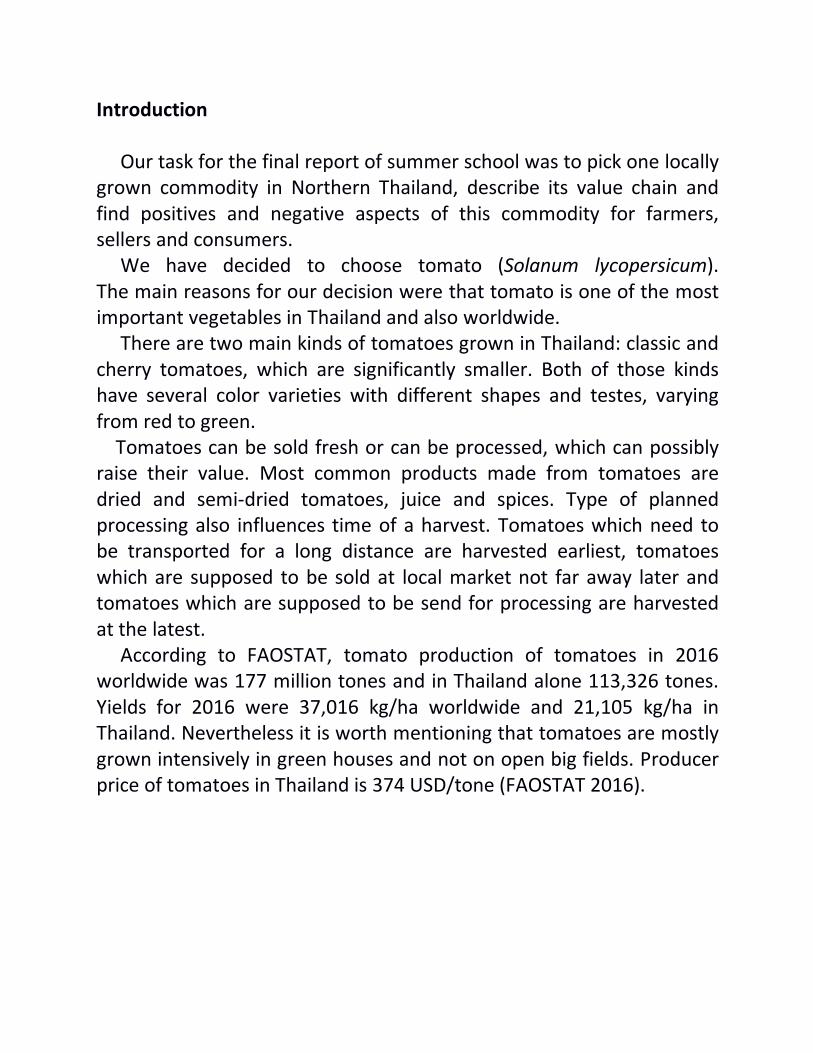
Introduction Our task for the final report of summer school was to pick one locally grown commodity in Northern Thailand, describe its value chain and find positives and negative aspects of this commodity for farmers, sellers and consumers. We have decided to choose tomato (Solanum lycopersicum). The main reasons for our decision were that tomato is one of the most important vegetables in Thailand and also worldwide. There are two main kinds of tomatoes grown in Thailand: classic and cherry tomatoes, which are significantly smaller. Both of those kinds have several color varieties with different shapes and testes, varying from red to green. Tomatoes can be sold fresh or can be processed, which can possibly raise their value. Most common products made from tomatoes are dried and semi-dried tomatoes, juice and spices. Type of planned processing also influences time of a harvest. Tomatoes which need to be transported for a long distance are harvested earliest, tomatoes which are supposed to be sold at local market not far away later and tomatoes which are supposed to be send for processing are harvested at the latest. According to FAOSTAT, tomato production of tomatoes in 2016 worldwide was 177 million tones and in Thailand alone 113,326 tones. Yields for 2016 were 37,016 kg/ha worldwide and 21,105 kg/ha in Thailand. Nevertheless it is worth mentioning that tomatoes are mostly grown intensively in green houses and not on open big fields. Producer price of tomatoes in Thailand is 374 USD/tone (FAOSTAT 2016).
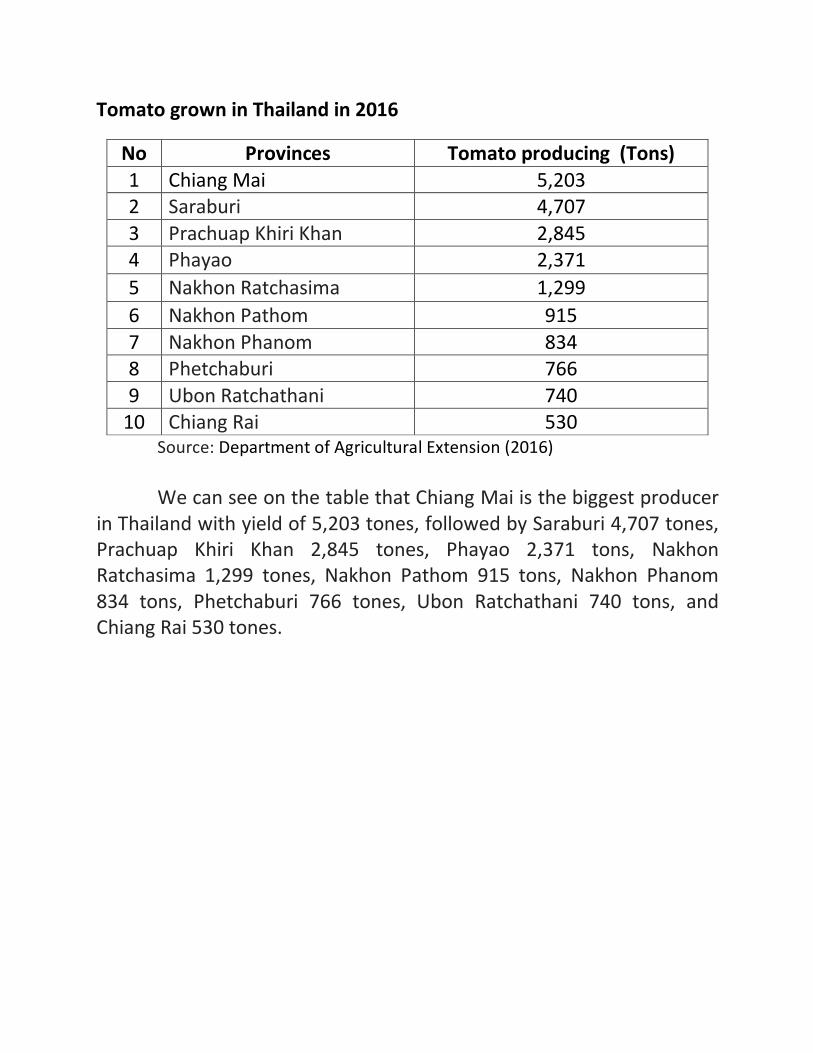
Tomato grown in Thailand in 2016
No Provinces Tomato producing (Tons) 1 Chiang Mai 5,203 2 Saraburi 4,707 3 Prachuap Khiri Khan 2,845 4 Phayao 2,371 5 Nakhon Ratchasima 1,299 6 Nakhon Pathom 915 7 Nakhon Phanom 834 8 Phetchaburi 766 9 Ubon Ratchathani 740
10 Chiang Rai 530 Source: Department of Agricultural Extension (2016) We can see on the table that Chiang Mai is the biggest producer in Thailand with yield of 5,203 tones, followed by Saraburi 4,707 tones, Prachuap Khiri Khan 2,845 tones, Phayao 2,371 tons, Nakhon Ratchasima 1,299 tones, Nakhon Pathom 915 tons, Nakhon Phanom 834 tons, Phetchaburi 766 tones, Ubon Ratchathani 740 tons, and Chiang Rai 530 tones.
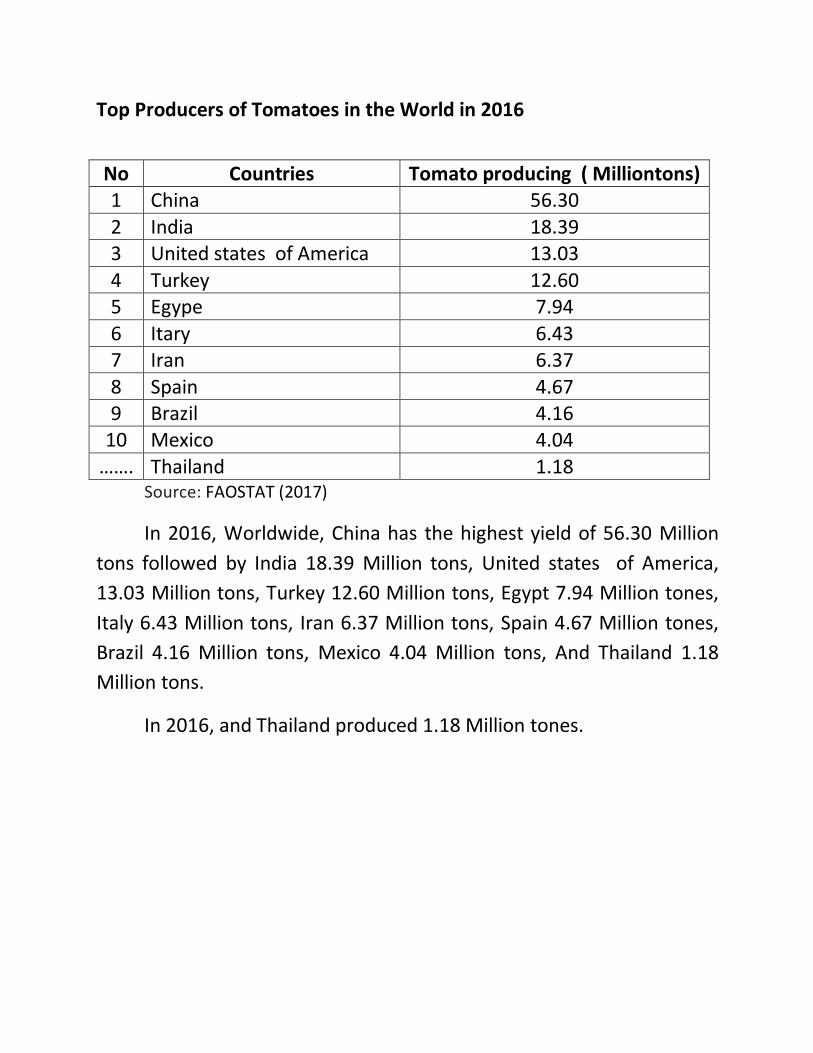
Top Producers of Tomatoes in the World in 2016
Source: FAOSTAT (2017)
In 2016, Worldwide, China has the highest yield of 56.30 Million tons followed by India 18.39 Million tons, United states of America, 13.03 Million tons, Turkey 12.60 Million tons, Egypt 7.94 Million tones, Italy 6.43 Million tons, Iran 6.37 Million tons, Spain 4.67 Million tones, Brazil 4.16 Million tons, Mexico 4.04 Million tons, And Thailand 1.18 Million tons.
In 2016, and Thailand produced 1.18 Million tones.
No Countries Tomato producing ( Milliontons) 1 China 56.30 2 India 18.39 3 United states of America 13.03 4 Turkey 12.60 5 Egype 7.94 6 Itary 6.43 7 Iran 6.37 8 Spain 4.67 9 Brazil 4.16
10 Mexico 4.04 ……. Thailand 1.18

Objectives We set our main objective as description of tomato value chain in Chiang Mai city. We also set two secondary objectives one regarding farmers and sellers: to find out about farmer marketing and management and other one regarding consumers: to find out information regarding consumer tomato preferences. Methodology All of our data were collected via questionnaires and personal interviews. The data collection was divided into three parts: collection of data from farmers, seller and consumers. The data from farmers were collected via personal interview with two owners of Green Garden, tomato farm outside Chiang Mai city. The information from sellers was also collected in a form of interviews from 10 respondents in markets and shops in Chiang Mai city. Since we needed significantly more consumer respondents, we decided to collect the data via online questionnaire. We collected 102 questionnaires in total. The questionnaire consisted 8 questions regarding tomatoes plus several personal background questions. Majority of the questionnaires was collected online through google forms and several additional questionnaires were collected personally Chiang Mai city. The data were processed afterwards and turned into graphs, tables and other easily understandable forms.
Results Farmers: We have visited Green garden, tomato farm located in Pong Pho subdistrict, Mae Rim District, Chiang Mai province and interviewed its owners. The owners were a couple, both 40 years old and both had university education from Department of Economic in Horticultural Khon Kaen University. They started their farm 3 years ago in 2015. At first they planted only cherry tomatoes, but since then, they expanded and started to grow both classic and cherry tomatoes in several color versions. They are part of contract farming union with 9 other tomato farmers. Vision of this farm is sustainable development, This farm does not grow organic tomatoes, because it would be more expensive and most of the consumers in Chiang Mai are not aware about organic farming so they are not willing to pay more for organic products. Their tomatoes are sold to supermarkets and restaurants in Chiang Mai district with variable prices dependable on the quality of the product. The farmers also stated that their success is also because of good marketing and advertising. They advertise their products on social media like facebook and instagram, they test their products and have many discount events like buy one get one free and others. All of those actions are raising farms profits. Overall, the farmers believe, that tomatoes is a very profitable commodity and they plan to expand their farm further more in the future. Sellers: The interviews with sellers confirmed Information from the farmers. The price varies fro 30 up to 100 bahts for 5kg depending on the quality of the tomatoes. Prices on local markets are usually lower than in supermarkets where is also different packaging. Most of the sellers also stated that their profits tend to be higher during weekends. Consumers: Our respondent group was costing from various age groups, education levels and gender.
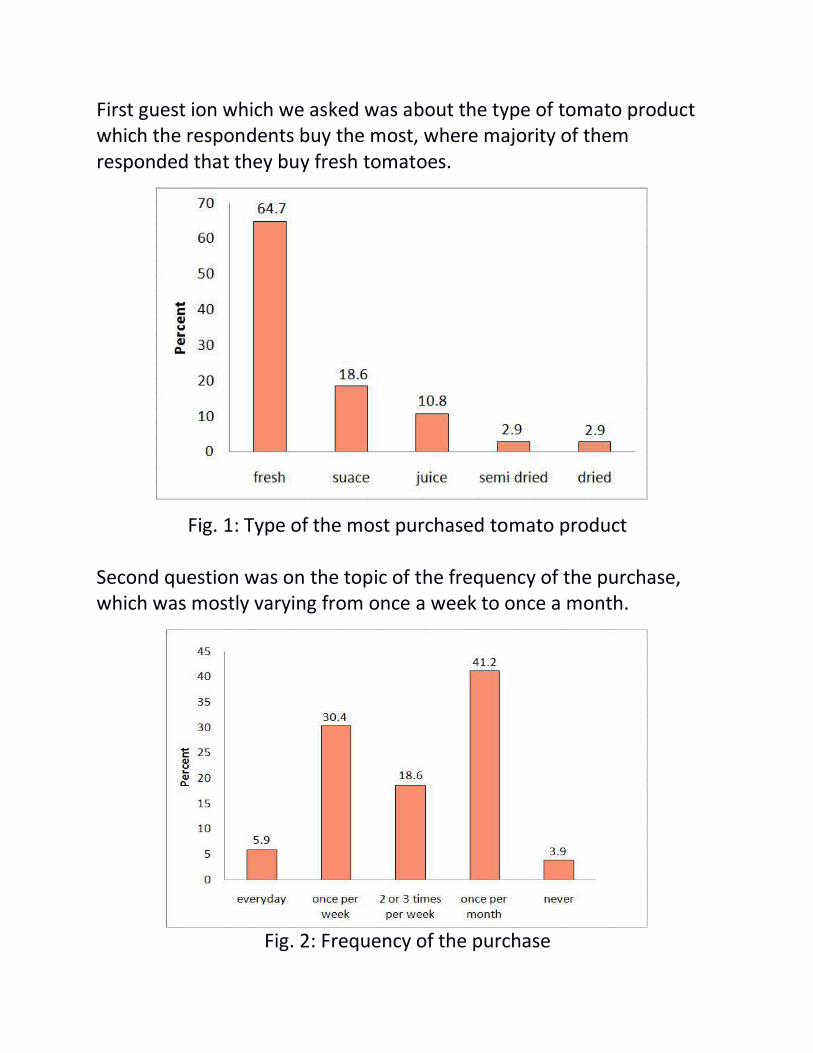
First guest ion which we asked was about the type of tomato product which the respondents buy the most, where majority of them responded that they buy fresh tomatoes.
Fig. 1: Type of the most purchased tomato product Second question was on the topic of the frequency of the purchase, which was mostly varying from once a week to once a month.
Fig. 2: Frequency of the purchase
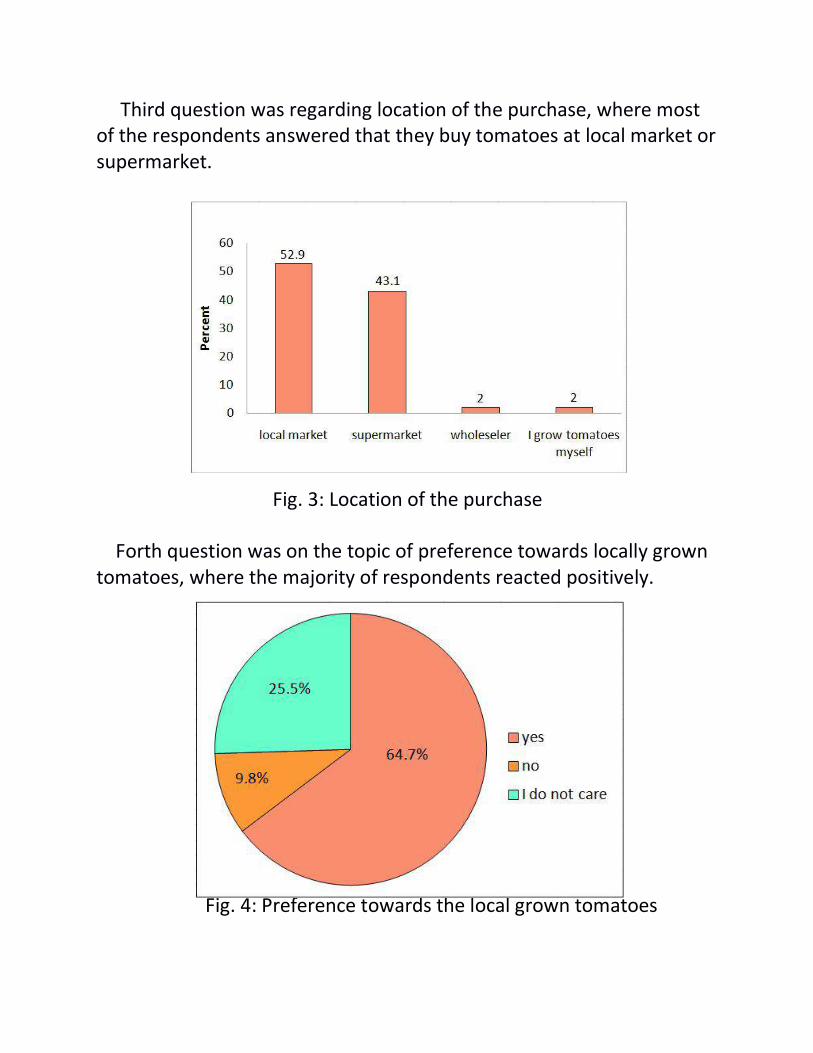
Third question was regarding location of the purchase, where most of the respondents answered that they buy tomatoes at local market or supermarket.
Fig. 3: Location of the purchase Forth question was on the topic of preference towards locally grown tomatoes, where the majority of respondents reacted positively.
Fig. 4: Preference towards the local grown tomatoes

In fifth question we asked about the amount of tomatoes bought in one week, where most of the respondents chose 0-0,9kg
Fig. 5: Amount of the purchased tomatoes in one week
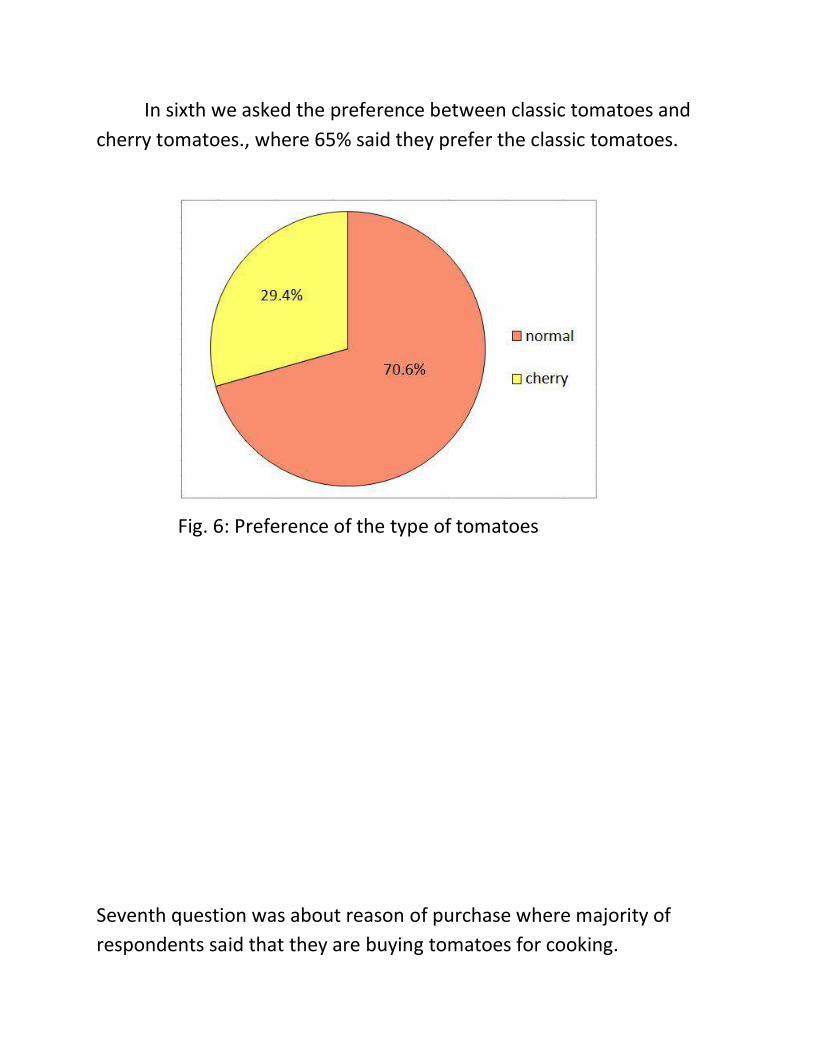
In sixth we asked the preference between classic tomatoes and cherry tomatoes., where 65% said they prefer the classic tomatoes.
Fig. 6: Preference of the type of tomatoes
Seventh question was about reason of purchase where majority of respondents said that they are buying tomatoes for cooking.

Fig. 7: Type of consumption
Last question was about awareness of the organically grown tomatoes, where respondents answered mostly negatively.
Fig. 8: Awareness about organically grown tomatoes

Personal background
Fig. 9: Gender
Fig. 10: Age

Fig. 11: Number of people in a household
Fig. 12: Monthly budget per household
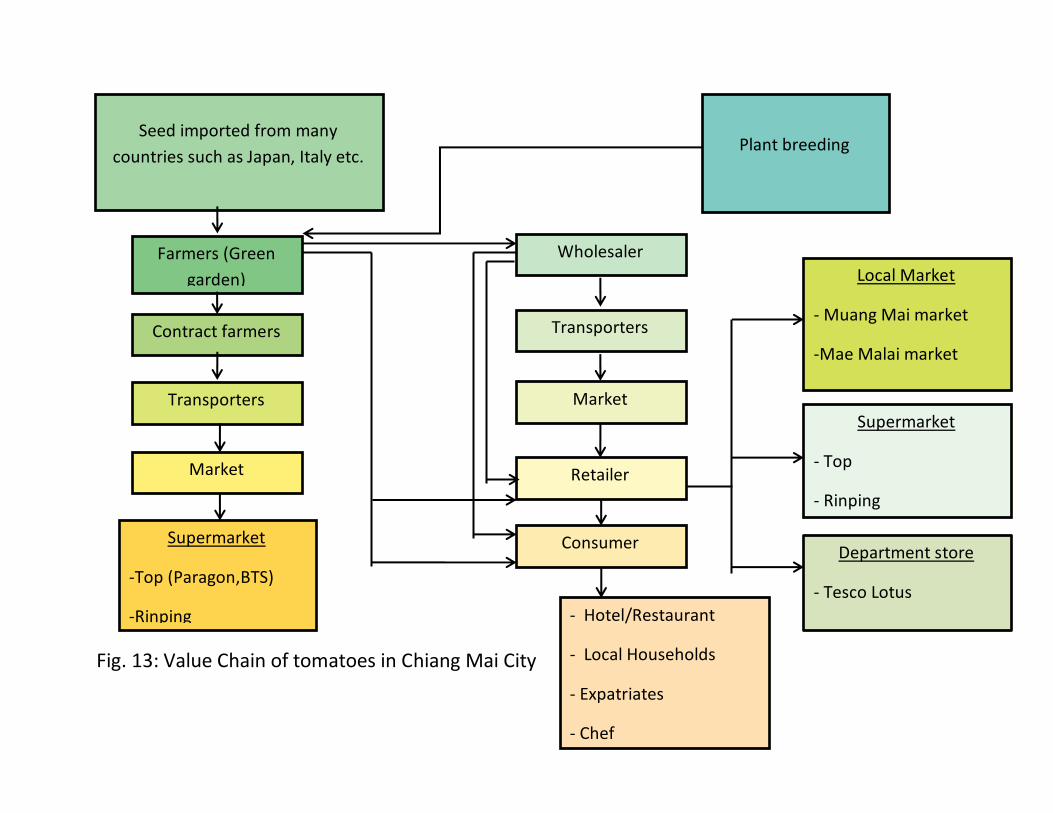
Fig. 13: Value Chain of tomatoes in Chiang Mai City
Farmers (Green garden)
Seed imported from many countries such as Japan, Italy etc. Plant breeding
Contract farmers
Transporters
Wholesaler
Retailer
Supermarket
-Top (Paragon,BTS)
-Rinping
Market Supermarket
- Top
- Rinping
Local Market
- Muang Mai market
-Mae Malai market
Department store
- Tesco Lotus
Consumer
- Hotel/Restaurant
- Local Households
- Expatriates
- Chef
Market
Transporters
Conclusion
The tomato value chain in Chiang Mai is well established. This statement is supported by majority of interviewed farmers and seller and also by the fact that Chiang Mai is top tomato producer in Thailand.
Tomatoes are profitable commodity for farmers, when they are properly organized and farm has good marketing and advertisement.
Consumers in Chiang Mai prefer to buy local classic tomatoes from markets and supermarkets and knowledge about organic farming is still relatively low.
Acknowledgements
The report is base on the homework in summer school. We are grateful for a number of friends and colleague in encouraging us to start the homework, collect the data, analyze data and write the report.
In farm data we thank Keaw and Pu. They form Green Garden tomato farm and give the data in farm for our group. This data is important to analyze for start the value chain.
In seller data we thanks a lot to the seller in Muang Mai market, Tonpayom market, Mae Malai market, Royal project and AGGRI Shop. They gave some information which benefit for make to data tomato value chain in Chiang Mai province.
In consumer data we thanks a lot to the consumers, who answer consumer questionnaire in online. It is given the information and behavior of consumer to consume tomato.
Finally we thanks the Chiang Mai University, The place was used to learn and gave opportunity in first module. We thanks the PISAI Project and Erasmus in Europe, which gave the scholarship for us. We thanks the teachers, who are Dr.Petra Chaloupková, Dr.Olga Leuner, Dr.Milan and Dr.Pornsiri Suebpongsung. They gave knowledge for us in this program. We thanks for everything that makes this report successful.
References
FAOSTAT. 2016. FAOSTAT DATA.
http://www.fao.org/faostat/en/#data . Accessed 21.8.2018.
Information Technology and Communication Center. 2016. Fresh
Tomatoes.
http://www.agriinfo.doae.go.th/year60/plant/rortor/veget/63.pdf.
Accessed 23.8.2018.
FAOSTAT. 2017. FAOSTAT DATA.
http://www.fao.org/faostat/en/#rankings/countries_by_commodity Accessed 23.8.2018.

ADDEDDA

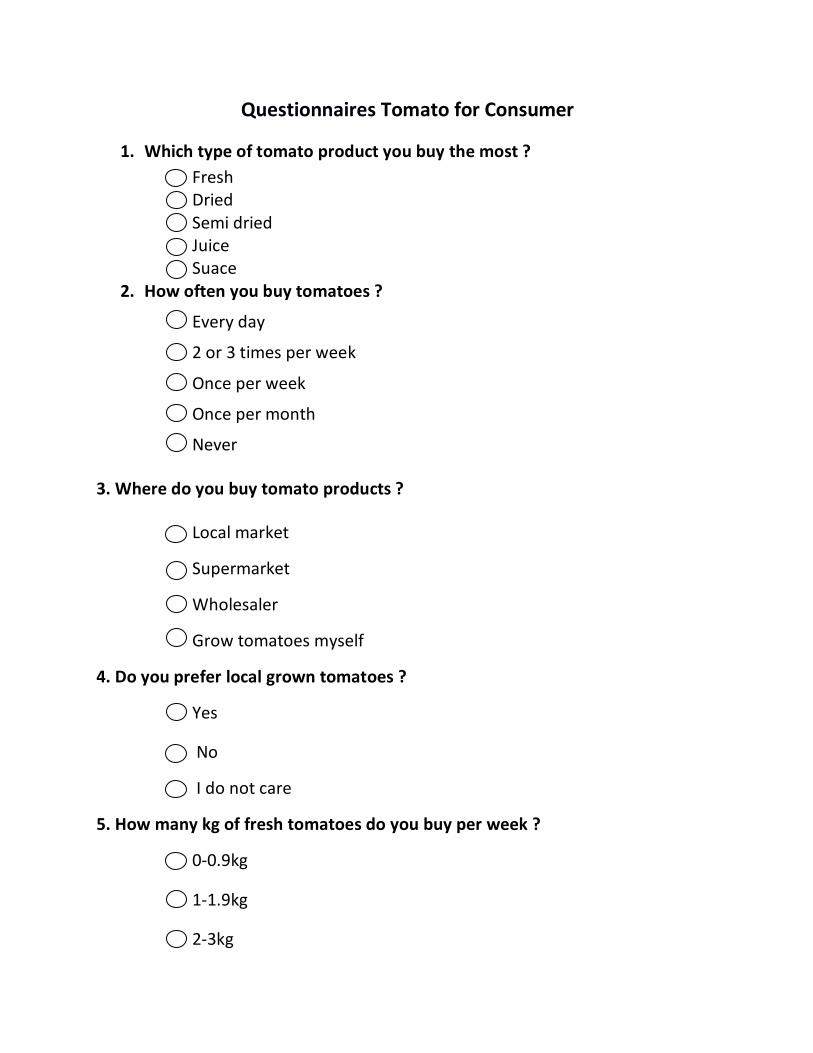
Questionnaires Tomato for Consumer
1. Which type of tomato product you buy the most ? Fresh Dried Semi dried Juice Suace
2. How often you buy tomatoes ?
Every day
2 or 3 times per week
Once per week
Once per month
Never
3. Where do you buy tomato products ?
Local market
Supermarket
Wholesaler
Grow tomatoes myself
4. Do you prefer local grown tomatoes ?
Yes
No
I do not care
5. How many kg of fresh tomatoes do you buy per week ?
0-0.9kg
1-1.9kg
2-3kg
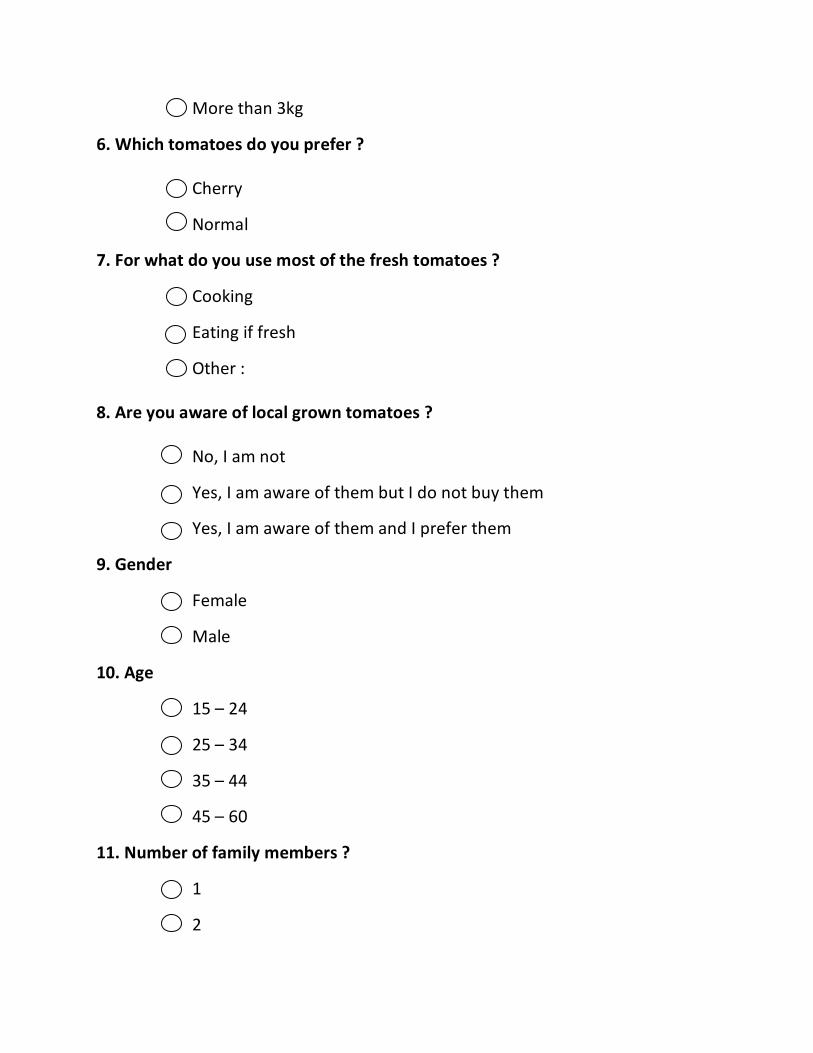
More than 3kg
6. Which tomatoes do you prefer ?
Cherry
Normal
7. For what do you use most of the fresh tomatoes ?
Cooking
Eating if fresh
Other :
8. Are you aware of local grown tomatoes ?
No, I am not
Yes, I am aware of them but I do not buy them
Yes, I am aware of them and I prefer them
9. Gender
Female
Male
10. Age
15 – 24
25 – 34
35 – 44
45 – 60
11. Number of family members ?
1
2
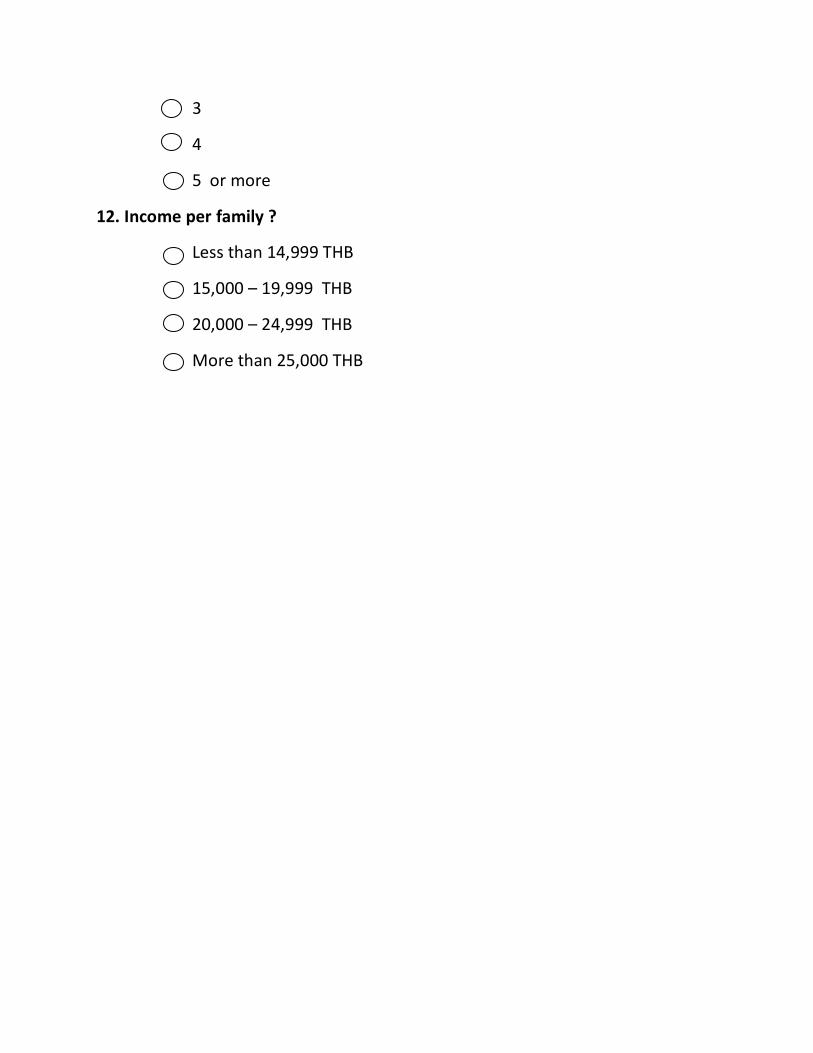
3
4
5 or more
12. Income per family ?
Less than 14,999 THB
15,000 – 19,999 THB
20,000 – 24,999 THB
More than 25,000 THB

Cucumber report
Cucumber value chain analysisDavid Syřiště [1], Aleksandra Kaleova [1], Nongnaphat Jongkraijak[2], Poramet Kaewprasert[2], Apinya Saentho [3],
Petra Chaloupková[1], Olga Leuner[1], Pornsiri Suebpongsung[4]
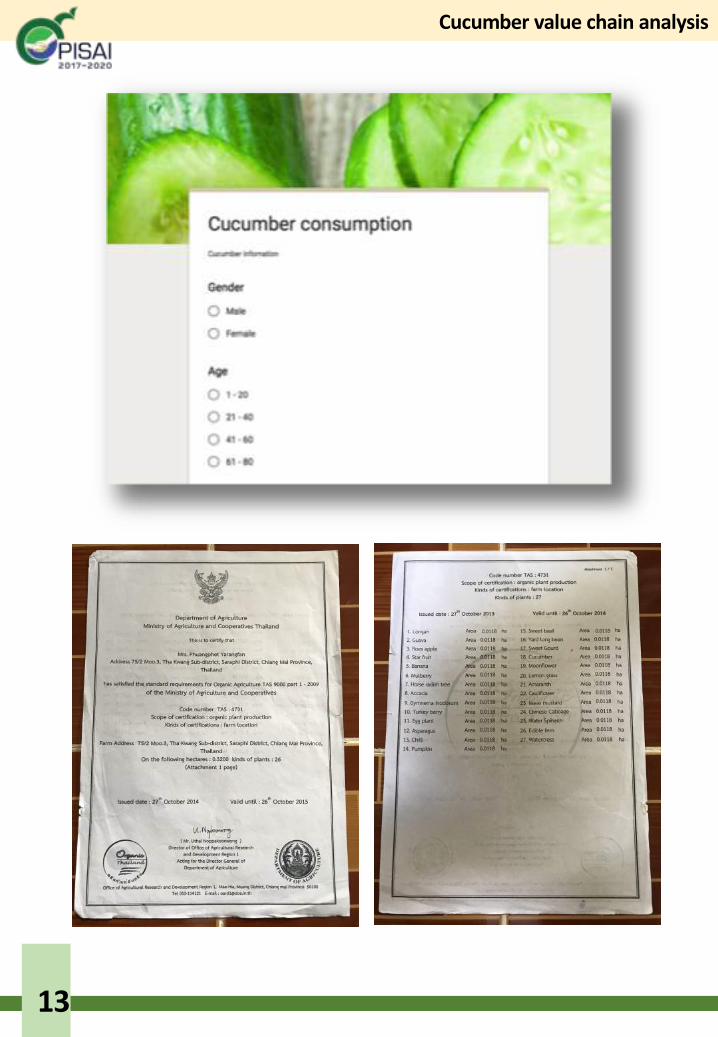
AbstractOur present research report deals with the production and consumptionof cucumbers in Northern Thailand, more specifically in the Chiang Mairegion. Value chain analysis follows, with a descriptive scheme and areport that breaks down into 4 parts: functional, economic, social andenvironmental analysis of the value chain. A description is given about thedata collecting process of the consumers and farmers in Chiang Mairegion. It is stated that 4 farms were visited, where farmers werequestioned about the production steps of cucumbers. The main steps ofproduction are as follows: high quality seeds acquirement, preferablyfrom the last harvest season; soil preparation and cultivation and the laststep being the harvest itself). Then, the report focuses on themethodology of collecting data from consumers, namely composing aquestionnaire, establishing a method on how to reach the target groupand reaching the target group itself. The questionnaire was composed by10 questions dealing with the personal preferences of cucumberconsumers. The target group was reached by visiting local markets andsupermarkets. Data analysis followed with concluding remarks. Accordingto the results, despite the fact that cucumbers are sold at a low price, themajority of consumers prefer to buy cucumbers sometimes per week(56.9%). Also, about 44% responders replied that they would not paymore than 10 BHT per kg. Our responders prefer to buy cucumbers fromone seller (63%). And last but not least, 66.1% responders said that theydo not really mind whether the cucumber production was organic orconventional. Our analysis took place at the end of August, 2018.
Key words: cucumber production, Thailand, value chain analysis,cucumber consumption, survey
[1] Czech U niversity of L ife Sciences Prague, [2] Prince of Songkla U niversitylty [3] Khon Kaen U niversity, [4] Ch iang M ai U niversity
2
Cucumber value chain analysis
PlantNumber of
farmers (persons)
Harvested yield (kg)
Average yield /harvested area
(kg/rai)
Average farmer selling price
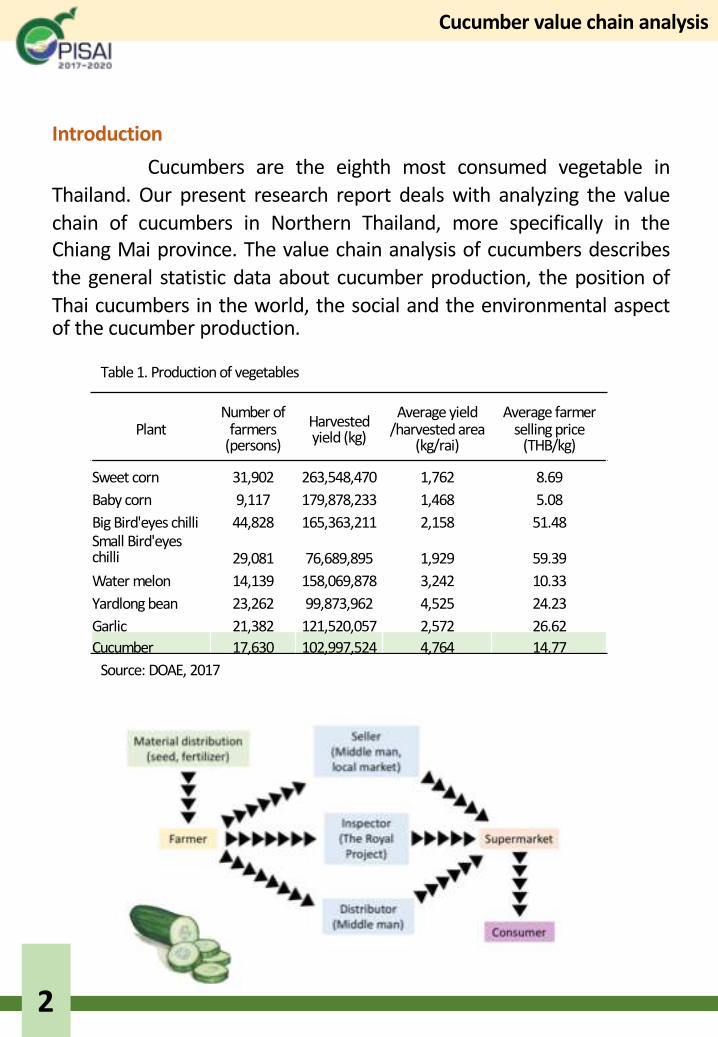
(THB/kg)
Sweet corn 31,902 263,548,470 1,762 8.69Baby corn 9,117 179,878,233 1,468 5.08Big Bird'eyes chilli 44,828 165,363,211 2,158 51.48Small Bird'eyeschilli 29,081 76,689,895 1,929 59.39Water melon 14,139 158,069,878 3,242 10.33Yardlong bean 23,262 99,873,962 4,525 24.23Garlic 21,382 121,520,057 2,572 26.62Cucumber 17,630 102,997,524 4,764 14.77
Table 1. Production of vegetables
Source: DOAE, 2017
IntroductionCucumbers are the eighth most consumed vegetable in
Thailand. Our present research report deals with analyzing the valuechain of cucumbers in Northern Thailand, more specifically in theChiang Mai province. The value chain analysis of cucumbers describesthe general statistic data about cucumber production, the position ofThai cucumbers in the world, the social and the environmental aspectof the cucumber production.
3
Cucumber value chain analysis
Functional analysisCucumber occupies the eighth place in importance in
Thailand, following corn, chilli, baby corn, garlic. It is cultivated in everypart of the country, with a major concentration in the Northeast –28,540,800 m2 with a production of 34,875 tons for mini cucumber and34,104,000 m2with a production of 58,722 tons for long cucumber. TheWestern region is the second largest producer with an area of 59670,400 m2 and a production of 52,470 tons of the mini type; and13,016,000 m2with a production of 16,153 tons of the long type.
Cucumbers require at least 220C for germination, with a pHof 7, fertile humid soil and seeds are planted at a depth of 5cm.
Cucumbers are transported from farmers by intermediarieseither to local markets, supermarkets or other intermediatedestinations (The Royal Project).
The average consumption of cucumber per capita inThailand is 19.36 g.

4
Cucumber value chain analysis
Rank Country Cucumbers (tons)1 China 54,315,900
2 Turkey 1,754,6133 Iran 1,570,078...
17 Thailand 265,000
Economic AnalysisAccording to World Atlas, Thai cucumber production is on
the 17thplace in the world.
Source: Burton, 2017
Table 2. The World Leaders In Cucumber Production
5
Cucumber value chain analysis
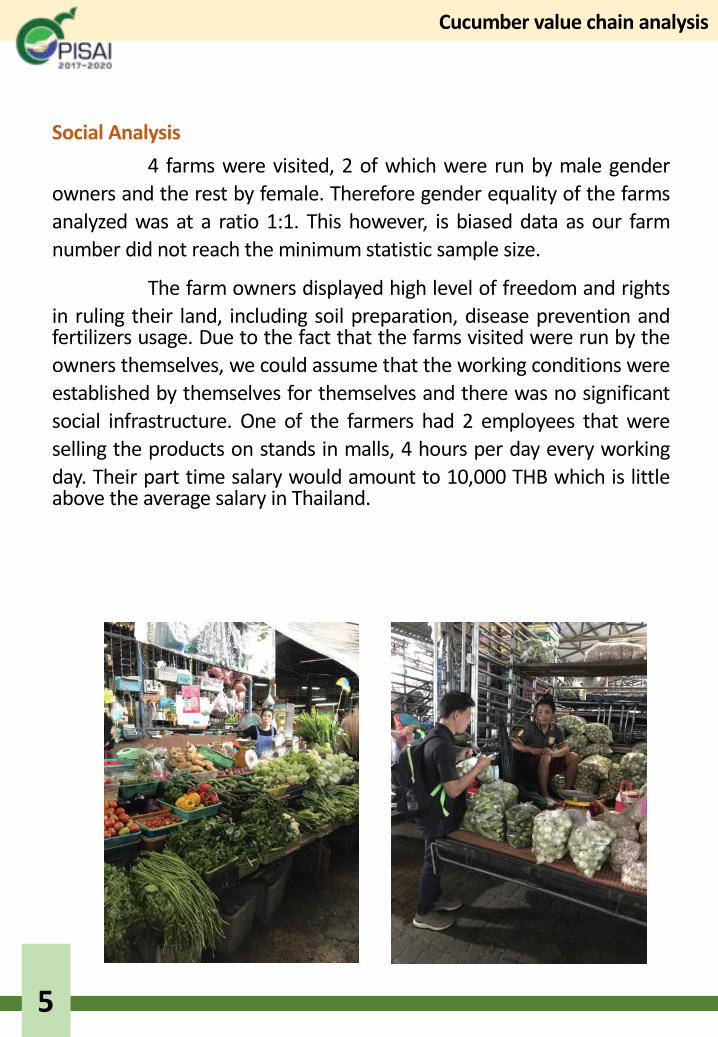
Social Analysis4 farms were visited, 2 of which were run by male gender
owners and the rest by female. Therefore gender equality of the farmsanalyzed was at a ratio 1:1. This however, is biased data as our farmnumber did not reach the minimum statistic sample size.
The farm owners displayed high level of freedom and rightsin ruling their land, including soil preparation, disease prevention andfertilizers usage. Due to the fact that the farms visited were run by theowners themselves, we could assume that the working conditions wereestablished by themselves for themselves and there was no significantsocial infrastructure. One of the farmers had 2 employees that wereselling the products on stands in malls, 4 hours per day every workingday. Their part time salary would amount to 10,000 THB which is littleabove the average salary in Thailand.

6
Cucumber value chain analysis
Environmental analysisAll of the farms visited used some type of alternative
fertilizers, such as fish derivates, coconut milk, nut mixtures andcomposts. Also, most of them used chilli as an insecticide. One of thefarmers had a BIO certification.
During the dry season, underground irrigation system wasused or water from the river. For the BIO production part, no riverwater irrigation was allowed.
As the farms were relatively small, the transport and marketphases were not significantly impacting the environment. Resourcedepletion was also at a small scales since water is easily accessible inThailand. No data was available about ammonia and phosphateemissions as well as the human health risk factors.
7
Cucumber value chain analysis
ObjectivesThe main goal of our research is to gather as much data on
the production and consumption process of cucumbers in Thailandincluding the production methods of cucumbers and the consumers’attitude towards cucumber consumption.
Data was collected from 4 farmers where information wasacquired about the production process of cucumbers. The productionprocess is standard and identical in all cases, except for one farmerwhich partially grows organically and other minor differences infertilizers usage and irrigation techniques. The production process wasas follows: seeds acquirement, either from the previous harvest or inthe case of organic production seeds, certified material had to be used.Soil preparation was mostly manual, as the farm types belonged tosmall independent specialized family farms, according to FAOclassification of farms. In the final production process, cucumbers werestored and distributed to sellers as intermediaries what would furthersell the product at local markets, distribute it further to supermarkets.The average yield of cucumbers per rai in Thailand is about 4,000 kg.
Sellers were interviewed at 4 local markets were workingwith both wholesaling and direct sell to consumers. They bought goodsat a price that in average amounted to 6 BHT while the sale priceamounted to 7 THB.

8
Cucumber value chain analysis
Methodology4 farmers were personally interviewed on the production process ofcucumbers. Questions as follows were asked:
• Could you explain the methods you use in the production process?• What kind of fertilizers do you use in the production process?• Do you grow organically?• What kind of irrigation system do you use?• What is the yield per rai?• Howmany employees does your farm have?• Do you distribute the cucumbers personally to sellers or vice versa?• What is the yield of cucumbers in Thailand?
4 sellers were personally interviewed at local supermarkets. Questionsas follows were asked:• What is the buy and sell price of cucumbers?• Are cucumbers a demanded product?• Do you buy the cucumbers at farms?• Do you sell the cucumbers to retailers?116 people were surveyed about their cucumber consumptionpreferences. An digital questionnaire format was used. Questions asfollows were asked:• Gender• Age• Where do you buy cucumbers?• How frequently per week do you buy cucumbers?• Howmany kg per week do you buy?• Do you prefer organically or conventionally grown cucumbers?• What size of cucumbers do you prefer?• Howmuch are you willing to pay for cucumbers per kg?• Do you prefer to buy cucumbers from one seller?
9
Cucumber value chain analysis
Results
Fig 1. Gender Fig 2. Age
Fig 3. Preferred location of shopping cucumbers
Fig 4. Frequency of cucumber shopping per week
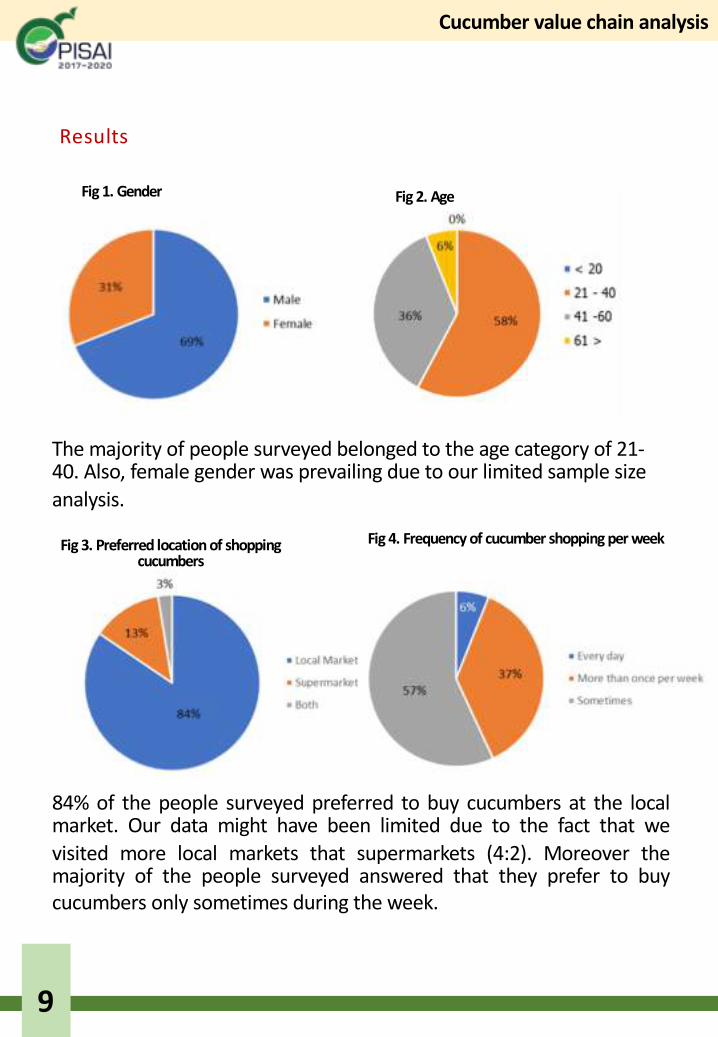
The majority of people surveyed belonged to the age category of 21-40. Also, female gender was prevailing due to our limited sample size analysis.
84% of the people surveyed preferred to buy cucumbers at the localmarket. Our data might have been limited due to the fact that wevisited more local markets that supermarkets (4:2). Moreover themajority of the people surveyed answered that they prefer to buycucumbers only sometimes during the week.
10
Cucumber value chain analysis
Fig 8. Price per kg that costumers are willing to pay
Fig 7. Fidelity to one seller
Fig 5. Quantity of cucumbers bought per week
Fig 6. Preference about organic cucumbers
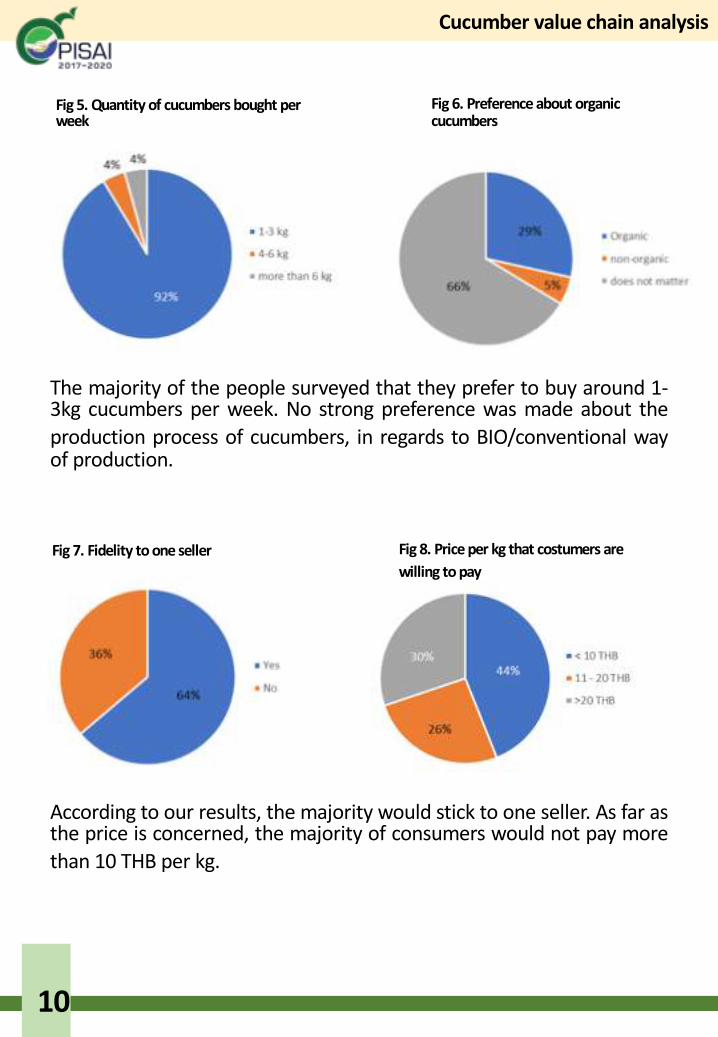
The majority of the people surveyed that they prefer to buy around 1-3kg cucumbers per week. No strong preference was made about theproduction process of cucumbers, in regards to BIO/conventional wayof production.
According to our results, the majority would stick to one seller. As far asthe price is concerned, the majority of consumers would not pay morethan 10 THB per kg.

11
Cucumber value chain analysis
Conclusions
The cucumber value chain in Chiang Mai is relativelydeveloped. Cucumber production does not take a big effort as theregion itself has high soil humidity and agriculture is very common.Because of the high seasonal humidity, there are no water resourcesaffected in quantity, while they might be affected in quality because ofthe potential fertilizers and pesticides pollution. Farmers were satisfiedwith the cucumber production and none of them was interested inquitting production. On the contrary, as the state had started to givesubventions for BIO agriculture, the cucumber production mightincrease. As far as the sellers are concerned, there is price stability onthe market of cucumbers which motivates sellers to continue with theirbusiness. Consumers were interested in continuing their shopping atthe local markets which does contribute to support of the localmarkets, which in return might result in improvement of the localmarket conditions.
Personal experience/advice
The process of communicating with the consumers washardened because of the language limits of European students.Foreigners with good command of English had to be questioned, andthere was not many of them at the local markets. Also, the hygieneconditions of the local super markets can be considered low, as fewrodents were noticed in couple of locations, one of them being thecucumber stand itself.
12
Cucumber value chain analysis
13
Cucumber value chain analysis

14
Cucumber value chain analysis
http://www.fao.org/docrep/004/ac145e/AC145E09.htm
http://www.fao.org/docrep/w7365e/w7365e05.htm#2.2%20farm%20types%20and%20structure
https://www.worldatlas.com
References
Melon report

Preferences and consumer behavior of melon consumption K. Tongma1/, L. Sriyapunt1/, C. Bunchamni2/, S. Suangto2/, M. Jirsova4 /,
P. Chaloupkova4/, O. Leuner4/, P. Suebpongsung3/
1/Prince of Songkla University, Songkhla, Thailand, 2/Khon Kaen University, Khon
Kaen, Thailand, 3/Chiang Mai University, Chiang Mai, Thailand, 4/Czech University of Life Sciences Prague, Czech Republic
Abstract
The purpose of this project is to focus on significant questions about melon .
The study is to focus on preferences and consumer behavior of melon consumption in Chiang Mai province. The project includes three parts, point of view from farmers, consumers and sellers. The objectives are to analyses farmers and their technology to grow melons, to evaluating role of consumer behavior and to know perspective of melon sellers. The data was collected by using personal interview for farmers and sellers and questionnaire survey for consumers. The questionnaire consisted of 16 questions. The survey have 2 farmers, 5 sellers and 1 0 2 consumer as respondents.
The results of the project about production of melon. Farm 77 is a small farm and focused on retailing while The Best Farm focuses on wholesaling. In consumer behavior of melon consumption, the main factors to buy melon are good taste, smell and healthy. The local market was the most convenient place to buy for melon. Melon juice is the best known of melon product. The acceptable prices are between 91-150 baht. Consumers are willing to buy organic melon at a higher prices . Organic production of melon is an interesting way of value if the farmer wants to increase the value of the product. Melon processing is also an interesting alternative. However, Farmers should find more information about the production, regulation and cost in order to make a decision.
Introduction
The purpose of this project is to focus on significant questions about melon .
Cantaloupes are also commonly known as muskmelons, mush melons, rock melons and Persian melons. They are member of the botanical family Cucurbitaceal, along with honeydew and watermelons (Megan Ware RDN LD, 2017). The main center of origin of the cantaloupe melon is the territory of Iran, Armenia and India. This kind of fruit is famous in the world for many good aspects. Melon is full of vitamins as are vitamins A, C, K, B-6 and magnesium. All of these vitamins are healthy and important for human body. Melon is popular among people because it is light and fresh fruit, especially in tropical countries as Thailand.
The study is to focus on preferences and consumer behavior of melon consumption in Chiang Mai province. For this area it is one of the most important produce. The project includes three parts, point of view from farmers, consumers and sellers. Farmers from two melon farms near Chiang Mai provided interview and gave us many useful information about melon cultivation, irrigation system and possibilities of melon diseases for the research. The next step in the research was questionnaire survey for consumers. Respondents were questioned by 1 1 questions their opinion about melon. The research was conducted in the 2 local markets and 3 supermarkets in Chiang Mai city. The study was also interested in the view of the melon sellers. Five sellers responded to personal interview. The questions were focus on buy frequency of melon and consumer behavior at buying melon.
Objective
The first objective is to analyses farmers and their technology to grow melons.
Is melon farming profitable? To Whom and where farmers deliver products? The second objective consists in evaluating role of consumer behavior. What do people think about melon? What is the main reason for decision to buy melon and if they prefer organic melon than non-organic melon. How much are they willing to spend for melon? The last objective gives reason by sellers. How many melons they sell per one day? Who gives them melons to shop? Could be useful for farmers this study?

Material & Method
3.1 Scope of the Research
The study is a field research in Chiang Mai, Thailand. Population of the study were 2 farmers from Best farm and Farm 77, 5 sellers and 102 consumer in the local market ( Waroros Market, Muang Mai Market) and supermarkets ( Rimping Supermarket, Agri CMU shop and Tops Supermarket in Central Festival Chiang Mai)
3.2 Personal interview and Questionnaire
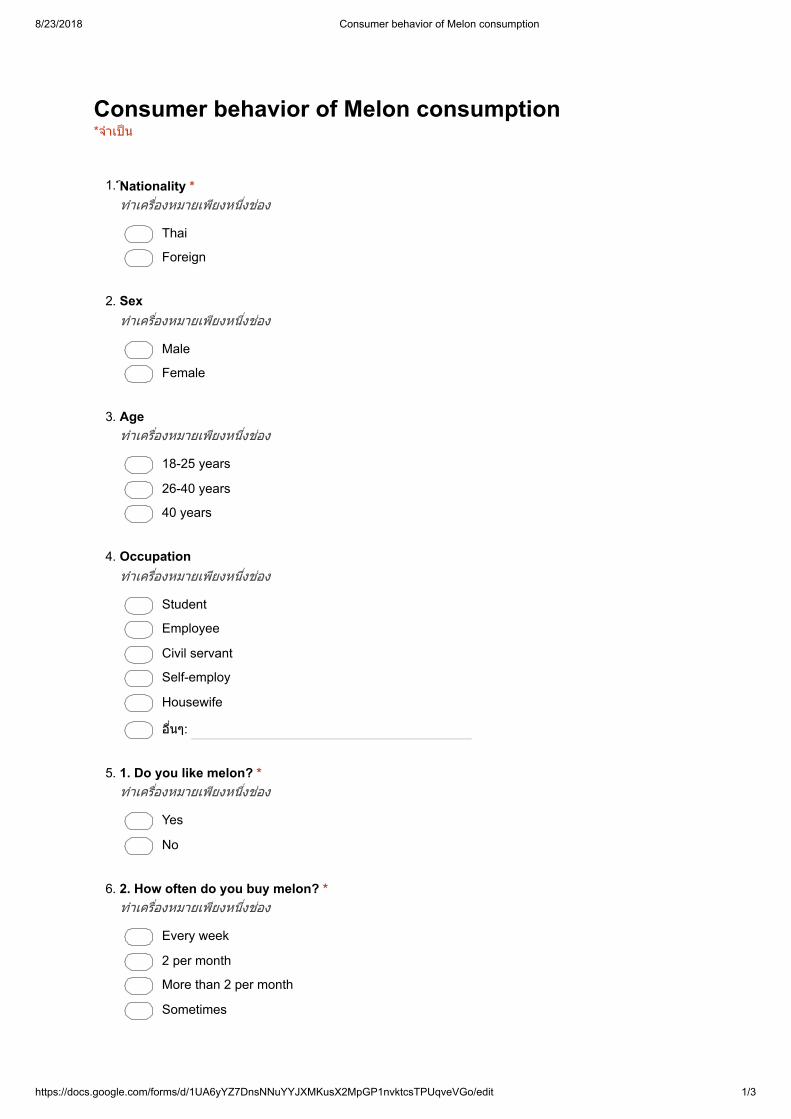
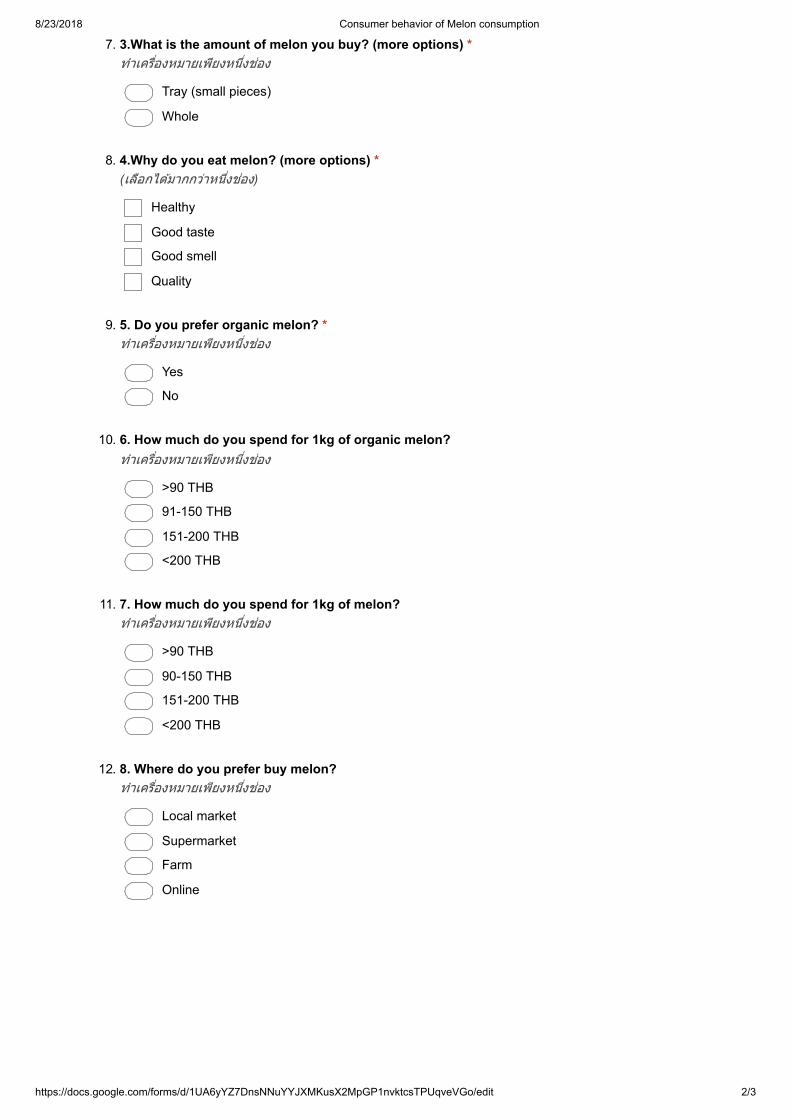
The data was collected by using personal interview for farmers and sellers and questionnaire survey for consumers. Survey was undertaken from August 16 of 2018 to August 18 of 2018. The questionnaire consisted of 16 questions. The first section consisted of 4 questions related to socio- demographic characteristics including nationality, age, gender and occupation. Second section contained 1 1 questions relating to buying motivations and preference on melon quality.
3.3. Statistical analysis
All data analyses were performed using google form. Descriptive statistics were calculated for the demographic and social characteristics of all respondents.
Results
Farmers’ perspective
1. Farm 77
Ohm, who is owner of Farm 77 melon farm. He graduated from Mining engineering. After 5 years of working as an engineer. He started his own farm by building a small greenhouse and planting melons. He also extended to 2 greenhouse after received a good feedback. Capacity of his farm is around 700-800 fruits per crop and 4 crops per year. In the production, he used mix of coconut coir and coconut shell hair as planting materials. Seedling take time around 7 days to emergence and were move to plant in the greenhouse. Hand pollination was done at 21 days after planting and the fruit can be harvested 40 days after pollination. The harvesting also depend on weathers. After he sure about harvesting time, he announce on his Facebook fan page so that consumers can order the melon. Wholesale price is around 55-65 per kilogram of fruit and the retailing price is around 120 per fruit. The revenue is around 80,000 Baht per harvesting.
2. Best Farm
Best have started her farm 4 years ago. She got knowledge of melon production when she was a trainee in melon farm. Now, she has 18 greenhouses in her farm and she also are a coordinator of community enterprise of many melon farms in the district. To find a new target group, she tried to have a contact with a supermarket in many shopping malls for 2 years. She sent her melons, both whole fruits and cut pieces, to many supermarket such as Rimping and Tops Supermarket.
Sellers’ approach
1. Tops supermarket in Central Festival Chiang Mai
There are 2 brands of melon that sold here; The Great Farm and My choice.
The Great Farm is the farm which has a contact to sell their products in the supermarket and most of melons are in this brand. Price of The Great Farm’s melon is around 159 Baht per kilogram of melon. The Great Farm also send staff to do the cutting of unqualified fruit into pieces to pack in the tray. My choice is brand own by the supermarket by has a contact with a melon farm to send them melons and sell under this brand. The price of melon is around 139 Baht per kilogram. Average sold melon of this supermarket is around 30 fruits per day.
2. Agri CMU Shop
The products that sell here are from alumni farm and nearby farm. Most of consumers that visit the shop are CMU Staff. 10- 20 melons arrive every month.
Residue detection is done every months. Damaged fruits can be in the promotion; sale 20-50 %, buy 1 get 1 more, depend on the agreement with a farmer.
3. Royal Project Shop
The Royal Project Shop located inside Chiang Mai University. Most of consumer are middle-aged people and also CMU Staffs. There are 20 fruits per round of arrival from The Royal Project Produce Center but the supply is not yet stable.
Price of each fruit was print and stick to the fruit individually. The leftovers and damaged fruits will return to The Center.
Consumer behavior output
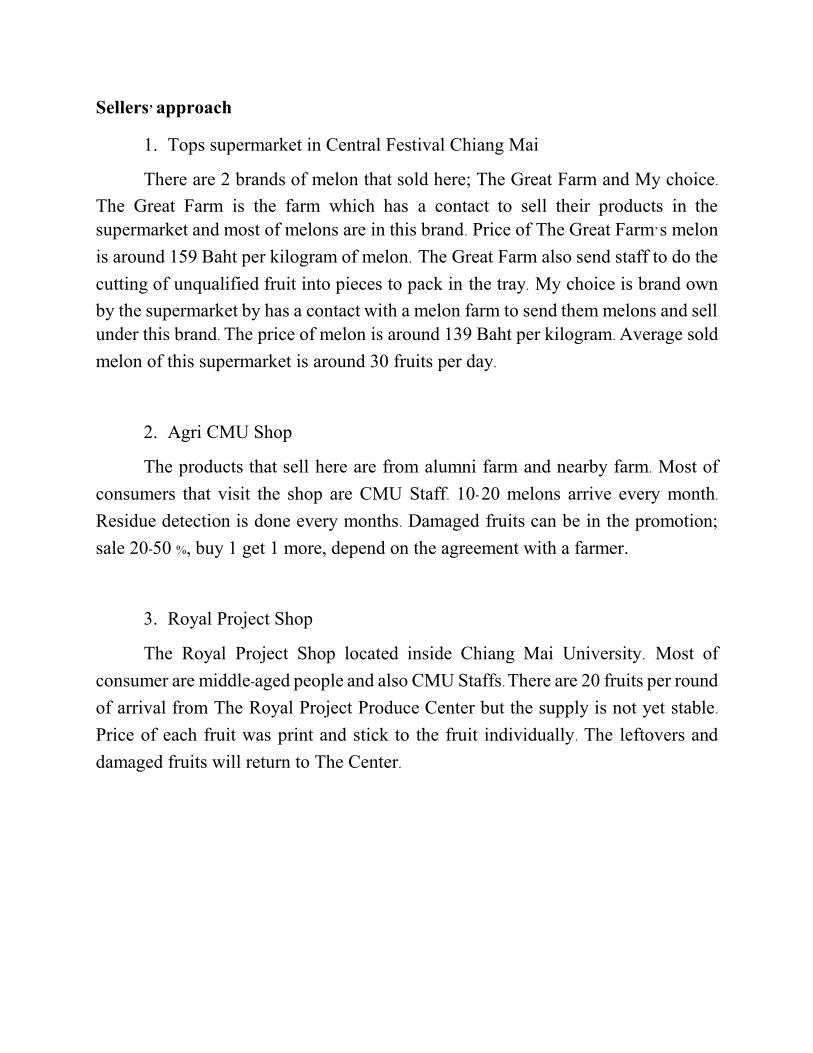
The respondent characteristics are presented in Table 1. The majority of the respondents (79%) are Thai while 21% are foreigner. Number of female respondents (59%) are more than male respondents (41%). Half of respondents are in 16 to 25 years old (53%). More than one third (35 %) of the respondents are student, followed by employee (31%) and Civil servant (13%).
Characteristics %
Nationality Thai 79 Foreigner 21
Gender Male 41 Female 59
Age 16-25 53 26-40 24 > 40 24
Occupation
Student 35 Employee 31 Civil servant 13 Self-employ 7 Housewife 5 Etc. 9
Table 1 Respondent characteristics
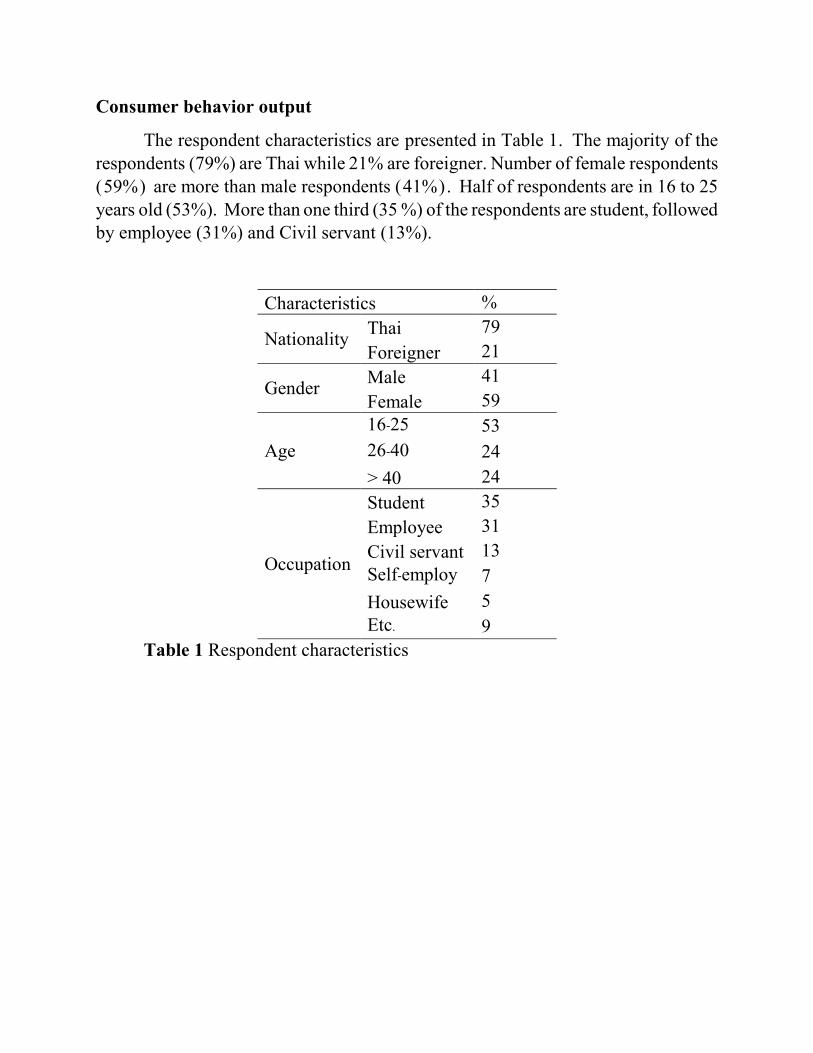
According to Figure 1, consumers prefer buying melons in local markets (46%) and supermarkets (41%) than in farm (19%) . It is more convenient for the consumer to go to local market than go to melon farm.
Figure 1 Places the consumers buy melons from
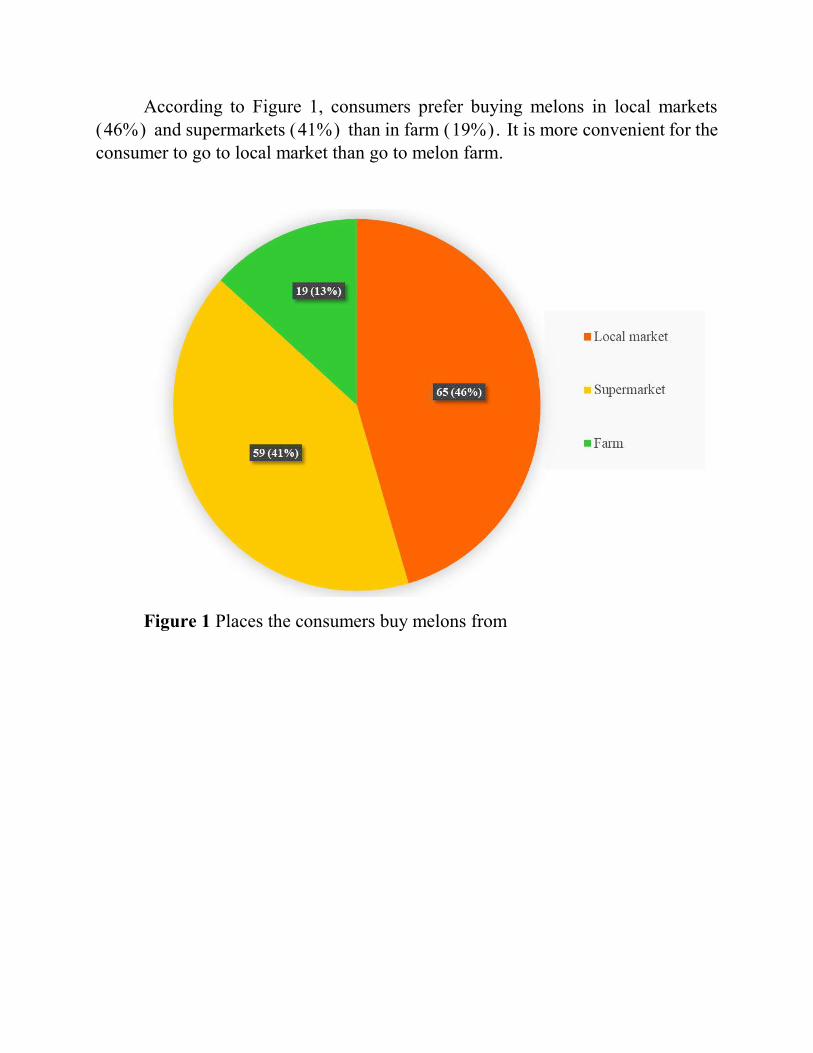
Figure 2 show that there are differences between Thai people and foreigners. While Thai consumers’ willingness to buy melon because of good taste ( 80.28%) and smell (70.42%). The foreigner consumers’ willingness to buy melon because of their good taste ( 68. 42%) and health ( 42. 11%). These results imply that there are some opportunities for melon product is promoted appropriately focusing on the healthy or benefit of melon.
Figure 2 Reasons to buy a melon compare between Thai and foreigners
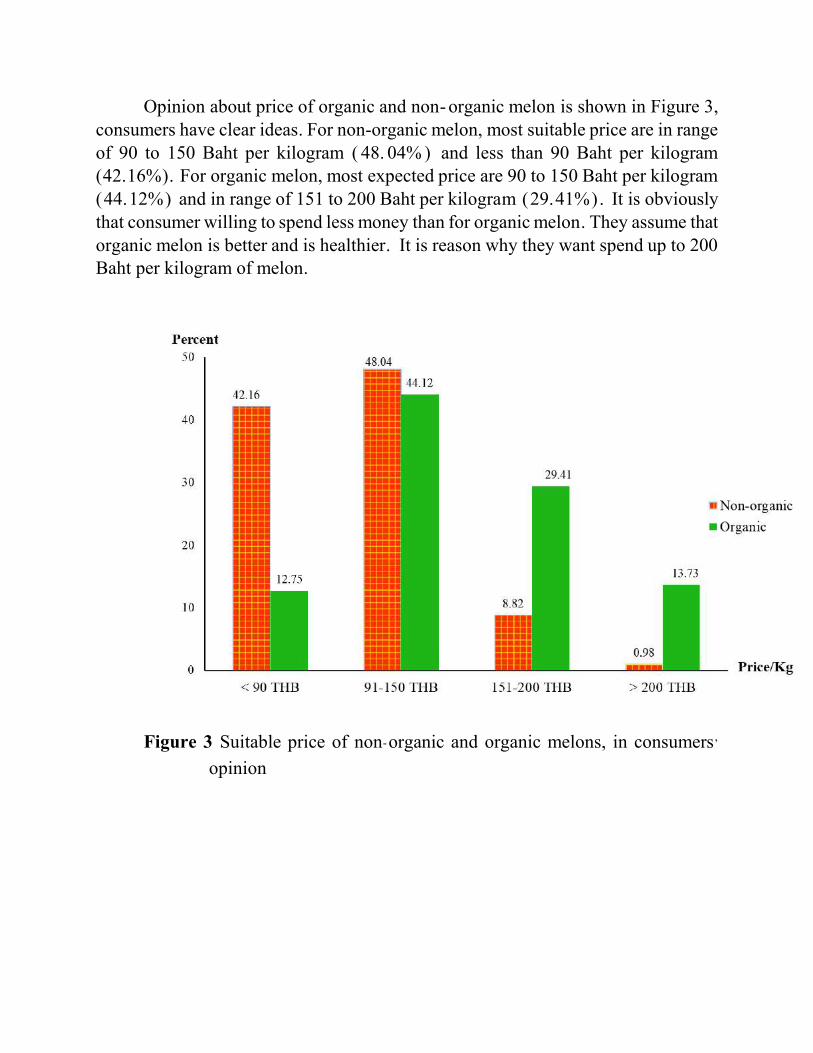
Opinion about price of organic and non- organic melon is shown in Figure 3, consumers have clear ideas. For non-organic melon, most suitable price are in range of 90 to 150 Baht per kilogram ( 48. 04% ) and less than 90 Baht per kilogram (42.16%). For organic melon, most expected price are 90 to 150 Baht per kilogram (44.12%) and in range of 151 to 200 Baht per kilogram (29.41%). It is obviously that consumer willing to spend less money than for organic melon. They assume that organic melon is better and is healthier. It is reason why they want spend up to 200 Baht per kilogram of melon.
Figure 3 Suitable price of non-organic and organic melons, in consumers’
opinion
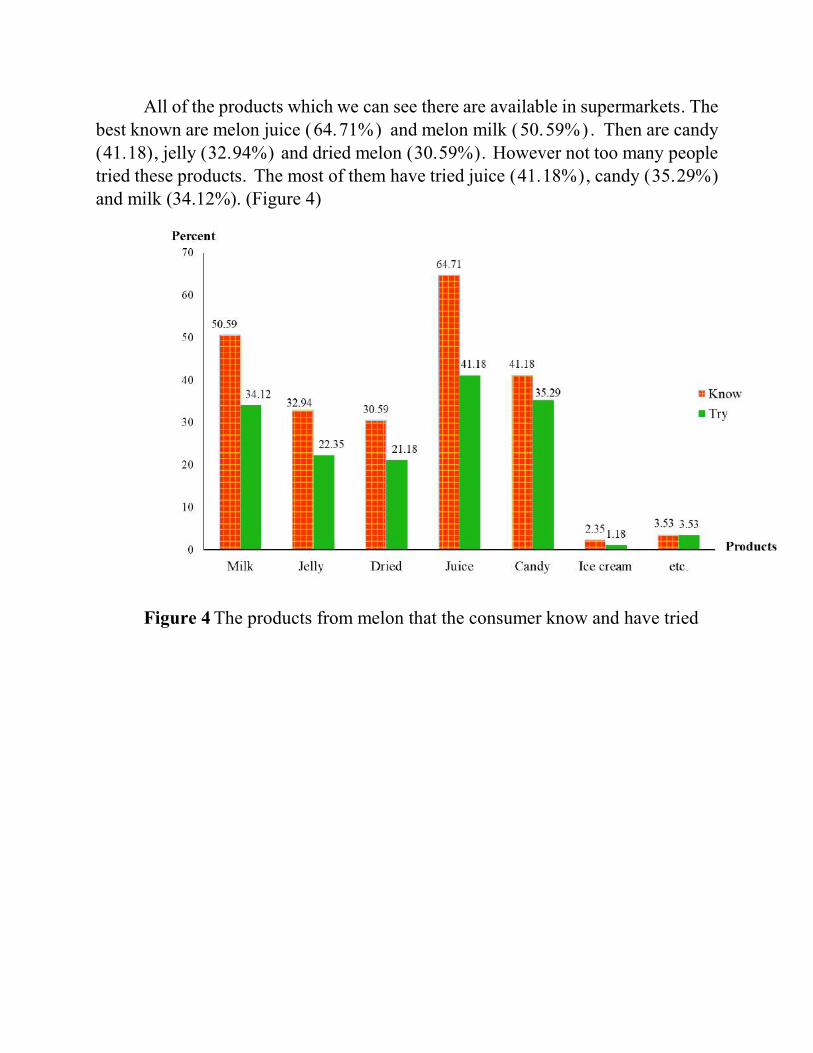
All of the products which we can see there are available in supermarkets. The best known are melon juice (64.71%) and melon milk (50.59%). Then are candy (41.18), jelly (32.94%) and dried melon (30.59%). However not too many people tried these products. The most of them have tried juice (41.18%) , candy (35.29%) and milk (34.12%). (Figure 4)
Figure 4 The products from melon that the consumer know and have tried

Conclusion
The results of the project about production of melon. The Farm 77 and The Best Farm are non-organic farms but the marketing is different. Farm 77 is the small farm and focused on retailing. The price is cheaper than The Best Farm which is the large farm and focus on wholesaling.
Part of preferences and consumer behavior of melon consumption, it is found that the main factors to buy melon of Thai and foreigner consumers are good taste, smell and healthy. Marketing of the local market was the most convenient place to buy for melon. Consumers also know the processed products of melon especially melon juice. The prices of non- organic melon compare between the farms and supermarkets. The prices are between 91-150 baht, which is acceptable. Consumers are willing to buy organic melon at a higher price. Organic production of melon is an interesting way of value if the farmer wants to increase the value of the product.
Melon processing is also an interesting alternative. However, farmers should find more information about the production, regulation and cost in order to make a decision.
Acknowledgement
Authors thank to PISAI Project under the ERASMUS+ Program for supporting finance.
References
Oneminutejuice. (2018, August 22 ). 10 Health Benefits of Musk Melon. Retrieved from http://oneminutejuice.com/health-benefits-of-musk-melon.
Nipon Chaimongkol. (2018, August 22 ). Melon/ Cantaloupe and Cultivation.
Retrieved from http://puechkaset.com.
Megan Ware. (2018, August 23). Everything you need to know about cantaloupe.
Retrieved from https://www.medicalnewstoday.com
/https://www.medicalnewstoday.com/articles/279176.php
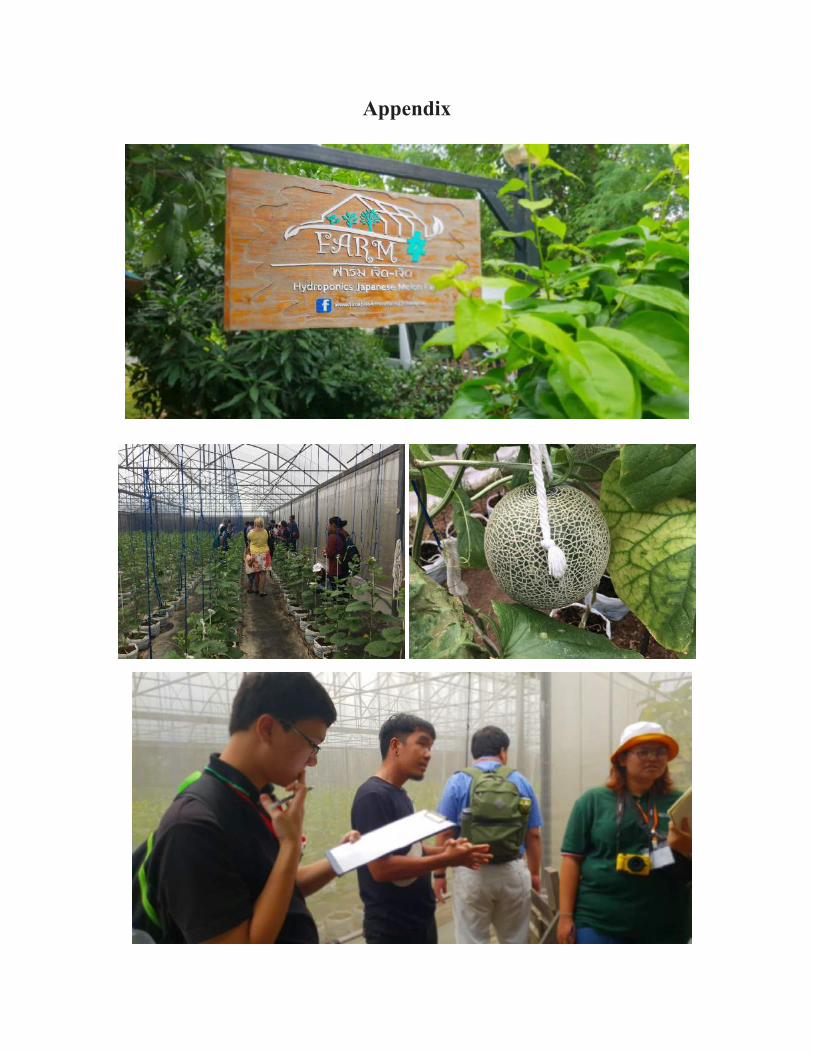
Appendix
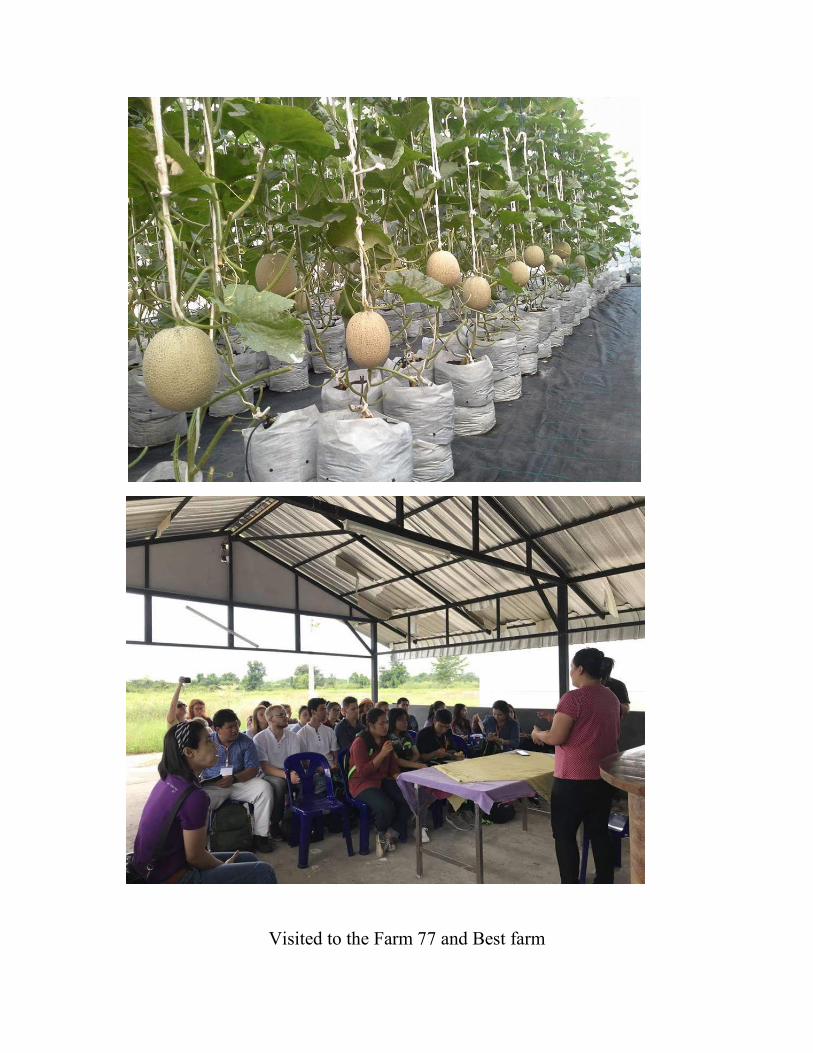
Visited to the Farm 77 and Best farm

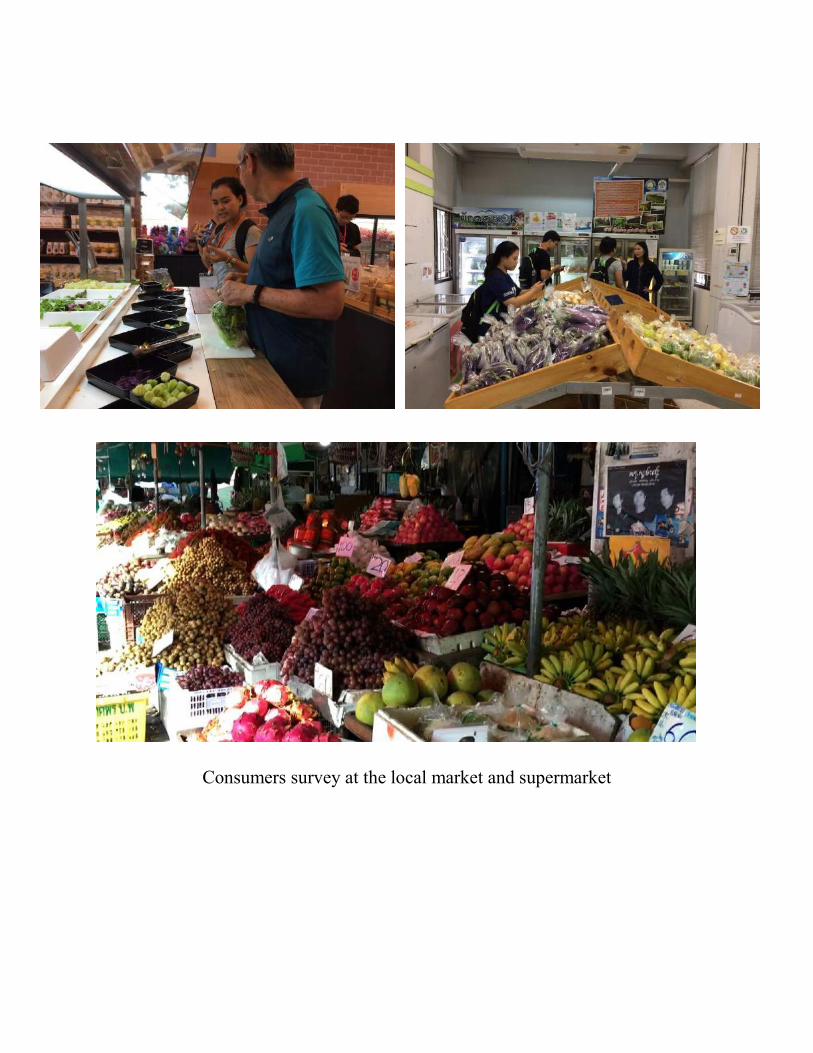
Consumers survey at the local market and supermarket
8/23/2018 Consumer behavior of Melon consumption
https://docs.google.com/forms/d/1UA6yYZ7DnsNNuYYJXMKusX2MpGP1nvktcsTPUqveVGo/edit 1/3
Consumer behavior of Melon consumption*จําเป็น
1. ์Nationality *
Thai
Foreign
2. Sex
Male
Female
3. Age
18-25 years
26-40 years
40 years
4. Occupation
Student
Employee
Civil servant
Self-employ
Housewife
อื�นๆ:
5. 1. Do you like melon? *
Yes
No
6. 2. How often do you buy melon? *
Every week
2 per month
More than 2 per month
Sometimes
8/23/2018 Consumer behavior of Melon consumption
https://docs.google.com/forms/d/1UA6yYZ7DnsNNuYYJXMKusX2MpGP1nvktcsTPUqveVGo/edit 2/3
7. 3.What is the amount of melon you buy? (more options) *
Tray (small pieces)
Whole
8. 4.Why do you eat melon? (more options) *( )
Healthy
Good taste
Good smell
Quality
9. 5. Do you prefer organic melon? *
Yes
No
10. 6. How much do you spend for 1kg of organic melon?
>90 THB
91-150 THB
151-200 THB
<200 THB
11. 7. How much do you spend for 1kg of melon?
>90 THB
90-150 THB
151-200 THB
<200 THB
12. 8. Where do you prefer buy melon?
Local market
Supermarket
Farm
Online

8/23/2018 Consumer behavior of Melon consumption
https://docs.google.com/forms/d/1UA6yYZ7DnsNNuYYJXMKusX2MpGP1nvktcsTPUqveVGo/edit 3/3
ขบัเคลื�อนโดย
13. 9. Do you know any product from melon? (more options)( )
Milk melon
Dried melon
Jelly
Candy
Juice
Don't know
อื�นๆ:
14. 10. Have you ever try any product melon? (more options)( )
Milk melon
Dried melon
Jelly
Candy
Juice
Never try
อื�นๆ:
15. 11. Do you plan to plant melon at home?
Yes
No
I have already plant melon
16. 12. Recommend