Innovation Value Chain of Chinese Pharmaceuticals - USCIPI
145
-
Upload
khangminh22 -
Category
Documents
-
view
1 -
download
0
Transcript of Innovation Value Chain of Chinese Pharmaceuticals - USCIPI

1
Innovation Value Chain of Chinese Pharmaceuticals
Edited by:
Yitao Wang, M.D.
Yuanjia Hu, Ph.D.
Albert Wai-Kit Chan, Ph.D., J.D.
United States-China Intellectual Property Institute Inc.
Whitestone, New York

2 3
Preface
In the last decade, China has rapidly ascended to a position as a worldwide leader in terms of R&D funding, scientific publications, and patents. In particular, the Chinese government has given high priority to the research of new medicines, reflected by the launch of the project ‘‘Key Drug Innovation’’ in 20071, 2. On the contrary, China’s pharmaceutical industry is well known for its mass production of low-level generic drugs. Recent evidence demon-strates the weak position of China in the global drug innovation network, as measured by globally recognized, innovative drugs3, 4.
In this context, the huge gap between weak innovative medical products and strong R&D input and “paper output” (i.e. publications and patents) is quite perplexing to China’s phar-maceutical industry and, thus, becomes a crucial question for the scientific community. It is necessary to re-examine pharmaceutical innovation in China more comprehensively because this paradox seems to be not only a purely technological problem, but also a com-plex issue involving economics, management, and law. First, we must redefine “innovation” from an economic perspective.
As the “father” of innovation economics, Joseph Schumpeter refers to “innovation” as “doing things differently in the realm of economic life5.” Modern Schumpeterian scholars further define “innovation” as the application of new ideas to the products, processes, or other aspects of the activities of a firm that lead to increased “value.” Moreover, the term “innovation value chain (IVC)” was developed to refer to an integrated flow that involves idea generation, conversion, and diffusion6.
However, only a few studies have shifted attention to address this paradox of Chinese pharmaceutical innovation from the perspective of IVC. Pharmaceutical innovation, re-ferred to in this book as the whole process of bringing a new drug to market, involves a series of research stages and regulatory approvals which usually take about 10-15 years for a new drug. Hence, this book re-examines pharmaceutical innovation in China from the viewpoint of the innovation value chain by sequentially scanning different sections in the whole process of drug innovation including idea generation indicated by academic
Innovation Value Chain of Chinese Pharmaceuticals
Published by:
United States-China Intellectual Property Institute Inc.
141-07 20th AvenueWorld Plaza, Suite 604Whitestone, NY 11357
Tel: (718) 799-1000Fax: (718) 357-8615
E-mail: [email protected]
All rights reserved. No part of this book mat be reproduced or transmitted in any form or by any
means, electronic or mechanical, including photocopying, recording or by any information storage
and retrieval system without written permission from the publisher, except for the inclusion of brief
quotations in a review.
Copyright © 2017 by United States-China Intellectual Property Institute Inc.
Cover Art by Sam Lai @ i HUBS
Book design and production by Sam Lai @ i HUBS
Library of Congress Cataloguing-in-Publication Data
United States-China Intellectual Property Institute
Innovation Value Chain of Chinese Pharmaceuticals/ By United States-China Intellectual Property
Institute Inc.
p. cm.
Includes bibliographical references and index.
ISBN (978-0-9862198-4-9) (electronic)
1. Business
2. Technology

4 5
References
1. Scherngell T, Borowiecki M, Hu YJ. Effects of Knowledge Capital on Total Factor Pro-ductivity in China: A Spatial Econometric Perspective. China Economic Review. 2014; (29): 82-94.
2. Scherngell T, Hu YJ. Collaborative Knowledge Production in China: Regional Evidence from a Gravity Model Approach. Regional Studies. 2011; 45(6): 755-772.
3. Hu YJ, Scherngell T, Qiu L, et al. R&D Internationalisation Patterns in the Global Phar-maceutical Industry: Evidence from a Network Analytic Perspective. Technology Analysis & Strategic Management. 2015; 27(5): 532-549.
4. Hu YJ, Scherngell T, Man SN, et al. Is the United States Still Dominant in the Global Pharmaceutical Innovation Network? PLOS ONE. 2013; 8(11): e77247.
5. Schumpeter JA. Business Cycles: A Theoretical, Historical, and Statistical Analysis of the Capitalist Process. Mansfield Centre, Connecticut: Martino Pub (2006) [1939]: ISBN 9781578985562.
6. Hansen MT, Birkinshaw J. The Innovation Value Chain. Harvard Business Review. 2007; 85(6): 121-130.
articles, basic research, and applied development measured by ongoing projects, technol-ogy flow captured by patent citations, technology valuation and transfer, product registra-tion, and the launch of new drugs. Each chapter is an independent research work which may either involve a specific therapeutic area or generally focus on a stage, but they can structurally be linked within the whole chain. Most of them are empirical studies based on substantial data and qualitative analysis. The table below sketches the outline of this book by specifying therapeutic coverage, measurement indicators, and positions in IVC of each chapter. An integrated understanding of all chapters in this book may provide an overview of Chinese drug innovation as an end-to-end process, which is helpful for the policymak-ers, investors, and researchers involved in drug innovation to spot both the weakest and the strongest links and, further, to find solutions to this paradox.
Note: IVC Innovation Value Chain
In this book, Chapters 3, 5, 6, 7, 9, 11, 12, and 13 are published originally. Chapters 1, 2, 4, 8, and 10 have been published in international prestigious journals, while their republica-tions as chapters in this book have been permitted by original journals, respectively.
Finally, we sincerely acknowledge many of our colleagues and students who contributed to this book, Ms. Julie Lai for her substantive editing and proofreading work, and Interna-tional Society for Chinese Medicine, the Science and Technology Development Fund of Macao SAR, and the University of Macau for financial support by projects, 013-2015-A1, MYRG2015-00145-ICMS-QRCM, MYRG2015-00172-ICMS-QRCM, and MYRG2016-00144-ICMS-QRCM for this book.
A table of the sketch of chapter structure

6 7
Contents
Chapter 8 P.159Research and development of hepatitis B drugs: An analysis based on technology flows measured by patent citations
Chapter 9 P.187An analysis of technology flows of antidepressants based on patent citation network
Chapter 10 P.209Pharmaceutical patent valuation based on empirical models
Chapter 11 P.221Cross-regional pharmaceutical technology transfer in China: An empirical study based on spatial interaction model
Chapter 12 P.241Changing pharmaceutical registration rules in China: Latest update and potential impacts
Chapter 13 P.259Pharmaceutical innovation network: Global patterns and the role of China
About The Editors P.282
Chapter 1 P.9Obstacles and opportunities in Chinese pharmaceutical innovation
Chapter 2 P.31Analyzing the Chinese landscape in anti-diabetic drug research: Leading knowledge production institutions and thematic communities
Chapter 3 P.53Monitoring drug research on clinical neurology in China: An analysis of institutional leaders and community themes
Chapter 4 P.73China’s landscape of discovering miRNAs in cancer
Chapter 5 P.91Global landscape of research and development on antibiotics
Chapter 6 P.115Entry inhibitors for AIDS therapy: A review of research and development projects
Chapter 7 P.135Collaboration networks for R&D of monoclonal antibodies: An analysis based on pipeline projects
Contents
8 9
Chapter 1
OBSTACLES AND OPPORTUNITIES IN CHINESE PHARMACEUTICAL INNOVATION
Jingyun Ni, Junrui Zhao, Carolina Oi Lam Ung, Hao Hu, Yuanjia Hu*, Yitao Wang*
State Key Laboratory of Quality Research in Chinese Medicine, Institute of Chinese Medical Sciences, University of Macau,
Macau SAR, China
* Corresponding authors: [email protected]; [email protected]
This chapter has been published as below.J.Y. Ni, J.R. Zhao, C.O.L. Ung, Y.J. Hu*, H. Hu, and Y.T. Wang. Obstacles and opportunities in Chinese pharmaceutical innovation, Globalization and Health, 13: 1-9, 2017.

10 11
Abstract
Background: Global healthcare innovation networks nowadays have expanded beyond developed countries, with many developing countries joining the force and becoming important players. China, in particular, has seen a significant increase in the number of innovative firms and research organizations stepping up to the global network in recent years. Nevertheless, the intense R&D input has not brought about the expected output. While China is ascending at a great speed to a leading position worldwide in terms of R&D investment, scientific publications and patents, the innovation capabilities in the pharma-ceutical sector remain weak.
Discussion: This study discusses the challenges and opportunities for pharmaceutical in-novation in China. On one hand, academic, industrial, institutional and financial constraints were found to be the major and inevitable barriers hindering the development of drug innovation. On the other hand, unique advantages had been observed which included a growing pharmaceutical market, R&D funding, distinctive R&D source, and international cooperation.
Summary: The most important thing for China’s pharmaceutical sector to leap forward is to break though innovation barriers and integrate own advantages into global value-chain of healthcare product development.
Keywords
China, Pharmaceutical industry, Obstacles, Opportunities, Global network, Innovation
1. Background
Pharmaceuticals are playing an extremely important role in global health system by di-agnosing, curing, treating, and preventing diseases. In terms of dramatically increasing R&D (Research and Development) expenditures and relatively decreasing approvals of new drugs during recent past, the decline in R&D efficiency has been the central issue in discussing global pharmaceutical innovation1, 2. Meanwhile, recent literature clearly points out that emerging countries, e.g., China, are playing important roles in global pharma-ceutical R&D activities. For instance, they keep investing a great amount of capitals and resources into drug innovation3, 4. In this context, it is of great significance to understand pharmaceutical innovation in China from the global perspective.
As one of the fastest growing markets among the emerging countries, China has received increasing attention from around the world. Due to supporting national polices, economic growth, aging population and global trends, China’s share of pharmaceutical industry out-put increased nearly seven-fold, from 2.5% in 1995 to 18.3% in 2010, and was expected to become the second-largest pharmaceutical market in the world by 20155, 6. This trend may also apply to the global healthcare innovation networks, as increased sales performance can better support R&D.
It is obvious that China has ascended to a worldwide leading position at an accelerated pace in terms of R&D funding, scientific publications, and patents in recent years4. With the perspective of switching from imitation to innovation, R&D expenditure in China’s phar-maceutical industry increased from $162.6 million USD (USA dollar) in 2000 to $3,249.2 million USD in 20117. The favorable condition created by such tremendous investments made by the Chinese pharmaceutical sector in R&D has resulted in significant output of scientific publications and patents in recent years. The number of articles published by Chi-nese scholars in peer review journals related to pharmaceuticals has leapt to the second position in the world8.
However, China is still weak in developing real innovative medicines. Considerable phar-maceutical R&D input, scientific publications and patents in China have not yet translated into the ultimate desired outcome of innovative pharmaceutical products that are recog-nized globally. For a long time, the pharmaceutical industry in China has been known for its mass-production of low-level generic drugs and as a ‘world factory’ of active pharma-ceutical ingredients (APIs) with little mentioning of real innovative medicines9. Studies have shown that China remains at a weak position in the global drug innovation network based on analysis of worldwide recognized innovative drugs10-12.

12 13
It is no doubt that the pharmaceutical innovation system in China is filled with obstacles which prevent China’s R&D capabilities from transforming into innovation competen-cies and eventually pharmaceutical products to generate market values13. With concerns about the huge gap between strong R&D input/“paper output” as well as weak innovative medical products, this study aims to provoke a more systematic analysis of obstacles and opportunities in Chinese pharmaceutical innovation system. More understanding of the pharmaceutical innovation system in China will be helpful to provide more opportunities of discovering new medicines effectively in the world.
2. Obstacles to Pharmaceutical Innovation in China
Innovation is a system phenomenon, with multiple types of individual and collective agents, including firms, entrepreneurs, institutes for education and research, policymak-ers, regulatory agencies, and many types of services and intermediaries, interacting in a variety of ways14. Based on prior literature15, 16, Figure 1 demonstrates the pharmaceutical innovation system, which is comprised of R&D organizations, governments, pharmaceuti-cal companies, and finance and service institutions, responsible for knowledge innovation, policy innovation, production innovation, and service innovation, respectively. These inno-vations link together and generate new medicine discovery under a favorable regulation, market, finance, and technology transfer environments. Obstacles to pharmaceutical inno-vation in China have been observed at each of the above-mentioned counterparts which will be discussed further in the following.
2.1 Academic Organizations
It has been suggested that close partnerships among universities, institutions and compa-nies are integral for the new business model of pharmaceutical R&D in China17. However, to maintain an effective collaboration between the science and the pharmaceutical industry has always been challenging. Pharmaceutical researchers in universities and research in-stitutes in China devote immensely to the research projects only and do not usually take into consideration of the overall development of the pharmaceutical industry. As a result, the research work may not fully address and respond to the challenges and changing de-mands of the industry18.
Figure 1. Pharmaceutical innovation system
Figure 2. Granted patents and licensing percentage of Chinese universities
Note: Data source: China Universities Statistics Yearbook
Moreover, “paper output”, i.e. scientific publications and patents, generated in this envi-ronment has been seriously criticized by the international society 19-21. The Science Cita-tion Index (SCI) -based promotion scheme provides scholars with great incentives in terms of personal honors and has successfully encouraged them to produce a large quantity of publications and file many applications for patents. However, the citation rate of academic papers remains low and the patent lives short. As is depicted in Figure 2, the proportion of licensed patents gradually declined, despite the rapid increase of granted patents during the past decade. The difficulty of licensing out patents produced by universities may imply

14 15
As shown in Figure 3, more than 70% of pharmaceutical manufacturers were small-scale enterprises with employees less than 300 and operating revenue less than $3 million USD in China (according to China’s Regulations on Small and Medium- sized Enterprises (SMEs) Categorizing Criteria’ last accessed in 2011)23. It was difficult for them to sufficiently sup-port R&D with all necessary financial resources to pursue new drug discovery.
Meanwhile, the current ratio of R&D investment to sales is about 2.7% in most of the Chi-nese pharmaceutical companies, which is significantly lower than that of US counterparts which range 15–20%9, 24. Due to a lack of R&D resources for new drug discovery and devel-opment, most of the small-scale firms are engaged mainly in low-value-added activities such as manufacturing, formulating, packaging and distributing generic products, rather than innovative activities. At most, these pharmaceutical firms usually opted for devel-oping generic drugs in order to obtain short-term revenue without going through the burden of high technical innovation. According to the ‘China Drug Review Annual Report’ released by the China Food and Drug Administration (CFDA) in 2012, the number of cate-gory 1.1 new drug applications (which reflect the status of innovative drug development solely in domestic Chinese pharmaceutical companies) remained around 70 per year over the past few years. On the contrary, applications of changing dosage form and new generic
drugs accounted for more than 50% of chemical drug applications in China (see Figure 4).
Note: Data source: China High-tech Industry Statistics Yearbook
Figure 4. Number of chemical drug applications accepted by the CFDA from 2009 to 2012
Figure 3. The number of pharmaceutical manufacture enterprises and percentage of large-medium enterprises in China
a considerable gap between academic research and innovations of pharmaceutical products. Critics have started to review the benefits and possible downside of the SCI-oriented research assessment criteria. It has been suggested that, under the scheme, scholars have become more oriented to personal achievements than the core value of research work, which has lowered the innovative quality and slowed down the overall pharmaceutical innovation development in China19, 20. Commer-cialization of R&D output to real innovative drugs well thus falls behind.
2.2 Pharmaceutical Industry
In the context of industry, high fragmentation of the industrial structure, weak R&D intensity and serious product homogeneity are the major barriers to new drug dis-coveries in China. As of 2012, there were around 4500 domestic pharmaceutical manufacturers and 14,000 domestic pharmaceutical distributors in China, which are attributed in three subsectors involving chemical drug (50%), Traditional Chi-nese Medicine (32%) and biotechnology production (18%)22.
16 17
Note: 1. Data source: 2013 China Drug Review Annual Report
2. Category 1.1 refers to new chemical drug which has never been previously approved for marketing as a drug anywhere else in the world. Category 3 of Chemical Drugs refers to a new drug which has only been marketed outside of China. Category 4 refers to Drug sub-stance and its preparation with changed acid or alkaline radicals (or metallic elements), but without any pharmacological change, and the original drug entity already approved in China. Category 5 is defined as Drug preparation with changed dose form, but no change of administration route and the original preparation already approved in China. Category 6 refers to Drug substance or preparation following national standard.
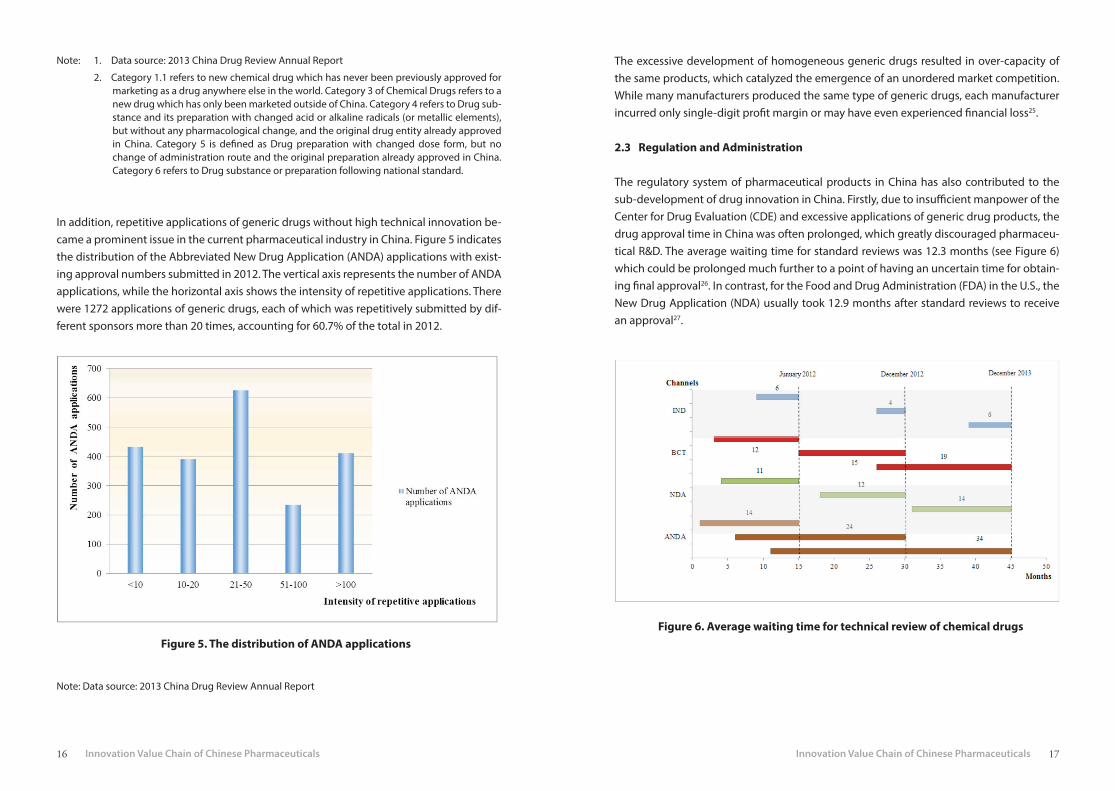
In addition, repetitive applications of generic drugs without high technical innovation be-came a prominent issue in the current pharmaceutical industry in China. Figure 5 indicates the distribution of the Abbreviated New Drug Application (ANDA) applications with exist-ing approval numbers submitted in 2012. The vertical axis represents the number of ANDA applications, while the horizontal axis shows the intensity of repetitive applications. There were 1272 applications of generic drugs, each of which was repetitively submitted by dif-ferent sponsors more than 20 times, accounting for 60.7% of the total in 2012.
The excessive development of homogeneous generic drugs resulted in over-capacity of the same products, which catalyzed the emergence of an unordered market competition. While many manufacturers produced the same type of generic drugs, each manufacturer incurred only single-digit profit margin or may have even experienced financial loss25.
2.3 Regulation and Administration
The regulatory system of pharmaceutical products in China has also contributed to the sub-development of drug innovation in China. Firstly, due to insufficient manpower of the Center for Drug Evaluation (CDE) and excessive applications of generic drug products, the drug approval time in China was often prolonged, which greatly discouraged pharmaceu-tical R&D. The average waiting time for standard reviews was 12.3 months (see Figure 6) which could be prolonged much further to a point of having an uncertain time for obtain-ing final approval26. In contrast, for the Food and Drug Administration (FDA) in the U.S., the New Drug Application (NDA) usually took 12.9 months after standard reviews to receive an approval27.
Figure 5. The distribution of ANDA applicationsFigure 6. Average waiting time for technical review of chemical drugs
Note: Data source: 2013 China Drug Review Annual Report

18 19
Note: 1 Data source: 2013 China Drug Review Annual Report
2 Figure 6 describes the average waiting time for technical review of chemical drugs in four
channels, including Investigational New Drug (IND), New Drug Application (NDA), bridg-
ing clinical trial (abbreviated as BCT in Figure 1) and Abbreviated New Drug Application
(ANDA). Waiting time is measured in month and calculated as the difference between CDE’s
reception date (the day CDE receives drug evaluation request of certain applications from
CFDA) and technical review starting time. The January 2012, December 2012 and Decem-
ber 2013 are three time points that CDE commences technical review of certain applica-
tions.
On the other hand, regulatory standards in China were not consistent with international practices. As China did not join the International Conference on Harmonization of Technical Requirements for Registration of Pharmaceuticals for Human Use (ICH), innovative drugs which were already marketed in other countries had to undergo the new drug registration pursuant to China’s Drug Registration Regulation. Consequently, the entry of import drugs to the local market could be delayed as many as 7 years on average compared with the date the drug are first marketed in other countries28. Furthermore, for registration purpos-es, it was necessary to repeat the clinical trials of import drugs in China as the China’s Good Clinical Practice (GCP) was different from the GCP according to ICH. In addition, pre-ap-proval by the CFDA was needed before clinical trials could be conducted, which meant ad-ditional months or more of waiting time. The international clinical trial multi-center might offer some advantages as a quick channel for import drugs, but this only applied to drugs that were already marketed or at least entered phase II clinical trial in other countries29. As a result, simultaneous global development of drugs faces great challenges in China.
Finally, unlike the practice of marketing authorization holder (MAH) widely adopted in many developed countries, drug marketing authorization in China was only granted to pharmaceutical manufacturers with production authorization. This created significant threat to the initiative of technology transfer between R&D players and pharmaceutical firms. On one hand, R&D institutions might lack the manufacturing facilities and thus were not eligible for applying marketing approval of the drug developed in-house. On the other hand, drug manufacturers needed to shoulder the pressure of massive financial invest-ment for every new production line when developing a new product. The potential risk caused by overcapacity would further constrain the future development of enterprises or even the entire pharmaceutical sector.
2.4 Finance and Service Institutions
As a major component of the innovation system, the financing system firstly poses signif-icant challenges to drug innovation in China. Improper funds arrangement was common and usually resulted in inefficiency of new drug R&D. Public investment was the key fund-ing source for R&D institutes in the pharmaceutical sector, of which more than 81% R&D expenditure was accounted for with government funding while private investment only accounted for 5.41% in 201230. Although the central government had allocated increasing resources into R&D institutions in recent years, investment for basic research was insuffi-cient. In China, only 4.7% of R&D investment was used to improve basic research which was little compared with the figure in some developed counties (see Table 1). This was especial-ly problematic for the pharmaceutical industry as preliminary research was the source of new ideas, important for fueling subsequent innovation and had significant impact on the performance of new drug discovery31.
Table 1. International comparison of R&D expenditure
Note: Data source: China Statistical Yearbook on Science and Technology.
20 21
For new drug developers, contributions of venture capital (VC) were limited. In particular, the small and medium enterprises relied considerably on government investment to sup-port their innovation projects18. Since the VC market only started 30 years ago, VC activity and investment level in the pharmaceutical sector was substantially lower in China than in other developed counties. According to S&P Capital IQ estimates, 711 VC and private equity (PE) funds had life sciences investments in the U.S., whereas only 89 similar funds in China. Moreover, out of the 89 funds, only 19 made more than one investment32. There were also other issues about financing for drug innovation. For instance, lack of an efficient investment exit channel made it difficult for investors to withdraw capital gains. As a result, many VCs were concerned only about short-term and less innovative projects7. Volatility of stock markets, highly exaggerated price to earnings ratios, and lack of sophisticated secondary markets were also detrimental to the financing for high-risk new drug R&D proj-ects18, 33.
Last but not least, barriers often cited in the literature were also found to be the key fac-tors influencing drug innovation in China which included lack of practical and effective IP (intellectual property) protection and enforcement strategies34, growing of counterfeit and substandard medicines, and undeveloped technology transaction platform and inter-mediary agencies.
3. Opportunities for China’s Pharmaceutical Innovation
As two sides of the same coin, China’s pharmaceutical innovation still has various unique opportunities, despite many obstacles mentioned above. For instance, during the stage of the “Key Drug Innovation Project” from 2009 to 2011, 62 NDAs originated from this project were approved by the CFDA and about 400 categories entered the clinical research stage35,
36. Moreover, some positive efforts have been made in recent years. For example, with the recruitment of Chinese scientists back from abroad, China is embracing ‘Thousand Talents plan’ 37. The latest news reported that The Chinese Academy of Sciences (CAS), the heart of China’s scientific development, is making unprecedented structural reforms to foster collaboration and to turbocharge research38. The CFDA issued a draft amendment to the Drug Registration Regulation and is planning to revise Drug Administration Law of China comprehensively. The article further analyzes comparative advantages of China’s drug in-novation system in the global context, elaborated one-by-one as below.
3.1 Growing Pharmaceutical Market
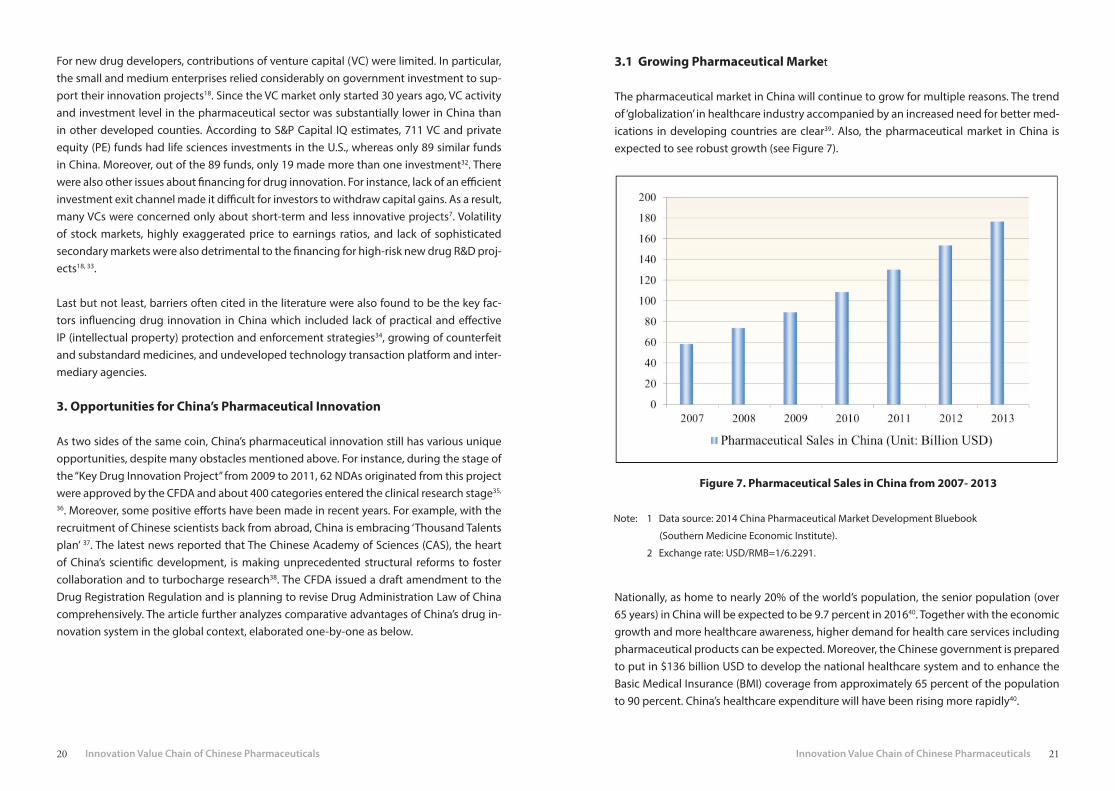
The pharmaceutical market in China will continue to grow for multiple reasons. The trend of ‘globalization’ in healthcare industry accompanied by an increased need for better med-ications in developing countries are clear39. Also, the pharmaceutical market in China is expected to see robust growth (see Figure 7).
Note: 1 Data source: 2014 China Pharmaceutical Market Development Bluebook
(Southern Medicine Economic Institute).
2 Exchange rate: USD/RMB=1/6.2291.
Figure 7. Pharmaceutical Sales in China from 2007- 2013
Nationally, as home to nearly 20% of the world’s population, the senior population (over 65 years) in China will be expected to be 9.7 percent in 201640. Together with the economic growth and more healthcare awareness, higher demand for health care services including pharmaceutical products can be expected. Moreover, the Chinese government is prepared to put in $136 billion USD to develop the national healthcare system and to enhance the Basic Medical Insurance (BMI) coverage from approximately 65 percent of the population to 90 percent. China’s healthcare expenditure will have been rising more rapidly40.

22 23
The dramatic growth of healthcare demand and expenditure in China implies tremendous market opportunities in near future. Consequently, all these trends are favorable to signifi-cantly drive the development of innovation.
3.2 Increasing R&D Funding
The R&D investment is considered as crucial fuel to catalyze innovation. Consequently, the dramatic growth of R&D investment in China generates enormous momentum to novel drug R&D activity. On the economic recession background, many developed countries have reduced the budget on drug R&D. The U.S. cut down R&D expenditures from 38% of the global total in 1999 to 31% in 20096. In contrast, China showed the largest percentage increase of R&D investment in the world (see Figure 8).
In the pharmaceutical sector, in order to create an innovation-oriented environment, the China government will increase the drug innovation funding by launching appropriate projects. For instance, the ‘Key Drug Innovation project’ launched in 2007 was a notable example. During the entire 12th Five- Year Plan, the project ‘Key Drug Innovation’ will be supported with the equivalent of about $16 billion USD from the central government and more than $49 million USD from local governments7. As the second largest R&D performer, comparison of the global compound annual growth rate of biomedical R&D expenditures by country, China showed the most rapid rise, from approximately $2.0 billion in 2007 to over $8.4 billion in 2012 with a compound annual growth rate of 32.8%41.
3.3 Distinctive R&D Source
China’s major advantage in life science is the distinctive R&D source in terms of large pa-tient samples, wide disease spectrum, great biodiversity, and strong basis of Traditional Chinese Medicine (TCM). In 2012, there were 1,431 hospitals in China, of which 420 had GCP certifications and a rich source of patient enough for multiple clinical R&D studies42. More importantly, distinct multiple patient populations and wide disease spectrum in Chi-na are beneficial to broaden the scope of new research activities in the healthcare system. For example, some specific diseases such as diabetes, liver cancer, stomach cancer, and neck cancer have a relatively high prevalence in Asian countries compared to the U.S. and European countries. The patient pool in China allows the development of specific knowl-edge such as biomarkers, genetics and therapies43.
Meanwhile, China is one of the countries with the richest biological resources and diver-sities, with approximately 10% of the world’s biological resources44. Additionally, with fur-ther research of active components and pharmacological mechanisms, TCM will broaden the pipeline of natural medicine discovery and development, increasing the importance of Chinese herbal medicines in therapeutic systems especially for cancer, HIV, diabetes and cardiovascular disease therapies.
3.4 Increasing International Involvements
The favorable conditions mentioned above have attracted more and more multinational pharmaceutical companies to China. Cost advantage related to developing health prod-uct in China has been attributed to the low-costs in scientific talent, clinical trials and raw materials available in the country, with the lowest figure estimated to be 10% of similar costs in the U.S.5 As a result, with exception of pharmaceutical R&D outsourcing moving to China, the linkage between domestic R&D organizations and multinational corporations
Note: 1 Data Source: China Statistical Yearbook on High Technology Industry.
2 Exchange rate: USD/RMB=1/6.2291.
Figure 8. Intramural Expenditure on R&D in Chinese Pharmaceutical Industry
24 25
has been increasingly prominent in R&D activity. Meanwhile, the strategies of large-cap pharmaceutical companies are steering to emphasize more on the discovery and develop-ment of medicines for China-specific and lifestyle-associated diseases. China has become one of the top markets pursued by global pharmaceutical companies to conduct R&D ac-tivities3. Increasing numbers of multinational pharmaceutical companies has established their R&D headquarters in China. For instance, AstraZeneca China has its headquarters in Shanghai, with 23 branch offices in major cities across China. Pfizer’s China Research and Development Centre were established in 2005 to support global R&D by partnering with clinical research organizations, biotechnology companies and academic researchers. It is beneficial for China’s pharmaceutical innovation that these high-quality multinational pharmaceutical companies moving to China will play innovatively with local institutions and further generate spillover effects on the healthcare system3, 45.
4. Conclusions
In summary, this study addressed the barriers and opportunities for pharmaceutical inno-vation in China. On one hand, China’s pharmaceutical sector is confronted with inevitable barriers hindering the pace of drug innovation, including academic, industrial, institutional and financial constraints. To reshape China and change the reputation of made-in-China to discovered-in-China is highly challenging. On the other hand, China exhibits unique advantages in the development of healthcare industry as shown by the dramatic growth in terms of R&D investment, healthcare expenditure and international cooperation. The increasingly intertwined relationship of both competition and cooperation in the global healthcare industry is of great significance to remove obstacles and create more opportu-nities for China’s pharmaceutical sector. All of these will greatly facilitate the development of pharmaceutical innovation in China. In a word, the most important thing is to break through innovation barriers and take advantage of the opportunities that are currently available for improving drug innovation in China, and integrate self-advantages into glob-al value-chain of healthcare product development.
List of Abbreviations
R&D: Research and Development; APIs: active pharmaceutical ingredients; SCI: Science Ci-tation Index; CFDA: China Food and Drug Administration; ANDA: Abbreviated New Drug Application; CDE: Center for Drug Evaluation; FDA: Food and Drug Administration in the U.S; NDA: the New Drug Application; BCT: Bridging clinical trial; ICH: Harmonization of Technical Requirements for Registration of Pharmaceuticals for Human Use; GCP: Good Clinical Practice; MAH: marketing authorization holder; VC: venture capital; PE: private equity; CAS: Chinese Academy of Sciences; BMI: Basic Medical Insurance; TCM: Traditional Chinese medicine
Authors’ Contributions
Jingyun Ni conducted data collection, performed data analysis and drafted the manuscript. Yuanjia Hu conceived and designed this study, analyzed data and revised the manuscript. Junrui Zhao participated in data collection, analysis and drafted the manuscript, Carolina Oi Lam Ung and Hao Hu participated in manuscript revision, Yitao Wang participated in research design, and reviewed the whole manuscript. All the authors read and approved the final manuscript.
Authors’ Information
Institute of Chinese Medical Sciences, State Key Laboratory of Quality Research in Chinese Medicine, Room 2053, N22, University of Macau, Avenida da Universidade, Taipa, Macao, China;
Acknowledgements
We would like to thank the University of Macau for their financial support of this research.

26 27
References
1. Kaitin KI. Deconstructing the Drug Development Process: The New Face of Innova-tion. Clinical Pharmacology & Therapeutics. 2010; 87(3): 356-361.
2. Scannell JW, Blanckley A, Boldon H, et al. Diagnosing the decline in pharmaceutical R&D efficiency. Nature Reviews Drug Discovery. 2012; 11: 191-200.
3. Hughes B. Evolving R&D for emerging markets. Nature Reviews Drug Discovery. 2010; 9: 417-420.
4. Gautam A, Yang S. Market watch: A framework for biomedical innovation in emerg-ing markets. Nature Reviews Drug Discovery. 2014; 13: 646-647.
5. Frew SE, Sammut SM, Shore AF, et al. Chinese health biotech and the billion-patient market. Nature Biotechnology. 2008; 26: 37-53.
6. Global competitiveness-the importance of US leadership in science and innovation for the Future of our economy and our health; 2015. http://www.nih.gov/about/im-pact/impact_global.pdf.
7. Qiu L, Chen ZY, Lu DY, et al. Public funding and private investment for R&D: a survey in China’s pharmaceutical industry. Health Research Policy and Systems. 2014; 12(27): 1-11.
8. Anonymous. China: a life sciences giant. Nature Reviews Microbiology. 2010; 8(1): 310.
9. Kermani F, Zhou YB. China commits itself to biotech in healthcare. Drug Discovery Today. 2007; 12: 501-503.
10. Friedman, Y. Location of pharmaceutical innovation: 2000–2009. Nature Reviews Drug Discovery. 2010; 9: 835-836.
11. Hu YJ, Scherngell T, Man SN, et al. Is the United States still dominant in the global pharmaceutical innovation network? PLOS ONE. 2013; 8: 1-6.
12. Hu YJ, Scherngell T, Qiu L, et al. R&D internationalisation patterns in the global phar-maceutical industry: evidence from a network analytic perspective. Technology Analysis and Strategic Management. 2015.
13. Gurvich VJ, Byrn SR. A multi-university partnership supporting academic drug devel-opment. Drug Discovery Today. 2013; 18: 916-921.
14. Nooteboom B, Stam E. Micro-foundations for Innovation Policy. Scientific council for government policy. Amsterdam: Amsterdam University; 2008.
15. Wang K, Hong J, Marinova D, et al. Evolution and governance of the biotechnology and pharmaceutical industry of China. Mathematics and Computers in Simulation. 2009; 79: 2947-2956.
16. Liu XL, White S. Comparing innovation systems: a framework and application to Chi-na’s transitional context. Research Policy. 2001; 30: 1091-1114.
17. Munos B. Can open-source drug R&D repower pharmaceutical innovation? Clinical Pharmacology & Therapeutics. 2010; 87 (5): 533-536.
18. Rezaie R, McGahan AM, Frew SE, et al. Emergence of biopharmaceutical innovators in China, India, Brazil, and South Africa as global competitors and collaborators. Health Research Policy and Systems. 2012; 10: 1-18.
19. Shi YG, Rao Y. China’s research culture. Science. 2010; 329: 1128.20. Anonymous. China’s publication bazaar. Science. 2013; 342: 1036-1039.21. Qiu J. Publish or perish in China. Nature. 2010; 463 (14): 142-143. 22. China High-tech Industry Statistics Yearbook. China Statistics Press, National Bureau
of Statistics of China. http://www.stats.gov.cn/tjsj/ndsj/2013/indexeh.htm. 23. National bureau of statistics of the People’s Republic of China. http://www.stats.gov.
cn/statsinfo/auto2073/201310/t20131031_450691.html.24. Rezaie R, McGahan AM, Daar AS, et al. Innovative drugs and vaccines in China, India
and Brazil. Nature Biotechnology. 2012; 30: 923-926. 25. Luo Y. China: Current trends in pharmaceutical drug discovery. IDrugs. 2008; 11(4):
279-282. 26. Ding JX, Xue YJ, Liang HG, et al. From imitation to innovation: A study of China’s drug
R&D and relevant national policies. Technol. Journal of Product Innovation Man-agement. 2011; 6: 1-13.
27. Chenoweth D. Is more really less in China’s new drug approvals? Drug Discovery Today. 2005;10: 1140-1142.
28. DXY Insight- China Pharma Database. Is new drug more and more far away from us [in Chinese]? http://db.dxy.cn/new/home/report/tag/65791/article/90860.
29. China Food and Drug Administration. Provisions for Drug Registration (SFDA Order No.28). http://eng.sfda.gov.cn/WS03/CL0768/61645.html.
30. China Statistical Yearbook on Science and Technology in 2013. China Statistics Press; National Bureau of Statistics of China. Beijing.2013.
31. Toole AA. The impact of public basic research on industrial innovation: Evidence from the pharmaceutical industry. Research Policy. 2012; 41: 1-12.
32. Chakma J, Sammut SM, Agrawal A. Life sciences venture capital in emerging markets. Nature Biotechnology. 2013; 31: 195-201.
33. Di Guo, Kun Jiang. Venture capital investment and the performance of entrepreneur-ial firms: Evidence from China. Journal of Corporate Finance. 2013; 22: 375-395.
34. Zhang YP, Deng MM. Enforcing pharmaceutical and biotech patent rights in China. Nature Biotechnology. 2008; 26:1235-1241.

28 29
35. Statistical bulletin of national science and technology major project. http://www.nmp.gov.cn/gzxgz/zdxy/201302/t20130227_3118.htm.
36. Qi JZ, Wang QL, Yu ZH, et al. Innovative drug R&D in China. Nature Reviews Drug Discovery. 2011; 10: 333-334.
37. Schiermeier Q. China at a crossroads. Nature. 2014; 507: 129.38. Cyranoski D. Chinese science gets mass transformation. Nature. 2014; 513: 468.39. Germann PG, Schuhmacher A, Harrison J, Law R, Haug K, Wong G. How to create in-
novation by building the translation bridge from basic research into medicinal drugs: an industrial perspective. Human Genomics. 2013; 7(5): 1-6.
40. Wu Y. Opportunities in China’s pharmaceuticals market. Reported by Deloitte China Life Sciences and Health Care. Deloitte Touche Tohmatsu CPA Ltd. 2011
http://www2.deloitte.com/content/dam/Deloitte/ch/Documents/life-scienc-es-health-care/ch_Studie_Pharmaceutical_China_05052014.pdf
41. Chakma J, Sun GH, Steinberg JD, Sammut SM, Jagsi R. Asia’s Ascent — Global Trends in Biomedical R&D Expenditures. The New England Journal of Medicine. 2014; 370: 3-6.
42. Shi YZ, Hu H, Wang CM. Contract Research Organizations (CROs) in China: integrating Chinese research and development capabilities for global drug innovation. Global-ization Health. 2014; 10: 1-6.
43. Rezaie R, Singer PA. Global health or global wealth? Nature Biotechnology. 2010; 28: 907-909.
44. Zhu C, Wang HG, Wen ZJ, Wang YH. Life sciences and biotechnology in China. Phil-osophical transactions of the Royal Society of London. Series B, Biological Sci-ences. 2007; 362: 947-957.
45. Kaitin KI. Global drug development and international harmonization: The emergence of China as a world pharmaceutical player. Therapeutic Innovation & Regulatory Science. 1998; doi: 10.1177/00928615980320S103.

30 31
Chapter 2
ANALYZING THE CHINESE LANDSCAPE IN ANTI-DIABETIC DRUG RESEARCH: LEADING
KNOWLEDGE PRODUCTION INSTITUTIONS AND THEMATIC COMMUNITIES
Junling Deng1§, Ka Weng Si Tou1§, Yongping Zhang2, Ru Yan1, Yuanjia Hu1*
1 State Key Laboratory of Quality Research in Chinese Medicine, Institute of Chinese Medical Sciences, University of Macau, Macau SAR, China
2 Guiyang College of Traditional Chinese Medicine, Guizhou, China
§These authors contributed equally to this work*Corresponding author: [email protected]
This chapter has been published as below.J. Deng, K. Sitou, Y. Zhang, R. Yan, Y.J. Hu*, Analyzing the Chinese landscape in anti-diabetic drug re-search: leading knowledge production institutions and thematic communities, Chinese Medicine, 11: 1-10, 2016.

32 33
Abstract
Background: The discovery of anti-diabetic drugs is an active area in Chinese Medicine researches. This study aims to map out anti-diabetic drug research in China using a net-work-based systemic approach based on co-authorship of academic publications. We fo-cused on identifying leading knowledge production institutions, analyzing interactions among them, detecting communities with high internal associations, and exploring future research directions.
Methods: Target articles published in 2009–2013 under the topic “diabetes” and subject category “pharmacology & pharmacy,” with “China,” “Taiwan,” “Hong Kong,” or “Macao” (or “Macau”) in the authors’ address field were retrieved from the Science Citation Index Ex-panded database and their bibliographic information (e.g., article title, authors, keywords, and authors’ affiliation addresses) analyzed. The social network approach was used to con-struct an institutional collaboration network based on co-publications. Gephi was used to visualize the network and relationships among institutes were analyzed using centrality measurements. Thematic analysis based on article keywords and ratio value were applied to reveal the research hotspots and directions of network communities.
Results: The top 50 institutions including Shanghai Jiao Tong University, National Taiwan University, Peking University, and China Pharmaceutical University were identified. In-stitutes from Taiwan tended to cooperate with institutes outside Taiwan, but those from mainland China showed low interest in external collaboration. Fourteen thematic com-munities were detected with the Louvain algorithm and further labeled by their high-fre-quency and characteristic keywords, such as Chinese medicines, diabetic complications, oxidative stress, pharmacokinetics, and insulin resistance. The keyword Chinese medicines comprised a range of Chinese medicine-related topics, including berberine, flavonoids, Astragalus polysaccharide, emodin, and ginsenoside. These keywords suggest potential fields for further anti-diabetic drug research. The correlation of −0.641 (P = 0.013) between degree centrality and the Rsc value of non-core keywords indicates that communities con-centrating on rare research fields are usually isolated by others and have a lower chance of collaboration.
Conclusion: With the better understanding of the Chinese landscape in anti-diabetic drug research, researchers and scholars looking for experts and institutions in a specific research area can rapidly spot their target community, then select the most appropriate potential collaborator and suggest preferential research directions for future studies.
1. Background
Diabetes mellitus (DM) is a chronic disease that is defined as a long period of having a high blood glucose level1, which results in excessive thirst, frequent urination, and hun-ger. DM complications include ketoacidosis and non-ketotic hyperosmolar syndrome2, 3. Ketoacidosis and non-ketotic hyperosmolar syndrome refer to the dysfunctional condition of over-acidic blood and high level of blood sugar in vivo, respectively, both of which are associated with the lack of insulin. According to the latest statistics of the International Diabetes Federation, the global prevalence of diabetes among adults aged between 20 and 79 years reached 8.3% in 20134. A total of 382 million people worldwide are affected by the disease; of these, 80% live in either mid- or low-income countries4. The number of people living with the disease worldwide is predicted to rise to 592 million by 20354. The prevalence of DM in China escalated from 0.9% in 1980 to 11.6% in 20105, 6. In 2013, diabe-tes caused 5.1 million deaths, accounting for 8.39% of global mortality4. The financial cost of diabetes in the U.S. exceeded $548 billion in 2013, accounting for 11% of global expen-diture on health care4. The rapidly growing prevalence of diabetes has placed an enormous burden on both social and economic development4.
The discovery of anti-diabetic drugs has become an active research area in Chinese med-icine7. Many institutes located in different regions of Greater China are currently engaged in the research and development (R&D) of anti-diabetic drugs. They cooperate on diabetes research projects and work concurrently on self-developed products. Some of these prod-ucts, such as Xiaoke wan (消渴丸), Yuquan pill (玉泉片), and Ginseng–milkvetch declining sugar granule (參芪降糖顆粒) are among the most popular and well-known anti-diabetic drugs in China. Several studies have investigated the R&D of anti-diabetic drugs in China using bibliometrics to examine the distribution of publication years and journals, docu-ment types, keywords, citation counts, and journal impact factors8, 9. However, the net-work-based systematic method has not been applied to evaluate China’s pharmaceutical research in relation to diabetes, creating a gap in the understanding of the R&D landscape.
This study aims to map the R&D landscape of anti-diabetic drugs in Greater China (which includes mainland China, Taiwan, Hong Kong, and Macao) using a network-based sys-tematic review. By analyzing co-authorship in the diabetic literature to include Chinese researchers published in international journals during the period 2009–2013, the active in-stitutes in this field were identified, the relationship between research units was explored, communities with high internal associations were detected, and the interests of a research community were characterized.

34 35
2. Methods
2.1 Data
This systematic review was based on the Web of Science’s Science Citation Index Expanded (SCIE) database, a multidisciplinary index of more than 8,500 peer-reviewed international journals10. Retrieved articles were those published during the period 2009–2013 under the topic “diabetes” and subject category “pharmacology & pharmacy,” with “China,” “Taiwan,” “Hong Kong,” or “Macao” (or “Macau”) in the authors’ address field.
Bibliographic information such as article title, authors, keywords, and authors’ affiliation addresses was extracted for analysis. Records of authors affiliated with non-Chinese insti-tutes were eliminated. We standardized and combined authors and their affiliated organi-zations. The data retrieval process is illustrated in Figure 1.
2.2 Network Visualization and Analysis
The network was visualized using the Gephi (Version 0.8.2; The Gephi Consortium, Paris, France) and the relationships were analyzed to extract the associations between organi-zations. Each node in the network represents a research unit, and an edge between two nodes indicates the strength of co-authoring between these two units. Nodes were posi-tioned using the Gephi’s Fruchterman–Reingold algorithm11. The algorithm belongs to a class of algorithms known as force-directed algorithms; these are used to calculate layouts of simple undirected graphs. This method uses a physical analogy to determine the place-ment of network nodes by minimizing the energy of the system. Nodes behave like atomic particles; they exert repulsive and attractive forces on one another. Repulsive forces exist between all pairs of nodes (like charged particles repelling each other); edges between adjacent nodes cause attraction (like spring force). The position of all nodes continues to adjust until the system reaches its equilibrium state. Thus, organizations with more con-nections have higher attractive forces and are positioned at the center; in contrast, weaker nodes with less or no connections to others are found on the periphery of the map.
Based on graph theory and network sciences, we applied four centrality metrics to identify the key institutes in this work, i.e., the degree centrality, weighted degree centrality, be-tweenness centrality, and closeness centrality.
Degree centrality measures centrality. This shows the number of ties associated with a node in an undirected graph and is reflected in node size. In our research, the degree cen-trality of an institute represents its number of collaborating organizations. Nodes with a high degree of centrality are usually found in the dense area of the network because they are working with many different research units.
Each node’s weighted degree was used to measure an institution’s actual performance in productivity and how active the organization was in the system. Weighted degree central-ity corresponds to the sum of weighted edges connected to a vertex. In the present study, it signified an organization’s total number of co-publications.
Betweenness and closeness centrality describe the importance and role of a node in the system. Betweenness centrality measures how often a node appears on the shortest path between two nodes. In a collaboration network, some nodes do not interact directly; in-stead, they depend on an intermediary for communication. An intermediary with high be-tweenness functions as a “gatekeeper” to control the flow of interactions in the network. However, a high-betweenness node need not necessarily be one with a high degree cen-
Note: Combined search strategy: “AD=(China or Taiwan or Hong Kong or Macau or Macao or Hongkong) and WC=(Pharmacology & Pharmacy) and TS=(Diabetes) and Indexes=SCIE and Timespan=2009-2013”. AD stands for address, TS is topic, HK is Hong Kong, and WC is Web of Science Category which aims to narrow search result to some specific fields of study. Institutional information was obtained from the addresses provided by authors in the target articles, and was later standardized. Records of authors belonging to a non-Chi-nese institute were removed.
Figure 1. Flowchart of the inclusion and exclusion criteria
36 37
trality12. The closeness centrality of a vertex is the total geodesic distance between a vertex and all other vertices; it can be defined as how close an organization is to all others. A lower closeness value indicates that it is a more central node; that is, a node that can access or disseminate new information quicker than others13, 14.
The above analysis focused mainly on absolute strength between nodes, but the relative strength between them was also considered. The Jaccard index is a statistic that shows how similar two sample sets are by calculating the ratio of intersection of the sets by the union of the sample sets15. Jaccard index values range from 0 to 1; a value closer to 1 indi-cates a higher mutual dependence between the two units. This value is defined as
where Nij and Jij stand for number of co-publications and relative strength of co-publi-cation between institutions i and j, respectively. Referring to Scherngell and Hu’s use of this index16, we used it to measure each institution’s level of mutual dependence on its collaborating pair for co-publication. We separately collected the top 50 institutional pairs measured by absolute (edge weight) and relative (Jaccard index) values. We selected the overlapping pairs between two rankings to determine the top institutional pairs in the Chinese anti-diabetic drug research network; this indicated those strongly connected in-stitutional pairs that rely heavily on each other for publication.
2.3 Community Detection and Thematic Analysis
In the undirected network, some tightly interconnected nodes formed relatively stable community subnetworks. To quantify the notion of community, we used modularity, a measure that assigns a numeric value assessing how well a partition of the network nodes matches the informal notion of community. We used the Louvain algorithm, an efficient and widely used Gephi method to detect high-modularity communities, to determine the relevant communities in the network17.
To characterize the themes of each identified community, the occurrence of each article keyword in the community was calculated and its relevance to that particular community was measured by a ratio value, which is defined as Rsc = fsc / fs
18. Rsc value is the ratio of fsc (occurrence of keyword S in community C’s articles) to fs (its occurrence in the article set as a whole). A high Rsc value indicates that a keyword’s occurrence in a specific community is relatively higher than in the whole system and is more significant to that community.
Moreover, for each community, we categorized all non-core keywords as “Others” and cal-culated its Rsc value. The term “non-core keywords” describes keywords that appeared in the article set less than five times in total. Considering the linear and normally distributed characteristics of the data at the interval or ratio level, we then performed a Pearson’s cor-relation test (SPSS Statistics software, Version 20; IBM Corp., Armonk, NY, USA) between the Rsc value of “Others” and the degree centrality of that community to identify the rela-tionship between research topics and collaboration opportunities of communities in the network.
3. Results
3.1 General Description of Data Sample
Using the retrieval criteria mentioned in the Methods section, a total of 882 articles were retrieved. Excluding one correction article, we obtained 881 articles after the exclusion pro-cess. A majority of the sampled items were research articles (86.85%); the rest comprised review articles (9.75%), meeting abstracts (3.29%), and proceedings papers (1.02%). Most of these publications were funded by government or non-profit organizations. The top three funding sources were the National Natural Science Foundation of China (25.26%), the National Basic Research Program (also called “973 Program”) (2.15%), and the Funda-mental Research Funds for the Central Universities (1.81%). In this article set, the number of publications rose from 128 to 241 over the 5-year period of 2009–2013, representing a growth rate of 88.28% or an annual rate of increase of 17.14%. Increasing attention has been paid to anti-diabetic drug research in China and the discovery of new therapeutics for the disease has become increasingly important and urgent.
After standardizing and combining authors and their affiliated organizations, 430 research units were identified. Universities and their affiliated hospitals accounted for the largest proportion (48.84%), followed by hospitals and clinics (24.88%). There were fewer research centers and enterprises, accounting for only 16.98% and 9.30%, respectively. Of all re-search units, 79.53% were located in mainland China while 17.44% were from Taiwan; the rest were from Hong Kong (2.56%) and Macao (0.47%).
3.2 Institutional Collaboration Network
Figure 2 illustrates the current collaborative relationship between Chinese institutes in-volved in the anti-diabetic drug research. There are 430 nodes on the map and 7,673 undi-rected weighted edges, indicating that these 430 institutes have cooperated 7,673 times.

38 39
Node size depends on degree centrality and edge thickness between two nodes is deter-mined by the number of co-publications between them19; more frequently collaborating institutional pairs are connected by a thicker edge.
In this figure, research units from mainland China and Taiwan are represented in cyan and yellow, respectively, and magenta represents those from both Hong Kong and Macao. Only the names of the more active nodes are shown here.
The structure of this network can be broadly divided into two parts. The left part is domi-nated by institutions from mainland China and those from Hong Kong and Macao, and the right part comprises mainly Taiwanese organizations. Although there were few connec-tions between these two parts, each part contained abundant internal connections. The research units in Taiwan tended to collaborate with organizations from the same region, but less with those from mainland China, Hong Kong, or Macao.
3.3 Leading Knowledge Producers
Table 1 shows the top 50 institutes in weighted degree, indicating the total number of an institute’s co-publications. In addition, the influence of a particular institute on others’ col-laborative behavior was explored using betweenness and closeness centrality.
The majority of mainland Chinese organizations on the list are outstanding academic insti-tutes; these include the universities of Project 985 and Project 211 and some of the coun-try’s best-known hospitals and research centers. Most of these are located in Shanghai (18.42%) and Beijing (15.79%).
The weighted degree comprises two parts: internal and external degrees. The internal degree represents the number of articles authored by scholars within the same research unit. The external degree reflects the number of co-publications by authors from different institutes. As characterized by their high weighted degrees, Shanghai Jiao Tong Universi-ty, National Yang Ming University, China Pharmaceutical University, Chang Gung Medical Foundation, Taipei Veterans General Hospital, and Peking Union Medical College are the key institutes in Greater China’s anti-diabetic drug research. Organizations that tend to col-laborate externally rather than internally had a higher level of external collaboration (LEC). The average LEC value of Taiwanese institutes listed here was 66.99%, indicating that they tended to cooperate more externally than internally. Conversely, mainland China’s LEC was much lower than that of Taiwan, at only 32.98%, indicating a rather closed collaboration network. As an example, Shanghai Jiao Tong University ranked first in weighted degree but its LEC was only 17%. In contrast, Peking University had the highest betweenness cen-trality in the whole system, acting as a gatekeeper of knowledge flow. Other organizations that showed strong betweenness performance include Fudan University, National Taiwan University, Shandong University, Sun Yat-Sen University, and the University of Hong Kong;
Note: This network is visualized and analyzed by using the software Gephi, it comprises 430
nodes and 7673 undirected weighted edges. A node represents a research institution
and node size depends on degree centrality while edge thickness between two nodes is
determined by the number of co-publications between them. Research institutions from
mainland China and Taiwan are represented in cyan and yellow respectively, and magenta
represents those from both Hong Kong and Macao. Only the names of the more active
nodes are shown here.
Figure 2. Institutional collaboration network of anti-diabetic drug research in China.

40 41
all of these acted as information intermediaries located in different regions across Greater China.
Many high-betweenness organizations were also the ones with low closeness centrality, emphasizing their important position as knowledge brokers who could access and share new information more quickly than others (Table 1). Some organizations occupied the highest positions for co-publication numbers, betweenness, and closeness, demonstrat-ing their extraordinary contributions to knowledge creation and dissemination. These institutions were Shanghai Jiao Tong University, China Pharmaceutical University, Peking Union Medical College Hospital, Fudan University, Peking University, National Taiwan Uni-versity, University of Hong Kong, and Sun Yat-Sen University.
Note: 1 WD: Weighted Degree; LEC: Level of External Collaborations; BC: BetweennessCentrality;
CC: Closeness Centrality.
2 Institutions based in Hong Kong and Taiwan are labelled HK and TW respectively, while
others are from the mainland of China.
Table 1. Top 50 institutions ranked by weighted degree

42 43
3.4 Top Institutional Pairs
Institutional pairs that concurrently ranked in the top 50 in terms of edge weight and Jac-card index were chosen to identify the most frequently collaborating pairs with highest mutual dependence. Table 2 shows the 12 pairs meeting these criteria. Closed collabora-tors that depend heavily on each other included National Yang Ming University and Taipei Veterans General Hospital in Taiwan, and Peking Union Medicine College and the Institute of Materia Medica of the Chinese Academy of Medical Science in Beijing. The data sug-gested that some pairs showing strong, solid collaborations (83.33%) were geographically adjacent.
Note: Institution’s regional location is the provincial-level administrative divisions of China.
Table 2. Top institutional pairs in Chinese diabetes drug research network
Figure 3. Thematic community network of diabetes drug research in greater China.3.5 Thematic Communities
The basic elements of an institutional collaboration network are the nodes and subgroups of the network, with various subgroups combining to form a complex institution network. As shown in Figure 3, closely collaborating organizations were clustered into various com-munity subnetworks. The 14 major subnetworks in this system were labeled in descending order of number of institutes. For example, Community 1 was the largest community, with 71 organizations, whereas Community 14 was the smallest, with only three organizations. Community size increases with number of articles, and edge thickness between any two nodes corresponds to the frequency of co-publications involving authors from those two communities. Table 3 contains additional information about the 14 communities.

44 45
Not
e:
This
figu
re c
onsi
sts o
f 14
com
mun
ities
whi
ch a
re sh
own
as n
odes
and
labe
lled
by th
eir h
igh
freq
uenc
y ke
ywor
ds in
whi
ch it
alic
wor
ds a
re re
sear
ch to
pics
mor
e re
leva
nt to
a g
iven
com
-
mun
ity th
an to
the
othe
rs a
nd th
ose
lett
ers
in b
old
are
mor
e re
late
d to
Chi
nese
med
icin
es.
Com
mun
ity s
ize
incr
ease
s w
ith n
umbe
r of
art
icle
s, an
d ed
ge t
hick
ness
bet
wee
n an
y tw
o
node
s co
rres
pond
s to
the
freq
uenc
y of
co-
publ
icat
ions
invo
lvin
g au
thor
s fr
om th
ose
two
com
mun
ities
. The
se s
ubne
twor
ks a
re la
belle
d in
des
cend
ing
orde
r of n
umbe
r of i
nstit
utes
.
Not
e:
Com
mun
ity si
ze in
crea
ses w
ith n
umbe
r of a
rtic
les,
and
the
subn
etw
orks
are
labe
lled
in d
e-
scen
ding
ord
er o
f num
ber o
f ins
titut
es. T
he e
dge
thic
knes
s bet
wee
n an
y tw
o no
des r
eflec
ts
the
freq
uenc
y of
co-
publ
icat
ions
invo
lvin
g au
thor
s fr
om th
ose
two
com
mun
ities
.
Tabl
e 3.
Det
aile
d in
form
atio
n of
14
com
mun
itie
s
Tabl
e 4.
Fre
quen
t key
wor
ds re
leva
nt to
Chi
nese
med
icin
es

46 47
The internal structure mining of communities revealed geographic features. For Communi-ty 2, only one out of the 64 institutes were outside Taiwan, indicating that this community was dominated by Taiwanese organizations that seldom communicate with mainland Chi-na, Hong Kong, or Macao. Community 3 was composed mainly of outstanding institutes from Shanghai, such as Shanghai Jiao Tong University, Fudan University, Shanghai Insti-tute of Materia Medical of Chinese Academy of Sciences, and The Second Military Medical University. In contrast, all six research units in Community 11 were found in Northwest China, including five from Shaanxi Province and one from the Xinjiang Uygur Autonomous Region.
The research interests of communities were identified by calculating the Rsc value of ar-ticle keywords. For each community, keywords were arranged in descending order of fre-quency; those accounting for the top 50% of cumulative frequency were shown and those in bold and in italic were the ones with top 10 Rsc values and more related to Chinese medicines respectively. As an example, Community 2 focuses not only on Chinese medi-cines, diabetic complications, and hyperglycemia, but also on cohort study and structural biology.
All keywords appearing in the system were standardized for statistical analysis. Those oc-curring more than five times were classified as core keywords and the rest were classified as non-core keywords. The top core keywords were Chinese medicines, diabetic complica-tions, oxidative stress, hyperglycemia, insulin resistance, mice model, inflammatory, phar-macokinetics, and GLP-1. The most frequent Chinese medicines keywords included ber-berine, flavonoids, Astragalus polysaccharide, emodin, ginsenoside, quercetin, curcumin, Ganoderma lucidum, and resveratrol. Table 4 shows the most frequently used keywords in Chinese medicine anti-diabetes research; these are categorized into “Herbs” and “Com-pounds.” More than three research articles focused on “Herbs” and more than five articles focused on “Compounds.
The Pearson’s test of correlations between degree centrality and the Rsc value of non-core keywords across communities produced a negative correlation coefficient of −0.641 (P = 0.013), indicating that when a community focuses on a research topic that is of common interest to all communities, it can easily build up its collaboration network. However, com-munities that concentrate on rare research fields are usually isolated by others and have a lower chance of collaboration.
4. Discussion
In the present study, the sample data included 881 scientific articles published by 430 Chi-nese institutes over the 5-year period of 2009–2013. This study identified the most pro-ductive institutes and leading academic communities in anti-diabetic drug development.
The average LEC of mainland China’s organizations was only half that of Taiwan, indicating that institutes in China were less dependent on external collaboration. This might be ex-plained by a number of factors: (1) the organization had sufficient resources to meet the needs of research projects; (2) there might be no adequate communication platform for knowledge sharing; and (3) geographic distance resulted in a negative impact on infor-mation flow between institutes. In contrast, although Taiwan exhibited a high LEC, it was rather disconnected from organizations in mainland China, Hong Kong, and Macao.
The network visualized data in this article may help researchers and scholars to navigate in this active research area and to find potential collaborators specializing in a particu-lar research area. For instance, a researcher affiliated with Jilin University (a member of Community 8) who specializes in the research of ginsenoside, is planning to explore the therapeutic effect of a combination of ginsenoside and medicinal mushrooms on diabetic complications. In Figure 3, Community 2 was the only group to focus on medicinal mush-rooms research; therefore, the researcher could probably identify potential collaborators from this community. Knowledge of the list of institutes that belong to Community 2, and with the help of the co-authorship network, the researcher could select the most appro-priate expert for research collaboration based on centrality measurements. In this case, the researcher might approach China Medical University in Taiwan, as it ranked at the top in the three aspects of centrality measurements among institutes studying medicinal mush-rooms. This kind of research collaboration does not simply represent the building of a new partnership between two researchers or institutions, but also fosters knowledge exchange across various diabetes research communities in China and further stimulates innovation and productivity.
In addition, each community studied here is labeled with a list of keywords, covering a diverse range of topics that included herbology, chemical component, molecular biology, clinical medicine, pharmacokinetics, therapeutic drugs, and animal experimental models. Chinese medicines, diabetic complications, oxidative stress, hyperglycemia, and insulin resistance were common topics that could be found on the keyword list across different communities, indicating their significance in the field. Only minimal adverse effects were reported for Chinese medicines used in treating type 2 DM, indicating certain advantages

48 49
in the prevention of diabetes and delay of its complications7. Studying the role of oxidative stress in the pathogenesis of diabetes provides a theoretical basis for the prevention and treatment of the disease20, as oxidative stress could be a major cause of the development of type 2 DM21. Furthermore, Chinese medicines in combination with insulin exhibited bet-ter clinical effect in the treatment of gestational diabetes22. Similarly, berberine exhibit-ed beneficial anti-inflammation effects, indicating that it could be a potential therapeutic drug in type 1 DM treatment23.
Each of the 14 communities in the studied system has its own area of expertise, which is usually a non-mainstream topic. Community 2, a subnetwork primarily composed of Tai-wanese organizations, focuses on cohort study and structural biology while Community 3 is a Shanghai-based group that specializes in ficolin-3 and islet cell culture. Community 5 focuses on wound healing, radix Rehmanniae, sweet tea, and synergistic effect; most of its constituent organizations are from Guangdong Province, Hong Kong, and Macao. Finally, the Beijing-dominated Community 6 concentrates on analytical chemistry, excretion, and mass spectrometry.
The collaboration opportunities available to a community are strongly affected by the lev-el of interest in its research topics. Communities dedicated to less-studied research areas usually have more difficulty in identifying suitable collaborators. This community thematic analysis provides a reference for researchers and institutes looking for potential collabora-tors based on research direction.
Researchers would find it easier to create research partnerships if the key researchers’ in-formation was also directly available. However, this study explored the research landscape of Chinese anti-diabetic drugs only at the institutional level. It would be more difficult to investigate the researches at a personal level because of data sensitivity and privacy pro-tection, though personal publication data are indeed available for identifying the most prolific or influential authors in specific research areas, units, or communities in the sys-tem. Readers interested in author-related information can contact us. For instance, upon request, we would provide additional file containing the “Article No.” that associates with the keywords interested. As each article carries a unique article number, this code can di-rectly identify the article title, authors of the paper, authors’ affiliations and geographic region, and the thematic community to which the article belongs.
Because of the need for a homogeneous sample composed of cutting-edge research arti-cles and regional biases, we chose to use just the Science Citation Index Expanded (SCIE) data source and to not include Chinese literature indexed in Chinese National Knowledge
Infrastructure (CNKI) and other Chinese databases. In using co-authorship academic publi-cation data, this study mainly focuses on basic research and is limited to academic collab-orations. A similar exercise for applied and competitive research would be an important addition to the current study and could, for instance, focus on collaboration in patenting and R&D projects. In addition, the arbitrary selection of keywords and the lack of keywords in a small proportion of sample articles may have caused potential bias in the thematic analysis. Future studies could construct a more complex and more influential collaboration network by expanding sample size or time span, or by widening the scope from domestic to international organizations. A dynamic network analysis could also be introduced to investigate how the network evolves over time.
5. Conclusions
By characterizing communities and noting their research themes, the results of this study could provide guidance to researchers seeking potential collaborators and could suggest a precise research direction for future studies.
50 51
References
1. World Health Organization. Diabetes Action Online: About Diabetes. http://www.who.int/diabetes/action_online/basics/en. Accessed 18 Nov 2014.
2. World Health Organization. Media Centre Fact Sheet: Diabetes Fact Sheet N 312. http://www.who.int/mediacentre/factsheets/fs312/en. Accessed 19 Nov 2014.
3. Kitabchi AE, Umpierrez GE, Miles JM, et al. Hyperglycemic crises in adult patients with diabetes. Diabetes care. 2009; 32(7): 1335-1343.
4. International Diabetes Federation: Sixth Edition of the IDF Diabetes Atlas. Brus-sels; 2014.
5. National Diabetes Prevention and Control Cooperative Group. A mass survey of dia-betes mellitus in a population of 300,000 in 14 provinces and municipalities in China. Zhonghua Nei Ke Za Zhi. 1981; 20 (83): 678.
6. Xu Y, Wang LM, He J, et al. Prevalence and control of diabetes in Chinese adults. Jour-nal of the American Medical Association. 2013; 310(9): 948-958.
7. Li WL, Zheng HC, Bukuru J, et al. Natural medicines used in the traditional Chinese medical system for therapy of diabetes mellitus. Journal of Ethnopharmacology. 2004; 92(1):1-21.
8. Wang SB & Meng QG. Bibliometric analysis on treatment of type 2 diabetes mellitus by traditional Chinese medicine. Chinese Archives of Traditional Chinese Medicine. 2014; 32: 273-276.
9. Hu H, Zhao WL. Analysis of diabetes papers indexed by SCI. Medical Informatics. 2008; 21: 53–57.
10. Thomson Reuters. Science Citation Index Expanded. http://thomsonreuters.com/sci-ence-citation-index-expanded. Accessed 18 Nov 2014.
11. Fruchterman TM & Reingold EM. Graph drawing by force-directed placement. Soft-ware: Practice and experience. 1991; 21(11): 1129-1164.
12. Lin JR. Social network analysis: theory, method and application. 1st ed. Beijing: Beijing Normal University Press; 2009.
13. Newman ME. Who is the best connected scientist? A study of scientific coauthorship networks: complex networks. Berlin: Springer; 2004; 337-370.
14. Newman ME. The structure of scientific collaboration networks. Proceedings of the National Academy of Sciences. 2001; 98(2): 404-409.
15. Leydesdorff L. On the normalization and visualization of author co‐citation data: Salton’s Cosine versus the Jaccard index. Journal of the American Society for Infor-mation Science and Technology. 2008; 59(1): 77-85.
16. Scherngell T & Hu Y. Collaborative knowledge production in China: regional evidence from a gravity model approach. Regional Studies. 2011; 45(6): 755-772.
17. Blondel VD, Guillaume JL, Lambiotte R, et al. Fast unfolding of communities in large networks. Journal of statistical mechanics: theory and experiment. 2008; 2008(10): P10008.
18. Barber MJ, Fischer MM, & Scherngell T. The community structure of research and de-velopment cooperation in Europe: evidence from a social network perspective. Geo-graphical Analysis. 2011; 43(4): 415-432.
19. Freeman LC. Centrality in social networks conceptual clarification. Social networks. 1978; 1(3): 215-239.
20. Ren CJ, Zhang Y, Cui WZ, et al. Progress in the role of oxidative stress in the pathogen-esis of type 2 diabetes. Acta Physiologica Sinica. 2013; 65(6): 664-673.
21. Fardoun RZ. The use of vitamin E in type 2 diabetes mellitus. Clinical and Experimen-tal Hypertension. 2007; 29(3): 135-148.
22. Zhang L, Wang LP, Zhang GF, Zhang XL. Traditional Chinese medicine combined with insulin in the treatment of gestational diabetes clinical comparative study. The Jour-nal of Medical Theory and Practice. 2014; 27(24): 3250-3251.
23. Cui GL, Qin X, Zhang YB, et al. Berberine Differentially Modulates the Activities of ERK, p38 MAPK, and JNK to Suppress Th17 and Th1 T Cell Differentiation in Type 1 Diabetic Mice. Journal of Biological Chemistry. 2009; 284(41):28420-28429.

52 53
Chapter 3
MONITORING DRUG RESEARCH ON CLINICAL NEUROLOGY IN CHINA: AN ANALYSIS OF
INSTITUTIONAL LEADERS AND COMMUNITY THEMES
Ka Weng Si Tou1, Jianbo Wan1, Marvin S.H. Mak2, Yifan Han2, Yuanjia Hu1*
1 State Key Laboratory of Quality Research in Chinese Medicine, Institute of Chinese Medical Sciences, University of Macau, Macau SAR, China
2 Department of Applied Biology and Chemical Technology, Institute of Modern Chinese Medicine, the Hong Kong Polytechnic University, Hung Hom, Hong Kong,
China.* Corresponding author: [email protected]

54 55
Abstract
Background: The discovery of new neurological therapeutic agents is one of the most active areas of research and development (R&D) in China. This paper intends to find out the leading Chinese institutes in neurological drug research based on co-authorship and to reveal the research directions of identified communities.
Methods: 629 papers published during 2008-2013 under the subject categories “Pharma-cology & Pharmacy” or “Integrative & Complementary Medicine” combining with “Clinical Neurology”, containing a Chinese institute in the author’s address were retrieved from the Science Citation Index Expanded (SCIE) Database. We used research collaboration associa-tions to define an institutional network and network communities to identify the research topics of each community.
Results: Key participants in the network are mainly located in Shanghai and Taiwan, while the ones from Hong Kong are acting as a bridge for knowledge exchange between main-land China and Taiwan. These sample articles cover a wide range of topics, in which depres-sion, schizophrenia, serotonin and genetic polymorphism are the most extensively studied issues.
Conclusions: Collaborations across regions and between academia, clinics, and industry need to be further enhanced. Meanwhile, this study may provide guidance for research-ers, clinicians, and investors to cooperate and in turn improve efficiency in drug discovery process.
Keywords
Neurological drugs; Publications; Research collaboration networks; Thematic analysis; Greater China
1. Background
Neurology is an important branch of medical science that deals with the nervous system and disorders affecting it. According to the World Health Organization (WHO), neurological and neuropsychiatric disorders represent one of the most challenging global public health problems of the 21st century. They affect people in all countries, regardless of age, sex, education or income. They not only affect the physical and mental health of patients, but also have impact on their families and the health care system. These disorders are the lead-ing noncommunicable diseases causing disability worldwide, accounting for around one third of Years Lost due to Disability (YLD) among adults aged 15 years and over in 20041,
2. It has been estimated that more than 1.5 billion people globally are affected by neuro-logical disorders and their sequelae, and would continue to exert an increasing burden for all nations3. Despite the high prevalence of neurological disorders, there is still a huge and growing unmet medical need for effective treatments. This emphasizes the urgen-cy and importance of developing novel therapeutics with better efficacy and improving treatments for these disorders.
As an emerging economy, science and technology in China is developing at an accelerated pace, especially in terms of R&D funding and scientific publications. It is predicted that China will outpace the United States and become world’s largest R&D spender by 20204. China also stands second only to the US in terms of world’s share of scientific publications since 20065, 6. The increasing contribution from China in modern biomedical research has been reported in the study7. Among various scientific research fields in China, research in neuroscience progressed steadily, especially since the establishment of the Institute of Neuroscience of the Chinese Academy of Sciences in 19998. From the statistics from Web of Science, China has even the world’s fastest-growing scientific output on the pharmaceuti-cal research of clinical neurology with a 5.5-fold increase in the share of global publications in this field over the past decade.
In terms of the dramatic development of neuroscience research in China, bibliometric analyses on publications of neuroscience basic research from China have been carried out from time to time in the past decade. Research conducted by Xu et al. and Bala et al. investigated the performance and growth of China in neurosciences in national and global context during 1984-2001 and 1999-2008 respectively9, 10, while studies from other research groups analyzed neuroscience literature published on Chinese journals sometime between 1998 and 201011-13. The research foci of these literatures were largely given to the number and quality of publications, impact of journals, citation counts, sources of funding, as well as rankings and characteristics of the most productive institutions. However, none

56 57
of the previous studies have identified leading institutions in the active research area from a network-based systemic perspective and further investigated their thematic behavior.
In this context, this article makes use of co-authorship to generate a network of collabo-ration at institutional level on the pharmaceutical research of clinical neurology in greater China during 2008 to 2013 based on published literature in leading international journals, intending to find out which institutions triggered off the active research field and what research themes institutional communities have focused on. This work on monitoring re-search players and thematic behavior in a specific technology area is of great significance for global relevant researchers, clinicians and investors to navigate in the emerging knowl-edge domain.
2. Methods
2.1 Data Collection
This paper utilizes source from the SCIE database of the Web of Science which covers more than 8,500 world’s leading journals in natural and medical sciences. Scientific articles pub-lished during 2008 to 2013 under the subject categories “Pharmacology & Pharmacy” or “Integrative & Complementary Medicine” combining with “Clinical Neurology”, containing either “China”, “Taiwan”, “Hong Kong” or “Macao (or Macau)” in the author’s address field, were retrieved from the database.
A search with the above criteria yielded a total of 629 articles. 65.82% of research in this sample are supported by government grants, the top funding sources are the National Natural Science Foundation of China (14.58%), National Science Council of Taiwan (8.56%) and Natural Basic Research Program of China (also known as the “973 Program”) (3.17%). Other sources of funding consist of grants from pharmaceutical companies, hospitals, non-profit organizations, universities and research institutes. More than 92% of sample articles are published on journals with high ranking in their subject categories.
We extracted bibliographic information including article titles, authors, keywords and au-thors’ affiliation addresses for analysis. Since our research focuses on the collaborative link-ages between Chinese institutes, records of authors belonging to a non-Chinese institute were removed. Before using these data, we standardized the names of authors and their affiliated institutes. After standardization and combination of data, duplicate records of author with identical affiliation addresses within one article were eliminated. Eventually,
a total of 256 institutes were included in this study, which comprised universities and col-leges (44.92%), hospitals and clinics (42.97%), scientific research institutes (8.59%), phar-maceutical and biotechnology companies (3.52%). Among these research units, 60.16% are located in mainland China, 33.98% are from Taiwan while the remaining 5.86% are from Hong Kong.
2.2 Collaboration Network Analysis
The institutional collaboration network based on co-authorship relationship is constructed via a network analysis tool Gephi. Each node in the network represents a research unit. An edge exists between two nodes if researchers from these two units collaborate on a research publication. The network layout is determined by the Fruchterman-Reingold Algorithm, which is a force-directed approach considering the attraction and repulsion between two nodes and further makes strongly interconnected nodes positioned each other14.
Centrality measurement collected from Gephi, including degree, weighted degree and betweenness, are utilized to identify the key participants and innovators in the system. Degree centrality is the number of links connected to a node, it is revealed in the graph by node size. In this paper, degree tells the number of collaborative partners an organization has, yet it does not give any information about its strength. To investigate the strength of an institute, we measure its weighted degree which is the sum of weighted edges connect-ed to it, weighted degree corresponds to the total number of co-publications. Between-ness centrality is a function of the number of shortest paths which pass through a node. It shows the control of a node over communication flow. Institutes with high betweenness centrality are regarded as the brokers or gatekeepers of knowledge diffusion. In addition, thickness of an edge corresponds to the number of collaborations, therefore a thick edge demonstrates an intense and frequent collaboration between the two units15.
Based on the above statistics obtained from Gephi, we calculated the Jaccard index Jij in order to describe the relative degree of interdependence between institutes16. It is defined as:
where Yij represents the absolute frequency of co-publication between organizations i and j. Jaccard index value ranges from 0 to 1, collaborative pair with a high Jaccard index value indicates that this particular partnership is of great importance to both of them, and they rely on each other heavily for co-publication.

58 59
2.3 Thematic Community Analysis
It is believed that organizations sharing common interest in a certain area cooperate more frequently than with others, therefore the ones which are more densely connected are grouped into communities (or subnetworks) by applying the Louvain community detec-tion algorithm17. Article keywords were studied and the research topics of each communi-ty were uncovered using thematic community analysis. We employed a ratio value, RSC, to illustrate the relevance of a specific keyword S to a community C, it is defined as RSC = fSC / fS
18. This value compares the ratio of occurrence of keyword S in articles from community C to that from the article set as a whole. The more significant a keyword is to a specific com-munity, a larger RSC value will be obtained.
3. Results
3.1 Leading Institutions in Neurological Drugs Research
Collaborative research network of neurological drugs in greater China is visualized and depicted in Figure 1. Institutes from mainland China, Taiwan and Hong Kong are colored in pink, green and yellow respectively. Only the names of the actively participating organiza-tions are shown here. As can be seen clearly, the network is divided into upper and lower parts by the institutions from mainland China and Taiwan, while the ones from Hong Kong are integrated into the whole network with connections to the organizations from these two regions. The unweighted degree centrality of each institute is reflected in its node size, Peking University ranks first, followed by Shanghai Jiao Tong University, Chinese University of Hong Kong (CUHK), Chang Gung Foundation and National Taiwan University.
Note: This network consists of 256 nodes; each represents a research unit in greater China.
An edge exists between two nodes if researchers from these two units collaborate on a
research publication. Node size reflects the number of collaborators an institute has while
edge thickness corresponds to the frequency of co-publication between two nodes. Or-
ganizations from mainland China, Taiwan and Hong Kong are represented in pink, green
and yellow respectively. The blue circle highlights the center of knowledge creation in the
system.
Figure 1. Institutional collaboration network of neurological drug research in greater China

60 61
From the figure we notice strong linkages between Shanghai institutions (encircled in blue), they have created a center of knowledge sharing. Shanghai Jiao Tong University, Fudan University, along with the Shanghai Institute for Biological Sciences (SIBS), are all leading research institutes in China, constituted with foremost research centers and lab-oratories specialized in neurological sciences. They cooperate with Shanghai Mental Health Center, the largest mental health organization nationwide, and other hospitals so as to build up a close connection between basic science and clinical demand. In addition, among all organizations from mainland China and Hong Kong, CUHK is the most connect-ed one to the institutes in Taiwan.
Among the 256 research institutes included in this study, 46 have a weighted degree above 100 and are listed in descending order in Table 1. As mentioned just now, research units in Shanghai has created a knowledge sharing center and are major contributors to the neurological research in the country, so it is not surprising to see them rank high in terms of number of co-publications. From the table, we find the top five organizations based on betweenness centrality are Peking University, Chang Gung Foundation, CUHK, Taipei City Hospital and Shanghai Jiao Tong University. They are considered as the brokers of informa-tion and resources dissemination that reach different regions in greater China, with large influence on others’ communications. Level of external collaboration (LEC) describes how dependent an organization is on collaborative partnerships. 83.79% of all organizations in the system have a LEC larger than 50%, implying that they focus more on inter-institutional cooperation rather than intra-institutional ones.
Not
e:
1. In
stitu
tions
loca
ted
in H
ong
Kong
and
Tai
wan
are
labe
lled
HK
and
TW re
spec
tivel
y, w
hile
ot
hers
are
from
mai
nlan
d Ch
ina.
2.
WD
: wei
ghte
d de
gree
; LEC
: lev
el o
f ext
erna
l col
labo
ratio
n; B
C: b
etw
eenn
ess
cent
ralit
y.
Tabl
e 1.
Top
inst
itut
ions
rank
ed b
y w
eigh
ted
degr
ee

62 63
3.2 Collaborative Partners
Table 2 shows the top ten institutional pairs with tight connection in terms of edge weight and Jaccard index value. They were sorted out by choosing the ten highest mutually de-pendent pairs among the fifty most frequently collaborating ones. Apparently, intense collaborative partners are mainly located in Shanghai and Taiwan, such as, “Shanghai Jiao Tong Univ-Shanghai Inst Biol Sci”, “Shanghai Jiao Tong Univ-Fudan Univ”, “Taipei Vet Gen Hosp-Natl Yang Ming Univ”, and “Natl Cheng Kung Univ-Tri Serv Gen Hosp”.
Tabl
e 2.
Top
inst
itut
iona
l par
tner
s

64 65
3.3 Network Communities
Organizations which are more densely connected than to the rest of the network are clus-tered into community subnetworks. As shown in Figure 2, research units in this system can be broadly categorized into 6 major communities and are labelled in descending order by the number of constituent institutes. Node size is proportional to the number of publica-tions involved in a community and thickness of an edge reveals the frequency of co-pub-lication between authors in two communities. Node colors correspond to the community membership of each node. Institutes from Taiwan and Shanghai are represented in green and blue respectively, whereas pink symbolizes a combination of all other regions in China except these two.
Figure 2. Research foci of thematic communities
Note: Research units are grouped into communities by applying the Louvain community de-
tection algorithm; we then investigate their research directions by community thematic
analysis based on article keywords. Words highlighted in bold are research topics more
relevant to a given community than to the others. Node colors correspond to the com-
munity membership of each node, green for Taiwan and blue for Shanghai, whereas pink
symbolizes all other regions in China except these two.
Communities 1 and 5 are dominated by institutes from Taiwan while Community 4 is led by organizations in Shanghai, particularly the ones belonging to the knowledge center. Communities 2, 3, and 6 comprise research units from various regions in mainland Chi-na. The ones from Hong Kong are mainly distributed into Communities 2 and 3, working closely with Chinese organizations within a community, and at the same time linking the Taiwan communities to Chinese ones. Since Community 2 includes institutes with highest betweenness centrality, namely Peking University and CUHK, it emerges as the most con-nected node in the network.
3.4 Research Foci of Communities
Article keywords in this system cover a wide range of topics in neuroscience, for instance, genetics, molecules, behavior, brain imaging techniques, neuropharmacology and neuro-pathology. In order to identify the common research interest of organizations in each sub-network, we conducted thematic analysis by studying the occurrence of keywords in com-munities. For each community, keywords are arranged in descending order of frequency; the ones that account for the top 50% of cumulative frequency are presented here. Words in bold are keywords with top 10 RSC values, which means they are more relevant to that particular community than to the others. Communities in this system share common in-terest in areas like depression, schizophrenia, serotonin and genetic polymorphism. On the other hand, it is clearly visible that research directions vary between communities and each of them has its own area of expertise.
4. Discussion
This paper is a first attempt to describe the landscape of Chinese institutes in neurologi-cal drugs research from a network-based perspective and to explore the research foci of thematic communities. Based on our findings, except the Peking University, the majority of the leading institutes in this system are located in Shanghai or Taiwan, such as Shanghai Jiao Tong University and Chang Gung Foundation. On the other hand, institutes from Hong Kong, particularly CUHK, play an important intermediary role in facilitating academic ex-changes between mainland China and Taiwan.
From the closely collaborating partners, we notice a large proportion of the linkages is between a university and a hospital or research institute, this can be explained by the fact that R&D in drugs requires the cooperation between university, research institute and in-dustry. Universities and scientific research institutes are generally regarded as important

66 67
knowledge creators in basic science, while pharmaceutical companies translate the fruits in academic research into clinical application. However, a translational gap is often found between academic innovative research and the needs of the pharmaceutical industry19. Therefore, the Chinese government has been encouraging more collaboration between the three parties, intending to bridge the gap between the academia, clinics, and industry. Yet from the results in Table 2, we believe that it will still take some time for the three-party partnership to be well-established in the neurological drugs R&D in China.
Organizations sharing common research interests tend to cooperate more actively and form a community subnetwork. By means of thematic analysis, we know that Communi-ty 1 focuses on methadone, insomnia, change-in-libido, Treatment Emergent Symptoms Scale (TESS) and imipramine, while Community 2 gives more concern on neurological soft sign, reelin and NRXN3. In contrast, Community 3 specializes in coherence-based regional homogeneity; Community 4 concentrates on case-control study, whereas Community 5 is proficient at attention, neuropsychological function, interaction and ADH1B. Last but not the least, Community 6 conducts in-depth research on cytotoxicity test, monoamine test, AC-5216 and allopregnanolone. Although these communities specialize in diverse research fields, there are some hotspots which attract the attention of every research group; they include depression, schizophrenia, serotonin and genetic polymorphism. According to the WHO, depression and schizophrenia are the leading causes for both males and females for the disabling burden of neuropsychiatric conditions worldwide1. More importantly, major depression is the second leading cause of disability in China in 201020. For serotonin and genetic polymorphism, to the best of our knowledge, there are several neurological drugs that target the serotonin system and a number of studies have been made on the effect and association of polymorphism of certain genes on neurological disorders.
Since the development of drugs is becoming an increasingly time-consuming and expen-sive process, efficient R&D is considered necessary to speed up drug discovery process and improve the chances of achieving clinical and commercial success. As the Chinese government is implementing new policies together with growing investment and fund-ing in innovative drug R&D, it is believed that research ability of Chinese institutes will be more competitive in the near future. With a better understanding of China’s landscape in the neurological drugs research at the early stage of development, scholars and investors across the globe can take advantage of the opportunities to select their best candidate for future cooperation on a particular research subject and to build up their own R&D net-work in the country. The establishment of new partnership does not merely increase the co-publication frequency of organizations involved, but also allows the blending of new perspectives and enriches interaction for information and resource sharing, meaning a
higher production in scientific knowledge. As a consequence, we expect that pharmaceu-tical R&D can benefit from the expansion of knowledge base in this field.
In future studies, in order to construct a more comprehensive research network, we can expand our scope of study from domestic to international co-authorships, and explore how the institutional network and hot research topics evolve over time.

68 69
5. Conclusions
In conclusion, prominent and productive organizations in this system are mainly univer-sities, hospitals, or research centers concentrated in a few territories. In order to promote progress in neurological drugs R&D, knowledge brokers should help in strengthening co-operation across the country, and also between the academia, clinics, and industry. The results of this analysis provide reference for researchers, clinicians, and investors sharing common interest to cooperate and in turn enhance efficiency in the drug discovery pro-cess.
Acknowledgements
We thank Dr. Thomas Scherngell and Dr. Michael Barber in Austrian Institute of Technology for their comments on network analysis, Ms. Han You for her assistance in the preliminary data processing, and the University of Macau for financial support for this research.
References
1. The Global Burden of Disease: 2004 Update. World Health Organization, Geneva, Switzerland; 2008.
2. The World Medicines Situation 2011 – Global Health Trends: Global Burden of Dis-ease and Pharmaceutical Need. World Health Organization. Geneva, Switzerland; 2011.
3. Palmer AM, Alavijeh MS. Translational CNS medicines research. Drug Discovery To-day. 2012; 17(19-20): 1068-1078.
4. 2014 Global R&D Funding Forecast. Battelle and R&D Magazine; 2013. http://www.battelle.org/docs/tpp/2014_global_rd_funding_forecast.pdf.
5. Adams J, King C, Ma N. Global Research Report: China, Thomson Reuters, Leeds; 2009.
6. Zhou P, Leydesdorff L. China ranks second in scientific publications since 2006. ISSI Newsletter. 2088; 4: 7-9.
7. Makris GC, Spanos A, Rafailidis PI, et al. Increasing contribution of China in modern biomedical research: statistical data from ISI Web of Knowledge. Medical Science Monitor. 2009; 15(12): 15-21.
8. Editorial. Neuroscience grows in China. Nature Neuroscience. 2008; 11(1): 1.9. Xu W, Chen YZ, Shen ZC. Neuroscience output of China: A MEDLINE-based biblio-
metric study. Scientometrics. 2003; 57(3): 399-409.10. Bala A, Gupta BM. Mapping of neuroscience research: a quantitative analysis of pub-
lications output of China, 1999-2008. Annals of Neurosciences. 2010; 17(2): 63-73.11. Chen HF, Jin G. Four years of the Chinese Journal of Neuroscience: a bibliometric ex-
amination of the first 4 volumes, 1998-2001. Chinese Journal of Neuroscience. 2002; 18(1): 431-432.
12. Qiao YY, Xu CT. Papers Published in Journal of Neuroanatomy in 2000-2009: A Biblio-metric Analysis. Chinese Journal of Medical Library and Information Science. 2011; 20(10): 75-80.
13. Duan BC, Meng L, Shi QK, et al. Citation analysis of Chinese Journal of Neuroimmu-nology and Neurology during 2006 to 2010. Chinese Journal of Neuroimmunology and Neurology. 2012; 19(1): 58-64.
14. Thomas M. Edward M. Graph Drawing by Force-directed Placement. Software: Prac-tice and Experience. 1991; 21(11): 1129-1164.
15. Freeman LC. Centrality in Social Networks Conceptual Clarification. Social Networks. 1979; 11(3): 215-239.

70 71
16. Leydesdorff L. On the Normalization and Visualization of Author Co‐Citation Data: Salton’s Cosine versus the Jaccard index. Journal of the American Society for Infor-mation Science and Technology. 2008; 59(1): 77-85.
17. Blondel VD, Guillaume JL, Lambiotte R, et al. Fast unfolding of communities in large networks. Journal of Statistical Mechanics: Theory and Experiment. (2008): P10008.
18. Barber MJ, Fischer MM, Scherngell T. The Community Structure of Research and Development Cooperation in Europe: Evidence from a Social Network Perspective. Geographical Analysis. 2011; 43(4): 415-432.
19. Tralau-Stewart CJ, Wyatt CA, Kleyn DE, et al. Drug discovery: new models for indus-try-academic partnerships. Drug Discovery Today. 2009; 14(1-2): 95-101.
20. Yang GH, Wang Y, Zeng YX, et al. Rapid health transition in China, 1990-2010: find-ings from the Global Burden of Disease Study 2010. The Lancet. 2013; 381(9882): 1987-2015.

72 73
Chapter 4
CHINA’S LANDSCAPE OF DISCOVERING MIRNAS IN CANCER
Hengwa Kuok, Xiangjun Kong, Yuanjia Hu*, Yitao Wang*
State Key Laboratory of Quality Research in Chinese Medicine, Institute of Chinese Medical Sciences, University of Macau, Macau SAR, China
* Corresponding authors: [email protected]; [email protected].
This chapter has been published as below.H.W. Kuok, X.J. Kong, Y.J. Hu*, Y.T. Wang, Discovering MiRNAs in Cancer: China’s Landscape and the Role of Hong Kong, in Biotechnology in Hong Kong, Volume II, United States-China Intellectual Property Institute, Hong Kong, 2015.
74 75
Abstract
The microRNA (miRNA) is a kind of short non-coding RNA that binds to genes and down-regulate gene expression. miRNAs have been proven to function in multiple bio-logical processes and play critical roles in pathogenic mechanisms, especially in cancer development. As one of the hottest research fields in biomedicine, miRNA has also been thoroughly studied in China.
This chapter aims to construct institutional collaboration network of cancer-related miRNA research in China. The network is based on co-publication frequency in the Web of Science, and analysis of China’s research landscape, which further provides information for inves-tors and researchers in building research partnership.
This chapter, acting as the navigation map of cancer-related miRNAs research in China, helps to figure out the leading and core research institutes, understand behavior of mem-bers and their associations, and even position every member in the system. Moreover, this work offers insight to policy-making for promotion of the biotechnological research and development in China.
1. Introduction
With the further development of post-human genome project, scientists are paying more and more attentions to the non-coding sequences accounting for 98% of the human genome. In the project, the most notable and exciting discovery was the miRNAs1. The miRNAs are short and highly conserved non-coding RNAs. As this research work is being carried out, the release of miRBase contains 28,645 entries representing hairpin precursor miRNAs, which associate with 35,828 mature miRNA products in 223 species2. miRNAs play a critical role in regulating posttranscriptional mRNA expression, and have been proven to be involved in diverse biological processes including cell proliferation, proliferation, apop-tosis, death, energy metabolism, immunoregulation and etc3.
Emerging evidences also indicate that dysfunction of miRNAs is associated with various human diseases, especially cancers4. A number of studies have shown that the location of miRNAs in tumor is also the hotspot of genetic variations such as human chromosome deletion, amplification and translocation. They have been mostly discovered through miRNAs differential expression profiling in various tumor tissue samples. The following function verification studies demonstrate that miRNAs contribute to tumor formation, de-
velopment and progression. In recent years, the miRNAs have gained substantial weight in the worldwide biomedical research community and become a popular sub-field in on-cological research.
Studies show that the scientific collaboration in biomedical research contributes to the expansion of this research field through sharing of scientific resources, reducing risks and achieving fruitful research outcomes with great impact5. As an important mode in biotech-nological innovation and production, the scientific collaboration becomes increasingly popular6, and co-publication is an important indicator to measure research collaboration behaviors. What is more, the quantity of co-written papers and the collaboration situation in certain period can indicate the development speed and quality of scientific exchanges and cooperation7.
In the past decade, researchers in China have been actively researching miRNAs and have obtained great achievements. In the database of Web of Science, a scientific research in-formation platform, there are about 14,000 papers on miRNA in recent ten years, among which 5,000 papers are co-written by authors from China (including Mainland China, Hong Kong, Macau and Taiwan). These publications totally account for up to 36% of all, which reflects the vital contributions to the global miRNA research community from researchers in China and the internationally recognized academic status of China. In this context, this chapter will unveil the research collaboration modes, and the performance and the region-al characteristics of biological knowledge creation in China by virtue of miRNA research in cancer studies. The direct collaboration relationships between institutions in China will be exhibited through the collaboration network. This chapter also propose suggestions to researchers and investors on finding partners for R&D (research and development) based on results obtained.
2. Data and Methods
This chapter, taking related articles indexed by SCI (Scientific Citation Indexing) as data samples, uses the social network analysis to visualize and analyze the structure of the col-laboration network of related research institutes. Based on network parameters and col-laboration analysis, the network’s structural features and institutes’ collaboration behav-iors are further explored.
For this research, the advanced search function provided by Web of Science has been used to retrieve miRNA research publications related to cancer studies in the recent five years,

76 77
i.e., from year 2010 to 2014, with restriction of the scholars from institutes in China (includ-ing Mainland China, Hong Kong, Macau and Taiwan). As a result, 1,200 articles have been retrieved.
Moreover, further bibliographic data were collected, such as article title, author name, affiliation, and institution address. To strengthen this work, the raw and messy institu-tion data were normalized following a series of rules for integration. After the normal-ization, the sample pool of institution includes 479 Chinese research institutions, and the relationship of co-publications amongst them was analyzed, both of which are the components of interest to construct the collaboration network.
3. Results
3.1 Network Mapping
Based on those 1,200 articles indexed by SCI, the collaboration relationships among Chi-nese institutes can be visualized and a network of collaborations in recent five years is mapped, in which, 479 nodes (i.e. 479 institutes) and 1,642 weighted edges are included; see Figure 1 for relevant results. From the statistical analysis, it can be concluded that 479 institutes from China participated in the collaboration of miRNA researches related to on-cology. Of all these institutes, more than 400 are from Mainland China.
Each node represents an independent institute and the edges between nodes represent the frequency of co-publishing papers for these institutes. Node degree is an effective conceptual tool to analyze the social network. The size of node represents the weighted degree. The thickness of edges represents their weight, i.e. the frequency of co-publishing papers for these institutes. Blue, yellow and red nodes respectively represent institutes from Mainland China, Taiwan, and Hong Kong. Some nodes occupying obviously import-ant places in terms of high weighted degree are noted with the name of the institute each node represents (in abbreviation).
In this research, Fruchterman-Reingold algorithm is used to optimize and visualize the structural layout of the network. According to this principle, i.e. the node with higher centrality is in the center of the network, the institute represents widely collaborates with different external institutes frequently. As shown in Figure 1, Nanjing Medical University, Shanghai Jiao Tong University, Sun Yat Sen University, Fudan University and Tianjin Med-ical University are in the center of the network. Among institutes from Taiwan, National
Yang-Ming University, and Academia Sinica - Genomics Research Center, Taipei Medicine University, Chang Gung Medical Foundation and Taipei Veterans General Hospital rank on the top.
As shown in Figure 1, institutes from Mainland China occupy relatively central positions in the network, while those from Taiwan are centralized at the right of the network. And those from Hong Kong are scattered in the center of the network through frequent inter-action between institutes from the Mainland and Taiwan. Institutes from the Mainland and Taiwan occupy both sides of the network respectively and are relatively independent mu-tually. As indicated in the network, institutes from Taiwan mainly collaborate with Peking University and China Medicine University but with weak frequencies and intensities. Thus, institutes from Mainland China and Taiwan are separated from each other in the network, showing that less interaction or collaboration exist between the Mainland and Taiwan in terms of miRNA researches related to oncology. Compared to the situation above, the col-laboration between Hong Kong and the Mainland is stronger, and the main and active collaborative partners in Hong Kong side are The Chinese University of Hong Kong and The University of Hong Kong. The details about cross-regional collaboration will be discussed in the later part of this study.

78 79
Figure 1. Institutional collaboration network of miRNA research in cancer in China
3.2 Centrality Analysis
To observe institutes’ behaviors further, centrality measures are considered as basic tools to analyze. In this research, the weighted degree, external dependency, and betweenness centrality are taken as the indexes to be researched.
Note: 1 WD: Weighted Degree; LEC: Level of External Collaborations;
BC: Betweenness Centrality.
2 Institutions based in Hong Kong and Taiwan are labelled HK and TW respectively,
while others are from the mainland of China.
Table 1. Top institutions ranked by weighted degree

80 81
As shown above, these 50 frequently collaborating institutes cover those from Mainland China, Taiwan, and Hong Kong. These institutions are universities, hospitals or research in-stitutes. Universities or colleges from Mainland are mostly the top-tier universities or med-ical universities. Most of their names can be found in the member list of Project 211 that, an enormous and ambitious project launched by ministry of education in order to develop the world-class universities. As a result, these universities have superior advantages over others in terms of elite faculties, talent pools, labor forces and resources. The weighted de-gree refers to the sum of frequency of edges between each node and its neighbor nodes, i.e. the sum of edge weight. As defined, the weighted degree is the total number of R&D collaborations an institute has, i.e. the total sum of the frequency of internally and exter-nally co-publishing papers for the institute. The top five institutes are: Sun Yat Sen Univer-sity, Nanjing Medical University, Tianjin Medical University, Shanghai Jiao Tong University and Fudan University. This indicates that these universities occupy central positions in on-cological miRNA research and play significant roles in the collaboration network. Top five institutes in Taiwan are: National Yang-Ming University, Taipei Veterans General Hospital, Chang Gung Medical Foundation, and Academia Sinica - Genomics Research Center and National Taipei University. Only two universities from Hong Kong are in the list of the top 50: The Chinese University of Hong Kong and The University of Hong Kong.
Besides, to reflect another concept of centrality, we introduce the betweenness centrality measures how often a node appears on shortest paths between nodes in the network, i.e. a node’s betweenness in the network. Intuitively, if a node appears on the shortest path be-tween other nodes, it acts as a “go-between” to control the information exchange between the nodes. Therefore, the betweenness centrality is an important measure for an institute to control information flow between other institutes. The Peking University has the highest betweenness centrality within the whole network, which means it is the go-between of the network and controls the information flow among most institutes. Following Peking University in terms of the betweenness centrality, Nanjing Medical University, Shanghai Jiao Tong University, Fudan University and Sun Yat Sen University also have the advantages of go-between and they are located in different parts of China: North China, East China, South China, Hong Kong and Taiwan, fully playing the role of go-between for information flow in respective areas. They have more positive influence on knowledge dissemination and play key roles in increasing the research effectiveness of the whole network.
Hong Kong’s government agencies, research institutes or investors may also give more attention to these institutes with high betweenness centrality. This helps to find other partners and obtain more abundant information resources through them, and encourages these institutes to disseminate knowledge to other institutes; Hong Kong could be the hub
to facilitate sino-foreign collaborations for the purpose of resources sharing and resourc-es allocation optimization. Increasing the investment to institutes with high betweenness centrality will greatly stimulate the research collaboration and facilitate the resources shar-ing and knowledge dissemination.
3.3 Analysis on Collaborative Pairs
Besides the analysis on social network centrality, this research also simply analyzes the col-laboration tendency of institutions and uses the co-publication frequency, level of external collaborations (LEC) and Jaccard index and further analyzes the data on R&D collaboration between institutions by reference of Table 1 and 2.
The internal co-publication frequency refers to the total frequency of co-publishing papers of researchers in an institute; the inter-institute co-publication frequency refers to the total frequency of collaboration between an institution and another institution, i.e. the co-pub-lication frequency minus the internal co-publication frequency. On this basis, the ratio of the inter-institute co-publication frequency and the co-publication frequency can be con-sidered as the external dependency of an institute, reflecting the degree of an institute’s dependency on external collaboration.
As shown in Table 1, the external dependency and weighted degree (i.e. the co-publication frequency) are uncorrelated. At the same time, it can also be concluded that although Sun Yat Sen University, Nanjing Medical University, Tianjin Medical University, Shanghai Jiao Tong University and Fudan University have the highest weighted degrees, their external dependencies are very low, because their high co-publication frequency mainly depends on the co-publication by internal researchers. Overall, the external dependency of insti-tutions from Mainland China, Taiwan and Hong Kong is 0.77, 0.89 and 0.88 respectively. The results of T-testing indicates that institutes from the Mainland are quite different from those in Taiwan and Hong Kong, since the latter has high external dependency while the former has relatively low external dependency. That is to say, more institutions from Tai-wan co-publish papers with external institutes while institutions from the Mainland are more inclined to independently publish papers. One of the reasons for this may be the relatively conservative academic culture in the Mainland, while Taiwan has a more open academic atmosphere, and institutions there pay more attention to co-publishing papers with external partners. Institutions from Hong Kong have more collaboration with interna-tional institutions.
The Jaccard index, different from three indicators aforementioned, measures the degree

82 83
of mutual collaboration and dependency between two institutions. This index reflects im-portance of the collaboration relationship in all collaboration between both institutions. A higher dependency indicates the collaboration relationship is more important for both institutions, i.e. they are more dependent on the relationship. The pairs of institutions hav-ing stable collaboration are listed. As shown in the list of indexes, 75% of all pairs are geo-graphically adjacent, i.e. located in same region or province. One of the factors restricting the R&D collaboration between Mainland China and other countries or regions may be the geographic distance. A study on collaboration in scientific research projects in China’s medical field from Scherngell and Hu concluded that the geographical factor is a major one affecting the collaboration8. Additionally, the pairs keeping stable partnership mostly are institutions possessing equivalent R&D capacity to each other, such as the Southern Medical University and Sun Yat Sen University, National Yang-Ming University and Taipei Veterans General Hospital, National Taiwan University and its affiliated hospitals. But usu-ally, in more cases, three factors above coexist and “adjacency, equivalence and interest” become the key influencing factors in building close collaboration relationships. Besides, the local governance and specific organizational features of institutions in China may also be an influencing factor causing regional barriers in the network.
Tabl
e 2.
Top
inst
itut
iona
l pai
rs in
miR
NA
rese
arch
in c
ance
r in
the
netw
ork
Not
e:
1 In
stitu
tion’
s re
gion
al lo
catio
n is
the
prov
inci
al-le
vel a
dmin
istr
ativ
e di
visi
ons
of
Ch
ina.
2
The
val
ue o
f geo
grap
hic
adja
cenc
y is
yes
whe
n th
e in
stitu
tiona
l par
tner
s ar
e l
oc
ated
with
in th
e sa
me
regi
on; o
n th
e co
ntra
ry, t
he v
alue
is n
o.

84 85
3.4 Cross-regional Collaboration
In this part, the collaborative relations across regions are extracted to profile the region-al academic communication in the aspect of oncological miRNA studies. As previously described, the inter-institutional relationships tend to be generated among the same region, especially within the Mainland China and Taiwan. However, the aggregation of Taiwan is drawn into the principle part by the sporadic researches accomplished to-gether with the institutions from the Mainland. Participants from Hong Kong, in con-trast, are surrounding some partners from the Mainland, displaying a more intense col-laborative relationship with the Mainland China than Taiwan. This obvious distinction could also be told from the different proportions of regional cooperation, denoting the rate of collaborative relations across different regions to all the partnerships the specific region involved, with 82% of Hong Kong, while 3% for Taiwan.
Moreover, the details of cross-regional collaboration, referring to the relevant institu-tional pairs, have been provided in the Table 3. There are 33 pairs scattering in 432 of the co-publication frequency between the Mainland and Hong Kong, and top 10 relations with closest collaboration are exhibited in the table. Clearly, the institutions from Hong Kong are inclined to collaborate with its neighbor province Guangdong considering the geographic advantage and also with cities of the highest research capacities, i.e., Beijing and Shanghai. These tendencies contribute a considerable amount of the cross-region-al co-publications for both Hong Kong and the Mainland. Southern Medical University and Sun Yat Sen University from Guangdong province, Peking University from Beijing as well as East China Normal University from Shanghai play an outstanding role for the specific academic communications with Hong Kong, and vice versa for Chinese Univer-sity Hong Kong and University Hong Kong. The relative low Jaccard index indicates the humbly mutual collaborative dependency between institutions, especially for institu-tions in the Mainland due to their large amounts of co-publications.
In the case of Taiwan, it tells a different story. A total of 13 institutional pairs covering 80 of the co-publication frequency between Taiwan and the Mainland, and the top 6 relations with more tense collaboration-comparing among all cross-regional relations involving Taiwan’s institutions-are exhibited in the table. Taiwan’s partners are concen-trated in three institutions distributed in Beijing and Liaoning province, i.e., China Med-ical University and Hospital, China Medical University, and Peking University. More than the relatively intensive partners within the Mainland, the cross-regional relations within Taiwan have scattered in 10 distinct participants, also bearing weak mutual dependen-cy. This situation is in contrast with Hong Kong’s cross-regional relations, which show
some kind of concentration for Hong Kong’s institutions but appear much more disper-sive for their partners from the Mainland (3 institutions are from Hong Kong whereas 26 are from the Mainland). Taiwan, maintaining substantial institutional co-publications, exhibits not only a non-negligible research strength but also an open collaboration pro-file in the oncological miRNA studies. However, this partnering custom has been merely limited within the island, just with little connections with the Mainland and none with Hong Kong.

86 87
Table 3. Institutional pairs across different regions in miRNA research in cancer
Note: The second column lists the institutions-located in Hong Kong, Taiwan, and Macau respec-
tively)-involved in cross-regional collaboration with Mainland China. For Hong Kong and
Taiwan, not all relations with the Mainland are exhibited but some the most intense ones,
while all the collaboration involving institution from Macau is offered.
4. Implications for Oncological miRNA Researches in China
This work acts as an essential navigation map for oncological miRNA studies, positioning each institution, the leading institutions and collaborative clusters in the collaboration system and unveiling their structures and behaviors. Government agencies, research in-stitutions and investors can pay further attention to the leading institutions identified and consider giving more investment to them. Meanwhile, foreign institutions interested in transferring research projects to China can regard them as the potential partners.
Increased investment on biomedical researches facilitated the research capability of Chi-na, especially within the Mainland China. It also indirectly strengthened the institutional partnerships and cross-regional collaboration which would leverage the relevant scientific performance. However, although researchers from Mainland China are actively conduct-ing oncological miRNA research in larger scale, in order to transfer novel knowledge into clinical and therapeutic application, further efforts should be made to adopt advances from its cross regional partners. For example, building the powerful intellectual property protection system, constructing excellent infrastructure, enhancing reliable quality control system and stringent system of laws and regulations. In this context, the knowledge and investment in science and technology need to flow smoothly across institutions and re-gions to accelerate the improvement of scientific and practical innovation.
Researchers, governmental agencies and investors can, according to the scientific and industrial demands, initiate diversified collaborations in modern scientific innovation ac-tivities to accelerate cross-border and cross-regional flow, integrate knowledge with rea-sonable breadth, depth and strength, keep up with the trends of open innovation and enhance win-win collaboration in science and technology. This has become the basic requirement for modern scientific innovation and an important way for today’s research institutions to improve the capability of innovation.
88 89
Acknowledgements
The authors would like to thank Ms Han You and Mr Chuoji Huang for their assistance in the data collection and analysis.
References
1. Bartel DP. MicroRNAs: genomics, biogenesis, mechanism, and function. Cell. 2004; 116(2): 281-297.
2. Squela-Kerscher A, Slack FJ. Oncomirs - microRNAs with a role in cancer. Nature Review Cancer. 2006; 6: 259–269.
3. miRBase: the microRNA database. July 25, 2014. http://www.mirbase.org/index.shtml
4. Yu F, Chen JN, Zhang JF. miRNA: New hot-spot of tumor-biological research. Jour-nal of Southeast University (Medical Science Edition). 2012; 31(4): 477-482.
5. Liu L, Song G, Yuan XL, et al. Analysis and measure on the academic institutions’ collaboration networks under the perspective of coauthor. Journal of Modern Information. 2014; 34(1): 94-99.
6. Wang XW, Ding K, Zhu XY. Analysis on scientific collaboration network of main research institutes in China. Studies in Science of Science. 2010; 12: 1806-1812.
7. Zhang DL, Wang XW, Hou JH. Analysis on inter-city high level scientific paper col-laboration network in China. Forum on Science and Technology in China. 2008; 9: 102-106.
8. Scherngell T, Hu YJ. Collaborative Knowledge Production in China. Regional Evi-dence from a Gravity Model Approach. Regional Studies. 2011; 6(45): 755-772.

90 91
Chapter 5
GLOBAL LANDSCAPE OF RESEARCH AND DEVELOPMENT ON ANTIBIOTICS
Xiangjun Kong1, Hong Lu1, Qianru Zhang1, Huali Zuo1, Yuanjia Hu1*,
Albert Wai-Kit Chan2*
1 State Key Laboratory of Quality Research in Chinese Medicine, Institute of Chinese Medical Sciences, University of Macau, Macau SAR, China
2 United States-China Intellectual Property Institute, New York, United States
*Corresponding authors: [email protected]; [email protected]

92 93
Abstract
Given the rapid and widespread emergence of bacterial resistance and the less satisfy-ing antibiotic R&D (research and development) progress made, there is an urgent need to accelerate antibiotic R&D. In light of the growing complexity and risks of the drug discov-ery process, R&D of new drugs tends to follow an “open innovation” model. To maintain efficiency in such a model, it is helpful for antibiotic researchers to receive an overview of efforts regarding R&D collaboration. This chapter attempts to profile the collaboration patterns of antibiotic R&D by analyzing collaborative relationships using constructed col-laboration networks from both institutional and national levels.
1. Background
Antibiotics are a type of antimicrobial agent used specifically to treat bacterial infections. A revolutionary form of medicine developed in the 20th century, antibiotics inhibit the growth of bacteria and reduce infections’ complications and mortality rates1. Resistance to antibiotics is now a serious threat to global public health. As reported by the Infectious Dis-eases Society of America (IDSA), nearly 2 million Americans developed hospital-acquired infections annually as a result of antibacterial-resistant pathogens, resulting in 99,000 deaths2. The spread of resistant and multi-resistant bacterial strains places a significant burden on healthcare systems and society3.
Despite the need for new antibacterial agents to compensate for the decreasing efficacy of existing antibiotics, the development pipeline of such products is constrained. Pharma-ceutical and biotechnology firms are reluctant to invest in developing new antibiotics as the market is financially unattractive to them. First, bacterial resistance to new antibiotics impedes their long-term efficacy, and thus their market life. Compared to drugs used to treat chronic diseases, antibiotics provide low amounts of profit over short treatment pe-riods4, 5. Second, the growing resistance to antibiotics makes the regulations for market approval and use of new antibiotics more stringent, which creates additional development risks6, 7. Third, there are considerable scientific hurdles to be overcome in creating new anti-biotics, especially identifying new lead compounds8.
We are facing with a paradoxical situation, wherein increasing resistance to antibiotics is leading to a waning trend in new antibiotic development. As the challenges inherent in drug development have increased, no single organization has been able to internally mas-ter and control all the various factors required to develop new, effective medicine. Collab-oration, especially inter-institution and cross-country collaboration, would be important
to help reinvigorate antibiotic development. Collaboration would give companies easier access to new antibiotics and also follow an “open innovation” model9. This chapter ana-lyzes the current landscape of collaborative antibiotic R&D by investigating partnerships in pipeline projects with the intent of providing insight into the facilitation of antibiotic discovery.
2. Methodology
2.1 Data Collection
R&D projects were targeted to measure collaboration in antibiotic research in an effort to reflect levels of R&D collaboration directly. Since the field of antibiotics has been devel-oping for decades, it is necessary to reliably collect and analyze a wide variety of relevant pipeline projects. For this study, we retrieved the R&D projects related to antibiotic resis-tance from the IMS R&D Focus database, which was a powerful tool for evaluating the progress of R&D pipelines as it covers more than 23,300 drugs in R&D in different develop-ment phases10. The database provides comprehensive, well-structured, and project-based records of trials with up-to-date intelligences, with all data judged and sorted by experts in the relevant fields. Within this database, all the antibiotic R&D projects were identified by the action “antibiotic or antibacterial.” A total of 1,761 relevant items were obtained, and related clinical and collaborative information was also identified.
2.2 Collaboration Networks
Collaborative R&D projects were defined as projects that involved more than two institu-tions as disclosed in the IMS R&D Focus database, where “institutions” referred to all kinds of involved entities, including private firms, non-profit organizations, and public establish-ments. The dataset was comprised of 423 projects that involved collaboration with part-ners. The collaborative relationships between entities were divided into two types, devel-oping and licensing, which were disclosed by the database.
Social network analysis (SNA), an efficient tool for mapping and studying the linkage (edg-es or ties) among connected actors (nodes or vertices), was employed to exhibit the overall collaboration profile of antibiotic R&D. The institutional network was constructed based on the partnerships within institutions involved in the collaborative R&D projects. In this network, nodes represent institutions and edges represent the interconnections among these institutions. In instances where more than one collaborative relationship exists be-

94 95
tween two institutions, the related edge would gain a value that referred to the number of partnerships. A loop, starting from and ending at the same node, denotes an instance of self-cooperation.
To create a profile of international collaboration in antibiotic R&D, the participation of dif-ferent countries (or regions) can be assumed based on the geographic location of collab-orating institutions. The country-based collaboration network was thus generated by con-densing the institutional collaboration network, with nodes representing countries and edges showing international partnerships.
2.3 Network Analysis
A topological analysis of networks helps to identify their structural characteristics. The cen-trality definition of a node is related to its importance; it has developed various measures to find central nodes from different topological perspectives11. This study focuses on four types of centrality measures: degree, weighted degree, betweenness, and closeness. The degree of a node is defined as the number of edges linked to it, in this case, the number of partners of an institution (or country). Weighted degree measures the actual performance of a node by considering the frequency of its relationships. The betweenness centrality of a node is equal to the number of shortest paths that pass through it; an institution (or country) with high betweenness centrality serves as a bridge between other institutions (or countries) in the network as a whole. The closeness centrality of nodes denotes the direct and indirect links connected to them; it is the average shortest path from a node to all other nodes. In this study, the network visualization and analysis were accomplished by an open-source software, Gephi12.
3. Results
3.1 Overview of Antibiotic R&D Projects
1,761 projects related to antibacterial trails were identified in the aforementioned search
strategy, ranging in phase from preclinical to marketed. The projects’ phase distribution
is shown in Figure 1. Nearly half of all the studied projects were preclinical, and the next
highest number was the discontinued trails. Only a small number of agents (12%) were
in clinical development, involving clinical phases I, II, and III. Phase III, the closest to the
market, had the lowest number of projects in development. Considering the rapid increase
in antibacterial resistance, there appears to be a conspicuous gap between the need for
antibiotic R&D to combat bacterial resistance and the low output of the clinical pipeline.
Figure 1. The phase distribution of antibiotic R&D projects

96 97
In order to identify the trends of recent antibiotic R&D, the start year of each project was also catalogued. This study contains projects with starting dates spanning from 1961 to the end of 2014. The early records might be incomplete. Only five sporadic cases appeared in the database between 1961 and 1976, including: priority patent applications on mi-nocycline, filed in 1961; gentamicin, filed in 1962; midecamycin, first launched in 1968; flumequine, filed in 1971; and idarubicin, filed in 1974, all of which had been marketed for decades. It is challenging to compile records of R&D on antibiotics decades ago as the unmet recording system. Although this situation seems inconsistent given the prosperity of antibiotics in the 1950s and 1960s, we can still construct an R&D profile on antibiotics in over the past 30 years.
Figure 2. The phase distribution in project starting year
In Figure 2, the time of projects refers to the starting years of the projects which were obtained in the database. The corresponding phase distribution provides the latest devel-opment state of the projects which started in the given year. The data sample focused on the period of 1977-2014, and the marketed projects were concentrated in the late 1970s and early 1980s. After extensive antibiotic production emerged globally in the 1970s, there were so many antibiotics on the market that the profits from the development of new antibacterial drugs were seriously reduced in the 1980s13, 14. As a result, pharmaceutical companies reduced funding for their antibiotic research programs, which may explain the
comparatively small number of antibacterial projects in the 1980s. In the 1990s, the in-creasing prevalence of resistant bacteria, which had gradually come to the attention of pharmaceutical developers, created a new market for drugs to overcome these resistant strains. This new market opportunity resulted in the increase in research and development activities in the mid-1990s. Many of the projects launched in this period failed despite the commercialization of several new antibiotics, most of which were additions to existing classes of drug. The highest proportion of projects launched after the year 2000 were still in the preclinical phase, facing challenges stemming from low projected profits. Due to short treatment periods, prudent use and regulatory restriction, and scientific hurdles, the downward trend in antibiotic development has continued since the mid-2000s15. As seen in Figure 2, only few antibacterial R&D projects launched in this period were pushed to market. If this trend continues, it would become a serious crisis of public health in light of increasing incidence of antibiotic resistance and the shortfall of R&D pipelines.
Figure 3. Phase distribution of collaborative and non-collaborative R&D projects

98 99
3.2 Collaborative vs. Non-collaborative Antibiotic R&D
Among the antibiotic R&D projects in this study, only 24% (423 out of 1,761 projects) have collaborative partners to conduct the tails. Developers or licensors collaborate under var-ious agreements to co-develop or out-license the programs. The percentages of collabo-rative and non-collaborative R&D projects across all the developmental stages (including discontinued and withdrawn programs) are exhibited in Figure 3. Over 86% of the non-col-laborative R&D projects were either preclinical or discontinued (50% preclinical, 36% dis-continued). This shows that the majority of the projects were still available for collabora-tion in the preclinical development phase, a phase which entails considerable uncertainty and risk, or were discontinued before getting partners to aid in their development. Only a few projects managed to move into the clinical stages. Similar percentage distributions over the preclinical, clinical, and discontinued phases can be observed in the collaborative projects. However, a substantial percentage (27%) of the collaborative R&D projects have been marketed. Comparing this amount to the small percentage of marketed, non-collab-orative projects (3%), highlights the influence of collaboration on antibiotic R&D: the vast majority of projects that made it to the later clinical phases and to market are the result of collaborative effort. It is reasonable to assume that this is due in part to the fact that the late development phases tend to require more resources to push the project forward, especially as the cost of R&D increases, a problem which can be surmounted through part-nerships.
There are 480 total institutions from 40 countries involved in the 423 collaborative projects in this study, whereas only 417 institutions from 31 countries participated in the devel-opment of the 1,338 non-collaborative projects (Figure 4). Furthermore, only 156 out of 417 institutions utilized partnerships in addition to building up their pipelines individually, while 261 developers never had opportunities to collaborate with others to develop their agents as most of them discontinued their programs or never left the preclinical phase. More than 300 institutions, mostly small and medium enterprises (SMEs), participated in antibiotic R&D by collaborating with others. At the same time, more developing countries (Chile, Brazil, Argentina, Egypt, Indonesia, Pakistan, etc.) have become involved in the anti-biotic development process through international agreements among institutions. Small companies tend to lack financial stability, as well as ability to market and distribute a new medicine, making collaboration with larger corporations or institutions an important part of antibiotic innovation as it allows ongoing projects to be pushed forward through the sharing of resources. Collaboration can help bring new medicines to markets worldwide, improving the public health and allowing for access to antibiotics in developing countries.
Figure 4. The difference in involved participants between collaborative and non-collaborative R&D projects

100 101
Note: The nodes represent the institutions involved in collaborative projects. Edges represent
collaborative relations, and are weighted by the frequency of co-projects. A node is sur-
rounded by a loop if self-cooperation exists. Node size is relative to the weighted degree
centrality of an institution. The nodes with top weighted degrees are colored and labeled.
Figure 5. Institutional collaboration network on antibiotic R&D.
3.3 Institutional Collaboration Network in Antibiotic R&D
Since dwindling R&D activities result in inactive clinical pipelines, more effective antibiotic R&D methods need to be implemented to prevent serious health crises caused by anti-bacterial resistance. Collaborative R&D is an essential strategy to improve antibiotic drug discovery and development16, 17.
The overall institutional collaboration network, generated by partnerships in antibiotic
R&D collaborative projects, is visualized in Figure 5. The network contains 480 nodes and
606 weighted edges. The average weighted degree (the average number of relationships
of each node involved) of the network is 3.02. The top 20 actors, those with the highest
weighted degree, are labeled in the network for their close and extensive partnerships
with other institutions; most are large international pharmaceutical corporations (e.g., Pfiz-
er, Sanofi, AstraZeneca, GlaxoSmithKline, Johnson & Johnson, and Bristol-Myers Squibb).
As seen in Table 1, Pfizer has the most partners (40) from around the world, followed by
Astellas (33) and Sanofi (30). Several corporations, Pfizer (USA), Astellas (Japan), Sanofi
(France), AzstraZeneca (UK), GlaxoSmithKline (UK), and Dainippon Sumitomo (Japan) oc-
cupying the notable positions in the network from all four centrality measures. That is,
these corporations not only have the most extensive and intensive collaborative relation-
ships (highest degree and weighted degree), but also position as gatekeepers in the net-
work (highest betweenness centrality) and are widely connected with other central nodes
(highest closeness centrality).
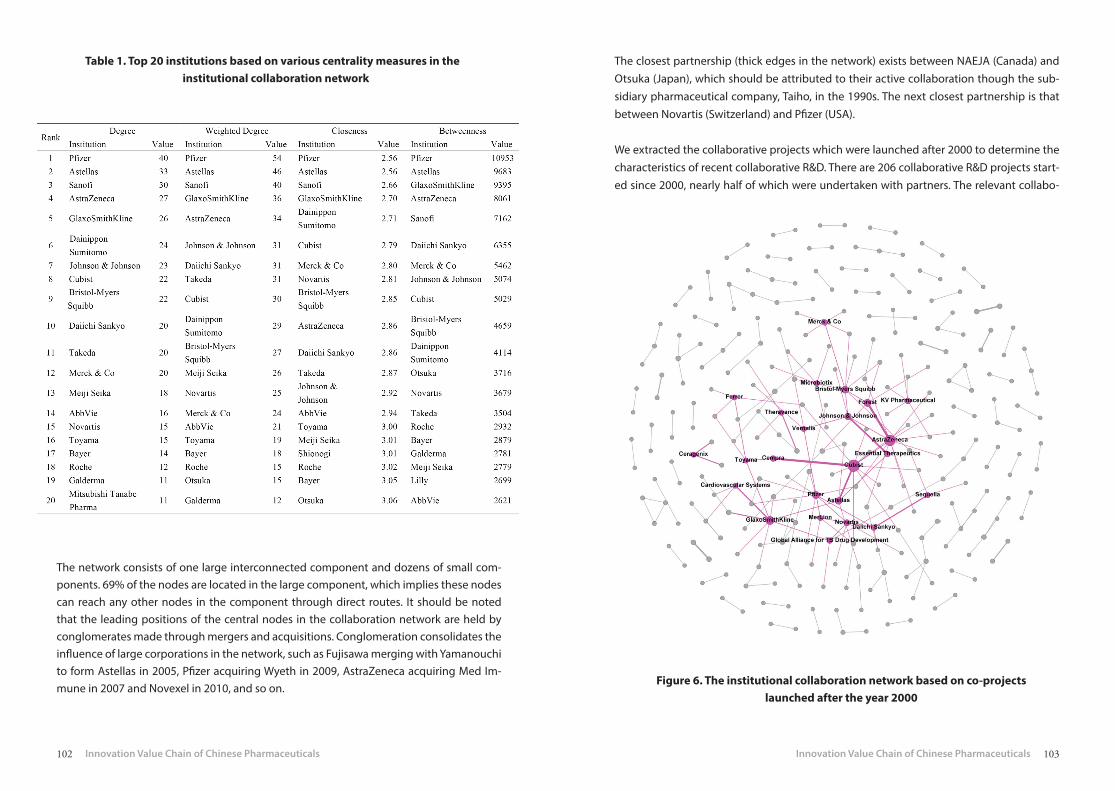
102 103
Table 1. Top 20 institutions based on various centrality measures in the institutional collaboration network
The network consists of one large interconnected component and dozens of small com-ponents. 69% of the nodes are located in the large component, which implies these nodes can reach any other nodes in the component through direct routes. It should be noted that the leading positions of the central nodes in the collaboration network are held by conglomerates made through mergers and acquisitions. Conglomeration consolidates the influence of large corporations in the network, such as Fujisawa merging with Yamanouchi to form Astellas in 2005, Pfizer acquiring Wyeth in 2009, AstraZeneca acquiring Med Im-mune in 2007 and Novexel in 2010, and so on.
The closest partnership (thick edges in the network) exists between NAEJA (Canada) and Otsuka (Japan), which should be attributed to their active collaboration though the sub-sidiary pharmaceutical company, Taiho, in the 1990s. The next closest partnership is that between Novartis (Switzerland) and Pfizer (USA).
We extracted the collaborative projects which were launched after 2000 to determine the characteristics of recent collaborative R&D. There are 206 collaborative R&D projects start-ed since 2000, nearly half of which were undertaken with partners. The relevant collabo-
Figure 6. The institutional collaboration network based on co-projects launched after the year 2000

104 105
ration network shown in Figure 6 was generated following the same practices discussed
in the methodology section, and the comparison between the total collaboration network
and network after the year 2000 was performed using various network features (Table 2).
Table 2. Comparison between the total collaboration network and network after the year of 2000
Note: 1 WD = weighted degree.
The shrunken network only includes 276 out of the study’s 480 collaborative institutions; 204 institutions have not participated in collaborative antibiotic R&D in recent years and have been excluded from the network. With the removal of these inactive institutions, the number of partner relationships in the collaboration network diminished by nearly two thirds. The network, accordingly, looks much sparser and has a decreased average weight-ed degree. Additionally, the largest component of the network also shrank in proportion to the total collaboration network. These changes reveal a relatively inactive collaboration profile on antibiotic R&D. Interestingly, most of the collaborative relationships dedicated to development, rather than licensing activities, were built up in the last 15 years. 38.8% of all the R&D project partnerships were formed after 2000. While Pfizer and Astellas remained in the core of the network, they relinquished their positions as the largest nodes to Cubist and AstraZeneca. Also, the closest partnerships in the new network were formed by col-laborations between AstraZeneca and Forest and Cubist and Cempra. In summation, the collaborative antibiotic R&D projects launched in recent years suggests a serious decline and a concomitant low-connectivity network.
Figure 7. Country-based collaboration network of antibiotic R&D.
Note: The network was generated and transformed by the location identifica-
tion of institutions involved in collaborative R&D. The nodes represent
the countries involved in collaborative projects.

106 107
3.4 Country-based Collaboration Network in Antibiotic R&D
The country-based collaboration network (Figure 7), transformed by the location identi-fication of participants involved in collaborative R&D, represents the global landscape of partnerships in antibiotic development between countries. There are 40 countries with 117 weighted ties between them, combined together to form a connective network (only one component in the network).
As shown in Figure 7, the USA and Japan occupy the central position and have the tight-est internal collaboration and the most extensive international partnerships, measured in global co-projects. Compared to the USA, Japan takes part in a higher number of interna-tional collaborative projects, primarily through partnership with the USA. Some European countries (Germany, Switzerland, UK, Italy, France, and Spain), Canada, and South Korea form the core group of the collaboration network through their connections with the USA and Japan, as well as amongst themselves. The partnerships involving these countries (in-cluding the USA and Japan) make up more than 90% of the connections in the entire col-laboration network. Developing countries are established in the outer layer of the network and generally participate in international collaboration with members of the core group; few connections exist among the developing countries themselves. This may be attributed to their inadequate capacity for antibiotic development, a factor which also accounts for their tendency to focus on marketing, distribution, and in-licensing activities when coop-erating with others.
Similar to the institutional network, a shrunken country-based collaboration network was generated to observe the partnerships between nations after the year 2000 (Figure 8). The network contains 29 out of the 40 countries: 11 countries have not been involved in global collaboration in antibiotic R&D since 2000. Almost all of those 11 countries are develop-ing nations. The collaborative R&D did not insist in the dwindling antibiotic R&D activities even in the wave of globalization in the 21st century. After 2000, the USA took on an even more central role as Japan lost its critical position. Meanwhile, the rest of the core group collapsed. The USA was involved in more than 70% of the post-2000 collaborative rela-tionships. As such, the joint resources of antibiotic R&D were too concentrated in the USA, causing other countries to suffer from a scarcity of connections.
Figure 8. The country-based collaboration network according to co-projects launched after the year 2000

108 109
4. Discussion
The recent shortfall of antibiotic R&D stems from economic, regulatory, and scientific ob-stacles, a problem which has been exacerbated by growing bacterial resistance18-20. One of the possible solutions to combat bacterial resistance is the renewal of the depleted pipe-line of fresh antibacterial agents with new chemical classes or antibacterial mechanisms. An overview of collaboration on antibacterial R&D is valuable for making informed deci-sions and strategies to improve antibiotic R&D. In this study, the collaborative landscape of antibiotic research was measured by co-projects and collaboration networks in antibiotic R&D. This not only illustrates the comprehensive situation regarding modern collabora-tion, but also reveals the relationships of involved actors in antibiotic development.
There was still a greater number of non-collaborative projects in antibiotic R&D than col-laborative ones; most of partnerships that were established dealt with licensing activities instead of early co-developing activities. Many institutions from developing countries were called upon to facilitate the global marketing and distribution of drugs, which also explained the inactive interaction after 2000, when only a few new drugs were marketed or in late-stage development. This kind of cooperation is of little help to the decreasing effect of existing antibiotics as little effort is being put into early innovation and new drug development. Since academic research has traditionally been the home of research inno-vation and its purveyors are the powerhouses of innovative, target-based drug discovery and fundamental knowledge, public-private partnerships have a significant role to play in addressing specific issues in access to drugs21. However, the infrastructure of antibiotic discovery in both academia and industry has fallen to a dangerously low level18. Translation of new ideas from academia into a marketable antibiotic is difficult, time-consuming, and expensive. This gap can be filled by encouraging entrepreneurs or collaborators to facili-tate development. One of the industry incentives being considered is encouraging open source approaches and rewarding collaborative agreements with a public or quasi-public organization. All the stakeholders, including the industry, government, and research in-stitutions, need to consider effective strategies for sustaining the new antibiotic develop-ment capabilities brought forward by academia.
While biotechnology companies and SMEs have long been involved in partnerships in the general drug development field, they also offer new ideas for antibiotic discovery. Trans-lation of ideas into preclinical development is something that such enterprises often do well, and some can take the ideas forward into early stage clinical trials, as indicated by the large percentage of preclinical projects available for partnering in our dataset. To encour-age this, a new grant-giving branch should be proposed and the creation of a new system
of loans for SMEs in antibiotic development is also necessary18. The organization support-ing this sort of collaboration should be built up at a national or international level to bring together companies that are actually dedicated to antibiotic R&D.
Large corporations took important positions not only in the collaboration network of an-tibiotic R&D, but also in non-collaborative projects which relied on in-house efforts, col-laborations with academia, buying or investing in SMEs, or mergers with other large phar-maceutical companies. Worth noting is the influence of frequent mergers and acquisitions (M&A) on antibiotic R&D. From a business perspective, M&A are often considered to be attractive as they remove duplication, reduce costs, and produce synergy22. However, it has been suggested that major mergers not only make cuts to R&D, but eliminate entire re-search sites23. After a major merger, the rate of progress of compounds in the development pipeline is dampened as the acquirers discuss which R&D programs should be integrated or discontinued. The initial focus is on the phase III trials, followed by mid-stage agents, with the early-stage programs handled last. Thus, early-stage R&D is slowed. Furthermore, the acquired resources would likely be re-purposed to fit the development strategies of the new corporation. Large companies also tend to reduce their investment in other phar-maceutical companies.
Developing countries, or low-and-middle-income countries, face a grim situation regard-ing antibiotic resistance due to their frail healthcare systems, poor awareness and surveil-lance, low levels of involvement in antibiotic research, and high susceptibility to bacterial infectious diseases24, 25. Our results show that developing countries are located in out-layer positions in the global collaboration network on antibiotic R&D, a situation which has only gotten worse in light of the recent decline in R&D activities and the tendency to exclude developing countries from global collaborative R&D. The European and Developing Coun-tries Clinical Trials Partnership (EDCTP), formed in 2003 (and the later EDCTP-2 in 2014), is an important program that responds to antibiotic resistance by fostering collaboration and drugs’ clinical development via partnerships between European and African countries. Multinational projects and collaboration among relevant shareholders, including indus-try, research organizations, product development partners, and funders, were showcased to raise awareness. These networking activities could be improved through funding from multinational projects and strengthened scientific capacity in endemic countries.
The World Health Organization’s (WHO) Global Action Plan on Antimicrobial Resistance was endorsed in 2015. This plan called for global-scale participation in combating the spread of antimicrobial resistance, as, “without harmonized and immediate action on a global scale, the world is heading towards a post-antibiotic era in which common infections could once

110 111
again kill.” One of its strategic objectives is to develop an economic case for sustainable investment, which aims to support effective and sustainable antibiotic development. Un-der this plan, member states are encouraged to participate in international collaboration and to promote partnerships between research institutions in developed and developing countries, strengthening existing and creating new public-private partnerships, investi-gating natural sources of biodiversity and biorepositories for developing new antibiotics, and piloting innovative ideas for financing R&D in order to encourage investment and en-sure access to new products. In this framework, developing countries need to implement national action plans on antimicrobial resistance in collaboration with others to enhance their R&D capabilities, helping them learn to face challenges both global and endemic.
As the largest developing country, China has been involved in the global collaboration network on antibiotic R&D partnering with the USA, Japan, South Korea, Italy, Taiwan, and Hong Kong. However, the partnerships were particularly weak, moving China to the pe-riphery of the collaboration network, and China was continuously elbowed out the net-work with fewer partnerships after the year 2000. Concurrently, the prevalence of antimi-crobial resistance to several bacteria in China rose from 1999-200626. Data in 2011 showed that 70% of Chinese inpatients used antibiotics, and the average consumption of antibi-otics per capita in China is ten times that in the United States. The proper and effective use of antibiotics, as well as available and timely information on antimicrobial resistance, must be presented by the government and understood by the public. Since the Major New Drug Innovation Program (MNDIP) of China started in 2009, the government has invested a great deal of money in improving new drug research and development. At the same time, large international pharmaceutical corporations tend to set up R&D centers in China or collaborate with Chinese research institutions to accelerate new drug innovation and enhance their market share in China. In this encouraging environment of new drug inno-vation, China should pay more attention to new antibiotic research and development to combat the growing challenge of antimicrobial resistance.
References
1. Power E. Impact of antibiotic restrictions: the pharmaceutical perspective. Clinical Microbiology and Infection. 2006; 12(Suppl 5): 25-34.
2. Infectious Diseases Society of America. Facts about Antibiotic Resistance. April 4, 2015. http://www.idsociety.org/AR_Facts/#sthash.Yln0D8jP.dpuf.
3. Hawkey PM. The growing burden of antimicrobial resistance. Journal of Antimicrobi-al Chemotherapy. 2008; 62(Suppl 1): i1–i9.
4. Spellberg B, Bartlett J, Wunderink R, et al. Novel approaches are needed to develop tomorrow’s antibacterial therapies. American Journal of Respiratory and Critical Care Medicine. 2015; 191(2): 135–140.
5. So AD, Gupta N, Brahmachari SK, et al. Towards new business models for R&D for novel antibiotics. Drug Resistance Updates. 2011; 14(2): 88–94.
6. Bax R, Green S. Antibiotics: the changing regulatory and pharmaceutical industry par-adigm. Journal of Antimicrobial Chemotherapy. 2015; 70(5): 1281-1284.
7. Rex JH, Goldberger M, Eisenstein BI, et al. The evolution of the regulatory framework for antibacterial agents. Annals of the New York Academy of Sciences. 2014; 1323: 11–21.
8. Silver LL. Challenges of antibacterial discovery. Clinical Microbiology Reviews. 2011; 24(1): 71–109.
9. Chesbrough HW. Open innovation: The new imperative for creating and profiting from technology. Boston: Harvard Business Press, 2003.
10. Official website of IMS Health. http://www.imshealth.com11. Dekker AH. Centrality in social networks: theoretical and simulation approaches. Pro-
ceedings of Sim TecT. 2008; Melbourne, Australia: 33-38.12. Bastian M, Heymann S, Jacomy M. Gephi: an open source software for exploring and
manipulating networks. International AAAI Conference on Weblogs and Social Media, 2009.
13. Goozner M. The $800 Million Pill: The Truth behind the Cost of New Drugs, California University Press, Berkeley, CA, 2004.
14. Reed SD, Laxminarayan R, Black DJ, et al. Economic issues and antibiotic resistance in the community. Annals of Pharmacother. 2002; 36: 148–154.
15. Hogberg LD, Heddini A, Cars O. The global need for effective antibiotics: challenges and recent advances. Trends in pharmacological sciences. 2010; 31(11): 509-515.
16. Tralau-Stewart CJ, Wyatt CA, Kleyn DE, et al. Drug discovery: new models for indus-try-academic partnerships. Drug Discovery Today. 2009; 14: 95–101.
17. So AD, Shah TA. New business models for antibiotic innovation. Upsala Journal of Medical Sciences. 2014; 119: 176–180.

112 113
18. Laxminarayan R, Duse A, Wattal C, et al. Antibiotic resistance-the need for global solu-tions. The Lancet Infectious Diseases. 2013; 13(12): 1057-1098.
19. Nathan C, Goldber FM. The profit problem in antibiotic R&D. Nature Reviews Drug Discovery. 2005; 4(11): 887-891.
20. Brogan DM, Mossialos E. Incentives for new antibiotics: the options market for antibi-otics (OMA) model. Globalization and Health. 2013; 9(11): 58.
21. DiMasi JA, Hansen RW, Grabowski HG. The price of innovation: new estimates of drug development costs. Journal of Health Economics. 2003; 22(2): 151–185.
22. Paul SM, Mytelka DS, Dunwiddie CT, et al. How to improve R&D productivity: the phar-maceutical industry’s grand challenge. Nature Reviews Drug Discovery. 2010; 9(3): 203–214.
23. LaMattina JL. The impact of mergers on pharmaceutical R&D. Nature Reviews Drug Discovery. 2011; 10(8): 559-560.
24. Okeke IN, Laxminarayan R, Bhutta ZA, et al. Antimicrobial resistance in developing countries. Part I: recent trends and current status. The Lancet Infectious Diseases. 2005; 5: 481–493.
25. Okeke IN, Klugman KP, Bhutta ZA, et al. Antimicrobial resistance in developing coun-tries. Part II: strategies for containment. The Lancet Infectious Diseases. 2005; 5: 568–580.
26. Su X, Jiang F, Qimuge, et al. Surveillance of antimicrobial susceptibilities in Neisseria gonorrhoeae in Nanjing, China, 1999–2006. Sexually Transmitted Diseases. 2007; 34: 995–999.

114 115
Chapter 6
ENTRY INHIBITORS FOR AIDS THERAPY: A REVIEW OF RESEARCH AND DEVELOPMENT PROJECTS
Xiangjun Kong, Hongyu Liang, Qingwen Yuan, Yuanjia Hu*
State Key Laboratory of Quality Research in Chinese Medicine, Institute of Chinese Medical Sciences, University of Macau, Macau SAR, China
*Corresponding author: [email protected]

116 117
Abstract
The HIV (human immunodeficiency virus) entry process, the first step of the HIV replication cycle, plays a significant role in the subsequent viral infections and human immune system collapse. Virus binding and entrance into the host cell involves multiple steps, including viral attachment, co-receptor interactions, and membrane fusion. This sequence of events offers several potential targets for therapeutic interference. Some antiretroviral drugs that interact with different targets involved in the entry process have been tested in various phases, but only two of them were approved for clinical application. This study attempts to provide an overall research and development (R&D) landscape of HIV entry inhibitors by reviewing relevant projects (78 projects were collected for this study). The entry inhibitors have been divided into three classes based on their functional targets: attachment inhibi-tors, co-receptor inhibitors, and fusion inhibitors. The development profiles are integrated to provide a clinical overview of entry inhibitors. Furthermore, the performance of each class of inhibitor in clinical trials is summarized to demonstrate their specific roles in an-ti-HIV therapy.
1. Background
Human Immunodeficiency Virus (HIV), especially type I, is the main cause of acquired im-munodeficiency syndrome (AIDS), which has become a serious medical and public health problem throughout the world. Since 1981, approximately 78 million people have been infected with HIV and an estimated 39 million people died due to HIV infection or AIDS. Al-though various precautionary measures and active antiretroviral treatments have reduced the number of new infections and deaths every year, the number of people infected with HIV increased from 32 million to about 37 million in 2014. Currently, nearly 30 drugs with various action mechanisms have been approved for treating HIV infection or AIDS. These have helped to improve the quality of life and extend the lifespan of HIV-positive patients while simultaneously lowering the rates of virus transmission. However, without a normal immune function and system, patients still suffer from comorbidities including cardio-vascular disease, bone disorders, and cognitive impairment1. If the virus is not eliminated completely, viral replication and progression often causes AIDS to re-emerge as antiret-roviral therapies are interrupted2. R&D activities are being undertaken to create new and more effective anti-HIV drugs with fewer side effects, more convenient administrations, and stronger ability to overcome resistant viral strains.
HIV is a virus capable of infecting non-dividing cells with a certain incubation period. The
life cycle of HIV replication can be divided into several steps, including viral binding and entry, un-coating, reverse transcription, integration of newly transcribed viral DNA into the host DNA, transcription of viral proteins, assembly, and budding. The first step of the repli-cation cycle is the entry of HIV to the host cell, which starts with the adhesion of the virus and ends with the fusion of the membranes of the host cell and virus, implanting the viral core into the cytoplasm and triggering the subsequent replication events. Drugs targeting virus entry, known as entry inhibitors, can act independently from the intracellular access, which makes entry an attractive intervention point in preventing HIV.
The virus binding to the target cell is mediated either by viral envelope (Env) proteins, comprised of gp120 and gp41 subunits, or host cell membrane proteins. The complicated series of protein-protein interaction in the entry process is comprised of several phases3. Firstly, the Env glycoprotein gp120 attaches to its primary receptor on the host cell, CD4. This binding leads to conformational changes of variable loops of gp120 and the forma-tion of a bridging sheet, allowing for the engagement of a co-receptor. Secondly, the co-re-ceptor, CCR5 or CXCR4, binds, a process which induces the exposure and insertion of gp41 fusion peptide into the host cell membrane. Thirdly, viral and host membranes tether to-gether, mediated by Env, via the formation of a six-helix bundle of gp41, which brings the opposing membranes into close apposition and opens the membrane fusion pore. Then, the membrane fusion complete, the viral contents can enter into the host cell cytoplasm. These three phases are all potential targets for HIV entry inhibitors. Entry inhibitors can be divided into three classes based on which phase they target: 1) gp120-CD4 binding inhibi-tors, or attachment inhibitors, 2) co-receptor inhibitors, and 3) fusion inhibitors. Enfuvirtide and maraviroc, targeting the HIV entry process, have already been approved by the Food and Drug Administration (FDA) in 2003 and 2007 for the treatment of experienced pa-tients. With the emergence of virus strains that are resistant to existing protease inhibitors and reverse transcriptase, entry inhibitors have arisen at an opportune time.
A growing number of entry inhibitors are currently under clinical development. Recently, there have been several studies discussing the advances of entry inhibitors, which provide a general understanding of some potential agents in R&D4, 5. However, the overall R&D landscape of entry inhibitors is still unclear. This study systematically reviews the available HIV entry inhibitors from the perspectives of different R&D projects in an attempt to pro-vide an overall understanding of the development of entry inhibitors.

118 119
2. Data Retrieval
The R&D projects regarding HIV entry inhibitors were collected from the IMS R&D Focus database, which offers fine-grained scientific and commercial information with a weekly update on the international pharmaceutical research and development industry. The da-tabase collects information from governmental agencies, industry conferences, analyses of issued patents and scientific publications, and by maintaining contact with scientists and managers in focal firms. It is a powerful tool to evaluate the progress of R&D pipelines, from drug discovery to marketing. The data of this study was retrieved by searching the database with “J5C4 (HIV entry inhibitor)” in the class code field; it returned 78 projects in different clinical phases targeting the HIV entry process. Information related to these projects was also obtained and organized, including product name, company information, phases of development, action of mechanisms, and R&D progress. The observation of the outcomes of these projects ended in December 2015.
Based on the actions of their agents, the R&D projects were divided into four categories: attachment inhibitors, co-receptor inhibitors, fusion inhibitors, and others. The specific target of each drug was also identified, and as an important part of this research, R&D progress on agents that were designed against the key targets of the entry process was summarized and discussed.
3. Entry Inhibitors in R&D
3.1 Profile of Drug Development
Given the search principle described above, there are 78 means that can be used to pre-vent HIV virions from entering human cells. Each one experienced different development phases, from discovery to the marketing stage, as seen in Figure 1. Nearly half (45%) of the projects are in the preclinical phase, an early phase in drug development that takes place before a drug is tested on people. 16 projects were discontinued, 20% of all the entry in-hibitors in the study. The number of projects in the discovery, preclinical, and discontinued stages makes up more than three-quarters of all the studied entry inhibitors, suggesting that huge amounts of effort and remarkable risks are present in the activities required to develop effective drugs. There are also 16 agents in clinical phases, or, to be more precise, there are 8 in clinical phase I, 5 in phase II, and 3 in phase III. Only two entry inhibitors have been approved for marketing by the US FDA. The first is enfuvirtid, and the other is maravi-roc, both of which will be discussed in the following sections.
Figure 1. Development stages of HIV entry inhibitors in pipelines
Since the actions of the anti-HIV entry process are divided into four types, the action dis-tribution of the R&D projects was illustrated in Figure 2, accompanying information on the drugs’ targets. What should be noted is that the projects in the discovery phase have been excluded because those programs, as defined by the database, have no lead compounds identified. Therefore, 69 projects with specific lead compounds were analyzed in the sub-sequent discussion. As shown in Figure 2, half of the HIV entry inhibitor projects with lead compounds are co-receptor inhibitors, which mainly target CCR5 and CXCR4. Among them, 27 projects are CCR5 inhibitors. The other three actions, attachment inhibitors, fu-sion inhibitors, and others, are less frequently developed, almost equally splitting the oth-er half of the projects among themselves. The developed attachment inhibitors include 8 drugs that target gp120 and 4 agents targeting CD4. All 11 of the fusion inhibitors target Env gp41, though via different strategies. The category of “others” contains drug actions that could not be associated with specific HIV entry phases, like glycosphingolipid com-pounds. Thus, this kind of inhibitor is not included in the scope of the following analysis.

120 121
Figure 2. Target distribution of HIV entry inhibitors in different actions
Figure 3 synthesizes information from diverse perspectives to offer an integrated drug development profile of entry inhibitors with those in preclinical stages in the outer layer, those in clinical development in the middle, and marketed drugs in the center. The ca-pacity for inhibitors shrinks from layer to layer as the clinical process moves on. The two FDA-approved drugs, enfuvirtid and maraviroc, function as a fusion inhibitor and CCR5 co-receptor inhibitor respectively. There is an attachment inhibitor (ibalizumab), a CCR5 inhibitor (PRO-140), and a fusion inhibitor (albuvirtide) currently in phase III clinical testing, whereas CXCR4 co-receptor inhibitors are still in early phases of studies. Only one agent of a CXCR4 inhibitor, AMD-070, has been pushed into phase II development; others have either been discontinued or are still under preclinical study.
Anti-HIV entry agents are mostly developed as small molecules or peptide/protein-based inhibitors administered orally or via injection, whereas agents like 5P12 RANTES, a CLL5 analogue, are vaginally administered in early-phase testing. Some entry inhibitors are for-mulated as fixed-dose combinations and exhibit synergistic effects when combined with other anti-AIDS drugs.
Figure 3. Therapeutic agents against distinct targets of HIV entry process in each clinical phase
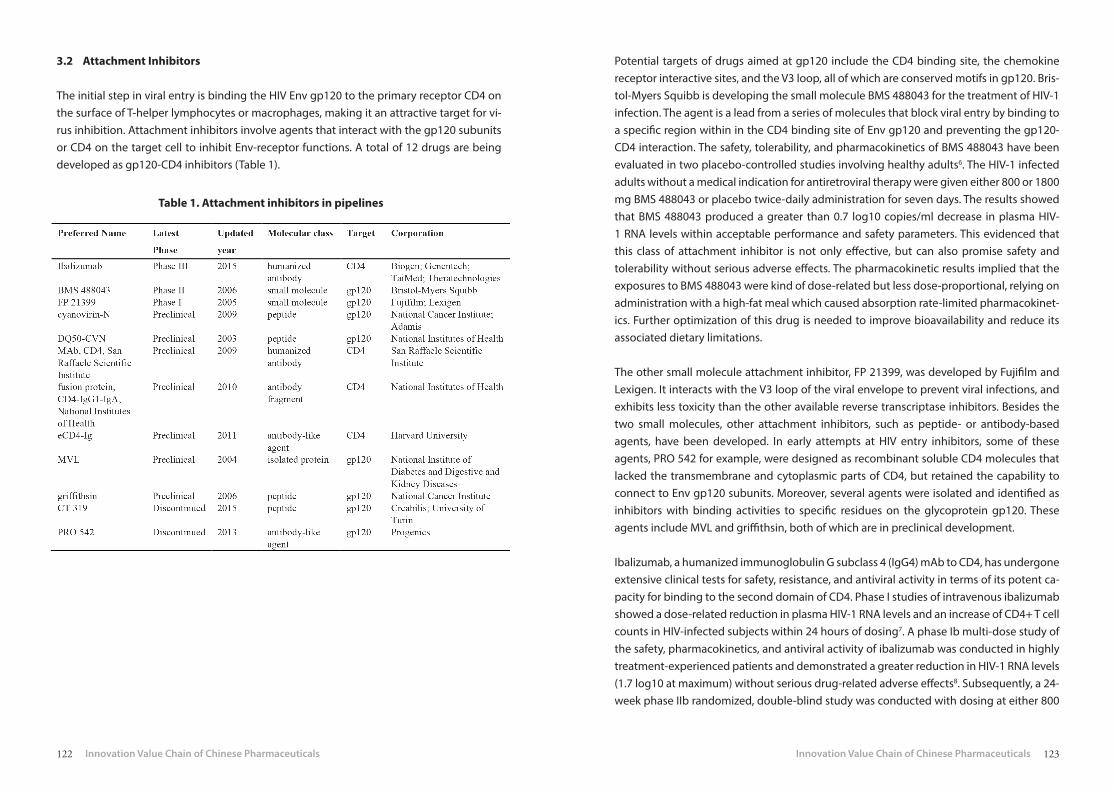
122 123
Table 1. Attachment inhibitors in pipelines
3.2 Attachment Inhibitors
The initial step in viral entry is binding the HIV Env gp120 to the primary receptor CD4 on the surface of T-helper lymphocytes or macrophages, making it an attractive target for vi-rus inhibition. Attachment inhibitors involve agents that interact with the gp120 subunits or CD4 on the target cell to inhibit Env-receptor functions. A total of 12 drugs are being developed as gp120-CD4 inhibitors (Table 1).
Potential targets of drugs aimed at gp120 include the CD4 binding site, the chemokine receptor interactive sites, and the V3 loop, all of which are conserved motifs in gp120. Bris-tol-Myers Squibb is developing the small molecule BMS 488043 for the treatment of HIV-1 infection. The agent is a lead from a series of molecules that block viral entry by binding to a specific region within in the CD4 binding site of Env gp120 and preventing the gp120-CD4 interaction. The safety, tolerability, and pharmacokinetics of BMS 488043 have been evaluated in two placebo-controlled studies involving healthy adults6. The HIV-1 infected adults without a medical indication for antiretroviral therapy were given either 800 or 1800 mg BMS 488043 or placebo twice-daily administration for seven days. The results showed that BMS 488043 produced a greater than 0.7 log10 copies/ml decrease in plasma HIV-1 RNA levels within acceptable performance and safety parameters. This evidenced that this class of attachment inhibitor is not only effective, but can also promise safety and tolerability without serious adverse effects. The pharmacokinetic results implied that the exposures to BMS 488043 were kind of dose-related but less dose-proportional, relying on administration with a high-fat meal which caused absorption rate-limited pharmacokinet-ics. Further optimization of this drug is needed to improve bioavailability and reduce its associated dietary limitations.
The other small molecule attachment inhibitor, FP 21399, was developed by Fujifilm and Lexigen. It interacts with the V3 loop of the viral envelope to prevent viral infections, and exhibits less toxicity than the other available reverse transcriptase inhibitors. Besides the two small molecules, other attachment inhibitors, such as peptide- or antibody-based agents, have been developed. In early attempts at HIV entry inhibitors, some of these agents, PRO 542 for example, were designed as recombinant soluble CD4 molecules that lacked the transmembrane and cytoplasmic parts of CD4, but retained the capability to connect to Env gp120 subunits. Moreover, several agents were isolated and identified as inhibitors with binding activities to specific residues on the glycoprotein gp120. These agents include MVL and griffithsin, both of which are in preclinical development.
Ibalizumab, a humanized immunoglobulin G subclass 4 (IgG4) mAb to CD4, has undergone extensive clinical tests for safety, resistance, and antiviral activity in terms of its potent ca-pacity for binding to the second domain of CD4. Phase I studies of intravenous ibalizumab showed a dose-related reduction in plasma HIV-1 RNA levels and an increase of CD4+ T cell counts in HIV-infected subjects within 24 hours of dosing7. A phase Ib multi-dose study of the safety, pharmacokinetics, and antiviral activity of ibalizumab was conducted in highly treatment-experienced patients and demonstrated a greater reduction in HIV-1 RNA levels (1.7 log10 at maximum) without serious drug-related adverse effects8. Subsequently, a 24-week phase IIb randomized, double-blind study was conducted with dosing at either 800

124 125
mg every 2 weeks or 2000mg every 4 weeks, which were well tolerated and resulted in sig-nificant viral load reductions over 24 weeks9. All data supports the continued development of ibalizumab as a potent method to combat HIV infection. Recently, ibalizumab’s develop-er has entered a 12-year collaboration with Theratechnologies to co-develop, market, and distribute ibalizumab in the US and Canada, which should accelerate the remaining clinical studies and encourage effective application of the drug.
3.3 Co-receptor Inhibitors
Following the virus’ attachment to the host cell surface by CD4 binding, Env interacts with a co-receptor to mediate HIV infections. Inhibitors of co-receptor interactions are a broad category of HIV entry inhibitors, which use proteins, small molecules, and monoclonal an-tibodies to obstruct functional Env-co-receptor interactions. HIV-1 isolates can be distin-guished, based on their chemokine co-receptor usage, into three classes: R5 viruses using CCR5, X4 viruses using CXCR4, and R5/X4 strains using both CCR5 and CXCR4. R5 strains predominate in the early development HIV and are mainly responsible for viral transmis-sion between HIV-infected patients, while X4 and R5/X4 are rare in early stages of the dis-ease and evolve in later stages. The R5 strains ultimately evolve into X4 or R5/X4 isolates in nearly 50% of HIV-1 positive individuals, leading to faster disease progression10.
3.3.1 CCR5 Co-Receptor Inhibitors
CCR5 is considered an appealing target in ccr5 32 homozygote individuals (32 base pair deletion in both copies of ccr5 gene) without being effectively CCR5-negative. There are 26 agents that have been developed as CCR5 co-receptor inhibitors in various clinical phas-es (Table 2). The approaches used include CCR5 small molecule antagonists, CCR5 mon-oclonal antibodies, and covalently modified natural CCR5 ligands. Among them, only a small-molecule CCR5 antagonist, maraviroc, is currently approved for clinical use. Several orally available compounds, cenicriviroc, ancriviroc, TBR 220, and INCB 15050, are currently undergoing phase I or III clinical trials. A few agents have been discontinued after pro-gressing into the late clinical phases, such as aplaviroc (discontinued in phase III), vicriviroc (discontinued in phase III), and INCB 9471 (discontinued for licensing in phase IIa). These achievements on small molecule CCR5 antagonists demonstrate their promise as thera-peutic antiviral drugs
Maraviroc, developed by ViiV Healthcare, a company set up by combining HIV/AIDS thera-py businesses of GlxoSmithKline and Pfizer, is an orally bioavailable CCR5 antagonist with potent in vitro and in vivo anti-HIV-1 activity against R5 viruses in low nanomolar concen-trations11. The antiviral efficacy of maraviroc was determined in a pair of phase III rand-omized, placebo-controlled trials (MOTIVATE 1 and 2) 11, 12. The US FDA approved maraviroc under the brand name Selzentry for treating treatment-experienced adults infected with CCR5-tropic HIV-1 in combination with other antiretroviral agents.
Table 2. CCR5 co-receptor inhibitors in different development stages

126 127
Cenicriviroc, developed by Tobira, can effectively target both CCR2 and CCR5 simultane-ously by performing antiretroviral and anti-inflammatory activities. It is dosed once daily and has a longer half-life than maraviroc. The phase I and phase IIa studies of cenicriviroc identified a significant reduction in plasma HIV-1 RNA levels (up to 1.8 log10) without se-rious adverse events13, 14. A 48-week randomized phase IIb study has recently been com-pleted. Cenicriviroc showed efficacy and favorable safety performance in treatment-naive HIV-1-infected adults with the R5 virus, results which support the subsequent phase III studies15.
Orally bioavailable small molecules might have the most therapeutic potential as co-re-ceptor inhibitors given their application convenience and advantage in production cost as compared to monoclonal antibodies (mAb) and chemokine derivatives. However, broad and potent neutralizing monoclonal antibodies to HIV-1 entry targets are identified at an accelerated rate for their effective and long-lasting anti-virus performance.
PRO 140 is a humanized IgG4 mAb directed to a complex epitope comprising multiple ex-tracellular domains on CCR5. A phase I study in HIV-1 infected individuals demonstrated a 1.7 log10 mean reduction in plasma HIV-1 RNA levels at doses of under 5mg/kg with no se-rious adverse events16. A phase IIa study was subsequently initiated to assess the antiviral activity, tolerability, and pharmacokinetics of weekly or biweekly doses of PRO 140, which showed that this agent demonstrated potent and prolonged antiretroviral activity and was generally well tolerated without serious drug-related adverse effects17. Additionally, PRO 140 proved active against HIV strains resistant to small-molecule CCR5 co-receptor inhibi-tors such as maraviroc18. In August 2015, the developer CytoDyn initiated an open-enroll-ment 25-week phase III study of PRO 140 for treating HIV-1 infection.
One of the significant concerns in CCR5 antagonist therapy is the potential of drug im-mune modulation resulting in the promotion of emergence of X4 virus strains, which would advance the progression of the disease. R5 viruses could adapt to use CXCR4 to es-cape inhibitors that hinder CCR5 binding19. For example, the virus’ failure to maraviroc was related to the increased prevalence of X4 strains in 57% of tested individuals as a repeat tropism test at the time of failure12. Furthermore, individuals with R5/X4 strains at baseline who were dosed maraviroc achieved a lower virologic response and smaller CD4 increase as compared to CCR5-usage individuals12. Careful monitoring of co-receptor tropism is cer-tainly required in the evaluation of the clinical efficacy of CCR5 inhibitors.
3.3.2 CXCR4 Co-Receptor Inhibitors
CXCR4 is also a potential co-receptor target for antiretroviral intervention with a distinct development profile from CCR5 inhibitors. Table 3 lists the agents of CXCR4 antagonists in different pipeline stages; all 7 of the agents were developed as small molecules.
AMD 070, an orally bioavailable AMD 3100 derivative developed by AnorMED (now Gen-zyme), is under clinical study due to its potent anti-HIV activities. Results from an open- la-bel, dose-escalation phase I trial of 30 healthy volunteers demonstrated that AMD 070 was a safe, well-tolerated drug20. A phase Ib/IIa XACT (X4 Antagonist Concept Trial) trial of AMD 070 in subjects with HIV infection has since been initiated. Before the study on AMD 070, AMD 3100 was a bicyclam compound first shown inhibition on T-cell-tropic HIV strains, but its development for HIV therapy had been halted because of its adverse effects and lack of oral absorption21. There are several analogs to AMD 3100 that were developed as active CXCR4 antagonists still in preclinical studies, such as AMD 3465 and AMD 8664.
There are fewer relevant development studies on CXCR4 inhibitors than on CCR5 inhibitors due to the unavoidable challenges that exist in CXCR4 antagonist development. Consider-ing the essential functions of CXCR4 and its ligand SDF-1 in normal development in mice, CXCR4 inhibitors may interfere with this relationship and cause adverse consequences in humans. It is difficult to develop a CXCR4 antagonist that blocks HIV entry without disturb-ing any other CXCR4 down-stream signaling. On the other hand, X4 viruses usually emerge as co-receptor switches from R5 strains and exist as mixtures together with R5 viruses, so inhibiting just the X4 virus population may lead to disappointing therapeutic results. The
Table 3. CXCR4 co-receptor inhibitors in different development stages

128 129
combination of CCR5 and CXCR4 inhibitors could prove effective, although it is possible for viruses to adapt to use other alternate co-receptors. However, the development of CXCR4 inhibitors is still delayed in the early clinical phases.
Table 4. Fusion inhibitors (gp41 inhibitors) in different development stages
3.4 Fusion Inhibitors
Env gp41 plays a critical role in HIV entry by changing its conformation as a reaction to gp120 binding to CD4 and a co-receptor, which makes it an attractive target to prevent HIV entry. Peptides derived from the N-heptad repeats (NHRs) or C heptad repeats (CHRs) of the gp41 extracellular region have demonstrated potent HIV inhibitory activities by in-teracting with their counterpart regions in gp41. They are likely made by peptide synthesis or produced as recombinant peptides or proteins, depending on the length and stability in vivo. 9 out of 12 fusion inhibitors in pipelines are developed based on peptides (Table 4). One of these peptides, enfuvirtide (T-20), became the first and the only accredited success in this class of anti-HIV agents, approved by the US FDA in 2003.
Enfuvirtide, developed by Trimeris and Roche, is a 36-mer synthetic oligopeptide the se-quence of which is derived from residues 638–673 of the CHR region of the gp41 subunit. It blocks HIV-1 entry by impeding the interaction between CHR and NHR, thus resulting in the inhibition of a broad spectrum of HIV-1 isolates and suppression of viral replication in HIV-1 infected patients.
As viruses grew more resistant to enfivirtide, new generations of peptide fusion inhibi-tors and engineered T-20 sequences, have been developed to increase in vivo stability and NHR binding affinity and to overcome T-20 resistance. Tifuvirtide (T1249) was designed by Trimeris’ researchers as a second-generation HIV-1 fusion inhibitor following T-20. Ti-fuvirtide includes all the T-20 and C-34 binding domains and shows enhanced anti-HIV-1 activity against enfuvirtide-resistant viruses. It was studied in phase II clinical testing, but its development was terminated because of its side effects. Afterwards, Trimeris designed a third-generation peptide fusion inhibitor which was based on the C-38 sequence. An ex-ample of this kind of inhibitor is TRI-1144, which is expected to possess enhanced efficacy and a greater resistance profile than its predecessors. The development of TRI-114 is in a phase I clinical study.
Albuvirtide, chemically related to enfuvirtide, is a new peptide-based and the first long-act-ing HIV fusion inhibitor, and is being developed in phase III clinical study by Frontier Bio-tech. Its early clinical testing showed that albuvirtide had a potent and broad anti-HIV-1 activity with a much longer half-life than enfuvirtide22. Also, it was evaluated clinically when administrated under combination therapy with other antiretroviral agents (lopina-vir/ritonavir). The preliminary results showed the co-administration had little effect on al-buvirtide exposure, which provided basis for further evaluation23.
130 131
The primary limitations of peptide-based fusion inhibitors are their lack of oral bioavail-ability, the inconvenience of frequent administration by injection, and their high cost of production. Advances in fusion inhibitors are committed to overcoming these limitations. One of the most promising approaches is the design of effective small molecule inhibitors targeting gp41. Many efforts have been made to develop small molecule fusion inhibitors via molecular docking to design and synthesize agents or screen natural products and microbicide candidates, but there has been no significant improvement in their anti-HIV-1 potency. As exhibited in Table 4, only 3 small molecule fusion inhibitors are being devel-oped under preclinical studies. The challenge to find cheaper and effective drugs to over-come the limitations of existing peptide fusion inhibitors persists.
4. China’s Role in the Drug Development against HIV Entry
As the most populous country in the world, China faces a severe challenge in the prev-alence of HIV/AIDS despite a relatively low per capita infection rate. In 2013, there were more than 800,000 people living with HIV in China, and 28,000 people died of AIDS-related causes. Remarkable progress has been made in enhancing HIV prevention and improving treatment care and support in China in recent years24. As early as 2004, China established a unified, web-based HIV/AIDS information system, unique in the global society. China is an enormous market for antiretroviral drugs simply because of its huge population, a fact which gains it a great deal of attention from the global pharmaceutical industry. It also pro-vides the potential to improve China’s engagement in new HIV/AIDS drug development.
However, China exhibits a relatively low rate of adoption of entry inhibitors as compared to other classes of antiretroviral drugs or vaccines. There are two HIV entry inhibitor agents in pipelines based upon Chinese firms’ involvement: a CCR5 co-receptor inhibitor and a fusion inhibitor. The study of the CCR5 inhibitor, co-developed by TargetDrug (China) and Avexa (Australia), was discontinued. The fusion inhibitor albuvirtide, developed by Frontier Biotech (China), is under phase III evaluation in China. In addition, a phase III drug, ibali-zumab, is being developed by TaiMed’s manufacturing partner, the Shanghai-based WuXi PharmaTech (China). If approved, ibalizumab would be the first biologic product manufac-tured in China to be launched in the US market.
It is worth noting that medicinal herbs are being used in the treatment of HIV positive sub-jects and AIDS patients and being investigated intensely as sources of drug compounds in China. These practices seem like reasonable and effective means for HIV inhibition via dif-ferent actions, including hindering HIV entry process, as demonstrated in some studies25.
The Chinese government has set grants for the research and development of treatments for HIV infections from Chinese Traditional Medicines. Through this research, herb medi-cines may provide a fresh strategy to develop new entry inhibitors.
5. Conclusions
Although there are a variety of entry inhibitors with different targets being developed in pipelines, only two drugs, maraviroc and enfuvirtide, have been approved for clinical ap-plication. Resistance to these drugs is emerging, and there have been no new entry inhib-itors introduced to the market for nearly ten years. The success of entry inhibitors relies on a complete understanding of the biological basis of the HIV entry process, including the R5-to-X4 switch of tropism and the key protein structure of gp41. Currently, there are several potential entry inhibitors in clinical phases that have already achieved fine clinical results. These promising developments may provide new concepts in the management and prophylaxis of HIV infection in the coming years.

132 133
Reference
1. Phillips AN, Neaton J, Lundgren JD. The role of HIV in serious diseases other than AIDS. AIDS. 2008; 22(18): 2409-2418.
2. Deeks SG, Autran B, Berkhout B, et al. Towards an HIV cure: a global scientificstrategy. Nature Reviews Immunology. 2012; 12(8): 607-614.
3. Wilen CB, Tilton JC, Doms RW. HIV: cell binding and entry. Cold Spring Harbor Per-spectives in Medicine. 2012; 2(8).
4. Pang W, Tam SC, Zheng YT. Current peptide HIV type-1 fusion inhibitors. Antiviral Chemistry & Chemotherapy. 2009; 20(1): 1-18.
5. Henrich TJ, Kuritzkes DR. HIV-1 entry inhibitors: recent development and clinical use. Current Opinion in Virology. 2013; 3(1): 51-57.
6. Hanna GJ, Lalezari J, Hellinger JA, et al. Antiviral activity, pharmacokinetics, and safety of BMS-488043, a novel oral small-molecule HIV-1 attachment inhibitor, in HIV-1-in-fected subjects. Antimicrobial Agents Chemotherapy. 2011; 55(2): 722-728.
7. Kuritzkes DR, Jacobson J, Powderly WG, et al. Antiretroviral activity of the anti-CD4 monoclonal antibody TNX-355 in patients infected with HIV type 1. The Journal of Infectious Diseases. 2004; 189(2): 286-291.
8. Jacobson JM, Kuritzkes DR, Godofsky E, et al. Safety, pharmacokinetics, and antiretro-viral activity of multiple doses of ibalizumab (formerly TNX-355), an anti-CD4 mono-clonal antibody, in human immunodeficiency virus type 1-infected adults. Antimicro-bial Agents Chemotherapy, 2009; 53(2): 450-457.
9. Khanlou H, Gathe J, Schrader S, et al. Lewis S. Safety, efficacy, and pharmacokinetics of ibalizumab in treatment-experienced HIV-1 infected patients: a phase 2b study. Ab-stract presented at: 51st Interscience Conference on Antimicrobial Agents and Che-motherapy (ICAAC). 2011(Abstract H2-794b).
10. Moyle GJ, Wildfire A, Mandalia S, et al. Epidemiology and predictive factors for chemo-kine receptor use in HIV-1 infection. The Journal of Infectious Diseases. 2005; 191(6): 866-872.
11. Dorr P, Westby M, Dobbs S, et al. Maraviroc (UK-427,857), a potent, orally bioavailable, and selective small-molecule inhibitor of chemokine receptor CCR5 with broad-spec-trum anti-human immunodeficiency virus type 1 activity. Antimicrobial Agents Che-motherapy. 2005; 49(11): 4721-4732.
12. Fatkenheuer G, Nelson M, Lazzarin A, et al. Subgroup Analyses of Maraviroc in Previ-ously Treated R5 HIV-1 Infection. The New England Journal of Medicine. 2008; 359: 1422-1455.
13. Lalezari J, Gathe J, Brinson C, et al. Safety, efficacy, and pharmacokinetics of TBR-652, a CCR5/CCR2 antagonist, in HIV-1-infected, treatment-experienced, CCR5 antago-nist-naive subjects. Journal of Acquired Immune Deficiency Syndromes. 2011; 57(2): 118-125.
14. Marier JF, Trinh M, Pheng LH, et al. Pharmacokinetics and pharmacodynamics of TBR-652, a novel CCR5 antagonist, in HIV-1-infected, antiretroviral treatment-experienced, CCR5 antagonist-naive patients. Antimicrobial Agents Chemotherapy. 2011; 55(6): 2768-2774.
15. Thompson M, Saag M, DeJesus E, et al. A 48-week randomized phase 2b study eval-uating cenicriviroc versus efavirenz in treatment-naive HIV-infected adults with C-C chemokine receptor type 5-tropic virus. AIDS. 2016; 30(6): 869-878.
16. Jacobson JM, Saag MS, Thompson MA, et al. Antiviral activity of single-dose PRO 140, a CCR5 monoclonal antibody, in HIV-infected adults. The Journal of Infectious Dis-eases. 2008; 198(9):1345-1352.
17. Jacobson JM, Thompson MA, Lalezari JP, et al. Anti-HIV-1 activity of weekly or biweekly treatment with subcutaneous PRO 140, a CCR5 monoclonal antibody. The Journal of Infectious Diseases. 2010; 201(10): 1481-1487.
18. Pugach P, Ketas TJ, Michael E, et al. Neutralizing antibody and anti-retroviral drug sen-sitivities of HIV-1 isolates resistant to small molecule CCR5 inhibitors. Virology. 2008; 377(2): 401-407.
19. Mosier DE, Picchio GR, Gulizia RJ, et al. Highly potent RANTES analogues either pre-vent CCR5-using human immunodeficiency virus type 1 infection in vivo or rapidly select for CXCR4-using variants. Journal of Virology. 1999; 73(5): 3544-3550.
20. Stone ND, Dunaway SB, Flexner C, et al. Multiple-dose escalation study of the safety, pharmacokinetics, and biologic activity of oral AMD070, a selective CXCR4 receptor inhibitor, in human subjects. Antimicrobial Agents Chemotherapy. 2007; 51(7): 2351-2358.
21. Reeves JD, Piefer AJ. Emerging drug targets for antiretroviral therapy. Drugs. 2005; 65(13): 1747-1766.
22. Wu H, Yao C, Lu R, et al. Albuvirtide, the first long-acting HIV-1 fusion inhibitor, sup-pressed viral replication in HIV infected adults. The Inter-science Conference on Anti-microbial Agents and Chemotherapy, 2012. San Francisco: p. Abstract H-554.
23. Yang W, Xiao Q, Wang D, et al. Evaluation of pharmacokinetic interactions between long-acting HIV-1 fusion inhibitor albuvirtide and lopinavir/ritonavir, in HIV-infected subjects, combined with clinical study and simulation results. Xenobiotica. 2016; 1-11.
24. State Council AIDS Working Committee Office, United Nations Theme Group on AIDS in China. A joint assessment of HIV/AIDS prevention, treatment and care in China Bei-jing: China Ministry of Health, 2007.
25. Park IW, Han CR, Song XP, et al. Inhibition of HIV-1 entry by extracts derived from tradi-tional Chinese medicinal herbal plants. BMC Complementary and Alternative Med-icine. 2009; 9: 29.

134 135
Chapter 7
COLLABORATION NETWORKS FOR R&D OF MONOCLONAL ANTIBODIES :
AN ANALYSIS BASED ON PIPELINE PROJECTS
Tianhong Yin1, Xiangjun Kong2, Yitao Wang2, Xin Chen2, Yuanjia Hu2*, Rong Shao1*
1 School of International Pharmaceutical Business, China Pharmaceutical University, Jiangsu, China
2 State Key Laboratory of Quality Research in Chinese Medicine, Institute of Chinese Medical Sciences, University of Macau, Macau SAR, China
*Corresponding authors: [email protected]; [email protected]

136 137
Abstract
Monoclonal Antibodies (mAbs) have become a major class of biopharmaceutics for the treatment of major human diseases including cancers and autoimmune diseases. Conse-quently, the market for mAbs is the fastest-growing sector of the biopharmaceutical in-dustry. Cross-institutional and cross-country collaboration is increasingly important in the R&D (research and development) of therapeutic mAbs. We analyzed collaboration patterns by capturing collaborative relationships in mAb R&D. To this end, the network analysis, a promising method for defining and assessing complex collaborative relationships as shown previously by other investigators, has been employed. More specifically, our study aims 1) to visualize the overall institutional collaboration network; 2) to identify the key firms and the behavioral characteristics expressed in the network; 3) to investigate special collaboration patterns among the firms in the network; and 4) to detect the evolving pat-terns of R&D collaboration from a country-based perspective and understand the chang-ing positions of specific countries throughout the development period. The results of our analysis may help the stakeholders of mAb R&D to make decisions in seeking collaboration partners.
Keywords: Monoclonal antibodies; Research and development; Network analysis; Institu-tional collaboration network; Country-based collaboration network
1. Introduction
Monoclonal antibodies (mAbs) are identical antibodies produced by a single clone of im-mune cells and attack only specific target antigens. The first mAb for human therapeutic use (Orthoclone OKT3) was approved in 1986 by the U.S. Food and Drug Administration (FDA) for the treatment of acute kidney transplant rejection1. MAbs have become a major class of biopharmaceutical products for the treatment of cancers, autoimmune diseases, infectious diseases, transplantation, asthma, and etc. The market for mAbs is the fast-est-growing sector of the biopharmaceutical industry2, 3. In 2013, six of the top 10 best-sell-ing drugs were mAbs. The tremendous commercial potential drives the considerable worldwide research and development (R&D) activities on mAb clinical applications, and the traditional pharmaceutical industry, in addition to the young biotechnology sector, has shown much interest4.
With the rapid development of science and technology, the growing complexity of the drug discovery process, higher uncertainty surrounding R&D as well as the escalating costs
of innovation, conducting R&D of new drugs that relies completely on in-house efforts is becoming more difficult for firms. Scientific and technological breakthroughs are the result of the integration of contributions from multiple actors or sources5, 6. These partnerships are reflected in the “open innovation” model that describes innovative firms as increasingly utilizing ideas and knowledge provided by not only internal R&D but also a broad range of external sources and actors, including those located in foreign countries7. Thus, collab-oration, especially cross-institutional and cross-country collaboration, helps to access the required resources.
Figure 1 shows the annual rate of collaboration in mAb R&D and illustrates that the level of collaboration in R&D has been rising for the past 30 years, especially the last five years. Collaborative partnerships are playing an increasingly important part in the R&D process of mAbs and receiving more attention from developers. However, although many studies have reviewed the R&D of mAbs from the technology or market perspective2, 8, 9, few stud-ies have investigated the collaboration patterns of mAb R&D, which would be beneficial for understanding the R&D process and further help to accelerate the pace of innovation. Thus, we analyzed collaboration patterns by capturing collaborative relationships in mAb R&D. Network analysis, a promising method for disclosing and assessing complex collab-orative relationships, has been successfully employed in numerous studies10-12. In general, constructing and analyzing collaboration networks may provide an overall picture of the collaboration patterns in mAb R&D.
The current study differs from previous studies by shifting attention to the collaboration patterns in mAb R&D. The objectives of this study were as follows: first, to visualize the overall institutional collaboration network; second, to identify the key participants and the behavioral characteristics expressed in the network; third, to investigate special col-laboration patterns among the institutions in the network; and fourth, to detect the evolv-ing patterns of R&D collaboration from a country-based perspective and understand the changing positions of specific countries throughout the development period.
2. Methods
R&D collaboration has been empirically investigated by using various measurable indica-tors such as co-patents, co-publications, and R&D projects13-15. In this study, R&D projects were used to measure the collaboration in mAb R&D in terms of the importance of projects that reflect R&D collaboration, especially in the dramatically evolving technology fields.

138 139
IMS R&D Focus is a comprehensive, well-structured, and project-based database that mon-itors the progress of new active substances through the R&D pipeline, from the discovery phase to the marketing phase. A total of 2,441 pipeline projects on mAbs were retrieved by searching with the criteria “mechanism of action: monoclonal antibody” in the IMS R&D Focus database. The data is refined in institutional collaboration projects, which involve more than two institutions disclosed in the IMS R&D Focus database. The collaboration relationships in these projects are broad and varied, such as technology transfer, technol-ogy licensing, technology alliance, and joint R&D. In addition, information on institutions involved in the sampled collaborative projects and their geographic location was also col-lected.
Note: All projects in this study were gathered from IMS R&D Focus. For details, see the Meth-
ods section. The annual rate of collaboration was calculated with the following formula:
(the number of collaboration projects launched in year x / the total number of projects
launched in year x) / (2014-x); x refers to a specific year between 1985 and 2013.
Figure 1. Illustration of the annual rate of collaboration in mAb R&D from 1985 to 2013.
A full counting procedure was followed, that is, a project developed by n institutions pro-duced n*(n – 1)/2 links that can be counted16. For instance, for a project involving three institutions, three links were counted: between institution a and institution b, between institution b and institution c, and between institution a and institution c. The strengths of the institutional and accordingly country-based collaboration were calculated based on the accumulated project collaboration links. The data set in this study comprised 843 institutional collaboration projects launched from 1985 through 2013, involving 879 links between 530 institutions in 38 countries. The network analytic perspective was employed in this study to describe patterns of R&D collaboration. Social network analysis (SNA) is the mapping and measuring of relationships and flows between connected actors; it views relationships in terms of network theory consisting of nodes (also called vertices, points, or actors) and ties (also called edges, links, or connections). SNA enables us to identify and describe the general picture of collabora-tion in mAb R&D and to capture the role and position of a single institution and country in the network.
The set of relations within and between institutions, as measured with R&D partnerships in all pipeline mAb projects in the data sample, is a network in which nodes represent in-stitutions interconnected by edges that represent the collaborations within and between them. Similarly, an institutional collaboration network can be condensed into a coun-try-based collaboration network according to the geographic location of the institutions, where nodes represent countries and edges international partnerships based on institu-tional projects.
Within graph theory and network analysis, many indicators analyze the structural and to-pological characteristics of the network, as well as the roles of specific nodes. The centrality index has been widely adopted in studies of networks17; the index examines the promi-nence of a particular node, thus representing the extent to which a node is located at the center of the entire network. Various measures determine the centrality of a vertex, each of which has its own unique characteristics. This study focuses on four types of centrality measures: degree, weighted degree, betweenness, and eigenvector centrality. First, degree centrality is defined as the total number of edges connected to a node, and is interpreted as the extent or level of prestige a node in the network with regard to the number of con-nections the node has. However, weighted degree is used more often to understand the actual performance of a node as this measure counts not only the number of connections of a node but also the frequency of those connections. Second, the betweenness central-ity of a node is the fraction of geodesic paths between any pair of vertices on which this

140 141
vertex lies. It can be measured by the frequency of one node positioned on the shortest path between other groups of nodes arranged in pairs. Those nodes, which are located on the shortest paths between many nodes, therefore hold a key position for controlling the flow of information within the network (gatekeeper function). Third, the eigenvector cen-trality accords each vertex a centrality that depends on the number and the quality of the vertex’s connections by examining all vertices in parallel and assigning centrality weights that correspond to the average centrality of all neighbors. A high eigenvector centrality indicates that the node is connected to other nodes that also show many connections, as opposed to peripheral nodes.
3. Results
3.1 Collaboration Network for mAb R&D
The overall institutional collaboration network () of mAb R&D projects is visualized in Fig. 2; the network contains 530 nodes and 879 weighted edges. The top 25 players with the highest weighted degree centrality are labeled as such due to their influential roles in the network, and most are big pharmaceutical firms. Their central positions in the collabora-tion network in terms of layout strategy indicate broad and strong connections with other participants. In Table 1, the top 25 players in terms of degree, weighted degree, between-ness, and eigenvector centrality are extracted to understand their varied topological im-portance.
Some of the biggest pharmaceutical firms, such as Bristol-Myers Squibb, AstraZeneca, Roche, Sanofi, and GlaxoSmithKline, have the highest centrality values for all four centrality measures. These firms not only have the most extensive and intensive collaboration with their partners but are also prominent gatekeepers in the mAb R&D network and are linked to other central nodes. Some firms, such as Affitech and Peregrine, appear within the top rankings for only one centrality measure, a meaningful gatekeeper role via high between-ness centrality. Firms in the United States (US) and Europe are the dominant players and occupy the most important positions in degree, weighted degree, betweenness, and ei-genvector centrality due to their long history and strong background in drug research and development. Interestingly, in addition to US and European firms, Japanese firms exhibit a significant performance in the entire collaboration network of mAb R&D (e.g., Takeda, Daii-chi Sankyo, Kyowa Hakko Kirin, and Eisai), which is attributed to their broad partnership with leading nodes, such as Amgen, Roche, and Bristol-Myers Squibb.
Note: The nodes represent the institutions involved in collaboration projects. Edges represent
the collaboration relations and are weighted by the frequency of co-projects between
these participants. A node is surrounded by a loop if self-cooperation exists. Node size
is relative to the weighted degree centrality of an institution. The top 25 actors with the
highest weighted degree centrality are labeled in the network. Among them, four key
actors, AstraZeneca, Bristol-Myers Squibb, Roche, and Amgen, are colored. This network
was generated by Gephi, and the layout was determined with the Fruchterman–Reingold
algorithm. Thus, influential nodes are generally positioned at the center while nodes with
weaker connections are found on the periphery of the network18.
Figure 2. Institutional collaboration network for mAb R&D

142 143
Table 1. Top 25 institutions based on various centrality measures in the collaboration network for mAb R&D

144 145
3.2 Key Participants
Due to the diverse dominant positions and widest influence, cooperative partnerships among the leading institutions form the backbone of the collaboration network involved in mAb research and development. Therefore, the four remarkable performers, AstraZene-ca, Bristol-Myers Squibb, Roche, and Amgen, are key participants in the collaboration net-work. Their partnership profiles are shown in Fig. 3, and the relevant collaborative behavior is discussed.
Among the four key participants, Bristol-Myers Squibb collaborates with the highest num-ber of entities (highest degree, 57 partners), followed by AstraZeneca (53 partners), Roche (40 partners), and Amgen (37 partners). All have unique advantages as large firms in R&D collaboration since forming partnerships usually requires substantial administrative, orga-nizational, and monitoring support19.
The high betweenness centrality for Bristol-Myers Squibb and AstraZeneca (Table 1) sug-gests their superior gatekeeper roles in the overall collaboration network by essentially influencing the information flow and sharing of mAb R&D. The firms’ high eigenvector centrality denotes meaningful links with central nodes; in addition, these two firms are involved in important connections with peripheral participants (Fig. 3). Roche and Amgen have comparably low betweenness and eigenvector centrality, but a substantial difference in determining collaborative partners remains: Roche seems more connected to periph-eral institutions than to central ones, while Amgen, a big biopharmaceutical firm, is more willing to choose large firms as partners.
3.3 Collaboration Patterns among Institutions
A collaboration network consists of diverse collaborative relations among different types of participants. Thus, in order to conduct a preliminary and representative analysis of the col-laboration patterns in mAb R&D, we categorized the institutions in the network into three types: type 1 is big pharmaceutical firms; type 2 is small or young (biotechnology) firms, which refers to firms that specialize in biotechnology that are typically small or young and excludes big biopharmaceutical firms such as Amgen; and type 3 is research institutions, including universities and non-university public research institutions. Big pharmaceutical and biotechnology firms are the principal players in the collaboration network for mAb R&D for the development of applications for products.
Studies of alliances in the biopharmaceutical industry have shown that strategic collabo-ration between big pharmaceutical firms and small or young biotechnology firms is the most common type of collaboration20, and collaboration in mAb R&D is no exception. Al-most all of the big pharmaceutical firms involved in the collaboration network for mAb R&D maintain partnerships with biotechnology firms. These firms generally have dedicat-ed efforts to novel scientific technologies, whereas big pharmaceutical firms possess the complementary assets to promote and commercialize the product development of a mAb. Understanding the specific characteristics of biotechnology firms and big pharmaceutical firms could provide distinct sets of resources along the value chain to accelerate the R&D of mAbs.
In the collaboration network, research institutions (type 3) are involved in less than one-fifth of all collaborative partnerships and are mostly located in peripheral positions, since these research institutions have fewer connections to the central big pharmaceutical firms but construct close collaboration with type 2 institutions. Collaboration involving universi-ties or other public research institutions always brings upstream scientific discoveries from research institutions directly to downstream strategic partners, including big pharmaceu-tical firms and biotechnology firms, which attempt to advance the discoveries. Meanwhile, firms provide research funding for relevant institutions’ research.
There is broad and close collaboration among big pharmaceutical firms, which normally are big rivals, including the four key participants. A strategy of simultaneous cooperation and competition, referred to as co-opetition, exists between big pharmaceutical firms, such as the collaboration between Roche and AstraZeneca, AstraZeneca and GlaxoSmith-Kline, Bristol-Myers Squibb and GlaxoSmithKline, Sanofi and AstraZeneca, and Merck & Co and Johnson & Johnson. Most of these big pharmaceutical firms reside in the critical cen-tral positions of the overall collaboration network (Fig. 2). Collaboration with competitors may help firms address major technological challenges in the emerging high-tech field, create proportionately larger benefits for each other, and push advances in technological innovations, as these competing firms have relevant resources and face similar problems in developing mAbs21.

146 147
Figure 3. Four key participants and their partners in the collaboration network for mAb R&D
3.4 Country-Based Collaboration Network
The country-based collaboration network (Fig. 4), transformed by the geographic identifi-cation of firms and institutions involved in institutional collaboration networks, represents the global landscape of co-project partnerships in mAb R&D at the national level. There are 38 countries and 111 weighted links between the countries. The US occupies the cen-tral position and dominates global co-project partnerships, including within and between countries, followed by the United Kingdom (UK), Japan, Germany, Switzerland, and France, all of which have significant interactions with the US.
Figure 4. Country-based collaboration network for mAb R&D

148 149
As the complexity of new drug development and the global strategic market grow, the internationalization of R&D in the pharmaceutical sector has increased22, 23. To understand the country-based collaboration and the implications of the internationalization of mAb R&D, we visualized the collaboration network via three periods (Fig. 5): 1985–1993, 1994–2003, and 2004–2013.
The complexity of country-based collaboration networks increased dramatically, especial-ly from the 1985–1993 period to the 1994–2003 period. The intricacy was generally pic-tured as early as the second period (1994–2003). The number of countries involved in the collaboration networks increased from 15 in 1985–1993 to 27 in 1994–2003, and reached 33 in the latest period; the links increased from 31 to 95 and, recently, to 111. There was no separate component in the networks during the two later periods; all collaboration par-ticipants were connected in 1994–2003 and 2004–2013. This suggests that country-based collaboration is becoming more active and complicated, and the trends may continue in the next development period.
Moreover, collaboration between US, British, and Japanese institutions formed a clear col-laborative triangle during the 1994–2003 period. However, in the more recent period, US institutions formed strong partnerships with French and Swiss entities. Meanwhile, instead of the UK, Japan became the US’s biggest partner again. In addition, since the second pe-riod, institutions in developing countries have entered collaboration networks, indicating that the R&D partnering of mAbs is no longer a “game” monopolized by developed econ-omies.
Figure 5. The evolution of global collaboration networks for mAb R&D
Note: a 1985-1993; b 1994-2003; c 2004-2013

150 151
3.5 Changing Positions of Specific Countries
The US was the dominant country in each period (Fig. 5), but the country’s dominant po-sition is influenced by more noticeable interactions across European and other emerging countries. The expanding and diversifying process raises the question of whether we can identify the position change of specific countries in collaboration networks over time. We employed centrality percentages for three centrality measures instead of absolute num-bers in Fig. 6 to clearly illustrate the changing positions of specific countries or groups of countries in the networks in shorter time spans.
Figure 6. Evolution of the centrality percentages of specific countries or groups of countries over time
Generally, the global patterns in R&D collaboration concerning centrality percentages changed considerably over the studied time period, 1985–2013. For all three centrality measures, although the US still maintains its dominant role in absolute terms in the col-laboration networks for mAb R&D, the country’s influence on whole networks seems to be decreasing. This process might have been induced by the continuous cutting of public R&D budgets in the US due to the fiscal cliff in recent years and indirectly influenced by the increasing integration of Europe as well as emerging economies24-26.
An interesting point of collaboration network development in mAb R&D is that European countries (here defined as the EU-28 member states) and the group of the “Rest of the World” (RoW) seem to have evolved in opposite directions. The ascendance of the RoW has taken place at the expense of the US and European countries. Although the RoW is far from the center of the collaboration network (Fig. 5), the group is expected to reach a more important position as long as the trend continues, which can be realized by extended new participants and broader and more intensive collaboration with the leading participants.
4. Discussion
The promising future of mAb applications has ignited enthusiasm for relevant R&D activi-ties worldwide, and collaboration across institutions and even countries is encouraged to improve R&D efficiency and productivity27, 28. This study investigated the comprehensive collaboration patterns of mAb R&D from a network analytic perspective constructed by screening co-project partnerships.
The collaboration network for mAb R&D consists of diverse players: big pharmaceutical firms, small or young biotechnology firms, and research institutions. The partnerships among these players are also varied, including big firms joining forces, small firms collab-orating with each other, small biotechnology firms partnering with big pharmaceutical firms, small and big firms forming alliances with universities or research institutions, or three-party relationships involving the combination of big firms, small firms, and research institutions. The diversity of an institution’s partnerships has been described as promoting
Note: a percentage of weighted degree centrality; b percentage of betweenness centrality; c per-
centage of eigenvector centrality. A country’s centrality percentage is defined as the ratio
of the centrality of the country to the total centrality of all countries in the network.

152 153
access to a variety of sources to facilitate product innovation5; thus, a diversified collabo-rative relationship assembled in the network in mAb R&D should also be helpful for a high degree of innovation.
The classical collaboration is between biotechnology firms and big pharmaceutical firms, which was the most common type of relationship in the overall collaboration network for mAb R&D. In this type of collaboration, biotechnology firms, as important technological originators, need strategic partnerships with big pharmaceutical firms to bring technol-ogies to the marketplace. Another important collaboration is the contact between bio-technology firms and research institutions that provides timely access to specific knowl-edge, new ideas, and initial discoveries29. Thus, biotechnology firms are more likely to act as intermediaries in the network by connecting upstream-oriented alliances with research institutions and downstream-focused transactions with established big entities20, 29. In this position, small biotechnology firms may lack the expertise to effectively monitor their up-stream partners’ R&D activities, leaving the firms vulnerable to the risks of opportunism. On the other side, when collaborating with big pharmaceutical firms, small technology firms may have low bargaining power and then put themselves at high risk of having pro-prietary technologies expropriated by their giant partners, losing operation control and relevant product ownership rights20, 29. Small or young biotechnology firms should be vig-ilant regarding situations that threaten effective collaborations in order to set up a robust collaboration network.
The US has been dominant in the global collaboration network throughout the entire mAb research and development period. The country’s scale has been much bigger than any other participants since the initial collaboration in clinical mAb development in 1980s. This may be attributed to early policy incentives in the pharmaceutical and biopharmaceutical sectors as well as unceasing encouragement of cooperation and innovation30, 31. However, the dominance of the US is now threatened by the increasing collaboration activities in mAb R&D of European countries, such as the UK, Germany, France, and Switzerland, and emerging players in the RoW, including developing countries. Emerging economies, such as China, Cuba, and India, are forming a force that cannot be neglected by their more in-tensive global collaboration and more active performance in new drug development. For instance, Cuba has launched joint venture projects with developed and developing coun-tries, which has helped the country successfully establish a position in the collaboration network for R&D32, 33. Many developing countries prioritize collaboration with developed countries in the R&D of biosimilar versions of mAbs instead of developing novel mAbs separately due to the strong desire to lower drug costs. In one example, in the sample data, the largest biopharmaceutical firm in India, Biocon, partnered with a generics firm in the
US, Mylan, to develop biosimilar versions of adalimumab, bevacizumab, and trastuzumab.
With respect to the innovation system on mAbs in China, it relies on the government’s guidance for the industrial direction at beginning, then alters to government-support-ed entrepreneurship and technology development and diffusion34. Since 2006, China has made a series of policies to support and accelerate enterprises’ innovation on gene drugs and antibody R&D (from three main perspectives: market, enterprises, and acad-emies), which were recognized as the first time to certify the long-term development of mAbs34. Moreover, a state-level scientific research system has also been established, and substantial efforts has extended to international collaboration with developed countries. This definitely contributes to the promotion of China in the global collaboration network, especially interacting with central countries.
Finally, we provide recommendations for collaboration for stakeholders involved in mAb development. From the perspective of investors or managers, it should be beneficial for firms to seek favorable R&D partnerships. Collaborations between giants, external links with small biotechnology firms, and partnerships with academic research institutions are effective methods for big pharmaceutical firms to improve resource integration and to fa-cilitate the R&D process. Small firms should have a more intelligent understanding of part-nerships with research institutions and big pharmaceutical firms. Universities and other research institutions should actively collaborate with firms in the private sector to transfer the research results to commercialization efforts, and a more durable partnership is more likely to result in high-quality outcomes. As far as policymakers are concerned, govern-ments could provide incentives to enhance partnerships among diverse participants.
Acknowledgements
We gratefully acknowledge Ms. Xiaomei Geng for data collection.

154 155
References
1. Chatenoud L, Bluestone JA. CD3-specific antibodies: a portal to the treatment of au-toimmunity. Nature Reviews Immunology. 2007; 7: 622-632.
2. Ecker DM, Jones SD, Levine HL. The therapeutic monoclonal antibody market. Mon-ey Advice and Budgeting Service. 2015; 7: 9-14.
3. Li J, Zhu Z. Research and development of next generation of antibody-based thera-peutics. Acta Pharmacologica Sinica. 2010; 31: 1198-1207.
4. Geng XM, Kong XJ, Hu H, et al. Research and development of therapeutic mAbs: An analysis based on pipeline projects. Human Vaccines & Immunotherapeutics. 2015; in press.
5. Nieto MJ, Santamaría L. The importance of diverse collaborative networks for the novelty of product innovation. Technovation. 2007; 27: 367–377.
6. Talaga P. Open Innovation: share or die…. Drug Discovery Today. 2009; 14: 1003-1005.
7. Chesbrough HW. Open innovation: The new imperative for creating and profit-ing from technology. Boston: Harvard Business Press; 2003.
8. Reichert JM. Marketed therapeutic antibodies compendium. Money Advice and Budgeting Service. 2012; 4: 413-415.
9. Elvin JG, Couston RG, van der Walle CF. Therapeutic antibodies: market consider-ations, disease targets and bioprocessing. International Journal of Pharmaceutics. 2013; 440: 83-98.
10. Inoue H, Souma W, Tamada S. Spatial characteristics of joint application networks in Japanese patents. Physica A. 2007; 383: 152-157.
11. Kegler MC, Rigler J, Ravani MK. Using network analysis to assess the evolution of organizational collaboration in response to a major environmental health threat. Health Education Research. 2010; 25: 413-424.
12. De Prato G, Nepelski D. Global technological collaboration network: network analysis of international co-inventions. The Journal of Technology Transfer. 2014; 39: 358-375.
13. Hu YJ, Scherngell T, Man SN, et al. Is the United States still dominant in the global pharmaceutical innovation network? PLOS ONE. 2013; 8: e77247.
14. You H, Ni JY, Barber M, et al. China’s landscape in oncology drug research: perspec-tives from research collaboration networks. Chinese Journal of Cancer Research. 2015; 27: 138-147.
15. Scherngell T, Barber M. Distinct spatial characteristics of industrial and public re-search collaborations: evidence from the 5th EU framework programme. The Annals of Regional Science. 2011; 46: 247-266.
16. Breschi S, Lissoni F. Mobility of skilled workers and co-invention networks: An anat-omy of localized knowledge flows. Journal of Economic Geography. 2009; 9: 439–468.
17. Dekker AH. Centrality in social networks: theoretical and simulation approaches. Proceedings of Social Interaction and Mundane Technologies. 2008; Melbourne, Australia: 33-38.
18. Fruchterman TMJ, Reingold EM. Graph drawing by force-directed placement. Soft-ware: Practice and Experience. 1991; 21: 1129-1164.
19. Hagedoorn J, Schakenraad J. The effect of strategic technology alliances on company performance. Strategic Management Journal. 1994; 15: 291-309.
20. Haeussler C, Patzelt H, Zahra SA. Strategic alliances and product development in high technology new firms: The moderating effect of technological capabilities. Journal of Business Venturing. 2012; 27:217-233.
21. Gnyawali DR, Park BJR. Co-opetition between giants: Collaboration with competitors for technological innovation. Research Policy. 2011; 40: 650-663.
22. Dachs B, Stehrer R, Zahradnik G. The Sectoral Perspective. The Internationalisation of Business R&D. Cheltenham: Edward Elgar. 2014;71.
23. Hu YJ, Scherngell T, Qiu L, Wang YT. R&D internationalisation patterns in the global pharmaceutical industry: evidence from a network analytic perspective. Technology Analysis & Strategic Management. 2015; 27: 532-549.
24. Hather GJ, Haynes W, Higdon R, et al. The United States of America and scientific re-search. PLOS ONE. 2010; 5: e12203.
25. Matthews J. Global R&D spending up, US industry spending down. Physics Today. 2010; 63: 23.
26. Ledford H. US fiscal deal leaves science vulnerable. Nature. 2013; 493: 13. 27. Liu JK. The history of monoclonal antibody development–Progress, remaining chal-
lenges and future innovations. Annals of Medicine and Surgery. 2014; 3: 113-116.28. Ribatti D. From the discovery of monoclonal antibodies to their therapeutic applica-
tion: An historical reappraisal. Immunology Letters. 2014; 161: 96-99.29. Stuart TE, Ozdemir SZ, Ding WW. Vertical alliance networks: The case of university–
biotechnology–pharmaceutical alliance chains. Research Policy. 2007; 36: 477-498.30. Lazonick W, Tulum Ö. US biopharmaceutical finance and the sustainability of the bio-
tech business model. Research Policy. 2011; 40: 1170-1187.31. Ranga M, Hoareau C, Durazzi N, et al. Study on university-business cooperation in
the US. Final report. London: LSE Enterprise Limited. 2013; EAC-2011-0469.32. Mola EL, Acevedo BE, Silva R, et al. Development of Cuban biotechnology. Journal of
Commercial Biotechnology. 2003; 9: 147-152.33. Evenson D. Cuba’s Biotechnology Revolution. MEDICC Review. 2007; 9:8-10.
156 157
34. Zhang MY, Li J, Hu H, et al. Seizing the strategic opportunities of emerging technolo-gies by building up innovation system: monoclonal antibody (mAb) development in China. Health Research Policy and System. 2015; 13:64.

158 159
Chapter 8
RESEARCH AND DEVELOPMENT OF HEPATITIS B DRUGS : AN ANALYSIS BASED ON TECHNOLOGY
FLOWS MEASURED BY PATENT CITATIONS
Chuoji Huang#, Hui Heng Lin#, Jian-bo Wan, Chengwei He, Yuanjia Hu*
State Key Laboratory of Quality Research in Chinese Medicine, Institute of Chinese Medical Sciences, University of Macau, Macau SAR, China
# These authors contribute equally to this work.* Corresponding author: [email protected]
This chapter has been published as below.C.J. Huang, H.H. Lin, J.B. Wan, C. He, Y.J. Hu*, Research and development of hepatitis B drugs: An analysis based on technology flows measured by patent citations, Plos One, 11: e0164328, 2016.
160 161
Abstract
Despite the existence of available therapies, the Hepatitis B virus infection continues to be one of the most serious threats to human health, especially in developing countries such as China and India. To shed light on the improvement of current therapies and development of novel anti-HBV drugs, we thoroughly investigated 212 US patents of anti-HBV drugs and analyzed the technology flow in research and development of anti-HBV drugs based on data from IMS LifeCycle databases. Moreover, utilizing the patent citation method, which is an effective indicator of technology flow, we constructed patent citation network models and performed network analysis in order to reveal the features of different technology clusters. As a result, we identified the stagnant status of anti-HBV drug development and pointed the way for development of domestic pharmaceuticals in developing countries. We also discussed therapeutic vaccines as the potential next generation therapy for HBV infection. Lastly, we depicted the cooperation between entities and found that novel forms of cooperation added diversity to the conventional form of cooperation within the pharmaceutical industry. In summary, our study provides inspiring insights for investors, policy makers, researchers, and other readers interested in anti-HBV drug development.
Key words: hepatitis B virus, patent citation network, research and development, technol-ogy flow, HBV drugs.
1. Introduction
The hepatitis B virus (HBV) is the cause of one of the most common viral infections in the world1. HBV spreads primarily through transcutaneous or mucosal exposure to blood or other body fluids from infected hosts2. A number of studies have shown that active HBV replication leads to liver injury and disease progression3. Patients with chronic HBV infection suffer from risks of liver fibrosis, cirrhosis, and hepatocellular carcinoma (HCC) and may eventually die from liver failure or other complications4. According to the World Health Organization (WHO), two billion people have been infected with HBV so far and 240 million people worldwide were chronic carriers of HBV surface antigen (HBsAg) by the end of 20141. Though prophylactic vaccines for HBV have been available for over 30 years thanks to universal hepatitis B immunization programs, these preventive vaccines are not enough to protect the infected population from HBV-related deaths, especially those who have been infected prior to the launch of the program1. As a result, around 650,000 people die each year from the complications of chronic hepatitis B (CHB) 1, 5.
Currently, available treatments for chronic hepatitis B depend primarily on nucleoside an-alogs (NAs), which effectively inhibit virus replication but fail to eliminate the virus. Conse-quently, NAs merely prolong survival by preventing hepatic decompensation and slowing progression to cirrhosis or HCC6. In addition, adopting lifelong therapies is typically not an option for patients in developing countries where the infected populations are larger7,
8. Thus, current treatments against HBV infection are far from satisfactory, and there is an emerging call to develop new therapies that not only improve efficacy and tolerability but also decrease side effects and shorten treatment periods.
Nevertheless, developing new drugs is a difficult and complex project. Fortunately, an overview of the evolution process of pharmaceutical technologies can provide both guid-ance for and insights into drug development, including anti-HBV drug development. Cox et al. reviewed the treatments of chronic HBV infection by analyzing the latest safety and efficacy data on existing and emerging agents9, while our study sheds light on the evolu-tion process of pharmaceutical technologies from a different perspective and approach, i.e., analysis of patent citation networks. Patent citation has been considered an effective representation of knowledge diffusion and has been used to drive innovation10. It is im-portant for drug discovery, including new anti-HBV drugs, because all drugs are developed step-by-step through pharmaceutical technology processes11-13. The basic principle of pat-ent citation analysis is based on the theory that citing patents adopt knowledge elements from the patents cited, allowing the evolution process of technological innovations to be modeled as networks10. Thus, we are able to use patent citation network analysis to obtain valuable insights into the technological development of anti-HBV drugs and the flow of that technology. So far, to our knowledge, there has not been any report about patent citation network analysis of anti-HBV drugs. In order to fill this gap in the research, we performed a patent citation network analysis of US patents issued for HBV drug development to identify both core and emerging technologies. The purposes of this study is three-fold: first, to illustrate the technology flows of anti-HBV drug research and development (R&D) through patent citation network; second, to characterize the technology communities via cluster compar-ison in the network models; and third, to provide further insights and advice for investors, pharmaceutical companies, policymakers in governmental organizations, and researchers interested in anti-HBV drug development.

162 163
2. Methodology
2.1 Research Framework
The research framework of this study generally followed a pipeline of database survey (IMS LifeCycle), patent information analysis, and patent citation network analysis, as shown in Figure 1.
Note: Data were collected from IMS LifeCycle databases and processed for statistical analysis, net-
work modeling, and network analysis.
Figure 1. The research framework of this study.
We initially performed a systematic database survey across IMS LifeCycle databases, fol-lowed by filtering, transform, and integration of patent information. Upon retrieval of the unified data in US patent formats, statistical analysis was performed and network models were built. Finally, we analyzed the data in detail and summarized the conclusions of our study.
2.2 Data
This study collected data from the IMS LifeCycle databases, which is a collection of multi-functional databases about pharmaceutical. IMS R&D Focus covers facets of global drug development, from the discovery phase to availability on the market. IMS Patent Fo-cus is a database providing information on the most significant pharmaceutical patents. Information including estimated patent granted and expiry dates, patent extension infor-mation, patent numbers, and originators of marketed compounds, both pharmaceutical and biotechnological, can be found in the databases.
The original patents were identified through a hepatitis B query against IMS databases and listed according to their country of origin. All of the patents were transformed into the corresponding US patent format via the patent family system of the European Patent Office (EPO) because analyzing and comparing patent data using one single patent system results in more standard, comparable, and unified patent citation information. Finally, 212 US patents were retrieved and their citations and related information were collected from the IMS databases and the United States Patent and Trademark Office (USPTO) database. We also provided the relevant patent data for public access. They could be found in Sup-porting Information file(s).
2.3 Descriptive Analysis on Marketed Drugs and Patents
In this research, we initially collected patent information about marketed HBV drugs from the IMS Patent Focus database. Patents obtained were divided into three categories, i.e., nucleoside analogue, interferon, and vaccine, according to different actions of drugs. For example, the inhibitor of viral DNA polymerase for NAs, immunomodulator for IFN. We measured the core development period of those drugs by calculating the median year of drug’s patent granted. By analyzing the patentees, we identified the main contributors for each kind of drug and the changes of their patentee from the first year to the last one (Table 1).
A series of diagrams were also produced to display the results of patent distributions. Pat-ent were sorted into different R&D phases including discovery, preclinical, phaseⅠto Ⅰ, and so on (Fig. 2). Patents were also classified into years so as to show the temporal changes. Bars with different colors indicate the percentage of each kind of treatment and the orange curve reflects the patent count changes by year (Fig. 3). Lastly, patents were assigned to their patentees to compare the amount and treatment types of patents held by different patentees (Fig. 4).

164 165
2.4 Patent Citation Network Analysis
Patent analyses have been utilized in many studies attempting to identify current tech-nology structures and predict technological trends14 because patents provide detailed technological information and descriptions of the patented innovation15, 16. Thus, patents are considered a good proxy for the exchange of and links between technological knowl-edge, as well as a powerful indicator of the diffusion of technology and the process of improvement. They offer a historical record of the evolution of knowledge and provide a continuous view to view the interactions of technology12. Thus, we can trace the genealogy of technological knowledge through patent citations.
As technology systems are highly connected and interdependent, technological structures and linkages are often represented and analyzed in the form of networks. Many studies have integrated patent citations and social networks17-19; one recent examples is Stuart et al., who used patents and patent citations to represent a technological network20. In other words, patent citation networks can be viewed as a combination of social network theory and bibliometric methods.
Based on the idea that patent citations can show the relationships between technologies and form specific clusters, we employed social network analysis (SNA) to visualize the tech-nology structures behind the patents and citation information, with the aim of enhancing the identification of both core and emerging technologies in HBV drug development.
In general, a network consists of nodes and links. Alternatively, in social network analysis, they are usually called actors and relationships, respectively. In this study, each node rep-resents a patent and each link with arrow represents the citation. In network analysis, the degree of a node is defined as the number of links or the sum of values of links incident to the node. The in-degree is the number of incoming links to a given node, and it mea-sures technology input and indicates importance in the sense of technological impact. The out-degree represents the citations received by a patent and indicates the importance of the patent in terms of the fundamentality of an invention. Density is a measure of the compactness of networks, defined as the proportion of pairs in a network relative to the total number of pairs possible21.
The core period of drug evolution in each cluster is reflected by median of the years in which the patents were granted. Moreover, the major patentees of technology input and output in each cluster are determined by their share of in-degree (SI) and out-degree (SO) links. SI is equal to the number of in-degree patents by a patentee divided by the sum of the in-degree patents within a cluster. SO is calculated in the same way using the data of
the out-degree on patents. The high SI of a patentee is associated with increased domina-tion in the technology cluster to which they belong.
2.5 Clustering Analysis
In network analysis, cluster is also called community or module, and a network community is a sub-network whose nodes are more strongly connected to one another than to the rest of the network22. In this study, in order to identify the highly inter-connected nodes in networks, modularity of the partition is used to measure the quality of the partitions and decomposing the networks into sub-units or communities. By running the modularity algorithm integrated into Gephi23, which is also the tool for visualizing our network model, we obtained multiple resulted clusters for further analysis.

166 167
3. Results
Consistent with the design of our research framework, we divided the results into three parts and interpreted them following an order of drug information, patent data analysis, and network analysis in order to illustrate the technology flows of patent citation networks for HBV drugs.
3.1 Marketed Drugs Information
In order to identify the process of technology evolution for HBV drugs and further investi-gate the related patents of the drugs, we initially collected patent information about mar-keted HBV drugs from the IMS Patent Focus database and divided the resulting patents into three categories, i.e., nucleoside analogue, interferon, and vaccine. A total of seven anti-HBV therapies are available, as listed in Table 1.
Table 1. Patent information of marketed HBV drugs. a
a Marketed HBV drugs contain 3 classes. i.e., nucleoside analogue, interferon, and vaccine. Nucleoside analogs acting as inhibitors of viral DNA polymerase are the main options for current treatment, but none of the drug classes com-pletely eliminates HBV.
Lamivudine, adefovir, entecavir, telbivudine, and tenofovir are five types of oral NAs that share similar mechanisms by inhibiting viral DNA polymerase and replication. The inter-feron (IFN) alpha-based therapies include two subtypes of immunomodulators, i.e., IFN-α-2b and PEGylated IFN-α-2a. They trigger immune responses and activate antiviral proteins in the human immune system to fight against HBV; therefore, they can be used either as monotherapy or in combination treatments10.
Dating back to 1991, IFN-α-2b was the first agent approved for the treatment of HBV infec-tion and its median year of granted patents is 2004. This suggests a long period of 13 years for evaluating IFN. The situation for NAs is quite similar to that of IFN.
In terms of the patent holder, the patentee of Entecavir and Tenofovir remains the same after long time and their patents are still held by Bristol-Myers Squibb and Gilead Sciences, respectively. Oppositely, the owner of patents of lamivudine begins with IAF BioChem and ends up with Emory University. As a well-known and widely used product from GSK, pat-ents of lamivudine seems to be interested by multiple companies. A glance at the country of patentee shows that, except for lamivudine, patents related to adefovir, entecavir, tel-bivudine, and tenofovir are mostly held by American companies or institutions.

168 169
3.2 Descriptive Statistical Analysis
Before the analyses of patent citation data, we initially investigated the distribution of pat-ent data as a view of the distribution of different R&D phases can help us understand the status of drug development. As shown in Fig. 2, most patents are in the marketed phase. The data in Fig. 2, on one hand, indicate that drug development for HBV infection is ap-proaching a mature stage. On the other hand, it may indicate that new anti-HBV drug de-velopment is reaching a bottleneck, which would be worrisome. Patents on IFN cannot be found in any phase but the marketed phase. This suggests the development of IFN has stopped or stagnated. On the contrary, vaccines and NAs seem to have gained more atten-tion from drug developers as they are widely distributed in different development phases.
Figure 2. Illustration of distribution of patents by development phase.
Note: Most patents are in the marketed phase, indicating stagnancy of R&D of anti-HBV drugs.
Fig. 3 shows the temporal changes in patent counts. An inverted U-shape with long tails and a peak value in 1998–2000 was captured. There was a sharp increase in patent counts in 1995, with this bloom indicating diversification. Considered the increases in numbers and types of patents, we identified 1995 to 2004 as the bloom period, a golden age of importance for anti-HBV drug development.
The patent counts peak in 2000 when monoclonal antibodies were patented. Since 2004, NAs and vaccines have become the main types of patents, and they now play a dominant role.
Last but not the least, we identified the bloom period of HBV drug development was year 1995-2004 from Fig. 3. During this bloom period, the count and diversity of patents in-creased. Various technology clusters emerged and further increased the patent count. All the median years of clusters are in this bloom period. As close to 65% of patents in this study are at the marketing phase and the median years of granting of patent for marketed drugs are in this bloom period, we can see a prosperous period for both R&D and commer-cialization of HBV drugs. In addition, 1978 to 1995 can be viewed as a pre-bloom period and 2005 to 2014 is post-bloom.
Note: a reversed U-shaped curve with fluctuations showed the 1995–2004 bloom period of an-
ti-HBV drug development.
Figure 3. Illustration of distribution of patents by year granted.

170 171
In Fig. 4, patentees are represented by patenting institution and their patents were count-ed as long as the institution is associated with a patent, regardless of whether the institu-tion is the only holder of a patent or it shares a patent with other institutions. Obviously, there is an asymmetric distribution of patent counts. GlaxoSmithKline (GSK), a giant phar-maceutical company headquartered in London, leads in patent counts and has investigat-ed many different kinds of therapies.
From the perspective of technology diversity, patentees can be divided into two classes. The first class includes GSK, Sanofi, and Roche. They make up a technologically diversified class because they possess multiple technologies for HBV infection treatments. The second class of patentee focuses on a single technology, such as Emory University, IAF BioChem, and Yale University.
Figure 4. Illustration of distribution of patents by patentee.
Note: patentees are listed in descending order from left to right. A portion of the patents are
shared by multiple institutions.
3.3 Patent Citation Network
3.3.1 Overall Profile
To identify the technological flow of HBV drugs, a patent citation network was generated based on the citation information from the 212 patents recorded in the USPTO database; nodes and arrows represent patents and citations, respectively, and are colored based on different types of treatments (Fig. 5).
Note: Network model is divided into different clusters and patents worth noticing are annotated
with their US patent numbers (the prefix “US” is removed and only the numbers are shown
for users to search in the USPTO’s online database).
Figure 5. Patent citation network.

172 173
As shown in the patent citation network (Fig. 5), there are 122 nodes representing patents and 146 edges representing citations. Ninety nodes were removed as they were not linked with any other nodes. The average degree of the whole network is 1.197, calculated by di-viding the sum of all node degrees by the total count of nodes in the network. The degree of a node can be calculated as the number of links that a given node has to other nodes. The patent citation network is a directed network, i.e., the direction of a link is determined by the citation relationship: citing or cited24. Thus, the in-degree and out-degree are de-fined as different degrees. The in-degree represents the number of times a patent cites other patents. This reflects the adoption of technology from former patents by a newer patent and therefore can be used to measure technology input. The out-degree represents the number of times a patent is cited by other patents, which measures the technology output13.
3.3.2 Comparison Among Clusters
To analyze the technology flow and community, the network has been divided into several clusters through the fast unfolding modularity algorithm as described in the methodology section22. Furthermore, the R&D statuses, patentees, and network topological features of resulted 11 clusters were further analyzed and are summarized in Table 2. Specifically, the average degree of a cluster can be defined as the average number of links between nodes, which can be used to identify the tightness of the interactive relation within a cluster. For example, cluster 1 dominated by NAs shows a much higher average degree than the other clusters. Based on this attribute, NAs show a more interconnected structure and closer interaction in technology flows.
A general look at Fig. 5 tells that cluster 1 is the biggest cluster in the overall network and is highly interactive, indicating an on-going development of NAs. The interconnecting clusters 1, 3, 4, and 5 can be further combined into a big component including the tech-nologies of NAs, interferon, and vaccines. Similarly, clusters 2, 6, 8, and 9 also display nodes with different colors and technology combinations through patent citations. The rest of the clusters, i.e., clusters 7, 10, and 11, are dominated by only a single type of treatment and can be viewed as technologically concentrated community. Cluster 11 is dominated by merely the single technology of monoclonal antibodies. From the perspective of net-work, the technology of monoclonal antibody has few connections with other technolo-gies and therefore cluster 11 belongs to the type of technologically concentrated commu-nity. The same situation can be found in cluster 10 as well. Interestingly, cluster 11 is the only cluster about monoclonal antibody treatment, and it consists of four patents all held by PDL BioPharma only (Table 2). While a point to notice is that, the therapy of monoclonal antibody is still under investigation and thus many work is to be done to address issues
about clinical efficacy and safety.
a Clusters representing different technology communities, their topological parameters in the net-
work model, and related patent information are listed.b SI: Share of in-degree. SI is equal to the number of in-degree patents by a patentee divided by the
sum of the in-degree patents within a cluster. c SO: Share of out-degree. SO is equal to the number of out-degree patents by a patentee divided by
the sum of the out-degree patents within a cluster.
Table 2. Information of the main technology clusters in the patent citation network.
Moreover, it has been observed in Fig. 5 that, within cluster 1 to 6, vaccine patents lie in the end or terminal points of technology flows, and vaccines always appear together with other technologies in clusters. This is an important discovery indicating vaccines may play a role of technological synthesizer in anti-HBV drug development. This provides research-ers with insights for future R&D on anti-HBV drugs. Take cluster 5 as an example, patent US6013264 located at the end of the technology flow is a vaccine composition technology comprising of HBV surface antigens. Similarly, according to the patent claim, US5972346 at the end of cluster 6 is a kind of therapeutic vaccine used in medical treatment for on-going hepatitis viral infections.

174 175
4. Discussion
Patent citations have been used to represent technology transfer or technology spillover in many studies25, and it has been regarded as a good measurement of technology flows among different industries and fields of technology26. In this study, we carried out sys-tematic analyses of patent data on anti-HBV drugs in order to identify its technology flow. We presented the results of patent distribution, network analysis, and cluster comparison analysis in order to gain a deeper understanding of the technological knowledge flows in the development of anti-HBV drugs. We selected network analysis as our core method for patent citation analysis because citations can be modeled using arrows to measure the direction of technology flow in HBV drug development.
The reported results consist of three parts, each of which emphasized a unique aspect of anti-HBV drug patents. Firstly, analyses of marketed anti-HBV drugs from IMS databases identified the United Statesas one of the countries enjoying technological advantages in anti-HBV drug development. Amongst drugs available on the market, entecavir and teno-fovir outperform their competitors because of their relatively high potency and low resis-tance profile27,28.
Secondly, a diagram of patent distribution (Fig. 2) shows that patents of NAs have the ad-vantage of other drugs regarding patent count. In addition to the large quantity, they have the characteristics of high interactions and continual development in the technological community (Fig. 5). Likewise, NAs administered orally are more suitable for patients ow-ing to its potent antiviral activity along with fewer side effects28. Further, in consideration of the efficacy and safety of drugs, NAs have been positioned as the current mainstream treatment of HBV infection29. Whilst Fig. 2, illustrating the distribution of the development phase, showed that most patents are located in marketed drugs, suggesting stagnancy of the research and development of anti-HBV drugs. This conclusion also is supported by Fig. 5, and the phenomenon is quite different from our previous reports of patent studies of anti-Alzheimer’s drugs, therapeutic monoclonal antibodies, and dendritic cells13, 30, 31. In our previous reports, the patents were mainly distributed in the earlier phases of clinical trials; such distribution patterns indicate the on-going processes of R&D.
What is more, we found the increased diversity of the cooperation form between entities, which affects the R&D of anti-HBV drugs. Conventionally, university–industry collabora-tions in biotech industry have been common32. For instance, through careful examination on patent documents, we identified university-industry cooperation cases amongst the top 10 anti-HBV drug patentees in Fig. 4, (Here, we consider that, cooperation exists among
patentees if a patent is held by two or more patentees from different institutions.), i.e., Em-ory University, Yale University, University of Georgia, and seven pharmaceuticals33.
Whilst the conventional university-industry cooperation is the predominant form, the Bayh–Dole Act passed in 1980 has increased the diversity of cooperation forms. The Act in fact benefits both the industrial corporations and the public research institutions. It not only greatly facilitated the technology transfer by industrial corporations, but also stimu-lated the cooperation mode by encouraging universities to commercialize the federally funded research projects33, 34. The Bayh-Dole Act boosted the university–university coop-eration as it allows the patentee identity of universities in the patenting system. For the academic institutions, the Bayh-Dole Act facilitated the growth of university patenting and licensing of technologies33. Specifically, in 2008, American universities have owned licens-ing revenues of $3.4 billion, as opposed to $7.3 million in 198135. Moreover, revenue from the commercialization of technology becomes an increasingly important and substantial source of financial support for universities in the United States, with combined revenues from licensing and industry-supported research in all fields reaching well over $6 billion per year34.
Here, we take Emory University as the typical example for illustrating the diversity of co-operation relationship. According to our analysis, Emory University possesses 21 (38.1% of the total 55 patents held by two or more institutions) patents shared with other patentees. Emory University shares these patents with both academic and industrial partners such as GSK, University of Georgia, Gilead Sciences, Japan Tobacco, and etc. Another example of university–university collaboration is the University of Georgia, holding 13 patents in nucleoside analogues as co-owner with Emory University (4/13) and Yale University (9/13). These cases show that university-university cooperation is a novel type of patentee form in addition to the conventional university–industry cooperation.
Inspired by cases above, we suggest policymakers should act on policies to encourage diverse forms of cooperation in the R&D community. For domestic pharmaceutical com-panies in developing countries, which are facing severe HBV infection threats, we suggest building cooperative relationships with large pharmaceutical companies possessing ad-vanced anti-HBV technologies, since the health of its population is a vital issue to a country. It is also possible and beneficial for local governments to play a coordinating role in such international forms of cooperation.
Thirdly, through the patent citation network and cluster analysis, we identified technology flow and technology-based R&D communities. One of our most interesting discoveries is

176 177
that the overall network model of ours shows high dispersion and most of clusters are completely separated and have little contact with each other (Fig. 5). As mentioned previ-ously, patent citations represent a technological connection. Therefore, this indicates that the technologies of HBV drugs have less interaction with each other than technologies investigated in our previous reports13, 30, 31, where network models were highly connected and exhibited patterns of continuous growth and expansion. Hence, we conclude that the features of the network model of anti-HBV drugs display less potential in further growth and expansion. This is graphically consistent with what we found in the patent distribution (Fig. 2), i.e., anti-HBV drug development has reached a bottleneck.
Another interesting discovery is the multi-technological concentricity of vaccines (Fig. 5). The technology flow of anti-HBV drug development identified by our network analysis suggests that vaccine technologies adopt the knowledge from patents of NAs and INF drugs, and hence the vaccine technologies are the potential next generation therapy for HBV infection treatment.
A study showed that the combination of vaccines with immunotherapy or classical anti-viral treatments may be a more effective treatment strategy due to additive or synergistic efficacy, and this kind of vaccines can be viewed as therapeutic vaccines36. Inspired by this, we searched and listed a part of clinical trials for therapeutic vaccines and immunomod-ulatory agents against HBV infection in Table 3. In order to access the safety of the novel technologies, we further investigated the safety reports of these trials. To our disappoint-ment, few information of side effect and adverse drug reaction is available so far. Amongst the trials, HB-110 from Genexine, Inc., a kind of novel therapeutic DNA vaccine against chronic hepatitis B, is currently in phase I and a study from Yoon et al. indicated that HB-110 is potentially safe and tolerable in CHB patients37. This is also supported by data from IMS R&D Focus database and other clinical trials, with similar safety comment for DV-601 and ppdpSC18 in Table 3.
a List of clinical trials of potential novel drugs for HBV infection treatment.
Data are from www.clinicaltirals.gov.b Safety comments data are from IMS R&D Focus and www.clinicaltirals.gov.
Table 3. Partial list of current clinical trials evaluating various vaccine therapies for HBV a, b
178 179
In terms of currently available therapies for HBV infection, there are some points to be improved. One example is the failure to completely eliminate HBV and the other is the poor availability of drugs due to high expense, especially for developing countries whose infected populations are quite large. China, estimated to have an infected population of 93 million and with one of the highest rates of HBV infection in the world, should actively engage with other developing countries in the fight against HBV infection9. In China, the HBV vaccination was integrated into an expanded program of immunization vaccines by the government in 2001, but the service fee for the vaccination procedure was still charged to those families. It was not until 2005 that the Chinese government adopted a completely free HBV vaccination program for all neonates. However, this means those older than 10 years may not be protected by the vaccination program. So a large part of the population, which also serves as the primary labor force in China’s economy, remains unprotected and open to infection. Thus, developing effective drugs for this large segment of the popula-tion is an urgent mission.
Next, from the perspective of drug development, there is a great demand for new drug de-velopment because limitations, such as failure of elimination of HBV and long-term treat-ment, still exist in current therapies30. As explained in the previous section, current drugs mainly act as inhibitors by targeting HBV replication, while they are unable to eliminate HBsAg. The following two points may account for this technological bottleneck. Firstly, pharmaceutical companies may have decreasing interest in anti-HBV drug development due to the high risk of failure and the opportunity cost, i.e., the huge investments and lengthy periods required for drug development. Secondly, pharmaceutical companies have become less interested in developing novel anti-HBV treatments due to the lower prevalence of HBV infection in developed countries, as well as the fact that from an invest-ment standpoint, new drugs that might cure people from HBV infection may not bring as much profit as current drugs that require long-term therapy.
Dr. Zhang Lianshanis the president of Global R&D of Jiangsu Hengrui Medicine Co., Ltd. and a delegate from the Chinese domestic pharmaceuticals in a drug R&D forum of Chi-nese-American pharmaceuticals. Dr. Zhang suggested that, “Domestic pharmaceutical companies should give priority to R&D on drugs for diseases that are not only with a high local incidence rate, but also less interesting to foreign pharmaceuticals.” This comment significantly supports our viewpoint.
Although there is a great demand for new anti-HBV drugs in China, we fully understand the difficulties of developing a novel therapy with better efficacy and cheaper price. For-tunately, our technology flow analysis indicates that vaccine may be the next generation
therapy and therefore is one of the potential ways for researchers and investors to go. In fact, vaccine products have been undergoing a revolution in recent years, i.e., newly de-veloped vaccines are gaining therapeutic effects besides their traditional roles in preven-tive medicine. Therefore, therapeutic vaccines are considered a better therapeutic strategy than those traditional chemical drugs failing to cure diseases such as cancer. Although the development of therapeutic vaccines remains in a primary stage, a group of Chinese researchers from Fudan University is working hard and enthusiastically developing a novel therapeutic vaccine for HBV infection. The vaccine is currently in clinical trial phase III. In fact, therapeutic vaccines not only possess the potential to overcome the bottlenecks in current HBV infection treatments to achieve the complete elimination of HBsAg, it is also of great hope that it can effectively cure other complex and incurable diseases, e.g., cancers. For researchers and pharmaceuticals, giving priority to the development of therapeutic vaccines rather than mature technologies may be the way to go. The development of a therapeutic vaccine may also be of interest to investors.
Generally speaking, the combat against HBV infection now is still far from being satisfied and greater efforts are required, especially for China. Despite these negative circumstanc-es, there is still hope of fighting against HBV infection if we are willing to undertake chal-lenges.
On one hand, we are glad to see the active motivation and efforts from both the Chinese government and research communities to accelerate the battle against HBV infection. A recent good news is that, the government of China successfully negotiated with pharma-ceuticals about lowering the price of several effective marketed anti-HBV drugs. For exam-ple, the price of Tenofovir made by GSK will be largely reduced by 67%. Another exciting scientific breakthrough is that a novel gene targeting the HBVs has been discovered by a group of researchers in China.
On the other hand, we are concerned about whether the higher priority is given to the de-velopment of anti-HBV drugs in drug innovation projects in China. In fact, the government of China is now fully aware of the importance of drug innovation and is investing large amount of capital into it. As a result, several enormous drug innovation projects led by the Chinese Academy of Science have been initialized in the recent decade. Here, we strongly suggest that drug innovation for HBV infection should be given a high priority to cater to the urgent needs of HBV infection treatments.
Going back to the patents and their citation relations, we see that they offer strategic hints for anti-HBV drug development in China. Take the SI and SO of clusters, which were intro-

180 181
duced in previous sections, as the example. Theoretically, the out-degree indicating novel technological innovation presents the competitive strength and is more important than the in-degree of patent nodes representing the adoption or absorption of existed tech-nologies in drug innovation. Unfortunately, the current pipeline for hepatitis B drug devel-opment is drying up, and therefore it is difficult to achieve such out-degree breakthrough or innovation. This is also true in China, and the in-degree way is now the majority of hep-atitis B drug development in China. Based on the analyses above, we have two points of suggestions facilitating the anti-HBV drug innovation in China. For one thing, to achieve the out-degree innovation, more and more investments and resources should be given to fundamental research instead of applied research. For another, the institutions with the larger SI can be viewed as potential partners if cooperation is sought for.
Despite our encouragement of the international cooperation, China should ultimately construct an integrative system or environment of its own to facilitate the development of pharmaceutical technologies. The US is a good example to follow and has been doing this very well. The effective communication and smooth cooperation among academic re-searchers, industries, and governmental organizations in the US give it a leading role in R&D in the global pharmaceutical market. In summary, novel drug development is a large project and good cooperation and coordination among governmental organizations, uni-versity researchers, and pharmaceutical companies are of vital importance to the develop-ment and success of new drugs.
Last but not the least, our study has space for improvement as well. As every coin has two sides, in terms of our core methodology, i.e., the patent citation network analysis, which heavily relies on patents and their citation information, has the following potential drawbacks. One is that it is difficult to guarantee and expect all technological innovations can be found in the patent pools, as applying for patents is quite a subjective, time- and resource-consuming process. More straightforward, small and middle-sized enterprises (SMEs) with less resources may not be so active as giant corporations in patent filing. The next point is that patents may not contain R&Ds carried out by some public sectors, espe-cially those who are not targeting the translational researches. Generally speaking, these sectors lack incentives and external stimulations for patent filing. In such aspect, patent citation network may not be able to completely reflect the R&D tracks as well as the tech-nology flow. Another drawback is that we could not provide more details about the safety information of the aforementioned clinical trials, which prevents the deeper evaluation of technologies involved. The last point is that we also tried to differentiate the therapeutic vaccine-related patents from the preventive vaccine-related patents, as these two kinds of vaccine are in different purposes for use. However, most of the relevant patent claims
obtained in this study do not contain information for telling the preventive and therapeu-tic vaccine apart. Thus, we are not able to further specify the type of vaccine in this study.
Initially, in this study, we investigated the marketed anti-HBV drugs and analyzed their technologies. With descriptive statistical analysis on their corresponding patent data, we identified the stagnant status of anti-HBV drug development and pointed the way for de-velopment of domestic pharmaceuticals in developing countries. Next, our analysis on patentee data discovered that, the novel cooperation forms added diversity to the con-ventional form of cooperation within the biotech and pharmaceutical industry. Last but not the least, we depicted an overall network model so as to visualize and then analyze the whole technology community of anti-HBV drug development, in which we also discussed about therapeutic vaccines as the potential next generation therapy for HBV infection. Our work thoroughly provides inspiring insights for investors, policy makers, researchers, and other readers interested in anti-HBV drug development.
Acknowledgements
We thank Ms. Xiangjun Kong for her technical assistance in the preliminary data collection and analysis. We also thank Ms. Qianru Zhang for the valuable advice.

182 183
References
1. WHO. Guidelines for the prevention, care and treatment of persons with chronic hepatitis B infection. WHO Press, 2015.
2. Lai CL, Ratziu V, Yuen M-F, et al. Viral hepatitis B. The Lancet. 2003; 362(9401): 2089-2094.
3. Liaw YF. Reduction of cirrhosis and hepatocellular carcinoma with antiviral therapy in chronic hepatitis B. Hepatology. 2013; 58(5): 1856.
4. Lok AS. Hepatitis: Long-term therapy of chronic hepatitis B reverses cirrhosis. Nature Reviews Gastroenterology & Hepatology. 2013; 10(4): 199-200.
5. Lozano R, Naghavi M, Foreman K, et al. Global and regional mortality from 235 caus-es of death for 20 age groups in 1990 and 2010: a systematic analysis for the Global Burden of Disease Study 2010. The Lancet. 2012; 380(9859): 2095-2128.
6. Sun J, Hou JL. Management of chronic hepatitis B: experience from China. Viral Hep-atitis Journal. 2010; 17(Suppl 1): 10-17.
7. Buchmann P, Dembek C, Kuklick L, et al. A novel therapeutic hepatitis B vaccine in-duces cellular and humoral immune responses and breaks tolerance in hepatitis B virus (HBV) transgenic mice. Vaccine. 2013; 31(8): 1197-1203.
8. Barnes E. Therapeutic vaccines in HBV: lessons from HCV. Medical Microbiology and Immunology. 2015; 204(1): 79-86.
9. Cox N, Tillmann H. Emerging pipeline drugs for hepatitis B infection. Expert Opin-ion on Emerging Drugs. 2011; 16(4): 713-729.
10. Li X, Chen H, Zhang Z, et al. Managing Knowledge in Light of Its Evolution Process: An Empirical Study on Citation Network-Based Patent Classification. Journal of Management Information Systems. 2009; 26(1): 129-154.
11. Jaffe AB, Trajtenberg M. International Knowledge Flows: Evidence From Patent Cita-tions. Economics of Innovation and New Technology. 2006; 8(1-2): 105-136.
12. Sorenson O, Rivkin JW, Fleming L. Complexity, networks and knowledge flow. Re-search Policy. 2006; 35(7): 994-1017.
13. Xu J, Kong X, Qiu L, et al. Research and development of anti-Alzheimer’s drugs: an analysis based on technology flows measured by patent citations. Expert Opinion on Therapeutic Patents. 2014; 24(7): 791-800.
14. Cho TS, Shih HY. Patent citation network analysis of core and emerging technologies in Taiwan: 1997-2008. Scientometrics. 2011 ;89(3): 795-811.
15. Park H, Yoon J. Assessing coreness and intermediarity of technology sectors using patent co-classification analysis: the case of Korean national R&D. Scientometrics. 2013; 98(2): 853-890.
16. Verspagen B. Mapping technological trajectories as patent citation networks: A study on the history of fuel cell research. Advances In Complex Systems. 2007; 10(1): 93-115.
17. Chang SB, Lai KK, Chang SM. Exploring technology diffusion and classification of business methods: Using the patent citation network. Technological Forecasting And Social Change. 2009; 76(1): 107-117.
18. Li X, Chen H, Huang Z, et al. Patent citation network in nanotechnology (1976–2004). Journal of Nanoparticle Research. 2007; 9(3): 337-352.
19. Gress B. Properties of the USPTO patent citation network: 1963–2002. World Patent Information. 2010; 32(1): 3-21.
20. Stuart TE, Podolny JM. Local search and the evolution of technological capabilities. Strategic Management Journal. 1996; 17: 21-38.
21. Yoon J, Kim K. Identifying rapidly evolving technological trends for R&D planning using SAO-based semantic patent networks. Scientometrics. 2011; 88(1): 213-228.
22. Blondel VD, Guillaume JL, Lambiotte R,et al. Fast unfolding of communities in large networks. Journal of Statistical Mechanics: Theory and Experiment. 2008; 1-12.
23. Jacomy M, Venturini T, Heymann S, et al. ForceAtlas2, a continuous graph layout algorithm for handy network visualization designed for the Gephi software. PLoS One. 2014; 9(6): e98679.
24. Choe H, Lee DH, Seo IW, et al. Patent citation network analysis for the domain of or-ganic photovoltaic cells: Country, institution, and technology field. Renewable and Sustainable Energy Reviews. 2013; 26: 492-505.

184 185
25. Stolpe M. Determinants of knowledge diffusion as evidenced in patent data: the case of liquid crystal display technology. Research Policy. 2002; 31(7): 1181-1198.
26. Karki MMS. Patent citation analysis: A policy analysis tool. World Patent Informa-tion. 1997; 19(4): 269-272.
27. Yuen MF, Lai CL. Treatment of chronic hepatitis B: Evolution over two decades. Jour-nal of Gastroenterology and Hepatology. 2011; 26(Suppl 1): 138-143.
28. Locarnini S, Hatzakis A, Chen DS, et al. Strategies to control hepatitis B: Public policy, epidemiology, vaccine and drugs. J Hepatol. 2015; 62(Suppl 1): 76-86.
29. Yuen MF. Anti-viral therapy in hepatitis B virus reactivation with acute-on-chronic liver failure. Hepatology International. 2015; 9(3): 373-377.
30. Kong X, Hu Y, Cai Z, et al. Dendritic-cell-based technology landscape: Insights from patents and citation networks. Human Vaccines & Immunotherapeutics. 2015; 11(3): 682-688.
31. Geng X, Kong X, Hu H, et al. Research and development of therapeutic mAbs: An analysis based on pipeline projects. Human Vaccines & Immunotherapeutics. 2015; 11(12): 2769-2776.
32. Smith HL, Bagchi‐Sen S. University–Industry Interactions: the Case of the UK Biotech Industry. Industry & Innovation. 2006; 13(4): 371-392.
33. Mowery DC, Nelson RR, Sampat BN, et al. The growth of patenting and licensing by U.S. universities: an assessment of the effects of the Bayh–Dole act of 1980. Re-search Policy. 2001; 30(1): 99-119.
34. Drozdoff V, Fairbairn D. Licensing biotech intellectual property in university-industry partnerships. Cold Spring Harbor Perspectives in Medicine. 2015; 5(3): a021014.
35. Loise V, Stevens AJ. The Bayh-Dole Act Turns 30. Science Translational Medicine. 2010; 2(52): 52cm27-52cm27.
36. Michel ML, Deng Q, Mancini-Bourgine M. Therapeutic vaccines and immune-based therapies for the treatment of chronic hepatitis B: perspectives and challenges. Journal of Hepatology. 2011; 54(6): 1286-1296.
37. Yoon SK, Seo YB, et al. Safety and immunogenicity of therapeutic DNA vaccine with antiviral drug in chronic HBV patients and its immunogenicity in mice. Liver Inter-national. 2015; 35(3): 805-815.
186 187
Chapter 9
AN ANALYSIS OF TECHNOLOGY FLOWS OF ANTIDEPRESSANTS BASED ON PATENT CITATION
NETWORK
Siqi Tian1#, Hui Heng Lin1#, Marvin S.H. Mak2, Yifan Han2, Yuanjia Hu1*
1 State Key Laboratory of Quality Research in Chinese Medicine, Institute of Chinese Medical Sciences, University of Macau, Macau SAR, China
2 Department of Applied Biology and Chemical Technology, Institute of Modern Chinese Medicine, the Hong Kong Polytechnic University, Hung Hom, Hong Kong,
China.# These authors contribute equally to this work.* Corresponding author: [email protected]

188 189
Abstract
Depression is threatening the large population of worldwide patients severely. The cur-rent situation is that therapies available so far are less effective, which imposes an urgent call for better therapeutic solutions for fighting against depression. Our study not only thoroughly reviewed the past and the latest facts relevant to depression and antidepres-sants, but also shed light on the future of antidepressants development. In more detail, by mining the data in IMS databases, we were able to perform statistical analysis to reveal the up-to-date facts of the marketed antidepressants. We also followed up the latest proj-ects and the progress in R&D of antidepressants in order to identify the current trends of antidepressants R&D. Subsequently, we employed the network modelling to identify the antidepressants’ R&D technology flow and community. Last but not the least, we offered insightful discussion covering depression and its relevant facts as well as the latest R&D circumstances in China specifically, hoping that our study will inspire researchers and poli-cymakers for the development of the better next generation antidepressants.
1. Introduction
1.1 Background Information of Depression
As defined by WHO (World Health Organization), depression is a kind of mental disorder, and it is characterized by sadness, loss of interest or pleasure, feelings of guilt or low self-worth, disturbed sleep or appetite, feelings of tiredness, and poor concentration. What is worse, depression can be long lasting or recurrent, which substantially impairs individuals’ ability in daily life and work. In the worst case, depression can lead patients to commit suicide1, 2.
Instead of being a local or regional problem, it is estimated that more than 350 million people are suffering from depression worldwide, which result in 1 million suicide or deaths annually. According to the WHO and other reports, depression is the leading cause of disability worldwide, and unipolar depressive disorders were ranked as the third leading cause of the global burden of disease in 2004 and will move into the first place by 20302, 3. In fact, the harm of depression is no less than the top killers of human health, i.e., the can-cers, cardiovascular diseases, diabetes, and etc. Therefore, people should be alarmed that depression is a very severe problem threating the health of large amount of population in the world.
Despite of the advancement of the modern medicine, the pathogenic mechanisms of de-pression are still under investigation. It is of great pity that, so far, there is no objective diagnostic tests for depression. This is due to, on one hand, the super complexity of the brain regions and neural circuits which beyond the scope of modern technology. For ex-ample, scientists do not even know where the biopsy should be extracted from the patient due to the heterogeneity of the illness, i.e., different neural regions are involved in differ-ent individuals. On the other hand, controversy still exists since different complex factors, including genetic predisposition, environmental factors, chronic disease and disability, direct biochemical changes in the brain, and early childhood experiences, are relevant to depression4.
So far, most of the depression studies focus on the frontal regions of the cerebral cortex and hippocampus, and it has been reported that, something wrong occurs in the reward pathways in the brain of depression patients5.
Currently, therapies for depression can be classified into pharmacotherapy, physiotherapy and psychotherapy. Physiotherapy consists of electroconvulsive therapy, magnetic stimu-lation therapy, Vagus nerve stimulation therapy, deep brain stimulation therapy, and etc6. Psychotherapy treats mild depression or alleviate severe depression. The most mature one of pharmacotherapies is to directly increase the activity of the brain’s serotonergic, nor-adrenergic or dopaminergic system. Most of patients with severe depression need to be treated by pharmacotherapy. However, the same mechanism of action shared by drugs also brings similar deficiencies. Some examples are: it usually takes 3-8 weeks before on-set, providing little or even invalid help to 30% - 50% of patients with severe side effects, and 80% of patients will relapse after withdrawal, which means patients need life-long medication5, 7.
According to WIPO (World Intellectually Property Organization), more than 90% of the out-comes of the invention are patents. It is widely believed that patent citations are power-ful tools showing technology diffusion8. Patents connected via citation relation form the patent citations work systematically displaying the technology diffusion and transfer pro-cesses of a specific domain. Upon further network analysis, trends and future direction of development in this domain can be predicted9, 10.
Many reports focused on depicting the development process of antidepressants and re-viewing the patent status, while our study illustrates various technology flows of antide-pressants via patent citation network to provide dynamic insights into its R&D (research

190 191
and development) activities. As a result, we employed the approaches of network visual-ization and analysis, and demonstrated our hypothesis that, patents connected with cita-tions would show a tight technological relationship and form specific clusters11.
1.2 Mechanisms of Antidepressants
For quite a long period, little of the biochemical basis of brain disorders, especially in the field of psychiatry, was developed due to the limitation of technology. It was not until the beginning of the 20th century that a variety of techniques, including electrophysiology and brain imaging, enabled the research of the regulatory mechanisms of the brain12. Whilst the pathogenic mechanisms for depression remain unclear, a series of brain imaging stud-ies have shown that, the alteration of neuronal activities in a single brain section may not lead to depression. Furthermore, emerging evidence shows that, the co-regulations of de-pressive state involve different brain regions including the hippocampus, amygdala, dorsal raphe nucleus, prefrontal cortex13.
The monoamine theory, first proposed by Joseph Schildkraut in 1965, is the main bio-chemical theory describing that the deficit of monoamine neurotransmitters such as nor-adrenaline and 5-hydroxytryphtamine (5-HT) might be the main causes of depression14. Monoamine neurotransmitters are responsible for maintaining the neurotransmission of the monoaminergic signal transductions, which are important for the regulation of cog-nitive functions including emotion. The monoamine hypothesis is supported by the ob-servations associated with the clinical effects of the known drugs, which might regulate the monoaminergic transmission in the brain15. The evidence have shown that these drugs might interfere the symptoms of depression by enhancing or suppressing the monoami-nergic transmission in depressed patients. In the past decades, the researchers attempted to identify and develop drugs, which might correct the imbalance of the neurotransmitters in of the depression patients16. Based on the monoamine hypothesis, there are three types of anti-depressant drugs that have been developed. The first one is selective serotonin reuptake inhibitors (SSRIs), which remain the most successful therapeutic approach to the depression management. Monoamine such as serotonin might re-enter into the presynap-tic neuron by the specific transporter and SSRIs might selectively inhibit the transporters, increasing the level of serotonin in the synaptic cleft. In addition, the monoamine oxidase (MAO), which is responsible for the degradation of serotonin, is another target for treating depression. The MAO inhibitors might increase the synthesis and storage of noradrena-line or serotonin by inhibiting the activity of MAO, compensating the deficit of the neu-rotransmitters. Monoamine receptor antagonists, e.g., the a2 adrenoceptor antagonists, can enhance the release of serotonin indirectly. Some studies have also reported that the
monoamine receptor antagonists might also have weak inhibitory effects on the mono-amine reuptake process.
Chronic stress has been demonstrated as one of the major causes of depression. It has been reported that the decrease in the brain-derived neurotrophic factor (BDNF) is associ-ated with the depressive behaviors17. The lowered level of BDNF could induce the degener-ation of neurons in the hippocampus by suppressing the neurogenesis, retracting dendrit-ic growth and leading to neuronal loss18. Many researches have reported the findings that the size or volume of the hippocampal area might shrink in the depression patients19, 20. On the other hand, the levels of BDNF were decreased in the blood of the depressed patients. After the anti-depressant treatment, the levels of BDNF were elevated. These findings sug-gest that BDNF, as well as its receptor, TrkB, might be closely associated with the pathology of depression. Recent studies have shown that Kai Xin San, a prescription of traditional Chinese medicine, might relieve the depression-like symptoms in stressed rats and induc-es neurogenesis in cultured neurons by promoting the expression of BDNF21. Furthermore, exposure of chronic stress might lead to the dysregulation of glutamate level, which is also believed to play an important role for the pathological progress of depression. Glutamate interacts with ionotropic glutamate receptors and metabotropic glutamate receptors at the synapses, regulating synaptic signal transmission and plasticity. Glutamate might dif-fuse out of the synapses and interact with the extrasynaptic glutamate receptors22. Acti-vating the extrasynaptic glutamate receptors might produce neurotoxicity, which might induce apoptosis in the neurons. Recent studies have shown that these chemicals, which might enhance the clearance of glutamate, can provide antidepressant effects in the ani-mal with depression symptoms induced by chronic glucocorticoid exposure. Furthermore, ketamine, the ionotropic glutamate receptor antagonist, might offer the rapid antidepres-sant effects within hours after the administration23. The rapid anti-depressant effects of ketamine might involve the rapid activation of the mammalian target of rapamycin (mTOR) pathway24. The mTOR pathway regulates the synaptic plasticity, which might be the novel therapeutic target for developing the rapid anti-depressants. These lines of evidences have suggested the dysregulated glutamate level might greatly contribute to the pathological progress of depression.

192 193
2. Results
2.1 Marketed Drugs for Depression in the US
Because most drug developers prefer to apply for US patents to protect their core tech-nologies, we focused on studying the US patents in this work. We collected all marketed antidepressants’ information including action, generic name, average year of patent grant, patentee and country from the IMS Patent Focus database, as summarized into Table 1. So far, 25 drugs for depression treatment have been approved by the US FDA (Food and Drug Administration) (Note that some drugs have more than one dosage form, such as bupropi-on.), and all of them belong to the category of Action 1, i.e., directly increasing the activity of the brain’s serotonergic or noradrenergic or dopaminergic system.
Table 1. Patent information of marketed drugs for depression treatment.
a Parts of the information of the countries are not available in IMS database.

194 195
2.2 Antidepressants in the R&D Pipeline
Drug development is known for its time-consuming and high risks of failure. In conse-quence, only a small number of drugs could be successfully launched into the market at the end. Besides marketed antidepressants, our study also paid attention to the entire R&D (research and development) process of antidepressants, including statuses and phases of Discovery, Preclinical, Phase I, Phase II, Phase III, Suspended, Discontinued and Marketed.
IMS R&D Focus, a comprehensive and structured database, monitors the whole progress of new active substances throughout the R&D pipeline ranging from the discovery phase to the final marketed phase. Hence, we chose IMS R&D Focus database as the source of data for our study.
The patents of antidepressant R&D projects were collected through querying ATC (An-atomical Therapeutic Chemical) codes of N6A family, i.e., N6A2, N6A3, N6A4, N6A5 and N6A9, against the IMS R&D Focus database. Each code represents a type of depression diseases or syndromes. The resulted 541 patents approved by different countries were fur-ther transformed into 387 corresponding US patents by the patent family system of the International Patent Documentation Center, so as to obtain the standard and comparable patent citation data. The workflow of data collection and pre-processing were summarized and shown in Figure 1.
Figure 1. Data collection and pre-processing flow chart
Initially, we analyzed the patent data obtained and characterized them. Figure 2 shows the distribution of all 387 US patents by the aforementioned four types of actions.
Figure 2. Illustration of distribution of patents by 2-year cohorts of patent grant.
The curve in Figure 2 reflects the annual fluctuation of the patent number. At the begin-ning, the number of the annual total patents kept increasing slowly. Then it climbed onto the peak in year 2006-2007 and finally fell into the low level as it was in the beginning. Based on the distribution, we divided the time line into 3 stages in general. The first one is from the beginning to 1995, during which the number of patents grew in a slow speed. The next stage is from year 1996 to 2007 during which we found the peak of the patent numbers and therefore considered the climax period of antidepressant patenting. In last stage, i.e., after the year 2007, the number of patents declines. Moreover, the peak that ap-peared in years 2006-2007 is partly owing to an R&D project with a large number of patents granted in the year 2007.
Amongst the 4 types of mechanisms of action, Action 1 established an unshakable po-sition. The percentage of patents of Action 1 occupies over half of the total patents, and actually accounts for 76% of all (Figure 2). The number of patents of Action 3 increased only a bit during 1990-2007, and no significant increase is observed. The patent number of Action 2 remains low. These evidences are consistent with the fact that, the Action 1-based antidepressants are the predominant antidepressant in the current market, whilst other 3 types of mechanisms of action for antidepressant development still have a long way and phases to get through in terms of drug development.

196 197
As mentioned above, the mechanisms of action of antidepressants are generally divided into four categories. And we further categorized these four categories into more detailed subcategories, as shown in Figure 3. The top four subcategories, i.e., the dopamine an-tagonist, 5-HT antagonist, SRIs (5-HT reuptake inhibitor) and NDRIs (dopamine reuptake inhibitor and norepinephrine reuptake inhibitor), all belong to Action 1. Neurokinin antag-onist and CRF antagonist belonging to Action 3 also take important positions whereas the patents of the rest two types of mechanisms of action are less prominent than the former two’s in the patent count.
Figure 3. Distribution of patents by mechanisms of action.
Figure 4 tells that drugs in marketed phase have the largest share of patents, and 90% of these patents belong to Action 1. These facts indicate that the development of antide-pressants may be in the mature stage. Note that drugs of marketed phase here are not only limited to those in the United States market, also include antidepressants marketed in other countries.
Discontinued phase takes the second largest share of patents, indicating a high failure rate of antidepressants R&D. Interestingly, besides patents of Action 1, those of Actions 3 and 4 also contribute a considerable proportion in the discontinued phase (Figure 4). Notably, patents of Action 3 distribute merely in the phases limited to preclinical, phase I, phase II and discontinued. What is worse, a number of patents of Action 3 is in discontinued phase. From this observation, we infer that great difficulties exist in R&D projects for antidepres-sants of Action 3, whose patents have been prevented from proceeding to the marketed phase.
The Preclinical, Phase I, II and III stages consist of other kind(s) of patent in addition to Action 1, suggesting the on-going researches for other mechanisms of antidepressants.
Figure. 4 Illustration of distribution of patents by phases of the drug pipeline.

198 199
For each type of mechanism of action, the four pie charts in Figure 5 display the patent distribution by different phases. Patents of marketed drugs account for over half of all pat-ents in the pie chart of Action 1. The rest of two integrated phases, i.e., Preclinical & Clinical and Discontinued and Suspended, occupies 19% and 22%, respectively. Unlike Action 1, patents in Preclinical and Clinical stage account for over 80% in the pie chart of Action 2. While in the pie chart of Action 3, patents in Discontinued and Suspended stage account for nearly 67%. To summarize, the development of antidepressants of Action 1 is approach-ing to the mature status, and the antidepressants of Action 2 seem to be in the infancy, whereas the outlook of R&D of antidepressants of Action 3 is less optimistic.
Figure 5. Illustration of distribution of patents by actions and phases of the drug pipeline.
Note: Note that the preclinical phase and clinical phase I, II and III are integrated into the legend
“Preclinical & Clinical” in blue.Top five patentees are Alexza Molecular Delivery, Sanofi, GlaxoSmithKline, Eil Lilly and Mer-ck, as seen in Figure 6. However, all the 74 patents of Alexza Molecular Delivery belong to the same project. This project is ADASUVE® (loxapine), a marketed dopamine antagonist drug treatment for depression.
Figure 6. Distribution of patents by patentees. (Only included patentees holding more than or equal to 5 patents).

200 201
Patents are also counted by company, which displays a different pattern of distribution compared with Figure 6 (Figure 7).
Figure 7. Distribution of patents by pharmaceutical company.
Figure 8. Distribution of patents by countries.
Ranked via the number of patents, the top 5 countries in antidepressants R&D patenting are identified, and they are the USA, France, Japan, Germany and Sweden in the descend-ing order (Figure 8).
2.3 Patent Citation Network
Visible patent citation network can show a historical record of the flow of knowledge as well as offer a successional angle to view the cross-mechanism of technology25.
Figure 9. Seven clusters are identified in the antidepressants patent citation network (Nodes with no citation relations have been removed out of the citation
network).

202 203
387 patents in total have been identified in the database of the USPTO. However, patents without citation relation do not make sense in the technology flows and thus were re-moved from the network as they are isolated nodes. As a result, 164 patent nodes were removed, and the rest of the 223 patent nodes and their corresponding 1,852 internal ci-tation edges identified formed the antidepressant patent citation network. Figure 9 shows the technology flow in the antidepressants patent citation network. Nodes with different colors represent patents of different mechanisms of action, and edges represent citations between patents. The average degree of the overall citation network is 8.305, reflecting the high connection number of the entire network.
From Figure 9, we figured out that technology flows between different mechanisms of action are rare. In the other words, antidepressant technology flows mostly occur with-in same mechanism of action, e.g., the cluster 1 to 5. Interestingly, all the 74 patents in cluster 1 come from one single R&D project, and these patents only quote patents of the same project but do not quote patents from other R&D projects. It seemed that such case is common except for the cluster 6, which is the only cluster displaying the technology flow amongst different mechanisms of action. Though dominated by patents of Action 1, a patent of Action 1 in cluster 6, related to a 5-HT antagonist, cited a patent of Action 2 (glutamate and GABA agonist) and a patent of Action 3 (sigma agonist).
3. Discussion/Implications for China
As mentioned in previous section, a large portion of both the mental and physical health of the world population is severely threatened by depression. Despite the constant develop-ment and advancement in anti-depressive treatments, approximately 40% of depressive patients are still suffering from treatment-resistant symptoms coupled with severe decline of physical health, suicidal thoughts and quality of life. Unfortunately, this is also true for depression patients in China. The circumstance in China is perhaps far worse than any oth-er country. An epidemiological survey carried out during year 2001 to 2005 reported the incidence rate of depression in China reached an extremely high level of 6.1%, which is double the global average incident rate of 3.1%. In other words, a large population of Chi-nese people of as many as about 90 million are suffering from depression as well. Yet, this figure is just a conservative estimation not including those potential patients not identi-fied. Furthermore, the incidence rate of depression in China seems to increase.
Depression can cause great harm on different levels, i.e., individual level and group level, and even the national level. On an individual level, depression is the inheritable disease,
meaning that the children of the patients will be in greater risk of being the patients as well. Similar to patients in other countries, depression patients in China tend to commit suicide, too. It is reported that, depression patients are with the suicide risk of 19%, i.e., one of every 5 depression patients commit suicide. In China, suicide results an annual death toll of 278,000, and amongst which, 63% are with mental problems and 40% are with depres-sion, according to estimation. Reports also revealed that people in the highly urbanized metropolitans such as Shanghai, Beijing, and Guangzhou are bearing greater financial and survival stresses due to the intense workload, and hence possess higher risk of depression.
Depression not only harms the health and life of people, it also causes economic loss on group and national level by lowering the working efficiencies and productivities of the labor forces. Moreover, the resulted medical cost is also a heavy burden of the whole coun-try. It is estimated that depression results in an annual economic loss of over 100 Billion US Dollar in Asia, and by 2020, it will become the disease with the second heaviest healthcare burden in the world according to WHO. In terms of China, depression is estimated to cause an annual loss of 51.37 Billion RMB, in which 5.62 Billion is for medical care.
Bearing in mind the huge economic loss caused by the depression, the urgent need for de-pression treatment should be taken seriously. Meanwhile, there is further bad news about the treatment coverage. Merely less than half of the global 350 million patients receive therapy. In China, the figure is even lower and estimated to be only 5%. Reasons account for this figure vary; some patients do not consider depression as disease and hence are not aware of the need for treatments, whilst others fear the side effects of current antidepres-sants in the market and therefore refuse to take the pills.
Unfortunately, new evidences rationalized the worry of the latter. A recent study from Aus-tralian scientists claims that, treated with current antidepressants in the adolescence, side effects on children and teenagers may last forever, for instance, the headache, tiredness, and even the emergence of suicidal thoughts. Consequently, this increases the risk of de-pression in their adulthood. Furthermore, results from recent meta-analysis unveiled that most of the antidepressants are ineffective on children and teenagers.
Altogether, so many evidences demonstrated that undeniable side effects exist in current pharmacotherapy, despite the fact that pharmacotherapy is the most effective treatment so far. Therefore, it should be borne in mind that the unsatisfying efficacy of current anti-depressants cannot support the enormous demand in China, and novel antidepressants with better efficacy and fewer side effects must be developed as they are in urgent need.
204 205
Although current marketed antidepressants are all developed by foreign countries, China should accept the fact that it has been left behind in terms of antidepressant development, and it is never too late to make efforts to catch up with other countries. Interestingly, a recent epidemiological survey on 18 countries with different income levels revealed the US and France were the top 2 countries with the highest incidence rate of depression, fol-lowed by Japan and Sweden. The country ranking by patent number in Figure 8 basically follows the same order. It seems that countries with the higher incidence rate of depres-sion invest more on R&D of antidepressants and thus harvest more.
Actually, current global R&D conditions of antidepressants offer great chance and timing for China to join the game. As analyzed above, the whole world including China itself is in great demand of better antidepressants. The current condition is that, amongst 4 different types of mechanisms of actions for antidepressants, the antidepressants of Action 1 are dominating the market, while R&D of antidepressants of other mechanisms is still in infan-cy. Although known defects exist in Action 1 type of antidepressants, pharmaceuticals are still in favor of improving these old drugs by researching on reducing the side effects and lowering the frequency of medication, rather than developing new drugs based on other mechanisms. For example, selective norepinephrine reuptake inhibitor (SNRIs) have the same efficacy with TCAs and SSRIs, but fewer adverse reactions. The preference of pharma-ceuticals is due to, on one hand, as mentioned in previous section, developing new drugs is by no means easy and it is with high risks of failure. On the other hand, the higher abun-dance and accessibility of existing knowledge about Action 1 keeps pharmaceuticals in the comfort zone, and thus made them stick to research on Action 1 based antidepressants.
In summary, our network analysis of patent citation revealed that, antidepressive drugs based on Action 1 are becoming mature. We question how much space is there to improve for these old drugs. Nevertheless, development of drugs of other mechanisms remains in a primary stage as the R&D on them lacks significant breakthrough, e.g., drugs of Action 3 once have had potential to develop while they are discontinued now. As every coin has two sides, on one hand, we are quite concerned about this worrisome phenomena of an-tidepressant development. On the other hand, we are glad to find that drug R&D of other kinds of mechanisms remains in the infancy, and therefore their drug innovations are with great potential to be research and developed. Hence, it is a great timing for Chinese re-searchers to take this challenge and study on these mechanisms that have yet to be fully researched and developed, when competitors are now spending lots of times on the old drugs.
Meanwhile, another global marathon started recently that China has to join. More and more governments in different countries have become highly aware of the urgent needs for exploring the human brains and researching the neuroscience to acquire knowledge of the brain and nervous system and fight against the relevant diseases such as depression and Alzheimer’s disease. As a result, countries around the world initialized their own brain and neuroscience research plan one by one and started the huge investments of resources into the related research projects. Pioneered by the USA’s “BRAIN Initiative” in 2013, Euro-pean Union and Japan, too, started their “big brain projects” soon thereafter. These actions will surely facilitate the antidepressant innovation in their respective countries.
Fortunately, China is catching up with these countries with its active pace. China initial-ized its own large research plan about brain sciences in 2015. This suggests that, Chinese policymakers have realized the necessity of developing neurosciences, which ultimately will serve as the powerful knowledgebase for therapeutic innovation on neural diseases including depression.
A latest good news from Chinese pharma industry is that a novel Chinese medicine based antidepressant jointly developed by Xinjiang Huachun group and Tsinghua University has passed the phase III of clinical trial, and it is ready for registration. This is an exciting and successful example of drug innovation in China. We believe there will soon be more re-search breakthroughs on the human brain and nervous systems brought by these huge neuroscience plans. We also look forward to the fruitful antidepressant innovation in China along with the full elucidation of the pathogenic mechanisms of depression.

206 207
References
1. World Health Organization Health topics: Depression [EB/OL]. http://www.who.int/topics/depression/en/.
2. DEPRESSION: A Global Crisis. World Mental Health Day, October 10 2012 (for 20th An-niversary of World Mental Health Day).
3. World Health Organization Media Centre: Depression [EB/OL]. http://www.who.int/mediacentre/factsheets/fs369/en/.
4. Gordon A, MikockaWalus A, Grzeskowiak LE, et al. Antidepressants for depression during pregnancy. Cochrane Database of Systematic Reviews 2013; (8): 1-17.
5. Berton O, Nestler E J. New approaches to antidepressant drug discovery: beyond monoamines. Nature Reviews Neuroscience. 2006; 7(2): 137-151.
6. Cao L, Ye Y, Luo W. The research progress of antidepressant drug targets. China Phar-macy.2014; 25(13): 1227-1231.
7. 趙會娟,史義靜,劉琨。抗抑鬱藥種類概述及發展趨勢 [J]. 河北化工, 2010; (2): 24-26.
8. Stolpe M. Determinants of knowledge diffusion as evidenced in patent data: the case of liquid crystal display technology. Research Policy. 2002; 31(7): 1181-1198.
9. Narin F. Patent bibliometrics. Scientometrics. 1994; 30(1): 147-155.10. Karki M. Patent citation analysis: a policy analysis tool. World Patent Information.
1997; 19(4): 269-272.11. Xu J, Kong X, Qiu L, et al. Research and development of anti-Alzheimer’s drugs: an
analysis based on technology flows measured by patent citations. Expert Opinion on Therapeutic Patents. 2014; 24(7): 791-800.
12. Nestler EJ, Barrot M, Dileone RJ et al. Neurobiology of depression. Neuron. 2002; 34(1): 13–25.
13. Krishnan V, Nestler EJ. The molecular neurobiology of depression. Nature. 2008; 455: 894–902.
14. Gildengers AG, MD, Whyte EM, et al. Medical burden in late-life bipolar and major depressive disorders. The American Journal of Geriatric Psychiatry. 2008; 16(3): 194–200.
15. Ressler KJ, Mayberg HS. Targeting abnormal neural circuits in mood and anxiety disor-ders: from the laboratory to the clinic. Nature Neuroscience. 2007; 10: 1116–1124.
16. Mathew SJ, Manji HK, Charney DS. Novel drugs and therapeutic targets for severe mood disorders. Neuropsychopharmacology, 2008; 33: 2080–2092.
17. Monteggia LM, Luikartb B, Barrota M, et al. Brain-derived neurotrophic factor condi-tional knockouts show gender differences in depression-related behaviors. Biologi-cal Psychiatry. 2007; 61: 187–197.
18. Airan RD, Meltzer LA, Roy M, et al. High-speed imaging reveals neurophysiological links to behavior in an animal model of depression. Science. 2007; 317: 819–823.
19. Diniz, BS, Butters MA, Albert SM, et al. Late-life depression and risk of vascular de-mentia and Alzheimer’s disease: systematic review and meta-analysis of communi-ty-based cohort studies. The British Journal of Psychiatry. 2013; 202: 329–335.
20. Garza JC, Guo M, Zhang W, et al. Leptin restores adult hippocampal neurogenesis in a chronic unpredictable stress model of depression and reverses glucocorti-coid-induced inhibition of GSK-3β/β-catenin signaling. Molecular Psychiatry. 2012; 17(8): 790-808.
21. Yan L, Hu Q, Mak MSH, et al. A Chinese herbal decoction, reformulated from Kai-Xin-San, relieves the depression-like symptoms in stressed rats and induces neurogenesis in cultured neurons. Scientific Reports. 2016; 6: 30014.
22. Santarelli L, Saxe M, Gross C, et al. Requirement of hippocampal neurogenesis for the behavioral effects of antidepressants. Science. 2003; 301: 805–809.
23. Krystal JH, Sanacora G, Duman RS. Rapid-acting glutamatergic antidepressants: the path to ketamine and beyond. Biological psychiatry. 2013; 73: 1133-1141.
24. Duman RS, Li N, Liu RJ, et al. Signaling pathways underlying the rapid antidepressant actions of ketamine. Neuropharmacology. 2012; 62: 35-41.
25. Sorenson O, Rivkin JW, Fleming L. Complexity, networks and knowledge flow. Re-search Policy. 2006; 35(7): 994-1017.

208 209
Chapter 10
PHARMACEUTICAL PATENT VALUATION BASED ON EMPIRICAL MODELS
Jingyun Ni1, Rong Shao2, Carolina Oi Lam Ung1, Yitao Wang1,
Yuanjia Hu1*, Yong Cai1
1 State Key Laboratory of Quality Research in Chinese Medicine, Institute of Chinese Medical Sciences, University of Macau, Macau SAR, China
2 School of International Pharmaceutical Business, China Pharmaceutical University, Jiangsu, China.
*Corresponding author: [email protected]
This chapter has been published as below.J.Y. Ni, R. Shao, C.O.L. Ung, Y. Wang, Y.J. Hu*, Y. Cai, Valuation of pharmaceutical patents: A comprehen-sive analytical framework based on technological, commercial, and legal factors, Journal of Pharma-ceutical Innovation, 10: 281-285, 2015.

210 211
Abstract
Patent valuation has long been a serious concern in the research-oriented pharmaceuti-cal industry. Although there exists both technological valuation models for specific drug patents and the general (non-drug-specific) patent valuation models based on economet-rics, direct application of these models to patent valuation in the pharmaceutical industry encounters tremendous challenges. This article proposes an integrative and systematic framework for analyzing pharmaceutical patent value, which integrates technological, commercial and legal indicators. This work is of great significance to pharmaceutical re-searchers, managers and investors in their decision-making in relation to patents and pat-ent value.
Key words
Pharmaceutical patents, patent value, valuation, technological factors, commercial factors, legal factors
1. Introduction
In the high-cost and high-risk pharmaceutical industry, patenting is viewed as an import-ant part of intellectual property strategy. As a strong form of protection, a patent generates market exclusivity, enabling branded pharmaceutical manufacturers to maximize market revenues from novel drugs, hence driving further innovation1. There are well-known exam-ples linking drug patent protection and the profits of pharmaceutical firms. For instance, in the case of atorvastatin, sales revenues for the branded product (Lipitor) reached $12.6 billion in 2010, while those of a competitor product called Crestor (rosuvastatin) and a generic alternative (Lipicor) were only $6.8 billion and $8 million, respectively2. Clearly, pat-ents play a critical role in the research-oriented pharmaceutical industry, especially with respect to licensing, technology transfer, venture investment and M&A (mergers and ac-quisitions). As a result, the pharmaceutical industry is interested in developing a reason-able, objective and transparent approach to valuing drug patents.
Although specific drug patents have been evaluated technologically3-6 and general (non-drug-specific) patent valuation models have been successfully developed by econo-mists7-10, direct application of existing patent valuation approaches to the pharmaceutical industry is facing significant challenges due to the high-tech characteristics of pharmaceu-tical industry. In light of this dilemma, the present article proposes a systematic framework
for analyzing pharmaceutical patent value. Unlike the approaches in previous studies, our framework integrates technological, commercial and legal indicators. This is of great sig-nificance to the decision-making of pharmaceutical researchers, managers and investors in relation to patenting and patent value, especially in respect of cross licensing, technology transfer, venture investment and M&A.
2. Existing Patent Valuation Methods
As mentioned above, previous studies on pharmaceutical patent valuation seem to be separately conducted within the pharmaceuticals and economics communities. While the former focuses on the technology value of pharmaceutical patents and neglects the im-plications of patents in a commercial setting, the latter presents a series of econometric valuation methods with little attention to technological factors. The present study focuses on the market value of a patent, which can be defined as the difference between discount-ed future profits accruing to the patent holder during the remaining lifetime of the patent and their likely profits if the patent were held instead by the strongest competitor in the field8. On that basis, it becomes necessary to review existed econometric patent valuation methodology. The classic econometric patent valuation methods can be roughly divid-ed into two categories: market benchmarking methods and non-market benchmarking methods. Market benchmarking methods generally encompass income method, market method and cost method11. Income method considers the income-producing capability of the property rather than the cost of constructing or creating it. The underlying theory is that the value of a property can be measured by the present value of the net economic benefit (cash receipts less cash outlays) to be received over the life of that property. Market method is the most direct and comprehensive appraisal technique. It measures the pres-ent value of future benefits by reference to what others in the marketplace would consen-sually judge that value to be. This method has two pre-requisites: an active, public market and an exchange of comparable properties. Finally, the cost approach measures the future benefits of ownership by quantifying the amount of money that would be required to re-place the future service capability of the subject property.
Although market benchmarking methods are thorough in capturing market information, they are highly time- and resource-consuming and reflect only subjective expectations such as estimated future income. Certain extent of “speculation” is, therefore, inevitable, as subjectivity and uncertainty are always of issue in adopting benchmarking methods. When different appraisers apply the same evaluation approach to estimate the value of a given patent, the results can be entirely different. Additionally, it is very difficult to assess

212 213
patent portfolios comprising a large number of patent rights by using market benchmark-ing methods12.
By contrast, non-market benchmarking methods based on statistics of patent citation, claim and opposition may be more convenient, especially when assessing patent portfoli-os. These methods usually allow early-stage, high-efficiency and low-cost estimations and are therefore now more frequently employed12. However, these non-market benchmark-ing methods have application mainly to general and multi-industry patents, taking little account of the specific technological factors that would ensure their relevance to various industries12.
Apart from the market and non-market benchmarking methods, another patent valuation method has been studied in detail in recent decades. Briefly, this alternative method iden-tifies indicators from patent statistics according to relevant theories and empirical results. It selects appropriate dependent variables reflecting patent value before finally validating the correlation between indicators and patent value to establish a patent valuation model. Reitzig’s review offers a useful account of the core steps entailed by this approach9.The pharmaceutical industry is a research-driven, high-tech environment, in which tech-nologies play a key role. For that reason, none of the methods mentioned above is appro-priate for patent valuation in this sector, as they fail to take account of technology factors such as chemical process, dosage form and clinical indication. To date, there has been little economic studies on patent valuation specific to therapeutic pharmaceutical agents with due or comprehensive consideration of technological factors. The present research bridg-es the gap between pharmaceuticals and economics by developing a comprehensive analytical framework for pharmaceutical patent valuation encompassing technological, commercial and legal factors.
3. An Analytical Framework Based on Technological, Commercial and Legal Factors
Any such proposed framework should reflect technological importance, therapeutic attri-butes, sophistication, advancement and contribution to pharmaceutical patents in order to fundamentally determine the value of drug patents13. At the same time, technological success must not be wholly equated with commercial success, as it is not unusual to find products of high technological value that are not well recognized by the market. Commer-cial factors represent another set of key determinants. While there exists a commercial log-ic and rules that are generally obeyed, additional commercial factors may come into play,
especially in the case of successful blockbuster drugs, which carry an extremely high mar-ket value14, 15. Since any technology product has commercial value only when commercial-ized to the market, commercial considerations based on business logic and rules should be seen as indispensable in assessing the value of pharmaceutical patents. In addition, sustainable revenue streams for patented products in a competitive market will depend on how any exclusive rights covered by claims of patent are protected in the legal system. In other words, sustainable market value is not generated by products that have technolog-ical and commercial advantages but are exposed to competition without adequate legal protection. It follows that completeness and effectiveness of legal protection of exclusive patent rights are also crucial factors when measuring the market value of patents16.
Figure 1. Analytical framework based on technological, commercial and legal factors

214 215
Figure 1 presents the proposed comprehensive analytical framework for assessing phar-maceutical patent value on the basis of technological, commercial and legal factors. The yellow-shaded area refers to the latent variables or value drivers that determine pharma-ceutical patent value but are not directly accessible to empirical observation or measure-ment. The grey-shaded area denotes measurable indicators. This comprehensive frame-work ensures that the analysis acknowledges the overall relationship among technology, commercial and legal factors. Based on a review of the literature, relevant latent variables and indicators of pharmaceutical patent value have also been identified and integrated in the analytical framework. These are further elaborated below.
3.1 Technological Factors
The principal technological factors of relevance to drug patent valuation include technol-ogy evolution, types of technology and drug safety and efficacy. The first of these (technol-ogy evolution) is captured by backward and forward citations. Patent citations are widely seen as powerful tools for representing technology diffusion and evolution8, as inventors must cite all related patents in their submission, while patent examiners are responsible for ensuring that all appropriate patents have been cited. In this context, prior patents cited in a patent application are called “backward” citations, while “forward” citations refer to all subsequent patents citing a given patent in their own application. In some studies, pat-ent citations have been used to identify valuable patents by reference to the “big picture” of technology evolution17. Backward citations reflect the technological distance between patents and the state of the art; forward citations demonstrate technological expansion and development in the subsequent period. Patent citations indicate the position or value of a patented technology in the overall evolution of a technology. For present purposes, patent citations are regarded as technological factors although they were originally con-sidered to be legal in nature.
Second, because drug patents can be divided into several technological categories (in-cluding new chemical entity (NCE), new dosage form, new indication and etc.), some em-pirical studies have suggested that certain types of technology are drivers of patent value or significantly associated with patent value. For example, NCE patents have a higher mar-ket value by comparison with other types of patents12, 18.
Additionally, pharmaceutical patents are usually embedded in specific pharmaceutical products or drug candidates. Basic pharmaceutical features of drugs or drug candidates, such as safety and efficacy, directly affect the value of pharmaceutical patents. Therapeutic index (TI) is one indicator of drug safety, defined as the amount of a therapeutic agent that
causes the therapeutic effect relative to the amount that causes death (in animal studies) or toxicity (in human studies) (TI = LD50/ED50), in which a higher therapeutic index is pref-erable to a lower one. On the other hand, the number of drug targets is also considered as a proxy indicator of drug efficacy in terms of the effectiveness of multi-target therapy19.
Finally, phases of drug development comprehensively reflect the safety and efficacy of drugs or drug candidates and are therefore considered relevant to patent value. There are four phases in the high-risk pharmaceutical lifecycle: discovery, preclinical study, clinical test (Phase I, II and III) and marketed stage.
3.2 Commercial Factors
Business logic and rules dictate that market capacity, competition intensity and commer-cialization feasibility are necessarily involved in pharmaceutical patent valuation. First, market capacity as measured by therapeutic areas, market share and market growth rate directly reflects the size and trend of the target market. For example, patents relevant to prevalent and chronic diseases have higher economic value because of their huge and robust patient pool as compared to “orphan” drugs15.
Market competition intensity, as captured by the number of competing products and companies, is also a crucial commercial factor in assessing the value of a drug patent. It is assumed that a greater number of homogeneous or alternative products and companies in the same target market will attract higher market competition, leading to less market share for each individual product and company, where all other commercial factors are constant18.
Commercialization feasibility is also a key factor in estimating a patent’s economic value. In general, complementary resources involving technology, assets and materials are needed to commercialize a patent-protected invention, and availability of these complementary resources is also taken as a measure of commercialization feasibility9.
3.3 Legal Factors
With regard to legal factors, this framework for pharmaceutical patent valuation must take account of the scope of patent protection and the difficulty of inventing around, as well as relevant procedural issues.
Scope of patent protection refers to the territory or area of technological exclusivity. Num-
216 217
ber of claims and family size are employed as indicators to measure the scope of patent protection. Claim is indicative of protection breadth, which exerts a positive effect in blocking competitors. Family size, computed as the number of countries or patent offic-es in which patent protection has been sought for the same invention, is associated with preliminary market coverage18, 20. For these reasons, these two indicators have a positive influence on pharmaceutical patent value.
The difficulty in inventing around variable describes the blocking power inhibiting com-petitors seeking to circumnavigate the patent-protected invention with a new technology. Theoretically, this variable is reflected by a patent portfolio derived from a series of patent applications, which are combined to protect a specific technology20. A patent portfolio stresses the dimensionality of patents, in that only promising drugs warrant so much en-deavor in constructing a huge patent network. A larger patent portfolio indicates more effort and input from the patent holder in protecting the product’s exclusivity or delaying the entry to market of generic products.
The procedural issues variable encompasses patent age, legal disputes, patent coopera-tion treaty (PCT) applications and accelerated examination requests. Numerous empirical studies have suggested that these indicators to some extent denote the importance of patent-protected invention and are significantly correlated with drug patent value16. For example, one such study found that patents were more likely to be legally “attacked” in an opposition procedure as patent value increased16.
4. Concluding Remarks
This work has proposed an analytical framework for patent valuation that integrates tech-nological, commercial and legal factors. Technological factors are fundamental to phar-maceutical patent value; commercial factors are prerequisite elements in the process of commercializing technology outputs; and legal factors are the best shield in sustaining the high economic value of innovation in a competitive environment. This comprehensive analytical framework ensures that the analysis of patent value will be conducted with due regard to the overall relationship among technology, commercial and legal factors.
It is worth mentioning that all of the indicators incorporated in this framework have been directly or indirectly tested in prior empirical studies. Most of the relevant data are avail-able early in the lifetime of a patent or from publicly available information which can be acquired and processed at low cost. The proposed framework has the advantages of high
effectiveness, early predictability and easy accessibility in the analysis of pharmaceutical patent valuation.
In view of the importance of pharmaceutical patent value, subsequent studies might use-fully extend this framework to other areas of concern, perhaps inspiring a series of prom-ising applications to cross licensing, technology transfer, venture investment and M&A in the context of patent value. In addition to the key indicators integrated in the framework, there remain in practice other indicators that affect drug patent value but have not as yet been fully explored.

218 219
References
1. Jones N. Patents discipline is key to securing big pharma investment. Drug Discov-ery Today. 2012; 17(1-2): 1-2.
2. DiMasi JA, Hansen RW, Grabowski HG. The price of innovation: new estimates of drug development costs. Journal of Health Economics. 2003; 22(2): 151-185.
3. Shi ZH, Li NG, Tang YP, et al. Prolinamide derivatives as thrombin inhibitors for the treatment of thrombin-mediated diseases: a patent evaluation of US2013296245. Expert Opinion on Therapeutic Patents. 2014; 4(10): 1139-1148.
4. Geldenhuys WJ, Abdelmagid SM, Gallegos PG, et al. Parkinson’s disease biomarker: a patent evaluation of WO2013153386. Expert Opinion on Therapeutic Patents. 2014; 24(8): 947-951.
5. Nakajima K, Kobayashi J. Antibodies to human angiopoietin-like protein 3: a patent evaluation of WO2012174178. Expert Opinion on Therapeutic Patents. 2014; 24(1): 113-119.
6. Winum JY, Capasso C. Novel antibody to a carbonic anhydrase: patent evaluation of WO2011138279A1. Expert Opinion on Therapeutic Patents. 2013; 23(6): 757-760.
7. Schankerman M, Pakes A. Estimates of the value of patent rights in European coun-tries during the post -1950 period. The Economic Journal. 1986; 96: 1052-1076.
8. Harhoff D, Scherer FM, Vopel K. Citations, family size, opposition and the value of patent rights. Research Policy. 2003; 32(8): 1343-1363.
9. Reitzig M. Valuing patents and patent portfolios from a corporate perspective: theoretical considerations, applied needs and future challenges. Edward Elgar Publishing Ltd, Cheltenham; 2006.
10. Deepak H, Bhaven S. Examiner citations, applicant citations, and the private value of patents. Economics Letters. 2009; 105(3): 287-289.
11. Smith GV, Parr RL. Valuation of Intellectual Property and Intangible Assets, 3rd edition. New York: John Wiley; 2000.
12. Griliches Z. Patent statistics as economic indicators: a survey. Journal of Economic Literature. 1990; 28: 1661–1707.
13. Hu YJ, Bian Y, Wang YT. Opening the black box of pharmaceutical patent value: an empirical analysis. Drug information journal. 2008; 42: 561-568.
14. Lin W, Zhao ZD, Yang ZG, et al. Establishment of Drug Value Indicators System. China Pharma. 2013; 24(1):7-10.
15. Anonymous. Is that it, then, for blockbuster drugs? Lancet. 2004; 364(9440): 1100.16. Zhang YR, Li L, Hu YJ, et al. A quantitative study based on impact factors of blockbust-
er drugs. Chinese Journal of New Drugs. 2011; 20(8): 669-672.
17. Reitzig M. Improving patent valuations for management purposes -validating new indicators by analyzing application rationales. Research Policy. 2004; 33(6): 939-957.
18. Xu JC, Kong XJ, Qiu L, et al. Research and development of anti-Alzheimer’s drugs: an analysis based on technology flows measured by patent citations. Expert Opinion on Therapeutic Patents. 2014; 24(7): 791-800.
19. Guo Y, Hu YJ, Zheng ML, et al. Patent indicators: a window to pharmaceutical market success. Expert Opinion on Therapeutic Patents. 2013; 23(7): 765-771.
20. Boran AD, Iyengar R. Systems approaches to polypharmacology and drug discovery. Current Opinion in Drug Discovery & Development. 2010; 13: 297-309.
21. Neuhäusler P, Frietsch R. Patent families as macro level patent value indicators: apply-ing weights to account for market differences. Scientometrics. 2013; 96: 27-49.

220 221
Chapter 11
CROSS-REGIONAL PHARMACEUTICAL TECHNOL-OGY TRANSFER IN CHINA: AN EMPIRICAL STUDY
BASED ON SPATIAL INTERACTION MODEL
Jingyun Ni1, Yuanjia Hu1*, Jianbo Wan1, Thomas Scherngell2, Fung Kwan3
1 State Key Laboratory of Quality Research in Chinese Medicine, Institute of Chinese Medical Sciences, University of Macau, Macau SAR, China.
2 Innovation Systems Department, AIT Austrian Institute of Technology, Austria.3 Department of Economics, Faculty of Social Sciences, University of Macau, Macau
SAR, China.* Corresponding author: [email protected].

222 223
Abstract
Background: Cross-regional technology transfer has been increasingly implemented in China, and it is playing a more and more important role in Chinese drug innovation perfor-mance. However, few attempts have been made to identify determinants of cross-regional pharmaceutical technology transfer in China. This study hence aims to identify the influ-ence of different factors in cross-regional pharmaceutical technology transfer in China and propose policy recommendations. Methods: We employ spatial interaction model in this study to identify different kinds of factors that influence pharmaceutical technology transfer in different spatial entities. The research sample is composed of 2,076 cases of pharmaceutical patent licensing from ex-ternal domain to firms in SIPO (State Intellectual Property Office of China), geographically covering 31 province-level regions in China. Results and Discussion: R&D (research and development) input and output in the origin region and technological demand in the destination region have positive associations with the cross-regional pharmaceutical technology transfer in China. Spatial distance shows a negative regression coefficient, which reveals that pharmaceutical technology transfer is significantly affected by geographical proximity. Fully opposed spatial spillover effects are observed between R&D input and output. This difference further implies synergistic and antagonistic relationships between regions. Accordingly, some relevant strategies have been proposed to stimulate pharmaceutical technology transfer. Conclusions: This article sheds light on main determinants on cross-regional pharmaceu-tical technology transfer in China based on spatial interaction model. Through empirical test, we confirmed some influence factors. Based on results, some relevant strategies have been proposed to stimulate pharmaceutical technology transfer. This study can provide some references for policy makers, technology agencies, R&D managers.
Key words
Cross region; Pharmaceutical technology transfer; Influence factors; China.
1. Introduction
In the current age of knowledge-based economies, cross-regional technology transfer has received much attention in both academia and industry. Accumulating evidences indicate that the movement of knowledge and technology can drive the pace of innovation and trigger economic development1. In the case of high-tech and high-risk pharmaceutical in-dustry, drug development process includes crucial disciplines such as chemical develop-ment, drug metabolism, pharmaceutical formulation, clinical trial and regulatory science2. To integrate external knowledge sources into their own innovation process, more and more pharmaceutical companies break through geographical restraint to share specific strength and decrease cost3-5.
As an emerging economy, China has been achieving dramatic development. The Chinese pharmaceutical industry is a prominent example, and it is predicted to become the sec-ond-largest pharmaceutical market in the world by 20156, 7. In recent years, high priority has been devoted to the development of new medicines in China. However, China’s wide territory has caused essential resources for pharmaceutical development such as technol-ogies, talents, capitals, infrastructures, and policies, to be scattered geographically. In this context, cross-regional technology transfer has been increasingly implemented and it is playing the more important role in contributing to Chinese drug innovation performance8,
9.
The theory of regional innovation believes that geographic boundary have a significant impact on the trajectory and performance of industrial innovation due to the spatial het-erogeneity of regional innovation system such as economic base, source endowment, in-dustrial performance and policy environment10, 11. Since the beginning of the 1980s, the regional dimension has been a crucial component of Chinese policy. China’s size and ge-ography naturally contribute to an emphasis on the role of the regions (or provinces)4. As a consequence, it is necessary to analyze cross-regional pharmaceutical technology transfer in Chinese province level.
In previous literatures, some scholars have addressed spatial distribution of technology transfer in China. They investigated the patterns of knowledge transfer and technology exchange at Chinese province level. The results demonstrated that innovative actions ex-hibit strong local and specific characteristics shaped by regional institutions12. One of the most prominent features of technology transfer in China is the disequilibrium between different regions8. However, these previous studies only map the patterns of cross-regional technology exchange, few attempts have been made at what determines cross-regional

224 225
technology transfer in China. The influence factors, including the specific country, specific time period, and specific industry, have never been tested by any empirical study. We be-lieve this is an increasingly vital question to comprehensively understand pharmaceutical technology transfer in China. It can provide references for policymakers to stimulate tech-nology transfer and pharmaceutical innovation in China. To fill this gap, this study aims to investigate technology transfer in pharmaceutical industry of China, and identify the influence of different factors into cross-regional technology transfer by employing a spa-tial interaction modeling approach. Furthermore, based on the results, we propose some policy recommendations for pharmaceutical technology diffusion in China. The remainder of this paper is organized as follows. Section 2 presents theoretical review of relevant influence factors on technology transfer. The next section introduces the data sources and methods used in this study. In section 4, the results of the empirical analysis are presented. Finally, the paper ends with a discussion on the implications for policies and innovation theories in addition to concluding remarks.
2. Literature Review
Overall, influence factors of technology transfer can be summarized in five aspects, in-cluding supplier-side factors, receipt-side factors, transfer platform factors, technological factors, and environmental factors13-17. Up to now, no consensus yet has been reached on what determines technology transfer. Based on resource-based theory, some previous studies empirically tested the relationship between R&D source and technology trans-fer18-19. For example, using panel data from 1980 to 2001, O’Shea et al. found that the size and nature of financial resources allocated to universities influence academic entrepre-neurship20. Especially, the size of federal science grants demonstrated positive orientation on technology commercialization of university research in life sciences. According to Gre-gorio and Shane, patenting activity has a significantly positive effect on technology trans-fer21. However, not all evidences demonstrate that R&D funding have positive impact on technology transfer activity. To illustrate, Powers indicated that federal R&D funding has positive correlation with technology transfer, while the institutional R&D and state R&D have a strong influence on patenting activity but no measurable effect on technology transfer22, 23. Wu and Dong investigated 36 Chinese universities in the period 2003-2007, and the results show that R&D funding has no significant impact on technology transfer in these universities in China24.
In addition, demand-side characteristics also affect technology transfer activity25. From
a ‘knowledge-based’ perspective, some previous studies have investigated the link be-tween absorptive capacity of recipient-side and technology transfer. Martin and Salomon addressed the role of tacit knowledge in constraining a firm’s ability to do internation-al technology transfer and examined the impacts of knowledge transfer capacity26. They found the effectiveness of technology transfer will reach the peak when absorptive ca-pacity of recipient-side simultaneously matched transfer capacity of the organization that develops knowledge (source transfer capacity). Based on firm data, Arvanitis et al. explored determinants of knowledge and technology transfer activities between firms and science institutions in Switzerland27. They found that ability to absorb new knowledge and the existence of R&D activities is an important precondition for technology transfer activities. Though many studies emphasized that the demand-side factors of the technology market should be considered, there are some distinguished conclusions. By using a novel firm-lev-el dataset that combines a Japanese Patent Office survey and the licensing activity survey, Kani et al. estimated the influence factors of technology licensing28. The results show that potential demand for the technology measured by forward-citations is not statistically sig-nificant in influencing patent licensing.
Moreover, some researches propose that the analyses of technology transfer have to consider the impact of regional environment. Utilizing spatial dimension, the scholars addressed the analysis of geographic distance pertaining to technology transfer. For in-stance, Coccia and Rolfo used the spatial barycenter as a tool, and showed that the tech-nology transfer intensity is spatially concentrated within circular areas with radii from 86.8 km (min) to 417.9 km (max) 29. That is to say the technology transfer has spatial proximity effect. With technology transfer, there are various types of spillovers such as knowledge spillovers, market spillovers and network spillovers30; the spillover effect is a driving force in technological development and through different channels the technology diffuses across regions. Friedman and Silberman suggested that R&D and other knowledge source not only generate externalities, but the evidence also suggests that such knowledge spillovers tend to be geographically bounded within the region where the new economic knowl-edge was created31. Bottazzi and Peri estimated the effect of research externalities in gen-erating innovation. They use R&D and patent data for European regions during the period of 1977-1995, and confirmed spillovers are localized and exist only within a distance of 300 km32.
In summary, existing literatures estimate influence factor of technology transfer from vari-ous perspective. However, factors determining cross-regional technology transfer has not reached an agreement, especially in the rapidly developing Chinese pharmaceutical in-dustry.

226 227
3. Methods
3.1 Empirical Model
Spatial interaction models, originally used in Economics, in particular Economic Geogra-phy, are powerful instruments to model interaction across geographic units33, 34. Consider-ing the focus on cross-regional issues, we employ spatial interaction model in this study to identify different kinds of factors that influence the interaction between different spatial entities.
Notes: Ovals represent regions, between which technologies flow, while underlined words refer
to potential influential factors to cross-regional pharmaceutical technology transfer that
are tested and controlled in this study.
Figure 1. Spatial interaction models of cross-regional pharmaceutical technology transfer
This study mainly discusses three kinds of factors which are technological origin regions, destination regions and interactive associations between them, respectively. The variables considered in this model include R&D input, scientific output, interactive associations be-tween them, and relevant spatial and temporal effects from the angle of licensing-out re-gions35. In addition, it is necessary to consider the geographical distance between regions, as well as the R&D scale of the regions as control variables. These influence factors have never been tested in such specific framework, though they seem to be fully consistent with common theoretical and experienced hypotheses. It is still necessary to examine them by empirical approaches in the specific country, specific time period, and specific industry.
The empirical model to be estimated in this study is given by:
where i and j represent indexes for the origin region and destination region of the technol-ogy transfer, respectively. Tij denotes the frequency of technology transfer from region i to region j. Ii and Oi imply R&D input and output in region i, respectively, while IiOi represents interactive associations between the R&D input and output. Ii* refers to the spillover re-ceived by region i from the R&D input in the surrounding regions j, which is calculated by
Similarly, Oi* represents the R&D output spillover of all external regions to region i, which is estimated by
Mj refers to the technological demand in region j, while Dij is the spatial distance between region i and region j. Ai and Bj are employed as control variables, which show the R&D scale of region i and j, and α and β are relevant parameters, while C is constant and is a stochastic error term36.

228 229
3.2 Data and Variable Measurement
As a representative type of technology transfer, the patent license has been widely used to measure the transfer of technology37. SIPO of China officially published the data of the pat-ent licenses in China. According to the Regulation on Filing Management of Patent Licensing Contracts released by SIPO, interested parties are encouraged to file for patent licensing within three months after the patent license contracts come into effect. In practice, the of-ficial filing of patent licensing contracts is, however, basically generated by patent licensers or licensees on a voluntary basis. Thus, there are few records of past patent licenses in the official database of the SIPO. It is worth noting that the official filing system of patent licenses has contained more and more records during the past five years, with the govern-ment’s encouragement and increasing legal consciousness of the public37.
In this context, the research sample is composed of all pharmaceutical patent licensing from external domain to firms in SIPO between January 1, 2009 and December 31, 2012, which (in total) includes 2,076 cases, geographically covering 31 province-level regions in China, except for Hong Kong, Macau, and Taiwan. This sample is transformed into 961 observations (i.e. regional pairs combined by 31 regions) for estimation of the model at the regional level. The actual number of observations in regression models decreases due to possible missing values of observations in some variables. The province-level location information of the patent licensors and licensees is retrieved in the CPRS (Chinese Patent Retrieval System). Thus, Tij is measured by the accumulated count of the patent licenses from region i to j during the observed period.
More data on the influential factors of pharmaceutical technology transfer in China are elaborated as follows:
• Ii is measured by the total R&D expenditures of region i in 2004, 2005, 2006, 2007, and 2008, respectively.
•. Oi is operationally captured by the number of granted patents in region i in 2008
• Mj is the gross output value of the pharmaceutical industry in region j in 2008, given that high industrial output means strong technological de-mand.
• Dij is measured in terms of the great circle distance between the capital cities of the regions.
• Ai and Bj are calculated by the full-time equivalent of the R&D personnel of pharmaceutical product manufacturing in 2008 in regional i and j, respec-tively.
The data on the above factors have been collected from the China Statistics Yearbook on High Technology Industry published by the China Statistics Press. It is noteworthy that we measure the information on the influential factors in earlier years (for example, 2004 and 2008) to analyze the technology transfer during 2009-2012, in order to reflect the time lagging effects of different factors on technology transfer. Especially, we observe a longer time lag of R&D input and separately measure the effects of R&D input in different years in order to feed the unfixed R&D pipeline from input to output and test the robustness of models.
3.3 Estimation Method
In order to approximate a proportionate change, natural logarithmic form is employed to all variables in the model, while ordinary least squares (OLS) estimation procedures are used as a method of statistical model estimation.
Note: 1 The i and j represent the original region and destination region of the technology trans-
fer, respectively. Dependent variable Tij denotes the frequency of technology transfer
from region i to region j. Ai and Bj are employed as control variables; Ii and Oi imply R&D
input and output in region i, respectively. Ii* refers to the geographic spillover received
by region i from the R&D input in the external regions. Similarly, Oi* represents the R&D
output spillover of all external regions to regioni.Mj refers to the technological demand
in region j.Dij is the spatial distance between region i and region j. IiOi represents inter-
active associations between the R&D input and output.
2 Different estimation results caused by Ii measured in different years, from 2004 to 2008,
are individually shown in the above table, in order to observe time lagging effects of
R&D input in specific years and test the robustness of models.
3 Standard errors (SE) are in parentheses.
4 *Significance at 10% level (two-tailed tests). **Significance at 5% level (two-tailed tests).
***Significance at 1% level (two-tailed tests).

230 231
Tabl
e 1.
Em
piri
cal m
odel
of p
harm
aceu
tica
l tec
hnol
ogy
tran
sfer
4. Results
The estimation results of the empirical model are shown in Table 1. Table 1 shows that all independent variables considered in the model significantly affect the cross-regional pharmaceutical technology transfer in China, while the different factors have different (even opposed) effects. In general, the estimation results are basically consistent with our experienced assumptions. Moreover, the empirical models are roughly robust in terms of different R&D input measured in different years. The slight changes in the model in 2006 may be caused by the relatively smaller size of observations.
First, R&D input and output in the origin region have positive associations with the cross-regional pharmaceutical technology transfer in China. This means that increasing R&D input and output significantly improves the technological supply capability, and may further imply that R&D input, as well as output, accounted for by approved patents in the pharmaceutical industry, have been positively commercialized to transform into concrete industrial achievements in China.
Though R&D output spillover shows the significant effect only in the model in 2008, fully opposed spatial spillover effects are observed between R&D input and output,. This differ-ence further implies synergistic and antagonistic relationships between regions. As a kind of early-stage resource prior to technology transfer, R&D input can be well-shared between neighboring regions. R&D funding gained by one region can relatively freely circulate to adjacent regions, while this kind of spatial spillover decays with the increasing distance. In other words, neighbors of rich regions with sufficient R&D input can win synergistic ben-efits, compared to remote regions. However, neighboring regions competitively provide patents as R&D output for further technology transfer. Neighbors of developed regions with strong innovation achievements have relatively small opportunities to transfer tech-nologies to external regions; therefore, the slightly negative spatial effect is shown in R&D output. Moreover, the interaction term between R&D input and output has a negative in-fluence on pharmaceutical technology transfer. This reflects that increasing R&D input in one region makes a big difference when R&D output of this region is low, but makes much less of a difference when the R&D output is large. In this sense, increasing the share of undeveloped regions in the allocation of overall R&D input should be an optimal policy to stimulate pharmaceutical technology transfer in China.
Technological demand in the destination region has a positive association with pharma-ceutical technology transfer, which further demonstrates that regions with strong techno-logical demand, reflected by high gross industrial output value, have a higher chance of

232 233
receiving technology transfer from external regions28. In addition, it is notable that spatial distance shows a negative regression coefficient, which reveals that pharmaceutical tech-nology transfer is significantly affected by geographical proximity. Long-distance technol-ogy transfer is, relatively, more difficult in the Chinese pharmaceutical industry. Finally, the significant coefficient of the scale control variable shows that the potential bias caused by the regional scale is effectively avoided in this model.
5. Discussion
This study provides evidence for understanding determinants of cross-regional pharma-ceutical technology transfer in China by empirical study based on spatial interactive mod-el. The results clearly show that cross-regional pharmaceutical technology transfer in China is significantly influenced by R&D inputs and outputs of origin regions, technological de-mand of destination regions as well as geographical distance between them. Though they seem to be fully consistent with common theoretical and experienced hypotheses, these influence factors are examined for the first time by advanced empirical approaches in such a framework. In addition to these, spillovers of R&D input and output and interaction asso-ciations between R&D input and output have significant impact on pharmaceutical tech-nology transfer in China. Accordingly, our findings also have implications for policy makers. Some relevant policy recommendations can be proposed to stimulate cross-regional phar-maceutical technology transfer in China.
First of all, increasing R&D investment in the technological origin region can be viewed as a positive strategy to promote cross-regional pharmaceutical technology transfer in China. The pharmaceutical industry is a research-driven, high-tech environment, in which R&D investment play a key role to spur innovative output. China’s R&D expenditure exhibited the most dramatic R&D input growth pattern in recent years, at an average annual rate of 29.1% since 2008 (National science and technology statistical report 2012). In the phar-maceutical sector, as the second largest R&D performer, the Chinese government has in-creased the R&D funding to create an innovation-oriented environment, reflected by the launch of the project ‘‘Key Drug Innovation’’ in 200738. More importantly, it is worth noting that major pharmaceutical technology origin regions such as Beijing, Shanghai, Zhejiang and Sichuan should receive more concern because these regions are highly centralized in R&D resources including outstanding researchers and excellent infrastructure. To some extent, they imply stronger innovation capability, i.e., the power to generate new technol-ogies. The increasing R&D investment in the above mentioned regions will trigger more R&D output. Thus, it helps promote more technology outflowing.
Secondly, improving quality of R&D output represented by granted patents may be a feasi-ble pattern to promote pharmaceutical technology transfer in China. Though China’s R&D output keeps rising tremendously, along with R&D investment expansion, from “catching up” to becoming “world leading” with a great number of patent applications, the quality of patents is a great concern. For example, the numbers of Chinese patent applications have broken through 2 million in 2012, about 33% patents have been granted, of which the pro-portion of invention patent only accounted for 12.4%39. In fact, short life and low-quality patent have provoked a great deal of controversy with Chinese researchers. In recent years, more and more scholars have criticized the numerous “sleeping” patents in China which obviously fail to be commercialized to real innovative drugs well-recognized by end-con-sumers40. Therefore, improving quality of R&D output is a precondition of cross-regional pharmaceutical technology transfer in China.
Thirdly, pharmaceutical industry concentration in China should be enhanced. The study demonstrates that technology absorption capability seems to be essentially determined by pharmaceutical industry scale of recipient side. As of 2012, there are around 4,500 do-mestic pharmaceutical manufacturers and 14,000 domestic pharmaceutical distributors in China, of which more than 70% are small-scale enterprises (employees less than 300, operating revenue less than 3 million USD) 41. Due to the lack of R&D resource related to drug discovery and development, most of small-scale firms were engaged mainly in low-value-added activities such as manufacturing, formulating, packaging and distribut-ing generic productions rather than innovation activities. As a result, they have a relatively limited technology demand. In this sense, enhancing pharmaceutical industry scale and concentration in technology inflow region such as Jiangsu, Guangdong and Shandong may be conducive to promote pharmaceutical technology transfer37.
In addition, we suggest that efficiency of cross-regional pharmaceutical technology trans-fer in China should be enhanced by development traffic and communication infrastruc-ture. Though technology transfer has spatial proximity effect, a large amount of literature on regional studies has demonstrated that the negative effect of geographical distance on innovation is intermediated by transportation infrastructure and information communica-tion. Moreover, the impact of geographical restraint is decreasing with the development of transportation and information technology42. The spatial distances could be extremely shortened with the rapid development of transportation and information technology in China. For example, the Yangtze River Delta Economic Zone has formed a ‘one-hour eco-nomic circle’, where it only takes 20 minutes to get from Shanghai to Suzhou by high-speed rail. There are most frequent technology flows between Jiangsu and Shanghai37. In this context, development traffic and communication infrastructure should be recommended

234 235
as a positive strategy for pharmaceutical technology transfer.
Finally, region balance development and cross-regional cooperation, especially developed regions and undeveloped regions, should be an optimal policy to stimulate pharmaceutical technology transfer in China. Over the past three decades, China was undergoing a period of rapid economic development via the performance of reform and opening-up policies. However, the imbalance of regional development is increasingly prominent between the eastern coastal area and the western regions43. When it comes to economic development and resource distribution, regional inequality exists in pharmaceutical technology transfer. The economically developed regions play active roles in technology transfer, whereas for economically underdeveloped regions, especially in Ningxia, Xizang, and Gansu, pharma-ceutical technology transfer is quite rare8, 37. Our examination demonstrates fully opposed spatial spillover effects imply synergistic and antagonistic relationships between regions, which have significant impact on pharmaceutical technology transfer in China. In this sense, in order to bridge the gap of cross-regional technology transfer, it is necessary to increase the share of undeveloped regions in the allocation of overall R&D input, and accel-erate cross-regional cooperation by breaking through the geographic boundary.
6. Conclusions
This article sheds light on main determinants on cross-regional pharmaceutical technol-ogy transfer in China based on spatial interaction model. By empirical test, we confirmed some influence factors including R&D investment, granted patent, pharmaceutical indus-try scale, geographical distance and spillover effect. Based on results, some relevant strat-egies have been proposed to stimulate pharmaceutical technology transfer. This study can provide references for policy makers, technology agencies, and R&D managers. On the background of global open innovation, cross-regional technology transfer is playing an increasing important role in drug development not only in China but in the world. In-tegrating worldwide resource such as technologies, talents, capitals, infrastructures, and policies will be conducive to break through the bottleneck of drug development and pro-mote worldwide pharmaceutical innovation.
Some limitations of this research must be mentioned. There are more influence factors on pharmaceutical technology transfer in the real world have not been elaborated in this study. For example, regional technology transfer policy, regional economic level as well as regional technology transfer platform and capability could perhaps significantly influence regional technology transfer. In addition, patterns, efficiency and performance of pharma-ceutical technology transfer in specific regions should be further clarified and analyzed. All of these issues are on top of the research agenda for future studies.
List of abbreviations
R&D: research and development; SIPO: The State Intellectual Property Office; km (kilome-ter); OLS: ordinary least squares; CPRS: Chinese Patent Retrieval System.
Disclosure of Potential Conflicts of Interest
The authors declare that they have no conflicts of interest to disclose.
236 237
References
1. Sun LX, Hong E, Li T. Incorporating technology diffusion, factor mobility and structural change into cross-region growth regression: an application to China. Journal of Re-gional Science. 2010; 50(3): 734-755.
2. Gurvich VJ, Byrn SR. NIPTE: a multi-university partnership supporting academic drug development. Drug Discovery Today. 2013; 18(19): 916-921.
3. Talaga P. Open Innovation: share or die. Drug Discovery Today. 2009; 14(21): 1003-1005.
4. Munos B. Can Open-Source Drug R&D Repower Pharmaceutical Innovation? Clinical Pharmacology & Therapeutics. 2010; 87(5): 534-536.
5. Michael V, Tomas M, Harald P, et al. Health region development from the perspective of system theory: An empirical cross-regional case study. Social Science & Medicine. 2015; 124: 321-330.
6. Bethan H. Evolving R&D for emerging markets. Nature Reviews Drug Discovery. 2010; 9: 417-420.
7. Frew SE, Sammut SM, Shore AF, et al. Chinese health biotech and the billion-patient market. Nature Biotechnology. 2008; 26(1): 37-54.
8. Wang YD, Xin P, Ning LT, et al. Technology exchange patterns in China: an analysis of regional data. The Journal of Technology Transfer. 2015; 40(2): 252-272.
9. Campbell EG, Powers JB, Blumenthal D, et al. Inside the Triple Helix: Technology Trans-fer And Commercialization in The Life Sciences. Health Affair.2004; 23(1): 64-76.
10. Cooke P, Uranga MG, Etxebarria G. Regional innovation systems: institutional and or-ganizational dimensions. Research Policy. 1997; 26(4): 475-491.
11. Cilem SZ, Corinne AB. Determinants of cross-regional R&D collaboration: some empir-ical evidence from Europe in biotechnology. The Annals of Regional Science. 2014; 53(2): 369-393.
12. Gao X, Guan JC, Rousseau R. Mapping collaborative knowledge production in China using patent co-inventorships. Scientometrics. 2011; 88(2): 343-362.
13. Cao Y, Li RH. A quantitative analysis of factors influencing the tacit knowledge con-verting in technology transfer. International Conference on Management Science & Engineering (15th) (Long Beach, USA). 2008; 10: 1365-1372.
14. David R, Jennifer B, Sumiye O, et al. The economic impact of licensed commercialized inventions originating in university research. Research Policy. 2013; 42(1): 23-34.
15. Steven T, Scott L, Valerie K. Individual choice or institutional practice: Which guides the technology transfer decision-making process? Management Decision. 2010; 48(8): 1261-1281.
16. Motohashi K. Licensing or not licensing? An empirical analysis of the strategic use of patents by Japanese firms. Research. Policy. 2008; 37(9): 1548-1555.
17. Mom T, Oshri I, Volberda HW. The skills base of technology transfer professionals. Technology Analysis and Strategic Management. 2012; 24(9): 871-891.
18. Mansfield E, Lee J. The modern university: Contributor to industrial innovation and recipient of industrial R&D support. Research Policy. 1996; 25(7): 1047-1058.
19. Bozeman B. Technology transfer and public policy: a review of research and theory. Research Policy. 2000; 29(4): 627-655.
20. O’Shea RP, Allen TJ, Chevalier A, et al. Entrepreneurial orientation, technology transfer and spinoff performance of U.S. universities. Research Policy. 2005; 34(7): 994-1009.
21. Gregorio D, Shane S. Why some universities generate more TLO start-ups than others? Research Policy. 2003; 32(2): 209-227.
22. Powers JB. Commercializing academic research: resource effects on performance of university technology transfer. Journal of Higher Education. 2003; 74(1): 26-50.
23. P owers JB. R&D funding sources and university technology transfer: what is stimulating universities to be more entrepreneurial? Research in Higher Education. 2004; 45(1): 1-23.
24. Wu F, Dong ZY. The influencing factors of university technology transfer ability and the empirical analysis. Science & Technology Progress and Policy. 2010; 27(10): 137-140.
25. Cohen WM, Levinthal DA. Absorptive capacity: a new perspective on learning and in-novation. Administrative Science Quarterly.1990; 35(1): 128-152.
26. Martin X, Salomon R. Knowledge transfer capacity and its implication for the theory of the multinational corporation. Journal of International Business Studies. 2003; 34(4): 356-373.
27. Arvanitis S, Kubli U, Wörter M. Determinants of Knowledge and Technology Transfer Activities Between Firms and Science Institutions in Switzerland: An Analysis Based on Firm Data. Swiss Institute for Business Cycle Research (KOF) Working Paper. 2005; (116): 1-41.
28. Kani M, Motohashib K. Understanding the technology market for patents: New in-sights from a licensing survey of Japanese firms. Research Policy. 2012; 41(1): 226-235.
29. Coccia M, Rolfo S. Technology transfer analysis in the Italian National Research Coun-cil. Technovation. 2002; 22(5): 291-299.
30. Van AJ, Nieuwenhuijsen HR. Knowledge Spillovers and Economic Growth: An Analysis Using Data of Dutch Regions in the Period 1987-1995. Regional Studies. 2004; 38(4): 393-407.

238 239
31. Friedman J, Silberman J. University technology transfer: do incentives, management and location matter? The Journal of Technology Transfer. 2003; 28(1): 17-30.
32. Bottazzi L, Peri G. Innovation and spillovers in regions: Evidence from European patent data. European economic review. 2003; 47(4): 687-710.
33. Scherngell T, Hu YJ. Collaborative knowledge production in China: Regional evidence from a gravity model approach. Regional Studies. 2011; 45: 755-772.
34. Scherngell T, Borowiecki M, Hu YJ. Effects of knowledge capital on total factor produc-tivity in China: a spatial econometric perspective. China Economic Review 2014; 29: 82-94.
35. Funke M, Niebuhr A. Regional geographic research and development spillovers and economic growth: Evidence from West Germany. Regional Studies. 2005; 39(1): 143-153.
36. Scherngell T, Fischer MM, Reismann M. Total factor productivity effects of interregion-al knowledge spillovers in manufacturing industries across Europe. Romanian Jour-nal of Regional Science. 2008; 1(1): 1-16.
37. Ni JY, Xu JC, Hu YJ, et al. Cross-regional pharmaceutical technology transfer in China: Patterns and proposed investment strategies. Therapeutic Innovation & Regulatory Science. 2014; 48(2): 226-235.
38. Hu YJ, Scherngell T, Man SN, et al. Is the United States still dominant in the global phar-maceutical innovation network? PloS ONE. 2013; 8(11): e77247.
39. Controversy on the quantity and quality of patents in China. State Intellectual Property Office of the People’s Republic of China. 2013. http://www.sipo.gov.cn/mtjj/2013/201312/t20131213_888956.html Accessed 16 Dec 2013.
40. Shi, Y. & Rao, Y. China’s research culture. Science. 2010; 329(5996): 1128-1128.41. Kermani F, Zhou YB. China commits itself to biotech in healthcare. Drug Discovery
Today. 2007; 12(13): 501-503.42. Feng GC, Guo SZ. Tracing the route of China’s internet censorship: An empirical study.
Telematics and Informatics. 2013; 30(4): 335-345.43. Statistical bulletin of R&D investment in 2012. Ministry of Science of Technology of the
People’s Republic of China. 2013.http://www.sts.org.cn/tjbg/tjgb/document/2013/20130927.htm. Accessed 27 Sept 2013.

240 241
Chapter 12
CHANGING PHARMACEUTICAL REGISTRATION RULES IN CHINA :
LATEST UPDATES AND POTENTIAL IMPACTS
Miao Wan, Junrui Zhao, Bingyu Zhang, Dongning Yao, Yuanjia Hu*
State Key Laboratory of Quality Research in Chinese Medicine, Institute of Chinese Medical Sciences, University of Macau, Macau SAR, China
* Corresponding author: [email protected]

242 243
Abstract
In recent decades, the Chinese pharmaceutical industry has developed at an accelerating pace, and the drug registration and approval system in China has undergone a series of dramatic changes and reforms. As current provisions became incompatible with sector development, the China Food and Drug Administration (CFDA), the supreme drug regula-tory authority in China, has updated the current regulation system of drug registration and approval. This article describes the current state of regulation, comprehensively discloses the proposed new rules, and concludes with the potential implications for the future.
1. Current Status
The current version of the Drug Registration Regulation (DRR) was issued on July 10, 2007, which has led to the implementation of an entirely new registration and approval system for pharmaceutical and biological products1. Dramatically, on the same day the DRR was issued, the former head of the State Food and Drug Administration (SFDA, predecessor of CFDA) was executed for accepting bribes from drug companies in exchange for marketing authorizations. Perhaps this is not a coincidence or the only case. Since then, the Chinese pharmaceutical regulatory system has been undergoing a series of tough reforms. With the rapid development of both the regulatory system and the pharmaceutical industry in recent years, the DRR now appears to be incompatible and outdated in a number of respects.
Under this context, the CFDA realized the necessity of change and reform, and this was ac-complished over the past three years. Initially, the CFDA issued a draft amendment to the DRR in November 2013, as well as its Drafting Explanation for comments from pharmaceu-tical manufacturers, R&D institutes, other organizations, and individuals. Three months lat-er, the Legislative Affairs Office of China’s State Council published a further revised version of the DRR, with all public comments due by March 23, 2014. Afterwards, the Department of Drug and Cosmetics Registration of CFDA drafted a notice in September 2014, with the purpose of rearranging the internal operating procedures of drug registration. Moreover, the National Working Conference on Drug Registration held in April 2015 released some reform measures and also exposed the future direction to the public. The next month, Chi-na’s Ministry of Finance (MOF) and National Development and Reform Commission (NDRC) jointly released the Provisions for Registration Charging Standards of Drug and Medical Device, which aimed to promote the healthy development of registration work and to establish a new charging standard for pharmaceutical products. Then, in July 2015, the
CFDA released a notice for self-inspection and scrutiny of clinical trial data, which greatly lightened the CFDA’s burden of review and approval. One month later, the State Council is-sued the No. 44[2015] (StateCouncilIssued[2015]No.44) document to reform the drug and medical device review and approval process to improve the review and approval quality, to solve the problem of registration lag, and to leverage generic drug quality along with other reforms. As a response to this document, in December 2015, the CFDA issued its No. 257 document of 2015 for the filing management of chemical drug’s bioequivalence (BE) trials.
The year 2016, which is destined to be extraordinary and one year before the tenth anni-versary of the DRR issued in 2007, the State Council No. 44[2015] document continued to play an important role in the drug registration and approval system. In February 2016, the Department of Drug and Cosmetics Registration of the CFDA drafted a document for pub-lic comments regarding the operating procedures of inspecting drugs’ clinical trial data. Half a year later, the CFDA opened a draft for public comments on the settlement of drugs’ clinical trial data inspection. As its own response to the No. 44[2015] document, in March 2016, the State Council Office issued the No. 8[2016] (StateCouncilOfficeIssued[2016]No.8) document to evaluate quality consistency evaluations for generic drugs. Then, from March 2016 to September 2016, the CFDA drafted a series of regulatory documents regarding the assessment of quality consistency evaluations for generic drugs for public comments. The latest one opened on September 14, 2016, which focused on the general consideration of clinical efficacy. The government’s determination to improve generic drugs had dramat-ic impacts on China’s registration rules, and the content will be described in more detail hereinafter. On March 4, 2016, the CFDA issued a notice to implement the Reform Plan for Chemical Drug Registration Classification from the issuance date forward2. On July 25, 2016, the CFDA published a draft amendment to the DRR, with any public comments due by August 26, 2016. Thus far, the revisions of the drug registration and approval system have not been finalized; however, in the near future, a formally amended DRR will be released, and a better registration system will be established.

244 245
2. Proposed Changes
Based on the relevant draft amendments, official notices, national conferences, and other newly implemented provisions, the main proposed changes of China’s pharmaceutical reg-istration rules can be highlighted and analyzed in terms of the following eight elements3-7.
2.1 Adjustments to Registration Procedures
In this round of reform, the CFDA applied certain modifications to the New Drug Applica-tion (NDA), Abbreviated New Drug Application (ANDA), and import drug application pro-cedures. Firstly, under the current NDA process, an applicant must first apply for a clinical trial and then apply for marketing approval only after completion; however, certain drug categories, including normal and specific immunoglobulins for intramuscular administra-tion, human albumins, multiple electrolytes injections, and blood volume expanders, are currently exempted from clinical trial applications, and applicants can directly apply for marketing approval.
Secondly, under the current ANDA procedures, after the acceptance of an application, Pro-vincial Food and Drug Administrations (PFDAs) will conduct on-site inspections of drug R&D conditions and raw data as well as production site inspections of the manufacturing processes and quality specifications provided by the applicant. Once the inspections are passed, applicants can initiate a bioequivalence study. The draft amendment to the DRR in 2013 modified the procedures for ANDA. Briefly, production site inspections of manu-facturing processes and quality specifications will be postponed to be conducted upon completion of the bioequivalence study. The Drafting Explanation pointed out that the long-standing practice of conducting production site inspections too early led to several problems, including resource waste and low-quality checks, and it was also detached from technical review and GMP inspection. In fact, manufacturing processes need to be opti-mized to be in line with the results of the bioequivalence study; thus, it is more practical and reasonable to delay the inspection of a production site.
Thirdly, under the current import drug application procedures, when a foreign manufac-turer submits a clinical trial application for a class I chemical drug (new drugs never mar-keted in any country), a certificate of pharmaceutical product (CPP) issued by the export-ing country must be supplied to the CFDA; however, such requirements were considered unreasonable and led to complaints among foreign manufacturers. As it stands, the CFDA has deferred the submission of marketing authorization until the day of application for
marketing approval. In the latest draft amendment to the DRR issued in 2016, an imported drug is considered a domestic drug and does not have a specific provision in the DRR.
2.2 Changes in Clinical Trial Processes
Under the current DRR, there are no procedures that accommodate changes requested by applicants in ongoing clinical trials; such as formulae, manufacturing processes, or pro-duction sites. Consequently, an applicant may have to withdraw an application and file an entirely new one. The draft amendment to the DRR issued in 2016 permitted supple-mental applications on clinical trials, and Article 50 , a new provision allows supplemental applications, was added to the DRR instead of the obsolete provision. Applicants could file pharmacy changes after evaluating the influence on safety, efficacy, and quality control with relevant technology guidelines. If pharmacy changes influence the clinical protocol, applicants could submit the changes for review with a follow-up clinical protocol or other major changing ways.
Secondly, under the current rules, only drugs already marketed in other countries, or at least entered in a phase II clinical trial, are eligible for multi-center clinical trials in China. According to a 2015 national conference, the CFDA planned to permit drugs never mar-keted before to be used in synchronized clinical trials in Chinese institutions, and the data obtained would be permitted to be used in import drug applications if the requirements were met.
Thirdly, the CFDA implemented changes regarding bioequivalence studies. The current DRR stipulates that applicants must have their clinical trial applications approved before beginning bioequivalence studies. However, as per CFDA’s No. 257 document of 2015 is-sued in December 2015, based on the original review and approval process, applicants whose chemical drug registration applications were accepted before the issue day could continue to conduct BE studies or withdraw the original registration voluntarily. They could then complete it based on this new notice (CFDA’s No. 257 document of 2015) in-stead. After December 1, 2015, the scope included the items listed below and was applied to the BE filling management system:
1) Generic drug of which the active ingredient, delivery system, dosage form, and specification is compliant with the reference listed drugs.
2) Marketed drugs approved domestically but that require changes based on a BE study.
3) Marketed drugs approved domestically, but quality consistency evaluations for

246 247
generic drugs with the reference listed drugs must be conducted, which should include off-patent products or internationally recognized drugs, using a BE study.
2.3 Improvement of Special Review and Fast Track Mechanism
The CFDA recently added several circumstances that allow for special reviews and fast track procedures. First, there are mainly too many newly added drug categories for special review, which contain “Key R&D Project” drugs, import innovative drugs, and import pedi-atric drugs that are to be produced in China instead of an exporting country. Secondly, the CFDA established a fast track review for generic drugs and gave priority to certain catego-ries: 1) fill an unmet medical need; 2) affect public availability and affordability; and 3) first copy for a pioneer drug.
2.4 Increase in Drug Registration FeesThe current registration charging standard was set by China’s Ministry of Finance in 19959. Among all registration categories, the NDA registration fee is the most expensive, but the cost is only around 7,300 USD. Apparently, the standard charges established in 1995 are no longer suitable for current prices and salary levels. Moreover, the drug registra-tion fee in China is also quite low in contrast to developed countries. For example, the NDA registration fee is 35 thousand CNY in China compared with 0.98 million CNY in Australia, 1.76 million CNY in Canada, and 12.07 million CNY in USA7.
Under this context, China’s authorities began to establish the new charging standards for drug registration in China. On April 21, China’s Ministry of Finance and National Devel-opment and Reform Commission jointly issued the Provisions for Registration Charging Standards of Drug and Medical Device7, and then the CFDA released the detailed charging plan on its official website one month later. Table 1 shows the new charging standards for drug registration.
According to the CFDA, the new charging standards were established under the principle of cost compensation and were measured by a third-party accounting firm. Compared with the previous charging standards, the amount of the new standards greatly increased for all four registration items, and drug manufacturers will incur additional financial expenses for drug registration and supplementary applications. In addition, it is worth noting that the import drug registration fee is much higher than the domestic drug registration fee, as it is calculated as the sum of the domestic drug registration fee as well as the transportation expenses and accommodation expenses accrued by CFDA inspectors.
On the other hand, the new charging standards in China are still much lower than that in developed countries. For instance, the newly adjusted NDA registration fee in China is equal to that of 64% in Australia, 35.5% in Canada, and 5.2% in the US7.
2.5 Changes on Market Protection Policies of Drugs
Currently, there are two primary market protection policies for drugs in China. The first protects drugs already patented under China’s patent laws and regulations, and the sec-ond protects drugs recognized as new drugs by the CFDA based on the DRR, which is more likely to be a type of administrative protection, such as a new drug observation period. However, in this round of reform, the CFDA made adjustments to both market protection policies.
1 USD= 6.2047 CNY

248 249
2.5.1 Patent Protection Policy
The current 2007 version of the DRR contains two provisions regarding patent protec-tion for drugs during the registration process. Pursuant to Article 18, when an applicant submits a registration request, patent information and its ownership situations shall be provided to the CFDA, including the drug applied for registration and its formulae, manu-facturing processes, and/or uses. Non-infringement statements must also be submitted. If patent disputes arise during the registration process, they must be settled by referring to relevant patent laws and regulations. Moreover, Article 19 stipulates that generic manufac-turers cannot submit registration requests until two years prior to the expiry date of corre-sponding drug patents. Once generic drug applications are approved, the Drug Approval Number and other certificates will be issued after the expiry date and will be effective immediately.
In the most recent draft amendment, the corresponding provisions have been modified. At first, the phrase “during the registration process” in Article 18 was deleted, and this re-vised article was moved to Article 130 of the draft amendment to the DRR issued in 2016. Then, the two-year limit was deleted from Article 19. In addition, authorization procedures were changed: once applications are approved according to the requirements of the draft amendment to the DRR issued in 2016, Drug Approval certificates are issued immediately. Revised Article 19 was moved to Article 129 of the draft amendment to the DRR issued in 2016.
According to the Drafting Explanation3, the purpose of these modifications is to eliminate contradictions between the DRR and China’s Patent Law. For instance, China’s Patent Law was revised in 2008, adding a new exemption to patent infringements regarding drug pat-ents, which is similar to the “Bolar Exemption” that is widely used to encourage drug R&D. Patent Law stipulates that the use of drug, apparatus, and instrument patents is permitted for the purpose of providing necessary information for administrative approval10. Thus, patent disputes in the registration process described in Article 18 have been exempted in the new Patent Law. Another issue involves the two-year time limit for generic drug applications set by the CFDA on the basis of the evaluation and approval schedule that was commonly applied in the past; however, the current approval time for generic drugs is much longer than two years. Such constraints deprive generic manufacturers of the rights to market on time as well as actually extend the patent life of patented drugs.
Revisions to provisions related to patents actually liberates the CFDA from patent admin-istration, which allows the CFDA to primarily focus on drug safety, efficacy, and quality
control. Patent disputes that arise among applicants are also settled directly by the courts.
2.5.2 Administrative Protection Policy
In the DRR, an observation period during which the CFDA shall not accept registration requests from other manufacturers to produce, change dosage forms, or import drugs was established for any new drug approved for production. Manufacturers are required to investigate the drugs during this period and to report annually to drug regulatory de-partments. The length of the observation period is determined by the type of drug, up to a maximum of five years.
Under the current DRR, from the date a new drug enters the observation period, any man-ufacturer with an already approved clinical trial application for that drug will be exempted from the constraints of an observation period. If the requirements are met, they will be permitted to proceed, and marketing authorization can still be issued. Applications for the same drug that have already been accepted but not yet approved will be returned.
The CFDA has also made adjustments to the applicability of the observation period. When a new drug enters the observation period, applications already accepted but not yet ap-proved will no longer be returned and are permitted to proceed. In addition, when an im-port drug gains marketing authorization for the first time, applications for the same drug already accepted but not yet approved can proceed, or applicants can opt to withdraw their accepted applications and submit generic drug applications instead.
According to the Drafting Explanation, the aforementioned adjustments are intended to resolve the controversies regarding “registration application returning” and to further en-courage drug R&D3. In fact, drug manufacturers regarded the observation period as anoth-er type of market exclusivity protection. To avoid being shut out of the market, their clinical trial applications had to be approved before the first applicant could gain the approval of its NDA. Inevitably, this is likely to arouse hostile competition and big losses for out-of-game manufacturers. Decreasing the length of the observation period exclusivity provides more opportunities for applicants and helps create a more suitable environment for drug R&D.
2.6 Exploration for a New Drug Regulatory Mechanism
The National Working Conference on Drug Registration held in April 2015 indicated that

250 251
several new mechanisms are being explored to improve the drug regulatory environment-First, to address the drug lag problem, the CFDA proposed outsourcing part of the drug re-view by purchasing external review resources, such as provincial counterparts, universities, and R&D institutes. In this way, the CFDA hopes to solve the heavy backlog of drug appli-cations and to accomplish drug review normalization by 2018. Second, the CFDA planned to explore the China’s Marketing Authorization Holder (MAH) system of innovative drugs to eliminate the negative effect of the current authorization mode and to further motivate the initiatives of drug R&D institutions. Third, the CFDA planned to extend its power in controlling drug applications of pharmaceutical firms by publishing drug registration in-formation regularly, such as the list of preferred drug categories and the list of excessively imitated drug categories, to suppress the over-imitated drug applications and to alleviate the pressure of regulatory authority.
2.7 Review & Approval Duration and Self-inspection & Scrutiny of Clinical Trial Data
To better understand the DRR and its draft amendment, it is necessary to review data of Chinese drug registration applications. The statistics presented in this section were re-trieved from the Annual Report on Drug Registration and Approval in China11-13, published by the CFDA, and the China Drug Review Annual Report14-17, published by the Center for Drug Evaluation (CDE).
Figure 1. Drug registration applications accepted and completed by the CFDA
According to Figure 1, at least 6000 drug registration applications were accepted from 2009 to 2014; however, the annual number of completed applications was 5,300 during this period. In addition, despite the current version of the DRR using a chapter to express provisions, the CFDA must complete drug registration within the fixed time, and the num-ber of finished applications has changed significantly. Figure 1 shows that the CFDA re-mains unstable in drug review and approval work. The DRR provided the CDE with 90 days to review and approve an investigational new drug application (IND) in the first paragraph of Article 105 of chapter 12. The CDE cannot finish the review and approval work on time, and the reasons are as follows.
First, compared to the workload, the CDE is noticeably shorthanded for drug review and approval work. Second, even if applicants submit a defective application report, they ac-crue lower regulatory costs, so applicants submitted application reports even though the reports were not completely in conformity with the regulations. The third reason is that the drug registration fee is lower, which has been mentioned in part 4. Indeed, the time limit system in the DRR for registration is not satisfactory; however, under the latest draft amendment to the DRR in July 2016, the related time limit system for drug registration was abolished.
It is worth noting that in 2015, the number of completed applications was higher than accepted applications. What caused the change? For the pharmaceutical registration and approval system, 2015 and 2016 have been years of revolution. To review and approve the huge backlog of registration work that had accumulated from 2009 to 2014, the CFDA is-sued new regulations on drug review and approval. The second reason that the CDE could not finish the review and approval work was also eliminated during this period. Previously, applicants only needed to pay small regulatory costs to submit a defective application report, but after receiving the notice “CFDA: Self-inspection and Scrutiny of Clinical Trials Data for Drugs” (CFDA [2015] No. 117) and the notice “CFDA: Policy Suggestions on the quick settlement of pending drug registration applications” (CFDA [2015] No. 140). Both notices provide that if the clinical trial data from applicants has authenticity issues, their applications will not be accepted for three consecutive years. In addition, the CFDA [2015] No. 140 also provides that the authority will not accept research materials from clinical trial organizations or contract research organizations before the completion of rectification if they collectively falsify the clinical trial data in the study. Moreover, if clinical trial data is falsified, the authority will not accept research materials from the people in charge of the organization for ten consecutive years.

252 253
As of December 14, 2015, 727 applicants voluntarily withdrew their application reports18. This means their reports had one or more of the following problems: (1) Lack of research data; (2) A need to complete the unfinished experiment; (3) Lack of comprehensive compa-rability studies; (4) Lack of a comprehensive evaluation on impurities and toxic substances; and (5) A need to complete the test of prescription technic and so on.
To further standardize drug clinical trial activities, the CFDA has released drafts to the pub-lic for comments. These drafts are based on current regulations to further cement the cre-ation and imposition of administrative penalties and the applicable legal circumstances of sentencing in judicial practices. The contents primarily involve the following aspects:
(1) Discuss the division and manner of responsibility of applicants, clinical trial institu-tions, and contract research organizations.
(2) Define the clinical trial data inventing and its application in a specific situation.(3) The details of administrative punishments.(4) A “blacklist” system for illegal behaviors will be established.(5) Provide legal applications for aggravation, mitigation, and exemption from punish-
ment.
2.8 Reform Plan for Chemical Drug Registration Classification
As mentioned, current provisions have become incompatible in several sectors, and there-fore it is urgent to update and reform registration classification. The CFDA issued Reform Plan for Chemical Drug Registration Classification ([2016] No. 51), which was approved by the State Council and was put into effect on March 4, 2016.
The most significant reform in this plan is the adjustment of the five categories of registra-tion classifications of chemical drugs, which are as follows:Class 1: Innovative drugs never sold in domestic and overseas markets, which refer to those containing new chemical compounds with clear structures and pharmacological effects and with clinical value.
Class 2: Improved new drugs, sold neither domestically nor overseas, which refer to those with their structures, dosage forms, formulations and technologies, administra-tion routes, and indications optimized based on known active ingredients and with significant clinical advantages.
Class 3: Generic drugs of domestic applicants produced based on originators sold in overseas markets but not yet listed in the domestic market. The quality and effi-cacy of such drugs shall be consistent with that of off-patent drugs.
Class 4: Generic drugs of domestic applicants produced based on off-patent drugs sold in the domestic market. The quality and efficacy of such drugs shall be consistent with that of off-patent drugs.
Class 5: The drugs marketed overseas under application for being listed in China.
Compared to the original classification, the reform plan is formulated to encourage new drug development, improve drug quality, and stimulate industry upgrading. From a policy orientation, the government is demonstrating a strong resolution to encourage innova-tive drug development, to emphasize the clinical advantage of these new products, and to focus on the consistency in quality and efficacy between the generic drugs and their originators.
2.9 Evaluation of Generic Drugs’ Quality and Efficacy Consistency
For a long period of time, the quality and efficacy of drugs approved to market domesti-cally were not required to be the same as the original drug, so some marketed drugs had a certain gap compared with the original drug. To address this gap, the State Council office issued the No. 8 [2016] document in March 2016, and soon after, in April 2016, the CFDA asked for public comments on the implementation of the State Council’s No. 8 [2016] doc-ument. All generic drugs approved before the implementation of the new classifications of chemical drugs must undergo a consistency evaluation. OSDF (oral solid dosage form) chemical generic drugs listed in the National Essential Medicine List (2012) and approved before October 1, 2007, should complete the consistency evaluation before 2018. If man-ufacturers of other OSDF chemical generic drugs first pass the consistency evaluation, the same generic drug manufacturer will be exempt from consistency evaluations for three years.
The reference drug used in a consistency evaluation must be the original drug, but the internationally recognized generic drug may also be chosen to serve as a reference drug. Pharmaceutical manufacturers may select the reference drug and then report to the CFDA. If the CFDA does not reject it within a specific time limit, then the manufacturers can begin their studies. Pharmaceutical manufacturers shall in principle use in vivo bioequivalence

254 255
tests to carry out consistency evaluations. For those that meet the principle of exemption from bioequivalence tests, pharmaceutical manufacturers are allowed to use in vitro disso-lution tests to carry out consistency evaluations. It is clear that pharmaceutical manufac-turers are the subjects of consistency evaluations and therefore have greater responsibili-ty. Thus, they shall act in a more initiative way to select the reference drug and evaluation method to demonstrate the safety and efficacy of the generic drugs.
3. Latent Impacts
Though the changes have not yet been finalized in this round of reform, the information provided by China’s drug regulatory authority is of great significance. It is no exaggeration to assert that this recent reform is unprecedented in strength and scale, and there is no doubt that the latent impacts will greatly affect pharmaceutical manufacturers, especially pharmaceutical multinationals.
First and foremost, it is clear that the CFDA recognized the serious consequences of drug lag and was eager to seek solutions, and a more efficient registration system is likely to be established in the future. Pharmaceutical multinational companies may have the op-portunity to decrease the new product approval period in China. Second, the proposed changes in import drug application procedures may enable foreign drug manufacturers to conduct international multi-center clinical trials in earlier stages, which will make mar-keting new products in China more convenient. Third, the restoration of the patent linkage system may lead to fiercer competition between pioneer drugs and generic drugs. Domes-tic drug manufacturers get closer to the marketing authorization of the first copy drug; therefore, pharmaceutical multinationals may encounter a more complex situation caused by the “patent cliff.” Fourth, by publishing the new charging standards for drug registration, pharmaceutical multinationals will encounter rising financial costs in NDA, import drug applications, and supplementary applications. Fifth, the implementation of self-inspection and scrutiny of clinical trial data will prevent many unqualified drug manufacturers from obtaining registration and will relieve the CFDA’s review and approval burden, while the draft amendment to the DRR issued in 2016 blurs the CFDA’s review and approval time-line. Finally, the State Council’s issuance of No. 44 [2015] and No. 8 [2016] are indicators of China’s determination to improve generic drugs in the domestic market, and the CFDA’s successive draft documents will become a challenge for generic drug manufacturers.
References
1. China Food and Drug Administration. Provisions for Drug Registration (SFDA Order No.28). http://eng.sfda.gov.cn/WS03/CL0768/61645.html.
2. China Food and Drug Administration. Notice on issuing the Reform Plan for Chemical Drug Registration Classification. http://www.sda.gov.cn/WS01/CL0051/146140.html.
3. China Food and Drug Administration. Notice on seeking opinions for draft amend-ment to Drug Registration Regulation [in Chinese]. http://www.sda.gov.cn/ WS01/CL0778/94158.html.
4. Legislative Affairs Office of the State Council. Notice on further seeking opinions for draft amendment to Drug Registration Regulation [in Chinese]. http:// www.chi-nalaw.gov.cn/article/cazjgg/201402/20140200394953.shtml.
5. Securities Times. CFDA plans to improve the work of drug registration [in Chinese]. http://www.stcn.com/2014/0919/11728943.shtml.
6. Chemdrug.com. Highlights of 2015 National Conference on Drug Registration [in Chinese]. http://www.chemdrug.com/news/230/9/41980.html.
7. China Food and Drug Administration. Provisions for Registration Charging Standards of Drug and Medical Device [in Chinese]. Available at: http://www.sda.gov.cn/ WS01/CL0050/120200.html.
8. China Food and Drug Administration. Complementary Provisions for TCM Registra-tion [in Chinese]. http://www.sda.gov.cn/WS01/CL0055/27432.html.
9. China Food and Drug Administration. Notice on Adjustments of Drug Approval and Testing Fees [in Chinese]. http://www.sda.gov.cn/WS01/CL0056/107 56.html.
10. State Intellectual Property Office of China. Patent Law of People’s Republic of China.http://english.sipo.gov.cn/laws/lawsregulations/201101/t20110119_566 244.html.
11. China Food and Drug Administration. 2009 Annual Report on Drug Registration and Approval in China. http://www.sda.gov.cn/WS01/CL0027/54135. html.
12. China Food and Drug Administration. 2010 Annual Report on Drug Registration and Approval in China. http://www.sda.gov.cn/WS01/CL0236/65856. html.
256 257
13. China Food and Drug Administration. 2011 Annual Report on Drug Registration and Approval in China. http://www.sda. gov.cn/WS01/CL0236/75250. Html.
14. Center for Drug Evaluation. 2012 China Drug Review Annual Report. Available at: http://www.cde.org.cn/ news.do? method=viewInfoCommon&id=313135.
15. Center for Drug Evaluation. 2013 China Drug Review Annual Report [in Chinese]. http://www.cde.org.cn/news.do?method=largeInfo&id=313280.
16. Center for Drug Evaluation. 2014 China Drug Review Annual Report. http://www.cde.org.cn/news.do?method=largeInfo&id=313425.
17. Center for Drug Evaluation. 2015 China Drug Review Annual Report. http://www.cde.org.cn/news.do?method=largeInfo&id=313528.
18. From the source to ensure drug safety and effectiveness. http://www.sda.gov.cn/WS01/CL1033/140266.html.
258 259
Chapter 13
PHARMACEUTICAL INNOVATION NETWORK : GLOBAL PATTERNS AND THE ROLE OF CHINA
Pengpeng Li, Huiheng Lin, Yuanjia Hu*
State Key Laboratory of Quality Research in Chinese Medicine, Institute of Chinese Medical Sciences, University of Macau, Macau SAR, China
* Corresponding author: [email protected]

260 261
Abstract
In recent decades, the increasing R&D investment in the pharmaceutical sector of emerg-ing economies has been shaping the novel global pharmaceutical innovation network. This study aims to investigate the dynamics of the innovation landscape in the pharmaceu-tical sector and identify the changing role of different countries via (1) collaborative inno-vation network composed of co-inventorship on new drug patents as well as (2) evaluating the role of China within the global network. The Social Network Analysis approach was utilized to analyze the information of inventors in USTPO-granted patents of new drugs and model the structure of pharmaceutical collaborative innovation network. The findings show that R&D collaborations have gained substantial momentum in pharmaceutical in-novation, especially during 2011-2015. During four of the “five-year” development plans set and implemented by China government, a remarkable increase has been identified in the international collaborative innovation activities and a large shift of the innovation network landscape took place, particularly during year 2006-2010 and 2011-2015. The United States, United Kingdom and Germany collectively form a dominant cluster in the network, which was demonstrated by various network centrality measures. Additionally, the dominance of the United States was weakened during 2006-2015. Instead, the Euro-pean countries were rising in pharmaceutical co-innovation, partly due to reinforcement of intra-European countries. Meanwhile, the young member China, with skyrocketing R&D investment, failed to seize the chance to cut a figure. Last but not least, we propose that friendly policy environment is also needed for enhancing pharmaceutical innovation.
Key words
Pharmaceutical innovation; drug patents; network analysis.
1. Introduction
Many countries pursue pharmaceutical innovation, but it is a process full of difficulties and complexities1. Over the past decades, pharmaceuticals attached due significance and ef-fort to drug innovation2, as they could gain large amount of profits if they could successful-ly discover and launch new drugs3. To this end, cutting-edge knowledge and technologies, complicated clinical trials, as well as sufficient investments are required. However, only 1 of the 10,000 drug candidates might be able to pass the screenings of the authorities af-ter surviving the lengthy R&D (Research and Development) processes which could last as
long as 10-15 years1, 4. Standing from the viewpoint of a pharmaceutical company, it has to prioritize the innovation due to the fierce competition in the industry and its rapid growth in R&D costs.
Given that innovation always becomes more and more difficult and complicated to achieve as time goes by, to stay innovatively productive, R&D-focused pharmaceuticals seek new knowledge not only from the internal environment, but also from the external environ-ment. Thanks to globalization, all giant pharmaceuticals such as GSK, Pfizer and Roche have been internationalized instead of staying local. In fact, they are interconnected in the co-innovation network, owing to the traditional innovation pattern based on local innova-tion being too costly and inefficient to keep ahead in the fierce competition. For adapta-tion, a new collaborative form, i.e., co-innovation, has been strategized to share risks and explore global market for new drugs5. Recently, collaborative innovation has been largely reinforced in pharmaceutical sectors, while it remains globally imbalanced6, 7.
This study is mainly based on three points of fact. First, pharmaceuticals is an industry with features of knowledge-intensive, high R&D expenditure and intensively sales-driven. Sec-ond, a variety of disease treatments requires import of distinctive drugs from other coun-tries. Last, pharmaceutical industry is suffering from low productivity with skyrocketing costs, coupled with the fact of rapid market growth in emerging economies.
Amongst all countries, the United States with the most number of giant pharmaceuticals, is the leading actor in new drug innovation owing to its advantageous pharmaceutical technologies, excellent talent pool, and vast research funding9. However, recent findings show that the US R&D budgets are constantly declining, and it is somewhat because of economic downturn following the recent global financial crisis9, 10. Hence, the United States went through slowed-down trends in pharmaceutical R&D activities over the last decades in terms of relevant literatures published11, and now it urgently looks for more opportuni-ties of collaborative innovation for risk pooling. On the other hand, emerging economies are accelerating the development of science, technology and pharmaceutical researches, especially China and India, to make contribution to economic growth. China ranks second worldwide in research funding and R&D expenditure. In the meantime, it is presumably the second largest pharmaceutical market, following the US by 201512. In 2007, the Chi-nese government initiated the “Key Drug Innovation” program, providing research fund-ing up to 1 billion RMB (Chinese Yuan) to boost new drug innovation in pharmaceutical industry during 2011-2015. Probably, the funding might rise to 4.3 billion RMB by 202013, 14. Meanwhile, India is also increasingly investing financial resource and intellectual capitals into pharmaceutical innovation15. Both of them seek to gain competences and innovation

262 263
capability through not only local R&D process but also collaborative activities in the phar-maceutical industry. The geography of the pharmaceutical innovation network will change if developing countries become more capable in innovation, i.e., developing countries may play more and more active roles in global innovation network.
Despite the prevalence of pharmaceutical co-innovation around the world, the co-inno-vation landscape and geographical distribution largely remains uncharted. Recent studies show the global landscape of pharmaceutical innovation during 2000-2009 by analyzing location of pharmaceutical patents related to new drug approved16. However, it focuses on the frequency of patents inventors of each country without considering collaborative in-novation across countries. Indeed, collaboration and alignment are regarded as imperative key factors for innovation in knowledge-intensive industry17, 18. So we perform the network analysis to explore global patterns of pharmaceutical co-innovation network, in particular the characteristics of geographical distribution. This novel perspective, originated from Social Networks Analysis (SNA), is based on structural relations instead of traditional indi-viduality. The structural relations in the context is usually critical for understanding of be-havioral observation as well as resulting structures that are attributes of the components19.
To sum up, this research aims to shape the dynamics of the innovation landscape in the pharmaceutical sector and changing roles of different countries by collaborative innova-tion network composed of co-inventorship on new drug patents, especially for the role of China.
To build context, the remaining parts of this paper is structured as follows: section 2 briefly provides a definition of co-innovation in pharmaceutical industry. Section 3 justifies in-ventorship of new drug patents from different countries as a reasonable indicator to study the relationship of pharmaceutical co-innovation. At the same time, SNA is defined spe-cifically as a formal way to depict global pharmaceutical innovation network. Section 4 presents the results of network analysis and main observation from complicated network made of patents inventorship. In particular, it illustrates dynamics of innovation networks across different countries and also addresses the role of China within the pharmaceutical co-innovation network. Section 5, the final section, summarizes the main contributions and insights for further research.
2. Co-innovation in Pharmaceutical Industry
Innovation in pharmaceutical industry is a broad concept. It may refer to scientific inven-
tions, patents or technological breakthrough. While in this study, we define innovation in a relative narrow way, i.e., it simply includes patents related to new drug approved. Co-in-novation is based on collaborations within or between pharmaceutical firms, universities, and research institutions. A decade ago, this new model of open innovation shifting from closed innovation was for the first time brought into the reality. It combines internal and external ideas, sources and talents to produce extra value, in comparison to traditional innovation model20. With regard to pharmaceutical industry, multinational pharmaceutical companies currently realized that collaborative innovation might be the solution for the crisis that innovation outputs declined despite the burning of R&D and time cost21. In the past few years, networked innovation models have widely been accepted in pharmaceu-tical industry. This is promising because it can extensively highlight fatigue of the current innovation situation22. For example, in 2007, GSK (GlaxoSmithKline) established the Center for Excellence for External Drug Discovery. This R&D center focused on seeking external innovation team that can facilitate drug discovery process. In 2010, Pfizer built the Centers for Therapeutic Innovation. This program aimed at building innovation partnerships be-tween Pfizer and academic medical centers2.
3. Research Methodology
To better identify the global network of pharmaceutical innovation, we need a proper geographic indicator to measure the location of innovation. Indicators on an organiza-tional level may be the one of the options as most of new drugs are innovated through col-laborations amongst research institutes, universities and multinational pharmaceuticals. However, data on R&D activities are not fully available. Alternatively, patent is one of the common indicators to evaluate innovation capability because it can indicate innovation outputs and commercial value23. Therefore, we exploit sampling strategy to collect inven-tors’ information of pharmaceutical patents granted by the US Patent and Trademark Office (USPTO) and all patents are associated with drugs approved by the US Food and Drug Association (USFDA) during 1996-2015. These pharmaceutical patents listed in the annual “Orange Book” enable us to exclude noise of insignificant and supplementary innovation. In this sense, our data can precisely evaluate the mega-trends of pharmaceutical innova-tion networks by observing the collaboration amongst inventors from different countries.
Before calculation, we labeled patent data with inventor country code. The country-specif-ic patent frequency, reflecting on the co-inventorship linkage between countries, is based on location of patent inventors applied. In more detail, each inventor pair in the same pat-ent is counted as the value 1 while at least two inventors collectively shared this patent.

264 265
Usually inventors affiliate with different types of institutions, e.g., universities, pharmaceu-ticals and etc.
Co-inventorship of our patent data can be used to picture the global co-innovation net-work, where nodes represent inventors’ countries and the edges indicate the number of inventorship of these countries. Through network analysis, hypotheses regarding structur-al characteristic and contents of relation among actors are identified, evaluated and mea-sured24. Hence, we exploit network analysis method to illustrate the structure of innovation network in pharmaceutical sector.
A network contains nodes and edges. Let V be a set of nodes, which represents specific countries, involving in global pharmaceutical innovation network. E is a set of undirected edges between a pair of nodes, e.g., vi, vj, indicating the existence of co-inventorships be-tween vi, vj. These two sets form the graph G1= (V, E), for vi, vj, i≠j = 1, n=26, The number of edges incident on the node i, i=1, n, is called the degree ki. A path is the alternating se-quence of nodes and links in the network. Thus, the shortest path or geodesic distance (dij) between two nodes i and j is defined as the number of nodes going through the shortest path in the network.
A set of weights (W) are further included into G1 to form G2 = (V, E, W), where W= {w1, w2, wn} represents weights between two nodes vi and vj denoting the frequency of inventor-ships between each two countries.
The topology of the network is firstly encoded in the n× n adjacency matrix X with ele-ments
The centrality describes the role of node in the network. Several types of centrality are measured for each country. First, degree centrality, simply called degree, is the total num-ber of edges connected to a specific node, and it is mathematically defined by
Second, betweenness centrality of a node is defined as the fraction of geodesic paths be-tween any pair of nodes on which this node lies. It reflects on the frequency of one node positioned on the shortest path between other groups of nodes arranged in pairs, calcu-lated by
Where d_(jk(i)) indicates the shortest path between nodes j and k passing through nodes i. Nodes embedded in the shortest paths are critical for controlling the flow of information within the network.
Third, closeness centrality of a node can be defined as the inverse of the mean geodesic distance from the node to every other node in a connected network, formulated by
Closeness centrality indicates how close a node is to any other nodes in the network based on network structure, and how fast the nodes can get access to dispersed information in this system.
Fourth, Eigenvector centrality depends both on the number and the quality of its connec-tions by examining all nodes in parallel and assigning centrality weights that aligned with the average centrality of all neighbors. It is interpreted as
Where γ is the largest eigenvalue of X. It indicates whether a node is connected to other highly nodes with many connections or to peripheral nodes.
With respect to global indicators in SNA, several other parameters are needed to describe connectedness and cohesion. Density is defined as a ratio of the number of edges (fre-quency of cross-countries) to the number of possible edges. The average degree is closely related to density, increasing with the number of nodes having higher number of partners. Average path length is calculated by the average of the shortest paths between all pairs of nodes, while cluster coefficient refers to the likelihood that two associates of a country are associates themselves.

266 267
4. Results
In this section, we will present our findings regarding dynamics of pharmaceutical inno-vation network step-by-step. Totally, there are 2,799 patents of 1,850 drugs in our dataset retrieved from USPTO and USFDA, respectively.
4.1 Dynamics of Pharmaceutical Innovation Networks Across Different Countries
In the first place, based on information-theoretic techniques, we construct global phar-maceutical innovation networks using G2 for the time periods 1996-2000 (Figure 1-1), 2001-2005 (Figure 1-2), 2006-2010 (Figure 1-3), and 2011-2015 (Figure 1-4). Meanwhile, the normalized Laplacian, a standard approach for spectral graph analysis, is implemented to determine the nodes (countries) position in the network. Therefore, comparatively, nodes (countries) with higher intensity of co-inventorships are located near to each other.
Figure 1-1. Global pharmaceutical innovation network (1996-2000)
Figure 1-2. Global pharmaceutical innovation network (2001-2005)

268 269
Figure 1-3. Global pharmaceutical innovation network (2006-2010)
Note: Node positions determined using spectral graph analytic methods according to the nor-
malized Laplacian so that countries that are strongly interconnected positioned nearer to
each other. Node size corresponds to the weighted degree centrality of a country that is
defined as the sum of a country’s co-inventorships, the strength of the lines corresponds to
total co-inventorships between two countries.
Figure 1-4. Global pharmaceutical innovation network (2011-2015)
Generally, collaboration intensity of pharmaceutical innovation significantly increases over those four periods. The US, located in the central position in the networks of the first two periods, 1996-2000 and 2001-2005, maintained the highest collaborative innovation in-tensity with other countries. In 1996-2000, the US built a strong connection with the other countries, mainly situated in Europe, leading collaborative innovation trends in pharma-ceutical industry around the world. In 2001-2005, in terms of absolute size of nodes (coun-tries), the network looks like a so-called star graph, where one hub in the center connects tightly to other nodes. In other words, the US kept its way to extensively strengthen dom-inance in global pharmaceutical innovation network, while the UK established the closest partnership with the US. However, the remarkable changes in overall structure of innova-tion network can be observed easily in the third period, 2006-2010. Interaction dynamics began to disperse across various countries, especially for the countries located near each other in Europe. The leading position of the US in the network slightly weakened due to considerable interaction among other countries. In addition, surprisingly, emerging econ-omies are documented in the network this time. It is the first time that China entered into the innovation network through Japan. At the same time, India joined into the network, connected to the US. Their intensity of collaborative innovation in this network remains in low level in comparison to other countries. During the most recent period, 2011-2015, the pharmaceutical innovation network became more complicated than before. Germany and the UK almost successfully caught up to the US in terms of absolute value of nodes, denoting the intensity of collaborative innovation. The US, together with Germany and the UK, established a distinct cluster of pharmaceutical innovation that is largely integrated in the network. The new cluster tightly connected to other parts of the network. This is to say, the US dominance in collaborative innovation has been sharply slashed during recent five years’ period. In the meantime, we identify that the neighboring countries are likely to build a collaborative relationship in drug innovation due to closeness in geographical area, especially in Europe.

270 271
Note: The percentages in the rows of Difference are equal to values of relative NME minus values
of corresponding total new drugs. The differences are used to measure changes of the cen-
trality share of countries from innovation network based on total new drugs to the network
constructed by NME. The percentages in the total new drugs and NME refer to the share of
national or regional centrality in total sum of relative centrality.
Table 1. Centrality percentage of countries in global drug innovation network: Total new drugs vs. NME drugs (2011-2015)
In addition, we evaluated whether those trends can also be recorded in different types of new drugs. Our dataset constituted distinctive types of new drugs, including New Molec-ular Entity (NME), new dosage form, new active ingredient, new combination and so on. NME, as original core outputs of pharmaceutical innovation, can be developed to other diversified derivatives and complementary new drugs25. Thus, to further understand the global landscape of essential core innovations, it is necessary to determine the roles of key countries and regions by using dataset including NME drugs only, and compare the differences within pharmaceutical innovation network.
Obviously, the US is losing its dominance in the global pharmaceutical innovation network in accordance with all centrality measures produced by NME drugs only. The comparative results based on different datasets are presented in Table 1. The US only shows a little bit higher centralities for degree, closeness and eigenvector centrality while only betweeness centrality is higher than that of Germany and the UK. During 2011-2015, it can be seen clearly that the US, Germany and UK almost share identical dominances in the network, developing into a cluster of pharmaceutical innovation. In general, the US is less dominant neither in the network with total new drugs nor with NME drugs only.
Note: The percentages in the cell refer to the share of the centrality of the United States in total
sum of relative centrality of all countries in global innovation network of specific drug cov-
erage during specific time periods.
Table 2. The centrality shares of the United States in global drug innovation networks
Furthermore, we use the network of total new drugs and NME drugs as well as specific centrality indicator to analyze the evolution of US position in global networks over four five-year periods. From Table 2, the step-by-step reduction of dominance for the US has been significantly recorded in the network during the periods 2001-2005, 2006-2010, and 2011-2015. These findings could be found not only in the global network with total new drug but also with NME drugs, though the US made a sparkling figure in pharmaceutical innovation network at the first two periods. It is probably because frequent interaction among each countries diversifies the global network structure.

272 273
Next, we move to further investigate basic indicator of this network, as shown in Table 3. The findings in Table 3 indicate that the cohesion of the network in pharmaceutical inno-vation are relatively low in first two periods, 1996-2000 and 2001-2005. Identically, interna-tional collaboration of pharmaceutical innovation is in a rather inactive level. Nevertheless, for the latest two periods, 2006-2010 and 2011-2015, the number of collaboration increas-es strikingly, along with the increment in number of edges. This change may mostly be produced by MNCs. Because those companies seek all opportunities to employ high-end knowledge from home and abroad7. In addition, increasing mobility of talents can be a key element in fast change in collaborative innovation. Improvement of research capability in emerging countries is counted as well. Speaking of density of this network, we find that it gradually grows due to more interaction among each country around the world and the involvement of new comers. The mean degree also shares the same trends over four peri-ods, conforming the augmentation of collaboration intensity.
4.2 Pharmaceutical Innovation Landscape in Specific Countries
The previous section demonstrates dynamics of key nodes (countries), such as the US, in pharmaceutical collaborative innovation process from network perspective. Nevertheless, the fact that how the position of other countries shifts in network, is less addressed in the context. Therefore, we employ the centrality analysis to make a comparison on the posi-tion of specific countries in the pharmaceutical innovation network.
Table 3. Indicators for cohesion in the global pharmaceutical networks
We solely consider the collaborative innovation network during 2011-2015, as shown in Ta-ble 4. It, according to three centralities, shows the rankings of each countries followed with centrality value of each countries. The results in Table 4 confirm previous findings on the United States: it partly indicates highest values on degree and betweeness centrality but not on eigenvector centrality. Instead, Germany seeks out catch-up opportunity, listing 1st place on eigenvector centrality. The UK, with a degree centrality 11, eigenvector centrality 0.397, and betweeness 32.75, holds the thirrd place through all three centralities. Those
Table 4. Centrality of countries in the global pharmaceutical network (2011-2015)

274 275
three countries collectively share dominance over whole co-innovation network. Switzer-land secures fourth place on degree and eigenvector centrality, but does not perform well on betweeness centrality. That is, it has relatively high number of partner countries, but it does not play an important role as a gatekeeper.
After that, we try to visualize the evolution of centrality shares of selected countries and regions from 1996 to 2015 (Figure 2). Overlapping time periods are employed to describe subtle changes in the graph. Besides, the centrality share of country refers to the portion between the centrality of specific country and the total centrality of all countries. In Figure 2, the emerging countries, China and India, are grouped into the category of “Rest of the World” (RoW).
Figure 2. Evolution of centrality shares of selected countries over 1996-2015
276 277
We can probably speculate that the emerging countries, China and India, developed higher innovation capability with the decline of United States dominance due to substantial R&D investment in pharmaceutical sector of those emerging economies. However, surprisingly, while United States dominance has been weakening, Europe, as a group, stole the thun-der by achieving considerable improvement on collaborative innovation network (Figure 2.). Europe, by virtue of adjacency of member states, is likely to establish joint innovation relationship. UK and Germany are the striking examples. RoW contains not only countries with high R&D inputs, such as China and India, but also countries with less resource, like Korea. However, less outputs produce in China though high R&D investment is poured into pharmaceutical industry. It is mainly due to new drugs discovery requiring long period and experiencing high risk. It is practical to consecutively evaluate specific country in global innovation landscape of pharmaceutical sector.
4.3 The Role of China in Global Pharmaceutical Innovation Network
As a knowledge-intensive industry, the pharmaceutical sector undoubtedly relies heavily on drug innovation to improve commercial performance and gain more profit from unique new products. Therefore, drug innovation becomes increasingly important for pharmaceu-tical companies themselves. Meanwhile, the government urgently needs the pharmaceuti-cal sector to discover new drugs to overcome emerging diseases as well as reducing health care expense13. Since the development of new drug innovation is highly influenced by financial investment and policy environment, national funding strategy and regulation in China will be prominently analyzed during this study within global pharmaceutical inno-vation network.
From four “five-year” pharmaceutical collaborative innovation network, it is clear to see that the newcomer, China, eventually makes a debut during 2006-2010 period. The first Chinese involved US-patent was found in the pharmaceutical innovation network in 2006. It means that the first new drug with Chinese innovation involvement unprecedentedly entered into international market. Totally, there are only 5 Chinese patents documented in new drugs approved by FDA until 2015. On one hand, the first new drug with Chinese US-patent approved by FDA in 2006 is Sinecatechins – VEREGEN, dedicated to treat exter-nal genital and perianal warts. One of its Chinese US-patent was filed in 1998. This 8-year time lag partly indicates that new drugs innovation takes great amount of time. On the other hand, most of those Chinese patents originated from natural botany, such as the discovery pattern of Traditional Chinese Medicine. However, it is hard to distinguish active pharmaceutical ingredients from complicated natural compounds. This could be a spiny
problem lying in the way of new drug discovery.
In recent decades, China has striven to find its place of pharmaceutical innovation in the international market. All we know is that China, as an emerging giant economy, invested massive capital and talents into industrial innovation, especially into pharmaceutical inno-vation. To be more precise, China launched National Programs for Long- and Medium-term Scientific and Technological Development in 2006 (2006–2020), to encourage enterprises and scientific researchers to innovate new pharmaceutical products. Furthermore, in 2007, the Chinese government released a proposal on Pharmaceutical Industry Development, aiming to strengthen scientific innovation construction as well as speed up transforma-tion from fundamental research to practical products. Still, several subsequent plans were initiated to boost innovation. Unfortunately, pharmaceutical innovation is highly risky and unpredictable. The whole process is likely to take about a decade. In comparison with the US’s ratio of 17.4% of R&D cost to sales, the figure of China remains extremely insufficient, which is only documented to be 2.7% in the ratio R&D to sales26. This may partly account for the different productivity of the new drugs between China and US.
Whereas patent legal protection is probably the most influential factor to stop China work-ing out the dilemma of new drug’s scarcity. Before 2009, owing to the giant pressure from international society, patent laws and amendments came into effect, but it allows a drug to be patented only if it is novelty in China, and no pharmaceuticals were allowed to be pat-ented in the first patent law. Those ineffective law protections for patents heavily impeded the development of new drug. In 2009, the third amendment of patent law was launched to productively prevent imitation from existing drugs even though some pharmaceutical firms continuously took imitation as principle development strategy14. Consequently, we barely found new drugs from China in the US market throughout the global pharmaceuti-cal innovation network.
Through the pharmaceutical innovation network, China, however, made no critical impact on pharmaceutical innovation performance at the first beginning. As Chinese government initiated a series of strategies improving innovation investment together with comprehen-sive patent protection system, China is increasingly strengthening its innovation capabili-ty. Countless efforts from talents and organizations and long period are equally important in drug innovation. In the next decades, we expect that, there will be a more profound and impactful role that China would play in pharmaceutical innovation network.

278 279
5. Conclusions
This research employs the network analysis approach to describe the pharmaceutical inno-vation landscape/structure and dynamics of specific countries. In comparison with recent studies focusing on R&D outputs with country-centric perspective, pharmaceutical R&D collaboration across countries can be documented to value the role of specific country in global pharmaceutical innovation network.
In this study, we find R&D collaborations gained substantial momentum in pharmaceuti-cal innovation, especially during 2011-2015. Throughout the four periods of the five-year development plan initiated by China government, a remarkable increase has been record-ed in the international co-innovation activities and a large shift of the network landscape took place, particularly during year 2006-2010 and 2011-2015. The United States, United Kingdom and Germany formed a dominant cluster identified by various network centrality measures. Additionally, the United States became less dominant in the network during 2006-2015, while Europe’s impact was rising in the pharmaceutical co-innovation, partly due to reinforcement of intra-European countries. China, as one of the emerging countries with high R&D investment, is still left behind and has long way to go. Meanwhile, friendly policy environment is also needed for pharmaceutical innovation.
In the end, limitations of this study should be noted. First, this work uses collaborative inventors of key patents related to new drugs approved by FDA as an indicator to mea-sure joint innovativeness around the world. This indicator, indeed, fully values innovations through their contribution to new drug products, but it fails to measure R&D inputs and innovation in fundamental researches. Second, the research findings solely focus on gen-eral trends of global new drug innovation. It would be more informative if therapeutic types of new drug could be integrated into the analyses, from which we could identify why the United States is dominating the pharmaceutical innovation landscape in specific therapeutic area.
References
1. Tijssen RJ. Internationalisation of pharmaceutical R&D: how globalised are Europe’s largest multinational companies? Technology Analysis & Strategic Management. 2009; 21(7): 859-879.
2. Schuhmacher A, Germann P-G, Trill H, et al. Models for open innovation in the phar-maceutical industry. Drug Discovery Today. 2013; 18(23): 1133-1137.
3. Dubois P, de Mouzon O, Scott‐Morton F, et al. Market size and pharmaceutical inno-vation. The RAND Journal of Economics. 2015; 46(4): 844-871.
4. Kaitin KI. Deconstructing the drug development process: the new face of innova-tion. Clinical Pharmacology and Therapeutics. 2010; 87(3): 356.
5. Lee SM, Olson DL, Trimi S. Co-innovation: convergenomics, collaboration, and co-creation for organizational values. Management Decision. 2012; 50(5): 817-831.
6. Ramirez P. The globalisation of research in the pharmaceutical industry: A case of un-even development. Technology Analysis & Strategic Management. 2006; 18(2): 143-167.
7. Dachs B, Stehrer R, Zahradnik G. The Internationalisation of Business R&D. Ed-ward Elgar Publishing; 2014.
8. Hu Y, Scherngell T, Man SN, et al. Is the United States still dominant in the global pharmaceutical innovation network? PlOS ONE. 2013; 8(11): e77247.
9. Atkinson RD, Ezell SJ, Giddings L, et al. Leadership in decline: Assessing US inter-national competitiveness in biomedical research. Washington, DC: The Information Technology and Innovation Foundation and United for Medical Research. 2012; 78.
10. Ledford H. US fiscal deal leaves science vulnerable. Nature. 2013; 493(7430): 13.
11. Pammolli F, Magazzini L, Riccaboni M. The productivity crisis in pharmaceutical R&D. Nature Reviews Drug Discovery. 2011; 10(6): 428-438.
12. Hughes B. Evolving R&D for Emerging Markets. Nature Publishing Group Macmil-lan Building, 4 Crinan St, London N1 9XW, ENGLAND; 2010.
13. Liang H, Ding J, Xue Y. China’s drug innovation and policy environment. Drug Dis-covery Today. 2011; 16(1): 1-3.

280 281
14. Ding J, Xue Y, Liang H, et al. From imitation to innovation: A study of China’s drug R&D and relevant national policies. Journal of Technology Management & Inno-vation. 2011; 6(2): 1-13.
15. Chaudhuri S. Intellectual Property Rights and Innovation: MNCs in Pharmaceutical Industry in India after TRIPS. New Delhi: Institute for Studies in Industrial Devel-opment. 2014.
16. Friedman Y. Location of pharmaceutical innovation: 2000–2009. Nature Reviews Drug Discovery. 2010; 9(11): 835-836.
17. Talaga P. Open Innovation: share or die…. Drug Discovery Today. 2009; 14(21): 1003-1005.
18. Powell WW, Grodal S. Networks of innovators. The Oxford Handbook of Innova-tion. 2005: 56-85.
19. Lu J-J, Pan W, Hu Y-J, et al. Multi-target drugs: the trend of drug research and devel-opment. PlOS ONE. 2012; 7(6): e40262.
20. Chesbrough HW. Open innovation: The new imperative for creating and profiting from technology: Harvard Business Press; 2006.
21. Hunter J, Stephens S. Is open innovation the way forward for big pharma? Nature Reviews Drug Discovery. 2010; 9(2): 87-88.
22. Munos B. Can Open‐Source Drug R&D Repower Pharmaceutical Innovation? Clinical Pharmacology & Therapeutics. 2010; 87(5): 534-536.
23. Griliches Z. Patent statistics as economic indicators: a survey. National Bureau of Economic Research, 1990.
24. Scott J. Social network analysis: Sage; 2012.
25. Toole AA. The impact of public basic research on industrial innovation: Evidence from the pharmaceutical industry. Research Policy. 2012; 41(1): 1-12.
26. Kermani F, Zhou Y. China commits itself to biotech in healthcare. Drug Discovery Today. 2007; 12(13): 501-503.

282 283
About Our Editors
Prof. Yitao Wang is Chair Professor and Director of the Institute of Chinese Medical Scienc-es (ICMS) at the University of Macau (UM), the Director of State Key Laboratory of Quality Research in Chinese Medicine (UM), and Co-Chair & General Secretary of Chinese Joint Research Centre for Drug Discovery and Development (Peking University, National Taiwan University, University of Hong Kong and UM). As the founding Director of the ICMS at the UM and the State Key Laboratory of Quality Research in Chinese Medicine (UM), Prof. Wang is known internationally for his pioneering contributions to the modernization of Chinese medicine (CM), with an emphasis on systematic evaluation and quality control of CM. He has a long-standing interest in integrating CM research with the cutting-edge areas of sys-tems pharmacology and molecular pharmaceutics. In the past decade, he has published 260 research papers in international peer-reviewed journals included in Science Citation Index (SCI) with a notable h-Index of 36, (co-)edited 16 academic books, and supervised 100+ PhD/MSc graduates and 20 postdoctoral researchers.
Prof. Wang obtained his Bachelor degree (Medical Sciences, 1982) from Chengdu Univer-sity of Chinese Medicine (CUCM), and completed his postgraduate study (Pharmacology, 1986) at Chongqing Medical University. After working as Visiting Scholar at Hiroshima Uni-versity in Japan, he returned to CUCM in 1989 where he contributed to mark several firsts in the history of CM – by establishing the first state key subject in CM education, the first Bachelor programme in Pharmacology of CM, the first postdoctoral training programme in CM, as well as the first “National training base for talents in science – CM”. He served in turn as Dean and Vice President of CUCM, and moved in 1996 to Beijing to take the post of Vice President and Director of Chinese Academy of Chinese Medical Sciences, where he be-came in 1999 the Chief Scientist for China’s first National Basic Research Program of China (973 Program) in the field of CM. In 2000, Prof Wang was appointed Professor and Director for the CM Programme at the Hong Kong University of Science and Technology (HKUST).
In 2002, Yitao set off for Macau and founded the ICMS at UM, which has in 10 years evolved to be a promising academic hub to provide complete programmes from BSc, MSc, PhD to postdoctoral training in Biomedical Sciences. In 2008, together with other local experts, he drafted the proposal to launch the first state key laboratory in CM. This application was approved in 2010 by the Ministry of Science and Technology of China, which announced
to establish in Macao the State Key Laboratory of Quality Research in Chinese Medicine, as China’s first state key laboratory in CM. In 2012, he initiated the creation of the Chinese Joint Research Centre for Drug Discovery and Development among Peking University, National Taiwan University, University of Hong Kong and UM, a strategic partnership to mark the first substantial collaboration in science and technology among the four most elite universities in the Greater China region. In line with these accomplishments, Yitao has also initiated joint training programmes and academic collaborations with world-renown universities (e.g. Harvard University, Yale University, University of Chicago and Cambridge University) and organisations (like the World Health Organization and the US Pharmaco-peial Convention).
Prof Wang has been awarded over 30 major funding grants from national, provincial, and special administrative regional administrations. These supports include the prestigious National Basic Research Programme (973), Mega-projects of Scientific Research for 10th Five-Year Plan, China Ministry of Education Key Project, Macao S&T Development Fund, among others. Only in the period between 2010 and 2014, he has been awarded 28 mil-lion MOP research funding (20 million of which were obtained externally). His outstanding achievements in academic service have also been recognized by 11 prestigious awards, including the Special Allowance for Experts with Outstanding Contribution from the Na-tional Council (1993), National Science and Technology Progress Award (1998), National Intellectual Property Outstanding Achievement Award (1998), Macau Medal of Merit – Ed-ucation (2011) and 1st Macao Science and Technology Awards - Natural Science Award (2012). In addition, Yitao holds adjunct appointments as Director of International Research Centre of Medicinal Administration at Peking University and as adjunct professors / visiting scholars at numerous universities worldwide, and was elected General Secretory for the International Society for Chinese Medicine and Deputy Secretory for the World Federa-tion of Chinese Medicine Societies. In addition, Yitao serves on several of China’s national committee panels including National Science and Technology Programmes, National Basic Research Programme (973), National Natural Science Foundation, the State Science and Technology Awards and National Centre for Drug Evaluation.

284 285
Dr. Yuanjia Hu is Associate Professor of Biomedical Sciences and Programme Coordinator of Medicinal Administration in the Institute of Chinese Medical Sciences, University of Ma-cau (UM). Dr. Hu is doing multidisciplinary research across pharmacy, intellectual property, and technology management. He creatively established a systematic framework for ana-lyzing pharmaceutical patent value based on technological, commercial, and legal indica-tors, which has been well documented in various academic circles such as DIA 2007 and 2010, LES 2016, and WIPO-WTO Colloquium for Teachers of IP 2016. On the other hand, he was actively involved in modern research of Traditional Chinese Medicine based on com-plex network approach. Network-based analytical platform developed by him has been widely used by external project teams. He supervised about 40 Ph.D. and master students and postdoctoral researchers, led above 10 research projects as PI, and further produced over 80 international publications. Dr. Yuanjia Hu received B.Sc. degree from China Phar-maceutical University (CPU), UM-CPU dual M.Sc degree in Medicinal administration, Ph.D. degree in Biomedical Sciences from the UM, and Guest Researcher fellowship in Austri-an Institute of Technology. He is also the founding Commissioner in the Commission on Network Pharmacology of the Chinese Pharmacological Society, Deputy Secretary-Gen-eral and Executive Council Member in Specialty Committee on Network Pharmacology of World Federation of Chinese Medicine Societies, and Project Researcher in the Research Center of National Drug Policy & Ecosystem.
Dr. Albert Wai-Kit Chan is a former research scientist in molecular biology. He was born and raised in Hong Kong, graduated from The Chinese University of Hong Kong, and was awarded his Ph.D. in virology at Baylor College of Medicine in Houston, Texas. Dr. Chan then completed his postdoctoral training at Cold Spring Harbor Laboratory in New York as an American Cancer Society postdoctoral fellow. With the emerging legal needs of the biotechnology industry in the late 1980s, Dr. Chan organically began his career in law, fo-cusing on intellectual property and using his background in science as a solid foundation for his practice. He later received his J.D. degree from Columbia University School of Law in New York.
Through the years, Dr. Chan has handled all areas of intellectual property law, including technology transfer, patents, trademarks, copyrights, business transactions, and trade se-crets. He is well-versed in all aspects of prosecution and litigation and is experienced in licensing, technology transfer and the evaluation of intellectual property portfolios. Since 1996, Dr. Chan has taught as an adjunct professor of law at The City University of New York School of Law. His classes include intellectual property law, patent law, technology
transfer, Internet and the law, food and drug law, and international business law. He is cur-rently adjunct associate professor in the School of Life Sciences at The Chinese University of Hong Kong and has adjunct professorship in the Department of Health Technology and Informatics at The Hong Kong Polytechnic University
Dr. Chan has worked extensively with all constituents of the intellectual property protec-tion process in the U.S., China and other international jurisdictions. The importance of intellectual property protection for, not only businesses but also for, the overall national economy became apparent. With all the IP and transactional work he has done in China, which includes facilitating joint ventures and contracts between East and West companies and building up clients’ intellectual property portfolios, one thing became clear: Intellec-tual Property was a mystery to many people. Not only that, differences in cultures and constant changes in local laws and practices made it difficult for even those who are con-sidered experts in the field to navigate. There was a need to gather to communicate, share perspectives and educate. With this in mind, the United States-China Intellectual Property Institute was founded.
Dr. Albert Wai-Kit Chan is the Managing Partner of the Law Offices of Albert Wai-Kit Chan, PLLC in New York. Dr. Chan also heads Albert Wai-Kit Chan Intellectual Property Limited in Hong Kong. He is currently a registered foreign lawyer at the Law Offices of Hui & Lam in Hong Kong. Hui & Lam is now in association with Long An Law Firm, a full service law firm headquartered in Beijing, China.

286
OUR MISSION
United States-China Intellectual Property Institute (USCIPI) is a non-profit organization de-voted to promoting the mutual understanding of intellectual property practices in the U.S. and China. Our philosophy is “We Educate. We Serve. We Bridge.” We hope our work will help minimize intellectual property disputes between the U.S. and China in order to bring about both countries’ innovative excellence and maximize collaborative opportunities.
OUR METHOD
We are dedicated to educate those interested in learning about intellectual property con-cepts and legal matters of both countries. Hoping to serve as a bridge between the U.S. and China, we invite government officials, scholars and business people of both countries to come together at our meetings, training courses, seminars, and conferences.
About USCIPI