CHAIN MANAGEMENT
317
Creating Value-Adding Networks LOGISTICS AND SUPPLY CHAIN MANAGEMENT Third Edition MARTIN CHRISTOPHER
-
Upload
khangminh22 -
Category
Documents
-
view
1 -
download
0
Transcript of CHAIN MANAGEMENT

Creating Value-Adding Networks
LOGISTICS AND SUPPLYCHAIN MANAGEMENT
Third Edition
MARTIN CHRISTOPHER
Visit our website at www.pearson-books.compearson-books.com – who to read, what to know and where togo in the world of finance. Find out more about the people andideas that can make you and your finances more effective.
About the author
Martin Christopher is Professor of Marketing and Logisticsat Cranfield School of Management. His work in the field of logistics and supply chain management has gained international recognition. He has published widely and isrecognized as a leading authority on how supply chains canbe managed to provide sustainable competitive advantage.Martin is also co-editor of the International Journal of Logistics Management and is a regular contributor to conferences and workshops worldwide.
He is Emeritus Fellow of the Chartered Institute of Logisticsand Transport on whose council he sits. He has beenawarded the Sir Robert Lawrence Gold Medal for his contribution to logistics education.
The goal of supply chain management is to link the marketplace, the distribution network, the manufacturingprocess and the procurement activity in such a way thatcustomers are serviced at higher levels and yet at a lowertotal cost.
In this book, Martin Christopher develops the idea that competition is no longer between stand-alone companies,but rather supply chain against supply chain.
This practical guide provides information on auditing logistics systems and describes how greater responsivenessin the supply chain can be achieved through lead timereduction. Informative case-studies from a wide range ofindustries and markets illustrate the points discussed.
LOGISTICS AND SUPPLYCHAIN MANAGEMENTCreating Value-Adding Networks
9 780273 681762
ISBN 0-273-68176-1
––––––––––––––––––––MANAGEMENT
––––––––––––––––––––
Front Cover Photograph:© Stone/Getty Images
Visit our website at www.pearson-books.com
An imprint of Pearson Education
Develop and exploit logistics strategies
In today’s highly competitive global marketplace, the pressure on organizations to find new ways to createand deliver value to customers grows ever stronger. There is a growing recognition that it is through logistic efficiency and effective management of the supply chain that the twin goals of cost reduction andservice enhancement can be achieved.
Enhanced by diagrams, case-studies and chapter summaries, Logistics and Supply Chain Management looks at the tools, core processes and initiatives to ensure businesses gain and maintain their competitive advantage.
Key topics covered by Logistics and Supply Chain Management include:
● the idea of a customer-driven logistics system based upon identified service priorities and a customerbase segmented according to service requirements
● the many ways in which logistics can impact on overall return on investment and, ultimately,shareholder value
● logistics performance indicators: the concept of competitive benchmarking and the principles behindthe logistics scorecard
● globalization: structuring a global logistics network, outsourcing and the co-ordination of network partners
● the logistics implications of JIT and how developments in information technology have been harnessedto access its power.
New to this edition:
● new chapters on logistics and customer value, integrated logistics and network logistics
● more emphasis on responsiveness, reflecting increased volatility of demand in many markets
● new chapter on managing risk in the supply chain.
Responsiveness, reliability, resilience and relationships – the basis for successful logistics and supply chain management.
Creating Value-Adding Networks
LOGISTICS AND SUPPLYCHAIN MANAGEMENT
LOG
ISTICS A
ND
SUP
PLY
CH
AIN
MA
NA
GE
ME
NT
CH
RISTO
PH
ER
Third Edition
Third Edition

Logistics and Supply Chain Management
LSCH_A01.QXD 12/11/04 3:24 pm Page i

In an increasingly competitive world, we believe it’s quality ofthinking that gives you the edge – an idea that opens newdoors, a technique that solves a problem, or an insight that
simply makes sense of it all. The more you know, the smarterand faster you can go.
That’s why we work with the best minds in business and financeto bring cutting-edge thinking and best learning practice to a
global market.
Under a range of leading imprints, including Financial TimesPrentice Hall, we create world-class print publications and
electronic products bringing our readers knowledge, skills andunderstanding, which can be applied whether studying or at work.
To find out more about Pearson Education publications, or tell us about the books you’d like to find, you can visit us at
www.pearsoned.co.uk
LSCH_A01.QXD 12/11/04 3:24 pm Page ii

Logistics and Supply Chain Management
Creating Value-Adding Networks
Third edition
MARTIN CHRISTOPHER
LSCH_A01.QXD 12/11/04 3:24 pm Page iii

PEARSON EDUCATION LIMITED
Edinburgh GateHarlow CM20 2JE
Tel: +44 (0)1279 623623Fax: +44 (0)1279 431059
Website: www.pearsoned.co.uk
First published 1992Second edition 1998
Third edition published in Great Britain 2005
© Pearson Education Limited 2005
The right of Martin Christopher to be identified as author of this work has been asserted by him in accordance
with the Copyright, Designs and Patents Act 1988.
ISBN 0 273 68176 1
British Library Cataloguing-in-Publication DataA catalogue record for this book is available
from the British Library.
Library of Congress Cataloging-in-Publication DataA catalog record for this book is available
from the Library of Congress
All rights reserved. No part of this publication may be reproduced, stored in a retrieval system, or transmitted in any form or by any means,
electronic, mechanical, photocopying, recording, or otherwise without eitherthe prior written permission of the publisher or a licence permitting restrictedcopying in the United Kingdom issued by the Copyright Licensing Agency Ltd,
90 Tottenham Court Road, London W1T 4LP. This book may not be lent,resold, hired out or otherwise disposed of by way of trade in any form
of binding or cover other than that in which it is published, without the prior consent of the Publishers.
All trademarks used herein are the property of their respective owners. The use of any trademark in this text does not vest in the author or publisher any trademark
ownership rights in such trademarks, nor does the use of such trademarks imply any affiliation with or endorsement of this book by such owners.
10 9 8 7 6 5 4 3 2 109 08 07 06 05
Typeset by 30Printed and bound in Great Britain by
Biddles Ltd, King’s Lynn
The publisher’s policy is to use paper manufacturedfrom sustainable forests.
LSCH_A01.QXD 12/11/04 3:24 pm Page iv

About the Author
Martin Christopher is Professor of Marketing and Logistics atCranfield School of Management, one of Europe’s leading businessschools, which is itself a part of Cranfield University. His work in thefield of logistics and supply chain management has gained internationalrecognition. He has published widely, and Marketing Logistics featuresamong recent books. Martin Christopher is also co-editor of theInternational Journal of Logistics Management and is a regular con-tributor to conferences and workshops around the world.
At Cranfield, Martin Christopher directs the Centre for Logisticsand Supply Chain Management, the largest activity of its type inEurope. The work of the centre covers all aspects of logistics andsupply chain management and offers both full-time and part-timeMasters degree courses as well as extensive management developmentprogrammes. Research plays a key role in the work of the centre andcontributes to its international standing.
Martin Christopher is an Emeritus Fellow of the Chartered Instituteof Logistics and Transport on whose Council he sits. In 1988 he wasawarded the Sir Robert Lawrence Gold Medal for his contribution tologistics education.
LSCH_A01.QXD 12/11/04 3:24 pm Page v

1
LSCH_A01.QXD 12/11/04 3:24 pm Page vi

Contents
Preface ix
1 Logistics, the supply chain and competitive strategy 1Supply chain management is a wider concept than logistics 4Competitive advantage 6The supply chain becomes the value chain 13The mission of logistics management 15The supply chain and competitive performance 17The changing competitive environment 28
2 Logistics and customer value 43The marketing and logistics interface 45Delivering customer value 46What is customer service? 48The impact of out-of-stock 50Customer service and customer retention 53Market-driven supply chains 56Defining customer service objectives 65Setting customer service priorities 69Setting service standards 74
3 Measuring logistics costs and performance 81Logistics and the bottom line 83Logistics and shareholder value 88Logistics cost analysis 95The concept of total cost analysis 96Principles of logistics costing 99Customer profitability analysis 103Direct product profitability 109Cost drivers and activity-based costing 111
4 Creating the responsive supply chain 115Product ‘push’ versus demand ‘pull’ 123The Japanese philosophy 129The foundations of agility 130A routemap to responsiveness 137
5 Strategic lead-time management 143Time-based competition 145The concept of lead time 150Logistics pipeline management 154The lead-time gap 160
vii
LSCH_A01.QXD 12/11/04 3:24 pm Page vii

6 The synchronous supply chain 175The extended enterprise and the virtual supply chain 178The role of information in the virtual supply chain 180Implications for logistics 183‘Quick response’ logistics 190Production strategies for quick response 193Logistics systems dynamics 195Collaboration in the supply chain 199Vendor Managed Inventory 203
7 Managing the global pipeline 205The trend towards globalization in the supply chain 209Gaining visibility in the global pipeline 217Organizing for global logistics 222Thinking global, acting local 225
8 Managing risk in the supply chain 231Why are supply chains more vulnerable? 234Understanding the supply chain risk profile 237Managing supply chain risk 242Achieving supply chain resilience 254
9 Overcoming the barriers to supply chain integration 259Creating the logistics vision 261The problems with conventional organizations 262Developing the logistics organization 267Logistics as the vehicle for change 274Benchmarking 275
10 Entering the era of network competition 281The new organizational paradigm 283Managing the supply chain as a network 286The supply chain of the future 287Seven major business transformations 288The implications for tomorrow’s logistics managers 291Supply chain orchestration 292From 3PL to 4PL™ 295The last word 297
Index 299
viii
CONTENTS
LSCH_A01.QXD 12/11/04 3:24 pm Page viii

Preface
It is only relatively recently that logistics and supply chain managementhave emerged as key business concerns. When the first edition of thisbook appeared in 1992 there were only a few other texts addressingthese subjects, today there are many.
However, even though awareness of the importance of logistics andthe supply chain is now much greater, there are still many companieswhere these ideas have yet to be fully implemented. The good newsthough is that, generally, logistics and supply chain management havemoved much higher up the agenda in organizations in every industryand sector.
Another significant development since the first edition has been thegrowing recognition that supply chains are, in reality, networks. Thesenetworks are complex webs of independent – but interdependent –organizations. As a result of increased out-sourcing of tasks that wereonce performed in-house, the complexity of these webs has grown and,hence, with it the need for active co-ordination of the network. Forthis reason alone the importance of supply chain management isheightened considerably.
This new edition of Logistics and Supply Chain Management buildson the ideas and concepts of the earlier versions but as new thinkingemerges and best practice gets even better, the need for revision and up-dating becomes inevitable. For example, in this third edition there is aneven greater emphasis on responsiveness, reflecting the increasedvolatility of demand in many markets. Another addition is a new chap-ter on supply chain risk, recognizing that as networks become morecomplex so does their vulnerability to disruption increase.
In preparing this book I have drawn greatly on the idea and thoughtsof others. I have been fortunate to work in the stimulating environmentof the Centre for Logistics and Supply Chain Management at CranfieldUniversity and have benefited greatly from interaction with colleagues,post-graduate students and practising managers.
Outside Cranfield I have gained much through a number of fruitfulcollaborations, particularly with Alan Braithwaite, Chairman of LCP
ix
LSCH_A01.QXD 12/11/04 3:24 pm Page ix

Worldwide, Professor John Gattorna of the Sydney Business School,Australia, Professor Douglas Lambert of Ohio State University, USA, andProfessor Denis Towill of Cardiff University, UK.
Finally, I would like to thank Dr Helen Peck who has researched andwritten most of the case studies in the book and Tracy Stickells whohas skilfully masterminded the production of the manuscript – theirefforts are greatly appreciated.
Martin ChristopherProfessor of Marketing and LogisticsCentre for Logistics and Supply Chain ManagementCranfield University, UK
PREFACE
x
LSCH_A01.QXD 12/11/04 3:24 pm Page x

Logistics, the supply chainand competitive strategy
Supply chain management is a wider conceptthan logistics 4
Competitive advantage 6
The supply chain becomes the value chain 13
The mission of logistics management 15
The supply chain and competitive performance 17
The changing competitive environment 28
1
Chapter
1
LSCH_C01.QXD 12/11/04 12:04 pm Page 1

This chapter:
Introduces the concept of logistics with a brief reviewof its origins in military strategy and its subsequentadoption within industry.
●
Highlights the principles of competitive strategy andthe pursuit of differentiation through the developmentof productivity and value advantage.
●
Explains the concept of the value chain and theintegrative role of logistics within the organization.
●
Describes the emerging discipline of supply chainmanagement, defining it and explaining how and whyit takes the principles of logistics forward.
●
Discusses the impact upon logistics and supply chainmanagement of the significant changes in the widercompetitive environment.
LOGISTICS AND SUPPLY CHAIN MANAGEMENT
2
LSCH_C01.QXD 12/11/04 12:04 pm Page 2

Logistics and supply chain management are not new ideas. From thebuilding of the pyramids to the relief of hunger in Africa, the prin-
ciples underpinning the effective flow of materials and information tomeet the requirements of customers have altered little.
Throughout the history of mankind wars have been won and lostthrough logistics strengths and capabilities – or the lack of them. It hasbeen argued that the defeat of the British in the American War ofIndependence can largely be attributed to logistics failure. The BritishArmy in America depended almost entirely upon Britain for supplies.At the height of the war there were 12,000 troops overseas and for themost part they had not only to be equipped, but fed from Britain. Forthe first six years of the war the administration of these vital supplieswas totally inadequate, affecting the course of operations and themorale of the troops. An organization capable of supplying the armywas not developed until 1781 and by then it was too late.1
In the Second World War logistics also played a major role. The AlliedForces’ invasion of Europe was a highly skilled exercise in logistics, aswas the defeat of Rommel in the desert. Rommel himself once said that‘… before the fighting proper, the battle is won or lost by quartermasters’.
However, whilst the Generals andField Marshals from the earliesttimes have understood the criticalrole of logistics, strangely it is only inthe recent past that business organi-zations have come to recognize thevital impact that logistics manage-ment can have in the achievement ofcompetitive advantage. Partly this lack of recognition springs from therelatively low level of understanding of the benefits of integrated logis-tics. As early as 1915, Arch Shaw pointed out that:
1 LOGISTICS, THE SUPPLY CHAIN AND COMPETIT IVE STRATEGY
3
It is only in the recent past thatbusiness organizations have
come to recognize the vital impactthat logistics management can
have in the achievement ofcompetitive advantage.
LSCH_C01.QXD 12/11/04 12:04 pm Page 3

The relations between the activities of demand creation and physicalsupply … illustrate the existence of the two principles of interdependenceand balance. Failure to co-ordinate any one of these activities with itsgroup-fellows and also with those in the other group, or undue emphasisor outlay put upon any one of these activities, is certain to upset the equi-librium of forces which means efficient distribution.
… The physical distribution of the goods is a problem distinct from thecreation of demand … Not a few worthy failures in distribution cam-paigns have been due to such a lack of co-ordination between demandcreation and physical supply …
Instead of being a subsequent problem, this question of supply must bemet and answered before the work of distribution begins.2
It is paradoxical that it has taken almost 100 years for these basic prin-ciples of logistics management to be widely accepted.
What is logistics management in the sense that it is understoodtoday? There are many ways of defining logistics but the underlyingconcept might be defined as:
Logistics is the process of strategically managing the procurement,movement and storage of materials, parts and finished inventory(and the related information flows) through the organization and itsmarketing channels in such a way that current and future profit-ability are maximized through the cost-effective fulfilment of orders.
This basic definition will be extended and developed as the book pro-gresses, but it makes an adequate starting point.
Supply chain management is a wider concept than logistics
Logistics is essentially a planning orientation and framework that seeksto create a single plan for the flow of product and information through abusiness. Supply chain management builds upon this framework andseeks to achieve linkage and co-ordination between the processes ofother entities in the pipeline, i.e. suppliers and customers, and the organi-zation itself. Thus, for example, one goal of supply chain managementmight be to reduce or eliminate the buffers of inventory that existbetween organizations in a chain through the sharing of information ondemand and current stock levels. This is the concept of ‘Co-ManagedInventory’ (CMI) that will be discussed in more detail later in the book.
LOGISTICS AND SUPPLY CHAIN MANAGEMENT
4
LSCH_C01.QXD 12/11/04 12:04 pm Page 4

It will be apparent that supply chain management involves a significantchange from the traditional arm’s-length, even adversarial, relationshipsthat so often typified buyer/supplier relationships in the past. The focusof supply chain management is on co-operation and trust and the recog-nition that, properly managed, the ‘whole can be greater than the sum ofits parts’.
The definition of supply chain management that is adopted in thisbook is:
The management of upstream and downstream relationships withsuppliers and customers to deliver superior customer value at lesscost to the supply chain as a whole.
Thus the focus of supply chain management is upon the managementof relationships in order to achieve a more profitable outcome for allparties in the chain. This brings with it some significant challengessince there may be occasions when the narrow self interest of one partyhas to be subsumed for the benefit of the chain as a whole.
Whilst the phrase ‘supply chain management’ is now widely used, itcould be argued that it should really be termed ‘demand chain manage-ment’ to reflect the fact that the chain should be driven by the market,not by suppliers. Equally the word ‘chain’ should be replaced by ‘net-work’ since there will normally be multiple suppliers and, indeed,suppliers to suppliers as well as multiple customers and customers’ cus-tomers to be included in the total system.
Figure 1.1 illustrates this idea of the firm being at the centre of a net-work of suppliers and customers.
1 LOGISTICS, THE SUPPLY CHAIN AND COMPETIT IVE STRATEGY
5
Fig. 1.1 The supply chain network
LSCH_C01.QXD 12/11/04 12:04 pm Page 5

Extending this idea it has been suggested that a supply chain couldmore accurately be defined as:
A network of connected and interdependent organisations mutuallyand co-operatively working together to control, manage and improvethe flow of materials and information from suppliers to end users.
Source: J Aitken3
Competitive advantage
A central theme of this book is that effective logistics and supply chainmanagement can provide a major source of competitive advantage – inother words a position of enduring superiority over competitors interms of customer preference may be achieved through better manage-ment of logistics and the supply chain.
The foundations for success in the marketplace are numerous, but asimple model is based around the triangular linkage of the company, itscustomers and its competitors – the ‘Three Cs’. Figure 1.2 illustratesthe three-way relationship.
The source of competitive advantage is found firstly in the ability of theorganization to differentiate itself, in the eyes of the customer, from itscompetition and secondly by operating at a lower cost and hence atgreater profit.
LOGISTICS AND SUPPLY CHAIN MANAGEMENT
6
Customers
Needs seeking benefitsat acceptable prices
Costdifferentials
Assets andutilization
Assets andutilization
Company Competitor
Value
Value
Fig. 1.2 Competitive advantage and the ‘Three Cs’Source: Ohmae, K., The Mind of the Strategist, Penguin Books, 1983.
LSCH_C01.QXD 12/11/04 12:04 pm Page 6

Seeking a sustainable and defensible competitive advantage hasbecome the concern of every manager who is alert to the realities of themarketplace. It is no longer acceptable to assume that good productswill sell themselves, neither is it advisable to imagine that success todaywill carry forward into tomorrow.
Let us consider the bases of success in any competitive context. At itsmost elemental, commercial success derives from either a cost advan-tage or a value advantage or, ideally, both. It is as simple as that – themost profitable competitor in any industry sector tends to be the lowestcost producer or the supplier providing a product with the greatest per-ceived differentiated values.
Put very simply, successful companies either have a cost advantageor they have a value advantage, or a combination of the two. Costadvantage gives a lower cost profile and the value advantage gives theproduct or offering a differential ‘plus’ over competitive offerings.
Let us briefly examine these two vectors of strategic direction.
1 Cost advantage
In many industries there will typically be one competitor who will bethe low-cost producer and often that competitor will have the greatestsales volume in the sector. There is substantial evidence to suggest that‘big is beautiful’ when it comes to cost advantage. This is partly due toeconomies of scale, which enable fixed costs to be spread over a greatervolume, but more particularly to the impact of the ‘experience curve’.
The experience curve is a phenomenon with its roots in the earliernotion of the ‘learning curve’. Researchers in the Second World Wardiscovered that it was possible to identify and predict improvements inthe rate of output of workers as they became more skilled in theprocesses and tasks on which they were working. Subsequent work byBruce Henderson, founder of the Boston Consulting Group, extendedthis concept by demonstrating that all costs, not just production costs,would decline at a given rate as volume increased (see Figure 1.3). Infact, to be precise, the relationship that the experience curve describesis between real unit costs and cumulative volume.
1 LOGISTICS, THE SUPPLY CHAIN AND COMPETIT IVE STRATEGY
7
LSCH_C01.QXD 12/11/04 12:04 pm Page 7
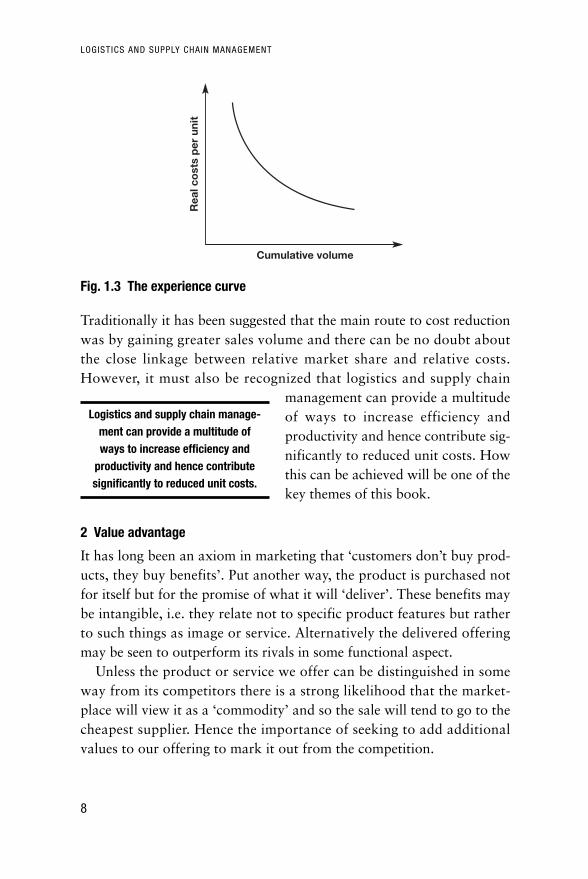
Traditionally it has been suggested that the main route to cost reductionwas by gaining greater sales volume and there can be no doubt aboutthe close linkage between relative market share and relative costs.However, it must also be recognized that logistics and supply chain
management can provide a multitudeof ways to increase efficiency andproductivity and hence contribute sig-nificantly to reduced unit costs. Howthis can be achieved will be one of thekey themes of this book.
2 Value advantage
It has long been an axiom in marketing that ‘customers don’t buy prod-ucts, they buy benefits’. Put another way, the product is purchased notfor itself but for the promise of what it will ‘deliver’. These benefits maybe intangible, i.e. they relate not to specific product features but ratherto such things as image or service. Alternatively the delivered offeringmay be seen to outperform its rivals in some functional aspect.
Unless the product or service we offer can be distinguished in someway from its competitors there is a strong likelihood that the market-place will view it as a ‘commodity’ and so the sale will tend to go to thecheapest supplier. Hence the importance of seeking to add additionalvalues to our offering to mark it out from the competition.
LOGISTICS AND SUPPLY CHAIN MANAGEMENT
8
Cumulative volume
Rea
l co
sts
per
uni
t
Fig. 1.3 The experience curve
Logistics and supply chain manage-ment can provide a multitude ofways to increase efficiency and
productivity and hence contributesignificantly to reduced unit costs.
LSCH_C01.QXD 12/11/04 12:04 pm Page 8

What are the means by which such value differentiation may begained? Essentially the development of a strategy based upon addedvalues will normally require a more segmented approach to the market.When a company scrutinizes markets closely it frequently finds thatthere are distinct ‘value segments’. In other words, different groups ofcustomers within the total market attach different importance to differ-ent benefits. The importance of such benefit segmentation lies in thefact that often there are substantial opportunities for creating differen-tiated appeals for specific segments. Take the motor car as an example.A model such as the Ford Mondeo is not only positioned in the middlerange of European cars but within that broad category specific versionsare aimed at defined segments. Thus we find the basic, small engine,two-door model at one end of the spectrum and the four-door, highperformance version at the other extreme. In between are a whole vari-ety of options each of which seeks to satisfy the needs of quite different‘benefit segments’. Adding value through differentiation is a powerfulmeans of achieving a defensible advantage in the market.
Equally powerful as a means of adding value is service. Increasingly itis the case that markets are becoming more service sensitive and this ofcourse poses particular challenges for logistics management. There is atrend in many markets towards a decline in the strength of the ‘brand’and a consequent move towards ‘commodity’ market status. Quitesimply this means that it is becoming progressively more difficult to com-pete purely on the basis of brand or corporate image. Additionally, thereis increasingly a convergence of technology within product categories,which means that it is often no longer possible to compete effectively onthe basis of product differences. Thus the need to seek differentiationthrough means other than technology. Many companies have respondedto this by focusing upon service as a means of gaining a competitive edge.Service in this context relates to the process of developing relationshipswith customers through the provision of an augmented offer. This aug-mentation can take many forms including delivery service, after-salesservices, financial packages, technical support and so forth.
In practice what we find is that the successful companies will oftenseek to achieve a position based upon both a cost advantage and avalue advantage. A useful way of examining the available options is topresent them as a simple matrix. Let us consider these options in turn.
1 LOGISTICS, THE SUPPLY CHAIN AND COMPETIT IVE STRATEGY
9
LSCH_C01.QXD 12/11/04 12:04 pm Page 9

For companies who find themselves in the bottom left hand corner ofour matrix (Figure 1.4) the world is an uncomfortable place. Theirproducts are indistinguishable from their competitors’ offerings andthey have no cost advantage. These are typical commodity market situ-ations and ultimately the only strategy is either to move to the right ofthe matrix, i.e. to cost leadership, or upwards towards service leader-ship. Often the cost leadership route is simply not available. Thisparticularly will be the case in a mature market where substantialmarket share gains are difficult to achieve. New technology may some-times provide a window of opportunity for cost reduction but in suchsituations the same technology is often available to competitors.
Cost leadership strategies have traditionally been based upon theeconomies of scale, gained through sales volume. This is why marketshare is considered to be so important in many industries. However, ifvolume is to be the basis for cost leadership then it is preferable for thatvolume to be gained early in the market life cycle. The ‘experience curve’concept, briefly described earlier, demonstrates the value of early marketshare gains – the higher your share relative to your competitors the loweryour costs should be. This cost advantage can be used strategically toassume a position of price leader and, if appropriate, to make it impossi-ble for higher-cost competitors to survive. Alternatively, price may bemaintained, enabling above-average profit to be earned, which potentiallyis available to further develop the position of the product in the market.
LOGISTICS AND SUPPLY CHAIN MANAGEMENT
10
Valu
e ad
vant
age
Cost advantage
Low High
Low
Hig
h Serviceleader
Cost andservice leader
Commoditymarket
Costleader
Fig. 1.4 Logistics and competitive advantage
LSCH_C01.QXD 12/11/04 12:04 pm Page 10

However, an increasingly powerful route to achieving a cost advan-tage comes not necessarily through volume and the economies of scalebut instead through logistics and supply chain management. In manyindustries, logistics costs represent such a significant proportion oftotal costs that it is possible to make major cost reductions throughfundamentally re-engineering logistics processes. The means wherebythis can be achieved will be returned to later in this book.
The other way out of the ‘commodity’ quadrant of the matrix is toseek a strategy of differentiation through service excellence. We havealready commented on the fact that markets have become more‘service-sensitive’. Customers in all industries are seeking greaterresponsiveness and reliability from suppliers; they are looking forreduced lead times, just-in-time delivery and value-added services thatenable them to do a better job of serving their customers. In Chapter 2we will examine the specific ways in which superior service strategies,based upon enhanced logistics management, can be developed.
One thing is certain: there is no middle ground between cost leadershipand service excellence. Indeed the challenge to management is to iden-tify appropriate logistics and supply chain strategies to take theorganization to the top right hand corner of the matrix. Companieswho occupy that position have offers that are distinctive in the valuethey deliver and are also cost competitive. Clearly it is a position of
1 LOGISTICS, THE SUPPLY CHAIN AND COMPETIT IVE STRATEGY
11
Rel
ativ
e d
iffer
entia
tion
Relative delivered costs
High Low
Low
Hig
h
Fig. 1.5 The challenge to logistics and supply chain management
LSCH_C01.QXD 12/11/04 12:04 pm Page 11

some strength, occupying ‘high ground’ that is extremely difficult forcompetitors to attack. Figure 1.5 clearly presents the challenge: it is toseek out strategies that will take the business away from the ‘commod-ity’ end of the market towards a securer position of strength basedupon differentiation and cost advantage.
Logistics management, it can be argued, has the potential to assistthe organization in the achievement of both a cost advantage and avalue advantage. As Figure 1.6 suggests, in the first instance there are anumber of important ways in which productivity can be enhancedthrough logistics and supply chain management. Whilst these possibili-ties for leverage will be discussed in detail later in the book, suffice it tosay that the opportunities for better capacity utilization, inventoryreduction and closer integration with suppliers at a planning level areconsiderable. Equally the prospects for gaining a value advantage in themarketplace through superior customer service should not be under-estimated. It will be argued later that the way we service the customerhas become a vital means of differentiation.
To summarize, those organizations that will be the leaders in the mar-kets of the future will be those that have sought and achieved the twinpeaks of excellence: they have gained both cost leadership and serviceleadership.
LOGISTICS AND SUPPLY CHAIN MANAGEMENT
12
Valueadvantage
Logistics leverageopportunities:
• Tailored services• Reliability• Responsiveness
Cost advantageLogistics leverage opportunities:
The goal:superior
customervalue atless cost
• Capacity utilization• Asset turn• Synchronous supply
Fig. 1.6 Gaining competitive advantage
LSCH_C01.QXD 12/11/04 12:04 pm Page 12

The underlying philosophy behind the logistics and supply chainconcept is that of planning and co-ordinating the materials flow fromsource to user as an integrated system rather than, as was so often thecase in the past, managing the goods flow as a series of independentactivities. Thus under this approach the goal is to link the marketplace,the distribution network, the manufacturing process and the procure-ment activity in such a way that customers are serviced at higher levelsand yet at lower cost. In other words the goal is to achieve competitiveadvantage through both cost reduction and service enhancement.
The supply chain becomes the value chain
Of the many changes that have taken place in management thinkingover the last 20 years or so perhaps the most significant has been theemphasis placed upon the search for strategies that will provide supe-rior value in the eyes of the customer. To a large extent the credit forthis must go to Michael Porter, the Harvard Business School professor,who through his research and writing4 has alerted managers and strate-gists to the central importance of competitive relativities in achievingsuccess in the marketplace.
One concept in particular that Michael Porter has brought to awider audience is the ‘value chain’:
Competitive advantage cannot be understood by looking at a firm as awhole. It stems from the many discrete activities a firm performs indesigning, producing, marketing, delivering, and supporting its product.Each of these activities can contribute to a firm’s relative cost position andcreate a basis for differentiation … The value chain disaggregates a firminto its strategically relevant activities in order to understand the behav-iour of costs and the existing and potential sources of differentiation. Afirm gains competitive advantage by performing these strategically impor-tant activities more cheaply or better than its competitors.5
Value chain activities (shown in Figure 1.7) can be categorized into twotypes – primary activities (inbound logistics, operations, outboundlogistics, marketing and sales, and service) and support activities (infra-structure, human resource management, technology development andprocurement). These activities are integrating functions that cut acrossthe traditional functions of the firm. Competitive advantage is derived
1 LOGISTICS, THE SUPPLY CHAIN AND COMPETIT IVE STRATEGY
13
LSCH_C01.QXD 12/11/04 12:04 pm Page 13

from the way in which firms organize and perform these activitieswithin the value chain. To gain competitive advantage over its rivals, afirm must deliver value to its customers by performing these activitiesmore efficiently than its competitors or by performing the activities in aunique way that creates greater differentiation.
The implication of Michael Porter’s thesis is that organizations shouldlook at each activity in their value chain and assess whether they have areal competitive advantage in the activity. If they do not, the argumentgoes, then perhaps they should consider outsourcing that activity to apartner who can provide that cost or value advantage. This logic isnow widely accepted and has led to the dramatic upsurge in outsourc-ing activity that can be witnessed in almost every industry.
The effect of outsourcing is to extend the value chain beyond theboundaries of the business. In other words, the supply chain becomesthe value chain. Value (and cost) is created not just by the focal firm ina network, but by all the entities that connect to each other.
Outsourcing has made supply chains more complex and hence hasmade the need for effective supply chain management even more pressing.
LOGISTICS AND SUPPLY CHAIN MANAGEMENT
14
Firm infrastructure
Human resource management
Technology development
Procurement
Supportactivities
Outboundlogistics
OperationsInboundlogistics
Marketingand sales
Service
Primary activities
Ma
rgin
Fig. 1.7 The value chainSource: Porter, M.E., Competitive Advantage, The Free Press, 1985.
LSCH_C01.QXD 12/11/04 12:04 pm Page 14

The mission of logistics management
It will be apparent from the previous comments that the mission of logis-tics management is to plan and co-ordinate all those activities necessaryto achieve desired levels of deliveredservice and quality at lowest possiblecost. Logistics must therefore be seenas the link between the marketplaceand the supply base. The scope oflogistics spans the organization, fromthe management of raw materials through to the delivery of the finalproduct. Figure 1.8 illustrates this total systems concept.
Logistics management, from this total systems viewpoint, is the meanswhereby the needs of customers are satisfied through the co-ordinationof the materials and information flows that extend from the market-place, through the firm and its operations and beyond that to suppliers.To achieve this company-wide integration clearly requires a quite dif-ferent orientation than that typically encountered in the conventionalorganization.
For example, for many years marketing and manufacturing have beenseen as largely separate activities within the organization. At best theyhave coexisted, at worst there has been open warfare. Manufacturingpriorities and objectives have typically been focused on operating effi-ciency, achieved through long production runs, minimized set-ups andchange-overs and product standardization. On the other hand, market-ing has sought to achieve competitive advantage through variety, highservice levels and frequent product changes.
1 LOGISTICS, THE SUPPLY CHAIN AND COMPETIT IVE STRATEGY
15
Suppliers
Materials flow
Procurement Operations Distribution Customers
Requirements information flow
Fig. 1.8 Logistics management process
The scope of logistics spans theorganization, from the management
of raw materials through to thedelivery of the final product.
LSCH_C01.QXD 12/11/04 12:04 pm Page 15
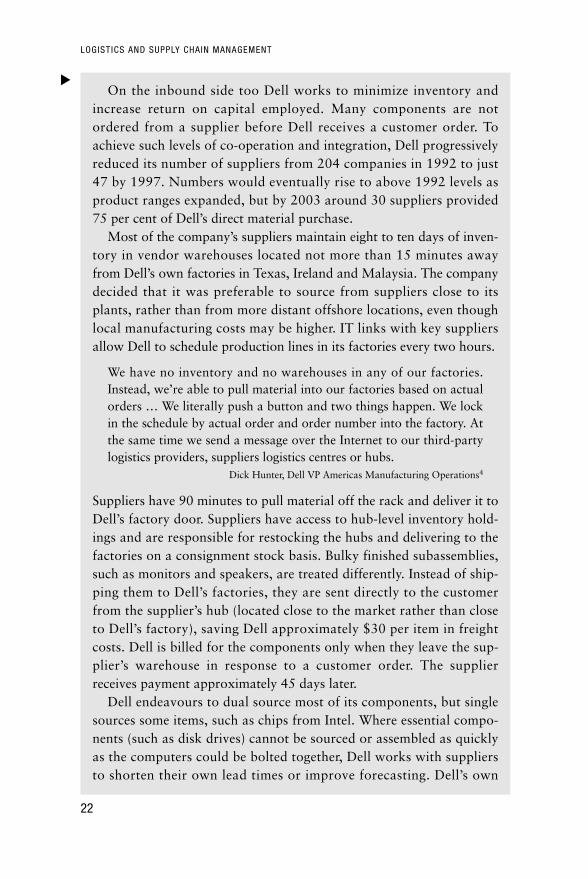
In today’s more turbulent environment there is no longer any possi-bility of manufacturing and marketing acting independently of eachother. The internecine disputes between the ‘barons’ of production andmarketing are clearly counter-productive to the achievement of overallcorporate goals.
It is no coincidence that in recent years both marketing and manufac-turing have become the focus of renewed attention. Marketing as aconcept and a philosophy of customer orientation now enjoys a wideracceptance than ever. It is now generally accepted that the need tounderstand and meet customer requirements is a prerequisite for sur-vival. At the same time, in the search for improved cost competitiveness,manufacturing management has been the subject of a massive revolu-tion. The last decade has seen the rapid introduction of flexiblemanufacturing systems (FMS), of new approaches to inventory based onmaterials requirements planning (MRP) and just-in-time (JIT) methodsand, perhaps most important of all, a sustained emphasis on total qual-ity management (TQM).
Equally there has been a growing recognition of the critical role thatprocurement plays in creating and sustaining competitive advantage aspart of an integrated logistics process. Leading-edge organizationsnow routinely include supply-side issues in the development of theirstrategic plans. Not only is the cost of purchased materials and sup-plies a significant part of total costs in most organizations, but there isa major opportunity for leveraging the capabilities and competenciesof suppliers through closer integration of the buyers’ and suppliers’logistics processes.
In this scheme of things, logistics is therefore essentially an integrativeconcept that seeks to develop a system-wide view of the firm. It is fun-damentally a planning concept that seeks to create a framework throughwhich the needs of the marketplace can be translated into a manufactur-ing strategy and plan, which in turn links into a strategy and plan forprocurement. Ideally there should be a ‘one-plan’ mentality within thebusiness which seeks to replace the conventional stand-alone and sepa-rate plans of marketing, distribution, production and procurement.This, quite simply, is the mission of logistics management.
LOGISTICS AND SUPPLY CHAIN MANAGEMENT
16
LSCH_C01.QXD 12/11/04 12:04 pm Page 16

The supply chain and competitive performance
Traditionally most organizations have viewed themselves as entitiesthat exist independently from others and indeed need to compete withthem in order to survive. There is almost a Darwinian ethic of the ‘sur-vival of the fittest’ driving much of corporate strategy. However, such aphilosophy can be self-defeating if it leads to an unwillingness to co-operate in order to compete. Behind this seemingly paradoxical conceptis the idea of supply chain integration.
The supply chain is the network of organizations that are involved,through upstream and downstream linkages, in the different processes andactivities that produce value in the form of products and services in thehands of the ultimate consumer. Thus, for example, a shirt manufactureris a part of a supply chain that extends upstream through the weavers offabrics to the manufacturers of fibres, and downstream through distribu-tors and retailers to the final consumer. Each of these organizations in thechain are dependent upon each other by definition and yet, paradoxically,by tradition do not closely co-operate with each other.
Supply chain management is not the same as ‘vertical integration’.Vertical integration normally implies ownership of upstream suppliersand downstream customers. This was once thought to be a desirablestrategy but increasingly organizations are now focusing on their ‘corebusiness’ – in other words the things they do really well and where theyhave a differential advantage. Everything else is ‘outsourced’ – in otherwords it is procured outside the firm. So, for example, companies thatperhaps once made their own components now only assemble the fin-ished product, e.g. automobile manufacturers. Other companies mayalso subcontract the manufacturing as well, e.g. Nike in footwear andsportswear. These companies have sometimes been termed ‘virtual’ or‘network’ organizations.
Clearly this trend has many implications for supply chain manage-ment, not the least being the challenge of integrating and co-ordinatingthe flow of materials from a multitude of suppliers, often offshore, andsimilarly managing the distribution of the finished product by way ofmultiple intermediaries.
In the past it was often the case that relationships with suppliers anddownstream customers (such as distributors or retailers) were adver-sarial rather than co-operative. It is still the case today that some
1 LOGISTICS, THE SUPPLY CHAIN AND COMPETIT IVE STRATEGY
17
LSCH_C01.QXD 12/11/04 12:04 pm Page 17

companies will seek to achieve cost reductions or profit improvementat the expense of their supply chain partners. Companies such as thesedo not realize that simply transferring costs upstream or downstreamdoes not make them any more competitive. The reason for this is thatultimately all costs will make their way to the final marketplace to bereflected in the price paid by the end user. The leading-edge companiesrecognize the fallacy of this conventional approach and instead seek tomake the supply chain as a whole more competitive through the valueit adds and the costs that it reduces overall. They have realized that thereal competition is not company against company but rather supplychain against supply chain.
It must be recognized that the concept of supply chain management,whilst relatively new, is in fact no more than an extension of the logicof logistics. Logistics management is primarily concerned with optimiz-ing flows within the organization, whilst supply chain managementrecognizes that internal integration by itself is not sufficient. Figure 1.9suggests that there is in effect an evolution of integration from the stage1 position of complete functional independence where each businessfunction such as production or purchasing does their own thing incomplete isolation from the other business functions. An examplewould be where production seeks to optimize its unit costs of manufac-ture by long production runs without regard for the build-up offinished goods inventory and heedless of the impact it will have on theneed for warehousing space and the impact on working capital.
Stage 2 companies have recognized the need for at least a limiteddegree of integration between adjacent functions, e.g. distribution andinventory management or purchasing and materials control. The nat-ural next step to stage 3 requires the establishment and implementationof an ‘end-to-end’ planning framework that will be fully described laterin this book.
Stage 4 represents true supply chain integration in that the conceptof linkage and co-ordination that is achieved in stage 3 is nowextended upstream to suppliers and downstream to customers. There isthus a crucial and important distinction to be made between logisticsand supply chain management.
LOGISTICS AND SUPPLY CHAIN MANAGEMENT
18
LSCH_C01.QXD 12/11/04 12:04 pm Page 18

1 LOGISTICS, THE SUPPLY CHAIN AND COMPETIT IVE STRATEGY
19
Material
flow
Customer
service
Stage one: baseline
Purchasing Materialcontrol
Production Sales Distribution
Material
flow
Customer
service
Stage two: functional integration
Materialsmanagement
Manufacturingmanagement
Distribution
Material
flow
Customer
service
Stage three: internal integration
Manufacturingmanagement
Distribution
Material
flow
Customer
service
Stage four: external integration
Suppliers Internal supplychain
Customers
Materialsmanagement
Fig. 1.9 Achieving an integrated supply chainSource : Stevens, G.C., ‘Integrating the Supply Chain’, International Journal of Physical Distribution and Materials Management, Vol. 19, No. 8, 1989.
Dell Inc.: using the supply chain to compete
The personal computer (PC) sector was still in its infancy when, in1983, medical student Michael Dell began buying up remainder stocksof outdated IBM PCs from local retailers. Dell upgraded the machinesin his college dorm, then sold them on at bargain prices to eager cus-tomers. Dell abandoned his studies soon afterwards to concentrate onhis growing computer business. By 1985 Dell Computer had switchedfrom upgrading old IBMs to building its own machines. Even then,
▼
LSCH_C01.QXD 12/11/04 12:04 pm Page 19

LOGISTICS AND SUPPLY CHAIN MANAGEMENT
20
Dell was different from other computer manufacturers of its day. Themachines themselves were technologically unremarkable, but it wasthe way in which they were sold – directly to the customer – that gavethe upstart company a unique advantage over established PC makers.
Dell’s business model
While the industry leaders vied to introduce PCs with ever faster andmore impressive technology, they gave little consideration to the mun-dane business of supply chain management. The computers theyproduced were invariably made-to-forecast and because of the waythey were sold – through shops, resellers and systems integrators –were then destined to languish for an average of two months in ware-houses or on shop shelves before being purchased by a customer. Indoing so they exposed their makers to the inherent double jeopardycreated by the dynamics and economics of the industry. Firstly, compo-nent costs have been falling since the industry’s inception, particularlythe all-important processors that had fallen in price by an average of30 per cent per year.1 The longer these components wait to be sold, theworse value they become. Historically, component costs accounted foraround 80 per cent of the total cost of a PC. Secondly, there is the riskthat a step-change in technology may make millions of dollars’ worthof finished product obsolete overnight, forcing manufacturers to com-pensate resellers for unloading stocks at a loss.
By selling directly to the customer Dell was able to configure andassemble every PC to order, which in turn enabled it to maintain itscost advantage over conventional rivals. Dell’s low-priced machineswith their bespoke configuration were an attractive option for cus-tomers who were confident enough to buy direct. Nevertheless, formany years received wisdom in the industry considered Dell to benothing more than a successful niche player. It was widely believedthat the majority of business-to-business customers, and indeed con-sumers buying PCs for the home, would always prefer to purchasetheir equipment through traditional channels. Distributors and retail-ers would reassure the customer that help would be at hand shouldsomething go wrong. Moreover, consumers could see and touch theproducts before purchase.
LSCH_C01.QXD 12/11/04 12:04 pm Page 20

1 LOGISTICS, THE SUPPLY CHAIN AND COMPETIT IVE STRATEGY
21
In the early 1990s Dell embarked on a brief flirtation with conven-tional retail distribution channels in a bid to break out of its perceivedniche. The move was a mistake. Retail sales plummeted as soon as Delloffered a new PC through its direct channel. Dell was obliged to com-pensate the retailers for their losses. As a result, the company postedits first ever loss ($36m) in 1993.2 The ill-judged foray was a salutarylesson in the perils of attempting to operate through conflicting distri-bution channels and a vindication of its original low-cost direct salesstrategy. Dell pulled out of the retail market in 1994 and retrenchedwith a vengeance, rebounding immediately with profits of $149m.From this point on Dell concentrated on finding ways to leverage thestrengths of its original direct sales strategy.
The arrival of the Internet offered Dell the opportunity to develop aneven more cost-effective version of its direct-sales approach. Thecompany was not the first PC retailer to venture into cyberspace,though no other manufacturer was better placed to make such a move.Within six months of opening for business through its website, Dell wasclocking up Internet sales of $1m per day, with sales through the channelgrowing by 20 per cent per month.3 Far from remaining a small nicheoption, direct buyers soon accounted for a third of all PC sales in theUS, up from only 15 per cent in 1991. Not more than 36 hours afterplacing an Internet order, customers’ bespoke PCs trundled off theproduction lines and onto delivery trucks. In fact more than 80 per centof Dell’s orders were built, customized and shipped within eight hours.More time was spent testing the machines and loading software thanactually assembling them. For most direct-to-customer sales Dell couldexpect to see payment within 24 hours of order placement, whileCompaq (global market leader at the time) had to wait around 35 daysfor payment through primary dealers. Even other direct sellers were aptto take over a fortnight to convert an order in cash.
Dell’s own operations continue to be constantly re-examined tosqueeze every possible moment of non-value-adding time out of pro-curement and assembly processes. As a result, the total number ofinterventions or ‘touches’ involved in the manufacture of a Dell PC hasbeen reduced to 60, against an industry average of around 130. Thesimplification is facilitated in part by Dell’s focus on common compo-nents and, from the late 1990s, the formation of long-term relationshipswith suppliers, including competitors such as IBM and Toshiba.
▼
LSCH_C01.QXD 12/11/04 12:04 pm Page 21
LOGISTICS AND SUPPLY CHAIN MANAGEMENT
22
On the inbound side too Dell works to minimize inventory andincrease return on capital employed. Many components are notordered from a supplier before Dell receives a customer order. Toachieve such levels of co-operation and integration, Dell progressivelyreduced its number of suppliers from 204 companies in 1992 to just47 by 1997. Numbers would eventually rise to above 1992 levels asproduct ranges expanded, but by 2003 around 30 suppliers provided75 per cent of Dell’s direct material purchase.
Most of the company’s suppliers maintain eight to ten days of inven-tory in vendor warehouses located not more than 15 minutes awayfrom Dell’s own factories in Texas, Ireland and Malaysia. The companydecided that it was preferable to source from suppliers close to itsplants, rather than from more distant offshore locations, even thoughlocal manufacturing costs may be higher. IT links with key suppliersallow Dell to schedule production lines in its factories every two hours.
We have no inventory and no warehouses in any of our factories.Instead, we’re able to pull material into our factories based on actualorders … We literally push a button and two things happen. We lockin the schedule by actual order and order number into the factory. Atthe same time we send a message over the Internet to our third-partylogistics providers, suppliers logistics centres or hubs.
Dick Hunter, Dell VP Americas Manufacturing Operations4
Suppliers have 90 minutes to pull material off the rack and deliver it toDell’s factory door. Suppliers have access to hub-level inventory hold-ings and are responsible for restocking the hubs and delivering to thefactories on a consignment stock basis. Bulky finished subassemblies,such as monitors and speakers, are treated differently. Instead of ship-ping them to Dell’s factories, they are sent directly to the customerfrom the supplier’s hub (located close to the market rather than closeto Dell’s factory), saving Dell approximately $30 per item in freightcosts. Dell is billed for the components only when they leave the sup-plier’s warehouse in response to a customer order. The supplierreceives payment approximately 45 days later.
Dell endeavours to dual source most of its components, but singlesources some items, such as chips from Intel. Where essential compo-nents (such as disk drives) cannot be sourced or assembled as quicklyas the computers could be bolted together, Dell works with suppliersto shorten their own lead times or improve forecasting. Dell’s own
▼
LSCH_C01.QXD 12/11/04 12:04 pm Page 22

1 LOGISTICS, THE SUPPLY CHAIN AND COMPETIT IVE STRATEGY
23
forecasts are posted on its extranet. Fortunately, demand for compo-nents is much more predictable than demand for finished goods,though shortages of some critical components (most notably micro-processors) can be a problem across the industry. Here again, thedirect sales method placed Dell at an advantage over those makerswho used traditional routes to market. Because Dell communicatesdirectly with its customers, it is able to shape demand by steering cus-tomers towards configurations using readily available components.The model enables Dell to carry only four days’ inventory, while manyof its competitors continue to hold between 20–30 days worth.5
Twenty-first century price wars
Dell’s mastery of its own business model allowed it to grow at a ratethat was more than three times the industry average throughout the1990s. By the end of the decade it was challenging global market leaderCompaq to become the world’s biggest PC maker (by unit sales).Importantly, Dell’s operating margins had been maintained regardlessof relentless downward pressure on prices. However, things seemed totake a dramatic downturn in February 2001 when Dell revealed itsfourth quarter results. The announcement was accompanied by thenews of the first ever redundancies in its 16-year history: 1700 jobs,accounting for 4 per cent of its workforce, were to go immediately.Some analysts had seen it coming, others scurried to investigate.
In the US, still home to more than 70 per cent of its business,demand for Dell’s core product – the mid-range office desktop – wasweakening. Michael Dell maintained his stance that reports of thedeath of the PC were exaggerated. Nevertheless, it was clear thatdemand for PCs had fallen sharply after a pre-Y2K boom in sales.Across the industry manufacturers were suffering a post-millenniumhangover and everyone was feeling the pinch. To the alarm of its com-petitors Dell resorted to slashing PC prices in a bid to increase its shareof the US market, a region where its rivals were already struggling toturn a profit. Dell went on to announce a further 4000 redundancies inMay 2001 as the industry descended into a full-blooded price war.There was speculation that Dell might be prepared to lower its mar-gins as far as 3.5 per cent, pushing most of its rivals well into the red.
▼
LSCH_C01.QXD 12/11/04 12:04 pm Page 23

LOGISTICS AND SUPPLY CHAIN MANAGEMENT
24
IBM’s PC unit was already making a loss but, being focused on thecorporate market, it was managing to claw back margin on its servicepackages. For the smaller players, the future looked bleak. Some, suchas Micron Electronics, had already bailed out of the PC sector, whileothers were to do the same before the year was over. Meanwhile newsof an impending merger with Hewlett Packard damaged Compaq’ssales, apparently allowing Dell to capitalize on confusion in themarketplace. It gained a 31 per cent share of the US market at theexpense of its nearest rivals. Despite the aggressive price-cutting,analysts believed that Dell had managed to maintain margins ofaround 7 per cent,6 but in the post-Enron and post-9/11 malaise WallStreet was nervous. There were whisperings that Dell might be tooaggressive in its accounting practices and rumours that it made suppliershold back inventory at the end of a quarter to improve its figures.7
I’m not going to suggest that there couldn’t be incidents where we didthings that could appear like that … but on a broad scale, no, thatdoes not reflect our activities at all.
Michael Dell8
The merger between Hewlett Packard and Compaq had been designedto protect their evaporating margins, but post-merger integration didnot go smoothly. Outside the US efforts to cut costs through rational-ization across the two companies repeatedly fell foul of labour and taxlaws or systems requirements in other national markets, while in theUS the newly combined group found that Best Buy, the largest retailerof Hewlett Packard PCs, was keen to restrict shelf space for the newgiant, fearing that the enlarged company could wield too much power.Hewlett Packard and other established industry players had repeatedlytried to improve their own cost structures by emulating Dell’s directsales formula, but many retreated after running into the same channelconflicts as Dell had encountered with its foray into retail sales.
New territories
By November 2001, Dell was undisputed leader of the still contractingglobal PC market, but analysts were anxious about Dell’s dependence onits depressed domestic market. The company had been expanding over-seas for some years but had struggled in Europe, particularly in Germany
▼
LSCH_C01.QXD 12/11/04 12:04 pm Page 24

1 LOGISTICS, THE SUPPLY CHAIN AND COMPETIT IVE STRATEGY
25
where it had experienced great difficulty in establishing a managementteam schooled in and capable of delivering the Dell model. In terms ofmarket share, it had latterly managed to improve its position, but conti-nental Europeans did not embrace the direct sales model as readily astheir US and British counterparts. By 2001, more than 50 per cent of UKcompanies were buying hardware online, in Germany only 27 per centdid so, while in Italy online buying was as low as 17 per cent.9
A report by independent technology analysts Gartner Dataquest, inthe third quarter of 2001, showed that demand for PCs across continen-tal Europe was down 11 per cent on the previous year. Amongst the topfive vendors, only Dell had achieved growth, up 5.6 per cent. Compaq(still European market leader) had recorded a fall of 18.8 per cent.10
We are number one in the world, but have only 13% of the market afteryear-on-year of aggressive growth … Michael Dell has stated he wants40% market share worldwide, so we are not going to ease off … At aminimum we are aiming for 25%. It will take several years to get there.
Paul Bell, Dell’s European Operations Manager11
Without changing the business model, Dell’s target is unrealistic. Therate of growth is dependent on the rate of change in the businessbuying culture. Dell has already cornered around half of the directsales business in Europe, so the propensity to grow is limited by theoverall size of the direct market … Dell’s Anglo-Saxon model hasmapped most readily to the UK and Australia. But Dell could find itcan’t colonise the world without taking on the cultural peculiarities ofthose continental European countries.
Brian Gammage, Analyst, Gartner Dataquest.12
Internet sales had risen in Europe and in Asia as the 1990s drew to aclose, but analysts still wondered whether Dell was being over-ambitious. To achieve such total worldwide domination of the PCmarket and keep it Dell could not ignore China. Dell first establishedan assembly operation making ‘Smart PCs’ in China through aTaiwanese contractor. In 2002 it began making them itself in its ownfactory in Xiamen in southern China, but once again Dell would haveto risk a departure from its proven business model. China lacked thedirect marketing infrastructure, high levels of Internet usage and auto-mated payment systems that made Dell’s direct sales model workable
▼
LSCH_C01.QXD 12/11/04 12:04 pm Page 25

LOGISTICS AND SUPPLY CHAIN MANAGEMENT
26
elsewhere. Instead Dell produces low-cost standardized products inXiamen. The Smart PCs are shown to would-be customers by salesteams in shopping malls in the wealthier Chinese cities. Customers cantouch and see the product before ordering by phone, with payment ondelivery or by arrangement through local banks.13
Beyond PCs
By 2001 Dell was not only the leading PC maker worldwide, but ithad risen to become the leading supplier of servers in the US.Nevertheless, 83 per cent of Dell’s revenues still came from desktopsand portables. In the harsh economic climate of the day observers con-tinued to question whether Dell had the vision, products and skills toremain competitive in the twenty-first century. Could it survive in anage when attention was turning towards innovative non-PC devices?Could the root of Dell’s success – its ability to customize and deliverotherwise standardized desktop computers – now be its downfall?
People are more concerned with what it takes, for instance, to down-load MP3 music files and burn their own CDs than they are withwhat kind of computer they use to do it. Meanwhile many corpora-tions now provide workers with a new PC every four years – up fromevery three years, which had been standard practice.
Mark Tebbe, Internet Consultant, Lante14
The PC business has been about products, feeds and speeds. Nowcustomers don’t give a rat’s ass about how fast the processor is. Theissue is, ‘How do I get stuff done with my computer?’
Aaron Goldberg, Analyst, Ziff-Davis Media15
Much of the real action in the industry appeared to be in the markets forwireless networks and hand-held computing, but Dell appeared to steerclear of these new exciting opportunities. Instead it started to diversifyinto low-cost storage and networking support where it had high hopes ofgrowth in the European, Middle Eastern and African (EMEA) markets.
We need to keep the financial health strong by diversifying … Our jobis not to stake our future on the big grey desktop … We are lookingto double storage revenues across EMEA next year.
Paul Bell, European Operations Manager, Dell16
▼
LSCH_C01.QXD 12/11/04 12:04 pm Page 26

1 LOGISTICS, THE SUPPLY CHAIN AND COMPETIT IVE STRATEGY
27
In March 2002 Dell announced an alliance with Philips, Europe’s biggestsupplier of consumer electronics. Philips would supply cathode ray andflat screens or semiconductors to some Dell suppliers. It would also pro-vide rewritable disk drives and wireless technology. In exchange, Dellwould supply servers and workstations for internal use by Philips. Itwould also carry some Philips products on its website, giving the Dutchbrand visibility in the US, a market where it had long struggled to estab-lish a profitable presence.17
Elsewhere, despite the calls for diversification, Dell’s plans to buildits networking business provoked the same old responses from its crit-ics. Once again there was speculation that without intermediaries Dellwould be unable to meet the service requirements of the sector. Yetagain Dell went on to confound its critics, developing its service offerthrough partnerships with leading service suppliers such as EDS.Consulting services were becoming a critical factor in many large cor-porate account bids, but Dell signalled that it would not be puttingsignificant resources into building its own services capability as IBMhad done. It was far more interested in the less glamourous peripheralhardware products, such as the switches that connect small- andmedium-sized computer networks, and storage to support low- tomedium-powered servers. Margins were high in both sectors, up to50 per cent in switches.
Other niches were also attracting Dell’s attention. In 2003 Dellunveiled its first range of printers. Its share price rose by 1 per cent on theday, while Hewlett Packard’s dropped by the same amount. Soon after-wards, the launch of its first hand-held computer was received with newsthat market leader Palm would be merging with its rival Handspring. Bynow a distinct pattern was emerging. Dell was picking off high-volume,high-margin categories of PC-related hardware. It was doing so onceindustry standards had emerged, which in turn signalled to customersthat the item was becoming a commodity. Commodities are fair game forprice competition, the very thing Dell’s competitors fear most!
References1. The Economist, ‘Dell Computer: Selling PCs like Bananas’, 5 October 1996, p. 99. 2. Serwer, Andrew E., ‘Michael Dell Turns the PC World Inside Out’, Fortune,
8 September 1997, pp. 38–44.3. McWilliams, Gary, ‘Whirlwind on the Web’, Business Week, 7 April 1997, pp. 132,
134, 136.
▼
LSCH_C01.QXD 12/11/04 12:04 pm Page 27

The changing competitive environment
As the competitive context of business continues to change, bringingwith it new complexities and concerns for management generally, italso has to be recognized that the impact on logistics and supply chainmanagement of these changes can be considerable. Indeed, of the manystrategic issues that confront the business organization today, perhapsthe most challenging are in the area of logistics.
Much of this book will be devoted to addressing these challenges indetail but it is useful at this stage to highlight what are perhaps themost pressing currently. These are:
● The new rules of competition● Globalization of industry● Downward pressure on price● Customers taking control
The new rules of competition
We are now entering the era of ‘supply chain competition’. The funda-mental difference from the previous model of competition is that anorganization can no longer act as an isolated and independent entity incompetition with other similarly ‘stand-alone’ organizations. Instead,
LOGISTICS AND SUPPLY CHAIN MANAGEMENT
28
4. Jacobs, Daniel G., ‘Anatomy of a Supply Chain’, Transportation & Distribution,June 2003, pp. 60–62.
5. Ibid.6. Financial Times, ‘The Dell Curve’, Lex Column, 5 October 2001.7. Serwer, A., ‘Dell Does Domination’, Fortune, 21 January 2002, pp. 43–47.8. Ibid.9. Ashwood, Ashley, ‘Dell Moves up a Gear as PC Industry Declines’, Financial Times,
9 November 2001.10. Ibid.11. Ibid.12. Ibid.13. Einhorn, B. ‘Dell Takes a Different Tack in China’, Business Week Online,
3 December 2001.14. Kirkpatrick, David, ‘Please Don’t call us PC’, Fortune, 16 October 2000, pp. 81–84.15. Ibid.16. Ashwood, Ashley, ‘Dell Moves up a Gear as PC Industry Declines’, Financial Times,
9 November 2001.17. Crambe, Gordon, ‘Philips and Dell Agree on Global Alliance’, Financial Times,
28 March 2002.
▼
LSCH_C01.QXD 12/11/04 12:04 pm Page 28

the need to create value delivery systems that are more responsive tofast-changing markets and are much more consistent and reliable in thedelivery of that value requires that the supply chain as a whole befocused on the achievement of these goals.
In the past the ground rules for marketing success were obvious:strong brands backed up by large advertising budgets and aggressiveselling. This formula now appears to have lost its power. Instead, theargument is heard, companies must recognize that increasingly it isthrough their capabilities and competencies that they compete.6
Essentially, this means that organizations create superior value for cus-tomers and consumers by managing their core processes better thancompetitors manage theirs. These core processes encompass such activitiesas new product development, supplier development, order fulfilment andcustomer management. By performing these fundamental activities in amore cost-effective way than competitors, it is argued, organizations willgain the advantage in the marketplace. This principle is powerfullyexpressed in the words of Jorma Ollila, the Chairman and CEO of Nokia:
Our experienced and unique way of operating is what we see as increasinglyputting us ahead of the competition. As we move forward in this complex indus-try, winning will be less about what we do and more about the way we do it.
One capability that is now regarded by many companies as fundamen-tal to success in the marketplace is the management of in-bound andout-bound logistics. As product life cycles shorten, as customers adoptjust-in-time practices and as sellers’ markets become buyers’ marketsthen the ability of the organization to respond rapidly and flexibly todemand can provide a powerful competitive edge.
A major contributing factor influencing the changed competitive envi-ronment has been the trend towards ‘commoditization’ in manymarkets. A commodity market is characterized by perceived productequality in the eyes of customers resulting in a high preparedness to sub-stitute one make of product for another. Research increasingly suggeststhat consumers are less loyal to specific brands but instead will have aportfolio of brands within a category from which they make theirchoice. In situations such as this actual product availability becomes amajor determinant of demand. There is evidence that more and moredecisions are being taken at the point of purchase and if there is a gapon the shelf where Brand X should be, but Brand Y is there instead, thenthere is a strong probability that Brand Y will win the sale.
1 LOGISTICS, THE SUPPLY CHAIN AND COMPETIT IVE STRATEGY
29
LSCH_C01.QXD 12/11/04 12:04 pm Page 29

It is not only in consumer markets that the importance of logisticsprocess excellence is apparent. In business-to-business and industrialmarkets it seems that product or technical features are of less impor-
tance in winning orders than issuessuch as delivery lead times and flexi-bility. This is not to suggest thatproduct or technical features areunimportant – rather it is that theyare taken as a ‘given’ by the cus-
tomer. Quite simply, in today’s marketplace the order-winning criteriaare more likely to be service-based than product-based.
A parallel development in many markets is the trend towards a con-solidation of demand. In other words customers – as against consumers– are tending to grow in size whilst becoming fewer in number. Theretail grocery industry is a good example in that in most northernEuropean countries a handful of large retailers account for over 50 percent of all sales in any one country. This tendency to the concentrationof buying power is being accelerated as a result of global mergers andacquisitions. The impact of these trends is that these more powerfulcustomers are becoming more demanding in terms of their servicerequirements from suppliers.
At the same time as the power in the distribution channel continues toshift from supplier to buyer, there is also a trend for customers to reducetheir supplier base. In other words they want to do business with fewersuppliers and often on a longer-term basis. The successful companies inthe coming years will be those that recognize these trends and seek toestablish strategies based upon establishing closer relationships with keyaccounts. Such strategies will focus upon seeking innovative ways tocreate more value for these customers. These strategies will be ‘vertical’rather than ‘horizontal’ in that the organization will seek to do more forfewer customers rather than looking for more customers to whom to sellthe same product. The car industry provides a good example of this phe-nomenon with ‘lead’ suppliers taking on much greater responsibility forthe delivery of entire systems or modules to the assembly line.
Such a transition from volume-based growth to value-based growthwill require a much greater focus on managing the core processes thatwe referred to earlier. Whereas the competitive model of the past relied
LOGISTICS AND SUPPLY CHAIN MANAGEMENT
30
In today’s marketplace theorder-winning criteria are morelikely to be service-based than
product-based.
LSCH_C01.QXD 12/11/04 12:04 pm Page 30

heavily on product innovation this will have to be increasingly supple-mented by process innovation. The basis for competing in this new erawill be:
Competitive advantage = Product excellence × Process excellence
Figure 1.10 suggests that traditionally for many companies the investmenthas mainly been on product excellence and less on process excellence.
This is not to suggest that product innovation should be given lessemphasis – far from it – but rather that more emphasis needs to beplaced on developing and managing processes that deliver greater valuefor key customers.
We have already commented that product life cycles are gettingshorter. What we have witnessed in many markets is the effect ofchanges in technology and consumer demand combining to producemore volatile markets where a product can be obsolete almost as soonas it reaches the market. There are many current examples of shorten-ing life cycles but perhaps the personal computer symbolizes them all.In this particular case we have seen rapid developments in technologythat have first created markets where none existed before and thenalmost as quickly have rendered themselves obsolete as the next gener-ation of product is announced.
1 LOGISTICS, THE SUPPLY CHAIN AND COMPETIT IVE STRATEGY
31
Pro
duc
t ex
celle
nce
(%)
Process excellence (%)100
100
Revisedemphasis
Currentemphasis
Fig. 1.10 Investing in process excellence yields greater benefits
LSCH_C01.QXD 12/11/04 12:04 pm Page 31

Such shortening of life cycles creates substantial problems for logis-tics management. In particular, shorter life cycles demand shorter leadtimes – indeed our definition of lead time may well need to change.Lead times are traditionally defined as the elapsed period from receiptof customer order to delivery. However, in today’s environment there isa wider perspective that needs to be taken. The real lead time is thetime taken from the drawing board, through procurement, manufac-ture and assembly to the end market. This is the concept of strategiclead time and the management of this time span is the key to success inmanaging logistics operations.
There are already situations arising where the life cycle is shorterthan the strategic lead time. In other words the life of a product on themarket is less than the time it takes to design, procure, manufactureand distribute that same product! The implications of this are consider-able both for planning and operations. In a global context the problemis exacerbated by the longer transportation times involved.
Ultimately, therefore, the means of achieving success in such marketsis to accelerate movement through the supply chain and to make theentire logistics system far more flexible and thus responsive to thesefast-changing markets.
Globalization of industry
A further strategic issue that provides a challenge for logistics manage-ment is the continued trend towards globalization.
A global company is more than a multinational company. In theglobal business materials and components are sourced worldwide andproducts may be manufactured offshore and sold in many differentcountries, perhaps with local customization.
Such is the trend towards globalization that it is probably safe toforecast that before long most markets will be dominated by globalcompanies. The only role left for national companies will be to cater forspecific and unique local demands, for example in the food industry.
For global companies like Hewlett Packard, Philips and Caterpillar,the management of the logistics process has become an issue of centralconcern. The difference between profit and loss for an individual prod-uct can hinge upon the extent to which the global pipeline can beoptimized, because the costs involved are so great. The global company
LOGISTICS AND SUPPLY CHAIN MANAGEMENT
32
LSCH_C01.QXD 12/11/04 12:04 pm Page 32

seeks to achieve competitive advantage by identifying world marketsfor its products and then to develop a manufacturing and logisticsstrategy to support its marketing strategy. So a company likeCaterpillar, for example, has dispersed assembly operations to keyoverseas markets and uses global logistics channels to supply parts tooffshore assembly plants and after-markets. Where appropriate,Caterpillar will use third-party companies to manage distribution andeven final finishing. So, for example, in the US a third-party companyin addition to providing parts inspection and warehousing attachesoptions to fork lift trucks. Wheels, counterweights, forks and masts areinstalled as specified by Caterpillar. Thus local market needs can becatered for from a standardized production process.
Globalization also tends to lengthen supply chains as companiesincreasingly move production offshore or source from more distantlocations. The impetus for this trend, which in recent years has acceler-ated dramatically, is the search for lower labour costs. However, oneimplication of these decisions is that ‘end-to-end’ pipeline times mayincrease significantly. In time-sensitive markets, longer lead times canbe fatal.
‘Time-based competition’ is an idea that will be returned to manytimes in later chapters. Time compression has become a critical man-agement issue. Product life cycles are shorter than ever, customers anddistributors require just-in-time deliveries and end users are ever morewilling to accept a substitute product if their first choice is not instantlyavailable.
The globalization of industry, and hence supply chains, is inevitable.However, to enable the potential benefits of global networks to be fullyrealized, a wider supply chain perspective must be adopted. It can beargued that for the global corporation competitive advantage willincreasingly derive from excellence in managing the complex web ofrelationships and flows that characterize their supply chains.
Downward pressure on price
Whilst the trend might not be universal there can be no doubting thatmost markets are more price competitive today than they were adecade ago. Prices in the high streets and the shopping malls continueto fall in many countries and upstream of the retail store the prices of
1 LOGISTICS, THE SUPPLY CHAIN AND COMPETIT IVE STRATEGY
33
LSCH_C01.QXD 12/11/04 12:04 pm Page 33

components, raw materials and industrial products with some excep-tions follow the same downward pattern.
Whilst some of this price deflation can be explained as the result ofnormal cost reduction through learning and experience effects, therapid fall in the price of many consumer goods has other causes. Figure1.11 shows the comparative rate at which VCR and DVD player pricesfell in the UK market. The striking feature is that whilst it took 20years for a VCR to fall in price from £400 to just over £40, it took onlyfive years for a DVD player to fall by the same amount. The same phe-nomenon is apparent in markets as diverse as clothing, homefurnishings and air travel.
A fundamental change in the global competitive landscape is driving pricesto levels that in real terms are as low as they have ever been. A number ofcausal factors have contributed to this new market environment.
First, there are new global competitors who have entered the market-place supported by low-cost manufacturing bases. The dramatic rise ofChina as a major producer of quality consumer products is evidenceof this. Secondly, the removal of barriers to trade and the deregulation ofmany markets has accelerated this trend, enabling new players to rapidlygain ground. One result of this has been overcapacity in many industries.Overcapacity implies an excess of supply against demand and hence leadsto further downward pressure on price.
LOGISTICS AND SUPPLY CHAIN MANAGEMENT
34
1984
50
1986 1988 1990 1992 1994 1996 1998 2000 2002 2004
100
150
200
250
300
350
400
Year
Pric
e (£
)
VCR1984 £4002004 £45
DVD1999 £4002004 £40
VCR DVD
Fig. 1.11 Price deflation in consumer electronics (UK high street prices)
LSCH_C01.QXD 12/11/04 12:04 pm Page 34

A further cause of price deflation, it has been suggested, is theInternet, which makes price comparison so much easier. The Internethas also enabled auctions and exchanges to be established at industry-wide levels, which have also tended to drive down prices.
In addition, there is evidence that customers and consumers are morevalue conscious than has hitherto been the case. Brands and suppliersthat could once command a price premium because of their perceivedsuperiority can no longer do so as the market recognizes that equallyattractive offers are available at significantly lower prices. The successof many retailers’ own-label products or the inroads made by low-costairlines proves this point.
Against the backdrop of a continued downward pressure on price, itis self-evident that, in order to maintain profitability, companies mustfind a way to bring down costs to match the fall in price.
The challenge to the business is to find new opportunities for costreduction when, in all likelihood, the company has been through manyprevious cost-reduction programmes. It can be argued that the lastremaining opportunity of any significance for major cost reduction liesin the wider supply chain rather than in the firm’s own operations.
This idea is not new. Back in 1929 Ralph Borsodi7 expressed it in thefollowing words:
In 50 years between 1870 and 1920 the cost of distributing necessities andluxuries has nearly trebled, while production costs have gone down by one-fifth … What we are saving in production we are losing in distribution.
The situation that Borsodi describes can still be witnessed in manyindustries today. For example, companies who thought they couldachieve a leaner operation by moving to just-in-time (JIT) practicesoften only shifted costs elsewhere in the supply chain by forcing suppli-ers or customers to carry that inventory. The car industry, which tomany is the home of lean thinking and JIT practices, has certainly exhib-ited some of those characteristics. A recent analysis of the westernEuropean automobile industry8 showed that whilst car assembly opera-tions were indeed very lean with minimal inventory, the same was nottrue upstream and downstream of those operations. Figure 1.12 showsthe profile of inventory through the supply chain from the tier 1 suppli-ers down to the car dealerships.
1 LOGISTICS, THE SUPPLY CHAIN AND COMPETIT IVE STRATEGY
35
LSCH_C01.QXD 12/11/04 12:04 pm Page 35

In this particular case the paradox is that most inventory is being heldwhen it is at its most expensive, i.e. as a finished product. The true costof this inventory to the industry is considerable. Whilst inventory costswill vary by industry and by company, it will be suggested in Chapter 3that the true cost of carrying inventory is rarely less that 25 per centper year of its value. In the conditions in which the automobile industrycurrently finds itself, this alone is enough to make the differencebetween profit and loss.
This example illustrates the frequently encountered failure to take awider view of cost. For many companies their definition of cost is lim-ited only to those costs that are contained within the four walls of theirbusiness entity. However, as has been suggested earlier, since today’scompetition takes place not between companies but between supplychains the proper view of costs has to be ‘end-to-end’ since all costswill ultimately be reflected in the price of the finished product in thefinal marketplace.
The need to take a supply chain view of cost is further underscoredby the major trend that is observable across industries worldwidetowards outsourcing. For many companies today, most of their costs lie
LOGISTICS AND SUPPLY CHAIN MANAGEMENT
36
Day
s of
inve
ntor
y120
Cus
tom
er
100
80
60
40
20
0
Mar
ketp
lace
Out
bou
nd t
rans
it
Load
ing
and
des
pat
ch
Vehi
cle
pro
duc
tion
WIP
On-
site
par
t (V
M)
Inb
ound
tra
nsit
Fini
shed
com
pon
ents
Ass
emb
ly W
IP
Pre
-ass
emb
ly W
IP
In-h
ouse
bui
lt p
arts
Bou
ght-
out
par
ts
Raw
mat
eria
ls
Inboundlogistics
Vehiclemanufacturers
Outboundlogistics
First tiersupplier
Maximum Average Minimum
Distributionand retail
Fig. 1.12 Inventory profile of the automotive supply chain Source: Holweg & Pil.9
LSCH_C01.QXD 12/11/04 12:04 pm Page 36

outside their legal boundaries; activities that used to be performed in-house are now outsourced to specialist service providers. The amazinggrowth of contract manufacturing in electronics bears witness to thistrend. If the majority of an organization’s costs lie outside the businessthen it follows that the biggest opportunities for improvement in theircost position will also be found in that wider supply chain.
The customers take control
So much has been written and talked about service, quality and excellencethat there is no escaping the fact that the customer in today’s marketplaceis more demanding, not just of prod-uct quality, but also of service.
As more and more markets becomein effect ‘commodity’ markets, wherethe customer perceives little technicaldifference between competing offers,the need is for the creation of differential advantage through added value.Increasingly a prime source of this added value is through customer service.
Customer service may be defined as the consistent provision of timeand place utility. In other words, products don’t have value until they arein the hands of the customer at the time and place required. There areclearly many facets of customer service, ranging from on-time deliverythrough to after-sales support. Essentially the role of customer serviceshould be to enhance ‘value-in-use’, meaning that the product becomesworth more in the eyes of the customer because service has added valueto the core product. In this way significant differentiation of the totaloffer (that is the core product plus the service package) can be achieved.
Those companies that have achieved recognition for service excel-lence, and thus have been able to establish a differential advantage overtheir competition, are typically those companies where logistics manage-ment is a high priority. Companies like Xerox, Toyota, Benetton andDell are typical of such organizations. The achievement of competitiveadvantage through service comes not from slogans or expensive so-called customer care programmes, but rather from a combination of acarefully thought-out strategy for service, the development of appropri-ate delivery systems and commitment from people, from the chiefexecutive down.
1 LOGISTICS, THE SUPPLY CHAIN AND COMPETIT IVE STRATEGY
37
The customer in today’s market-place is more demanding, not
just of product quality, but alsoof service.
LSCH_C01.QXD 12/11/04 12:04 pm Page 37

The attainment of service excellence in this broad sense can only beachieved through a closely integrated logistics strategy. In reality, theability to become a world-class supplier depends as much upon theeffectiveness of one’s operating systems as it does upon the presentationof the product, the creation of images and the influencing of consumerperceptions. In other words, the success of McDonald’s, WalMart orany of the other frequently cited paragons of service excellence is duenot to their choice of advertising agency, but rather to their recognitionthat managing the logistics of service delivery on a consistent basis isthe crucial source of differential advantage.
Managing the ‘4Rs’
As we move rapidly into the era of supply chain competition a numberof principles emerge to guide the supply chain manager. These can beconveniently summarized as the ‘4Rs’ of responsiveness, reliability,resilience and relationships.
1 Responsiveness
In today’s just-in-time world the ability to respond to customers’requirements in ever-shorter time-frames has become critical. Not onlydo customers want shorter lead times, they are also looking for flexibil-ity and increasingly customized solutions. In other words the supplierhas to be able to meet the precise needs of customers in less time thanever before. The key word in this changed environment is agility.Agility implies the ability to move quickly and to meet customerdemand sooner. In a fast-changing marketplace agility is actually moreimportant than long-term strategy in a traditional business planningsense. Because future demand patterns are uncertain, by definition thismakes planning more difficult and, in a sense, hazardous.
In the future, organizations must be much more demand-driven thanforecast-driven. The means of making this transition will be throughthe achievement of agility, not just within the company but across thesupply chain.
2 Reliability
One of the main reasons why any company carries safety stock isbecause of uncertainty. It may be uncertainty about future demand oruncertainty about a supplier’s ability to meet a delivery promise, or
LOGISTICS AND SUPPLY CHAIN MANAGEMENT
38
LSCH_C01.QXD 12/11/04 12:04 pm Page 38

about the quality of materials or components. Significant improve-ments in reliability can only be achieved through re-engineering theprocesses that impact performance. Manufacturing managers long agodiscovered that the best way to improve product quality was not byquality control through inspection but rather to focus on process con-trol. The same is true for logistics reliability.
A key to improving reliability in logistics processes is enhancedpipeline visibility. It is often the case that there is limited visibility ofdownstream demand at the end of the pipeline. This problem is exacer-bated the further removed from final demand the organization orsupply chain entity is. Thus the manufacturer of synthetic fibres mayhave little awareness of current demand for the garments that incorpo-rate those fibres in the material from which they are made.
If a means can be found of opening up the pipeline so that there is clearend-to-end visibility then reliability of response will inevitably improve.
3 Resilience
Today’s marketplace is characterized by higher levels of turbulence andvolatility. The wider business, economic and political environments areincreasingly subjected to unexpected shocks and discontinuities. As aresult, supply chains are vulnerable to disruption and, in consequence,the risk to business continuity is increased.
Whereas in the past the prime objective in supply chain design wasprobably cost minimization or possibly service optimization, theemphasis today has to be upon resilience. Resilience refers to the abilityof the supply chain to cope with unexpected disturbances. There is evi-dence that the tendencies of many companies to seek out low-costsolutions because of pressure on margins may have led to leaner, butmore vulnerable, supply chains.
Resilient supply chains may not be the lowest-cost supply chains butthey are more capable of coping with the uncertain business environ-ment. Resilient supply chains have a number of characteristics, ofwhich the most important is a business-wide recognition of where thesupply chain is at its most vulnerable. Managing the critical nodes andlinks of a supply chain, to be discussed further in Chapter 8, becomes akey priority. Sometimes these ‘critical paths’ may be where there isdependence on a single supplier, or a supplier with long replenishmentlead times, or a bottleneck in a process.
1 LOGISTICS, THE SUPPLY CHAIN AND COMPETIT IVE STRATEGY
39
LSCH_C01.QXD 12/11/04 12:04 pm Page 39

Other characteristics of resilient supply chains are their recognitionof the importance of strategic inventory and the selective use of sparecapacity to cope with ‘surge’ effects.
4 Relationships
The trend towards customers seeking to reduce their supplier base hasalready been commented upon. In many industries the practice of‘single sourcing’ is widespread. It is usually suggested that the benefitsof such practices include improved quality, innovation sharing, reducedcosts and integrated scheduling of production and deliveries.Underlying all of this is the idea that buyer/supplier relationshipsshould be based upon partnership. Increasingly companies are discov-ering the advantages that can be gained by seeking mutually beneficial,long-term relationships with suppliers. From the suppliers’ point ofview, such partnerships can prove formidable barriers to entry for com-petitors. The more processes are linked between the supplier and thecustomer the more the mutual dependencies increase and hence themore difficult it is for competitors to break in.
Supply chain management by definition is about the management ofrelationships across complex networks of companies that, whilst legallyindependent, are in reality interdependent. Successful supply chains willbe those that are governed by a constant search for win-win solutionsbased upon mutuality and trust. This is not a model of relationships thathas typically prevailed in the past. It is one that will have to prevail inthe future as supply chain competition becomes the norm.
These four themes of responsiveness, reliability, resilience and rela-tionships provide the basis for successful logistics and supply chainmanagement. They are themes that will be explored in greater detaillater in this book.
Summary
This chapter familiarizes the reader with the tenets of competitive strat-egy and within them the vectors of strategic direction: cost and valueadvantage. Managers are urged to look beyond the traditional touch-stones of the experience curve and the link between relative costs andmarket share. They are encouraged to seek out and develop logistics
LOGISTICS AND SUPPLY CHAIN MANAGEMENT
40
LSCH_C01.QXD 12/11/04 12:04 pm Page 40

and supply chain strategies that exploit numerous latent opportunitiesto increase efficiency and productivity to deliver significant advances incustomer service. They may include efforts to realize better capacityutilization, inventory reduction and/or service improvements throughcloser co-operation with suppliers. Behind every enduring example ofdifferentiation through service excellence there is evidence of a wellthought through strategy for managing the logistics of service delivery.
Vertically integrated businesses continue to be dismembered, refo-cused and transformed into virtual ones held together not by ownershipbut by closely integrated core business processes and financial engineer-ing. Instead of rivalry and mistrust within the supply chain, newcompetitive pressures are demanding speed and flexibility, which them-selves require greater openness and trust. In fact the ability to manageprocess innovation and integration are becoming as important capabili-ties as product innovation.
References
1. Bowler, R.A., Logistics and the Failure of the British Army in America1775–1783, Princeton University Press, 1975.
2. Shaw, A.W., Some Problems in Market Distribution, Harvard University Press,1915.
3. Aitken, J., Supply Chain Integration within the Context of a SupplierAssociation, Cranfield University, Ph.D. Thesis, 1998.
4. Porter, M.E.,Competitive Strategy, The Free Press, 1980; CompetitiveAdvantage, The Free Press, 1985.
5. See note 4 above.6. Stalk, G., Evans, P. and Shulman, L.E., ‘Competing on Capabilities: The New
Rule of Corporate Strategy’, Harvard Business Review, March–April 1992;Prahalad, C. and Hamel, G., ‘The Core Competence of the Corporation’,Harvard Business Review, May–June 1990.
7. Borsodi, R., The Distribution Age, D. Appleton & Co, 1929.8. Holweg, M. and Pil, F.K., The Second Century, MIT Press, 2004.9. Ibid.
1 LOGISTICS, THE SUPPLY CHAIN AND COMPETIT IVE STRATEGY
41
LSCH_C01.QXD 12/11/04 12:04 pm Page 41

LSCH_C01.QXD 12/11/04 12:04 pm Page 42

Logistics and customervalue
The marketing and logistics interface 45
Delivering customer value 46
What is customer service? 48
The impact of out-of-stock 50
Customer service and customer retention 53
Market-driven supply chains 56
Defining customer service objectives 65
Setting customer service priorities 69
Setting service standards 74
43
Chapter
2
LSCH_C02.QXD 12/11/04 12:04 pm Page 43

This chapter:
Highlights the importance of managing the marketingand logistics interface on an integrated basis.
●
Emphasizes the need to understand the multipleelements of service from the customers’ perspective.
●
Explains the importance of customer retention andthe lifetime value of a customer.
●
Outlines the idea of a service-driven logistics systembased upon identified service priorities and acustomer base segmented according to servicerequirements.
●
Introduces the idea of the ‘perfect order’ as the basisfor measuring service performance.
LOGISTICS AND SUPPLY CHAIN MANAGEMENT
44
LSCH_C02.QXD 12/11/04 12:04 pm Page 44

Earlier in Chapter 1 the mission of logistics management was definedsimply in terms of providing the means whereby customers’ service
requirements are met at lowest cost. In other words the ultimate purposeof any logistics system is to satisfy customers. It is a simple idea that is notalways easy to recognize if you are a manager involved in activities such asproduction scheduling or inventory control which may seem to be somedistance away from the marketplace. The fact is of course that everybodyin the organization has a stake in customer service. Indeed many success-ful companies have started to examine their internal service standards inorder that everyone who works in the business understands that they mustservice someone – if they don’t, why are they on the payroll?
The objective should be to establish a chain of customers that linkspeople at all levels in the organization directly or indirectly to the market-place.1 Xerox is a company that has worked hard to implement the ideaof the internal customer. They have even extended the idea to the point oflinking bonuses to an index of customer satisfaction. In organizations likeXerox, managing the customer service chain through the business andonwards is the central concern of logistics management.
The marketing and logistics interface
Even though the textbooks describe marketing as the management ofthe ‘Four Ps’ – product, price, promotion and place – it is probably trueto say that, in practice, most of the emphasis has always been placed onthe first three. ‘Place’, which might better be described in the words ofthe old cliché, ‘the right product, in the right place at the right time’,was rarely considered part of mainstream marketing.
There are signs that this view is rapidly changing, however, as thepower of customer service as a potential means of differentiation isincreasingly recognized. In more and more markets the power of thebrand has declined and customers are more willing to accept substitutes;even technology differences between products have been reduced so that
2 LOGISTICS AND CUSTOMER VALUE
45
LSCH_C02.QXD 12/11/04 12:04 pm Page 45

LOGISTICS AND SUPPLY CHAIN MANAGEMENT
46
it is harder to maintain a competitive edge through the product itself. Insituations like this it is customer service that can provide the distinctivedifference between one company’s offer and that of its competitors.
Two factors have perhaps contributed more than anything else to thegrowing importance of customer service as a competitive weapon. Oneis the continual increase in customer expectations; in almost everymarket the customer is now more demanding, more ‘sophisticated’ thanhe or she was, say, 30 years ago. Likewise, in industrial purchasing situ-ations we find that buyers expect higher levels of service from vendors,particularly as more companies convert to just-in-time logistics systems.
The second factor is the slow but inexorable transition towards ‘com-modity’ type markets. By this is meant that increasingly the power of the‘brand’ is diminishing as the technologies of competing products con-verge, thus making product differences difficult to perceive – at least tothe average buyer. Take, for example, the current state of the personalcomputer market. There are many competing models which in realityare substitutable as far as most would-be purchasers are concerned.
Faced with a situation such as this the customer may be influenced byprice or by ‘image’ perceptions but overriding these aspects may well be‘availability’ – in other words, is the product in stock, can I have it now?Since availability is clearly an aspect of customer service, we are in effectsaying that the power of customer service is paramount in a situationsuch as this. Nor is it only in consumer markets that we are encounter-ing the force of customer service as a determinant of purchase; there ismuch evidence from industrial markets of the same phenomenon.
Delivering customer value
Ultimately the success or failure of any business will be determined bythe level of customer value that it delivers in its chosen markets.Customer value can be defined quite simply as the difference betweenthe perceived benefits that flow from a purchase or a relationship andthe total costs incurred. Another way of expressing the idea is:
Perceptions of benefitsCustomer value = ––––––––––––––––––––––
Total cost of ownership
LSCH_C02.QXD 12/11/04 12:04 pm Page 46

It is better to refer to the ‘total cost of ownership’ rather than pricesince so often a purchase or a relationship will involve significant costsother than price. Equally the benefits that are perceived to flow fromthe purchase or a relationship will often be greater than the tangibleproduct features or functionality. For example, there may be little dif-ference between two competitive products in terms of technicalperformance, but one may be superior in terms of the customer supportthat is provided.
One way to define ‘competitive advantage’ is simply that the success-ful companies will generally be those that deliver more customer valuethan their competitors. In other words, their ratio of benefits to costs issuperior to other players in that market or segment.
Logistics management is almost unique in its ability to impact boththe numerator and the denominator of the customer value ratio. Thispoint becomes clearer if we expand the ratio as follows:
Quality × ServiceCustomer value = ––––––––––––––––
Cost × Time
Each of the four constituent elements can briefly be defined as follows:
Quality: The functionality, performance and technical specificationof the offer.
Service: The availability, support and commitment provided to thecustomer.
Cost: The customer’s transaction costs including price and lifecycle costs.
Time: The time taken to respond to customer requirements, e.g.delivery lead times.
Each of these four elements requires a continuous programme ofimprovement, innovation and investment to ensure continued competi-tive advantage.
One company that has built a global leadership position in its marketsis Caterpillar, marketing machines and diesel engines for the constructionand mining industries. Caterpillar has for many years focused on develop-ing not just its manufacturing capabilities and innovative products but alsoits customer support and responsiveness. Underpinning these initiatives
2 LOGISTICS AND CUSTOMER VALUE
47
LSCH_C02.QXD 12/11/04 12:04 pm Page 47

has been a continuing emphasis on creating superior logistics and supplychain management capabilities. Caterpillar has developed a world-classreputation for customer support, in particular its guarantee to provide 48-hour availability on parts no matter how remote the location. In theindustries where Caterpillar’s equipment is used, the cost of ‘down-time’can be significant, hence the importance of responsive service. Throughclose partnership with its worldwide network of dealers and distributorsand through advanced inventory and information management systems,Caterpillar offers levels of customer support – and thus customer value –that few companies in any industry can match.
What is customer service?
It has been suggested that the role of customer service is to provide‘time and place utility’ in the transfer of goods and services betweenbuyer and seller. Put another way, there is no value in the product orservice until it is in the hands of the customer or consumer. It followsthat making the product or service ‘available’ is what, in essence, thedistribution function of the business is all about. ‘Availability’ is initself a complex concept, impacted upon by a galaxy of factors whichtogether constitute customer service. These factors might include deliv-ery frequency and reliability, stock levels and order cycle time, forexample. Indeed it could be said that ultimately customer service isdetermined by the interaction of all those factors that affect the processof making products and services available to the buyer.
In practice, we see that many companies have varying views of cus-tomer service. LaLonde and Zinszer2 in a major study of customerservice practices suggested that customer service could be examinedunder three headings:
1. Pre-transaction elements2. Transaction elements3. Post-transaction elements
The pre-transaction elements of customer service relate to corporatepolicies or programmes, e.g. written statements of service policy, ade-quacy of organizational structure and system flexibility. The transactionelements are those customer service variables directly involved in per-
LOGISTICS AND SUPPLY CHAIN MANAGEMENT
48
LSCH_C02.QXD 12/11/04 12:04 pm Page 48

2 LOGISTICS AND CUSTOMER VALUE
49
Table 2.1 The components of customer service
Pre-transaction elements
For example:
● Written customer service policy(Is it communicated internally and externally? Is it understood? Is it specificand quantified where possible?)
● Accessibility(Are we easy to contact/do business with? Is there a single point of contact?)
● Organization structure(Is there a customer service management structure in place? What level ofcontrol do they have over their service process?)
● System flexibility(Can we adapt our service delivery systems to meet particular customer needs?)
Transaction elements
For example:
● Order cycle time(What is the elapsed time from order to delivery? What is the reliability/variation?)
● Inventory availability(What percentage of demand for each item can be met from stock?)
● Order fill rate(What proportion of orders are completely filled within the stated lead time?)
● Order status information(How long does it take us to respond to a query with the required information?Do we inform the customer of problems or do they contact us?)
Post-transaction elements
For example:
● Availability of spares(What are the in-stock levels of service parts?)
● Call-out time(How long does it take for the engineer to arrive and what is the ‘first call fixrate’?)
● Product tracing/warranty(Can we identify the location of individual products once purchased? Can wemaintain/extend the warranty to customers’ expected levels?)
● Customer complaints, claims, etc.(How promptly do we deal with complaints and returns? Do we measurecustomer satisfaction with our response?)
LSCH_C02.QXD 12/11/04 12:04 pm Page 49

forming the physical distribution function, e.g. product and deliveryreliability. The post-transaction elements of customer service are gener-ally supportive of the product while in use, for instance, productwarranty, parts and repair service, procedures for customer complaintsand product replacement.
Table 2.1 indicates some of the many elements of customer serviceunder these three headings.
In any particular product/market situation, some of these elementswill be more important than others and there may be factors other thanthose listed above which have a significance in a specific market.Indeed the argument that will be developed later is that it is essential tounderstand customer service in terms of the differing requirements ofdifferent market segments and that no universally appropriate list ofelements exists; each market that the company services will attach dif-ferent importance to different service elements.
It is because of the multivariate nature of customer service and becauseof the widely differing requirements of specific markets that it is essentialfor any business to have a clearly identified policy towards customerservice. It is surprising perhaps that sofew companies have defined policieson customer service, let alone an orga-nization flexible enough to manageand control that service, when it isconsidered that service can be themost important element in the com-pany’s marketing mix. A considerablebody of evidence exists that supportsthe view that if the product or service is not available at the time the cus-tomer requires it and a close substitute is available then the sale will belost to the competition. Even in markets where brand loyalty is strong astock-out might be sufficient to trigger brand switching.
The impact of out-of-stock
A recent study3 identified that a significant cost penalty is incurred byboth manufacturers and retailers when a stock-out occurs on the shelf.The research found that on a typical day a shopper in the average
LOGISTICS AND SUPPLY CHAIN MANAGEMENT
50
It is because of the multivariatenature of customer service andbecause of the widely differing
requirements of specific marketsthat it is essential for any businessto have a clearly identified policy
towards customer service.
LSCH_C02.QXD 12/11/04 12:04 pm Page 50

supermarket will face stock-outs on 8 per cent of items in the categoriesstudied. The reaction of customers when faced with a stock-out was high-lighted by the same study. As Figure 2.1 illustrates, over a quarter ofshoppers bought a different brand and 37 per cent said they would shopelsewhere for that product. This represents bad news for both the manu-facturer and the retailer. Even worse, other research4 has suggested thatover two-thirds of shopping decisions are made at the point of purchase,i.e. the purchase is triggered by seeing the product on the shelf. If theproduct is not on the shelf then the purchase will not be triggered.Persistent stock-outs can also drive customers away from the brand and/orthe store permanently. The potential loss of business for both manufactur-ers and retailers caused by out-of-stock situations is clearly significant.
In industrial markets, too, the same pressures on purchasing sourceloyalty seem to be at work. It is perhaps not surprising that as moreand more companies adopt ‘just-in-time’ strategies, with minimalinventories, they require even higher levels of response from suppliers.The demand is for ever shorter delivery lead times and reliable delivery.The pressure on suppliers is further increased as these same customersseek to rationalize their supplier base and to do business with fewersuppliers. Becoming a preferred supplier in any industry todayinevitably means that a high priority must be placed on delivering supe-rior customer service.
Many companies have suffered in this new competitive environmentbecause in the past they have focused on the traditional aspects of market-ing – product development, promotional activities and price competition.
2 LOGISTICS AND CUSTOMER VALUE
51
Do not purchase item
Delay purchase
Substitute different brand
Substitute same brand
Buy item at another store
9%
15%
19%
31%
26%
Fig. 2.1 Shopper behaviour when faced with a stock-outSource: Corsten, D. and Gruen, T., ‘Stock-outs cause walkouts’, Harvard Business Review, May 2004.
LSCH_C02.QXD 12/11/04 12:04 pm Page 51

However, whilst these are still necessary dimensions of a successful mar-keting strategy they are not sufficient. Equally damaging has been thefocus on cost reduction that has driven many companies’ operational andlogistics strategy – particularly as a result of recession. Cost reduction is aworthy goal as long as it is not achieved at the expense of value creation.Low-cost strategies may lead to efficient logistics but not to effective logis-tics. More often than not today the order winning criteria are thoseelements of the offer that have a clearly identifiable positive impact uponthe customers’ own value-creating processes.
One powerful way of highlighting the impact that customer serviceand logistics management can have on marketing effectiveness is out-lined in Figure 2.2. The suggestion here is that customer serviceimpacts not only on the ultimate end user but also on intermediate cus-tomers such as distributors. Traditionally marketing has focused on theend customer – or consumer – seeking to promote brand values and togenerate a ‘demand pull’ in the marketplace for the company’s prod-ucts. More recently we have come to recognize that this by itself is notsufficient. Because of the swing in power in many marketing channelsaway from manufacturers and towards the distributor (e.g. the largeconcentrated retailers) it is now vital to develop the strongest possiblerelations with such intermediaries – in other words to create a cus-tomer franchise as well as a consumer franchise.
The impact of both a strong consumer franchise and a customer fran-chise can be enhanced or diminished by the efficiency of the supplier’slogistics system. It is only when all three components are working opti-mally that marketing effectiveness is maximized. To stress theinterdependence of these three components of competitive performanceit is suggested that the relationship is multiplicative. In other words thecombined impact depends upon the product of all three.
LOGISTICS AND SUPPLY CHAIN MANAGEMENT
52
Consumerfranchise
Customerfranchise
Supply chainefficiency
Marketingeffectiveness
• Brand values• Corporate image• Availability
• Customer service• Partnership• Quick response
• Flexibility• Reduced asset base• Low–cost supplier
• Market share• Customer retention• Superior ROI
x x =
Fig. 2.2 The impact of logistics and customer service on marketing
LSCH_C02.QXD 12/11/04 12:04 pm Page 52

Customer service and customer retention
It will be apparent from what has been said that organizations thatcompete only on the product’s features will find themselves at a severedisadvantage to those companies that augment the basic product withadded-value services. It was one of the leading thinkers in marketing,Theodore Levitt, who first said that ‘people don’t buy products, theybuy benefits’. The idea behind this statement is that it is the totality ofthe ‘offer’ that delivers customer value. A simple example would bethat a finished product in a warehouse is the same as a finished productin the hands of the customer in terms of its tangible features. Clearly,however, the product in the hands of the customer has far more valuethan the product in the warehouse. Distribution service in this case hasbeen the source of added value. Figure 2.3 develops this idea with theconcept of the ‘service surround’.
At the centre is the core product, which is the basic product as it leavesthe factory. The outer ‘halo’ represents all the added value that cus-tomer service and logistics provide. Clearly it is not only customerservice and logistics activity that add value; in many cases advertising,branding and the packaging can all enhance the perceived value of theproduct to the customer. However, it is increasingly evident, as we haveseen, that it takes more than branding to differentiate the product.
2 LOGISTICS AND CUSTOMER VALUE
53
Servic
e
Coreproduct
Surround
• Quality• Product features• Technology• Durability, etc.
• Delivery lead time and flexibility• Delivery reliability and consistency• Order fill• Ease of doing business• After-sales support, etc.
Fig. 2.3 Using service to augment the core product
LSCH_C02.QXD 12/11/04 12:04 pm Page 53

What impact does the service surround have on the customer?One of the classic definitions of marketing is that it is concerned
with ‘getting and keeping customers’. In practice, if we look at wheremost organizations’ marketing efforts focus, it is on the ‘getting’ of cus-tomers, rather than on the ‘keeping’ of them. Thus an examination ofthe typical marketing plan will show a bias towards increasing marketshare rather than towards customer retention. Whilst new customersare always welcome in any business it has to be realized that an exist-ing customer can provide a higher profit contribution and has thepotential to grow in terms of the value and frequency of purchases.
The importance of customer retention is underlined by the conceptof the ‘lifetime value’ of a customer. The lifetime value of a customer iscalculated as follows:
Lifetime value = Average transaction value × Yearly frequency of purchase × Customer ‘life expectancy’
Clearly if customers can be persuaded to remain loyal to a supplier, theirlifetime value can be significantly increased. A further benefit comesfrom the fact that the longer the customer stays with us the more prof-itable they become. A study by consulting company Bain and Co5 foundhigher customer retention rates correlated strongly with profitability.The reasons for this are that a retained customer typically costs less tosell to and to service. Also as the relationship develops there is a greaterlikelihood that they will give a greater part of their business to a supplierwhom they are prepared to treat as a partner. This is the idea of ‘share ofwallet’ whereby the goal is to increase the total spend that is captured bythe company. Furthermore, satisfied customers tell others and thus thechance increases that further business from new customers will be gener-ated through this source.
A simple measure of customer retention is to ask the question: ‘Howmany of the customers that we had 12 months ago do we still havetoday?’ This measure is the real test of customer retention. It can beextended to include the value of purchases made by the retained cus-tomer base to assess how successful the company has been in increasingthe level of purchasing from these accounts (see Figure 2.4).
LOGISTICS AND SUPPLY CHAIN MANAGEMENT
54
LSCH_C02.QXD 12/11/04 12:04 pm Page 54

A prime objective of any customer service strategy should be to enhancecustomer retention. Whilst customer service obviously also plays a rolein winning new customers it is perhaps the most potent weapon in themarketing armoury for the keeping of customers.
There is rapidly emerging a new focus in marketing and logistics onthe creation of ‘relationships’ with customers. The idea is that weshould seek to create such a level of satisfaction with customers thatthey do not feel it necessary even to consider alternative offers or sup-pliers. Many markets are characterized by a high level of ‘churn’ or‘promiscuity’ amongst the customer base. In these markets customerswill buy one brand on one occasion and then are just as likely to buyanother on the next occasion.
The principle behind ‘relationship marketing’ is that the organiza-tion should consciously strive to develop marketing strategies tomaintain and strengthen customer loyalty.6 So, for example, an airline
2 LOGISTICS AND CUSTOMER VALUE
55
No. ofcustomers 12months ago
No. ofcustomerstoday
Retainedcustomers
Newcustomers
(a)
Value ofpurchases12 months ago
Value of purchasesby retainedcustomers
£
(b)
£
Fig. 2.4 Customer retention indicators
LSCH_C02.QXD 12/11/04 12:04 pm Page 55

might develop a frequent-flyer programme, or a credit card companymight award points based upon the value of purchases made with thecard that can then be redeemed for cash or awards. At the otherextreme a company like IBM will consciously seek to develop long-term relationships with its customers through training programmes,client seminars, frequent customer communication and so on.
Market-driven supply chains
Most traditional supply chains were designed to optimize the internaloperations of the supplying company. Thus a manufacturer might bemotivated to establish supply and distribution arrangements that wouldenable production efficiencies to be maximized. Typically this wouldentail manufacturing in large batches, shipping in large quantities andbuffering the factory, both upstream and downstream, with inventory. Inthis way the goal of becoming a ‘low-cost producer’ could be achieved.
Whilst this approach was fine from the perspective of the manufac-turing organization, it clearly did not come anywhere close to being‘customer-centric’ in the sense of designing the supply chain around theneeds of the customer. With the continuing transfer of power in the dis-tribution channel from the producer to the consumer, this conventionalphilosophy has become less and less appropriate. Now, instead ofdesigning supply chains from the ‘factory outwards’ the challenge is todesign them from the ‘customer backwards’.
This new perspective sees the consumer not at the end of the supplychain but at its start. In effect this is the philosophical differencebetween supply chain management and what more properly might becalled ‘demand chain management’.
As one author has suggested:
Managing demand chains is … fundamentally different to managingsupply chains. It requires turning the supply chain on its head, andtaking the end user as the organization’s point of departure and not itsfinal destination.
Baker7
Figure 2.5 suggests an appropriate sequence of actions to create amarket-driven supply chain.
LOGISTICS AND SUPPLY CHAIN MANAGEMENT
56
LSCH_C02.QXD 12/11/04 12:04 pm Page 56

This sequence begins with an understanding of the value that cus-tomers seek in the market in which the company competes. Thiscustomer insight will enable the identification of the real market seg-mentation, i.e. the clusters of customers who share the same valuepreferences. The Spanish fashion chain Zara provides an excellentexample of how market understanding and supply chain excellence cancreate real value for its target customers.
2 LOGISTICS AND CUSTOMER VALUE
57
Identifyvalue
segmentsWhat do our customers value?
Define thevalue
proposition
How do we translate theserequirements into an offer?
Identifythe market
winners
What does it take to succeedin this market?
Develop thesupply chain
strategy
How do we deliver againstthis proposition?
Fig. 2.5 Linking customer value to supply chain strategy
ZARA
Zara is one of world’s most successful and dynamic apparel businesses.It is the flagship of Inditex, a vertically integrated retail and manufac-turing group based in Galicia in north-west Spain. The first Zara storeopened in the city of La Coruña in 1975, the brain child of AmanicoOrtega, owner of a small clothing factory. Ortega was looking for abetter way to run his business, one which would avoid the inefficiencyof making clothes that might not sell. In the intervening decades more
▼
LSCH_C02.QXD 12/11/04 12:04 pm Page 57

LOGISTICS AND SUPPLY CHAIN MANAGEMENT
58
than 600 Zara stores – most owned directly by the company – haveopened throughout Spain and 43 other countries worldwide.
Zara produces and sells highly fashionable apparel for men, womenand children, but its core customers are fashion conscious 18–35-year-old women. It offers them the very latest design trends at affordablemass-market prices. Physical product quality is good enough to see outthe season, but not necessarily longer. By then the same customers willhave moved onto the next ‘hot’ look. The customers are loyal, fre-quent shoppers who visit a Zara store on average 17 times per year.1
To retain their interest, stock is constantly varied and updated. Newdeliveries arrive on a twice weekly basis. Few products are available instore for more than a month, adding a sense of exclusivity and urgencyto buy. The stores themselves are sited in fashionable prestige loca-tions, their interiors are smart, fresh, modern and regularly refurbishedto retain their contemporary appeal.
Zara is a design-sensitive, but not designer-led operation. The com-pany does not seek to set new trends itself, just to be a very fast andflexible follower. It employs a large cadre of design staff who interpretthe latest in international fashion trends, often identified by ‘coolhunters’ who glean inspiration through visits to fashion shows, competi-tors’ stores, university campuses, pubs, cafes and clubs, plus any othervenues or events deemed to be relevant to the lifestyles of the target cus-tomers. The team’s understanding of directional fashion trends is furtherguided by regular inflows of sales data and other information from all ofthe company’s stores and sites around the world.
Zara’s positioning puts it in direct competition with some of thebest known operators in the apparel industry, including US-based TheLimited and Gap, as well as the highly successful vertically integratedEuropean retailers, Mango, Mexx and the Italian giant Benetton.All are exponents of quick response logistics. However, Zara’srapid growth and ongoing success in such a fiercely competitive envi-ronment is testament to its ability to implement an operating strategy –based on the dual objectives of minimizing stock and responding quicklyto market needs2 – even more effectively than its internationallyacclaimed rivals.
The process of supplying goods to the stores begins with the cross-functional teams – comprising fashion, commercial and retail specialists –
▼
LSCH_C02.QXD 12/11/04 12:04 pm Page 58

2 LOGISTICS AND CUSTOMER VALUE
59
working within Zara’s Design Department at the company’s headquartersin La Coruña. Fashion specialists within the Design Department areresponsible for the initial designs, fabric selection and choice of prints andcolours. It is then up to the team’s commercial management specialists toascertain the likely commercial viability of the items proposed. If thedesign is accepted – two-thirds are not – the commercial specialists pro-ceed to negotiate with suppliers, agree purchase prices, analyze costs andmargins, and fix a standard cross-currency price position for the garment.Store prices reflect the price position agreed for goods sold in Spain, plusthe cost of distribution. Hence a shopper in the UK will pay 50 per centmore for the same item as a shopper in Spain. For customers in the USand Japan the price is more than double.
The size of the production run – i.e. the number of garments required– and launch dates (the latter vary between countries in accordance withcustom and climate) are also determined at this point.
Approximately 20 per cent of merchandise – items with the broadestand least transient appeal – is imported as finished goods from low-costmanufacturing centres, mostly in Asia. The rest is produced by quickresponse. Around 50 per cent of all Zara’s merchandise is manufacturedin-house using the company’s own highly automated factories and a net-work of smaller contractors clustered around La Coruña. The remainderis produced elsewhere in Spain or in other European countires.
Raw materials are procured through the company’s buying officesin Europe and Asia, with material coming in from Mauritius, NewZealand, Australia, Morocco, China, Korea, India, Turkey, Italy andGermany. The global sourcing policy, using a broad supplier base, pro-vides the widest possible selection of fashion fabrics, while reducing therisk of dependence on any source or supplier. Approximately half of thematerial is purchased in ‘gray’, to be dyed or printed and finished by oneof Inditex’s other Galician subsidiaries. The turnaround time for thisprocess is only one week, illustrating how high production costs inEurope are offset by the benefits of proximity and control.
Zara’s manufacturing systems are similar in many ways to thosedeveloped and employed so successfully by Benetton in northern Italy,but refined using ideas developed in conjunction with Toyota. Onlythose operations which enhance cost-efficiency through economies of
▼
LSCH_C02.QXD 12/11/04 12:04 pm Page 59

LOGISTICS AND SUPPLY CHAIN MANAGEMENT
60
scale are conducted in-house (such as dying, cutting, labelling andpackaging). All other manufacturing activities, including the labour-intensive finishing stages, are completed by networks of hundreds ofsmall subcontractors, each specializing in one particular part of the pro-duction process or garment type. These subcontractors work exclusivelyfor Zara’s parent, Inditex SA. In return they receive the necessary tech-nological, financial and logistical support required to achieve stringenttime and quality targets. Inventory costs are kept to a minimum becauseZara pays only for the completed garments.
Finished goods are forwarded to the company’s two distributioncentres in La Coruña and Zaragoza where they are labelled, price-tagged (all items carry international price tags showing the price inrelevant currencies) and packed. From there they are carried by third-party contractors by road and/or air to their penultimate destinations.Road is used for journeys of 24 hours or less, while airfreight is usedfor longer distances. All deliveries are completed within 48 hours.
In an industry where lead times of many months are common, Zarahas reduced its lead time for more than half of the garments it sells to alevel unmatched by any of its European or North American competi-tors. The whole design, production and delivery cycle takes only fourto five weeks. Design modifications and restocking of existing prod-ucts, if required, is completed within 14 days. The system is flexibleenough to cope with sudden changes in demand and shop-by-shopstock allocations are calculated centrally, rather than in-store, becauseproduction is always kept at a level slightly below expected sales tokeep stock moving. True to its original objectives, the company hasconsciously opted for undersupply, viewing it as a lesser evil than hold-ing slow-moving or obsolete stock.
References1. Bonace, Jaime and Cervino, Julio, ‘Global Integration Without Expatriates’, Human
Resource Management Journal, Vol. 7, No. 3, 1997, pp. 89–100.2. Ghemawat, P. and Nueno, J.L., Zara: Fast fashion, Harvard Business School
Publishing, Boston, MA, 2002, p. 15
▼
LSCH_C02.QXD 12/11/04 12:04 pm Page 60

Identifying customers’ service needs
It is important to remember that no two customers will ever be exactlythe same in terms of their service requirements. However, it will oftenbe the case that customers will fall into groups or ‘segments’ that arecharacterized by a broad similarity of service needs. These groupingsmight be thought of as ‘service segments’. The logistics planner needstherefore to know just what the service issues are that differentiate cus-tomers. Market research can be of great assistance in understandingthis service segmentation and it is often surprising to see how littleformal research is conducted in this crucial area.
How might such a research programme be implemented?The first point to emphasize is that customer service is perceptual.
Whatever our own ‘hard’ internal measures of service might say ourservice performance is, perceptions are the reality. We might use mea-sures which, whilst providing useful measures of productivity, do notactually reflect the things the customer values. For example, whilst‘stock availability’ is a widespread internal measure of performance, amore appropriate external measure from the customer’s viewpointcould be ‘on-time delivery’. Hence it is critical that we develop a set ofservice criteria that are meaningful to customers.
The approach to service segmentation suggested here follows athree-stage process:
1 Identify the key components of customer service as seen by customersthemselves.
2 Establish the relative importance of those service components tocustomers.
3 Identify ‘clusters’ of customers according to similarity of servicepreferences.
1 Identifying the key components of customer service
A common failing in business is to assume that ‘we know what our cus-tomers want’. However, the truth is that it is so easy to become divorcedfrom the reality of the marketplace when management is consumed withthe day-to-day pressures of running a business. How should we knowwhich aspects of service are most highly rated by the customer? Giventhe complexity of the market that the typical company serves how might
2 LOGISTICS AND CUSTOMER VALUE
61
LSCH_C02.QXD 12/11/04 12:04 pm Page 61

it better understand the segmentation of those markets in terms of ser-vice requirements? What does it take for a company to become thesupplier of choice?
Clearly it is important to develop an understanding of the serviceneeds of customers through detailed research.
The first step in research of this type is to identify the key sources ofinfluence upon the purchase decision. If, for example, we are sellingcomponents to a manufacturer, who will make the decision on thechoice of supplier? This is not always an easy question to answer as inmany cases there will be several people involved. The purchasing man-ager of the company to which we are selling may only be acting as anagent for others within the firm. In other cases his influence will bemuch greater. Alternatively if we are manufacturing products for salethrough retail outlets, is the decision to stock made centrally or by indi-vidual store managers? The answers can often be supplied by the salesforce. The sales representative should know from experience who arethe decision makers.
Given that a clear indication of the source of decision-making powercan be gained the customer service researcher at least knows who toresearch. The question remains as to which elements of the vendor’stotal marketing offering have what effect upon the purchase decision.
Ideally once the decision-making unit in a specific market has beenidentified, an initial, small-scale research programme should be initi-ated based upon personal interviews with a representative sample ofbuyers. The purpose of these interviews is to elicit, in the language ofthe customers, firstly, the importance they attach to customer servicevis-à-vis the other marketing mix elements such as price, product qual-ity, promotion, etc., and secondly, the specific importance they attachto the individual components of customer service.
The importance of this initial step in measuring customer service isthat relevant and meaningful measures of customer service are gener-ated by the customers themselves. Once these dimensions are definedwe can identify the relative importance of each one and the extent towhich different types of customer are prepared to trade off one aspectof service for another.
LOGISTICS AND SUPPLY CHAIN MANAGEMENT
62
LSCH_C02.QXD 12/11/04 12:04 pm Page 62

2 Establishing the relative importance of customer service components
One of the simplest ways of discovering the importance a customerattaches to each element of customer service is to take the componentsgenerated by means of the process described in step 1 and to ask a rep-resentative sample of customers to rank order them from the ‘mostimportant’ to the ‘least important’. In practice this is difficult, particu-larly with a large number of components, and would not give anyinsight into the relative importance of each element. Alternatively aform of rating scale could be used. For example, the respondents couldbe asked to place a weight from 1 to 10 against each componentaccording to how much importance they attached to each element. Theproblem here is that respondents will tend to rate most of the compo-nents as highly important, especially since those components weregenerated on the grounds of importance to customers in the first place.A partial solution is to ask the respondent to allocate a total of 100points amongst all the elements listed, according to perceived impor-tance. However, this is a fairly daunting task for the respondent andcan often result in an arbitrary allocation.
Fortunately a relatively recent innovation in consumer research tech-nology now enables us to evaluate very simply the implicit importancethat a customer attaches to the separate elements of customer service.The technique is based around the concept of trade-off and can best beillustrated by an example from everyday life. In considering, say, thepurchase of a new car we might desire specific attributes, e.g. perfor-mance in terms of speed and acceleration, economy in terms of petrolconsumption, size in terms of passenger and luggage capacity and, ofcourse, low price. However, it is unlikely that any one car will meet allof these requirements so we are forced to trade off one or more of theseattributes against the others.
The same is true of the customer faced with alternative options ofdistribution service. The buyer might be prepared to sacrifice a day ortwo on lead time in order to gain delivery reliability, or to trade-offorder completeness against improvements in order entry, etc.Essentially the trade-off technique works by presenting the respondentwith feasible combinations of customer service elements and asking fora rank order of preference for those combinations. Computer analysisthen determines the implicit importance attached by the respondent toeach service element.8
2 LOGISTICS AND CUSTOMER VALUE
63
LSCH_C02.QXD 12/11/04 12:04 pm Page 63

3 Identifying customer service segments
Now that we have determined the importance attached by differentrespondents to each of the service attributes previously identified, thefinal step is to see if any similarities of preference emerge. If one groupof respondents, for example, has a clearly distinct set of priorities fromanother then it would be reasonable to think of them both as differentservice segments.
How can these customer service segments be identified? One tech-nique that has been successfully used in this connection is clusteranalysis. Cluster analysis is a computer-based method for lookingacross a set of data and seeking to ‘match’ respondents across as manydimensions as possible. Thus if two respondents completed the step 2trade-off analysis in a similar way their importance scores on the vari-ous service dimensions would be similar and hence the cluster analysiswould assign them to the same group.
One study in an industrial market suggested that the traditional way ofsegmenting customers according to ‘Standard Industrial Classification’(SIC) had little relevance to purchasing behaviour. The classic categoriza-tion of customers according to industry sector did not correlate with theattributes they sought from suppliers. Instead it seemed that some compa-nies were very time-sensitive in terms of delivery reliability – a ‘just-in-time’segment – regardless of the industry they were in. In the same way therewas a very clear ‘price’ segment, which also cut across conventional indus-trial classifications. A further segment was much more responsive to a‘relationship’ approach, valuing technical support and close supplier liaisonmuch more highly. As a result of this research the supplier was better ableto focus its marketing efforts and to re-engineer its supply chain strategy toachieve a better match with customer requirements.
The challenge to logistics management is to create appropriate supplychain solutions to meet the needs of these different value segments. Morethan likely there will be the need for multiple supply chain solutions since‘one size will not fit all’. This issue will be dealt with in detail in Chapter 4where the concept of supply chain agility is discussed.
LOGISTICS AND SUPPLY CHAIN MANAGEMENT
64
LSCH_C02.QXD 12/11/04 12:04 pm Page 64

Defining customer service objectives
The whole purpose of supply chain management and logistics is to pro-vide customers with the level and quality of service that they requireand to do so at less cost to the total supply chain. In developing amarket-driven logistics strategy theaim is to achieve ‘service excellence’in a consistent and cost-effective way.
The definition of appropriate ser-vice objectives is made easier if weadopt the concept of the perfectorder. The perfect order is achievedwhen the customer’s service require-ments are met in full. Clearly such a definition is specific to individualcustomers, but it is usually possible to group customers into segmentsand then to identify, along the lines described earlier, the key serviceneeds of those segments. The perfect order is achieved only when eachof those service needs is met to the customer’s satisfaction.
The measure of service is therefore defined as the percentage of occa-sions on which the customer’s requirements are met in full. Normallythis percentage would be measured across all customers over a periodof time. However, it can also be used to measure service performance atthe individual customer level and indeed at any level, e.g. segment,country or by distribution centre.
One frequently encountered measure of the perfect order is ‘on-time,in-full’ (OTIF). An extension of this is on-time, in-full and error-free.This latter element relates to documentation, labelling and damage tothe product or its packaging. To calculate the actual service level usingthe perfect order concept requires performance on each element to bemonitored and then the percentage achievement on each element to bemultiplied together.
For example, if the actual performance across all orders for the last12 months was as follows:
On-time : 90%In-full : 80%Error-free : 70%
2 LOGISTICS AND CUSTOMER VALUE
65
The whole purpose of supply chainmanagement and logistics is to pro-
vide customers with the level andquality of service that they require
and to do so at less cost to the totalsupply chain.
LSCH_C02.QXD 12/11/04 12:04 pm Page 65

the actual perfect order achievement would be:
90% × 80% × 70% = 50.4%
In other words the likelihood that a perfect order was achieved duringthe period under review was only 50.4 per cent!
The cost benefit of customer service
All companies have to face a basic fact: there will be significant differ-ences in profitability between customers. Not only do differentcustomers buy different quantities of different products, but the cost toservice these customers will typically vary considerably. This issue willbe explored more fully in Chapter 3.
The 80/20 rule will often be found to hold: 80 per cent of the profitsof the business come from 20 per cent of the customers. Furthermore,80 per cent of the total costs to serve will be generated from 20 percent of the customers (but probably not the same 20 per cent!). Whilstthe proportion may not be exactly 80/20 it will generally be in thatregion. This is the so-called Pareto Law, named after a nineteenth cen-tury Italian economist.
The challenge to customer service management therefore is, firstly, toidentify the real profitability of customers and then, secondly, todevelop strategies for service that will improve the profitability of allcustomers. What has to be recognized is that there are costs as well asbenefits in providing customer service and that therefore the appropri-ate level and mix of service will need to vary by customer type.
The basic relationship between the level of service and the cost isoften depicted as a steeply rising curve (Figure 2.6).
The curve assumes that demand for the item is ‘normally’ distributed,i.e. it takes on the classic bell-shape. A feature of the normal distributionis that once its two key parameters, the mean (–x) and standard deviation(σ), are known, the probability of a given value occurring can be easilycalculated. Thus, as Figure 2.7 shows, if the distribution depicteddescribes daily sales for a particular product, it can be calculated that onapproximately 68 per cent of occasions total demand would be withinplus or minus one standard deviation either side of the mean; onapproximately 95 per cent of occasions total demand would lie withinplus or minus two standard deviations either side of the mean and on 99per cent of occasions three standard deviations either side of the mean.
LOGISTICS AND SUPPLY CHAIN MANAGEMENT
66
LSCH_C02.QXD 12/11/04 12:04 pm Page 66

In calculating how much safety stock is required the inventory manageris only concerned with those occasions when demand is greater thanaverage. If sales are approximately normally distributed, demand willbe lower than average approximately 50 per cent of the time, and thusa 50 per cent service level would be maintained with no safety stock. Itis on those occasions when demand exceeds the average that safetystock is required. In other words we must focus attention on the area ofthe curve to the right of the mean. Thus, by setting a stock level onestandard deviation greater than the mean, the manager can achieve aservice level of approximately 84 per cent. By setting the level two
2 LOGISTICS AND CUSTOMER VALUE
67
Service level100%0
Cos
ts o
f ser
vice
Fig. 2.6 The costs of service
–2σ
68.3%
Averagesales
–3σ –σ σ 2σ 3σ
95.4%99.7%
Fig. 2.7 Probability of level of sales being within given limits
LSCH_C02.QXD 12/11/04 12:04 pm Page 67

standard deviations greater than the mean the service level would beapproximately 98 per cent and with three standard deviations it wouldbe 99.9 per cent (Figure 2.8).
What this highlights is that as the desired service level rises, it takes adisproportionate investment in inventory to achieve small incrementalimprovements in availability.
The table below illustrates this effect:
● If inventory equivalent to average expected daily demand (x_) is held
then the service level would be 50 per cent.● If safety stock equivalent to one standard deviation of demand (σ) is
held then the service level would be 84 per cent, etc.
However, if it is possible to find alternative service strategies for servic-ing customers, say, for example, by speeding up the flow of informationabout customer requirements and by using faster modes of transport,
LOGISTICS AND SUPPLY CHAIN MANAGEMENT
68
σ 2σ 3σ
99.9%98%
84%
Fig. 2.8 Service levels and the normal distribution
Inventory Servicelevel level
x– 50%x– + σ 84%x– + 2σ 98%x– + 3σ 99.9%
LSCH_C02.QXD 12/11/04 12:04 pm Page 68

then the same level of service can be achieved with less inventory – ineffect pushing the curve to the right (Figure 2.9). This is the idea of sub-stituting information and responsiveness for inventory. In other words ifwe can gain earlier warning of customer requirements and our leadtimes are short, then we can reduce our reliance on inventory.
Setting customer service priorities
Whilst it should be the objective of any logistics system to provide allcustomers with the level of service that has been agreed or negotiated,it must be recognized that there will inevitably need to be service prior-ities. In this connection the Pareto Law, or 80/20 rule, can provide uswith the basis for developing a more cost-effective service strategy.Fundamentally, the service issue is that since not all our customers areequally profitable nor are our products equally profitable, should notthe highest service be given to key customers and key products? Sincewe can assume that money spent on service is a scarce resource then weshould look upon the service decision as a resource allocation issue.
Figure 2.10 shows how a typical company might find its profitsvarying by customer and by product.
The curve is traditionally divided into three categories: the top20 per cent of products and customers by profitability are the ‘A’ cate-gory; the next 50 per cent or so are labelled ‘B’; and the final 30 percent are category ‘C’. The precise split between the categories is arbi-trary as the shape of the distribution will vary from business tobusiness and from market to market.
2 LOGISTICS AND CUSTOMER VALUE
69
Service level100%0
Cos
ts o
f ser
vice
Fig. 2.9 Shifting the costs of service
LSCH_C02.QXD 12/11/04 12:04 pm Page 69

The appropriate measure should be profit rather than sales revenue orvolume. The reason for this is that revenue and volume measures mightdisguise considerable variation in costs. In the case of customers this costis the ‘cost to serve’ and we will later suggest an approach to measuringcustomer profitability. In the case of product profitability we must alsobe careful that we are identifying the appropriate service-related costs asthey differ by product. One of the problems here is that conventionalaccounting methods do not help in the identification of these costs.
What we should be concerned to do at this stage in the analysis is toidentify the contribution to profit that each product (at the individualstock keeping unit (SKU) level) makes. By contribution we mean thedifference between total revenue accruing and the directly attributablecosts that attach as the product moves through the logistics system.
Looking first at differences in product profitability, what use mightbe made of the A,B,C categorization? Firstly it can be used as the basisfor classic inventory control whereby the highest level of service (asrepresented by safety stock) is provided for the ‘A’ products, a slightlylower level for the ‘B’ products and lower still for the ‘Cs’. Thus wemight seek to follow the stock holding policy shown below:
LOGISTICS AND SUPPLY CHAIN MANAGEMENT
70
15%
5%
80%
20% 30%50%
'A' 'C''B'
% Products/customers
% S
ales
/pro
fits
Fig. 2.10 The ‘Pareto’ or 80/20 rule
LSCH_C02.QXD 12/11/04 12:04 pm Page 70

Product category Stock availabilityA 99%B 97%C 90%
Alternatively, and probably to be preferred, we might differentiate thestock holding by holding the ‘A’ items as close as possible to the cus-tomer and the ‘B’ and ‘C’ items further up the supply chain. Thesavings in stock holding costs achieved by consolidating the ‘B’ and ‘C’items as a result of holding them at fewer locations would normallycover the additional cost of despatching them to the customer by afaster means of transportation (e.g. overnight delivery).
Perhaps the best way to manage product service levels is to take intoaccount both the profit contribution and the individual product demand.
We can bring both these measures together in the form of a simplematrix in Figure 2.11. The matrix can be explained as follows.
Quadrant 1: Seek cost reductions
Because these products have high volume it would suggest that they arein frequent demand. However, they are also low in profit contributionand the priority should be to re-examine product and logistics costs tosee if there is any scope for enhancing profit.
Quadrant 2: Provide high availability
These products are frequently demanded and they are more profitable.We should offer the highest level of service on these items by holdingthem as close to the customer as possible and with high availability.Because there will be relatively few of these items we can afford tofollow such a strategy.
Quadrant 3: Review
Products in this category should be regularly appraised with a view todeletion from the range. They do not contribute to profits (or at leastonly marginally) and they are slow movers from a sales point of view.Unless they play a strategic role in the product portfolio of the firmthen there is probably a strong case for dropping them.
2 LOGISTICS AND CUSTOMER VALUE
71
LSCH_C02.QXD 12/11/04 12:04 pm Page 71

Quadrant 4: Centralized inventory
Because these products are highly profitable but only sell at a relativelyslow rate they are candidates for centralized management. In otherwords, they should be kept in some central location, as far back up thesupply chain as possible in order to reduce the total inventory invest-ment, and then shipped by express transport direct to customers.
This concept of service prioritization by product can be extended toinclude customer priorities. Because the same 80/20 rule applies to cus-tomers as it does to products, it makes sense to focus resources on keyaccounts as well as key products.
Figure 2.12 shows that if the 80/20 rule applies both to products andcustomers then all businesses are actually very dependent upon a very fewcustomers buying a few high profit lines. Indeed the arithmetic is easy:
20% of customers buying 20% of the products= 4% of all customer/product transactions
Which provides:
80% of 80% of total profit = 64%
In other words, just 4 per cent of transactions (measured order line byorder line) gives us 64 per cent of all our profit!
LOGISTICS AND SUPPLY CHAIN MANAGEMENT
72
(1)Seek costreduction
(3)Review
(2)Provide highavailability
(4)Centralizedinventory
Low High
Hig
hLo
wVolu
me
(by
SK
U)
Profit contribution (by SKU)
Fig. 2.11 Managing product service levels
LSCH_C02.QXD 12/11/04 12:04 pm Page 72
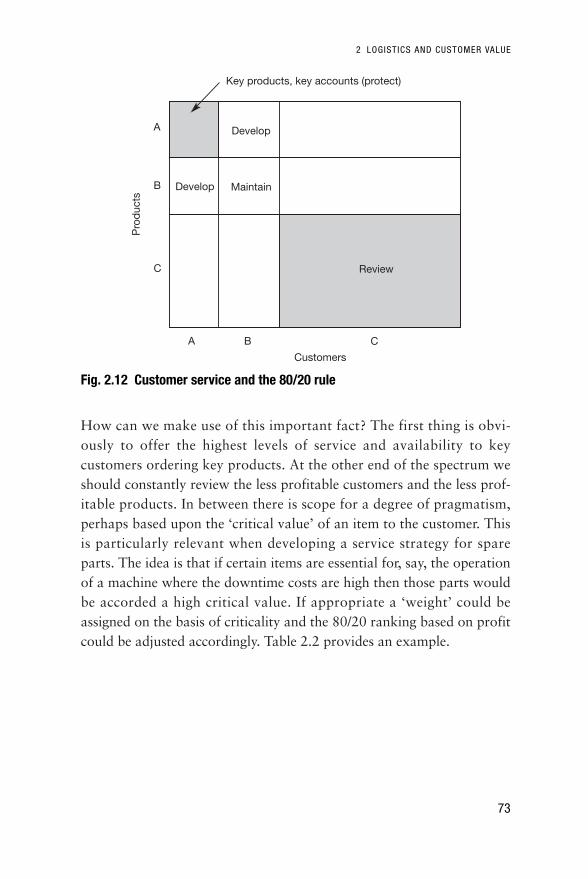
How can we make use of this important fact? The first thing is obvi-ously to offer the highest levels of service and availability to keycustomers ordering key products. At the other end of the spectrum weshould constantly review the less profitable customers and the less prof-itable products. In between there is scope for a degree of pragmatism,perhaps based upon the ‘critical value’ of an item to the customer. Thisis particularly relevant when developing a service strategy for spareparts. The idea is that if certain items are essential for, say, the operationof a machine where the downtime costs are high then those parts wouldbe accorded a high critical value. If appropriate a ‘weight’ could beassigned on the basis of criticality and the 80/20 ranking based on profitcould be adjusted accordingly. Table 2.2 provides an example.
2 LOGISTICS AND CUSTOMER VALUE
73
Develop
Review
A B
Pro
duc
ts
Customers
Maintain
Develop
C
C
B
A
Key products, key accounts (protect)
Fig. 2.12 Customer service and the 80/20 rule
LSCH_C02.QXD 12/11/04 12:04 pm Page 73

Setting service standards
Obviously if service performance is to be controlled then it must beagainst predetermined standards.
Ultimately the only standard to be achieved is 100 per cent confor-mity to customer expectations. This requires a clear and objectiveunderstanding of the customers’ requirements and at the same timeplaces an obligation upon the supplier to shape those expectations. Inother words there must be a complete match between what the customerexpects and what we are willing and able to provide. This may requirenegotiation of service standards since clearly it is in neither party’s inter-est to provide service levels that would lead to a long-term deteriorationin profitability – either for the supplier or the customer.
What are the customer service elements for which standards shouldbe set?
To be effective these standards must be defined by the customersthemselves. This requires customer research and competitive bench-marking studies to be conducted so that an objective definition ofcustomer service for each market segment may be identified.
LOGISTICS AND SUPPLY CHAIN MANAGEMENT
74
Table 2.2 Critical value analysis
Profitability Critical value Rank Order ofProducts rank to × priority
order customers Critical for service1 2 3 value
C 1 x 3 1P 2 x 4 2 =R 3 x 6 5B 4 x 4 2 =X 5 x 5 4Y 6 x 18 8Z 7 x 14 7H 8 x 8 6J 9 x 27 10K 10 x 20 9
Critical values: 1 = Sale lost2 = Slight delay acceptable3 = Longer delay acceptable
LSCH_C02.QXD 12/11/04 12:04 pm Page 74

However, for the moment we can indicate some of the key areaswhere standards are essential:
● Order cycle time● Stock availability● Order-size constraints● Ordering convenience● Frequency of delivery● Delivery reliability● Documentation quality● Claims procedure● Order completeness● Technical support● Order status information
Let us examine each of these in turn.
Order cycle time
This is the elapsed time from customer order to delivery. Standardsshould be defined against the customer’s stated requirements.
Stock availability
This relates to the percentage of demand for a given line item (stockkeeping unit, or SKU) that can be met from available inventory.
Order-size constraints
More and more customers seek just-in-time deliveries of small quanti-ties. Do we have the flexibility to cope with the range of customerdemands likely to be placed upon us?
Ordering convenience
Are we accessible and easy to do business with? How are we seen fromthe customers’ viewpoint? Do our systems talk to their systems?
Frequency of delivery
A further manifestation of the move to just-in-time is that customersrequire more frequent deliveries within closely specified time windows.Again it is flexibility of response that should be the basis for the perfor-mance standard.
2 LOGISTICS AND CUSTOMER VALUE
75
LSCH_C02.QXD 12/11/04 12:04 pm Page 75

LOGISTICS AND SUPPLY CHAIN MANAGEMENT
76
Delivery reliability
What proportion of total orders are delivered on time? It is a reflectionnot just of delivery performance but also of stock availability and orderprocessing performance.
Documentation quality
What is the error rate on invoices, delivery notes and other customercommunications? Is the documentation ‘user friendly’? A surprisinglylarge number of service failures are from this source.
Claims procedure
What is the trend in claims? What are their causes? How quickly dowe deal with complaints and claims? Do we have procedures for ‘ser-vice recovery’?
Order completeness
What proportion of orders do we deliver complete, i.e. no back ordersor part shipments?
Technical support
What support do we provide customers with after the sale? If appropriatedo we have standards for call-out time and first-time fix rate on repairs?
Order status information
Can we inform customers at any time on the status of their order? Do wehave ‘hotlines’ or their equivalent? Do we have procedures for informingcustomers of potential problems on stock availability or delivery?
All of these issues are capable of quantification and measurementagainst customer requirements. Similarly they are all capable of com-parison against competitive performance.
It must be recognized that from the customer’s perspective there are onlytwo levels of service – either 100 per cent or 0 per cent. In other wordseither the customer gets exactly what they ordered at the time and placerequired or they don’t. It must also be remembered that 100 per centorder fill rates are extremely difficult to achieve – the laws of probabilitysee to that! If there are ten items on a particular order and each item iscarried in stock at the 95 per cent level of availability then the probabilitythat the complete order can be filled is (0.95)10, which is 0.599. In otherwords, just over a 50/50 chance that we can satisfy the complete order.
LSCH_C02.QXD 12/11/04 12:04 pm Page 76

Table 2.3 shows how the probability of order fill diminishes as thenumber of items on the customer order increases.
Ideally organizations should establish standards and monitor perfor-mance across a range of customer service measures. For example, usingthe pre-transaction, transaction and post-transaction framework, thefollowing measures provide valuable indicators of performance:
Pre-transaction● Stock availability ● Target delivery dates● Response times to queries
Transaction● Order fill rate● On-time delivery
2 LOGISTICS AND CUSTOMER VALUE
77
Table 2.3 Probability of a complete order
Number of lines Line item availabilityin order
90% 92% 94% 95%
1 .900 .920 .940 .9502 .810 .846 .884 .9033 .729 .779 .831 .8574 .656 .716 .781 .8155 .590 .659 .734 .7746 .531 .606. .690 .7357 .478 .558 .648 .6988 .430 .513 .610 .6639 .387 .472 .573 .63010 .348 .434 .538 .59911 .314 .399 .506 .56912 .282 .368 .476 .54014 .225 .311 .400 .48815 .206 .286 .395 .46316 .195 .263 .372 .44017 .167 .243 .349 .41818 .150 .223 .328 .39719 .135 .205 .309 .37720 .122 .185 .290 .358
LSCH_C02.QXD 12/11/04 12:04 pm Page 77
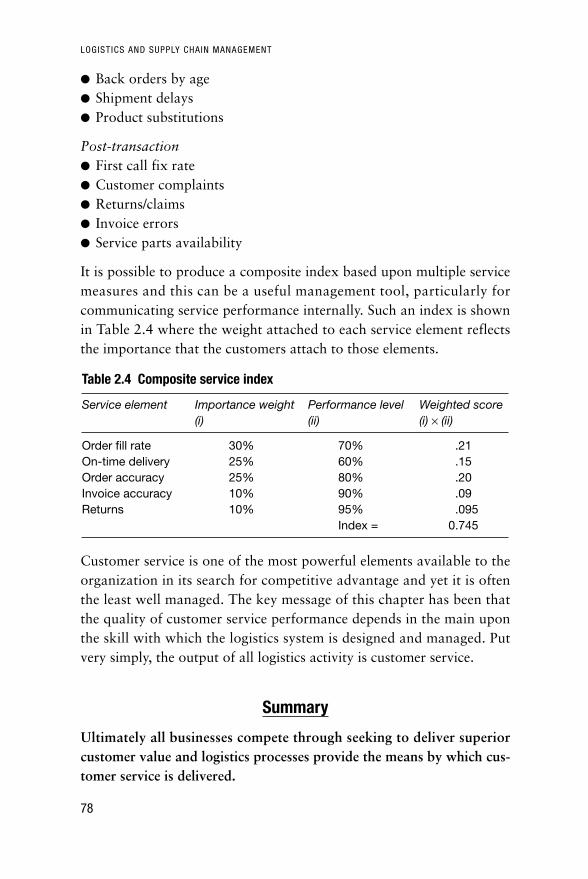
LOGISTICS AND SUPPLY CHAIN MANAGEMENT
78
● Back orders by age● Shipment delays● Product substitutions
Post-transaction● First call fix rate● Customer complaints● Returns/claims● Invoice errors● Service parts availability
It is possible to produce a composite index based upon multiple servicemeasures and this can be a useful management tool, particularly forcommunicating service performance internally. Such an index is shownin Table 2.4 where the weight attached to each service element reflectsthe importance that the customers attach to those elements.
Customer service is one of the most powerful elements available to theorganization in its search for competitive advantage and yet it is oftenthe least well managed. The key message of this chapter has been thatthe quality of customer service performance depends in the main uponthe skill with which the logistics system is designed and managed. Putvery simply, the output of all logistics activity is customer service.
Summary
Ultimately all businesses compete through seeking to deliver superiorcustomer value and logistics processes provide the means by which cus-tomer service is delivered.
Table 2.4 Composite service index
Service element Importance weight Performance level Weighted score (i) (ii) (i) × (ii)
Order fill rate 30% 70% .21On-time delivery 25% 60% .15Order accuracy 25% 80% .20Invoice accuracy 10% 90% .09Returns 10% 95% .095
Index = 0.745
LSCH_C02.QXD 12/11/04 12:04 pm Page 78

Customer service is a multi-faceted concept. It is increasingly importantas a means of gaining and maintaining differentiation in the marketplace.Equally, since no two customers are alike it must be recognized that ser-vice must be tailored to meet the needs of different customers.
Logistics management can play a key role in enhancing customerlifetime value through increasing customer satisfaction and enhancedcustomer retention. To achieve this will require the development of amarket-driven logistics strategy and the redefinition of service objec-tives based upon customers’ specific requirements. ‘Perfect order’achievement should form the basis for the measurement of service per-formance and the creation of service standard.
References
1. Schonberger, R.J., Building a Chain of Customers, The Free Press, 1990.2. LaLonde, B.J. and Zinszer, P.H., Customer Service: Meaning and Measurement,
National Council of Physical Distribution Management, Chicago, 1976.3. Corsten, D. and Gruen, T., ‘Stock-Outs Cause Walkouts’, Harvard Business
Review, May 2004.4. Bayle, M., ‘Brand Killers’, Fortune, 11 August 2003, pp. 51–56.5. Reichheld, F.A., ‘Loyalty and the Renaissance of Marketing’, Marketing
Management, Vol. 2, No. 4, 1994, pp. 10–21.6. Christopher, M., Payne, A. and Ballantyne, D., Relationship Marketing:
Creating Stakeholder Value, Butterworth-Heinemann, 2002.7. Baker, S., New Consumer Marketing, John Wiley & Sons, 2003.8. Christopher, M.C. and Peck, H., Marketing Logistics, 2nd Edition, Butterworth-
Heinemann, 2003.
2 LOGISTICS AND CUSTOMER VALUE
79
LSCH_C02.QXD 12/11/04 12:04 pm Page 79

1
LSCH_C02.QXD 12/11/04 12:04 pm Page 80

Measuring logistics costsand performance
Logistics and the bottom line 83
Logistics and shareholder value 88
Logistics cost analysis 95
The concept of total cost analysis 96
Principles of logistics costing 99
Customer profitability analysis 103
Direct product profitability 109
Cost drivers and activity-based costing 111
81
Chapter
3
LSCH_C03.QXD 12/11/04 12:04 pm Page 81

This chapter:
Outlines the many ways in which logistics manage-ment can impact on overall return on investment and,ultimately, shareholder value.
●
Explains the rationale behind total cost analysis, a sys-tematic logistics-oriented cost accounting system andthe principal requirements for an effective logisticscosting system.
●
Emphasizes the importance of customer profitabilityanalysis based upon an understanding of the ‘cost-to-serve’.
●
Introduces the concept of direct product profitabilityand underlines the need to understand the customers’logistics costs.
●
Highlights the need to identify the cost drivers in thelogistics pipeline and to replace traditional forms ofcost allocation with more appropriate methods.
LOGISTICS AND SUPPLY CHAIN MANAGEMENT
82
LSCH_C03.QXD 12/11/04 12:04 pm Page 82

The costs of satisfying customer demand can be significant and yet,surprisingly, they are not always fully understood by organizations.
One reason for this is that traditional accounting systems tend to befocused around understanding product costs rather than customer costs.Whilst logistics costs will vary by company and by industry, across theeconomy as a whole that total cost of logistics as a percentage of grossdomestic product is estimated to be close to 10 per cent in the US1 andin other countries costs of similar magnitudes will be encountered.
However, logistics activity does not just generate cost, it also gener-ates revenue through the provision of availability – thus it is importantto understand the profit impact of logistics and supply chain decisions.At the same time logistics activity requires resources in the form offixed capital and working capital and so there are financial issues to beconsidered when supply chain strategies are devised.
Logistics and the bottom line
Today’s turbulent business environment has produced an ever greaterawareness amongst managers of the financial dimension of decisionmaking. ‘The bottom line’ has become the driving force which, perhapserroneously, determines the direction of the company. In some cases thishas led to a limiting, and potentially dangerous, focus on the short term.Hence we find that investment in brands, in R&D and in capacity maywell be curtailed if there is no prospect of an immediate payback.
Just as powerful an influence on decision making and managementhorizons is cash flow. Strong positive cash flow has become as much adesired goal of management as profit.
The third financial dimension to decision making is resource utiliza-tion and specifically the use of fixed and working capital. The pressure inmost organizations is to improve the productivity of capital – ‘to makethe assets sweat’. In this regard it is usual to utilize the concept of returnon investment (ROI). Return on investment is the ratio between the netprofit and the capital that was employed to produce that profit, thus:
3 MEASURING LOGISTICS COSTS AND PERFORMANCE
83
LSCH_C03.QXD 12/11/04 12:04 pm Page 83

ProfitROI = ––––––––––––––––
Capital employed
This ratio can be further expanded:
Profit SalesROI = –––––– × ––––––––––––––––
Sales Capital employed
It will be seen that ROI is the product of two ratios: the first,profit/sales, being commonly referred to as the margin and the second,sales/capital employed, termed capital turnover or asset turn. Thus togain improvement on ROI one or other, or both, of these ratios mustincrease. Typically many companies will focus their main attention onthe margin in their attempt to drive up ROI, yet it can often be moreeffective to use the leverage of improved capital turnover to boost ROI.For example, many successful retailers have long since recognized thatvery small net margins can lead to excellent ROI if the productivity ofcapital is high, e.g. limited inventory, high sales per square foot,premises that are leased rather than owned and so on.
Figure 3.1 illustrates the opportunities that exist for boosting ROIthrough either achieving better margins or higher assets turns or both.Each ‘iso-curve’ reflects the different ways the same ROI can beachieved through specific margin/asset turn combination. The chal-lenge to logistics management is to find ways of moving the iso-curveto the right.
LOGISTICS AND SUPPLY CHAIN MANAGEMENT
84
20% ROI
15% ROI
10% ROI
ProfitSales
(Margin)
SalesCap Emp
(Asset turn)
Fig. 3.1 The impact of margin and asset turn on ROI
LSCH_C03.QXD 12/11/04 12:04 pm Page 84

The ways in which logistics management can impact on ROI are many andvaried. Figure 3.2 highlights the major elements determining ROI and thepotential for improvement through more effective logistics management.
Logistics and the balance sheet
As well as its impact on operating income (revenue less costs) logistics canaffect the balance sheet of the business in a number of ways. In today’sfinancially-oriented business environment improving the shape of the bal-ance sheet through better use of resources has become a priority.
Once again better logistics management has the power to transformperformance in this crucial area. Figure 3.3 summarizes the major ele-ments of the balance sheet and links to each of the relevant logisticsmanagement components.
By examining each element of the balance sheet in turn it will beseen how logistics variables can influence its final shape.
3 MEASURING LOGISTICS COSTS AND PERFORMANCE
85
Salesrevenue
Costs
Cash
Accountsreceivable/payable
Inventory
Fixed assets
Profit
Capitalemployed
Return oninvestment
Customerservice
Pipelinemanagement
Cash-to-cashcycle time
Logisticsefficiency
Just-in-timelogistics
Assetdeploymentand utilization
Fig. 3.2 Logistics impact on ROI
LSCH_C03.QXD 12/11/04 12:04 pm Page 85

Cash and receivables
This component of current assets is crucial to the liquidity of the busi-ness. In recent years its importance has been recognized as morecompanies become squeezed for cash. It is not always recognized how-ever that logistics variables have a direct impact on this part of thebalance sheet. For example, the shorter the order cycle time, fromwhen the customer places the order to when the goods are delivered,the sooner the invoice can be issued. Likewise the order completionrate can affect the cash flow if the invoice is not issued until after thegoods are despatched. One of the less obvious logistics variables affect-ing cash and receivables is invoice accuracy. If the customer finds thathis invoice is inaccurate he is unlikely to pay and the payment lead timewill be extended until the problem is rectified.
Inventories
Fifty per cent or more of a company’s current assets will often be tiedup in inventory. Logistics is concerned with all inventory within thebusiness from raw materials, subassembly or bought-in components,through work-in-progress to finished goods. The company’s policies oninventory levels and stock locations will clearly influence the size of totalinventory. Also influential will be the extent to which inventory levels aremonitored and managed, and beyond that the extent to which strategiesare in operation that minimize the need for inventory.
LOGISTICS AND SUPPLY CHAIN MANAGEMENT
86
Current liabilities Purchase order quantities
Liabilities
Debt Financing options for inventory,plant and equipmentEquity
Inventories Inventory
Distribution facilities and equipmentProperty, plantand equipment Plant and equipment
Cash
Receivables
Order cycle time
Invoice accuracy
Order completion rate
Assets
Balance sheet Logistics variable
Fig. 3.3 Logistics management and the balance sheet
LSCH_C03.QXD 12/11/04 12:04 pm Page 86

Property, plant and equipment
The logistics system of any business will usually be a heavy user offixed assets. The plant, depots and warehouses that form the logisticsnetwork, if valued realistically on a replacement basis, will represent asubstantial part of total capacity employed (assuming that they areowned rather than rented or leased). Materials handling equipment,vehicles and other equipment involved in storage and transport canalso add considerably to the total sum of fixed assets. Many companieshave outsourced the physical distribution of their products partly tomove assets off their balance sheet. Warehouses, for example, withtheir associated storage and handling equipment represent a sizeableinvestment and the question should be asked: ‘Is this the most effectiveway to deploy our assets?’
Current liabilities
The current liabilities of the business are debts that must be paid incash within a specified period of time. From the logistics point of viewthe key elements are accounts payable for bought-in materials, compo-nents, etc. This is an area where a greater integration of purchasingwith operations management can yield dividends. The traditional con-cepts of economic order quantities can often lead to excessive levels ofraw materials inventory as those quantities may not reflect actual man-ufacturing or distribution requirements. The phasing of supplies tomatch the total logistics requirements of the system can be achievedthrough the twin techniques of materials requirement planning (MRP)and distribution requirements planning (DRP). If premature commit-ment of materials can be minimized this should lead to an improvedposition on current liabilities.
Debt/equity
Whilst the balance between debt and equity has many ramifications forthe financial management of the total business it is worth reflecting onthe impact of alternative logistics strategies. More companies are leasingplant facilities and equipment and thus converting a fixed asset into acontinuing expense. The growing use of ‘third-party’ suppliers for ware-housing and transport instead of owning and managing these facilitiesin-house is a parallel development. These changes obviously affect thefunding requirements of the business. They may also affect the means
3 MEASURING LOGISTICS COSTS AND PERFORMANCE
87
LSCH_C03.QXD 12/11/04 12:04 pm Page 87

whereby that funding is achieved, i.e. through debt rather than equity.The ratio of debt to equity, usually referred to as ‘gearing’ or ‘leverage’,will influence the return on equity and will also have implications forcash flow in terms of interest payments and debt repayment.
Logistics and shareholder value
One of the key measures of corporate performance today is share-holder value. In other words, what is the company worth to its owners?Increasingly senior management within the business is being driven bythe goal of enhancing shareholder value. There are a number of com-plex issues involved in actually calculating shareholder value but at itssimplest it is determined by the net present value of future cash flows.These cash flows may themselves be defined as:
Net operating incomeless
Taxesless
Working capital investmentless
Fixed capital investment=
After-tax free cash flow
More recently there has been a further development in that the conceptof economic value added (EVA) has become widely used and linked tothe creation of shareholder value. The term EVA originated with theconsulting firm Stern Stewart,2 although its origins go back to theeconomist Alfred Marshall who, over 100 years ago, developed theconcept of ‘economic income’.
Essentially EVA is the difference between operating income after taxesless the true cost of capital employed to generate those profits. Thus:
Economic value added (EVA)= Profit after tax – True cost of capital employed
It will be apparent that it is possible for a company to generate a nega-tive EVA. In other words, the cost of capital employed is greater thanthe profit after tax. The impact of a negative EVA, particularly if
LOGISTICS AND SUPPLY CHAIN MANAGEMENT
88
LSCH_C03.QXD 12/11/04 12:04 pm Page 88

sustained over a period of time, is to erode shareholder value. Equallyimprovements in EVA will lead to an enhancement of shareholdervalue. If the net present value of expected future EVAs were to be cal-culated this would generate a measure of wealth known as marketvalue added (MVA), which is a true measure of what the business isworth to its shareholders. A simple definition of MVA is:
Stock price × Issued sharesless
Book value of total capital invested=
Market value added
and, as we have already noted,
MVA = Net present value of expected future EVA
Clearly, it will be recognized that there are a number of significant con-nections between logistics performance and shareholder value. Notonly the impact that logistics service can have upon net operatingincome (profit) but also the impact on capital efficiency (asset turn).Many companies have come to realize the effect that lengthy pipelinesand highly capital-intensive logistics facilities can have on EVA andhence shareholder value. As a result they have focused on finding waysin which pipelines can be shortened and, consequently, working capitalrequirements reduced. At the same time they have looked again at theirfixed capital deployment of distribution facilities and vehicle fleets andin many cases have moved these assets off the balance sheet throughthe use of third-party logistics service providers.
The drivers of shareholder value
The five basic drivers of enhanced shareholder value are shown inFigure 3.4. They are revenue growth, operating cost reduction, fixedcapital efficiency, working capital efficiency and tax minimization. Allfive of these drivers are directly and indirectly affected by logisticsmanagement and supply chain strategy.
3 MEASURING LOGISTICS COSTS AND PERFORMANCE
89
LSCH_C03.QXD 12/11/04 12:04 pm Page 89

Revenue growth
The critical linkage here is the impact that logistics service can have onsales volume and customer retention. Whilst it is not generally possibleto calculate the exact correlation between service and sales there havebeen many studies that have indicated a positive causality.
It can also be argued that superior logistics service (in terms of relia-bility and responsiveness) can strengthen the likelihood that customerswill remain loyal to a supplier. In Chapter 2 it was suggested thathigher levels of customer retention lead to greater sales. Typically thisoccurs because satisfied customers are more likely to place a greaterproportion of their purchases with that supplier.
Operating cost reduction
The potential for operating cost reduction through logistics and supplychain management is considerable. Because a large proportion of costsin a typical business are driven by logistics decisions and the quality ofsupply chain relationships, it is not surprising that in the search forenhanced margins many companies are taking a new look at the waythey manage the supply chain.
It is not just the transportation, storage, handling and order processingcosts within the business that need to be considered. Rather a totalpipeline view of costs on a true ‘end-to-end’ basis should be taken. Oftenthe upstream logistics costs can represent a significant proportion of totalsupply chain costs embedded in the final product.
LOGISTICS AND SUPPLY CHAIN MANAGEMENT
90
Shareholdervalue
Revenuegrowth
Taxminimization
Fixed capitalefficiency
Working capitalefficiency
Operating costreduction
Fig. 3.4 The drivers of shareholder value
LSCH_C03.QXD 12/11/04 12:04 pm Page 90

There is also a growing recognition that time compression in thesupply chain not only enhances customer service but can also reducecosts through the reduction of non-value-adding activities. This is anissue that we shall return to in Chapter 5.
Fixed capital efficiency
Logistics by its very nature tends to be fixed asset ‘intensive’. Trucks, dis-tribution centres and automated handling systems involve considerableinvestment and, consequently, will often depress return on investment. Inconventional multi-echelon distribution systems, it is not unusual to findfactory warehouses, regional distribution centres and local depots, all ofwhich represent significant fixed investment.
One of the main drivers behind the growth of the third-party logisticsservice sector has been the desire to reduce fixed asset investment. At thesame time the trend to lease rather than buy has accelerated. Decisions torationalize distribution networks and production facilities are increas-ingly being driven by the realization that the true cost of financing thatcapital investment is sometimes greater than the return it generates.
Working capital efficiency
Supply chain strategy and logistics management are fundamentallylinked to the working capital requirement within the business. Longpipelines by definition generate more inventory; order fill and invoiceaccuracy directly impact accounts receivable and procurement policiesalso affect cash flow. Working capital requirements can be dramaticallyreduced through time compression in the pipeline and subsequentlyreduced order-to-cash cycle times.
Surprisingly few companies know the true length of the pipeline forthe products they sell. The ‘cash-to-cash’ cycle time (i.e. the elapsedtime from procurement of materials/components through to sale of thefinished product) can be six months or longer in many manufacturingindustries. By focusing on eliminating non-value-adding time in thesupply chain, dramatic reduction in working capital can be achieved.So many companies have lived with low inventory turns for so longthat they assume that it is a feature of their industry and that nothingcan be done. They are also possibly not motivated to give working cap-ital reduction a higher priority because an unrealistically low cost ofcapital is being employed.
3 MEASURING LOGISTICS COSTS AND PERFORMANCE
91
LSCH_C03.QXD 12/11/04 12:04 pm Page 91

Tax minimization
In today’s increasingly global economy organizations have choices as towhere they can locate their assets and activities. Because tax regimes aredifferent country by country, location decisions can have an importantimpact on after-tax free cash flow. It is not just corporate taxes on profitsthat are affected, but also property tax and excise duty on fuel. Customsregulations, tariffs and quotas become further considerations, as do rulesand regulation on transfer pricing. For large global companies with pro-duction facilities in many different countries and with disperseddistribution centres and multiple markets, supply chain decisions can sig-nificantly affect the total tax bill and hence shareholder value.
The role of cash flow in creating shareholder value
There is general agreement with the view of Warren Buffet3 that ulti-mately the value of a business to its owners is determined by the netpresent value of the free cash flow occurring from its operations overits lifetime. Thus the challenge to managers seeking to enhance share-holder value is to identify strategies that can directly or indirectly affectfree cash flow. Srivastava et al.4 have suggested that the value of anystrategy is inherently driven by:
1. An acceleration of cash flows because risk and time adjustmentsreduce the value of later cash flows;
2. An increase in the level of cash flows (e.g. higher revenues and/orlower costs, working capital and fixed investment);
3. A reduction in risk associated with cash flows (e.g. through reduc-tion in both volatility and vulnerability of future cash flows) andhence, indirectly, the firm’s cost of capital; and
4. The residual value of the business (long-term value can be enhanced,for example, by increasing the size of the customer base).
In effect, what Srivastava et al. are suggesting is that strategies shouldbe evaluated in terms of how they either enhance or accelerate cashflow. Those strategic objectives can be graphically expressed as a cumu-lative distribution of free cash flow over time (see Figure 3.5) with theobjective of building a greater cumulative cash flow, sooner. Obviouslythe sooner cash is received and the greater the amount then the greaterwill be the net present value of those cash flows.
LOGISTICS AND SUPPLY CHAIN MANAGEMENT
92
LSCH_C03.QXD 12/11/04 12:04 pm Page 92

An example of the impact that logistics issues can have on the financialperformance of a company is provided by the comparison of twoNorth American retailers, Wal-Mart and Kmart.
3 MEASURING LOGISTICS COSTS AND PERFORMANCE
93
Time
Cas
h flo
w
Enhancingcash flow
Acceleratingcash flow
Fig. 3.5 Changing the cash flow profileSource: Srivastava et al.5
Wal-Mart and Kmart
In 2002 five general merchandise retailers – Wal-Mart, Kmart, Target,Costco and Sears – accounted for 60 per cent of US sales in thatsector.1 Wal-Mart was the undisputed market and cost leader and themain innovator in North American retailing. It was the first to intro-duce the ‘big box’ retail format and flexible cross-trained employeeswho could work in more than one department. Historically Wal-Martalso led the way with aggressive investment in IT. Back in the 1960s itwas one of the first to use computers to track inventory and was anearly adopter of bar-codes technology in the 1980s. In 1983 it wasreported that Wal-Mart was spending only 2 cents in the sales dollaron getting goods into the stores, while its long-established competitorKmart was spending 5 cents per dollar on the same activities.2
Wal-Mart subsequently became a classic case study for supply chainmanagement programmes, due to its use of Electronic Data Interchange(EDI) to improve co-ordination with suppliers. Technological innova-tions were coupled with a strategy that exploited economies of scale inpurchasing and logistics, and gradually expanded operations aroundcentral distribution centres. By 1987 it enjoyed a 9 per cent market
▼
LSCH_C03.QXD 12/11/04 12:04 pm Page 93

LOGISTICS AND SUPPLY CHAIN MANAGEMENT
94
share, but was 40 per cent more productive than its competitors asmeasured by sales per employee.
The introduction soon afterwards of wireless scanning guns and theRetail Link Program, which captures sales data giving real-time visibilityof stock holding and sales patterns, were just two more technologicalinnovations that boosted capital and labour productivity. They facili-tated more effective micro-merchandising campaigns as well asimproved inventory management, allowing a better overall value propo-sition for customers, not least from significant cost savings, which werepassed on to customers in the form of ‘every day low prices’.
By 1995 Wal-Mart had increased its market share to 27 per centand widened the gap on productivity to 48 per cent. Other retailersadopted many of the same practices and technological solutions toimprove their own performance. Nevertheless, Wal-Mart maintained acommanding lead, improving its own performance by an additional22 per cent in the four years to 1999. Wal-Mart’s sales per employeeleapt from $148,000 to $181,000 between 1995 and 1999. Kmart, fordecades the dominant force in general merchandise retailing, onlymanaged to improve its own performance from $109,000 to $133,000over the same period.
In sharp contrast to Wal-Mart, Kmart had been losing favour withUS shoppers for years. Poor in-store presentation and unhelpful staffhad eroded customer satisfaction, as had promotional flyers advertis-ing cut-price products that were often missing from the shelves.Sometimes the stock was simply unavailable, while other times it wason site but had been left to linger in the back of the stores before beingunpacked and logged on the central tracking system.
Kmart had tried to challenge Wal-Mart on ever more competitivepromotional pricing, but its supply chain lacked the co-ordination torespond to the demand volatility the promotions induced. Its on-shelfavailability had dropped to 86 per cent, while massively bloated stocksof seasonal items filled its warehouses long after the appropriate salesperiod had passed. The result was that while Wal-Mart enjoyed astock-turn of 7.3 in 2000, Kmart could only manage 3.6 turns.
In September 2001 Kmart’s Chief Executive issued a statementadmitting that: ‘I believe the supply chain is really the Achilles heel ofKmart. Just fixing the supply chain could really turbo-charge Kmart.’3
▼
LSCH_C03.QXD 12/11/04 12:04 pm Page 94

Logistics cost analysis
After a century or more of reliance upon traditional cost accounting pro-cedures to provide an often unreliable insight into profitability, managersare now starting to question the relevance of these methods.6 Theaccounting frameworks still in use by the majority of companies todayrely upon arbitrary methods for the allocation of shared and indirectcosts and hence frequently distort the true profitability of both productsand customers. Indeed, as we shall see, these traditional accounting meth-ods are often quite unsuited for analyzing the profitability of customersand markets since they were originally devised to measure product costs.
Because logistics management is aflow-oriented concept with the objec-tive of integrating resources across apipeline which extends from suppli-ers to final customers, it is desirableto have a means whereby costs andperformance of that pipeline flowcan be assessed.
3 MEASURING LOGISTICS COSTS AND PERFORMANCE
95
Efforts to ‘just fix’ the supply chain involved the introduction of point-of-sale systems a month earlier and followed a two-year $1.7bn ITupgrade, plus $70m spent on the introduction of hand-held scannersin 2000. The investment was too little too late.
Wal-Mart had spent $4bn on its supply chain system and thenforced suppliers to invest a further $40bn in their supply chain opera-tions. The suppliers had no choice other than to adopt the toolsrequired to drive their own costs down further. Kmart had no chanceof matching that level of performance. Its sales per square foot were bythen only $227, almost half of Wal-Mart’s $446.
The impact of the difference in performance of the two companies’supply chains has been dramatic. In January 2002 Kmart became thelargest company, ever to file for Chapter 11 bankruptcy. Wal-Mart, theworld’s largest company, continues to prosper.
References1. Johnson, B.C. ‘Retail: The Wal-Mart effect’, McKinsey Quarterly, No. 1, 2002. 2. Simpson, L. ‘No so Special K’, Supply Management, 2 March 2002, pp. 22–25.3. Ibid.
Because logistics management is aflow-oriented concept with the
objective of integrating resourcesacross a pipeline which extends
from suppliers to final customers, itis desirable to have a means
whereby costs and performance ofthat pipeline flow can be assessed.
LSCH_C03.QXD 12/11/04 12:04 pm Page 95

Probably one of the main reasons why the adoption of an integratedapproach to logistics and distribution management has proved so diffi-cult for many companies is the lack of appropriate cost information.The need to manage the total distribution activity as a completesystem, having regard for the effects of decisions taken in one cost areaupon other cost areas, has implications for the cost accounting systemsof the organization. Typically, conventional accounting systems groupcosts into broad, aggregated categories which do not then allow themore detailed analysis necessary to identify the true costs of servicingcustomers buying particular product mixes. Without this facility toanalyze aggregated cost data, it becomes impossible to reveal thepotential for cost trade-offs that may exist within the logistics system.
Generally the effects of trade-offs are assessed in two ways: from thepoint of view of their impact on total costs and their impact on sales rev-enue. For example, it may be possible to trade-off costs in such a waythat total costs increase, yet because of the better service now beingoffered, sales revenue also increases. If the difference between revenueand costs is greater than before, the trade-off may be regarded as leadingto an improvement in cost effectiveness. However, without an adequatelogistics-oriented cost accounting system it is extremely difficult to iden-tify the extent to which a particular trade-off is cost-beneficial.
The concept of total cost analysis
Many problems at the operational level in logistics management arisebecause all the impacts of specific decisions, both direct and indirect,are not taken into account throughout the corporate system. Too oftendecisions taken in one area can lead to unforeseen results in otherareas. Changes in policy on minimum order value, for example, mayinfluence customer ordering patterns and lead to additional costs.Similarly, changes in production schedules that aim to improve produc-tion efficiency may lead to fluctuations in finished stock availabilityand thus affect customer service.
The problems associated with identifying the total system impact ofdistribution policies are immense. By its very nature logistics cutsacross traditional company organization functions with cost impactson most of those functions. Conventional accounting systems do not
LOGISTICS AND SUPPLY CHAIN MANAGEMENT
96
LSCH_C03.QXD 12/11/04 12:04 pm Page 96
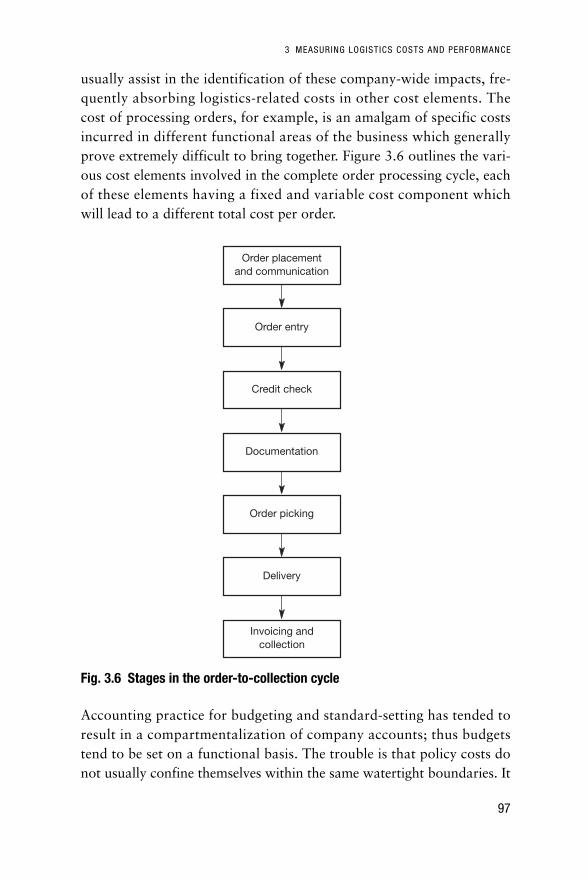
usually assist in the identification of these company-wide impacts, fre-quently absorbing logistics-related costs in other cost elements. Thecost of processing orders, for example, is an amalgam of specific costsincurred in different functional areas of the business which generallyprove extremely difficult to bring together. Figure 3.6 outlines the vari-ous cost elements involved in the complete order processing cycle, eachof these elements having a fixed and variable cost component whichwill lead to a different total cost per order.
Accounting practice for budgeting and standard-setting has tended toresult in a compartmentalization of company accounts; thus budgetstend to be set on a functional basis. The trouble is that policy costs donot usually confine themselves within the same watertight boundaries. It
3 MEASURING LOGISTICS COSTS AND PERFORMANCE
97
Order placementand communication
Order entry
Credit check
Documentation
Order picking
Delivery
Invoicing andcollection
Fig. 3.6 Stages in the order-to-collection cycle
LSCH_C03.QXD 12/11/04 12:04 pm Page 97

is the nature of logistics that, like a stone thrown into a pond, the effectsof specific policies spread beyond their immediate area of impact.
A further feature of logistics decisions that contributes to the com-plexity of generating appropriate cost information is that they areusually taken against a background of an existing system. The purposeof total cost analysis in this context is to identify the change in costsbrought about by these decisions. Cost must therefore be viewed inincremental terms – the change in total costs caused by the change tothe system. Thus the addition of an extra warehouse to the distributionnetwork will bring about cost changes in transport, inventory invest-ment and communications. It is the incremental cost difference betweenthe two options that is the relevant accounting information for decisionmaking in this case. Figure 3.7 shows how total logistics costs can beinfluenced by the addition, or removal, of a depot from the system.
LOGISTICS AND SUPPLY CHAIN MANAGEMENT
98
Cos
ts
Number of outlets
Totaldistributioncosts
Trunkingcosts
Inventorycosts
Outlet costs
Local deliverycosts
Orderprocessing costs
Fig. 3.7 The total costs of a distribution network
LSCH_C03.QXD 12/11/04 12:04 pm Page 98

Principles of logistics costing
It will be apparent from the previous comments that the problem ofdeveloping an appropriate logistics-oriented costing system is primarilyone of focus. That is the ability to focus upon the output of the distrib-ution system, in essence the provision of customer service, and toidentify the unique costs associated with that output. Traditionalaccounting methods lack this focus, mainly because they were designedwith something else in mind.
One of the basic principles of logistics costing, it has been argued, isthat the system should mirror the materials flow, i.e. it should becapable of identifying the costs that result from providing customerservice in the marketplace. A second principle is that it should be capa-ble of enabling separate cost and revenue analyses to be made bycustomer type and by market segment or distribution channel. Thislatter requirement emerges because of the dangers inherent in dealingsolely with averages, e.g. the average cost per delivery, since they canoften conceal substantial variations either side of the mean.
To operationalize these principles requires an ‘output’ orientation tocosting. In other words, we must first define the desired outputs of thelogistics system and then seek to identify the costs associated with pro-viding those outputs. A useful concept here is the idea of ‘mission’. Inthe context of logistics, a mission is a set of customer service goals to
3 MEASURING LOGISTICS COSTS AND PERFORMANCE
99
Purchasing
Production
Sales
Marketing
Transportation
Etc
Distributionmission A
Distributionmission B
Distributionmission C
Fig. 3.8 Logistics missions that cut across functional boundaries
LSCH_C03.QXD 12/11/04 12:04 pm Page 99

be achieved by the system within a specific product/market context.Missions can be defined in terms of the type of market served, bywhich products and within what constraints of service and cost. A mis-sion by its very nature cuts across traditional company lines. Figure 3.8illustrates the concept and demonstrates the difference between an‘output’ orientation based upon missions and the ‘input’ orientationbased upon functions.
The successful achievement of defined mission goals involves inputsfrom a large number of functional areas and activity centres within thefirm. Thus an effective logistics costing system must seek to determinethe total systems cost of meeting desired logistic objectives (the ‘output’of the system) and the costs of the various inputs involved in meetingthese outputs. Interest has been growing in an approach to this prob-lem, known as ‘mission costing’.7
Figure 3.9 illustrates how three distribution missions may make adifferential impact upon activity centre/functional area costs and, in sodoing, provide a logical basis for costing within the company. As a costor budgeting method, mission costing is the reverse of traditional tech-niques: under this scheme a functional budget is determined now by thedemands of the missions it serves. Thus in Figure 3.9 the cost per mis-sion is identified horizontally and from this the functional budgets maybe determined by summing vertically.
Given that the logic of mission costing is sound, how might it bemade to work in practice? This approach requires firstly that theactivity centres associated with a particular distribution mission beidentified, e.g. transport, warehousing, inventory, etc., and secondlythat the incremental costs for each activity centre incurred as a resultof undertaking that mission must be isolated. Incremental costs areused because it is important not to take into account ‘sunk’ costs orcosts that would still be incurred even if the mission were abandoned.We can make use of the idea of ‘attributable costs’8 to operationalizethe concept:
Attributable cost is a cost per unit that could be avoided if a productor function were discontinued entirely without changing the sup-porting organization structure.
LOGISTICS AND SUPPLY CHAIN MANAGEMENT
100
LSCH_C03.QXD 12/11/04 12:04 pm Page 100

In determining the costs of an activity centre, e.g. transport, attribut-able to a specific mission, the question should be asked: ‘What costswould we avoid if this customer/segment/channel were no longer ser-viced?’ These avoidable costs are the true incremental costs of servicingthe customer/segment/channel. Often they will be substantially lowerthan the average cost because so many distribution costs are fixedand/or shared. For example, a vehicle leaves a depot in London tomake deliveries in Nottingham and Leeds. If those customers inNottingham were abandoned, but those in Leeds retained, what wouldbe the difference in the total cost of transport? The answer would be –not very much, since Leeds is further north from London thanNottingham. However, if the customers in Leeds were dropped, but notthose in Nottingham, there would be a greater saving of costs becauseof the reduction in miles travelled.
This approach becomes particularly powerful when combined with acustomer revenue analysis, because even customers with low sales off-take may still be profitable in incremental costs terms if not on anaverage cost basis. In other words the company would be worse off ifthose customers were abandoned.
Such insights as this can be gained by extending the mission costingconcept to produce profitability analyses for customers, market seg-ments or distribution channels. The term ‘customer profitability
3 MEASURING LOGISTICS COSTS AND PERFORMANCE
101
Functionalarea/
Activity centre1
100
50
70
220
Functionalarea/
Activity centre2
90
70
30
190
Functionalarea/
Activity centre3
20
200
50
270
Functionalarea/
Activity centre4
80
20
70
170
Totalmission
cost
290
340
220
850
Mission A
Mission B
Mission C
Activity centreinputs
Fig. 3.9 The programme budget (£’000)
LSCH_C03.QXD 12/11/04 12:04 pm Page 101

accounting’ describes any attempt to relate the revenue produced by acustomer, market segment or distribution channel to the costs of servic-ing that customer/segment/channel. The principles of customerprofitability accounting will be explored in detail later in this chapter.
The cost of holding inventory
As we noted, there are many costs incurred in the total logistics processof converting customer orders into cash. However, one of the largestcost elements is also the one that is perhaps least well accounted forand that is inventory. Is it probably the case that many managers areunaware of what the true cost of holding inventory actually is. If all thecosts that arise as a result of holding inventory are fully accounted for,then the real holding cost of inventory is probably in the region of25 per cent per annum of the book value of the inventory.
The reason this figure is as high as it is is that there are a number ofcosts to be included. The largest cost element will normally be the costof capital. The cost of capital comprises the cost to the company ofdebt and the cost of equity. It is usual to use the weighted cost of capi-tal to reflect this. Hence, even though the cost of borrowed moneymight be low, the expectation of shareholders as to the return they arelooking for from the equity investment could be high.
The other costs that need to be included in the inventory holdingcost are the costs of storage and handling, obsolescence, deteriorationand pilferage, as well as insurance and all the administrative costs asso-ciated with the management of the inventory (see box).
LOGISTICS AND SUPPLY CHAIN MANAGEMENT
102
■ The true cost of inventory ■
● Cost of capital● Storage and handling● Obsolescence● Damage and deterioration● Pilferage/shrinkage● Insurance● Management costs
LSCH_C03.QXD 12/11/04 12:04 pm Page 102

Customer profitability analysis
One of the basic questions that conventional accounting procedureshave difficulty answering is: ‘How profitable is this customer comparedto another?’ Usually customer profitability is only calculated at thelevel of gross profit – in other words the net sales revenue generated bythe customer in a period, less the cost of goods sold for the actual prod-uct mix purchased. However, there are still many other costs to takeinto account before the real profitability of an individual customer canbe exposed. The same is true if we seek to identify the relative prof-itability of different market segments or distribution channels.
The significance of these costs that occur as a result of servicing cus-tomers can be profound in terms of how logistics strategies should bedeveloped. Firstly, customer profitability analysis will often reveal aproportion of customers who make a negative contribution, as inFigure 3.10. The reason for this is very simply that the costs of servic-ing a customer can vary considerably – even between two customerswho may make equivalent purchases from us.
3 MEASURING LOGISTICS COSTS AND PERFORMANCE
103
110
100
90
80
70
60
50
40
30
20
10
0 10 20 30 40 50 60 70 80 90 100
Cumulative customers (%)
Cum
ulat
ive
cont
ribut
ion
(%)
0
Figure 3.10 Customer profitability analysisSource: Hill, G.V., Logistics – The Battleground of the 1990s, A.T. Kearney.
LSCH_C03.QXD 12/11/04 12:04 pm Page 103

If we think of all the costs that a company incurs from when it captures anorder from a customer to when it collects the payment, is will be apparentthat the total figure could be quite high. It will also very likely be the casethat there will be significant differences in these costs customer by cus-tomer. At the same time, different customers will order a different mix ofproducts so the gross margin that they generate will differ.
As Table 3.1 highlights, there are many costs that need to be identi-fied if customer profitability is to be accurately measured.
The best measure of customer profitability is to ask the question:‘What costs would I avoid and what revenues would I lose if I lost thiscustomer?’ This is the concept of ‘avoidable’ costs and incremental rev-enue. Using this principle helps circumvent the problems that arisewhen fixed costs are allocated against individual customers.
LOGISTICS AND SUPPLY CHAIN MANAGEMENT
104
Table 3.1 The customer profit and loss account
Revenues ● Net sales valueLessCosts ● Cost of sales (actual product mix)(attributable costs only) ● Commissions
● Sales calls● Key account management time● Trade bonuses and special discount● Order processing costs● Promotional costs (visible and hidden)● Merchandising costs● Non-standard packaging/unitization● Dedicated inventory holding costs● Dedicated warehouse space● Materials handling costs● Transport costs● Documentation/communications costs● Returns/refusals● Trade credit (actual payment period)
LSCH_C03.QXD 12/11/04 12:04 pm Page 104

What sort of costs should be taken into account in this type of analysis?Figure 3.11 presents a basic model that seeks to identify only those cus-tomer-related costs that are avoidable (i.e. if the customer did not exist,these costs would not be incurred).
The starting point is the gross sales value of the order from which isthen subtracted the discounts that are given on that order to the customer.This leaves the net sales value from which must be taken the direct pro-duction costs or cost of goods sold. Indirect costs are not allocated unlessthey are fully attributable to that customer. The same principle applies tosales and marketing costs as attempts to allocate indirect costs, such asnational advertising, can only be done on an arbitrary and usuallymisleading basis. The attributable distribution costs can then be assignedto give customer gross contribution. Finally any other customer-relatedcosts, such as trade credit, returns, etc., are subtracted to give a net
3 MEASURING LOGISTICS COSTS AND PERFORMANCE
105
■ The average customer ■
A study by the consulting company A.T. Kearney suggested that the signifi-cance of customer-oriented costs is not their average value, but specificallyhow they vary by customer, by order size, by type of order and other keyfactors. Whilst the average cost per customer may be easily calculated,there may be no customer that incurs the average cost to serve. The need isto be aware of the customers at the extremes of the cost range because, onthe one hand, profits may be eroded by serving them and, on the other,although high profit is being generated, the business is vulnerable to com-petitive price-cutting. The table below shows an example of the range ofvalues of some customer-oriented costs expressed as a percentage of netsales. This illustrates how misleading the use of averages can be.
Customer costs as a % of net sales
Low Average High
Order processing 0.2 2.6 7.4Inventory carrying 1.1 2.6 10.2Picking and shipping 0.3 0.7 2.5Outbound freight 2.8 7.1 14.1Commissions 2.4 3.1 4.4
Source: Hill, G.V. and Harland, D.V., ‘The Customer Profit Centre’, Focus, Institute of Logistics and Distribution Management, Vol. 2,
No. 2, 1983.
LSCH_C03.QXD 12/11/04 12:04 pm Page 105

LOGISTICS AND SUPPLY CHAIN MANAGEMENT
106
Gross salesvalue (GSV)
Net salesvalue (NSV)
Trade discount/Terms of trade
Productioncosts
Productioncontribution
Direct
Indirect
Customer-relatedcosts (direct)
• Sales calls• In-store and co-operative promotions• Bonuses• Merchandising
Overhead costs(indirect)
• Sales force management• National advertising campaign
Customer-relatedcosts (direct)
• Transportation• Packaging/ unitization• Stock holding• Warehousing• Trade credit• Order processing
(Sales)Marketing costs
Marketingcontribution
Distributionservice costs
Customergross
profitability
Customercontributionto company
overhead profit
Fig. 3.11 Customer profitability analysis: a basic modelSource: Gattorna, J.L. and Walters, D.W., Managing the Supply Chain: A Strategic Perspective, Macmillan Press, 1996.
LSCH_C03.QXD 12/11/04 12:04 pm Page 106

contribution to overheads and profit. Often the figure that emerges as the‘bottom line’ can be revealing as shown, in Table 3.2.
In this case a gross contribution of £70,000 becomes a net contributionof £56,400 as soon as the costs unique to this customer are taken intoaccount. If the analysis were to be extended by attempting to allocateoverheads (a step not to be advised because of the problems usuallyassociated with such allocation), what might at first seem to be a prof-itable customer could be deemed to be the reverse. However, as long asthe net contribution is positive and there is no ‘opportunity cost’ in ser-vicing that customer the company would be better off with the businessthan without it.
3 MEASURING LOGISTICS COSTS AND PERFORMANCE
107
Table 3.2 Analysis of revenue and cost for a specific customer
£ £
Gross sales value 100,000Less discount 10,000
Net sales value 90,000Less direct cost of goods sold 20,000
Gross contribution 70,000Less sales and marketing costs:Sales calls 3,000Co-operative promotions 1,000Merchandising 3,000
––––––7,000
63,000Less distribution costs:
Order processing 500Storage and handling 600Inventory financing 700Transport 2,000Packaging 300Refusals 500
––––––4,600
Customer gross contribution 58,400Less other customer-related costs:Credit financing 1,500Returns 500
––––––2,000
Customer net contribution 56,400
LSCH_C03.QXD 12/11/04 12:04 pm Page 107

The value of this type of exercise can be substantial. The informationcould be used, firstly, when the next sales contract is negotiated and,secondly, as the basis for sales and marketing strategy in directingeffort away from less profitable types of account towards more prof-itable business. More importantly it can point the way to alternativestrategies for managing customers with high servicing costs. Ideally werequire all our customers to be profitable in the medium to long termand where customers currently are profitable we should seek to buildand extend that profitability further.
Figure 3.12 represents a simple categorization of customers along twodimensions: their total net sales value during the period and their cost-to-serve. The suggestion is that there could be a benefit in developingcustomer-specific solutions depending upon which box of the matrixthey fall into. Possible strategies for each of the quadrants are sug-gested below.
Build
These customers are relatively cheap to service but their net sales valueis low. Can volume be increased without a proportionate increase inthe costs of service? Can our sales team be directed to seek to influencethese customers’ purchases towards a more profitable sales mix?
LOGISTICS AND SUPPLY CHAIN MANAGEMENT
108
Protect
Build
Costengineer
Dangerzone
Low High
Hig
hLo
w
Net
sal
es v
alue
of c
usto
mer
acc
ount
Cost of service
Fig. 3.12 Customer profitability matrix
LSCH_C03.QXD 12/11/04 12:04 pm Page 108

Danger zone
These customers should be looked at very carefully. Is there any medium-to long-term prospect either of improving net sales value or of reducingthe costs of service? Is there a strategic reason for keeping them? Do weneed them for their volume even if their profit contribution is low?
Cost engineer
These customers could be more profitable if the costs of servicing themcould be reduced. Is there any scope for increasing drop sizes? Candeliveries be consolidated? If new accounts in the same geographic areawere developed would it make delivery more economic? Is there acheaper way of gathering orders from these customers, e.g. the Internet.
Protect
The high net sales value customers who are relatively cheap to serviceare worth their weight in gold. The strategy for these customers shouldbe to seek relationships which make the customer less likely to want tolook for alternative suppliers. At the same time we should constantlyseek opportunities to develop the volume of business that we do withthem whilst keeping strict control of costs.
Ideally the organization should seek to develop an accounting systemthat would routinely collect and analyze data on customer profitability.Unfortunately most accounting systems are product focused ratherthan customer focused. Likewise cost reporting is traditionally on afunctional basis rather than a customer basis. So, for example, weknow the costs of the transport function as a whole or the costs ofmaking a particular product but what we do not know are the costsof delivering a specific mix of product to a particular customer.
There is a pressing need for companies to move towards a system ofaccounting for customers and marketing as well as accounting forproducts. As has often been observed, it is customers who make prof-its, not products!
Direct product profitability
An application of logistics cost analysis that has gained widespreadacceptance, particularly in the retail industry, is a technique known asdirect product profitability – or more simply ‘DPP’. In essence it is
3 MEASURING LOGISTICS COSTS AND PERFORMANCE
109
LSCH_C03.QXD 12/11/04 12:04 pm Page 109

somewhat analogous to customer profitability analysis in that itattempts to identify all the costs that attach to a product or an order asit moves through the distribution channel.
The idea behind DPP is that in many transactions the customer willincur costs other than the immediate purchase price of the product.Often this is termed the total cost of ownership. Sometimes these costswill be hidden and often they can be substantial – certainly big enoughto reduce or even eliminate net profit on a particular item.
For the supplier it is important to understand DPP inasmuch as hisability to be a low-cost supplier is clearly influenced by the costs thatare incurred as that product moves through his logistics system.Similarly, as distributors and retailers are now very much more con-scious of an item’s DPP, it is to the advantage of the supplier equally tounderstand the cost drivers that impact upon DPP so as to seek toinfluence it favourably.
Table 3.3 describes the steps to be followed in moving from a crudegross margin measure to a more precise DPP.
LOGISTICS AND SUPPLY CHAIN MANAGEMENT
110
Table 3.3 Direct product profit (DPP)
The net profit contribution from the sales of a product after allowancesare added and all costs that can be rationally allocated or assigned to anindividual product are subtracted = direct product profit.
Sales– Cost of goods sold= Gross margin+ Allowances and discounts= Adjusted gross margin
– Warehouse costsLabour (labour model – case, cube, weight)Occupancy (space and cube)Inventory (average inventory)
– Transportation costs (cube)
– Retail costsStocking labourFront end labourOccupancyInventory
= Direct product profit
LSCH_C03.QXD 12/11/04 12:04 pm Page 110

The importance to the supplier of DPP is based on the proposition thata key objective of customer service strategy is ‘to reduce the customer’scosts of ownership’. In other words the supplier should be looking athis products and asking the question: ‘How can I favourably influencethe DPP of my customers by changing either the characteristics of theproducts I sell, or the way I distribute them?’
From pack design onwards there are a number of elements that themanufacturer or supplier may be able to vary in order to influenceDPP/square metre in a positive way, for example, changing the casesize, increasing the delivery frequency, direct store deliveries, etc.
Cost drivers and activity-based costing
As we indicated earlier in this chapter there is a growing dissatisfactionwith conventional cost accounting, particularly as it relates to logisticsmanagement. Essentially these problems can be summarized as follows:
● There is a general ignorance of the true costs of servicing differentcustomer types/channels/market segments.
● Costs are captured at too high a level of aggregation.● Full cost allocation still reigns supreme.● Conventional accounting systems are functional in their orientation
rather than output oriented.● Companies understand product costs but not customer costs.
The common theme that links these points is that we seem to suffer inbusiness from a lack of visibility of costs as they are incurred through thelogistics pipeline. Ideally what logistics management requires is a meansof capturing costs as products and orders flow towards the customer.
To overcome this problem it is necessary to change radically the basisof cost accounting away from the notion that all expenses must be allo-cated (often on an arbitrary basis) to individual units (such as products)and, instead, to separate the expenses and match them to the activitiesthat consume the resources. One approach that can help overcome thisproblem is ‘activity-based costing’.9 The key to activity-based costing(ABC) is to seek out the ‘cost drivers’ along the logistics pipeline thatcause costs because they consume resources. Thus, for example, if weare concerned to assign the costs of order picking to orders then in the
3 MEASURING LOGISTICS COSTS AND PERFORMANCE
111
LSCH_C03.QXD 12/11/04 12:04 pm Page 111

past this may have been achieved by calculating an average cost perorder. In fact an activity-based approach might suggest that it is thenumber of lines on an order that consume the order picking resourceand hence should instead be seen as the cost driver. Table 3.4 contraststhe ABC approach with the traditional method.
The advantage of using activity-based costing is that it enables eachcustomer’s unique characteristics in terms of ordering behaviour anddistribution requirements to be separately accounted for. Once the costattached to each level of activity is identified (e.g. cost per line itempicked, cost per delivery, etc.) then a clearer picture of the true cost-to-serve will emerge. Whilst ABC is still strictly a cost allocation method ituses a more logical basis for that allocation than traditional methods.
There are certain parallels between activity-based costing and the ideaof mission costing introduced earlier in this chapter. Essentiallymission costing seeks to identify the unique costs that are generated asa result of specific logistics/customer service strategies aimed at tar-geted market segments. The aim is to establish a better matching ofthe service needs of the various markets that the company addresseswith the inevitably limited resources of the company. There is littlepoint in committing incremental costs where the incremental benefitsdo not justify the expenditure.
LOGISTICS AND SUPPLY CHAIN MANAGEMENT
112
Table 3.4 Activity-based costing vs traditional cost bases
Traditional cost bases £000s Activity cost bases £000s Cost drivers
Salaries 550 Sales order processing 300 Number of ordersWages 580 Holding inventory 600 Value of shipmentDepreciation 250 Picking 300 Number of order linesRent/electricity/ Packing/assembly
telephone 700 of orders 100 Number of order linesMaintenance 100 Loading 200 WeightFuel 200 Transportation 500 Location of customer
Delivery at customer 200 Number of dropsSolving problems 380 Number of order lines
£2,380 £2,580
Source: Based upon Simmons, G. and Steeple, D., ‘Overhead Recovery – It’s as Easy as ABC’, Focus, Institute of Logistics and Distribution
Management, Vol. 10, No. 8, October 1991.
LSCH_C03.QXD 12/11/04 12:04 pm Page 112

There are four stages in the implementation of an effective missioncosting process:
1. Define the customer service segmentUse the methodology described in Chapter 2 to identify the differentservice needs of different customer types. The basic principle is thatbecause not all customers share the same service requirements andcharacteristics they should be treated differently.
2. Identify the factors that produce variations in the cost of serviceThis step involves the determination of the service elements that willdirectly or indirectly impact upon the costs of service, e.g. the prod-uct mix, the delivery characteristics such as drop size and frequencyor incidence of direct deliveries, merchandising support, specialpacks and so on.
3. Identify the specific resources used to support customer segmentsThis is the point at which the principles of activity-based costing andmission costing coincide. The basic tenet of ABC is that the activitiesthat generate cost should be defined and the specific cost driversinvolved identified. These may be the number of lines on an order,the people involved, the inventory support or the delivery frequency.
4. Attribute activity costs by customer type or segmentUsing the principle of ‘avoidability’ the incremental costs incurredthrough the application of a specific resource to meeting serviceneeds are attributed to customers. It must be emphasized that this isnot cost allocation but cost attribution. In other words it is becausecustomers use resources that the appropriate share of cost is attrib-uted to them.
Clearly to make this work there is a prerequisite that the cost codingsystem in the business be restructured. In other words, the codingsystem must be capable of gathering costs as they are incurred by cus-tomers from the point of order generation through to final delivery,invoicing and collection.
The basic purpose of logistics cost analysis is to provide managerswith reliable information that will enable a better allocation ofresources to be achieved. Given that logistics management, as we haveobserved, ultimately is concerned to meet customer service require-ments in the most cost-effective way, then it is essential that thoseresponsible have the most accurate and meaningful data possible.
3 MEASURING LOGISTICS COSTS AND PERFORMANCE
113
LSCH_C03.QXD 12/11/04 12:04 pm Page 113

Summary
Because logistics costs can account for such a large proportion of totalcosts in the business it is critical that they be carefully managed.However, it is not always the case that the true costs of logistics are fullyunderstood. Traditional approaches to accounting based upon full-costallocation can be misleading and dangerous. Activity-based costing meth-ods provide some significant advantages in identifying the real costs ofserving different types of customers or different channels of distribution.
Logistics management impacts not only upon the profit and lossaccount of the business, but also upon the balance sheet. Logistics isalso increasingly being recognized as having a significant impact uponeconomic value added and hence shareholder value. It is critical thatdecisions on logistics strategies made based upon a thorough under-standing of the impact they will have on the financial performance ofthe business.
References
1. State of Logistics Report, Council for Logistics Management, 2004.2. Stewart, G.B., The Quest for Value, Harper Business, 1991 (EVA is a registered
trademark of Stern Stewart & Co).3. Buffet, W., Annual Report, Berkshire Hathaway Corporation, 1994.4. Srivastava, R. et al., ‘Market-Based Assets and Shareholder Value: A Framework
for Analysis’, Journal of Marketing, Vol. 62, No. 1, January 1998, pp. 2–18.5. Ibid.6. Johnson, H.T. and Kaplan, R.S., Relevance Lost: The Rise and Fall of
Management Accounting, Harvard Business School Press, 1987.7. Barrett, T., ‘Mission Costing: A New Approach to Logistics Analysis’,
International Journal of Physical Distribution and Materials Management, Vol.12, No. 7, 1982.
8. Shillinglow, G., ‘The Concept of Attributable Cost’, Journal of AccountingResearch, Vol. 1, No. 1, Spring 1963.
9. Cooper, R. and Kaplan, R.S., ‘Profit Priorities from Activity-Based Costing’,Harvard Business Review, May–June 1991.
LOGISTICS AND SUPPLY CHAIN MANAGEMENT
114
LSCH_C03.QXD 12/11/04 12:04 pm Page 114

Creating the responsivesupply chain
Product ‘push’ versus demand ‘pull’ 123
The Japanese philosophy 129
The foundations of agility 130
A routemap to responsiveness 137
115
Chapter
4
LSCH_C04.QXD 12/11/04 12:04 pm Page 115
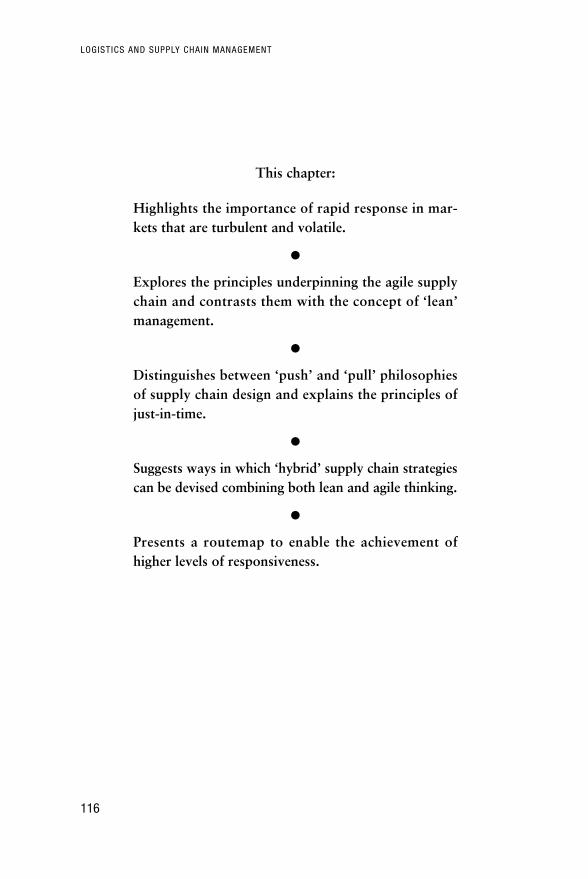
This chapter:
Highlights the importance of rapid response in mar-kets that are turbulent and volatile.
●
Explores the principles underpinning the agile supplychain and contrasts them with the concept of ‘lean’management.
●
Distinguishes between ‘push’ and ‘pull’ philosophiesof supply chain design and explains the principles ofjust-in-time.
●
Suggests ways in which ‘hybrid’ supply chain strategiescan be devised combining both lean and agile thinking.
●
Presents a routemap to enable the achievement ofhigher levels of responsiveness.
LOGISTICS AND SUPPLY CHAIN MANAGEMENT
116
LSCH_C04.QXD 12/11/04 12:04 pm Page 116

One of the biggest challenges facing organizations today is the needto respond to ever increasing levels of volatility in demand. For a
variety of reasons product and technology life cycles are shortening,competitive pressures force more frequent product changes and con-sumers demand greater variety than ever before.
To meet this challenge the organization needs to focus its effortsupon achieving greater agility such that it can respond in shorter time-frames both in terms of volume change and variety change. In otherwords it needs to be able quickly to adjust output to match marketdemand and to switch rapidly from one variant to another. To a trulyagile business volatility of demand is not a problem; its processes andorganizational structure as well as its supply chain relationships enableit to cope with whatever demands are placed upon it.
Agility in the sense of the ability to match supply with demand is notnecessarily synonymous with ‘leanness’. Much has been written aboutlean manufacturing – often with reference to the automobile industry.1
The lean approach to manufacturing seeks to minimize inventory ofcomponents and work-in-progress and to move towards a ‘just-in-time’environment wherever possible. However, while ‘leanness’ may be anelement of ‘agility’ in certain circumstances, by itself it will not enablethe organization to meet the precise needs of the customer more rapidly.Indeed it could be argued that, at least until recently, the automobileindustry, for all its leanness, is one of the least agile industries around.Webster’s Dictionary makes the distinction clearly when it defines leanas ‘containing little fat’ whereas agile is defined as ‘nimble’.
Agility has many dimensions and the concept applies as much to net-works as it does to individual companies. Indeed a key to agileresponse is the presence of agile partners upstream and downstream ofthe focal firm. Whilst organizations may have internal processes thatare capable of rapid response, their agility will still be constrained ifthey face long replenishment lead times from suppliers, for example.
Agility, as we have said, is not synonymous with ‘leanness’ but it canbuild upon it. Leanness in a sense is about doing more with less. It
4 CREATING THE RESPONSIVE SUPPLY CHAIN
117
LSCH_C04.QXD 12/11/04 12:04 pm Page 117

owes its origins to the Toyota Production System (TPS) and its pre-occupation with the reduction or elimination of waste (muda).2 Leanmanufacturing is characterized by ‘level schedules’, i.e. a forward planto ensure that the use of resources is optimized.
The backdrop against which lean thinking was originated was theJapanese automobile industry of the 1970s. This was an industrial con-text typified by the volume manufacture of relatively standard products(i.e. low levels of variety) and a focus on achieving efficiencies in theuse of resources and in maximizing economies of scale. In this type ofsituation, i.e. standard products and relatively predictable demand,experience has shown that lean practices work well.
However, in market environments where demand is uncertain, thelevels of variety are high and consequently volume per stock keeping unit(SKU) is low, then a different response is required. Whilst efficiency isalways desirable, in the context of unpredictable demand it may have totake second place to ‘effectiveness’ as the main priority for supply chainmanagement. By effectiveness in this context is meant the ability torespond rapidly to meet the precise needs of an often fragmented market-place. In other words, rather than the emphasis being on producingstandard products for mass markets ahead of demand, the requirementbecomes one of producing multiple product variants (often customized)for much smaller market segments in response to known demand.
Figure 4.1 reflects the different contexts in which the ‘lean’ and‘agile’ paradigms might work best.
LOGISTICS AND SUPPLY CHAIN MANAGEMENT
118
LEAN
AGILE
Low High
Volume
Varie
ty/V
aria
bili
ty
Low
Hig
h
‘Agility’ is needed inless predictableenvironments wherethe demand for varietyis high
‘Lean’ works best inhigh volume, lowvariety and predictableenvironments
Fig. 4.1 Agile or lean?
LSCH_C04.QXD 12/11/04 12:04 pm Page 118

In reality, within the same business it is likely that there will exist theneed for both lean and agile supply chain solutions since some productswill have predictable demand whilst for others demand will be farmore volatile. In fact it can be argued that rather than the conventional‘one size fits all’ strategy for supply chain design, the need today is formultiple supply chain solutions. One way to identify what types ofsupply chain strategies might be appropriate in different circumstancesis to position the products in an organization’s portfolio according totheir supply and demand characteristics.
By ‘supply characteristic’ is meant the lead time of replenishment.This could be replenishment of the product itself if it is bought in (e.g.a retailer) or of components in the case of a manufacturer. Clearly, ifreplenishment lead times are short then a different supply chain strat-egy can be employed than when lead times are long.
Demand conditions may be characterized by the predictability ofdemand. One measure of demand predictability is the variability ofdemand; by definition demand that does not vary much from oneperiod to another is easier to predict.
Figure 4.2 suggests four broad generic supply chains strategiesdependent upon the combination of supply/demand conditions foreach product.
4 CREATING THE RESPONSIVE SUPPLY CHAIN
119
KanbanContinuous
replenishment
AgileQuick
response
LeanPlan andoptimize
HybridDe-couple
throughpostponement
Predictable Unpredictable
Demand characteristics
Sup
ply
cha
ract
eris
tics
Sho
rtle
ad t
imes
Long
lead
tim
es
Fig. 4.2 Generic Supply Chain Strategies
LSCH_C04.QXD 12/11/04 12:04 pm Page 119

In those cases where demand in predictable and replenishment leadtimes are short, then a ‘Kanban’ type of solution is indicated. This is aphilosophy of continuous replenishment where, at its extreme, as eachproduct is sold or used it is replaced.
In the top left hand box where lead times are long but demand ispredictable then a ‘lean’ type approach will be appropriate. Materials,components or products can be ordered ahead of demand and manu-facturing and transportation facilities can be optimized in terms of costand asset utilization. Conversely the bottom right hand corner is thereal domain of the agile supply chain. Here demand is unpredictablebut lead times are short, enabling ‘quick response’ type solutions – theextreme case being make-to-order (but in very short time-frames).
The top right hand corner presents an interesting situation: leadtimes are long and demand is unpredictable. In situations such as this,the first priority should be to seek to reduce lead times since the vari-ability of demand is almost certainly outside the organization’s control.Lead-time reduction would enable the application of agile solutions.However, if lead times cannot be reduced the next option is to seek tocreate a hybrid lean/agile solution. These hybrid solutions require thesupply chain to be ‘de-coupled’ through holding strategic inventory insome generic or unfinished form, with final configuration being com-pleted rapidly once real demand is known. This is the classic‘postponement’ strategy. An alternative form of postponement wherethe final physical configuration cannot be delayed is to postpone theactual distribution of the product by holding it in fewer (or even onlyone) locations and using express transportation to move it to the finalmarket or point of use once actual demand is known.
The goal of a hybrid strategy should be to build an agile response upona lean platform by seeking to follow lean principles up to the de-couplingpoint and agile practices after that point.3 Figure 4.3 illustrates this idea.
A good example of a de-coupling point enabling a lean/agile hybridstrategy is provided by paint manufacturers such as ICI. Today, con-sumers can be offered customized solutions in terms of the colour ofpaint through the use of paint mixing machines located in retail outlets.The retailers only need to stock a relatively small number of basecolours to provide an almost infinite number of final colours. Thus ICIcan utilize lean processes in producing base colours in volume but canprovide an agile and timely response to end users. This example also
LOGISTICS AND SUPPLY CHAIN MANAGEMENT
120
LSCH_C04.QXD 12/11/04 12:04 pm Page 120

illustrates the principle of seeking to reduce complexity whilst provid-ing the requisite level of variety that the market demands.
To be truly agile a supply chain must possess a number of distinguish-ing characteristics, as Figure 4.4 suggests.
Firstly, the agile supply chain is market-sensitive. By market-sensitive ismeant that the supply chain is capable of reading and responding to realdemand. Most organizations are forecast-driven rather than demand-driven. In other words, because they have little direct feed-forward fromthe marketplace by way of data on actual customer requirements, they
4 CREATING THE RESPONSIVE SUPPLY CHAIN
121
• Forecast at generic level• Economic batch quantities• Maximize efficiencies
• Demand driven• Localized configuration• Maximize effectiveness
Strategicinventory
Lean Agile
Fig. 4.3 The de-coupling point
Agilesupplychain
Virtual
Processalignment
Marketsensitive
Networkbased
Fig. 4.4 The agile supply chainSource: Adapted from Harrison, A., Christopher, M. and van Hoek, R., Creating the Agile Supply Chain, Chartered Institute of Logistics and
Transport, 1999.
LSCH_C04.QXD 12/11/04 12:04 pm Page 121

are forced to make forecasts based upon past sales or shipments andconvert these forecasts into inventory. The breakthroughs of the lastdecade in the use of information technology to capture data on demanddirect from the point-of-sale or point-of-use are now transforming theorganization’s ability to hear the voice of the market and to responddirectly to it.
The use of information technology to share data between buyers andsuppliers is, in effect, creating a virtual supply chain. Virtual supplychains are information based rather than inventory based.
Conventional logistics systems are based upon a paradigm that seeksto identify the optimal quantities and the spatial location of inventory.Complex formulae and algorithms exist to support this inventory-basedbusiness model. Paradoxically, what we are now learning is that oncewe have visibility of demand through shared information, the premiseupon which these formulae are based no longer holds. Electronic DataInterchange (EDI) and now the Internet have enabled partners in thesupply chain to act upon the same data, i.e. real demand, rather than bedependent upon the distorted and noisy picture that emerges whenorders are transmitted from one step to another in an extended chain.
Supply chain partners can only make full use of shared informationthrough process alignment, i.e. collaborative working between buyersand suppliers, joint product development, common systems and sharedinformation. This form of co-operation in the supply chain is becomingever more prevalent as companies focus on managing their core compe-tencies and outsource all other activities. In this new world a greaterreliance on suppliers and alliance partners becomes inevitable and,hence, a new style of relationship is essential. In the ‘extended enter-prise’, as it is often called, there can be no boundaries and an ethos oftrust and commitment must prevail. Along with process integrationcomes joint strategy determination, buyer/supplier teams, transparencyof information and even open-book accounting.
This idea of the supply chain as a confederation of partners linkedtogether as a network provides the fourth ingredient of agility. There isa growing recognition that individual businesses no longer compete asstand-alone entities but rather as supply chains. Managing networkscalls for an entirely difference model than the conventional ‘arm’s-length’ approach to managing customer and supplier relationships.
LOGISTICS AND SUPPLY CHAIN MANAGEMENT
122
LSCH_C04.QXD 12/11/04 12:04 pm Page 122

Clearly a much higher level of collaboration and synchronization isrequired if the network is to be truly agile. It can be argued that, intoday’s challenging global markets, the route to sustainable advantagelies in being able to make best use of the respective strengths and com-petencies of network partners to achieve greater responsiveness tomarket needs.
Product ‘push’ versus demand ‘pull’
There have been many new ideas and concepts in business managementover the last 30 or so years, some of which have endured and otherssoon discarded. However, perhaps one of the most significant princi-ples to become widely adopted and practised is that of just-in-time.Just-in-time, or JIT, is a philosophy as much as it is a technique. It isbased upon the simple idea that wherever possible no activity shouldtake place in a system until there is a need for it.
Thus no products should be made, no components ordered, untilthere is a downstream requirement. Essentially JIT is a ‘pull’ concept,where demand at the end of the pipeline pulls products towards themarket and behind those products the flow of components is also deter-mined by that same demand. This contrasts with the traditional ‘push’system where products are manufactured or assembled in batches inanticipation of demand and are positioned in the supply chain as‘buffers’ between the various functions and entities (see Figure 4.5).
The conventional approach to meeting customer requirements isbased upon some form of statistical inventory control which typicallymight rely upon reordering when inventory levels fall to a certain pre-determined point – the so-called reorder point (ROP).
Under this approach a reorder point or reorder level is predeter-mined based upon the expected length of the replenishment lead time(see Figure 4.6). The amount to be ordered may be based upon the eco-nomic order quantity (EOQ) formulation which balances the cost ofholding inventory against the costs of placing replenishment orders.
Alternative methods include the regular review of stock levels withfixed intervals between orders when the amount to be ordered is deter-mined with reference to a predetermined replenishment level, as inFigure 4.7.
4 CREATING THE RESPONSIVE SUPPLY CHAIN
123
LSCH_C04.QXD 12/11/04 12:04 pm Page 123

There are numerous variations on these themes and the techniqueshave been well documented and practised for many years. However,they all tend to share one weakness, that is they frequently lead tostock levels being higher or lower than necessary, particularly in thosecases where the rate of demand may change or occurs in discrete‘lumps’. This latter situation frequently occurs when demand for anitem is ‘dependent’ upon demand for another item, e.g. demand for a
LOGISTICS AND SUPPLY CHAIN MANAGEMENT
124
CustomersDemand‘pull’
D1 D2 D3 D4
RDC2RDC1Regional
distributioncentres
Factorywarehouse
Factory
Vendors/suppliersProduct‘push’
Finished products(demand forecastlevel)
Finished products
Finished products
Work-in-progress
Sub-assemblies
Components
Fig. 4.5 ‘Push’ versus ‘pull’ in the logistics chain
LSCH_C04.QXD 12/11/04 12:04 pm Page 124

TV component is dependent upon the demand for TV sets; or wheredemand is ‘derived’, e.g. the demand for TV sets at the factory is deter-mined by demand from the retailer, which is derived from ultimatedemand in the marketplace.
The implications of dependent demand are illustrated in the examplegiven in Figure 4.8, which shows how a regular off-take at the retaillevel can be converted into a much more ‘lumpy’ demand situation atthe plant by the use of reorder points.
A similar situation can occur in a multi-level distribution systemwhere the combined demand from each level is aggregated at the nextlevel in the system. Figure 4.9 demonstrates such an occurrence.
4 CREATING THE RESPONSIVE SUPPLY CHAIN
125
Averagelead-timedemand
Lead time Safetystock
Reorder point
Reorderquantity
Orderplaced
Orderarrives
Time
Sto
ck le
vel
Fig. 4.6 The reorder point method of stock control
Replenishmentlevel
Reviewperiod
Sto
ck le
vel
Fig. 4.7 The review period method of stock control
LSCH_C04.QXD 12/11/04 12:05 pm Page 125

The common feature of these examples is that demand at each level inthe logistics system is dependent upon the demand at the next level inthe system. Demand is termed ‘dependent’ when it is directly related to,
or derives from, the demand foranother inventory item or product.Conversely, the demand for a givenitem is termed ‘independent’ whensuch demand is unrelated to demandfor other items – when it is not afunction of demand for other items.This distinction is crucial because
whilst independent demand may be forecast using traditional methods,dependent demand must be calculated, based upon the demand at thenext level in the logistics chain.
LOGISTICS AND SUPPLY CHAIN MANAGEMENT
126
Inventory
Order point
J F M A M J J A S O N
J F M A M J J A S O N
J F M A M J J A S O N
Order point
Order point
2. Central warehouse inventory:few large demands dependent on RDC demand
3. Plant inventory:irregular demand dependent on warehouse demand
1. Regional distribution centre (RDC) inventory:many small independent demands from customers
Fig. 4.8 Order point and dependent demand
Whilst independent demand maybe forecast using traditional
methods, dependent demand mustbe calculated, based upon thedemand at the next level in the
logistics chain.
LSCH_C04.QXD 12/11/04 12:05 pm Page 126

Using the example in Figure 4.9 it would clearly be inappropriate toattempt to forecast demand at the plant using data based upon the pat-tern of combined demand from the regional centres. Rather it has to becalculated from the identified requirements at each of the precedinglevels. It is only at the point of final demand, in this case at the depots,where forecasts can sensibly be made – in fact in most cases demand atthe depot would itself be dependent upon retailers’ or other intermedi-aries’ demand, but since this is obviously outside the supplier’s directcontrol it is necessary to produce a forecasted estimate of demand.
The classic economic order quantity (EOQ) model has tended tochannel our thinking towards the idea that there is some ‘optimum’amount to order (and hence to hold in stock). The EOQ model arrivesat this optimum by balancing the holding cost of inventory against thecost of issuing replenishment orders and/or the costs of production set-ups (see Figure 4.10).
4 CREATING THE RESPONSIVE SUPPLY CHAIN
127
Fig. 4.9 Causes of uneven demand at the plant
LSCH_C04.QXD 12/11/04 12:05 pm Page 127

The EOQ can be easily determined by the formula:
2ASEOQ = ––––
i
where,
A = Annual usageS = Ordering cost/set-up costi = Inventory carrying cost
So, for example, if we use 1,000 units of product X a year, each costing£40, and each order/set-up costs £100 and the carrying cost of inven-tory is 25 per cent then:
2 × 1000 × 100EOQ = –––––––––––––– = 14140 × 0.25
The problem is that this reorder quantity means that we will be carryingmore inventory than is actually required per day over the complete ordercycle (except on the last day). For example, if the EOQ were 100 unitsand daily usage was 10 units then on the first day of the cycle we will beoverstocked by 90 units, on the second day by 80 units and so on.
To compound the problem we have additional inventory in the formof ‘safety’ stock, which is carried in order to provide a safeguardagainst demand during the replenishment lead time being greater thanexpected and/or variation in the lead time itself.
The result is that we end up with a lot of unproductive inventory,which represents a continuing drain on working capital.
LOGISTICS AND SUPPLY CHAIN MANAGEMENT
128
Totalcost
Inventorycarrying
cost
Quantity
Ordering/set-upcost
EOQ
Cos
t
Fig. 4.10 Determining the economic order quantity
LSCH_C04.QXD 12/11/04 12:05 pm Page 128

The Japanese philosophy
It has often been said that the scarcity of space in industrialized Japanhas made the nation conscious of the need to make the most productiveuse of all physical resources, including inventory – whether this is trueis of academic interest only – what is the case is that it is the widelyheld view in Japan that inventory is waste.
An analogy that is frequently drawn in Japan is that an organization’sinvestment in inventory is like a large, deep lake (see Figure 4.11). Wellbelow the surface of this lake are numerous jagged rocks, but because ofthe depth of the water, the captain of the ship need have no fear of strik-ing one of them.
The comparison with business is simple: the depth of the water inthe lake represents inventory and the rocks represent problems. Theseproblems might include such things as inaccurate forecasts, unreliablesuppliers, quality problems, bottlenecks, industrial relations problemsand so on. The Japanese philosophy is that inventory merely hides theproblems. Their view is that the level of water in the lake should bereduced (say to level ‘B’ in Figure 4.11). Now the captain of the ship isforced to confront the problems – they cannot be avoided. In the sameway if inventory is reduced then management must grasp the variousnettles of forecast inaccuracy, unreliable suppliers and so on.
4 CREATING THE RESPONSIVE SUPPLY CHAIN
129
Fig. 4.11 Inventory hides the problems
LSCH_C04.QXD 12/11/04 12:05 pm Page 129

The Japanese developed the so-called Kanban concept as a way of lower-ing the water in the lake. Kanban originated in assembly-type operationsbut the principles can be extended across the supply chain and to alltypes of operations. The name Kanban comes from the Japanese for atype of card that was used in early systems to signal to the upstreamsupply point that a certain quantity of material could be released.
Kanban is a ‘pull’ system that is driven by the demand at the lowestpoint in the chain. In a production operation the aim would be to produceonly that quantity needed for immediate demand. When parts are neededon the assembly line they are fed from the next stage up the chain in justthe quantity needed at the time they are needed. Likewise this movementnow triggers demand at the next work station in the chain and so on.
By progressively reducing the Kanban quantity (i.e. the amountdemanded from the supplying work station) bottlenecks will becomeapparent. Management will then focus attention on the bottleneck toremove it by the most cost-effective means possible. Again the Kanbanquantity will be reduced until a further bottleneck is revealed. Hencethe Kanban philosophy essentially seeks to achieve a balanced supplychain with minimal inventory at every stage and where the process andtransit quantities of materials and stock are reduced to the lowest pos-sible amount. The ultimate aim, say the Japanese, should be the‘economic batch quantity of 1’!
In fact this logic does not necessarily conflict with the traditionalview of how the economic batch (or order) quantity is determined. Allthat is different is that the Japanese are seeking to minimize the batchquantity by shifting the curve that represents the cost of ordering or thecost of set-ups to the left (see Figure 4.12). In other words, they focuson finding ways to reduce set-up costs and ordering costs.
The effect of moving the curve to the left on the economicbatch/order quantity is seen in Figure 4.13.
The foundations of agility
It will be apparent that agility is not a single company concept butrather it extends from one end of the supply chain to the other. Theconcept of agility has significant implications for how organizationswithin the supply/demand network relate to each other and how theycan best work together on the basis of shared information.
LOGISTICS AND SUPPLY CHAIN MANAGEMENT
130
LSCH_C04.QXD 12/11/04 12:05 pm Page 130

4 CREATING THE RESPONSIVE SUPPLY CHAIN
131
Order/batch quantity
Cos
t
Fig. 4.12 Reducing set-up costs/ordering costs
Totalcost (2)
Totalcost (1)
Inventorycarrying
cost
Set-up cost(1)
Set-up cost(2)
EO
Q (2
)
EO
Q (1
)
Order/batch quantity
Cos
t
Fig. 4.13 Reducing the economic batch/order quantity
LSCH_C04.QXD 12/11/04 12:05 pm Page 131

To bring these ideas together, a number of basic principles can beidentified as the starting point for the creation of the agile supply chain.
1 Synchronize activities through shared information
Synchronization implies that all parties in the supply chain are ‘march-ing to the same drumbeat’. In other words, through shared informationand process alignment there is in effect one set of numbers and a singleschedule for the entire supply chain. This somewhat Utopian vision isincreasingly becoming reality as web-based technology enables differ-ent entities in a network to share information on real demand,inventory and capacity in a collaborative context.
In the fast moving consumer goods (fmcg) sector there is a growingnumber of examples of supply chain synchronization made possible bythe retailers’ increasing willingness to share point-of-sale data withmanufacturers. One such instance is the web-based system establishedby the UK’s biggest retailer, Tesco. The Tesco Information Exchange(TIE) is an extranet that enables Tesco’s suppliers to access their ownsales data, item by item. This data is updated several times a day andpotentially can provide manufacturers with the means to link their pro-duction schedules to Tesco’s replenishment requirements.
In the automobile industry most of the volume car manufacturershave established ‘seamless’ processes with their first tier suppliers basedupon providing immediate access to production plans and schedules.This enables just-in-time deliveries to be achieved without the need formajor buffers of inventory at the first tier level.
In the US the ‘quick response’ initiative in the apparel industry haslinked retailers to garment manufacturers and also to the fabric produc-ers through shared information. The impact of this collaboration hasbeen a significant improvement in the competitiveness of that industry.
2 Work smarter, not harder
Detailed examination of the processes that together constitute a supplychain inevitably highlights the fact that a large proportion of the end-to-end time is ‘non-value-adding’. In other words, time is being spenton activities that typically create cost but do not create a benefit for thecustomer. Time spent in inventory is a classic example of non-value-adding time. Supply chain mapping can reveal where this idle time
LOGISTICS AND SUPPLY CHAIN MANAGEMENT
132
LSCH_C04.QXD 12/11/04 12:05 pm Page 132

occurs; to attack it then requires a review of the processes that precedeor follow that idle time. Process time is directly correlated with inven-tory, e.g. if it takes three weeks from raising a purchase order toreceiving the goods, at least three weeks of inventory will be requiredto buffer ourselves during that lead time.
Business process re-engineering (BPR) is the term frequently appliedto the activity of simplifying and reshaping the organizational processeswith the goal of achieving the desired outcomes in shorter time-framesat less cost. Many processes in the supply chain are lengthy because theconstituent activities are performed in ‘series’, i.e. in a linear, ‘one afterthe other’ way. It is often possible to re-engineer the process so thatthose same activities can be performed ‘in parallel’, i.e. simultaneously.
Time compression in a supply chain can be achieved not necessarilyby speeding up activities, but rather by doing fewer things – i.e. elimi-nating where possible non-value adding activities. Many existingpractices in business are performed for historical reasons; there wasonce a justification for those practices but, with changed conditions,that justification may no longer exist.
Supply chains can be transformed in terms of their agility by the rig-orous application of process re-engineering principles.
3 Partner with suppliers to reduce in-bound lead times
Conventionally, firms have maintained an arm’s-length relationship withsuppliers. Suppliers have often been chosen on the basis of price ratherthan their responsiveness. A major opportunity exists for reducing in-bound lead times through close working with key suppliers. Onepowerful way in which collaboration can improve responsiveness isthrough the adoption of Vendor Managed Inventory (VMI) practices.
VMI, which is discussed in more detail in Chapter 6, switches theresponsibility for the management and replenishment of inventory fromthe customer to the supplier. The customer no longer places orders onthe supplier but rather shares with them information on sales, rates ofusage or consumption. Using this information the supplier is better ableto plan and schedule the acquisition, production and delivery of theproduct. Both parties benefit, the customer through higher levels ofavailability and reliability and the supplier through a reduction in theirneed to carry safety stock and, often, a better use of capacity. VMI is a
4 CREATING THE RESPONSIVE SUPPLY CHAIN
133
LSCH_C04.QXD 12/11/04 12:05 pm Page 133

classic instance of the application of the principle of ‘substituting infor-mation for inventory’.
Increasingly in the defence and aerospace sector the sheer complexityof the products requires a high level of information sharing with sup-pliers. Thus companies like BAe Systems, Thales and EADS areworking with key suppliers to create more responsive supply chainsthrough VMI-type arrangements.
4 Seek to reduce complexity
Complexity comes in many guises in supply chains. Complexity may begenerated by multiple variants of the same product, e.g. different packsizes, or by each product in a family having greatly different Bills ofMaterial, or by frequent product changes, and so on. Complexity canalso be generated through cumbersome processes that involve manydifferent stages and hand-offs. Simplification is an obvious remedy forcomplexity but one which may not always be available. However, therewill often be opportunities to reduce complexity by questioning thereasons why things are the way they are.
For example, is the level of product variety greater than the customeractually requires? Often product, proliferation is driven by sales ormarketing departments and may not actually achieve additional salesbut spread the same total demand over a greater number of stock keep-ing units (SKUs). The greater the fragmentation of demand the harderit becomes to manage availability in that the variability of demand willtend to be higher.
Simplification can sometimes be achieved through seeking greatercommonality of components or sub-assembly across a family of prod-ucts. For example, in automobile design these days it is increasingly thecase that several different models of car are built on the same platformand ‘under the skin’ share common components and sub-assemblies.
The point about complexity is that it provides a barrier to agility aswell as generating cost.
5 Postpone the final configuration/assembly/distribution of products
Postponement refers to the process by which the commitment of a prod-uct to its final form or location is delayed for as long as possible. Whendecisions on the final configuration or pack have to be made ahead of
LOGISTICS AND SUPPLY CHAIN MANAGEMENT
134
LSCH_C04.QXD 12/11/04 12:05 pm Page 134

demand there is the inevitable risk that the products that are availableare not the ones the customer wants. For example, the customer maywant a blue four-door car with air-conditioning but the dealer has a red,two-door with a sunroof. Or, again, there may be a blue four-door avail-able but it is at a different dealer at the other end of the country.
The philosophy of postponement ideally would begin on the draw-ing board so that products are designed with late configuration inmind. The longer that products can remain as generic ‘work inprogress’ then the more flexibility there will be to ensure the ‘rightproduct in the right place at the right time’.
An example of late configuration is provided by Hewlett Packardand its DeskJet printers. These products are designed so that they canbe manufactured as generic, but incomplete, units. They are then local-ized at regional centres where the appropriate power pack, plug andcable, local packaging, etc. are added. In this way inventory is mini-mized but availability is enhanced.
Postponement may not always be feasible in terms of late configura-tion but there may be scope for spatial postponement through holdinginventory in just a few locations with the ability to ship the productrapidly to the location required when an order is received.
6 Manage processes not just functions
For centuries organizations have followed an organizational logicbased upon the ‘division of labour’ whereby activities take place withinfunctions or departments. Whilst this functionally based organizationalconcept may ensure the efficient use of resources it is actually inwardlyfocused and tends to lead to a ‘silo’ type mentality. It also seems to bethe case that these functionally based organizations are slow to respondto changes in the market or business environment. Because there areoften multiple ‘hand-offs’ as things get passed from one function toanother there is an inevitable lengthening in the time to respond. Infunctionally based businesses the new product development activity, forexample, is often lengthy as it moves from R&D to product engineer-ing to market research and eventually into production.
On the other hand, those companies who are able to respond rapidlyto changing customer requirements tend to focus more upon managing‘processes’. Processes are the horizontal, market-facing sequences ofactivities that create value for customers. They are cross-functional by
4 CREATING THE RESPONSIVE SUPPLY CHAIN
135
LSCH_C04.QXD 12/11/04 12:05 pm Page 135

definition and are usually best managed through the means of inter-disciplinary teams. The critical business processes that cut across theorganization would include innovation, customer relationship manage-ment and supplier relationship management.
The way businesses are organized can have a significant impact upontheir agility; those companies with cumbersome, multi-level decision-making processes tend to be far slower to respond to market changes thantheir competitors who give autonomy to self-managed process teams.
A further reason why process management is critical to agility acrossthe wider supply chain is that process alignment between entities inthat chain is clearly facilitated if organizational structures are horizon-tal rather than vertical.
7 Utilize appropriate performance metrics
It is a truism that performance measurement shapes behaviour. This isparticularly the case in business organizations where formal measure-ment systems drive the business. In functionally based organizationsthese measurements often are based upon departmental budgets andare underpinned by objectives such as cost minimization, asset utiliza-tion and efficiency, and productivity improvement. Whilst on the faceof it these objectives may appear to be desirable, they will not necessar-ily encourage agile practices within the organization. If, for example, amanufacturing facility is measured on, say, unit cost of production thenthe incentive will be to go for big batch sizes to take advantage ofeconomies of scale. However, such actions will probably lead to a lossof flexibility and the creation of additional inventory. If, on the otherhand, time-based metrics were to be employed then the focus could beon cycle-time reduction, set-up time reduction and other measures thatencourage agile practices.
A further incentive to agility can be created by linking processes tocustomer-based metrics. One such widely used measure is ‘perfect orderachievement’. A perfect order is one where the customer gets exactlywhat they want at the time and place they want it. It will also usuallybe the case that different customers may well have different require-ments and expectations, so the definition of what constitutes a perfectorder will have to be specific to each segment, channel or even individ-ual key accounts.
LOGISTICS AND SUPPLY CHAIN MANAGEMENT
136
LSCH_C04.QXD 12/11/04 12:05 pm Page 136

A fundamental tenet of agility is customer responsiveness, hence theneed to ensure that the primary measures of business performancereflect this imperative. ‘Time to market’ and ‘time to volume’ are pow-erful metrics employed by companies such as Sony and Canon whereshort life cycles dictate a focus on rapid response to fast-changing tech-nologies and volatile customer demand.
In the past, the focus of many companies was primarily on efficiency,i.e. a continuing search for lower costs, better use of capacity, reducedinventories and so on. These are still worthy goals today but the prior-ity has shifted. Now the emphasis must be on effectiveness. In otherwords the challenge is to create strategies and procedures that willenable organizations to become the supplier of choice and to sustainthat position through higher levels of customer responsiveness. This isthe logic that underpins the concept of the agile supply chains.
A routemap to responsiveness
The shift in the balance of power in the distribution channel has high-lighted the need for the business to be driven by the market rather thanby its own internal goals. However, for organizations to become trulymarket-driven, there has to be a sustained focus on responsiveness acrossthe business and its wider supply chain. There are many prerequisites forresponsiveness and Figure 4.14 summarizes the key elements.
The responsive business will have agile suppliers and will work veryclosely with them to align processes across the extended enterprise. Itwill also be very close to its customers, capturing information on realdemand and sharing that information with its partners across the net-work. Internally the business will also be focused on agility through theway it organizes – breaking through functional silos to create processteams. In terms of its manufacturing and sourcing strategy, the respon-sive business will seek to marry the lean and agile paradigm throughde-coupling its upstream and downstream processes, utilizing the prin-ciples of postponement wherever possible.
Those companies that can follow this routemap will be more likelyto be the leaders in their field. More often than not, when we look atthe successful companies in any market, they tend to be the ones that
4 CREATING THE RESPONSIVE SUPPLY CHAIN
137
LSCH_C04.QXD 12/11/04 12:05 pm Page 137

LOGISTICS AND SUPPLY CHAIN MANAGEMENT
138
De-
coup
le t
hesu
pp
ly c
hain
Flex
ible
resp
onse
The
resp
ons
ive
bus
ines
s
Qui
ckre
spon
se
Pro
cess
re-e
ngin
eerin
gN
on-v
alue
-ad
din
gtim
e re
duc
tion
Set
-up
tim
ere
duc
tion
Cap
acity
man
agem
ent
Lean
pro
duc
tion
Was
tere
duc
tion
Eco
nom
ies
of s
cale
Sta
ndar
diz
atio
n/m
odul
ariz
atio
n
Agi
lesu
pp
ly
Syn
chro
nize
dp
rod
uctio
n
Vend
orm
anag
edin
vent
ory
Dem
and
driv
en
Con
tinuo
usre
ple
nish
men
tp
rogr
amm
es
Vis
ibili
ty o
fre
al d
eand
Org
aniz
atio
nal
agili
ty
Pro
cess
man
agem
ent
Cro
ss-f
unct
iona
lte
ams
Fig.
4.14
Rout
emap
to th
e re
spon
sive
bus
ines
s
LSCH_C04.QXD 12/11/04 12:05 pm Page 138

have demonstrated their ability to respond more rapidly to the chang-ing needs of their customers. The case study that concludes this chapterunderlines the challenges that organizations must confront as they seekto become more responsive to customer needs.
4 CREATING THE RESPONSIVE SUPPLY CHAIN
139
The three-day car programme
Automotive assemblers have for many years led the way with lean pro-duction techniques, proving a template for efficiency improvements inmany other sectors. They mastered just-in-time supply from first tiersuppliers to assembly line, achieved dramatic improvements in termsof better quality, faster throughput and lower production costs. Whatthey did not do was improve end-to-end supply chain efficiency. Nordid they provide customers with exactly the car they wanted whenthey wanted it, despite producing large stockpiles of unsold finishedcars. The problem was identified long ago, and assemblers have beenattempting to realize the theoretical goal of a ‘stockless’ supply chainfor many years. Back in 1993 British-based car maker Rover intro-duced the concept of ‘Personal Production’, an initiative that aimed toprovide prospective buyers and fleet car user-choosers with exactly thecar they wanted within 14 days. The project revolved around efforts tolink customers’ showroom orders directly with production scheduling.Research at the time had underlined the necessity of such a systemshowing that (industry-wide) only a quarter of all showroom visitorsever got exactly the car they wanted and one in five failed to buy atall.1 Personal Production eventually foundered, not least because offriction with the dealer network and the difficulties in deliveringoverseas within the required time-frame; nevertheless, the underlyingproblem – the lack of agility in automotive supply chains – is morepressing than ever.
Subsequent ‘best practice’ research, involving eight automotiveassembly companies,2 has shown that speed of supply – and their fail-ure to get it – remains a very significant issue for car buyers, with65 per cent stating that it was an important factor in their car buyingdecision. One in five stated that their ideal delivery time was less thanone week, not the 40 days they were likely to have to wait for theirprecisely specified vehicle. Moreover, it was the younger customerswho were the most impatient.
▼
LSCH_C04.QXD 12/11/04 12:05 pm Page 139

LOGISTICS AND SUPPLY CHAIN MANAGEMENT
140
Research by specialist teams at Cardiff University and the Universityof Bath concluded that it was in fact possible for lead times for UK-produced cars for UK customers to be reduced to just three days, ifbest practice principles were observed. Classic lean production meth-ods, pioneered in the car industry by Toyota, have tended to focus onoptimizing flows through a small part of the supply chain – the assem-bly plant – not the total lead time. Toyota continues to lead theindustry in terms of quality and flexible manufacturing systems. Itslatest innovations allow up to eight different models to move throughthe same body shop, making it easier than ever to produce high-margin, low-volume ‘boutique’ to order.
However, the UK industry research shows that amongst the manu-facturers collaborating in the three-day car project, delays inproduction were minimal, but the batching of orders at dealerships,and delays in transferring this to schedules, more delays with schedul-ing, together with the unreliability of data sent to suppliers wasactually responsible for the bulk of time wasted. Thereafter shortagesof components and problems with the quality of paintwork meant theonly two-thirds of vehicles were built as scheduled. More delaysfollow as efforts are made to put together batch loads of finished carsto optimize efficient utilization of high-capacity vehicle transporters.
All of these delays could, in theory, be removed if car manufacturerstook some pointers from other retail sectors, notably that demanddata in the form of customer orders could be fed in real time directlyinto production slots. The precise sequence could be determinedhourly, but schedules would be frozen 36 hours in advance to provide12 hours for locally based logistics and first tier component suppliersto deliver inbound supplies. The third and final day is then allowed fordelivery of the finished vehicles to the dealerships.
As the three-day car research study is keen to point out, however,some practical hurdles would have to be overcome. First, a differentapproach to planning would be required. It would be forecast driven,but capacity planning would rely on likely customer orders, segmentedby lead-time sensitivity. Private customers would be three-day car cus-tomers so scheduling would be based around their orders; orders for‘captive customers’, i.e. employees and demonstrators for dealerships,would be used to fill three-day buffer capacity during seasonal dips in
▼
LSCH_C04.QXD 12/11/04 12:05 pm Page 140

4 CREATING THE RESPONSIVE SUPPLY CHAIN
141
demand. The bulk of the production capacity would, however, con-tinue to be assigned to less time-sensitive customers such as fleetbuyers who research reveals are willing to wait longer or are betterable to place orders well ahead of demand.
A single shared data system, linking dealer showroom all the waythrough the assembler into first tier suppliers, was deemed essential sothat sales staff could check the availability of all component parts forthe specified model before the order was formally committed to theproduction schedule. Then active demand management techniquescould be applied to level out serious fluctuations in demand. Some sig-nificant sources of demand volatility, such as monthly sales targets,which encourage sales staff to discount heavily at month ends, couldbe redesigned to take out unnecessary spikes. Other seasonal fluctua-tions could be levelled to some extent by other ‘revenue management’techniques, such as off-peak price promotions. Visibility of componentavailability would also allow sales staff to steer customers away fromsome variants where specific component capacity constraints werelikely to be problematic.
Back in the assembler’s factory common platforms reduce productmix complexity. The researchers found that de-coupling the paint shopfrom other production processes was key to avoiding in-productiondelays. The solution was to increase the storage capacity for stocks ofunpainted car shells known as ‘bodies in white’. Storage capacity levels,currently running at up to 800 bodies, had to be increased. Staffinglevels on production lines would also have to be raised. Higher staffinglevels, though more costly, allow greater flexibility meaning that allvariants could be handled by the same production line, regardless ofdifferences in labour content. In addition employees would themselvesbe required to be more flexible in terms of working hours, adjustingtheir working hours in line with fluctuations in demand.
The third and final leg of the process is delivery of the finished vehi-cle to the appropriate dealership. Ensuring three-day delivery wouldincrease outbound logistics costs, unless the existing model waschanged. The solution, according to the three-day car research team, isbetter information sharing with the logistics providers, together withround the clock, multi-franchise delivery operations, using car
▼
LSCH_C04.QXD 12/11/04 12:05 pm Page 141

Summary
Because markets are volatile and demand uncertain, it is imperative thatorganizations become more responsive. Responsiveness is characterizedby the ability to change more quickly. This change could be in terms ofproduct variety or volume or in the speed of new product introductions.
Agility lies at the heart of the responsive organization. Agile busi-nesses have a number of distinguishing features: they are marketsensitive; they are information based and they share that informationacross their supply network; and, finally, their processes connect easilywith those of their supply chain partners.
Whilst ‘lean’ practices have much to commend them, by themselvesthey are unlikely to provide levels of responsiveness that the marketdemand. However, a hybrid lean/agile approach can be adopted or thesupply chain can be de-coupled through postponement.
References
1. Womack, J.P., Jones, D.T. and Roos, D., The Machine that Changed the World,Macmillan, 1990.
2. Monden, Y., The Toyota Production System, Productivity Press, 1983.3. Christopher, M. and Towill, D., ‘An Integrated Model for the Design of Agile
Supply Chains’, International Journal of Physical Distribution and LogisticsManagement, Vol. 31, No. 4, 2001.
LOGISTICS AND SUPPLY CHAIN MANAGEMENT
142
transporters of differing sizes. This would allow the extended enter-prise to optimize the final lead-time component and bring the dream ofa stockless supply chain considerably closer.
References1. Retail Motor Industry Federation, in Towers, J., Transcript of speech delivered at
Management Centre Europe, Brussels, 1 February 1996, p. 5.2. Whiteman, J. et al., ‘The Car You Want When You Want It: Summary of the 3-Day
Car Programme’, ICDP Working Paper 2002, p.32.
▼
LSCH_C04.QXD 12/11/04 12:05 pm Page 142

Strategic lead-timemanagement
Time-based competition 145
The concept of lead time 150
Logistics pipeline management 154
The lead-time gap 160
143
Chapter
5
LSCH_C05.QXD 12/11/04 12:05 pm Page 143
This chapter:
Explores the ‘cost of time’ and the drivers of time-based competition: shortening product life cycles,customers’ desire for reduced inventories and thedangers of being forecast-dependent in an increas-ingly volatile marketplace.
●
Examines the concept of lead time, the order-to-deliver cycle, its components and the need to considerthe wider context of the order-to-cash cycle.
●
Looks at how the reduction of lead times can impacton the goals of logistics pipeline management.
●
Outlines some of the ways in which inadequatesystem design can lengthen lead times and engineercosts rather than value into the logistics process.
●
Introduces the concept of the lead-time gap, offeringa number of suggestions for lead time reduction.
LOGISTICS AND SUPPLY CHAIN MANAGEMENT
144
LSCH_C05.QXD 12/11/04 12:05 pm Page 144

Time is money’ is perhaps an over-worked cliché in common par-lance, but in logistics management it goes to the heart of the
matter. Not only does time represent cost to the logistics manager butextended lead times also imply a customer service penalty. As far as costis concerned there is a direct relationship between the length of thelogistics pipeline and the inventory that is locked up in it; every day thatthe product is in the pipeline it incurs an inventory holding cost.Secondly, long lead times mean a slower response to customer require-ments, and, given the increased importance of delivery speed in today’sinternationally competitive environment, this combination of high costsand lack of responsiveness provides a recipe for decline and decay.
Time-based competition
Customers in all markets, industrial or consumer, are increasinglytime-sensitive.1 In other words they value time and this is reflected intheir purchasing behaviour. Thus, for example, in industrial marketsbuyers tend to source from supplierswith the shortest lead times who canmeet their quality specification. Inconsumer markets customers maketheir choice from amongst the brandsavailable at the time; hence if the preferred brand is out of stock it isquite likely that a substitute brand will be purchased instead.
In the past it was often the case that price was paramount as aninfluence on the purchase decision. Now, whilst price is still important,a major determinant of choice of supplier or brand is the ‘cost of time’.The cost of time is simply the additional costs that a customer mustbear whilst waiting for delivery or whilst seeking out alternatives.
There are many pressures leading to the growth of time-sensitivemarkets but perhaps the most significant are:
5 STRATEGIC LEAD-TIME MANAGEMENT
145
Customers in all markets, industrialor consumer, are increasingly
time-sensitive.
‘
LSCH_C05.QXD 12/11/04 12:05 pm Page 145

1. Shortening life cycles2. Customers’ drive for reduced inventories3. Volatile markets making reliance on forecasts dangerous
1 Shortening life cycles
The concept of the product life cycle is well established. It suggests thatfor many products there is a recognizable pattern of sales from launchthrough to final decline (see Figure 5.1).
A feature of the last few decades has been the shortening of these lifecycles. Take as an example the case of the typewriter. The earlymechanical typewriter had a life cycle of about 30 years – meaning thatan individual model would be little changed during that period. Thesemechanical typewriters were replaced by the electro-mechanical type-writer, which had a life cycle of approximately ten years. Theelectro-mechanical typewriter gave way to the electronic typewriterwith a four-year life cycle. Now personal computers have taken overwith a life cycle of one year or less!
In situations like this the time available to develop new products, tolaunch them and to meet marketplace demand is clearly greatlyreduced. Hence the ability to ‘fast track’ product development, manu-facturing and logistics becomes a key element of competitive strategy.Figure 5.2 shows the effect of being late into the market and slow tomeet demand.
LOGISTICS AND SUPPLY CHAIN MANAGEMENT
146
Introduction
Growth
Maturity
Saturation Decline
Time
Sal
es (£
)
Fig. 5.1 The product life cycle
LSCH_C05.QXD 12/11/04 12:05 pm Page 146

However, it is not just time-to-market that is important. Once a productis on the market the ability to respond quickly to demand is equallyimportant. Here the lead time to re-supply a market determines the orga-nization’s ability to exploit demand during the life cycle. It is apparentthat those companies that can achieve reductions in the order-to-deliverycycle will have a strong advantage over their slower competitors.
2 Customers’ drive for reduced inventories
One of the most pronounced phenomena of recent years has been thealmost universal move by companies to reduce their inventories.Whether the inventory is in the form of raw materials, components,work-in-progress or finished products, the pressure has been to releasethe capital locked up in stock and hence simultaneously to reduce theholding cost of that stock. The same companies that have reduced theirinventories in this way have also recognized the advantage that they gainin terms of improved flexibility and responsiveness to their customers.
The knock-on effect of this development upstream to suppliers hasbeen considerable. It is now imperative that suppliers can provide ajust-in-time delivery service. Timeliness of delivery – meaning deliveryof the complete order at the time required by the customer – becomesthe number one order-winning criterion.
Many companies still think that the only way to service customerswho require just-in-time deliveries is for them, the supplier, to carry the
5 STRATEGIC LEAD-TIME MANAGEMENT
147
Market
Late entrant
Obsoletestock
Time
Sal
es
• Less time to make profit• Higher risk of obsolescence
Fig. 5.2 Shorter life cycles make timing crucial
LSCH_C05.QXD 12/11/04 12:05 pm Page 147

inventory instead of the customer. Whilst the requirements of such cus-tomers could always be met by the supplier carrying inventory close tothe customer(s), this is simply shifting the cost burden from one part ofthe supply chain to another – indeed the cost may even be higher.Instead what is needed is for the supplier to substitute responsivenessfor inventory whenever possible.
As we discussed in Chapter 4, responsiveness essentially is achievedthrough agility in the supply chain. Not only can customers be servicedmore rapidly but the degree of flexibility offered can be greater and yetthe cost should be less because the pipeline is shorter. Figure 5.3 sug-gests that agility can enable companies to break free of the classictrade-off between service and cost. Instead of having to choose betweeneither higher service levels or lower costs it is possible to have the bestof both worlds.
3 Volatile markets make reliance on forecasts dangerous
A continuing problem for most organizations is the inaccuracy of fore-casts. It seems that no matter how sophisticated the forecastingtechniques employed, the volatility of markets ensures that the forecastwill be wrong! Whilst many forecasting errors are the result of inap-propriate forecasting methodology, the root cause of these problems isthat forecast error increases as lead time increases.
The evidence from most markets is that demand volatility is tendingto increase, often due to competitive activity, sometimes due to unex-pected responses to promotions or price changes and as a result ofintermediaries’ reordering policies. In situations such as these there arevery few forecasting methods that will be able to predict short-termchanges in demand with any accuracy.
LOGISTICS AND SUPPLY CHAIN MANAGEMENT
148
Time compression
Service enhancement Cost reduction
Fig. 5.3 Breaking free of the classic service/cost trade-off
LSCH_C05.QXD 12/11/04 12:05 pm Page 148

All forecasts are prone to error and the further ahead the forecasthorizon is the greater the error. Figure 5.4 shows how forecast errorincreases more than proportionately over time.
The conventional response to such a problem has been to increasethe safety stock to provide protection against such forecast errors.However, it is surely preferable to reduce lead times in order to reduceforecast error and hence reduce the need for inventory.
Many businesses have invested heavily in automation in the factorywith the aim of reducing throughput times. In some cases processesthat used to take days to complete now only take hours and activitiesthat took hours now only take minutes. However, it is paradoxical thatmany of those same businesses that have spent millions of pounds onautomation to speed up the time it takes to manufacture a product arethen content to let it sit in a distribution centre or warehouse for weekswaiting to be sold! The requirement is to look across the differentstages in the supply chain to see how time as a whole can be reducedthrough re-engineering the way the chain is structured.
One of the basic fallacies of management is that long lead times pro-vide security and cover against uncertainty. In fact the reverse is true!Imagine a Utopian situation where a company had reduced its procure-ment, manufacturing and delivery lead time to zero. In other words, assoon as a customer ordered an item – any item – that product wasmade and delivered instantaneously. In such a situation there would beno need for a forecast and no need for inventory and at the same time agreater variety could be offered to the customer.
5 STRATEGIC LEAD-TIME MANAGEMENT
149
+
–
Forecasterror
Time
Fig. 5.4 Forecast error and planning horizons
LSCH_C05.QXD 12/11/04 12:05 pm Page 149

Whilst clearly zero lead times are hardly likely to exist in the realworld, the target for any organization should be to reduce lead times, atevery stage in the logistics pipeline, to as close to zero as possible. In somany cases it is possible to find considerable opportunity for total lead-time reduction, often through some very simple changes in procedure.
The concept of lead time
From the customer’s viewpoint there is only one lead time: the elapsedtime from order to delivery. Clearly this is a crucial competitive vari-able as more and more markets become increasingly time competitive.Nevertheless it represents only a partial view of lead time. Just asimportant, from the supplier’s perspective, is the time it takes to con-vert an order into cash and, indeed, the total time that working capitalis committed from when materials are first procured through to whenthe customer’s payment is received.
Let us examine both of these lead-time concepts in turn.
1 The order-to-delivery cycle
From a marketing point of view the time taken from receipt of a cus-tomer’s order through to delivery (sometimes referred to as order cycletime (OCT)) is critical. In today’s just-in-time environment short leadtimes are a major source of competitive advantage. Equally important,however, is the reliability or consistency of that lead time. It can actu-ally be argued that reliability of delivery is more important than thelength of the order cycle – at least up to a point – because the impact ofa failure to deliver on time is more severe than the need to order furtherin advance. However, because, as we have seen, long lead times requirelonger-term forecasts, then the pressure from the customer will con-tinue to be for deliveries to be made in ever-shorter time-frames.
What are the components of order cycle time? Figure 5.5 highlightsthe major elements.
LOGISTICS AND SUPPLY CHAIN MANAGEMENT
150
Customerplacesorder
Orderentry
Orderprocessing
Orderassembly
Transport Orderreceived
Fig. 5.5 The order cycle
LSCH_C05.QXD 12/11/04 12:05 pm Page 150

Each of these steps in the chain will consume time. Because of bottle-necks, inefficient processes and fluctuations in the volume of ordershandled there will often be considerable variation in the time taken forthese various activities to be completed. The overall effect can lead to asubstantial reduction in the reliability of delivery. As an example, Figure5.6 shows the cumulative effect of variations in an order cycle whichresults in a range of possible cycle times from five days to 25 days.
In those situations where orders are not met from stock but may haveto be manufactured, assembled or sourced from external vendors, thenclearly lead times will be even further extended, with the possibility ofstill greater variations in total order-to-delivery time. Figure 5.7 high-lights typical activities in such extended lead times.
5 STRATEGIC LEAD-TIME MANAGEMENT
151
1. Order communication
3Time range1 to 5 days
2. Order entry and processing
2Time range1 to 3 days
3. Order picking or production
5Time range1 to 9 days
4. Transportation
3Time range1 to 5 days
5. Customer receiving
2Time range1 to 3 days
Total
155 days 25 days
Fig. 5.6 Total order cycle with variabilitySource: Stock, J.R. and Lambert, D.M., Strategic Logistics Management, 2nd edition, Irwin, 1987.
LSCH_C05.QXD 12/11/04 12:05 pm Page 151

LOGISTICS AND SUPPLY CHAIN MANAGEMENT
152
Installationlead times
Distributionlead times
Assemblylead times
Materialslead times
Commercialand planninglead times
Transportation timeto customer
Despatch preparation time(documents, packages)
Transport time to next stage(e.g. to inventory assembly)
Processing times
Waiting times
Assembly releaseand order picking
Reception andinspection lead time
Transport lead time
Supplier lead time
Materials planning andpurchase lead time
Planning lead time
Processing lead time
Order reception lead time
Fig. 5.7 Lead-time components
LSCH_C05.QXD 12/11/04 12:05 pm Page 152

2 The cash-to-cash cycle
As we have already observed, a basic concern of any organization is:How long does it take to convert an order into cash? In reality theissue is not just how long it takes to process orders, raise invoices andreceive payment, but also how long is the pipeline from the sourcingof raw material through to the finished product because throughoutthe pipeline resources are being consumed and working capital needsto be financed.
From the moment when decisions are taken on the sourcing and pro-curement of materials and components, through the manufacturing andassembly process to final distribution, time is being consumed. Thattime is represented by the number of days of inventory in the pipeline,whether as raw materials, work-in-progress, goods in transit, or timetaken to process orders, issue replenishment orders, as well as timespent in manufacturing, time in queues or bottlenecks and so on. Thecontrol of this total pipeline is the true scope of logistics lead-time man-agement. Figure 5.8 illustrates the way in which cumulative lead timebuilds up from procurement through to payment.
As we shall see later in this chapter, the longer the pipeline fromsource of materials to the final user the less responsive to changes indemand the system will be. It is also the case that longer pipelinesobscure the ‘visibility’ of end demandso that it is difficult to link manufac-turing and procurement decisions tomarketplace requirements. Thus wefind an inevitable build-up of inven-tory as a buffer at each step alongthe supply chain. An approximate rule of thumb suggests that theamount of safety stock in a pipeline varies with the square root of thepipeline length.
Overcoming these problems and ensuring timely response to volatiledemand requires a new and fundamentally different approach to themanagement of lead times.
5 STRATEGIC LEAD-TIME MANAGEMENT
153
The longer the pipeline from sourceof materials to the final user the
less responsive to changes indemand the system will be.
LSCH_C05.QXD 12/11/04 12:05 pm Page 153

Logistics pipeline management
The key to the successful control of logistics lead times is pipeline man-agement. Pipeline management is the process whereby manufacturingand procurement lead times are linked to the needs of the marketplace.At the same time, pipeline management seeks to meet the competitivechallenge of increasing the speed of response to those market needs.
The goals of logistics pipeline management are:
● Lower costs● Higher quality● More flexibility● Faster response times
LOGISTICS AND SUPPLY CHAIN MANAGEMENT
154
Cumulativelead time
[procurementto payment]
Raw materialstock
Subassemblyproduction
Intermediate stock
Product assembly
Finished stock atcentral warehouse
In-transit
Regional distributioncentre stock
Customer ordercycle (order-cash)
Fig. 5.8 Strategic lead-time management
LSCH_C05.QXD 12/11/04 12:05 pm Page 154

The achievement of these goals is dependent upon managing the supplychain as an entity and seeking to reduce the pipeline length and/or tospeed up the flow through that pipeline. In examining the efficiency ofsupply chains it is often found that many of the activities that take placeadd more cost than value. For example, moving a pallet into a ware-house, repositioning it, storing it and then moving it out in all likelihoodhas added no value but has added considerably to the total cost.
Very simply, value-adding time is time spent doing something thatcreates a benefit for which the customer is prepared to pay. Thus wecould classify manufacturing as a value-added activity as well as thephysical movement of the product and the means of creatingthe exchange. The old adage ‘the right product in the right place at theright time’ summarizes the idea of customer value-adding activities.Thus any activity that contributes to the achievement of that goal couldbe classified as value adding.
On the other hand, non-value-adding time is time spent on an activ-ity whose elimination would lead to no reduction of benefit to thecustomer. Some non-value-adding activities are necessary because ofthe current design of our processes but they still represent a cost andshould be minimized.
The difference between value-adding time and non-value-adding timeis crucial to an understanding of how logistics processes can be improved.Flowcharting supply chain processes is the first step towards understand-ing the opportunities that exist forimprovements in productivity throughre-engineering those processes.
Once processes have been flow-charted, the first step is to bringtogether the managers involved inthose processes to debate and agreeexactly which elements of the process can truly be described as valueadding. Agreement may not easily be achieved as no one likes to admitthat the activity they are responsible for does not actually add anyvalue for customers.
The next step is to do a rough-cut graph highlighting visually howmuch time is consumed in both non-value-adding and value-addingactivities. Figure 5.9 shows a generic example of such a graph.
5 STRATEGIC LEAD-TIME MANAGEMENT
155
The difference between value-adding time and non-value-addingtime is crucial to an understanding
of how logistics processes canbe improved.
LSCH_C05.QXD 12/11/04 12:05 pm Page 155

Figure 5.10 shows an actual analysis for a pharmaceutical productwhere the total process time was 40 weeks and yet value was onlybeing added for 6.2 per cent of that time.
It will be noted from this example that most of the value is addedearly in the process and hence it is more expensive to hold as inventory.Furthermore, much of the flexibility is probably lost as the product isconfigured and/or packaged in specific forms early in that process.Figure 5.11 shows that this product started as a combination of threeactive ingredients but very rapidly became 25 stock keeping unitsbecause it was packaged in different sizes, formats, etc., and was thenheld in inventory for the rest of the time in the company’s pipeline.
An indicator of the efficiency of a supply chain is given by itsthroughput efficiency, which can be measured as:
Value-added time––––––––––––––––––––––– × 100End-to-end pipeline time
Throughput efficiency can be as low as 10 per cent, meaning that mosttime spent in a supply chain is non-value-adding time.
LOGISTICS AND SUPPLY CHAIN MANAGEMENT
156
Rawmaterialstock
Production
Finishedproduct
In-transit
Regionalstock
Customerordercycle
Cost addedProduction, storage and transport costs and the time cost of money
ValueaddedTime,place andformutility
Fig. 5.9 Which activities add cost and which add value?
LSCH_C05.QXD 12/11/04 12:05 pm Page 156

5 STRATEGIC LEAD-TIME MANAGEMENT
157
10%
20%
30%
40%
50%
60%
70%
80%
13
57
911
1315
1719
2123
2527
2931
3335
3739
Wee
ks in
the
sup
ply
cha
in
• 6.
2 p
er c
ent
of v
alue
-ad
ded
tim
e ov
er a
40-
wee
k su
pp
ly c
hain
Supplier lead time
Inbound material
Primary conversion
Secondaryconversion
Packaging
Shipment
Distributor
Ship to customer
Distribution centre pick
% o
f tot
al c
ost
add
ed b
y lo
gist
ics
pro
cess
es
Fig.
5.1
0Va
lue
adde
d th
roug
h tim
e
LSCH_C05.QXD 12/11/04 12:05 pm Page 157

Figure 5.12 shows how cost-adding activities can easily outstrip value-adding activities.
LOGISTICS AND SUPPLY CHAIN MANAGEMENT
158
5
10
15
20
25
0 1 3 5 7 9 11 13 15 17 19 21 23 25 27 29 31 33 35 37 39
Numberof
variants
Weeks through the supply chain
• Longest period is spent at the maximum variety level• Greatest flexibility is available when the product is generic
Plot of variety through the supply chain
Fig. 5.11 Variety through time
Raw materialstock
Production
In-transit
Finishedstock
Regionalstock
Customerdelivery
Cost-adding time(Promotion, storage and transport costs and the time cost of money)
Valu
e-ad
din
g tim
e(T
ime,
pla
ce a
nd fo
rm u
tility
)
Fig. 5.12 Cost-added versus value-added time
LSCH_C05.QXD 12/11/04 12:05 pm Page 158

The challenge to pipeline management is to find ways in which theratio of value-added to cost-added time in the pipeline can beimproved. Figure 5.13 graphically shows the goal of strategic lead-timemanagement: to compress the chain in terms of time consumption sothat cost-added time is reduced.
Pipeline management is concerned with removing the blockages andthe fractures that occur in the pipeline and which lead to inventorybuild-ups and lengthened response times. The sources of these block-ages and fractures are such things as extended set-up and change-overtimes, bottlenecks, excessive inventory, sequential order processing andinadequate pipeline visibility.
To achieve improvement in the logistics process requires a focusupon the lead time as a whole, rather than the individual componentsof that lead time. In particular the interfaces between the componentsmust be examined in detail. These interfaces provide fertile ground forlogistics process re-engineering.
5 STRATEGIC LEAD-TIME MANAGEMENT
159
Raw materialstock
Production In-transit
Finishedstock
Regionalstock
Customerdelivery
Cost-adding time
Valu
e-ad
din
g tim
e
Customerdelivery
Regionalstock
In-transit
Finishedstock
Production
Raw materialstock
Fig. 5.13 Reducing non-value-adding time improves service and reducescost
LSCH_C05.QXD 12/11/04 12:05 pm Page 159
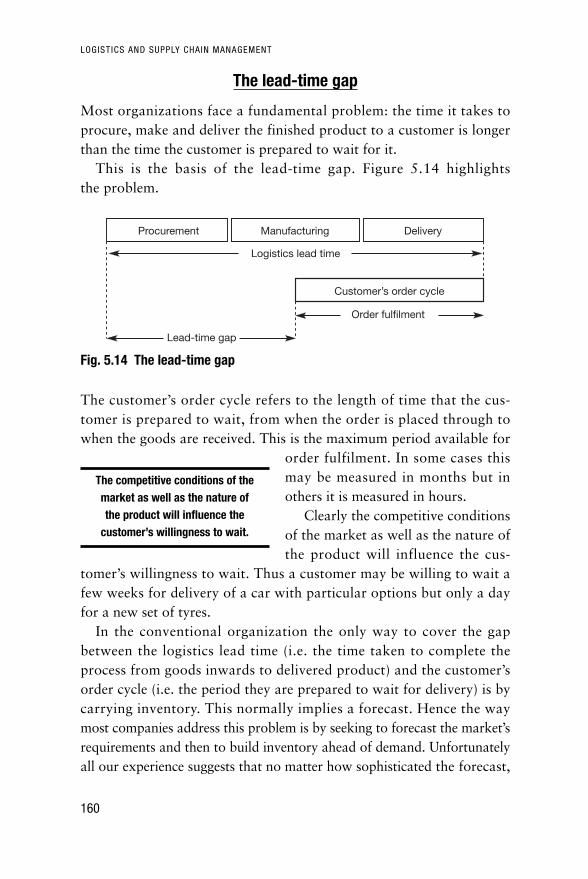
The lead-time gap
Most organizations face a fundamental problem: the time it takes toprocure, make and deliver the finished product to a customer is longerthan the time the customer is prepared to wait for it.
This is the basis of the lead-time gap. Figure 5.14 highlightsthe problem.
The customer’s order cycle refers to the length of time that the cus-tomer is prepared to wait, from when the order is placed through towhen the goods are received. This is the maximum period available for
order fulfilment. In some cases thismay be measured in months but inothers it is measured in hours.
Clearly the competitive conditionsof the market as well as the nature ofthe product will influence the cus-
tomer’s willingness to wait. Thus a customer may be willing to wait afew weeks for delivery of a car with particular options but only a dayfor a new set of tyres.
In the conventional organization the only way to cover the gapbetween the logistics lead time (i.e. the time taken to complete theprocess from goods inwards to delivered product) and the customer’sorder cycle (i.e. the period they are prepared to wait for delivery) is bycarrying inventory. This normally implies a forecast. Hence the waymost companies address this problem is by seeking to forecast the market’srequirements and then to build inventory ahead of demand. Unfortunatelyall our experience suggests that no matter how sophisticated the forecast,
LOGISTICS AND SUPPLY CHAIN MANAGEMENT
160
Logistics lead time
ManufacturingProcurement
Customer’s order cycle
Delivery
Order fulfilment
Lead-time gap
Fig. 5.14 The lead-time gap
The competitive conditions of themarket as well as the nature ofthe product will influence the
customer’s willingness to wait.
LSCH_C05.QXD 12/11/04 12:05 pm Page 160

its accuracy is always less than perfect. It has been suggested that allmistakes in forecasting end up as an inventory problem – whether toomuch or too little!
Whilst improving forecast accuracy will always be a desirable goal itmay be that the answer to the problem lies not in investing ever greatersums of money and energy in improving forecasting techniques, butrather in reducing the lead-time gap.
The company that achieves a perfect match between the logisticslead time and the customer’s required order cycle has no need of fore-casts and no need for inventory.
The challenge for logistics management is to search for the meanswhereby the gap between the two lead times can be reduced if notclosed (see Figure 5.15).
Reducing the gap can be achieved by shortening the logistics lead time(end-to-end pipeline time) whilst simultaneously trying to move thecustomer’s order cycle closer by gaining earlier warning of require-ments through improved visibility of demand.
Reducing logistics lead time
Because companies have typically not managed well the total flow ofmaterials and information that link the source of supply with the ulti-mate customer, what we find is that there is an incredibly richopportunity for improving the efficiency of that process.
In those companies that do not recognize the importance of man-aging the supply chain as an integrated system it is usually the casethat considerable periods of time are consumed at the interfacesbetween adjacent stages in the total process and in inefficiently per-formed procedures.
5 STRATEGIC LEAD-TIME MANAGEMENT
161
Logistics lead time
Customer’s order cycle
Fig. 5.15 Closing the lead-time gap
LSCH_C05.QXD 12/11/04 12:05 pm Page 161

Because no one department or individual manager has complete visi-bility of the total logistics process, it is often the case that majoropportunities for time reduction across the pipeline as a whole are notrecognized. One electronics company in Europe did not realize formany years that, although it had reduced its throughput time in the fac-tory from days down to hours, finished inventory was still sitting in thewarehouse for three weeks! The reason was that finished inventory wasthe responsibility of the distribution function, which was outside theconcern of the production management.
To enable the identification of opportunities for reducing end-to-endpipeline time an essential starting point is the construction of a supplychain map.
A supply chain map is essentially a time-based representation of theprocesses and activities that are involved as the materials or productsmove through the chain. At the same time the map highlights the timethat is consumed when those materials or products are simply standingstill, i.e. as inventory.
In these maps, it is usual to distinguish between ‘horizontal’ time and‘vertical’ time. Horizontal time is time spent in process. It could be in-transit time, manufacturing or assembly time, time spent in productionplanning or processing, and so on. It may not necessarily be time whencustomer value is being created but at least something is going on. Theother type of time is vertical time, which is time when nothing is hap-pening and hence the material or product is standing still as inventory.No value is being added during vertical time, only cost.
The labels ‘horizontal’ and ‘vertical’ refer to the maps themselveswhere the two axes reflect process time and time spent as static inven-tory respectively. Figure 5.16 depicts such a map for the manufactureand distribution of men’s underwear.
From this map it can be seen that horizontal time is 60 days. In otherwords, the various processes of gathering materials, spinning, knitting,dyeing, finishing, sewing and so on take 60 days to complete from startto finish. This is important because horizontal time determines the timethat it would take for the system to respond to an increase in demand.Hence, if there were to be a sustained increase in demand, it wouldtake that long to ‘ramp up’ output to the new level. Conversely, if therewas a downturn in demand then the critical measure is pipeline
LOGISTICS AND SUPPLY CHAIN MANAGEMENT
162
LSCH_C05.QXD 12/11/04 12:05 pm Page 162

5 STRATEGIC LEAD-TIME MANAGEMENT
163
Com
mod
itym
arke
tE
nd u
ser
(20)
(10)
(5)
(20)
(15)
(10)
(5)
(15)
(10)
(5)
(2)
Volu
me
175
day
sLe
ngth
60
day
s
Com
pon
ent
cutt
ing
(5)
Sp
inni
ng (1
5)K
nitt
ing
(10)
Sew
ing
(18)
Dye
ing
&fin
ishi
ng (7
)
Sp
inni
ngFa
bric
sup
plie
rU
nder
wea
r m
anuf
actu
rer
Ret
aile
rSto
re
Dis
trib
utio
nce
ntre
Fini
shed
good
sw
areh
ouse
Cut
wor
kb
uffe
rR
awm
ater
ial
stor
eFi
nish
edfa
bric
Gre
y st
ock
Yarn
sto
re
Yarn
fini
shed
good
s st
ore
Fib
re
Fig.
5.1
6Su
pply
cha
in m
appi
ng –
an
exam
ple
Sour
ce: S
cott,
C. a
nd W
estb
rook
, R.,
‘New
Stra
tegi
c To
ols
for S
uppl
y Ch
ain
Man
agem
ent’,
Inte
rnat
iona
l Jou
rnal
of P
hysi
cal D
istri
butio
n &
Logi
stic
s M
anag
emen
t, Vo
l. 21
, No.
1.,
1991
.
LSCH_C05.QXD 12/11/04 12:05 pm Page 163

volume, i.e. the sum of both horizontal and vertical time. In otherwords it would take 175 days to ‘drain’ the system of inventory. So involatile fashion markets, for instance, pipeline volume is a criticaldeterminant of business risk.
Pipeline maps can also provide a useful internal benchmark. Becauseeach day of process time requires a day of inventory to ‘cover’ that daythen, in an ideal world, the only inventory would be that needed tocover during the process lead time. So a 60-day total process timewould result in 60 days’ inventory. However, in the case highlightedhere there are actually 175 days of inventory in the pipeline. Clearly,unless the individual processes are highly time variable or unlessdemand is very volatile, there is more inventory than can be justified.
It must be remembered that in multi-product businesses each prod-uct will have a different end-to-end pipeline time. Furthermore, whereproducts comprise multiple components, packaging materials or sub-assemblies, total pipeline time will be determined by the speed of theslowest moving item or element in that product. Hence in procuringmaterials for and manufacturing a household aerosol air freshener, itwas found that the replenishment lead time for one of the fragrancesused was such that weeks were added to the total pipeline.
Mapping pipelines in this way provides a powerful basis for logisticsre-engineering projects. Because it makes the total process and itsassociated inventory transparent, the opportunities for reducing non-value-adding time become apparent. In many cases much of thenon-value-adding time in a supply chain is there because it is self-inflicted through the ‘rules’ that are imposed or that have beeninherited. Such rules include: economic batch quantities, economicorder quantities, minimum order sizes, fixed inventory review periods,production planning cycles and forecasting review periods.
The importance of strategic lead-time management is that it forces usto challenge every process and every activity in the supply chain and toapply the acid test of ‘does this activity add value for a customer orconsumer or does it simply add cost?’
The basic principle to be noted is that every hour of time in thepipeline is directly reflected in the quantity of inventory in the pipelineand thus the time it takes to respond to marketplace requirements.
LOGISTICS AND SUPPLY CHAIN MANAGEMENT
164
LSCH_C05.QXD 12/11/04 12:05 pm Page 164

A simple analogy is with an oil pipeline. Imagine a pipeline from arefinery to a port that is 500 kilometres long. In normal conditions therewill be 500 kilometres equivalent of oil in the pipeline. If there is achange in requirement at the end of the pipeline (say, for a differentgrade of oil) then 500 kilometres of the original grade has to be pumpedthrough before the changed grade reaches the point of demand.
In the case of the logistics pipeline it is the case that time is con-sumed not just in slow-moving processes but also in unnecessary stockholding – whether it be raw materials, work-in-progress, waiting at abottleneck or finished inventory.
Bottleneck management
All the logistics processes can be viewed as a network of inter-linkedactivities that can only be optimized as a whole by focusing on totalthroughput time. Any attempt to manage by optimizing individual ele-ments or activities in the process will lead to a less-than-optimal resultoverall. A significant contribution to the way we view logistics processeshas been made by Goldratt,2 who developed the theory of constraintsmore usually known as Optimized Production Technology (OPT).
The essence of OPT is that all activities in a logistics chain can becategorized as either ‘bottlenecks’ or ‘non-bottlenecks’. A bottleneck isthe slowest activity in a chain and whilst it may often be a machine, itcould also be a part of the information flow such as order processing.The throughput time of the entire system is determined by bottleneckactivities. It follows therefore that to speed up total system throughputtime it is important to focus on the bottlenecks, to add capacity wherepossible and to reduce set-ups and set-up times if applicable.
Equally important, however, is the realization that non-bottlenecksshould not be treated in the same way. It is unnecessary to improvethroughput at non-bottlenecks as this will only lead to the build-up ofunwanted inventory at the bottleneck. Consequently, the output ofnon-bottlenecks that feed bottlenecks must be governed by the require-ments of the bottlenecks they serve.
These ideas have profound implications for the re-engineering oflogistics systems where the objective is to improve throughput timeoverall, whilst simultaneously reducing total inventory in the system.The aim is to manage the bottlenecks for throughput efficiency, whichimplies larger batch quantities and fewer set-ups at those crucial points,
5 STRATEGIC LEAD-TIME MANAGEMENT
165
LSCH_C05.QXD 12/11/04 12:05 pm Page 165

whereas non-bottlenecks should minimize batch quantities even thoughmore set-ups will be involved. This has the effect of speeding up theflow of work-in-progress and these ‘transfer batches’ merge into larger‘process batches’ at the bottlenecks, enabling a faster flow through thebottleneck. It follows that idle time at a non-bottleneck need not be aconcern, indeed it should be welcomed if the effect is to reduce theamount of work-in-progress waiting at a bottleneck.
Emerging from the theory of constraints is the idea of ‘drum-buffer-rope’. The drum is beating the pace at which the system as a wholeshould work. The buffer is placed before the bottleneck to ensure thatthis limiting factor in the system is always working to its full capacity.The rope is drawn from an analogy with a column of marching soldierswhere the slowest man sets the pace. The rope attaches the leader ofthe column to the slowest man – in a supply chain the rope is themeans by which replenishment quantities of materials, components,etc., are communicated to suppliers.
Improving visibility of demand
The idea that it could be possible to ‘extend’ the customer’s order cyclemay at first sight seem implausible. Certainly it is unrealistic to expect thatcustomers could be persuaded to wait longer for delivery of their order – ifanything, as we have seen, the pressure is on to reduce order cycle times.
No, what is meant by extending the customer’s order cycle is that weshould seek to obtain significantly earlier warnings of the customer’srequirements. What we frequently find is that, firstly, the demand pene-tration point is too far down the pipeline and that, secondly, realdemand is hidden from view and all we tend to see are orders. Boththese points need further explanation; we will deal with the concept ofthe demand penetration point first.
The simplest definition of the demand penetration point is that itoccurs at that point in the logistics chain where real demand meets theplan. Upstream from this point everything is driven by a forecastand/or a plan. Downstream we can respond to customer demand.Clearly in an ideal world we would like everything to be demand-driven so that nothing is purchased, manufactured or shipped unlessthere is a known requirement.
A key concern of logistics management should be to seek to identifyways in which the demand penetration point can be pushed as far as
LOGISTICS AND SUPPLY CHAIN MANAGEMENT
166
LSCH_C05.QXD 12/11/04 12:05 pm Page 166

possible upstream. This might be achieved by the use of information sothat manufacturing and purchasing get to hear of what is happening inthe marketplace faster than they currently do. Figure 5.17 illustrates arange of possible demand penetration points in different industrial andmarket contexts.
Perhaps the greatest opportunity for extending the customer’s ordercycle is by gaining earlier notice of their requirements. In so many casesthe supplying company receives no indication of the customer’s actualusage until an order arrives. For example, the customer may be usingten items a day but because they order only intermittently the suppliersometimes receives an order for 100, sometimes for 150 and sometimesfor 200. If the supplier could receive ‘feed-forward’ on what was beingconsumed they would anticipate the customer’s requirement and betterschedule their own logistics activities.
In a sense the information we receive, if we only have the order torely on, is like the tip of an iceberg. Only a small proportion of thetotal iceberg is visible above the surface. Likewise the order cycle time(i.e. the required response time from order to delivery) may only be thevisible tip of the ‘information iceberg’ (see Figure 5.18).
The area below the surface of the iceberg represents the ongoingconsumption, demand or usage of the product which is hidden fromthe view of the supplier. It is only when an order is issued that demandbecomes transparent.
There are now signs that buyers and suppliers are recognizing theopportunities for mutual advantage if information on requirements canbe shared on a continuing basis. If the supplier can see right to the endof the pipeline then the logistics system can become much more respon-sive to actual demand. Thus, whilst the customer will still require everswifter delivery, if an ongoing feed-forward of information on demandor usage can be established there is a greater chance that the service tothe customer will be enhanced and the supplier’s costs reduced.
This twin-pronged approach of simultaneously seeking to reduce thelogistics lead time whilst extending the customer’s order cycle may nevercompletely close the lead-time gap. However, the experience of a grow-ing number of companies is that substantial improvements can be madeboth in responsiveness and in the early capture of information ondemand – the end result of which is better customer service at lower cost.
5 STRATEGIC LEAD-TIME MANAGEMENT
167
LSCH_C05.QXD 12/11/04 12:05 pm Page 167

LOGISTICS AND SUPPLY CHAIN MANAGEMENT
168
War
ehou
ses
Pla
nts
Dep
ots
Dis
trib
utio
nce
ntre
s
Driv
enb
yd
eman
d
Driv
enb
yfo
reca
st
Fig.
5.1
7De
man
d pe
netr
atio
n po
ints
and
str
ateg
ic in
vent
ory
LSCH_C05.QXD 12/11/04 12:05 pm Page 168

The supply chain fulcrum
At its simplest the purpose of the supply chain is to balance supply anddemand. Traditionally, as we have noted, this has been achievedthrough forecasting ahead of demand and creating inventory againstthat forecast. Alternatively, additional capacity might be maintained tocope if demand turned out to be greater than forecast. Either way,demand was balanced with supply. Figure 5.19(a) illustrates a balancewith the box marked ‘D’ representing demand and the boxes ‘I’ and ‘C’representing inventory and capacity respectively.
In other words there must be enough capacity and/or inventory to meetanticipated demand.
Now imagine that the fulcrum is moved closer to the box marked‘D’ as in Figure 5.19(b). Obviously the same amount of demand can bebalanced with less inventory and/or less capacity.
5 STRATEGIC LEAD-TIME MANAGEMENT
169
Order cycletime
Actual usage/demand
The order
Fig. 5.18 The information iceberg
D C I
Fig. 5.19(a) Balancing supply and demand
D C I
Fig. 5.19(b) Balancing supply and demand
LSCH_C05.QXD 12/11/04 12:05 pm Page 169

What does the fulcrum represent in a supply chain? The fulcrum is thepoint at which we commit to source/produce/ship the product in its finalform and where decisions on volume and mix are made. The idea beingthat if that point of commitment can be delayed as long as possible thenthe closer we are to make-to-order with all the benefits that brings.
The problem for many companies is that the fulcrum in their supplychains is more like that shown in Figure 5.19(c).
Here the fulcrum is a long way from demand, i.e. the forecasting hori-zon is long, necessitating more inventory and capacity to balanceagainst demand.
How in reality do we move the fulcrum closer to demand? The answerin effect is to improve visibility of demand along with enhancing thevelocity of the supply chain. In other words, if we can have a clearer viewof real demand in the final marketplace, rather than the distorted picturethat more typically is the case, and if we can respond more rapidly, then amore effective matching of supply and demand can be achieved.
Thus it can be argued that visibility and velocity are the foundationsfor a responsive supply chain.
Figure 5.20 indicates some of the key drivers of velocity and visibil-ity in a supply chain. Some of these drivers have already been discussedin this and earlier chapters. The remaining elements are addressed insubsequent chapters.
The case of Cisco Systems, described below, illustrates how relianceon forecasts and lack of visibility of real demand can have a dramaticimpact upon a company’s operations.
LOGISTICS AND SUPPLY CHAIN MANAGEMENT
170
D C I
Fig. 5.19(c) Balancing supply and demand
LSCH_C05.QXD 12/11/04 12:05 pm Page 170

5 STRATEGIC LEAD-TIME MANAGEMENT
171
Responsiveness Visibility Internalintegration
VelocityStreamlinedprocesses
Close tocustomers
Processmanagement
Reduce non-value-adding
timeSimplification
Close tosuppliers
Sharedinformation
Reducein-boundlead times
Reducebatch sizes
Postponement Bottleneckmanagement
Collaborativeplanning
Access toreal demand
Synchronoussupply
Strategicsourcing
Collaborativeplanning
Eventmanagement
Fig. 5.20 Velocity and visibility drive responsiveness
What went wrong at Cisco Systems?
In 2000 Cisco Systems was the world’s foremost e-business and themost valuable quoted company on the planet, more valuable even thanMicrosoft, with a market capitalization of $579bn. ‘I have never beenmore optimistic about the future of our industry as a whole or ofCisco’, CEO John Chambers declared in December 2000, projecting50 per cent annual growth for the coming year. Chambers’ optimismwas not shared by others in industry. Less technologically sophisti-cated competitors also believed that the Internet boom was over and adownturn was deepening. They were cutting back inventory levels inanticipation, unlike the bullish Cisco. Cisco was wrong, its competi-tors were right. The markets were in turmoil.
In April 2001 Cisco announced its first quarterly decline in revenuessince it was founded in 1985, along with over 8000 redundancies, arestructuring of the business and a rationalization of its portfolio ofrouters, switches and other equipment that powers the Internet andlarge corporate networks. Some of Cisco’s largest customers, the
▼
LSCH_C05.QXD 12/11/04 12:05 pm Page 171

LOGISTICS AND SUPPLY CHAIN MANAGEMENT
172
telecoms companies, were going bankrupt and market research consul-tants Forrester Research reported that 41 per cent of US companies hadpostponed e-business projects as a result of the economic downturn.1
Cisco’s own results for the quarter ending 27 January 2001 hadalready confirmed that something was going badly wrong. It showedthat the level of inventory (finished and semi-finished goods) on itsbooks had more than doubled from $1.2bn to $2.5bn over the preced-ing six months. The cost of financing its inventory had shot up from$25m to $645m in just one year. The inventory overhang was trans-lated into a $2.2bn write down. Its shares lost 88 per cent of theirvalue in a year.2 So what went wrong at Cisco?
Cisco’s optimism was born out of its combination of denial, techno-logical wizardry and the success of its business model. Its technologicallead came first from the operating software it developed to route largeamounts of data from one computer to another, using specially designedmicroprocessors. Its operational capabilities came from its online supplychain management system – the most advanced in the world. From themid-1990s Cisco’s ‘Networked Strategy’ used the Internet to createinteractive relationships, linking employees, partners, suppliers and cus-tomers together. The links enabled Cisco itself to concentrate on productdesign, while other tasks were outsourced to suppliers and contractmanufacturers. Cisco’s sophisticated automatic testing software meantthat much of the production could be outsourced to suppliers withoutany danger of quality problems going undetected.
The company had always made customer service and on-time orderfulfilment key performance indicators internally and throughout itsextended enterprise. The Internet-based network allowed customers toorder and configure online, and contract manufacturers to begin build-ing systems within 15 minutes of receipt of the order. Third-partylogistics suppliers were also linked in to the system, enabling Cisco toprovide customers with information on the status of their orders atany time. The Network Strategy facilitated direct fulfilment, which ledto a reduction in inventories, labour and shipping costs, saving Cisco$12m per year. Cycle times were further shortened by online prototypetesting of customers’ new systems, allowing lead times to be reducedfrom weeks to days. To the delight of the investment community, thiscompletely networked environment allowed Cisco to monitor demandand revenues on an hour-by-hour basis. This ‘virtual close’ facility not
▼
LSCH_C05.QXD 12/11/04 12:05 pm Page 172

5 STRATEGIC LEAD-TIME MANAGEMENT
173
only helped Cisco to run its own business, but also became a usefulmarketing tool to promote its systems to customers.
Real world problems began to impinge on Cisco’s virtual idyll inJune 2000, when a booming market led to component shortages,delaying deliveries of customer orders by three to four weeks.3 It wasby then becoming apparent that there were also communication andforecasting problems between Cisco and lower tiers of subcontractorsin the network. The problem was quickly addressed by the introduc-tion of Cisco Connection Online, linking in all subcontractors.Another innovation – the Integrated Commerce Solution (ICS) – wasintroduced soon afterwards, connecting in any remaining larger cus-tomers (mainly telecoms equipment distributors or operators) who hadpreviously been unable to link up. Thus all parties were connected inreal time to the network.
To overcome the problem of component shortages, Cisco enteredinto long-term contractual agreements with key suppliers of scarcecomponents. The forecasts for these orders were based on the projec-tions of sales staff. These were in turn based on indications of demandfrom suppliers and partners (systems integration consultants) and cus-tomer orders. What Cisco’s real-time systems failed to recognize wasthat waning confidence in delivery lead times was prompting buyers toover-order. Customers were placing multiple orders with several suppliers,accepting only the first to deliver. Cisco was itself actioning orders thatwould never be confirmed and its suppliers – who were also receivingmultiple orders from other manufacturers – would interpret and dulyreport this as a surge in demand. Cisco’s inventory cycle rose from 53.9days to over 88. The problem was eventually recognized towards theend of 2000, when Cisco began hurried implementation of its e-hubsolution, which would automatically cancel any unconfirmed orderwithin two hours. But the task of implementing the e-hub proved morecostly, complex and time consuming than expected. When the bubbleburst Cisco was left holding the inventory.
The company’s executives later explained that the scale of the inven-tory write down was partly due to the need to maintain relationshipswith its supply chain partners – notably the semiconductor manufactur-ers – by honouring long-term contractual commitments. They werealso keen to stress that the company had in fact experienced the fore-casting equivalent of ‘the 100-year flood’ and, less convincingly, they
▼
LSCH_C05.QXD 12/11/04 12:05 pm Page 173

Summary
In a world of shortening product life cycles, volatile demand and con-stant competitive pressure, the ability to move quickly is critical. It is notjust a question of speeding up the time it takes to get new products tomarket, but rather the time it takes to replenish existing demand.Markets today are often ‘time-sensitive’ as well as ‘price-sensitive’, thusthe search is for logistics solutions that are more responsive but low-cost.
Time compression in the pipeline has the potential both to speed upresponse times and to reduce supply chain cost. The key to achievingthese dual goals is through focusing on the reduction of non-value-addingtime – and particularly time spent as inventory. Whereas in the past logis-tics systems were very dependent upon a forecast, with all the problemsthat entailed, now the focal point has become lead-time reduction.
References
1. Stalk, G. and Hout, T.M., Competing Against Time, The Free Press, 1990.2. Goldratt, E.M., Theory of Constraints, North River Press, 1990.
LOGISTICS AND SUPPLY CHAIN MANAGEMENT
174
continued to insist that their systems had enabled them to respondfaster than anyone to this unprecedented downturn.
References1. Luce, E. and Kehoe, L., ‘Cisco has a Fighting Chance’, Financial Times, 5 April 2001.2. Chara, R. and Useem, J., ‘Why Companies Fail’, Fortune, 27 May 2002, pp. 36–44.3. Mukund, A. and Subhadra, K., Cisco Systems – The Supply Chain Story, ICFAI,
Centre for Management, Hyderabad, 2002.
▼
LSCH_C05.QXD 12/11/04 12:05 pm Page 174

The synchronoussupply chain
The extended enterprise and the virtual supplychain 178
The role of information in the virtual supply chain 180
Implications for logistics 183
‘Quick response’ logistics 190
Production strategies for quick response 193
Logistics systems dynamics 195
Collaboration in the supply chain 199
Vendor Managed Inventory 203
175
Chapter
6
LSCH_C06.QXD 12/11/04 12:05 pm Page 175

This chapter:
Introduces the idea of synchronization across a series ofconnected businesses to create an ‘extended enterprise’.
●
Examines the role of the logistics information systemin enabling the sharing of supply and demand dataacross the network.
●
Highlights the benefits of implementing ‘quickresponse’ logistics processes based upon enhancedpipeline visibility.
●
Outlines the ‘Forrester Effect’ and ‘acceleration effect’as key concepts from the field of industrial dynamics,explaining their significance.
●
Emphasizes the importance of collaborative workingand ‘co-makership’ as the foundation for the creationof synchronous supply chains.
LOGISTICS AND SUPPLY CHAIN MANAGEMENT
176
LSCH_C06.QXD 12/11/04 12:05 pm Page 176

In conventional supply chains each stage in the chain tends to be dis-connected from the others. Even within the same company the
tendency is for separate functions to seek to optimize their own perfor-mance. As a result the interfaces between organizations and betweenfunctions within those organizations need to be buffered with inven-tory and/or time lags. The effect of this is that end-to-end pipeline timesare long, responsiveness is low and total costs are high.
To overcome these problems it is clear that the supply chain needs toact as a synchronized network – not as a series of separate islands.Synchronization implies that each stage in the chain is connected to theother and that they all ‘march to the same drumbeat’. The way in whichentities in a supply chain become connected is through shared information.
The information to be shared between supply chain partnersincludes demand data and forecasts, production schedules, new prod-uct launch details and bill of material changes.
To enable this degree of visibility and transparency, synchronizationrequires a high level of process alignment, which itself demands ahigher level of collaborative working. These are issues to which weshall return. The box below indicates some of the key processes thatneed to be linked, upstream and downstream, to provide the founda-tion for supply chain synchronization.
6 THE SYNCHRONOUS SUPPLY CHAIN
177
● Planning and scheduling: Material positioning/visibility, advanced plan-ning, scheduling, forecasting, capacity management.
● Design: Mechanical design, electrical design, design for supply chain,component selection.
● New product introduction: Bill of materials management, prototyping,design validation, testing, production validation, transfer to volume.
● Product content management: Change generation, change impactassessment, product change release, change cut-in/phase-out.
● Order management: Order capture/configuration, available to promise,order tracking, exception management.
▼
LSCH_C06.QXD 12/11/04 12:05 pm Page 177

Figure 6.1 depicts the difference between the conventional supply chainwith limited transfer of information and the synchronous supply chainwith network-wide visibility and transparency.
The extended enterprise and the virtual supply chain
The nature of business enterprise is changing. Today’s business isincreasingly ‘boundaryless’, meaning that internal functional barriersare being eroded in favour of horizontal process management and exter-nally the separation between vendors, distributors, customers and the
LOGISTICS AND SUPPLY CHAIN MANAGEMENT
178
● Sourcing and procurement: Approved vendor management, strategicsourcing, supplier selection, component selection.
Source: Cookson, C. ‘Linking Supply Chains to Support Collaborative Manufacturing’, Ascet, Vol. 3, 2001, www.ascet.com
CustomerOEMTier 1Tier 2
(a)
OEM
Customer
Customer
Tier 1
Tier 2
Tier 1
Tier 2
(b)
Key:OEM = Original equipment manufacturerTier 1 and 2 = Supplier echelons
Fig. 6.1 Achieving synchronization through shared information: (a) beforesynchronization; (b) after synchronization
LSCH_C06.QXD 12/11/04 12:05 pm Page 178

firm is gradually lessening. This is the idea of the extended enterprise,which is transforming our thinking on how organizations compete andhow value chains might be reformulated.
Underpinning the concept of the extended enterprise is a commoninformation ‘highway’. It is the use of shared information that enablescross-functional, horizontal management to become a reality. Evenmore importantly it is information shared between partners in thesupply chain that makes possible the responsive flow of product fromone end of the pipeline to another. What has now come to be termedthe virtual enterprise or supply chain is in effect a series of relationshipsbetween partners that is based upon the value-added exchange of infor-mation. Figure 6.2 illustrates the concept.
The notion that partnership arrangements and a mentality of co-operation are more effective than the traditional arm’s-length and oftenadversarial basis of relationships is now gaining ground. Thus thesupply chain is becoming a confederation of organizations that agreecommon goals and who bring specific strengths to the overall valuecreation and value delivery system. This process is being accelerated asthe trend towards outsourcing continues. Outsourcing should not beconfused with ‘subcontracting’ where a task or an activity is simplyhanded over to a specialist. In a way it would be better to use the term‘in-sourcing’ or ‘re-sourcing’, when we refer to the quite different con-cept of partnering that the virtual supply chain depends upon. These
6 THE SYNCHRONOUS SUPPLY CHAIN
179
Sources
Suppliers
Converters
Distributors
Retailers
Consumer
Product and service flow
Information flow
Funds flow
Fig. 6.2 The extended enterprise and the virtual supply chainSource: A. T. Kearney.
LSCH_C06.QXD 12/11/04 12:05 pm Page 179

partnerships may not be for all time – quite possibly they exist only toexploit a specific market opportunity – but they will be ‘seamless’ andtruly synergetic.
The role of information in the virtual supply chain
Leading organizations have long recognized that the key to success insupply chain management is the information system. However, whatwe are now learning is that there is a dimension to information thatenables supply and demand to be matched in multiple markets, oftenwith tailored products, in ever-shorter time-frames.
This extension of the information system beyond the classical dimen-sions of simple planning and control enables time and space to becollapsed through the ability to link the customer directly to the sup-plier and for the supplier to react, sometimes in real time, to changes inthe market. Rayport and Sviokla1 have coined the term ‘marketspace’to describe the new world of electronic commerce, internets and virtualsupply chains. In the marketspace, customer demand can be identifiedas it occurs and, through CAD/CAM and flexible manufacturing, prod-ucts created in minimal batch sizes. Equally, networks of specialistsuppliers can be joined together to create innovative yet cost-effectivesolutions for complex design and manufacturing problems. The waythat Airbus now designs and assembles its advanced aeroplanes, forexample, would not be possible without the use of global informationnetworks that link one end of the value chain to the other.
The Internet has in many ways transformed the ways in whichsupply chain members can connect with each other.2 It provides a per-fect vehicle for the establishment of the virtual supply chain. Not onlydoes it enable vast global markets to be accessed at minimal cost andallow customers to shorten dramatically search time and reduce transac-tion costs, but it also enables different organizations in a supply chain toshare information with each other in a highly cost-effective way.Extranets as they have come to be termed are revolutionizing supplychain management. Organizations with quite different internal informa-tion systems can now access data from customers on sales or productusage and can use that information to manage replenishment and to alerttheir suppliers of forthcoming requirements.
LOGISTICS AND SUPPLY CHAIN MANAGEMENT
180
LSCH_C06.QXD 12/11/04 12:05 pm Page 180

One of Britain’s major retailers, Tesco, is using an extranet to linkwith its suppliers to share point-of-sale data. At the same time the com-pany is successfully running a home shopping and delivery system forconsumers over the Internet. Within the business, intranets are in placethat enable information to be shared between stores and to facilitatecommunication across the business. We are probably even now onlyscraping the surface in terms of how the Internet and its associatedtechnologies can be used to further exploit the virtual supply chain.Figure 6.3 highlights some of the current applications of Internet-basedconcepts to supply chain management.
The IT solutions now exist to enable supply chain partners to shareinformation easily and at relatively low cost. A major benefit that flowsfrom this greater transparency is that the internal operations of thebusiness can become much more efficient as a result. For example, bycapturing customer demand data sooner, better utilization of produc-tion and transport capacity can be achieved through better planning orscheduling. Figure 6.4 indicates some of the uses to which improvedlogistics information can be put.
Increasingly, it seems that successful companies have one thing incommon – their use of information and information technology toimprove customer responsiveness. Information systems are reshapingthe organization and also the nature of the linkages between organiza-tions. Information has always been central to the efficient managementof logistics but now, enabled by technology, it is providing the drivingforce for competitive logistics strategy.
We are now starting to see the emergence of integrated logistics sys-tems that link the operations of the business, such as production anddistribution, with the supplier’s operations on the one hand and the cus-tomer on the other.3 Already it is the case that companies can literallylink the replenishment of product in the marketplace with their upstreamoperations and those of their suppliers through the use of shared infor-mation. The use of these systems has the potential to convert supplychains into demand chains in the sense that the system can now respondto known demand rather than having to anticipate that demand througha forecast. Figure 6.5 describes the architecture of such a system.
6 THE SYNCHRONOUS SUPPLY CHAIN
181
LSCH_C06.QXD 12/11/04 12:05 pm Page 181

LOGISTICS AND SUPPLY CHAIN MANAGEMENT
182
Cus
tom
er s
ervi
ce•
Info
rmat
ion
and
sup
por
tp
rod
ucts
and
ser
vice
s•
Ele
ctro
nic
help
des
k•
Mas
s cu
stom
izat
ion
and
o
rder
pro
cess
ing
Mar
keti
ng c
hann
el•
Pub
lic r
elat
ions
and
ad
vert
isin
g•
Mar
ket
rese
arch
and
tes
t•
Ele
ctro
nic
mai
ls a
nd c
atal
ogue
sIn
form
atio
n re
trie
val
•O
nlin
e ne
ws
•S
tatis
tics,
rep
orts
and
dat
abas
es•
Dat
a m
inin
g•
Com
pet
itive
ana
lysi
sS
upp
lier
rela
tio
nshi
ps
•Lo
gist
ics
•P
rod
uct
sear
ch•
Ele
ctro
nic
dat
a in
terc
hang
e•
Ord
erin
g an
d p
aym
ent
•S
upp
ly c
hain
inte
grat
ion
Ele
ctro
nic
dis
trib
utio
n•
Pro
duc
t, d
ata,
info
rmat
ion
Inte
rnal
co
mm
unic
atio
ns•
Com
ple
te in
tern
al, e
xter
nal,
vert
ical
and
hor
izon
tal c
omm
unic
atio
ns•
Gro
upw
are
•E
-mai
l•
Col
lab
orat
ion
•K
now
led
ge t
rans
fer
•Te
leco
mm
utin
gH
uman
res
our
ces
and
emp
loye
e re
lati
ons
•Jo
b o
pen
ing
pos
ting
•E
xper
t se
arch
•E
mp
loye
e tr
aini
ng a
nd s
upp
ort
•D
ista
nce
lear
ning
Sal
es f
orc
e au
tom
atio
n•
On-
site
con
figur
atio
n an
d o
rder
pro
cess
ing
•S
ales
pro
cess
tra
nsfo
rmat
ion
Fina
ncia
l tra
nsac
tio
ns•
Sel
ling
and
pay
men
t•
Man
agin
g ac
coun
ts•
Cre
dit
card
pay
men
ts
Bui
ldin
g s
trat
egic
alli
ance
s•
New
slet
ters
, bul
letin
boa
rds,
dis
cuss
ion
dat
abas
es•
Sha
ring
know
led
ge a
nd e
xper
ienc
e
Inte
rnet
Intr
anet
Ext
rane
t
Fig.
6.3
Inte
rnet
app
licat
ions
and
the
supp
ly c
hain
Sour
ce: A
. T. K
earn
ey.
LSCH_C06.QXD 12/11/04 12:05 pm Page 182

Implications for logistics
In the same way that the conventional wisdom in production and manu-facturing was to maximize batch quantities, similar thinking could befound in the rest of the supply chain. Thus we used to seek to ship by thecontainer or truck load, customers were discouraged from ordering insmaller quantities by price penalties and delivery schedules were typicallybased on optimizing the efficiency of routes and the consolidation ofdeliveries. Clearly such an approach runs counter to the requirements ofa synchronous supply chain. Under the synchronization philosophy therequirement is for small shipments to be made more frequently and tomeet the precise time requirements of the customer.
The challenge to logistics management is to find ways in which thesechanged requirements can be achieved without an uneconomic escala-tion of costs. There may have to be trade-offs but the goal must be toimprove total supply chain cost effectiveness. The Smart Car case study
6 THE SYNCHRONOUS SUPPLY CHAIN
183
Planning function
• Stock management• By product/
customer• By location
• Demand forecasting• Strategy planning
Database
• External data• Customer orders• Inbound shipments
• Internal data• Production• Inventory
Control function
• Customer servicelevels
• Vendor performance• Carrier performance• System performance
Customer servicecommunication function
• Customer order status• Inventory availability
• By product• By stock location
• Outbound shipmentstatus
Co-ordination function
• Productionscheduling
• Materials requirementplanning
• Sales/marketingplanning
Fig. 6.4 Functions of a logistics information system
LSCH_C06.QXD 12/11/04 12:05 pm Page 183

LOGISTICS AND SUPPLY CHAIN MANAGEMENT
184
Dem
and
flow
dat
a
Dem
and
flow
man
agem
ent
Pro
duc
tion
sche
dul
ing
Pur
chas
ing
Cre
dit
Bill
ing
1112
1310
1
Sch
edul
ed
Req
uest
E.T
.A.
Req
ui-
sitio
n
Ava
ilab
le
Com
mitt
edB
illed
Shi
pp
ed
Fini
shed
good
sin
vent
ory
stat
us
Fini
shed
good
sw
are-
hous
ing
Tran
s-p
orta
tion
Dep
loym
ent
Fore
cast
ing
3
2
Rep
leni
shm
ent
req
uire
men
ts
Act
ual
dem
and
Allo
catio
nR
ated
ship
men
ts
Shi
pp
edLo
ads
to p
ick
Ava
ilab
leFo
reca
st d
eman
d
Eco
nom
ic s
hip
pin
g un
its
54
89
Tran
s-p
orta
tion
pla
nnin
g
Inve
ntor
yp
lann
ing
Pro
mot
ion
sche
dulin
gIn
vent
ory
cost
ing
Net
wor
king
pla
nnin
g
Shi
pm
ents
1415
716
176
18
Loca
tions
serv
ice
area
sst
ocki
ng r
ules
Rou
tes
carr
iers
rat
esR
ecei
pts
adju
stm
ents
Tran
sact
ion
rep
ortin
g
Min
imum
sm
axim
ums
EO
QP
rom
otio
nsc
hed
ules
Fig.
6.5
An in
tegr
ated
logi
stic
s in
form
atio
n sy
stem
Sour
ce: D
igita
l Equ
ipm
ent C
orpo
ratio
n.
LSCH_C06.QXD 12/11/04 12:05 pm Page 184

below demonstrates what can be achieved if the partners in the supplychain are closely linked to each other.
6 THE SYNCHRONOUS SUPPLY CHAIN
185
Smart Car’s synchronous supply chain
At the 1998 Geneva Motor Show, the car that everyone wanted to seewas the eagerly awaited ‘Smart Car’, the tiny, relatively cheap, two-seater run-around produced by Micro Compact Car (MCC). Originallyconceived as an unlikely joint venture project between Germany’sDaimler-Benz and Swiss watchmakers, SMH, MCC was soon takenover to be wholly run by Daimler-Benz. The innovative little car it pro-duced was meant to be unlike any other car currently on the road.Designed to appeal to the young urban drivers of continental Europe, itforms part of a wider urban mobility concept that includes space-savingparking, pool leasing and networking with public transport systems.The public were intrigued by the concept, the car’s odd appearance andthe prospect of using multi-media systems to allow them to order on-screen their own individually configured vehicles. Other car makerswere much more interested in MCC’s manufacturing systems.
At launch in 1998 the Smart Car could be built in only seven and ahalf hours, beating the industry’s leading performers by some two anda half hours.1 The difference in performance was due to the fact thatMCC was a very different kind of car company with a radically differ-ent approach to vehicle development and manufacturing. The firstSmart Cars were produced in a region with no previous history ofautomotive manufacturing, at a single site factory complex atHambach in eastern France. At the heart of the complex a large cruci-form building houses the main assembly line. Radiating off each armof the cruciform are a number of smaller structures, containing one ofMCC’s seven first tier suppliers or ‘system partners’. The systemspartners, a multinational collection of specialist companies, are sub-contracted to undertake large portions of the assembly process. Mostwere involved in the car’s development right from the earliest conceptstage. Unlike conventional suppliers, they provide entire subassembliesincluding the five ‘super modules’ – chassis, power train, doors androof, electronics and cockpit. The remaining parts are supplied by afurther 16 less-integrated suppliers, some located at quite a distancefrom the plant.
▼
LSCH_C06.QXD 12/11/04 12:05 pm Page 185

LOGISTICS AND SUPPLY CHAIN MANAGEMENT
186
The cars are constructed around an integral body frame, known asthe ‘Tridion’ to which the modular subassemblies are attached. Theseare delivered to the production lines on conveyor belts in sequencewith the line, from the systems partners who are linked into MCC’sorder and production scheduling systems, allowing their operationsand those of their webs of suppliers to be fully integrated in real timeinto a single synchronous supply chain.2 Learning how to producesubassemblies in lock-step with a production line that moved 88 feetper minute was one of the toughest challenges the systems partnershad to overcome. As one MCC executive observed: ‘Some suppliersunderestimated what they had to do in project management. It’s a dif-ferent job to produce a component than to be the manager of a bigmodule like a cockpit.’ Nevertheless, by 2002 the processes hadbedded in and build times had been reduced to just four hours, with anew Smart rolling off the Hambach production line every 90 seconds.All were sold and each was different from the last.
The super modules originally accounted for around 70 per cent of theengineering work on the car, but not all of the systems partners man-aged to stay the course. One company hired to build complete doorshad to be replaced and another stopped building the front end modulewhen it became clear that it could be assembled on the production lineat less cost. Nevertheless, if the three logistics companies involved in themovement of materials and cars are included into the calculations, onlyten suppliers are responsible for 85 per cent of the cost of goods.3 Thesystems partners’ involvement in modular subassemblies reduces thefinal assembler’s capital costs and the amount of working capital tied upin stocks, as suppliers are only paid once the modules are used. Some ofthe modules, such as the power train and cockpit, contain complex sub-assemblies that are necessarily assembled in advance by the suppliers.
Smart Car’s integrated manufacturing site is in fact a logical extensionof the 1990s trend that saw clusters of first tier suppliers opening dedi-cated facilities in industrial parks adjacent to large automotive customers’plants. It is also indicative of a wider trend towards integrated suppliersactually installing parts on the line, which totally blurs the distinctionbetween the car manufacturer’s own employees and those of its systemssuppliers. At Hambach over half of the 1900 people working in the com-plex and two-thirds of all production workers are not on MCC’s payroll.Ownership of the factory buildings and the site’s facilities management
▼
LSCH_C06.QXD 12/11/04 12:05 pm Page 186

The basic principle of synchronization is to ensure that all elements ofthe chain act as one and hence there must be early identification ofshipping and replenishment requirements and, most importantly of all,there must be the highest level of planning discipline.
In a synchronous supply chain the management of in-bound materialsflow becomes a crucial issue. In particular the search for consolidationopportunities has to be a priority. Thus, for example, rather than onesupplier making a series of deliveries in small quantities to a customer,the orders from a number of suppliers are combined into a single deliv-ery. It is perhaps not surprising that the emergence of synchronoussupply chains as a management philosophy has coincided with thegrowth of third-party distribution and logistics companies specializingin providing an in-bound consolidation service.
6 THE SYNCHRONOUS SUPPLY CHAIN
187
are also outsourced to specialist providers. In addition, programmemanagement and information technology operations have all been passedover to consultants Accenture on a long-term contract.
Accenture were also contracted to develop and implement the busi-ness and vehicle production processes and oversee Smart Car’sintroduction to the market.4 The cars are sold through a network ofdealerships located in special ‘lifestyle centres’ within shopping com-plexes or other frequently visited urban locations, increasingly throughsatellite branches Mercedes dealerships. To retain maximum flexibility,it was also decided that some elements of product customizationshould take place between factory and dealer at the distributioncentre, where stocks of easily interchangeable modules and body partsare held so that other features can be changed or added as required,without introducing unnecessary complexity on the production line.
References1. Simonian, Haig, ‘Carmakers’ Smart Move’, Financial Times, 1 July 1997.2. Siekman, Philip, ‘The Smart Car is Looking More so’, Fortune, 15 April 2002,
p. 310; Van Hoek, Remko and Weken, Harm, ‘How Modular Production canContribute to Integration in Inbound and Outbound Logistics’, Proceedings of theLogistics Research Network Conference, University of Huddersfield, 16–17September 1997.
3. Van Hoek, Remko, ‘E-supply Chains – Virtually Non-existing’, Supply ChainManagement: An International Journal, Vol. 6, No. 1, 2001, pp. 21–28.
4. Reuter News Service, ‘Andersen Consulting joins Smart Car Project’, Reuter NewsService – Western Europe, Reuter Textline, 18 February 1997 (Q2:23).
LSCH_C06.QXD 12/11/04 12:05 pm Page 187

These logistics service companies can manage the pick-up of materi-als and components from suppliers on a ‘milk round’ basis, using acentral ‘hub’ or transhipment centre for re-sorting and consolidatingfor in-bound delivery. They may also perform certain value-addingactivities such as quality control, kitting, sequencing or final finishing.
A good example of such a third-party service is that provided in theUK by TNT on behalf of the Rover Group car company. Here bothsuppliers and TNT deliver consolidated loads to a specially designedtranshipment centre owned and operated by TNT near to Rover’s fac-tory. Components and subassemblies are then sequenced for delivery tothe point of use on the assembly line in the required quantities at therequired time. This enables the smooth flow of in-bound material withno congestion of delivery vehicles at the plant.
In complex assembly operations such as motor manufacture theprior sequencing of parts and components prior to assembly is a crucialactivity (see the example below of seat delivery to Nissan’s assemblyline in north-east England).
LOGISTICS AND SUPPLY CHAIN MANAGEMENT
188
■ Synchronized delivery ■
How Nissan Motors UK receives vehicle seats
Elapsed hours
0 – Painted body passes to trim line in Nissan– Precise vehicle specifications of next 12 vehicles transmitted by
computer from Nissan to seat suppliers– Supplier transfers information to picking lists– Seat covers selected from range
1 – Covers prepared for assembly (in reverse order)– Seat assembly from synchronized manufacture of subassemblies
(frames, foams, finishers, plastic parts)
2 – Quality audit and load– Delivery of seats to stock holding point by special purpose vehicle– Stock to lineside
3 – Rear seats fitted followed by front seats (waiting stillages returnedto empty wagon)
– Delivery frequency now every 15–20 minutes
LSCH_C06.QXD 12/11/04 12:05 pm Page 188

Similar developments have enabled the transformation of retail logis-tics. The idea of ‘stockless distribution centres’ or ‘cross-docking’enables a more frequent and efficient replenishment of product frommanufacture to individual stores. Cross-docking, often facilitated by alogistics service provider, is a single, but powerful, concept. Point-of-sale data from individual stores is transmitted to the retailer’s headoffice to enable them to determine replenishment requirements. Thisinformation is then transmitted directly to the suppliers who assembleorders for specific stores and the pallets or cases are then bar-coded (orincreasingly electronically tagged). On a pre-planned basis these storeorders are then collected by the logistics service provider and are takento a transhipment centre (the ‘cross-dock’ facility) – possibly operatedby the logistics service provider – where they are sorted for store deliv-ery along with other suppliers’ orders. In effect, a just-in-time deliveryis achieved, which enables minimum stock to be carried in the retailstores, and yet transport costs are contained through the principles ofconsolidation (see Figures 6.6 and 6.7).
6 THE SYNCHRONOUS SUPPLY CHAIN
189
Supplier
Supplier
SupplierSupplier
Supplier
Logisticsservice
company
Headoffice
Store
Store
Store
Store
Store
Fig. 6.6 Daily sales data drives the replenishment order system
LSCH_C06.QXD 12/11/04 12:05 pm Page 189

‘Quick response’ logistics
An outgrowth of the synchronization philosophy has emerged in recentyears under the banner of ‘quick response’ logistics.4 The basic ideabehind quick response (QR) is that in order to reap the advantages oftime-based competition it is necessary to develop systems that are
responsive and fast. Hence QR is theumbrella term for the informationsystems and the logistics systems thatcombine to provide ‘the right productin the right place at the right time’.
What has made QR possible is thedevelopment of information tech-nology and in particular the rise of
Internet-enabled data exchange, bar coding, the use of electronic pointof sale (EPOS) systems with laser scanners and so on.
Essentially the logic behind QR is that demand is captured in asclose to real-time as possible and as close to the final consumer as
LOGISTICS AND SUPPLY CHAIN MANAGEMENT
190
Supplier
Supplier
Supplier
Supplier
Supplier
Logisticsservice
company
Store
Store
Store
Store
Store
Consolidatedlocal delivery
Transhipmentcentre
Scheduledpick-ups fromsuppliers
Fig. 6.7 Acting on this information a consolidated pick-up and store deliverysequence is activated
The basic idea behind quickresponse (QR) is that in order to
reap the advantages of time-basedcompetition it is necessary to
develop systems that areresponsive and fast.
LSCH_C06.QXD 12/11/04 12:05 pm Page 190

possible. The logistics response is then made directly as a result of thatinformation. An example of such an approach is provided in the UnitedStates by Procter & Gamble who receive sales data directly from thecheck-out counters of North America’s largest retailer, Wal-Mart.Making use of this information P&G can plan production and scheduledelivery to Wal-Mart on a replenishment basis. The result is that Wal-Mart carries less inventory yet has fewer stock-outs and P&G benefitbecause they get better economies in production and logistics as aresult of the early warning and – most importantly – they have greatlyincreased their sales to Wal-Mart. Whilst the investment in the infor-mation system is considerable, so too is the payback. Early experiencewith QR suggests that paybacks of less than two years can be expected.
QR is obviously a classic case of the substitution of information forinventory. Figure 6.8 indicates the relative advantage of QR whenhigher service levels are demanded. Whilst QR may have a high fixedcost the incremental costs of service improvements are relatively low.
A further feature in favour of QR systems is that by speeding up pro-cessing time in the system, cumulative lead times are reduced. This canthen result in lower inventory (see Figure 6.9) and thus further reduceresponse times. In effect a ‘virtuous circle’!
Quick response systems have begun to emerge in the fashion andapparel industry where the costs of traditional inventory-based systemsbased upon buyers’ prior purchase decisions (in effect a ‘push’ system)
6 THE SYNCHRONOUS SUPPLY CHAIN
191
Service level
Cos
t
Inventory
Quickresponse
Fig. 6.8 Quick response system versus inventory-based system
LSCH_C06.QXD 12/11/04 12:05 pm Page 191

can be considerable. In the United States it is estimated that the annualcosts to the US textile and apparel industry of conventional logisticssystems is $25 billion. This comprises the following elements:
Forced markdowns $14.08bnStock-outs $6.08bnInventory carrying costs $5.08bnTotal: $25.24bn
There could be massive advantages to be gained by all parties in thesupply chain if the concept of QR was adopted throughout the chain.Thus in the case of fashion garments the aim should be to link retailsales with the apparel manufacturers, who in turn are linked to the tex-tile producers who themselves are linked to the suppliers of fibres. Onesuch reported case is the linkage through shared information of the UStextile company Milliken with the Seminole Manufacturing Company (amanufacturer of men’s slacks) and the retailer Wal-Mart. Informationon end-user demand was captured at the point of sale and rapidly fedback up the supply chain, enabling dramatic reductions in lead times tobe achieved and hence substantial reductions in inventory.
LOGISTICS AND SUPPLY CHAIN MANAGEMENT
192
Quick response
Reducedlead times
Lesspipeline
inventory
Less inventoryrequired
Lesssafety stock
Reducedforecasting
error
Fig. 6.9 Quick response system can trigger a ‘virtuous circle’ in logistics
LSCH_C06.QXD 12/11/04 12:05 pm Page 192

Another case from the US is provided by the chain of retail fashionstores, The Limited. Each of the several thousand stores in the chaintracks consumer preferences daily using their point-of-sale data. Basedupon this, orders are sent by satellite links to the suppliers around theworld. Using Hong Kong as a consolidation centre, goods are flownback to The Limited’s distribution centre in Columbus, Ohio. At the dis-tribution centre the goods are price-marked and re-sorted for immediateonward shipment by truck and plane to the retail stores. The whole cyclefrom reorder to in-store display can be achieved in six weeks.Conventional systems take more like six months.
Production strategies for quick response
As the demand by all partners in the supply chain for a quick responseincreases, the more will be the pressure placed upon manufacturing tomeet the customer’s needs for variety in shorter and shorter time-frames.
The answer has to lie in flexibility. As we have already observed, if itwere possible to reduce manufacturing and logistics lead times to zerothen total flexibility could be achieved. In other words the organizationcould respond to any request that was technologically feasible in anyquantity. Whilst zero lead times are obviously not achievable, the newfocus on flexible manufacturing systems (FMS) has highlighted the pos-sibility of substantial progress in this direction.
The key to flexibility in manufacturing is not just new technology, e.g.robotics, although this can contribute dramatically to its achievement.The main barrier to flexibility is the time taken to change; to changefrom one level of volume to another and to change from making onevariant to another. Typically we call this ‘set-up time’. It will be appar-ent that if set-up times can be driven as close as possible to zero thenflexible response to customer requirements presents no problem.
The Japanese, not surprisingly, have led the way in developing tech-niques for set-up time reduction. ‘Single minute exchange of die’, orSMED, is the goal in many Japanese plants. In other words continuousattention by management and the workforce is focused upon the waysin which set-up times can be reduced. Sometimes it will involve newtechnology, but more often than not it is achieved through taking atotally different look at the process itself. In many cases set-up times
6 THE SYNCHRONOUS SUPPLY CHAIN
193
LSCH_C06.QXD 12/11/04 12:05 pm Page 193

have been reduced from hours down to minutes, simply by questioningthe conventional wisdom.
What in effect we are seeing is a fundamental shift away from theeconomies of scale model, which is volume based and hence implieslong production runs with few change-overs, to the economies of scopemodel, which is based upon producing small quantities of a widerrange, hence requiring more change-overs.
It has been suggested that under the economies of scope model:
…a single plant can produce a variety of output at the same cost as (if notlower than) a separate plant, dedicated to producing only one type ofproduct at a given level. In other words an economic order quantity (EOQ)of one unit, and specific production designs, engender no additional costs.Economies of scope change the materials-driven, batch-system technologyinto a multi-functional, flow system configuration.5
The marketing advantages that such flexibility brings with it are con-siderable. It means that in effect the company can cater for the preciseneeds of multiple customers, and instead of the old Henry Ford Model‘T’ motto – ‘Any colour you like, as long as it’s black’ – we can offereven higher levels of customization. In today’s marketplace where cus-tomers seek individuality and where segments or ‘niches’ are gettingever smaller, a major source of competitive advantage can be gained bylinking production flexibility to customers’ needs for variety.
A classic example is provided by Benetton, the Italian fashion goodsmanufacturer and distributor, who have created a worldwide businessbased upon responsiveness to fashion changes – with a particularemphasis upon colour. By developing an innovative process wherebyentire knitted garments can be dyed in small batches, they reduced theneed to carry inventory of multiple colours, and because of the smallbatch sizes for dying they greatly enhanced their flexibility. Benetton’sspeed of response is also assisted by the investment that they have madein high-speed distribution systems, which are themselves aided by rapidfeedback of sales information from the marketplace.
Many companies are now seeking to construct supply chains toenable them to support a marketing strategy of mass customization.The idea behind this is that today’s customers in many markets areincreasingly demanding tailored solutions for their specific require-ments. The challenge is to find ways of achieving this marketing goal
LOGISTICS AND SUPPLY CHAIN MANAGEMENT
194
LSCH_C06.QXD 12/11/04 12:05 pm Page 194

without increasing finished goods inventory and without incurring thehigher costs of production normally associated with make-to-order.
Often this can be achieved by postponing the final configuration orassembly of the product until the actual customer requirement isknown – a strategy pursued by Dell and Hewlett Packard for example.
In other cases high technology in the form of computer-aided design/computer-aided manufacturing (CAD/CAM) can provide the means forthis mass customization.
Logistics systems dynamics
One of the major advantages of moving to QR and synchronous supplychain strategies is that, by reducing lot quantities and increasing therate of throughput in the logistics system, modulations in the level ofactivity in the pipeline can be reduced.
Logistics systems are prone to what has been called the ‘Bullwhip’ or‘Forrester Effect’, after Jay Forrester, who developed a set of techniquesknown as Industrial Dynamics.6 Forrester defined industrial dynamics as:
The study of the information feedback characteristics of industrial activityto show how organizational structure, amplification (in policies) and timedelays (in decisions and returns) interact to influence the success of theenterprise. It treats the interactions between the flows of information,money, orders, materials, personnel, and capital equipment in a company,an industry or a national economy.
Industrial dynamics provides a single framework for integrating the func-tional areas of management – marketing, production, accounting, researchand development and capital investment.
Using a specially developed computer simulation language, DYNAMO,Forrester built a model of a production/distribution system involvingthree levels in the distribution channel: a retailer’s inventory, a distribu-tor’s inventory and a factory inventory. Each level was interconnectedthrough information flows and flows of goods. The model used realworld relationships and data and included parameters such as ordertransmission times, order processing times, factory lead times and ship-ment delivery times. Management could then examine the effects on thetotal system of, say, a change in retail sales or the impact of changingproduction levels or any other policy change or combination of changes.
6 THE SYNCHRONOUS SUPPLY CHAIN
195
LSCH_C06.QXD 12/11/04 12:05 pm Page 195

What becomes apparent from this modelling of complex systems isthat small disturbances in one part of the system can very quicklybecome magnified as the effect spreads through the pipeline.
For example, many consumer product companies that are heavyspenders on trade promotions (e.g. special discounts, incentives, etc.)do not realize what the true costs of such activities are. In the firstinstance there is the loss of profit through the discount itself, and thenthere is the hidden cost of the disturbance to the logistics system.Consider first the loss of profit. When a discount is offered for a lim-ited period then that discount obviously will apply to all sales – not justany incremental sales. So if sales during the promotional period are,say, 1100 cases but without the promotion they would have been 1000,then whilst the incremental revenue comes only from the additional100 cases, the discount applies to all 1100. Additionally the retailermay decide to take advantage of the discount and ‘forward order’; inother words buy ahead of requirement to sell at a later time at the regu-lar price. One study7 found that for these reasons only 16 per cent ofpromotions were profitable, the rest only ‘bought sales’ at a loss.
The second impact of promotional activity on profit is the potentialit provides for triggering the ‘acceleration effect’ and hence creating aForrester-type surge throughout the logistics pipeline. This is because inmost logistics systems there will be ‘leads and lags’, in other words theresponse to an input or a change in the system may be delayed. Forexample, the presence of a warehouse or a stock holding intermediaryin the distribution channel can cause a substantial distortion in demandat the factory. This is due to the ‘acceleration effect’, which can causeself-generated fluctuations in the operating characteristics of a system.
As an example, imagine a retailer who has an inventory managementreordering strategy based on starting each week with the equivalent ofthree weeks’ demand in stock. So if weekly demand were 100 units for aparticular item the target starting inventory would be 300 (i.e. 100 × 3).Now let us assume that as a result of a promotion demand increases by10 per cent to 110. This means that the system would place an order tobring the next week’s starting inventory up to 330 (i.e. 110 × 3). So there-order quantity would have to be 140 (i.e. the 110 units sold to con-sumers plus the extra 30 required to meet the new starting level).
LOGISTICS AND SUPPLY CHAIN MANAGEMENT
196
LSCH_C06.QXD 12/11/04 12:05 pm Page 196

In this particular case an increase in consumer demand of 10 per centleads to a one-off increase in demand on the supplier of 40 per cent!
If in the next period consumer demand were to fall back to its oldlevel then the same effect would happen in reverse.
It is not unusual for companies undertaking frequent promotionalactivity to experience considerable upswings and downswings in fac-tory shipments on a continuing basis. Figure 6.10 illustrates the laggedand magnified effect of such promotional activity upon the factory. Itcan be imagined that such unpredictable changes in production require-ment add considerably to the unit costs of production. In the case of USretailer Kmart previously described (see page 93), it has been suggestedthat high levels of promotional activity led to a loss of control of theirsupply chain and hence to their cash flow crisis.
In the grocery industry, where much of this promotional activity isfound, there is a growing recognition of the need to achieve a closerlinkage between the ordering policies of the retail trade and the manu-facturing schedules of the supplier. In the United States it was estimatedthat the time from the end of the production line to purchase by theconsumer in a retail store was 84 days for a typical dry grocery product(see Figures 6.11 and 6.12).
6 THE SYNCHRONOUS SUPPLY CHAIN
197
Volume
Norm
Retailsales
Productionrequirement
Fig. 6.10 The impact of promotional activity upon production requirement
LSCH_C06.QXD 12/11/04 12:05 pm Page 197

LOGISTICS AND SUPPLY CHAIN MANAGEMENT
198
Retailer Manufacturer
Inventorydepletion
Ordertransmission
Receive orderand initiateprocessing
Initiateorder
Removeproduct from
shelf
In-storeinventorystorage
Place onshelf
Orderprocessing
Authorizeshipment
Delivery
Receiveshipment and
store
Retailwarehouse
storage
Interface Purchasematerials
Rawmaterialstorage
Ware-houseorder
Completeproductionand store
ProductionManufacturer
inventorydepletion Initiate
productioncycle
Fig. 6.11 Grocery industry delivery system order cycleSource: Grocery Manufacturers Association of America.
Retailer Manufacturer
Initiateorder
Inventorydepletion
Ordertransmission
Completeproductionand store
Production
Manufacturerinventorydepletion
Initiateproduction
cycle
Purchasematerials
Authorizeshipment
Interface
Delivery
Receiveshipmentand store
Placeon shelf Retail
warehousestorage
Initiateorder
Removeproduct
from shelf
1 day
Receive orderand initiateprocessing
1–3 days
36 days
6 days
18 days
24 days
Orderprocessing
Warehousestorage
Raw materialstorage
Fig. 6.12 Grocery industry product flowSource: Grocery Manufacturers Association of America.
LSCH_C06.QXD 12/11/04 12:05 pm Page 198

This means that the ‘tidal wave’ effect of changes in demand can beconsiderably magnified as they pass through all the intermediate stockholding and reorder points. One of the benefits of a quick responsesystem is that by linking the retail check-out desk to the point of pro-duction through electronic data transfer, the surge effect can bedramatically reduced. This fact alone could more than justify the initialinvestment in linked buyer/supplier logistics information systems.
Collaboration in the supply chain
It will be clear that none of the benefits of synchronous supply can beachieved without high levels of collaboration across the network.
The benefits of collaboration are well illustrated by the often quotedexample of the ‘prisoner’s dilemma’. The scenario is that you and yourpartner have been arrested on suspicion of robbing a bank. You areboth put in separate cells and not allowed to communicate with eachother. The police officer tells you both independently that you will beleniently treated if you confess, but less well so if you do not!
In fact the precise penalties are given to you as follows:
Option 1: You confess but your partner doesn’t.Outcome: You get one year in jail for co-operating but your partner
gets five years.
Option 2: You don’t confess but your partner does.Outcome: You get five years in jail and your partner gets only one
year for co-operating.
Option 3: Both of you confess.Outcome: You get two years each.
Option 4: Neither of you confess.Outcome: You both go free.
These options and outcomes can be summarized in the matrix inFigure 6.13.
6 THE SYNCHRONOUS SUPPLY CHAIN
199
LSCH_C06.QXD 12/11/04 12:05 pm Page 199

What is the most likely outcome? If neither you nor your partner reallytrusts the other, particularly if previous experience has taught you to bewary of each other, then both of you will confess. Obviously the beststrategy is one based on trust and hence for neither party to confess!
This simple example provides a good analogy with the real world.The conventional wisdom of purchasing has tended towards the viewthat multiple sources of supply for a single item are to be preferred. Insuch situations, it is argued, one is unlikely to become too reliant upona single source of supply. Furthermore we can play one supplier offagainst another and reduce the cost of purchases. However, such rela-tionships tend to be adversarial and, in fact, sub-optimal.
One of the first things to suffer when the relationship is based onlyupon negotiations about price is quality. The supplier seeks to minimizehis costs and to provide only the basic specification. In situations likethis the buyer will incur additional costs on in-bound inspection andre-work. Quality in respect of service is also likely to suffer when thesupplier does not put any particular priority on the customer’s order.
At a more tangible level those customers who have moved over tosynchronous supply with the consequent need for JIT deliveries havefound that it is simply impractical to manage in-bound shipments frommultiple suppliers. Similarly the communication of orders and replen-ishment instructions is so much more difficult with multiple suppliers.
LOGISTICS AND SUPPLY CHAIN MANAGEMENT
200
2,2
5,1
1,5
0,0
Confess Don’t confess
Con
fess
Don
’t co
nfes
sPar
tner
You
Fig. 6.13 The prisoner’s dilemma: penalty options (years in jail)
LSCH_C06.QXD 12/11/04 12:05 pm Page 200

The closer the relationship between buyer and supplier the more likelyit is that the expertise of both parties can be applied to mutual benefit.For example, many companies have found that by close co-operationwith suppliers they can improve product design, value-engineer compo-nents, and generally find more efficient ways of working together.
This is the logic that underlines the emergence of the concept of ‘co-makership’ or ‘partnership sourcing’. Co-makership may be defined as:
The development of a long-term relationship with a limited numberof suppliers on the basis of mutual confidence.
The basic philosophy of co-makership is that the supplier should beconsidered to be an extension of the customer’s operations with theemphasis on continuity and a ‘seamless’ end-to-end pipeline. As thetrend to outsourcing continues so must the move towards co-makership.Nissan Motors in the UK have been one of the leading advocates of thisconcept. A key element of their approach is the use of ‘supplier devel-opment teams’, which are small groups of Nissan specialists who willhelp suppliers to achieve the requirements that Nissan places uponthem. The overall objective of the supplier development team is toreduce the costs and increase the efficiency for both parties – in otherwords a ‘win-win’ outcome. Because the cost of materials in an auto-mobile can be as high as 85 per cent, anything that can reduce the costsof purchased supplies can have a significant effect on total costs.
Figure 6.14 depicts a not-untypical situation where a car manufac-turer’s purchased materials are 85 per cent of total costs. This is thenexploded further where it is shown that the material costs of the compo-nent supplier are a figure closer to the average for manufacturing industryof 40 per cent. Of the remaining 60 per cent (‘supplier value added’), 80per cent of that figure might be accounted for by overheads, of which typ-ically 30 per cent or so would be accounted for by the supplier’s logisticscosts (i.e. inventory, set-up costs transport, warehousing, etc.).
What this implies is that approximately 12 per cent of the cost ofmaterials to the car manufacturer are accounted for by the supplier’slogistics costs (i.e. 85 per cent × 60 per cent × 80 per cent × 30 percent). When it is realized that a proportion of the supplier’s logisticscosts are caused by the lack of integration and partnership between thecar manufacturer and the supplier, it becomes apparent that a majoropportunity for cost reduction exists.
6 THE SYNCHRONOUS SUPPLY CHAIN
201
LSCH_C06.QXD 12/11/04 12:05 pm Page 201

Under the traditional adversarial relationship the vehicle manufacturerwould seek to reduce his material cost by squeezing the profit margin ofthe component suppliers. The co-makership approach is quite different– here the vehicle manufacturer seeks to reduce a supplier’s costs, not hisprofits. Through collaboration and closely integrated logistics planningmechanisms the two parties seek to achieve a situation where there arebenefits to both parties. Companies like Nissan Motors in the UK haveshown that this is not a Utopian dream but can be a practical reality.
The principle of co-makership can be extended in both directions inthe supply chain – upstream to suppliers and downstream to distribu-tors, retailers and even end users. The prizes to be won from successfulco-makership potentially include lower costs for all parties through
reduced inventories and lower set-upcosts as a result of better scheduleintegration. The implications forcompetitive strategy are profound.The new competitive paradigm isthat supply chain competes withsupply chain and the success of anyone company will depend upon how
well it manages its supply chain relationships.One example of collaboration in the supply chain that is increasingly
encountered is the concept of Vendor Managed Inventory.
LOGISTICS AND SUPPLY CHAIN MANAGEMENT
202
Valueadded 15%
Componentsuppliers
Materialcosts 85%
Vehiclemanufacturer
Materialcosts 40%
Suppliervalue
added 60%Overheads
and indirects80%
Logisticscosts 30%
Fig. 6.14 The impact of suppliers’ logistics costs on the costs of a car
The new competitive paradigm isthat supply chain competes withsupply chain and the success of
any one company will depend uponhow well it manages its supply
chain relationships.
LSCH_C06.QXD 12/11/04 12:05 pm Page 202

Vendor Managed Inventory
Traditionally, customers place orders on their suppliers. Whilst thelogic of this might seem obvious, the inherent inefficiencies are signifi-cant. Firstly, the supplier has no advance warning of requirements –they are forced to make forecasts and, as a result, carry unnecessarysafety stocks. Secondly, the supplier is often faced with unexpectedshort-term demands for products, which leads to frequent changes totheir production and distribution schedules and thus additional cost.The paradoxical end result is that customer service suffers because ofthe inevitably higher level of stock-outs.
There is now emerging an alternative way of managing demand. Inthis revised model the customer no longer places orders but insteadshares information with the vendor. This information relates to theactual usage or sales of their product, their current on-hand inventoryand details of any additional marketing activity such as promotions.
On the basis of this information, the supplier takes responsibility forreplenishment of the customer’s inventory. No orders are received, butinstead an indication is given by the customer of the upper and lowerlimits of stock that they wish to keep on hand.
It is the responsibility of the supplier to maintain the customer’sinventory within the specified stock bands.
The benefit to the customer is that inventory levels can be signifi-cantly reduced whilst the risk of stock-outs diminishes. Furthermore itis often the case that the customer does not pay for the inventory untilafter it has been sold or used – so there is a considerable cash flow ben-efit. The advantage to the supplier is that because they have directaccess to information on real demand, usually transmitted throughElectronic Data Interchange (EDI) or web-based systems, they canmuch better plan and schedule production and distribution – thusimproving capacity utilization – and at the same time the requirementfor safety stock is considerably reduced.
This system of demand management and replenishment is known asVendor Managed Inventory (VMI). However, because such arrange-ments are usually based upon close co-operation between the customerand the supplier, the term Co-managed Inventory (CMI) is probablymore appropriate.
6 THE SYNCHRONOUS SUPPLY CHAIN
203
LSCH_C06.QXD 12/11/04 12:05 pm Page 203

Summary
The key to supply chain responsiveness is synchronization.Synchronization implies that each entity in the network is closely con-nected to the others and that they share the same information. In thepast there was often limited visibility, either upstream or downstream,meaning that organizations were forced to act independently, makingtheir own forecasts, and, as a result, inevitably relying upon a ‘push’rather than a ‘pull’ philosophy.
Underpinning successful supply chain synchronization is, firstly, theinformation systems capability to capture data on supply and demandand, secondly, a spirit of co-operation across the so-called ‘extendedenterprise’. In practice it is the latter issue that tends to limit the extentto which synchronization can be achieved.
Nevertheless, as more examples of the financial benefits of ideas likequick response and Vendor Managed Inventory come to be publicised,the likelihood is that supply chain synchronization will come to bemore widely practised.
References
1. Rayport, J.F. and Sviokla, J.J., ‘Managing in the Marketspace’, HarvardBusiness Review, November–December 1994.
2. Chandrashekar, A. and Schary, P., ‘The Virtual Web-Based Supply Chain’, inFranke, U. (ed.), Managing Virtual Web Organizations in the 21st Century, IdeaGroup Publishing, 2002.
3. Heinrich, C., Adapt or Die: Transforming your Supply Chain into an AdaptiveBusiness Network, John Wiley & Sons, 2003.
4. Lowson, R., King, R. and Hunter, A., Quick Response: Managing the SupplyChain to Meet Consumer Demand, John Wiley & Sons, 1999.
5. Lei, D. and Goldhars, J.D., ‘Computer-Integrated Manufacturing: Redefiningthe Manufacturing Firm into a Global Service Business’, International Journal ofOperations & Production Management, Vol. 11, No. 10, 1991.
6. Forrester, J., Industrial Dynamics, MIT Press, 1961.7. Abraham, M.M. and Lodish, L.M., ‘Getting the Most out of Advertising and
Promotion’, Harvard Business Review, May–June 1990.
LOGISTICS AND SUPPLY CHAIN MANAGEMENT
204
LSCH_C06.QXD 12/11/04 12:05 pm Page 204

Managing the globalpipeline
The trend towards globalization in the supply chain209
Gaining visibility in the global pipeline 217
Organizing for global logistics 222
Thinking global, acting local 225
205
Chapter
7
LSCH_C07.QXD 12/11/04 12:05 pm Page 205

This chapter:
Discusses the globalization of industry, the emergenceof global companies and the trend towards globalproduction, distribution and marketing strategies.
●
Explores the implications of some of the most signifi-cant aspects of globalization in the supply chain:focused factories, centralization of inventories andpostponement and localization.
●
Identifies the most pressing challenges for logisticsmanagers arising from the globalization of supplychains.
●
Considers how managers might structure and managea global logistics network, balancing the benefits ofcentralized logistics planning with the need to meetlocalized customer demands.
●
Raises issues of outsourcing and the co-ordination ofnetwork partners and the critical role of logisticsinformation in managing a global logistics pipeline.
LOGISTICS AND SUPPLY CHAIN MANAGEMENT
206
LSCH_C07.QXD 12/11/04 12:05 pm Page 206

Global brands and companies now dominate most markets. Overthe last two decades there has been a steady trend towards the
worldwide marketing of products under a common brand umbrella –whether it be Coca-Cola or Marlborough, IBM or Toyota. At the sametime the global company has revised its previously localized focus,manufacturing and marketing its products in individual countries, andnow instead will typically source on a worldwide basis for global pro-duction and distribution.
The logic of the global company is clear: it seeks to grow its businessby extending its markets whilst at the same time seeking cost reductionthrough scale economies in purchasing and production and throughfocused manufacturing and/or assembly operations.
However, whilst the logic of globalization is strong, we must recog-nize that it also presents certain challenges. Firstly, world markets arenot homogeneous, there is still a requirement for local variation inmany product categories. Secondly, unless there is a high level of co-ordination the complex logistics of managing global supply chains mayresult in higher costs and extended lead times.
These two challenges are related: on the one hand, how to offer localmarkets the variety they seek whilst still gaining the advantage of stan-dardized global production and, on the other, how to manage the links inthe global chain from sources of supply through to end user. There is adanger that some global companies in their search for cost advantage maytake too narrow a view of cost and only see the purchasing or manufactur-ing cost reduction that may be achieved through using low-cost supplysources. In reality it is a total cost trade-off where the costs of longersupply pipelines may outweigh the production cost saving. Figure 7.1 illus-trates some of the potential cost trade-offs to be considered in establishingthe extent to which a global strategy for logistics will be cost-justified.Clearly a key component of the decision to go global must be the serviceneeds of the marketplace. There is a danger that companies might run therisk of sacrificing service on the altar of cost reduction through a failure tofully understand the service needs of individual markets.
7 MANAGING THE GLOBAL P IPELINE
207
LSCH_C07.QXD 12/11/04 12:05 pm Page 207

The trend towards global organization of both manufacturing andmarketing is highlighting the critical importance of logistics and supply
chain management as the keys toprofitability. The complexity of thelogistics task appears to be increasingexponentially, influenced by suchfactors as the increasing range ofproducts, shorter product life cycles,marketplace growth and the numberof supply/market channels.
There is no doubting that the globalization of industrial activity hasbecome a major issue in business. Articles in the business press, semi-nars and academic symposia have all focused upon the emerging globaltrend. The competitive pressures and challenges that have led to thisupsurge of interest have been well documented. What are less wellunderstood are the implications of globalization for operations man-agement in general and specifically for logistics management.
At the outset it is important that we define the global business andrecognize its distinctiveness from an international or a multinationalbusiness. A global business is one that does more than simply export.The global business will typically source its materials and componentsin more than one country. Similarly it will often have multiple assemblyor manufacturing locations geographically dispersed. It will subse-quently market its products worldwide. A classic example is the Singer
LOGISTICS AND SUPPLY CHAIN MANAGEMENT
208
Transport(source to user)
Inventory
Materials
Production
GlobalLocalized
Degree of globalization(production/sourcing/marketing)
Co
sts
Fig. 7.1 Trade-offs in global logistics
The trend towards globalorganization of both manufacturingand marketing is highlighting the
critical importance of logistics andsupply chain management as the
keys to profitability.
LSCH_C07.QXD 12/11/04 12:05 pm Page 208
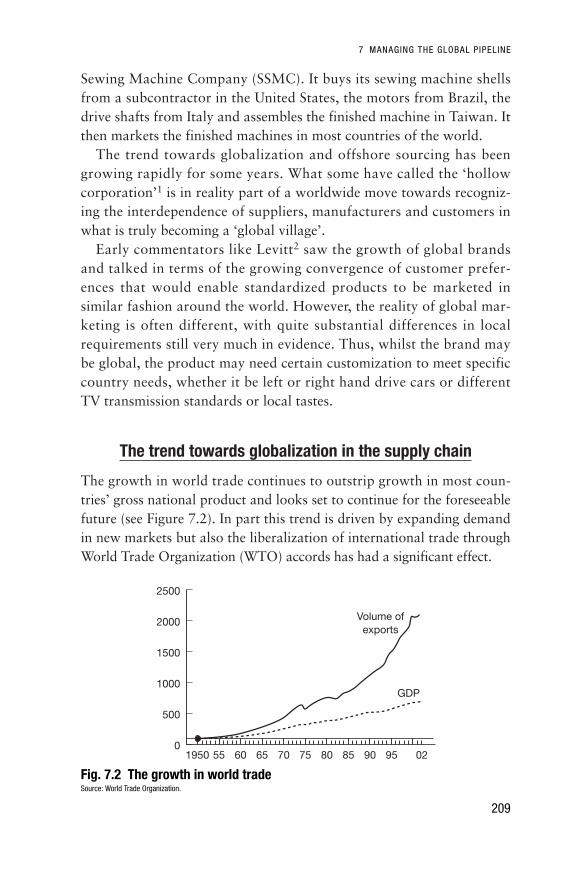
Sewing Machine Company (SSMC). It buys its sewing machine shellsfrom a subcontractor in the United States, the motors from Brazil, thedrive shafts from Italy and assembles the finished machine in Taiwan. Itthen markets the finished machines in most countries of the world.
The trend towards globalization and offshore sourcing has beengrowing rapidly for some years. What some have called the ‘hollowcorporation’1 is in reality part of a worldwide move towards recogniz-ing the interdependence of suppliers, manufacturers and customers inwhat is truly becoming a ‘global village’.
Early commentators like Levitt2 saw the growth of global brandsand talked in terms of the growing convergence of customer prefer-ences that would enable standardized products to be marketed insimilar fashion around the world. However, the reality of global mar-keting is often different, with quite substantial differences in localrequirements still very much in evidence. Thus, whilst the brand maybe global, the product may need certain customization to meet specificcountry needs, whether it be left or right hand drive cars or differentTV transmission standards or local tastes.
The trend towards globalization in the supply chain
The growth in world trade continues to outstrip growth in most coun-tries’ gross national product and looks set to continue for the foreseeablefuture (see Figure 7.2). In part this trend is driven by expanding demandin new markets but also the liberalization of international trade throughWorld Trade Organization (WTO) accords has had a significant effect.
7 MANAGING THE GLOBAL P IPELINE
209
2500
2000
1500
1000
500
01950 959085807570656055 02
GDP
Volume ofexports
Fig. 7.2 The growth in world tradeSource: World Trade Organization.
LSCH_C07.QXD 12/11/04 12:05 pm Page 209

Once, companies established factories in overseas countries to manu-facture products to meet local demand. Now, with the reduction oftrade barriers and the development of a global transportation infra-structure, fewer factories can produce in larger quantities to meetglobal, rather than local, demand.
Paradoxically, as the barriers to global movement have come downso the sources of global competition have increased. Newly emergingeconomies are building their own industries with global capabilities. Atthe same time technological change and production efficiencies meanthat most companies in most industries are capable of producing ingreater quantity at less cost. The result of all of this is that there is nowovercapacity in virtually every industry, meaning that competitive pres-sure is greater than ever before.
To remain competitive in this new global environment, companieswill have to continually seek ways in which costs can be lowered andservice enhanced, meaning that supply chain efficiency and effective-ness will become ever more critical. See the Nike case study below.
LOGISTICS AND SUPPLY CHAIN MANAGEMENT
210
Nike: The logistics challenge of global business
In little more than the time needed to raise just one generation ofrebellious youth, US-based sports company Nike Inc. reinvented theconcept of sports shoes. It transformed the cheapest of mass-marketfootwear into high-tech, high-performance products – imbued withall the cachet of haute couture and carrying price tags to match.Technologically, Nike’s products are leading edge, as is its brand-ledmarketing which successfully used sporting superstar endorsementand advertisements with ‘attitude’ to establish the brand as an iconof youth subculture. However, as in any global organization, logisticsand the management of the supply chain is a crucial strategic issueat Nike.
From its headquarters in Beaverton, Oregon, Nike operates a globe-spanning virtual enterprise. At its core are a set of business processes,designed to combine its state-of-the-art R&D capabilities with a ruth-lessly low-cost manufacturing strategy.1 The company outsourcesvirtually 100 per cent of its shoe production, for example, retaining in-house manufacturing of a few key components of its patented Nike Air
LSCH_C07.QXD 12/11/04 12:05 pm Page 210

7 MANAGING THE GLOBAL P IPELINE
211
System. Nike’s basketball shoe, for example, is designed in Oregon andTennessee and developed jointly by Asian and US technicians inOregon, Taiwan and South Korea. The shoes themselves are manufac-tured in South Korea (men’s sizes) and in Indonesia (boys’ sizes), from72 components supplied by companies in Japan, South Korea, Taiwan,Indonesia and the United States. Moreover, the complexity of theproduct means that each pair of shoes passes through more than 120pairs of hands during the production process.2 It also means that thereis a danger of extended lead times.
Tying the whole Nike enterprise together are information systemsthat co-ordinate each step of these far-flung activities, and a logisticsinfrastructure capable of bringing the components together at preciselythe right time, as well as managing the supply of finished goods intothe global marketplace. Significantly, both are flexible enough to copewith the constant product, materials and process innovation, allowingthe company to bring more than 300 new shoe designs to market eachyear. However, this punishing rate of innovation brings with it highlevels of finished inventory if sales forecasts are not achieved.
In the United States and Europe, primary distribution of Nike prod-ucts is increasingly outsourced to specialist third parties,3 who arelinked into the company’s global sales and customer service support sys-tems. These links allow the contractors to prioritize shipments andmanage order fulfilment as cost effectively as possible, while ensuringthat product availability information is readily accessible to all decisionmakers throughout Nike’s virtual enterprise. Importantly too, theseorganizational capabilities should also hold Nike in good stead shouldfashionable youth turn away from designer sports shoes, forcing thecompany to rely more heavily on sales of its widening portfolio of sportsequipment, clothing, watches and eyewear. When the supply chains areglobal and the products are fashion oriented the management of logis-tics becomes a key determinant of business success or failure.
References1. Seth, Andrew, ‘Just Doing It’, Marketing Business, February 1998.2. Business Wire, ‘Nike Equipment Signs up Manlo Logistics to Manage Distribution
Centres in North America, Europe’, Business Wire/Reuter Textline, 5 February 1998.3. Far Eastern Economic Review, ‘The Post National Economy: Goodbye Widget,
Hello Nike’, 29 August 1996, p. 5.
LSCH_C07.QXD 12/11/04 12:05 pm Page 211

In developing a global logistics strategy a number of issues arise whichmay require careful consideration. In particular, what degree of central-ization is appropriate in terms of management, manufacturing anddistribution, and how can the needs of local markets be met at the sametime as the achievement of economies of scale through standardization?
Three of the ways in which businesses have sought to implementtheir global logistics strategies have been through focused factories,centralized inventories and postponement.
1 Focused factories
The idea behind the focused factory is simple: by limiting the range andmix of products manufactured in a single location the company canachieve considerable economies of scale. Typically the nationally ori-ented business will have ‘local-for-local’ production, meaning that eachcountry’s factory will produce the full range of products for sale in thatcountry. On the other hand the global business will treat the worldmarket as one market and will rationalize its production so that theremaining factories produce fewer products in volumes capable of sat-isfying perhaps the entire market.
One company that has moved in this direction is Mars. Their policyhas been to simultaneously rationalize production capacity by seekingto manage demand as a whole on at least a regional level and to con-centrate production by category, factory by factory. Hence theirM&Ms for sale in Moscow are likely to have been produced in theUnited States. In a similar fashion, Heinz produce tomato ketchup forall of Europe from just three plants and will switch production depend-ing upon how local costs and demand conditions vary against exchangerate fluctuations. A further example is provided by Procter & Gamblewho manufacture their successful product Pringles in just two plants tomeet worldwide demand.
Such strategies can be expected to become widespread as ‘globalthinking’ becomes dominant.
However, a number of crucial logistics trade-offs may be overlookedin what might possibly be a too-hasty search for low-cost producerstatus through greater economies of scale. The most obvious trade-offis the effect on transport costs and delivery lead times. The costs ofshipping products, often of relatively low value, across greater dis-
LOGISTICS AND SUPPLY CHAIN MANAGEMENT
212
LSCH_C07.QXD 12/11/04 12:05 pm Page 212

tances may erode some or all of the production cost saving. Similarlythe longer lead times involved may need to be countered by local stockholding, again possibly offsetting the production cost advantage.
Further problems of focused production may be encountered wherethe need for local packs exist, e.g. with labelling in different languagesor even different brand names and packages for the same product. Thisproblem might be overcome by ‘postponing’ the final packaging untilcloser to the point of sale.
Another issue is that created by customers ordering a variety ofproducts from the same company on a single order but which are nowproduced in a number of focused factories in different locations. Thesolution here may be some type of transhipment or cross-dock opera-tion where flows of goods from diverse localities and origins aremerged for onward delivery to the customer.
Finally, what will be the impact on production flexibility of the trendtowards focused factories where volume and economies of scale rulethe day? Whilst these goals are not necessarily mutually incompatible itmay be that organizations that put low-cost production at the top oftheir list of priorities may be at risk in markets where responsivenessand the ability to provide ‘variety’ are key success factors.
In response to these issues a number of companies are questioningdecisions that previously were thought sound. For example, Sony usedto manufacture their digital cameras and camcorders in China,attracted by the lower labour costs. However, they came to recognizethat because life cycles were so short for these products, it was better tobring the assembly back to Japan where the product design took placeand, indeed, where most of the components originated. Other high-techcompanies are also looking again at their offshore production andsourcing strategies for this same reason. Typically less than 10 per centof a high-tech company’s costs are direct labour. Hence the decision tosource offshore, simply to save on labour costs, makes little sense ifpenalties are incurred elsewhere in the supply chain.
All in all it would appear that the total logistics impact of focusedproduction will be complex and significant. To ensure that decisions aretaken which are not sub-optimal it will become even more important toundertake detailed analysis based upon total system modelling and sim-ulation prior to making commitments that may later be regretted.
7 MANAGING THE GLOBAL P IPELINE
213
LSCH_C07.QXD 12/11/04 12:05 pm Page 213

2 Centralization of inventories
In the same way that the advent of globalization has encouraged compa-nies to rationalize production into fewer locations, so too has it led to atrend towards the centralization of inventories. Making use of the well-known statistical fact that consolidating inventory into fewer locations cansubstantially reduce total inventory requirement, organizations have beensteadily closing national warehouses and amalgamating them into regionaldistribution centres (RDCs) serving a much wider geographical area.
For example, Philips has reduced its consumer electronics productswarehouses in western Europe from 22 to just four. Likewise AppleComputers replaced their 13 national warehouses with two EuropeanRDCs. Similar examples can be found in just about every industry.
LOGISTICS AND SUPPLY CHAIN MANAGEMENT
214
■ Centralized logistics at Lever Europe ■
Lever, part of the global corporation Unilever, manufacture and market awide range of soaps, detergents and cleaners. As part of a drive to imple-ment a European strategy for manufacturing and the supply chain theycreated a centralized manufacturing and supply chain management struc-ture – Lever Europe. A key part of this strategy involved a rationalization ofother production facilities from a total of 16 across western Europe to 11.The remaining facilities became ‘focused factories’, each one concentrat-ing on certain product families. So, for example, most bar soaps for Europeare now made at Port Sunlight in England; Mannheim in Germany makesall the Dove soap products, not just for Europe but for much of the rest ofthe world; France focuses on machine dishwasher products and so on.
Because national markets are now supplied from many differentEuropean sources they have retained distribution facilities in each countryto act as a local consolidation centre for final delivery to customers.
Whilst some significant production cost savings have been achieved, acertain amount of flexibility has been lost. There is still a high level of varia-tion in requirement by individual market. Many countries sell the sameproduct but under different brand names; the languages are different hencethe need for local packs; sometimes too the formulations differ.
A further problem is that as retailers become more demanding in thedelivery service they require and as the trend towards just-in-time deliverycontinues, the loss of flexibility becomes a problem. Even though manufac-turing economies of scale are welcome, it has to be recognized that theachievement of these cost benefits may be more than offset by the loss offlexibility and responsiveness in the supply chain as a whole.
LSCH_C07.QXD 12/11/04 12:05 pm Page 214

Whilst the logic of centralization is sound, it is becoming increas-ingly recognized that there may be even greater gains to be had by notphysically centralizing the inventory but rather by locating it strategi-cally near the customer or the point of production but managing andcontrolling it centrally. This is the idea of ‘virtual’ or ‘electronic’ inven-tory. The idea is that by the use of information the organization canachieve the same stock reduction that it would achieve through central-ization whilst retaining a greater flexibility by localizing inventory. Atthe same time the penalties of centralizing physical stock holding arereduced, i.e. double handling, higher transport charges and possiblylonger total pipelines.
One of the arguments for centralized inventory is that advantage canbe taken of the ‘square root rule’.4 Whilst an approximation, this rule ofthumb provides an indication of the opportunity for inventory reductionthat is possible through holding inventory in fewer locations. The rulestates that the reduction in total systems inventory that can be expected isproportional to the square root of the number of stock locations beforeand after rationalization. Thus if previously there were 25 stock locationsand now there are only four then the overall reduction in inventorywould be in the ratio of 25 to 4 or 5:2, i.e. a 60 per cent reduction.
Many organizations are now recognizing the advantage of managingworldwide inventories on a centralized basis. To do so successfully,however, requires an information system that can provide complete vis-ibility of demand from one end of the pipeline to another in as close toreal time as possible. Equally such centralized systems will typicallylead to higher transport costs in that products inevitably have to movegreater distances and often high-cost air express will be necessary toensure short lead times for delivery to the customer.
Xerox, in its management of its European spares business, hasdemonstrated how great benefits can be derived by centralizing thecontrol of inventory and by using information systems and, in sodoing, enabling a much higher service to its engineers to be providedbut with only half the total inventory. SKF is another company that for20 years or more has been driving down its European inventory ofbearings whilst still improving service to its customers. Again, themeans to this remarkable achievement has been through a centralizedinformation system.
7 MANAGING THE GLOBAL P IPELINE
215
LSCH_C07.QXD 12/11/04 12:05 pm Page 215

3 Postponement and localization
Although the trend to global brands and products continues, it shouldbe recognized that there are still significant local differences in cus-tomer and consumer requirements. Even within a relatively compact
market like western Europe there aremajor differences in consumer tastesand, of course, languages. Hencethere are a large number of marketswhere standard, global productswould not be successful. Take, forexample, the differences in prefer-ence for domestic appliances such as
refrigerators and washing machines. Northern Europeans prefer largerrefrigerators because they shop once a week rather than daily, whilstsouthern Europeans, shopping more frequently, prefer smaller ones.Similarly, Britons consume more frozen foods than most otherEuropean countries and thus require more freezer space.
In the case of washing machines, there are differences in preference fortop-loading versus front-loading machines – in the UK almost all themachines purchased are front loaders whilst in France the reverse is true.
How is it possible to reconcile the need to meet local requirementswhilst seeking to organize logistics on a global basis? Ideally organiza-tions would like to achieve the benefits of standardization in terms of costreduction whilst maximizing their marketing success through localization.
One strategy that is increasingly being adopted is the idea of post-ponement. Postponement, or delayed configuration, is based on theprinciple of seeking to design products using common platforms, com-ponents or modules but where the final assembly or customization doesnot take place until the final market destination and/or customerrequirement is known.
The advantages of the strategy of postponement are several. Firstly,inventory can be held at a generic level so that there will be fewer stockkeeping variants and hence less inventory in total. Secondly, becausethe inventory is generic, its flexibility is greater, meaning that the samecomponents, modules or platforms can be embodied in a variety of endproducts. Thirdly, forecasting is easier at the generic level than at thelevel of the finished item. This last point is particularly relevant in
LOGISTICS AND SUPPLY CHAIN MANAGEMENT
216
Although the trend to global brandsand products continues, it shouldbe recognized that there are stillsignificant local differences in
customer and consumerrequirements.
LSCH_C07.QXD 12/11/04 12:05 pm Page 216

global markets where local forecasts will be less accurate than a fore-cast for worldwide volume. Furthermore the ability to customizeproducts locally means that a higher level of variety may be offered atlower total cost – this is the principle of ‘mass customization’.
To take full advantage of the possibilities offered by postponementoften requires a ‘design for localization’ philosophy. Products andprocesses must be designed and engineered in such a way that semi-finished product can be assembled, configured and finished to providethe highest level of variety to customers based upon the smallestnumber of standard modules or components. In many cases the finalfinishing will take place in the local market, perhaps at a distributioncentre, and, increasingly, the physical activity outsourced to a third-party logistics service provider.
Gaining visibility in the global pipeline
One of the features of global pipelines is that there is often a higherlevel of uncertainty about the status of a shipment whilst in transit.This uncertainty is made worse by the many stages in a typical globalpipeline as a product flows from factory to port, from the port to itscountry of destination, through customs clearance and so on until itfinally reaches the point where it is required. Not surprisingly there is ahigh degree of variation in these extended pipelines.
Shipping, consolidation and customs clearance all contribute todelays and variability in the end-to-end lead time of global supplychains. This is highlighted in the example shown in Table 7.1 below.This can be a major issue for companies as they increasingly go global.It has the consequence that local managers tend to compensate for thisunreliability by over-ordering and by building inventory buffers.
7 MANAGING THE GLOBAL P IPELINE
217
Table 7.1 End-to-end lead-time variability (days)
From point Freight Arrive in Customs Transit to Total of origin forwarding/ country of clearance point of elapsedto port consolidation destination use time
Maximum 5 7 15 5 5 37Average 4 3 14 2 4 32Minimum 1 1 12 1 2 17
LSCH_C07.QXD 12/11/04 12:05 pm Page 217

One emerging tool that could greatly improve the visibility across com-plex global supply chains is supply chain event management.
Supply chain event management (SCEM) is the term given to theprocess of monitoring the planned sequence of activities along a supplychain and the subsequent reporting of any divergence from that plan.Ideally SCEM will also enable a proactive, even automatic, response todeviations from the plan.
The Internet can provide the means whereby SCEM reporting systemscan link together even widely dispersed partners in global supplychains. The use of XML communications across the web means thateven organizations with different information systems can be linkedtogether. The key requirement though is not technological, it is the will-ingness of the different entities in a supply chain to work in acollaborative mode and to agree to share information.
Supply chain event management enables organizations to gain visibil-ity upstream and downstream of their own operations and to assume anactive rather than a passive approach to supply chain risk. Figure 7.3
LOGISTICS AND SUPPLY CHAIN MANAGEMENT
218
‘The SCEM system should act like an intensive care monitor in a hospital.To use an intensive care monitor, the doctor places probes at strategicpoints on the patient’s body; each measures a discrete and differentfunction – temperature, respiration rate, blood pressure. The monitor isprogrammed with separate upper and lower control limits for each probeand for each patient. If any of the watched bodily functions go above orbelow the defined tolerance, the monitor sets off an alarm to the doctor forimmediate follow-up and corrective action. The SCEM application shouldact in the same manner.
‘The company determines its unique measurement points along itssupply chain and installs probes. The company then programmes theSCEM application to monitor the plan-to-actual supply chain progress, andestablishes upper and lower control limits. If any of the control limits areexceeded, or if anomalies occur, the application publishes alerts or alarmsso that the functional manager can take appropriate corrective action.’
Source: Styles, Peter, ‘Determining Supply Chain Event Management’, in Achieving Supply Chain Excellence Through Technology,
Montgomery Research, San Francisco, 2002.
LSCH_C07.QXD 12/11/04 12:05 pm Page 218

shows the progression from the traditional, limited scope of supplychain visibility to the intended goal of an ‘intelligent’ supply chain infor-mation system.
Event management software is now becoming available from a numberof providers. The principles underpinning event management are that‘intelligent agents’ are created within the software that are instructed torespond within pre-determined decision rules, e.g. upper and lowerlimits for inventory levels at different stages in a supply chain. Theseagents monitor the critical stage in a process and issue alerts when devi-ations from required performance occurs. The agents can also beinstructed to take corrective action where necessary, and they can iden-tify trends and anomalies and report back to supply chain managers onemerging situations that might require pre-emptive attention.
Whilst event management is primarily a tool for managing processes,its advantage is that it can look across networks, thus enabling con-nected processes to be monitored and, if necessary, modified.
Clearly the complexity of most supply networks is such that in real-ity event management needs to be restricted to the critical paths in thatnetwork. Critical paths might be typified by such features as: long leadtimes to react to unplanned events, reliance on single-source suppliers,bottlenecks, etc.
Event management is rooted in the concept of workflow and mile-stones, and Figure 7.4 uses nodes and links to illustrate the idea ofworkflow across the supply chain. Once a chain has been described in
7 MANAGING THE GLOBAL P IPELINE
219
SCEM1.
• Anticipate• Analyze• Resolve• Collaborate
Dynamic visibility2.
• Real-time information• Ability to re-plan
Static visibility3.
• Where is it?• What went wrong?
Fig. 7.3 The progression to supply chain event management
LSCH_C07.QXD 12/11/04 12:05 pm Page 219

terms of the nodes that are in place and the links that have been estab-lished, the controls that have been defined respond to events across thechain. An event is a conversion of material at a node in the chain or amovement of material between nodes in the chain. Events should onlyhappen as a result of an instruction (control). Therefore on the timehorizon over which instructions are issued, events are capable of beingmonitored for the timeliness and completeness with which they are exe-cuted against the original instruction.
So, for example, a simple data string will be attached to the followingevents at the time the instruction is issued:
● Node point● Process (conversion or link)● Date of instruction● Product code● Quantity● Date for commencement of task● Date due for completion● Consignment/order number● Next node in the chain
The data string can be very lengthy depending on the product andindustry and the level of data capture that the firm is trying to achieve.
Event management systems rely on being connected to the systems ofthe players in the extended chain (both internal to the firm and with itssuppliers and customers) so that their obligation to comply to the con-trols that have been set and their actual performance is recorded througha data feed to the event management system, when the event happens.
When an event does not occur on time and/or in full, the system willautomatically raise alerts and alarms through an escalation sequence tothe people controlling the chain requiring them to take action. Currently,event management systems typically do not determine the actions thatare most appropriate or provide optimization capabilities; however,future generations of supply chain event management systems will prob-ably have this capability.
LOGISTICS AND SUPPLY CHAIN MANAGEMENT
220
LSCH_C07.QXD 12/11/04 12:05 pm Page 220

7 MANAGING THE GLOBAL P IPELINE
221
Nod
eN
ode
Dat
e st
art
Dat
e st
art
Dat
e d
ueD
ate
due
Qua
ntity
Qua
ntity
Sys
tem
ref
Sys
tem
ref
......
......
......
......
......
......
......
......
####
## #
# ##
## #
# ##
## #
# ##
## #
# ## ##
###
###
####
####
##...
......
......
......
......
......
......
......
...
Nod
eN
ode
Dat
e st
art
Dat
e st
art
Dat
e d
ueD
ate
due
Qua
ntity
Qua
ntity
Sys
tem
ref
Sys
tem
ref
......
......
......
......
......
......
......
......
####
## #
# ##
## #
# ##
## #
# ##
## #
# ## ##
###
###
####
####
##...
......
......
......
......
......
......
......
...
Nod
eN
ode
Dat
e st
art
Dat
e st
art
Dat
e d
ueD
ate
due
Qua
ntity
Qua
ntity
Sys
tem
ref
Sys
tem
ref
......
......
......
......
......
......
......
......
####
## #
# ##
## #
# ##
## #
# ##
## #
# ## ##
###
###
####
####
##...
......
......
......
......
......
......
......
...
Nod
eN
ode
Dat
e st
art
Dat
e st
art
Dat
e d
ueD
ate
due
Qua
ntity
Qua
ntity
Sys
tem
ref
Sys
tem
ref
......
......
......
......
......
......
......
......
####
## #
# ##
## #
# ##
## #
# ##
## #
# ## ##
###
###
####
####
##...
......
......
......
......
......
......
......
...
Nod
eN
ode
Dat
e st
art
Dat
e st
art
Dat
e d
ueD
ate
due
Qua
ntity
Qua
ntity
Sys
tem
ref
Sys
tem
ref
......
......
......
......
......
......
......
......
####
## #
# ##
## #
# ##
## #
# ##
## #
# ## ##
###
###
####
####
##...
......
......
......
......
......
......
......
...
Sin
gle
end
-to-
end
vie
w o
f the
cha
in g
ives
vis
ibili
ty o
f non
-con
form
ance
and
hen
ce r
isk
Nod
es
Con
trol
s
Link
s
Key
Fig.
7.4
Even
t man
agem
ent a
cros
s th
e su
pply
cha
inSo
urce
: Cra
nfie
ld S
choo
l of M
anag
emen
t, Cr
eatin
g Re
silie
nt S
uppl
y Ch
ains
, Rep
ort o
n be
half
of th
e De
partm
ent f
or T
rans
port,
200
2.
LSCH_C07.QXD 12/11/04 12:05 pm Page 221

Organizing for global logistics
As companies have extended their supply chains internationally theyhave been forced to confront the issue of how to structure their globallogistics organization. In their different ways these companies havemoved towards the same conclusion: effectiveness in global logistics canonly be achieved through a greater element of centralization. This inmany respects runs counter to much of the conventional wisdom, whichtends to argue that decision-making responsibility should be devolvedand decentralized at least to the strategic business unit level. This philos-ophy has manifested itself in many companies in the form of stronglocal management, often with autonomous decision making at the coun-try level. Good though this may be for encouraging local initiatives, ittends to be dysfunctional when integrated global strategies are required.
Clearly there will still be many areas where local decision making willbe preferable – for example, sales strategy and, possibly, promotionaland marketing communications strategy. Likewise the implementationof global strategy can still be adjusted to take account of national differ-ences and requirements.
How then can the appropriate balance of global versus local decisionmaking be achieved in formulating and implementing logistics strategy?
Because specific market environments and industry characteristicswill differ from company to company it is dangerous to offer all-embracing solutions. However, a number of general principles arebeginning to emerge:
● The strategic structuring and overall control of logistics flows mustbe centralized to achieve worldwide optimization of costs.
● The control and management of customer service must be localizedagainst the requirements of specific markets to ensure competitiveadvantage is gained and maintained.
● As the trend towards outsourcing everything except core competen-cies increases then so does the need for global co-ordination.
● A global logistics information system is the prerequisite for enablingthe achievement of local service needs whilst seeking global costoptimization.
LOGISTICS AND SUPPLY CHAIN MANAGEMENT
222
LSCH_C07.QXD 12/11/04 12:05 pm Page 222

1 Structure and control
If the potential trade-offs in rationalizing sourcing, production and dis-tribution across national boundaries are to be achieved then it isessential that a central decision-making structure for logistics is estab-lished. Many companies that are active on an international basis findthat they are constrained in their search for global optimization bystrongly entrenched local systemsand structures. Only through central-ized planning and co-ordination oflogistics can the organization hope toachieve the twin goals of cost mini-mization and service maximization.
For example, location decisions area basic determinant of profitability ininternational logistics. The decisionon where to manufacture, to assemble, to store, to transship and to con-solidate can make the difference between profit and loss. Because ofinternational differences in basic factor costs and because of exchangerate movements, location decisions are fundamental. Also these deci-sions tend to involve investment in fixed assets in the form of facilitiesand equipment. Decisions taken today can therefore have a continuingimpact over time on the company’s financial and competitive position.
As the trend towards global manufacturing continues, organizationswill increasingly need to look at location decisions through total costanalysis. The requirement there is for improved access to activity-related costs such as manufacturing, transportation and handling.Accurate information on inventory holding costs and the cost/benefit ofpostponement also becomes a key variable in location decisions.
The opportunities for reducing costs and improving throughput effi-ciency by a reappraisal of the global logistics network, and inparticular manufacturing and inventory locations, can be substantial.By their very nature, decisions on location in a global network can onlybe taken centrally.
2 Customer service management
Because local markets have their own specific characteristics and needsthere is considerable advantage to be achieved by shaping marketingstrategies locally – albeit within overall global guidelines. This is particularly
7 MANAGING THE GLOBAL P IPELINE
223
If the potential trade-offs inrationalizing sourcing, productionand distribution across national
boundaries are to be achieved thenit is essential that a central
decision-making structure forlogistics is established.
LSCH_C07.QXD 12/11/04 12:05 pm Page 223

true of customer service management where the opportunities for tailoringservice against individual customer requirements are great. The manage-ment of customer service involves the monitoring of service needs as well asperformance and extends to the management of the entire order fulfilmentprocess – from order through to delivery. Whilst order fulfilment systemsare increasingly global and centrally managed there will always remain theneed to have strong local customer service management.
3 Outsourcing and partnerships
As we have previously noted, one of the greatest changes in the globalbusiness today is the trend towards outsourcing. Not just outsourcingthe procurement of materials and components but also outsourcing ofservices that traditionally have been provided in-house. The logic ofthis trend is that the organization will increasingly focus on those activ-ities in the value chain where it has a distinctive advantage – the corecompetencies of the business – and everything else it will outsource.This movement has been particularly evident in logistics where the pro-vision of transport, warehousing and inventory control is increasinglysubcontracted to specialists or logistics partners.
To manage and control this network of partners and suppliersrequires a blend of both central and local involvement. The argumentonce again is that the strategic decisions need to be taken centrally,with the monitoring and control of supplier performance and day-to-day liaison with logistics partners being best managed at a local level.
4 Logistics information
The management of global logistics is in reality the management ofinformation flows. The information system is the mechanism wherebythe complex flows of materials, parts, subassemblies and finished prod-ucts can be co-ordinated to achieve cost-effective service. Anyorganization with aspirations to global leadership is dependent uponthe visibility it can gain of materials flows, inventories and demandthroughout the pipeline. Without the ability to see down the pipelineinto end-user markets, to read actual demand and subsequently tomanage replenishment in virtual real time, the system is doomed todepend upon inventory. To ‘substitute information for inventory’ hasbecome something of a cliché but it should be a prime objective never-
LOGISTICS AND SUPPLY CHAIN MANAGEMENT
224
LSCH_C07.QXD 12/11/04 12:05 pm Page 224

theless. Time lapses in information flows are directly translated intoinventory. The great advances that are being made in introducing‘quick response’ logistics systems are all based upon information flowfrom the point of actual demand directly into the supplier’s logisticsand replenishment systems. On a global scale we typically find that thepresence of intervening inventories between the plant and the marketplaceobscure the view of real demand. Hence the need for information sys-tems that can read demand at every level in the pipeline and providethe driving power for a centrally controlled logistics system.
Thinking global, acting local
The implementation of global pipeline control is highly dependent uponthe ability of the organization to find the correct balance between centralcontrol and local management. It is unwise to be too prescriptive but theexperience that global organizations are gaining every day suggests thatcertain tasks and functions lend themselves to central control and othersto local management. Table 7.2 summarizes some of the possibilities.
Much has been learned in the last 20 years or so about the opportuni-ties for cost and service enhancement through better management oflogistics at a national level. Now organizations are faced with applyingthose lessons on a much broader stage. As international competition
7 MANAGING THE GLOBAL P IPELINE
225
Table 7.2 Global co-ordination and local management
Global Local
● Network structuring for production ● Customer service managementand transportation optimization
● Information systems development ● Gathering market intelligenceand control
● Inventory positioning ● Warehouse management andlocal delivery
● Sourcing decisions ● Customer profitability analyses
● International transport mode and ● Liaison with local sales andsourcing decisions marketing management
● Trade-off analyses and supply ● Human resource managementchain cost control
LSCH_C07.QXD 12/11/04 12:05 pm Page 225

becomes more intense and as national barriers to trade graduallyreduce, the era of the global business has arrived. Increasingly the dif-ference between success and failure in the global marketplace will bedetermined not by the sophistication of product technology or even ofmarketing communications, but rather by the way in which we manageand control the global logistics pipeline. The case of Marks & Spencer,the UK retailer, dramatically underlines this point of view.
LOGISTICS AND SUPPLY CHAIN MANAGEMENT
226
The impact of global sourcing
Marks & Spencer (M&S), a major British retailer, had long been atextbook example of a successful extended enterprise. For decades ithad been an industry leader in collaborative working with its networkof dedicated local suppliers. The formula worked well for more than100 years, until 1998 when M&S hit trouble. Commentators werequick to highlight M&S’s failure to respond to the changing require-ments of the company’s famously loyal customer base.
M&S’s strength had been its ability to satisfy the British middleclasses with good quality, fairly conservative apparel at reasonableprices. At the time it was becoming apparent that the mass-marketmiddle ground was being squeezed by discount stores, such asMatalan, at one end and by niche players catering for specific age orlifestyle groups, such as Zara and Gap, at the other. Whatever thechanges in the nature of the market, one element that has had a severeimpact on the sector as a whole has been the continuing downwardpressure on prices. In order to survive, retailers have had to focus oncost reduction. Paradoxically this need for more competitive pricingwas accompanied by a demand from consumers for enhanced quality,more fashionable styling and a heightened shopping experience. Inshort, customers wanted varied and distinctive styles at lower prices,available on demand.
M&S’s response to this was to seek to reduce its cost base by insist-ing that its suppliers source more of their products from locationswhere labour costs are low. It abandoned its longstanding UK sourcingstrategy, first by requiring its established suppliers to relocate produc-tion overseas to low-cost manufacturing centres, then by adoptingmore open sourcing policies. The potential for cost reduction fromglobal sourcing was dramatic, at least on paper. According to the
LSCH_C07.QXD 12/11/04 12:05 pm Page 226

7 MANAGING THE GLOBAL P IPELINE
227
British Apparel and Textile Confederation, the average hourly labourcost for clothing manufacturers in the UK in 2000 was $9.50 com-pared to $1.20 an hour in Morocco and less than 50 cents an hour inChina, Pakistan and Indonesia. However, as M&S soon discovered,this simplistic calculation failed to take into account the hidden costsof overseas sourcing, particularly the risks relating to significantlyextended replenishment lead times. It overlooked the need to securetransport capacity and textile import quotas ahead of season, discover-ing too late that it lacked the essential logistics know-how needed tosupport its new sourcing strategy.
Whereas M&S’s dedicated domestic suppliers had been able to re-supply relatively rapidly, with overseas sourcing orders typically had tobe placed many months ahead of requirement. Inevitably, reliance onforecasts increased. Thus buyers had to predict styles, colours and vol-umes well ahead of the season. If these forecasts were wrong – andthey often were – then the result was either over-stocking or a stock-out. Either way, this had a negative impact on profitability. Indeed oneof the major causes of the M&S profit slump in the late 1990s was thelack of interest shown by consumers in the M&S clothing range wherethe buyers had seriously misjudged fashion trends.
Part of the problem for M&S was that its definition of cost was toonarrow, i.e. the purchase cost rather than the total cost of ownership.In the event, what was intended to be a low-cost supply chain solutionturned out to be high cost, not least because it had adopted a ‘one sizefits all’ supply chain strategy for its clothing products. It could beargued that the strategy M&S adopted would have been, and indeedis, appropriate for high volume ‘standard’ items, such as men’s shirtsand socks. It was nevertheless totally inappropriate for the more ‘inno-vative’ or ‘special’ ranges such as M&S’s exclusive designer-ledAutograph range, one of several new introductions that had latterlybeen added to bring spice and variety to the core product mix. Theselow volume, short life cycle and high value ranges demanded an alto-gether more responsive supply chain.
In time it was recognized amongst the top management team atM&S that a much more differentiated procurement strategy for gar-ments was essential. A revised strategy was subsequently outlined inM&S’s Interim Report of September 2002 when its Chairman andChief Executive wrote:
▼
LSCH_C07.QXD 12/11/04 12:05 pm Page 227

Summary
For the last decade or so the continued trend towards the globalizationof business has been evident. Markets have become global in the sensethat the same brands and products are increasingly offered for salearound the world. Equally apparent has been the move towards globalsourcing and manufacturing as companies concentrate their operationsso that often just one or two factories serve the whole world.
Paradoxically the trend to globalization has increased the com-plexity of logistics. Often pipelines are longer with greater reliance onoutsourced supply chain partners. Furthermore local differences inrequirements still exist so that the needs of local markets must be bal-anced against the economic advantage of standardized products. Thus
LOGISTICS AND SUPPLY CHAIN MANAGEMENT
228
Lack of flexibility has been the major weakness within our supplychain. In the past, we bought stock to cover 100% of budgeted saleswell in advance of the season. We have now discontinued this practice.For Spring 2001, while 50% of merchandise is core and thereforebought with long lead times, we will commit to approximately 40% ofmerchandise much closer to the season, and a further 10% will bebought in the season itself in response to emerging fashion trends.
Likely predictability of demand and the length of the season are nowfactored in to M&S’s purchasing decisions. These issues increasinglydetermine where products should be sourced, how they should betransported and whether it is a one-off buy or a continuing supply. Inspring 2004, 80 per cent of clothing sourced by M&S was manufac-tured overseas, though it retains close relationships with its leadingsuppliers, with its top 15 suppliers accounting for 92 per cent of itsclothing business. Many of these are UK-owned companies operatingoverseas, in up and coming Asian countries such as Cambodia as wellas some of the newer EU states. ‘Journey time’ has become a principaldeciding factor in product sourcing decisions. The emphasis is onquick response for lines where demand is difficult to predict. Theseitems are manufactured in locations with a journey time of less thanfour days. Standard items, for which demand is expected to be pre-dictable and continuous, continue to be sourced from low-cost centresaround the globe.
▼
LSCH_C07.QXD 12/11/04 12:05 pm Page 228

the challenge to global logistics management is to structure a supplychain that is agile and flexible enough to cope with differences in cus-tomer requirements and yet can enable the benefits of focusedmanufacturing to be realized.
References
1. ‘The Hollow Corporation’, Business Week, 3 March 1986.2. Levitt, T., ‘The Globalization of Markets’, Harvard Business Review, Vol. 61,
May–June 1983.3. Roberts, J., ‘Formulating and Implementing a Global Logistics Strategy’,
International Journal of Logistics Management, Vol. 1, No. 2, 1990.4. Sussams, J.E., ‘Buffer Stocks and the Square Root Law’, Focus, Institute of
Logistics, UK, Vol. 5, No. 5, 1986.
7 MANAGING THE GLOBAL P IPELINE
229
LSCH_C07.QXD 12/11/04 12:05 pm Page 229

1
LSCH_C07.QXD 12/11/04 12:05 pm Page 230

Managing risk in thesupply chain
Why are supply chains more vulnerable? 234
Understanding the supply chain risk profile 237
Managing supply chain risk 242
Achieving supply chain resilience 254
231
Chapter
8
LSCH_C08.QXD 12/11/04 12:05 pm Page 231

This chapter:
Identifies the major sources of supply chain vulnera-bility.
●
Suggests ways in which the supply chain risk profilecan be monitored.
●
Proposes a seven-point action plan to manage andmitigate supply chain risk.
●
Highlights the opportunity for using Six Sigmamethodologies to reduce variation in key processes.
●
Indicates ways in which supply chain resilience canbe improved.
LOGISTICS AND SUPPLY CHAIN MANAGEMENT
232
LSCH_C08.QXD 12/11/04 12:05 pm Page 232

Today’s marketplace is characterized by turbulence and uncertainty.Market turbulence has tended to increase in recent years for a
number of reasons. Demand in almost every industrial sector seems tobe more volatile than was the case in the past. Product and technologylife cycles have shortened significantly and competitive product intro-ductions make life-cycle demand difficult to predict. Considerable‘chaos’ exists in our supply chains through the effects of such actions assales promotions, quarterly sales incentives or decision rules such as re-order quantities.
At the same time the vulnerability of supply chains to disturbance ordisruption has increased. It is not only the effect of external events suchas natural disasters, strikes or terrorist attacks but also the impact ofchanges in business strategy. Many companies have experienced achange in their supply chain risk profile as a result of changes in theirbusiness models. For example, the adoption of ‘lean’ practices, themove to outsourcing and a general tendency to reduce the size of thesupplier base potentially increase supply chain vulnerability.
As a result of this heightened risk, organizations will need to developappropriate programmes to mitigate and manage that risk.
The impact of unplanned and unforeseen events in supply chains canhave severe financial effects across the network as a whole. Research inNorth America1 suggests that when companies experience disruptionsto their supply chains the impact on their share price once the problembecomes public knowledge can be significant. The research suggeststhat companies experiencing these sorts of problems saw their averageoperating income drop 107 per cent, return on sales fall 114 per centand return on assets decrease by 93 per cent. Figure 8.1 shows theimpact on shareholder value of supply chain disruption.
In 2003 the Gartner Group, a US-based research and consultancycompany, predicted that one in five businesses would be impacted bysome form of supply chain disruption and that of those companies60 per cent would go out of business as a result.
8 MANAGING RISK IN THE SUPPLY CHAIN
233
LSCH_C08.QXD 12/11/04 12:05 pm Page 233

A year earlier Land Rover, part of the Ford Motor Company,announced that it might have to halt production of its Discovery four-wheel drive vehicle because its sole supplier of chassis – UPF-Thompson– had gone into liquidation. It was estimated that it could take up to sixmonths for an alternative source of supply to be brought onstream. Atsome significant cost, Land Rover had no alternative but to finance thesupplier to enable the production of chassis to continue.
A survey by The Economist3 of chief executives stated that a major-ity of respondents reported a greater dependency on external suppliersand that there was a fear that this could lead to a loss of control andhence greater supply chain vulnerability.
Clearly, there are risks that are external to the supply chain andthose that are internal. External risks may arise from natural disasters,wars, terrorism and epidemics, or from government imposed legalrestrictions. Internal risks will be described in more detail later in thischapter but essentially they refer to the risks that arise as a result ofhow the supply chain is structured and managed. Whilst external riskcannot be influenced by managerial actions, internal risk can.
Why are supply chains more vulnerable?
A study conducted by Cranfield University4 for the UK governmentdefines supply chain vulnerability as:
an exposure to serious disturbance, arising from risks within thesupply chain as well as risks external to the supply chain.
LOGISTICS AND SUPPLY CHAIN MANAGEMENT
234
Ave
rage
sha
reho
lder
ret
urns
–25
–48 –36 –24 –12 0 12 24 36 48 60–60
–20
–15
–10
–5
0
Trading day relative to announcement day
Fig. 8.1 The impact of supply chain disruptions on shareholder valueSource: Singhal and Hendricks2
LSCH_C08.QXD 12/11/04 12:05 pm Page 234

The same study identified a number of reasons why modern supplychains have become more vulnerable.
These factors are considered below in more depth.
A focus on efficiency rather than effectiveness
The prevailing business model of the closing decades of the twentiethcentury was very much based upon the search for greater levels of effi-ciency in the supply chain. Experience highlighted that there was anopportunity in many sectors of industry to take out significant cost byfocusing on inventory reduction. Just-in-time (JIT) practices werewidely adopted and organizations became increasingly dependent uponsuppliers. This model, whilst undoubtedly of merit in stable marketconditions, may become less viable as volatility of demand increases.The challenge in today’s business environment is how best to combine‘lean’ practices with an ‘agile’ response.
The globalization of supply chains
There has been a dramatic shift away from the predominantly ‘local forlocal’ manufacturing and marketing strategy of the past. Now, throughoffshore sourcing, manufacturing and assembly, supply chains extendfrom one side of the globe to the other. For example, components maybe sourced in Taiwan, subassembled in Singapore with final assemblyin the US for sale in world markets.
Usually the motivation for offshore sourcing and manufacturing iscost reduction. However, that definition of cost is typically limited tothe cost of purchase or manufacture. Only rarely are total supply chaincosts considered. The result of these cost-based decisions is often higherlevels of risk as a result of extended lead times, greater buffer stocksand potentially higher levels of obsolescence – particularly in short life-cycle markets. A further impetus to the globalization of supply chainshas come from the increase in cross-border mergers and acquisitionsthat we have witnessed over the last decade or so.
Focused factories and centralized distribution
One of the impacts of the implementation of the Single Market withinthe European Union and the consequent reduction in the barriers to theflow of products across borders has been the centralization of production
8 MANAGING RISK IN THE SUPPLY CHAIN
235
LSCH_C08.QXD 12/11/04 12:05 pm Page 235

and distribution facilities. Significant scale economies can be achieved inmanufacturing if greater volumes are produced on fewer sites. In somecases companies have chosen to ‘focus’ their factories – instead of pro-ducing the full range of products at each site, they produce fewerproducts exclusively at a single site. As a result, production costs may belower but the product has to travel greater distances, often across manyborders. Incidentally, at the same time, flexibility may be lost becausethese focused factories tend to be designed to produce in very largebatches to achieve maximum scale economies.
Simultaneously with this move to fewer production sites is the ten-dency to centralize distribution. Many fast moving consumer goodsmanufacturers aim to serve the whole of the western European marketthrough a few distribution centres, for example, one in north-westEurope and one in the south.
The trend to outsourcing
One widespread trend, observable over many years, has been the tendencyto outsource activities that were previously conducted within the organiza-tion. No part of the value chain has been immune from this phenomenon;companies have outsourced distribution, manufacturing, accounting andinformation systems, for example. In some cases these companies mightaccurately be described as ‘virtual’ companies. There is a strong logicbehind this based upon the view that organizations are more likely to suc-ceed if they focus on the activities in which they have a differentialadvantage over competitors. This is leading to the creation of ‘networkorganizations’, whereby confederations of firms are linked together – usu-ally through shared information and aligned processes – to achieve greateroverall competitiveness. However, outsourcing also brings with it anumber of risks, not least being the potential loss of control. Disruptionsin supply can often be attributed to the failure of one of the links andnodes in the chain and, by definition, the more complex the supply net-work the more links there are and hence the greater the risk of failure.
Reduction of the supplier base
A further prevailing trend over the last decade or so has been a dramaticreduction in the number of suppliers from whom an organization typi-cally will procure materials, components, services, etc. In some cases this
LOGISTICS AND SUPPLY CHAIN MANAGEMENT
236
LSCH_C08.QXD 12/11/04 12:05 pm Page 236

has been extended to ‘single sourcing’, whereby one supplier is respons-ible for the sole supply of an item. Several well-documented cases existwhere major supply chain disruptions have been caused because of a fail-ure at a single source. Even though there are many benefits to supplierbase reduction it has to be recognized that it brings with it increased risk.
Sometimes a consolidation of the supply base happens throughmerger and acquisition. Since the rate of merger and acquisition hasincreased so dramatically over recent years, it follows that the supplybase reduction will have accelerated for this reason alone.
Understanding the supply chain risk profile
Many organizations today are addressing the issues of what has cometo be termed ‘business continuity’. In practice, however, there tends tobe a limited focus for much of business continuity management. Thereis a strong focus on IT and internal process management but often thewider supply risk dimension is not considered. This is paradoxical sinceit can be argued that the biggest risk to business continuity may be inthe wider network of which the individual business is just a part.
To widen the focus on supply chain vulnerability it is suggested that asupply risk profile be established for the business. The purpose of the riskprofile is to establish where the greatest vulnerabilities lie and what theprobability of disruption is. In a sense this approach takes the view that:
Supply chain risk = Probability of disruption × Impact
Thus the risk profile attempts to seek out the ‘critical paths’ through anetwork where management attention should be especially focused. Aweakness of this definition of risk is that it may lead to a failure to rec-ognize that supply chains may be at their most vulnerable where theprobability of occurrence is small but the potential impact could be cat-astrophic. For example, in May 2003 a tornado struck Jackson,Tennessee in the US severely damaging Procter & Gamble’s sole factoryin North America for the manufacture of Pringles. Production of this$1 billion a year sales revenue product was severely curtailed sinceP&G’s only other manufacturing facility for Pringles is in Belgium.
To help identify the risk profile of a business it is helpful to undertakean audit of the main sources of risk across the network. This audit shouldexamine potential risk to business disruptions arising from five sources:
8 MANAGING RISK IN THE SUPPLY CHAIN
237
LSCH_C08.QXD 12/11/04 12:05 pm Page 237

1. Supply riskHow vulnerable is the business to disruptions in supply? Risk maybe higher due to global sourcing, reliance on key suppliers, poorsupply management, etc.
2. Demand riskHow volatile is demand? Does the ‘bullwhip’ effect cause demandamplification? Are there parallel interactions where the demand foranother product affects the demand for ours?
3. Process riskHow resilient are our processes? Do we understand the sources ofvariability in those processe, e.g. manufacturing? Where are thebottlenecks? How much additional capacity is available if required?
4. Control riskHow likely are disturbances and distortions to be caused by our owninternal control systems? For example, order opportunities, batchsizes and safety stock policies can distant real demand. Our owndecision rules and policies can cause ‘chaos’ type effects.
5. Environmental riskWhere across the supply chain as a whole are we vulnerable to exter-nal forces? Whilst the type and timings of extreme external eventsmay not be forecastable, their impact needs to be assessed.
Figure 8.2 below summarizes the connections between the five sourcesof risk.
It is important for senior management to understand that the risk profileis directly and indirectly impacted by the strategic decisions that theytake. Thus the decision, for instance, to transfer production from a
LOGISTICS AND SUPPLY CHAIN MANAGEMENT
238
Environmental risk
Supplyrisk
Processrisk
Controlrisk
Demandrisk
Fig. 8.2 Sources of risk in the supply chainSource: Adapted from Mason-Jones, R. and Towill, D.R., ‘Shrinking the Supply Chain Uncertainty Cycle’, Control, September 1998, pp. 17–22.
LSCH_C08.QXD 12/11/04 12:05 pm Page 238
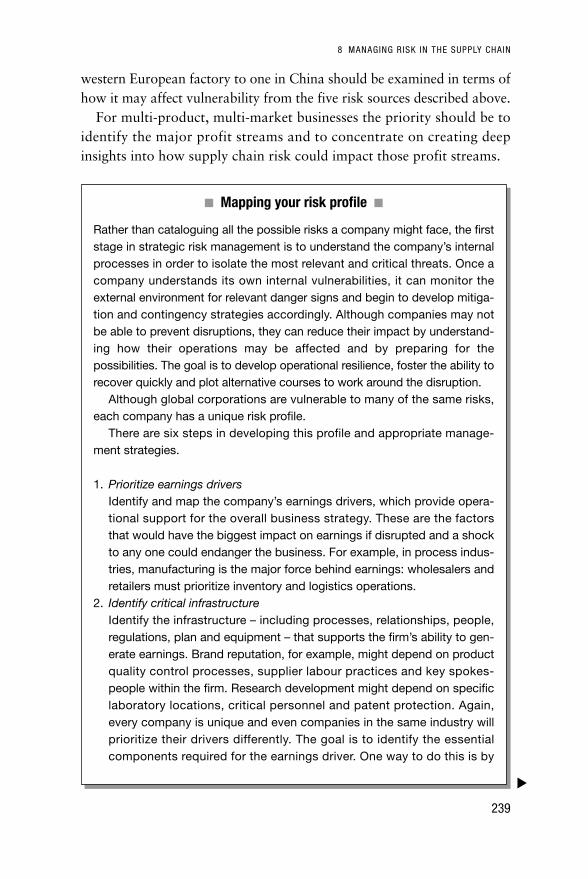
western European factory to one in China should be examined in terms ofhow it may affect vulnerability from the five risk sources described above.
For multi-product, multi-market businesses the priority should be toidentify the major profit streams and to concentrate on creating deepinsights into how supply chain risk could impact those profit streams.
8 MANAGING RISK IN THE SUPPLY CHAIN
239
■ Mapping your risk profile ■
Rather than cataloguing all the possible risks a company might face, the firststage in strategic risk management is to understand the company’s internalprocesses in order to isolate the most relevant and critical threats. Once acompany understands its own internal vulnerabilities, it can monitor theexternal environment for relevant danger signs and begin to develop mitiga-tion and contingency strategies accordingly. Although companies may notbe able to prevent disruptions, they can reduce their impact by understand-ing how their operations may be affected and by preparing for thepossibilities. The goal is to develop operational resilience, foster the ability torecover quickly and plot alternative courses to work around the disruption.
Although global corporations are vulnerable to many of the same risks,each company has a unique risk profile.
There are six steps in developing this profile and appropriate manage-ment strategies.
1. Prioritize earnings driversIdentify and map the company’s earnings drivers, which provide opera-tional support for the overall business strategy. These are the factorsthat would have the biggest impact on earnings if disrupted and a shockto any one could endanger the business. For example, in process indus-tries, manufacturing is the major force behind earnings: wholesalers andretailers must prioritize inventory and logistics operations.
2. Identify critical infrastructureIdentify the infrastructure – including processes, relationships, people,regulations, plan and equipment – that supports the firm’s ability to gen-erate earnings. Brand reputation, for example, might depend on productquality control processes, supplier labour practices and key spokes-people within the firm. Research development might depend on specificlaboratory locations, critical personnel and patent protection. Again,every company is unique and even companies in the same industry willprioritize their drivers differently. The goal is to identify the essentialcomponents required for the earnings driver. One way to do this is by
▼
LSCH_C08.QXD 12/11/04 12:05 pm Page 239

LOGISTICS AND SUPPLY CHAIN MANAGEMENT
240
asking ‘What are the processes which, if they failed, would seriouslyaffect my earnings?’ Put another way, these are the factors that couldend up in a footnote in an annual report explaining the rationale behind acharge against earnings.
3. Locate vulnerabilitiesWhat are the weakest links, the elements on which all others depend? Itcould be a single supplier for a critical component, a border that 80 percent of your products must cross to get to your key markets, a singleemployee who knows how to restore data if the IT system fails, or a reg-ulation that makes it possible for you to stay in business. Vulnerabilitiesare characterized by:● An element on which many others depend – a bottleneck● A high degree of concentration – suppliers, manufacturing locations,
material or information flows● Limited alternatives● Association with high-risk geographic areas, industries and products
(such as war or flood zones, or economically troubled industries,such as airlines)
● Insecure access points to important infrastructure
Notice that the focus is still on the internal processes rather than potentialexternal events. In many ways the impact of a disruption does not dependon the precise manner in which these elements fail. Whether your key sup-plier fails because of a fire in a plant, an earthquake, a terrorist attack or aneconomic crisis, you may have the same response plan.
4. Model scenariosBest-practice organizations continuously assess their strengths andweaknesses by creating scenarios based on the full spectrum of criseshighlighted earlier. In a recent Harvard Business Review article,1 IanMitroff discussed his approach of spinning a ‘Wheel of Crises’ to chal-lenge executives to think creatively and randomly. Using supply chainmodelling tools to simulate the impact of crises is also useful in gaugingrisk levels for your trading partners.
5. Develop responsesAfter executives assess the impact of alternative crisis scenarios on thesupply chain, they will have detailed knowledge of their operational vul-nerabilities and how these soft spots relate to performance goals andearnings. Understanding these weak areas at the enterprise level willclarify critical decisions.
LSCH_C08.QXD 12/11/04 12:05 pm Page 240

8 MANAGING RISK IN THE SUPPLY CHAIN
241
Completing a risk profile will also bring to light opportunities to reduce riskand indicate the value to be gained. Risk-mitigation plans can be put intotwo broad categories: redundancy and flexibility. Traditional risk-manage-ment approaches have focused heavily on redundant solutions, such asincreasing inventory, preparing backup IT and telecommunications sys-tems, and fostering long-term supplier contracts. While generally effectivein protecting against potential risk, such approaches come with a highercost – sometimes explicitly and sometimes hidden – that can potentiallyput organizations at a competitive disadvantage.
Flexible responses, however, utilize supply chain capabilities that notonly manage risk but simultaneously increase an organization’s competitivecapability. Examples include:
● Product design for agility – common components and delayed productdifferentiation
● Common, flexible and readily transferable manufacturing practices● Lead-time reduction – duration and variability● Dynamic inventory planning● Supply chain visibility● Cross-training of employees
Just as supply chain modelling tools and techniques can help assess theimpact of crisis scenarios, they can also be used to evaluate the costs andbenefits of alternative responses.
6. Monitor the risk environmentEach vulnerability will suggest a number of potential responses. The chal-lenge is to ensure that the chosen response is proportional to the risk, interms of both magnitude and likelihood. A company’s risk profile is con-stantly changing: economic and market conditions change, consumertastes change, the regulatory environment changes, as will products andprocesses. It is essential to redraw the company’s risk map in tandem. Partof the mapping process includes identifying leading indicators based on thekey supply chain vulnerabilities. Such an early warning system helps ensurethat contingency plans are activated as soon as possible. Although adetailed assessment of a company’s excellence in risk management is quiteinvolved, a simple self-assessment can quickly identify the largest gaps.
References1. ‘Preparing for Evil’, Harvard Business Review, April 2003, pp. 109–115.
Source: Supply Chains in a Vulnerable, Volatile World. Copyright A.T. Kearney, 2003. All rights reserved. Reprinted with permission.
LSCH_C08.QXD 12/11/04 12:05 pm Page 241

Managing supply chain risk
Figure 8.3 below suggests a seven-stage approach to the managementof supply chain risk. Each of the seven stages is described in more detailin the following sections.
1 Understand the supply chain
There is in many companies an amazing lack of awareness of the widersupply/demand network of which the organization is a part. Whilstthere is often a good understanding of the downstream routes tomarket, the same is not always true of what lies upstream of first tiersuppliers. First tier suppliers are often dependent themselves on secondand even third tier suppliers for their continuity.
An example of this is provided by Chrysler who were reviewing theupstream supply chain for the Jeep Grand Cherokee’s V8 engine.5 Thecompany mapped all the hundreds of component flows and found thatone of these components – a roller lift valve manufactured by EatonCorp. – was made from castings sourced from a local foundry. Whenthe Chrysler team visited that foundry they discovered that the clay
LOGISTICS AND SUPPLY CHAIN MANAGEMENT
242
Understand the supply chain
Improve the supply chain
Identify the critical paths (nodes and links)
Manage the critical paths
Improve network visibility
Establish a supply chain continuity team
Work with suppliers and customers to improvesupply chain risk management procedures
Fig. 8.3 The supply chain risk management process
LSCH_C08.QXD 12/11/04 12:05 pm Page 242

that was used to produce the castings came from a sole supplier whowas losing money and thinking of exiting the business.
It is this detailed level of supply chain understanding that is neces-sary if risk is to be mitigated and managed. For complex supply chainsor where complete mapping of the entire network is not practical itwould be appropriate only to look in detail at the ‘critical paths’ – howthese are identified is dealt with later.
2 Improve the supply chain
‘Improving’ the supply chain is all about simplification, improvingprocess reliability, reducing process variability and reducing complex-ity. For more long-established businesses it is probably true to say thatrarely have their supply chains been planned or designed in a holisticway. Rather they have developed organically in response to the needsand opportunities of the time. Suppliers have been chosen because oftheir ability to meet the demands for lower price rather than becauseof the reliability of their supply chains for example.
Variability and complexity add to supply chain risk in a number ofways. Variation implies unstable processes with outcomes that are notalways predictable. The use of Six Sigma methodology can be a power-ful way to reduce variability in supply chain processes (see box).
8 MANAGING RISK IN THE SUPPLY CHAIN
243
■ Reducing process variability through Six Sigma methodology ■
Conventional approaches to quality management were typically based
upon ‘inspection’. In other words, a sample of the output of a process
would be taken on a periodic basis and if non-standard outputs were
detected then remedial action would be taken. Not surprisingly, inspection-
based quality management has proved to be less than satisfactory. Often
non-conforming items would ‘slip through the net’ and, in any case,
inspection is ‘after the event’. Today, our thinking on quality management
has changed. Now the recognition is that if we seek consistency in the
quality of the output then the only way to achieve this is to ensure that the
process that produces those outputs is under control. Thus process control becomes the means by which variation in output is
identified. Variation in any process is the problem. If everything in life or inbusiness was totally constant or even predictable, then there would be few
▼
LSCH_C08.QXD 12/11/04 12:05 pm Page 243

LOGISTICS AND SUPPLY CHAIN MANAGEMENT
244
problems. The challenges arise because of variations. Hence it follows thatif variation can be reduced then the consistency (and, by definition, the reli-ability) of the output can almost be guaranteed.
The Six Sigma way
The Six Sigma route to quality control emerged in the 1980s as Motorolasearched for a robust quantitative approach that would drive variability outof their manufacturing processes and thus guarantee the reliability of theirproducts. The term ‘Six Sigma’ is largely symbolic, referring to a methodol-ogy and a culture for continuous quality improvement, as well as referringto the statistical goal, six sigma. The term ‘sigma’ (σ) is used in statistics tomeasure variation from the mean; in a business context the higher thevalue of sigma the more capable the process of delivering an output withincustomer specifications. The diagram below illustrates the differencebetween two processes: one with a low capability and the other with sixsigma capability.
The Six Sigma goal (which in many cases is an aspirational one) is tosqueeze out process variability until the process produces just 3.4 defectsper million activities or ‘opportunities’; this reduces waste and hence savesmoney whilst improving customer satisfaction. Whilst Six Sigma perfor-mance may be unattainable in many cases, it is used as a target.
Lowerspecification
limit
Upperspecification
limit
2σ2σ
Two sigma
Lowerspecification
limit
Upperspecification
limit
6σ6σ
Six sigma
0.00034%probability of
defect
4.56%probability of
defect
The difference between a two sigma and a six sigma process
LSCH_C08.QXD 12/11/04 12:05 pm Page 244

Complexity in supply chains has a number of sources: the number ofproducts and variants offered; and the number of components and/or sub-assemblies; and the number of suppliers and customers and their location.
At Motorola, competitive pressure caused the company to extend itsrange of mobile telephones. However, often there was little commonalityof parts across the range. For a single product there could be over 100possible configurations, i.e. four different colours and 30 softwarechoices. Furthermore, these product variations were made ahead ofdemand to a forecast that was only accurate 3 per cent of the time!6 Toaddress this problem, Motorola devised a ‘Complexity Index’ for eachproduct, which included the number of components, the degree of com-monality, lead time of supply and so on. Ideas for new products withhigh scores on the Complexity Index tend not to be proceeded with. As aresult of this focus on complexity reduction, Motorola was able to signif-icantly reduce its costs and improve its responsiveness.
3 Identify the critical paths
Supply networks are in effect a complex web of interconnected ‘nodes’and ‘links’. The nodes represent the entities or facilities such as suppli-ers, distributors, factories and warehouses. The links are the means bywhich the nodes are connected – these links may be physical flows,
8 MANAGING RISK IN THE SUPPLY CHAIN
245
Six Sigma is a data-driven continuous improvement methodology thatseeks to bring processes under control and to improve process capability.The methodology itself follows the five-stage DMAIC cycle:
Define: What is it we are seeking to improve? Measure: What is the current capability of the process? What averages,what variability in process output is evident?Analyze: Map the process, use cause and effect analysis (Ishikawa) andprioritize for action.Improve: Re-engineer the process, simplify.Control: Improve visibility of the process. Use statistical process controland monitor performance.
Six Sigma tools and techniques enable the proper execution of the DMAICcycle and ensure that decisions are based on hard quantitative evidence.
Source: Christopher, M. and Rutherford, C., ‘Creating Supply Chain Resilience through Agile Six Sigma’, Critical Eye, June/August 2004.
LSCH_C08.QXD 12/11/04 12:05 pm Page 245

information flows or financial flows. The vulnerability of a supply net-work is determined by the risk of failure of these nodes and links.
As there will be potentially thousands of nodes and links the chal-lenge to supply chain risk management is to identify which of them are‘mission critical’. In other words, how severe would the effect of failurebe on the performance of the supply chain? Companies need to be ableto identify the critical paths that must be managed and monitored toensure continuity.
Critical paths are likely to have a number of characteristics:
● Long lead time, e.g. the time taken to replenish components fromorder to delivery.
● A single source of supply with no short-term alternative.● Dependence on specific infrastructure, e.g. ports, transport modes or
information systems.● A high degree of concentration amongst suppliers and customers.● Bottlenecks or ‘pinch points’ through which material or product
must flow.● High levels of identifiable risk (i.e. supply, demand, process, control
and environmental risk).
To help in identifying where the priority should be placed in supplychain risk management a useful tool is Failure Mode and EffectAnalysis (FMEA). The purpose of FMEA is to provide a systematicapproach to identifying where in a complex system attention should befocused to reduce the risk of failure. It is a tool more frequently associ-ated with total quality management (TQM) but it is especiallyapplicable to supply chain risk management. FMEA begins by lookingat each node and link and asking three questions:
● What could go wrong?● What effect would this failure have?● What are the key causes of this failure?
LOGISTICS AND SUPPLY CHAIN MANAGEMENT
246
LSCH_C08.QXD 12/11/04 12:05 pm Page 246

The next step is to assess any possible failure opportunity against thefollowing criteria:
● What is the severity of the effect of failure?● How likely is this failure to occur?● How likely is the failure to be detected?
A rating system such as the one shown below is then used to create acombined priority score by multiplying the three scores together.
8 MANAGING RISK IN THE SUPPLY CHAIN
247
■ Risk analysis scoring system ■
S = Severity 1. No direct effect on operating service level
2. Minor deterioration in operating service level
3. Definite reduction in operating service level
4. Serious deterioration in operating service level
5. Operating service level approaches zero
O = Likelihood of occurrence 1. Probability of once in many years2. Probability of once in many operating
months3. Probability of once in some operating
weeks4. Probability of weekly occurrence5. Probability of daily occurrence
D = Likelihood of detection 1. Detectability is very high2. Considerable warning of failure before
occurrence3. Some warning of failure before
occurrence4. Little warning of failure before
occurrence5. Detectability is effectively zero
LSCH_C08.QXD 12/11/04 12:05 pm Page 247

4 Manage the critical paths
Once the critical nodes and links have been identified the first questionis how can the risk be mitigated or removed? At its simplest this stageshould involve the development of contingency plans for actions to betaken in the event of failure. At the other extreme, re-engineering of thesupply chain may be necessary. Where possible Statistical ProcessControl should be used to monitor the critical stages along the pipeline.
‘Cause and effect’ analysis is another tool that can be used to identifythe causes of problems with a view to removing or avoiding the causes.It seeks to separate symptoms from causes by a process of progressivequestioning – sometimes known as ‘Asking why five times’ (see box).
If bottlenecks are the cause of the problem then decisions will have to bemade about the options. Can the bottlenecks be removed? Can they bereduced by adding capacity or by holding inventory? Sometimes the bot-tleneck may be a key supplier who is capacity constrained. If alternativesources are not available at short notice then it will be necessary tomanage the bottleneck by carrying strategic inventory to enable the flowthrough the downstream nodes to be maintained.
LOGISTICS AND SUPPLY CHAIN MANAGEMENT
248
■ Asking ‘why?’ – five times ■
1. Q. Why did the machine stop?A. There was an overload and the fuse blew.
2. Q. Why was there an overload?A. The bearing was not sufficiently lubricated.
3. Q. Why was it not sufficiently lubricated?A. The lubrication pump was not pumping sufficiently.
4. Q. Why was it not pumping sufficiently?A. The shaft of the pump was worn and rattling.
5. Q. Why was the shaft worn?A. There was no strainer and metal scrap got in.
Repeating why five times like this can help uncover the root problem andcorrect it. If this procedure were not carried through, one might simplyreplace the fuse or the pump shaft. In that case the problem would reoccurin a few months.
Source: Taiichi Ohno, Toyota Production System, Productivity Press, 1988.
LSCH_C08.QXD 12/11/04 12:05 pm Page 248

Whilst the drive for commonality of components and standardiza-tion of platforms in a manufacturing context helps reduce complexity,as was noted earlier, it can also add to risk if the component or plat-form comes from a single source. The case of Aisin Seiki and Toyotadescribed below highlights the potential danger.
5 Improve network visibility
Many supply chains suffer from limited visibility. What this means isthat a particular entity in the network is not aware of the status ofupstream and downstream operations of the levels and flow of inven-tory as it progresses through the chain.
8 MANAGING RISK IN THE SUPPLY CHAIN
249
Don’t lean too far
On Monday, 3 February 1997, Japan’s largest motor manufacturer,Toyota, announced that all of its Japanese assembly lines had beenbrought to a halt following a devastating fire at the premises of one ofits affiliated suppliers, Aisin Seiki. The company supplied brake mastercylinders for several Toyota models and was its only supplier of brake-fluid proportioning valves. The fire had shown up one of the weaknessesof Toyota’s famous lean manufacturing system, which runs on minimumstock levels using components delivered on a just-in-time basis from asmall number of linked-ownership suppliers. The fire left Toyota hold-ing only half a day’s stock of the vital components. The motormanufacturer’s production lines ground to a halt soon afterwards, as didthe lines of all other Toyota suppliers. This was not the first time that acatastrophic event had shut down production throughout the Toyotakieretsu. The company had suffered similar problems in 1995 when theHanshin earthquake severed its supply lines to component manufactur-ers in and around the city of Kobe.
Toyota’s rival Honda has long worked a policy of dual sourcing,partly because its does not have such a tightly bound network of suppliersand partly to hedge against the loss of a key supplier. Honda maintainsthat there are advantages in retaining a degree of competitive rivalryamong suppliers, believing that this pushes forward quality and costimprovements.
LSCH_C08.QXD 12/11/04 12:05 pm Page 249

In such a situation it can often be weeks or months before problemsbecome visible, by which time it may be too late to take effectiveaction. The case study of Nokia and Ericsson featured below demon-strates the advantage that supply chain visibility can confer.
LOGISTICS AND SUPPLY CHAIN MANAGEMENT
250
Nokia and Ericsson
Nokia obviously has better supply chain management than its com-petitors, and that definitely helps margins by allowing them to getcomponents when others can’t – and at lower prices … While Nokiadoes get priority because they’re a large customer, they’ve been amuch better customer by ordering sufficient quantities in advance,not cancelling orders, and sharing their projections with customers.1
Just how good Nokia’s supply chain management is was demonstratedin March 2000. Worldwide demand for mobile telephones was boomingand shortages of critical components regularly represented a threat togrowth. Two of the international market leaders were Finnish electron-ics company Nokia and its Swedish rival Ericsson. This is the tale ofhow a thunderstorm over central New Mexico would trigger a series ofevents that would eventually severely disadvantage one of the players.
On 17 March 2000, a lightening bolt hit a power line, which causeda fluctuation in the power supply. With no power to keep fans running,a fire broke out in a furnace in a semiconductor plant owned by Dutchfirm Phillips Electronics NV. The fire was brought under control inminutes, but eight trays containing enough silicon wafers for thousandsof mobile phones were destroyed in the furnace.2 The damage to thefactory from smoke and water was much more extensive than the fireitself, contaminating the entire stock of millions of chips.
Phillips immediately prioritized its customers, according to the valueof their business. Between them, Nokia and Ericsson accounted for40 per cent of the plant’s output of the vital radio frequency chips, sothese companies were put at the top of the supplier’s list. They wouldbe notified of the fire in due course.
Over in Finland Nokia’s supply chain managers had almost immediatelydetected that there was a problem. Within two days of the fire Nokia’sevent management systems indicated that something was badly amiss.Even then orders were not coming through as predicted. A components
LSCH_C08.QXD 12/11/04 12:05 pm Page 250

8 MANAGING RISK IN THE SUPPLY CHAIN
251
purchasing manager telephoned the supplier, who informed him that therehad been a fire in the plant, which was likely to disrupt production foraround a week. As a matter of routine, Nokia’s staff immediately placedthe five components produced at the Phillips plant on ‘special monitor’ list.From then onwards Nokia increased monitoring of incoming suppliesfrom weekly to daily checks.
It soon became clear to both Nokia and Phillips that the problem wasso serious that supplies could be disrupted for months. Pressure wasbrought to bear at the highest levels between Nokia and its supplier toensure that all other Phillips plants were commissioned to use any addi-tional capacity to meet Nokia’s requirements. In addition, Nokiaimmediately sent representatives out to its other suppliers in the US andJapan to secure priority status for all available supplies of chips and topersuade them to ramp up production as quickly as possible. BecauseNokia was such an important customer, they obliged with a lead time ofless than one week. Nokia also set about reconfiguring its products totake slightly different chips from other sources.
Ericsson had remained oblivious to the fire or its effects on the phonemaker’s incoming orders until three days after the event, when a techni-cian from Phillips called a counterpart in Ericsson to notify him of thefire. Accepting the initial assurances from the supplier that the fire wasonly a minor event, Ericsson did not recognize the need to act until earlyApril. By then Nokia had already moved to secure its supplies, and unlikethe quick-acting Finns, Ericsson had no alternative sources of supply. Ithad taken the decision some years earlier to single source key componentsin a bid to simplify its supply chains as a cost-reduction measure.
Ericsson lost an estimated $400m in new product sales as a result ofthe fire. An insurance claim would later offset some of the losses, butnevertheless Ericsson was forced to cease manufacturing mobile phones.In contrast, the vigilant Nokia was able to maintain production levelsthroughout, enabling it to cement its position as European market leader.
References1. Gregory Teets, Analyst, in: Gain, B. and Dunn, D., ‘Nokia Stays Firmly on Path
While its Competitors Stumble’, Electronic Buyers’ News, 30 October, No. 1235,2000, p. 4.
2. Latour, A. ‘Was Sisu the Difference?’, Wall Street Journal, 29 January 2001.
LSCH_C08.QXD 12/11/04 12:05 pm Page 251

We referred in Chapter 7 to the potential of supply chain event man-agement (SCEM) to enable better identification of the occurence ofunplanned events (or the non-occural of planned events). Tools such asthese can significantly reduce supply chain uncertainty and thus reducethe need for additional inventory buffers. Another emerging technologythat is enabling dramatic improvements in visibility is Radio FrequencyIdentification (RFID).
RFID tags enable a supply chain ‘track and trace’ capability to becreated. Tags are either ‘active’ or ‘passive’. Active tags transmit infor-mation to receiving stations and passive tags are read by scanners asthey move through the chain. As the cost of these tags falls, and asmore and more organizations require their suppliers to use them, thenthe adoption of this technology will accelerate. The impact, for exam-ple, of the decisions by Wal-Mart and the US Defense Department toutilize RFID has already had an impact on the rate of adoption.
A parallel technological development that will greatly assist theglobal management of assets in the supply chain is satellite tracking.Containers and trucks can be fitted with devices that enable the geo-graphical position of the asset to be monitored by satellite, includinginformation on variables such as temperature.
The challenge, as ever, is not technological but is the need to engendera greater willingness amongst supply chain entities to share informationwith each other, even if that information may not always be good news.
6 Establish a supply chain continuity team
All the foregoing stages in the supply chain risk management processrequire resources to undertake them. One way to do this is to create apermanent supply chain continuity team.
Many companies already have business continuity teams in placebut, as was suggested earlier, often their focus is more limited andlargely IT/IS focused. Other companies look at risk mainly from afinancial perspective. All of these activities are necessary and essentialbut the argument here is that these teams should be expanded in theirscope to take account of the fact that the biggest risk to business conti-nuity lies in the wider supply chain.
Ideally these teams will be cross-functional and will have access to allthe skills necessary to undertake the detailed analysis and implementation
LOGISTICS AND SUPPLY CHAIN MANAGEMENT
252
LSCH_C08.QXD 12/11/04 12:05 pm Page 252

involved in the supply chain risk management process. The team shouldmaintain a ‘risk register’, which identifies the possible points of vulnerabil-ity along with the actions that are to be taken to mitigate thatvulnerability.
To ensure that high priority is given to supply chain risk manage-ment, the team should report to a board-level executive – ideally theSupply Chain Director or Vice-President if that person is on the board.
7 Work with suppliers and customers
Given the complexity of most supply networks, how can risk be bettermanaged upstream and downstream of the focal firm? Ideally, if eachentity in a network took responsibility for implementing risk managementprocedures of the type advocated here with their immediate first tier sup-pliers and customers then a far more resilient supply chain would emerge.
There are some good examples of collaborative working with bothsuppliers and customers to develop a greater understanding of thepotential vulnerabilities in specific industries. At BAe systems – a majoraerospace company – they have a strategic supplier managementprocess with about 200 key suppliers based upon an industry initiative‘Supply Chain Relationships in Action’ (SCRIA). BAe put small teamsinto these key suppliers to find ways of aligning supply chain processesand improving visibility. With their biggest suppliers such as Rolls-Royce there is ongoing contact right up to board level.
This approach is akin to the idea of supplier development, which hasbeen quite widely adopted in the automotive sector. Going beyond thisthere is an opportunity to draw from the experience of companies whohave insisted that their suppliers meet rigorous quality standards in termsof the products that they supply. The same practice could be applied insupply chain risk management by requiring suppliers to monitor andmanage their supply chain vulnerabilities. In this way a ‘snowball effect’might be achieved, with each supplier working with their first tier suppli-ers to implement supply chain risk management procedures.
Target Stores, the North American retailer, requires its suppliers to signan agreement that they will comply with Target’s requirements on supplychain security and risk management. Pfizer, the pharmaceutical company,also has clearly established performance standards for its suppliers interms of supply chain management which are audited continuously.
8 MANAGING RISK IN THE SUPPLY CHAIN
253
LSCH_C08.QXD 12/11/04 12:05 pm Page 253

Achieving supply chain resilience
Because even the best managed supply chains will hit unexpected tur-bulence or be impacted by events that are impossible to forecast, it iscritical that resilience be built into them. Resilience implies the abilityof a system to return to its original or desired state after being dis-turbed.7 Resilient processes are flexible and agile and are able tochange quickly. In this latter respect it is important to realize thatvelocity alone is not enough – it is acceleration or the ability to rampup or down quickly that matters so far as resilience is concerned.Supply chain resilience also requires ‘slack’ at those critical points thatconstitute the limiting factors to changes in the rate of flow.
Access to information as rapidly as possible is also a prerequisite forresilience as we observed in the Nokia/Ericsson case study. Throughcollaborative working this information can be converted into supplychain intelligence. Because networks have become more complex theywill rapidly descent into chaos unless they can be connected throughshared information and knowledge. The aim is to create a supply chaincommunity whereby there is a greater visibility of upstream and down-stream risk profiles (and change in those profiles) and a sharedcommitment to mitigate and manage those risks.
Finally, supply chain resilience requires a recognition that whenstrategic decisions are taken, such as relocating facilities or changingsources of supply, then the impact of those decisions on the supplychain risk profile must be fully understood. Based upon that analysis itmay be necessary to re-engineer the supply chain, or parts of it, toensure the mitigation or removal of that risk. Figure 8.4 attempts tosummarize the different requirements that need to be in place if supplychain resilience is to be improved.
A report by A. T. Kearney8 suggested a number of stages to supplychain risk management excellence (see Table 8.1). Stage 1 companieshave a very limited definition of risk, largely confined to financial, prop-erty and IT issues. At the other extreme, stage 5 companies have a supplychain wide perspective and have active programmes for risk mitigation.
LOGISTICS AND SUPPLY CHAIN MANAGEMENT
254
LSCH_C08.QXD 12/11/04 12:05 pm Page 254

8 MANAGING RISK IN THE SUPPLY CHAIN
255
Boa
rd-l
edre
spon
sib
ility
and
lead
ersh
ip
4. C
reat
ing
asu
pp
ly c
hain
ris
km
anag
emen
t cu
lture
Fact
or r
isk
cons
ider
atio
nsin
to d
ecis
ion
mak
ing
Est
ablis
hsu
pp
ly c
hain
cont
inun
ityte
ams
2. S
upp
ly c
hain
colla
bor
atio
n
Col
lab
orat
ive
pla
nnin
g
1. S
upp
ly c
hain
(re-)
engi
neer
ing
Sup
ply
chai
nin
telli
genc
e
3. A
gilit
y
Vis
ibili
ty
Velo
city
and
acce
lera
tion
Sou
rcin
gd
ecis
ions
and
crite
ria
Sup
plie
rd
evel
opm
ent
Sup
ply
chai
nun
der
stan
din
g
Map
pin
g an
dcr
itica
lp
ath
anal
ysis
Sup
ply
chai
n d
esig
np
rinci
ple
s
Effi
cien
cyvs
red
und
ancy
Sup
ply
chai
n ris
kre
gist
er
Rea
lop
tions
thin
king
The
resi
lient
sup
ply
cha
in
Sup
ply
bas
est
rate
gy
Fig.
8.4
Crea
ting
the
resi
lient
sup
ply
chai
n
LSCH_C08.QXD 12/11/04 12:05 pm Page 255

LOGISTICS AND SUPPLY CHAIN MANAGEMENT
256
Tabl
e 8.
1St
ages
of e
xcel
lenc
e in
sup
ply
chai
n ris
k m
anag
emen
t
Dim
ensi
onS
tage
1S
tage
2S
tage
3S
tage
4
Res
po
nsib
ility
leve
l●
Func
tiona
l or
●B
usin
ess
unit
●C
orp
orat
e (c
hief
ris
k ●
Ext
end
ed e
nter
pris
ed
epar
tmen
tal s
kills
offic
er)
(boa
rd le
vel)
Sco
pe
of
risk
●M
arke
t ris
ks (f
orei
gn
●M
arke
t ris
k●
All
ente
rpris
e ris
ks●
Str
ateg
ic r
isks
exch
ange
cre
dit,
●
Pro
per
ty o
r sa
fety
ris
k●
Bus
ines
s co
ntin
uity
●O
per
atio
nal r
esili
ence
com
mod
ity)
●O
per
atio
nal r
isk
●C
ount
ry r
isk
●G
lob
al b
usin
ess
●P
rop
erty
or
safe
ty r
isks
●IT
dis
rup
tion
●K
ey b
usin
ess
proc
esse
sen
viro
nmen
t●
IT s
ecur
ity●
Eas
ily q
uant
ified
ris
ks●
Day
-to-
day
ris
ks●
Org
aniz
atio
nal o
r cu
ltura
l com
pon
ent
of r
isk
man
agem
ent
Ris
k-m
itig
atio
n to
ols
●Fi
nanc
ial d
eriv
ativ
es,
●In
cide
nt d
ata
and
tren
d●
Con
tinge
ncy
pla
nnin
g●
Ad
vanc
e w
arni
ngp
rop
erty
insu
ranc
ean
alys
is●
Sce
nario
ana
lysi
ssy
stem
s●
Sup
plie
r co
ntra
ct●
New
bus
ines
s an
d n
ew
●B
ack-
up o
f pro
cess
es
revi
ews
vent
ure
revi
ews
as w
ell a
s d
ata
●S
elf-
asse
ssm
ent
●In
dep
end
ent
aud
its●
Qua
rter
ly d
rills
tha
t ●
Ris
k ad
just
ed
incl
ude
key
par
tner
sp
erfo
rman
ce m
easu
res
Mo
tiva
tio
n●
Follo
w r
egul
atio
ns,
●A
void
op
erat
iona
l ●
Pro
tect
bra
nd im
age,
●
Cre
ate
com
pet
itive
re
duc
e fin
anci
al
disr
uptio
ns, a
void
cos
tsm
aint
ain
earn
ings
ad
vant
age,
gen
erat
eex
pos
ure
of a
ccid
ents
stab
ility
shar
ehol
der
val
ue
LSCH_C08.QXD 12/11/04 12:05 pm Page 256

8 MANAGING RISK IN THE SUPPLY CHAIN
257
Tabl
e 8.
1Co
ntin
ued
Dim
ensi
onS
tage
1S
tage
2S
tage
3S
tage
4
Up
dat
es t
o r
isk
pla
n●
Nev
er●
Aft
er m
ajor
inci
den
ts●
Ann
ually
●Q
uart
erly
Sup
ply
cha
in●
Buf
fer
inve
ntor
ies
●A
ltern
ativ
e su
pp
liers
●C
o-or
din
ated
fore
cast
s ●
Sup
ply
cha
in
●E
xces
s ca
pac
ity●
Rec
over
y p
lans
–
thro
ugho
ut s
uppl
y ch
ain
tran
spar
ency
sele
ct s
cena
rios
●‘W
hat
if’ m
odel
ling
●‘W
ar g
amin
g’●
Agi
lity:
pro
duc
ts a
nd
●D
ynam
ic r
eser
ves
of
pro
cess
escr
itica
l com
pon
ents
Co
llab
ora
tio
n●
Focu
s in
tern
ally
●C
omm
unic
ate
pol
icie
s ●
Col
lab
orat
e w
ith
●Le
ad in
dus
try
initi
ativ
es,
to s
upp
liers
sup
plie
rs, i
ndus
try
colla
bor
ate
with
as
soci
atio
nsgo
vern
men
t
Sour
ce: S
uppl
y Ch
ains
in a
Vul
nera
ble,
Vol
atile
Wor
ld. C
opyr
ight
A.T
. Kea
rney
, 200
3. A
ll rig
hts
rese
rved
. Rep
rinte
d w
ith p
erm
issi
on.
LSCH_C08.QXD 12/11/04 12:05 pm Page 257

Summary
All the evidence indicates that as markets become more volatile and thebusiness environment more turbulent, so supply chains become more vul-nerable to disruption. Not all of the risk to supply chain continuity isexternal. Significant risk can be created as a result of management deci-sions that are taken on supply chain design and strategy.
It is imperative that organizations manage supply chain risk in a sys-tematic way. The risk profile of supply chains must be identified andcontinuously monitored, critical paths through the network assessedand, if necessary, safeguards built in.
Because the financial risk to the business of supply chain disruptioncan be so great, it is essential that these issues receive top managementattention on an ongoing basis. In today’s complex and interconnectedworld supply chain risk management will need to be placed muchhigher on the boardroom agenda.
References
1. Singhal, V.R. and Hendricks, K., Supply Chain Management Review, January/February 2002.
2. Ibid.3. The Economist, The Extended Enterprise 2002: CEO Agenda, Economist White
Paper Series, 2002.4. Cranfield School of Management, Supply Chain Vulnerability, report on behalf
of DTLR, DTI and Home Office, 2002.5. Houghton, T., Markham, B., and Tevelson, B. ‘Thinking Strategically About Supply
Chain Management’, in Supply Chain Management Review, Sept–Oct. 2002.6. Whyte, C., ‘Motorola’s Battle with Supply and Demand Chain Complexity’,
Supply and Demand Chain Executive, 12 August 2004.7. Cranfield School of Management, Creating Resilient Supply Chains: A Practical
Guide, report on behalf of the Department for Transport, 2003.8. A.T. Kearney, Supply Chains in a Vulnerable, Volatile World, 2003.
LOGISTICS AND SUPPLY CHAIN MANAGEMENT
258
LSCH_C08.QXD 12/11/04 12:05 pm Page 258

Overcoming the barriers tosupply chain integration
Creating the logistics vision 261
The problems with conventional organizations 262
Developing the logistics organization 267
Logistics as the vehicle for change 274
Benchmarking 275
259
Chapter
9
LSCH_C09.QXD 12/11/04 12:05 pm Page 259

This chapter:
Considers some of the organizational impediments toimplementation of integrated supply chain strategies,highlighting the problems with conventional, func-tionally focused management systems.
●
Identifies logistics as a planning and co-ordinationactivity, a force for organizational change and one ofseveral core processes within a horizontally organized,market-facing business.
●
Stresses the need to extend logistics integrationupstream to suppliers and downstream to distributorsand customers, outlining a series of measures whichfacilitate the development of integrated end-to-endsupply chain processes.
●
Highlights the importance of process benchmarkingto identify best practice.
●
Suggests appropriate Key Performance Indicatorsto support a more responsive, customer-facingorganization.
LOGISTICS AND SUPPLY CHAIN MANAGEMENT
260
LSCH_C09.QXD 12/11/04 12:05 pm Page 260

The transition to the twenty-first century seems to have been accom-panied by ever higher levels of change in the business environment.
Companies that were market leaders a decade ago have in many casesencountered severe reversals of fortune. Mergers and takeovers havechanged the shape of many markets and the advent of regional andglobal competition have changed for all time the rules of the game. Ontop of all this, as we have noted, has been a growing demand from themarketplace for ever higher levels of service and quality. These pres-sures have combined to produce a new imperative for the organization:the need to be responsive.
The responsive organization not only seeks to put the customer at thecentre of the business, but it also designs all its systems and procedureswith the prime objective of improving the speed of response and the reli-ability of that response. Traditional organizations have grown heavywith layer upon layer of managementand bureaucracy. Such companieshave little chance of remaining com-petitive in the new marketplace.Neither is it sufficient to rely uponrestructuring the organization through removing layers of management,i.e. ‘flattening’ the organizational chart – as many companies are nowseeking to do – if such ‘de-layering’ is not accompanied by equivalentchange to the networks and systems that deliver service to the customer.
Creating the logistics vision
Making service happen is the ultimate challenge. Whilst it is by nomeans easy to develop strategies for service that will lead to improvedcompetitive performance, the hardest task is to put that strategy intoaction. How do we develop an organization that is capable of deliver-ing high quality service on a consistent, ongoing basis?
9 OVERCOMING THE BARRIERS TO SUPPLY CHAIN INTEGRATION
261
Traditional organizations havegrown heavy with layer upon layerof management and bureaucracy.
LSCH_C09.QXD 12/11/04 12:05 pm Page 261

These days most companies are familiar with the idea of ‘missionstatements’ as an articulation of the vision of the business. The missionstatement seeks to define the purpose of the business, its boundariesand its aspirations. It is now by no means uncommon for organizationsto have such statements for the business as a whole and for key con-stituent components. What some companies have found is that therecan be significant benefits to defining the logistics vision of the firm.
The purpose of the logistics vision statement is to give a clear indica-tion of the basis on which the business intends to build a position ofadvantage through closer customer relationships. Such statements arenever easy to construct. There is always the danger that they willdescend into vague ‘motherhood’ statements that give everyone a warmfeeling but provide no guidelines for action.
Ideally the logistics vision should be built around the simple issue of‘How do we intend to use logistics and supply chain management tocreate value for our customers?’ To operationalize this idea will necessi-tate a detailed understanding of how customer value is (or could be)created and delivered in the markets in which the business competes.Value chain analysis will be a fundamental element in this investiga-tion, as will the definition of the core competencies and capabilities ofthe organization. Asking the questions ‘What activities do we excel in?’and ‘What is it that differentiates us from our competitors?’ is the start-ing point for creating the logistics vision statement.
The four elements of logistics-derived customer value highlightedpreviously are ‘Better, Faster, Cheaper, Closer’ and the criterion for agood logistics vision statement is that it should provide the roadmapfor how these four goals are to be achieved.
The problems with conventional organizations
Amongst experienced observers and commentators of the logisticsmanagement process there is general agreement that the major barrierto the implementation of the logistics concept is organizational. Inother words, a major impediment to change in this crucial managerialarea is the entrenched and rigid organizational structure that mostestablished companies are burdened with.
LOGISTICS AND SUPPLY CHAIN MANAGEMENT
262
LSCH_C09.QXD 12/11/04 12:05 pm Page 262

There is a great danger that those companies that do not recognizethe need for organizational change, or that lack the will to make ithappen, will never achieve the improvements in competitive advantagethat integrated logistics management can bring. The argument advancedhere is that the demands of the marketplace for enhanced service provi-sion combined with dramatically heightened competition call for aparadigm shift in the way in which we think about our organizations.
The concept of integrated supply chain management, whereby flowsof information and material between source and user are co-ordinatedand managed as a system, is now widely understood, if not widelyimplemented. The logic of linking each step of the process as materialsand products move towards the customer is based upon the principlesof optimization. In other words, the goal is to maximize customer ser-vice whilst simultaneously minimizing costs and reducing assets lockedup in the logistics pipeline.
However, in the conventional organization this poses an immediateproblem. Most companies are organized on a functional basis. In otherwords, they have created a division of responsibility by function, so wemight find a purchasing function, a production function, a sales func-tion and so on. Typically the organization chart would look like that inFigure 9.1.
Each of the ‘vertical’ functions in the conventional organization is nor-mally headed by senior managers who come to regard their functionalarea as their ‘territory’. Indeed in many companies these functionalheads are ‘barons’ who wield considerable power and who jealouslyguard those territories from what they perceive as unwarranted incur-sions from other functional barons.
9 OVERCOMING THE BARRIERS TO SUPPLY CHAIN INTEGRATION
263
Purchasing Production Distribution Sales
Fig. 9.1 The functional organization
LSCH_C09.QXD 12/11/04 12:05 pm Page 263

Further reinforcing the functional or vertical orientation in the con-ventional organization is the budgeting system. Typically, each functionwill be driven by a budget that seeks to control the resources consumedby those functions. It is almost as if the company is working on theassumption that the prime purpose of any enterprise is to control theconsumption of resources. In fact, the leading-edge companies have longsince realized that the sole purpose of the business is to create profitableoutputs and that outputs, not inputs, should form the basis both for theway we organize and for the way we plan and control.
We will look in detail later at the alternative models for organizationand for planning and control, but first let us highlight some of the realproblems that the conventional organization creates that hamper thesuccessful implementation of integrated logistics management.
Inventory builds up at functional boundaries
If individual functions are encouraged to ‘optimize’ their own costs –because of the budgeting system – then this will often be at the expenseof substantially increased inventory across the system as a whole. Whathappens if, say, production seeks to minimize the unit costs of produc-tion by maintaining long production runs with large batch quantities isthe creation of more inventory than is normally required for immediaterequirements. Likewise, if purchasing management seeks low materialcosts through bulk purchases then again the inventory of raw materialsahead of production will often be excessive. Similar buffers of inven-tory will exist right across the supply chain at boundaries withinorganizations and, indeed, at boundaries between organizations.
Not only is this increased inventory a financial burden and a furtherstrain on working capital, it also obscures our ‘visibility’ of finaldemand. Thus upstream activities may not have any clear view of whatthe real demand is downstream, as all they see is a reorder-point-generated order hitting them at short notice (or more often than not,no notice at all). Figure 9.2 illustrates this point.
LOGISTICS AND SUPPLY CHAIN MANAGEMENT
264
LSCH_C09.QXD 12/11/04 12:05 pm Page 264

Pipeline costs are not transparent
Closely related to the preceding issue is the problem of cost ‘trans-parency’. What this means is that costs relating to the flows of materialacross functional areas are not easy to measure. Hence the real costs toserve different customers with different product mixes are rarely revealed.
Once again the problem is that the conventional organization willnormally only identify costs on a functional basis, and even then at afairly high level of aggregation. Hence we may well know our transportcosts in total but not necessarily how they vary by customer categoryor by delivery characteristics, e.g. central delivery to a regional distrib-ution centre or local delivery to a supermarket. Where attempts toestimate the costs of outputs are made they usually require, out ofnecessity, crude allocation procedures. As we noted in Chapter 3, therehas recently been much interest in ‘throughput accounting’ and ‘activ-ity-based costing’, both of which are attempts to pin down costs as theyoccur and hence to make the total pipeline costs easier to identify. Theproblem need not exist, it is only a problem because the costing systemswe have are designed to monitor functional or input costs rather thanflow or output costs. Figure 9.3 makes this point.
9 OVERCOMING THE BARRIERS TO SUPPLY CHAIN INTEGRATION
265
National distributioncentre
Regional distributioncentre
Stockist
Reorderpoint
Reorderpoint
Reorderpoint
Inve
ntor
y le
vel
Fig. 9.2 Inventory hides demand
Market/outputcosts
Functional/inputcosts
Fig. 9.3 Alternative cost concepts
LSCH_C09.QXD 12/11/04 12:05 pm Page 265

Functional boundaries impede process management
The process of satisfying customer demand begins with in-boundsupply and continues through manufacturing or assembly operationsand onwards by way of distribution to the customer. Logically the idealway to manage this process is as a complete system, not by fragmentingit into watertight sections. Yet that is more or less what happens in theconventional business as we have seen. Not only is this inefficient, itactually leads to a loss of effectiveness in competitive terms.
Many of the variations in the order-to-delivery cycle, for example, arecaused by the variability that inevitably arises in the inefficient proce-dures that have to be created to manage the interfaces betweenfunctions. The time taken to process orders, for instance, is oftenextended purely because of the paperwork, checking and re-checking,that conventional systems generate. Because organizations grow organi-cally they tend to add to existing processes in a patchwork mannerrather than taking a ‘clean piece of paper’ approach. As a result the sys-tems in use tend to owe more to history than to any concept of holisticmanagement. This phenomenon is further compounded by the inabilityof managers to detach themselves from their familiar surroundings andto see the ‘big picture’. Instead there is a natural tendency to focus onpiecemeal improvements within their own narrow functional area.
To achieve a smooth-flowing logistics pipeline requires an orienta-tion that facilitates end-to-end process management. The principle canbe compared to the management of an industrial process, say an oilrefinery, where to ensure the achievement of optimum efficiency theentire process is managed and controlled as a system, not as a series ofadjacent, independent activities.
The cost to an organization, and indeed to the economy as a whole, ofthese fragmented processes can only be guessed at, but it must be huge.
Conventional organizations present many faces to the customer
Perhaps the most damning criticism of the traditional organization isthat it does not present a ‘single face’ to the customer. Rather than thecustomer having to do business with just one organization, in effectthey deal with many.
This criticism goes beyond the obvious problems that arise when acustomer, seeking, say, information on an order, is passed from one sec-tion of the company to another – although that is a common enough
LOGISTICS AND SUPPLY CHAIN MANAGEMENT
266
LSCH_C09.QXD 12/11/04 12:05 pm Page 266

occurrence. The real problem is that no one person or department isempowered to manage a customer from enquiry through to order deliv-ery – in other words, to service the customer.
Consider for a moment how the conventional organization processesorders. Typically there will be a sequence of activities beginning withorder entry. The point of entry may be within the sales or commercialfunction but then it goes to credit control, from where it may pass toproduction planning or, in a make-to-stock environment, to the ware-house. Once the order has been manufactured or assembled it willbecome the responsibility of distribution and transport planning. At thesame time there is a separate process involving the generation of docu-ments such as bills of lading, delivery notes, invoices and so on. Theproblem is that these activities are sequential, performed in seriesrather than in parallel. Each function performs its task and then passesthe order on to the next function; at each step it is as if the order is‘thrown over the wall’. Figure 9.4 depicts this classic process.
Developing the logistics organization
Some commentators have suggested that the solution to the problems out-lined above lies in creating a higher level of authority in the form of alogistics function that links together the purchasing, production and distri-bution tasks. Appealing as this may appear at first sight, it will not solvethe underlying conflicts that the traditional organization creates. It merelyadds another layer of management. At a time when the trend is towards‘flattening’ organizations, this solution is unlikely to gain ground.
9 OVERCOMING THE BARRIERS TO SUPPLY CHAIN INTEGRATION
267
Traditional sequential order processing system
Fig. 9.4 Managing the order
LSCH_C09.QXD 12/11/04 12:05 pm Page 267

Instead radical solutions must be sought which may require arestructuring of the conventional ‘vertical’ organization and lead to thecreation of a ‘horizontal’, or market-facing, business. Figures 9.5 and9.6 contrast the ‘vertical’ with the ‘horizontal’ organization.
The horizontal organization has a number of distinguishing charac-teristics. It is:
● Organized around processes● Flat and de-layered● Built upon multi-functional teams● Guided by performance metrics that are market-based
It is the focus on processes rather than functions that is the key to thehorizontal organization. The basic precept of process management isthat it is through processes that customer value is created. Hence thelogic of seeking to manage processes on an integrated basis.
LOGISTICS AND SUPPLY CHAIN MANAGEMENT
268
Input focused, budget-driven
Traditional, functional organization
Fig. 9.5 Vertical organizational focus
LSCH_C09.QXD 12/11/04 12:05 pm Page 268

In most organizations there will only be a limited number of coreprocesses and the following are likely to be central to most businesses:
● Innovation (including new product development)● Consumer development (primarily focused on building loyalty with
end users)● Customer management (creating relationships with intermediaries)● Supplier development (strengthening upstream and alliance relation-
ships)● Supply chain management (the cash-to-cash process)
Typically, companies that focus upon process management have recog-nized that they are best managed by cross-functional teams. These teamswill comprise specialists drawn from the functional areas (which nowbecome ‘centres of excellence’) and will be led by ‘integrators’ whose jobit is to focus the process team around the achievement of market-basedgoals. In such organizations a different type of skills profile is clearlyrequired for managers at all levels. Equally the reward systems need tochange as the horizontal organization by definition is flatter and hencethe traditional upward promotion opportunities are fewer.
9 OVERCOMING THE BARRIERS TO SUPPLY CHAIN INTEGRATION
269
Out
put
focu
sed
, mar
ket-
driv
en
Market-facing organization
Fig. 9.6 Horizontal organizational focus
LSCH_C09.QXD 12/11/04 12:05 pm Page 269

Making the change from the ‘vertical’ to the ‘horizontal’ poses manychallenges and yet it is critical to the implementation of a market-driven logistics strategy.
The achievement of this transformation might begin by the recogni-tion that logistics is essentially a planning orientation – in other wordsthe logistics management process entails the linking of productionplans with materials requirements plans in one direction and distribu-tion requirements plans in the other. The aim of any organizationshould be to ensure that production produces only what the market-place requires whilst purchasing supplies production with what it needsto meet its immediate requirements. How can this fairly obvious ideabe converted into reality?
LOGISTICS AND SUPPLY CHAIN MANAGEMENT
270
Developing process management skills at Unipart
Unipart Group of Companies (UGC) was formed in 1987, when thegroup’s Chief Executive John Neill led a buy-out of a disparate collec-tion of functional parts of the failing nationalized Rover Group. Withinthe privatized UGC the autonomous functional groups – automotiveparts manufacturing, warehousing and distribution, sales, marketing,information systems and communications – became divisions of UGC.1
Most prominent was the large and successful automotive parts manu-facturing division, Unipart Industries, which had found itself in thehappy position of being able to acquire leading-edge lean manufactur-ing and process management know-how from two of its Japanesecustomers, Honda and Toyota.
UGC’s divisions, though operating as independent business units,were to some extent interdependent, and the company’s senior man-agement were quick to recognize that the less efficient and agile partsof the business would, in time, impede the development of the others.To lift the competitiveness of the whole enterprise, each division wascharged with identifying best practice in its field, tailoring it toUnipart’s needs and then – as a centre of excellence within the business– passing this learning on to other departments. Unipart’s now famoustraining establishment ‘Unipart University’ was devised as a means oftranscending divisional barriers and speeding up the dissemination ofknow-how throughout the business. In practice this meant that all
LSCH_C09.QXD 12/11/04 12:05 pm Page 270
9 OVERCOMING THE BARRIERS TO SUPPLY CHAIN INTEGRATION
271
employees, from shop floor to directors, became involved in continu-ous learning programmes and team-based problem-solving exercises.Unipart was in fact amongst the first British companies to introducetruly cross-functional team working. The move highlighted the needfor employees to acquire a working knowledge of each other’s rolesand to extend their own skills beyond those required to perform theirfunctional tasks. Unipart University is therefore equipped to help andencourage all employees to acquire voluntarily a much wider range ofskills and qualifications, offering everything from remedial adult liter-acy programmes to the chance to study for an MBA.2
The development of process management skills throughout the busi-ness has been amongst the most significant breakthroughs inorganizational learning at UGC. Unipart Industries had been workingto strengthen its relationships with key suppliers through a mutuallyagreed continuous improvement process known as ‘Tend-to-Zero’.Tend-to-Zero provides a framework for identifying the ten most criti-cal factors in the business relationship – quality, cost, delivery times,product range, environmental issues, etc. – and assessing the short-comings of each on a scale of zero to ten. A score of ten means thatsomething is unacceptable, so both sides work together towards aworld-class zero, with scores continually reassessed as the relationshipand business performance improves.
The transfer of this process expertise from Unipart Industries to theformer warehouse and distribution division, Unipart Demand ChainManagement (DCM), became an early priority within the group. Theaim was to get DCM to co-operate more closely with UnipartIndustries and its major suppliers so that together they could workmore effectively to fill orders on time. DCM went on to place anincreasing focus on teaching employees how to improve both internaland supplier processes to eliminate waste from the supply chain.3
References1. Womack, James P. and Jones, Daniel T., ‘From Lean Production to the Lean
Enterprise’, Harvard Business Review, March–April 1994, pp. 93–102.2. Bassett, Philip, The Times, 28 May 1997.3. Unipart Group of Companies, Annual Review, 1995, pp. 9, 21.
LSCH_C09.QXD 12/11/04 12:05 pm Page 271

The key lies in the recognition that the order and its associated informa-tion flows should be at the heart of the business. It may be a truism butthe only rationale for any commercial organization is to generate ordersand to fulfil those orders. Everything the company does should be directlylinked to facilitating this process, and the process must itself be reflected inthe organizational design and in its planning and control systems.
All of this leads to the conclusion that the order fulfilment processshould be designed as an integrated activity across the company withthe conventional functions of the business supporting that process. Toassist this transition the development of a customer order managementsystem is a vital prerequisite.
A customer order management system is a planning framework thatlinks the information system with the physical flow of materialsrequired to fulfil demand. To achieve this requires the central manage-ment of forecasts, requirements plans, material and production control,and purchasing.
At the heart of the customer order management system is a require-ments plan that is market-driven. The inputs to this plan include dataand information relating to enquiries and orders, price changes, pro-motional activity and product availability. This information providesthe basis for the forecast that then drives the requirements plan.Alongside this is a process for the fulfilment of current orders. They arenot separated but closely integrated through the information system.
Order fulfilment groups
Given that the process of managing orders can be refined along the linesdescribed above, what scope exists for improving the ‘process architecture’?
Several companies have experimented with the idea of a cross-functional, cross-departmental team to take responsibility for the man-agement of orders. This team may be termed the order fulfilment group.The idea behind such a group is that rather than having an organizationalstructure for order management where every activity is separated withresponsibility for each activity fragmented around the organization,instead these activities should be grouped together both organizationallyand physically. In other words, instead of seeing each step in the processas a discrete activity we cluster them together and bring the peopleinvolved together as well – ideally in a single open-plan office. Thus the
LOGISTICS AND SUPPLY CHAIN MANAGEMENT
272
LSCH_C09.QXD 12/11/04 12:05 pm Page 272

order fulfilment group might comprise commercial or sales office people,credit control and accounts, the production scheduler and transportscheduler – indeed anyone involved in the crucial business processes ofconverting an order into cash.
It is likely that in a large business serving many different customers anumber of these teams may be required. Indeed for the biggest, mostimportant accounts it is probable that a single dedicated team will berequired to manage the relationship.
The effect that such groups can have is often dramatic. Because allthe key people in the order fulfilment process are brought together andlinked around a common entity – the order – they are better able tosort out problems and eliminate bottlenecks. Order cycle times can bedramatically reduced as teamwork prevails over inter-departmentalrivalry. New ways of dealing with problems emerge, more non-value-added activities are eliminated and customer service problems – whenthey arise – can quickly be resolved, since all the key people are in closeconnection with each other.
Schonberger1 gives a number of examples of how the concept of amanufacturing ‘cell’ – where linked actions are performed in parallel bymulti-functional teams – can work just as effectively in order process-ing. One of the cases he quotes, Ahlstrom, a Finnish company, hasreduced lead times in order processing from one week to one day, andvariation in total lead time has dropped from up to six weeks to oneweek. Another case was that of Nashua Corporation in NorthAmerica, where order entry lead time has been reduced from eight daysto one hour, with a 40 per cent reduction in space and a 70 per centreduction in customer claims.
This approach has been likened to a game of rugby rather than arelay race! What this means is that a team of closely integrated col-leagues run up the field together passing the ball as they run. In a relayrace no one can run until they receive the baton from the precedingperson in the chain. The end result is that this vital part of the serviceprocess can be speeded up whilst simultaneously improving the qualityof the output, hence a major competitive advantage is achieved.
In a manufacturing context the customer order management systemmust be closely linked to production planning and the materials
9 OVERCOMING THE BARRIERS TO SUPPLY CHAIN INTEGRATION
273
LSCH_C09.QXD 12/11/04 12:05 pm Page 273

requirements plan. Ideally all the planning and scheduling activities inthe organization relating to the order and its satisfaction should bebrought together organizationally.
Logistics as the vehicle for change
As markets, technologies and competitive forces change at ever increas-ing rates the imperative for organizational change becomes morepressing. The paradox is that because organizational structures are
rigid, even ossified, they do not havethe ability to change at anything likethe same rate as the environment inwhich they exist.
The trend towards globalizationof industry, involving as it does theco-ordination of complex flows of
materials and information from a multitude of offshore sources andmanufacturing plants to a diversity of markets, has sharply highlightedthe inappropriateness of existing structures. What we are discovering isthat the driving force for organizational change is logistics.
To compete and survive in these global markets requires a logistics-oriented organization. There has to be nothing less than a shift from afunctional focus to a process focus. Such a radical change entails a re-grouping within the organization so that the key tasks become themanagement of cross-functional work flows. Hewlett Packard is anexample of a company that has restructured its organization aroundmarket-facing processes, rather than functions. Order fulfilment hasbeen recognized as a core process and so, on a global scale, there is oneorder management system architecture that links order entry, ordermanagement and factory order/shipment processing. This core processis supported by a common information system that provides ‘end-to-end’ visibility of the logistics pipeline from order through to delivery.
In fact it is through such breakthroughs in information technologythat the type of organizational change we are describing has been madepossible. The information network now defines the organization struc-ture. In other words, the information that flows from the marketplaceat one end of the pipeline to supply points at the other will increasinglyshape the organization – not the other way round.
LOGISTICS AND SUPPLY CHAIN MANAGEMENT
274
As markets, technologies andcompetitive forces change at everincreasing rates the imperative for
organizational change becomesmore pressing.
LSCH_C09.QXD 12/11/04 12:05 pm Page 274

Such a change will be accelerated by the trend, commented upon ear-lier in this book, for companies to focus on what might be termed ‘corecompetencies’ and to outsource everything else. In other words, thebusiness of tomorrow will most likely only perform those activities inthe value chain where they believe they have a differential advantage,and all other activities will be performed by partners, co-makers andlogistics service providers. In cases such as this the need for co-ordination of information and materials flows between entities in thesupply chain becomes a key priority, further highlighting the centralrole of logistics as a process-oriented management task.
In this brief review of the challenges facing the organization in achanged environment we have emphasized the need to break down the‘walls’ that traditionally have fragmented the organization andimpeded the cost-effective achievement of customer service require-ments. Clearly there is a need for ‘pattern breaking’ on a major scale.The only way such significant change will be achieved is through lead-ership from the very top of the organization. It is no coincidence thatthe handful of companies who have achieved excellence in logisticshave been through a process of change that was driven from the top.Companies like Xerox, Hewlett Packard, Nokia and Philips have expe-rienced, and are still experiencing, often painful change as theytransform themselves from functionally based businesses to market-facing businesses. Whilst the impetus for change differs from companyto company, the engine of change has been the same – the search forsuperior performance through logistics management.
Benchmarking
The intense level of competitive activity encountered in most marketshas led to a new emphasis on measuring performance not just inabsolute terms, but rather in terms relative to the competition, andbeyond that to ‘best practice’.
In the past it was usually deemed to be sufficient simply to measureinternal performance. In other words, the focus was on things such asproductivity, utilization, cost per activity and so on. Whilst it is clearlyimportant that such things continue to be measured and controlled it alsohas to be recognized that such measures only have meaning when they are
9 OVERCOMING THE BARRIERS TO SUPPLY CHAIN INTEGRATION
275
LSCH_C09.QXD 12/11/04 12:05 pm Page 275

compared against a relevant ‘metric’ or benchmark. What should be themetric that is used in assessing logistics and supply chain performance?
There are in fact several dimensions to the measurement problem.The first key point to make is that the ultimate measuring rod is thecustomer, hence it is customers’ perceptions of performance that mustbe paramount. Secondly, it is not sufficient just to compare perfor-mance to that of immediate competitors. We must also compareourselves to the ‘best in the class’. Thirdly, it is not just outputs thatshould be measured and compared but also the processes that producethat output. These three ideas lie at the heart of what today is termedcompetitive benchmarking.
Competitive benchmarking might simply be defined as the continu-ous measurement of the company’s products, services, processes andpractices against the standards of best competitors and other compa-nies who are recognized as leaders. The measures that are chosen forthe comparison must directly or indirectly impact upon customers’evaluation of the company’s performance.
One of the earliest firms to adopt benchmarking was the XeroxCorporation who used it as a major tool in gaining competitive advan-tage. Xerox first started benchmarking in their manufacturing activitywith a focus on product quality and feature improvements. Followingsuccess in the manufacturing area, Xerox’s top management directedthat benchmarking be performed by all cost centres and business units,and by 1981 it was adopted company-wide.
Initially there was some difficulty in performing benchmarking indepartments such as repair, service, maintenance, invoicing and collec-tion and distribution, until it was recognized that their ‘product’ was,in fact, a process. It was this process that needed to be articulated andcompared with that used in other organizations. By looking at competi-tors’ processes step-by-step and operation-by-operation, Xerox wereable to identify best methods and practices in use by their competitors.
Initially benchmarking activities were concentrated solely on com-petitors until it became clear that Xerox’s objective in achievingsuperior performance in each business function was not being obtainedby looking only at competitors’ practices.
The objective of creating competitive advantage involves outper-forming rather than matching the efforts of competitors. This, togetherwith the obvious difficulties in gaining all the information required on
LOGISTICS AND SUPPLY CHAIN MANAGEMENT
276
LSCH_C09.QXD 12/11/04 12:05 pm Page 276

competitors and their internal systems and processes, led to a broaderperspective on benchmarking being adopted. Thus benchmarking wasexpanded from a focus solely on competitors to a wider, but selective,focus on the processes of top performing companies regardless of theirindustry sector.
Xerox have successfully used this broader perspective on benchmark-ing as a major element in increasing both quality and productivity.Collaborative co-operation between firms in non-competing industriesoffers significant opportunity in this regard. For example, in the Xeroxlogistics and distribution unit, annual productivity has doubled as a resultof benefits obtained from non-competitive collaborative benchmarking.
Camp2 has identified a number of benefits that a company derivesfrom benchmarking. These include the following:
● It enables the best practices from any industry to be creatively incor-porated into the processes of the benchmarked function.
● It can provide stimulation and motivation to the professionals whosecreativity is required to perform and implement benchmark findings.
● Benchmarking breaks down ingrained reluctance of operations tochange. It has been found that people are more receptive to newideas and their creative adoption when those ideas did not necessar-ily originate in their own industry.
● Benchmarking may also identify a technological breakthrough thatwould not have been recognized, and thus not applied, in one’s ownindustry for some time to come.
What to benchmark?
One useful framework for benchmarking is that devised by a cross-industry association – The Supply Chain Council.3 Their model, knownas SCOR (Supply Chain Operations Reference), is built around fivemajor processes – Plan–Source–Make–Deliver–Return – and covers thekey supply chain activities from identifying customer demand throughto delivering the product and collecting the cash. The aim of SCOR isto provide a standard way to measure supply chain performance and touse common metrics to benchmark against other organizations.
9 OVERCOMING THE BARRIERS TO SUPPLY CHAIN INTEGRATION
277
LSCH_C09.QXD 12/11/04 12:05 pm Page 277

Identifying logistics performance indicators
One benefit of a rigorous approach to logistics and supply chain bench-marking is that it soon becomes apparent that there are a number ofcritical measures of performance that need to be continuously moni-tored. The idea of ‘Key Performance Indicators’ (KPIs) is simple. Itsuggests that, whilst there are many measures of performance that canbe deployed in an organization, there are a relatively small number ofcritical dimensions that contribute more than proportionately to suc-cess or failure in the marketplace.
Much interest has been shown in recent years in the concept of the‘Balanced Scorecard’.4 The idea behind the balanced scorecard is thatthere are a number of key performance indicators – most of them prob-ably non-financial measures – that will provide management with abetter means of meeting strategic goals than the more traditional finan-cially oriented measures. These KPIs derive from the strategic goalsthemselves. Thus the intention is that the balanced scorecard will pro-vide ongoing guidance on those critical areas where action may beneeded to ensure the achievement of those goals.
These ideas transfer readily into the management of logistics and supplychain strategy. If suitable performance measures can be identified that linkwith the achievement of these strategic goals they can become the basis fora more appropriate scorecard than might traditionally be the case.
A logical four-step process is suggested for constructing such ascorecard:
Step 1: Articulate logistics and supply chain strategy
How do we see our logistics and supply chain strategy contributing tothe overall achievement of corporate and marketing goals?
Step 2: What are the measurable outcomes of success?
Typically, these might be summarized as ‘Better, Faster, Cheaper,Closer’. In other words, superior service quality, achieved in shortertime-frames at less cost to the supply chain as a whole, built on strongrelationships with supply chain partners.
Step 3: What are the processes that impact these outcomes?
In the case of ‘Better, Faster, Cheaper, Closer’, the processes that lead to‘perfect order achievement’, shorter pipeline times, reduced cost-to-serve and stronger relationships need to be identified.
LOGISTICS AND SUPPLY CHAIN MANAGEMENT
278
LSCH_C09.QXD 12/11/04 12:05 pm Page 278

Step 4: What are the drivers of performance within these processes?
These activities are the basis for the derivation of the key performanceindicators. Cause and effect analysis can aid in their identification.
In this framework the four key outcomes of success are suggested to be:Better, Faster, Cheaper, Closer. This quartet of interconnected goals arealmost universal in their desirability. They are significant because theycombine customer-based measures of performance in terms of totalquality with internal measures of resource and asset utilization.
The idea behind the logistics scorecard is to produce a number ofmeasures against each of the four broad aims. There should be no morethan 20 measures in total since the aim is to focus on the major driversof excellence in each area. Like any dashboard or cockpit, there is aneed for simplicity and to focus on the ‘mission critical’ measures.Figure 9.7 summarizes this idea.
As the old cliché reminds us: ‘What gets measured, gets managed.’Hence it is important to ensure that the logistics scorecard is designedto encourage the actions and behaviour that will lead to the fulfilmentof the ‘logistics vision’ that we earlier described. Indeed it can beargued that if organizational change is necessary, the place to beginthat change process is with a review of the performance measures cur-rently in use. Many companies seek to be responsive and market-facingand yet they still use performance metrics that relate to internal effi-ciencies. As a result they are unlikely ever to change.
9 OVERCOMING THE BARRIERS TO SUPPLY CHAIN INTEGRATION
279
Service qualityBetter e.g. Perfect order achievement
TimeFaster e.g. End-to-end pipeline time
CostCheaper e.g. Cost-to-serve
RelationshipsCloser e.g. Customer retention
Fig. 9.7 Creating the logistics scorecard
LSCH_C09.QXD 12/11/04 12:05 pm Page 279

Summary
Responsive supply chains are by definition highly integrated. They areinternally integrated across functions and they are externally integratedwith upstream suppliers and downstream customers. Many companiesare impeded in their attempts to become more agile and responsivebecause of an entrenched functional structure. They manage functionsrather than processes and hence have a fragmented approach to themarketplace. It is also difficult for such firms to contemplate externalintegration when they lack internal integration.
Making the transition from a ‘vertical’ to a ‘horizontal’ structurerequires a commitment to organizational change. To assist in thischange process it will be helpful if best practice can be defined througha benchmarking programme. Equally important is the identification ofappropriate Key Performance Indicators (KPIs) to ensure that everyonewithin the organization is focused upon the things that will enable amore responsive supply chain.
References
1. Schonberger, R.J., Building a Chain of Customers, The Free Press, 1990.2. Camp, Robert, Benchmarking: The Search For Industry Best Practices That
Lead to Superior Performance, ASQC Quality Press, 1989.3. For further details of the SCOR model, visit www.supply-chain.org.4. Kaplan, R.S. and Norton, D.P., The Balanced Scorecard, Harvard Business
School Press, 1996.
LOGISTICS AND SUPPLY CHAIN MANAGEMENT
280
LSCH_C09.QXD 12/11/04 12:05 pm Page 280

Entering the era ofnetwork competition
The new organizational paradigm 283
Managing the supply chain as a network 286
The supply chain of the future 287
Seven major business transformations 288
The implications for tomorrow’s logistics managers 291
Supply chain orchestration 292
From 3PL to 4PL™ 295
The last word 297
281
Chapter
10
LSCH_C10.QXD 12/11/04 12:06 pm Page 281

This chapter:
Suggests that a new business model is required tocope with the radically changing nature of thebusiness environment.
●
Describes the emergence of the ‘network organization’and explores the implications for supply chainmanagement.
●
Highlights seven major business transformationsthat must be undertaken for competitive success intomorrow’s marketplace.
●
Underlines the importance of developing the widerprofile of skills that will be needed to manage thesupply chain of the future.
●
Discusses the need for supply chain orchestration andproposes ways in which complex networks might bebetter co-ordinated.
LOGISTICS AND SUPPLY CHAIN MANAGEMENT
282
LSCH_C10.QXD 12/11/04 12:06 pm Page 282

Throughout this book the emphasis has been upon the achievement ofcompetitive advantage through logistics excellence. Many of the ideas
presented are relatively untried and still, for some companies, the area oflogistics and supply chain management is unexplored territory.
However, an increasing number of organizations can be identified inwhich logistics is quite clearly recognized as a major strategic variable.Companies like Xerox, Dell, Nokia, Benetton and 3M have investedsignificantly in developing responsive logistics systems. Whilst theirsuccess in the marketplace is due to many things there can be no doubt-ing the role that logistics has played in achieving that success.
A study carried out in North America for the Council of LogisticsManagement sought to identify the characteristics of companies thatwere at the leading edge in logistics and the essential features of theseorganizations seemed to be that they:
● Exhibit an overriding commitment to customers● Encompass a significant span of cross-functional control● Commit to external alliances with service suppliers● Have a highly formalized logistical process● Place a premium on operational flexibility● Employ comprehensive performance measurement● Invest in state-of-the-art information technology
The new organizational paradigm
It will be apparent that to achieve success in all of these areas willrequire significant change within the company. It requires a transfor-mation that goes beyond re-drawing the organization chart and entailsa cultural change that must be driven from the top. In fact the basicprinciples that have traditionally guided the company must be chal-lenged and what is required is a shift in the basic paradigms that haveunderpinned industrial organizations for so long.
10 ENTERING THE ERA OF NETWORK COMPETIT ION
283
LSCH_C10.QXD 12/11/04 12:06 pm Page 283
The need for new business models
Most of us work in organizations that are hierarchical, vertical andfunctionally defined. The organization chart for the typical company
resembles a pyramid and provides aclear view of where everyone fits inrelation to each other and will alsonormally reflect reporting relation-ships. In essence, the conventional
organization structure is little changed since the armies of the RomanEmpire developed the precursor of the pyramid organization.
Whilst there can be no doubting that this organizational model hasserved us well in the past, there are now serious questions about itsappropriateness for the changed conditions that confront us today. Ofthe many changes that have taken place in the marketing environment,perhaps the biggest is the focus upon ‘speed’. Because of shorteningproduct life cycles, time-to-market becomes ever more critical.Similarly, the dramatic growth of just-in-time (JIT) practices in manu-facturing means that those companies wishing to supply into thatenvironment have to develop systems capable of responding rapidlyand flexibly to customers’ delivery requirements, Indeed, the same istrue in almost every market today as organizations seek to reduce theirinventories, and hence a critical requirement of a supplier is that theyare capable of rapid response.
The challenge to every business is to become a responsive organizationin every sense of the word. The organization must respond to changes inthe market with products and services that provide innovative solutionsto customers’ problems; it must respond to volatile demand and it mustbe able to provide high levels of flexibility in delivery.
Perhaps one of the most significant breakthroughs in managementthinking in recent years has been the realization that individual busi-nesses no longer compete as stand-alone entities, but rather as supplychains. We are now entering the era of ‘network competition’, wherethe prizes will go to those organizations who can better structure, co-ordinate and manage the relationships with their partners in a networkcommitted to delivering superior value in the final marketplace.
The emergence of the ‘network organization’ is a recent phenome-non that has given rise to much comment and analysis. These ‘virtual’organizations are characterized by a confederation of specialist skills
LOGISTICS AND SUPPLY CHAIN MANAGEMENT
284
Most of us work in organizationsthat are hierarchical, vertical and
functionally defined.
LSCH_C10.QXD 12/11/04 12:06 pm Page 284

and capabilities provided by the network members. It is argued thatsuch collaborative arrangements provide a more effective means of sat-isfying customer needs at a profit than does the single firm undertakingmultiple value-creating activities. The implications of the networkorganization for management are considerable and, in particular, thechallenges to logistics management are profound.
To make networks more effective in satisfying end-user requirementsdemands a high level of co-operation between organizations in the net-work, along with the recognition of the need to make inter-firmrelationships mutually beneficial. Underpinning the successful networkorganization is the value-added exchange of information between part-ners, meaning that information on downstream demand or usage ismade visible to all the upstream members of the supply chain. Creating‘visibility’ along the pipeline ensures that the manufacture and deliveryof product can be driven by real demand rather than by a forecast andhence enables all parties in the chain to operate more effectively.
Supply chain management is concerned with achieving a more cost-effective satisfaction of end customer requirements through buyer/supplierprocess integration. This integration is typically achieved through a greatertransparency of customer requirements via the sharing of information,assisted by the establishment of ‘seamless’ processes that link the identifi-cation of physical replenishment needs with a ‘just-in-time’ response.
In the past it was more often the case that organizations were struc-tured and managed on the basis of optimizing their own operations withlittle regard for the way in which they interfaced with suppliers or,indeed, customers. The business model was essentially ‘transactional’,meaning that products and services were bought and sold on an arm’s-length basis and that there was little enthusiasm for the concept oflonger-term, mutually dependent relationships. The end result was oftena high-cost, low quality solution for the final customer in the chain.
This emerging competitive paradigm is in stark contrast to the con-ventional model. It suggests that in today’s challenging global markets,the route to sustainable advantage lies in managing the complex web ofrelationships that link highly focused providers of specific elements ofthe final offer in a cost-effective, value-adding chain.
The key to success in this new competitive framework, it can beargued, is the way in which this network of alliances and suppliers arewelded together in partnership to achieve mutually beneficial goals.
10 ENTERING THE ERA OF NETWORK COMPETIT ION
285
LSCH_C10.QXD 12/11/04 12:06 pm Page 285

Managing the supply chain as a network
The new competitive paradigm that we have described places the firmat the centre of an interdependent network – a confederation of mutu-ally complementary competencies and capabilities – which competes asan integrated supply chain against other supply chains.
To manage in such a radically revised competitive structure clearlyrequires different skills and priorities to those employed in the traditionalmodel. To achieve market leadership in the world of network competi-tion necessitates a focus on network management as well as uponinternal processes. Of the many issues and challenges facing organiza-tions as they make the transition to this new competitive environment,the following are perhaps most significant.
1 Collective strategy development
Traditionally, members of a supply chain have never considered them-selves to be part of a marketing network and so have not shared witheach other their strategic thinking. For network competition to be trulyeffective a significantly higher level of joint strategy development isrequired. This means that network members must collectively agreestrategic goals for the network and the means of attaining them.
2 Win-win thinking
Perhaps one of the biggest challenges to the successful establishment ofmarketing networks is the need to break free from the often adversarialnature of buyer/supplier relationships that existed in the past. There isnow a growing realization that co-operation between network partnersusually leads to improved performance generally. The issue thenbecomes one of determining how the results of that improved perfor-mance can be shared amongst the various players. ‘Win-win’ need notmean 50/50, but at a minimum all partners should benefit and be betteroff as a result of co-operation.
LOGISTICS AND SUPPLY CHAIN MANAGEMENT
286
LSCH_C10.QXD 12/11/04 12:06 pm Page 286

3 Open communication
One of the most powerful drivers of change in marketing networks hasbeen the advent of information technology, making the exchange ofinformation between supply chain partners so easy and so advanta-geous. Electronic Data Interchange (EDI) was an early precursor of theinformation highway that now exists in some industries enabling end-to-end pipeline visibility to become a reality. With all parties ‘singingfrom the same hymn sheet’ a much more rapid response to marketplacechanges is achieved with less inventory and lower risks of obsolescence.For network marketing to work to its fullest potential, visibility andtransparency of relevant information throughout the supply chain isessential. Open-book accounting is another manifestation of this movetowards transparency by which cost data is shared upstream anddownstream and hence each partner’s profit is visible to the others.
The supply chain of the future
Clearly, markets and supply chains are always in a constant state ofdynamic change and adaptation. However, the evidence is that the rateof change has accelerated to the point where the business models thathave served us well in the past may no longer work today and will,almost certainly, not work at all tomorrow.
Figure 10.1 highlights the challenge. We have moved from a businessenvironment where the supplier held the power – often through theirownership of resources, technology and brands – to a situation wherethe customer, or even the consumer, is now in the driving seat. Whereonce it was a ‘seller’s market’, today it is a ‘buyer’s market’.Simultaneously, the prevailing marketing philosophy has moved fromthe idea of mass markets serviced by mass production to the idea of‘markets-of-one’ serviced by mass customization.
Even though this fundamental shift has been observable for sometime, it has not been reflected in a similar shift in thinking about supplychain design.
The traditional supply chain business model was based around max-imizing efficiencies, particularly through the exploitation of the‘economies of scale’. So our factories were designed to produce things
10 ENTERING THE ERA OF NETWORK COMPETIT ION
287
LSCH_C10.QXD 12/11/04 12:06 pm Page 287

in large volumes and to maximize the use of capacity. This businessmodel worked well in the conditions for which it was designed, e.g. theproduction of standard products designed for mass markets.
The problem now is that the context has changed. We have seen a movefrom the lower left quadrant in Figure 10.1 to the upper right quadrant,and yet many companies have not recognized the implications of this shiftfor supply chain design. What is now required are supply chains that arefar more agile and better able to cope with rapid change and higher levelsof variety and even customization. Our systems today need to be able tocope with small numbers and to react in ever shorter lead times.
Accompanying this change in the marketing environment are anumber of other critical business transformations, all with significantimplications for supply chain management.
Seven major business transformations
1 From supplier-centric to customer-centric
Traditionally supply chains have been designed from the ‘factory out-wards’ rather than from the ‘customer backwards’. The emphasis in thepast was on how to ensure that a batch-oriented production processcould most efficiently distribute its output. Thus the goal in supply chain
LOGISTICS AND SUPPLY CHAIN MANAGEMENT
288
Tomorrow’s model• Virtual networks• Information based• Customer value oriented
Mass customization/one-to-one marketing
Mass production/mass marketing
Market-driven
Supplier-driven
Yesterday’s model• Independent entities• Inventory based• Low-cost production
Fig. 10.1 The supply chain of the future
LSCH_C10.QXD 12/11/04 12:06 pm Page 288

design was often cost minimization. In today’s highly competitive market-place the goal must change to the attainment of higher levels of customerresponsiveness. Thus agility rather than cost becomes the key driver.
2 From push to pull
Closely linked to the first transformation is the idea of moving from a‘production push’ mentality which seeks to optimize operations throughlevel scheduling and long planning horizons to a ‘demand pull’ philoso-phy in which, ideally, nothing is made, sourced or moved until there is ademand for it. This in essence is the Japanese ‘Kanban’ principle, withthe modification that the quantities triggered by the Kanban should bevariable depending on demand. Clearly the success of such a systemrequires the highest level of flexibility of all the supply chain’s resources,including people.
3 From inventory to information
Logistics and supply chain management have conventionally beenforecast-driven rather than demand-driven. In other words, the focushas been to look ahead over a planning horizon and to predict demandat a point in time and then to build inventory against that forecast. Asmarkets become more volatile and turbulent so too have they becomeharder to predict. The risk of over- or under-stocking increases. Thechallenge today is to enable supply chains to become demand-driven asa result of better visibility of real demand. Real demand occurs at theend of the supply chain and if that information can be captured andshared upstream then the dependency on inventory reduces.
4 From transactions to relationships
There is a growing recognition that the route to sustained profitability isthrough building long-term relationships with selected customers. Thefocus in the past was on volume and market share and the company wastransactional in its orientation. Today, customer retention is a key measureof success in the world of relationship marketing. One of the drivers ofimproved customer retention is the delivery of superior customer service.Hence there is a very clear connection between logistics and customerretention. Managing customer relationships has become a critical businessprocess as organizations seek to improve the quality of their earnings.
10 ENTERING THE ERA OF NETWORK COMPETIT ION
289
LSCH_C10.QXD 12/11/04 12:06 pm Page 289
5 From ‘trucks and sheds’ to ‘end-to-end’ pipeline management
Over the last two decades there has been a dramatic broadening of thescope of logistics and supply chain management in many organizations.Previously logistics – or, more properly, distribution management – wasseen as being primarily a concern with transportation and warehous-ing. As such, the focus of managerial effort tended to be on costminimization and the ‘optimization’ of networks and resources. Whilstthe need for efficient distribution is still as strong now as in the past,there is a widely held view that the real task of supply chain manage-ment is to co-ordinate the wider end-to-end pipeline. In-bound logisticsis just as critical as the distribution of final product under this para-digm and the emphasis is now on time compression from one end ofthe supply chain to the other.
6 From functions to processes
Only recently have companies come to challenge the primacy of functionsin the organizational structure. Traditionally the business has been orga-nized around functions and those functions have provided a convenientmechanism for the allocation of resources and for the promotion of per-sonnel. The classic business organization could be described as ‘vertical’with a multi-layered hierarchical decision-making structure. However, intoday’s turbulent business environment questions are increasingly beingasked about the ability of such organizations to respond rapidly to thefast-changing needs of the market. It is now suggested that the emphasisin organizations should be upon the key business processes that createvalue for customers. These processes, by definition, are cross-functionaland market-facing. They are, more than likely, team-based and they drawtheir members from the functions whose roles are now transformed to‘centres of excellence’.
7 From stand-alone competition to network rivalry
The conventional business model has always been that companies suc-ceed or fail on the basis of their own resources and competencies.However, as the trend to outsourcing has increased, there has come arealization that the competitive vehicle is no longer the individual firmbut rather the supply chain of which that firm is a member. Whereas
LOGISTICS AND SUPPLY CHAIN MANAGEMENT
290
LSCH_C10.QXD 12/11/04 12:06 pm Page 290

once a single firm might encompass almost the whole supply chain,today that is no longer the case. Instead, today the company finds itselfa member of an ‘extended enterprise’. This extended enterprise is inreality a complex network of specialist providers of resources and com-petencies. The companies that will be the most successful in this era ofnetwork competition will be those that are best able to utilize theresources and competencies of other partners across the network.
The implications for tomorrow’s logistics managers
Transformations of the type outlined above have significant implica-tions for the type of skills profile that will characterize successfullogistics and supply chain managers.
Table 10.1 suggests some of the elements of the necessary skills pro-file that flow from the seven business transformations.
10 ENTERING THE ERA OF NETWORK COMPETIT ION
291
Table 10.1 The key business transformations and the implications formanagement skills
Business transformation Leading to Skills required
From supplier-centric to The design of customer- Market understanding; customer-centric driven supply chains customer insight
From push to pull Higher levels of agility Management of and flexibility complexity and change
From inventory to Capturing and sharing Information systems and information information on real demand information technology
expertise
From transactions to Focus on service and Ability to define, measure relationships responsiveness as the and manage service
basis for customer requirements by market retention segment
From ‘trucks and sheds’ A wider definition of Understanding of the to ‘end-to-end’ pipeline supply chain cost ‘cost-to-serve’ and management time-based performance
indicators
From functions to The creation of cross- Specific functional processes functional teams focused excellence with cross-
on value creation functional understanding; team working capabilities
From stand-alone More collaborative Relationship management competition to network working with supply chain and ‘win-win’ orientationrivalry partners
LSCH_C10.QXD 12/11/04 12:06 pm Page 291

This is only indicative, but what it does suggest is that there is a realneed for formal education and training in areas as diverse as informa-tion systems and change management. The skills that are indicatedcannot be acquired solely through osmosis and experience; the founda-tion for mastery of these skills must be gained through appropriatemanagement education programmes.
This is the challenge for today’s logistics educators: how to establishprogrammes that have the breadth as well as the depth to create ‘T-shaped’ managers.
‘T-shaped’ managers are so called because of their skills profile. Eventhough they have a specific specialism (the down-bar of the T) with in-depth knowledge and capability, they also have a significant understandingof the other key business processes (see Figure 10.2). This breadth ofunderstanding is critical for the supply chain manager of the future, giventhe need to think and manage ‘horizontally’, i.e. across functions andbetween businesses.
Supply chain orchestration
With the emergence of the virtual organization and the extended enter-prise comes a heightened requirement for some way of managing thecomplexity that is inevitably created. Consider for a moment the differ-ence between the supply chain at Ford during the time of Henry Fordwith Ford’s supply chain today. Henry Ford had an integrated supplychain because in effect he owned most of it. As well as manufacturingthe vast majority of all the components that went into the vehicle, thecompany also owned steel mills, rubber plantations and mahogany
LOGISTICS AND SUPPLY CHAIN MANAGEMENT
292
Creating the ‘T-shaped’ skills profile
Effective process management requires significant cross-functional skills
Managers have in-depth expertisein one discipline combined with
enough breadth to see theconnections with others
Fig. 10.2 Creating a T-shaped skills profile
LSCH_C10.QXD 12/11/04 12:06 pm Page 292

forests! Today’s Ford could not be more different. Most of the compo-nent manufacturing business was floated off as a separate company,Visteon, and the steel mills have long since gone. Instead Ford is at thecentre of a network of specialist service providers, first tier suppliersand collaborative alliances. The task of managing, co-ordinating andfocusing this value-creating network might usefully be termed supplychain orchestration.
The idea of orchestration is that there has to be a common agreedagenda driving the achievement of the supply chain goals. This itselfimplies that there must be a supply chain strategy that is subscribed toby the entities in the chain. By the very nature of things, the orchestratorwill probably be the most powerful member of the network, i.e. aWal-Mart or a Dell, but not necessarily. Innovative organizations canutilize their superior supply chain capabilities to act as orchestrators, asthe Li & Fung case study below demonstrates.
10 ENTERING THE ERA OF NETWORK COMPETIT ION
293
Li and Fung: supply chain orchestrator
Li and Fung (L&F) is a long established Hong Kong-based trading com-pany, orchestrating one of the largest and most successful of alloutsourced manufacturing networks. It supplies apparel, accessories,sporting equipment, household goods and toys to retail chains locatedmostly in North America and Europe. Valued at around $5.5bn1 with areturn on equity of more than 30 per cent per annum for much of the lastdecade, it is the envy of almost every other company in its sector.2
L&F does not manufacture anything in-house, but as network co-ordinator it oversees the manufacturing and delivery processes end-to-end. Its modus operandi is, however, in sharp contrast to automotiveindustry-style supplier management programmes. L&F does not micromanage or monitor each and every process of a handful of first tiersuppliers. Nor does it control its network through intricately wordedcontracts or sophisticated IT capabilities. The secret of L&F’s success isthat it has learned how to manage outsourced operations throughhands-off relationships with over 7500 trusted and very specialized man-ufacturing organizations, working with up to 2500 at any time. L&F’ssuppliers are located in around 40 countries, stretching across South EastAsia, into China, the Indian subcontinent, the Mediterranean, Africa andacross to the Americas. Together the suppliers represent a highly flexible
▼
LSCH_C10.QXD 12/11/04 12:06 pm Page 293

LOGISTICS AND SUPPLY CHAIN MANAGEMENT
294
and highly skilled resource pool, able to meet the requirements of almostany customer. L&F ensures their loyalty by pre-booking between 30 and70 per cent of the selected suppliers’ capacity each season and rewardinghigh performers with more business.
When an order is received, L&F is able to draw on this vast array oftalent, selecting yarn from one country, to be woven and dyed inanother, cut in a third and assembled in a forth, before being shippedto retailers elsewhere. For each stage of manufacture and distributionit carefully picks the organization best able to undertake that particu-lar value-adding activity, but then leaves the company to determineexactly how that should be achieved. For each value-adding step, L&Fwill provide specifications for the work – relating to what must beachieved – but not how – and the deadline by which the supplier musthave shipped the work to its next destination. In doing so L&F getsthe benefits of control without stifling innovation. It gets the productor service it requires, but leaves it to the supplier to determine the mostefficient way of achieving it. If a quality problem or some logistical dif-ficulty arises, then the network is flexible enough for production to betransferred very quickly to an alternative source or location.
L&F is constantly searching for new companies to add to the network,as well as new product opportunities. Over 90 years of experience hasprovided the company with a deep knowledge of its business and the abil-ity to identify those organizations that have the right capabilities toenhance and sustain the growth and diversity of the network. Co-ordina-tion costs are high, but L&F have demonstrated that these are more thanoffset by the advantages of flexibility offered by its loosely coupled net-work. The company does use technological advances where they offeropportunities to enhance efficiency or its trading relationships, such asthe provision of dedicated extranet sites for its largest customers in theUnited States, home to around 75 per cent of its customer base.Elsewhere it uses Internet-based and e-mail-based communications withsuppliers if local conditions permit. However, in many less developedcountries much of its trade continues to be conducted by telephone, faxand even old-fashioned personal visits.
References1. Felgner, B., ‘Li & Fung “look to the source”’, Home Textiles Today, 19 April,
Vol. 25, No. 32, 2004, p. 19.2. Bown, J., Durchslag, S. and Hagel, J., ‘Loosening up: How Process Networks Unlock
the Power of Specialization’, The McKinsey Quarterly, 2002.
▼
LSCH_C10.QXD 12/11/04 12:06 pm Page 294

Another model for the co-ordination of complex networks that has beenproposed is the idea of a 4PL™ or a Lead Logistics Service Provider.
From 3PL to 4PL™
Third-party logistics service providers are companies who provide arange of logistics activities for their clients. They might operate distrib-ution centres, manage the delivery of the product through theirtransport fleets or undertake value-adding services such as re-packing.
The idea of the fourth-party logistics service provider was originatedby the consulting company Accenture (previously Andersen Consulting).The underpinning principle was that because modern supply networksare increasingly global and certainly more complex, the capabilities tomanage the network probably do not exist in any one organization. Insuch situations, there is a need for an organization – possibly comingtogether with the focal firm through a joint venture – who can use itsknowledge of supply chains and specialist third-party service providersto manage and integrate the complete end-to-end supply chain.
The 4PL™ would assemble a coalition of the ‘best of breed’ serviceproviders and – using its own information systems capability – ensure acost-effective and sustainable supply chain solution. Figure 10.3 sum-marizes the principle behind the 4PL™ concept.
In this particular business model a joint venture (JV) has beenformed between the client and the partner. As well as putting in equitythe client will also transfer its existing logistics assets (e.g. distributioncentres) to the JV. Probably too, the staff who manage and run theexisting logistics system will move to this new company. The partner’scontribution might include, as well as start-up equity, its informationsystems capability, its strategy development skills and its process re-engineering skills.
The JV will then identify those specialist providers of logistics ser-vices who between them will execute the different activities in thesupply chain. Using its information systems the JV now becomes thesupply chain orchestrator and delivers to the client, against agreed ser-vice and cost goals, a complete network management capability.
10 ENTERING THE ERA OF NETWORK COMPETIT ION
295
LSCH_C10.QXD 12/11/04 12:06 pm Page 295

Whether the 4PL™ be a joint venture or some other model there arefour key components that must be in place. These are:
● Systems architecture and integration skills● A supply chain ‘control room’● Ability to capture and utilize information and knowledge across
the network● Access to ‘best of breed’ asset providers
Figure 10.4 summarizes these key requirements.One such joint venture that has delivered significant cost and service
advantages is that created by General Motors and Menlo Logistics. Thetwo companies jointly invested $6 billion of start-up equity, GeneralMotors having the majority share, to create Vector SCM.
Vector became responsible for managing all of GM’s in-bound andout-bound logistics and for co-ordinating all the individual transporta-tion, warehousing and other logistics service companies. Underpinningthe whole operation is a state-of-the-art logistics information system,‘Vector Vision’, which enables much higher levels of synchronizationacross the whole of General Motors’ supply and demand network.
LOGISTICS AND SUPPLY CHAIN MANAGEMENT
296
4PL™organization Partner(s)Primary clients
3PL service providers’contribution• Transportation services• Warehouse facilities
Partnners’ contribution• Set-up equity• Logistics strategy• Re-engineering skill• Best practice benchmarks• IT development• Customer service
management• Supplier management• Logistics consultancy
Primary clients’contribution• Start-up equity• Assets• Working capital• Operational expertise• Operational staff• Procures logistics services
from 4PL™ organization
Key characteristics• Hybrid organization – formed from a number of different entities• Typically established as a JV or long-term contract• Alignment of goals of partners and clients through profit sharing• Responsible for management and operation of entire supply chain• Continual flow of information between partners and 4PL™ organization• Potential for revenue generation
Fig. 10.3 The 4PL™ conceptSource: Accenture.
LSCH_C10.QXD 12/11/04 12:06 pm Page 296

The last word
We are seemingly entering an era where the rules of competition will besignificantly different from those that prevailed in the past. A new par-adigm of competition is emerging in which the supply chain networkincreasingly will provide a source of sustainable advantage throughenhanced customer value.
If such an advantage is to be achieved, then it is critical for the orga-nization to review the way in which it currently delivers value to itscustomers and to consider whether the time has come to reconfigurethe chain to utilize the strengths of other players in the supply chain.One thing is for certain, companies that believe that they can continue
10 ENTERING THE ERA OF NETWORK COMPETIT ION
297
Change leader• Supply chain visionary• Multiple customer relationship• Deal shaper and maker• Supply chain re-engineers• Project management• Service, systems and information integrator• Continuous innovation
Architect/integrator
Decision-makers• Experienced logisticians• Optimization engines and decision support• Neutral positioning• Manage multiple 3PLs• Continuous improvement
Control room(intelligence)
InformationNervous system• IT system integration• IT infrastructure provision• Real-time data capture• Convert data to information• Provide info to point of need• Technical support
Supply chaininfomediary
Assets• Transportation asset provider• Warehouse, cross-dock, property facility• Manufacturing – outsourcing• Procurement service• Co-packing service
Resourceproviders
4PL™
Fig. 10.4 Four key components a 4PL™ must assembleSource: Accenture.
LSCH_C10.QXD 12/11/04 12:06 pm Page 297

to conduct ‘business as usual’ will find that their prospects for successin tomorrow’s marketplace will decline rapidly.
It is not the strongest of the species that survive nor the most intelligent,but the one most responsive to change.
Charles Darwin
LOGISTICS AND SUPPLY CHAIN MANAGEMENT
298
LSCH_C10.QXD 12/11/04 12:06 pm Page 298

acceleration effect 196–7Accenture (fmly Andersen Consulting)
187, 295activities
non-value adding 155, 159value adding 156 illus.
activity-based costing 112 illus., 265agility
customer responsiveness 137definition 117–18foundations 130–7supply chain 121 illus., 254velocity and visibility drive
responsiveness 171 illus.Ahlstrom 273Aisin Seiki 249American War of Independence 3
BAe Systems 134, 253Baker, S 56balanced scorecard 278–9barcoding 190benchmarking 275–7
internal 164model 277–9
Benetton 37, 58, 194, 283Borsodi, Ralph 35bottlenecks 165–6, 248Buffet, Warren 92Bullwhip 195business models
efficient 235need for new 284–6transformations 288–91 illus.
business process re-engineering (BPR) 133businesses see organizations; under name
CAD (computer aided design) 180CAM (computer aided manufacturing) 180Canon 137capabilities 29cash and receivables 86cash flow 83
changing the profile 93 illus.and shareholder value 92–3
cash-to-cash cycles 153–4Caterpillar 47–8
centralization of distribution 235–6Chambers, John 172Chrysler 242–3Cisco Systems 171–4claims procedures 76co-managed inventory (CMI) 4, 203Coca-Cola 207collaborative working 177
and networks 253, 284–6prisoner’s dilemma 200 illus.
collective strategy development 286commoditization 29, 46companies see organizations; under nameCompaq Computers 21, 24competencies 29competition
global 210–11network 290–1new rules 28–32
competitive advantage 6–13through capabilities and competencies
29through cost advantage 7–8, 10–11through customer service 45–6gaining 12–13and logistics 10 illus.new rules of 28–32and process innovation 31–2procurement policies 16through productivity 12, 13–14service-based 29–303 Cs 6 illus., 7time-based 145–50through value 7, 8–10, 12, 46–8
competitive environmentchanging 28–40customer-centred 37–40globalization 32–3price deflation 33–7resilience in 39–40
computer aided design (CAD) 180computer aided manufacturing (CAM) 180consumer electronics: price deflation 34 illus.core processes 29cost advantage 7–8, 10–11cost leadership 10–11Costco 93
299
Index
LSCH_Z01.QXD 12/11/04 3:25 pm Page 299

costingactivity-based 111, 112 illus., 113, 265logistics oriented 99–102mission 100–1, 112–13traditional 112 illus.
costsalternative concepts 265analysis of total 96–8attributable 100–1avoidable 104, 113customer 83, 105 tablecustomer profitability 103 illus.customer service 67 illus.of distribution network 98 illus.impact of logistics missions 101 illus.of inventory holdings 102logistics, analysis of 95operating 90–1opportunity 107product 83profitability analysis 103–9set-up 131 illus.strategies 52supply chain view 36–7transparency 265
critical paths see also supply chainidentifying 245–7managing 248–9
critical value analysis 74 illus.cross-docking 189cross-functional teams 252–3, 269current assets 86current liabilities 87customer service 48–56, 73, 79
augmenting core product 53 illus.and competitive advantage 45–6components 49 illus., 50, 61–2, 63composite index 78 illus.cost 67 illus.cost/benefit analysis 66–9definition 48–9and 80/20 rule (Pareto) 73 illus.functional (conventional) organizations
266–7global management 223–4goals 99–100and inventory investment 68 illus.and marketing effectiveness 52 illus., 54objectives 65–6priority setting 69–74relationship management 289reliability 38–9and retention 53–6segment identification 64standards 74–8
customer value: and supply chain strategy57 illus.
customerscosts of average 105 table80/20 rule (Pareto) 70, 72–3expectations 37–8, 46lifetime value 54local differences 216needs identification 61–4profit and loss account 104 illus., 107
illus.profitability accounting 101–2profitability analysis 103 illus., 104–5,
106 illus., 107-9profitability matrix 108 illus.reaction to stock-outs 51 illus.relationship marketing 45–6responsiveness to 38, 136–9retention 53–6
indicators 55 illus.
de-coupling/de-coupling point 120–1 illus.,137
debt/equity ratio 87–8deliveries: frequency and reliability 75–6Dell Computers 19–28, 37, 283, 293demand
conditions 119dependent 124–6improving visibility 166–7independent 126managing 203penetration points 166–8 illus.supply requirements by type 119 illus.variations 118–20, 127 illus.
demand pullchange to 289vs product push 123–4 illus., 125–8
dependent demand 124–6 illus.direct product profitability (DPP) 109–10
illus., 111distribution
centralization 235–6network costs 98 illus.
documentation quality 76dynamics of logistics systems 195–9DYNAMO 195–6
EADS 134Eaton Corp 242–3economic order quantity (EOQ) 123,
127–8 illus.economies of scale 194economies of scope 194
LOGISTICS AND SUPPLY CHAIN MANAGEMENT
300
LSCH_Z01.QXD 12/11/04 3:25 pm Page 300

efficient business model 23580/20 rule (Pareto) 70, 72–3electronic data interchange 120, 190electronic point of sale 190Ericsson 250–1, 254event management 218–21 illus.experience curve 8 illus.extended enterprises 122and virtual supply chain 178–80extranet 180–2, 294
Failure Mode and Effect Analysis (FMEA)246–7
fixed assets 87efficiency 91
fixed capital 83flexible manufacturing systems (FMS) 16,
193focused factories 212–13, 235–6Ford, Henry 194, 292–3Ford Mondeo 9forecast error: and planning 149 illus.Forrester Effect 195Forrester Research 1724PL™ (fourth party logistics) 295–6 illus.,
297frequency of deliveries 75–6functional (conventional) organizations
135–6, 263 illus.and customer interface 266–7and logistics concept 262–7
Gap 58Gartner Group 233globalization 32–3
challenges 207–8of economy 92and focused factories 212–13and local management 225 illus.logistics challenges 220–3marketing 209and sourcing 226–8and supply chain 235
Goldratt, E.M. 165
Heinz 212Hewlett Packard 24, 135, 274, 275Honda 249, 270horizontal organizations 135–6, 268–9
illus., 270
IBM 21, 24, 56independent demand 126Industrial Dynamics 195
information iceberg 169information technology (IT)
and collaboration 132, 179data exchange 190–1electronic data interchange 120, 190electronic point of sale 190and event management 219extranet 180–2, 294importance 285Internet 21, 23, 122, 172, 181, 182
illus., 294intranet 181and inventory control 22–3and logistics 183–4 illus., 185, 224–5and response to market 122return on investment 191and supply chain 132, 180–3, 254
Integrated Commerce Solutions (ICS) 173Intel 21Internet 122, 181, 294
data exchange 190direct sales 21, 23interactive relationships 172supply chain management 182 illus.,
218intranet 181inventory
availability 75buildup 264centralized 72–3, 214–5, 235–6co-managed (CMI) 4and customer service levels 68dependency reduction 289economic order quantity (EOQ) 123,
127–8 illus.effective levels 118finished goods 194–5hiding demand 265 illus.hiding problems 129 illus., 130Japanese philosophy 129–30just-in-time (JIT) 16, 35, 75, 123, 189,
235, 284, 285managing 131 illus.minimization 22–3, 134–5, 147–8, 284policies 70–1, 86reorder points (ROP) 123, 125 illus.,
126 illus.stock-outs 29–30strategic 168 illus.supply chain profile 36 illus.true costs 102vendor managed (VMI) 133–4, 203
Japanese philosophyinventory 129–30
INDEX
301
LSCH_Z01.QXD 12/11/04 3:25 pm Page 301

lean thinking 118set-up time reduction 193–4
Jeep Grand Cherokee 242–3joint ventures (JVs) 295–7just-in-time (JIT) 16, 35, 75, 123, 189,
235, 284, 285
Kanban concept 130, 289Kearney, A.T. 254key performance indicators (KPIs) 278Kmart 93, 94–5, 197
Lalonde, B.J. 48Land Rover 234lead-time
components 152 illus.replenishment 119shortening 22, 161–2variability 217 illus.
lead-time gap 160 illus., 162–70closing 161 illus.
lead-time managementbottlenecks 165–6, 248cash-to-cash cycle 153–4collaboration 133–4components 152 illus.order-to-delivery cycle 150–1reducing logistics lead-time 161–5strategic 154 illus.
lean practices 233dangers 249
Lever Europe 214Levitt, Theodor 53, 209Li and Fung 293–4The Limited 58, 193logistics see also pipeline management
centralized 214challenges 11 illus.and competitive advantage 10 illus.cost analysis 95definition 4and focused factories 212–13and globalization 210–11, 220–3information system 183 illus., 185
integrated 184 illus.leverage opportunities 12 illus.market-driven strategy 270–2marketing interface 45–6and organizational change 274–5pipeline management 154–9process improvement 155–9quick-response (QR) 132, 190–5and return on investment (ROI) 83–8scorecard 279 illus.
and service delivery 38and shareholder value 88–92systems, dynamics of 195–9tradeoffs in global 208 illus.virtuous circle 192 illus.vision 261–2
logistics chain: push vs pull 124 illus.logistics concept: and conventional
organizations 262–7logistics costing 99–102logistics costs: impact 202 illus.logistics management
and the balance sheet 86 illus., 87–8and business transformations 291–2and marketing effectiveness 52 illus.mission 15–16, 99 illus., 100, 101 illus.,
262process 15 illus.
logistics missionscosts 101 illus.cross-functional 99 illus.definition 99–100
logistics organization 274–5developing 267–74
logistics service companies 188–90low cost strategies 52
Mango 58manufacturing: agile and lean models 117,
118 illus.mapping the supply chain 132–3, 162–5market changes
and forecasting 148–50and resilience 39–40
marketing 45–6, 55–6, 209, 223–4Four Ps 45impact logistics and customer service 52
illus.marketspace 180Marks & Spencer 226–8Mars 212mass customization 194, 287Matalan 226materials requirements planning (MRP) 16McDonald’s 38Mexx 58Micro Compact Car (MCC) 185–7Milliken 192mission costing 100–1, 112–13mission statements 262Motorola 244–5
Nashua Corporation 273Neill, John 270
LOGISTICS AND SUPPLY CHAIN MANAGEMENT
302
LSCH_Z01.QXD 12/11/04 3:25 pm Page 302

network competition 284–6network management 122–3Nike 17, 210–11Nissan 188, 201Nokia 29, 250–1, 254non-value-added activities 155, 159
Ollila, Jorma 29open communication 287opportunity costs 107optimized production technology (OPT)
165orchestrators 293–4order cycle 150 illus.
extending 167grocery industry 198 illus.with variability 151 illus.
order cycle time (OCT) 75order-to-collection cycle 97 illus.order-to-delivery cycle 150–2orders
achieving perfect 136completeness 76convenience 75cycle time 75fill probabilities 76–7 illus.fulfillment groups 272–4management systems 271–4managing 267 illus.processing cycle 97size constraints 75status information 76
organizations see also under namefunctional (conventional) 135–6, 262–3
illus., 264–7global 207, 212horizontal 135–6, 268–9 illus., 270logistics oriented 267–75new paradigm 283vertical 268 illus., 269–70virtual 284–5
Ortega, Amanico 57out-of-stock 50, 51
impact on sales 29–30out-sourcing 179–80, 224, 233, 236
Pareto (80/20 rule) 70, 72–3performance indicators 136–7, 278Personal Production 139Pfizer 253Philips 27, 275Phillips Electronics 250–1pipeline management 154–9 see also
logistics
change to 290future 225–6visibility, importance of 285
pipelinesmapping 162–5visibility 39, 217–21
Porter, Michael 13–14postponement strategy 120, 134–5, 137, 216–7price deflation 33–7price wars 23–4Pringles 237process alignment 122, 177process excellence: return on investment 31
illus.process innovation 31–2process integration 122process management 135–6, 243–5, 266,
269end-to-end 266re-engineering 133skills 270–1
processescore 29new importance 290variability 243–5
Proctor & Gamble 237product costs 83product flow: grocery industry 198 illus.product life cycle 146 illus.product push: vs demand pull 123–8, 124
illus.product service levels: managing 72 illus.productivity advantage 12, 13–14
logistics leverage opportunities 12 illus.products
direct profitability 109–11innovation 31life cycles 31–2stock-outs 50, 51
profitability analysis 103–9profits
product contribution 71–2and stock-outs 50, 51
programme budget 101 illus.promotional activity
and logistics 196–7and production requirements 197 illus.
quick-response (QR) logistics 132, 190–3production strategies 193–5vs inventory-based system 191 illus.
Radio Frequency Indentification (RFID)252
INDEX
303
LSCH_Z01.QXD 12/11/04 3:25 pm Page 303

Rayport, J.F. 180relationship management: and suppliers 40relationship marketing 55–6reliability 38–9reorder points (ROP) 123, 125 illus., 126 illus.
and dependent demand 126 illus.replenishment order system 189 illus.resilience 39–40resource utilization 83responsiveness 38
achieving 138 illus.retention of customers 53–6return on investment (ROI)
impact of margin and asset turn 84 illus.and logistics 83–5 illus., 86–8
revenue growth 90risk analysis: scoring system 247 illus.risk profile: mapping 239–41ROP (reorder points) 123, 125 illus., 126
illus.Rover Group 139, 188, 270
sales: probabilities 67 illus.Schonberger, R J 273SCOR (Supply Chain Operations
Reference) 277Sears 93Second World War 3Seminole Manufacturing Company 192service/cost tradeoff: ending 148 illus.set-up time: reduction 193–4shareholder value 88–92, 234 illus.
and cash flow 92–3drivers 90 illus.
sharing information see information technology (IT)
Shaw, A. 4–5Singer Sewing Machine Company (SSMC)
208–9Six Sigma methodology 243–5SKF 215skills profile: T-shaped 292 illus.Smart Car 183–7Sony 137Srivastava, R. et al. 92stock-keeping unit (SKU) 70–5, 134stock-outs 29–30, 50
and customer behaviour 51 illus.stockless distribution centres 189suppliers
development programmes 253reduction in number 236–7relationship management 40
supply chain see also critical paths
achieving resilience 254–7agile 121 illus., 132–7, 254collaboration 199–202, 253, 285and competitive performance 17–19continuity team 252–3conventional 177–8critical paths 245–9customer-centred 288–9definition 6, 17–18demand driven 121–2event management 219 illus., 221 illus.external risks 234fulcrum 169–70future 287–8 illus.globalization 209–17, 235improving 243–5integrated, management of 263internal risks 234Internet applications 182, 218inventory profile 36 illus.linking strategy to customer value 57
illus.mapping 132–3, 162–3 illus., 164–5market-driven 56–7orchestration 292–4reducing complexity 134resilient 255 illus.risk, sources 238 illus.risk management 242–53, 256–7 tablerisk profile 237–9strategies 119–23synchronous 132, 177–8 illus., 187–90time compression 133understanding 242–3value chain 13–14 illus.virtual 122, 178–83visibility 249–51vulnerability 233–7
Supply Chain Council 277Supply Chain Event Management (SCEM)
218–21, 252supply chain management
4 Rs 38–40challenge to 11 illus.change in emphasis 290definition 4–5integrated 263
Supply Chain Relationships in Action(SCRIA) 253
supply networks 5 illus.collaboration 253, 284–6critical paths 245–7management 286–7visibility 249–51
LOGISTICS AND SUPPLY CHAIN MANAGEMENT
304
LSCH_Z01.QXD 12/11/04 3:25 pm Page 304

Sviokla, J.J. 180synchronized delivery 188 illus.synchronous supply chain 132, 187–90
Target Stores 93, 253tax minimization 92technical support 76Tend-to-Zero 271Tesco Information Exchange (TIE) 132,
181Thales 1343PL (third party logistics) 2953M 283throughput accounting 265time
compression 31, 133, 174cost-added vs value-added 158 illus.effective control 159 illus.horizontal 162idle 132–3non-value-adding 132, 155value-adding 155–7, 157 illus.variety-adding 158 illus.vertical 162
time-based competition 145–50time to market 137time to volume 137timing: and product life cycle 147 illus.TNT 188Toshiba 21Total Quality Management 16, 246Toyota 37, 140, 207, 249, 270Toyota Production System (TPS) 118trade barriers: disappearing 209
Unilever 214Unipart 270–1UPF-Thompson 234US Defense Department 252
value-added exchange of information 179value advantage 7, 8–10, 12
logistics leverage opportunities 12 illus.value chain 13–14 illus.vendor managed inventory (VMI) 133–4,
203vertical integration 17vertical organizations 268 illus., 269–70vertical time 162virtual organizations 41, 284–5virtual supply chain 122
and extended enterprises 178–80role of information 180–3
volatility of demand 118–20
Wal-Mart 38, 191, 192, 252, 293win-win thinking 286working capital 83
efficiency 91world trade growth 209 illus.World Trade Organization 209
Xerox 37, 275, 283benchmarking 276–7internal market concept 45
XML communications 218
Zara 57–60, 226Zinszer, P.H. 48
INDEX
305
LSCH_Z01.QXD 12/11/04 3:25 pm Page 305

LSCH_Z01.QXD 12/11/04 3:25 pm Page 306