Supply Chain Management: A Teaching Experiment
12
78 Chapter 5 SUPPLY CHAIN MANAGEMENT: A TEACHING EXPERIMENT Rachel Croson University of Pennsylvania Karen Donohue University of Minnesota Elena Katok Pennsylvania State University John Sterman Massachusetts Institute of Technology Abstract How firms choose and manage their inventory is a question of interest for academics and practitioners in many fields, including Operations Management, Marketing, and Information Technology. Much recent attention has focused on the possibilities of information-sharing systems to aid in this setting, including sharing inventory information among firms (SAP) and sharing point-of-sale data (EDI). This classroom exercise illustrates the existence and implications of bounded rationality on the part of inventory managers, and shows how systems like these can help in inventory decision-making. 1. INTRODUCTION This chapter describes an experiment that illustrates the challenges of supply chain management. Supply chain management involves the management of orders and shipments of goods through a supply chain; for example, shipping beer from the manufacturer to the distributor to the wholesaler and then to the retailer for sale to customers, and transmitting the orders for beer back up the supply line. Recent research and business practice highlights the importance of managing one’s supply chain. Better supply chain management can coordinate decision- making across firms. Anticipated benefits include decreased inventory costs, reduced flow times, and better matching of supply and demand. Companies as diverse as HK3C02(5) 10/15/04, 16:15 78
-
Upload
independent -
Category
Documents
-
view
0 -
download
0
Transcript of Supply Chain Management: A Teaching Experiment
78 Experimental Business Research Vol. XX
78
Chapter 5
SUPPLY CHAIN MANAGEMENT: A TEACHINGEXPERIMENT
Rachel CrosonUniversity of Pennsylvania
Karen DonohueUniversity of Minnesota
Elena KatokPennsylvania State University
John StermanMassachusetts Institute of Technology
Abstract
How firms choose and manage their inventory is a question of interest for academicsand practitioners in many fields, including Operations Management, Marketing,and Information Technology. Much recent attention has focused on the possibilitiesof information-sharing systems to aid in this setting, including sharing inventoryinformation among firms (SAP) and sharing point-of-sale data (EDI). This classroomexercise illustrates the existence and implications of bounded rationality on the partof inventory managers, and shows how systems like these can help in inventorydecision-making.
1. INTRODUCTION
This chapter describes an experiment that illustrates the challenges of supply chainmanagement. Supply chain management involves the management of orders andshipments of goods through a supply chain; for example, shipping beer from themanufacturer to the distributor to the wholesaler and then to the retailer for sale tocustomers, and transmitting the orders for beer back up the supply line.
Recent research and business practice highlights the importance of managingone’s supply chain. Better supply chain management can coordinate decision-making across firms. Anticipated benefits include decreased inventory costs, reducedflow times, and better matching of supply and demand. Companies as diverse as
HK3C02(5) 10/15/04, 16:1578
SUPPLY CHAIN MANAGEMENT 79
Boeing, Dayton Hudson, and Eastman Chemical are investing in initiatives to bettercoordinate production and order decisions between supply chain partners (Stein andSweat 1998). In academia, 50% of the presentations sponsored by the Manufacturingand Service Operations Management Society (MSOM) at INFORMS 1998 and 1999meetings were dedicated to supply chain related topics.
However, managing a supply chain isn’t easy. Demand from consumers is oftenboth highly variable and unpredictable, including not only random events andseasonality but also growth and fluctuations induced by competitive, industry, tech-nological, and macroeconomic processes. Demand is typically nonstationary andmay not have constant variability. There is often a lag between when an order isplaced and when the product arrives, either because of just-in-time production (theproduction process begins when the order arrives), or because it takes time to trans-port the product physically. Stockouts and shortages occur at various levels in thesupply chain, adding further delays. And often one manufacturer, distributor orwholesaler serves multiple retailers, while each retailer receives inventory fromnumerous other actors.
A large body of research investigates these issues theoretically (see Croson andDonohue, 2004 for a discussion). In addition to these operational challenges, thereare also cognitive limitations that managers face which prevent them from optimallymanaging their supply chains. This chapter describes an in-class experimental gamethat can be used to illustrate a number of these challenges, operational and cognitive,that managers face in supply chain management.
The experiment is well-suited for undergraduate, MBA or executive teaching,and has been used in all those forums. Exactly which treatments you choose, andhow deep the debriefing should be, will depend on the sophistication of your audienceas well as the manner in which you choose to implement the experiment (physical orcomputer). Section II below describes the game, section III details possible implement-ation options and debriefing strategies, and section IV provides some final thoughts.Finally, an appendix lists resources (electronic and physical) for implementation.
2. THE BEER GAME
The experiment is based on a management simulation called the Beer Game. Thegame was developed by Sloan’s System Dynamics Group in the early 1960s as partof Jay Forrester’s research on industrial dynamics (Forrester 1958, 1961; Jarmain1963). It has been played all over the world by thousands of people ranging fromhigh school students to chief executive officers and government officials.1
The game’s structure mimics the ordering and production decisions of a four-level serial supply chain (a retailer, wholesaler, distributor and manufacturer, whobuy from and sell to only each other). Participants play the game over several dozenhypothetical weeks. Each week, players decide how many cases of beer to orderfrom their immediate suppliers to maintain enough inventory to fill orders from theirimmediate customers while maximizing supply chain profit. This task is complicatedby delays in order processing, production, and shipping.
HK3C02(5) 10/15/04, 16:1579

80 Experimental Business Research Vol. XX
CurrentInventory
• • • •• • • •• • • •
CustomerOrders
UsedOrderCards
CurrentInventory
• • • •• • • •• • • •
• •• •
• •• •
CurrentInventory
• • • •• • • •• • • •
• •• •
• •• •
CurrentInventory
• • • •• • • •• • • •
RETAILER WHOLESALER DISTRIBUTOR FACTORY
• •• •
• •• •
4 4 4 4 4 4 4
OrdersPlaced
IncomingOrders
OrdersPlaced
IncomingOrders
OrdersPlaced
IncomingOrders
ProductionRequests
• •• •
ShippingDelay
ShippingDelay
ShippingDelay
ShippingDelay
ShippingDelay
ShippingDelay
ProductionDelay
• •• •
ProductionDelay
RawMaterials
Orders Soldto Customers
Figure 1. The Beer Game Board.
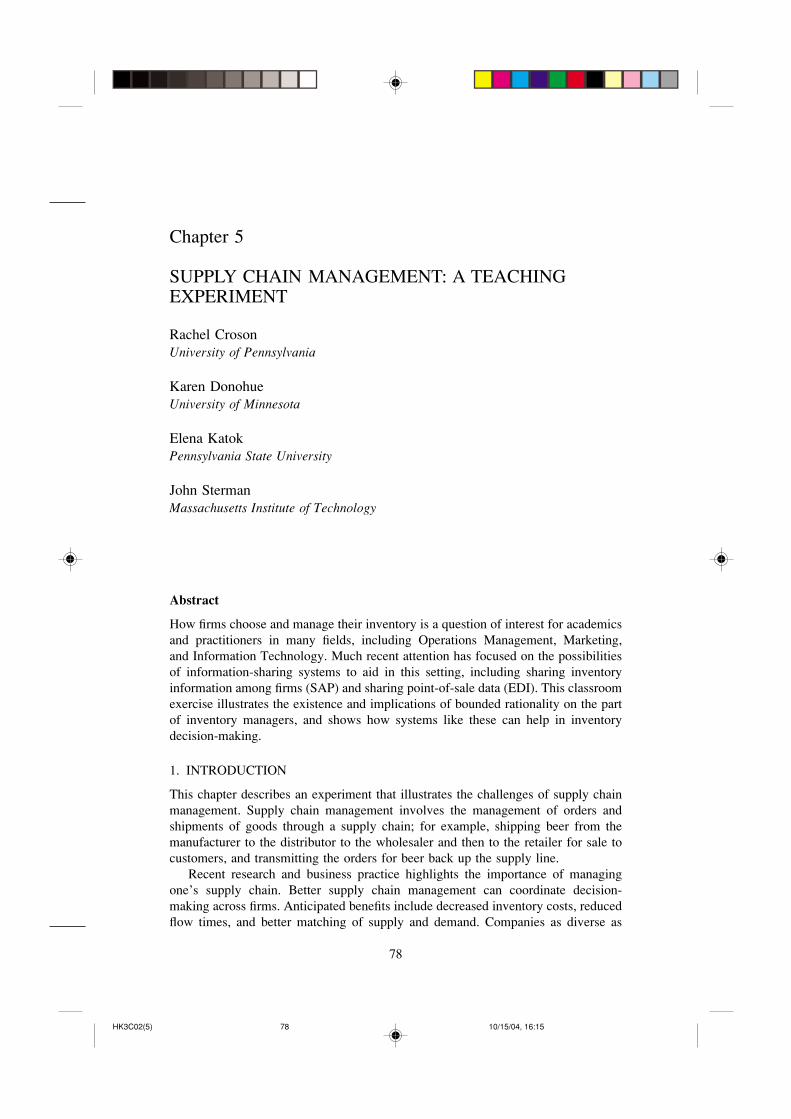
There are four roles in the game–retailer, wholesaler, distributor, and manu-facturer (also called factory). Each position begins with an inventory of beer (usually,12 cases), receives orders from, and ships beer to the player downstream. Eachposition also orders beer from the player upstream. A schematic of this game isdepicted in Figure 1.
Each week, customers purchase beer from the retailer, who provides the beerrequested out of inventory. The retailer in turn places orders for more beer with thewholesaler, who ships the beer requested out of their own inventory. The wholesalerorders and receives beer from the distributor, who in turn orders and receives beerfrom the factory, where the beer is brewed. At each stage there are shipping delaysand order processing delays.
The boxes along the top of the figure represent the delays in order processing.When a player places an order, it takes two weeks for the order to be received bytheir upstream supplier. The boxes along the bottom of the figure represent thedelays in shipping beer. When a player sends off a shipment, it takes two weeksfor the shipment to be received by their downstream customer. Note that for themanufacturer, it takes three weeks to manufacture beer. Manipulations on thesedelays are discussed below.
The players’ objective is to minimize total team costs. It costs $.50 for each caseof beer that each player holds in inventory each week. If your customer has orderedbeer and you have none in inventory, you incur a backlog cost of $1.00/case/week,which captures both the lost revenue and the ill will a stockout causes amongcustomers. Furthermore, backlogged orders carry over; if you haven’t served a cus-tomer in week 3, you can sell to them from beer that arrives at your site in week 4.Costs are assessed at each link of the distribution chain.
There is no communication (other than the transmittal of orders and shipments)allowed between positions within the team. This restriction means that the playerscan’t explicitly coordinate their decisions. Manipulations on this limited informationwill be discussed below.
HK3C02(5) 10/15/04, 16:1580
SUPPLY CHAIN MANAGEMENT 81
The numbers in the boxes show typical initial conditions. The simulation beginsin an equilibrium where each player has an inventory of 12 cases of beer, and orders,shipments, and beer in the pipeline of order processing and shipping delays allreflect a steady throughput of four cases per week. In the classic game consumerdemand begins at 4 cases of beer per week (for the first four weeks), then jumpsto 8 cases of beer per week and remains there for the remainder of the game.Alternative demand patterns will be discussed below.
The objective of players in the game is to maximize the earnings of their supplychain (experimental manipulations to highlight incentive problems within the chainwill be discussed below). When consumer demand is stationary and/or known (note,it is not in the demand function described above), the cost-minimizing strategy inthis game is an order-up-to policy where each individual places an order to lift theirinventory to some level S in each period, where S is a function of the demanddistribution, the length of the lags, and other institutional factors (Clark and Scarf1960, Chen 1999). However, like many equilibria, it is difficult to calculate and hasbeen the subject of much theoretical research (e.g., Caplin 1985, Graves 1999, Chen1999, Chen and Samroengraja 1999, Cachon 1999, Cachon and Lariviere 1999,Cachon and Fisher 2000, Chen et al. 2000).
The game can be run using a tournament payoff structure or payoffs based onthe performance of each team. In a classroom tournament, each person puts up anominal wager such as $1, and the pot goes to the team with the lowest total costs(or highest profit), winner take all (in very large groups, prizes can go to the top fewteams). For research or other purposes, participants can be paid based on theirsupply chain’s absolute or relative earnings. The tournament is exciting and workswell for teaching; payoffs proportional to each team’s outcomes provide a straight-forward incentive to maximize performance.
2.1. Expected results
One of the most interesting and reliable results that the beer game illustrates is thebullwhip effect. The effect itself is described by two regularities; oscillations oforders at each level of the supply chain and amplification of these oscillations as onemoves farther up the chain. Both oscillation and amplification are costly to supplychains, as factories gear up (and down) to meet ever-changing demand. Oscillationand amplification also cause firms to incur inventory and/or stockout costs, as theyeither have too much beer in their warehouse or not enough to sell to their customers.Oscillation and amplification in supply chains has been documented since at leastthe pioneering work on business cycles of Wesley Mitchell in the 1930s, and formalmodels of supply chains that explain how it arises date from at least Forrester(1958).
Proctor and Gamble first coined the term bullwhip effect to describe the systematicordering behavior witnessed between customers and suppliers of Pampers diapers(Lee, Padmanabhan, Whang 1997). While customers use diapers at a fairly constantrate, Proctor and Gamble found that wholesale orders fluctuated considerably over
HK3C02(5) 10/15/04, 16:1581

82 Experimental Business Research Vol. XX
Figure 2. Amplification in the Macroeconomy.Source: Federal Reserve Industrial Production Data, series B51000 Consumer Goods,B54000 Intermediate Products, B53010 Materials, each shown as the ratio to the best-fitexponential growth trend.
1950 1960 1970 1980 1990 2000
US Industrial Production(Detrended)
Rat
io to
Tre
nd (
Tre
nd =
100
)
120
100
80
120
100
80
120
100
80
Final Products
Intermediate Goods
Materials
time. The firm also found that the orders it placed for raw materials with its suppliersfluctuated even more than these wholesale orders. Other companies have observed asimilar tendency in their internal supply chains (Baljko 1999a, 1999b). Baganha andCohen (1998) provide empirical evidence of these problems in industries with highorder variation, while Kahn (1987) shows this pattern exists in the macroeconomyas well. Figure 2, depicts this pattern using detrended US Industrial Productionfrom 1945–2002. Sterman (2000) presents many other examples, in industries fromaircraft to zinc.
From its original conception and first implementation, the Beer Game hasbeen updated in a number of ways. The original game was run on a physical gameboard, but now there are a number of computer interfaces that can be used if thefacilitator wishes. The interfaces are often easier to use, but some argue that thephysical implementation creates excitement and energy that the “colder” computerversions miss. The original game uses a particular (nonstationary) demand dis-tribution, which is effective at making the point but doesn’t have nice theoreticalproperties. Newer versions use stationary and known demand distributions (e.g.,customers order x cases of beer each week when x is drawn from a uniform dis-tribution, 0 to 8), which are more difficult to explain but enable the equilibrium tobe calculated. These and other comparisons will be discussed in the next sectionon implementation.
HK3C02(5) 10/15/04, 16:1582

SUPPLY CHAIN MANAGEMENT 83
3. HOW TO IMPLEMENT
3.1. Board game
The board game and appropriate materials can be ordered from the System DynamicsSociety (the web site can be found in the resources list at the end of this chapter).These materials include the physical board, depicted in Figure 1 along with a deckof cards representing customer orders and other materials and instructions. Atthe beginning of each week, the retailer draws a new card representing customerdemand. There are also game chips (small coins can be used), representing casesof beer. Each individual begins with 12 chips in inventory, and 4 in each of theshipping positions above. As beer moves through the system, the chips physicallymove as well. So when the retailer sells beer to the customers to fill orders, the chipsare removed from the board. When the shipment arrives from the wholesaler to theretailer, the chips are moved from the closest square into the retailers’ inventory,
The materials also include order slips on which players write the number of casesof beer that they wish to order. These slips then move along the upper track inFigure 1 to the upstream supplier who fills the orders as they come in. Instructionsand a videotape for debriefing are also included.
The physical game creates a lot of excitement, and the tangibility and visibilityof orders and inventory help players understand how the supply chain works. Yet theboard game also poses some implementation challenges. There is a particular “orderof events” in which play occurs, and players must manually record their inventorypositions and orders. Players sometimes make mistakes (as occur in real supplychains as well); it is helpful to have facilitators to help run the game smoothly.An experienced person can run the game without help for up to 50 people, but forlarger groups more facilitators are needed. For example, the game is the capstoneevent of the annual orientation for incoming MBA students at the MIT Sloan Schoolof Management. To run the game for more than 360 people in a single session(about 50 teams) requires the assistance of about 40–50 facilitators. These facilitatorsare typically 2nd year students who are trained by the session leader just prior to theevent (training requires a few hours).
It takes three or four weeks in the game for the players to learn and feel comfort-able with the procedure. There is also (often) a delay around week 10 when playersfirst stock out and begin to accumulate backlogs of unfilled orders; it is helpful toexplain the meaning of backlogs at this point, particularly for players with limitedbusiness experience. The game runs for 36 or 48 weeks, but participants are usuallytold the game will last a simulated year (50 weeks) to avoid endgame effects.
To implement on a board game you’ll want to have the materials, and also somefacilitators to watch the game, answer questions and help with calculation. For largergroups you’ll need a loud voice or wireless microphone to call out the steps foreach week.
The manual game takes about 2 hours to play, including time for instructions.At the end, the instructor collects the record sheets, and graphs results (orders and
HK3C02(5) 10/15/04, 16:1583

84 Experimental Business Research Vol. XX
net inventories) for discussion either after a break or in the next class. Additionalsupport for physical implementation, forms and other material can be found onlinein the resource section at the end of this chapter.
3.2. Computer game
The game is sufficiently popular that a number of individuals have developed web-based and/or server-based versions of the game. Some websites where the game canbe played online can be found in the resources section at the end of this chapter.
Play is typically faster in computerized versions. There is never an issue of theorder of moves; the computer automatically enforces them. You avoid accountingand other math errors participants often make. It is also easier to control the com-munication between participants; in the board game the other members of the supplychain are sitting next to each other and in the computer game they most likely arenot. Finally, computer implementations allow you to save the data directly for chartsand graphs, rather than having to type it in or make graphs by hand.
However, the computer implementation has disadvantages as well. In some ofthese games the parameters are fixed, thus doing the manipulations described belowis not feasible without original programming. Finally (and most importantly forclassroom use), the students simply don’t get as excited or emotional about the gamewhen it’s played via computer as they do when it’s played face-to-face. The game isnot merely about the dynamics of supply chains. Participants in the board versiontypically experience considerable frustration and often blame their teammates for thepoor performance and instability they experiences. These emotional dynamics are atleast as important as the dynamics of orders and inventory. The game illustratesimportant lessons about the dynamics of teams, group and individual decision mak-ing, and the tendency of people to form unfounded and dysfunctional attributionsabout others that hinder individual and organizational learning (see Senge 1990;Sterman 2000). Indeed, for these reasons the game is widely used in teambuildingand organizational development workshops, and by companies in the service, financial,and other industries where there are no physical inventories at all. The board versionis superior to the computer version in addressing these issues.
3.3. Debriefing
So now you’ve played the game and collected the students’ outcomes. Now what?The first step is to put the outcomes into a form that will be clear and understand-able to the students. Typically these involve graphs. These graphs can depict theorders each individual placed, their inventory/backlog position, and/or profits/costsearned in the game.
Figure 3 shows an example of the orders placed and inventories/backlogs fromsupply chains consisting of graduate students and business executives, originallyreported in Sterman (1989). Each column shows the results of a single supply chain,with the retailer on the bottom and the manufacturer on the top. Orders placed are
HK3C02(5) 10/15/04, 16:1584

SUPPLY CHAIN MANAGEMENT 85
in the top panel, and net inventory in the bottom (backlogs are shown as negativeinventory).
As is typical, we observe oscillation and amplification. The peak order placed bythe manufacturer is on average more than double the peak order of the retailer. Graphsthat you make from your course will look remarkably similar to these. Though eachplayer is free to make their own decisions, the same patterns of behavior emerge inall the supply chains, demonstrating the role of institutions in shaping our behavior.
In addition to (and possibly before) showing the outcomes, you may want tohave a discussion about the process. Participants in the game (especially the boardgame) often report feeling frustrated and helpless. Many blame others – theirteammates, the customers, or even the professor – for their failings.
One interesting exercise to do is the following. Immediately after the game, askthe players (except retailers, who directly experienced it) to graph their best estim-ate of customer demand. Most draw a pattern with huge swings (see Figure 4 foran example). Blaming the customer for the observed cycle is attractive (and oftenobserved in real organizations) but, it turns out, incorrect. Customer demand is, infact, not cyclic as depicted below.
Research reported in Sterman (1989) shows how this occurs. Most people havedifficulty appreciating the multiple feedback loops, time delays and nonlinearities inthe system, and use instead a very simple heuristic to place orders. In particular,many players ignore the supply line of beer they have ordered but not yet received.Players faced with a backlog will typically order enough to eliminate it. The delays
Team 1
Cas
es/W
eek
0
0
0
00 10 20 30
Team 1
Cas
es
0
0
0
0
0 10 20 30
Team 2
0
0
0
00 10 20 30
Team 3
0
0
0
00 10 20 30
Team 4
0
0
0
00 10 20 30
Team 5
0
0
0
0
F
D
W
R
0 10 20 30
Team 2
0
0
0
0
0 10 20 30
Team 3
0
0
0
0
0 10 20 30
Team 4
0
0
0
0
0 10 20 30
Team 5
0
0
0
0
F
D
W
R
0 10 20 30
Figure 3. Orders Placed and Net Inventory Positions of Typical Teams.
HK3C02(5) 10/15/04, 16:1585

86 Experimental Business Research Vol. XX
Figure 4. Ensemble of typical player estimates of customer demand.In fact, orders in the classic game never exceed 8 cases/week and do not fluctuate.
45 10 15 20
Week25 30
Customer Orders(Sketch here what you think customer orders were)
Team:
Position:�Wholesalor�Distributor�Factory
(Retailers do notfill this in)
35
in order fulfillment mean this beer is not immediately received. However, knowingthey have ordered enough to clear the backlog, players should reduce their ordersand wait patiently for the beer they’ve already ordered to arrive. Most, however, donot, but continue to order until they actually take delivery and clear the backlog.Consequently, they over-order, often by large amounts, and accumulate large excessinventories. The tendency to ignore the supply line contributes to the amplificationand distortion of customer demand as it is passed up the supply chain (see Sterman1989, Kleinmuntz 1985 for analysis and discussion; Sterman 2000 provides ex-amples from diverse real systems and case studies of industries where firms andinvestors ignore time delays including real estate, commodities, shipbuilding, andhigh technology). Game leaders can also estimate the decision rules of the playersusing the procedure described in e.g., Sterman 1989 and Croson et al. 2003, whichcan also provide some useful material for discussion in the debrief.
Game leaders should allow about as much time for debriefing and discussion ofthe results as it takes to play. One of the profound lessons of the game is that wellintentioned, intelligent people can create an outcome no one expected and no onewants. Second, individual decision-making is often biased, and those biases havelarge and important consequences. Finally, faced with poor performance, most peopleblame external events (fluctuations in customer demand) or other people. Theseattributions are not correct – customer demand does not fluctuate, and essentiallyevery person generates the same patterns, indicating it is not particular people that
HK3C02(5) 10/15/04, 16:1586
SUPPLY CHAIN MANAGEMENT 87
cause the dysfunctional behavior but the way in which the structure of the systemmolds our behavior so that diverse people generate the same patterns. Focusing onexternal events or the people in the system diverts attention from opportunities forimprovement – the design of the system – and thwarts learning (Sterman 2000,Senge 1990).
3.4. Manipulations
In addition to the baseline game described here, a number of scholars have investig-ated the impact of changing the structure or parameters of the game. Forrester(1961), and later, Kaminsky and Simchi-Levi (1998), show that shortening thetime-delays improves performance. Croson and Donohue (2003) and Gupta et al.,(2001) investigate the impact of sharing customer demand (point-of-sale data) withthe entire supply chain. Croson and Donohue (2004) show that performanceimproves when inventory information is shared across the supply chain. Crosonet al. (2003) investigate changing the demand function and using automated playersas counterparts.
Other manipulations include alternative demand distributions (including con-stant, uniform[0, 8] and s-shaped), changing the initial conditions (the amount ofinventory and orders everyone starts with), changing the ratio of costs of inventory/backlog, altering the objective function (playing for yourself versus for the team),allowing communication among teammates before or during the game, and theintroduction of simulated (usually, optimal) players in the other roles. Some of thesemanipulations are easier to do in the board version and others in the computerversion. If you have a large class, or two classes which will run at separate times,implementing one of these manipulations and comparing the two treatments addsinterest to your discussion.
4. FINAL THOUGHTS
There is by now a large and growing literature on the benefits of experiential learn-ing generally and classroom experiments in particular. This chapter has introduced aclassroom experiment on supply chain management. The experiment is particularlyuseful in classes on operations management, but is also of interest in other domainslike decision-making, organizational behavior, strategy, or macroeconomics. Thegame is fun to play, engages students and provides enduring lessons for the manage-ment of complex dynamic systems.
4.1. Resources
System Dynamics Society: ordering form for board gamehttp://www.albany.edu/cpr/sds/Beer.htm (ordering form for board game)
MacNeil-Lehrer Report, (1989) Risky Business – Business Cycles, Video, PublicBroadcasting System, aired 23 October 1989. (videotape available for debriefing)
HK3C02(5) 10/15/04, 16:1587

88 Experimental Business Research Vol. XX
Craig Kirkwood’s System Dynamics Resource page includes materials and instruc-tions for running the board game version.http://www.public.asu.edu/∼kirkwood/sysdyn/SDRes.htm.
Electronic versions can be found at the following sites.http://beergame.mit.edu/guide.htm (done by Li and Simchi-Levi)http://www.beergame.lim.ethz.ch/ (done by Nienhaus)http://www.bwl.tu-darmstadt.de/bwl1 (done by Dickerhof and Schilz, supervised byProf. Dr. Hartmut Stadtler)
NOTE
1 The reader should note that there is no beer in the beer game, and the game does not promote drinking.Originally the “production-distribution game”, most students are more excited about producing beerthan widgets or toasters. When played in, say, high schools, it easily becomes the apple juice game.Many organizations customize it to their context, for example, BP (British Petroleum) recast it as “TheOil Biz Game” for use in their refinery and distribution operations.
REFERENCES
Baganha, M. and M. Cohen (1998). “The Stabilizing Effect of Inventory in Supply Chains.” OperationsResearch, 46, S72–S83.
Baljko, J. (1999a). “Expert Warns of ‘Bullwhip Effect’.” Electronic Buyers’ News, July 26.Baljko, J. (1999b). “Creativity Turns EFTC Supply Chain to Gold.” Electronic Buyers’ News, June 7.Cachon, G. (1999). “Managing supply chain demand variability with scheduled ordering policies.”
Management Science, 45, 843–856.Cachon, G. and M. Fisher (2000). “Supply Chain Inventory Management and the Value of Shared
Information.” Management Science, 46, 1032–1048.Cachon, G. and M. Lariviere (1999). “Capacity Choice and Allocation: Strategic Behavior and Supply
Chain Performance.” Management Science, 45, 1091–1108.Caplin, A. (1985). “The Variability of Aggregate Demand with (S, s) Inventory Policies.” Econometrica,
53, 1395–1409.Chen, F. (1999). “Decentralized Supply Chains Subject to Information Delays.” Management Science,
45, 1016–1090.Chen, F., Z. Drezner, J. Ryan, and D. Simchi-Levi (2000). “Quantifying the Bullwhip Effect in a Simple
Supply Chain: The Impact of Forecasting, Leadtimes and Information.” Management Science,46, 463–493.
Chen, F. and R. Samroengraja (1999). “The stationary beer game.” Production and Operations Manage-ment, 9, 19–30.
Clark, A. and H. Scarf (1960). “Optimal policies for a multi-echelon inventory problem.” ManagementScience, 6, 475–490.
Croson, R. and K. Donohue (2002). “Experimental Economics and Supply-Chain Management.” INTER-FACES, 32, 74–82.
Croson, R. and K Donohue (2003). “The Impact of POS Data Sharing on Supply Chain Management:An Experimental Study.” Production and Operations Management, 12, 1–11.
Croson, R. and K. Donohue (2004). “Behavioral Causes of the Bullwhip Effect and the Observed Valueof Inventory Information.” Management Science.
Croson, R., K. Donohue, E. Katok and J. Sterman (2003). “Safety and Coordination Stock: The BullwhipEffect Revisited.” MIT Working Paper.
HK3C02(5) 10/15/04, 16:1588
SUPPLY CHAIN MANAGEMENT 89
Forrester, J. (1958). “Industrial Dynamics: A Major Breakthrough for Decision Makers.” Harvard Busi-ness Review, 36, 37–66.
Forrester, J. (1961). Industrial Dynamics. Cambridge, MA: MIT Press.Graves, S. (1999). “A Single-Item Inventory Model for a Nonstationary Demand Process.” Manufactur-
ing and Service Operations Management, 1, 50–61.Gupta, S., J. Steckel and A. Banerji (2002). “Dynamic Decision Making in Marketing Channels:
An Experimental Study of Cycle Time, Shared Information and Customer Demand Patterns,” inZwick, Rami and Amnon Rapoport (eds.), Experimental Business Research. Kluwer AcademicPublishers: Norwell, MA and Dordrecht, The Netherlands.
Jarmain, W. (ed.) (1963). Problems in Industrial Dynamics. Cambridge, MA: MIT Press.Kahn, J. (1987). “Inventories and the Volatility of Production.” American Economic Review, 77, 667–
679.Kaminsky, P. and D. Simchi-Levi (1998). “A new computerized beer game: A tool for teaching the value
of integrated supply chain management.” in Global Supply Chain and Technology Management,POMS Series in Technology and Operations Management (eds.), H. Lee and S. M. Ng, Vol. 1,pp. 216–225.
Kleinmuntz, D. (1985). “Cognitive Heuristics and Feedback in a Dynamic Decision Environment.”Management Science, 31, 680–702.
Lee, H., P. Padmanabhan and S. Whang (1997). “Information Distortion in a Supply Chain: The BullwhipEffect.” Management Science, 43, 546–558.
Mosekilde, E., E. Larsen and J. Sterman (1991). Coping with complexity: Deterministic Choas in humandecision making bahavior. In J. L. Casti & A. Karlqvist (eds.), Beyond Belief: Randomness, Predic-tion, and Explanation in Science, 199–229. Boston: CRC Press.
Roberts, E. (ed.) (1978). Managerial Applications of System Dynamics. Cambridge, MA: ProductivityPress.
Senge, P. (1990). The Fifth Discipline. New York: Doubleday.Stein, T. and J. Sweat (1998). “Killer supply chains.” Information Week, 708, Nov. 9, 36–46.Sterman, J. (1984). “Instructions for Running the Beer Distribution Game,” D-3679, System Dynamics
Group, MIT, E60-383, Cambridge, MA 02139.Sterman, J. (1988). “Deterministic Chaos in Models of Human Behavior: Methodological Issues and
Experimental Results.” System Dynamics Review, 4, 148–178.Sterman, J. (1989). “Modeling Managerial Behavior: Misperceptions of Feedback in a Dynamic Decision
Making Experiment.” Management Science, 35, 321–339.Sterman, J. (1992). “Teaching takes off: Flight simulators for management education.” OR/MS Today, 19,
40–44.Sterman, J. (2000). Business Dynamics: Systems Thinking and Modeling for a Complex World, Irwin/
McGraw-Hill: New York.
HK3C02(5) 10/15/04, 16:1589