
Ground-Based Temperature and Humidity Profiling Using Spectral Infrared and Microwave Observations....
16
Ground-Based Temperature and Humidity Profiling Using Spectral Infrared and Microwave Observations. Part I: Simulated Retrieval Performance in Clear-Sky Conditions ULRICH LO ¨ HNERT Institute for Meteorology and Geophysics, University of Cologne, Cologne, Germany D. D. TURNER Space Science and Engineering Center, University of Wisconsin—Madison, Madison, Wisconsin S. CREWELL Institute for Meteorology and Geophysics, University of Cologne, Cologne, Germany (Manuscript received 18 June 2008, in final form 13 October 2008) ABSTRACT Two independent ground-based passive remote sensing methods are used to retrieve lower-tropospheric temperature and humidity profiles in clear-sky cases. A simulation study for two distinctly different climatic zones is performed to evaluate the accuracies of a standard microwave profiler [humidity and temperature profiler (HATPRO)] and an infrared spectrometer [Atmospheric Emitted Radiance Interferometer (AERI)] by applying a unified optimal estimation scheme to each instrument. Different measurement modes for each instrument are also evaluated in which the retrieval uses different spectral channels and observa- tional view angles. In addition, both instruments have been combined into the same physically consistent retrieval scheme to evaluate the differences between a combined retrieval relative to the single-instrument retrievals. In general, retrievals derived from only infrared measurements yield superior RMS error and bias to retrievals derived only from microwave measurements. The AERI retrievals show high potential, espe- cially for retrieving humidity in the boundary layer, where accuracies are on the order of 0.25–0.5 g m 23 for a central European climate. In the lowest 500 m the retrieval accuracies for temperature from elevation- scanning microwave measurements and spectral infrared measurements are very similar (0.2–0.6 K). Above this level the accuracies of the AERI retrieval are significantly more accurate (,1 K RMSE below 4 km). The inclusion of microwave measurements to the spectral infrared measurements within a unified physical re- trieval scheme only results in improvements in the high-humidity tropical climate. However, relative to the HATPRO retrieval, the accuracy of the AERI retrieval is more sensitive to changes in the measurement uncertainty. The discussed results are drawn from a subset of ‘‘pristine’’ clear-sky cases: in the general case in which clouds and aerosols are present, the combined HATPRO–AERI retrieval algorithm is expected to yield much more beneficial results. 1. Introduction High-temporal-resolution vertical profiles of atmo- spheric temperature and humidity are needed by many applications in atmospheric sciences, such as weather forecasting initialization, model evaluation, and process studies. Atmospheric stability in particular is described by the basic meteorological quantities, namely, tem- perature and humidity profiles. Even today, radio- sondes continue to provide a benchmark measurement for determining high-resolution vertical profiles of pres- sure, temperature, humidity, and wind because all of the parameters can be simultaneously determined and the accuracy is acceptable for a number of meteorological and aerological applications. Operational radiosonde soundings, however, typically provide 12-hourly obser- vations, a temporal resolution that is often not sufficient Corresponding author address: Dr. Ulrich Lo ¨ hnert, Institute for Meteorology and Geophysics, Zu ¨ lpicher Straße 49a, 50674 Ko ¨ ln, Germany. E-mail: [email protected] MAY 2009 LO ¨ HNERT ET AL. 1017 DOI: 10.1175/2008JAMC2060.1 Ó 2009 American Meteorological Society
-
Upload
independent -
Category
Documents
-
view
1 -
download
0
Transcript of Ground-Based Temperature and Humidity Profiling Using Spectral Infrared and Microwave Observations....
Ground-Based Temperature and Humidity Profiling Using SpectralInfrared and Microwave Observations. Part I: Simulated Retrieval
Performance in Clear-Sky Conditions
ULRICH LOHNERT
Institute for Meteorology and Geophysics, University of Cologne, Cologne, Germany
D. D. TURNER
Space Science and Engineering Center, University of Wisconsin—Madison, Madison, Wisconsin
S. CREWELL
Institute for Meteorology and Geophysics, University of Cologne, Cologne, Germany
(Manuscript received 18 June 2008, in final form 13 October 2008)
ABSTRACT
Two independent ground-based passive remote sensing methods are used to retrieve lower-tropospheric
temperature and humidity profiles in clear-sky cases. A simulation study for two distinctly different climatic
zones is performed to evaluate the accuracies of a standard microwave profiler [humidity and temperature
profiler (HATPRO)] and an infrared spectrometer [Atmospheric Emitted Radiance Interferometer
(AERI)] by applying a unified optimal estimation scheme to each instrument. Different measurement modes
for each instrument are also evaluated in which the retrieval uses different spectral channels and observa-
tional view angles. In addition, both instruments have been combined into the same physically consistent
retrieval scheme to evaluate the differences between a combined retrieval relative to the single-instrument
retrievals. In general, retrievals derived from only infrared measurements yield superior RMS error and bias
to retrievals derived only from microwave measurements. The AERI retrievals show high potential, espe-
cially for retrieving humidity in the boundary layer, where accuracies are on the order of 0.25–0.5 g m23 for a
central European climate. In the lowest 500 m the retrieval accuracies for temperature from elevation-
scanning microwave measurements and spectral infrared measurements are very similar (0.2–0.6 K). Above
this level the accuracies of the AERI retrieval are significantly more accurate (,1 K RMSE below 4 km). The
inclusion of microwave measurements to the spectral infrared measurements within a unified physical re-
trieval scheme only results in improvements in the high-humidity tropical climate. However, relative to the
HATPRO retrieval, the accuracy of the AERI retrieval is more sensitive to changes in the measurement
uncertainty. The discussed results are drawn from a subset of ‘‘pristine’’ clear-sky cases: in the general case in
which clouds and aerosols are present, the combined HATPRO–AERI retrieval algorithm is expected to
yield much more beneficial results.
1. Introduction
High-temporal-resolution vertical profiles of atmo-
spheric temperature and humidity are needed by many
applications in atmospheric sciences, such as weather
forecasting initialization, model evaluation, and process
studies. Atmospheric stability in particular is described
by the basic meteorological quantities, namely, tem-
perature and humidity profiles. Even today, radio-
sondes continue to provide a benchmark measurement
for determining high-resolution vertical profiles of pres-
sure, temperature, humidity, and wind because all of the
parameters can be simultaneously determined and the
accuracy is acceptable for a number of meteorological
and aerological applications. Operational radiosonde
soundings, however, typically provide 12-hourly obser-
vations, a temporal resolution that is often not sufficient
Corresponding author address: Dr. Ulrich Lohnert, Institute for
Meteorology and Geophysics, Zulpicher Straße 49a, 50674 Koln,
Germany.
E-mail: [email protected]
MAY 2009 L O H N E R T E T A L . 1017
DOI: 10.1175/2008JAMC2060.1
� 2009 American Meteorological Society
for many meteorological applications, such as resolving
boundary layer (BL) transitions or frontal passages.
Also a radiosonde ascent drifts with the wind, which can
lead to a significant horizontal displacement, and the
ascent as such will take ;1 h to profile the troposphere,
both of these factors leading to a sampling error. Ad-
ditionally, many radiosonde sensors show a ‘‘dry bias’’
behavior during the daytime (e.g., Cady-Pereira et al.
2008; Turner et al. 2003), an error that is difficult to
account for because of its dependence on multiple en-
vironmental factors.
Remote sensing methods have the advantage of being
able to derive profile information of temperature and
humidity with a high temporal resolution but suffer
some drawbacks in vertical resolution and accuracy. This
paper compares the performance of ground-based tem-
perature and humidity profiling methods in two different
spectral regions: microwave and infrared. Using identi-
cal retrieval approaches, we will address the following
questions: What are the respective merits of microwave
and infrared ground-based temperature and humidity
profiling, and what can be gained from a combination of
both? This study (part I of a planned series) focuses
purely on simulations of clear-sky (CS) conditions. The
application to measured data will follow in part II, where
we are currently analyzing the humidity and tempera-
ture profiler–Atmospheric Emitted Radiance Interfer-
ometer (HATPRO–AERI) retrieval performance dur-
ing a field experiment conducted in the Black Forest
during the summer of 2007 (Wulfmeyer et al. 2008). The
overall goal is to analyze retrieval performance in detail
to pursue simultaneous temperature, humidity, and
cloud microphysical parameter retrieval in the near
future.
Passive microwave radiometry uses frequency bands
around the water vapor absorption line at 22.235 GHz
for water vapor profiling and around the 60-GHz oxygen
complex for temperature profiling. Studies have shown
that approximately four to five independent levels of
temperature information may be obtained, whereas the
number of independent water vapor levels is on the
order of two (Lohnert et al. 2008; Hewison 2007). If
elevation-scanning measurements are additionally con-
sidered, temperature accuracies are within 0.5 K close to
the ground and degrade with height to ;1–2 K in the
lower troposphere (Crewell and Lohnert 2007), whereas
humidity accuracies range on the order of ;0.8 g m23.
These values are more or less independent of the oc-
currence of clouds, except in cases of heavy precipita-
tion where saturation effects may occur or the instru-
ment is influenced by rainwater on the radome.
Previous studies have shown that multispectral mea-
surements in the infrared contain information on the
tropospheric temperature and humidity profile (Smith
et al. 1999; Feltz et al. 2003). This information is gen-
erally limited to clear-sky cases and cases where clouds
are optically thin. However, in the case of an optically
thick cloud, information on temperature and humidity
may still be obtained below the cloud if the cloud
emissivity and temperature are known or retrieved.
In the following, we describe the parallel development
of microwave (MW) and infrared (IR) techniques for
temperature and humidity retrieval for clear-sky cases
using the same optimal estimation retrieval framework
for each. These retrieval algorithms are applied to a
typical central European climate and a humid tropical
climate to be able to interpret the results as a function of
vertically integrated water vapor (IWV) amount.
Our goal is to analyze the error characteristics of both
approaches and to combine both measurements to
evaluate the accuracy that is obtained in a joint retrieval
algorithm. The results shown in this study are based
purely on virtual measurements derived from radiative
transfer simulations to facilitate the retrieval error anal-
ysis. In this way we can exclude sources of bias error as
a result of erroneous calibration and absorption model
uncertainties—errors that are difficult to quantify in
general. We underline that the results shown in this pa-
per are only to be interpreted under these circumstances.
The characteristics of the microwave and infrared
instruments used for simulation are described in section
2 of this paper, whereas the retrieval framework, which
consists of an optimal estimation approach, is described
in section 3. In section 4, we evaluate the accuracies
of the retrieval procedures, whereby the MW and IR
techniques are separately applied to the same cases and
compared to each other. We examine the benefits of
combining MW and IR approaches in one joint retrieval
and also evaluate the impact of using different IR bands
and microwave measurement approaches (zenith-only
measurements versus zenith-plus-elevation–scanning mea-
surements). In section 5 we provide a summary and an
outlook toward describing the cloudy atmosphere with
the expected powerful combination of microwave and
infrared bands.
2. Instrumentation and simulation
This study employs simulations of two state-of-the-art
passive ground-based remote sensing instruments: the
microwave profiler HATPRO and the infrared inter-
ferometer AERI. In the following, the basic principles
and characteristics of each instrument are briefly spec-
ified. We also describe the generation of the simulated
measurements, illustrating how the instrument charac-
teristics are maintained.
1018 J O U R N A L O F A P P L I E D M E T E O R O L O G Y A N D C L I M A T O L O G Y VOLUME 48
a. HATPRO
The microwave profiler HATPRO was designed as a
network-suitable low-cost microwave radiometer that
can observe liquid water path (LWP), humidity, and
temperature profiles with high temporal resolution up
to 1 s (Rose et al. 2005). HATPRO consists of total-
power radiometers utilizing direct detection receivers
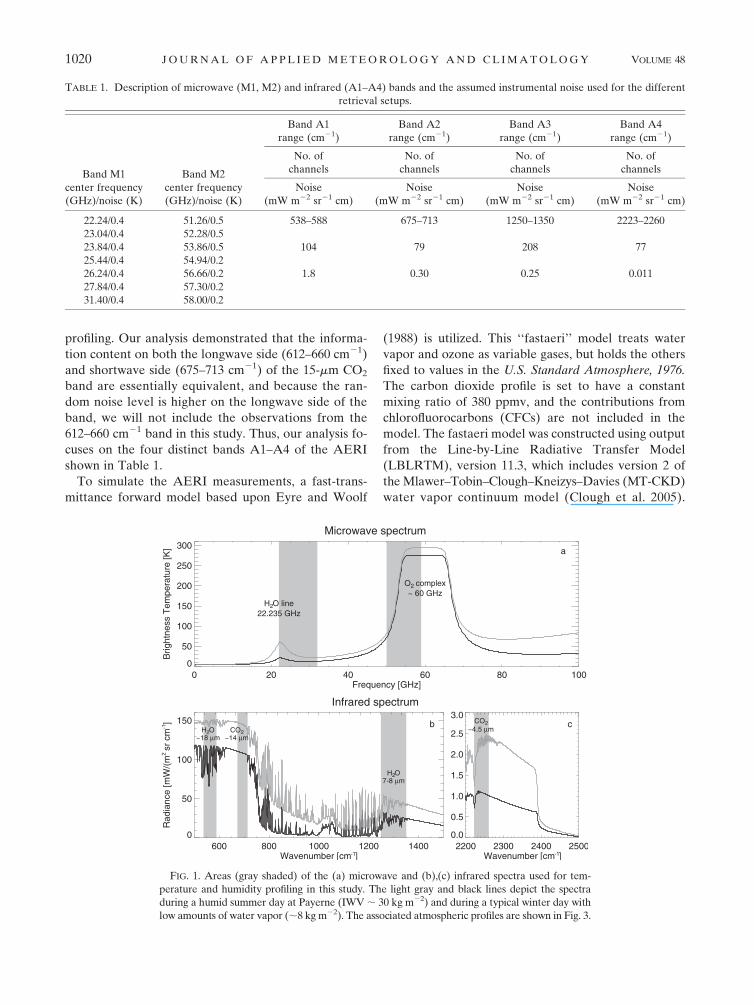
within two bands, M1 and M2 (see Table 1, Fig. 1). The
seven channels of band M1 contain information about
the vertical profile of humidity through the pressure
broadening of the optically thin 22.235-GHz H2O line
and also contain information for determining LWP. The
seven channels of band M2 contain information on the
vertical profile of temperature resulting from the ho-
mogeneous mixing of O2 throughout the atmosphere.
At the opaque center of the O2 absorption complex at
60 GHz, most of the information originates from near
the surface, whereas further away from the line, the
atmosphere becomes less and less opaque so that more
and more information also originates from higher at-
mospheric layers.
In addition to the spectral information, angular in-
formation can enhance the accuracy of the temperature
profile in the boundary layer (Crewell and Lohnert
2007) when the atmosphere in the direct horizontal vi-
cinity (;3 km) of the microwave profiler is assumed
to be horizontally homogeneous. Only the brightness
temperature from the optically thick frequency bands
close to 60 GHz are used in these elevation scans. Be-
cause the brightness temperatures vary only slightly with
elevation angle, the method requires a highly sensitive
radiometer (i.e., low random noise levels), which is typ-
ically realized by using wide bandwidths (up to 4 GHz) in
these channels.
To simulate the HATPRO measurements, we use a
radiative transfer operator consisting purely of a 1D
emission-only forward integration of the radiative
transfer equation, which generates brightness temper-
atures monochromatically at the HATPRO center fre-
quencies. For the calculation of the absorption coeffi-
cients, a fast absorption predictor (Lohnert et al. 2004)
based on Rosenkranz’s (1998) millimeter-wave absorp-
tion model is employed to enhance the speed of the
Jacobian calculations. In clear-sky situations, this so-
called microwave forward model needs profiles of tem-
perature, humidity, and pressure to be able to simulate
realistic brightness temperatures; other gaseous atmo-
spheric constituents play only a minor role at the
HATPRO center frequencies from the perspective of a
ground-based upward-looking instrument. To take into
account the estimated random error of real HATPRO
measurements, the error numbers listed in Table 1 are
randomly added to the forward model simulations.
These error estimates include typical radiometric noise,
calibration uncertainties, and random uncertainties in
the fast absorption predictor.
b. AERI
The AERI is an operational infrared spectrometer
that measures the downwelling infrared radiance from
3.3–19 mm (3020–520 cm21; see Fig. 1) at 1-cm21 reso-
lution (Knuteson et al. 2004a,b). Two detectors are used
in a ‘‘sandwich’’ configuration to provide the needed
sensitivity across the entire spectral range. Details on
the calibration approach and accuracy are provided by
Knuteson et al. (2004b). The random noise in the AERI
observations is determined from the imaginary com-
ponent of the calibrated radiance (Knuteson et al.
2004b), and thus any scene-dependence of the noise
level is automatically captured for each sample. The
AERI is typically run in one of two temporal sampling
modes: 1) ‘‘normal sample’’ mode, whereby sky radi-
ance is averaged for 3 min followed by views of the two
calibration blackbodies, resulting in an approximate
7-min temporal resolution; and 2) ‘‘rapid sample’’ mode,
where sky radiance is averaged for 12 s and multiple
(8–10) sky averages are collected before the black-
bodies are viewed. Although the rapid-sample data
have approximately 4 times more random noise than the
normal-sample data, a principal component-based noise
filter is used to remove the uncorrelated random error
from the AERI observations, which results in a similar
noise level in the rapid-sample data as that in the
normal-sample data (Turner et al. 2006).
The AERI has approximately 2500 spectral channels
for each of its two detectors. Previous studies (e.g.,
Turner 2005) have assumed that the random noise be-
tween any two of these spectral channels is indepen-
dent. We have confirmed this by analyzing a long time
series of observations where a well-characterized black-
body was placed in the sky port. The analysis of these
data demonstrated that the absolute value of the cor-
relation coefficient between any two spectral channels
was less than approximately 0.3, and there was no ap-
parent pattern identified when the correlation matrix
was plotted (not shown).
Like the microwave spectrum, the infrared spectrum
also contains information on the vertical profile of
temperature and humidity. Smith et al. (1999) and Feltz
et al. (1998) used spectral observations from 612–713
and 2223–2260 cm21 (i.e., measurements from the 15- and
4.3-mm CO2 bands, respectively) for temperature profil-
ing, and observations from 538–588 and 1250–1350 cm21
(i.e., measurements from the wings of the rotational and
6.3-mm water vapor bands, respectively) for water vapor
MAY 2009 L O H N E R T E T A L . 1019
profiling. Our analysis demonstrated that the informa-
tion content on both the longwave side (612–660 cm21)
and shortwave side (675–713 cm21) of the 15-mm CO2
band are essentially equivalent, and because the ran-
dom noise level is higher on the longwave side of the
band, we will not include the observations from the
612–660 cm21 band in this study. Thus, our analysis fo-
cuses on the four distinct bands A1–A4 of the AERI
shown in Table 1.
To simulate the AERI measurements, a fast-trans-
mittance forward model based upon Eyre and Woolf
(1988) is utilized. This ‘‘fastaeri’’ model treats water
vapor and ozone as variable gases, but holds the others
fixed to values in the U.S. Standard Atmosphere, 1976.
The carbon dioxide profile is set to have a constant
mixing ratio of 380 ppmv, and the contributions from
chlorofluorocarbons (CFCs) are not included in the
model. The fastaeri model was constructed using output
from the Line-by-Line Radiative Transfer Model
(LBLRTM), version 11.3, which includes version 2 of
the Mlawer–Tobin–Clough–Kneizys–Davies (MT-CKD)
water vapor continuum model (Clough et al. 2005).
TABLE 1. Description of microwave (M1, M2) and infrared (A1–A4) bands and the assumed instrumental noise used for the different
retrieval setups.
Band M1
center frequency
(GHz)/noise (K)
Band M2
center frequency
(GHz)/noise (K)
Band A1
range (cm21)
Band A2
range (cm21)
Band A3
range (cm21)
Band A4
range (cm21)
No. of
channels
No. of
channels
No. of
channels
No. of
channels
Noise
(mW m22 sr21 cm)
Noise
(mW m22 sr21 cm)
Noise
(mW m22 sr21 cm)
Noise
(mW m22 sr21 cm)
22.24/0.4 51.26/0.5 538–588 675–713 1250–1350 2223–2260
23.04/0.4 52.28/0.5
23.84/0.4 53.86/0.5 104 79 208 77
25.44/0.4 54.94/0.2
26.24/0.4 56.66/0.2 1.8 0.30 0.25 0.011
27.84/0.4 57.30/0.2
31.40/0.4 58.00/0.2
FIG. 1. Areas (gray shaded) of the (a) microwave and (b),(c) infrared spectra used for tem-
perature and humidity profiling in this study. The light gray and black lines depict the spectra
during a humid summer day at Payerne (IWV ; 30 kg m22) and during a typical winter day with
low amounts of water vapor (;8 kg m22). The associated atmospheric profiles are shown in Fig. 3.
1020 J O U R N A L O F A P P L I E D M E T E O R O L O G Y A N D C L I M A T O L O G Y VOLUME 48
The monochromatic layer-to-surface transmission pro-
files from the LBLRTM are convolved with the AERI’s
spectral response function (a sinc function), the effec-
tive layer optical depths at each AERI spectral channel
are computed by taking ratios of the convolved trans-
mittance profiles at different layers, and these layer
optical depths are related to the atmospheric state
predictor variables at those layers via linear regression.
The fastaeri model contains both uncorrelated error
(because each of the regressions for each spectral
channel were determined independently of the other
channels) and correlated error that comes from inade-
quacies in the LBLRTM (such as errors in the for-
mulation of the water vapor continuum). The model’s
uncorrelated error is assumed to be smaller than the
uncorrelated error in the normal-sample AERI data.
The correlated error in the model would most likely
manifest itself as a bias, and we have assumed for this
study that the forward models are unbiased estimators;
thus, we are assuming that the correlated error in the
model is negligible. Note that fastaeri is an emission-
only model that does not include scattering (i.e., real-
istic clouds cannot be simulated). The fastaeri model
has been used extensively in previous analyses of water
vapor and temperature from the AERI (e.g., Smith
et al. 1999; Feltz et al. 2003).
For this sensitivity study, the fastaeri model was used
to compute radiance with the spectral resolution of the
AERI, and uncorrelated random noise was added to
these calculations. We utilized the average noise level of
a normal-sampling AERI system in clearsky cases
(Knuteson et al. 2004b). This translates into 1-sigma
uncertainties of bands A1–A4 given in Table 1.
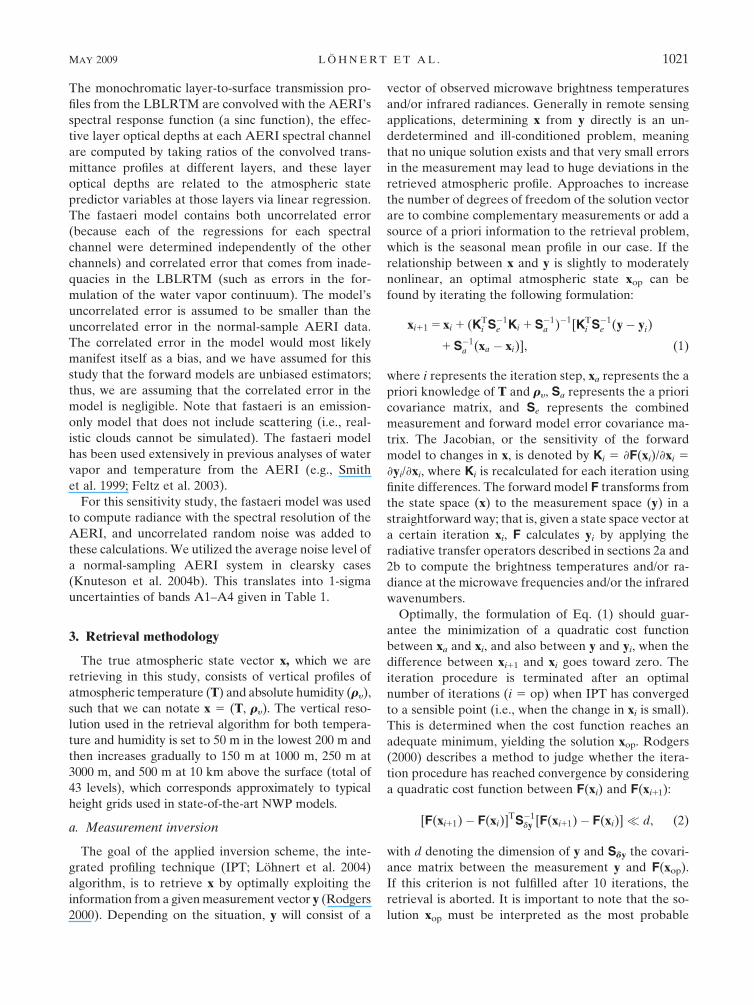
3. Retrieval methodology
The true atmospheric state vector x, which we are
retrieving in this study, consists of vertical profiles of
atmospheric temperature (T) and absolute humidity (ry),
such that we can notate x 5 (T, ry). The vertical reso-
lution used in the retrieval algorithm for both tempera-
ture and humidity is set to 50 m in the lowest 200 m and
then increases gradually to 150 m at 1000 m, 250 m at
3000 m, and 500 m at 10 km above the surface (total of
43 levels), which corresponds approximately to typical
height grids used in state-of-the-art NWP models.
a. Measurement inversion
The goal of the applied inversion scheme, the inte-
grated profiling technique (IPT; Lohnert et al. 2004)
algorithm, is to retrieve x by optimally exploiting the
information from a given measurement vector y (Rodgers
2000). Depending on the situation, y will consist of a
vector of observed microwave brightness temperatures
and/or infrared radiances. Generally in remote sensing
applications, determining x from y directly is an un-
derdetermined and ill-conditioned problem, meaning
that no unique solution exists and that very small errors
in the measurement may lead to huge deviations in the
retrieved atmospheric profile. Approaches to increase
the number of degrees of freedom of the solution vector
are to combine complementary measurements or add a
source of a priori information to the retrieval problem,
which is the seasonal mean profile in our case. If the
relationship between x and y is slightly to moderately
nonlinear, an optimal atmospheric state xop can be
found by iterating the following formulation:
xi11 5 xi 1 (KTi S�1
e Ki 1 S�1a )�1[KT
i S�1e (y� yi)
1 S�1a (xa � xi)], (1)
where i represents the iteration step, xa represents the a
priori knowledge of T and ry, Sa represents the a priori
covariance matrix, and Se represents the combined
measurement and forward model error covariance ma-
trix. The Jacobian, or the sensitivity of the forward
model to changes in x, is denoted by Ki 5 ›F(xi)/›xi 5
›yi/›xi, where Ki is recalculated for each iteration using
finite differences. The forward model F transforms from
the state space (x) to the measurement space (y) in a
straightforward way; that is, given a state space vector at
a certain iteration xi, F calculates yi by applying the
radiative transfer operators described in sections 2a and
2b to compute the brightness temperatures and/or ra-
diance at the microwave frequencies and/or the infrared
wavenumbers.
Optimally, the formulation of Eq. (1) should guar-
antee the minimization of a quadratic cost function
between xa and xi, and also between y and yi, when the
difference between xi11 and xi goes toward zero. The
iteration procedure is terminated after an optimal
number of iterations (i 5 op) when IPT has converged
to a sensible point (i.e., when the change in xi is small).
This is determined when the cost function reaches an
adequate minimum, yielding the solution xop. Rodgers
(2000) describes a method to judge whether the itera-
tion procedure has reached convergence by considering
a quadratic cost function between F(xi) and F(xi11):
[F(xi11)� F(xi)]TS�1dy [F(xi11)� F(xi)]� d, (2)
with d denoting the dimension of y and Sdy the covari-
ance matrix between the measurement y and F(xop).
If this criterion is not fulfilled after 10 iterations, the
retrieval is aborted. It is important to note that the so-
lution xop must be interpreted as the most probable
MAY 2009 L O H N E R T E T A L . 1021
solution of a Gaussian distributed probability density
function, whose covariance can be written as
Sop 5 (KTi S�1
e Ki 1 S�1a )�1. (3)
The diagonal elements of this matrix give an estimate of
the mean quadratic error of xop, whereas the off-diagonal
elements yield information on the correlation of re-
trieval errors between the different heights.
A further important measure for retrieval algorithm
evaluation is the averaging kernel matrix A that states the
sensitivity of the retrieved to the true state (5›xop /›x). In
the case of Gaussian statistics, A can be written as
A 5 Sop(KTopS�1
e Kop). (4)
The diagonal values of A are frequently used as a
measure of vertical resolution (Rodgers 2000), whereas
the trace of A states the independent number of levels
that can be retrieved from a given measurement.
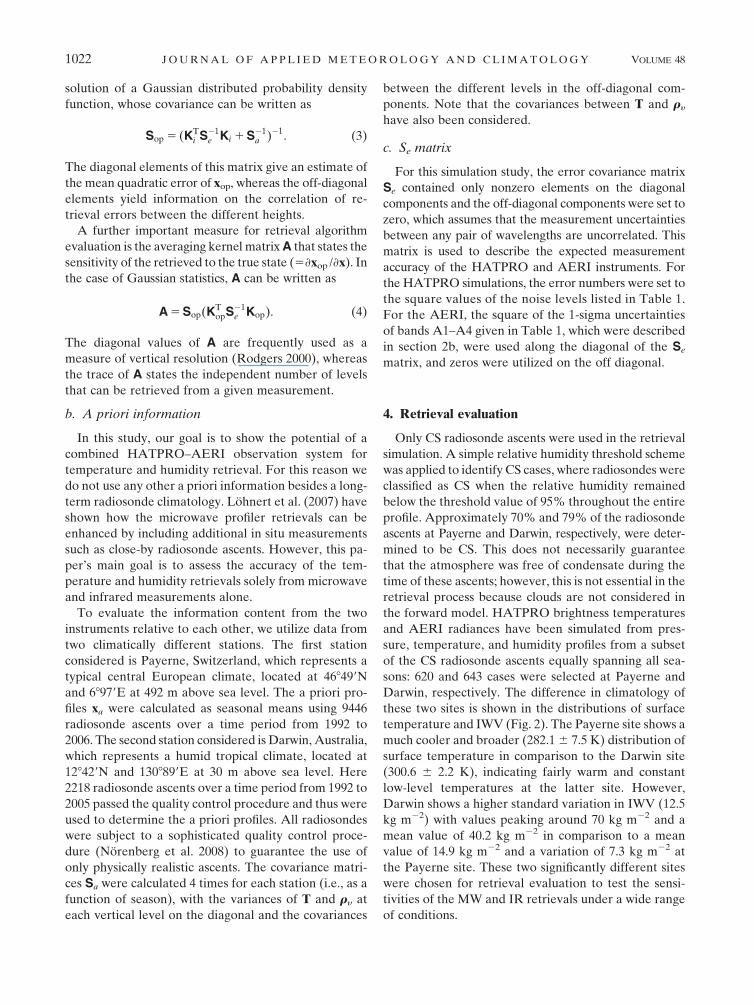
b. A priori information
In this study, our goal is to show the potential of a
combined HATPRO–AERI observation system for
temperature and humidity retrieval. For this reason we
do not use any other a priori information besides a long-
term radiosonde climatology. Lohnert et al. (2007) have
shown how the microwave profiler retrievals can be
enhanced by including additional in situ measurements
such as close-by radiosonde ascents. However, this pa-
per’s main goal is to assess the accuracy of the tem-
perature and humidity retrievals solely from microwave
and infrared measurements alone.
To evaluate the information content from the two
instruments relative to each other, we utilize data from
two climatically different stations. The first station
considered is Payerne, Switzerland, which represents a
typical central European climate, located at 468499N
and 68979E at 492 m above sea level. The a priori pro-
files xa were calculated as seasonal means using 9446
radiosonde ascents over a time period from 1992 to
2006. The second station considered is Darwin, Australia,
which represents a humid tropical climate, located at
128429N and 1308899E at 30 m above sea level. Here
2218 radiosonde ascents over a time period from 1992 to
2005 passed the quality control procedure and thus were
used to determine the a priori profiles. All radiosondes
were subject to a sophisticated quality control proce-
dure (Norenberg et al. 2008) to guarantee the use of
only physically realistic ascents. The covariance matri-
ces Sa were calculated 4 times for each station (i.e., as a
function of season), with the variances of T and ry at
each vertical level on the diagonal and the covariances
between the different levels in the off-diagonal com-
ponents. Note that the covariances between T and ry
have also been considered.
c. Se matrix
For this simulation study, the error covariance matrix
Se contained only nonzero elements on the diagonal
components and the off-diagonal components were set to
zero, which assumes that the measurement uncertainties
between any pair of wavelengths are uncorrelated. This
matrix is used to describe the expected measurement
accuracy of the HATPRO and AERI instruments. For
the HATPRO simulations, the error numbers were set to
the square values of the noise levels listed in Table 1.
For the AERI, the square of the 1-sigma uncertainties
of bands A1–A4 given in Table 1, which were described
in section 2b, were used along the diagonal of the Se
matrix, and zeros were utilized on the off diagonal.
4. Retrieval evaluation
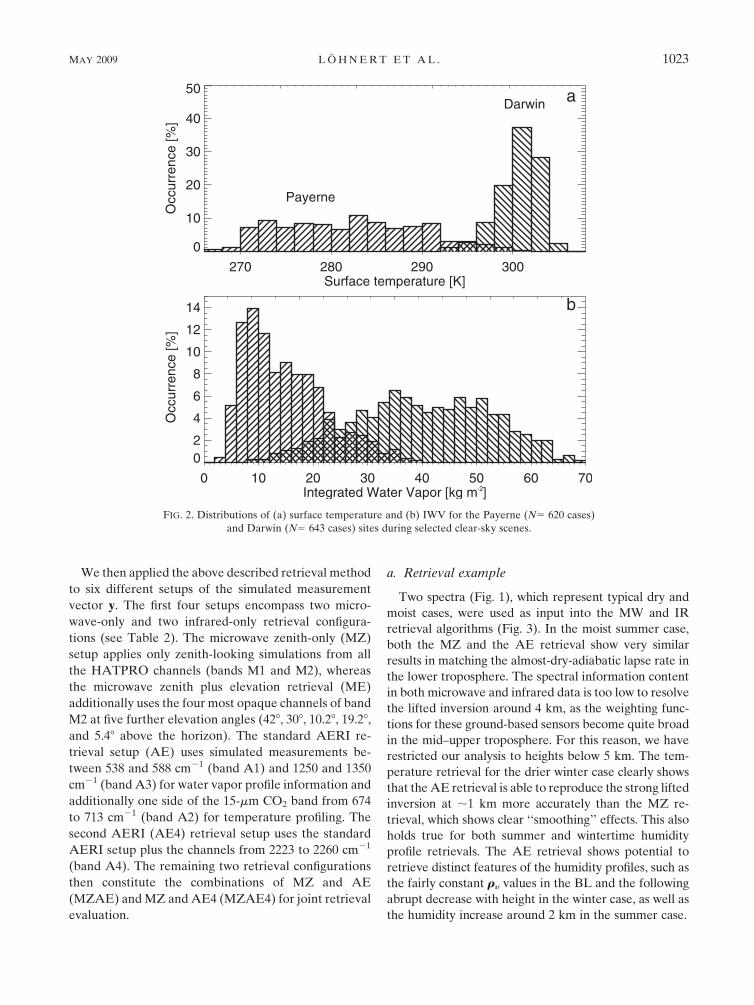
Only CS radiosonde ascents were used in the retrieval
simulation. A simple relative humidity threshold scheme
was applied to identify CS cases, where radiosondes were
classified as CS when the relative humidity remained
below the threshold value of 95% throughout the entire
profile. Approximately 70% and 79% of the radiosonde
ascents at Payerne and Darwin, respectively, were deter-
mined to be CS. This does not necessarily guarantee
that the atmosphere was free of condensate during the
time of these ascents; however, this is not essential in the
retrieval process because clouds are not considered in
the forward model. HATPRO brightness temperatures
and AERI radiances have been simulated from pres-
sure, temperature, and humidity profiles from a subset
of the CS radiosonde ascents equally spanning all sea-
sons: 620 and 643 cases were selected at Payerne and
Darwin, respectively. The difference in climatology of
these two sites is shown in the distributions of surface
temperature and IWV (Fig. 2). The Payerne site shows a
much cooler and broader (282.1 6 7.5 K) distribution of
surface temperature in comparison to the Darwin site
(300.6 6 2.2 K), indicating fairly warm and constant
low-level temperatures at the latter site. However,
Darwin shows a higher standard variation in IWV (12.5
kg m22) with values peaking around 70 kg m22 and a
mean value of 40.2 kg m22 in comparison to a mean
value of 14.9 kg m22 and a variation of 7.3 kg m22 at
the Payerne site. These two significantly different sites
were chosen for retrieval evaluation to test the sensi-
tivities of the MW and IR retrievals under a wide range
of conditions.
1022 J O U R N A L O F A P P L I E D M E T E O R O L O G Y A N D C L I M A T O L O G Y VOLUME 48
We then applied the above described retrieval method
to six different setups of the simulated measurement
vector y. The first four setups encompass two micro-
wave-only and two infrared-only retrieval configura-
tions (see Table 2). The microwave zenith-only (MZ)
setup applies only zenith-looking simulations from all
the HATPRO channels (bands M1 and M2), whereas
the microwave zenith plus elevation retrieval (ME)
additionally uses the four most opaque channels of band
M2 at five further elevation angles (428, 308, 10.28, 19.28,
and 5.48 above the horizon). The standard AERI re-
trieval setup (AE) uses simulated measurements be-
tween 538 and 588 cm21 (band A1) and 1250 and 1350
cm21 (band A3) for water vapor profile information and
additionally one side of the 15-mm CO2 band from 674
to 713 cm21 (band A2) for temperature profiling. The
second AERI (AE4) retrieval setup uses the standard
AERI setup plus the channels from 2223 to 2260 cm21
(band A4). The remaining two retrieval configurations
then constitute the combinations of MZ and AE
(MZAE) and MZ and AE4 (MZAE4) for joint retrieval
evaluation.
a. Retrieval example
Two spectra (Fig. 1), which represent typical dry and
moist cases, were used as input into the MW and IR
retrieval algorithms (Fig. 3). In the moist summer case,
both the MZ and the AE retrieval show very similar
results in matching the almost-dry-adiabatic lapse rate in
the lower troposphere. The spectral information content
in both microwave and infrared data is too low to resolve
the lifted inversion around 4 km, as the weighting func-
tions for these ground-based sensors become quite broad
in the mid–upper troposphere. For this reason, we have
restricted our analysis to heights below 5 km. The tem-
perature retrieval for the drier winter case clearly shows
that the AE retrieval is able to reproduce the strong lifted
inversion at ;1 km more accurately than the MZ re-
trieval, which shows clear ‘‘smoothing’’ effects. This also
holds true for both summer and wintertime humidity
profile retrievals. The AE retrieval shows potential to
retrieve distinct features of the humidity profiles, such as
the fairly constant ry values in the BL and the following
abrupt decrease with height in the winter case, as well as
the humidity increase around 2 km in the summer case.
FIG. 2. Distributions of (a) surface temperature and (b) IWV for the Payerne (N5 620 cases)
and Darwin (N5 643 cases) sites during selected clear-sky scenes.
MAY 2009 L O H N E R T E T A L . 1023

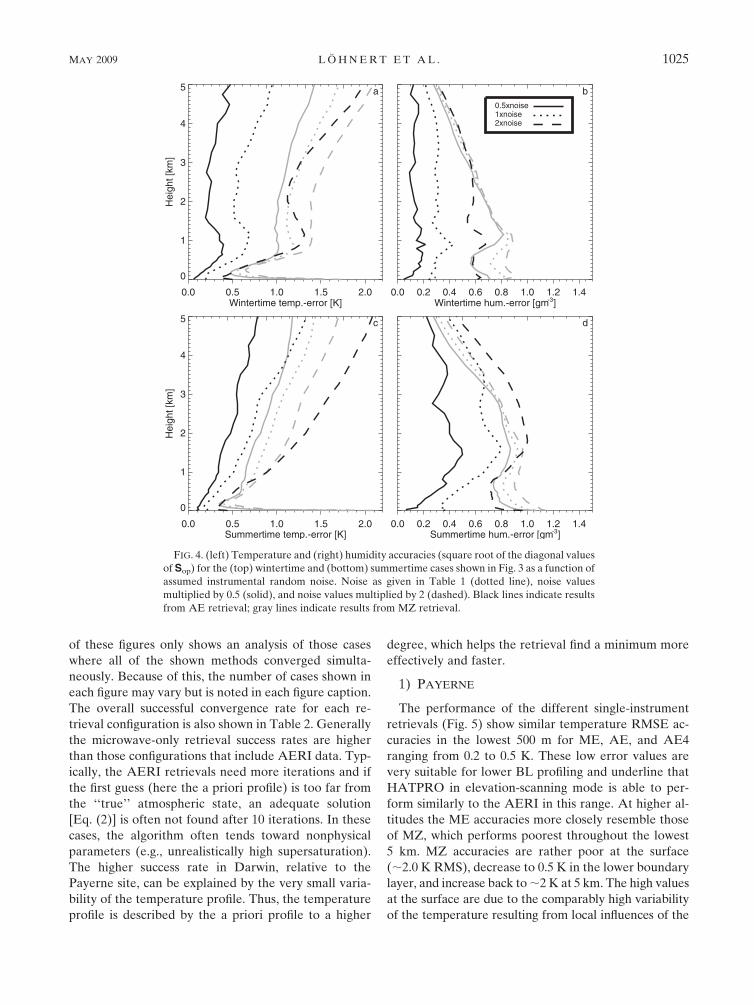
Additionally, the diagonal components of Sop have
been evaluated for retrieval error characterization (Fig. 4).
As expected from Fig. 3, the error in the AE retrieval
for T and ry is smaller than the error in MZ, both in the
winter and summer cases. Note that for the winter case,
the ry accuracy of AE is better than of MZ by almost a
factor of 4. To test the sensitivity of the assumed mag-
nitude of the instrument random noise, the HATPRO
and AERI noise levels have been multiplied by 0.5 and
2 and the retrieval was then reapplied (Fig. 4). For these
two example profiles, the sensitivity of the MZ retrieval
to changes in the assumed magnitude of the random
error in the instrument is significantly smaller than for
the AE retrieval, with the changes in MZ retrieval ac-
curacy ranging from 8% to 18% and the changes in the
AE retrieval accuracy ranging from 40% to 100%. The
instrument noise level has relatively little influence on
the MZ retrieval accuracy of ry above 1.2 km (winter)
and 2.5 km (summer). This suggests that the MW
measurements add no significant amount of information
to retrieval accuracy above these heights. However, the
retrieval will still perform more accurately than the as-
sumption of the seasonal a priori profile resulting from
the level-to-level correlation contained in Sa. The much
higher sensitivity of AE to the assumed instrumental
noise reflects the fact that there is generally more in-
formation contained in the AERI compared to the
HATPRO measurements. If the error noise assump-
tions for the AERI (Table 1) are too conservative and/or
are significantly reduced by principal component analysis
noise filter (section 2b), then AE retrievals may be
much more accurate than assumed; however, if the
uncertainties in the AERI observations are larger than
expected, MZ may even outperform AE—especially in
high-humidity cases above the lower BL.
b. Statistical retrieval evaluation
We applied the retrieval technique to the six different
configurations of the simulated measurement vector y
(Table 2) for the selected CS scenes at each site. Figures
5–8 show the derived accuracies from the retrieval
simulations as a function of height above ground. Each
FIG. 3. Profiles of (a) temperature and (b) humidity for a summer and winter case at Payerne.
Shown are radiosonde measurements (gray), MZ retrievals (dotted), and AERI retrievals
without the 4-mm channel (AE; solid).
TABLE 2. Description of different measurement configurations and their overall retrieval performance averaged over 0–5 km.
Name Measurements used
Successful
convergence (%)
(Payerne/Darwin)
Temperature
retrieval accuracy (K):
mean RMSE 0–5 km
(Payerne/Darwin)
Humidity retrieval
accuracy (g m23):
mean RMSE 0–5 km
(Payerne/Darwin)
MZ Bands M1, M2 88/99 1.22/0.86 0.66/1.24
ME Bands M1, M2 (elevation
scanning in band M2)
90/98 0.95/0.73 0.65/1.19
AE Bands A1, A2, A3 71/84 0.69/0.71 0.42/1.15
AE4 Bands A1, A2, A3, A4 70/87 0.64/0.65 0.41/1.05
MZAE Bands M1, M2, A1, A2, A3 74/83 0.67/0.67 0.41/0.99
MZAE4 Bands M1, M2, A1, A2, A3, A4 72/85 0.64/0.62 0.38/0.94
1024 J O U R N A L O F A P P L I E D M E T E O R O L O G Y A N D C L I M A T O L O G Y VOLUME 48
of these figures only shows an analysis of those cases
where all of the shown methods converged simulta-
neously. Because of this, the number of cases shown in
each figure may vary but is noted in each figure caption.
The overall successful convergence rate for each re-
trieval configuration is also shown in Table 2. Generally
the microwave-only retrieval success rates are higher
than those configurations that include AERI data. Typ-
ically, the AERI retrievals need more iterations and if
the first guess (here the a priori profile) is too far from
the ‘‘true’’ atmospheric state, an adequate solution
[Eq. (2)] is often not found after 10 iterations. In these
cases, the algorithm often tends toward nonphysical
parameters (e.g., unrealistically high supersaturation).
The higher success rate in Darwin, relative to the
Payerne site, can be explained by the very small varia-
bility of the temperature profile. Thus, the temperature
profile is described by the a priori profile to a higher
degree, which helps the retrieval find a minimum more
effectively and faster.
1) PAYERNE
The performance of the different single-instrument
retrievals (Fig. 5) show similar temperature RMSE ac-
curacies in the lowest 500 m for ME, AE, and AE4
ranging from 0.2 to 0.5 K. These low error values are
very suitable for lower BL profiling and underline that
HATPRO in elevation-scanning mode is able to per-
form similarly to the AERI in this range. At higher al-
titudes the ME accuracies more closely resemble those
of MZ, which performs poorest throughout the lowest
5 km. MZ accuracies are rather poor at the surface
(;2.0 K RMS), decrease to 0.5 K in the lower boundary
layer, and increase back to ;2 K at 5 km. The high values
at the surface are due to the comparably high variability
of the temperature resulting from local influences of the
FIG. 4. (left) Temperature and (right) humidity accuracies (square root of the diagonal values
of Sop) for the (top) wintertime and (bottom) summertime cases shown in Fig. 3 as a function of
assumed instrumental random noise. Noise as given in Table 1 (dotted line), noise values
multiplied by 0.5 (solid), and noise values multiplied by 2 (dashed). Black lines indicate results
from AE retrieval; gray lines indicate results from MZ retrieval.
MAY 2009 L O H N E R T E T A L . 1025
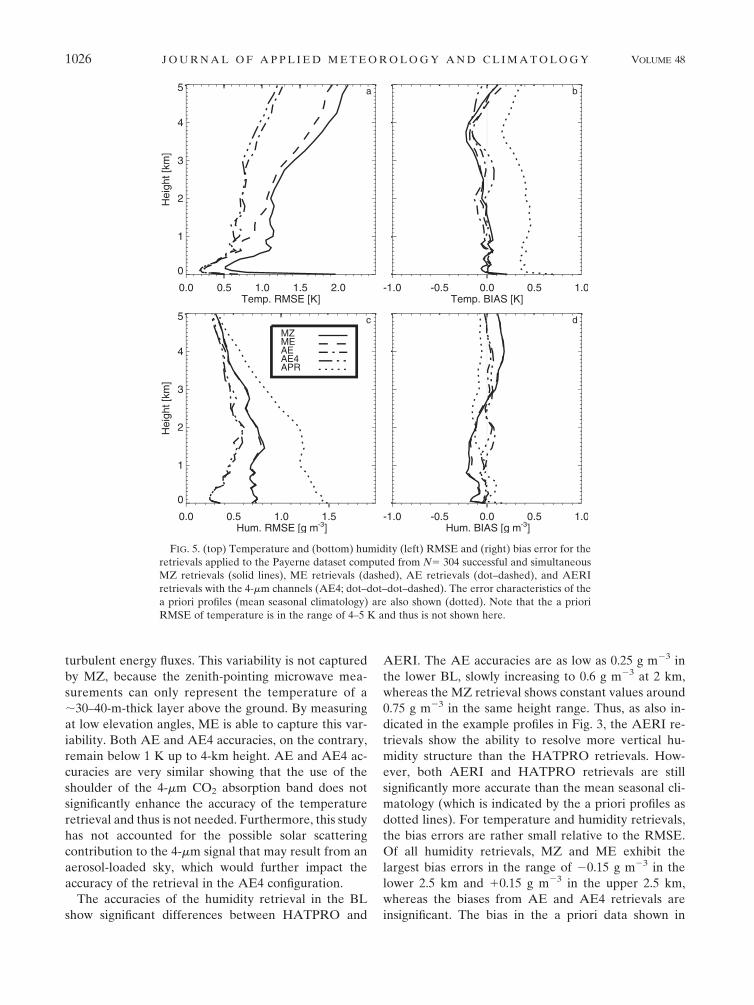
turbulent energy fluxes. This variability is not captured
by MZ, because the zenith-pointing microwave mea-
surements can only represent the temperature of a
;30–40-m-thick layer above the ground. By measuring
at low elevation angles, ME is able to capture this var-
iability. Both AE and AE4 accuracies, on the contrary,
remain below 1 K up to 4-km height. AE and AE4 ac-
curacies are very similar showing that the use of the
shoulder of the 4-mm CO2 absorption band does not
significantly enhance the accuracy of the temperature
retrieval and thus is not needed. Furthermore, this study
has not accounted for the possible solar scattering
contribution to the 4-mm signal that may result from an
aerosol-loaded sky, which would further impact the
accuracy of the retrieval in the AE4 configuration.
The accuracies of the humidity retrieval in the BL
show significant differences between HATPRO and
AERI. The AE accuracies are as low as 0.25 g m23 in
the lower BL, slowly increasing to 0.6 g m23 at 2 km,
whereas the MZ retrieval shows constant values around
0.75 g m23 in the same height range. Thus, as also in-
dicated in the example profiles in Fig. 3, the AERI re-
trievals show the ability to resolve more vertical hu-
midity structure than the HATPRO retrievals. How-
ever, both AERI and HATPRO retrievals are still
significantly more accurate than the mean seasonal cli-
matology (which is indicated by the a priori profiles as
dotted lines). For temperature and humidity retrievals,
the bias errors are rather small relative to the RMSE.
Of all humidity retrievals, MZ and ME exhibit the
largest bias errors in the range of 20.15 g m23 in the
lower 2.5 km and 10.15 g m23 in the upper 2.5 km,
whereas the biases from AE and AE4 retrievals are
insignificant. The bias in the a priori data shown in
FIG. 5. (top) Temperature and (bottom) humidity (left) RMSE and (right) bias error for the
retrievals applied to the Payerne dataset computed from N5 304 successful and simultaneous
MZ retrievals (solid lines), ME retrievals (dashed), AE retrievals (dot–dashed), and AERI
retrievals with the 4-mm channels (AE4; dot–dot–dot–dashed). The error characteristics of the
a priori profiles (mean seasonal climatology) are also shown (dotted). Note that the a priori
RMSE of temperature is in the range of 4–5 K and thus is not shown here.
1026 J O U R N A L O F A P P L I E D M E T E O R O L O G Y A N D C L I M A T O L O G Y VOLUME 48
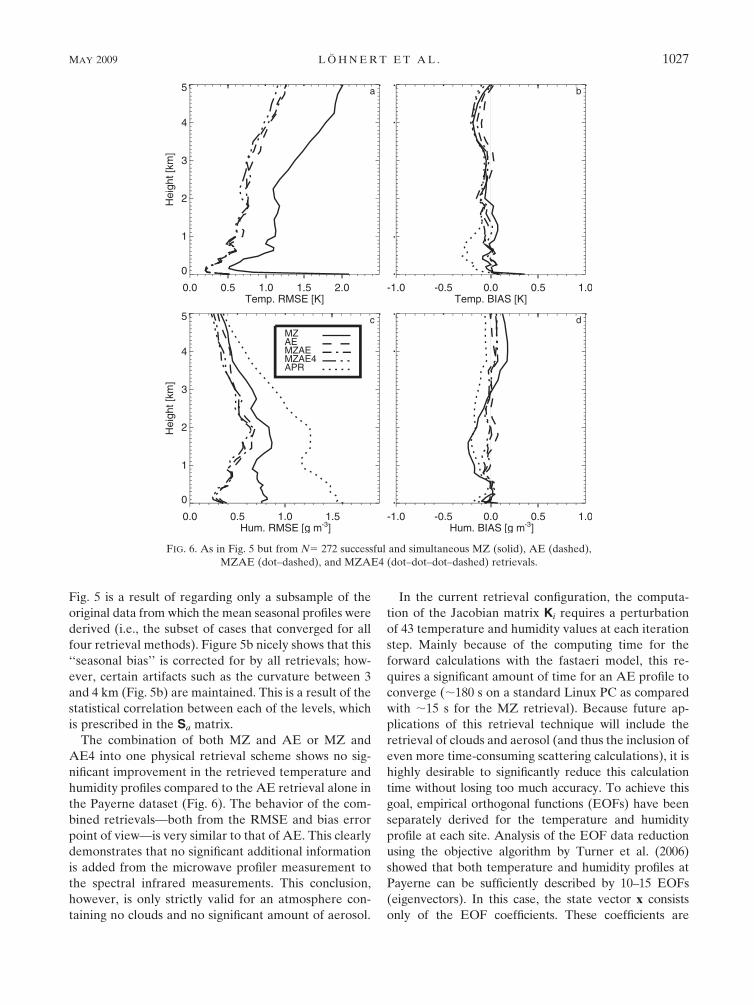
Fig. 5 is a result of regarding only a subsample of the
original data from which the mean seasonal profiles were
derived (i.e., the subset of cases that converged for all
four retrieval methods). Figure 5b nicely shows that this
‘‘seasonal bias’’ is corrected for by all retrievals; how-
ever, certain artifacts such as the curvature between 3
and 4 km (Fig. 5b) are maintained. This is a result of the
statistical correlation between each of the levels, which
is prescribed in the Sa matrix.
The combination of both MZ and AE or MZ and
AE4 into one physical retrieval scheme shows no sig-
nificant improvement in the retrieved temperature and
humidity profiles compared to the AE retrieval alone in
the Payerne dataset (Fig. 6). The behavior of the com-
bined retrievals—both from the RMSE and bias error
point of view—is very similar to that of AE. This clearly
demonstrates that no significant additional information
is added from the microwave profiler measurement to
the spectral infrared measurements. This conclusion,
however, is only strictly valid for an atmosphere con-
taining no clouds and no significant amount of aerosol.
In the current retrieval configuration, the computa-
tion of the Jacobian matrix Ki requires a perturbation
of 43 temperature and humidity values at each iteration
step. Mainly because of the computing time for the
forward calculations with the fastaeri model, this re-
quires a significant amount of time for an AE profile to
converge (;180 s on a standard Linux PC as compared
with ;15 s for the MZ retrieval). Because future ap-
plications of this retrieval technique will include the
retrieval of clouds and aerosol (and thus the inclusion of
even more time-consuming scattering calculations), it is
highly desirable to significantly reduce this calculation
time without losing too much accuracy. To achieve this
goal, empirical orthogonal functions (EOFs) have been
separately derived for the temperature and humidity
profile at each site. Analysis of the EOF data reduction
using the objective algorithm by Turner et al. (2006)
showed that both temperature and humidity profiles at
Payerne can be sufficiently described by 10–15 EOFs
(eigenvectors). In this case, the state vector x consists
only of the EOF coefficients. These coefficients are
FIG. 6. As in Fig. 5 but from N5 272 successful and simultaneous MZ (solid), AE (dashed),
MZAE (dot–dashed), and MZAE4 (dot–dot–dot–dashed) retrievals.
MAY 2009 L O H N E R T E T A L . 1027
multiplied with the corresponding eigenvector and sub-
sequently summed up to obtain the profile. The finite-
difference calculations to compute K are thus performed
in a space with smaller dimensionality, allowing K to be
computed much more efficiently. However, before call-
ing the forward model, the perturbed EOF-coefficient
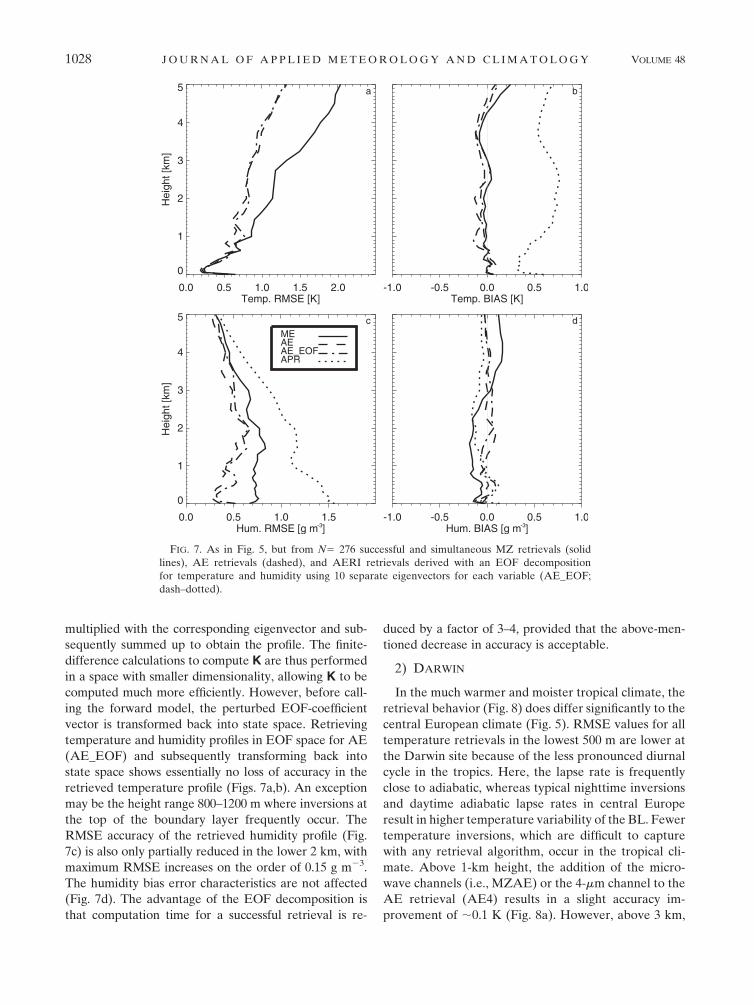
vector is transformed back into state space. Retrieving
temperature and humidity profiles in EOF space for AE
(AE_EOF) and subsequently transforming back into
state space shows essentially no loss of accuracy in the
retrieved temperature profile (Figs. 7a,b). An exception
may be the height range 800–1200 m where inversions at
the top of the boundary layer frequently occur. The
RMSE accuracy of the retrieved humidity profile (Fig.
7c) is also only partially reduced in the lower 2 km, with
maximum RMSE increases on the order of 0.15 g m23.
The humidity bias error characteristics are not affected
(Fig. 7d). The advantage of the EOF decomposition is
that computation time for a successful retrieval is re-
duced by a factor of 3–4, provided that the above-men-
tioned decrease in accuracy is acceptable.
2) DARWIN
In the much warmer and moister tropical climate, the
retrieval behavior (Fig. 8) does differ significantly to the
central European climate (Fig. 5). RMSE values for all
temperature retrievals in the lowest 500 m are lower at
the Darwin site because of the less pronounced diurnal
cycle in the tropics. Here, the lapse rate is frequently
close to adiabatic, whereas typical nighttime inversions
and daytime adiabatic lapse rates in central Europe
result in higher temperature variability of the BL. Fewer
temperature inversions, which are difficult to capture
with any retrieval algorithm, occur in the tropical cli-
mate. Above 1-km height, the addition of the micro-
wave channels (i.e., MZAE) or the 4-mm channel to the
AE retrieval (AE4) results in a slight accuracy im-
provement of ;0.1 K (Fig. 8a). However, above 3 km,
FIG. 7. As in Fig. 5, but from N5 276 successful and simultaneous MZ retrievals (solid
lines), AE retrievals (dashed), and AERI retrievals derived with an EOF decomposition
for temperature and humidity using 10 separate eigenvectors for each variable (AE_EOF;
dash–dotted).
1028 J O U R N A L O F A P P L I E D M E T E O R O L O G Y A N D C L I M A T O L O G Y VOLUME 48
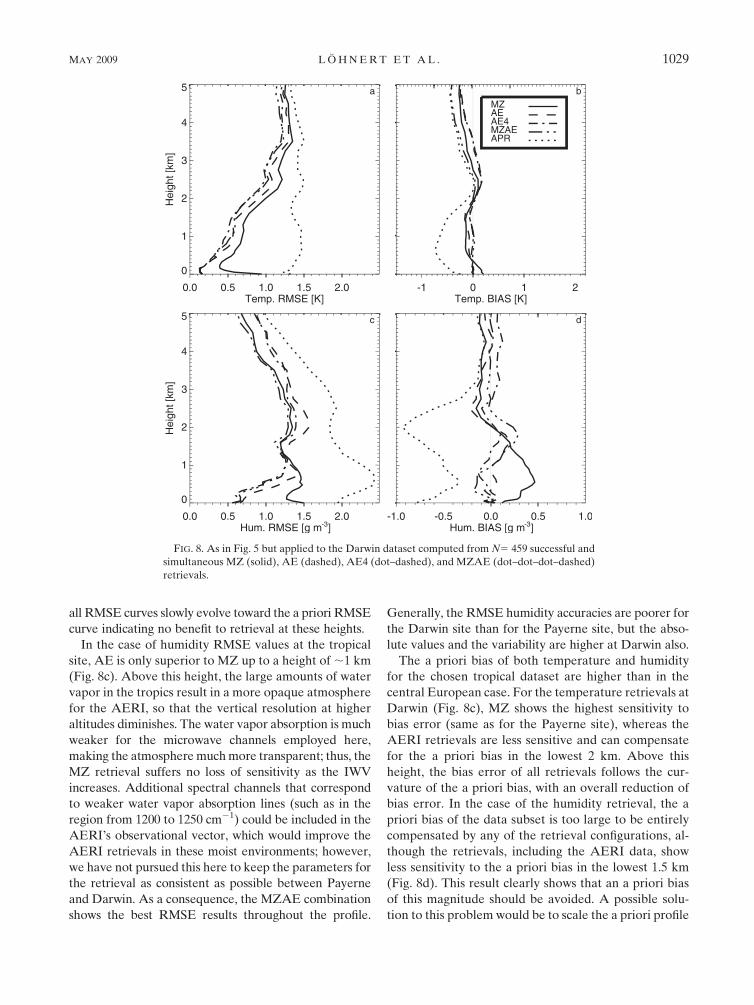
all RMSE curves slowly evolve toward the a priori RMSE
curve indicating no benefit to retrieval at these heights.
In the case of humidity RMSE values at the tropical
site, AE is only superior to MZ up to a height of ;1 km
(Fig. 8c). Above this height, the large amounts of water
vapor in the tropics result in a more opaque atmosphere
for the AERI, so that the vertical resolution at higher
altitudes diminishes. The water vapor absorption is much
weaker for the microwave channels employed here,
making the atmosphere much more transparent; thus, the
MZ retrieval suffers no loss of sensitivity as the IWV
increases. Additional spectral channels that correspond
to weaker water vapor absorption lines (such as in the
region from 1200 to 1250 cm21) could be included in the
AERI’s observational vector, which would improve the
AERI retrievals in these moist environments; however,
we have not pursued this here to keep the parameters for
the retrieval as consistent as possible between Payerne
and Darwin. As a consequence, the MZAE combination
shows the best RMSE results throughout the profile.
Generally, the RMSE humidity accuracies are poorer for
the Darwin site than for the Payerne site, but the abso-
lute values and the variability are higher at Darwin also.
The a priori bias of both temperature and humidity
for the chosen tropical dataset are higher than in the
central European case. For the temperature retrievals at
Darwin (Fig. 8c), MZ shows the highest sensitivity to
bias error (same as for the Payerne site), whereas the
AERI retrievals are less sensitive and can compensate
for the a priori bias in the lowest 2 km. Above this
height, the bias error of all retrievals follows the cur-
vature of the a priori bias, with an overall reduction of
bias error. In the case of the humidity retrieval, the a
priori bias of the data subset is too large to be entirely
compensated by any of the retrieval configurations, al-
though the retrievals, including the AERI data, show
less sensitivity to the a priori bias in the lowest 1.5 km
(Fig. 8d). This result clearly shows that an a priori bias
of this magnitude should be avoided. A possible solu-
tion to this problem would be to scale the a priori profile
FIG. 8. As in Fig. 5 but applied to the Darwin dataset computed from N5 459 successful and
simultaneous MZ (solid), AE (dashed), AE4 (dot–dashed), and MZAE (dot–dot–dot–dashed)
retrievals.
MAY 2009 L O H N E R T E T A L . 1029
of humidity with a realistic and independent IWV value
(e.g., obtainable from a temporally and spatially nearby
radiosonde measurement or a GPS measurement).
The main results discussed above are summarized in
Table 2, where the RMSE have been averaged over the
0–5-km altitude range to show the benefits and draw-
backs of each retrieval configuration that were evalu-
ated. This table demonstrates that the AERI offers
significantly more value relative to the HATPRO ob-
servations in clear-sky conditions for temperature and
humidity profiling, except in very humid conditions.
c. Degrees of freedom
An objective way to analyze the information content
of the different retrievals is to evaluate the distribution
of the number of degrees of freedom of the each single
retrieval [Eq. (4); i.e., the number of independent levels
of temperature or humidity that can be determined].
For temperature, the distributions of degrees of free-
dom of MZ and AE do not overlap, neither for the
Payerne nor for the Darwin site retrieval simulations
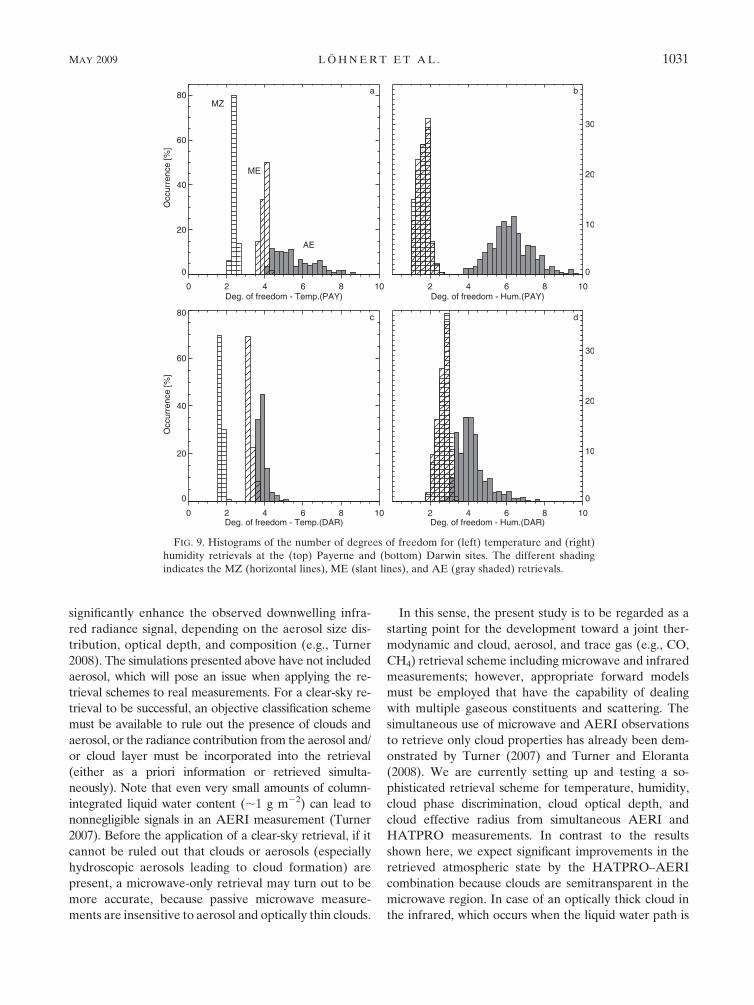
(Figs. 9a,c). This clearly demonstrates that AE provides
more information on the temperature profile than MZ:
on average 5.6 as opposed to 2.4 independent layers.
Figure 9a also illustrates that the inclusion of the
elevation-scanning mode for the HATPRO can double
the amount of independently retrieved levels, but as
seen from Fig. 5, this improvement is mostly limited to
the lowest 500 m. As expected, ME and MZ do not
differ with respect to the humidity retrievals because no
additional information about the humidity profile has
been added and scanning has only been considered for
the channels between 50.8 and 60 GHz, which are sen-
sitive primarily to temperature. For the Darwin site
simulations, in comparison with Payerne, the average
number of independent levels in the humidity retrievals
is reduced for AE (from 6.3 to 4.2) and increased for
MZ (from 1.6 to 2.7). For MZ, the increased opacity at
the band M1 microwave channels leads to a slightly
improved height resolution, whereas the AERI chan-
nels in bands A1 and A3 are becoming more opaque
and thus resolve the height profile in a less accurate way
in the moist tropical environment.
The potential of an instrument to retrieve the tem-
perature or humidity profile with a certain accuracy and
vertical resolution depends on the number of indepen-
dent pieces of information contained in the measure-
ment. The number of independent pieces of information
depends to some degree on the number of spectral
channels of the observations, the noise levels, and the
spectral location of the channels, but it also depends
strongly on the spectral characteristics of the absorption
lines observed. For example, the oxygen absorption
feature from 51 to 60 GHz really comprises 33 different
absorption lines, yet it is perceived as one continuous
feature (see Fig. 1) because of pressure broadening of
the lines. All measurements made along this absorption
feature are highly correlated and thus the number of
independent pieces of information about the tempera-
ture profile is rather low. In the infrared region between
675 and 713 cm21, the CO2 absorption lines can be re-
solved by the instrument (because they do not overlap as
much) and there are more distinctly independent spectral
features, thereby providing more pieces of information
allowing the temperature profile to be better resolved.
5. Conclusions and outlook
We have presented simulation results from two in-
dependent ground-based remote sensing instruments, a
standard microwave profiler (HATPRO) and an infra-
red spectrometer (AERI), for lower-tropospheric pro-
filing of temperature and humidity in ‘‘pristine’’ clear-
sky conditions. To compare both methods objectively,
all measurements have been simulated realistically and
consistently, and the same optimal estimation retrieval
framework was applied to both using the same a priori
information. In all cases, the infrared retrievals of
temperature and humidity outperform the microwave
retrievals concerning RMSE and bias error, although
the microwave temperature retrievals that incorporate
elevation scans are as accurate as the infrared retrievals
in the lowest 500 m. The AERI retrievals show high
potential, especially for retrieving humidity in the BL,
where accuracies are better than 0.5 g m23 for a central
European climate. Distinct differences occur between a
tropical and central European climate, where the inclu-
sion of microwave measurements to the spectral infrared
measurements within a unified physical retrieval scheme
results in a slight improvement because of the higher
opacity of the very moist atmosphere in the tropics.
The limited number of sondes (constituting the CS
data subset) employed in this study present a trade-off
between representativeness and calculation time.
However, we believe that the presented statistics reflect
the true distribution because the CS data subset was
equally distributed over all seasons.
If the error statistics presented here were to be inter-
preted for climatological studies, a detailed error analysis
for the full set of encountered conditions—including
cloudy conditions—would be necessary. This is of par-
ticular relevance because ;30% of the cases from the
entire Payerne dataset show that the relative humidity
threshold of 95% was exceeded and thus the presence of
clouds in the moist layers was likely. Also, aerosols can
1030 J O U R N A L O F A P P L I E D M E T E O R O L O G Y A N D C L I M A T O L O G Y VOLUME 48
significantly enhance the observed downwelling infra-
red radiance signal, depending on the aerosol size dis-
tribution, optical depth, and composition (e.g., Turner
2008). The simulations presented above have not included
aerosol, which will pose an issue when applying the re-
trieval schemes to real measurements. For a clear-sky re-
trieval to be successful, an objective classification scheme
must be available to rule out the presence of clouds and
aerosol, or the radiance contribution from the aerosol and/
or cloud layer must be incorporated into the retrieval
(either as a priori information or retrieved simulta-
neously). Note that even very small amounts of column-
integrated liquid water content (;1 g m22) can lead to
nonnegligible signals in an AERI measurement (Turner
2007). Before the application of a clear-sky retrieval, if it
cannot be ruled out that clouds or aerosols (especially
hydroscopic aerosols leading to cloud formation) are
present, a microwave-only retrieval may turn out to be
more accurate, because passive microwave measure-
ments are insensitive to aerosol and optically thin clouds.
In this sense, the present study is to be regarded as a
starting point for the development toward a joint ther-
modynamic and cloud, aerosol, and trace gas (e.g., CO,
CH4) retrieval scheme including microwave and infrared
measurements; however, appropriate forward models
must be employed that have the capability of dealing
with multiple gaseous constituents and scattering. The
simultaneous use of microwave and AERI observations
to retrieve only cloud properties has already been dem-
onstrated by Turner (2007) and Turner and Eloranta
(2008). We are currently setting up and testing a so-
phisticated retrieval scheme for temperature, humidity,
cloud phase discrimination, cloud optical depth, and
cloud effective radius from simultaneous AERI and
HATPRO measurements. In contrast to the results
shown here, we expect significant improvements in the
retrieved atmospheric state by the HATPRO–AERI
combination because clouds are semitransparent in the
microwave region. In case of an optically thick cloud in
the infrared, which occurs when the liquid water path is
FIG. 9. Histograms of the number of degrees of freedom for (left) temperature and (right)
humidity retrievals at the (top) Payerne and (bottom) Darwin sites. The different shading
indicates the MZ (horizontal lines), ME (slant lines), and AE (gray shaded) retrievals.
MAY 2009 L O H N E R T E T A L . 1031
above approximately 60 g m22, the AERI measurements
will yield accurate information on temperature and hu-
midity profiles below the cloud and the cloud-base tem-
perature, as well as—to a certain extent—cloud optical
depth, whereas the microwave measurements will give
information on temperature and humidity throughout
and above the cloud, in addition to the total liquid water
content. In the case of an optically thin cloud, the AERI
will provide information on cloud effective radius and
optical depth and the atmospheric state profiles below
the cloud, whereas again the microwave radiometer will
provide a reliable source on temperature and humidity
profile throughout the troposphere.
Acknowledgments. This work has been supported in
part by the U.S. Department of Energy, Office of Sci-
ence, Office of Biological and Environmental Research,
Environmental Sciences division as part of the Atmo-
spheric Radiation Measurement (ARM) Program
under Grant DE-FG02-06ER64167. We acknowledge
the Payerne Aerological Station of MeteoSwiss and
the Australian Bureau of Meteorology for supplying us
with the radiosonde data. In addition, the authors thank
Dr. Robert Knuteson for his valuable comments and
suggestions for improvement of the manuscript.
REFERENCES
Cady-Pereira, K. E., M. W. Shephard, D. D. Turner, E. J. Mlawer,
S. A. Clough, and T. J. Wagner, 2008: Improved daytime
column-integrated precipitable water vapor from Vaisala radio-
sonde humidity sensors. J. Atmos. Oceanic Technol., 25, 873–883.
Clough, S. A., M. W. Shephard, E. J. Mlawer, J. S. Delamere, M. J.
Iacono, K. Cady-Pereira, S. Boukabara, and P. D. Brown, 2005:
Atmospheric radiative transfer modeling: A summary of the
AER codes. J. Quant. Spectrosc. Radiat. Transfer, 91, 233–244.
Crewell, S., and U. Lohnert, 2007: Accuracy of boundary layer
temperature profiles retrieved with multifrequency multiangle
microwave radiometry. IEEE Trans. Geosci. Remote Sens., 45,2195–2201.
Eyre, J. R., and H. M. Woolf, 1988: Transmittance of atmospheric
gases in the microwave region: A fast model. Appl. Opt., 27,
3244–3249.
Feltz, W. F., W. L. Smith, R. O. Knuteson, H. E. Revercomb,
and H. B. Howell, 1998: Meteorological applications of tem-
perature and water vapor retrievals from the ground-based
Atmospheric Emitted Radiance Interferometer (AERI).
J. Appl. Meteor., 37, 857–875.
——, ——, H. B. Howell, R. O. Knuteson, H. Woolf, and H. E. Re-
vercomb, 2003: Near-continuous profiling of temperature, mois-
ture, and atmospheric stability using the Atmospheric Emitted
Radiance Interferometer (AERI). J. Appl. Meteor., 42, 857–875.
Hewison, T. J., 2007: 1D-VAR retrieval of temperature and hu-
midity profiles from a ground-based microwave radiometer.
IEEE Trans. Geosci. Remote Sens., 45, 2163–2168, doi:10.1109/
TGRS.2007.898091.
Knuteson, R. O., and Coauthors, 2004a: Atmospheric Emitted
Radiance Interferometer. Part I: Instrument design. J. Atmos.
Oceanic Technol., 21, 1763–1776.
——, and Coauthors, 2004b: Atmospheric Emitted Radiance
Interferometer. Part II: Instrument performance. J. Atmos.
Oceanic Technol., 21, 1777–1789.
Lohnert, U., S. Crewell, and C. Simmer, 2004: An integrated ap-
proach toward retrieving physically consistent profiles of
temperature, humidity, and cloud liquid water. J. Appl.
Meteor., 43, 1295–1307.
——, E. van Meijgaard, H. K. Baltink, S. Groß, and R. Boers, 2007:
Accuracy assessment of an integrated profiling technique for
operationally deriving profiles of temperature, humidity, and
cloud liquid water. J. Geophys. Res., 112, D04205, doi:10.1029/
2006JD007379.
——, S. Crewell, O. Krasnov, E. O’Connor, and H. Russchenberg,
2008: Advances in continuously profiling the thermodynamic
state of the boundary layer: Integration of measurements and
methods. J. Atmos. Oceanic Technol., 25, 1251–1266.
Norenberg, D., S. Crewell, U. Lohnert, and T. Rose, 2008: De-
velopment of ground equipment for atmospheric propagation
conditions assessment from 10 up to 90 GHz frequency bands
(ATPROP). ESA Final Rep. Contract 19839/06/NL/GLC.
[Available from ESA-ESTEC, Keplerlaan 1, Postbus 299,
2200 AG Noordwijk, Netherlands.]
Rodgers, C. D., 2000: Inverse Methods for Atmospheric Sounding:
Theory and Practice. World Scientific, 238 pp.
Rose, T., S. Crewell, U. Lohnert, and C. Simmer, 2005: A network
suitable microwave radiometer for operational monitoring of
the cloudy atmosphere. Atmos. Res., 75, 183–200, doi:10.1016/
j.atmosres.2004.12.005.
Rosenkranz, P. W., 1998: Water vapor microwave continuum ab-
sorption: A comparison of measurements and models. Radio
Sci., 33, 919–928.
Smith, W. L., W. F. Feltz, R. O. Knuteson, H. E. Revercomb,
H. M. Woolf, and H. B. Howell, 1999: The retrieval of
planetary boundary layer structure using ground-based infrared
spectral radiance measurements. J. Atmos. Oceanic Technol.,
16, 323–333.
Turner, D. D., 2005: Arctic mixed-phase cloud properties from
AERI lidar observations: Algorithm and results from
SHEBA. J. Appl. Meteor., 44, 427–444.
——, 2007: Improved ground-based liquid water path retrievals
using a combined infrared and microwave approach.
J. Geophys. Res., 112, D15204, doi:10.1029/2007JD008530.
——, 2008: Ground-based infrared retrievals of optical depth, ef-
fective radius, and composition of airborne mineral dust
above the Sahel. J. Geophys. Res., 113, D00E03, doi:10.1029/
2008JD010054.
——, and E. W. Eloranta, 2008: Validating mixed-phase cloud
optical depth retrieved from infrared observations with high
spectral resolution lidar. IEEE Geosci. Remote Sens. Lett., 5,
285–288, doi:10.1109/LGRS.2008.915940.
——, B. M. Lesht, S. A. Clough, J. C. Liljegren, H. E. Revercomb,
and D. C. Tobin, 2003: Dry bias and variability in Vaisala
radiosondes: The ARM experience. J. Atmos. Oceanic Tech-
nol., 20, 117–132.
——, R. O. Knuteson, H. E. Revercomb, C. Lo, and R. G. Dedecker,
2006: Noise reduction of Atmospheric Emitted Radiance In-
terferometer (AERI) observations using principal component
analysis. J. Atmos. Oceanic Technol., 23, 1223–1238.
Wulfmeyer, V., and Coauthors, 2008: The Convective and Oro-
graphically Induced Precipitation Study: A research and de-
velopment project of the World Weather Research Program
for improving quantitative precipitation forecasting in low-
mountain regions. Bull. Amer. Meteor. Soc., 89, 1477–1486.
1032 J O U R N A L O F A P P L I E D M E T E O R O L O G Y A N D C L I M A T O L O G Y VOLUME 48