Green Technology and Sustainable Development - MDPI
13
sustainability Article Green Technology and Sustainable Development: Assessment and Green Growth Frameworks Minjian Guo 1 , Joanna Nowakowska-Grunt 2, * , Vladimir Gorbanyov 3 and Maria Egorova 4 1 Department of Art, Shandong University of Science and Technology, Qingdao 266590, China; [email protected] 2 The Management Faculty, Czestochowa University of Technology, Dabrowskiego, 42–201 Czestochowa, Poland 3 Department of World Economy, Moscow State Institute of International Relations (University), 117342 Moscow, Russia; [email protected] 4 Department of Social Sciences and Humanities, National Research Tomsk Polytechnic University, 634050 Tomsk, Russia; [email protected] * Correspondence: [email protected] Received: 20 July 2020; Accepted: 11 August 2020; Published: 13 August 2020 Abstract: The aim of this study is to investigate the characteristics of a sustainable development assessment methodology being designed in the context of green technology. The methodology in question is based on indicators from the Sustainable Development Goals Index (SGDI), specifically in its ecological component. These indicators underlie an Averaging Sustainable Development Index (ASDI) and a Normalized Sustainable Development Index (NSDI). The resultant methodology was applied to 20 countries from the SDGI ranking. According to the research results, the intensive activity of the brown industries in the United Arab Emirates, Kazakhstan, the United States, Korea, and Russia resulted in significant carbon dioxide emissions. Switzerland, Kazakhstan, and Russia had high scores on sustainable management of water and sanitation. Russia was the only developed country to have an ASDI higher than its SDGI and its gap between NSDI and ASDI indexes was not significant, indicating a positive trend in greentech development. The reason why NSDI was increasingly different from SDGI was that countries leading the socio-economic rankings had higher consumption of energy and resources, and a much greater environmental footprint than those countries that consumed less. The originality of this study is that it identifies gaps between NSDI and ASDI values, which indicate that conditions for greentech adoption in most developing countries are unfavorable. Keywords: green economy; green technology; innovation; investment; sustainable development index 1. Introduction In the light of growing global problems such as climate change, population growth, environmental pollution, and inefficient use and depletion of natural resources, countries need to employ technologies and approaches towards economic activity that are environmentally less harmful and that preserve resources. Sustainable development is associated with less environmental damage and is driven by comprehensive and all-encompassing policies, both international and of single countries that take into account the needs of future generations. Among these policies, several suggest employing green technologies. Threats such as the exhaustion of natural resources, climate change due to overpopulation, and the accelerating economic growth of new industrial countries (South Korea, Singapore, India, Malaysia, Turkey, Iran, the Philippines, etc.) associated with negative environmental impacts are widely recognized. They necessitate the adaption of new approaches to economic growth and development Sustainability 2020, 12, 6571; doi:10.3390/su12166571 www.mdpi.com/journal/sustainability
-
Upload
khangminh22 -
Category
Documents
-
view
3 -
download
0
Transcript of Green Technology and Sustainable Development - MDPI
sustainability
Article
Green Technology and Sustainable Development:Assessment and Green Growth Frameworks
Minjian Guo 1, Joanna Nowakowska-Grunt 2,* , Vladimir Gorbanyov 3 and Maria Egorova 4
1 Department of Art, Shandong University of Science and Technology, Qingdao 266590, China;[email protected]
2 The Management Faculty, Czestochowa University of Technology, Dabrowskiego,42–201 Czestochowa, Poland
3 Department of World Economy, Moscow State Institute of International Relations (University),117342 Moscow, Russia; [email protected]
4 Department of Social Sciences and Humanities, National Research Tomsk Polytechnic University,634050 Tomsk, Russia; [email protected]
* Correspondence: [email protected]
Received: 20 July 2020; Accepted: 11 August 2020; Published: 13 August 2020�����������������
Abstract: The aim of this study is to investigate the characteristics of a sustainable developmentassessment methodology being designed in the context of green technology. The methodology inquestion is based on indicators from the Sustainable Development Goals Index (SGDI), specifically inits ecological component. These indicators underlie an Averaging Sustainable Development Index(ASDI) and a Normalized Sustainable Development Index (NSDI). The resultant methodology wasapplied to 20 countries from the SDGI ranking. According to the research results, the intensive activityof the brown industries in the United Arab Emirates, Kazakhstan, the United States, Korea, and Russiaresulted in significant carbon dioxide emissions. Switzerland, Kazakhstan, and Russia had highscores on sustainable management of water and sanitation. Russia was the only developed country tohave an ASDI higher than its SDGI and its gap between NSDI and ASDI indexes was not significant,indicating a positive trend in greentech development. The reason why NSDI was increasingly differentfrom SDGI was that countries leading the socio-economic rankings had higher consumption of energyand resources, and a much greater environmental footprint than those countries that consumed less.The originality of this study is that it identifies gaps between NSDI and ASDI values, which indicatethat conditions for greentech adoption in most developing countries are unfavorable.
Keywords: green economy; green technology; innovation; investment; sustainable development index
1. Introduction
In the light of growing global problems such as climate change, population growth, environmentalpollution, and inefficient use and depletion of natural resources, countries need to employ technologiesand approaches towards economic activity that are environmentally less harmful and that preserveresources. Sustainable development is associated with less environmental damage and is drivenby comprehensive and all-encompassing policies, both international and of single countries thattake into account the needs of future generations. Among these policies, several suggest employinggreen technologies.
Threats such as the exhaustion of natural resources, climate change due to overpopulation,and the accelerating economic growth of new industrial countries (South Korea, Singapore, India,Malaysia, Turkey, Iran, the Philippines, etc.) associated with negative environmental impacts are widelyrecognized. They necessitate the adaption of new approaches to economic growth and development
Sustainability 2020, 12, 6571; doi:10.3390/su12166571 www.mdpi.com/journal/sustainability
Sustainability 2020, 12, 6571 2 of 13
that would focus more on additional sources of growth to minimize the use of natural resources andimprove the living conditions of the population [1].
The Europe 2020 strategy for smart, sustainable, and inclusive growth distinguishes the followingmajor factors that contribute to the strengthening of the economy: smart growth (developing aneconomy based on knowledge and innovation); sustainable growth (promoting a more resource-efficient,greener, and more competitive economy); and inclusive growth (fostering a high-employment economydelivering social and territorial cohesion). This strategy has specially developed sections devotedto the smart use of resources and energy sources in Europe, to the economic transition towards ahydrocarbon-non-intensive scenario, and to the advantages of utilizing renewable energy sources andmodernizing the transport sector [2]. Although its scope of application is wide enough, encompassingactions from the improvement of energy efficiency to the reduction of emissions, the strategy failed tocover the full range of green sectors.
According to the OECD report entitled “Towards Green Growth,” policymakers should followthe concept of green growth. The economy needs to be flexible, dynamic, and efficient when usingresources and imposing a mutual effect on the environment for its preservation. Innovation andinvestment are seen as drivers for the green technology development [3]. A development forecast isbased on a common scenario (increasing productivity, innovation, and technology) that additionallybrings an extra range of ecological advantages. Indirectly-mentioned threats such as climate change,the loss of biodiversity, and food shortages undermine the promotion of growth. The social pillar ofsustainable development and green growth is also disregarded.
It is green technology that stimulates sustainable development, which means identifyingenvironmentally-friendly sources of growth, developing new environmentally-friendly industries,and creating jobs and technologies [4]. To achieve green growth, it is necessary to intensify investmentsand innovations that represent a foundation of sustainable development and open new economicopportunities [5]. Thus, the promotion of green economy requires thorough research on the conditionsof its formation, system-forming factors, and its impact on national sustainable development. Partiesthat are interested in green economic development include business (which focuses on economicbenefits), the authorities (which set environmental goals of sustainable development), and the public(which represents the interests of a social community) [6].
To achieve goals of sustainable development, innovations are needed [7]. The processes ofgreen knowledge management play a special role in sustainable development, more specifically thecreation, acquisition, exchange, and use of knowledge, as well as its impact on green technologies,eco-innovations, and the socio-economic dimension of sustainable development [8,9]. Sustainableinnovation allows the company to keep up with technology. The sustainable green innovationsare aimed at the generation of high-quality innovative products that can reduce environmentalfootprint. As long as environmental issues arise, the importance of sustainable green innovationswill be widely recognized [10]. The compliance with environmental standards is the strongestpredictor in the structural model, representing the impact of variable environmental factors,i.e., innovations, on the environmental situation. Market orientation and technologies were proven todrive environmental performance, imposing a positive impact on the latter. The eco-innovation valuesenable companies to confront challenges inflicted by competitors in the market [11]. The increasedinvestment in environmental and social information disclosure in corporations facilitates operationaldevelopment [12].
Sustainable green technologies add much to a sustainable society while promoting environmentalprotection and economic development. Upon that, special attention should be paid to both determinantsof sustainable green technology invention and differences between their development priorities [13].
Nevertheless, not only do the cumulative efforts of participants within the leader–follower supplychain with sustainable eco-innovations influence the creation of sustainable green innovations butalso the equity among these participants. The latter posed major challenges for all participantswithin the supply chain, such as imbalances in supply and demand, environmental damage, and job
Sustainability 2020, 12, 6571 3 of 13
distribution [14]. The current policy focuses on limiting the consumption of harmful products [15],on improving the effectiveness of supply chains in enterprises [16], and on integrating green humanresource management (HRM) to companies. In this way, green employee behavior and green valueswill acquire a mediating role in reducing the environmental footprint [17].
Any country geared towards green growth first needs to solve a range of financing-related issues.Therefore, the current framework for sustainable development expands to place a financial componentin line with the accepted environmental, social, and economic components [8]. Today, green financecan be regarded as (1) a component of the financial framework for sustainable development [18] and(2) a process of financing diverse activities including those conducive to sustainable development [19].Multiple decision-making models such as quantitative and qualitative economic analysis, environmentalimpact assessment, and sustainable development assessment can enable new angles and approachesto promote green growth and improve sustainability [20].
In the environmental context, the sustainable development assessment involves the following keyindicators:
1. Environmental Sustainability Index (ESI). This index includes 76 variables integrated into21 indicators of environmental sustainability. These indicators embrace natural resourceendowments, the environmental management efforts of the country, past and present pollutionlevels, the country’s capacity to improve environmental efficiency, etc. [21].
2. Environmental Performance Index (EPI). The EPI index consists of 16 indicators that measureprogress towards environmental sustainability. These indicators include child mortality (deathsper 1000 children 1–14 years old); air pollution (µg/m3); access to drinking water (%); regionalozone; nitrate level in drinking water (mg/l); water consumption; wilderness protection; timberharvest rate (%); agricultural subsidies; overfishing; renewable energy; energy efficiency;and carbon dioxide emissions per GDP [22,23].
So far, a hybrid mathematical approach has been developed to prioritize the most effective variablesamong green economy and sustainable development indicators (23 criteria). This methodology isknown as DEMATEL or Decision-Making Trial and Evaluation Laboratory. It is designed to examineinterconnections between multiple criteria to collect the most effective variables (12 criteria) based onthe three pillars (economic, environmental, and social) of sustainable development [24].
A system of criteria for green innovation risk identification in the manufacturing industry underthe global value chain has been created. Three methods were applied to identify the green innovationrisks of manufacturing under the global value chain. From the perspective of the green innovationprocess, four risks were classified: green R&D risk, green manufacturing risk, green marketing risk,and green service risk [25]. Given these risks, one should take into account the behavior of indicatorsand how they change at the time of development fluctuations [26].
There are studies that assess countries with different levels of sustainable development to identifypriority areas and to draw recommendations for policymakers to improve green technologies interms of effectiveness [27]. These studies may present a variety of global indexes and provide anopportunity to compare the sustainability directions of different countries. The construction ofSustainable Development Goals Indexes (SDGIs) is based on top-down approaches [28]. Significantsimilarities (above 95%) between SDGI and results obtained with the artificial neural network weredetermined [29]. An integrated Wellbeing Global Index (WeGIx) was proposed to assess the qualityof life of communities at the global level. WeGIx includes a set of forty-three variables aimed atdiagnosing global progress towards achieving the SDGs [30]. The indicators of sustainability areconsidered as analytical tools. However, the integration of micro, meso, and macro agents plays animportant role, since the macro-level SDG can only be achieved through the actions of micro and mesoagents. Their actions require a methodologically sound approach to assessment in order to avoidlow-impact decisions [31].
Sustainability indicators are discussed in many studies. For example, the rationale of theSDGs and the conceptual parameters of their indicators are reviewed, covering certain fundamental
Sustainability 2020, 12, 6571 4 of 13
aspects such as uncertainty, irreversibility, and criteria for defining critical points [32]. Studies on thecontextualization of global objectives at the national level regarding urban development have revealedthat the SDG baselines and indicators were not used to the full extent [33]. Particular attention waspaid to the development of SDG regional indexes to achieve more limited ultimate goals. Based on thecomposite index (SDGI) the expediency of its application for the assessment of the implementationof the Action Plan to 2030 was studied [34]. A multi-disciplinary approach is needed to developindicators of sustainable development. The aim of this study is to investigate the characteristics of asustainable development assessment methodology being designed in the context of green technology.The methodological proposal is projected to be useful in identifying gaps in the implicit values betweenindicators and thus in contributing to the acquisition of real results, which are necessary for assessingthe potential for green technology development. The level of sustainable development is determined inaccordance with a specially designed strategy by using certain sets of indicators. The sets of indicatorsmay not only differ, but also indicate real results. Therefore, this study seeks to compare differentsystems of indicators with the proposed methodological approach.
The key tasks to achieve the aim of the study are as follows: (1) to explore the link between nationaldevelopment and CO2 emissions; (2) to identify differences between sustainable development indicatorsaccepted in different countries; (3) to establish a connection between environmental developmentand the overall sustainable development. Furthermore, the study assesses indicators underlying theNormalized Sustainability Index (NSDI). The assessment methodology for sustainable developmentwas found to be dependent on the market conditions.
2. Materials and Methods
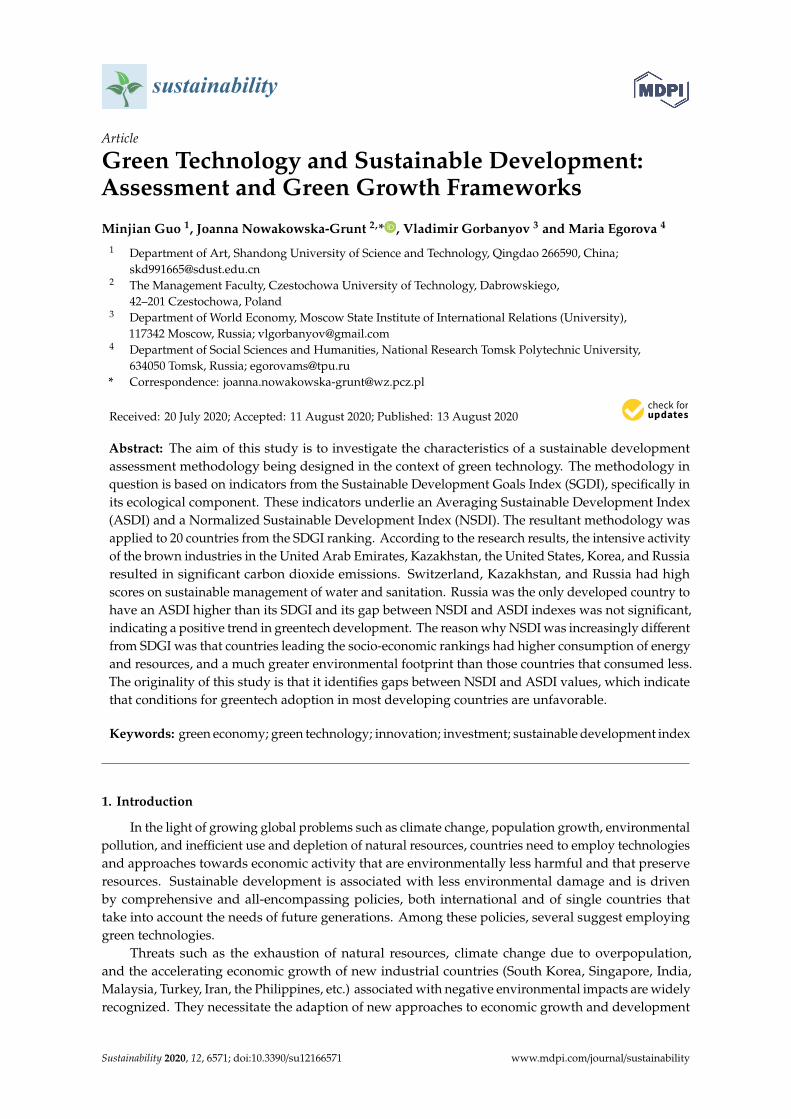
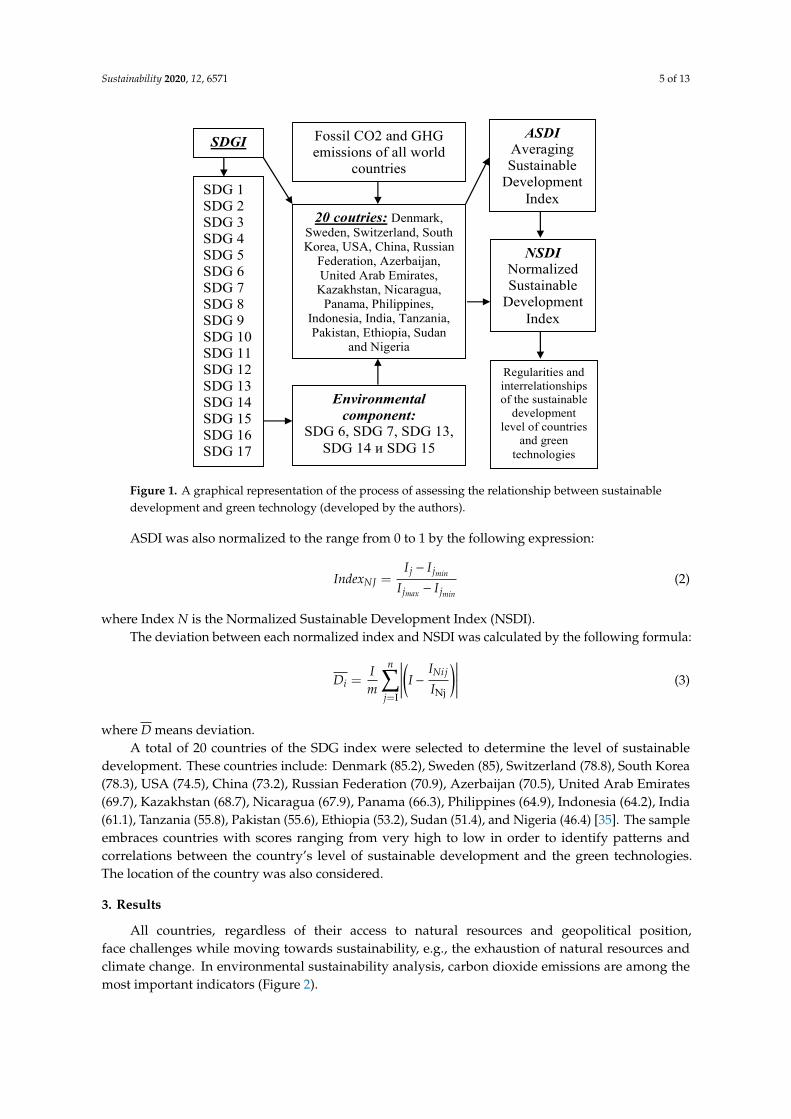
Figure 1 presents the methodological framework used in this study. It is based on a SustainableDevelopment Goals Index (SDGI) consisting of 17 sustainable development goals: SDG 1 (no poverty),SDG 2 (zero hunger), SDG 3 (good health and well-being), SDG 4 (quality education), SDG 5 (genderequality), SDG 6 (clean water and sanitation), SDG 7 (affordable and clean energy), SDG 8 (decent workand economic growth), SDG 9 (industry, innovation and infrastructure), SDG 10 (reduced inequalities),SDG 11 (sustainable cities and communities), SDG 12 (responsible consumption and production), SDG13 (climate action), SDG 14 (life below water), SDG 15 (life on land), SDG 16 (peace, justice, and stronginstitutions), and SDG 17 (partnerships for the goals) [35].
From among all SDGs, a set of goals was selected that is related to environmental sustainability:SDG 6, SDG 7, SDG 13, SDG 14, and SDG 15. This set was next incorporated into a novelmethodological approach towards assessment alongside the general averaging (ASDI—AveragingSustainable Development Index) and normalized (NSDI—Normalized Sustainable Development Index)indexes. The relative weight of the overall index varied depending on the number of indicatorsassigned to one of the key components of sustainable development.
Given that each index has different units and values, all units were normalized to a range from 0to 1, where 0 is the least stable goal and 1 is the most stable goal for each country. Equation (1) is asimple expression used to normalize each index.
IndexJ =In
n∑i=1
INij =In
n∑i=1
( Ii j − Ii jmin
Ii jmax − Ii jmin
)(1)
I represents the sustainability index found for a specific goal; and N represents the normalizedvalue; i indicates the type of the index; j represents the country, and n represents the number ofindicators. In this study, five indicators were used (SDG 6, SDG 7, SDG 13, SDG 14, and SDG 15),therefore n = 5.
Sustainability 2020, 12, 6571 5 of 13
Sustainability 2020, 12, x FOR PEER REVIEW 4 of 13
contextualization of global objectives at the national level regarding urban development have revealed that the SDG baselines and indicators were not used to the full extent [33]. Particular attention was paid to the development of SDG regional indexes to achieve more limited ultimate goals. Based on the composite index (SDGI) the expediency of its application for the assessment of the implementation of the Action Plan to 2030 was studied [34]. A multi-disciplinary approach is needed to develop indicators of sustainable development. The aim of this study is to investigate the characteristics of a sustainable development assessment methodology being designed in the context of green technology. The methodological proposal is projected to be useful in identifying gaps in the implicit values between indicators and thus in contributing to the acquisition of real results, which are necessary for assessing the potential for green technology development. The level of sustainable development is determined in accordance with a specially designed strategy by using certain sets of indicators. The sets of indicators may not only differ, but also indicate real results. Therefore, this study seeks to compare different systems of indicators with the proposed methodological approach.
The key tasks to achieve the aim of the study are as follows: (1) to explore the link between national development and CO2 emissions; (2) to identify differences between sustainable development indicators accepted in different countries; (3) to establish a connection between environmental development and the overall sustainable development. Furthermore, the study assesses indicators underlying the Normalized Sustainability Index (NSDI). The assessment methodology for sustainable development was found to be dependent on the market conditions.
2. Materials and Methods
Figure 1 presents the methodological framework used in this study. It is based on a Sustainable Development Goals Index (SDGI) consisting of 17 sustainable development goals: SDG 1 (no poverty), SDG 2 (zero hunger), SDG 3 (good health and well-being), SDG 4 (quality education), SDG 5 (gender equality), SDG 6 (clean water and sanitation), SDG 7 (affordable and clean energy), SDG 8 (decent work and economic growth), SDG 9 (industry, innovation and infrastructure), SDG 10 (reduced inequalities), SDG 11 (sustainable cities and communities), SDG 12 (responsible consumption and production), SDG 13 (climate action), SDG 14 (life below water), SDG 15 (life on land), SDG 16 (peace, justice, and strong institutions), and SDG 17 (partnerships for the goals) [35].
SDG 1 SDG 2 SDG 3 SDG 4 SDG 5 SDG 6 SDG 7 SDG 8 SDG 9 SDG 10 SDG 11 SDG 12 SDG 13 SDG 14 SDG 15 SDG 16 SDG 17
SDGI
20 coutries: Denmark, Sweden, Switzerland, South Korea, USA, China, Russian
Federation, Azerbaijan, United Arab Emirates, Kazakhstan, Nicaragua,
Panama, Philippines, Indonesia, India, Tanzania, Pakistan, Ethiopia, Sudan
and Nigeria
Environmental component:
SDG 6, SDG 7, SDG 13, SDG 14 и SDG 15
NSDI Normalized Sustainable
Development Index
АSDI Averaging Sustainable
Development Index
Fossil CO2 and GHG emissions of all world
countries
Regularities and interrelationships of the sustainable
development level of countries
and green technologies
Figure 1. A graphical representation of the process of assessing the relationship between sustainabledevelopment and green technology (developed by the authors).
ASDI was also normalized to the range from 0 to 1 by the following expression:
IndexNJ =I j − I jmin
I jmax − I jmin
(2)
where Index N is the Normalized Sustainable Development Index (NSDI).The deviation between each normalized index and NSDI was calculated by the following formula:
Di =Im
n∑j=I
∣∣∣∣∣∣(I −
INij
INj
)∣∣∣∣∣∣ (3)
where D means deviation.A total of 20 countries of the SDG index were selected to determine the level of sustainable
development. These countries include: Denmark (85.2), Sweden (85), Switzerland (78.8), South Korea(78.3), USA (74.5), China (73.2), Russian Federation (70.9), Azerbaijan (70.5), United Arab Emirates(69.7), Kazakhstan (68.7), Nicaragua (67.9), Panama (66.3), Philippines (64.9), Indonesia (64.2), India(61.1), Tanzania (55.8), Pakistan (55.6), Ethiopia (53.2), Sudan (51.4), and Nigeria (46.4) [35]. The sampleembraces countries with scores ranging from very high to low in order to identify patterns andcorrelations between the country’s level of sustainable development and the green technologies.The location of the country was also considered.
3. Results
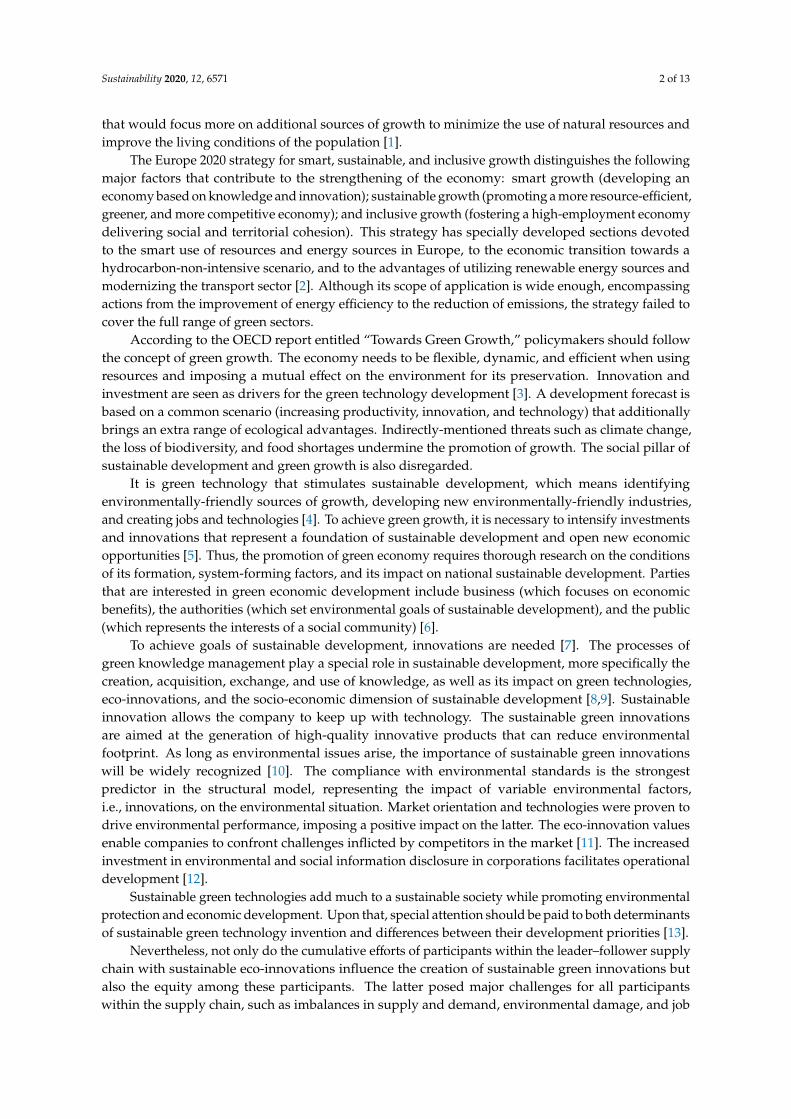
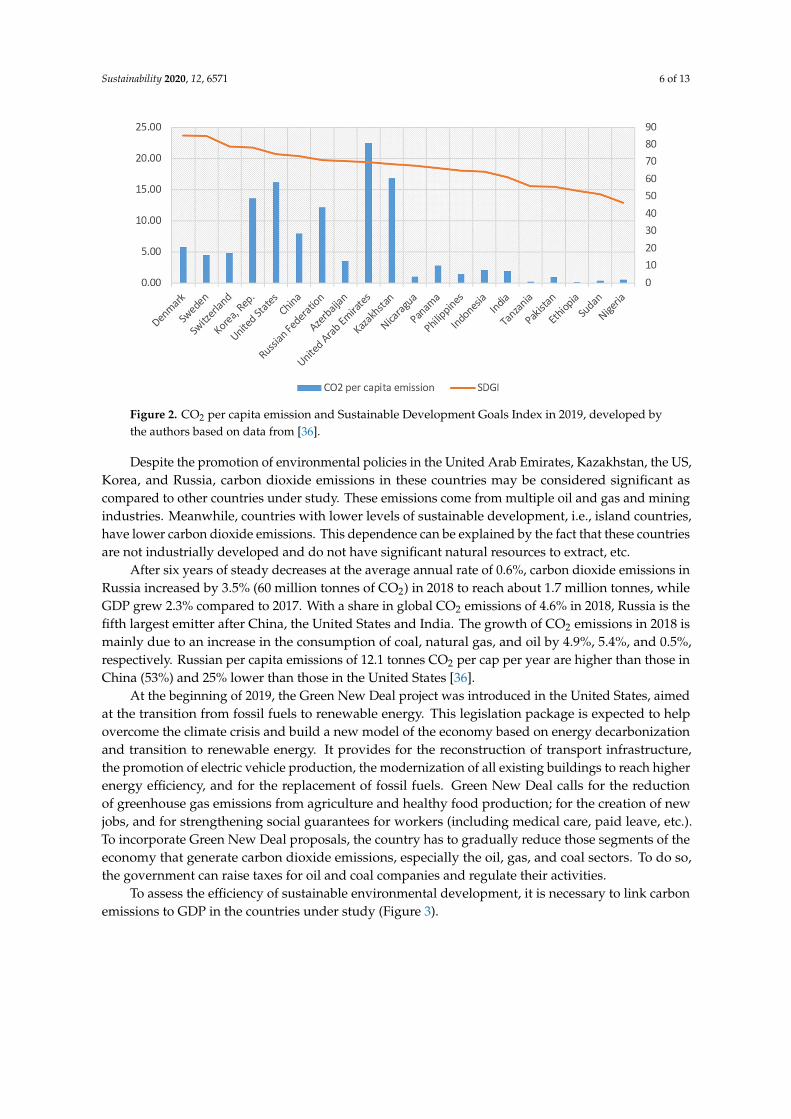
All countries, regardless of their access to natural resources and geopolitical position,face challenges while moving towards sustainability, e.g., the exhaustion of natural resources andclimate change. In environmental sustainability analysis, carbon dioxide emissions are among themost important indicators (Figure 2).
Sustainability 2020, 12, 6571 6 of 13Sustainability 2020, 12, x FOR PEER REVIEW 6 of 13
Figure 2. CO2 per capita emission and Sustainable Development Goals Index in 2019, developed by the authors based on data from [36].
Despite the promotion of environmental policies in the United Arab Emirates, Kazakhstan, the US, Korea, and Russia, carbon dioxide emissions in these countries may be considered significant as compared to other countries under study. These emissions come from multiple oil and gas and mining industries. Meanwhile, countries with lower levels of sustainable development, i.e., island countries, have lower carbon dioxide emissions. This dependence can be explained by the fact that these countries are not industrially developed and do not have significant natural resources to extract, etc.
After six years of steady decreases at the average annual rate of 0.6%, carbon dioxide emissions in Russia increased by 3.5% (60 million tonnes of CO2) in 2018 to reach about 1.7 million tonnes, while GDP grew 2.3% compared to 2017. With a share in global CO2 emissions of 4.6% in 2018, Russia is the fifth largest emitter after China, the United States and India. The growth of CO2 emissions in 2018 is mainly due to an increase in the consumption of coal, natural gas, and oil by 4.9%, 5.4%, and 0.5%, respectively. Russian per capita emissions of 12.1 tonnes CO2 per cap per year are higher than those in China (53%) and 25% lower than those in the United States [36].
At the beginning of 2019, the Green New Deal project was introduced in the United States, aimed at the transition from fossil fuels to renewable energy. This legislation package is expected to help overcome the climate crisis and build a new model of the economy based on energy decarbonization and transition to renewable energy. It provides for the reconstruction of transport infrastructure, the promotion of electric vehicle production, the modernization of all existing buildings to reach higher energy efficiency, and for the replacement of fossil fuels. Green New Deal calls for the reduction of greenhouse gas emissions from agriculture and healthy food production; for the creation of new jobs, and for strengthening social guarantees for workers (including medical care, paid leave, etc.). To incorporate Green New Deal proposals, the country has to gradually reduce those segments of the economy that generate carbon dioxide emissions, especially the oil, gas, and coal sectors. To do so, the government can raise taxes for oil and coal companies and regulate their activities.
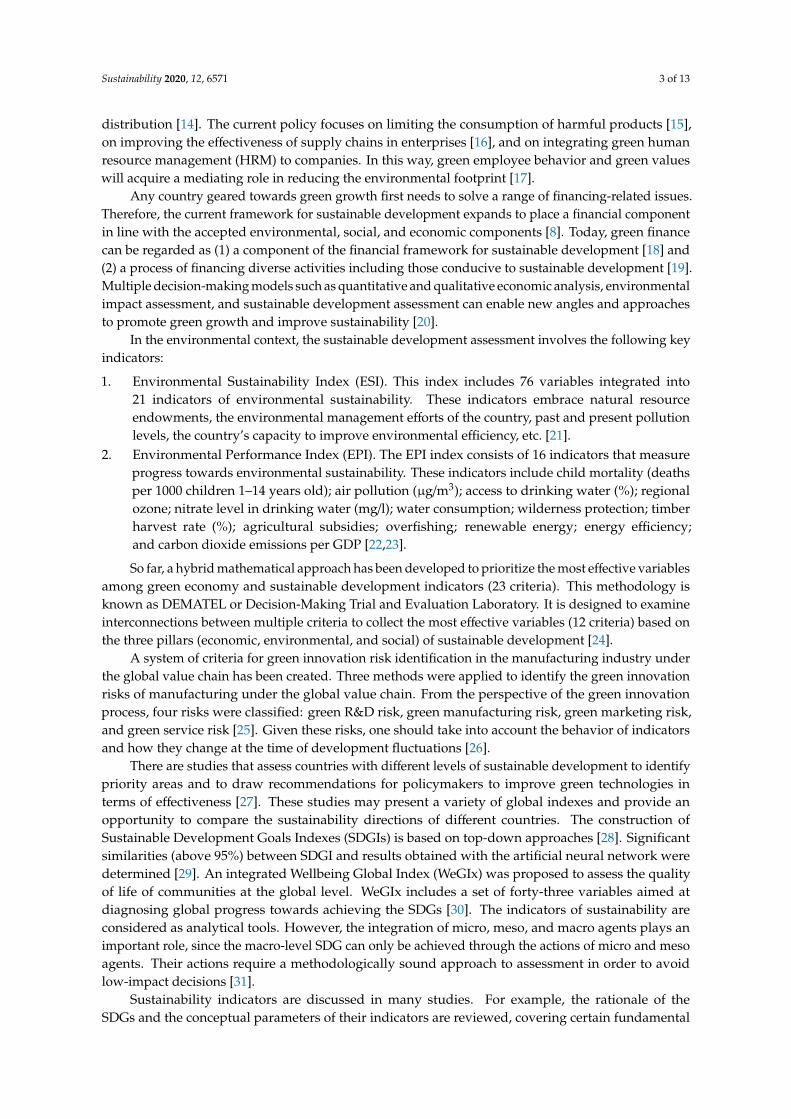
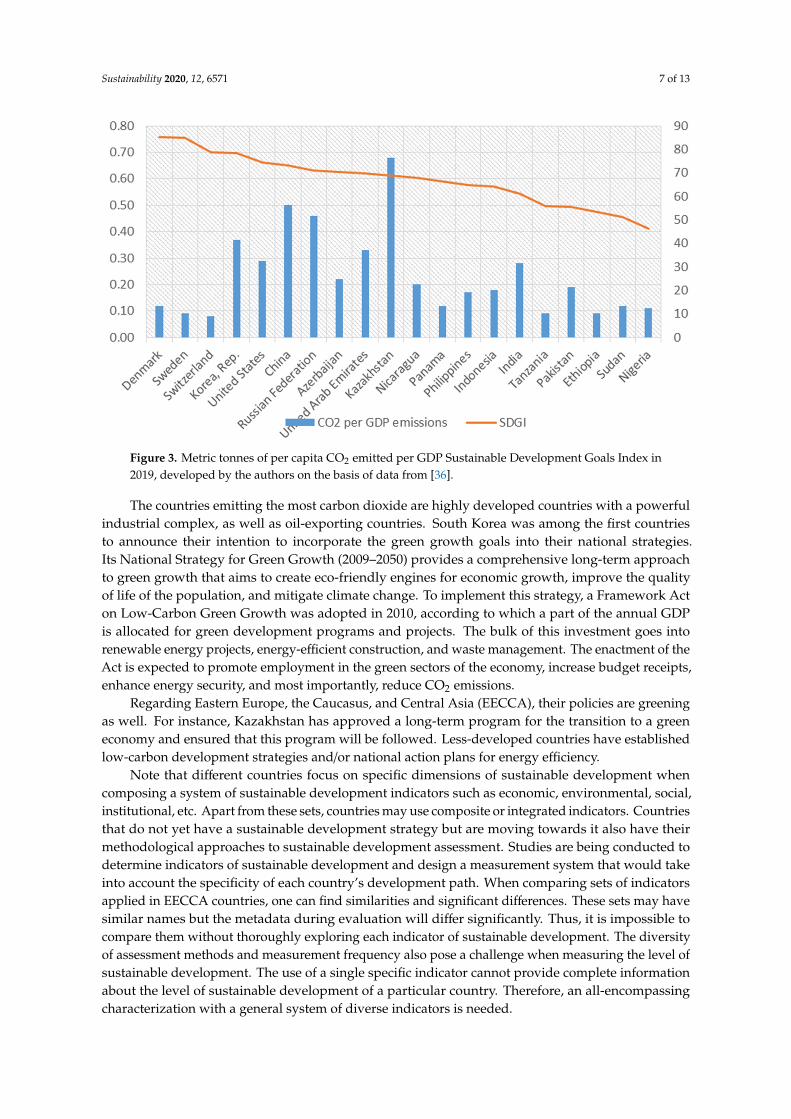
To assess the efficiency of sustainable environmental development, it is necessary to link carbon emissions to GDP in the countries under study (Figure 3).
The countries emitting the most carbon dioxide are highly developed countries with a powerful industrial complex, as well as oil-exporting countries. South Korea was among the first countries to announce their intention to incorporate the green growth goals into their national strategies. Its National Strategy for Green Growth (2009-2050) provides a comprehensive long-term approach to green growth that aims to create eco-friendly engines for economic growth, improve the quality of life of the population, and mitigate climate change. To implement this strategy, a Framework Act on
Figure 2. CO2 per capita emission and Sustainable Development Goals Index in 2019, developed bythe authors based on data from [36].
Despite the promotion of environmental policies in the United Arab Emirates, Kazakhstan, the US,Korea, and Russia, carbon dioxide emissions in these countries may be considered significant ascompared to other countries under study. These emissions come from multiple oil and gas and miningindustries. Meanwhile, countries with lower levels of sustainable development, i.e., island countries,have lower carbon dioxide emissions. This dependence can be explained by the fact that these countriesare not industrially developed and do not have significant natural resources to extract, etc.
After six years of steady decreases at the average annual rate of 0.6%, carbon dioxide emissions inRussia increased by 3.5% (60 million tonnes of CO2) in 2018 to reach about 1.7 million tonnes, whileGDP grew 2.3% compared to 2017. With a share in global CO2 emissions of 4.6% in 2018, Russia is thefifth largest emitter after China, the United States and India. The growth of CO2 emissions in 2018 ismainly due to an increase in the consumption of coal, natural gas, and oil by 4.9%, 5.4%, and 0.5%,respectively. Russian per capita emissions of 12.1 tonnes CO2 per cap per year are higher than those inChina (53%) and 25% lower than those in the United States [36].
At the beginning of 2019, the Green New Deal project was introduced in the United States, aimedat the transition from fossil fuels to renewable energy. This legislation package is expected to helpovercome the climate crisis and build a new model of the economy based on energy decarbonizationand transition to renewable energy. It provides for the reconstruction of transport infrastructure,the promotion of electric vehicle production, the modernization of all existing buildings to reach higherenergy efficiency, and for the replacement of fossil fuels. Green New Deal calls for the reductionof greenhouse gas emissions from agriculture and healthy food production; for the creation of newjobs, and for strengthening social guarantees for workers (including medical care, paid leave, etc.).To incorporate Green New Deal proposals, the country has to gradually reduce those segments of theeconomy that generate carbon dioxide emissions, especially the oil, gas, and coal sectors. To do so,the government can raise taxes for oil and coal companies and regulate their activities.
To assess the efficiency of sustainable environmental development, it is necessary to link carbonemissions to GDP in the countries under study (Figure 3).
Sustainability 2020, 12, 6571 7 of 13
Sustainability 2020, 12, x FOR PEER REVIEW 7 of 13
Low-Carbon Green Growth was adopted in 2010, according to which a part of the annual GDP is allocated for green development programs and projects. The bulk of this investment goes into renewable energy projects, energy-efficient construction, and waste management. The enactment of the Act is expected to promote employment in the green sectors of the economy, increase budget receipts, enhance energy security, and most importantly, reduce CO2 emissions.
Figure 3. Metric tonnes of per capita CO2 emitted per GDP Sustainable Development Goals Index in 2019, developed by the authors on the basis of data from [36].
Regarding Eastern Europe, the Caucasus, and Central Asia (EECCA), their policies are greening as well. For instance, Kazakhstan has approved a long-term program for the transition to a green economy and ensured that this program will be followed. Less-developed countries have established low-carbon development strategies and/or national action plans for energy efficiency.
Note that different countries focus on specific dimensions of sustainable development when composing a system of sustainable development indicators such as economic, environmental, social, institutional, etc. Apart from these sets, countries may use composite or integrated indicators. Countries that do not yet have a sustainable development strategy but are moving towards it also have their methodological approaches to sustainable development assessment. Studies are being conducted to determine indicators of sustainable development and design a measurement system that would take into account the specificity of each country’s development path. When comparing sets of indicators applied in EECCA countries, one can find similarities and significant differences. These sets may have similar names but the metadata during evaluation will differ significantly. Thus, it is impossible to compare them without thoroughly exploring each indicator of sustainable development. The diversity of assessment methods and measurement frequency also pose a challenge when measuring the level of sustainable development. The use of a single specific indicator cannot provide complete information about the level of sustainable development of a particular country. Therefore, an all-encompassing characterization with a general system of diverse indicators is needed.
Given the importance and impact of environmental sustainability, it is necessary to study interconnections between its growth and the overall level of sustainable development in the country. For doing so, the indicators of green technology development were separated from the overall index of sustainable development, i.e., SDG 6 (providing availability and sustainable management of water and sanitation), SDG 7 (ensuring access to affordable, reliable, sustainable and modern energy), SDG
Figure 3. Metric tonnes of per capita CO2 emitted per GDP Sustainable Development Goals Index in2019, developed by the authors on the basis of data from [36].
The countries emitting the most carbon dioxide are highly developed countries with a powerfulindustrial complex, as well as oil-exporting countries. South Korea was among the first countriesto announce their intention to incorporate the green growth goals into their national strategies.Its National Strategy for Green Growth (2009–2050) provides a comprehensive long-term approachto green growth that aims to create eco-friendly engines for economic growth, improve the qualityof life of the population, and mitigate climate change. To implement this strategy, a Framework Acton Low-Carbon Green Growth was adopted in 2010, according to which a part of the annual GDPis allocated for green development programs and projects. The bulk of this investment goes intorenewable energy projects, energy-efficient construction, and waste management. The enactment of theAct is expected to promote employment in the green sectors of the economy, increase budget receipts,enhance energy security, and most importantly, reduce CO2 emissions.
Regarding Eastern Europe, the Caucasus, and Central Asia (EECCA), their policies are greeningas well. For instance, Kazakhstan has approved a long-term program for the transition to a greeneconomy and ensured that this program will be followed. Less-developed countries have establishedlow-carbon development strategies and/or national action plans for energy efficiency.
Note that different countries focus on specific dimensions of sustainable development whencomposing a system of sustainable development indicators such as economic, environmental, social,institutional, etc. Apart from these sets, countries may use composite or integrated indicators. Countriesthat do not yet have a sustainable development strategy but are moving towards it also have theirmethodological approaches to sustainable development assessment. Studies are being conducted todetermine indicators of sustainable development and design a measurement system that would takeinto account the specificity of each country’s development path. When comparing sets of indicatorsapplied in EECCA countries, one can find similarities and significant differences. These sets may havesimilar names but the metadata during evaluation will differ significantly. Thus, it is impossible tocompare them without thoroughly exploring each indicator of sustainable development. The diversityof assessment methods and measurement frequency also pose a challenge when measuring the level ofsustainable development. The use of a single specific indicator cannot provide complete informationabout the level of sustainable development of a particular country. Therefore, an all-encompassingcharacterization with a general system of diverse indicators is needed.
Sustainability 2020, 12, 6571 8 of 13
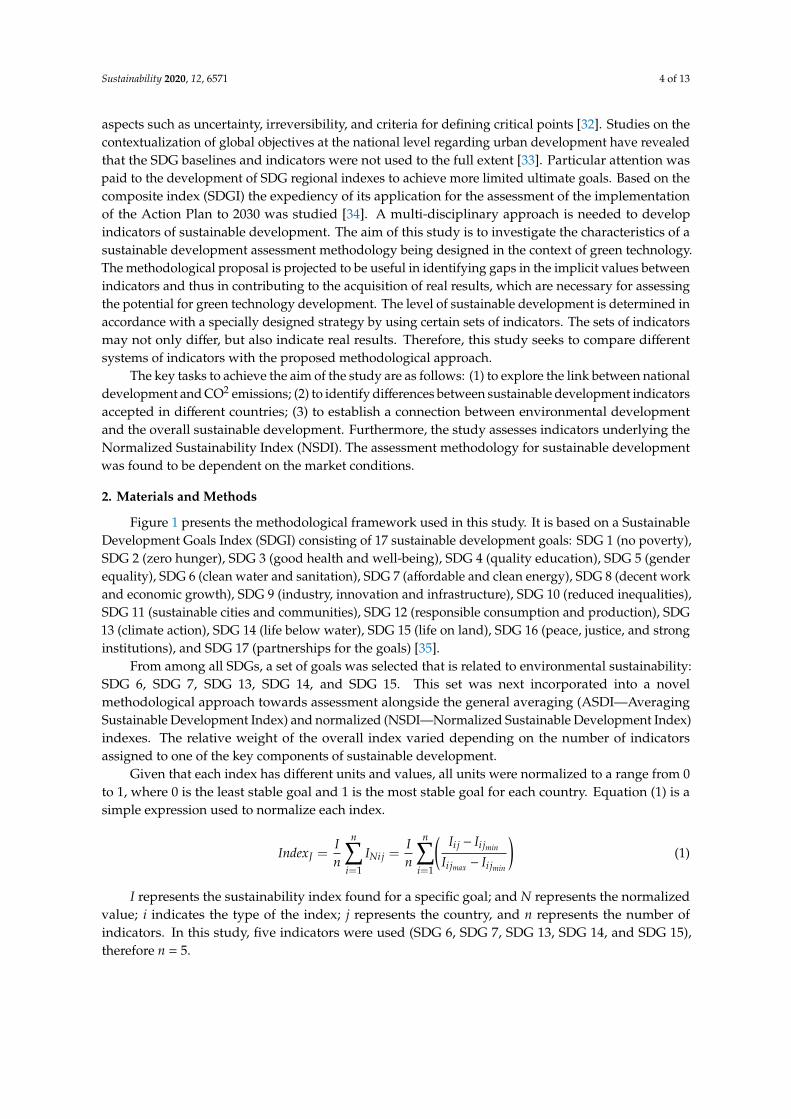
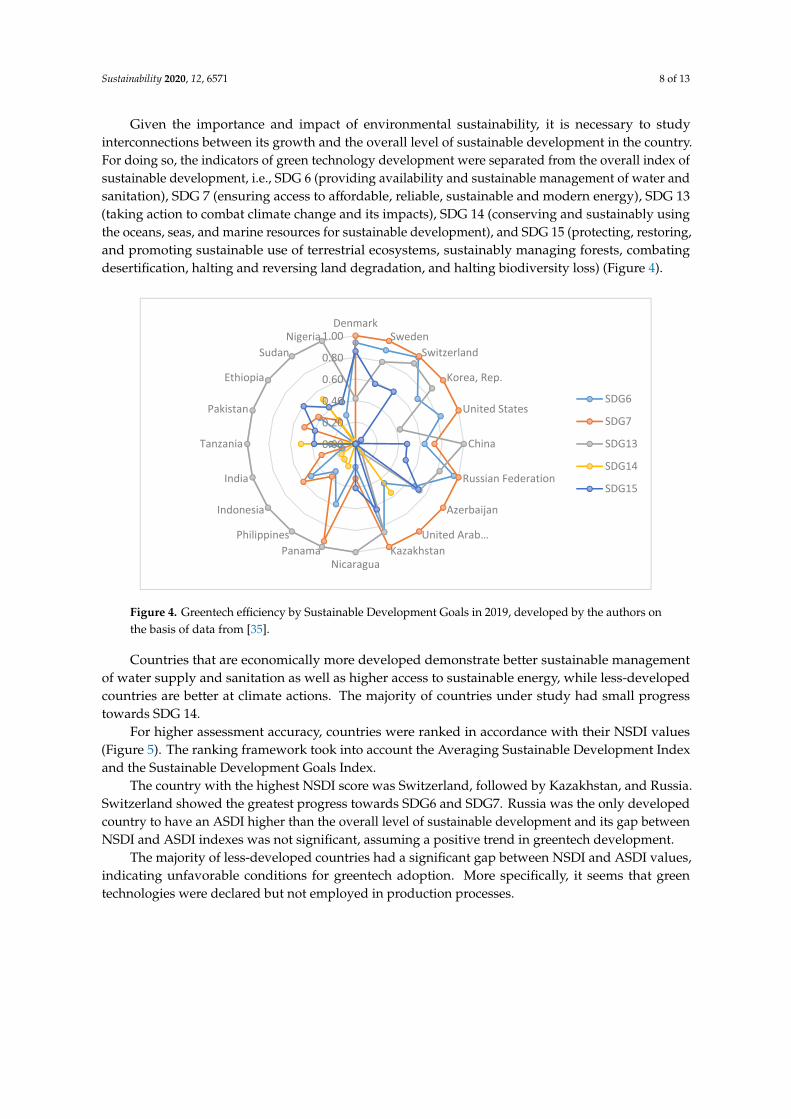
Given the importance and impact of environmental sustainability, it is necessary to studyinterconnections between its growth and the overall level of sustainable development in the country.For doing so, the indicators of green technology development were separated from the overall index ofsustainable development, i.e., SDG 6 (providing availability and sustainable management of water andsanitation), SDG 7 (ensuring access to affordable, reliable, sustainable and modern energy), SDG 13(taking action to combat climate change and its impacts), SDG 14 (conserving and sustainably usingthe oceans, seas, and marine resources for sustainable development), and SDG 15 (protecting, restoring,and promoting sustainable use of terrestrial ecosystems, sustainably managing forests, combatingdesertification, halting and reversing land degradation, and halting biodiversity loss) (Figure 4).
Sustainability 2020, 12, x FOR PEER REVIEW 8 of 13
13 (taking action to combat climate change and its impacts), SDG 14 (conserving and sustainably using the oceans, seas, and marine resources for sustainable development), and SDG 15 (protecting, restoring, and promoting sustainable use of terrestrial ecosystems, sustainably managing forests, combating desertification, halting and reversing land degradation, and halting biodiversity loss) (Figure 4).
Figure 4. Greentech efficiency by Sustainable Development Goals in 2019, developed by the authors on the basis of data from [35].
Countries that are economically more developed demonstrate better sustainable management of water supply and sanitation as well as higher access to sustainable energy, while less-developed countries are better at climate actions. The majority of countries under study had small progress towards SDG 14.
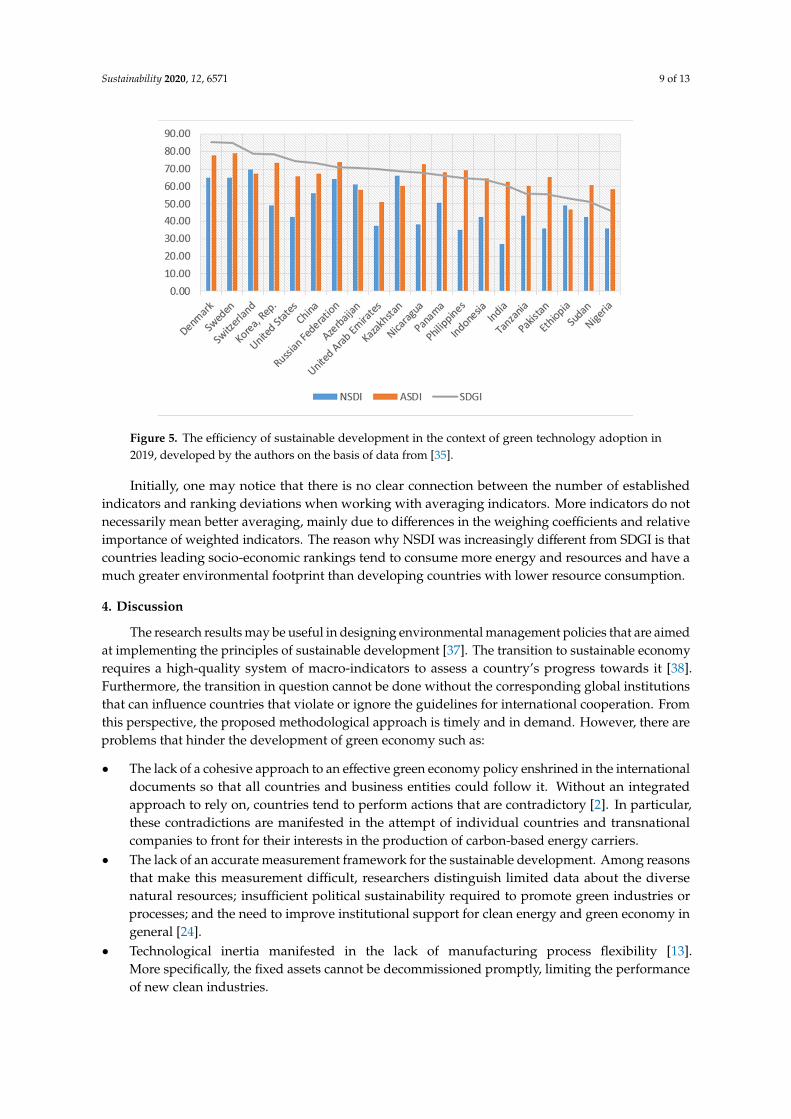
For higher assessment accuracy, countries were ranked in accordance with their NSDI values (Figure 5). The ranking framework took into account the Averaging Sustainable Development Index and the Sustainable Development Goals Index.
Figure 5. The efficiency of sustainable development in the context of green technology adoption in 2019, developed by the authors on the basis of data from [35].
0.00
0.20
0.40
0.60
0.80
1.00Denmark
SwedenSwitzerland
Korea, Rep.
United States
China
Russian Federation
Azerbaijan
United Arab…Kazakhstan
NicaraguaPanama
Philippines
Indonesia
India
Tanzania
Pakistan
Ethiopia
SudanNigeria
SDG6
SDG7
SDG13
SDG14
SDG15
Figure 4. Greentech efficiency by Sustainable Development Goals in 2019, developed by the authors onthe basis of data from [35].
Countries that are economically more developed demonstrate better sustainable managementof water supply and sanitation as well as higher access to sustainable energy, while less-developedcountries are better at climate actions. The majority of countries under study had small progresstowards SDG 14.
For higher assessment accuracy, countries were ranked in accordance with their NSDI values(Figure 5). The ranking framework took into account the Averaging Sustainable Development Indexand the Sustainable Development Goals Index.
The country with the highest NSDI score was Switzerland, followed by Kazakhstan, and Russia.Switzerland showed the greatest progress towards SDG6 and SDG7. Russia was the only developedcountry to have an ASDI higher than the overall level of sustainable development and its gap betweenNSDI and ASDI indexes was not significant, assuming a positive trend in greentech development.
The majority of less-developed countries had a significant gap between NSDI and ASDI values,indicating unfavorable conditions for greentech adoption. More specifically, it seems that greentechnologies were declared but not employed in production processes.
Sustainability 2020, 12, 6571 9 of 13
Sustainability 2020, 12, x FOR PEER REVIEW 8 of 13
13 (taking action to combat climate change and its impacts), SDG 14 (conserving and sustainably using the oceans, seas, and marine resources for sustainable development), and SDG 15 (protecting, restoring, and promoting sustainable use of terrestrial ecosystems, sustainably managing forests, combating desertification, halting and reversing land degradation, and halting biodiversity loss) (Figure 4).
Figure 4. Greentech efficiency by Sustainable Development Goals in 2019, developed by the authors on the basis of data from [35].
Countries that are economically more developed demonstrate better sustainable management of water supply and sanitation as well as higher access to sustainable energy, while less-developed countries are better at climate actions. The majority of countries under study had small progress towards SDG 14.
For higher assessment accuracy, countries were ranked in accordance with their NSDI values (Figure 5). The ranking framework took into account the Averaging Sustainable Development Index and the Sustainable Development Goals Index.
Figure 5. The efficiency of sustainable development in the context of green technology adoption in 2019, developed by the authors on the basis of data from [35].
0.00
0.20
0.40
0.60
0.80
1.00Denmark
SwedenSwitzerland
Korea, Rep.
United States
China
Russian Federation
Azerbaijan
United Arab…Kazakhstan
NicaraguaPanama
Philippines
Indonesia
India
Tanzania
Pakistan
Ethiopia
SudanNigeria
SDG6
SDG7
SDG13
SDG14
SDG15
Figure 5. The efficiency of sustainable development in the context of green technology adoption in2019, developed by the authors on the basis of data from [35].
Initially, one may notice that there is no clear connection between the number of establishedindicators and ranking deviations when working with averaging indicators. More indicators do notnecessarily mean better averaging, mainly due to differences in the weighing coefficients and relativeimportance of weighted indicators. The reason why NSDI was increasingly different from SDGI is thatcountries leading socio-economic rankings tend to consume more energy and resources and have amuch greater environmental footprint than developing countries with lower resource consumption.
4. Discussion
The research results may be useful in designing environmental management policies that are aimedat implementing the principles of sustainable development [37]. The transition to sustainable economyrequires a high-quality system of macro-indicators to assess a country’s progress towards it [38].Furthermore, the transition in question cannot be done without the corresponding global institutionsthat can influence countries that violate or ignore the guidelines for international cooperation. Fromthis perspective, the proposed methodological approach is timely and in demand. However, there areproblems that hinder the development of green economy such as:
• The lack of a cohesive approach to an effective green economy policy enshrined in the internationaldocuments so that all countries and business entities could follow it. Without an integratedapproach to rely on, countries tend to perform actions that are contradictory [2]. In particular,these contradictions are manifested in the attempt of individual countries and transnationalcompanies to front for their interests in the production of carbon-based energy carriers.
• The lack of an accurate measurement framework for the sustainable development. Among reasonsthat make this measurement difficult, researchers distinguish limited data about the diversenatural resources; insufficient political sustainability required to promote green industries orprocesses; and the need to improve institutional support for clean energy and green economy ingeneral [24].
• Technological inertia manifested in the lack of manufacturing process flexibility [13].More specifically, the fixed assets cannot be decommissioned promptly, limiting the performanceof new clean industries.
Sustainability 2020, 12, 6571 10 of 13
The normalized NSDI index allows determining progress towards sustainability greatly facilitatedby green technologies. Greentech expands the range of available options and potential strategies forachieving sustainable development goals such as clean water and sanitation, affordable and cleanenergy, climate action, and life below water and on land while reducing the costs of their implementationover time [14]. However, green technologies are not created, developed, or implemented on their own.Their progress depends on the market structure, demand, the ability of countries to introduce them,and most importantly, on government assistance (in particular, fiscal and financial support).
The proposed approach could be incorporated into a toolkit for assessing the effectiveness of greeneconomy in the context of investment decision-making. A green economy today offers substantialand safe investment opportunities. It accounts for 6% of the global stock market (about 4 trillion USdollars) coming from the clean energy, energy efficiency, water supply, waste management, and so on.If a sustainable economy maintains its current course, it can hit about 90 trillion US dollars in greeninvestments, reaching approximately 10% of the global market value by 2030 [35,36].
The identification of gaps between NSDI, ASDI, and SDGI values helps in finding real opportunitiesfor green technology development. This process should take the impact of globalization on sustainabledevelopment and environmental policies into account. In China, for example, the twelfth Five-YearPlan shifted R&D priorities from renewable energy to pollution control and other sustainable greentechnologies [13,39,40]. However, the proposed approach limited by the baseline data, which allow forthe macro-level assessment only. Considering that green and lean practices are becoming a criticalapproach for organizations in achieving sustainable development and improving organizationalperformance, it is reasonable to assess the lean and green impact on the overall outcome of theenterprise [31]. It is therefore appropriate to incorporate the proposed methodological approachinto an integrated framework that promotes cross-sectoral integration, the use of local (regional)practices and knowledge, the promotion of stakeholder engagement and the empowerment of localorganizations [41,42].
There is a need to use indicators for both general innovation capabilities and specific greentechnology capabilities including the normalized NSDI index. It is possible to expand the list oftarget countries to include their integration strategies and partnerships [7]. As most developingcountries are at a very early stage of industrial development, a total leapfrogging to a greener industrialbase is possible. This may affect the scores on NSDI, ASDI, and SDGI. Technical assistance andcapacity-building support from multilateral banks and international development institutions willcertainly play a decisive role in this regard [10]. Not only economic incentives are needed to switchto cleaner technologies but also a stronger action to promote job creation relative to environmentalactivities, which is essential for a full achievement of sustainable development goals [9].
The novelty of this study is that it offers a methodology for assessing sustainable developmentin the context of green technology enhancement while avoiding those errors that may emerge whenusing NSDI and ASDI indexes alone. This methodology facilitates the implementation of SDGs duringtransition to a green economy. In countries where the interests of companies operating in the browneconomy are a priority, the transition to green technologies may result in the loss of income and jobs inthe brown industries [43].
The future study can focus on factors affecting the acceleration of green technology adoption.These factors may be associated with the adaptive capacity to financial [8], social, economic, and culturalregulations, and with the availability of technological resources [6].
5. Conclusions
Countries emitting the most carbon dioxide are highly developed countries with a powerfulindustrial complex, as well as oil-exporting countries. In the United Arab Emirates, Kazakhstan,the US, Korea, and Russia, carbon dioxide emissions are higher than those in other countries understudy. These emissions come from multiple oil, gas, and mining industries. Meanwhile, countries withlower levels of sustainable development, i.e., island countries, have less significant natural resources to
Sustainability 2020, 12, 6571 11 of 13
extract and hence emit less carbon dioxide. Each country has its own characteristics originating fromits development path, geographical location, and richness in natural resources. Therefore, greeningscenarios may vary depending on the country.
Following the proposed methodological approach based on the Sustainable Development GoalsIndex (SDGI), in particular its environmental component, a connection between environmentaldevelopment and the overall sustainable development was established. The ecology-related indicatorsunderlay the Averaging Sustainable Development Index (ASDI) and the Normalized SustainableDevelopment Index (NSDI). Countries that are economically more developed show progress towardsSDG 6 and SDG 7, while less-developed countries are better at climate actions. The majority ofcountries under study had small progress towards SDG 14. The country with the highest NSDI scorewas Switzerland, followed by Kazakhstan, and Russia. Switzerland showed the greatest progresstowards sustainable management of water and sanitation, and towards sustainable energy. Russia wasthe only developed country to have an ASDI higher that SDGI and its gap between NSDI and ASDIindexes was not significant, assuming a positive trend in greentech development. The majority ofless-developed countries had a significant gap between NSDI and ASDI values, indicating unfavorableconditions for greentech adoption.
The majority of less-developed countries had a significant gap between NSDI and ASDI values,indicating unfavorable conditions for greentech adoption. Initially, no clear connection betweenthe number of averaging indicators and ranking deviations can be found. More indicators do notnecessarily mean better averaging. The reason why NSDI was increasingly different from SDGI is thatcountries leading socio-economic rankings had higher consumption of energy and resources and amuch greater environmental footprint than those countries that consumed less.
Strategies and legislative acts adopted by countries need to clearly interpret sustainabledevelopment in the context of green economy and follow the recognized international standards.Countries should continue to improve their national strategies to define a clear vision, specific goals,a sequence of actions and ways to fulfill their commitments.
Countries need clearly defined action programs and indicators to monitor sustainable developmentand green growth. The transition to green technologies should consolidate global trends in increasingwell-being of people and their social equality while reducing environmental risks. The success ofthis course depends on countries’ efforts to increase public investment and spending; introduceenvironmental taxes and approaches (that compensate for the insufficient impact of market institutions)to reduce the environmental footprint of industries; prohibit environmentally harmful subsidies; andimprove the legal regulation framework for environmental protection.
A limitation of the proposed approach is the baseline data, which only allow for the macro-levelassessment. The approach may be incorporated into a comprehensive framework that facilitatescross-sectoral integration, the use of local (regional) practices and knowledge, stakeholder engagement,and the empowerment of organizations.
Author Contributions: Conceptualization, M.G., V.G. and M.E.; methodology, J.N.-G.; software, J.N.-G.; validation,V.G. and M.E.; formal analysis, M.G. and J.N.-G.; investigation, M.E.; resources, V.G.; data curation, M.E.;writing—original draft preparation, M.G., V.G. and M.E.; writing—review and editing, J.N.-G.; visualization, V.G.;funding acquisition, M.G. All authors have read and agreed to the published version of the manuscript.
Funding: Minjian Guo was funded by Qingdao Social Science Planning Research Project: “Strategic Research onThe Practice of Green Development Concept in Qingdao cultural Industry” and Shandong Social Science PlanningResearch Project: [19CWYJ26, 17CQRJ07].
Acknowledgments: Mariya Egorova was supported by Tomsk Polytechnic University within the framework ofTomsk Polytechnic University Competitiveness Enhancement Program.
Conflicts of Interest: The authors declare no conflicts of interest.
Sustainability 2020, 12, 6571 12 of 13
References
1. Vargas-Hernández, J.G. Strategic transformational transition of green economy, green growth and sustainabledevelopment: An institutional approach. Int. J. Environ. Sustain. Green Technol. 2020, 11, 34–56. [CrossRef]
2. Silander, D. The European Commission and Europe 2020: Smart, sustainable and inclusive growth. In Smart,Sustainable and Inclusive Growth; Karlsson, C., Silander, D., Pircher, B., Eds.; Edward Elgar Publishing:Cheltenham, UK, 2019; pp. 2–35.
3. Rosenbaum, E. Green growth-magic bullet or damp squib? Sustainability 2017, 9, 1092. [CrossRef]4. Ghisetti, C.; Quatraro, F. Green technologies and environmental productivity: A cross-sectoral analysis of
direct and indirect effects in Italian regions. Ecol. Econ. 2017, 132, 1–13. [CrossRef]5. Przychodzen, W.; Leyva-de la Hiz, D.I.; Przychodzen, J. First-mover advantages in green
innovation—Opportunities and threats for financial performance: A longitudinal analysis. Corp. Soc.Responsib. Environ. Manag. 2020, 27, 339–357. [CrossRef]
6. Ramdhani, M.A.; Aulawi, H.; Ikhwana, A.; Mauluddin, Y. Model of green technology adaptation in smalland medium-sized tannery industry. J. Eng. Appl. Sci. 2017, 12, 954–962.
7. Walz, R.; Pfaff, M.; Marscheider-Weidemann, F.; Glöser-Chahoud, S. Innovations for reaching the greensustainable development goals–where will they come from? Int. Econ. Econ. Policy 2017, 14, 449–480.[CrossRef]
8. Abbas, J.; Sagsan, M. Impact of knowledge management practices on green innovation and corporatesustainable development: A structural analysis. J. Clean. Prod. 2019, 229, 611–620. [CrossRef]
9. Aldieri, L.; Vinci, C.P. Green economy and sustainable development: The economic impact of innovation onemployment. Sustainability 2018, 10, 3541. [CrossRef]
10. Hyung, K.; Baral, P. Use of innovative public policy instruments to establish and enhance the linkage betweengreen technology and finance. In Handbook of Green Finance: Energy Security and Sustainable Development;Sachs, J.D., Woo, W.T., Yoshino, N., Taghizadeh-Hesary, F., Eds.; Springer: Singapore, 2019; pp. 1–24.
11. Fernando, Y.; Wah, W.X. The impact of eco-innovation drivers on environmental performance: Empiricalresults from the green technology sector in Malaysia. Sustain. Prod. Consum. 2017, 12, 27–43. [CrossRef]
12. Ayu, M.; Gamayuni, R.R.; Urbanski, M. The impact of environmental and social costs disclosure on financialperformance mediating by earning management. Pol. J. Manag. Stud 2020, 21, 74–86.
13. Fujii, H.; Managi, S. Decomposition analysis of sustainable green technology inventions in China.Technol. Forecast. Soc. Chang. 2019, 139, 10–16. [CrossRef]
14. Du, B.; Liu, Q.; Li, G. Coordinating leader-follower supply chain with sustainable green technology innovationon their fairness concerns. Int. J. Environ. Res. Public Health 2017, 14, 1357. [CrossRef] [PubMed]
15. Slusarczyk, B.; Kot, S. Solution for sustainable development: Provisions limiting the consumption ofdisposable plastic carrier bags in Poland. J. Secur. Sustain. Issues 2018, 7, 449–458. [CrossRef]
16. Kot, S.; Goldbach, I.R.; Slusarczyk, B. Supply chain management in SMES—Polish and Romanian approach.Econ. Sociol. 2018, 11, 142–156. [CrossRef]
17. Andjarwati, T.; Budiarti, E.; Audah, A.K.; Khouri, S.; Rebilas, R. The impact of green human resourcemanagement to gain enterprise sustainability. Pol. J. Manag. Stud 2019, 20, 93–103.
18. Janicka, M. Financing sustainable growth and building the capital markets union in the European Union.Argum. Oeconomica Crac. 2020, 2, 81–96. [CrossRef]
19. Maltais, A.; Nykvist, B. Understanding the role of green bonds in advancing sustainability. J. Sustain. Financ.Investig. 2020, 1, 1–20. [CrossRef]
20. Zhang, N.; Gong, Z.; Yin, K.; Wang, Y. Special issue “Decision models in green growth and sustainabledevelopment”. Int. J. Environ. Res. Public Health 2018, 15, 1093. [CrossRef]
21. Birgani, M.H.; Moghaddam, R.G. Evaluation of environmental sustainability index (ESI) in the countriesaround the Caspian Sea. Rev. Publicando 2018, 5, 788–816.
22. Garland, R.M.; Naidoo, M.; Sibiya, B.; Oosthuizen, R. Air quality indicators from the EnvironmentalPerformance Index: Potential use and limitations in South Africa. Clean Air J. Tydskr. Skoon Lug 2017, 27,33–41. [CrossRef]
23. Pimonenko, T.; Lyulyov, O.; Chygryn, O.; Palienko, M. Environmental performance index: Relation betweensocial and economic welfare of the countries. Environ. Econ. 2018, 9, 1. [CrossRef]
Sustainability 2020, 12, 6571 13 of 13
24. Khoshnava, S.M.; Rostami, R.; Zin, R.M.; Štreimikiene, D.; Yousefpour, A.; Strielkowski, W.; Mardani, A.Aligning the criteria of green economy (GE) and sustainable development goals (SDGs) to implementsustainable development. Sustainability 2019, 11, 4615. [CrossRef]
25. Sun, Y.; Bi, K.; Yin, S. Measuring and integrating risk management into green innovation practices for greenmanufacturing under the global value chain. Sustainability 2020, 12, 545. [CrossRef]
26. Boichenko, K.S.; Tepliuk, M.A.; Rekova, N.Y.; Stashkevych, I.I.; Morkunas, M. Management of fluctuationof financial and economic integrated development of innovative enterprise. Financ. Credit Act. Probl.Theory Pract. 2019, 3, 2306. [CrossRef]
27. Neofytou, H.; Nikas, A.; Doukas, H. Sustainable energy transition readiness: A multicriteria assessmentindex. Renew. Sustain. Energy Rev. 2020, 131, 109988. [CrossRef]
28. Kwatra, S.; Kumar, A.; Sharma, P. A critical review of studies related to construction and computation ofSustainable Development Indices. Ecol. Indic. 2020, 112, 106061. [CrossRef]
29. Mirghaderi, S.H. Using an artificial neural network for estimating sustainable development goals index.Manag. Environ. Qual. Int. J. 2020, 31, 1023–1037. [CrossRef]
30. Oliveira, G.M.; Vidal, D.G.; Viterbo, L.M.F.; Maia, R.L. Measuring the implementation of SustainableDevelopment Goals at a local level: The WeGIx index. In Universities and Sustainable Communities: Meetingthe Goals of the Agenda 2030; Springer: Cham, Switzerland, 2020; pp. 215–245.
31. Lemke, C.; Bastini, K. Embracing multiple perspectives of sustainable development in a composite measure:The Multilevel Sustainable Development Index. J. Clean. Prod. 2020, 246, 118884. [CrossRef]
32. Virto, L.R. A preliminary assessment of the indicators for Sustainable Development Goal (SDG) 14 “Conserveand sustainably use the oceans, seas and marine resources for sustainable development”. Mar. Policy 2018,98, 47–57. [CrossRef]
33. Koch, F.; Krellenberg, K. How to contextualize SDG 11? Looking at indicators for sustainable urbandevelopment in Germany. ISPRS Int. J. Geo-Inf. 2018, 7, 464. [CrossRef]
34. Diaz-Sarachaga, J.M.; Jato-Espino, D.; Castro-Fresno, D. Is the Sustainable Development Goals (SDG) indexan adequate framework to measure the progress of the 2030 Agenda? Sustain. Dev. 2018, 26, 663–671.[CrossRef]
35. Sachs, J.; Schmidt-Traub, G.; Kroll, C.; Lafortune, G.; Fuller, G. Sustainable development report2019. In Bertelsmann Stiftung and Sustainable Development Solutions Network (SDSN); Publisher:New York, NY, USA, 2019.
36. Crippa, M.; Oreggioni, G.; Guizzardi, D.; Muntean, M.; Schaaf, E.; Lo Vullo, E.; Solazzo, E.;Monforti-Ferrario, F.; Olivier, J.G.J.; Vignati, E. Fossil CO2 and GHG Emissions of all World Countries; PublicationOffice of the European Union: Luxemburg, 2019.
37. Hu, J.; Wang, Z.; Lian, Y.; Huang, Q. Environmental regulation, foreign direct investment and greentechnological progress—Evidence from Chinese manufacturing industries. Int. J. Environ. Res. Public Health2018, 15, 221.
38. Fankhauser, S.; Kazaglis, A.; Srivastav, S. Green growth opportunities for Asia. In Asian Development BankEconomics Working Paper Series No. 508; Asian Development Bank: Mandaluyong City, Philippines, 2017.
39. Hambel, C.; Kraft, H.; der Ploeg, R.V. Asset Pricing and decarbonization: Diversification versus climateaction. In Economics Series Working Papers; Universitat Pompeu Fabra: Barcelona, Spain, 2020; p. 901.
40. Zhang, M.; Duan, F.; Mao, Z. Empirical study on the sustainability of China’s grain quality improvement:The role of transportation, labor, and agricultural machinery. Int. J. Environ. Res. Public Health 2018, 15, 271.[CrossRef] [PubMed]
41. Zhan, Y.; Tan, K.H.; Ji, G.; Chung, L.; Chiu, A.S. Green and lean sustainable development path in China:Guanxi, practices and performance. Resour. Conserv. Recycl. 2018, 128, 240–249. [CrossRef]
42. Kemp, R.; Never, B. Green transition, industrial policy, and economic development. Oxf. Rev. Econ. Policy2017, 33, 66–84. [CrossRef]
43. Ferrara, R. Brown economy, green economy, blue economy: l’economia circolare e il diritto dell’ambiente.In Studi in Tema di Economia Circolare; EUM, Università di Macerataeum: Macerata, Italy, 2019; pp. 1–23.
© 2020 by the authors. Licensee MDPI, Basel, Switzerland. This article is an open accessarticle distributed under the terms and conditions of the Creative Commons Attribution(CC BY) license (http://creativecommons.org/licenses/by/4.0/).