towards green industrial building construction sustainable ...
Upload
khangminh22Category
view
2download
0
sustainability
Article
Evaluating Green Technology Strategies for the SustainableDevelopment of Solar Power Projects: Evidence from Pakistan
Shahid Ali 1, Qingyou Yan 1,2, Muhammad Sajjad Hussain 3, Muhammad Irfan 4,5,6,*, Munir Ahmad 7 ,Asif Razzaq 8, Vishal Dagar 9 and Cem Isık 10
�����������������
Citation: Ali, S.; Yan, Q.; Sajjad
Hussain, M.; Irfan, M.; Ahmad, M.;
Razzaq, A.; Dagar, V.; Isık, C.
Evaluating Green Technology
Strategies for the Sustainable
Development of Solar Power Projects:
Evidence from Pakistan. Sustainability
2021, 13, 12997. https://doi.org/
10.3390/su132312997
Academic Editor:
Enrique Rosales-Asensio
Received: 25 September 2021
Accepted: 16 November 2021
Published: 24 November 2021
Publisher’s Note: MDPI stays neutral
with regard to jurisdictional claims in
published maps and institutional affil-
iations.
Copyright: © 2021 by the authors.
Licensee MDPI, Basel, Switzerland.
This article is an open access article
distributed under the terms and
conditions of the Creative Commons
Attribution (CC BY) license (https://
creativecommons.org/licenses/by/
4.0/).
1 School of Economics and Management, North China Electric Power University, Beijing 102206, China;[email protected] (S.A.); [email protected] (Q.Y.)
2 Beijing Key Laboratory of New Energy and Low-Carbon Development, North China Electric Power University,Beijing 102206, China
3 School of Business Management, Superior University, Lahore 54600, Pakistan; [email protected] School of Management and Economics, Beijing Institute of Technology, Beijing 100081, China5 Centre for Energy and Environmental Policy Research, Beijing Institute of Technology, Beijing 100081, China6 Department of Business Administration, ILMA University, Karachi 75190, Pakistan7 School of Economics, Zhejiang University, Hangzhou 310058, China; [email protected] School of Management and Economics, Dalian University of Technology, Dalian 116024, China;
[email protected] Amity School of Economics, Amity University Uttar Pradesh, Noida 201301, India; [email protected] Faculty of Tourism, Anadolu University, Tepebası-Eskisehir 26470, Turkey; [email protected]* Correspondence: [email protected]; Tel.: +86-156-5207-0825
Abstract: Energy is the main element for a modern lifestyle that must be considered in economicallyreliable and sustainable development dialogues. The financial performance of solar power projectshas become the main issue, especially in developing countries such as Pakistan, where it has gainedthe special attention of government and regulatory authorities. The present study evaluates greentechnology strategies for the sustainable development of solar power projects in Pakistan. We examinethe moderating role of cost and riskiness of the methods between the nexus of capital budgetingtechniques and the financial performance of solar power projects. The analysis is performed on datacollected from 44 respondents (chief financial officers and chief executive officers) by accompanyingan inclusive questionnaire survey. Partial least squares structural equation modeling (PLS-SEM)is used to assess the formulated suppositions. The results reveal that green technology strategiespositively impact the sustainable development of solar power projects. The profitability index isa good source of higher financial performance of the solar power projects. The results furtherdemonstrate that the cost and riskiness of the methods significantly moderate the nexus of capitalbudgeting techniques and the financial performance of solar power projects. These findings providea valuable manual for policymakers, government institutions, and regulators to select the appropriategreen technology strategy to increase cleaner production and sustainable development of solarpower projects.
Keywords: green technology; cleaner production; sustainable development; profitability index;financial performance; solar power projects; Pakistan
1. Introduction
Energy has secured its place as one of the core needs in modern life [1]. It plays afundamental role in improving the standard of living and economic development of acountry [2,3]. Modern life depends on reliable energy resources [4,5]. Proper energy supplyplays a vital role in developing the economy [6]. One of the prime benefits of reliableenergy sources is eliminating the need and usage of fossil fuel, i.e., coal, oil, and natural gasfor electricity generation [7]. Besides, it is helpful for countries that do not have electricityaccess [8,9].
Sustainability 2021, 13, 12997. https://doi.org/10.3390/su132312997 https://www.mdpi.com/journal/sustainability

Sustainability 2021, 13, 12997 2 of 29
Recently, the energy demand has tremendously increased, and it is considered oneof the world’s crucial problems [10]. Energy shortage seriously affects people’s lives, pro-fessional and non-professional activities [11]. The governments of developing countriesare facilitating renewable energy expansion with policy strategies [12]. Similar to otherdeveloping countries, Pakistan requires massive energy to support its industry and largepopulation [13]. The electricity gap between demand and supply has been uncontrolled inthe past few years. The country faces the worst load shedding during the summer season,i.e., 10–12 h per day in urban areas and 16–18 h per day in rural areas [14]. Pakistan isconsidered an energy-deficient country [13]. In Pakistan, the available energy productionsources are not enough to satisfy the country’s increasing energy demands. In the pre-ceding years, the country’s power sector focused on generating energy from hydropowersources. Later, until 1994, the only electricity producer in the country was Water and PowerDevelopment Authority (WAPDA) [15]. Independent Power Producers (IPPs) joined thesystem later. The focus of IPPs was to produce energy from thermal power plants operatedon conventional fossil fuels. After 1994, the energy policy of Pakistan was introduced.The Private Power and Infrastructure Board (PPIB) was established to support the IPPs tosatisfy energy needs.
Presently, 67% of the energy demand in Pakistan is met with non-renewable resources,which are increasing at more than 10% annually, and the annual average growth rate ofenergy demand will be 8.35% by 2050 [16,17]. Pakistan is facing an energy crisis due totwo main reasons: first, energy policy and energy structure are mainly dependent onconventional energy sources, which are expensive and always under pressure due toshortages [18,19]. Second, Pakistan’s renewable energy sector only participates in 0.3% ofoverall energy needs, which is negligible [20]. The country’s power production sourcesinclude natural gas (44%), oil (35.5%), hydropower (11%), coal (7%), nuclear (2%), andrenewable energy (0.3%).
Severe energy crises have destructive impacts on the national economy of Pakistan [21].Solar energy resources are considered powerful, effective, and accessible on the Earthcompared to other alternative energy sources [22,23]. The international energy agencyexplored that worldwide solar capacity was 402 gigawatts (GW) at the end of 2020 [24].Pakistan has a total estimated potential for solar energy of about 1600 GW, which cansupport the country’s energy needs if used effectively [25]. The sustainable developmentof solar energy projects requires analyzing renewable energy policy and policy instrumentsto attract foreign direct investment and implement green technology strategies. Thereis a lack of green technology strategy for the sustainable development of solar powerprojects with financial analysis. Financial planning for assessing financial performance andimprovement in solar power generation is needed by green technology to develop solarpower projects.
As a result, the PPIB attracts the investors who installed the thermal power plants.Different phases of energy policy were introduced at subsequent periods in the country, butunfortunately, they cannot achieve the proposed targets. The energy policy of 2000 failedbecause it could not satisfy the country’s energy needs at the desired prices. As a result, theAlternate Energy Development Board (AEDB) was formed in 2003 to formalize alternateand renewable energy (ARE). The AEDB aims to support the private energy producers inthe country. The country’s first energy policy regarding renewable energy was introducedin 2006 [26]. The main objective of this policy was to convince IPPs to invest in renewableenergy projects. In Pakistan, the first solar power project was introduced by the PakistanEngineering Council (PEC) in 2010 with a capacity of 178 Kilowatt (kW) [27]. After that,the Punjab Government initiated Quaid-e-Azam Solar Power Project to meet the country’sincreasing energy demand. This project generated 1000 Megawatt (MW) in the initial phase.Similarly, the government of Pakistanis is also planning to establish more solar powerprojects in other parts of the country [28]. Some solar power projects of Pakistan, alongwith project capacity, are presented in Table 1.

Sustainability 2021, 13, 12997 3 of 29
Table 1. Current capacity-wise solar power projects in Pakistan [29].
Sr. No Company Project Capacity (MW) Location
1 IPS Solar Park- IPS 22 Pvt. Ltd. 50 Nooriabad, Sindh2 IPS Solar Park-JA 23 Pvt. Ltd. 50 Nooriabad, Sindh3 IPS Solar Park-SB 24 Pvt. Ltd. 50 Nooriabad, Sindh4 Siddiqsons Solar Ltd. 50 Kalar Kahar, Chakwal5 ET Solar (Pvt.) Ltd. 50 Fateh Jang, Attock6 ET Solar (Pvt.) Ltd. 50 Bahalwalnager, Punjab7 ACT Solar Pvt. Ltd. 50 Thatta, Sindh8 ET Solar Pvt. Ltd. 25 Dadu, Sindh9 R.E Solar Pvt. Ltd. 20 Dadu, Sindh10 R.E Solar Pvt. Ltd. 20 Dadu, Sindh11 Janpur Energy Ltd. 12 Sultanabad Rahim Yar Khan12 Lalpir Solar Ltd. 12 Mehmood Kot, Muzafar garh
Numerous investigations have been conducted on the energy crisis [30–39], solarpower project installation, and site selections [40]. Still, there is a lack of literature regardingenergy project failures and sustainable development for solar energy projects with greentechnology strategy. There is also a lack of literature related to the impact of capitalbudgeting techniques on the performance of solar power projects by using green technologyfor sustainable development. Capital budgeting is a set of techniques used to analyze anddecide a proposed investment in the new solar project or production line. Capital budgetingtechniques are also known as analyzing and planning processes to determine the long-terminvestment of the industry and deciding strategies for new project investment, matchingwith expenditure and profit by considering critical factors such as capital return, theeconomic value of the project, availability of funds, accounting methods, and taxation. Solarfirms also adopt traditional capital budgeting approaches, including internal rate of return,net present value, payback period, and profitability index. The financial performance ofthe energy projects can be assessed by applying these techniques. Financial performance isa subjective measure in which a solar firm can maintain the standards to use assets andgenerate revenue. The investor and analysts use the specific term to compare the samesolar projects or firms as a general measure for the financial backbone of the firm at aparticular time. Financial performance shows a snapshot of a solar project’s economichealth and general well-being for investors and shareholders. A primary document isrequired to publish annually and reports the financial performance of the solar firm. Asolar firm or project’s financial performance can be evaluated through financial statements,including cash flows, the income statement, and the balance sheet. The indicators offinancial performance specify the economic position of the solar project.
Previous investigations regarding the energy sector in Pakistan have mainly pin-pointed (i) energy gap between demand and supply, (ii) energy mix, (iii) evaluation of thecountry’s energy sector, (iv) the pros and cons of the introduction of renewable energy in thesystem, (v) future of energy sector, and (vi) renewable energy generation sources. Despitethe long-standing interest of earlier researchers, specific gaps exist among all these studies,i.e., (i) there is a need to apply green technology strategy for the sustainable development ofsolar power projects through financial analysis using capital budgeting techniques, (ii) thelack of financial analysis of solar power projects discourage the investors and all type ofinvestment, (iii) financial planning for assessment of the financial performance of solarpower projects need to attract foreign direct investment, and (iv) enhancing and improvingsolar energy generation using green technology strategies for the sustainable developmentin Pakistan. The present study contributes to the existing research gaps by addressingthe following questions: (i) examine the importance of green technology strategy for thesustainable development of solar power projects in Pakistan, (ii) highlight the importanceof financial planning for the financial performance of solar power projects using capitalbudgeting techniques, and (iii) empirically investigate the moderating role of cost andriskiness of the methods on the sustainable development of solar power projects.
Sustainability 2021, 13, 12997 4 of 29
The remaining study is organized as follows: Section 2 provides a brief literaturereview. Section 3 deliberates research methodology. Section 4 discusses the data analysisand results of the study. Section 5 indicates the discussion and implication. Finally,Section 6 concludes the research and provides study limitations.
2. Literature Review
The corporate financial policy includes various pillars, and investment decision tendsto be one of them. The vast body of investment decisions is evident from multiple aspects,which in financial policies. These policies usually address the capital budgeting techniquesand their usage among investment decisions [14]. The establishment of capital budgetingindicates numerous factors influencing the specific areas of projects. Although differentstudies in developed economies are categorized, investment decisions are dominant overcapital budgeting techniques. At the same time, interpreting solar energy technology insome other countries, various analyses were performed through statistical and financialmeans [41]. Hence, a green technology strategy for the sustainable development of solarpower projects is a possible solution to assess the financial performance of solar powerprojects through capital budgeting techniques. These analyses have dominantly stated theassessments through proper objectives of financial planning and improvements depicted inPakistan. Usually, financial planning is more dominant in the projects initiated for a betterprofitability index [42]. Therefore, the elements of financial planning have mainly improvedin developing and developed countries [43]. Capital budgeting techniques can closelyassess the sustainable development of solar power projects. The improvement adaptedto specific conditions of capital budgeting is closely associated with projected investmentdecisions. While enumerating the dominance of investment decisions, particular structuresof capital budgeting techniques were described. These structures include debt–equityand the cost of capital, linking its association with investment decisions. Reasonable,sustainable efforts are depicted in the projects while emphasizing financial crisis withappropriate management decision making, assessments, and strategic planning [44].
Solar power projects are the most highlighted innovation globally for energy produc-tion through different electrons and elements [45]. The creation of technology will widelylink with the structures of capital budgeting. Additional parameters were especially moreemphasized to enumerate the association of financial planning. The association is a clearindication of financial planning assessment over various projects. The presentation clari-fies the association of financial risks connected with the numerous infrastructure projects.Therefore, applying net present value (NPV) with other capital budgeting techniques helpsestablish uncertain situations prevailing in mitigation strategies. Financial planning usuallydepends on cash flows primarily used for budgeting and forecasting [45]. Therefore, theassessments are more likely to be dominated by the factors of capital budgeting. Theevaluation would not only help to capture the weak areas of performance but would alsobe beneficial for supporting the decision making process. Financial planning containsthe complete process of assessment performed by many large companies and assessmentagents. Usually, companies feel reluctant to have expert services essential in managingthe financial planning for solar projects and others. This financial planning involves manyfactors that importantly assert a beneficial role for the capital budgeting techniques [46].Although companies cannot grow without adequate financial planning and managementof their cash flows and company profits, in this context, the roles for assessing financialplanning are described with the fair election of elements that could control the economicefficacy of companies. It is a complete process of planning, forecasting, and reportingwith comprehensive analysis. Therefore, financial planning of solar power projects forsustainable development is important with a green technology strategy.
Corporate financial planning inserts their overall aspects to assert their objectivesand financial performance. These objectives are more related to financial planning as wellas operational decision making. Therefore, the company’s progress is the view with thelimelight aspects of plans and goals designed under the capital budgeting context [47].

Sustainability 2021, 13, 12997 5 of 29
Many obstacles were also grounded with the help of financial planning assessments thatgrow the company’s profits. Some critical issues were also eliminated with the economicevaluation and forecasting and considered an eye toward the company’s future. Financialplanning includes income, investment, financial statements, expenses, taxes, and otherfinancial affairs reviewed to strengthen capital budgeting [48]. Thus, the elements of finan-cial planning declare some factors that significantly influence the financial performance ofvarious projects and businesses. Economic performance and the sustainable developmentof solar power project is only possible with financial planning. The importance of corporateor solar project-related companies is only with capital budgeting and financial planningelements. These elements comprise NPV, internal rate of return (IRR), payback period(PBP), and profitability index (PI), with significant consideration of risk and cost towardfinancial performance. The initial investment in the project is required to be analyzedto place the effectiveness of financial planning. This comparative assessment helps tomaintain the expenses and knock the doors of profits through net present value. The poten-tial of investment is prevalent in the internal rate of return that assesses the profitabilityamong businesses of various companies [49]. The investment could be a complete andextended channel for the assessment in capital budgeting for financial performance. Manyprojects are essential for the companies as well as the countries. Therefore, the companiesprimarily focused more upon the payback period for the sustainable development of thesolar power projects.
The literature shows numerous studies conducted on the energy sector of Pakistan. Forinstance, [50] focused on the energy mix of the Pakistani power sector. The energy sectorwas proposed that the transition from dominant hydro energy to thermal dominant energymix was not financially suitable for the country and resulted in debt enhancement [51]. Theauthors of [52] discussed those factors associated with the gap between energy supply anddemand and found the best renewable energy sources in Pakistan. They concluded that thegovernment must prioritize the energy sector and formulate multidimensional policies tocontrol the energy crisis. The authors of [53] examined the present status and future of solarenergy from the developing economies’ perspective. The study focused on the ongoingand upcoming renewable energy projects such as solar, wind, biogas, and hydropower.Research findings proposed changing the energy mix by giving more shares to solar energyin the system and by keeping in view the ongoing renewable energy projects, which willminimize the energy demand and supply gap with a green technology strategy. Theseoutcomes support the sustainable development of renewable energy projects in Pakistan,and solar power projects were top rated.
Consequently, it is necessary to induce the appropriate measure of payback whileexecuting proper financial assessment. The profitability index of the projects is moreprecisely crucial for the countries due to more investment towards other projects. Therefore,the formulated profitability index approach helps assert the business project’s significantperformance [54]. All of the factors are related to the assessment of green technology for thesustainable development of solar power projects with financial planning while consideringthe capital budgeting eminence. There is a broad association of risk factors with financialplanning. These risk factors are uncertain due to some strange events and other safetyenvironments and issues.
3. Research Methodology3.1. Formulation of Hypotheses3.1.1. NPV Techniques and Financial Performance
To evaluate certain blamed conditions of inefficiencies, the establishment of NPVasserts dominance over investment decisions. The supremacy is necessary to analyze thedurables prevailing in energy efficiencies and NPV techniques implications with durableinvestments. Investment decision making of solar energy projects faced several conse-quences because the NPV techniques dominate with the critical role. Among solar powerprojects in Pakistan, capital budgeting techniques have induced a favorable position with

Sustainability 2021, 13, 12997 6 of 29
numerous methods. These methods indicate financial planning and state the NPV analysiswith methodological clashes [55]. The present study examines NPV technique for assessingfinancial planning and attaining the higher financial performance of solar power projects inPakistan. We have applied the NPV technique on selected solar power projects mentionedin Table 1 to mandate investment decisions and capital budgeting. This technique will helpassess the time value of money concept and investment decision making for selected solarpower projects. The sustainability of NPV techniques is to amalgamate the sustainabilityof large-scale energy supply. NPV occurs at the trade-off by maximizing sustainabilitybetween environmental burdening, economic profitability, and considering the time valueof money concept, creating new jobs [56]. If the investors practice an NPV model, subsidiesare close to zero due to corresponding implied. Investors expect subsidies, as shown intheir opinions [57]. The sensitivity analysis was used to verify the main economic variableseffect, such as levelized costs of electricity and NPV, which are highly sensitive to collectorcost [10]. Investment decisions are elaborate with plenty of characteristics. These elementsinclude lumpiness, flexible timings, uncertainty, and irreversibility. There is a broad as-sociation of investment decisions with NPV stating the implications of capital budgeting.Some facilities are the processes of decision making that develop with strategic decisionmaking over energy resources. Therefore, implementing NPV over facilities maintenancehas provided valid measures with explicit optimizations of the NPV life cycle [58]. Inthe renewable energy sector, solar power projects are important investment decisionstaken by the innovative world. The conditions of boundaries for establishing solar powerprojects are inducing NPV with a multiannual growth over the capital rate of return [59].These values enumerate the development of net present values through proper decisivecapital budgeting techniques. Based on these arguments, we proposed the first hypothesisas follows:
Hypothesis 1 (H1). There is a positive association between NPV and the financial performance ofsolar projects in Pakistan.
3.1.2. Internal Rate of Return and Financial Performance
Particular cash flow efficiencies were typically linked with every project. These cashflows explicitly assess the values of investments placed after proper implementationsof capital budgeting techniques. In the development sites, the internal rate of return isanalyzed with residual valuations to interpret profits and costs [60]. The study has appliedthe internal rate of return method for assessing a positive link of financial planning withthe financial performance of the selected and currently working solar power project inPakistan. We have used IRR technique to determine levelized cost and to assess higherprofitability on investment, future profitability, and financial performance of the selectedsolar energy projects mentioned in Table 1. The IRR technique will help to determinethe future profitability and energy performance of the chosen projects. The relationshipbetween allowances of interests and profits is specific due to the proportionate schemesestablished in solar projects of Pakistan. Therefore, the internal rate of return tends tobe an essential element in the project which states the importance among various otherprojects. Some rail projects were established in developing countries, and implementinginternal rate of return with meta-analysis significantly evaluated positive results [61].Future profitability (internal rate of return) depends on the evolution of installation costs,but it provides positive profitability in average condition [62]. Wave energy performancewith IRR can calculate through methodology at different locations. Investors can determinethe levelized cost of energy (LCOE) and IRR if economic terms are possible for floatingwave energy farms [63]. In the case of solar energy, discounted cash flow with investmentanalysis over 25 years showed a payback period of over five years and an IRR of 23% [64].These results are consistent with the development of solar projects initiated in Pakistan.This importance elaborates the significance of the project for individual investment and itsassociation with economic conditions. The proper appraisal of capital budgeting techniques

Sustainability 2021, 13, 12997 7 of 29
established various values which are beyond the limits of investment decisions. Therefore,in solar power projects, the establishment of capital budgeting techniques stated thefavorable implication of the return’s internal rate. While distributing the rates of returnwith external and internal perspectives, the partial problems were more analyzed in thevariances of economic issues [65]. These issues are more frequent with the issues of solarprojects initiated in Pakistan for profitable concerns. Its parallel situation positively depictsthe assessment of sites and its projections that could develop positive financial performance.We formulated the second hypothesis in light of these findings as follows:
Hypothesis 2 (H2). There is a positive association between the internal rate of return and thefinancial performance of solar projects in Pakistan.
3.1.3. Payback Period and Financial Performance
Innovation in the project states the positive and negative consequences for a specificperiod. The time frame for every project displays the determination of the payback period,which is mandatory for investment decisions. The responsiveness of some methods wasprecisely linked with the features of climatic, payback period, reduction of heat, andconstruction of projects [66]. The study implies the payback period method to assess thefinancial performance, planning, investment decisions, and capital cost of selected andcurrently working solar power projects in Pakistan. PBP technique will help to evaluatethe selected solar power projects with proper financial planning. It is among the principlesof selection due to the induction of financial planning with capital budgeting techniques.Careful financial planning is required in every investment, which indicates the time valueof money within a specific period for selected solar projects in this study. The inducementof technology has overcome various issues prevalent in the networks of irrigation projectsfor the recovery of energy [17]. The solar power system has an average payback periodwithin the range of 2–20 years.
Still, the payback period, with an extensive range for photovoltaic systems, hasbeen heavily influenced by incentives [63]. The cost–benefit analysis using a paybackperiod can provide positive financial performance and financial superiority with lowcapital investment and increase the energy production of solar panels daily with fixedflat indicators [67]. Calculations of the discounted payback periods and the net presentvalue of renewable energy projects include borrowed loans provided by the Americanand Ukrainian banks for developing renewable energy projects such as solar and windenergy [68]. This situation predicts the values of cash flows in a specific time frame withan association of investment paybacks. The investment decisions are placed in variousprojects, and the payback period is also estimated. The estimation requires particular yearsfor the recovery of the amount invested in the project. Solar power is one of the highestprojects that requires an economical amount and a better payback period within no time.The performance of tasks was based on technological inducements and reduction in thepayback period in energy projects [69]. Therefore, the calculated payback time usuallydepicts the negative performance of systems that develop the assessments associated withsolar projects. Thus, the exact implication of financial planning assessment establishesbetter improvement in the solar power project. The position indicates the simplicity ofthe payback period, which is favorable for investment decisions with optimistic capitalbudgeting. These arguments lead us to the formulation of the third hypothesis as follows:
Hypothesis 3 (H3). There is a positive association between the payback period and the financialperformance of solar projects in Pakistan.
3.1.4. Profitability Index and Financial Performance
Some solar power projects are usually established in developing countries to reducethe expenditures on energy production. Many countries with economic feasibility haveadmired the implication of the solar power project. In determining the profitability index,
Sustainability 2021, 13, 12997 8 of 29
the initiatives of public and private partnerships are more focused on the duration ofprojects [70]. The study used the profitability index to assess the relationship with thefinancial performance of the selected and currently working solar power projects in thecountry. The time also states the profitability index for further assessment of the selectedsolar power projects. The profitability index technique will help determine the feasibilityand performance of anew solar power project. The evaluations of financial planning overthese projects have also noted positive results for reducing expenses and the profitabilityindex. Storage of energy displays the power projects and their combined battery energywith the profitability of residential people [71]. Energy and economic analysis using finan-cial techniques (NPV, DPP, and Profitability Index) emphasize the feasibility of installingsolar water heaters and their performance. Hence, these economic techniques seem capableof estimating solar data using an adaptive neuro-fuzzy inference system (ANFIS), wherecostly equipment cannot install to measure solar energy data [72]. It helps in upbringingthe livelihood of people but could also denote negative impacts on people’s lives. Theinduction of profitability index over the solar power projects has stated positive cashflows. The present values of the initial investment in the selected solar power projectshave enumerated significant coverage of the amount invested. Although the positiveimplications of investment decisions list profitability index, this is also an indication ofcapital budgeting technique.
Solar power and onshore wind projects have gained much importance in Chinadue to their positive profitability in renewable energy [73]. The economic evaluation ofdifferent solar rooftop system sizes using economic indicators of DPP, NPV, IRR, andPI with the monocrystalline module was investigated and identified that Thailand issuitable for installing solar rooftops. All solar rooftop sizes give the same PI of 2.57, DPPof 6.1 years, and IRR of 15% with a feed-in tariff scheme, but an extensive solar rooftopsystem is required to attain better economic satisfaction [74]. The PI has derived to usedata from present solar photovoltaic power plants of possible different sites. The range oftransmission line losses between 0.7% and 12.2% depend on its load and length to establishutility-scale power plants as an economic perspective [75]. It contributes potentially to theeconomic conditions of many countries and is beneficial for the solar projects of Pakistan.It is considered a financial tool in the solar power project that elaborates on whether to berejected or accepted. We proposed the fourth hypothesis by keeping in view these findingsas follows:
Hypothesis 4 (H4). There is a positive association between profitability index and financialperformance of solar projects in Pakistan.
3.1.5. Moderating Role of Cost and Riskiness of the Solar Project between NPV andFinancial Performance
The elements of capital budgeting techniques depict the financial visibility of solarpower projects. These techniques state the projection values and their evaluation linkagewith positive and negative feedback toward the economy. The financial performanceand growth of renewable energy are significantly related to an increment of solar powerprojects [76]. There is a clear picture depicted in developing countries such as Pakistan,where financial performance has gained improvement. Debt service coverage, paybackperiod, internal rate of return, and net present values are eminent capital budgetingelements. The developing countries are geographically more critical for establishingsolar energy performance [77]. The current position states the evaluation based on costand dominance of the project, which describes the broader geographical region view.The moderating role of cost and riskiness will help identify cost and risk assessment ofselected and currently working solar power projects in this study. These elements arelinked significantly with investment decisions. Any investment could estimate thesefactors, stating its implications for the actual amount and its influence on the economy.Many projects were initiated after proper financial planning, and solar power is a positive

Sustainability 2021, 13, 12997 9 of 29
indication of these factors. The organic acceptor plays a vital role in achieving the higherperformance of solar cells by building blocks [78]. It is closely related to the solar energyand power projects that focus on electronic implications and capital budgeting associations.Renewable energy plans are dominantly playing a positive role toward the countries,but in Pakistan, the solar power project is commercially and financially viable. Cost andrisk factors have connected with the selected and currently working solar Projects in thecountry. The association of cost and risk also depicts the benefits linked with the solarprojects mentioned in Table 1.
Some factors played a role in delaying specific solar projects, but developing countriespositively associate services with solar power projects. Reducing cost is a compulsoryrequirement to attain sustainability in energy projects to avoid risks [79]. The cost of equityand other capital budgeting methods overcomes the weaknesses prevailing in developingcountries such as Pakistan [80]. It is upon the strategic views adopted with the implicationsof capital budgeting techniques. NPV and profitability index are jointly connected toestablish a solar power project [81]. An evaluation is asserting to select some methodslinked with capital budgeting and the environment. In Pakistan, the solar power projecthas benefited greatly from the economic conditions. These conditions are potential impactswith green technology of some elements of financial planning and close associations ofimprovement towards sustainable development for selected and currently working solarpower projects mentioned in Table 1. In light of these arguments, we proposed the followinghypotheses as follows:
Hypothesis 5 (H5). The project’s cost and risk positively moderate the association between NPVand financial performance of solar projects in Pakistan.
3.1.6. Moderating Role of Cost and Riskiness of the Solar Project between IRR andFinancial Performance
Capital budgeting techniques can describe the financial visibility through its compo-nents such as uncertainty of the cash flows, the quantification of risk, and characteristics fordecision making in high-risk investments in selected and currently working solar powerprojects in Pakistan. The IRR and NPV are used as fundamental approaches to measuringfinancial feasibility for solar power projects mentioned in Table 1. The decoupled NPV isa method used in the renewable energy field to quantify and identify the source of riskthat can affect the anticipated cash flows of energy-producing projects [82]. The purpose ofquantifying financial risk associated with selected solar energy projects is to secure financ-ing in this study. Quantitative risk assessment is required to calculate economic viabilitymeasures, including the levelized cost of electricity (LCOE), IRR, and varieties of values ofambiguous input parameters that can control the operating cost, capital cost, and energyrevenue. The level of the parameters indicates equal values for LCOE and IRR despiteall being different measures of economic viability [83]. The financial analysis expressedthat IRR, PBP, and cost of solar plant capital of the polycrystalline silicon were more thanamorphous silicon thin film. However, amorphous silicon thin film provides a low incomebesides 25 years than polycrystalline silicon [84]. The higher financial leverages can beselected for project finance of solar resources by choosing a rational threshold amount forconditional value-at-risk (CVaR). The debt service coverage ratio is used to facilitate deci-sion making in determining the weight of project finance [85]. IRR is engaged in estimatingthe profitability of renewable energy projects. However, the IRR with profit-sharing rangesfrom 1.67% to 7.64%, and without profit-sharing, it ranges are from 4.49% to 9.50% [86].These arguments lead us to the formulation of the six hypotheses as follows:
Hypothesis 6 (H6). The project’s cost and risk positively moderate the association between theinternal rate of return and the financial performance of solar projects in Pakistan.

Sustainability 2021, 13, 12997 10 of 29
3.1.7. Moderating Role of Cost and Riskiness of the Solar Project between PBP andFinancial Performance
The investment in renewable energy is an essential part of the economic growthand development of the country through the PBP technique for selected and currentlyworking solar power projects in Pakistan. Photovoltaics can cover the annual electricitydemand with a PBP of less than seven years for residential buildings. The PBP ranges ofthe solar combi system are between 5.5 and 6.5 years at the time of conventional fuel oilheating boiler and, in the case of natural gas boiler, nine years [87]. The study assesses theinfluence of four factors, the NPV technique, MIRR, PBP technique, and PI, to enhancethe performance of selected and currently working solar power projects in the country.Financial analyses indicated that all costs were incurred during the lifetime of the solarproject [61]. The solar system has an average payback period within a range of 2–20 years,but incentives have heavily influenced the solar system through the extensive range ofthe payback period [88]. The best renewable energy option for Pakistan is solar energy interms of operation and maintenance cost, life span, and energy price [14]. The instability ofelectricity, CO2 prices, and the high investment cost are not favorable to attract renewableenergy investment. Conversely, promoting technological progress, maintaining the mar-ket’s stability, and increasing the level of subsidy are helping to inspire investment [89]. Therisk-averse strategy can reduce the obtained profit of the risk-neutral strategy by increasingrobustness value that increases the solar radiation’s ambiguity. The concentrating solarpower operating profit in the risk-taker strategy will be 7% greater due to the increase insolar radiation than the risk-neutral case [90]. The lower percentiles are associated with thegreat uncertainties in the annual solar irradiation series that can assess risk for securing so-lar power projects with competitive financing. The direct normal solar irradiation is ~1.6%,with first percentile uncertainty and global horizontal solar irradiation being ~4% [91].The solar power plant developers must assess site risk for advanced performance in aridlocations and places with high annual irradiance levels. The airborne sand and dust withsubstantial quantities increase the risk of optical energy losses due to erosion damages,soiling, and extinction [92]. The arguments are associated and guide us to the formulationof the seven hypotheses as follows:
Hypothesis 7 (H7). The project’s cost and riskiness positively moderate the association betweenthe payback period and financial performance of the solar project in Pakistan.
3.1.8. Moderating Role of Cost and Riskiness of the Solar Project between PI andFinancial Performance
Pakistan requires an economic analysis methodology to simplify renewable energy’scost and profitability assessment, especially in this study’s photovoltaic systems. The studyassessing the cost and riskiness of the method is a considerable moderator between theinternal rate of return method and the financial performance of the selected and currentlyworking solar power projects in the country. This system helps preserve the environment,reduce global warming, lower the production of greenhouse gases [93,94], and is eco-nomically suitable for investors. Renewable energies have the leading role in expressingalternative energy policies based on sustainability, independence, and security [95–97].The economic parameters, including PBP, IRR, NPV, and PI, are calculated under 0–50%subsidy rates and support the financial viability of the solar plant [98]. The relationshipof these parameters with financial performance of solar power projects is presenting inFigure 1. The range of the transmission line losses depends on the length and load be-tween 0.7% and 12.2% of these lines. Based on numerous economic factors, the PI ofpotential utility-scale transmission line losses of solar photovoltaic is between −9.11%and 69.65% [75]. Profitability analysis of the solar photovoltaic project is required threefinancial instruments such as PI, IRR, and NPV [99]. In South Asia, economic and tradeliberalization policies have been expected to perform an attractive role in the transitionphenomenon of renewable energy [100]. The investor’s opinion with a profitability index

Sustainability 2021, 13, 12997 11 of 29
of 1.36 is economically feasible for solar energy communities [101]. Financial, technical,political, and environmental risks are the explicit risk factors associated with installingsolar projects [102]. In light of these arguments, we proposed eight hypotheses as follows:
Sustainability 2021, 13, x FOR PEER REVIEW 11 of 31
3.1.8. Moderating Role of Cost and Riskiness of the Solar Project between PI and Finan-cial Performance
Pakistan requires an economic analysis methodology to simplify renewable energy’s cost and profitability assessment, especially in this study’s photovoltaic systems. The study assessing the cost and riskiness of the method is a considerable moderator between the internal rate of return method and the financial performance of the selected and cur-rently working solar power projects in the country. This system helps preserve the envi-ronment, reduce global warming, lower the production of greenhouse gases [93,94], and is economically suitable for investors. Renewable energies have the leading role in ex-pressing alternative energy policies based on sustainability, independence, and security [95–97]. The economic parameters, including PBP, IRR, NPV, and PI, are calculated under 0–50% subsidy rates and support the financial viability of the solar plant [98]. The rela-tionship of these parameters with financial performance of solar power projects is pre-senting in Figure 1. The range of the transmission line losses depends on the length and load between 0.7% and 12.2% of these lines. Based on numerous economic factors, the PI of potential utility-scale transmission line losses of solar photovoltaic is between −9.11% and 69.65% [75]. Profitability analysis of the solar photovoltaic project is required three financial instruments such as PI, IRR, and NPV [99]. In South Asia, economic and trade liberalization policies have been expected to perform an attractive role in the transition phenomenon of renewable energy [100]. The investor’s opinion with a profitability index of 1.36 is economically feasible for solar energy communities [101]. Financial, technical, political, and environmental risks are the explicit risk factors associated with installing solar projects [102]. In light of these arguments, we proposed eight hypotheses as follows:
Hypothesis 8. (H8): The project’s cost and riskiness positively moderate the association between profitability index and financial performance of social tasks in Pakistan
Figure 1. Conceptual framework.
This research has used non-probability (purposive) sampling with a green technol-ogy strategy for sustainable development and for improving selected solar power projects using capital budgeting techniques (CBT) mentioned in Table 1. Current working solar power projects were selected as research with a green technology strategy for sustainable development to improve their service and quality financial performance using CBTs. Spe-cific solar projects were adopted when the purposive sampling technique was employed
Figure 1. Conceptual framework.
Hypothesis 8 (H8). The project’s cost and riskiness positively moderate the association betweenprofitability index and financial performance of social tasks in Pakistan.
This research has used non-probability (purposive) sampling with a green technologystrategy for sustainable development and for improving selected solar power projectsusing capital budgeting techniques (CBT) mentioned in Table 1. Current working solarpower projects were selected as research with a green technology strategy for sustainabledevelopment to improve their service and quality financial performance using CBTs.Specific solar projects were adopted when the purposive sampling technique was employedto present our sample from Pakistan’s top management of solar power projects. To fulfillthis purpose, the researchers surveyed from March to August (2021); when the fourth wave(Delta variant), a type of coronavirus (COVID-19), was at its peak in Pakistan [103–106],it was a high risk to approach relevant respondents. Questionnaires were sent usingmobile applications.
Purposive sampling is suitable for theoretical generalization, especially when access-ing the whole population [107]. The ongoing research goal is to examine the impact ofcapital budgeting techniques on financial performance and examine the moderating role ofcost and riskiness of the methods among the nexus of capital budgeting techniques andfinancial performance of solar power projects in Pakistan. The following criteria were con-sidered for the selection of respondents: (i) top-level professionals, i.e., (i.e., chief financialofficers and chief executive officers; (ii) respondents should have professional experiencein the relevant fields; (iii) qualification of the respondents should not be less than thebachelor’s level. The recruitment criteria show that the respondents have a heterogeneousbackground with diverse behaviors and cultures. In this context, the sample is rich enough,and the findings generated based on such a sample provide a fair representation of therespondents with heterogeneous features. The demographic profiles of respondents arelisted in Table A1, Appendix A.

Sustainability 2021, 13, 12997 12 of 29
3.2. Sample and Procedure
We managed to contact 87 top management officers, such as CFOs and CEOs of solarpower projects. Among these, 63 agreed to participate in the survey. After obtaining theconsent of top management officers, the researchers provided opened and closed handquestionnaires to each officer via LinkedIn and WhatsApp. Lastly, 51 filled questionnaireswere returned from the total sample size of the questionnaire survey. However, the re-searchers discarded 7 questionnaires due to unmatched and inadequate responses; theresponse rate was 69.84%. Finally, the sample resulted in 44 valid responses from topmanagement officers for study analysis. The respondents collected personal data fromthe stock exchange of Pakistan’s official website and companies’ respective websites. Thefinding is generated based on a fair representation of the sample. The respondents’ demo-graphic features include age and experience, education, and gender, which also indicateheterogeneous backgrounds of the respondents that provided the proper response in thisstudy (see Table 1). The first section of the questionnaire covers the personal detail of therespondents, while the second section of the questionnaire is related to the features of solarpower projects, such as quality, financial performance, project cost, and energy supply.
3.3. Instrument and Variables for Measurement
In this study, we have taken scale items from previous literature. Six items measuredthe construct NPV technique (NPVT). These items have been selected and modified fromthe study of [108]. Four items measured the internal rate of return (IRR), and these itemshave been adopted and modified from the study of [109]. Five items measured the paybackperiod technique (PBPT). These items were adopted and modified from [110]. Six itemsmeasured the profitability index (PI), and the items have been taken and modified fromthe research [111]. Cost and riskiness of method (CRM) were selected as a moderatingvariable, measured by four items. These items were adopted and modified from the workof [14]. Finally, the financial performance of solar power projects (FPSPP) was taken asa dependent variable and measured by five items. These items have been adopted andmodified from the study of [112]. A five-point Likert scale was employed to assess eachitem, as 1 specifies “strongly disagree” and 5 specifies “strongly agree”.
4. Data Analysis and Results
Our research employed the structural equation modeling (SEM) method for data anal-ysis objectives [113]. The study adopted this method to analyze the relational dimensionsbecause it is a component-focused method [114]. PLS-SEM has frequent usage and appro-priateness, which is why the author adopted it in this study; the subsequent studies areevidence [115,116]. Structural equation modeling (SEM) is more advantageous than othermethods of traditional statistical analysis. It is helpful for statistical analysis regarding effi-ciency, convenience, and accuracy [117,118]. SEM covers the problems of first-generationanalysis, but it is a second-generation technique. SEM can assist in analyzing abundantvariables at the same time because it is a multivariate analysis process. SEM is continuouslypopular in business research because it can simultaneously deal with complex and multiplerelationships [119].
The inappropriate adoption of analytical methods can cause inaccurate conclusions;however, an appropriate statistical technique is most important for management andsocial science research [120]. Measurement and structural models are two-stage analysisapproaches of PLS-SEM that include measurement results in two steps [121]. Reliabilityand validity tests or the assessment of the inner model was included in the measurementassessment model for selected and currently working solar power projects in this study.Hypotheses and relationships testing, or the evaluation of the outer model, formed astructural assessment model for selected solar projects. The present research used PLS3.0 software for primary data analysis and examined the links among the understudyvariables. Additionally, partial least square path modeling has higher statistical power

Sustainability 2021, 13, 12997 13 of 29
than covariance-based structural equation modeling. PLS-SEM is more advantageous tointercept relationships among the variables.
In addition, the smart-PLS for variance-based structural equation modeling (SEM)uses the partial least squares (PLS) path modeling method to examine the nexus amongthe variables [122]. The purpose of smart-PLS is to hypothesize testing in the research,and the complex model research has adapted to it. The smart-PLS has two approaches:a measurement assessment model and a structural model for the analysis used in thisstudy. The assessment measurement model includes the reliability and validity of theconstructs checked with convergent and discriminant validity. The convergent validityrelated to the correlation among the items examined using the Chronbach Alpha, compositereliability (CR), and items loading. However, the discriminant validity is associated with thecorrelation among variables examined using Fornell Larcker, cross-loading, and Heterotrait–Monotrait ratio. In addition, the assessment of the measurement model includes the testingof hypotheses that were reviewed using path analysis—the analysis of the study discussedin the findings section.
The path analysis has shown the links among the variables in this study. The resultsrevealed that capital budgeting techniques such as net present value, internal rate ofreturn, payback period, and profitability index positively impact the selected and currentlyworking solar power projects’ financial performance, and they accept H1, H2, H3, and H4.In addition, the findings also indicated that cost and riskiness of techniques significantlymoderated among the nexus of internal rate of return, profitability index, and financialperformance of the selected and working solar power projects mentioned in Table 1, andthey accept H6 and H8. Finally, the findings section of the measurement model has firstshown the nexus’s convergent validity among the selected solar power project items in thisstudy. The figures show that the loadings and average variance extracted (AVE) values arehigher than 0.50, while Alpha and CR values are more significant than 0.70. These valueshave indicated that convergent validity is the valid and high connection among the items.The results of the research also include the assessment of correlation among items namedconvergent validity. The figures highlighted that the factor loadings are more significantthan 0.50, Alpha values are more than 0.70, AVE values are also higher than 0.50, and CRvalues are also greater than 0.70. These values have indicated a high correlation amongitems and valid convergent validity. The results are reported in Table 2.
4.1. Measurement Assessment Model
In the present research, measurement model evaluation was required to conductreliability and validity tests for all the given constructs. The measurement model confirmsthe reliability and validity of the constructs and the factor loadings of all items approvedby the model [123]. The measurement evaluation model is consistent on reliability tests(item reliability and internal consistency reliability) and validity tests (convergent validityand discriminant validity) [124]. Convergent validity has been measured over the AVE,internal consistency reliability has been measured over composite reliability (CR), anditem reliability has been measured over outer loading in this study. All item loadingsare well upstairs with the threshold value of 0.5 [125]; see Table 2. The analysis of thestudy verified that all of the averaged factor loadings were greater than 0.50, and eachobservation contributed to the constructed variable [126]. AVE exceeds the suggestedvalue of 0.5. The composite reliability value for each standard exceeds the cut-off pointof 0.7, which displays that the measurements are reliable [127]. The results of the currentselected solar power projects designate that all the values of AVE are between 0.536 (costand riskiness of methods) and 0.908 (internal rate of return method). CR values are between0.820 (cost and riskiness of methods) and 0.975 (internal rate of return method). The valuesof all additional loadings are between 0.5 and 0.959.
All verified validity and reliability values in this measurement model are given belowin Tables 3–5. All the factor loading values are more significant than 0.50; thus, theconvergent validity of all items is valid in the measurement assessment model.

Sustainability 2021, 13, 12997 14 of 29
Table 2. Convergent validity analysis.
Constructs Items Loadings Alpha CR AVE
Cost and riskiness of methods CRM1 0.886 0.845 0.820 0.536CRM2 0.669CRM3 0.676CRM4 0.675
Financial performance of solarpower project FPSPP1 0.809 0.889 0.918 0.692
FPSPP2 0.815FPSPP3 0.855FPSPP4 0.815FPSPP5 0.864
Internal rate of return method IRRM1 0.958 0.966 0.975 0.908IRRM2 0.943IRRM3 0.952IRRM4 0.959
Net present valuetechnique NPVT1 0.912 0.944 0.956 0.782
NPVT2 0.823NPVT3 0.905NPVT4 0.904NPVT5 0.912NPVT6 0.846
Payback period technique PBPT1 0.880 0.909 0.936 0.785PBPT2 0.879PBPT3 0.888PBPT4 0.896
Profitability index PI1 0.954 0.959 0.968 0.834PI2 0.828PI3 0.952PI4 0.955PI5 0.827PI6 0.954
Table 3. Fornell–Larcker analysis.
Factors CRM FPSPP IRRM NPVT PBPT PI
CRM 0.732FPSPP 0.325 0.832IRRM 0.346 0.407 0.953NPVT 0.394 0.506 0.470 0.884PBPT 0.335 0.371 0.384 0.385 0.886
PI 0.400 0.498 0.486 0.348 0.362 0.913Notes: N = 44; NPV, net present value; IRR, internal rate of return; PBP, payback period; PI, profitability index;CRM, cost and riskiness of method; FPSPP, financial performance of solar power projects.
The findings of this research also include the assessment of correlation among variablesnamed as discriminant validity. First, a conventional method of Fornell–Larcker and cross-loading were used to test the discriminant validity (see Table 3). These values indicated alow correlation among variables and verified the discriminant validity of the selected solarpower projects. The bold values in Table 4 show that all factors have a strong relationshipbut weak relationships with other factors. The bold values of the cross-loadings tablewere compared with other factors row-wise to check discriminant validity. The cost andriskiness method (CRM) values are greater than row-wise other factors and show strongdiscriminant validity in this study and so on. The other left and right values are smallercompared to bold values in Table 4. The measurement assessment model is shown inFigure 2, which indicates the factor loading of the variables.

Sustainability 2021, 13, 12997 15 of 29
Table 4. Cross-loadings.
Items CRM FPSPP IRRM NPVT PBPT PI
CRM1 0.886 0.378 0.428 0.458 0.372 0.469CRM2 0.669 0.090 0.267 0.134 0.120 0.105CRM3 0.676 0.099 0.264 0.081 0.109 0.102CRM4 0.675 0.071 0.243 0.113 0.118 0.096
FPSPP1 0.334 0.809 0.378 0.473 0.295 0.493FPSPP2 0.288 0.815 0.350 0.455 0.306 0.403FPSPP3 0.242 0.855 0.296 0.369 0.285 0.398FPSPP4 0.214 0.815 0.330 0.392 0.335 0.359FPSPP5 0.261 0.864 0.330 0.402 0.321 0.403IRRM1 0.713 0.399 0.958 0.448 0.338 0.468IRRM2 0.705 0.360 0.943 0.444 0.400 0.450IRRM3 0.718 0.391 0.952 0.448 0.386 0.462IRRM4 0.709 0.401 0.959 0.453 0.342 0.471NPVT1 0.331 0.447 0.391 0.912 0.340 0.736NPVT2 0.362 0.465 0.434 0.823 0.328 0.776NPVT3 0.356 0.446 0.445 0.905 0.345 0.723NPVT4 0.352 0.452 0.440 0.904 0.339 0.731NPVT5 0.327 0.434 0.381 0.912 0.336 0.735NPVT6 0.361 0.438 0.400 0.846 0.351 0.794PBPT2 0.314 0.340 0.322 0.307 0.880 0.292PBPT3 0.276 0.339 0.350 0.351 0.879 0.342PBPT4 0.290 0.327 0.330 0.340 0.888 0.306PBPT5 0.308 0.305 0.359 0.369 0.896 0.345
PI1 0.367 0.450 0.450 0.770 0.315 0.954PI2 0.353 0.463 0.429 0.775 0.359 0.828PI3 0.368 0.456 0.452 0.769 0.317 0.952PI4 0.375 0.444 0.449 0.774 0.315 0.955PI5 0.352 0.459 0.430 0.775 0.360 0.827PI6 0.368 0.449 0.446 0.772 0.312 0.954
The Heterotrait–Monotrait ratio of correlations (HTMT) for discriminant validitymeasure is considered more suitable due to different researchers’ criticism on the criteria ofFornell-Larcker [128]. The value of discriminant validity confirms if it is less than 0.85 [129]or 0.90 [113]. All values are less than 0.90 in Table 5. The findings section has also shownthe discriminant validity that is about the nexus among the variables. First, cross-loadingsand Fornell Larcker are used to test the discriminant validity. The figures have shown thatthe values that indicated the nexus with the variable itself are higher than those with othervariables. These values explored that discriminant validity is the valid and low connectionamong the variables. All values are highlighted in Table 5. Second, the latest method, suchas the HTMT ratio, has been used to test the discriminant validity. The figures highlightthat the figures of HTMT ratio are lower than 0.85. These values have indicated a lowcorrelation among variables and valid discriminant validity (see Table 5).
Table 5. Heterotrait–Monotrait ratio.
Variables CRM FPSPP IRRM NPVT PBPT PI
CRMFPSPP 0.220IRRM 0.537 0.436NPVT 0.266 0.548 0.492PBPT 0.249 0.411 0.411 0.416
PI 0.259 0.535 0.504 0.389 0.388Notes: N = 44; NPV, net present value; IRR, internal rate of return; PBP, payback period; PI, profitability index;CRM, cost and riskiness of method; FPSPP, financial performance of solar power projects.

Sustainability 2021, 13, 12997 16 of 29
Sustainability 2021, 13, x FOR PEER REVIEW 16 of 31
PBPT3 0.276 0.339 0.350 0.351 0.879 0.342 PBPT4 0.290 0.327 0.330 0.340 0.888 0.306 PBPT5 0.308 0.305 0.359 0.369 0.896 0.345
PI1 0.367 0.450 0.450 0.770 0.315 0.954 PI2 0.353 0.463 0.429 0.775 0.359 0.828 PI3 0.368 0.456 0.452 0.769 0.317 0.952 PI4 0.375 0.444 0.449 0.774 0.315 0.955 PI5 0.352 0.459 0.430 0.775 0.360 0.827 PI6 0.368 0.449 0.446 0.772 0.312 0.954
Figure 2. Measurement assessment model.
The Heterotrait–Monotrait ratio of correlations (HTMT) for discriminant validity measure is considered more suitable due to different researchers’ criticism on the criteria
Figure 2. Measurement assessment model.
4.2. Structural Assessment Model
The smart-PLS have two steps. First, the measurement model, and second, the structuralassessment model. The second step was applied here, which checked the relationship betweenexogenous and endogenous variables. The different types of statistical values are presented bythe structural assessment model including effect size (f2), t values, predictive relevance (Q2),coefficient of determination (R2), and path coefficient (β values). The PLS-SEM literature hasprovided the criteria to evaluate hypotheses and estimate the significance of path coefficients.The 5000 sub-samples were applied for bootstrapping process with a 5% significance level(one-tailed) to test the significance of the hypotheses [124]. Results indicate that H4 and H7are not accepted. NPV (β = 0.222, t = 2.331 > 1.64, p < 0.05), NPV relationship (moderator),(β = 0.202, t = 3.441 > 1.64, p < 0.05), internal rate of return (β = −0.205, t = 2.552 > 1.64,p < 0.05), internal rate of return relationship (moderator), (β = 0.090, t = 1.660 > 1.64, p < 0.05),payback period, (β = 0.232, t = 2.303 > 1.64, p < 0.05), payback period relationship (moderator)(β = 0.119, t = 1.408 > 1.64, p < 0.05), profitability index, (β =−0.070, t = 0.639 > 1.64, p < 0.05),profitability index relationship (moderator) (β = 0.179, t = 2.681 > 1.64, p < 0.05) have a positiveand significant impact on the performance of selected and currently working solar powerprojects mentioned in Table 1.
The R2 value for NPVT→ FPSPP is 0.458, indicating that the model has substantialexplanatory power for increasing the financial performance of solar power projects. How-

Sustainability 2021, 13, 12997 17 of 29
ever, the R2 value is not enough to be considered a suitable and effective method to assista model [130]. Consequently, the predictive relevance measurement Q2 of the model is asuitable method. The value of Q2 is more sophisticated than zero, which was indicatedby the latent exogenous standards with excessive predictive relevance [128]. The valueof Q2 is 0.245, which shows the model has significant predictive relevance and suggeststhe financial performance of solar power projects is increasing through CBTs. The f2 hasa typical value, including 0.02, 0.15, and 0.35, which indicate effects in three categories,small, medium, and large, respectively [129]. Thus, the value of f2 assumed that effectsize differs from medium to large (see Table 6). Several kinds of statistical techniques arementioned in Table 6. The structural assessment model is shown in Figure 3. The variablesshow a significant relationship in the model, the t values are more critical than 1.64, and theprofitability index not positively impacts financial performance. The values of moderatedvariables have positive signs and show an entirely substantial relationship in the structuralassessment model for solar projects in Pakistan.
Table 6. Structural model results (hypotheses testing).
Hypotheses Relationships β S. D T-Statistics p-Value Supported R2 Q2 F2
H1 NPVT→ FPSPP 0.222 0.207 2.331 0.011 Yes 0.458 0.245 0.096H2 IRRM→ FPSPP 0.205 0.201 2.552 0.006 Yes 0.241 0.043H3 PBPT→ FPSPP 0.232 0.237 2.303 0.012 Yes 0.111H4 PI→ FPSPP 0.070 0.073 0.639 0.062 Yes 0.021H5 NPVT * CRM→ FPSPP 0.202 0.197 3.441 0.000 Yes 0.041H6 IRRM * CRM→ FPSPP 0.090 0.088 1.660 0.074 Yes 0.015H7 PBPT * CRM→ FPSPP 0.119 0.131 1.408 0.081 No 0.031H8 PI * CRM→ FPSPP 0.216 −0.209 1.917 0.029 Yes 0.481 0.026
Notes: N = 44; NPV, net present value; IRR, internal rate of return; PBP, payback period; PI, profitability index; CRM, cost and riskiness ofmethod; FPSPP, financial performance of solar power projects. *, asterisk shows the moderating relationship among the variables.
Sustainability 2021, 13, x FOR PEER REVIEW 18 of 31
significant relationship in the model, the t values are more critical than 1.64, and the prof-itability index not positively impacts financial performance. The values of moderated var-iables have positive signs and show an entirely substantial relationship in the structural assessment model for solar projects in Pakistan.
Table 6. Structural model results (hypotheses testing).
Hypotheses Relationships β S. D T-Statistics p-Value Supported R2 Q2 F2 H1 NPVT → FPSPP 0.222 0.207 2.331 0.011 Yes 0.458 0.245 0.096 H2 IRRM → FPSPP 0.205 0.201 2.552 0.006 Yes 0.241 0.043 H3 PBPT → FPSPP 0.232 0.237 2.303 0.012 Yes 0.111 H4 PI → FPSPP 0.070 0.073 0.639 0.062 Yes 0.021 H5 NPVT * CRM → FPSPP 0.202 0.197 3.441 0.000 Yes 0.041 H6 IRRM * CRM → FPSPP 0.090 0.088 1.660 0.074 Yes 0.015 H7 PBPT * CRM → FPSPP 0.119 0.131 1.408 0.081 No 0.031 H8 PI * CRM → FPSPP 0.216 −0.209 1.917 0.029 Yes 0.481 0.026
Notes: N = 44; NPV, net present value; IRR, internal rate of return; PBP, payback period; PI, profitability index; CRM, cost and riskiness of method; FPSPP, financial performance of solar power projects. *, asterisk shows the moderating relation-ship among the variables.
Figure 3. Structural assessment model. Figure 3. Structural assessment model.
Sustainability 2021, 13, 12997 18 of 29
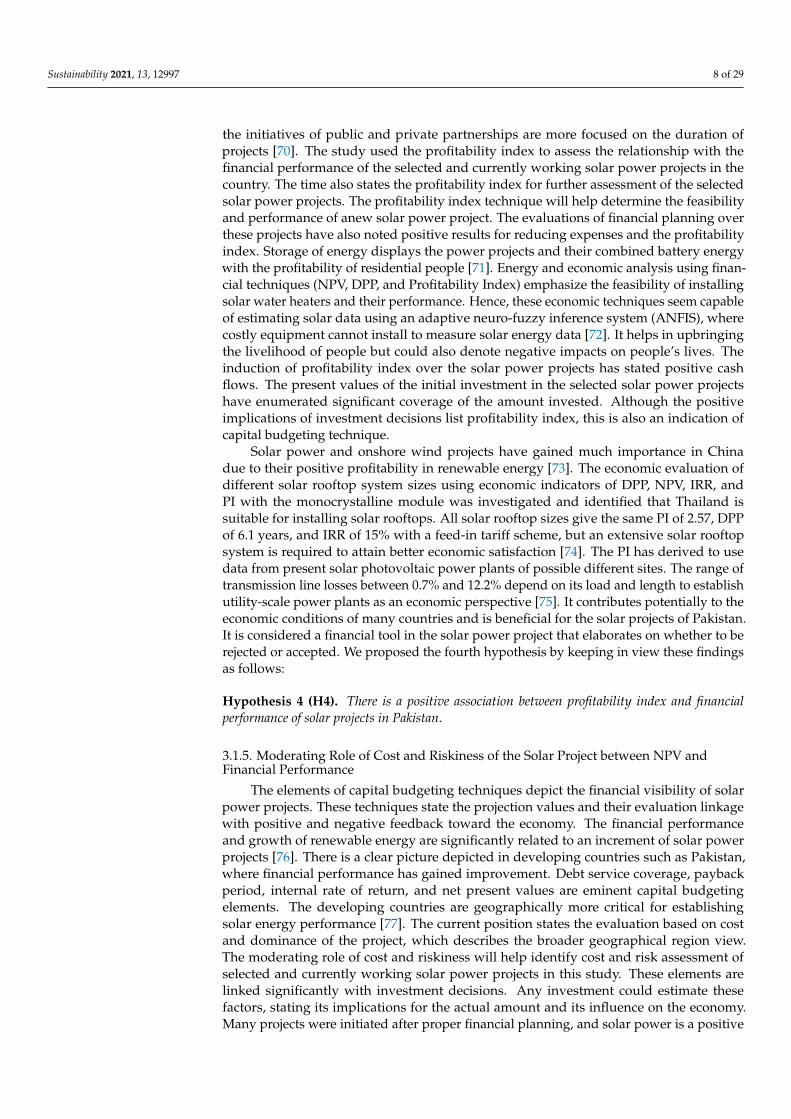
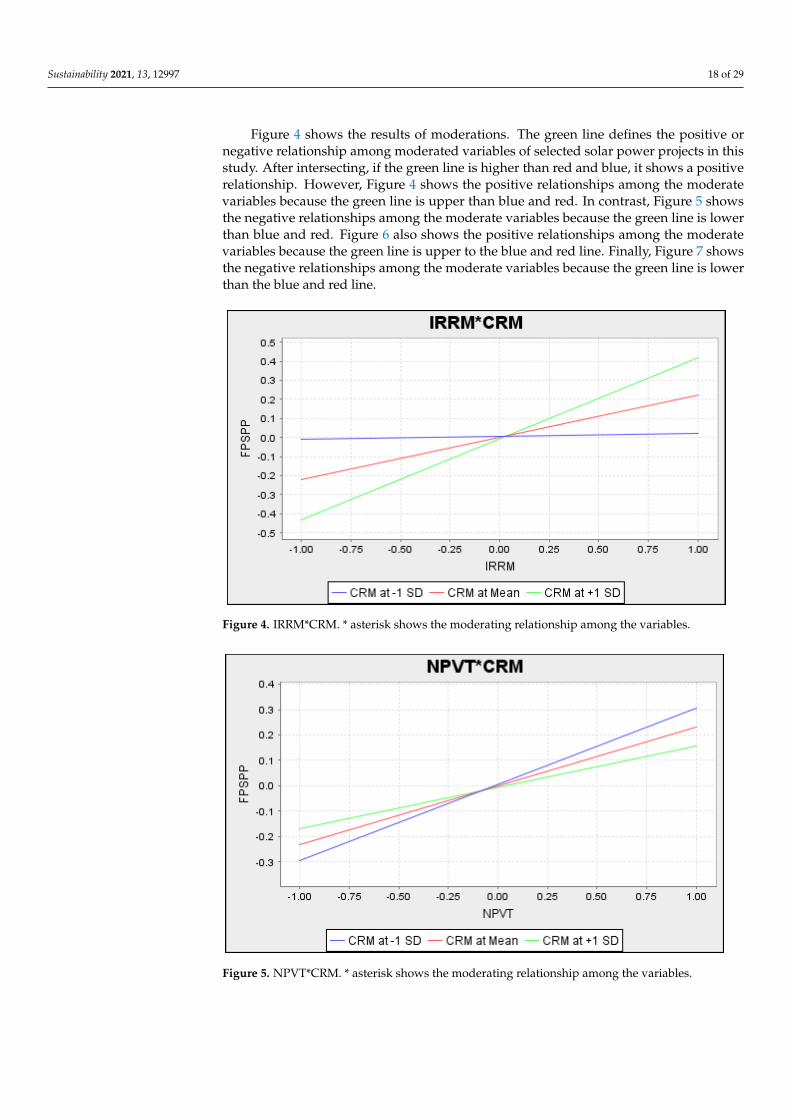
Figure 4 shows the results of moderations. The green line defines the positive ornegative relationship among moderated variables of selected solar power projects in thisstudy. After intersecting, if the green line is higher than red and blue, it shows a positiverelationship. However, Figure 4 shows the positive relationships among the moderatevariables because the green line is upper than blue and red. In contrast, Figure 5 showsthe negative relationships among the moderate variables because the green line is lowerthan blue and red. Figure 6 also shows the positive relationships among the moderatevariables because the green line is upper to the blue and red line. Finally, Figure 7 showsthe negative relationships among the moderate variables because the green line is lowerthan the blue and red line.
Sustainability 2021, 13, x FOR PEER REVIEW 19 of 31
Figure 4 shows the results of moderations. The green line defines the positive or neg-ative relationship among moderated variables of selected solar power projects in this study. After intersecting, if the green line is higher than red and blue, it shows a positive relationship. However, Figure 4 shows the positive relationships among the moderate variables because the green line is upper than blue and red. In contrast, Figure 5 shows the negative relationships among the moderate variables because the green line is lower than blue and red. Figure 6 also shows the positive relationships among the moderate variables because the green line is upper to the blue and red line. Finally, Figure 7 shows the negative relationships among the moderate variables because the green line is lower than the blue and red line.
Figure 4. IRRM*CRM. * asterisk shows the moderating relationship among the variables.
Figure 5. NPVT*CRM. * asterisk shows the moderating relationship among the variables.
Figure 4. IRRM*CRM. * asterisk shows the moderating relationship among the variables.
Sustainability 2021, 13, x FOR PEER REVIEW 19 of 31
Figure 4 shows the results of moderations. The green line defines the positive or neg-ative relationship among moderated variables of selected solar power projects in this study. After intersecting, if the green line is higher than red and blue, it shows a positive relationship. However, Figure 4 shows the positive relationships among the moderate variables because the green line is upper than blue and red. In contrast, Figure 5 shows the negative relationships among the moderate variables because the green line is lower than blue and red. Figure 6 also shows the positive relationships among the moderate variables because the green line is upper to the blue and red line. Finally, Figure 7 shows the negative relationships among the moderate variables because the green line is lower than the blue and red line.
Figure 4. IRRM*CRM. * asterisk shows the moderating relationship among the variables.
Figure 5. NPVT*CRM. * asterisk shows the moderating relationship among the variables. Figure 5. NPVT*CRM. * asterisk shows the moderating relationship among the variables.

Sustainability 2021, 13, 12997 19 of 29Sustainability 2021, 13, x FOR PEER REVIEW 20 of 31
Figure 6. PBPT*CRM. * asterisk shows the moderating relationship among the variables.
Figure 7. P.I. *CRM. * asterisk shows the moderating relationship among the variables.
5. Discussion and Implications The study examines how financial planning can be assessed through capital budget-
ing techniques such as net present value. The results reveal that the NPV technique has a significant and favorable influence on the financial performance of solar power projects. The projects have a high performance when the capital invested is under the NPV tech-nique. These results are in line with the past study of [131]. In this regard, the research suggests that the NPV technique proves to be beneficial for the currently working solar power projects to attain higher financial performance.
Additionally, the study results have also indicated that the internal rate of return method for assessing financial planning has a positive link with the financial performance of the selected currently working solar power project in Pakistan. These results verify the results of a past study, highlighting the influences of the internal rate of return method on investment in different power projects [132]. The present study implies that the internal rate of return method helps the management attain higher profitability on investment in
Figure 6. PBPT*CRM. * asterisk shows the moderating relationship among the variables.
Sustainability 2021, 13, x FOR PEER REVIEW 20 of 31
Figure 6. PBPT*CRM. * asterisk shows the moderating relationship among the variables.
Figure 7. P.I. *CRM. * asterisk shows the moderating relationship among the variables.
5. Discussion and Implications The study examines how financial planning can be assessed through capital budget-
ing techniques such as net present value. The results reveal that the NPV technique has a significant and favorable influence on the financial performance of solar power projects. The projects have a high performance when the capital invested is under the NPV tech-nique. These results are in line with the past study of [131]. In this regard, the research suggests that the NPV technique proves to be beneficial for the currently working solar power projects to attain higher financial performance.
Additionally, the study results have also indicated that the internal rate of return method for assessing financial planning has a positive link with the financial performance of the selected currently working solar power project in Pakistan. These results verify the results of a past study, highlighting the influences of the internal rate of return method on investment in different power projects [132]. The present study implies that the internal rate of return method helps the management attain higher profitability on investment in
Figure 7. P.I. *CRM. * asterisk shows the moderating relationship among the variables.
5. Discussion and Implications
The study examines how financial planning can be assessed through capital budgetingtechniques such as net present value. The results reveal that the NPV technique has asignificant and favorable influence on the financial performance of solar power projects.The projects have a high performance when the capital invested is under the NPV technique.These results are in line with the past study of [131]. In this regard, the research suggeststhat the NPV technique proves to be beneficial for the currently working solar powerprojects to attain higher financial performance.
Additionally, the study results have also indicated that the internal rate of returnmethod for assessing financial planning has a positive link with the financial performanceof the selected currently working solar power project in Pakistan. These results verify theresults of a past study, highlighting the influences of the internal rate of return method oninvestment in different power projects [132]. The present study implies that the internal

Sustainability 2021, 13, 12997 20 of 29
rate of return method helps the management attain higher profitability on investment indifferent selected and currently working solar power projects. Furthermore, the studyresults indicate that the payback period method (one of the capital budgeting techniques)positively affects the financial performance of selected and currently working solar powerprojects. The study also indicates that the payback period technique significantly impactssolar power projects and shows better financial performance if it adopts the selected andcurrently working solar power projects. These results agree with the study results of [133],which implies that applying the payback period technique for assessing financial planningwhile making investment decisions improves the financial performance of solar powerprojects. This study also aligns with past research that the investment based on periods canrecover the investment cost and give a higher financial performance. Therefore, solar powerprojects have more investment and enjoy better financial performance; thus, there is a minorcomplication in the acquisition of solar projects in this case [134]. Consequently, investmentis increasing, and the financial performance of the solar power projects is growing.
The study makes both theoretical and empirical implications. This literary work issignificant as it contributes to economic literature. The study deals with the influence offour factors: the NPV technique, MIRR, PBP technique, and PI to enhance the performanceof selected and currently working solar power projects in the country. This study adds inliterature to introduce capital budgeting techniques to minimize the cost and risk in solarpower projects. The present study has provided the guidelines to the top managementof the private and government sector in renewable energy to adopt capital budgetingtechniques for better financial planning to enhance the performance of solar power projects.The study carries great importance to the economists of an emerging economy such asPakistan because the guidance of this study improves the performance of selected andcurrently working solar power projects. The best financial planning can reduce the costand risk of solar projects and enhance the financial performance of solar power projects.Hence, capital budgeting techniques can improve the financial position of the solar powerprojects if appropriate financial planning is adopted in the projects.
The results indicate that the profitability index has a positive relationship with thefinancial performance of the selected and currently working solar power projects. Theimprovement in the profitability index of the investment in particular solar power projectsbrings higher investment in such projects and drives higher financial performance. Theprevious study has approved these results [135]. The capital budgeting technique, such asthe profitability index, helps to make an investment considering the attainment of higherprofitability on the investment in the future. The paper concludes that investment under theprofitability index raises the performance level of solar power projects. The study resultsfurther reveal that the cost and riskiness of the capital budgeting method is not a perfectmoderator between the NPV technique and the financial performance of the selected andcurrently working solar power project. The study suggests that the cost and riskiness of theNPV technique affect the financial performance of the selected and currently working solarpower projects. These results comply with the study of [132], indicating that the cost andriskiness of the method affect both the NPV technique and the financial performance of thesolar power projects and their mutual association. The study results have also indicatedthat the cost and riskiness of the method is a considerable moderator between the internalrate of return method and the financial performance of the selected and currently workingsolar power projects in the country. These results align with the past study of [76], whichindicates that the cost and riskiness of the capital budgeting method, such as the internalrate of return method, affect the effectiveness of this method and the performance of solarpower projects.
The study suggested that the NPV technique proves to be beneficial for selected andcurrently working solar power projects to attain higher financial performance. The internalrate of return method attains higher profitability, and assessing financial planning haspositively linked the financial performance in selected and currently working solar powerprojects in Pakistan. The study results have indicated that the payback period method
Sustainability 2021, 13, 12997 21 of 29
positively correlates with the financial performance of selected and currently workingsolar power projects. The profitability index is an effective technique that helps assessthe investment’s profitability over different periods and allows the investors to makeincreased profits on the investment. The study analysis proves that the profitability index isa good source of the higher financial performance and payout of the selected and currentlyworking solar power projects in Pakistan. The findings provide appreciated guidelinesfor the ministry of water and power, policymakers, government institutions, regulators,and top management of the alternative energy development board (AEDB) to adopt thesecapital budgeting techniques for selected and currently working solar power projects in thecountry. The competent authorities should consider NPV, PBP, IRR, and PI to reduce thecost and risk and enhance the performance of selected and currently working solar powerprojects in Pakistan.
These results also align with the past study, highlighting the cost occurrence and theriskiness involved in the internal rate of return. Still, this budgeting method improves thecapital budgeting technique’s contribution to attaining the higher performance of solarpower projects [78]. Our results have shown that the cost and riskiness of the method havenot played a moderating role between the payback period technique and the performanceof the solar power projects. These results are in line with the previous study of [131]. Thestudy analyzes the influences of cost and riskiness on the effectiveness of the paybackperiod method in power projects. It shows that the cost and riskiness of the technique proveto be a perfect moderator between the payback period method and the performance of theselected and currently working solar power projects in Pakistan. Furthermore, the resultshave revealed that the cost and riskiness of the process play a moderating role between thecapital budgeting technique such as profitability index and the performance of selected andcurrently working solar power projects in the country. These results agree with the resultsof [136], which show that the cost and riskiness of the method affect both the profitabilityindex and the performance of solar power projects. Thus, the financial performance is alsoaffected by selected and currently working solar power projects in Pakistan.
6. Conclusions and Limitations
The present study examined capital budgeting techniques for assessing financial plan-ning and attaining the higher financial performance of selected and currently workingsolar power projects in Pakistan. In this regard, we scrutinized four capital budgeting tech-niques, such as the NPV technique, MIRR, PBP technique, and PI, concerning the financialperformance of the selected and currently working solar power projects in this study. TheNVP of the capital budgeting technique analyzed the cash inflows and outflows; it helpsmake profitable investments in different projects. Under this capital budgeting method,the level of investment in solar power projects is rising, raising their performance level.
The assessment of the period that an entity takes to cover the investment cost is asimple capital budgeting technique because the lack of complications obtains popularityamong the investors and raises the financial sources and financial performance of solarpower projects. Similarly, the profitability index is one of the effective capital budgetingtechniques that help to assess the investment’s profitability over different periods. It allowsthe investors to make a good choice, resulting in increased profits on the investment.The study analyzed that the profitability index is a good source of the higher financialperformance of the selected and currently working solar power projects in Pakistan. Besides,the study examined the cost and risks by adopting particular capital budgeting techniques,including the NPV technique, MIRR, PBP technique, and PI, concerning the selected andcurrently working solar power projects. As a result, the influence and effectiveness of theNPV technique attained the higher financial performance of the selected and currentlyworking solar power projects in Pakistan.
Thus, the study shows that these capital budgeting techniques positively correlatewith capital investment, return on capital, and cost and risk for sustainable developmentof the selected and currently working solar energy projects in Pakistan. The study also
Sustainability 2021, 13, 12997 22 of 29
examined that these techniques are the best way to assess capital investment, return oninvestment, and capital investment before investing in a solar energy project in Pakistan.The present study has proved that capital budgeting techniques are more significant andbetter for green technology, return on capital, financial management, to assess cost andriskiness, and capital cost investing in selected and currently working solar energy projectsin Pakistan. The R2 value shown in Table 6 for NPV is 0.458, which indicates that themodel has substantial explanatory power for increasing the financial performance ofselected and currently working solar power projects in Pakistan. The value of Q2 is 0.245,which shows that the model has significant predictive relevance and suggests that thefinancial performance of selected and currently working solar power projects is increasingthrough CBTs. The variables show a meaningful relationship of a PBP of l in the model;the t values are more critical than (1.64), and the profitability index positively impactsfinancial performance. The importance of moderated variables has positive signs andshows an entirely substantial relationship in the structural assessment model for selectedand currently working solar projects in Pakistan. The study has also disclosed that thesetechniques and their moderation adopted in this research have a positive and significantimpact on the performance of selected solar energy projects in Pakistan.
Similarly, the study prompts introducing the cost and riskiness of the method as amoderator between the capital as mentioned-above budgeting techniques and the financialperformance of the selected and currently working solar power projects. The study alsoproves which techniques are more profitable in different circumstances and improves thefinancial performance for sustainable development of selected and currently working solarpower projects. Despite its theoretical and empirical implication, the current study hasseveral limitations that future authors should recover. First, the study has analyzed theinfluences of four capital budgeting techniques such as the NPV technique, MIRR, PBPtechnique, and PI on the financial performance of selected and currently working solarpower projects in Pakistan. At the same time, the other capital budgeting techniques, suchas discounted payback period, modified internal rate of return, etc., and other economicfactors affecting the financial performance of solar power projects have been completelyneglected. Therefore, the authors in the future must also analyze the rest of the capitalbudgeting techniques and economic factors while replicating these study results.
Similarly, the study has kept the financial performance of selected and currentlyworking solar power projects launched in Pakistan, a developing economy. Thus, theresearch is not equally valid in both developing and developed countries. Therefore,future authors must analyze the influences of capital budgeting techniques on the financialperformance of solar power projects in developed economies.
Author Contributions: Conceptualization, S.A.; Data curation, M.I.; Formal analysis, S.A.; Fundingacquisition, Q.Y.; Methodology, S.A.; Project administration, M.I.; Software, M.I.; Supervision, Q.Y.and M.I.; Writing—original draft, S.A.; Writing—review and editing, M.S.H., M.I., M.A., A.R., V.D.,and C.I. All authors have read and agreed to the published version of the manuscript.
Funding: This research received no external funding.
Institutional Review Board Statement: The study was conducted according to the guidelines of theDeclaration of Helsinki, and approved by the Institutional Review Board of Superior University,Pakistan (protocol code 634-2 on 12-07-2021).
Informed Consent Statement: Informed consent was obtained from all subjects involved in the study.
Data Availability Statement: The data that support the findings of this study are available from thecorresponding author upon reasonable request.
Conflicts of Interest: The authors declared no potential conflicts of interest concerning this article’sresearch, authorship, and publication.

Sustainability 2021, 13, 12997 23 of 29
Appendix A
Table A1. List of questions and how respondents countered in the semi-structured interview.
Part A: Demographic Characteristics of the Respondents
Characteristics Options Frequency Percentage
Gender Male 41 93.18Female 3 6.81
Age 26–30 years 3 6.8131–40 11 2541–55 13 29.5456–65 12 27.27
65 and above 5 11.36Education of respondents Bachelor 20.45
Master 52.27MS/MPhil 27.27
Selected industry Surgical sector 9 20.45Cotton weaving 13 29.54
Cosmetic industry 12 27.27Sports goods industry 10 22.72
Solar panel brand nameadopted by the owners Jinko Eagle 72 H.M. G2 13 29.54
Trina solar TSM 10 22.72Sun power x22 9 20.45
Ja solar MR series 7 15.9Hanwha Q cell Speak Duo 5 11.36
Job experience 1–5 years 7 15.96–10 years 11 25
11–15 years 9 20.45More than 15 years 17 38.63
Part B: Influencing Factors of Sustainable Development of Solar Power Projects
Variables Items Questions Percentage
Net present value technique NPVT1 Solar energy projects are demandingcapital budgeting planning 26.3
NPVT2 The net present value approach can assessthe profitable project of solar energy 24.4
NPVT3 Capital budgeting techniques can supportthe development of solar energy 13.2
NPVT4
The net present value technique candetermine the long-term investment and
differences in cash flows for solarenergy projects
11.5
NPVT5Long-term business and financial planningare necessary for solar energy projects by
using net present value12.9
NPVT6There is a need to use net present value
technique to attract investors and foreigndirect investment in a solar energy project
11.7
Internal rate of return method IRRM1 The internal rate of return approach canassess the profitable project of solar energy 29.1
IRRM2A firm can decide investment in a solar
energy project with an internal rateof return
32.2
IRRM3There is a need to adopt an internal rate ofreturn to assess return on capital for a solar
energy project24.4
IRRM4Solar energy projects require innovative
and rational financial decisions by using aninternal rate of return
14.3

Sustainability 2021, 13, 12997 24 of 29
Table A1. Cont.
Part B: Influencing Factors of Sustainable Development of Solar Power Projects
Variables Items Questions Percentage
Payback period technique PBPT1 The payback period approach can assessthe profitable project of solar energy 23.7
PBPT2 There is a need to assess the duration ofcapital return for solar energy systems 25.9
PBPT3 The payback period technique can assessthe initial investment cost. 24.3
PBPT4There is a need to boost up the solar energy
project by using the payback periodtechnique
13.3
PBPT5The payback period approach is suitable
for analyzing the solar energy projectperformance
12.8
Profitability index PI1The profitability index technique shows the
relationship between payout andinvestment of the solar energy project
22.6
PI2The profitability index provides the best
estimation of the financial performance ofthe solar power projects
14.3
PI3 Solar energy projects need to calculate theirperformance using the profitability index 16.3
PI4
There is a need to indicate the relationshipbetween investment of the project and
payout of the project using the profitabilityindex.
17.7
PI5 The profitability index is a suitabletechnique to assess solar energy projects 17.2
PI6There is a need to know the suitable solar
power project for investment using theprofitability index
11.7
Cost and riskiness method CRM1The cost of capital budgeting technique
influences the performance of solar energyprojects
29.7
CRM2 The cost of the techniques influences itsselection and rejection. 26.3
CRM3There is a need to assess the risk and cost of
the capital budgeting technique tominimize it
22.6
CRM4 The riskiness of the techniques influencesits selection and rejection. 21.4
Financial performance of solarpower project FPSPP1
Financial performance is a subjectivemeasure in which a solar firm can maintain
the standards to use assets and generaterevenue
29.1
FPSPP2 Financial planning for solar energy projectsis necessary to assess financial performance 27.2
FPSPP3There is a need to compare the same solarprojects for their financial health through
capital budgeting techniques13.1
FPSPP4The financial performance of the solarpower project can be assessed through
capital budgeting techniques19.4
FPSPP5 There is a need to analyze the financialperformance of the solar power project 11.2

Sustainability 2021, 13, 12997 25 of 29
References1. Ahmad, F.; Draz, M.U.; Chandio, A.A.; Su, L.; Ahmad, M.; Irfan, M. Investigating the myth of smokeless industry: Environmental
sustainability in the ASEAN countries and the role of service sector and renewable energy. Environ. Sci. Pollut. Res. 2021, 28,55344–55361. [CrossRef]
2. Tanveer, A.; Zeng, S.; Irfan, M. Do Perceived Risk, Perception of Self-Efficacy, and Openness to Technology Matter for Solar PVAdoption? An Application of the Extended Theory of Planned Behavior. Energies 2021, 14, 5008. [CrossRef]
3. Jan, A.; Xin-gang, Z.; Ahmad, M.; Irfan, M.; Ali, S. Do economic openness and electricity consumption matter for environmentaldeterioration: Silver bullet or a stake? Environ. Sci. Pollut. Res. 2021, 28, 54069–54084. [CrossRef] [PubMed]
4. Akram, R.; Chen, F.; Khalid, F.; Huang, G.; Irfan, M. Heterogeneous effects of energy efficiency and renewable energy on economicgrowth of BRICS countries: A fixed effect panel Quantile Regression Analysis. Energy 2020, 215, 119019. [CrossRef]
5. Hussain, A.; Oad, A.; Ahmad, M.; Irfan, M. Do financial development and economic openness matter for economic progress in anemerging country ? Seeking a sustainable development path. J. Risk Financ. Manag. 2021, 14, 237. [CrossRef]
6. Mukeshimana, M.C.; Zhao, Z.Y.; Ahmad, M.; Irfan, M. Analysis on barriers to biogas dissemination in Rwanda: AHP approach.Renew. Energy 2020, 163, 1127–1137. [CrossRef]
7. Irfan, M.; Ahmad, M. Relating consumers’ information and willingness to buy electric vehicles: Does personality matter? Transp.Res. Part D Transp. Environ. 2021, 100, 103049. [CrossRef]
8. Panji Galih Kusumo Adie Capital Budgeting Analysis to Assess the Karaoke Business Feasibility Panji. Pinisi Discret. Rev. 2019, 3,47–52. [CrossRef]
9. Dagar, V.; Khan, M.K.; Alvarado, R.; Rehman, A.; Irfan, M.; Adekoya, O.B.; Fahad, S. Impact of renewable energy consumption,financial development and natural resources on environmental degradation in OECD countries with dynamic panel data. Environ.Sci. Pollut. Res. 2021, 1–11. [CrossRef]
10. Abdelhady, S. Performance and cost evaluation of solar dish power plant: Sensitivity analysis of levelized cost of electricity(LCOE) and net present value (NPV). Renew. Energy 2021, 168, 332–342. [CrossRef]
11. Wu, H.; Ba, N.; Ren, S.; Xu, L.; Chai, J.; Irfan, M. The impact of internet development on the health of Chinese residents:Transmission mechanisms and empirical tests. Socioecon. Plann. Sci. 2021, 101178. [CrossRef]
12. Elavarasan, R.M.; Leoponraj, S.; Dheeraj, A.; Irfan, M.; Gangaram Sundar, G.; Mahesh, G.K. PV-Diesel-Hydrogen fuel cell basedgrid connected configurations for an institutional building using BWM framework and cost optimization algorithm. Sustain.Energy Technol. Assess. 2021, 43, 100934. [CrossRef]
13. Irfan, M.; Hao, Y.; Ikram, M.; Wu, H.; Akram, R.; Rauf, A. Assessment of the public acceptance and utilization of renewableenergy in Pakistan. Sustain. Prod. Consum. 2021, 27, 312–324. [CrossRef]
14. Irfan, M.; Zhao, Z.-Y.; Ahmad, M.; Mukeshimana, M. Solar energy development in Pakistan: Barriers and policy recommendations.Sustainability 2019, 11, 1206. [CrossRef]
15. Fahd Amjad, L.A.S. Identification and assessment of sites for solar farms development using GIS and density based clusteringtechnique—A case of Pakistan. Renew. Energy 2020, 155, 761–769. [CrossRef]
16. Awan, U.; Knight, I. Domestic sector energy demand and prediction models for Punjab Pakistan. J. Build. Eng. 2020, 32, 101790.[CrossRef]
17. Rafique, M.M.; Rehman, S. National energy scenario of Pakistan—Current status, future alternatives, and institutional infrastruc-ture: An overview. Renew. Sustain. Energy Rev. 2017, 69, 156–167. [CrossRef]
18. Irfan, M.; Zhao, Z.Y.; Rehman, A.; Ozturk, I.; Li, H. Consumers’ intention-based influence factors of renewable energy adoptionin Pakistan: A structural equation modeling approach. Environ. Sci. Pollut. Res. 2021, 28, 432–445. [CrossRef] [PubMed]
19. Irfan, M.; Zhao, Z.Y.; Li, H.; Rehman, A. The influence of consumers’ intention factors on willingness to pay for renewable energy:A structural equation modeling approach. Environ. Sci. Pollut. Res. 2020, 27, 21747–21761. [CrossRef] [PubMed]
20. Irfan, M.; Zhao, Z.Y.; Mukeshimana, M.C.; Ahmad, M. Wind energy development in South Asia: Status, potential and policies.In Proceedings of the 2019 2nd International Conference on Computing, Mathematics and Engineering Technologies, iCoMET,Sindh, Pakistan, 30–31 January 2019; pp. 1–6.
21. Irfan, M.; Zhao, Z.Y.; Panjwani, M.K.; Mangi, F.H.; Li, H.; Jan, A.; Ahmad, M.; Rehman, A. Assessing the energy dynamics ofPakistan: Prospects of biomass energy. Energy Rep. 2020, 6, 80–93. [CrossRef]
22. Irfan, M.; Zhao, Z.Y.; Ahmad, M.; Rehman, A. A techno-economic analysis of off-grid solar PV system: A case study for PunjabProvince in Pakistan. Processes 2019, 7, 708. [CrossRef]
23. Irfan, M.; Zhao, Z.Y.; Ikram, M.; Gilal, N.G.; Li, H.; Rehman, A. Assessment of India’s energy dynamics: Prospects of solar energy.J. Renew. Sustain. Energy 2020, 12, 053701. [CrossRef]
24. IEA International Energy Agency (IEA). World Energy Statistics Report 2020. Available online: https://www.iea.org/ (accessedon 11 June 2021).
25. Rafique, M.M.; Rehman, S.; Alhems, L.M. Assessment of solar energy potential and its deployment for cleaner production inPakistan. J. Mech. Sci. Technol. 2020, 34, 3437–3443. [CrossRef]
26. Azam, M.; Khan, A.Q.; Ozturk, I. The effects of energy on investment, human health, environment and economic growth:Empirical evidence from China. Environ. Sci. Pollut. Res. 2019, 26, 10816–10825. [CrossRef]
27. Batra, R.; Verma, S. Capital budgeting practices in Indian companies. IIMB Manag. Rev. 2017, 29, 29–44. [CrossRef]
Sustainability 2021, 13, 12997 26 of 29
28. Battisti, F.; Campo, O. A Methodology for Determining the Profitability Index of Real Estate Initiatives Involving Public—PrivatePartnerships. A Case Study: The Integrated Intervention Programs in Rome. Sustainability 2019, 11, 1371. [CrossRef]
29. Alternative Energy Development Board (AEDB). Current Status of Solar PV Power Projects. Available online: https://www.aedb.org/ae-technologies/solar-power/solar-current-status (accessed on 18 July 2021).
30. Chandio, A.A.; Jiang, Y.; Akram, W.; Adeel, S.; Irfan, M.; Jan, I. Addressing the effect of climate change in the framework offinancial and technological development on cereal production in Pakistan. J. Clean. Prod. 2021, 288, 125637. [CrossRef]
31. Khan, I.; Hou, F.; Irfan, M.; Zakari, A.; Phong, H. Does energy trilemma a driver of economic growth ? The roles of energy use,population growth, and financial development. Renew. Sustain. Energy Rev. 2021, 146, 111157. [CrossRef]
32. Li, Y.; Yang, X.; Ran, Q.; Wu, H.; Irfan, M.; Ahmad, M. Energy structure, digital economy, and carbon emissions: Evidence fromChina. Environ. Sci. Pollut. Res. 2021, 1–24. [CrossRef]
33. Razzaq, A.; Ajaz, T.; Li, J.C.; Irfan, M.; Suksatan, W. Investigating the asymmetric linkages between infrastructure development,green innovation, and consumption-based material footprint: Novel empirical estimations from highly resource-consumingeconomies. Resour. Policy 2021, 74, 102302. [CrossRef]
34. Rehman, A.; Ma, H.; Chishti, M.Z.; Ozturk, I.; Irfan, M.; Ahmad, M. Asymmetric investigation to track the effect of urbanization,energy utilization, fossil fuel energy and CO2 emission on economic efficiency in China: Another outlook. Environ. Sci. Pollut.Res. 2021, 28, 17319–17330. [CrossRef] [PubMed]
35. Rehman, A.; Ma, H.; Ozturk, I.; Ahmad, M.; Rauf, A.; Irfan, M. Another outlook to sector-level energy consumption in Pakistanfrom dominant energy sources and correlation with economic growth. Environ. Sci. Pollut. Res. 2021, 28, 33735–33750. [CrossRef]
36. Wang, J.; Wang, W.; Ran, Q.; Irfan, M.; Ren, S.; Yang, X.; Wu, H.; Ahmad, M. Analysis of the mechanism of the impact of internetdevelopment on green economic growth: Evidence from 269 prefecture cities in China. Environ. Sci. Pollut. Res. 2021, 1–15.[CrossRef] [PubMed]
37. Yang, C.; Hao, Y.; Muhammad, I. Energy consumption structural adjustment and carbon neutrality in the post-COVID-19 era.Struct. Chang. Econ. Dyn. 2021, 59, 442–453. [CrossRef]
38. Qiu, W.; Zhang, J.; Wu, H.; Irfan, M.; Ahmad, M. The role of innovation investment and institutional quality on green total factorproductivity: Evidence from 46 countries along the “Belt and Road”. Environ. Sci. Pollut. Res. 2021. ahead of print. [CrossRef][PubMed]
39. Isık, C.; Ongan, S.; Bulut, U.; Karakaya, S.; Irfan, M.; Alvarado, R.; Ahmad, M.; Rehman, A. Reinvestigating the EnvironmentalKuznets Curve (EKC) hypothesis by a composite model constructed on the Armey curve hypothesis with government spendingfor the US States. Environ. Sci. Pollut. Res. 2021. ahead of print. [CrossRef]
40. Perpiña, C.; Batista, F.; Lavalle, C. An assessment of the regional potential for solar power generation in EU-28. Energy Policy2020, 88, 86–99. [CrossRef]
41. Kamran, M. Current status and future success of renewable energy in Pakistan. Renew. Sustain. Energy Rev. 2018, 82, 609–617.[CrossRef]
42. Kamran, M.; Mudassar, M.; Abid, I.; Fazal, M.R.; Rukh, S. Reconsidering the Power Structure of Pakistan. Int. J. Renew. EnergyRes. 2019, 9, 480–492.
43. Karenlampi, P.P. Net present value of multiannual growth in the absence of periodic boundary conditions. Agric. Financ. Rev.2020, 81, 39–50. [CrossRef]
44. Kassem, Y.; Çamur, H.; Alhuoti, S.M.A. Solar energy technology for northern cyprus: Assessment, statistical analysis, andfeasibility study. Energies 2020, 13, 940. [CrossRef]
45. Kawabataa, Y.; Kato, E.; Yokota, H.; Lwanami, M. Net present value as an effective indicator leading to preventive maintenanceof port mooring facilities. Struct. Infrastruct. Eng. 2019, 16, 714–725. [CrossRef]
46. Khalil, H.B.; Zaidi, S.J.H. Energy crisis and potential of solar energy in Pakistan. Renew. Sustain. Energy Rev. 2014, 31, 194–201.[CrossRef]
47. Kozlovskyi, A.; Bilenko, D.; Kozlovskyi, S.; Lavrov, R.; Skydan, O.; Ivanyuta, N. Determination of the risk-free rate of return onan investment efficiency based on the fractal markets hypothesis. Pap. Present. Forum Sci. Oecon. 2020, 8, 61–72. [CrossRef]
48. Shakhovska, N.; Medykovskyy, M.O. Advances in Intelligent Systems and Computing IV; Springer: New Delhi, India, 2019;ISBN 9783030336943.
49. Mahapatra, M.S.; Raveendran, J.; De, A. Building a model on influence of behavioural and cognitive factors on personal financialplanning: A study among indian households. Glob. Bus. Rev. 2019, 20, 996–1009. [CrossRef]
50. Saurabh Chadha, S.K.S. Capital budgeting practices: A survey in the selected Indian manufacturing firms. Int. J. Ind. Cult. BusManag. 2019, 18, 381–390. [CrossRef]
51. Christensen, P.H. A post-global financial crisis (GFC) framework for strategic planning, assessment and management decisionmaking for U.S. sustainable commercial real estate. J. Prop. Investig. Financ. 2017, 35, 589–618. [CrossRef]
52. Chacon, M.C.; Diaz, J.A.R.; Morillo, J.G.; McNabola, A. Pump-as-turbine selection methodology for energy recovery in irrigationnetworks: Minimising the payback period. Water 2019, 11, 149. [CrossRef]
53. Crosby, N.; Devaney, S.; Wyatt, P. The implied internal rate of return in conventional residual valuations of development sitesvaluations of development sites. J. Prop. Res. 2018, 35, 234–251. [CrossRef]
54. Martinek, J.; Jorgenson, J.; Mehos, M.; Denholm, P. A comparison of price-taker and production cost models for determiningsystem value, revenue, and scheduling of concentrating solar power plants. Appl. Energy 2018, 231, 854–865. [CrossRef]

Sustainability 2021, 13, 12997 27 of 29
55. Mirjat, N.H.; Uqaili, M.A.; Harijan, K.; Valasai, G.D.; Shaikh, F.; Waris, M. A review of energy and power planning and policies ofPakistan. Renew. Sustain. Energy Rev. 2017, 79, 110–127. [CrossRef]
56. Zore, Ž.; Cucek, L.; Širovnik, D.; Kravanja, Z. Maximizing the sustainability net present value of renewable energy supplynetworks. Chem. Eng. Res. Des. 2018, 131, 245–265. [CrossRef]
57. Fleten, S.; Linnerud, K.; Molnár, P.; Nygaard, M.T. Green electricity investment timing in practice: Real options or net presentvalue? Energy 2016, 116, 498–506. [CrossRef]
58. Mubashar, A.; Tariq, B.T. Capital budgeting decision-making practices: Evidence from Pakistan. J. Adv. Manag. Res. 2018, 12,55–82. [CrossRef]
59. Nekhaychuk, D.V.; Nogas, I.L.; Vernadsky, V.I.; Nekhaychuk, E.V.; Vernadsky, V.I. The Financial Planning and Its Tasks in ModernModels of Enterprise Management; Atlantis Press: Amsterdam, The Netherlands, 2019; Volume 83, pp. 38–41.
60. Kameni, M.; Christophe, J.; Noelson, V.; Saadi, I.; Kenfack, H.; Andrianaharinjaka, A.F.R.; Foumouo, D.; Barahimo, J.; Reiter, S.Application of phase change materials, thermal insulation, and external shading for thermal comfort improvement and coolingenergy demand reduction in an o ffi ce building under di ff erent coastal tropical climates. Sol. Energy 2020, 207, 458–470.[CrossRef]
61. Ozcan, O.; Ersoz, F. Engineering Science and Technology, an International Journal Project and cost-based evaluation of solarenergy performance in three different geographical regions of Turkey: Investment analysis application. Eng. Sci. Technol. Int. J.2019, 22, 1098–1106. [CrossRef]
62. López Prol, J.; Steininger, K.W. Photovoltaic self-consumption is now profitable in Spain: Effects of the new regulation onprosumers’ internal rate of return. Energy Policy 2020, 146, 11793. [CrossRef]
63. Castro-Santos, L.; Filgueira-Vizoso, A.; Piegari, L. Calculation of the Levelized Cost of Energy and the Internal Rate of Returnusing GIS: The case study of a floating wave energy farm. In Proceedings of the 2019 International Conference on Clean ElectricalPower (ICCEP), Otranto, Italy, 2–4 July 2019; pp. 674–679.
64. Powell, J.W.; Welsh, J.M.; Farquharson, R. Investment analysis of solar energy in a hybrid diesel irrigation pumping system inNew South Wales, Australia. J. Cleaner Prod. 2019, 224, 444–454. [CrossRef]
65. Park, K.; Lee, G.; Lee, B. Study on theoretical research to reduce fire risk of solar power system. J. Korean Soc. Ind. Converg. 2020,23, 219–224. [CrossRef]
66. Pellerin, R.; Perrier, N. A review of methods, techniques and tools for project planning and control. Int. J. Prod. Res. 2019, 57,2160–2178. [CrossRef]
67. Wijesuriya, D.T.P.; Wickramathilaka, K.D.S.H.; Wijesinghe, L.S.; Vithana, D.M.; Perera, H.Y.R. Reduction of solar PV paybackperiod using optimally placed reflectors. Energy Procedia 2017, 134, 480–489. [CrossRef]
68. Sotnyk, I.; Sotnyk, I.; Momotiuk, L. Yulija Chortok Management of renewable energy innovative development in Ukrainianhouseholds: Problems of financial support. Mark. Manag. Innov. 2018, 6718, 150–160. [CrossRef]
69. Rai, K.; Tyagi, A.; Sahni, S. Modelling the factors of financial planning for retirement among individuals using ISM. J. Crit. Rev.2020, 7, 1547–1558.
70. Raj, A.N. Identifying appropriate Project Required Return. Psychol. Educ. J. 2020, 57, 4027–4036.71. Rich, S.P.; Rose, J.T.; Delaney, C.J. Net present value analysis in finance and real estate: A clash of methodologies. J. Real Estate
Portf. Manag. 2018, 24, 83–94. [CrossRef]72. Mohanty, S.; Rout, A.; Patra, P.K.; Sahoo, S.S. ANFIS based solar radiation data forecasting for energy & economic study of solar
water heaters in Eastern India. Int. J. Control Theory Appl. 2017, 10, 179–190.73. Ruggiero, S.; Lehkonen, H. Renewable energy growth and the fi nancial performance of electric utilities: A panel data study. J.
Clean. Prod. 2017, 142, 3676–3688. [CrossRef]74. Yoomak, S.; Patcharoen, T.; Ngaopitakkul, A. Performance and economic evaluation of solar rooftop systems in different regions
of Thailand. Sustainability 2019, 11, 6647. [CrossRef]75. Ullah, H.; Kamal, I.; Ali, A.; Arshad, N. Investor Focused Placement and Sizing of Photovoltaic Grid-Connected Systems in Pakistan;
Elsevier Ltd.: Amsterdam, The Netherlands, 2018; Volume 121, ISBN 9242358983.76. Salvi, A.; Petruzzella, F.; Giakoumelou, A. Does sustainability foster the cost of equity reduction? The relationship between
corporate social responsibility (CSR) and riskiness worldwide. Afr. J. Bus. Manag. 2018, 12, 381–397. [CrossRef]77. Sarper, H.; Chacon, P.; Demirtas, M.; Melnykov, I.; Palak, G.; Fraser, J.M. Distribution of the Internal and External Rates of Return
in a Partially Stochastic.Oil Pump Problem. Eng. Econ. 2018, 2701, 343–362. [CrossRef]78. Sarwary, Z. Strategy and capital budgeting techniques: The moderating role of entrepreneurial structure. Int. J. Manag. Financ.
Account. 2020, 12, 48–70. [CrossRef]79. Schlegel, D.; Frank, F.; Britzelmaier, B. Investment decisions and capital budgeting practices in German manufacturing companies.
Int. J. Bus. Glob. 2016, 16, 66–78. [CrossRef]80. Shin, H.; Kim, E. Meta-analysis of rate of return on road projects. Transp. Lett. 2017, 11, 190–199. [CrossRef]81. Siziba, S.; Hall, J.H. The evolution of the application of capital budgeting techniques in enterprises. Glob. Financ. J. 2019,
47, 100504. [CrossRef]82. Martínez-Ruiz, Y.; Manotas-Duque, D.F.; Ramírez-Malule, H. Evaluation of investment projects in photovoltaic solar energy
using the dnpv methodology. Int. J. Energy Econ. Policy 2020, 11, 180–185. [CrossRef]

Sustainability 2021, 13, 12997 28 of 29
83. Guindon, A.; Wright, D.J. Analytical approach to quantitative risk assessment for solar power projects. Renew. Sustain. EnergyRev. 2020, 133, 110262. [CrossRef]
84. Suphahitanukool, C.; Hunsacharoonroj, I.; Usapein, P.; Khedari, J. An evaluation of economic potentialsolar photovoltaic farmin Thailand: Case study of polycrystalline silicon and amorphous silicon thin film. Int. J. Energy Econ. Policy 2018, 8, 33–41.[CrossRef]
85. Jadidi, H.; Firouzi, A.; Rastegar, M.A.; Zandi, M. Bayesian updating of solar resource data for risk mitigation in project finance.Sol. Energy 2020, 207, 1390–1403. [CrossRef]
86. Jae, K.; Lee, H.; Koo, Y. Research on local acceptance cost of renewable energy in South Korea: A case study of photovoltaic andwind power projects. Energy Policy 2020, 144, 111684. [CrossRef]
87. Tsalikis, G.; Martinopoulos, G. ScienceDirect Solar energy systems potential for nearly net zero energy residential buildings. Sol.Energy 2015, 115, 743–756. [CrossRef]
88. Chang, B.; Starcher, K. Evaluation of wind and solar energy investments in Texas. Renew. Energy 2019, 132, 1348–1359. [CrossRef]89. Zhang, M.M.; Zhou, P.; Zhou, D.Q. A real options model for renewable energy investment with application to solar photovoltaic
power generation in China. Energy Econ. 2016, 26, 17–21. [CrossRef]90. Nojavan, S.; Pashaei-Didani, H.; Saberi, K.; Zare, K. Risk assessment in a central concentrating solar power plant. Sol. Energy
2019, 180, 293–300. [CrossRef]91. Fernández Peruchena, C.M.; Ramírez, L.; Silva-Pérez, M.A.; Lara, V.; Bermejo, D.; Gastón, M.; Moreno-Tejera, S.; Pulgar, J.; Liria, J.;
Macías, S.; et al. A statistical characterization of the long-term solar resource: Towards risk assessment for solar power projects.Sol. Energy 2016, 123, 29–39. [CrossRef]
92. Wiesinger, F.; Sutter, F.; Wolfertstetter, F.; Hanrieder, N.; Fernández-García, A.; Pitz-Paal, R.; Schmücker, M. Assessment of theerosion risk of sandstorms on solar energy technology at two sites in Morocco. Sol. Energy 2018, 162, 217–228. [CrossRef]
93. Ahmad, M.; Jabeen, G.; Irfan, M.; Isık, C.; Rehman, A. Do inward foreign direct investment and economic development improvelocal environmental quality: Aggregation bias puzzle. Environ. Sci. Pollut. Res. 2021, 34676–34696. [CrossRef]
94. Isık, C.; Ahmad, M.; Ongan, S.; Ozdemir, D.; Irfan, M.; Alvarado, R. Convergence analysis of the ecological footprint: Theory andempirical evidence from the USMCA countries. Environ. Sci. Pollut. Res. 2021, 28, 32648–32659. [CrossRef] [PubMed]
95. Isik, C.; Ongan, S.; Ozdemir, D.; Ahmad, M.; Irfan, M.; Alvarado, R.; Ongan, A. The increases and decreases of the environmentKuznets curve (EKC) for 8 OECD countries. Environ. Sci. Pollut. Res. 2021, 28, 28535–28543. [CrossRef]
96. Irfan, M.; Zhao, Z.Y.; Ahmad, M.; Batool, K.; Jan, A.; Mukeshimana, M.C. Competitive assessment of Indian wind power industry:A five forces model. J. Renew. Sustain. Energy 2019, 11, 063301. [CrossRef]
97. Irfan, M.; Hao, Y.; Panjwani, M.K.; Khan, D.; Chandio, A.A.; Li, H. Competitive assessment of South Asia’s wind power industry:SWOT analysis and value chain combined model. Energy Strateg. Rev. 2020, 32, 100540. [CrossRef]
98. Mukherji, R.; Mathur, V.; Bhati, A.; Mukherji, M. Assessment of 50 kWp rooftop solar photovoltaic plant at The ICFAI University,Jaipur: A case study. Environ. Prog. Sustain. Energy 2020, 39, 1–14. [CrossRef]
99. Zeraatpisheh, M.; Arababadi, R.; Pour, M.S. Economic analysis for residential solar PV systems based on different demand chargetariffs. Energies 2018, 11, 3271. [CrossRef]
100. Murshed, M.; Abbass, K.; Rashid, S. Modelling renewable energy adoption across south Asian economies: Empirical evidencefrom Bangladesh, India, Pakistan and Sri Lanka. Int. J. Financ. Econ. 2020, 26, 5425–5450. [CrossRef]
101. Moncecchi, M.; Meneghello, S.; Merlo, M. A Game Theoretic Approach for Energy Sharing in the Italian Renewable EnergyCommunities. Appl. Sci. 2020, 10, 8166. [CrossRef]
102. Shahid, M.; Firoz, N.M.S.; Dadu, M. Risk analysis in implementation of solar energy projects in kerala risk analysis in implementa-tion of solar energy projects in Kerala. In Proceedings of the International Conference on Aerospace and Mechanical Engineering,ICAME’18, Kollam, India, 17–19 December 2019.
103. Irfan, M.; Shahid, A.L.; Ahmad, M.; Iqbal, W.; Elavarasan, R.M.; Ren, S.; Hussain, A. Assessment of public intention to getvaccination against COVID-19: Evidence from a developing country. J. Eval. Clin. Pract. 2021, 1–11. [CrossRef] [PubMed]
104. Irfan, M.; Akhtar, N.; Ahmad, M.; Shahzad, F.; Elavarasan, R.M.; Wu, H.; Yang, C. Assessing public willingness to wear facemasks during the COVID-19 pandemic: Fresh insights from the theory of planned behavior. Int. J. Environ. Res. Public Health2021, 18, 4577. [CrossRef] [PubMed]
105. Irfan, M.; Ikram, M.; Ahmad, M.; Wu, H.; Hao, Y. Does temperature matter for COVID-19 transmissibility? Evidence acrossPakistani provinces. Environ. Sci. Pollut. Res. 2021, 28, 59705–59719. [CrossRef]
106. Ahmad, M.; Akhtar, N.; Jabeen, G.; Irfan, M.; Anser, M.K.; Wu, H.; Isek, C. Intention-based critical factors affecting willingnessto adopt Novel Coronavirus prevention in Pakistan: Implications for future pandemics. Int. J. Environ. Res. Public Health 2021,18, 6167. [CrossRef]
107. Calder, B.J.; Phillips, L.W.; Tybout, A.M. Designing Research for Application. J. Consum. Res. 1981, 8, 197. [CrossRef]108. Ozawa, A.; Kudoh, Y.; Yoshida, Y. A new method for household energy use modeling: A questionnaire-based approach. Energy
Build. 2018, 162, 32–41. [CrossRef]109. Bennouna, K.; Meredith, G.G.; Marchant, T. Improved capital budgeting decision making: Evidence from Canada. Manag. Decis.
2010, 48, 225–247. [CrossRef]110. Lu, Y.; Chang, R.; Shabunko, V.; Lay Yee, A.T. The implementation of building-integrated photovoltaics in Singapore: Drivers
versus barriers. Energy 2019, 168, 400–408. [CrossRef]

Sustainability 2021, 13, 12997 29 of 29
111. Zhang, X.; Shen, L.; Chan, S.Y. The diffusion of solar energy use in HK: What are the barriers? Energy Policy 2012, 41, 241–249.[CrossRef]
112. Braunholtz-Speight, T.; Sharmina, M.; Manderson, E.; McLachlan, C.; Hannon, M.; Hardy, J.; Mander, S. Business models andfinancial characteristics of community energy in the UK. Nat. Energy 2020, 5, 169–177. [CrossRef]
113. Irfan, M.; Elavarasan, R.M.; Hao, Y.; Feng, M.; Sailan, D. An assessment of consumers’ willingness to utilize solar energy in China:End-users’ perspective. J. Clean. Prod. 2021, 292, 126008. [CrossRef]
114. Urbach, N.; Ahlemann, F. Structural Equation Modeling in Information Systems Research Using Partial Least Squares. J. Inf.Technol. Theory Appl. 2010, 11, 5–40.
115. Hair, J.F.; Sarstedt, M.; Ringle, C.M. Rethinking some of the rethinking of partial least squares. Eur. J. Mark. 2019, 53, 566–584.[CrossRef]
116. Ying, M.; Faraz, N.A.; Ahmed, F.; Raza, A. How does servant leadership foster employees’ voluntary green behavior? A sequentialmediation model. Int. J. Environ. Res. Public Health 2020, 17, 1792. [CrossRef]
117. Henseler, J.; Ringle, C.M.; Sarstedt, M. A new criterion for assessing discriminant validity in variance-based structural equationmodeling. J. Acad. Mark. Sci. 2015, 43, 115–135. [CrossRef]
118. Franziska, R.N.; Carrion, G.C.; Roldán, J.L.; Ringle, C.M. European management research using partial least squares structuralequation modeling (PLS-SEM). Eur. Manag. J. 2016, 34, 589–597.
119. Chin, W.; Newsted, P.R. Structural equation modeling analysis with small samples using partial least squares. Stat. Strateg. SmallSample Res. 1999, 1, 307–341.
120. Ramayah, T.; Ahmad, N.H.; Halim, H.A.; Rohaida, S.; Zainal, M.; Lo, M. Discriminant analysis: An illustrated example. African J.Bus. Manag. 2010, 4, 1654–1667. [CrossRef]
121. Osborne, J.W. Improving your data transformations: Applying the Box-Cox transformation. Pract. Assess. Res. Eval. 2010, 15, 12.[CrossRef]
122. Solangi, Y.A.; Shah, S.A.A.; Zameer, H.; Ikram, M.; Saracoglu, B.O. Assessing the solar PV power project site selection in Pakistan:Based on AHP-fuzzy vikor approach. Environ. Sci. Pollut. Res. 2019, 26, 30286–30302. [CrossRef] [PubMed]
123. Hair, J.F.; Risher, J.J.; Sarstedt, M.; Ringle, C.M. When to use and how to report the results of PLS-SEM. Eur. Bus. Rev. 2019, 31,2–24. [CrossRef]
124. Hair, J.F.; Ringle, C.M.; Sarstedt, M. PLS-SEM: Indeed a silver bullet. J. Mark. Theory Pract. 2011, 19, 139–152. [CrossRef]125. Hair, J.F.; Sarstedt, M.; Hopkins, L.; Kuppelwieser, V.G. Partial least squares structural equation modeling (PLS-SEM): An
emerging tool in business research. Eur. Bus. Rev. 2014, 26, 106–121. [CrossRef]126. Arbuckle, J.L. IBM SPSS Amos 20 User’s Guide; Amos Development Corporation, SPSS Inc.: Chicago, IL, USA, 2011.127. Anderson, J.C.; Gerbing, D.W. Structural Equation Modeling in Practice: A Review and Recommended Two-Step Approach.
Psychol. Bull. 1988, 103, 411–423. [CrossRef]128. Akbar, A.; Ali, S.; Ahmad, M.A.; Akbar, M.; Danish, M. Understanding the antecedents of organic food consumption in pakistan:
Moderating role of food neophobia. Int. J. Environ. Res. Public Health 2019, 16, 4043. [CrossRef]129. Cohen, J. Statistical Power Analysis for the Behavioral Sciences New York; Academic Press: Cambridge, MA, USA, 1988.130. Hair, J.F.,Jr.; Hult, G.T.M.; Ringle, C.M.; Sarstedt, M. A primer on partial least squares structural equation modeling (PLS-SEM).
Sage publications. Eur. J. Tour. Res. 2021, 6, 211–213.131. Tu, Q.; Betz, R.; Mo, J.; Fan, Y. The profitability of onshore wind and solar PV power projects in China—A comparative study.
Energy Policy 2020, 132, 404–417. [CrossRef]132. Urbanski, M.; Haque, A.U.; Oino, I. The moderating role of risk management in project planning and project success: Evidence
from construction businesses of Pakistan and the UK. Eng. Manag. Prod. Serv. 2019, 11, 23–35. [CrossRef]133. Wang, M.; Wang, G.; Sun, Z.; Zhang, Y.; Xu, D. Review of renewable energy-based hydrogen production processes for sustainable
energy innovation. Glob. Energy Interconnect. 2020, 2, 436–443. [CrossRef]134. Warren, L.; Jack, L. The capital budgeting process and the energy trilemma—A strategic conduct analysis. Br. Account. Rev. 2018,
50, 481–496. [CrossRef]135. Yuan, J.; Zhang, Y.; Zhou, L.; Zhang, C.; Lau, T.; Zhang, G.; Lu, X.; Yip, H.; So, S.K.; Beaupré, S.; et al. Fused Benzothiadiazole: A
Building Block for n-Type Organic Acceptor to Achieve High-Performance Organic Solar Cells. Adv. Mater. 2019, 1807577, 1–8.[CrossRef] [PubMed]
136. Zafar, U.; Rashid, T.U.; Khosa, A.A.; Khalil, M.S.; Rashid, M. An overview of implemented renewable energy policy of Pakistan.Renew. Sustain. Energy Rev. 2018, 82, 654–665. [CrossRef]
Copyright © 2022 FDOKUMEN