Grand Park Economic Development Vision and Strategy
360
December, 2011 Grand Park Economic Development Vision and Strategy
-
Upload
khangminh22 -
Category
Documents
-
view
1 -
download
0
Transcript of Grand Park Economic Development Vision and Strategy

December, 2011
Grand Park Economic Development Vision and Strategy
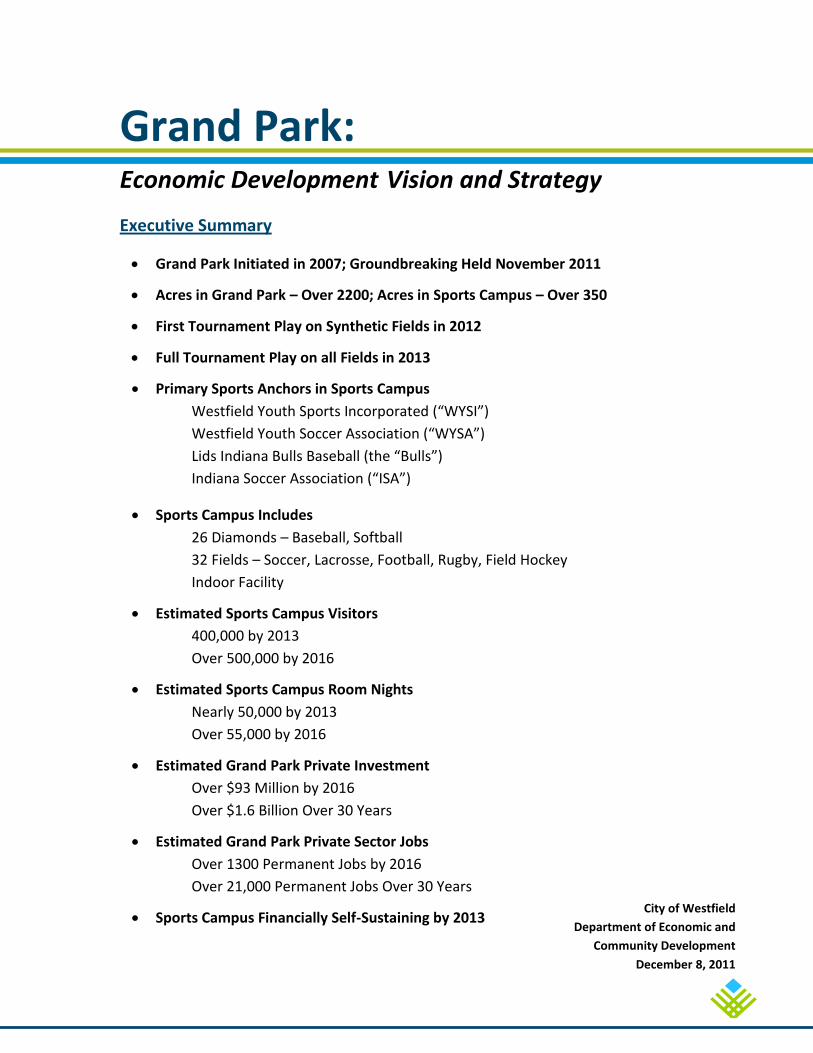
Grand Park: Economic Development Vision and Strategy Executive Summary
Grand Park Initiated in 2007; Groundbreaking Held November 2011
Acres in Grand Park – Over 2200; Acres in Sports Campus – Over 350
First Tournament Play on Synthetic Fields in 2012
Full Tournament Play on all Fields in 2013
Primary Sports Anchors in Sports Campus
Westfield Youth Sports Incorporated (“WYSI”)
Westfield Youth Soccer Association (“WYSA”)
Lids Indiana Bulls Baseball (the “Bulls”)
Indiana Soccer Association (“ISA”)
Sports Campus Includes
26 Diamonds – Baseball, Softball
32 Fields – Soccer, Lacrosse, Football, Rugby, Field Hockey
Indoor Facility
Estimated Sports Campus Visitors
400,000 by 2013
Over 500,000 by 2016
Estimated Sports Campus Room Nights
Nearly 50,000 by 2013
Over 55,000 by 2016
Estimated Grand Park Private Investment
Over $93 Million by 2016
Over $1.6 Billion Over 30 Years
Estimated Grand Park Private Sector Jobs
Over 1300 Permanent Jobs by 2016
Over 21,000 Permanent Jobs Over 30 Years
Sports Campus Financially Self-Sustaining by 2013
City of Westfield
Department of Economic and
Community Development
December 8, 2011

Grand Park Economic Development Vision and Strategy - December 8, 2011 2
Table of Contents
Introduction .......................................................................................................................... 3
History and Context of Project ...................................................................................................................... 3
The “Grand” Plan .......................................................................................................................................... 5
Sports Campus Detailed Description ...................................................................................... 7
Grand Park Economic Development Area Detailed Description .............................................. 8
Existing Conditions and Related Initiatives ............................................................................. 9
Labor ............................................................................................................................................................. 9
Income and Housing ..................................................................................................................................... 9
Education .................................................................................................................................................... 10
Local Sports Participation ........................................................................................................................... 10
AV – Trends/Current Conditions ................................................................................................................. 11
Grand Park Economic Development Area – Tax Increment Financing ....................................................... 12
Grand Park Annexation Plan ....................................................................................................................... 12
Major Moves US 31 Improvements in Hamilton County ............................................................................ 13
National Economy & Market Conditions .................................................................................................... 16
Economic Development Forecast - The Next Four Years ....................................................... 17
Economic Development Forecast - Long Term Build-Out ...................................................... 21

Grand Park Economic Development Vision and Strategy - December 8, 2011 3
I. Introduction
History and Context of Project
In 2007, the City of Westfield (the “City”) began exploring the concept of creating an
intergenerational competitive sporting destination for families (the “Sports Campus”). The City
worked closely with the Hamilton County Convention and Visitors Bureau (the “HCCVB”) in exploring
this opportunity. Together, the City and the HCCVB organized sports partners to share in the
formation of this regional, multiple sport campus vision. The HCCVB graciously provided the initial
grant money needed to study this regional sports campus concept.
Strategic Marketing and Research, Inc. was retained to study this opportunity. It completed a Retail
Analysis and Market Model Study of the sports campus concept in 2007 to determine the viability of
Westfield as a potential location for such a project (see Appendix A). The study concluded that
Westfield is a viable location for establishing a 9,000 seat sports venue.
In 2008, the HCCVB retained Hunden Strategic Partners to assemble information to be used in
planning a regional/national competitive sport venue. The findings of this report “The Hamilton
County Sports Complex Study” is included in Appendix B. Also in 2008, the City retained Financial
Solutions Group to prepare a Financial Feasibility Study for the proposal. The report concluded that
it is possible for such a facility to be completed and financed in the City of Westfield (see Appendix
C).
In 2009, the City refined the sports destination concept by clearly establishing economic
development as the overarching purpose for the City’s investment in a sports campus destination.
The initial economic development vision for the project included a land use concept that would
integrate sports, recreation, health and fitness, life sciences, hospitality and other supporting and
thematically related uses to create “The Family Sports Capital of America” (a/k/a “Grand Park”).
In 2009, the Westfield Sports Commission (the “Sports Commission”) was formed which included a
number of stakeholders and interested participants, including representatives from HCCVB, The City
of Westfield, citizens of the Westfield community, real estate professionals, Westfield Washington
School Corporation, Hamilton County Parks, Westfield Youth Soccer Association (“WYSA”), Westfield
Youth Sports Incorporated (“WYSI”), and other interested people/organizations. The Sports
Commission was formed to review the viability of the sports initiative and to provide the City with
feedback and recommendations related to the project.
On July 24, 2009 the Sports Commission completed the Westfield Family Sports Complex, Phase I
Report (see Appendix D). This report concluded that the family sports destination is a viable project
for the City of Westfield. The report also recommended further evaluation of this opportunity. In
August 2009 the Westfield Washington Township Comprehensive Plan was amended to include and
endorse the vision of Grand Park (see Appendix E).
On July 8, 2010, Financial Solutions Group completed an Economic Impact Analysis (see Appendix F).
This report concluded that one of the locations the City was considering for its regional/national

Grand Park Economic Development Vision and Strategy - December 8, 2011 4
sports destination, the location at the northwest quadrant of U.S. Highway 31 (“US 31”) and State
Highway 32 (“SR 32”), represented the greatest opportunity for increased tax revenue from the
City’s investment.
On September 28, 2010 the Sports Commission completed the Westfield Family Sports Complex,
Phase II Report (see Appendix G). The report identified the northwest quadrant of US 31 and SR 32
as the most viable location in Washington Township for a regional/national competitive sports
destination. The report also identified field sports, diamond sports, and an indoor training facility as
the components that should be hosted within this regional/national competitive sports destination.
The Sports Commission conducted a more refined financial analysis of the project and confirmed
that the project is a financially viable initiative that the City of Westfield should seriously consider.
In December 2010 the Westfield Washington Township Comprehensive Plan was amended to
identify the location of Grand Park – the northwest quadrant of SR 32 and US 31 (see Appendix H).
In November 2011, Hunden Strategic Partners completed a Feasibility and Business Plan Analysis for
the Sports Campus (see Appendix I). This report confirms the financial viability of the Sports Campus
and concludes that the City of Westfield has the economic and population base to support a major
sports destination.
The Sports Commission has initiated a study of governance and management options for the Sports
Campus. Recommendations from the Sports Commission are expected sometime in the next few
months. Design of the Sports Campus has been completed. Governor Mitch Daniels, Mayor Cook,
Westfield City Council, and other dignitaries participated in the Grand Park Groundbreaking
Ceremony on November 18, 2011.
The first tournament play at Grand Park is expected in 2012 on the synthetic fields. Full tournament
play on all fields is expected to commence in 2013.

Grand Park Economic Development Vision and Strategy - December 8, 2011 5
A full version of the Sports Campus map is provided in Appendix J.
The “Grand” Plan
The City has designed Grand Park to be an economic development engine for the Westfield
community, anchored by a regional/national championship sports venue called the Grand Park
Sports Campus (the “Sports Campus”). Although the Sports Campus alone is a very desirable
amenity and identity-maker for the Westfield community, the larger objective of the Sports Campus
project is to attract visitors and new business to Westfield.
In addition to being able to host regional and national sporting events, the Sports Campus is
designed to support Westfield youth and family sports. WYSI and WYSA, the two most prominent
local sports organization in the community, have been deeply involved in planning the Sports
Campus. The Sports Campus will be anchored by WYSA, WYSI, the Indiana Soccer Association, and
Lids Indiana Bulls Baseball.
The Sports Campus includes over 350 acres, located with great access to highways near SR 32 and
US 31. It is designed to accommodate: field sports (including, but not limited to, soccer, lacrosse,
football, field hockey and rugby); baseball, softball and other diamond sports; and indoor sport
activities within an indoor sports facility. The Sports Campus includes facilities to support the
hosting of championship level youth and amateur sports tournaments. The facilities could
eventually be used to accommodate professional or semi-professional sporting events as well.
The economic development area around the Sports Campus within Grand Park will include related
and supporting land uses. Such land uses will likely include hotels and hospitality uses, restaurants,
healthcare and sports medicine facilities, professional offices, retail uses, higher density residential
uses and other supporting commercial uses. The economic development area around the Sports
Campus includes approximately 2000 acres.

Grand Park Economic Development Vision and Strategy - December 8, 2011 6
Grand Park is contiguous to existing urbanized areas which is consistent with the traditional “good
planning” principles of orderly and efficient development patterns. Much of the area occupied by
Grand Park has been planned for more intense commercial and industrial development for years. As
a result, several of the City’s basic infrastructure systems have been planned and installed based on
this land use plan.
There is a significant amount of developable land within Grand Park which will provide for future
growth and expansion of sports facilities, if needed. Grand Park is designed with great vehicular
accessibility: two interchanges along US 31 and four major intersections along SR 32 will provide
excellent access to Grand Park; several thoroughfares running east/west and several running
north/south will provide excellent circulation within Grand Park. With Grand Park fronting on SR 32
and U.S. Highway 31, it will possess fantastic visibility from major thoroughfares. This will help
significantly to support economic sustainability of commercial and sports uses in the area.
Grand Park also fronts on the Monon Trail, the most popular recreational rail trail in the State. The
City has already obtained federal grants to begin acquiring and constructing the trail. This
alternative transportation connection will provide great opportunities for access to pedestrians and
cyclists, and will provide a nice link to the City’s old downtown, known as Grand Junction.
Grand Park lies a little over four miles east of the Indianapolis Executive Airport, one of Westfield’s
best kept secrets. The airport provides another great travel option for Sports Campus visitors and
business people visiting Grand Park.

Grand Park Economic Development Vision and Strategy - December 8, 2011 7
II. Sports Campus Detailed Description
The Grand Park Sports Campus is a planned 350-acre family sports destination like no other in the
State of Indiana or the Nation. The Sports Campus will feature a full range of championship-level
indoor and outdoor facilities for field and diamond sports that will be used by athletes of all ages. A
large-format map of the Sports Complex is provided at Appendix J.
The Sports Campus includes twenty-six (26) outdoor baseball and softball, turf and grass diamonds;
as well as thirty-two (32) outdoor turf and grass fields for soccer, lacrosse, football, rugby, and field
hockey. The diamonds include eight (8) high school, four (4) flex and sixteen (16) junior fields.
The fields and diamonds will be served by seven (7) concession stands located throughout the
Sports Campus. The concession stands will be sized and designed to provide restroom facilities and
press box rooms for tournament use. Connecting the facilities within the park, there will be
approximately fifteen (15) miles of trails and pathways including a trailhead on the Monon Trail at
191st Street. Parking will be especially convenient with eight (8) different parking locations along the
perimeter of the Sports Campus. Parking lots will be a combination of pavement and grass,
accommodating approximately 4,000 vehicles.
Playgrounds will be positioned in two locations within the facility: (1) adjacent to the diamonds,
north of Cool Creek; and (2) adjacent to the fields and woodland area. The woodland area, to be
known as “Wood’s Woods” (affectionately named after the previous land owner – the Wood Family)
provides a place of interest and respite in the middle of the thirty-two (32) sports fields.

Grand Park Economic Development Vision and Strategy - December 8, 2011 8
A large-format land use plan map of Grand Park is provided in Appendix K.
III. Grand Park Economic Development Area Detailed Description
The City ultimately expects over 500,000 visitors to
the Sports Campus each year. With the majority of
these visitors coming from out of town (150 miles or
more), there is a need for accommodations and
other conveniences during their stay. Approximately
400 acres in the area surrounding the Grand Park
Sports Campus have been planned for Regional Retail
and Hospitality uses. An additional 560 acres,
designated as Sports Village Mixed Use 1 and 2, will
also support, with a pedestrian friendly design,
smaller retail operations, restaurants, office space
and residential units.
Additionally, the City plans to pursue sports themed
manufacturing and distribution businesses as well as
those companies owned and operated by sports
enthusiasts. The 325 acres established for these
uses, Westfield’s Sports Corporate Campus, is
predominately located along the east side of Spring
Mill Road. Some additional sites may be found east of Dartown Road.
Immediate access to medical facilities is important for a facility like Grand Park. Additionally, the
emphasis on health, fitness and sports performance in Grand Park creates a perfect environment for
medical uses. Approximately 200 acres have been identified for Life Science Mixed-Use to
accommodate a potential hospital and supporting offices and services typically found in proximity to
such developments.
Acknowledging that Grand Park is not designed to support championship level facilities for every
sport, the City is encouraging the private sector to meet these needs within the Sports and
Recreation area of Grand Park. This 140 acre area is planned to have the same look and feel as the
Sports Campus, but to be owned and operated privately.

Grand Park Economic Development Vision and Strategy - December 8, 2011 9
IV. Existing Conditions and Related Initiatives
Westfield is a city in Hamilton County, Indiana located approximately fifteen (15) minutes from
Indianapolis. As a thriving community, Westfield was recently ranked the #1 best place to live in
the State of Indiana and #48 in the nation by CNN Money. Westfield amenities include an extensive
pedestrian trail system, connecting downtown Westfield to downtown Indianapolis and two (2) 18-
hole golf courses, The Bridgewater Club and Woodwind Golf Club, with full service clubhouses and
banquet facilities.
Labor
City of Westfield: The 2010 Census identifies the City of Westfield as having a population of 30,068,
which is a 223% increase from 2000 to 2010. The median age of Westfield residents is 32.8,
compared to 35.7 in Hamilton County, and 37 in the State of Indiana.
Hamilton County: In 2010, Hamilton County was identified as having a population of 274,569,
which is a 50.3% increase from 2000 to 2010. 144,102 residents were accounted for in the labor
force in 2010 and 8,786 residents were unemployed (6.1%).
State of Indiana: The State of Indiana possessed a population of 6,483,802 in 2010, which was a 7%
increase from 2000 to 2010. 3,129,680 residents were accounted for in the state labor force in 2010
and 277,614 residents were unemployed (8.9%).
Income and Housing
City of Westfield: The median household income in Westfield is $83,973 with the per capita income
is $32,909. The median home value in Westfield is $201,500. Housing growth in Westfield has seen
a 740% increase since 1990. Despite the challenges present in our national economy the growth
rate of single-family starts in Westfield remains strong (see Westfield Single-Family New Home
Starts chart below).
Hamilton County: The median household income in Hamilton County is $81,411 and the per capita
income being $38,181. The median home value in Hamilton County is $214,600. Housing growth in
the county has seen a 160% increase since 1990.
Year Westfield Single-Family New Home Starts
2011 260 Projected
2010 233
2009 182
2008 254
2007 402
2006 403

Grand Park Economic Development Vision and Strategy - December 8, 2011 10
Education
Westfield Washington Schools’ mission is to provide meaningful and engaging work in pursuit of
profound learning to all students served in the City’s nine (9) schools. Westfield Washington Schools
has had the highest graduation rate in Hamilton County for the past three years (2008 – 2010) and is
on track to maintain that statistic for the 2011 school year as well.
The graduation rate for Westfield High School has increased over the past six (6) years and
exemplifies the importance education is to the community. Enrollment for 2011-2012 is 1,840 with
440 seniors, 455 juniors, 487 sophomores and 458 freshmen. The following chart identifies the
graduation rates since 2006 and the amounts of scholarships awarded and received:
Year Graduation Rate Scholarships
2011 93.2% $3.1 million
2010 96.1% $3.2 million
2009 94.7% $3.3 million
2008 92.9% $3.1 million
2007 89.6% $2.0 million
2006 86.1% $1.7 million
Local Sports Participation
Westfield Youth Sports Incorporated (WYSI):
WYSI has a mission to promote amateur youth sports to school-age kids living within the Westfield
Washington School District in Hamilton County, Indiana by fostering competition through affiliation
with local and national amateur athletic governing organizations. WYSI’s goal is to provide all
eligible children, regardless of race, color, creed, ethnicity or socioeconomic status with an equal
opportunity to participate in instructional, recreational, and competitive sports leagues. Currently,
WYSI serves almost 2,000 children in a variety of sports like soccer, lacrosse, football and many
more. WYSI is a major contributor and partner in the development of Grand Park.
Westfield Youth Soccer Association (WYSA):
WYSA is a local soccer association that supports youth and adult soccer athletes. WYSA commits to
be the club that others aspire to be through the development of youth in recreation, academy and
competitive soccer. In 2010, WYSA served almost 2,500 athletes and is planning for a 5% increase in
membership for 2011 and 2012. With the continued support from the Westfield community, WYSA
will be a major contributor and partner in the development of Grand Park.
Grand Park Economic Development Vision and Strategy - December 8, 2011 11
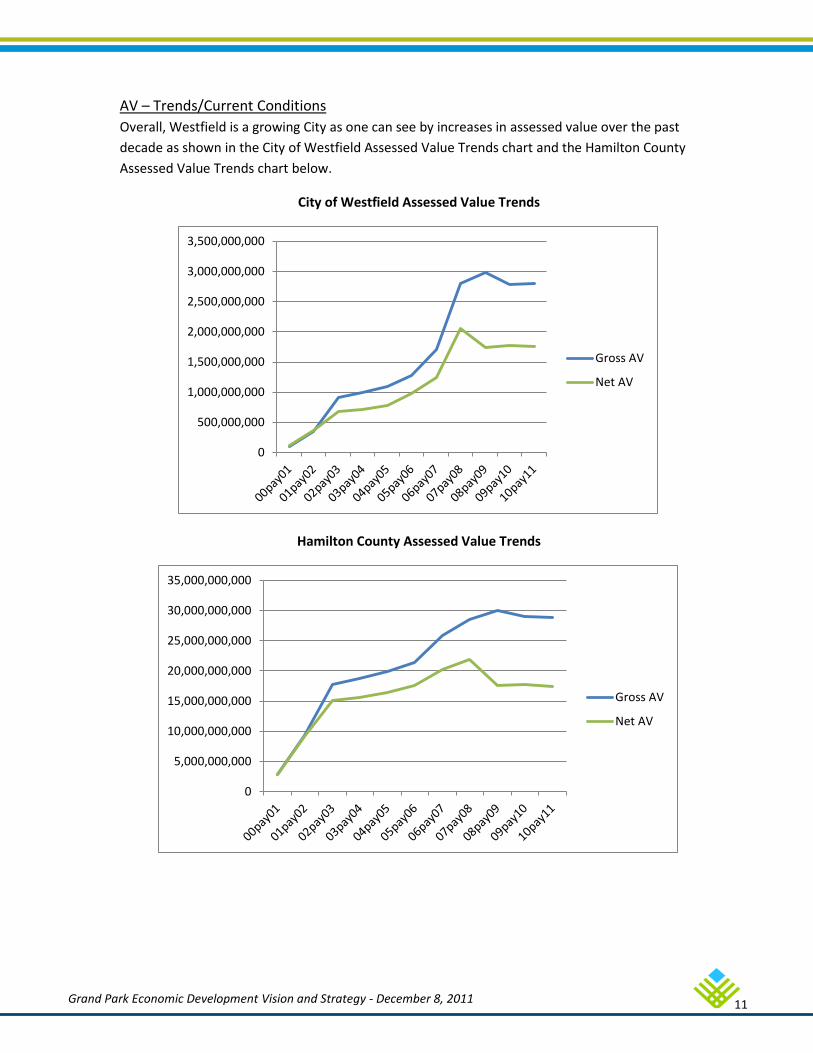
AV – Trends/Current Conditions
Overall, Westfield is a growing City as one can see by increases in assessed value over the past
decade as shown in the City of Westfield Assessed Value Trends chart and the Hamilton County
Assessed Value Trends chart below.
City of Westfield Assessed Value Trends
Hamilton County Assessed Value Trends
0
500,000,000
1,000,000,000
1,500,000,000
2,000,000,000
2,500,000,000
3,000,000,000
3,500,000,000
Gross AV
Net AV
0
5,000,000,000
10,000,000,000
15,000,000,000
20,000,000,000
25,000,000,000
30,000,000,000
35,000,000,000
Gross AV
Net AV

Grand Park Economic Development Vision and Strategy - December 8, 2011 12
Gross Assessed Value: Gross Assessed Value (“AV”) is assigned by a County Assessor to represent
the market value of a property in its current use. It does not include any exemptions or deductions
that a property may be eligible for. AV in Westfield has increased 697% over 10 years from
$350,972,190 in 2002 to 2,795,760,300 in 2011. Several annexations contributed to Westfield's
growth in assessed value over the 10 year period. In comparison, the AV in Hamilton County has
increased only 212%.
The largest increases in Westfield occurred from 2002 to 2003 ($565,598,290 or 161% increase) and
2007 to 2008 ($1,091,886,953 or 64% increase).
Net Assessed Value: Net Assessed Value (“NAV”) is the taxable assessed value of the property,
calculated as AV minus any exemptions and deductions. NAV in Westfield has increased 377% over
10 years from $368,314,026 in 2002 to 1,757,397,218 in 2011. In comparison, the NAV in Hamilton
County has increased only 93%. The peak of the NAV in Westfield occurred in 2008 with
2,057,307,423.
The largest increase in Westfield occurred from 2007 to 2008 ($813,687,359 or 65% increase). New
Indiana policy caused a decrease in NAV from 2008 to 2009 and forward. On residential homestead
property a supplemental deduction of 35% of AV was implemented in 2009 along with property tax
caps that limited residential property to 1% of gross assessed value, rental housing and farm land
taxes at 2%, and all other taxes at 3%. The tax caps were phased in at 1.5%, 2.5% and 3.5% in 2009
and 1%, 2%, and 3% in 2010 and forward.
Grand Park Economic Development Area – Tax Increment Financing
A significant portion of the Grand Park area was incorporated into one of the City’s TIF Districts in
2011; the Grand Junction Economic Development Area has now been expanded to include a total of
2,270 acres. Revenues generated from this District will greatly assist in responding to the impact of
growth expected in Grand Park.
Grand Park Annexation Plan
During the summer of 2011, the City engaged in the voluntary annexation of approximately 660
acres including the Sports Campus and a significant amount of land around the Sports Campus.
Approximately 25 smaller parcels located within Grand Park remain outside the City corporate
limits. The City is actively working with the property owners to annex any of these remaining
parcels. The City intends to process additional voluntary annexations for these areas as quickly as
possible.

Grand Park Economic Development Vision and Strategy - December 8, 2011 13
Graphic provided by the Indiana Department of Transportation.
Major Moves US 31 Improvements in Hamilton County
The City of Westfield is in the fortunate position of being on the receiving end of an Indiana
Department of Transportation (INDOT) $600 million dollar upgrade to U.S. Highway 31. The highway
will be converted into a freeway, built to interstate
highway standards. Express lanes will serve the high
speed traffic, while ramps and frontage roads will provide
access to businesses and neighborhoods in the area.
The initial research for US 31 improvements began in
2003, was put on hold until 2007, and in 2009 received
the Record of Decision from the Federal Highway
Administration, determining that the project had passed
the environmental review process. For the past several
years, the City has worked diligently with INDOT through
monthly meetings to create context sensitive designs that
accommodate the City’s Thoroughfare Plan and
community interests. Also, through public involvement,
the residents of Westfield have able to create a design
that is unique to the City.
The improvements to US 31 will eliminate thirteen (13)
stoplights between Westfield and Indianapolis. This
should allow visitors to travel from Westfield to
Indianapolis in approximately ten (10) minutes. In
addition, all existing at grade crossings along US 31
between the Marion-Hamilton County line (96th Street)
and 216th Street will be replaced with new interchanges
or underpasses, drastically decreasing commuting times
across the County.
The impact to Westfield will be dramatic. Reduced driving
time, better road and trail connections, and improved
efficiency for the movement of commerce all support
Westfield’s Grand Park initiative. Direct limited access to
I-465 allows easy and reliable commute times from
anywhere in the Greater Indianapolis Area and beyond. The
upgraded freeway will feature state-of-the-art design that will utilize space saving concepts to
reduce the amount of right-of-way needed for interchanges.
Construction has already begun on the State Highway 38 (“SR 38”) interchange and at the 146th
Street Bridge. The entire US 31 project is expected to be completed by 2017 or sooner. Construction
will be completed in stages. INDOT intends to have all street signals eliminated between 136th and
169th Streets by 2013. The major intersection at SR 32 and US 31 is slated for completion in 2015

Grand Park Economic Development Vision and Strategy - December 8, 2011 14
and the 191st Street interchange is scheduled to be completed by 2017. Below is a list of the
individual interchange improvements to be completed in Westfield, along with diagrams, land
acquisition schedules, and estimated times of completion.
SR 38 Interchange: The SR 38 and
US 31 intersection is one of the top
priorities for the overall
improvement of U.S. Highway 31.
Plagued by limited visibility due to
the natural landscape, many
accidents have occurred from
drivers running red lights on SR 38.
A folded diamond interchange
which creates two entrance ramps
along SR 38 is being constructed at
this location. This design avoids any
impact of MacGregor Park on the
northeast side of the intersection
and mitigates negative environmental effects. Twin bridges will span over SR 38 allowing for
uninterrupted traffic flow. Construction began on the interchange in spring of 2011 and is expected
to be completed in November 2012.
146th Street and 151st Street Interchange: Slated for completion in 2013, the intersections at 146th
Street and 151st Street will be converted into a split diamond interchange to reduce congestion
through the area. Currently, the 146th
Street Bridge is under construction to
widen by two lanes and allow for
entrance and exit ramps off US 31.
Estimated construction completion on
the bridge is spring 2012.
In addition, two bridges will be built
over US 31 to allow for access to
Keystone Parkway. Frontage roads will
be constructed to allow access to
commercial uses and residences in the
area. Twin bridges will also be
constructed over 151st Street with
construction to begin in summer 2012 and completion in 2013.
156th Street Underpass: Letting is to begin in July 2012 for an underpass to be constructed for 156th
Street. The underpass will feature a side by side trail connection and is expected for completion in
2013. The underpass allows for increased auto and trail connectivity in Westfield.

Grand Park Economic Development Vision and Strategy - December 8, 2011 15
161st Street Interchange: The 161st Street and US 31 intersection will be upgraded to a state-of-
the-art double teardrop roundabout design. This design reduces the land needed for construction of
a traditional diamond intersection and minimizes traffic backups due to elimination of all stoplights
and stop signs. The roundabout also features improved aesthetics and by design, reduces serious
traffic accidents as lower speeds are required to navigate the turns.
Land acquisition began in the
spring of 2011 and letting will
begin in July 2012. The schedule
for this project is being
coordinated with the
underpasses at 156th Street and
169th Street to eliminate all stop
lights from 136th Street to 169th
Street by 2013. The interchange
is scheduled for construction in
fall 2012 and completion in
2013.
SR 32 Interchange: Working closely with INDOT officials, the City of Westfield has been successful
in designing a unique single point urban
interchange for the intersection of US 31 and SR
32. The intersection, located in the heart of
downtown Westfield the “Grand Junction,” will
provide motorists with a magnificent view of
Grand Park and the Grand Junction areas as they
pass over SR 32, Westfield’s “Main Street.” A
single point urban interchange is unique as all
legs of the interchange converge at a single point.
The concise design uses much less space than a
traditional diamond interchange with only one
stop light to control traffic. The reduced area need for this intersections will maximize the
opportunity for additional economic development activity in Grand Park and Grand Junction. In
addition, the flow of traffic is greatly enhanced for drivers making left turns to enter the freeway.
The interchange provides a great first impression for the City, the likely entrance point for those
wishing to travel to the Grand Park and Grand Junction. Construction is anticipated in 2015 with
completion in 2016. In addition, a roundabout is to be installed at Shamrock Boulevard and SR 32
just east of the interchange.

Grand Park Economic Development Vision and Strategy - December 8, 2011 16
191st Street Interchange: The
interchange at 191st Street and US 31
will be upgraded to a double
teardrop roundabout design. Twin
bridges will span over 191st Street,
while roundabouts on 191st street
will disperse traffic to access ramps
underneath U.S. Highway 31. The
interchange provides Grand Park
with its own limited access entrance
and a connection to the Greater
Indianapolis Area. Land acquisition
will commence in 2012 and end in 2013. The interchange is scheduled for completion in 2017.
National Economy & Market Conditions
The U.S. economic environment has very recently shown signs of growth, but uncertainty still
remains and consumer confidence is still weak. Our nation experienced four (4) consecutive
quarters of negative gross domestic product (GDP) growth starting in the third quarter of 2008 and
ending in the second quarter of 2009. This recession has led to continued challenges such as;
decreases in consumer spending, increases in unemployment rates, a collapse in the housing
market, and more.
Challenging times in our economy create negative psychological effects on consumers. The volatile
U.S. stock market shows continued signs of economic unrest. However, 2009 and 2010 did indicate
some increase in investment since the stock market hit bottom in late November of 2008.
Consumers will become more optimistic as our economy continues to recover.
Economists believe that certain industries will lead our nation to recovery. Manufacturing is likely to
be one industry that bounces back faster than most, as it has shown modest growth recently. Cost
reduction, product optimization, and fiscal responsibility will be key in this industry. The housing
industry will continue to struggle, as foreclosures continue to rise and lending standards become
tighter than ever before. Conditions today have created a very competitive environment in the
economic development marketplace. In order to succeed, local jurisdictions are working hard to
distinguish themselves in this volatile market. Westfield has initiated innovative economic
development projects such as Grand Park in order to accomplish this objective.

Grand Park Economic Development Vision and Strategy - December 8, 2011 17
V. Economic Development Forecast – The Next Four Years
Based on information from known projects in the approval pipeline today and other information
gathered from economic development inquiries and projections of market demand in the Grand
Park area, the City has developed estimates of economic activity expected to occur in the Grand
Park economic development area over the next four years.
Anchors: The City is partnering with Lids Indiana Bulls Baseball (the “Bulls”) and the Indiana Soccer
Association (“ISA”) to relocate their headquarters, run tournaments, and maintain the facilities they
will use. The Bulls and ISA will work with other local sports organizations like Westfield Youth Sports
Incorporated (“WYSI”), Westfield Youth Soccer Association (“WYSA”) and the Hamilton County
Convention and Visitors Bureau for play and tournament usage.
Organizational Structure: Grand Park is likely to be directed by a General Manager or Executive
Director with a small operations staff. The General Manager will likely participate in fundraising,
negotiating contracts and managing the day-to-day operations of the Sports Campus. Initially this
position will likely be held by a City staff person; however, as the legal structure of the Sports
Campus develops and the facility becomes increasingly able to support itself, the Sports Campus
staff will be funded through the earnings of the Sports Campus.
At present, the Westfield Sports Commission is studying options for the legal structure of the Sports
Campus. A committee of eight, representing youth sports, tourism, parks and recreation, schools
and business, are working together to provide a recommendation to the City on the preferred
structure for the Sports Campus.
New Investment: The City expects to attract approximately $28,000,000 in private investment to
the Grand Park economic development area in 2012. This will likely be generated by the Mainstreet
senior care facility; the initial construction of a family entertainment and sport-related facility; a
fast-food restaurant; the initial construction of a small hotel facility; the initial construction of a
performance athletic facility; and construction of the first phase of an apartment community.
In 2013, the City expects an additional $23,000,000 of private investment in the Grand Park
economic development area. This investment will likely result from completion of the
aforementioned family entertainment facility, completion of the aforementioned small hotel,
completion of the aforementioned performance athletic facility, completion of the aforementioned
apartment community, construction of a second small hotel facility, a medical facility, and a second
fast-food restaurant.
In 2014, the City expects an additional $27,000,000 of private investment in the Grand Park
economic development area. This will likely result from additional expansions to the Mainstreet
facility, completion of the second hotel mentioned above, initial construction of a second medical
related facility, construction of a third and fourth fast-food restaurant, construction of a new dine-in
restaurant, partial completion of another dine-in restaurant, and partial completion of a larger hotel
facility.

Grand Park Economic Development Vision and Strategy - December 8, 2011 18
In 2015, the City expects at least an additional $14,000,000 of private investment in the Grand Park
economic development area. This investment will likely result from completion of the
aforementioned second medical facility, completion of the aforementioned second dine-in
restaurant facility, completion of the aforementioned larger hotel facility, and two additional new
dine-in restaurants. In total, approximately $93,500,000 dollars of private investment is expected by
2016.
Property Tax Revenue: As a result of these investments, the City expects to receive additional
property tax revenues in the following amounts: by 2014, approximately $862,000; by 2015,
approximately $1,500,000; by 2016, approximately $2,300,000, and by 2017, approximately
$2,800,000.
Jobs: Based on the projected investments in the Grand Park economic development area over the
several years, a significant number of new jobs should be generated. In 2012, it is estimated that
652 private sector construction jobs will be created. Additionally, it is anticipated that a total of 493
permanent jobs will ultimately be created both directly and indirectly from the investments
expected in 2012.
In 2013, it is estimated that 108 private sector construction jobs will be created. Additionally, it is
anticipated that a total of 302 permanent jobs will ultimately be created both directly and indirectly
from the investments expected in 2013. In 2014, it is estimated that 157 private sector construction
jobs will be created. Additionally, it is anticipated that a total of 403 permanent jobs will ultimately
be created both directly and indirectly from the investments expected in 2014.
In 2015, it is estimated that 100 private sector construction jobs will be created. Additionally, it is
anticipated that a total of 126 permanent jobs will ultimately be created both directly and indirectly
from the investments expected in 2015. In summary, a total of 1,017 private sector construction
jobs and 1,324 permanent jobs are expected to ultimately result from the investments estimated to
occur over the next four years.
Visitors & Room Nights: The City completed a study in late 2011 which includes conservative
estimates of the number of visitors expected at the Grand Park Sports Campus and the likely
number of room nights generated by those visitors (see Appendix I). The study concludes that by
2013, approximately 257,329 people will visit the Sports Campus. This number will grow to
approximately 287,194 by 2016.
A large number of those visitors will be from out of town and will require hotel accommodations
while visiting for tournaments. The 2011 study estimates that room nights generated by visitors to
the Sports Campus will range from approximately 43,934 in 2013 to approximately 55,637 in 2016.

Grand Park Economic Development Vision and Strategy - December 8, 2011 19
As stated earlier, the City believes these numbers to be conservative estimates. According to
estimates provided by the sports anchors to be headquartered within the Sports Campus, the total
number of visitors is expected to be closer to 400,000 to 500,000 by year 2016. When the indoor
training facility at the Sports Campus is completed (planned for 2013-2014) there will be additional
visits generated. Additionally, these estimates do not include visits generated by other uses being
developed within the greater Grand Park area.
Identity & Placemaking: The Sports Campus and the
sports/medicine/health/recreation focus of the economic
development area all around it (collectively known as
Grand Park), has created a very strong positive identity for
the City of Westfield. Prior to Grand Park, Westfield had
already established itself as a great place to live and raise a
family, but the introduction of Grand Park has crystalized
this image for the City regionally and nationally. Westfield
was awarded the honor of being selected as the #1 place
to live in the State of Indiana in 2011 by CNN’s Money
Magazine and #48 in the nation.
The term “Placemaking” is used as both a process and a philosophy in the practice of urban planning
and is a common strategy for creating an identity for a community. According to the Metropolitan
Planning Council in Chicago, placemaking is “a multi-faceted approach to the planning, design, and
management of public spaces.”1 The process of placemaking begins with grassroots efforts to
determine the needs and desires of the community. The information received formulates a
collective vision, and an implementation strategy is developed to make the idea of the place a
reality.
When the City began to explore the concept of a sports campus destination in 2007, the
placemaking process was used as a foundation. The City utilized local resources, organized a group
of interested stakeholders (the Westfield Sports Commission), conducted research and various
studies, developed a sustainable vision for good planning and economic development, and built
strong partnerships with organizations that play critical roles in the development of the sports
community concept and the long-term success of Grand Park.
From the groundbreaking (November 18, 2011) through the next four years, the placemaking
process will continue in order to ensure that Grand Park is a successful venture. The Project for
Public Spaces created the Place Diagram2 which illustrates that successful places should have four
key attributes: (1) opportunity for social interaction, (2) where uses are located and activities occur,
(3) with good access and links to the community, and (4) designed for comfort and aesthetic appeal.
1 http://www.placemakingchicago.com/about/
2 http://www.pps.org/articles/grplacefeat/

Grand Park Economic Development Vision and Strategy - December 8, 2011 20
In the planning and design stages of Grand Park, the City desired to achieve a place that:
Is welcoming and inspires sociability within the community;
Is centered around youth sports and family fun;
Is accessible to residents and visitors of all ages; and
Is comfortable, safe, attractive, and walkable.
Together, these elements will provide great opportunities for the long-term success and
sustainability of the Sports Campus and Grand Park as a whole.

Grand Park Economic Development Vision and Strategy - December 8, 2011 21
VI. Economic Development Forecast – Long Term Build-Out
Build-out of the entire Grand Park economic development area is anticipated to occur over the next
30 years. During that period, many factors will affect the rate, form and intensity of development
within the area. The City’s ability to guide and encourage development within the area will
contribute greatly to the rate, form and intensity of such development. In order to ensure the
economic success and sustainability of Grand Park, the City will pay close attention to the impact its
decisions related to Grand Park have on these Grand Park projections below. Modifications to
development policies will likely be made if necessary to ensure success and sustainability of Grand
Park.
At build-out, Grand Park is expected consist of the following general land use types:
Grand Park Land Use Acreage %
Grand Park Sports Campus 360 16%
Regional Retail & Hospitality 411 18%
Sports & Recreation Mixed Use 161 7%
Sports Village Mixed Use 1 308 14%
Sports Village Mixed Use 2 254 11%
Sports Corporate Campus 302 14%
Life Science Mixed Use 200 9%
School Campus 89 4%
Sports Residential 145 7%
Total 2230
16%
18%
7%
14%
11%
14%
9%
4% 7%
Grand Park Sports Campus
Regional Retail & Hospitality
Sports & Recreation Mixed Use
Sports Village Mixed Use 1
Sports Village Mixed Use 2
Sports Corporate Campus
Life Science Mixed Use
School Campus
Sports Residential
Grand Park Economic Development Vision and Strategy - December 8, 2011 22
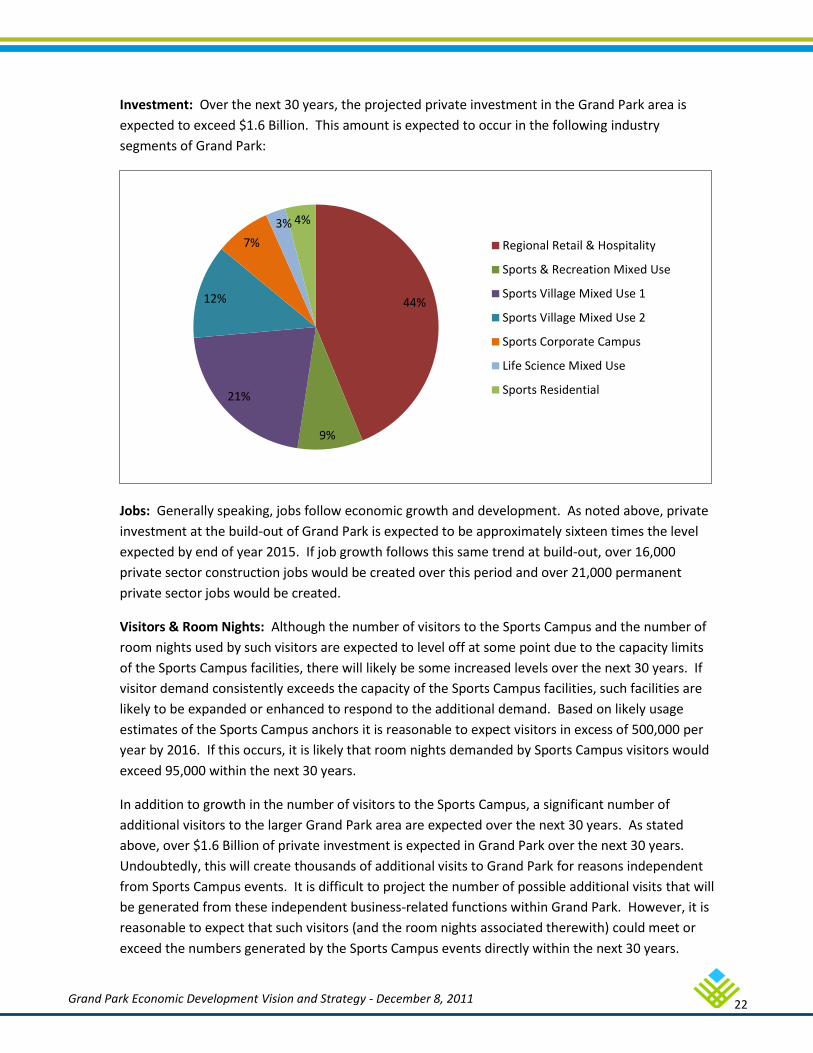
Investment: Over the next 30 years, the projected private investment in the Grand Park area is
expected to exceed $1.6 Billion. This amount is expected to occur in the following industry
segments of Grand Park:
Jobs: Generally speaking, jobs follow economic growth and development. As noted above, private
investment at the build-out of Grand Park is expected to be approximately sixteen times the level
expected by end of year 2015. If job growth follows this same trend at build-out, over 16,000
private sector construction jobs would be created over this period and over 21,000 permanent
private sector jobs would be created.
Visitors & Room Nights: Although the number of visitors to the Sports Campus and the number of
room nights used by such visitors are expected to level off at some point due to the capacity limits
of the Sports Campus facilities, there will likely be some increased levels over the next 30 years. If
visitor demand consistently exceeds the capacity of the Sports Campus facilities, such facilities are
likely to be expanded or enhanced to respond to the additional demand. Based on likely usage
estimates of the Sports Campus anchors it is reasonable to expect visitors in excess of 500,000 per
year by 2016. If this occurs, it is likely that room nights demanded by Sports Campus visitors would
exceed 95,000 within the next 30 years.
In addition to growth in the number of visitors to the Sports Campus, a significant number of
additional visitors to the larger Grand Park area are expected over the next 30 years. As stated
above, over $1.6 Billion of private investment is expected in Grand Park over the next 30 years.
Undoubtedly, this will create thousands of additional visits to Grand Park for reasons independent
from Sports Campus events. It is difficult to project the number of possible additional visits that will
be generated from these independent business-related functions within Grand Park. However, it is
reasonable to expect that such visitors (and the room nights associated therewith) could meet or
exceed the numbers generated by the Sports Campus events directly within the next 30 years.
44%
9%
21%
12%
7%
3% 4%
Regional Retail & Hospitality
Sports & Recreation Mixed Use
Sports Village Mixed Use 1
Sports Village Mixed Use 2
Sports Corporate Campus
Life Science Mixed Use
Sports Residential

Grand Park Economic Development Vision and Strategy - December 8, 2011 23
Identity & Placemaking: The process of placemaking continues after creation of the place. It
depends on economic development “synergy” that occurs within the community. As discussed
earlier in Section III: Community Profile, this synergy will help create Westfield’s competitive
advantage in the economic development marketplace. The successful integration and promotion of
the Grand Park identity are important factors in the success of this economic development project.
To ensure the long term success of Grand Park, the City will continue its search for: key
partnerships, interested stakeholders, and new economic development opportunities. A careful
monitoring of the Grand Park initiative will continue in order: (1) to identify trends and growth
patterns, (2) to make adjustments to keep the project on the charted path, and (3) to achieve and
sustain the vision of Grand Park – a significant component of Westfield’s economic development
competitive strategy for the future.

Strategic Marketing & Research, Inc
Sports Complex
Preliminary Site Review October 29, 2007
Strategic Marketing & Research, Inc
Objectives
• Review comparable sports complexes and their associated attendance
• Overlay population considerations
• Consider sports affinity adjustments
• Provide this context to review potential Hamilton County Sites
• Identify relative potential of alternative sites

Strategic Marketing & Research, Inc
Comparable Baseball Markets
Market 2006 Average Seating Market Population Attendance Capacity
Reading, PA - AA 358,200 6,669 9,100 Portland, ME - AA 234,800 6,357 6,860 Altoona, PA - AA 129,900 5,536 6,120 Traverse City, MI – FL 141,011 4,241 4,600 Lincoln, NE - AAB 237,600 4,061 5,000 Midland, TX - AA 237,132 3,922 6,669 Fort Worth, TX - AAB 534,000 3,867 5,100 Fargo, ND - NL 170,100 3,736 4,623 Rome, GA - A 296,185 3,415 5,100 Eugene, OR - A 314,900 3,229 6,800 Hamilton County 250,000 TBD 4,000+ AA=Class AA Minor League, A=Class A Minor League, AAB=American Association, FL=Frontier League, NL = Northern League

Strategic Marketing & Research, Inc
Comparable Suburban Markets
Adjacent 2006 Average Seating Market City Attendance Capacity Round Rock-AAA Austin 9,412 10,000 Frisco—AA Dallas 8,412 10,000 Brooklyn – A New York 7,819 7,500 Aberdeen—A Baltimore 6,375 6,000+ St. Paul—AAB Minneapolis/St. Paul 6,131 6,000+ Kansas City—NL Kansas City 5,852 6,000+ Lake Co.—A Cleveland 5,171 7,273 Schaumburg—NL Chicago 4,268 7,048 Gateway—FL St. Louis 4,235 6,500 Camden—AL Philadelphia 3,721 6,425 AAA=Class AAA Minor League, AA=Class AA Minor League, A=Class A Minor AL=Atlantic League, FL=Frontier League, NL = Northern League • AAA=Class AAA Minor League, AA=Class AA Minor League, A=Class
A Minor League, AAB=American Association, FL = Frontier League, • NL = Northern League

Strategic Marketing & Research, Inc
Initial Considerations
• Trading areas are quite large – Primary trading areas reportedly as
much as 30 mile radius – Other primary research by smari
confirmed this assumption • Demographics are broad as well
but focus on family households • 8.01% report having been to a
baseball game once a month or more
• PRIZM profiling could provide a way to assess potential or even model attendance.

Strategic Marketing & Research, Inc
Project Code: SMARI Order # 965844258PRIZM NE BaseMRI Household Count (H) Go to Baseball Games,1+ Times,1mo (A)
Users/# Nickname Count %Comp Count %Comp 100 HHs Index01 Upper Crust 781.00 1.52 112.00 2.73 14.34 17902 Blue Blood Estates 489.00 0.95 107.00 2.61 21.88 27303 Movers & Shakers 834.00 1.63 96.00 2.34 11.51 14404 Young Digerati 635.00 1.24 70.00 1.71 11.02 13805 Country Squires 947.00 1.85 138.00 3.36 14.57 18206 Winner's Circle 524.00 1.02 71.00 1.73 13.55 16907 Money & Brains 1,046.00 2.04 176.00 4.29 16.83 21008 Executive Suites 558.00 1.09 55.00 1.34 9.86 12309 Big Fish, Small Pond 1,132.00 2.21 78.00 1.90 6.89 8610 Second City Elite 607.00 1.18 96.00 2.34 15.82 19811 God's Country 837.00 1.63 94.00 2.29 11.23 14012 Brite Lites, Li'l City 766.00 1.49 129.00 3.14 16.84 21013 Upward Bound 780.00 1.52 102.00 2.49 13.08 16314 New Empty Nests 541.00 1.06 60.00 1.46 11.09 13915 Pools & Patios 634.00 1.24 69.00 1.68 10.88 13616 Bohemian Mix 932.00 1.82 78.00 1.90 8.37 10517 Beltway Boomers 476.00 0.93 76.00 1.85 15.97 19918 Kids & Cul-de-Sacs 779.00 1.52 85.00 2.07 10.91 13619 Home Sweet Home 914.00 1.78 160.00 3.90 17.51 21920 Fast-Track Families 753.00 1.47 149.00 3.63 19.79 24721 Gray Power 542.00 1.06 41.00 1.00 7.56 9422 Young Influentials 754.00 1.47 42.00 1.02 5.57 7023 Greenbelt Sports 870.00 1.70 51.00 1.24 5.86 7324 Up-and-Comers 627.00 1.22 31.00 0.76 4.94 6225 Country Casuals 718.00 1.40 68.00 1.66 9.47 11826 The Cosmopolitans 611.00 1.19 73.00 1.78 11.95 14927 Middleburg Managers 955.00 1.86 70.00 1.71 7.33 9228 Traditional Times 1,392.00 2.72 107.00 2.61 7.69 9629 American Dreams 1,124.00 2.19 68.00 1.66 6.05 7630 Suburban Sprawl 677.00 1.32 64.00 1.56 9.45 11831 Urban Achievers 855.00 1.67 32.00 0.78 3.74 4732 New Homesteaders 984.00 1.92 72.00 1.75 7.32 9133 Big Sky Families 856.00 1.67 70.00 1.71 8.18 10234 White Picket Fences 631.00 1.23 43.00 1.05 6.81 8535 Boomtown Singles 622.00 1.21 19.00 0.46 3.05 3836 Blue-Chip Blues 625.00 1.22 46.00 1.12 7.36 9237 Mayberry-ville 1,177.00 2.30 140.00 3.41 11.89 14938 Simple Pleasures 1,294.00 2.52 79.00 1.93 6.11 7639 Domestic Duos 549.00 1.07 76.00 1.85 13.84 17340 Close-In Couples 598.00 1.17 49.00 1.19 8.19 10241 Sunset City Blues 874.00 1.71 68.00 1.66 7.78 9742 Red, White & Blues 471.00 0.92 50.00 1.22 10.62 13343 Heartlanders 1,020.00 1.99 24.00 0.58 2.35 2944 New Beginnings 784.00 1.53 30.00 0.73 3.83 4845 Blue Highways 608.00 1.19 16.00 0.39 2.63 3346 Old Glories 504.00 0.98 13.00 0.32 2.58 3247 City Startups 741.00 1.45 44.00 1.07 5.94 7448 Young & Rustic 1,567.00 3.06 67.00 1.63 4.28 5349 American Classics 525.00 1.02 18.00 0.44 3.43 4350 Kid Country, USA 658.00 1.28 37.00 0.90 5.62 7051 Shotguns & Pickups 813.00 1.59 46.00 1.12 5.66 7152 Suburban Pioneers 536.00 1.05 17.00 0.41 3.17 4053 Mobility Blues 540.00 1.05 30.00 0.73 5.56 6954 Multi-Culti Mosaic 881.00 1.72 41.00 1.00 4.65 5855 Golden Ponds 898.00 1.75 27.00 0.66 3.01 3856 Crossroads Villagers 905.00 1.77 24.00 0.58 2.65 3357 Old Milltowns 734.00 1.43 33.00 0.80 4.50 5658 Back Country Folks 1,213.00 2.37 26.00 0.63 2.14 2759 Urban Elders 690.00 1.35 31.00 0.76 4.49 5660 Park Bench Seniors 561.00 1.09 16.00 0.39 2.85 3661 City Roots 610.00 1.19 20.00 0.49 3.28 4162 Hometown Retired 583.00 1.14 16.00 0.39 2.74 3463 Family Thrifts 863.00 1.68 55.00 1.34 6.37 8064 Bedrock America 975.00 1.90 61.00 1.49 6.26 7865 Big City Blues 609.00 1.19 17.00 0.41 2.79 3566 Low-Rise Living 660.00 1.29 34.00 0.83 5.15 6467 Unassigned .00 0.00 .00 0.00 0.00
Total 51,249 100.00 4,103 100.00 8.01 100Source: Mediamark Research Inc., 2006
PRIZM NE Profile Report

Strategic Marketing & Research, Inc
Preliminary Modeling
• Initial modeling efforts were explored using a 10/20/30 mile radius.
• Data captured on each of the comparable sites: – Households – PRIZM overlay
• Correlations and regressions • No strong predictors • Challenges:
– Huge data variance: e.g. 10 mile household populations ranging from 73,000 to 1,138,000.
– 30 mile variances even larger ranging from 78,000 to 5,332,000.
– Yet attendance ranges only from 3,200 to 10,000.
– And much of this variance is driven by capacity.
– The majority of facilities realize over 70% of their capacity and only one falls below 50%

Strategic Marketing & Research, Inc
10 mile households
20 mile households
30 mile households
Westfield 95,026 377,157 635,716
Noblesville 83,312 371,651 622,865
north 96,355 360,188 613,713
Prospective sites
• While the large trading area and extreme market variances made initial modeling unrewarding, the same effort made the prospective Hamilton County sites undifferentiated.
Noblesville
Westfield
North

Strategic Marketing & Research, Inc
Average Attendance Capacity 0 - 5 mile 5 - 10-mile 10 - 20-mile
Aberdeen, MD
6,375 6,000 1,379 5,418 11,402
Eugene, OR
3,229 6,800 5,109 2,752 1,559
Fort Worth, TX
3,867 5,100 5,293 19,555 36,565
Gateway - St. Louis
4,235 6,500 2,040 13,370 39,848
Kansas City, MO
5,852 6,000 1,296 5,333 33,295
Lake Co., OH
5,171 7,273 4,503 8,067 19,732
Lincoln, NE
4,061 5,000 5,524 3,135 1,001
Portland, ME
6,357 6,860 4,346 1,757 4,398
Reading, PA
6,669 9,100 5,402 3,967 9,896
Round Rock, TX
9,412 10,000 4,271 8,395 18,356
Refined Evaluations
• Consider baseball attending household potential not total households.
• Restrict comparable sites to those with similar population bases.
• Narrow trading area considerations in order to differentiate potential sites.

Strategic Marketing & Research, Inc
Refined Site Review
Noblesville
Westfield
North
0 - 5 mile % of total 5 - 10-mile 10 - 20-mile
Westfield 1,916 10.6% 10,086 33,463
Noblesville 1,367 11.1% 9,035 32,660
north 194 8.0% 10,410 31,850

Strategic Marketing & Research, Inc
Initial Conclusions
• Available data and potential 30 mile trading area suggests all potential sites are viable and nondifferentiatable
• More focused comparative set shows strong correlation with 5 mile baseball households.
• Both Westfield and Noblesville site are reasonably strong by this measures – the North site seems comparatively much weaker.
• Indexed potential relative to their overall population’s PRIZM profile Noblesville is the strongest site by a narrow margin versus Westfield – although the latter has a larger population base
– Noblesville 136 – Westfield 132 – North 100
• Modeling the small comparative set suggests that the first two should be capable of supporting a 9,000 seat facility
• Other considerations to be explore include more qualitative measures of the site’s appeal, other applications of the facility, as well as the community support of or resistance to the concept.

Comparable Youth & Minor League Sports ComplexesDRAFT
January 2009
hundenstrategicpartners
destination development consulting

January 31, 2009
Ms. Brenda Myers
Executive Director
Hamilton County CVB
37 E. Main Street
Carmel, IN 46032 VIA EMAIL: [email protected]
Dear Ms. Myers:
The Hamilton County CVB has engaged Hunden Strategic Partners (HSP) to conduct
a study to review and analyze existing and proposed sports complexes and minor
league baseball parks that would be comparable to a proposed sports complex in
Hamilton County. The attached is a draft of our analysis.
We have enjoyed serving you on this engagement and look forward to providing you
with continuing service.
Sincerely yours,
HUNDEN STRATEGIC PARTNERS
Attachment

ASSUMPTIONS AND LIMITING CONDITIONS
This report has been prepared under the following general assumptions and limiting
conditions:
! The findings presented herein reflect analysis of primary and secondary
sources of information. HSP utilized sources deemed to be reliable but cannot
guarantee their accuracy.
! No responsibility is taken for changes in market conditions and no obligation
is assumed to revise this report to reflect events or conditions which occur
after the date of this report.
! Responsible ownership, competent property management, and professional
marketing are assumed.
! Terrorist activity or other major calamity affecting travel, the economy and
tourism is assumed not to occur.
! This report has been made only for the purposes stated and shall not be used
for any other purpose.

Hamilton County Sports Complex Study Chapter 1 Page 1
INTRODUCTION, REPORT LAYOUT AND EXECUTIVE SUMMARY
Subject of the Study
Various stakeholders in Hamilton County, Indiana, are considering the development
of a sports complex to serve the youth and amateur sports communities in the area
and region. The same group is considering a potential minor league ballpark in the
same complex. The goal of Hamilton County and other stakeholders would be to
benefit the county and region in several capacities, including athletic and community
development, tourism and economic development.
Currently, Hamilton County has no facility that could host major outdoor or indoor
sports events or other entertainment events that normally use larger sports
complexes. A complex could consist of:
! All-purpose athletic fields that could be used for football, soccer, rugby and
other field sports,
! A number of softball/youth baseball fields, possibly augmented by one to
three full-size baseball fields, and
! An indoor facility that would have space for indoor soccer, basketball and/or
volleyball, and batting cages and pitchers mounds.
! A minor league baseball field that would be the home field to a minor league
baseball team.
The Hamilton County Convention and Visitors Bureau has retained Hunden Strategic
Partners to provide review and analysis of comparable facilities to determine
implications for the proposed Hamilton County complex in terms of facility costs,
development partners, ownership, funding and management, community impacts,
and other relevant items.
HSP has reviewed and analyzed comparable sports facilities for youth and
recreational activities as well as minor league ballparks that are located in areas
similar to Hamilton County. Several youth/recreational complexes have aspects that
the stakeholders should be able to use in determining the type and structure of a
potential complex, including options that would encourage regional tourism. Minor
league ballparks also offer several options for a potential sports and entertainment
facility in Hamilton County that would draw local and regional visitors. Depending on
the level of investment that the stakeholders wish to invest, the parties interested in
a sports facility in Hamilton County have several options that could create a viable
sports facility for the area.
Company Description
Hunden Strategic Partners is a full-service real estate development advisory
practice specializing in destination assets. With professionals in Chicago and Indiana,
HSP provides a variety of services for all stages of destination and economic
development, in the following primary areas:

Hamilton County Sports Complex Study Chapter 1 Page 2
! Market and Financial Studies, including Feasibility & Valuation
! Sports & Recreational Facilities
! Convention & Conference Centers
! Hotels
! Entertainment/Retail Districts, Mixed-use Developments
! Resorts
! Arts, Cultural & Entertainment Facilities
! Master Strategy and Planning Development
! Owner’s Representation and RFP Process Management
! Public Incentive Analysis
! Economic & Fiscal Impact Analysis
! Economic and Tourism Development Legislation Consulting
! Organizational Audits & Best Practices
Hunden Strategic Partners (HSP) professionals have provided all of the above
services for hundreds of client projects worldwide for the public and private sectors.
Beyond consulting, HSP professionals have experience in municipal and state
government, economic development, and non-profit management.
Report Layout
The report is organized as follows:
Chapter 1 – Outlines the study concept, provides the report layout and executive
summary.
Chapter 2 – Reviews comparable sports complexes for youth and recreational
outdoor and indoor sports, including two major types of ownership/management
structures: a purely municipal ownership and management, and a public-private
partnership structure.
Chapter 3 – Reviews the possibilities existing for a minor league ballpark and team,
including discussions of comparable minor league ballparks and the sources of funds
for those facilities.
Sports Facility Options
The principal parties interested in a sports complex in Hamilton County have been
exploring facility options for some time. National Sports Services submitted a
proposal for a multi-use facility to the principals in November 2007, outlining the
possibility of a youth/recreational complex that would be incorporated with a minor
league stadium. The principals then received a feasibility study, dated September 12,
2008, from Financial Solutions Group, Inc., of Indianapolis, Indiana, that outlined
some market and financial assumptions related to the development of such a facility.
According to that study, the complex is to include:

Hamilton County Sports Complex Study Chapter 1 Page 3
! A minor league baseball stadium that would play host to a professional team
and other events during the off-season,
! All-purpose athletic fields that could be used for football, soccer, rugby and
other field sports,
! A number of softball/youth baseball fields, possibly augmented by one to
three full-size baseball fields,
! An indoor facility that would have space for indoor soccer, basketball and/or
volleyball, and batting cages and pitchers mounds, and
! Other facilities including tennis courts and facilities that would be part of a
proposed YMCA.
The estimated cost for the complex according to that study is $50 to $60 million. The
components are further described below.
Minor League Baseball Stadium
The inclusion of a minor league baseball field that would be the home field to a minor
league baseball team could greatly enhance the regional tourism and economic
development of the Hamilton County area. The size and cost of ballpark varies and
depends on the type of team and minor league affiliation. Those considerations will
be major factors in a decision concerning next steps for a minor league ballpark
project. The facility would need to consider additional revenue sources such as
scheduling other events during the baseball off-season, or between games. The
stadium could have additional multiple uses as a venue for outdoor concerts,
entertainment events and amateur baseball/softball.
Multi-Purpose Athletic Fields
Multi-purpose fields would be designed for soccer, football, rugby and lacrosse. The
Westfield Youth Soccer Association, Inc. has a need for multiple soccer fields. Multi-
purpose fields could be used to hold regional and national tournaments for various
sports to pull additional revenue. The complex should include one field that would
provide stadium seating for major games and events. Stadium seating for up to
7,500 would provide seating for additional visitors to Hamilton County.
Youth Baseball/Softball Fields
A complex consisting of youth baseball/softball fields to host leagues and
tournaments would generate local interest as well as regional tourism in Hamilton
County. To host regional and national tournaments, the complex would require six to
eight baseball/softball fields. Incorporating artificial turf fields would be an option for
one or several of the fields. Outdoor facilities for baseball/softball and multi-purpose
sports fields would ideally operate from March to November and close during the
winter months.
Multi-Purpose Facility
A multi-purpose, indoor facility would consist of at least one indoor soccer field,
basketball and volleyball courts, batting cages, pitchers mounds, and other

Hamilton County Sports Complex Study Chapter 1 Page 4
recreational sports leagues. An indoor facility would attract major tournaments year-
round maximizing the potential economic impact drawing and bringing visitors from
outside Hamilton County throughout the year.
Other Facilities
The complex could include a tennis facility, which could be indoor and/or outdoor.
To host tournaments and leagues the facility would need approximately 10-12
courts. Available land could be an issue in incorporating 36 by 78 feet regulation
courts. Also, the YMCA has considered locating in the complex with a new facility,
which would add swimming, exercise and physical fitness and indoor sports.
Executive Summary of Comparable Facilities
HSP has completed a review and analysis of comparable sports facilities for both a
youth/recreational sports complex and for a possible minor league baseball park and
team. Throughout the United States various types and sizes of sports facilities offer a
myriad of comparisons for the interested parties in Hamilton County to consider. HSP
has analyzed several of these complexes, as set forth in the text and tables below.
Based on this analysis the principals considering a sports complex in Hamilton
County should be able to evaluate the best options for a new facility.
HSP considered both youth/recreational sports facilities in the United States and
minor league ballparks for comparison and review. No existing sports complex
incorporates all of the elements the Hamilton County principals contemplate as
options. HSP has divided the comparable facilities into two separate sections and
chapters: youth/recreational sports complexes and minor league ballparks. Most
minor league ballparks are not incorporated with any other sports facilities and all
have separate financial aspects.
Youth and recreational sports facilities exist throughout the country in various forms.
Most localities develop facilities on an ad hoc basis, building and adding as funds
become available and without an overall plan for a major complex. HSP therefore
attempted to find the best comparable examples of recreational and youth sports
complexes that municipalities, regions and in some cases private enterprises
developed as a total concept, at least a plan for an entire multi-use facility. Often
these plans develop in stages, but the complex itself is a complete entity with a
master development plan and an identifiable cost structure.
HSP conducted an in-depth analysis of several existing youth and recreational sports
complexes, as summarized by the table below.

Hamilton County Sports Complex Study Chapter 1 Page 5
Table 1-1
Summary of Comparable Youth Sports Complexes (ranked by cost)
Name Location MSA City2007
Population AcresAverage
AttendanceYear
OpenedCost
($Millions) Owner Manager Funding Method
Disney Wide World of Sports
Orlando, Florida Orlando, Florida 2,032,496 220 NA 1997 $100.0 Private Private Private
National Sports Center
Blaine, Minnesota
Minneapolis-St. Paul, Minnesota 3,208,212 600 3,000,000 1990 $55.0 State
National Sports Center
Foundation
State, Municipal, County, Foundation and Private Funds
Big League Dreams Various Various Various 35 250,000 1990 $25.0 Municipality Big League Dreams Municipal
Maryland SoccerPlex Boyds, Maryland Washington, DC 5,306,565 162 NA 2000 $19.0
Maryland Soccer
Foundation
Maryland Soccer
FoundationState Bonds
Virginia Sports Complex
Ruther Glen, Virginia
Richmond, Virginia 1,212,977 100 200,000 2005 $10.0 Private Private Private
Lake Charles Multi-Sports Complex
Lake Charles, Louisiana
Lake Charles, Louisiana 191,926 NA NA 2006 $10.0 City of Lake
Charles
Ward 3 Recreation Department
Municipal Bonds
Mid-America/Mid-America West Sports
Shawnee, Kansas
Kansas City, Missouri 1,842,965 110 800,000 1989/
1991 $8.3 Johnson County, KS
Johnson County, KS Local Bonds
Average 1,082,623 223 1,150,000 1997 $32.5
NA: Not AvailableSource: Specific Teams, Owners, Leagues, HSP
The multi-sports complexes listed above are varied in size and scope. The smallest
are the Virginia Sports Complex and the Lake Charles Multi-sports Complex, while
the National Sports Center and Disney Wide World of Sports are much larger in
scope than the interested parties in Hamilton County are contemplating. Each
comparable facility has attributes to consider when determining the size, scope and
amenities of a sports facility.
Several ownership/management structures exist involving youth and recreational
sports complexes. The ownership and management relationship is an essential
determination that the stakeholders in Hamilton County have to make when moving
forward in developing the project. The ownership/management structure will then
dictate the next steps of development.
The first type of ownership model is a public-private scenario, with the public sector
developing the facility and the private company leasing and/or managing the
complex. While the development costs can vary significantly, depending on the
quality and scale of development, it is rare for private enterprise to take on the risk
of such a facility unless it is a secondary amenity and demand generator to a larger
facility (with Disney’s Wide World of Sports being the primary example). The private
entity has to be able to make a profit for the complex to be viable. Typically, the
public sector has borne the cost of developing the facilities in question, while a
combination of private, non-profit and public management structures have been
employed. The goal of the private manager is to have operating expenses covered by
operating revenues and other revenue, such as sponsorships and advertising. A
location that includes a winter climate, such as Hamilton County, may find it more
difficult to generate the necessary revenue throughout the year to offset all expenses
unless an indoor facility is developed for basketball, indoor soccer and other non-
sports events that would use such space.

Hamilton County Sports Complex Study Chapter 1 Page 6
The second type of sports complex involves a not-for-profit foundation, either
through ownership or management. The two comparable complexes that fit this
model are the National Sports Center in Blaine, Minnesota and the Maryland
Soccerplex in Boyds, Maryland. Non-profit groups manage and control the complex
and use any excess profits for capital improvements. However, the public sector
funded the initial construction and development of each complex. As in the public-
private model, the public sector had to contribute a significant amount of funds for
the initial development of the project. The development cost structure is similar to
the public-private model. The development costs are too great to have the net
revenues of the complex make any substantial payment on the debt incurred for
development.
The last type of facility is a purely public sports complex, owned and managed by the
locality, municipality, or regional park authority. The Lake Charles, Louisiana, facility
and the Mid-America complex in Shawnee, Kansas, are comparable examples. The
comparable projects were less costly for development, but the municipalities have
ongoing management fees and costs that the localities with private or non-profit
management structures do not incur. Of note is the fact that the Mid-America
complex was originally a private enterprise that the locality purchased, and other
components of the complex were added later. The Lake Charles complex opened in
2006 and is now expanding by adding an indoor facility. Therefore, both purely
public facilities developed in stages.
Once the interested parties determine the ownership structure of the complex and
the method of financing the development, the parties can fit the different sports
options into the facility. Almost all of the types of fields and uses will fit into each
model, but both the public-private and the non-profit ownership structures would
require an indoor facility to allow for year-round revenue. The indoor facility will
increase the cost of development considerably.
Minor League Baseball. HSP also analyzed minor league baseball parks from
around the country because a minor league ballpark and team is one of the major
aspects that the stakeholders in Hamilton County are considering. Approximately 240
minor league teams play in various types of baseball fields across the United States.
The ballparks range from fields built a century ago to new ballparks with state-of-
the-art facilities. Capacities of the fields range from under 1,000 to more than
15,000. The teams range from AAA teams affiliated with Major League Baseball with
a large fan base to small rookie league or independent league teams that have
mainly local support.
The table below is a summary of the ballparks that HSP has used as comparable
minor league ballparks for the proposed facility in Hamilton County. The complexes
selected for benchmarking had the most in common with the National Sports
Services proposal and the Financial Solutions Group Feasibility Study.

Hamilton County Sports Complex Study Chapter 1 Page 7
Table 1-2
Summary of Comparable Ballparks
Name Team League Location Population MSA CityMSA
PopulationYear
Opened CapacityCost
($Millions) Owner Funding Method
Alexian Field Schaumburg Flyers Northern Schaumburg,
IL 75,386 Chicago, IL 9,524,673 1999 7,048 $18.0Schaumburg Village and Park District
Municipal Bonds
CommunityAmerica Ballpark
Kansas City T-Bones Northern Kansas City,
KS 142,266 Kansas City, MO 1,967,405 2003 6,345 $13.1 Private
Municipal STAR Bonds, Private
equity and financing
GCS Ballpark Gateway Grizzlies Frontier Sauget, IL 249 St. Louis, MO 2,803,707 2002 3,818 $6.5 Village of
Sauget
Municipal Financing, TIF
fundsT. R. Hughes Ballpark
River City Rascals Frontier O'Fallon, MO 74,976 St. Louis, MO 2,803,707 1999 3,491 $5.0 City of O'Fallon Municipal Funds
Standard Bank Stadium
Windy City ThunderBolts Frontier Crestwood, IL 11,251 Chicago, IL 9,524,673 1999 3,200 $8.0 Village of
Crestwood Municipal Funds
Average 60,826 5,324,833 2000 4,780 $10.1
Source: Specific Teams, Owners, Leagues, HSP
The ballparks that HSP chose as comparable ballparks have characteristics that
would relate well with the Hamilton County area. The locations are in suburbs of
major urban areas. The teams are all in independent leagues, in these cases the
Northern League or Frontier League, because of reasons more fully set out below.
The capacity of the facilities ranges from 7,048 at Alexian Field in Schaumburg,
Illinois, to 3,200 at Standard Bank Stadium in Crestwood, Illinois. The cost to
develop the facilities ranges from $6.5 Million for GCS Ballpark in Sauget, Illinois, to
$18 million for development of Alexian Field.
The minor league baseball system in North America has two separate league
structures, those that are affiliated with Major League Baseball, and those who are in
independent leagues, having no links to the major leagues. One initial consideration
for a community trying to bring minor league baseball to an area is whether to field a
team that is affiliated with Major League Baseball. Affiliated teams bring many
positives, including financial support from the major league team through player and
manager salaries. However, because it is located within the greater Indianapolis
area, an MLB-affiliated team located in Hamilton County would have to receive a
waiver from the AAA Indianapolis team, the Indianapolis Indians. Another
consideration is that most of the newer ballparks constructed for affiliated teams are
larger and more costly than independent league stadiums.
One affiliated minor league exists in the Indiana-Illinois-Michigan-Iowa region, the
Class A Midwest League, with fourteen teams. The closest teams are in Fort Wayne,
Indiana and South Bend, Indiana. The average cost of ballparks built within the past
ten years in that league is $23 million.
Minor leagues that do not have affiliation with the major leagues are identified as
“independent leagues.” The teams in these leagues have no connection with a major
league team and therefore have to bear the entire cost of the team, including
players’ and managers’ salaries. Because the teams are not part of the MLB system,
no restrictions exist as to location of teams.
Hamilton County is located in the geographic area served by two independent
leagues. The Northern League has six teams, three of which are in the Chicago
metropolitan area. The average seating capacity of the ballparks is approximately
6,000, and all of the ballparks have opened since 1996. The range of cost of
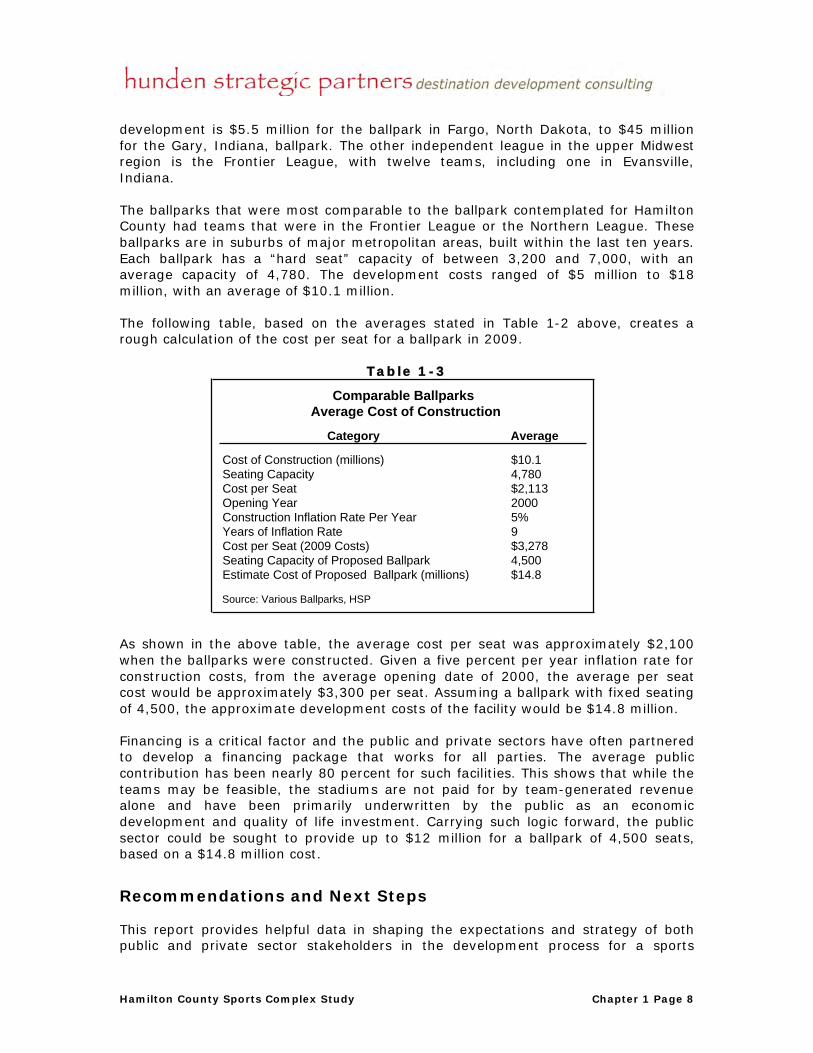
Hamilton County Sports Complex Study Chapter 1 Page 8
development is $5.5 million for the ballpark in Fargo, North Dakota, to $45 million
for the Gary, Indiana, ballpark. The other independent league in the upper Midwest
region is the Frontier League, with twelve teams, including one in Evansville,
Indiana.
The ballparks that were most comparable to the ballpark contemplated for Hamilton
County had teams that were in the Frontier League or the Northern League. These
ballparks are in suburbs of major metropolitan areas, built within the last ten years.
Each ballpark has a “hard seat” capacity of between 3,200 and 7,000, with an
average capacity of 4,780. The development costs ranged of $5 million to $18
million, with an average of $10.1 million.
The following table, based on the averages stated in Table 1-2 above, creates a
rough calculation of the cost per seat for a ballpark in 2009.
Table 1-3
Comparable Ballparks Average Cost of Construction
Category
Cost of Construction (millions) $10.1Seating Capacity 4,780Cost per Seat $2,113Opening Year 2000Construction Inflation Rate Per Year 5%Years of Inflation Rate 9Cost per Seat (2009 Costs) $3,278Seating Capacity of Proposed Ballpark 4,500Estimate Cost of Proposed Ballpark (millions) $14.8
Source: Various Ballparks, HSP
Average
As shown in the above table, the average cost per seat was approximately $2,100
when the ballparks were constructed. Given a five percent per year inflation rate for
construction costs, from the average opening date of 2000, the average per seat
cost would be approximately $3,300 per seat. Assuming a ballpark with fixed seating
of 4,500, the approximate development costs of the facility would be $14.8 million.
Financing is a critical factor and the public and private sectors have often partnered
to develop a financing package that works for all parties. The average public
contribution has been nearly 80 percent for such facilities. This shows that while the
teams may be feasible, the stadiums are not paid for by team-generated revenue
alone and have been primarily underwritten by the public as an economic
development and quality of life investment. Carrying such logic forward, the public
sector could be sought to provide up to $12 million for a ballpark of 4,500 seats,
based on a $14.8 million cost.
Recommendations and Next Steps
This report provides helpful data in shaping the expectations and strategy of both
public and private sector stakeholders in the development process for a sports

Hamilton County Sports Complex Study Chapter 1 Page 9
complex. In the pre-development arc of work that moves from feasibility to
implementation, there are many steps. These include:
! Initial Concept
! Understanding of Local Economic and Demographic Forces Shaping the
Environment for such a Development
! Market Supply and Demand Analysis for each Component
! Profiles of Comparable Complexes and/or Components
! Implications and Recommendations
! Determination of:
o Physical Components
o Financial Feasibility via Revenue & Expense Projections
o Ownership, Management Structures for the Complex and/or
Components
o Phasing
o Physical Layout of Complex
o Site
o Cost Estimate
o Finance Plan
! Land Acquisition
! Determination of Development Partners (including private ownership group
for minor league baseball, if applicable, and management company for all or part
of complex)
! Formation of Governance Structure
! Design Work and Construction Documents
! Financing (including private, public-private, and public components)
The stakeholders in Hamilton County have completed part or all of certain of these
items. In order to move the project toward completion, however, several critical
issues must be addressed. We believe these include:
! A realistic projection of revenue and expense for each component to
determine both who (public, private or both) will own and operate and how it will
be financed. This will help inform the plan of finance and governance. It will also
help determine what components should come first as priorities due to their
feasibility versus those that may be sought, but are not as financially viable
initially. These could be pushed to a later phase.
! Site selection and acquisition in concert with development of a concept plan
for the complex on the proposed site. Will the site be owned by the public or
private sector and how does this impact financing options?
! A more detailed cost estimate of the complex divided into components by
funding entity (public vs. private).

Hamilton County Sports Complex Study Chapter 1 Page 10
! A conservative plan of finance that matches risks and rewards for both the
public and private sectors. This will inform a more complete governance
structure.
Once these steps are taken, then the stakeholders will have a complete picture of
the development, including structures for finance, ownership, operations and
development.

Hamilton County Sports Complex Study Chapter 2 Page 1
COMPARABLE SPORTS FACILITIES
The table below is a summary of the sports complexes that HSP has used as
comparable facilities to the youth and recreational sports aspects of the proposed
facility in Hamilton County. The complexes selected for comparison had the most in
common with the complex discussed for Hamilton County.
Table 2-1
Summary of Comparable Youth Sports Complexes (ranked by cost)
Name Location MSA City2007
Population AcresAverage
AttendanceYear
OpenedCost
($Millions) Owner Manager Funding Method
Disney Wide World of Sports
Orlando, Florida Orlando, Florida 2,032,496 220 NA 1997 $100.0 Private Private Private
National Sports Center
Blaine, Minnesota
Minneapolis-St. Paul, Minnesota 3,208,212 600 3,000,000 1990 $55.0 State
National Sports Center
Foundation
State, Municipal, County, Foundation and Private Funds
Big League Dreams Various Various Various 35 250,000 1990 $25.0 Municipality Big League Dreams Municipal
Maryland SoccerPlex Boyds, Maryland Washington, DC 5,306,565 162 NA 2000 $19.0
Maryland Soccer
Foundation
Maryland Soccer
FoundationState Bonds
Virginia Sports Complex
Ruther Glen, Virginia
Richmond, Virginia 1,212,977 100 200,000 2005 $10.0 Private Private Private
Lake Charles Multi-Sports Complex
Lake Charles, Louisiana
Lake Charles, Louisiana 191,926 NA NA 2006 $10.0 City of Lake
Charles
Ward 3 Recreation Department
Municipal Bonds
Mid-America/Mid-America West Sports
Shawnee, Kansas
Kansas City, Missouri 1,842,965 110 800,000 1989/
1991 $8.3 Johnson County, KS
Johnson County, KS Local Bonds
Average 1,082,623 223 1,150,000 1997 $32.5
NA: Not AvailableSource: Specific Teams, Owners, Leagues, HSP
The multi-sports complexes listed above are varied in size and scope. The smallest
are the Virginia Sports Complex and the Lake Charles Multi-sports Complex, while
the National Sports Center and Disney Wide World of Sports are much larger in
scope than stakeholders in Hamilton County are contemplating. Each comparable
facility has attributes that should be considered when determining the size, scope
and amenities of a sports facility.
Two types of management/ownership structures are prevalent for local and regional
multi-sports facilities. In some cases the municipality or county, through itself or
through the local park district, owns and manages the facility. While some
subcontracts may exist for concessions or other aspects, the governmental entity
controls the facility. The other model that many localities use is to lease the complex
to a private organization that manages the facility. The locality works with the
private entity to develop the complex and the private group pays rent to be able to
manage and run the entire facility.

Hamilton County Sports Complex Study Chapter 2 Page 2
Several private companies have worked with municipalities to develop and manage
multi-sports facilities. Many of the developments have been beneficial for both the
locality and the private company. Many of the most popular developments involve
sports facilities like those being considered by parties involved in Hamilton County.
Private management of facilities is an option that stakeholders in Hamilton County
should consider.
Privately Operated Facilities
Big League Dreams Sports Parks
The private company Big League Dreams (BLD) works with localities to develop a
certain type of multi-sports facility, with the emphasis on baseball and softball. Each
field in the complex is a small replica of a specific Major League Baseball ballpark,
which increases the appeal of the facility. The municipality pays to build the facility,
but Big League Dreams provides the plans and oversees the construction. The
company then manages the facility and pays a fee to the locality.
Presently BLD has developed nine sports parks and is in the process of developing
several others. A list of the existing parks is stated in the table below:
Table 2-2
Big League Dreams Sports Park Locations Cathedral City, California (Palm Springs Area)
Mira Loma, California (Riverside/Ontario) Chino Hills, California
Redding, California League City, Texas Manteca, California
Gilbert, ArizonaWest Covina, California
Mansfield, Texas
Source: Big League Dreams
Each of the parks is unique and has different characteristics and numbers of fields,
but the usual template that BLD develops is as follows:
! Baseball/softball fields – Each facility has six or more recreational
baseball/softball fields, each built to resemble a major league ballpark. For
example, the Mansfield, Texas, complex has ballparks that resemble Wrigley
Field, Yankee Stadium, Fenway Park, Forbes Field, The Polo Grounds, and
Rangers Ballpark, the home field of the Texas Rangers.
The following figures are pictures of the replica stadiums of Wrigley Field, Fenway
Park and Yankee Stadium.

Hamilton County Sports Complex Study Chapter 2 Page 3
Figure 2-1
Figure 2-2
Figure 2-3

Hamilton County Sports Complex Study Chapter 2 Page 4
! Indoor Pavilion – Each facility has a 20,000- to 24,000-square foot indoor
pavilion that can be used for indoor soccer, ice or roller hockey, and in one case
basketball. The facility converts to meeting space for assemblies and
conferences.
! Stadium Club – Each grouping of four fields has a Big League Sports Club
located at the center (as shown below), which is a restaurant/bar that overlooks
the fields. Each serves a variety of food options as well as offering a full bar with
alcoholic beverages.
! Other Amenities – Each ballpark also offers other facilities such as
playgrounds for younger children, batting cages, sand volleyball courts, a grass
multi-purpose area, and other recreational sports facilities.
! Park Policies – Each park charges a set fee for each person entering the
facility, and then gives the entrant a token for part of the fee to be used at
concessions. For example, the park in Mansfield, Texas, charges $3 per person as
an entrance fee and gives each person a token for $1 for use at concessions.
Children under twelve are admitted free.
! Cost – The cost of each complex in 2008 dollars is estimated to be between
$20 and $25 million for development. The complex requires approximately 30-35
acres.
The following figure is a picture of the Mansfield, Texas, BLD complex, opened in
March of 2008.
Figure 2-4
Attendance - The sports complexes that have been completed are successful
enterprises, with baseball and softball leagues and tournaments using the facilities
much of the available time. Examples include:
! Manteca - In 2008 the complex at Manteca, California, held 53 tournaments
throughout the year, one every available weekend, with 1,923 teams and a total

Hamilton County Sports Complex Study Chapter 2 Page 5
of 4,154 total games. During the week leagues run almost year-round, often five
games a night. The estimated total number of attendees at the Manteca facility in
2008 was 317,000, up from 301,754 in 2007. The park at Manteca is completely
booked every weekend in 2009. The following table shows projected attendance
rates for the Manteca complex beyond the 2008 figures.
Table 2-3
Manteca Projected Attendance Rates
Year Figure2007 301,7542008 317,0002009 P 345,000
2010 P 360,000
2011 P 380,000
Source: Big League Dreams
There is an estimated three percent increase per year in attendance rates after
2011.
! Chino Hills - The most popular BLD facility, located in Chino Hills, California,
will have an estimated 375,000 attendees in 2008.
! West Covina – The facility at West Covina, California, opened in February of
2008. For the 2009 season, the complex has every weekend scheduled and has
league play every night except Monday. BLD at West Covina estimates that in
league play it will host 330 softball teams at the outdoor fields and 100 soccer
teams at the indoor facility.
! Redding – Redding, California, has the smallest population from which to
draw participants, with an estimated MSA population in 2007 of 179,427. The
BLD facility in Redding has five fields and an indoor fieldhouse. It averages over
200,000 paid visitors per year. That number does not include children 12 years
old and younger who do not participate in sports.
The BLD complexes are all located in the warm climates of Texas and the Southwest
United States, so that the outdoor facilities can be used most of the year. The most
comparable site is Redding, California, located on the northern California coast. That
location reduces the use of its ball fields for two months each year during the winter,
only offering a “rain or shine” softball league with a small number of participants. It
has a larger indoor fieldhouse, however, at 20,000 square feet, and that facility is
used for roller hockey and indoor soccer year-round. A more northern location such
as in Hamilton County, Indiana, would have to make use of the indoor facility to a
larger extent to make the complex economically feasible for BLD.
Big League Dreams assists in the development and construction of the facility but
does not construct the complex itself. The typical arrangement between BLD and the
municipal sector is a three-step process:

Hamilton County Sports Complex Study Chapter 2 Page 6
! Consulting Agreement – BLD and the municipality enter into a consulting
agreement, with BLD providing an economic impact analysis for the facility,
assistance with the selection of the design team, applying the general plans that
BLD uses to the specific needs of the locality, and guiding the construction
process.
! License Agreement – BLD charges a one-time license or franchise
agreement fee for the use of the name and concept of the replica ballparks.
! Operations Agreement – BLD and the locality enter into a long-term
(usually thirty-year) operating agreement in which BLD manages the facility and
pays a certain amount per month or per year to the locality. Each location has a
different agreement with the municipality as to the amount of the lease. Some
locations receive a percentage of the gross revenue of the complex, while others
receive a flat rate to pay for a portion of the cost of development plus a small
percentage of revenue. BLD retains all entrance fees, concession and restaurant
revenue, and other revenue and provides maintenance for the complex.
One major advantage of the BLD developments is that the municipality bears no
ongoing operational costs. BLD estimates that the cost of maintaining and operating
a recreational sports facility is approximately $15,000 per acre per year. With a
thirty-acre park, which is the size that would accommodate six baseball-softball
fields, the cost would be about $450,000 per year in maintenance and operations.
The cost of BLD is higher initially because the development costs are higher.
However, with no operational costs borne by the public, the savings over time could
be substantial.
Hotel and Visitor Information – BLD does not track visitor information to be able
to give specifics on increases for local businesses in tourism dollars or increased
room nights. Local convention and visitors’ bureaus have general information but do
not have specifics because BLD does not provide them with specific data. However,
general information that exists shows substantial increases in tourism and hotel
room nights due to a BLD park.
Each BLD complex has an agreement with a limited number of local hotels, granting
those hotels “host hotel” status, creating a link on the BLD website, and directing
tournament groups to those hotels. The BLD host hotel agreement gives the host
hotel two options of repayment in return for “host hotel” status, either pay an annual
fee to BLD or pay a smaller fee, track the number of people who stay due to the
park, and pay a small percentage per person to BLD. The relationship between BLD
and the host hotels has been a benefit both to the facility and to the hotels.
While no specific numbers exist, each BLD complex has increased visitor spending in
the local economy as well as increasing the hotel room nights of local hotels.
! Manteca, California, has seen an increase of thirty percent in room nights
on weekends at the three local host hotels in Manteca since the BLD park has
opened. Occupancy is over eighty percent and two new hotels are scheduled to
open in the next year.
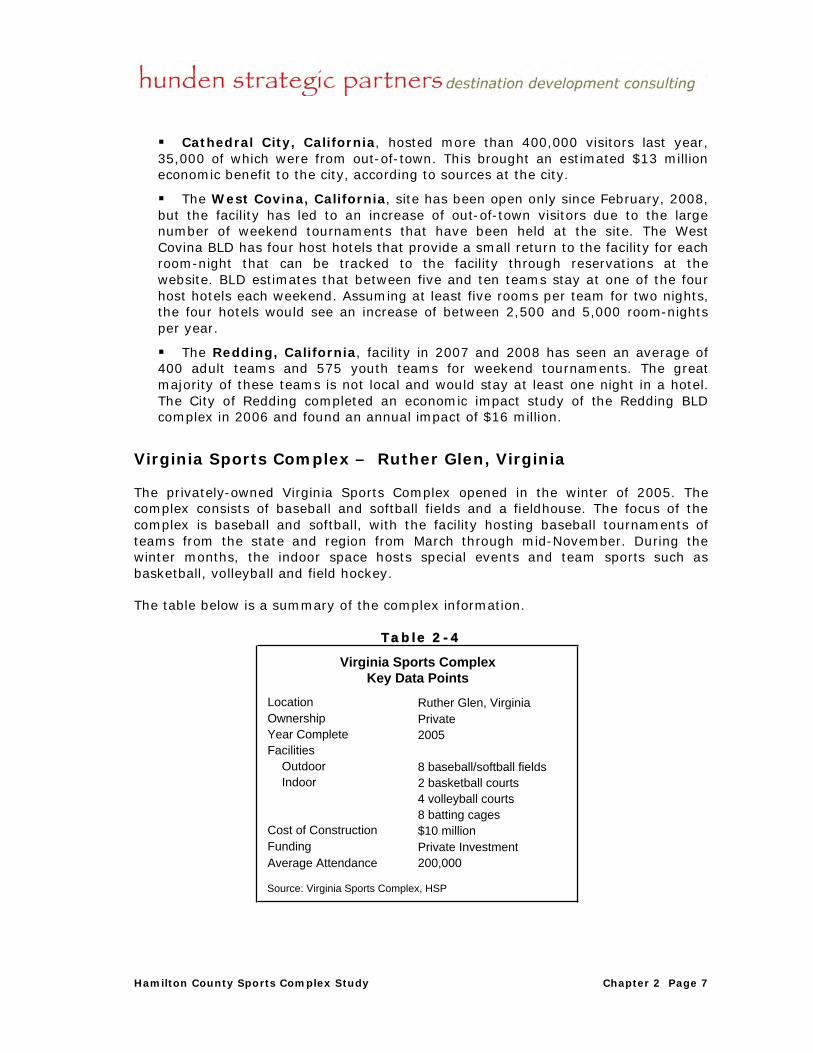
Hamilton County Sports Complex Study Chapter 2 Page 7
! Cathedral City, California, hosted more than 400,000 visitors last year,
35,000 of which were from out-of-town. This brought an estimated $13 million
economic benefit to the city, according to sources at the city.
! The West Covina, California, site has been open only since February, 2008,
but the facility has led to an increase of out-of-town visitors due to the large
number of weekend tournaments that have been held at the site. The West
Covina BLD has four host hotels that provide a small return to the facility for each
room-night that can be tracked to the facility through reservations at the
website. BLD estimates that between five and ten teams stay at one of the four
host hotels each weekend. Assuming at least five rooms per team for two nights,
the four hotels would see an increase of between 2,500 and 5,000 room-nights
per year.
! The Redding, California, facility in 2007 and 2008 has seen an average of
400 adult teams and 575 youth teams for weekend tournaments. The great
majority of these teams is not local and would stay at least one night in a hotel.
The City of Redding completed an economic impact study of the Redding BLD
complex in 2006 and found an annual impact of $16 million.
Virginia Sports Complex – Ruther Glen, Virginia
The privately-owned Virginia Sports Complex opened in the winter of 2005. The
complex consists of baseball and softball fields and a fieldhouse. The focus of the
complex is baseball and softball, with the facility hosting baseball tournaments of
teams from the state and region from March through mid-November. During the
winter months, the indoor space hosts special events and team sports such as
basketball, volleyball and field hockey.
The table below is a summary of the complex information.
Table 2-4
Virginia Sports ComplexKey Data Points
Location Ruther Glen, VirginiaOwnership PrivateYear Complete 2005Facilities
Outdoor 8 baseball/softball fieldsIndoor 2 basketball courts
4 volleyball courts8 batting cages
Cost of Construction $10 millionFunding Private InvestmentAverage Attendance 200,000
Source: Virginia Sports Complex, HSP

Hamilton County Sports Complex Study Chapter 2 Page 8
Ruther Glen, Virginia, is located on the Interstate 95 corridor between Washington,
D.C., and Richmond, Virginia. Located thirty miles north of Richmond, it is within the
Richmond MSA, which has a 2007 estimated population of 1.2 million. Ruther Glen is
an unincorporated community in Caroline County, Virginia, until recently a rural area,
with the population of 32,000 as of 2006. The county is expanding due to the
expansion of the Richmond suburbs and the relatively inexpensive cost of housing
that attracts people to the area from the more expensive Washington, D.C.
metroplex.
The figure below shows the entire 100+ acre complex.
Figure 2-5
The Virginia Sports Complex has both indoor and outdoor facilities, which consist of
the following:
! Baseball/softball fields – The facility has eight professional grade
baseball/softball fields, each with available lighting, that play host to about
600 teams yearly for tournament play. Four of the fields, which the VSC
classifies as “major league” fields, have the dimensions of adult baseball
fields, with grass infields and fences more than 300 feet from home plate.
Four of the fields, the “minor league” fields, have clay infields and shorter
fences for softball and youth baseball.
! Indoor Pavilion – The indoor facility consists of 44,000 square feet of space
complete with two basketball courts, four volleyball courts, eight batting
cages (with indoor pitching mounds), two classrooms, a weight room and
men’s and women’s locker rooms. There is space enough space to use for
indoor baseball training camps and infield practice (26 feet x 75 feet).
! Concessions/Pro Shop – The complex offers three concessions areas and a
pro shop stocked with baseball products and memorabilia.

Hamilton County Sports Complex Study Chapter 2 Page 9
Based on estimates by the Virginia Sports Complex, the average attendance has
been about 200,000 per year since opening in 2005. There has been roughly a thirty
percent increase per year in attendance since the facility opened.
Financial - The project cost was roughly $10 million. The operations costs per year
for the complex are about $1.5 million. Construction costs to install lights all eight
baseball/softball fields were $1.1 million and electricity to keep the fields lit is
$10,000 per month.
Revenue is built through tournament fees per team, training camp dues, team
rentals of indoor courts, corporate sponsorship/advertisements throughout the
facilities and concessions/pro shop profits.
The rental charges for the various parts of the complex are set forth below.
Table 2-5
Virginia Sports ComplexRental Costs
TypeHourly Cost
Baseball/Softball FieldsMajor League (baseball) $80Minor League (softball/youth) $70With Lights (additional hourly) $15
Indoor PavilionBasketball Court $30Volleyball Court $25Batting Cage $40Batting Cage w/ Pitching Machine $50
Source: Virginia Sports Complex
The rental fees for the baseball and softball fields vary based on which type of field is
used. The larger “Major League” field rents for $80 per hour, while the smaller field
is $70 per hour. Using lights is an extra $15 per hour for each field. The VSC charges
$30 per hour for the basketball courts and $25 per hour for volleyball. The batting
cages rent for $20 for thirty minutes, $40 per hour, or $50 per hour with a pitching
machine.
Hotel and Visitor Information – The complex accounts for a significant economic
impact, specifically to hotels, restaurants and gas stations in the area; however,
neither the facility nor the local visitors’ bureau have exact figures as to the benefit
to the locality and region. The Caroline County Visitors Bureau states that the area
businesses show an increase in the number of patrons during the months of March
through November when the complex is open and hosting weekly tournaments.

Hamilton County Sports Complex Study Chapter 2 Page 10
Disney Wide World of Sports
The Walt Disney Company has created an amateur and minor league sports complex
that is the state-of-the-art for youth and amateur sports complex facilities in the
United States. While the Disney complex includes several aspects and venues not
applicable in the stakeholders’ proposal, the facilities that would compare are the
standard that should be considered. Therefore, even though Disney is a private
company and the complex has no governmental involvement, the complex gives a
good comparison for the stakeholders’ consideration.
The table below is a summary of the information concerning the Disney Wide World
of Sports Complex.
Table 2-6
Disney Wide World of SportsKey Data Points
Location Orlando, FloridaOwnership Walt Disney CompanyOperator Walt Disney CompanyYear Opened 1997Facilities
Hess Sports Fields 9 multi-purpose fieldsDiamondplex 6 softball/youth baseball fieldsChampion Stadium 7,500 seat baseball stadium, spring
training home of Atlanta BravesBaseball Quadraplex 4 professional-size baseball fields, practice
infield, batting tunnels, 10 bullpens
Track and Field Complex
9-lane track, 3 shot-put rings, 2 discus/hammer rings, javelin runway, 2 high-jump pits, 2 long-jump runways, 2 pole-vault areas
Milk House 5,000 seat arenaJostens Center 44,800 square foot indoor facility with
basketball/volleyball courts, inline hockey rinks, locker rooms
Cost $100 millionFunding Private
Source: Wide World of Sports, HSP
The Disney Wide World of Sports complex is located in Orlando, Florida, in the north-
central part of the state. Orlando’s Metropolitan Statistical Area population for 2007
was estimated at 2.0 million, and the city of Orlando alone has an estimated 2007
population of 228,000. The Wide World of Sports complex is located adjacent to the
Walt Disney World resorts, at 700 South Victory Way, Lake Buena Vista, Florida.
The sports complex opened in March 1997, at a cost of more than $100 million. The
figure below is a layout of the complex.
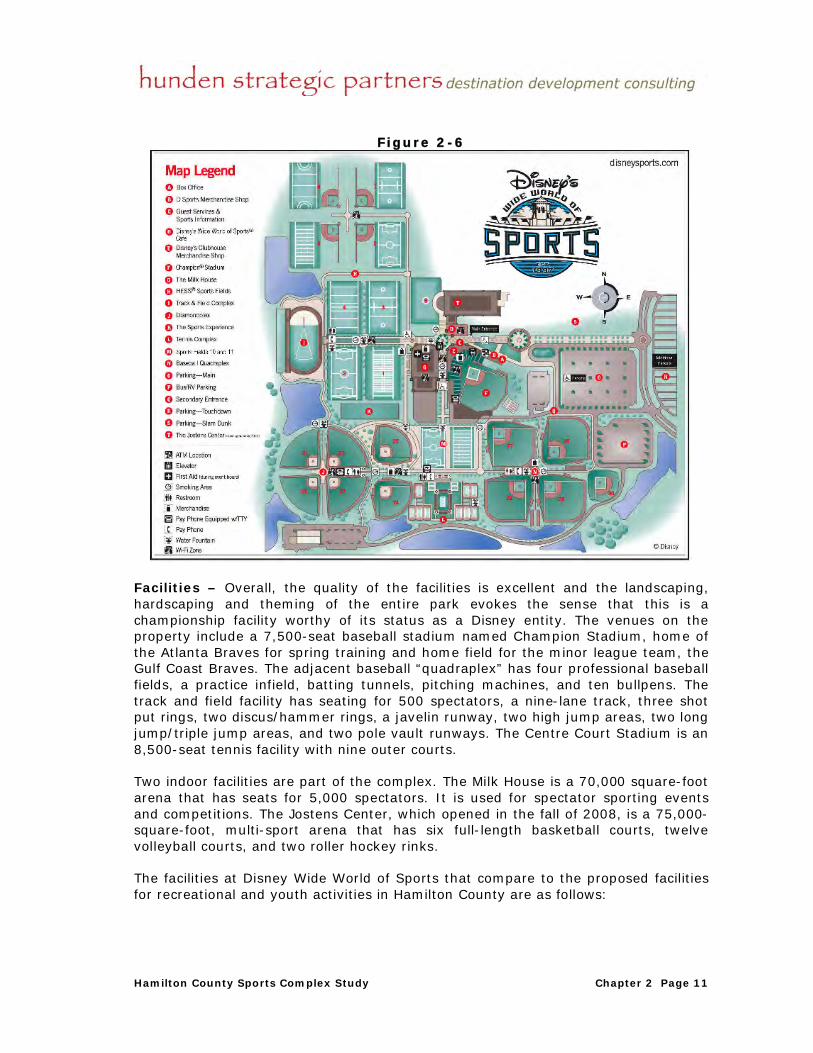
Hamilton County Sports Complex Study Chapter 2 Page 11
Figure 2-6
Facilities – Overall, the quality of the facilities is excellent and the landscaping,
hardscaping and theming of the entire park evokes the sense that this is a
championship facility worthy of its status as a Disney entity. The venues on the
property include a 7,500-seat baseball stadium named Champion Stadium, home of
the Atlanta Braves for spring training and home field for the minor league team, the
Gulf Coast Braves. The adjacent baseball “quadraplex” has four professional baseball
fields, a practice infield, batting tunnels, pitching machines, and ten bullpens. The
track and field facility has seating for 500 spectators, a nine-lane track, three shot
put rings, two discus/hammer rings, a javelin runway, two high jump areas, two long
jump/triple jump areas, and two pole vault runways. The Centre Court Stadium is an
8,500-seat tennis facility with nine outer courts.
Two indoor facilities are part of the complex. The Milk House is a 70,000 square-foot
arena that has seats for 5,000 spectators. It is used for spectator sporting events
and competitions. The Jostens Center, which opened in the fall of 2008, is a 75,000-
square-foot, multi-sport arena that has six full-length basketball courts, twelve
volleyball courts, and two roller hockey rinks.
The facilities at Disney Wide World of Sports that compare to the proposed facilities
for recreational and youth activities in Hamilton County are as follows:

Hamilton County Sports Complex Study Chapter 2 Page 12
! Hess Sports Fields - The Hess Sports Fields are nine multi-purpose fields set
up to host a number of sports. Four of the fields can be converted into
softball/youth baseball fields (separate from the Diamondplex fields described
below), and one also serves as the “front yard” of the new Jostens Center. All of
the fields are equipped with lights for night play, although some have less
lighting capacity, and four are constructed to international soccer standards. The
figure below is a picture of the Hess Sports Fields.
Figure 2-7
! The Diamondplex – The Diamondplex consists of six fields used for softball
and youth baseball. The fields are organized with four in a circle, fields A-D, and
two adjacent fields, E and F. The A-D fields have outfield fences measuring 305
feet, as well as temporary fences that can shorten the field. The fields have
bullpens, dugouts, and a centrally located tower that has press and scorekeeping
facilities, space for officials, and concession stands. The figure below is a picture
of the Diamondplex.

Hamilton County Sports Complex Study Chapter 2 Page 13
Figure 2-8
Financial Information - The Walt Disney Company is a private company that does
not have to give detailed financial information on each of its resorts, specifically the
Wide World of Sports. The original reports for the cost of the complex, which
included the Milk House, the softball Diamondplex, Champions stadium (the spring
training and minor league park), four of the Hess Sports Fields, and other amenities,
was more than $100 million.
Hotel and Visitor Information – The Disney Corporation and Disney Wide World of
Sports do not publish visitor and attendance information. However, the complex
hosts over 180 sporting events each year, ranging from clubs and AAU youth
tournaments to semi-professional sports and The Atlanta Braves spring training
season (with 150,000 spectators annually). The AAU, based in Orlando, hosts about
thirty tournaments at the facility per year, with an average of 35,000 participants
and approximately 125,000 total visitors to the complex. Therefore, the annual effect
on the local economy and more specifically the hotel industry is significant, even to a
large tourist destination such as Orlando.
Municipally Operated Facilities
National Sports Center – Blaine, Minnesota
The National Sports Center (NSC), located in Blaine, Minnesota, is a 600-acre
amateur and recreational sports facility that hosts several sports. The NSC facilities
draw over three million visitors each year to its numerous tournaments, leagues and
other sporting events. The management at the NSC states that it is the most visited
sports venue in the state, surpassing all of the professional sports venues in
Minneapolis-St. Paul.
The table below is a summary of the information about the NSC.

Hamilton County Sports Complex Study Chapter 2 Page 14
Table 2-7
National Sports CenterKey Data Points
Location Blaine, MinnesotaOwnership State of Minnesota
Operator National Sports Center Foundation
Year Opened 1990Facilities
52 Athletic Fields Soccer, football, lacrosse, rugby
Velodrome CyclingSports Hall Indoor soccer, indoor track,
training, meetingsSchwan Super Rink 8 ice rinks, locker roomsNational Youth Golf Center 18-hole course, 18-hole putting
course, driving rangeSchwan Center 15,500-SF events and meetings
facilityResidence Hall 180-bed dormatory with cafeteria
and dining hallStadium Soccer, home of Minnesota
Thunder pro soccer teamStadium Seating Capacity 12,000Funding
Athletic fields, velodrome, stadium, sports hall, residence hall
$14.7 million state appropriation
Schwan Super Rink 8 municipalities and state sports foundation ($11 million); municipalities, private foundation and Bethel University ($10 million expansion)
National Youth Golf Center $3.1 million in state funds, $6 million in private funds
Schwan Center $5.1 million in State Bonds
Source: National Sports Center, HSP
The NSC is located in Blaine, Minnesota, fifteen miles north of Minneapolis-St. Paul.
The 2003 census found the population of Blaine to be approximately 50,000, while
the estimated 2007 population of the Minneapolis-St. Paul MSA was 3.2 million.
The NSC began through an initial appropriation of $14.7 million from the State of
Minnesota in 1987, and opened in 1990 with 30 athletic fields, the velodrome, the
stadium, the residence hall and sports hall. The figure below is a map of the
complex.

Hamilton County Sports Complex Study Chapter 2 Page 15
Figure 2-9
Facilities - The facilities at the NSC include:
! Fifty-two athletic fields, used for soccer, football, lacrosse, rugby and ultimate
Frisbee.
! The NSC Stadium holds events for soccer and other outdoor uses, with fixed
seating for 12,000. It is the home of the Minnesota Thunder pro soccer team.
! The Schwan Super Rink, 300,000 square feet of space with eight ice rinks, 32
locker rooms, a pro shop, restaurant and training center.
! The National Youth Golf Center is a golf complex that includes an 18-hole
course built for youth, with multiple tee boxes on every hole, an 18-hole grass
putting green course, and a clubhouse and pro shop.
! The velodrome holds track cycling events on a year-round basis, including
Olympic trials and national championships.
! The sports hall has over 58,000 square feet of activity area with a “FieldTurf”
artificial surface, surrounded by an indoor track. The facility can be used for
youth indoor soccer and track and field events, as well as non-sports events such
as banquets and trade shows.
! The NSC Residence Hall is a 180-bed dormitory and adjoining cafeteria, as
well as two lounges.
! The Schwan Center is an all-purpose events center with a total of over 15,000
square feet of meeting space, broken out as follows:

Hamilton County Sports Complex Study Chapter 2 Page 16
Table 2-8
National Sports CenterSchwan Center Meeting Space
Meeting Room Size (Sq. Ft.)Grand Hall 5,600Exhibition Hall 3,000Silver room 2,000Gold Room A 2,000Gold Room B 1,250Conference 1 450Conference 2 450Conference 3 450
Total 15,200
Source: National Sports Center
Since opening the National Sports Center Foundation (NSCF) has handled the
operations of the complex. The non-profit foundation operates the facility on a self-
supporting basis, so that no public funds are needed to pay for operations. Each
facility charges a fee for use by leagues and tournaments. The following table states
the rental charges for the athletic fields and the sports hall.
Table 2-9
National Sports CenterRental Costs
Type Cost
Athletic FieldsHourly $75Daily $410
Sports Hall (hourly) $330
Source: National Sports Center
With 52 athletic fields, the NSC can accommodate a large soccer, football or lacrosse
league or tournament. The fees for the athletic fields shown above do not include
extra portable bathrooms, a sound system, or painting sidelines except for regulation
soccer fields.
The NSCF also develops sponsorships for the facility to supplement rental costs and
fees. Sponsors of the complex include The Schwan Food Company, Coca-Cola,
Farmers Insurance and several local companies. The NSCF also has fostered
partnerships with municipalities and counties, as well as with non-profit groups and
sports associations. These partnerships provide revenue through guaranteed group
use and other assistance.

Hamilton County Sports Complex Study Chapter 2 Page 17
Financing - The State of Minnesota provided the initial funds to develop the NSC
through a $14.7 million appropriation. Those funds paid for the land purchase and
construction of the original complex of 25 athletic fields, the velodrome, residence
hall, stadium and the sports hall. To date the total cost of all facilities total more
than $55 million. Municipal and private funds paid for the majority of the other
facilities, as follows:
! Schwan Super Rink - A coalition of eight communities partnered with Ramsey
and Anoka Counties and the Minnesota Amateur Sports Commission to pay the
construction costs of $11 million for the initial facility, and several of the partners
joined with the Herb Brooks Foundation and Bethel University to pay for the $10
million expansion.
! National Youth Golf Center - Funding sources for the development of the
center included $3.1 million from the State of Minnesota and more than $6
million from private sources, including the First Tee Foundation, a non-profit
organization established to encourage youth participation in golf.
! Schwan Center – The State of Minnesota issued $5.1 million in state bonds to
pay for the construction of the $11 million Schwan Center. The remainder of the
funds derived from private and non-profit sources, including sponsorships.
Hotel and Visitor Information – The National Sports Center works through the
regional Minneapolis Metro North Convention and Visitors Bureau to place visitors in
hotels in the area. The sports events from the NSC provide the area with
approximately 15,000 room-nights per year, with twenty-five percent of those room-
nights created from the annual USA Cup, the international youth soccer tournament
held each July at the complex. Each year over 1,000 teams from more than twenty
countries attend that week-long tournament.
Maryland SoccerPlex and Discovery Sports Center – Boyds,
Maryland
The Maryland SoccerPlex and the adjacent Discovery Sports Center, located in
Boyds, Maryland, are two adjacent facilities established through public and not-for-
profit organizations. The facilities, both owned and operated by the Maryland Soccer
Foundation, Inc., a non-profit, 501(c)(3) corporation, have been greatly successful in
furthering the recreational sports opportunities of the metropolitan Washington,
D.C., area.
The table below is a summary of the information about the two facilities.

Hamilton County Sports Complex Study Chapter 2 Page 18
Table 2-10
Maryland SoccerPlexKey Data Points
Location Boyds, MarylandOwnership Maryland Soccer FoundationOperator Maryland Soccer FoundationYear Opened 2000Facilities
22 Athletic Fields soccer, football, lacrosse, rugbyDisconvery Sports Center
Indoor soccer, basketball, volleyball, non-sports events
Stadium soccer, football, lacrosseStadium Seating Capacity 3,200
FundingFacilities and Infrastructure
$19 million through State Bonds
Land Donation by Montgomery County, Maryland
Source: Maryland Soccer Foundation, HSP
The Maryland SoccerPlex (MSP) and Discovery Sports Center (DSC) are located in
Boyds, Maryland, an incorporated town located in Montgomery County, 35 miles
northeast of Washington, D.C. As of 2000, the census found the population of Boyds
to be 2,025, but the town has added several new housing developments since that
time. The estimated 2007 population of the Washington, D.C. MSA, which includes
Boyds and a large area of suburban Maryland, as well as suburban Northern Virginia,
was 5.3 million.
The MSP and DSC opened in 2000, through a joint venture between the Maryland
Soccer Foundation and the Maryland-National Capital Park and Planning Commission,
the regional parks and recreation commission for Montgomery and Prince George’s
Counties, Maryland. The Maryland Soccer Foundation owns and manages the
facilities, located on 162 acres within a 655-acre South Germantown Recreational
Park. The figure below is a map of the complex.

Hamilton County Sports Complex Study Chapter 2 Page 19
Figure 2-10
Facilities - The facilities at the Maryland SoccerPlex include:
! Twenty-two athletic fields, used for primarily for soccer, but also for football,
lacrosse, rugby and ultimate Frisbee.
! The Championship Stadium holds events for soccer and other outdoor uses,
with fixed seating for 3,200, premier lighting system, a press box and electronic
scoreboard.
! Seventy-five parking spaces per field, based around field clusters.
! Comfort stations, including restrooms centrally located around field clusters.
The Discovery Sports Center is a 64,000-square foot indoor multi-sport complex,
located in the center of the MSP. It consists of:

Hamilton County Sports Complex Study Chapter 2 Page 20
! Eight basketball/volleyball courts that could convert into two indoor soccer
spaces.
! Fixed seating for 150 spectators.
! Discovery Sports Center Café with seating for 80 people.
The area is part of the South Germantown Recreational Park, which also includes a
children’s Adventure Playground, 36 holes of miniature golf, a golf driving range, and
more than two miles of paved trails. Future plans include an indoor racquet and
health club and an indoor aquatic center.
The following table shows the rental charges for the athletic fields and the sports
center.
Table 2-11
Maryland SoccerPlex and Discovery Sports Center
Rental Costs
Type Cost
Athletic Fields1/2 Field (Hourly) $75Whole Field (Hourly) $150With Lights (additional hourly) $35
StadiumDaily $1,000Daily with lights $1,500
DSC Indoor Soccer Hourly per Field $200
Source: Maryland Soccer Foundation
The MSP has nineteen natural grass fields and three artificial turf fields. The facility
leases the turf fields year-round but only rents the natural fields in the spring and fall
for weekend tournaments and throughout the summer, primarily for sports camps.
The fields rent for $75 per hour for half field for training and practice, and $150 for
the entire field. Each can have lights for an additional $35 per hour. Organizations
can rent the stadium for $1,000 per day, or $1,500 per day with lights. The outdoor
fields have many tournaments scheduled throughout the warm weather months. The
table below sets out the 2008 tournaments at the Maryland SoccerPlex.

Hamilton County Sports Complex Study Chapter 2 Page 21
Table 2-12
Maryland SoccerPlex
2008 TournamentsDate TournamentMarch 29-30 MSI March MadnessApril 12 Kicks Against Breast CancerApril 27 Maryland State Cup SemifinalsMay 23-26 Potomac Memorial Day TournamentMay 31 Maryland State Cup Finals
June 14-15 MSYSA/MD SoccerPlex Mid-Atlantic Cup
June 20-22 USTC All-American Showcase Girls Lacrosse Capitol Cup
July 18-20 CNC Championship Evolution Girls Lacrosse Games
July 18-20 adidas All-American National Boys Lacrosse Tournament
August 2 Julie Nagel Memorial Charity Field Hockey Tournament
August 23-24 August CupAugust 30-31 Labor Day Soccer TournamentOctober 11-13 Discovery Cup Soccer Tournament
November 15-16 Bethesda Girls Thanksgiving Tournament
November 22-23 Bethesda Boys Thanksgiving Tournament
Source: Maryland Soccer Foundation
The Discovery Sports Center has indoor soccer through the winter months,
November through March. During that time it has a synthetic turf field on the floors
and rents the facility at a rate of $155 to $200 per hour per field, depending on the
time of day. From April through October the center removes the turf and has
basketball/volleyball courts for league and tournament play with a synthetic
rubberized floor.
Financing - The State of Maryland issued tax-exempt bonds in 1999 through the
Maryland Economic Development Corporation to fund the project. The total cost was
$19 million, with $8 million for the SoccerPlex, $6 million for the Discovery Sports
Center, and $5 million for parking and other infrastructure. Montgomery County
donated the land for the facilities.
The facility has thirteen employees, three of which are devoted to marketing. The
major emphasis is on soccer and other sporting events, but the facility also holds
several non-sporting events each year. The complex markets for birthday parties,
bar/bat mitzvahs, and trade shows.
Hotel and Visitor Information – The SoccerPlex hosts several tournaments a year,
and the local convention and visitors bureau (CVB) estimates that the tournaments

Hamilton County Sports Complex Study Chapter 2 Page 22
account for approximately 12,000 hotel room nights. The most profitable tournament
occurs over Memorial Day weekend, when teams stay for the three-day weekend.
Based on the seven percent hotel tax that the county receives on each room, the
Soccerplex generates approximately $101,000 annually in hotel tax revenue.
Businesses in the Boyds area see a substantial increase in sales each weekend that
the Soccerplex holds a tournament.
Lake Charles Multi-Sports Complex – Lake Charles, Louisiana
The Lake Charles Multi-Sports Complex, in Lake Charles, Louisiana, is an outdoor
athletic facility for multiple sports. It is in the process of developing an indoor multi-
purpose recreational center to house indoor sports. The complex compares favorably
with the proposed facility in Hamilton County based on the size and number of fields
and multi-use recreation facility.
The table below is a summary of the information concerning the Lake Charles Multi-
Sports Complex.
Table 2-13
Lake Charles Multi-Sports ComplexKey Data Points
Location Lake Charles, LouisianaOwnership City of Lake CharlesManagement Ward 3 Parks and
Recreation DepartmentYear Complete 2005Facilities
Outdoor 5 baseball/softball fields12 soccer/football fields
Indoor 2 basketball courtsCost of Construction $10 millionFunding Municipal Bonds
Source: City of Lake Charles, Ward 3, HSP
The Lake Charles Multi-Sports Complex is located in Lake Charles, Louisiana, in the
southwestern part of the state. The Metropolitan Statistical Area population for Lake
Charles for 2007 was estimated at 192,000, and the city itself is the fifth-largest city
in Louisiana.
The sports complex is part of the Ward 3 Recreation Department, a joint enterprise
between the City of Lake Charles and Calcasieu Parish. The complex opened in 2005.
The figure below is a diagram of the complex.

Hamilton County Sports Complex Study Chapter 2 Page 23
Figure 2-11
Facilities – The complex consists of:
! Five baseball/softball fields with lights, each with a 300-foot fence. The figure
below is a picture of the baseball/softball fields.

Hamilton County Sports Complex Study Chapter 2 Page 24
Figure 2-12
! Twelve Soccer/Football fields, two of which are lighted.
! Concession stand, restrooms and small meeting rooms, a total of
approximately 5,000 square feet.
! Parking lot for 315 vehicles.
! Office and maintenance facility of approximately 5,000 square feet.
The multipurpose recreation center is under construction, and when completed it will
house two basketball courts, a walking track, a meeting room, concessions, an
additional 289 parking spaces and an administrative office. Future plans include a
playground site for children and a baseball stadium.
Financial Information – The City of Lake Charles funded the recreation
improvements for the city and for Ward 3, the location of the complex. A municipal
bond was passed in 2005 to fund the project. The ten-year bond was in the amount
of $9 million. The total cost of the project to date is $10 million. Ward 3 pays the
yearly operations costs.
Hotel and Visitor Information – Because the facility was constructed largely to
benefit the residents of Lake Charles and the surrounding area, the majority of the
visitors to the facility does not benefit the local hotels or add additional revenue from
out-of-town visitors.
Mid-America Sports Complex/Mid-America West Sports Complex –
Shawnee, Kansas
The Mid-America and Mid-America West Sports Complexes are located in Shawnee,
Kansas, which is a suburb of Kansas City, Missouri. A private company originally
developed and owned the facilities. The Mid-America facilities were built in 1991, the
Mid-America West outdoor facilities were built in 1989 and the Mid-America West
indoor complex was constructed in 1999. In 1994 the Johnson County Park and
Recreation District bought the Mid-America complex for $3.3 million and financed the

Hamilton County Sports Complex Study Chapter 2 Page 25
purchase through the sale of revenue bonds. The Mid-America West complex was
purchased for $5 million in 2004 by the JCPRD using general county funds. The Mid-
America West Sports Complex was originally the Johnson County Girls Athletic
Complex but the name was changed to in 2004 to accommodate recreational
opportunities for girls, boys and adults. The table below summarizes the complex
information.
Table 2-14
Location Shawnee, KansasOwnership/Management Johnson County Park and
Recreation DistrictFacilities
Ten Lighted Softball FieldsTwo Multipurpose FieldsTen-Stall Batting CageConcessions & Dinger’s Restaurant
Pro ShopClubhouse
Mid-America WestFour Basketball CourtsEight volleyball CourtsPro ShopConcessions12 Lighted Youth Softball FieldsEight-Stall Batting CagePro ShopConcessions
Purchase Price $8.3 millionFunding Municipal BondsAverage Attendance (over the past 5 years)
800,000
Mid-America Sports ComplexKey Data Points
Mid-America Sports Complex Completed in 1991
Indoor Completed in 1999
Source: Johnson Co Park & Recreation District, HSP
Outdoor Completed in 1989
The town of Shawnee is located in Johnson County in eastern Kansas, about 15 miles
from Kansas City, Missouri. Located along Highway 12, Shawnee is only a few miles
from the I-435 beltway, which loops around the Kansas City area and runs through
both Missouri and Kansas. The 2007 estimated population of Shawnee was 60,000.
The Kansas City MSA also experienced a fair amount of growth. In 2000 the
population was estimated at 1.8 million and in 2007 it had an estimated population
of 2.0 million.
Facilities – The complex is divided into two sections, the Mid-America Sports
Complex (MSC) and the Mid-America West Sports Complex (MWSC). The two areas
are adjacent to each other, divided by Mill Creek and 55th Street. The Gary L. Haller
Trail connects the facilities.
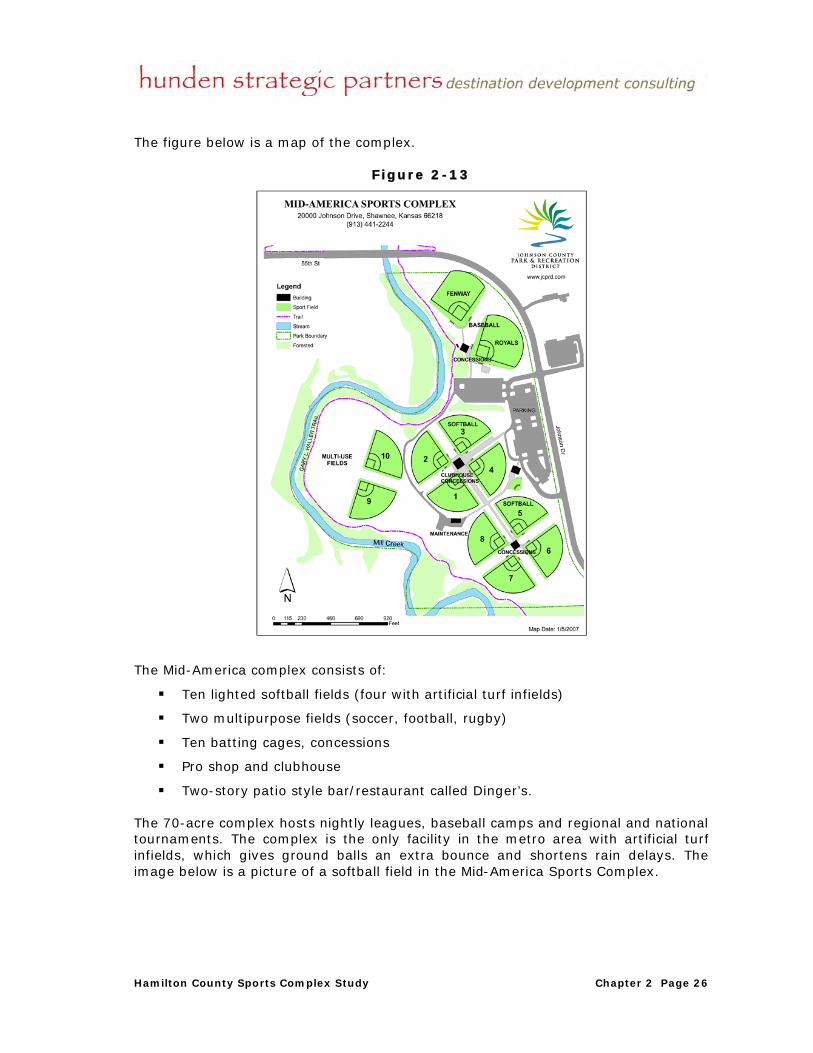
Hamilton County Sports Complex Study Chapter 2 Page 26
The figure below is a map of the complex.
Figure 2-13
The Mid-America complex consists of:
! Ten lighted softball fields (four with artificial turf infields)
! Two multipurpose fields (soccer, football, rugby)
! Ten batting cages, concessions
! Pro shop and clubhouse
! Two-story patio style bar/restaurant called Dinger’s.
The 70-acre complex hosts nightly leagues, baseball camps and regional and national
tournaments. The complex is the only facility in the metro area with artificial turf
infields, which gives ground balls an extra bounce and shortens rain delays. The
image below is a picture of a softball field in the Mid-America Sports Complex.

Hamilton County Sports Complex Study Chapter 2 Page 27
Figure 2-14
The Mid-America West complex, located on forty acres north of the Mid-America
Sports Complex, consists of both indoor and outdoor facilities. The figure below is a
map of the complex.
Figure 2-15

Hamilton County Sports Complex Study Chapter 2 Page 28
The outdoor facilities at the MWSC include:
! Twelve lighted youth softball/baseball fields
! Eight batting cages
! A pro shop and concession stand.
In 1999 Johnson County constructed the 56,500-square foot indoor facility, known as
the Okun Fieldhouse, to enhance the existing complex. The fieldhouse has:
! Four basketball courts
! Eight volleyball courts
! A pro shop and concession stand.
The image below shows the indoor facilities.
Figure 2-16
Financial Information – In 1994, the Johnson County Park & Recreation District
(JCPRD) acquired the Mid-America Sports Complex through $3.3 million in district
revenue bonds. The appraised value of the complex at that time, including
improvements and land value, was $3.5 million. The JCPRD pays $200,000 annually
in bond payments. Johnson County purchased the Mid-America West Sports Complex
in 2004 through $5 million in general county funds. Its appraised value in 2000 was
$5.8 million.
The operations revenue for the Mid-America complex usually equals the costs
incurred, with both costs and revenue averaging $1.5 million per year. The
percentage of revenue from complex is stated in the table below:

Hamilton County Sports Complex Study Chapter 2 Page 29
Table 2-15
Mid-America Sports ComplexRevenue Sources
Type of Revenue Percent
League and Program Fees 41%Concessions 42%Field and Court Rentals 10%Gate Fees 7%
Total 100%
Source: Mid-America Sports Complex, HSP
A large part of the revenue that the complex receives, 41 percent of gross revenue,
derive from team registration fees for tournaments, as well as team and individual
fees for camps and training. An equally important part of the revenue, 42 percent,
derives from the concessions that the complex manages at its stands and other
locations. The complex’s restaurant, Dinger’s, annually receives nearly $250,000 in
revenue from beer sales alone. Another aspect of concessions is sales at pro shops.
It is a requirement that softballs used at the complex are purchased at the Mid-
America Sport Complex because of softball size/type regulations for game play.
Operations costs for the Mid-America West complex average $1.6 million per year.
The percentage of revenue for the complex is shown in the table below:
Table 2-16
Mid-America West Sports ComplexRevenue Sources
Type of Revenue Percent
League and Program Fees 50%Concessions 26%Field and Court Rentals 12%Gate Fees 12%
Total 100%
Source: Mid-America Sports Complex, HSP
The majority of the revenue for the complex, 50 percent, was from league and
program fees. Concession sales made up 26 percent while field/court rentals and
gate fees each brought in 12 percent of revenue.
Field and court rentals are only ten percent of the total revenue. The multi-purpose
fields cost $20 per hour to rent and can be marked for an additional $50 fee. Below
is a table of the fees for programs and activities at the Okun Fieldhouse.

Hamilton County Sports Complex Study Chapter 2 Page 30
Table 2-17
Okun FieldhousePrograms & Activities Costs
Type CostBasketball Camp
3-2 Hour Sessions (Resident Fee) $453-2 Hour Sessions (Non-Resident Fee) $503-90 Minute Sessions (Resident Fee) $353-90 Minute Sessions (Non-Resident Fee) $40
Youth Soccer4-30 Minutes Sessions (Resident Fee) $504-30 Minutes Sessions (Non-Resident Fee) $55
Volleyball Camp3-4 Hour Sessions (Resident Fee) $653-4 Hour Sessions (Non-Resident Fee) $72
Source: Johnson County Park & Recreation District
The indoor facilities remain open all year while the outdoor facilities are only
available from mid-March to early November. Rates for basketball camps and youth
soccer classes run from $35-55 and volleyball camps are $65. Non-residents of
Johnson county pay on average about $5 more per person to attend programs and
activities at the Okun Fieldhouse.
Hotel and Visitor Information – The facility exists to benefit the residents of
Johnson County and the surrounding area, and therefore the majority of the visitors
to the facility are local. Most activities at the complexes do not benefit the local
hotels or add additional revenue from out-of-town visitors. However, the complex
played host to the 2006 USSSA Men’s D Slow Pitch Softball World Tournament.
Nearly 200 teams and 5,000 visitors attended the 5-day tournament. It drew guests
to 5,640 hotel rooms and made an economic impact of about $2.2 million to Johnson
County.
The average annual attendance rate for both complexes is 400,000 with participants
totaling 200,000 visits and 200,000 spectators. This rate has remained consistent
over the past five years.
Other Facilities
Many other facilities are not as suitable to use as comparable examples for the
proposed project have some aspect that may be of interest to stakeholders in
Hamilton County.
Sports Village USA – Frisco, Texas
The Sports Village USA, in Frisco, Texas, is a public-private development under
construction. The $100 million project is being developed through a joint partnership

Hamilton County Sports Complex Study Chapter 2 Page 31
between the City of Frisco and the private company, Sports Village USA. When
completed the 50-acre complex will include a variety of mixed uses, including a retail
area, office space, multi-unit residential, a hotel and restaurants.
The Sports Village USA is located in Frisco, Texas, which is a suburb of the Dallas-
Fort Worth area, north of Dallas. The population for Frisco in 2006 was 80,500 (a
significant increase from its 2000 population of 33,000), and the estimated
population in the Dallas-Fort Worth MSA for 2007 was 6.1 million.
The figure below is a drawing of the completed Sports Village USA.
Figure 2-17
The sport aspect of the development will center around an indoor facility, named
“Fieldhouse USA,” a 162,000-square foot complex. The facility will have two indoor
turf fields and 13 full hardwood basketball courts, including one center court that will
seat 500 spectators. The facility will also include a food court, retail space, meeting
space, and a training facility. Fieldhouse USA sits on fourteen acres that is part of the
50-acre Sports Village development.
The private company Sports Village USA, LLC (SVUSA), the developer of the project,
donated the acreage for Fieldhouse USA, valued at $5 million. The City of Frisco,
Texas, issued municipal bonds in the amount of $12.5 million for development of the
facility. The building is set to open in March of 2009. SVUSA will lease the facility
from the city at an annual fee that will pay the debt service on the bonds. SVUSA will
operate the facility as a for-profit enterprise and will receive all revenue for rentals
and concessions.
The Sports Village complex also has plans to develop a gymnastics center and state-
of-the-art sports medicine and training center within the development.
Warren County, Ohio
In the past few years Warren County, Ohio, investigated a proposal to complete a
destination facility that would include a major sports and recreational complex.
Warren County, Ohio, is a positioned in a growth corridor between two expanding
metropolitan areas, Cincinnati and Dayton, Ohio. The county is the location of Kings
Island, a major theme park, as well as the Cincinnati Zoo and other tourist
destinations. It is a growing area and therefore was interested in creating a facility
that would serve both the local community and bring in regional visitors.

Hamilton County Sports Complex Study Chapter 2 Page 32
Warren County sought to create a sports complex to serve the local community and
attract regional tournaments. The facility was to have 19 athletic fields to host
soccer, field hockey, lacrosse and football, eight baseball fields, and an indoor facility
for indoor soccer, basketball and volleyball. The programming was to emphasize
youth sports tournaments for weekends and recreational leagues during the week.
The complex was to be located next to the Cincinnati Zoo and include other tourist
and destination properties.
The cost of the facility was estimated to be $80 million, with operations expenses
estimated to begin at $2.5 million the first year, expanding as usage expands to $3.5
million by year five. The total economic impact of the facility for the county was
projected to be $78.3 million for the first stabilized year, with $45.3 million as new
revenue to the county from visitors, not transferred spending by locals.
As of the time of this report Warren County has chosen not to launch the project.
The county determined that the cost of the facility was too high and funding was not
available to pay for the development costs. The county is now considering other
avenues to move forward with at least part of the project, including partnering with
municipalities in the county to develop aspects of the project. The county hopes to
have a county-wide levy imposed that could assist in funding part of the complex.
Summary
The parties interested in a sports complex in Hamilton County have many
comparable sports facilities from which to gain information. The facilities that are
most comparable with the size and scope of facilities considered for the county fall
into three basic types. The interested parties will have to decide which ownership
structure would be in the parties’ best interests.
The first type of ownership model is a public-private scenario, with the public sector
developing the facility and the private company leasing and/or managing the
complex. While the development costs can vary significantly, depending on the
quality and scale of development, it is rare for private enterprise to take on the risk
of such a facility unless it is a secondary amenity and demand generator to a larger
facility, such as in Disney’s case. The private entity has to be able to make a profit
for the complex to be viable. Typically, the public sector has borne the cost of
developing the facilities in question, while a combination of private, non-profit and
public management structures have been employed. The operating expenses can
often be covered by operating revenues and other revenue, such as sponsorships
and advertising. A location that includes a winter climate, such as Hamilton County,
may find it more difficult to generate the necessary revenue throughout the year to
offset all expenses unless an indoor facility is developed for basketball, indoor soccer
and other events that would use such space.
The second type of sports complex involves a not-for-profit foundation, either
through ownership or management. The two comparable complexes that fit this
model are the National Sports Center in Blaine, Minnesota and the Maryland
Soccerplex in Boyds, Maryland. Non-profit groups manage and control the complex
and use any excess profits for capital improvements. However, the public sector

Hamilton County Sports Complex Study Chapter 2 Page 33
funded the initial construction and development of each complex. As in the public-
private model, the public sector had to contribute a significant amount of funds for
the initial development of the project.
The last type of facility is a purely public sports complex, owned and managed by the
locality, municipality, or regional park authority. The comparable projects were less
costly for development but have ongoing management fees and costs that the other
types of facilities do not incur.
Once the interested parties determine the ownership structure of the complex and
the method of financing the development, the parties can fit the different sports
options into the facility. Almost all of the types of fields and uses will fit into each
model, but both the public-private and the non-profit ownership structures would
require an indoor facility to allow for year-round revenue. The indoor facility will
increase the cost of development considerably.
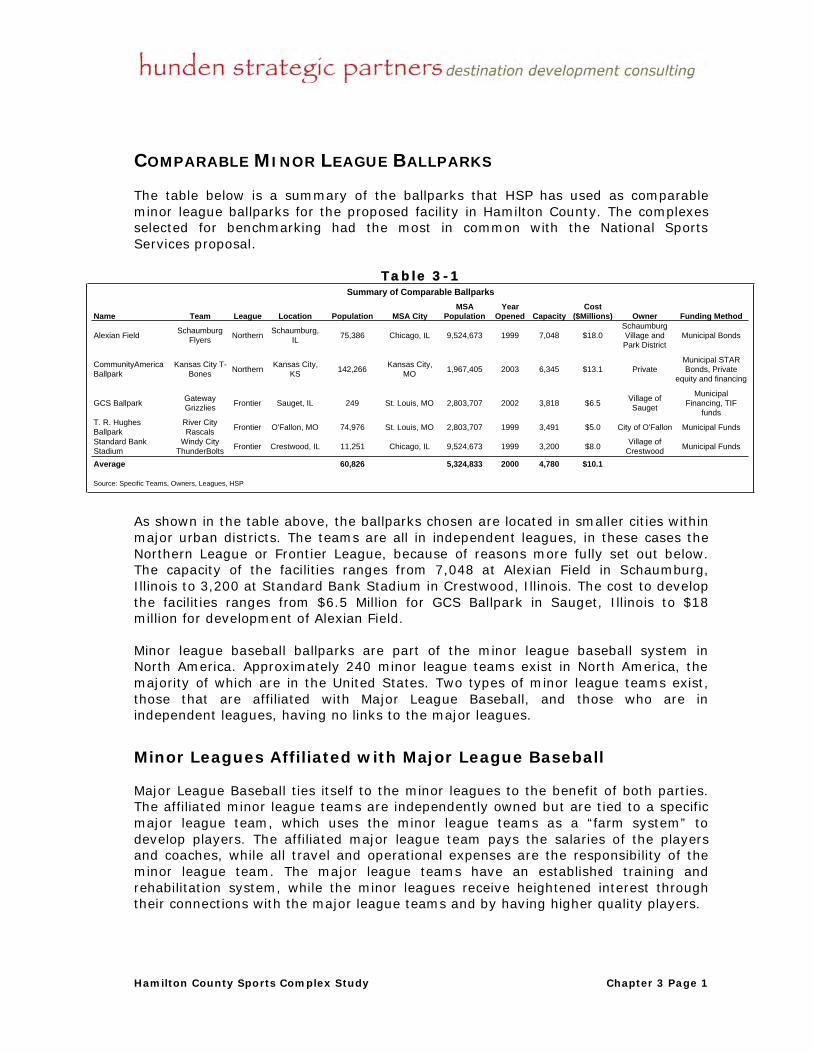
Hamilton County Sports Complex Study Chapter 3 Page 1
COMPARABLE MINOR LEAGUE BALLPARKS
The table below is a summary of the ballparks that HSP has used as comparable
minor league ballparks for the proposed facility in Hamilton County. The complexes
selected for benchmarking had the most in common with the National Sports
Services proposal.
Table 3-1
Summary of Comparable Ballparks
Name Team League Location Population MSA CityMSA
PopulationYear
Opened CapacityCost
($Millions) Owner Funding Method
Alexian Field Schaumburg Flyers Northern Schaumburg,
IL 75,386 Chicago, IL 9,524,673 1999 7,048 $18.0Schaumburg Village and Park District
Municipal Bonds
CommunityAmerica Ballpark
Kansas City T-Bones Northern Kansas City,
KS 142,266 Kansas City, MO 1,967,405 2003 6,345 $13.1 Private
Municipal STAR Bonds, Private
equity and financing
GCS Ballpark Gateway Grizzlies Frontier Sauget, IL 249 St. Louis, MO 2,803,707 2002 3,818 $6.5 Village of
Sauget
Municipal Financing, TIF
fundsT. R. Hughes Ballpark
River City Rascals Frontier O'Fallon, MO 74,976 St. Louis, MO 2,803,707 1999 3,491 $5.0 City of O'Fallon Municipal Funds
Standard Bank Stadium
Windy City ThunderBolts Frontier Crestwood, IL 11,251 Chicago, IL 9,524,673 1999 3,200 $8.0 Village of
Crestwood Municipal Funds
Average 60,826 5,324,833 2000 4,780 $10.1
Source: Specific Teams, Owners, Leagues, HSP
As shown in the table above, the ballparks chosen are located in smaller cities within
major urban districts. The teams are all in independent leagues, in these cases the
Northern League or Frontier League, because of reasons more fully set out below.
The capacity of the facilities ranges from 7,048 at Alexian Field in Schaumburg,
Illinois to 3,200 at Standard Bank Stadium in Crestwood, Illinois. The cost to develop
the facilities ranges from $6.5 Million for GCS Ballpark in Sauget, Illinois to $18
million for development of Alexian Field.
Minor league baseball ballparks are part of the minor league baseball system in
North America. Approximately 240 minor league teams exist in North America, the
majority of which are in the United States. Two types of minor league teams exist,
those that are affiliated with Major League Baseball, and those who are in
independent leagues, having no links to the major leagues.
Minor Leagues Affiliated with Major League Baseball
Major League Baseball ties itself to the minor leagues to the benefit of both parties.
The affiliated minor league teams are independently owned but are tied to a specific
major league team, which uses the minor league teams as a “farm system” to
develop players. The affiliated major league team pays the salaries of the players
and coaches, while all travel and operational expenses are the responsibility of the
minor league team. The major league teams have an established training and
rehabilitation system, while the minor leagues receive heightened interest through
their connections with the major league teams and by having higher quality players.
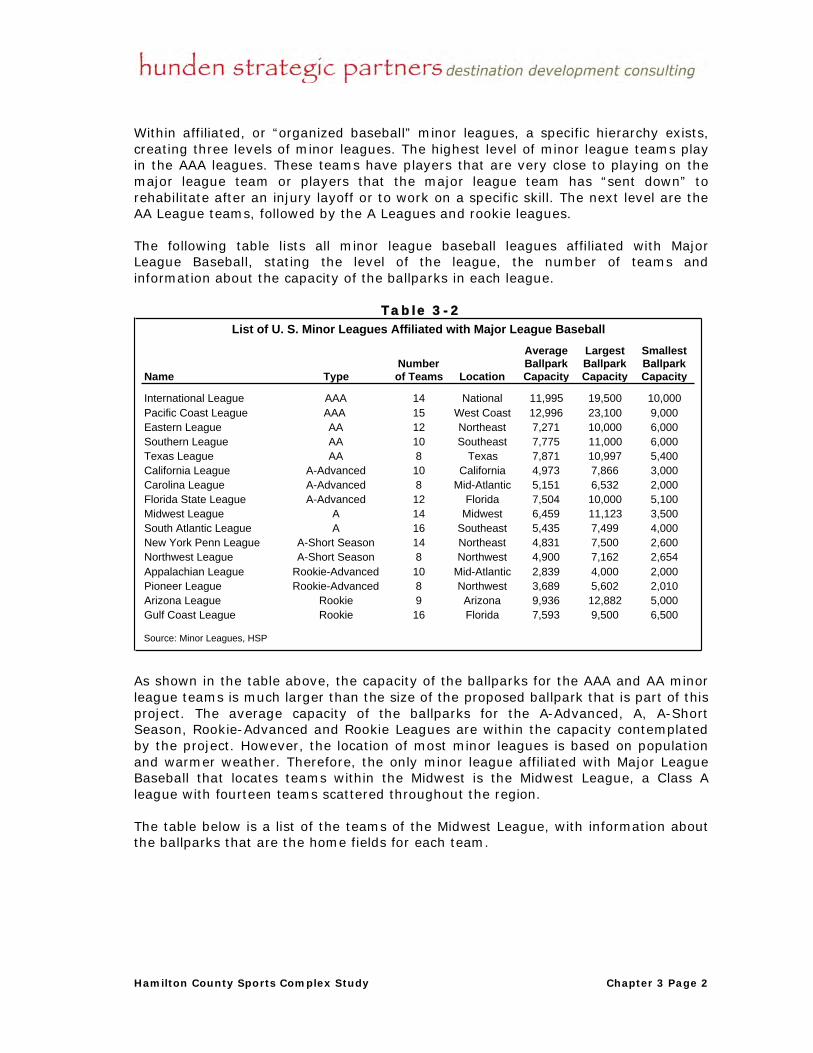
Hamilton County Sports Complex Study Chapter 3 Page 2
Within affiliated, or “organized baseball” minor leagues, a specific hierarchy exists,
creating three levels of minor leagues. The highest level of minor league teams play
in the AAA leagues. These teams have players that are very close to playing on the
major league team or players that the major league team has “sent down” to
rehabilitate after an injury layoff or to work on a specific skill. The next level are the
AA League teams, followed by the A Leagues and rookie leagues.
The following table lists all minor league baseball leagues affiliated with Major
League Baseball, stating the level of the league, the number of teams and
information about the capacity of the ballparks in each league.
Table 3-2
List of U. S. Minor Leagues Affiliated with Major League Baseball
Name TypeNumber of Teams Location
Average Ballpark Capacity
Largest Ballpark Capacity
Smallest Ballpark Capacity
International League AAA 14 National 11,995 19,500 10,000Pacific Coast League AAA 15 West Coast 12,996 23,100 9,000Eastern League AA 12 Northeast 7,271 10,000 6,000Southern League AA 10 Southeast 7,775 11,000 6,000Texas League AA 8 Texas 7,871 10,997 5,400California League A-Advanced 10 California 4,973 7,866 3,000Carolina League A-Advanced 8 Mid-Atlantic 5,151 6,532 2,000Florida State League A-Advanced 12 Florida 7,504 10,000 5,100Midwest League A 14 Midwest 6,459 11,123 3,500South Atlantic League A 16 Southeast 5,435 7,499 4,000New York Penn League A-Short Season 14 Northeast 4,831 7,500 2,600Northwest League A-Short Season 8 Northwest 4,900 7,162 2,654Appalachian League Rookie-Advanced 10 Mid-Atlantic 2,839 4,000 2,000Pioneer League Rookie-Advanced 8 Northwest 3,689 5,602 2,010Arizona League Rookie 9 Arizona 9,936 12,882 5,000Gulf Coast League Rookie 16 Florida 7,593 9,500 6,500
Source: Minor Leagues, HSP
As shown in the table above, the capacity of the ballparks for the AAA and AA minor
league teams is much larger than the size of the proposed ballpark that is part of this
project. The average capacity of the ballparks for the A-Advanced, A, A-Short
Season, Rookie-Advanced and Rookie Leagues are within the capacity contemplated
by the project. However, the location of most minor leagues is based on population
and warmer weather. Therefore, the only minor league affiliated with Major League
Baseball that locates teams within the Midwest is the Midwest League, a Class A
league with fourteen teams scattered throughout the region.
The table below is a list of the teams of the Midwest League, with information about
the ballparks that are the home fields for each team.

Hamilton County Sports Complex Study Chapter 3 Page 3
Table 3-3
Midwest League
Team MLB Affiliation City Stadium CapacityYear
Opened*Cost
($Millions)
Eastern DivisionDayton Dragons Cincinnati Reds Dayton, Ohio Fifth Third Field 8,200 2000 $22Fort Wayne TinCaps San Diego Padres Fort Wayne, Indiana Parkview Field 9,000 2009 $22Great Lakes Loons Los Angeles Dodgers Midland, Michigan Dow Diamond 5,500 2007 $33Lansing Lugnuts Toronto Blue Jays Lansing, Michigan Oldsmobile Park 11,000 1996 N/AWest Michigan Whitecaps Detroit Tigers Comstock Park, Michigan Fifth Third Ballpark 11,123 1994 N/A
South Bend Silver Hawks Arizona Diamondbacks South Bend, Indiana Stanley Coveleski Regional Stadium 5,000 1987 N/A
Western DivisionBeloit Snappers Minnesota Twins Beloit, Wisconsin Harry C. Pohlman Field 3,501 1982 N/ABurlington Bees Kansas City Royals Burlington, Iowa Community Field 3,500 1973 N/ACedar Rapids Kernels Los Angeles Angels Cedar Rapids, Iowa Veterans Memorial Stadium 5,300 2002 $16.5Clinton LumberKings Seattle Mariners Clinton, Iowa Alliant Energy Field1 4,000 1937 N/AKane County Cougars Oakland Athletics Geneva, Illinois Philip B. Elfstrom Stadium 7,400 1991 N/APeoria Chiefs Chicago Cubs Peoria, Illinois O'Brien Field 7,377 2002 $23Quad Cities River Bandits St. Louis Cardinals Davenport, Iowa Modern Woodmen Park 4,024 2004** $12.5**
Wisconsin Timber Rattlers Milwaukee Brewers Grand Chute, Wisconsin Time Warner Cable Field at Fox Cities Stadium 5,500 1995 N/A
Average 6,459 1990 $23*Cost for development of ballparks in past 10 years**Renovation of 1931 BallparkSource: Midwest League, HSP
The table above shows that only two teams in the Midwest League are from Indiana,
the South Bend Silver Hawks and the Fort Wayne TinCaps. The other team that is
located within 150 miles of Hamilton County is the Dayton Dragons, in Dayton, Ohio.
Of the fourteen teams in the Midwest League, five have developed ballparks in the
last decade, at an average cost of $23 million. Furthermore, the Quad Cities River
Bandits, in Davenport, Iowa, completely remodeled the Modern Woodmen Park at a
cost of $12.5 million. The two ballparks that have the seating capacity similar to the
proposed ballpark are Veterans Memorial Stadium, at Cedar Rapids Iowa, the
ballpark of the Cedar Rapids Kernels, and the Dow Diamond, in Midland, Michigan,
home to the Great Lakes Loons. However, neither of those facilities is in a location
that has demographics similar to Hamilton County, since neither are suburbs of large
cities.
Another aspect that stakeholders in Hamilton County needs to consider is the
average attendance at minor league baseball games to determine the size of the
facility and the expected cost of operations. Since the Midwest League is in the same
region, a review of the attendance for the league is of interest. The table below sets
out the attendance for each team in the Midwest League and the percent of capacity
of each ballpark.

Hamilton County Sports Complex Study Chapter 3 Page 4
Table 3-4
Midwest League 2008 Attendance
Team Total Home
Games Average CapacityPercent of Capacity
Dayton 586,417 68 8,623 8,200 105%Kane County 472,596 66 7,160 7,400 97%West Michigan 367,532 66 5,568 11,123 50%Lansing 353,571 69 5,124 11,000 47%Great Lakes 299,416 68 4,403 5,500 80%Peoria 275,673 65 4,241 7,377 57%Fort Wayne 256,693 69 3,720 9,000 41%Quad Cities 207,048 60 3,450 4,024 86%Wisconsin 190,263 62 3,068 5,500 56%Cedar Rapids 164,568 67 2,456 5,300 46%South Bend 163,479 68 2,404 5,000 48%Clinton 114,662 67 1,711 4,000 43%Beloit 82,456 67 1,230 3,501 35%Burlington 68,313 68 1,004 3,500 29%Average 257,335 66 3,869 6,459 59%
Source: Midwest League
The table above shows that the average attendance for the Midwest League is 3,869,
with the Dayton Dragons drawing the most spectators, an average of over 8,600,
and the Burlington Bees drawing the fewest, with an average of approximately 1,000
people per home game. Of the Indiana teams, Fort Wayne drew more, an average of
3,720, while South Bend averaged 2,400 spectators per game. Four teams averaged
over eighty percent capacity, including Dayton with over 100 percent capacity
(Dayton has lawn seating that is not counted in the seating capacity figure.)
However, the average attendance was only 59 percent of capacity, because eight of
the fourteen teams averaged fifty percent or lower.
If principles in Hamilton County wish to try to establish a minor league team in one
of the affiliated minor leagues, it will have to contend with a rule that may prevent
the team from forming. A new minor league team would not be able to form within a
certain distance of another minor league or major league team. Since Indianapolis
has a AAA team, the Indianapolis Indians, restrictions on a team in Hamilton County
may exist unless the Indianapolis team consents.
Independent Leagues in Baseball
Independent baseball leagues have no tie to Major League Baseball. The players in
the independent leagues are those who want a chance to play and show their skills
with the hope of signing with a major league team and moving into the affiliated
minor league system. Many players in Major League Baseball have begun their
careers on an independent minor league team.
The leagues vary in popularity and success, but several independent leagues have a
proven history of successful and viable franchises. Teams within a league have no

Hamilton County Sports Complex Study Chapter 3 Page 5
territorial limitations, so that several teams within the same region can form a
league, with less expensive travel expenses. Several of the teams in these leagues
have had success as suburban teams near large urban markets, even when the
larger cities contain other minor league and sometimes major league teams. The
ballparks that play home field to these minor league teams have had good
attendance and continued interest.
The table below lists the current independent baseball leagues in the United States.
Table 3-5
Independent Baseball Leagues
League First Season Geographical AreaNumber of Teams
Average Ballpark Capacity
American Association of Independent Professional Baseball 2006
Nebraska, Iowa, South Dakota, Minnesota, Kansas;
Gulf Coast10 5,377
Atlantic League of Professional Baseball 1998 Northeast 8 5,928
Canadian-American Association of Professional Baseball
2005 Northeast, Canada 8 5,063
Continental Baseball League 2007 Texas 4 2,107Frontier League 1993 Midwest 12 4,457Golden Baseball League 2005 West Coast, Canada 10 5,669Northern League 1993 Midwest, Manitoba 6 6,266United League Baseball 2006 Texas, Louisiana 6 4,783
Source: Baseball Leagues, HSP
As shown by the table above, the average ballpark capacity for the independent
baseball leagues is within the parameters of the proposed ballpark for Hamilton
County. In addition, two independent leagues are located in the Midwest, the
Frontier League and the Northern League. The two leagues also have several
ballparks that are in suburban areas of major cities that have other professional
baseball teams.
Northern League
The independent Northern League is the oldest current independent baseball league
in the United States, established in 1993. The table below lists the Northern League
baseball clubs and the home ballparks for each club.
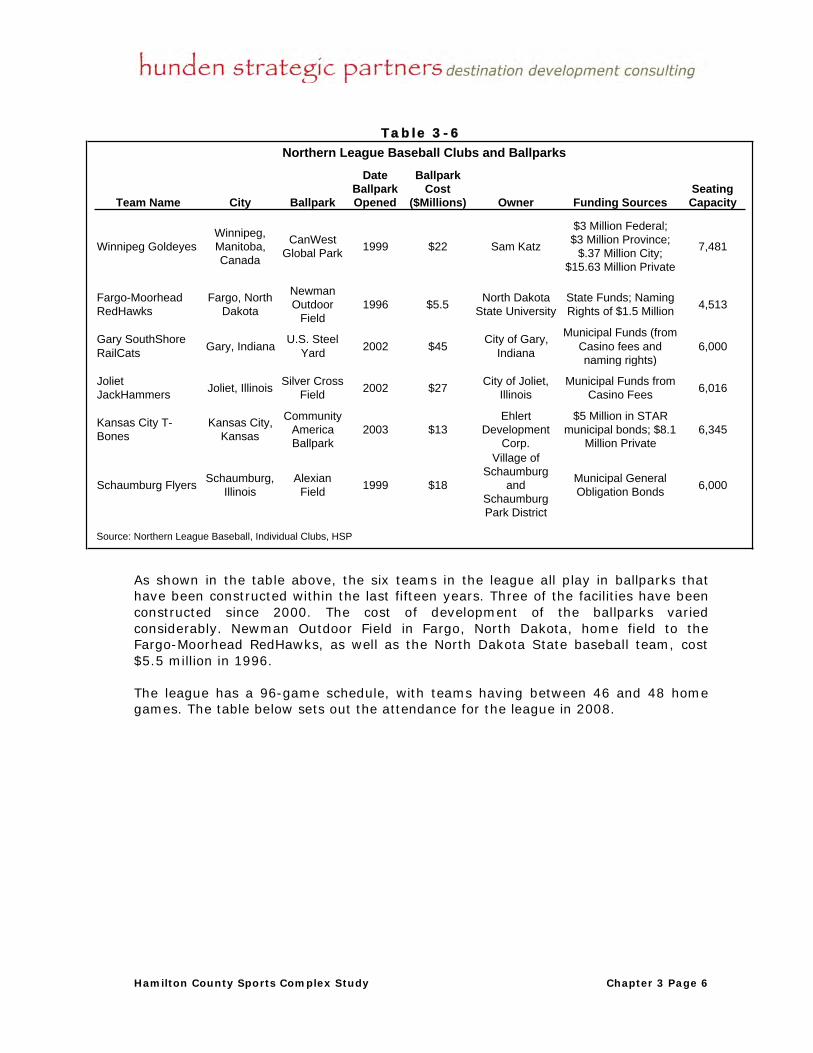
Hamilton County Sports Complex Study Chapter 3 Page 6
Table 3-6
Northern League Baseball Clubs and Ballparks
Team Name City Ballpark
Date Ballpark Opened
Ballpark Cost
($Millions) Owner Funding SourcesSeating Capacity
Winnipeg GoldeyesWinnipeg, Manitoba, Canada
CanWest Global Park 1999 $22 Sam Katz
$3 Million Federal; $3 Million Province;
$.37 Million City; $15.63 Million Private
7,481
Fargo-Moorhead RedHawks
Fargo, North Dakota
Newman Outdoor
Field1996 $5.5 North Dakota
State UniversityState Funds; Naming Rights of $1.5 Million 4,513
Gary SouthShore RailCats Gary, Indiana U.S. Steel
Yard 2002 $45 City of Gary, Indiana
Municipal Funds (from Casino fees and naming rights)
6,000
Joliet JackHammers Joliet, Illinois Silver Cross
Field 2002 $27 City of Joliet, Illinois
Municipal Funds from Casino Fees 6,016
Kansas City T-Bones
Kansas City, Kansas
Community America Ballpark
2003 $13Ehlert
Development Corp.
$5 Million in STAR municipal bonds; $8.1
Million Private6,345
Schaumburg Flyers Schaumburg, Illinois
Alexian Field 1999 $18
Village of Schaumburg
and Schaumburg Park District
Municipal General Obligation Bonds 6,000
Source: Northern League Baseball, Individual Clubs, HSP
As shown in the table above, the six teams in the league all play in ballparks that
have been constructed within the last fifteen years. Three of the facilities have been
constructed since 2000. The cost of development of the ballparks varied
considerably. Newman Outdoor Field in Fargo, North Dakota, home field to the
Fargo-Moorhead RedHawks, as well as the North Dakota State baseball team, cost
$5.5 million in 1996.
The league has a 96-game schedule, with teams having between 46 and 48 home
games. The table below sets out the attendance for the league in 2008.

Hamilton County Sports Complex Study Chapter 3 Page 7
Table 3-7
Northern League 2008 Attendance
Team AttendanceHome
Games AverageSeating Capacity
Percent of Capacity
Winnipeg 284,398 44 6,464 7,481 86%Kansas City 280,795 48 5,850 4,513 130%Schaumburg 202,013 47 4,298 7,048 61%Fargo-Moorhead 177,900 46 3,867 6,016 64%Joliet 184,638 48 3,847 6,345 61%Gary 159,586 46 3,469 6,000 58%
Average 214,888 47 4,633 6,234 74%
Source: Northern League Baseball
In 2008 the average attendance for the league was 4,633. Winnipeg had the highest
attendance, an average of 6,464 spectators, while Gary had the lowest attendance at
3,469. The percent of capacity figures show that all teams have more than fifty
percent capacity, with an average of 76 percent. Kansas City has the highest
percentage, with 130 percent of the seats sold due to the grass areas behind the
outfield that are not counted in the capacity numbers. Both average attendance and
average percent of capacity were higher than those of the Midwest League, the
affiliated minor league in the region.
Two of the Northern League ballparks are of special interest due to their size, date of
completion, financing and location near major metropolitan areas. Below is an
analysis of those facilities.
CommunityAmerica Ballpark – Kansas City, Kansas
The minor league field in Kansas City, Kansas, is the CommunityAmerica Ballpark
(the “CAB”), the home field for the Kansas City T-Bones, a minor league baseball
team playing in the independent Northern League. The specifics of the facility are as
follows:

Hamilton County Sports Complex Study Chapter 3 Page 8
Table 3-8
CommunityAmerica BallparkKey Data Points
Location Kansas City, KansasTeam Kansas City T-BonesOwnership PrivateYear Complete 2003Seating Capacity 6,345Cost of Construction $13.1 MillionFunding
Private Funds $8.1 MillionMunicipal STAR Bonds $5 Million
Luxury Suites 20Annual Fee for Luxury Suites $17,000 to $25,0002008 Average Attendance 5,850
Source: Kansas City T-Bones, HSP
Location - The CAB is located in Kansas City, Kansas, a suburb of the Kansas City,
Missouri metropolitan area. The population of the Kansas City MSA in 2007 was
estimated to be 2.0 million. Kansas City, Kansas, located in Wyandotte County, had
an estimated population for 2007 of 142,000. The city and county have formed a
“unified government” structure that works together to provide services to all
residents of the city and county.
The Kansas City area is the home of a Major League Baseball team, the Kansas City
Royals, which has several minor league clubs affiliated with the program. The closest
minor league clubs affiliated with the Royals are the Northwest Arkansas Naturals,
located in Springdale, Arkansas, and playing in the AA Texas League, the Burlington
Bees, located in Burlington Iowa and playing in the Low-A Midwest League, and the
Omaha Royals, located in Omaha, Nebraska, and playing in the AAA Pacific Coast
League.
The area also is home to the Kansas City Chiefs NFL franchise. The Chiefs play in
Arrowhead Stadium, located in Kansas City, Missouri. The Kansas City area is also
home to several other professional teams, including the Kansas City Brigade Arena
Football team, which plays at the new Sprint Center in downtown Kansas City,
Missouri, and the Kansas City Wizards, the Major League Soccer team that currently
plays at the CommunityAmerica Ballpark. (The team had previously played at
Arrowhead stadium and are building a soccer-specific facility, discussed below.)
CAB is part of the Village West development, a mixed-use retail, dining and
entertainment venue that opened in 2002. Located eleven miles from downtown
Kansas City, Missouri, Village West includes The Legends at Village West, a regional
shopping mall and lifestyle center, a theater complex, and Great Wolf Lodge, an
indoor water-park resort. It is located next to the Kansas Speedway, which hosts
NASCAR, Indy Car and other major races. A Hard Rock Hotel and Casino to be
constructed as part of the Kansas Speedway is in the planning stages of
development.

Hamilton County Sports Complex Study Chapter 3 Page 9
Home Team - The Kansas City T-Bones have been the home team of the CAB since
it opened on June 6, 2003. The team has never had a winning season, but finished
with a .500 record in 2004. In 2008 the T-Bones finished with a 44-52 record but
qualified for the playoffs, winning the semi-final series 3-0 and the championship
series 3-1 to claim the Northern League championship.
Facility Description - The owner and operator of the Kansas City team, Ehlart
Development Corporation, headed by John Ehlert as president and CEO, is also the
owner of the Community America Ballpark. Completed in 2003, the facility originally
had 4,365 fixed seats, with additional seating on the “berm,” the grass hill beyond
the center field fence. The regional Major League Soccer team, the Kansas City
Wizards, began playing home games at the stadium while the new Kansas City
soccer stadium is being constructed. Therefore, the ballpark was enlarged and new
seating was added, with the current total of 6,537 fixed seats and additional
grass/berm seating.
The figures below are pictures of the ballpark.
Figure 3-1

Hamilton County Sports Complex Study Chapter 3 Page 10
Figure 3-2
The ballpark was designed to be fan-friendly. Every seat is at most fifty feet from the
field, and the seats are wider (19 to 21 inches) and farther apart (39 inch tread
distance) than most stadium and ballpark seating. The public concourse encircles the
field and the facility has two-thirds more women’s restrooms than the building code
required. The outfield is asymmetrical and has an eighteen-foot tall wall in left field,
a mini “green monster.”
The upper level has twenty luxury suites and two club terraces. The luxury suites are
of three different sizes and have differing pricing structures. They can be rented for
$500 to $800 per night or $17,000 to $25,000 per year.
The Kansas City Wizards, the regional Major League Soccer team, has temporarily
located to the CAB. The field has been adjusted somewhat to allow for the soccer
matches, including having grass between the bases and the normal baseball clay
surface only around the bases and the pitcher’s mound. The Wizards organization
added seats to the facility to deal with the larger crowds that the soccer matches
draw. The MSL games in 2008 had an average attendance of 10,686, which is
beyond the seating capacity for fixed seats. The soccer team added the 2,172 new
seats before the beginning of the 2008 season at no cost to the owners. CAB
anticipates that the KC Wizards will use the ballpark for two more seasons before
moving to their permanent home, now under development.
Financing - The original cost of the CAB was $13.1 million, and the private
ownership paid $8.1 million of that amount for the development of the facility. The
unified Kansas City-Wyandotte County government and the State of Kansas
contributed $5 million of the cost by issuing bonds called STAR bonds. The State of

Hamilton County Sports Complex Study Chapter 3 Page 11
Kansas has authorized this type of bond, which collects sales and other state and
municipal taxes from a specific authorized district and applies the taxes to
repayment of the bonds. The STAR bonds are issued only for payment of
infrastructure and other development costs within a designated district, not
specifically for the construction of the facility itself. In the case of the CAB, the STAR
bonds were incorporated into the larger project of the Village West development and
the Kansas Speedway.
CommunityAmerica Credit Union bought the naming rights to the stadium for ten
years, beginning in the 2003 season. The amount paid was not disclosed.
Alexian Field, Schaumburg Flyers – Schaumburg, Illinois
The minor league field in Schaumburg, Illinois, a suburb of Chicago, is the Alexian
Field (the “Alexian”), the home field for the Schaumburg Flyers, a minor league
baseball team playing in the Northern League. The specifics of the facility are as
follows:
Table 3-9
Alexian FieldKey Data Points
Location Schaumburg, IllinoisTeam Schaumburg FlyersOwnership Village of Schaumburg and
Schaumburg Park District
Year Complete 1999Seating Capacity 7,048Cost of Construction $18 millionFunding
Municipal General Obligation BondsLuxury Suites 20Annual Fee for Luxury Suites
$18,000
2008 Average Attendance 4,298
Source: Schaumburg Flyers, HSP
Location – The Village of Schaumburg, Illinois, is in Cook County, located
approximately thirty miles northwest of downtown Chicago. The village had a
population in 2007 of 75,000, within the total Chicago MSA estimated in 2007 to be
9.5 million. The village has a total area of 19.1 square miles and is located near the
Interstate 90 Elgin-O’Hare Expressway. The Village of Schaumburg has a village
council form of government, with a village manager conducting the municipal
operations.
The metropolitan Chicago area has two Major League baseball teams, the northside
Chicago Cubs and the southside Chicago White Sox, as well as other minor league
teams, including the Kane County Cougars, in Geneva, Illinois, of the Midwest
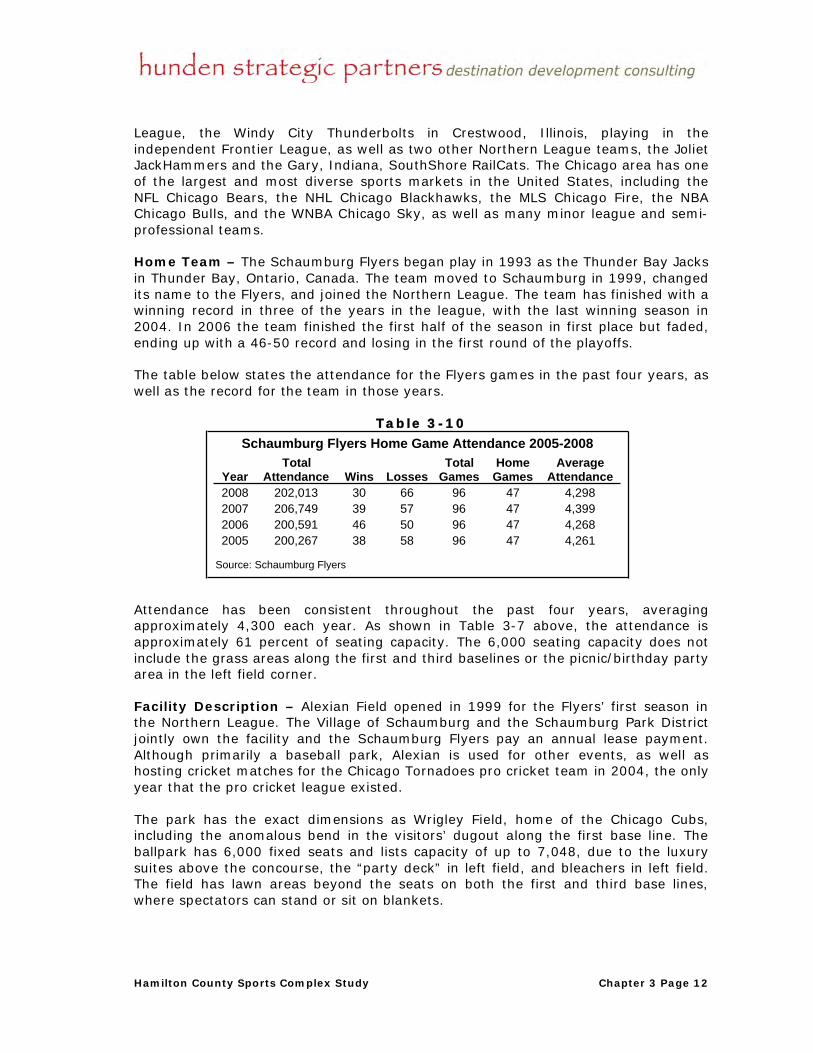
Hamilton County Sports Complex Study Chapter 3 Page 12
League, the Windy City Thunderbolts in Crestwood, Illinois, playing in the
independent Frontier League, as well as two other Northern League teams, the Joliet
JackHammers and the Gary, Indiana, SouthShore RailCats. The Chicago area has one
of the largest and most diverse sports markets in the United States, including the
NFL Chicago Bears, the NHL Chicago Blackhawks, the MLS Chicago Fire, the NBA
Chicago Bulls, and the WNBA Chicago Sky, as well as many minor league and semi-
professional teams.
Home Team – The Schaumburg Flyers began play in 1993 as the Thunder Bay Jacks
in Thunder Bay, Ontario, Canada. The team moved to Schaumburg in 1999, changed
its name to the Flyers, and joined the Northern League. The team has finished with a
winning record in three of the years in the league, with the last winning season in
2004. In 2006 the team finished the first half of the season in first place but faded,
ending up with a 46-50 record and losing in the first round of the playoffs.
The table below states the attendance for the Flyers games in the past four years, as
well as the record for the team in those years.
Table 3-10
Schaumburg Flyers Home Game Attendance 2005-2008
YearTotal
Attendance Wins LossesTotal
GamesHome
GamesAverage
Attendance2008 202,013 30 66 96 47 4,2982007 206,749 39 57 96 47 4,3992006 200,591 46 50 96 47 4,2682005 200,267 38 58 96 47 4,261
Source: Schaumburg Flyers
Attendance has been consistent throughout the past four years, averaging
approximately 4,300 each year. As shown in Table 3-7 above, the attendance is
approximately 61 percent of seating capacity. The 6,000 seating capacity does not
include the grass areas along the first and third baselines or the picnic/birthday party
area in the left field corner.
Facility Description – Alexian Field opened in 1999 for the Flyers’ first season in
the Northern League. The Village of Schaumburg and the Schaumburg Park District
jointly own the facility and the Schaumburg Flyers pay an annual lease payment.
Although primarily a baseball park, Alexian is used for other events, as well as
hosting cricket matches for the Chicago Tornadoes pro cricket team in 2004, the only
year that the pro cricket league existed.
The park has the exact dimensions as Wrigley Field, home of the Chicago Cubs,
including the anomalous bend in the visitors’ dugout along the first base line. The
ballpark has 6,000 fixed seats and lists capacity of up to 7,048, due to the luxury
suites above the concourse, the “party deck” in left field, and bleachers in left field.
The field has lawn areas beyond the seats on both the first and third base lines,
where spectators can stand or sit on blankets.

Hamilton County Sports Complex Study Chapter 3 Page 13
The figure below is the seating chart for Alexian Field:
Figure 3-3
The facility has twenty “skybox” luxury suites, which seat up to thirty people. The
cost for the full season for a skybox is $18,000. Along the first base side, on the
skybox level, is the Schaumburg Club, with a restaurant with full bar, a buffet, and a
sandwich menu. The club also markets for private events.
The figure below is a picture of the ballpark.

Hamilton County Sports Complex Study Chapter 3 Page 14
Figure 3-4
The ticket prices for the Schaumburg Flyers games are set forth in the table below:
Table 3-11
Schaumburg Flyers Home Ticket Prices
Ticket Type Price
Season TicketsReserved Club $450Reserved Seat $399
Single Game TicketsReserved Club $11Reserved $10Lawn/Bleacher $5
Source: Schaumburg Flyers
The Flyers try to keep the tickets at a reasonable cost to attract families with
children and other spectators to attend on a regular basis.
Financing – The ballpark is the result of the Village of Schaumburg’s village council
leadership and its drive to create the facility in an attempt to create a more
enjoyable village and draw tourists to the area. The Village of Schaumburg entered
into an agreement with the Schaumburg Park District (in Illinois the local park
district is a separate governmental entity with taxing authority) to issue general
obligation bonds to pay for the development of the ballpark. The bonds were to be
paid in full within fifteen years after issue, so that in 2013 the bonds will be retired.
The Village of Schaumburg issued the bonds and entered into an intergovernmental
agreement with the park district for reimbursement each year of fifty percent of the
debt payment. The full cost of development was approximately $18 million.
The ongoing operations of the ballpark are the responsibility of both the Village of
Schaumburg and the Schaumburg Flyers. The baseball team pays rent and has other
day-to-day responsibilities for upkeep and maintenance of the facility, while all

Hamilton County Sports Complex Study Chapter 3 Page 15
structural matters are the responsibility of the Village of Schaumburg. The baseball
team receives ticket and concessions revenues as well as merchandising income. The
village does not charge for parking in any lots, although the team does offer
premium parking in a small lot next to the stadium for a fee.
The table below states the actual revenue, consisting of rent and other fees from the
Schaumburg Flyers, as well as the expenses of Alexian Field for the fiscal years
2003-04 through 2007-08, and the budgeted amounts for the next three years.
Table 3-12
Village of SchaumburgAlexian Field Operations Revenue and Expenses
Year Revenue Expenses Net
Actual 2003-04 $394,951 $66,792 $328,159Actual 2004-05 $313,652 $76,755 $236,897Actual 2005-06 $430,403 $67,193 $363,210Actual 2006-07 $406,177 $54,031 $352,1462007-08
Budget $429,115 $228,774 $200,341Projected Actual $425,794 $234,837 $190,957
Budget 2008-09 $404,436 $264,379 $140,057Budget 2009-10 $395,656 $223,535 $172,121Budget 2010-11 $368,520 $154,882 $213,638
Source: Village of Schaumburg
The total operating revenue includes the rent and other fees that the Flyers pay to
the village as well as the annual payment (which is undisclosed) that Alexian makes
for the naming rights of the facility. The Alexian naming rights agreement was for $2
million over ten years, so that it is assumed that the annual payment is $200,000.
Annual revenue is greater than the operational expenses that the village incurs. The
Flyers owed additional amounts from years prior to the 2005-06 fiscal year, repaid in
2005-06 through 2009-10, which shows in the increased revenue for those years.
The expenses for the years 2003-04 through 2006-07 were lower because few
capital expenses existed for the first few years of the ballpark. The increase in the
2007-08 fiscal year to more than $200,000 per year shows the capital improvements
and general maintenance that the village has or will expend on the facility.
The expenses do not include the debt repayment on the general obligation municipal
bonds. The net income from Alexian Field would not cover the annual debt on the
bonds that the village and the park district owe. The village anticipates that after the
bond debt is retired the revenue received from the ballpark will exceed expenses.
Other Northern League Teams
Although each of the other Northern League teams have ballparks that were
developed in the past fifteen years, most would not compare to the proposed facility
in Hamilton County.
Hamilton County Sports Complex Study Chapter 3 Page 16
! Winnipeg Goldeneyes, CanWest Global Park – Winnipeg is its own small
urban area and is not close to any major urban population centers. The facility
was developed with major assistance form the province and federal governments,
which will not be an option for Hamilton County stakeholders.
! Fargo-Moorhead Redhawks, Newman Outdoor Field – Fargo is a small
urban community without any major population areas. North Dakota State
University owns and operates the ballpark, which is home not only to the
Redhawks but also to the North Dakota State baseball team.
! Gary SouthShore RailCats, U.S. Steel Yard – Gary, Indiana, is within the
Chicago MSA and therefore is comparable to Hamilton County as a suburb of a
major urban area. However, the funding for the ballpark is not comparable. The
state-of-the-art U. S. Steel Yard cost $45 million, funded by the City of Gary from
casino tax revenues and naming rights of the facility. The cost of the facility and
the funding source makes that ballpark not comparable to the proposed facility in
Hamilton County.
! Joliet Jackhammers, Silver Cross Field – Joliet, Illinois, is a suburb of
Chicago. The funding for the ballpark, at a cost of $27 million, paid from the
Gaming Fund, a capital account established from the fees that Joliet receives
from riverboat casinos. The city drew the development costs from the fund over a
four-year period. Operations are also funded through the ballpark rental, set at
$225,000 per year, from the team, and from the yearly naming rights fee of
$150,000. The team presently is facing financial difficulties, and therefore the
city of Joliet is considering a reduction or temporary suspension of the lease fees
to keep the team in a strong financial position.
Frontier League
The Frontier League is an independent minor league baseball league based in the
Midwest. The league has been in existence since 1993 and currently has twelve
teams that play at the A minor league level. The goals of the Frontier League are to
allow players who have not signed with a major league or affiliated minor league
team, and to bring professional baseball to areas of the country that do not have the
opportunity to have baseball through affiliated minor league teams. The league has
rules that prohibit more than half of the team roster being players with experience,
and only three players can have more than three years of professional baseball
experience. At least half of the team must be rookies.
The following table sets out the current teams that play in the league.

Hamilton County Sports Complex Study Chapter 3 Page 17
Table 3-13
Frontier League Baseball Clubs and Ballparks
Team City Ballpark
Date Ballpark Opened Owner
Seating Capacity
East Division
Florence Freedom Florence, Kentucky Champion Window Field 2004 City of Florence 4,500
Kalamazoo Kings Kalamazoo, Michigan Homer Stryker Field 1963 City of Kalamazoo 4,000
Lake Erie Crushers Avon, Ohio Avon Ballpark 2009 Avon Ballpark LLC 5,000
Midwest Sliders of Ypsilanti Ypsilanti, Michigan Oestrike Stadium 1971 Eastern Michigan
University 1,200
Traverse City Beach Bums Traverse City, Michigan Wuerfel Park 2006 Wuerfel Sports
Development LLC 4,660
Washington Wild Things Washington, Pennsylvania CONSOL Energy Park 2002 Ballpark
Scholarships, Inc. 5,000
West Division
Evansville Otters Evansville, Indiana Bosse Field 1915
Evansville Vanderburgh School Corp.
5,181
Gateway Grizzlies Sauget, Illinois GCS Ballpark 2002 GCS Federal
Credit Union 6,000
River City Rascals O'Fallon, Missouri T.R. Hughes Ballpark 1999 City of O'Fallon 3,491
Rockford RiverHawks Loves Park, Illinois Road Ranger Stadium 2006 Rockford
Riverhawks 4,246
Southern Illinois Miners Marion, Illinois Rent One Park 2007 Jayne Simmons 7,000
Windy City ThunderBolts Crestwood, Illinois Standard Bank Stadium 1999 City of Crestwood 3,200
Source: Frontier League, Individual teams, HSP
The Frontier League consists of teams in the Midwest, with one team from Indiana
and four from Illinois. The twelve teams divide into two divisions, with the East
Division consisting of teams in Kentucky, Ohio, Pennsylvania and Michigan, and the
West Division having teams from Indiana, Illinois and Missouri. The league intends to
expand, with new franchises anticipated in Champaign, Illinois in 2009, and in
Normal, Illinois, and Woodstock, Illinois in 2010. Each of these new franchises
anticipates partnering with a public entity to build a new ballpark.
The table below sets out the 2008 attendance for the teams of the Frontier League.

Hamilton County Sports Complex Study Chapter 3 Page 18
Table 3-14
Frontier League 2008 Attendance
Team TotalHome
Games AverageSeating Capacity
Percent of Capacity
Southern Illinois Miners 218,191 51 4,278 7,000 61%Gateway Grizzlies 190,892 50 3,818 6,000 64%Traverse City Beach Bums 193,724 54 3,587 4,660 77%Washington Wild Things 154,444 52 2,970 5,000 59%Rockford RiverHawks 138,234 50 2,765 4,246 65%Evansville Otters 119,645 50 2,393 5,181 46%River City Rascals 106,114 50 2,122 3,491 61%Florence Freedom 106,707 54 1,976 4,500 44%Windy City ThunderBolts 90,616 51 1,777 3,200 56%Kalamazoo Kings 83,157 51 1,631 4,000 41%Chillicothe Paints* 67,253 52 1,293 3,000 43%
Average 133,543 51 2,601 4,571 56%
*Chillicothe Paints left Frontier League after 2008 seasonSource: Frontier League, HSP
As shown in the table above, the Southern Illinois Miners had the highest average
attendance, at 4,278 per game, but that team also played in the largest stadium.
The team that had the highest percent of capacity was the Traverse City Beach
Bums, at 77 percent. The average attendance was 2,601, and the average percent of
capacity was 56 percent, with five teams averaging over sixty percent of capacity.
The Frontier League has lower franchise fees than most leagues and has salary caps
for players. A major emphasis for the league is to have teams that are viable and will
be part of a community for many years. The teams and ballpark owners share those
concerns so that the ballpark agreements reflect financial sustainability of the team
as well as the needs of the facility.
Most of the existing and new franchises are located in smaller cities and towns that
are not part of larger urban communities. Evansville, Indiana, located two hundred
miles southwest of Hamilton County, and Loves Park-Rockford, Illinois, are examples
of smaller cities that have Frontier League teams. The three teams described below
are located in suburban cities that are part of larger urban cities, and those would
compare favorably to the proposed ballpark in Hamilton County.
T. R. Hughes Ballpark – O’Fallon, Missouri
T. R. Hughes Ballpark (“Hughes”), in O’Fallon, Missouri, is the home field for the
River City Rascals of the Frontier League. The ballpark opened in 1999 and has a
capacity of 3,491 in fixed seats, with grass lawns that would seat an additional
1,700. The specifics of the facility are as follows:

Hamilton County Sports Complex Study Chapter 3 Page 19
Table 3-15
T. R. Hughes BallparkKey Data Points
Location O'Fallon, MissouriTeam River City RascalsOwnership City of O'FallonYear Complete 1999Seating Capacity 3,491Cost of Construction $3.5 millionFunding
Municipal $5 million (construction and infrastructure)
Luxury Suites NoneAnnual Fee for Luxury Suites
NA
2008 Average Attendance 2,211
Source: River City Rascals, HSP
Location – Hughes is located in O’Fallon, Missouri, a suburb within the St. Louis,
Missouri, metropolitan area. The population of the St. Louis MSA in 2007 was
estimated to be 2.8 million. O’Fallon, Missouri, located in Saint Charles County, had
an estimated population for 2007 of 75,000. In 2006 Money Magazine named
O’Fallon one of the “Best 100 Places to Live.”
The Saint Louis area is the home of a Major League Baseball team, the St. Louis
Cardinals, which has several minor league clubs affiliated with the program. The
closest minor league club affiliated with the Cardinals is the Springfield Cardinals,
based in Springfield, Missouri, and playing in the AA Texas League. Another minor
league team in the St. Louis MSA is the Gateway Grizzlies, of Sauget, Illinois, also in
the Frontier League.
The area also is home to the St. Louis Rams NFL franchise, which plays in the
Edward Jones Dome, and the St. Louis Blues NHL hockey team, which plays at the
Scotttrade Center. Both are based in St. Louis, Missouri. The St. Louis area is also
home to several other professional teams, including the RiverCity Rage indoor
football team, based in St. Charles, Missouri, and the minor league basketball St.
Louis Stunners.
Home Team - The River City Rascals have been the home team of Hughes Ballpark
since it opened in June 1999. The team began in Zanesville, Ohio, as the Greys, in
1993, but was inactive for the 1997 and 1998 seasons before moving to O’Fallon and
becoming the River City Rascals. The team has had one division title since that time
but no league championship. PS and J Professional Baseball Club, LLC, headed by
Steve Malliet, purchased the team in 2006.
The table below states the attendance for the River City Rascals games from 1999
through 2008.
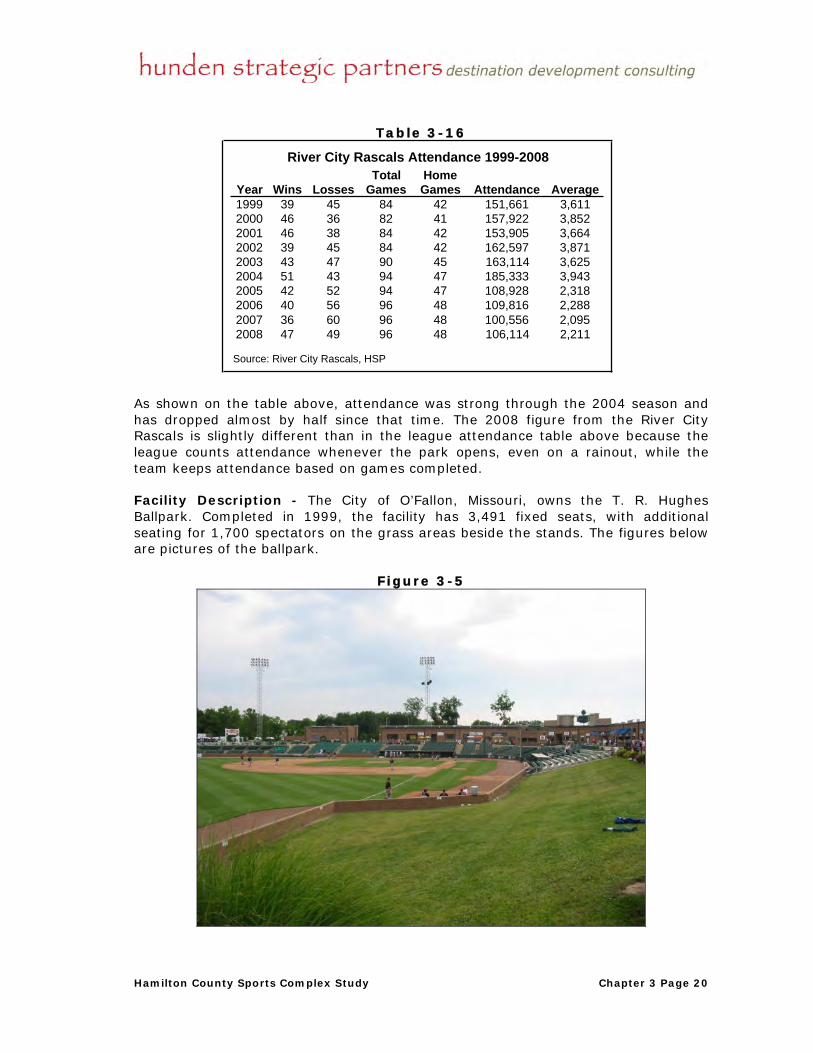
Hamilton County Sports Complex Study Chapter 3 Page 20
Table 3-16
River City Rascals Attendance 1999-2008
Year Wins LossesTotal
GamesHome Games Attendance Average
1999 39 45 84 42 151,661 3,6112000 46 36 82 41 157,922 3,8522001 46 38 84 42 153,905 3,6642002 39 45 84 42 162,597 3,8712003 43 47 90 45 163,114 3,6252004 51 43 94 47 185,333 3,9432005 42 52 94 47 108,928 2,3182006 40 56 96 48 109,816 2,2882007 36 60 96 48 100,556 2,0952008 47 49 96 48 106,114 2,211
Source: River City Rascals, HSP
As shown on the table above, attendance was strong through the 2004 season and
has dropped almost by half since that time. The 2008 figure from the River City
Rascals is slightly different than in the league attendance table above because the
league counts attendance whenever the park opens, even on a rainout, while the
team keeps attendance based on games completed.
Facility Description - The City of O’Fallon, Missouri, owns the T. R. Hughes
Ballpark. Completed in 1999, the facility has 3,491 fixed seats, with additional
seating for 1,700 spectators on the grass areas beside the stands. The figures below
are pictures of the ballpark.
Figure 3-5
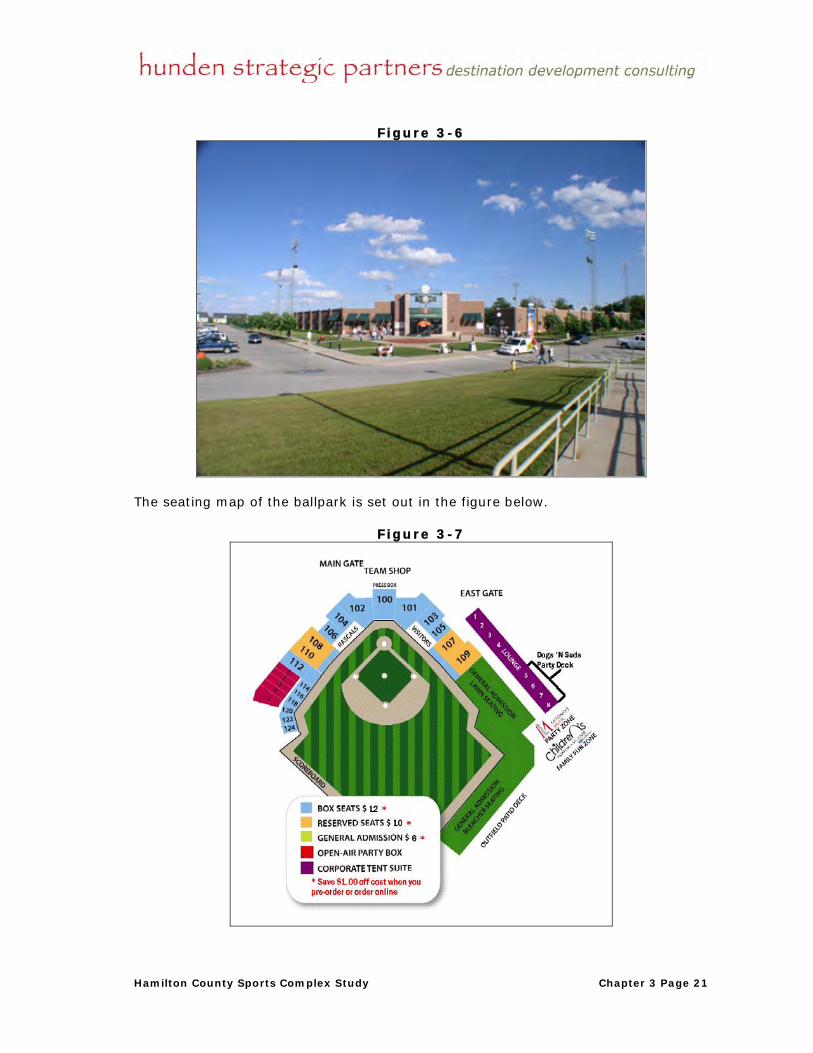
Hamilton County Sports Complex Study Chapter 3 Page 21
Figure 3-6
The seating map of the ballpark is set out in the figure below.
Figure 3-7

Hamilton County Sports Complex Study Chapter 3 Page 22
As shown in the figure above, tickets range from $12 to $6 per person. The facility
does not have luxury suites but does offer corporate tent suites off of the third base
line. The each tent suite costs $240 per game for 20 tickets and use of the suite. The
ballpark also offers open-air party boxes for ten people ($110) or twenty people
($220). Also offered is the “Dogs N Suds Party Deck” along the 3rd base line, at a
cost of $500 for twenty tickets.
Financing - The original cost of Hughes Ballpark was $3.5 million, and the City of
O’Fallon paid for the cost of construction plus cost of infrastructure, a total of $5
million. The city did not obtain long-term financing for this specific project, instead
paying for the infrastructure and development costs from the city budget.
T. R. Hughes, a home building company located in the St. Louis-O’Fallon area,
bought the naming rights to the stadium for ten years, before the opening of the
ballpark in 1999. The amount paid was not disclosed.
The River City Rascals, owned by Missouri River Baseball, LLC, leases Hughes
Ballpark through a lease agreement dated January 15, 1998, from the City of
O’Fallon. The lease has been amended several times and currently is in force through
2021. The amount of annual rent has increased from a base rate of $150,000 per
year in 1998 to the current amount of $150,000 for 2008, increasing to $175,000 in
2009, with further increases included for future years.
GCS Stadium, Gateway Grizzlies, Sauget, Illinois
GCS Ballpark (“GCS”), in Sauget, Illinois, is the home field for the Gateway Grizzlies
of the Frontier League. The specifics of the facility are as follows:
Table 3-17
GCS BallparkKey Data Points
Location Sauget, IllinoisTeam Gateway GrizzliesOwnership City of Sauget, IllinoisYear Complete 2002Seating Capacity 6,000Cost of Construction $6.5 millionFunding
Municipal Debt $5 millionMunicipal Funding $1.5 million
Luxury Suites 12Fee for Luxury Suites $300 per game2008 Average Attendance 3,818
Source: Gateway Grizzlies, Village of Sauget, HSP
Location – GCS Ballpark is located in Sauget, Illinois, a suburb within the St. Louis,
Missouri, metropolitan area. The population of the St. Louis MSA in 2007 was
estimated to be 2.8 million. Sauget, located on the Mississippi River in Saint Clair
County, is a small village next to East St. Louis, Illinois, and across the river from St.
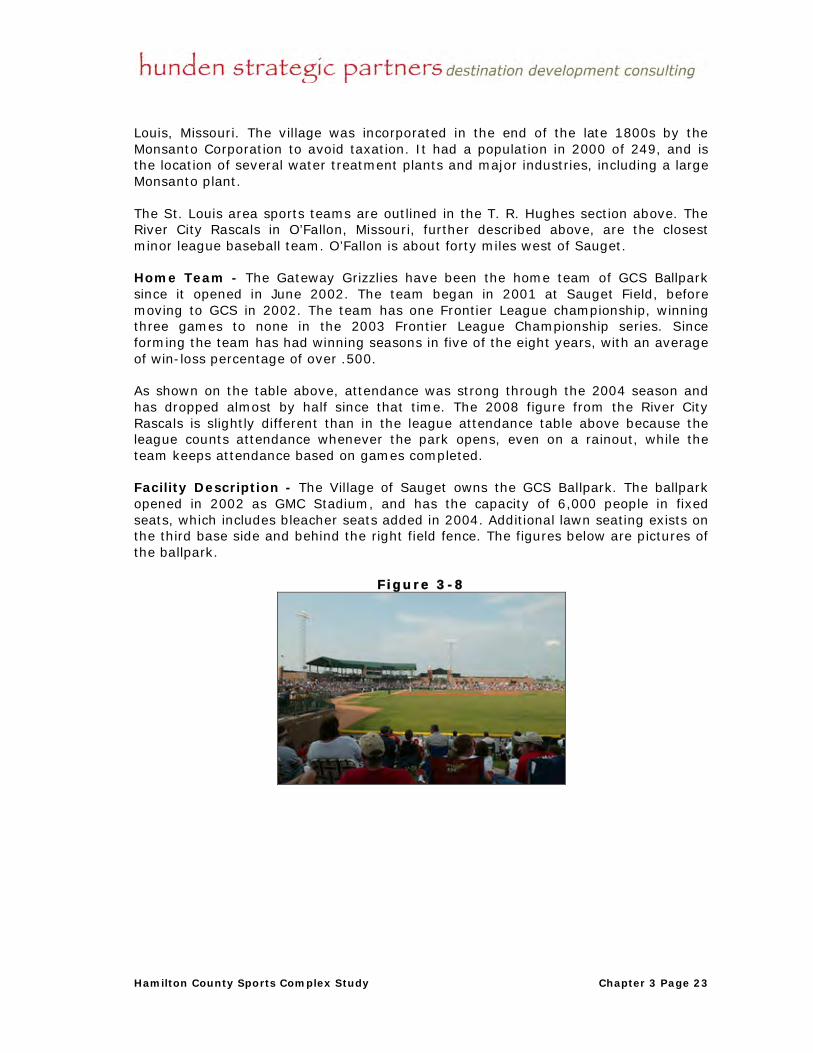
Hamilton County Sports Complex Study Chapter 3 Page 23
Louis, Missouri. The village was incorporated in the end of the late 1800s by the
Monsanto Corporation to avoid taxation. It had a population in 2000 of 249, and is
the location of several water treatment plants and major industries, including a large
Monsanto plant.
The St. Louis area sports teams are outlined in the T. R. Hughes section above. The
River City Rascals in O’Fallon, Missouri, further described above, are the closest
minor league baseball team. O’Fallon is about forty miles west of Sauget.
Home Team - The Gateway Grizzlies have been the home team of GCS Ballpark
since it opened in June 2002. The team began in 2001 at Sauget Field, before
moving to GCS in 2002. The team has one Frontier League championship, winning
three games to none in the 2003 Frontier League Championship series. Since
forming the team has had winning seasons in five of the eight years, with an average
of win-loss percentage of over .500.
As shown on the table above, attendance was strong through the 2004 season and
has dropped almost by half since that time. The 2008 figure from the River City
Rascals is slightly different than in the league attendance table above because the
league counts attendance whenever the park opens, even on a rainout, while the
team keeps attendance based on games completed.
Facility Description - The Village of Sauget owns the GCS Ballpark. The ballpark
opened in 2002 as GMC Stadium, and has the capacity of 6,000 people in fixed
seats, which includes bleacher seats added in 2004. Additional lawn seating exists on
the third base side and behind the right field fence. The figures below are pictures of
the ballpark.
Figure 3-8

Hamilton County Sports Complex Study Chapter 3 Page 24
Figure 3-9
The seating map of the ballpark is set out in the figure below.
Figure 3-10

Hamilton County Sports Complex Study Chapter 3 Page 25
As shown in the figure above, tickets range from $9 to $5 per person. Full season
tickets are offered for $384 per seat, and half-season tickets cost $192 per seat. The
facility has twelve party suites behind home plate, on the same level as the general
seating. Each suite costs $300 per game for 20 tickets and use of the suite. The
ballpark also offers open-air suites for $120. The park also offers hot tubs for rent at
the right field corner.
Financing - The original cost of GCS Ballpark was $6.5 million, which was
completely funded by the Village of Sauget, Illinois. The village determined that it
would be difficult to obtain municipal bond funding due to several factors, including
the reality that much of the debt service was to come from sales taxes and other
taxes generated by the ballpark. The uncertainty of the source of debt repayment
caused interest rates to be higher due to ratings of bond underwriters. Therefore the
village found conventional financing for $5 million and funded the rest of the
development through tax revenue. The total debt servicing cost is $500,000
annually.
GMC was paying $100,000 per year for the naming rights to the ballpark. The facility
was renamed GCS Ballpark prior to the 2006 season, for GCS Federal Credit Union’s
sponsorship. The amount paid was not disclosed, but the amount appears to be
approximately the same, $100,000 per year. The agreement with GCS includes
advertising at the ballpark (a sign in the outfield, other advertisement opportunities)
and therefore the Grizzlies organization receives most of the annual sponsorship fee.
The Village of Sauget receives approximately $20,000 per year from the sponsorship.
The Gateway Grizzlies organization leases GCS Ballpark for $200,000 per year. The
village also receives approximately $120,000 per year in food and beverage tax from
the TIF district that the village established around the ballpark, as well as the
additional sales tax. In addition, the new ballpark has encouraged development of a
new office complex and other small buildings. The additional property taxes and
sales taxes received from these new developments also go toward payment of the
ballpark debt. The other income that the village receives is from outside events held
at the ballpark, everything from high school baseball to a McCain-Palin rally in the
fall of 2008. The village receives most of the revenue from the outside events. The
total of all of those revenues almost reaches the annual debt service on the facility.
The Village of Sauget, Illinois, has a unique situation because it consists almost
entirely of industry and businesses, with few residents, so that the tax revenue is
strong and expenses, beyond essential services for industry, are few. However, the
goal of Sauget in bringing the Gateway Grizzlies to the village is similar to the goals
in Hamilton County. The village wanted to bring a sports and entertainment venue to
the village for the tangible purposes of attracting sales taxes, bringing new business
and more mixed use developments to the village. Furthermore, intangible goals
included redevelopment of a blighted industrial area, encouraging visitors and
tourists to the area, and making the village more interesting for its residents.
Standard Bank Stadium, Windy City ThunderBolts, Crestwood, Illinois
Standard Bank Stadium, in Crestwood, Illinois, is the home field for the Windy City
ThunderBolts of the Frontier League. The specifics of the facility are as follows:

Hamilton County Sports Complex Study Chapter 3 Page 26
Table 3-18
Standard Bank StadiumKey Data Points
Location Crestwood, IllinoisTeam Windy City
ThunderBoltsOwnership Village of CrestwoodYear Complete 1999Seating Capacity 3,200Cost of Construction $8 millionFunding
State Grant $1 millionMunicipal Funding $7 million
Luxury Suites 2Fee for Luxury Suites $600 per game2008 Average Attendance 2,970
Source: Windy City Tbolts, Frontier League, HSP
Location – Standard Bank Stadium is located in Crestwood, Illinois, a suburb of
Chicago, Illinois. The population of the Chicago MSA in 2007 was estimated to be 9.5
million. The Village of Crestwood is located in Cook County approximately twenty
miles from downtown Chicago. It had a population in 2000 of 11,251.
The Chicago area sports teams are outlined in the Alexian Field section above. The
Joliet Jackhammers, in Joliet, Illinois, and the Gary Southshore RailCats, in Gary,
Indiana, both playing in the Northern League and further described above, are the
closest minor league baseball teams.
Home Team – The Windy City ThunderBolts, formerly known as the Cook County
Cheetahs, joined the Frontier League and began using the Standard Bank Stadium
since it opened in 1999. The team recently has seen success, winning the Frontier
League championship in 2007 and in 2008, which are also the only two winning
seasons for the team.
The table below states the attendance for the team from 1999 through 2008.

Hamilton County Sports Complex Study Chapter 3 Page 27
Table 3-19
Windy City ThunderBolts Attendance 1999-2008
Year Won Lost TotalHome
Games AttendanceAverage
Attendance
1999 41 43 84 42 75,248 1,792 2000 38 46 84 42 76,445 1,820 2001 28 53 81 41 65,627 1,601 2002 40 44 84 42 66,214 1,577 2003 42 48 90 45 60,481 1,344 2004 37 57 94 47 67,397 1,434 2005 39 57 96 48 78,011 1,625 2006 41 54 95 48 70,907 1,477 2007 68 28 96 51 81,000 1,5882008 60 36 96 51 90,616 1,777
Source: Frontier League, HSP
Attendance was over 75,000 annually for the first two years of the team at the new
facility. Gradually annual attendance began to decline to a low of approximately
60,000. In 2004 the team restructured with new ownership, changed its name to the
Windy City ThunderBolts, and renovated parts of the ballpark. Since that time the
attendance has risen to a high in 2008 of more than 90,000 spectators.
Facility Description - The Village of Crestwood owns the Standard Bank Stadium.
The ballpark opened in 1999 as Hawkinson Ford Field, and has the capacity of 3,200
people in fixed seats. The figures below are pictures of the ballpark.
Figure 3-11

Hamilton County Sports Complex Study Chapter 3 Page 28
Figure 3-12
The seating configuration is unusual since only the third base side of the facility has
an upper deck. The first base side has only seven rows of seats, and behind the first
base seating are the concession stands and party deck. The seating map of the
ballpark is set out in the figure below.
Figure 3-13
As shown in the figure above, tickets range from $8 to $10 per person. Full season
tickets are offered for $375 per seat. The facility has two luxury suites behind home
plate, on the upper level. Each suite costs $600 per game for 25 tickets and use of

Hamilton County Sports Complex Study Chapter 3 Page 29
the suite, as well as a catered menu. The ballpark also offers a party suite for $300
for 10 tickets.
Financing - The original cost of the Crestwood facility was $8 million. The Village of
Crestwood received a $1 million discretionary fund grant from the State of Illinois
and funded the rest from the village budget.
Hawkinson Ford, now known as Hawk Ford, a local automobile dealership located in
Oaklawn, Illinois, had entered into an agreement to pay $350,000 over ten years for
the naming rights to the ballpark. That agreement ended early and the facility was
renamed Standard Bank Stadium during the 2007 season, for Standard Bank’s
sponsorship. The amount paid was not disclosed.
The Windy City ThunderBolts organization leases Standard Bank Stadium. The
original lease with the predecessor team, the Crestwood Cheetahs, was for $350,000
per year. The yearly lease presently has not been disclosed. The team receives the
concessions and ticket sales and also charges a small amount for parking. The
maintenance agreement is similar to others between teams and municipalities, with
the team responsible for routine maintenance and the village responsible for capital
improvements.
Summary
Minor league ballparks and teams have increased in popularity in the past decade,
and new stadiums and ballparks have been developed in small and medium markets.
Several minor league teams have had success in suburbs of large metropolitan
areas. The Hamilton County area could benefit from a minor league ballpark if the
team and ballpark are successful and financially viable.
One initial consideration is whether a community would try to field a team that is
affiliated with Major League Baseball. Affiliated teams bring many positives, including
financial support from the major league team through player and manager salaries.
However, because it is located within the greater Indianapolis area, an MLB-affiliated
team located in Hamilton County would have to receive a waiver from the local
Indianapolis team, the Indianapolis Indians. Another consideration is that most of
the newer ballparks constructed for affiliated teams are larger and more costly than
Hamilton County may be able to support.
One affiliated minor league exists in the Indiana-Illinois-Michigan-Iowa region, the
Class A Midwest League, with fourteen teams. The closest teams are in Fort Wayne,
Indiana and South Bend, Indiana. The average cost of MLB-affiliated minor league
ballparks built within the past ten years is $23 million, a significant outlay.
Minor leagues that do not have affiliation with the major leagues are identified as
“independent leagues.” The teams in these leagues have no connection with a major
league team and therefore have to bear the entire cost of the team, including
players’ and managers’ salaries. Because the teams are not part of the MLB system,
no restrictions exist as to location of teams.

Hamilton County Sports Complex Study Chapter 3 Page 30
Hamilton County lies within the geographic area served by two independent leagues.
The Northern League has six teams, three of which are in the Chicago metropolitan
area. The average seating capacity of the ballparks is approximately 6,000, and all of
the ballparks have opened since 1996. The range of cost of development is $5.5
million for the ballpark in Fargo, North Dakota, to $45 million for the Gary, Indiana,
ballpark. The other independent league in the upper Midwest region is the Frontier
League, with twelve teams, including one in Evansville, Indiana.
The ballparks that were most comparable to the ballpark contemplated for Hamilton
County had teams that were in the Frontier League or the Northern League. These
ballparks are in suburbs of major metropolitan areas, built within the last ten years.
Each ballpark has a “hard seat” capacity of between 3,200 and 7,000, with an
average capacity of 4,780. The development costs ranged of $5 million to $18
million, with an average of $10.1 million.
The following table, based on the averages stated in Table 3-1above, creates a rough
calculation of the cost per seat for a ballpark in 2009.
Table 3-20
Comparable Ballparks Average Cost of Construction
Category
Cost of Construction (millions) $10.1Seating Capacity 4,780Cost per Seat $2,113Opening Year 2000Construction Inflation Rate Per Year 5%Years of Inflation Rate 9Cost per Seat (2009 Costs) $3,278Seating Capacity of Proposed Ballpark 4,500Estimate Cost of Proposed Ballpark (millions) $14.8
Source: Various Ballparks, HSP
Average
As shown in the above table, the average cost per seat was approximately $2,100
when the ballparks were constructed. Given a five percent per year inflation rate for
construction costs, from the average opening date of 2000, the average per seat
cost would be approximately $3,300 per seat. Assuming a ballpark with fixed seating
of 4,500, the approximate development costs of the facility would be $14.8 million.
Financing is a critical factor and the public and private sectors have often partnered
to develop a financing package that works for all parties. The average public
contribution has been nearly 80 percent for such facilities. This shows that while the
teams may be feasible, the stadiums are not paid for by team-generated revenue
alone and have been primarily underwritten by the public as an economic
development and quality of life investment. Carrying such logic forward, the public
sector could be sought to provide up to $12 million for a ballpark of 4,500 seats,
based on a $14.8 million cost.

CITY OF WESTFIELD (Hamilton County, Indiana)
The Family Sports Capital of the United States
Feasibility Study
September 12, 2008
F i n a n c i a l
S o l u t i o n s
G r o u p,
I n c .
3639 North Raceway Road Suite 400
Indianapolis, IN 46234 (317) 347-0211
Fax: (317) 347-0259

CITY OF WESTFIELD (Hamilton County, Indiana)
The Family Sports Capital of the United States
Feasibility Study
T A B L E O F C O N T E N T S
EXECUTIVE SUMMARY ………………………………………………………………1 INTRODUCTION..……………………………………………………………………...4 POTENTIAL FACILITIES………………………………………………………….…...5
Multi-Use Facility…….………………………….….…………………...…….. 5 Minor League Baseball………………………….….…………………...……...5 Soccer…………………………..……………...…………………….…………....6 Lacrosse…………..…………………...…………………………….……………6 Youth Baseball and Other Sports Facilities....……….………….…….………6 Tennis Facility...………..………………………………………………………..7 YMCA…………………………………………………………………………….7
HAMILTON COUNTY MARKET AREA……………………………….....…….……7 COMPARABLE FACILITIES …………………………………………………………..8 BUILDING PROGRAM AND COST ………………………………………………….9 ESTIMATED FINANCIAL OPERATIONS…………….……………………….……10 ADDITIONAL RETAIL & COMMERCIAL DEVELOPMENT……………….……10 ESTIMATED ECONOMIC AND FISCAL IMPACT………….……………….…….11 FUNDING SOURCES…………………………………………….……………….……12 ACTION STEPS…………………………………………………………………………12 EXHIBIT A – Estimated Project Costs ..………………………………………………13 EXHIBIT B – Minor League Baseball/Estimated Annual Revenue and Expense..14 EXHIBIT C – Estimated Other Annual Revenue…………………………………….15

CITY OF WESTFIELD (Hamilton County, Indiana) The Family Sports Capital of the United States Feasibility Study
T A B L E O F C O N T E N T S (Continued)
EXHIBIT D – Estimated Tax Increment Financing Revenue..………………………….16 EXHIBIT E – Comparable Minor League Stadiums and Attendance…………………17 EXHIBIT F – Example of Naming Right Fees……………………………………………18 EXHIBIT G –Debt Service Schedule Example.…………………………………………..19 EXHIBIT H –Cash Flow – Pessimistic Example…………………………………………20 EXHIBIT I – Cash Flow – Optimistic Example…………………………………………..21 EXHIBIT J – Park District Bond Issue Example (Payable from Property Taxes) Estimated Sources and Uses of Funds and Tax Impact………………….22 EXHIBIT K – Economic Improvement District Revenue Example……………………23

-1-
EXECUTIVE SUMMARY The Family Sports Capital of the U.S. – Westfield, Indiana
The City of Westfield and Hamilton County are on the verge of being able to become the family sports capital of the United States. With the help of a true public/private partnership, this can evolve (over the next ten years) into the premier location for family sports. Forbes magazine recently named Hamilton County the best place to raise a family in the entire United States. This initiative will help the County maintain this ranking and continue to improve the quality of life in the area. What does a family sports destination require to move forward? The effort is already well under way. Over the summer, Financial Solutions Group, Inc. met with key stakeholders around Hamilton County and Westfield to gauge and measure the political and economic strengths of these important groups. Who makes up this group of stakeholders? The number of stakeholders has grown as this project continues to gain momentum. The potential, at this point, is so large that, quite simply, there is not enough land. This is exactly why a center like this has not been able to be put together. Thanks to a local developer, the dream could come true with assistance from Hamilton County and the City of Westfield.
Why would something like this be so important to the City of Westfield and the surrounding area? As a City develops during its lifetime, it takes on a character of its own or, quite frankly, has no character at all. The City of Westfield is known as a great place for families to live and, in fact, the area has not experienced the slow down in housing nearly as much as other areas. A lot of this positive tone is a direct result of the fine schools in the area and the quality of life enjoyed by Westfield residents.
What determines quality of life? It is well known that the area attracts high
income families and individuals because of the amenities and the positive living experience. The City of Westfield is now on the cusp of being able to build on that position, just like other cities are on such things as the Arts.
How does the City of Westfield build on this position? The City of Westfield
should be prepared to begin the process of assisting the developer in continuing to plan the proper use of the land now owned and assist in the acquisition of additional land. This process is never easy, and requires upfront commitment on the City’s part and the County’s part.
What funding initiative does the County and the City need to undertake
immediately to get this done? The City will need to bring all stakeholders together and start the process of developing written agreements, in order to start the process of writing and submitting special legislation. This legislation would cover the development of a Sports District for the City and a portion of Hamilton County. This district would allow the City to capture all possible incremental new tax revenue as a

-2-
result of the new facilities. This legislation would be similar in nature to the Sports District in downtown Indianapolis and what has been used in other parts of the State.
Where do the City and County want to start and stop? The following will answer that question:
1. A great deal of opportunity exists for the City to drive this project in a manner to invest the power of a municipal entity into the best assets in the community - the families;
2. The City of Westfield could create a spot on the GPS system in the country as the Family Sports Capital (Check the internet, one does not currently exist);
3. The City has the opportunity, through a public/private partnership, to begin to
create this now;
4. The City and the County can have the opportunity to create a new sports development district and have the legislators talk about something other than Circuit Breaker (and talk about the most critical element - “our kids”); and
5. The demand for housing can be enhanced and maintained with this new theme.
Scope of the Project Based on our meetings with potential participants in the project, the following items could be included in the project:
• Minor League Baseball Stadium with 4,000 Seats, Suites and Concession Stands • High School Football Stadium • Additional Youth Baseball and Softball Fields • Tennis Courts • Youth Soccer Fields • Lacrosse Fields • Professional Soccer Field • YMCA • Shared Parking for All Facilities • Retail and Commercial Development near the Proposed Complex
Depending on the design of the facility, it may be possible to create multi-
purpose fields that could be used for multiple sports. The goal would be to create a year round championship caliber sports destination.

-3-
Project Funding The proposed project will require a large public investment in order to be successful. We have analyzed the potential revenue that could be available to support this type of project. We have identified the following potential sources of revenue:
• Net Income from the Minor League Baseball Portion of the Project • Revenue from the Formation of a Professional Sports District • Tax Increment Revenue (TIF) from the Additional Retail and Commercial
Development near the Sports Complex • Ticket Taxes • Food and Beverage Tax • Innkeeper’s Tax • Naming Rights and Sponsorships • Private Donations • Grants for Green Space and Physical Fitness Projects • Park District Bond Issue Supported by Property Taxes • Economic Improvement District Revenue • Equity Contributions from Baseball Team Owner and Other Participants • Sports Medicine Referral Revenue
This revenue is detailed in our report and we have concluded that the facility could be completed and financed with a combination of the revenue listed.

-4-
INTRODUCTION The City of Westfield and Hamilton County asked Financial Solutions Group, Inc. to determine the feasibility of this type of development and comment on the overall interest and economic impact of this type of development. The interest in a development that requires 200 acres of land and includes multiple sports disciplines surrounded by commercial and residential developments is huge, in our opinion. Our opinion is limited to the proposed sports complex, including the commercial development. We have not attempted to quantify the potential residential component. In the process of the development of this report, we contacted numerous sports organizations, such as Minor League Baseball, high school athletics, local youth baseball and softball leagues, local youth soccer associations, a professional soccer team, professional tennis associations and numerous other sports teams. Quite frankly, each organization has unique wants and needs which (in some cases) can be combined into one facility and others that would need separate facilities. The real cost savings would be achieved through shared parking and a multi-use facility with possible shared locker rooms. At this time, it also appears to be the “Perfect Storm” - different sports groups are either outgrowing their facilities, possibly losing the current facilities, or looking for bigger and better places to play. Location
The location of this type of facility is very important to the overall success of the program. As of the date of this report, a site has been determined (on a confidential basis), but due to the increased demand for land and facilities, we have chosen not to discuss (in detail) the possible area, but rather point out the potential plan in general terms. Keep in mind that, in order for this program to work, the details of the plan must be worked out with stakeholders, including identifying the best site available. Funding This type of unique facility will require several creative funding vehicles. A professional sports district, created by the City of Westfield with the assistance of Hamilton County, would be an excellent way to start; also, the creation of a Tax Increment Allocation Area could be a source of revenue for funding this type of facility. The difficulty here, and in each of these projects, is the fact of “which comes first - the chicken or the egg?” In addition to public funding, it is quite critical to have a private source for financing, as well. There is no doubt, in our opinion, that there is a large amount of upfront risk with this type of project. To minimize this risk of non-payment of debt associated with a facility, we must begin to minimize the debt itself. One way to lower the risk is by locking the potential tenants of the facility into lease terms that are similar to the terms on the facility debt. For example, signing a 20-

-5-
year lease of the facility with entities such as a Minor League Baseball team or a school corporation for use of the facility. There may be other entities that could enter into similar lease agreements to further minimize the risk. Finally, it will be very important to create the legislation needed to capture the revenue, and potentially create the entity to own and operate the facility. The legislation needed for this type of facility may have to be specialized for Hamilton County. The various taxes to be captured under this type of project could be ticket tax, additional Food and Beverage Tax, additional Innkeeper’s tax, and capturing the full increments of Income Tax and Sales Tax in the Sports District. The Sports District has been defined (by us) as the area covered by this development and a ½ mile out, practically speaking, from each of the four corners of the facility. In this report, we have also assumed that a Tax Increment Financing (TIF) District would be approved by the State for this project. It may also be possible to obtain a direct grant, from the State of Indiana, based upon the improvement in the health and welfare of the children in the County.
POTENTIAL FACILITIES The proposed project is a large and complex undertaking. For it to be successful, it needs to develop the critical mass to sustain itself and reach its full potential. The project would most likely be developed, in phases, based upon a master plan. The following facilities have been identified as potential components of the overall plan. Multi-Use Facility We have discussed a potential multi-use facility and the surrounding amenities with many potential users and it is quite apparent that a very large market exists for youth sports facilities in Hamilton County, including facilities which could attract major tournaments. We believe it will be very important to create a facility that can be used on a year round basis and draw visitors from outside Hamilton County to maximize the potential economic impact of the facility and the Sports District. Minor League Baseball We have been working with a sponsor (or placement agent) for a Minor League Baseball team. As most should be aware, Fort Wayne is currently replacing their existing baseball stadium and will shortly have a new facility downtown. During our due diligence of this potential project, it became very obvious that the term of the lease should agree with the term of the financing. It is also apparent that additional revenue sources are needed and that from an analyst’s review, the facility must schedule other sports and events during the baseball off season. The owner of the facility must also be prepared in the event the lease is not honored for the entire period.

-6-
Soccer The Westfield Youth Soccer Association, Inc. (WYSA) has a huge need for a large number of soccer fields. In addition, a championship caliber field could be constructed and used for a professional soccer league and could host regional and national soccer tournaments. To fully develop the soccer component, an indoor soccer field could be built and could potentially become the home to a professional soccer team. WYSA appears to be run as a business. We were very impressed with the financial wherewithal the entire group portrayed, and the fact that capital could be contributed to a new facility; the group appears to be able to schedule and maintain their current assets in an outstanding way. A youth soccer league played at a new location that also has fields available for professional teams and league play, such as USL W-league, would assist in bringing in tourneys and championship matches. No direct information has been provided to us, by a professional team, regarding this potential revenue stream, at this time, due to confidential information, but we have reviewed other projections and have set forth an estimated amount for this area. It is our understanding, at this time, that an indoor soccer facility is also needed in the area. As a result of our extensive work with the City of Lawrence, and the potential indoor soccer center there, the economics of this type of facility can be very good, but only having soccer teams to pay for the facility is just not enough if land and other costs are not shared. The Umbro ® Stadium, or similar name, could be housed within the City of Westfield, containing two to four Federation International Football Association (FIFA) regulated fields, with bleacher seating for 7,500 fans. Lacrosse Further analysis is needed to see if a soccer stadium could be built to house a lacrosse team and tournament play. It is our understanding that the field would need artificial turf to withstand the intense play in front of the net. As to the potential for Lacrosse income, no projections are available for possible revenue at this time. Youth Baseball and Other Sports Facilities The City of Westfield and Hamilton County are serviced, in a great manner, by the Westfield Youth Sports, Inc. (WYSI). The WYSI runs over eight separate sports units, including baseball, basketball, cheerleading, football, lacrosse, softball, volleyball and wrestling. WYSI could utilize the multi-use center or incorporate the sports into additional facilities in the main area of the sports center. The WYSI Mission Statement is as follows: “Our mission is to promote amateur youth sports to school–aged children living within Westfield Washington School District of Hamilton County, Indiana fostering competition through affiliation with local and national amateur athletic governing organizations”. With this organization, the facilities could be unlimited in sports aspects. Also, the sponsorships, in our minds, could be very large. We estimated, on the low side, $25,000 (per year) to a high side of $100,000 (per year). It is important to remember that each sport could hold its own tournaments and additional revenue could

-7-
be generated. The WYSI group does an excellent job of scheduling and maintaining the existing facilities and it would be a natural group to participate in the new facility. One of the most successful youth baseball facilities is located in Cooperstown, New York. Cooperstown hosts baseball tournaments mainly in June, July and August, charging each team $10,000, which includes food and barracks style lodging. Typically, fifty teams play each week during the summer. Tennis Facility The sports opportunity continues here with a possibility for a tennis facility. One additional segment could include indoor/outdoor tennis courts. With International Tennis Federation courts running in size at 36 by 78 feet, available land could become an issue. If the United States Tennis Association and/or the International Tennis Federation were approached again, the possibilities could be endless. South of Westfield, there is a tournament that drew 57,271 people this year, over 13,050 less than last year. This type of tournament could attract 5,000-8,000 people per day over one month. A new home could revive tournament play with the right facility. The facility would require 10-12 courts and would have a permanent staff at the facility. YMCA
It is our understanding that the YMCA is looking to place a new facility in the Westfield area that could add swimming and other sports opportunities. The enticement to the YMCA could be the shared parking and maintenance, as well as a possible deal on the land. This is an additional opportunity to provide the critical mass needed to make this project successful.
HAMILTON COUNTY MARKET AREA
The size and strength of the potential market area will be one of the most important factors determining the success of the proposed project. The potential market has been analyzed based upon the current and projected size, as well as the income levels and demographic characteristics of the population. The proposed project will primarily draw events and spectators from the Hamilton County area and the Indianapolis Metro area. Potential visitors will be impacted by the site location and the accessibility to the site, including potential transportation systems. Population Hamilton County is the fastest growing county in the State of Indiana and one of the fastest growing counties in the United States. Population has increased from 108,936 in 1990 to the 2007 estimate of 261,661. The projected 2010 population is 298,642. Hamilton County is part of the Carmel-Indianapolis Metropolitan Statistical Area with a

-8-
2010 projected population of 1,747,197. The Hamilton County market compares favorably with other Minor League Baseball markets. Household Income Hamilton County leads the State of Indiana with a 2005 median household income of $79,927, which is almost double the State average of $44,051. The County also compares well nationally in this category. Household income is an important variable because the higher the income level, the better chance that the household will have the ability to purchase tickets to events and purchase other items while attending those events. Age The 18 to 44-year old age group is regarded as the most likely to purchase tickets for and attend sporting events. Currently, it is estimated that over 40% of the County’s population would fall into this category. In addition, the County has a large percentage of school-aged children who could participate in the youth sports portion of the proposed project. There are approximately 19,000 newborn to four-year old and approximately 52,000 five to seventeen-year old children living in Hamilton County. Data also shows that there are over 29,000 households with children in the County. It is believed that over half of the children living in Hamilton County participate in some type of youth sports. These figures show that the demand for youth sports facilities will continue to grow. Corporate Base In addition to the demographics of the population, it is also important to consider the local corporate community. Hamilton County is home to many national and regional corporate headquarters and boasts a rapidly growing business community. These local corporations will be important contributors to the project, including the purchase of advertising, sponsorships, season tickets, private suites and general support for the project through donations.
COMPARABLE FACILITIES There are currently five Minor League Baseball teams in the State of Indiana. There are no facilities in the State that have all the features and components that the proposed sports complex has. Exhibit E lists comparable population, stadium capacity, and average attendance for several minor league teams. All of the Minor League Baseball stadiums in the State are publicly owned, and in general, most new stadiums
-9-
around the country are publicly owned. In most cases, the team operates the stadium, keeps most of the revenue generated by the stadium and pays the operating expenses of the stadium. The City would need to negotiate an operating agreement with the team, as well as revenue sharing and stadium rental payments. The City of Fort Wayne is currently constructing a new $30,000,000 downtown baseball stadium with an 8,000-person capacity. The team contributed $5,000,000 to the project and the City financed the remainder of the cost. The project is part of a revitalization that includes a new hotel, condos and a large retail development. The City has pledged several sources of revenue to the project, including Tax Increment Revenue, Innkeeper’s Tax, Community Revitalization Enhancement District Revenue and Economic Development Income Tax. In addition, the bonds sold for the project have a property tax backup in the event the estimated revenue is not sufficient. The City of Indianapolis constructed a 14,500-seat Minor League Baseball stadium in 1996. Total attendance for 2007 was 468,869 and the franchise is considered one of the most successful in Minor League Baseball. The proposed baseball stadium would offer a lower price, and more family oriented, experience than the stadium located in Indianapolis. Also, local residents would be more likely to attend an event closer to their home. There has already been a substantial investment in youth sports facilities in the County; however, many of the current facilities are reaching capacity or have already become overcrowded. In addition, Westfield-Washington School Corporation has determined that a need exists for additional sports facilities for the School Corporation.
BUILDING PROGRAM AND COST The actual design and configuration of the proposed complex has not been completed, but we have prepared high and low estimates as examples of potential project costs. The proposed project will require a minimum of 100 acres to complete all potential phases. The baseball portion of the stadium assumes a 4,000-seat stadium with suites, picnic areas and concession stands. The estimated cost is $15,500,000 to $17,000,000. The complex would include shared parking, with a minimum of 2,000 spaces, and the estimated cost of the parking portion of the project is $4,000,000 to $5,000,000. The additional phases of the project have been estimated on Exhibit A. The total cost of the complex is estimated to range from $50,000,000 to $60,000,000, including necessary infrastructure. These amounts do not include financing costs, capitalized interest, debt service reserves or working capital. We have included an example debt service schedule, presented as Exhibit G. The debt service schedule assumes a $50,000,000 tax-exempt bond, issued at a 5.75% interest rate. Principal payments on the bonds have been deferred to allow the project time to begin to generate revenue to be used for debt service. The annual payment is estimated to be approximately $4,100,000.

-10-
The costs and annual debt service amounts are estimates for example purposes only. The project will be further defined and better estimates will be produced in the future.
ESTIMATED FINANCIAL OPERATIONS We have prepared the estimated revenue and expense for the Minor League Baseball portion of the project, based upon actual results at other similar ballparks. Those results are presented on Exhibit B. Our analysis is presented to show the potential financing results and should not be considered a projection of actual results. We estimate that a Minor League Baseball team could generate between $275,000 and $900,000 of net income, per year, before taxes, depreciation and lease payments. Based upon the size and quality of the Hamilton County market, we are optimistic that the potential net income could be in the higher range listed. We have not assumed any net income from the operations of any other portion of the sports complex. We have assumed that revenue generated in those areas will be used to cover the operating and maintenance costs of those areas. Likewise, we have not included any expense from the other portions of the sports complex. Based upon our discussions with members of the local youth sports organizations, we believe that these can be self sufficient from an operating standpoint. We have not assumed any contribution, from them, for debt service on the project.
ADDITIONAL RETAIL & COMMERCIAL DEVELOPMENT A critical assumption, in our analysis, is that the proposed sports complex will create additional retail and commercial development in the surrounding area. This will be dependent on the actual site selected for the proposed project and the amount of developable land surrounding the complex. We have assumed, for purposes of this report, that $75,000,000 to $150,000,000 of new retail and commercial investment will be made, in the area, in addition to the public investment in the project. This new development could provide an important source of revenue, for the project, through the creation of a TIF District. The TIF district would capture the incremental new property taxes paid, in the area, as a result of the development (See Exhibit D for an estimate of this revenue source). The master plan for the proposed sports complex should take into account this potential commercial development and provide for high quality and orderly growth that compliments the championship sports complex. The development could include retail, restaurants, offices and possibly a hotel. This commercial development is one of the keys to providing the revenue needed to support the sports complex through tax increment financing.

-11-
ESTIMATED ECONOMIC AND FISCAL IMPACT
Construction Impact The project could result in a minimum of $50,000,000 of direct construction spending. We estimate the total economic output, from construction, to be approximately $85,000,000. This would result in over $30,000,000 in total earnings as a result of the project and about $2,000,000 in new taxes. The construction of the sports complex could also spark additional new economic activity in Hamilton County, of about $12,000,000. Overall, the construction of the sports complex could generate 400 to 500 new full and part-time jobs during the construction period. Annual Operations Impact The annual operation of the proposed sports complex is estimated to generate approximately $10,000,000 in direct spending and approximately $16,000,000 in gross annual output. This would result in 100 to 125 full and part-time jobs. The creation of new jobs could result in $400,000 in new taxes. The Hamilton County Convention and Visitors Bureau estimates that 45,200 people visited the County in 2007 to participate in some type of sports tournament. These visitors are estimated to have spent $6,780,000 during their stay. The proposed project has the potential to increase the number of sports related visitors to the County many times over. Non-Quantifiable Benefits In addition to the economic benefits listed above, Hamilton County will enjoy many additional benefits as a result of the construction of the proposed sports complex. These benefits could include:
• Higher quality of life and enhanced community pride and self image, including giving the City of Westfield a defining project
• Increased exposure and reputation • Additional economic growth and private sector investment spurred by the
operation of the sports complex • A national and regional destination • A more diversified tax base • Affordable local family entertainment • A more healthy and physically fit community

-12-
FUNDING SOURCES We have identified the following potential sources of revenue for the proposed project:
• Equity Contribution from Baseball Team Owner • Net Income from Baseball Operations (Exhibit B) • Naming Right (Exhibit F) • Private Contributions • Tax Increment Financing (TIF) Revenue (Exhibit D) • Professional Sports District Revenue (Exhibit C) • Ticket Tax (Exhibit C) • Food and Beverage Tax (Exhibit C) • Innkeeper’s Tax (Exhibit C) • User Fees • State Grants • Park District Bond Payable from Property Taxes • Economic Improvement District Revenue
In order for the project to proceed, all of the above revenue sources will need to be investigated and committed to the project, if possible. In many cases, the first dollars are the most difficult to obtain. The City must identify the sources of funds to begin the process of designing the project so that future funding can be obtained. This listing is for example purposes only and the actual sources of revenue will be different than those listed.
ACTION STEPS
The City of Westfield and Hamilton County have a tremendous opportunity to create the “Family Sports Capital of the United States”. In order to make this dream a reality, the work must start now. Some of the actions steps needed are as follows:
• The City and County should publicly express their support for the project and authorize representatives to continue to prepare a complete plan for the project;
• Formal partnership agreements need to be negotiated with each of the potential participants in the project;
• A site for the proposed complex must be selected; • New legislation must be drafted to allow the creation of a sports district; • The City and County must determine the best entity to own and operate the facility.
This could include special legislation to create a “Capital Improvement Board”, similar to the entity in Indianapolis;
• Funds for the initial design and development must be procured; • An architect should be hired to begin the initial site plan once all the potential
participants have been identified and the site has been selected; • The scope of the project needs to be defined and the best phasing of the project needs
to be determined; and • The City and County must identify and commit funds and revenue streams to the
project.

EXHIBIT A
Low High
Baseball Stadium 15,500,000$ 17,000,000$ Parking 4,000,000 5,000,000 Land - - Purchase of Team and Working Capital (1) 1,500,000 1,500,000 Football Stadium and Locker Rooms 10,000,000 12,000,000 Youth Soccer Fields 4,000,000 4,750,000 Youth Baseball Fields 4,000,000 4,750,000 Infrastructure 11,000,000 15,000,000
Total Expense 50,000,000$ 60,000,000$
(1) To be paid by team owner
CITY OF WESTFIELD(Hamilton County, Indiana)
Estimated Project Costs
-13-

EXHIBIT B
Low HighRevenue
Ticket Sales 1,225,000$ 1,500,000$ Advertising 400,000 700,000 Concessions 200,000 375,000 Parking - 125,000 Other 50,000 50,000
Total Revenue 1,875,000$ 2,750,000$
Expense
Team Expense 325,000$ 325,000$ Payroll - Non-Player 450,000 600,000 Marketing and Promotions 115,000 115,000 Facility Expense 160,000 160,000 Direct Expense 300,000 300,000 General and Administrative 250,000 350,000
Total Expense 1,600,000$ 1,850,000$
Estimated Net Income 275,000$ 900,000$
Note: Estimated Net Income is before amortization, depreciation and income taxes and does not include any facility rental payment or debt service.
CITY OF WESTFIELD(Hamilton County, Indiana)
Minor League BaseballEstimated Annual Revenue and Expense
-14-

EXHIBIT C
Low High
Professional Sports District (1) 1,500,000$ 2,500,000$ Ticket Tax 150,000 250,000 Food and Beverage Tax (2) - 50,000 Incremental Food and Beverage Tax (3) 5,000 25,000 Incremental Innkeeper's Tax (3) - 25,000 Youth Sports Sponsorships 25,000 100,000 Innkeeper's Tax (2) - 50,000
Estimated Annual TIF Revenue 1,680,000$ 3,000,000$
Note: The above revenue may require legislative change in order to be available.
(1) Professional Sports District revenue includes estimated sales tax and income tax to be generated in the area.(2) Food and Beverage Tax and Innkeeper's Tax are assumed to be allocated to the project by the County.(3) Incremental Food and Beverage Tax and Incremental Innkeeper's Tax are based on revenue generated in the Sports Complex area.
CITY OF WESTFIELD(Hamilton County, Indiana)
Estimated Other Annual Revenue
-15-

EXHIBIT D
Low High
Estimated Construction Cost ofCommercial and Retail Areas 75,000,000$ 150,000,000$ Assessment Factor 75% 75%
Estimated Assessed Value 56,250,000$ 112,500,000$
Estimated Tax Rate 2.0000 2.1500
Estimated Annual TIF Revenue 1,125,000$ 2,418,750$
Note: Estimated TIF revenue will be dependent on actual construction cost and timing of build out.
CITY OF WESTFIELD(Hamilton County, Indiana)
Estimated Tax Increment Financing Revenue
-16-
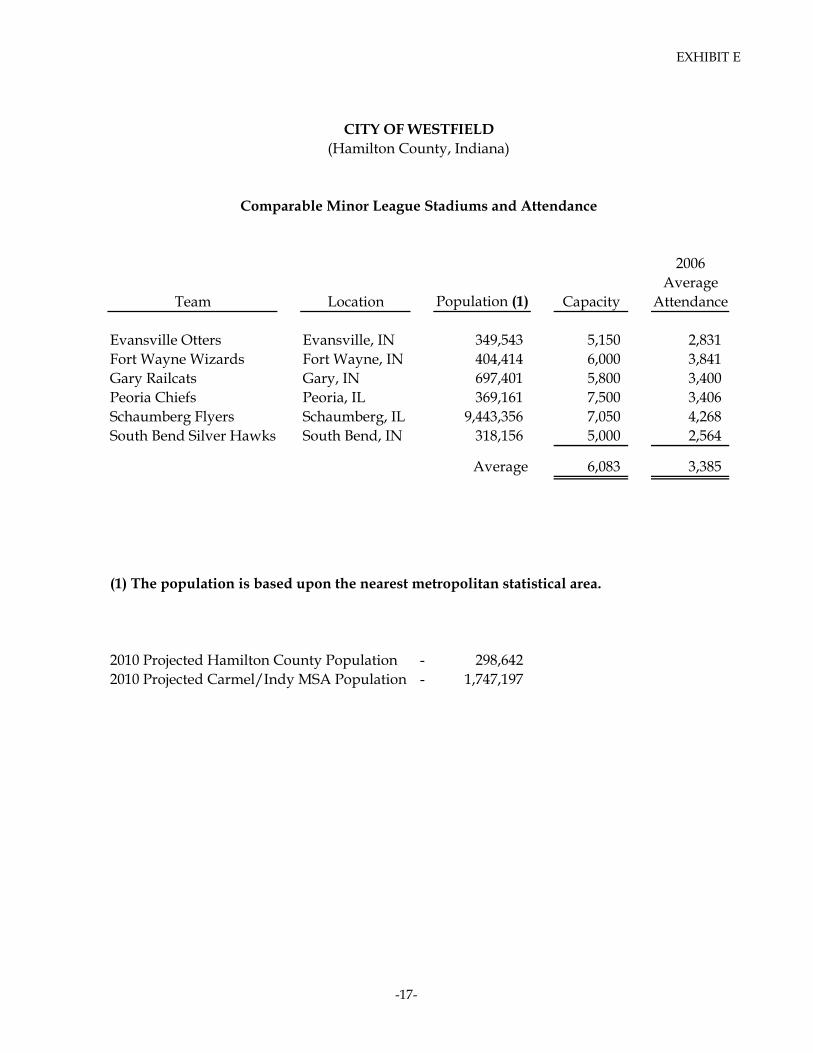
EXHIBIT E
2006Average
Team Location Population (1) Capacity Attendance
Evansville Otters Evansville, IN 349,543 5,150 2,831 Fort Wayne Wizards Fort Wayne, IN 404,414 6,000 3,841 Gary Railcats Gary, IN 697,401 5,800 3,400 Peoria Chiefs Peoria, IL 369,161 7,500 3,406 Schaumberg Flyers Schaumberg, IL 9,443,356 7,050 4,268 South Bend Silver Hawks South Bend, IN 318,156 5,000 2,564
Average 6,083 3,385
(1) The population is based upon the nearest metropolitan statistical area.
2010 Projected Hamilton County Population - 298,642 2010 Projected Carmel/Indy MSA Population - 1,747,197
CITY OF WESTFIELD(Hamilton County, Indiana)
Comparable Minor League Stadiums and Attendance
-17-

EXHIBIT F
Naming AnnualStadium Name Location Right Fee Term Amount
Fifth Third Field Dayton, OH 4,500,000$ 10 450,000$ United States Steel Yard Gary, IN 2,300,000 10 230,000 O'Brien Field Peoria, IL 1,050,000 7 150,000 Alexian Field Schaumberg, IL 2,000,000 10 200,000 GMC Park Collinsville, IL 1,000,000 10 100,000
CITY OF WESTFIELD(Hamilton County, Indiana)
Example of Naming Right Fees
-18-
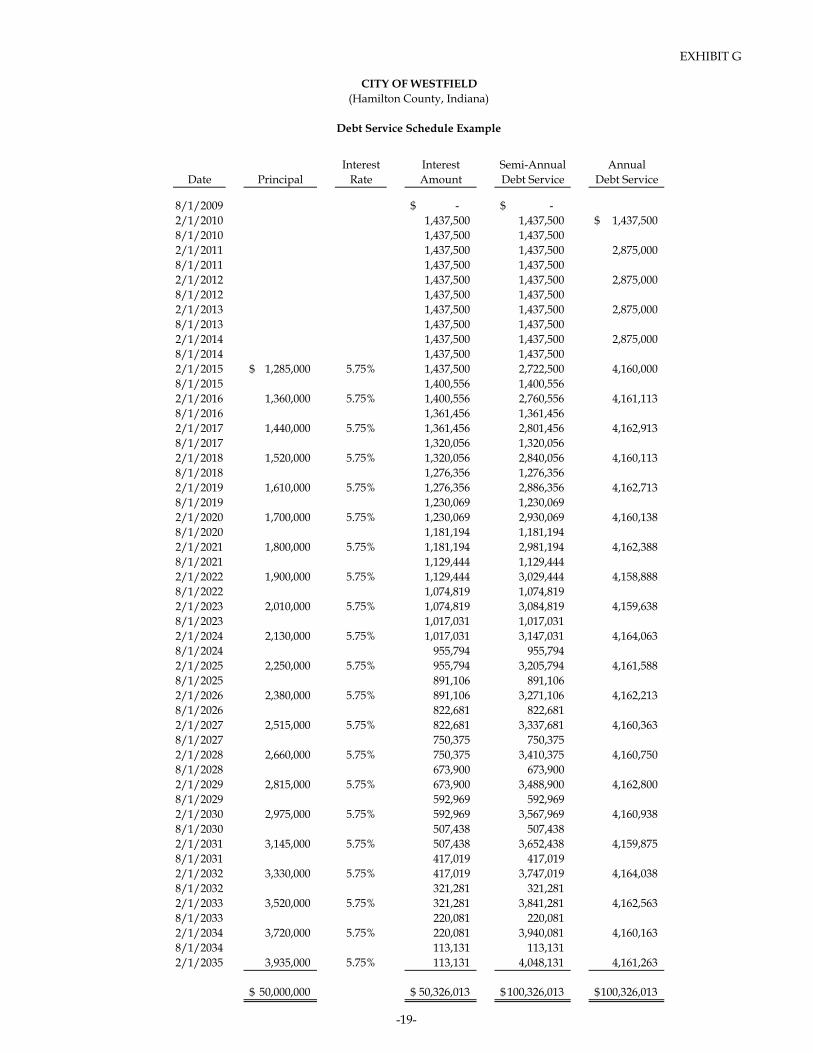
EXHIBIT G
Interest Interest Semi-Annual AnnualDate Principal Rate Amount Debt Service Debt Service
8/1/2009 -$ -$ 2/1/2010 1,437,500 1,437,500 1,437,500$ 8/1/2010 1,437,500 1,437,500 2/1/2011 1,437,500 1,437,500 2,875,000 8/1/2011 1,437,500 1,437,500 2/1/2012 1,437,500 1,437,500 2,875,000 8/1/2012 1,437,500 1,437,500 2/1/2013 1,437,500 1,437,500 2,875,000 8/1/2013 1,437,500 1,437,500 2/1/2014 1,437,500 1,437,500 2,875,000 8/1/2014 1,437,500 1,437,500 2/1/2015 1,285,000$ 5.75% 1,437,500 2,722,500 4,160,000 8/1/2015 1,400,556 1,400,556 2/1/2016 1,360,000 5.75% 1,400,556 2,760,556 4,161,113 8/1/2016 1,361,456 1,361,456 2/1/2017 1,440,000 5.75% 1,361,456 2,801,456 4,162,913 8/1/2017 1,320,056 1,320,056 2/1/2018 1,520,000 5.75% 1,320,056 2,840,056 4,160,113 8/1/2018 1,276,356 1,276,356 2/1/2019 1,610,000 5.75% 1,276,356 2,886,356 4,162,713 8/1/2019 1,230,069 1,230,069 2/1/2020 1,700,000 5.75% 1,230,069 2,930,069 4,160,138 8/1/2020 1,181,194 1,181,194 2/1/2021 1,800,000 5.75% 1,181,194 2,981,194 4,162,388 8/1/2021 1,129,444 1,129,444 2/1/2022 1,900,000 5.75% 1,129,444 3,029,444 4,158,888 8/1/2022 1,074,819 1,074,819 2/1/2023 2,010,000 5.75% 1,074,819 3,084,819 4,159,638 8/1/2023 1,017,031 1,017,031 2/1/2024 2,130,000 5.75% 1,017,031 3,147,031 4,164,063 8/1/2024 955,794 955,794 2/1/2025 2,250,000 5.75% 955,794 3,205,794 4,161,588 8/1/2025 891,106 891,106 2/1/2026 2,380,000 5.75% 891,106 3,271,106 4,162,213 8/1/2026 822,681 822,681 2/1/2027 2,515,000 5.75% 822,681 3,337,681 4,160,363 8/1/2027 750,375 750,375 2/1/2028 2,660,000 5.75% 750,375 3,410,375 4,160,750 8/1/2028 673,900 673,900 2/1/2029 2,815,000 5.75% 673,900 3,488,900 4,162,800 8/1/2029 592,969 592,969 2/1/2030 2,975,000 5.75% 592,969 3,567,969 4,160,938 8/1/2030 507,438 507,438 2/1/2031 3,145,000 5.75% 507,438 3,652,438 4,159,875 8/1/2031 417,019 417,019 2/1/2032 3,330,000 5.75% 417,019 3,747,019 4,164,038 8/1/2032 321,281 321,281 2/1/2033 3,520,000 5.75% 321,281 3,841,281 4,162,563 8/1/2033 220,081 220,081 2/1/2034 3,720,000 5.75% 220,081 3,940,081 4,160,163 8/1/2034 113,131 113,131 2/1/2035 3,935,000 5.75% 113,131 4,048,131 4,161,263
50,000,000$ 50,326,013$ 100,326,013$ 100,326,013$
CITY OF WESTFIELD
Debt Service Schedule Example
(Hamilton County, Indiana)
-19-
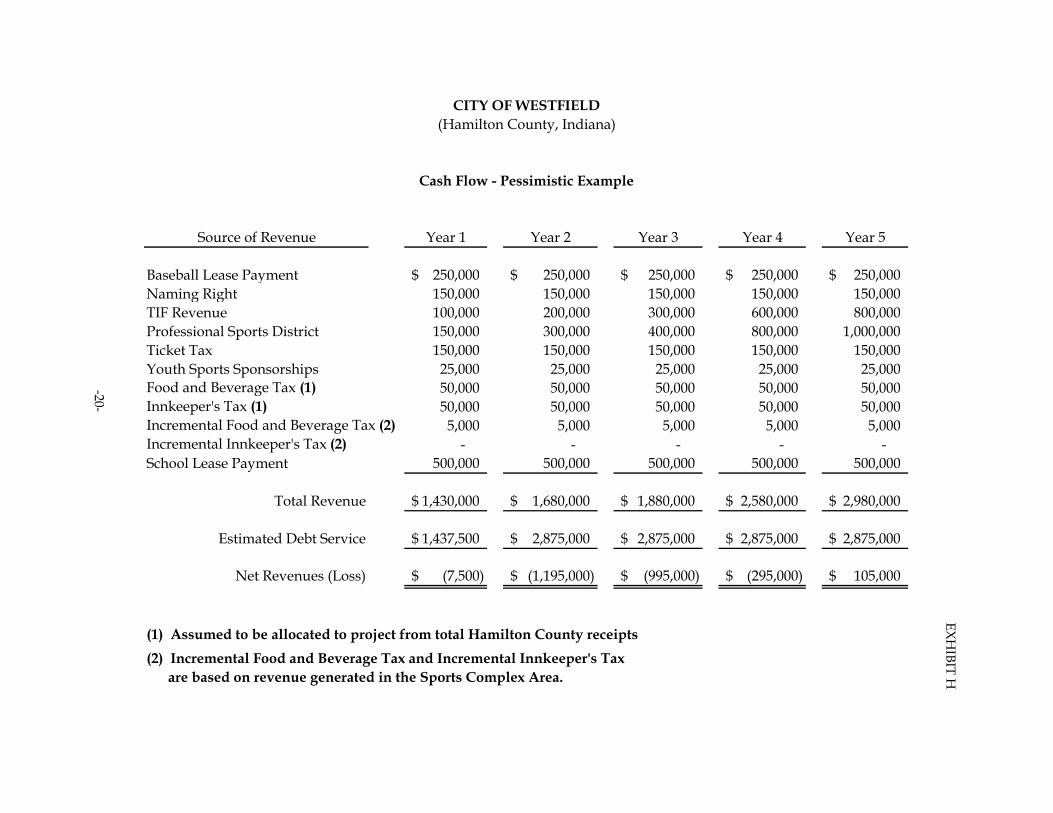
Source of Revenue Year 1 Year 2 Year 3 Year 4 Year 5
Baseball Lease Payment 250,000$ 250,000$ 250,000$ 250,000$ 250,000$ Naming Right 150,000 150,000 150,000 150,000 150,000 TIF Revenue 100,000 200,000 300,000 600,000 800,000 Professional Sports District 150,000 300,000 400,000 800,000 1,000,000 Ticket Tax 150,000 150,000 150,000 150,000 150,000 Youth Sports Sponsorships 25,000 25,000 25,000 25,000 25,000 Food and Beverage Tax (1) 50,000 50,000 50,000 50,000 50,000 Innkeeper's Tax (1) 50,000 50,000 50,000 50,000 50,000 Incremental Food and Beverage Tax (2) 5,000 5,000 5,000 5,000 5,000 Incremental Innkeeper's Tax (2) - - - - - School Lease Payment 500,000 500,000 500,000 500,000 500,000
Total Revenue 1,430,000$ 1,680,000$ 1,880,000$ 2,580,000$ 2,980,000$
Estimated Debt Service 1,437,500$ 2,875,000$ 2,875,000$ 2,875,000$ 2,875,000$
Net Revenues (Loss) (7,500)$ (1,195,000)$ (995,000)$ (295,000)$ 105,000$
(1) Assumed to be allocated to project from total Hamilton County receipts(2) Incremental Food and Beverage Tax and Incremental Innkeeper's Tax are based on revenue generated in the Sports Complex Area.
EXHIBIT H
-20-
CITY OF WESTFIELD(Hamilton County, Indiana)
Cash Flow - Pessimistic Example

Source of Revenue Year 1 Year 2 Year 3 Year 4 Year 5
Baseball Lease Payment 650,000$ 650,000$ 650,000$ 650,000$ 650,000$ Naming Right 225,000 225,000 225,000 225,000 225,000 TIF Revenue 200,000 400,000 800,000 900,000 1,100,000 Professional Sports District 400,000 650,000 900,000 1,200,000 1,400,000 Ticket Tax 250,000 250,000 250,000 250,000 250,000 Youth Sports Sponsorships 100,000 100,000 100,000 100,000 100,000 Food and Beverage Tax (1) 50,000 50,000 50,000 50,000 50,000 Innkeeper's Tax (1) 50,000 50,000 50,000 50,000 50,000 Incremental Food and Beverage Tax (2) 25,000 25,000 25,000 25,000 25,000 Incremental Innkeeper's Tax (2) 25,000 25,000 25,000 25,000 25,000 School Lease Payment 500,000 500,000 500,000 500,000 500,000
Total Revenue 2,475,000$ 2,925,000$ 3,575,000$ 3,975,000$ 4,375,000$
Estimated Debt Service 1,437,500$ 2,875,000$ 2,875,000$ 2,875,000$ 2,875,000$
Net Revenue (Loss) 1,037,500$ 50,000$ 700,000$ 1,100,000$ 1,500,000$
(1) Assumed to be allocated to project from total Hamilton County receipts(2) Incremental Food and Beverage Tax and Incremental Innkeeper's Tax are based on revenue generated in the Sports Complex area.
-21-
EXHIBIT I
CITY OF WESTFIELD(Hamilton County, Indiana)
Cash Flow - Optimistic Example

EXHIBIT J
Sources of Funds Option 1 Option 2
Bond Proceeds 15,000,000$ 25,000,000$ Cash on Hand - - Estimated Interest Income 150,000 250,000
Total Sources of Funds 15,150,000$ 25,250,000$
Uses of Funds
Construction Fund (1) 14,100,000$ 23,650,000$ Capitalized Interest (2) 750,000 1,250,000 Underwriter's Discount and Cost of Issuance 300,000 350,000
Total Uses of Funds 15,150,000$ 25,250,000$
Estimated Annual Debt Payment 1,255,190$ 2,091,983$
Estimated Tax Rate Impact per $100 (3) 0.0610 0.1017
Estimated Annual Impact to Homeowner (4): - $100,000 Assessed Valuation 20.62$ 34.37$ - $250,000 Assessed Valuation 80.11 133.51 - $400,000 Assessed Valuation 139.59 232.66
Estimated Monthly Impact to Homeowner (4): - $100,000 Assessed Valuation 1.72$ 2.86$ - $250,000 Assessed Valuation 6.68 11.13 - $400,000 Assessed Valuation 11.63 19.39
NotesThe proposed bonds are assumed to be payable from general property taxes and approvedby referendum - and not subject to the Circuit Breaker.
(1) The Construction Fund includes the architect fee, contingency and equipment, if any.(2) Capitalized Interest includes interest for 12 months.(3) The estimated tax rate impact is based upon Pay 2008 Westfield assessed value of $2,057,307,423.(4) The estimated increase in property taxes is net of a combined $48,000 of Standard Homestead and Mortgage Deductions and an additional 35% Homestead Deduction.
CITY OF WESTFIELD
Park District Bond Issue Example
(Hamilton County, Indiana)
Estimated Sources and Uses of Funds and Tax Impact
(Payable from Property Taxes)
-22-

EXHIBIT K
Low High
Estimated Assessed Value 250,000,000$ 350,000,000$
Estimated Tax Rate 0.1000 0.1000
Estimated Annual TIF Revenue 250,000$ 350,000$
NotesAn Economic Improvement District (EID) would need to be created around the area that will benefit from construction of the proposed complex.
A special tax would be levied on all property in the District to create the annualEID revenue.
CITY OF WESTFIELD(Hamilton County, Indiana)
Economic Improvement District Revenue Example
-23-

Westfield Family Sports Complex Phase 1 Report
Recommendation to the Mayor
July 24, 2009
\Çw|tÇt DKFG
“Old Town Charm, New City Style”
130 Penn Street • Westfield, IN 46074 • (317) 804-3000 • Fax (317) 804-3010 •
Website: www.westfield.in.gov

\Çw|tÇt DKFG
“Old Town Charm, New City Style”
Page 2 130 Penn Street • Westfield, IN 46074 • (317) 804-3000 • Fax (317) 804-3010 •
Website: www.westfield.in.gov
Letter of Transmittal July 24, 2009 The Honorable Andy Cook Mayor 130 Penn Street Westfield, IN 46074 Dear Mr. Mayor, Enclosed is the Phase I Report from Westfield Family Sports Commission (Commission). Thank you for allowing this commission to provide you and the City of Westfield (City) with our recommendation for the City’s consideration of a Family Sports Complex (Complex). Since forming the commission a couple of months ago at your direction, we have reviewed the information provided to us, talked to various stakeholders and discussed the business and financial viability of such a concept. Hopefully you find this report, and specifically our recommendation, beneficial in your final decision to spend City resources and focus on further analyzing the viability of a Family Sport Complex. The commission recognizes the Complex represents an exciting opportunity for the City. We believe the viability of such will depend greatly on the scope of the Complex and the proper mix of a business model between private and public ownership. We look forward to working with you, the City Council and other stakeholders as you move forward in this process.
The Westfield Sports Complex Commission cc: Mark Anderson, Commission Member Mike Deck, Commission Member John Dippel, Commission Member Dr. Mark Keen, Commission Member Ken Kingshill, Commission Member William Knox, Commission Member Dave Schmitz, Commission Member Chris Stice, Commission Member Melody Sweat, Commission Member Kevin Teder, Commission Chairman Nick Verhoff, Commission Member Steve Warner, Commission Member

\Çw|tÇt DKFG
“Old Town Charm, New City Style”
Page 3 130 Penn Street • Westfield, IN 46074 • (317) 804-3000 • Fax (317) 804-3010 •
Website: www.westfield.in.gov
Table of Contents
Letter of Transmittal ........................................................................................................... 2
Table of Contents ................................................................................................................ 3
Background and Purpose of Commission ........................................................................... 4
Commission Phase 1 Activities ............................................................................................ 7
Commission Recommendation ........................................................................................... 9
Commission Guidance for Phase II ................................................................................... 11
Conclusion ......................................................................................................................... 14
\Çw|tÇt DKFG
“Old Town Charm, New City Style”
Page 4 130 Penn Street • Westfield, IN 46074 • (317) 804-3000 • Fax (317) 804-3010 •
Website: www.westfield.in.gov
Background and Purpose of Commission
The discussion of the need to enhance certain youth and family sports facilities and related infrastructure began a couple of years ago. Studies have shown that over 50,000 children between the ages of 5‐17 currently live in Hamilton County, the population will continue to grow and a significant percentage of these children play youth sports competitively. The conversations started with representatives of Westfield Youth Soccer Association (WYSA) and Westfield Youth Sports Inc (WYSI), along with other stakeholders, communicating to City officials about their respective needs for facilities and infrastructure for certain sports. The conversations began smaller in scope, focusing primarily on “in‐house” Westfield youth sports. Those conversations began to expand as other stakeholders, such as the Hamilton County Convention and Visitor’s Bureau (HCCVB), recognized the potential for more of a “destination” if the facility could be built to a certain size and championship quality and be surrounded by complementary business, entertainment and lodging. It was also clear that these facilities could benefit family members of all ages, as adult leagues could leverage these facilities. These conversations continued over the course of the next couple of years with various stakeholders. A joint vision was developed for Westfield to be the home of a multiple championship sports facility that meets the needs of Westfield and Hamilton County sports community. The facility would offer family health, recreation and sporting opportunities locally and provide a site for state, regional and national tournaments unlike any in the nation. The vision statement turned into an organization chart expressing an effort to leverage existing assets and create new assets towards this direction. In addition to the youth and family aspects of this complex, the conversation continued to expand and include other ideas such as hosting an independent professional baseball team and serving as the new home for the Indianapolis professional tennis tournament, among other professional and semi‐professional teams. In certain cases, a Memorandum of Understanding and other agreements were entered with certain stakeholders to enable good collaboration on the concept. During 2007 and 2008, conversations varied in scope, size and purpose for such a facility. Over the course of this time, the City has partnered extensively with the HCCVB and other stakeholders to begin to identify scope, need, and funding sources for the facility. Formal and informal studies were performed accordingly. The scope and vision began to be formalized.

\Çw|tÇt DKFG
“Old Town Charm, New City Style”
Page 5 130 Penn Street • Westfield, IN 46074 • (317) 804-3000 • Fax (317) 804-3010 •
Website: www.westfield.in.gov
The City began to look at potential locations for such a facility. Differing degrees of discussions progressed with several land owners/developers, including properties owned by Beau Wilfong, The Estridge Group and others. The conversations have recently centered on a partnership with Estridge to leverage a portion of land slated for its project titled “Symphony” – a multi generational residential and commercial development. Symphony also considered ancillary sports related businesses such as the YMCA, as well as other businesses, restaurants and hotels. During 2008, the City engaged Financial Solutions Group (FSG) to perform a study of the business and economic viability of such a concept, including potential revenue sources and capital costs for such a project. The City and other stakeholders began to get information on comparable projects in other cities to help evaluate the viability and ideas for the concept. The City also began to evaluate alternatives for taxing districts and other vehicles, including options specific to sporting venues. The City, HCCVB and others collaborated with legislators to position Westfield and this facility for certain taxing authorities to maximize City, County and State revenues. Outside legal counsel and other advisors summarized options. The City began the process to trademark “Family Sports Capital of America.” In May 2009, the City and HCCVB formed a Commission to review the viability of the Family Sports Complex. The Commission includes the following members:
Mark Anderson, Commission Member Mike Deck, Commission Member John Dippel, Commission Member Dr. Mark Keen, Commission Member Ken Kingshill, Commission Member William Knox, Commission Member Dave Schmitz, Commission Member Chris Stice, Commission Member Melody Sweat, Commission Member Kevin Teder, Commission Chairman Nick Verhoff, Commission Member Steve Warner, Commission Member
\Çw|tÇt DKFG
“Old Town Charm, New City Style”
Page 6 130 Penn Street • Westfield, IN 46074 • (317) 804-3000 • Fax (317) 804-3010 •
Website: www.westfield.in.gov
It was determined the Commission’s activities would be separated into 2 Phases. Phase 1 This Phase was estimated to be 2 months in length. The purpose for Phase 1 was for the Commission to confirm the needs and viability for a family sports complex concept before the City engages in a much more extensive and detailed review that would require additional resources and energy over a longer period of time. The Commission would evaluate the viability of a family sports complex in Westfield and base its evaluation on a high level review of information accumulated and discussions held by the City and other stakeholders to date. The commission would then recommend whether the city should proceed to Phase 2. Phase 2 This Phase would likely be 9‐12 months in length and occur if the Commission recommends moving forward to Phase 2. This Phase would be a much more detailed review and analysis of the viability of the Family Sports Complex concept and likely include detailed financial studies, agreements on scope and purpose of the Complex, evaluation of public/private ownership and many other activities. RFI’s (Request for Information) would likely be sent out to various vendors and other interested parties. The conclusion of Phase 2 would be a final recommendation for the City and include specifics as to scope, location, budget and ownership model. The City could move forward with the Project based upon the Phase 2 findings and detail. This report summarizes the results of the Commission Phase 1 activities.
\Çw|tÇt DKFG
“Old Town Charm, New City Style”
Page 7 130 Penn Street • Westfield, IN 46074 • (317) 804-3000 • Fax (317) 804-3010 •
Website: www.westfield.in.gov
Commission Phase 1 Activities
The Commission’s first meeting was May 12th, 2009. Since this initial meeting, the Commission has met every 1‐2 weeks in person or on conference calls. At each meeting, the Commission reviewed information and studies compiled by the City, HCCVB and other stakeholders regarding the scope and viability of the Family Sports Complex concept. The Commission also engaged other stakeholders to gain their perspective about the City’s needs, vision and the related viability of the Complex. A summary of Commission’s activities are as follows:
At the first meeting, each of the Commission members summarized their individual perspectives for the Complex. The Commission was intentionally formed to provide a balance of skills and insights from stakeholders, schools, the City, Parks, HCCVB, business, financial, development, and championship sports, among others. The Commission’s perspectives touched on such things as scope, background, opportunities and responsibilities of the City, risks, location, ownership model, stakeholders, and similar projects at other cities.
The Mayor attended the second meeting and shared his perspectives and background on what led to the City’s consideration for a family sports complex. He also summarized his thoughts on the importance and purpose of the Commission.
During the next series of meeting, the Commission reviewed various information accumulated by the City about the Complex. A significant amount of time was spent reviewing the study prepared by FSG. The Commission discussed the detail presented in the study, perspectives on the accuracy of the information, areas/gaps the study did not cover and how the scope of the Complex may have changed since the study was completed. The following areas were covered in this review:
o Financial Viability o Scope of Sports to be Included in Complex o Destination/Theme Concepts o Location o Cost of Land and Acreage Assumptions o Viability to be a Family Sports Destination (hosting championship level
tournaments for amateur/youth sports) o Viability of Professional Sports

\Çw|tÇt DKFG
“Old Town Charm, New City Style”
Page 8 130 Penn Street • Westfield, IN 46074 • (317) 804-3000 • Fax (317) 804-3010 •
Website: www.westfield.in.gov
o Financing Assumptions o Taxing Authorities o Ownership Models – Private vs. Public Ownership o Operation of the Facility o The City’s Needs for the Complex o Cultural Fit
The Commission also invited representatives from the Estridge Group and National Sports Services to speak at a meeting. With Symphony being a key location considered by the City, the Commission believed it was important to understand the Estridge Group’s vision for Symphony and how the Complex would fit into Symphony. National Sports Services educated the Commission on the viability of an independent professional baseball team and how it could fit into the scope of the Complex.
The last groups of meetings were spent by the Commission summarizing findings, agreeing on a recommendation and preparing a final recommendations document for Phase 1.
Note the Commission’s recommendation and related insights were based upon the information provided to the Commission. The Commission did not complete additional detail or revise any information from the study based upon changes in scope or any perceived gaps – as this was not the purpose for Phase 1. The Commission’s recommendation has included suggestions for additional or more detailed analysis to be completed during Phase 2.

\Çw|tÇt DKFG
“Old Town Charm, New City Style”
Page 9 130 Penn Street • Westfield, IN 46074 • (317) 804-3000 • Fax (317) 804-3010 •
Website: www.westfield.in.gov
Commission Recommendation
Based upon the information provided to the Commission for its review, the Commission has confirmed that a family sports complex is viable for the City of Westfield and recommends the City of Westfield and HCCVB move forward to a Phase 2 set of activities that will further evaluate and conclude details of the project.
Keys to the Commission’s recommendation include the following:
The City has a responsibility to provide the proper facilities for Westfield youth and family sports. Currently, several youth sports are lacking the facilities, either because of growth or because their current facilities may not be available in the long term. Thus, the City needs to collaborate with these youth programs to provide the needed facilities.
There is a market demand for championship level facilities to host amateur tournaments and championships and the Complex can serve as a family sports destination. These tournaments and related revenue can help the City and Hamilton County fund the fixed costs that other cities have for youth sports. In summary, if done in a fiscally responsible way, the City has an opportunity to turn a traditional fixed city cost (youth sports facilities) into a revenue‐generating economic development initiative.
The City’s central geographic location (accessibility by visitors), availability of land and sports focus does provide other favorable aspects to this concept. This concept aligns with the economic development goals and objectives for the City.
The City could also receive additional revenue to fund the Complex if leveraged by professional or semi‐professional sports teams. Obviously, the City would want to ensure any additional infrastructure costs required by these professional teams would be offset by the additional revenue that could be generated accordingly.
The Commission also felt it was important to note that since the completion of the FSG study, various aspects about the Complex have changed, including (i) the scope of sports being considered for the Complex; (ii) championship level requirements; (iii) private/public ownership options and resulting operating models and profit; (iv) viable taxing authorities; (v) cost assumptions, including land; (vi) revenue/funding opportunities for the City; (vii) importance of a professional sports;

\Çw|tÇt DKFG
“Old Town Charm, New City Style”
Page 10 130 Penn Street • Westfield, IN 46074 • (317) 804-3000 • Fax (317) 804-3010 •
Website: www.westfield.in.gov
(viii) location options; (ix) possible phasing of the complex over several years based upon City and stakeholder priorities, funding and timeline requirements; (x) various other assumptions used in the study.
While the Commission considered and discussed much of the data in the study in order to reach a final recommendation, the results and conclusions of the study were not considered because of the changes highlighted above. As a result, as this Project moves to Phase 2, a significant level of additional analysis and studies would need to be completed once more details are confirmed on the scope, size and costs to the complex.
\Çw|tÇt DKFG
“Old Town Charm, New City Style”
Page 11 130 Penn Street • Westfield, IN 46074 • (317) 804-3000 • Fax (317) 804-3010 •
Website: www.westfield.in.gov
Commission Guidance for Phase II
As the activities for the family sports complex moves into Phase 2, the Commission recommends the below areas be further analyzed. In each of these areas, decisions need to be made regarding the details of the Complex and those decisions need to be included in the assumptions of a more detailed study to be performed. In addition, the City will want to engage vendors and stakeholders to gather information necessary to make these decisions as to cost, operations and funding. Public vs. Private Ownership and Operating Model There are various options the City should consider, all with different investment requirements and risks. This City should consider what it has to offer to the Complex – compared to what the private sector has to offer – and how much control the City and other stakeholders would want on the operations. These considerations will all need to be balanced. Location, Cost and Developer Capabilities The City and Estridge have discussed Symphony as a potential location for the Complex. The City will want to consider various locations, developers and the scope of services it is requesting from those developers. Scope of Sports The Commission has concluded there are likely 3 segments of sports that both have a need for expanded facilities (or fit well with the demand for tournament sites) and/or fit will within the Complex model to ensure utilization of the complex for 12 months of the year: (i) field sports – including soccer, lacrosse, rugby and possibly others; (ii) baseball; (iii) an indoor facility for winter sports – including basketball, volleyball, gymnastics and other indoor sport activities. The City will want to compare the infrastructure needs for Westfield youth sports for these sports, along with the viability of championship tournaments for each sport, to make the final decision as to scope of sports. These sports could also be ‘phased in’ over a multi year period, with the field sports being the scope for Phase I given specific
\Çw|tÇt DKFG
“Old Town Charm, New City Style”
Page 12 130 Penn Street • Westfield, IN 46074 • (317) 804-3000 • Fax (317) 804-3010 •
Website: www.westfield.in.gov
timing requirements from these sports and availability of funds. Leveraging the Complex for professional sports teams would also be considered in this review.
The Commission may also want to consider the needs of other cities within Hamilton County, including Carmel, Noblesville and others. In each case, these cities are also looking into the expansion of sports, most specifically field sports, for their respective youth and city needs. Purpose of Complex vs. Cost of Facility During Phase I, the Commission discussed the purpose of the Complex – and agreed there are 3 levels of purpose that should be considered: Level 1 – Westfield Family Sports
Build a facility to support Westfield youth and family sports. The scope of sports, the facility’s needs and related costs would be based upon the needs of the Westfield youth and adult sports programs.
Level 2 – Amateur Tournaments/ Family Destination
In addition to Level 1 needs, the Complex would include facilities to support the hosting of championship level youth and amateur sports tournaments. Financial studies would need to be performed to ensure the additional costs required to reach Level 2 would be offset by additional revenues brought to the City and Hamilton County because of these tournament.
Level 3 – Professional Sports
In addition to Levels 1 and 2, the Complex could serve as the ‘home’ for professional sports teams or events. Financial studies would need to be performed to ensure the additional infrastructure or operating costs required by a professional sports team would be offset by the additional revenues brought into the complex by such a team
Overall Financial Study
A more detailed financial study would need to be completed and include the assumptions on decisions made during the Phase 2 process around scope, size and revenue opportunities. This financial study would support a final

\Çw|tÇt DKFG
“Old Town Charm, New City Style”
Page 13 130 Penn Street • Westfield, IN 46074 • (317) 804-3000 • Fax (317) 804-3010 •
Website: www.westfield.in.gov
recommendation by the Commission as to whether to move forward with the project.
The Commission recognizes that during Phase 2, depending upon the progress and decisions made, there may need to be certain decisions and actions taken to keep the project moving in accordance with certain timelines required for certain youth sports. We also recognize that the City and HCCVB may require cash outlay in order to complete certain activities/studies and/or engage outside consultant/advisors for the Phase 2 decision making. Phase 2 activities will be more extensive and in depth – and thus the Commission will look to engage other City functions, HCCVB and other possible Commission members so that the City can move this process forward efficiently and in a thoughtful manner. The Commission would likely develop “sub‐committees” responsible for moving specific actions/initiatives forward during Phase 2.

\Çw|tÇt DKFG
“Old Town Charm, New City Style”
Page 14 130 Penn Street • Westfield, IN 46074 • (317) 804-3000 • Fax (317) 804-3010 •
Website: www.westfield.in.gov
Conclusion
In Conclusion, the Commission recommends the City and HCCVB move forward to Phase 2 and further evaluates, analyze and make final decisions regarding the Complex. Because the information reviewed by the Commission during Phase 1 was high level and not necessarily aligned with the scope of the Complex being anticipated, the Phase 2 efforts will require much more detailed reviews. We thank the Mayor and HCCVB for the opportunity to provide our recommendation and look forward participating in Phase 2 activities as the City and HCCVB determines appropriate.

Family Sports Capital
Addendum
to the Westfield Washington Township Comprehensive Plan
August 2009
Indiana 1834 “Old Town Charm, New City Style”

Executive Summary
Introduction
This addendum (the “Addendum”) to the Westfield-Washington Township Comprehensive Plan (the
“Comprehensive Plan”) is designed to support and facilitate implementation of the recommendations of the
Westfield Sports Complex Commission (the “Sports Commission”). The Commission was appointed by Mayor J.
Andrew Cook for the purpose of exploring the viability of a regional/national intergenerational sports facility
within the City of Westfield. To the extent that the policies and recommendations set forth in this Addendum
conflicts with the recommendations of the Westfield-Washington Township Comprehensive Plan, this
Addendum shall supersede the Comprehensive Plan.
Goals
The Sports Commission, in its report to the Mayor titled “Westfield Family Sports Complex, Phase 1
Report”, July 24, 2009 (the “Report”), identifies the following goals for the Westfield community
Provide intergenerational health, recreation and sporting opportunities within the City of
Westfield (the “City”) and provide facilities for state, regional and national tournaments;
Cooperate with the Hamilton County Convention and Visitor’s Bureau (“HCCVB”) to make Westfield the “Family Sports Capital of America” – a regional and national destination for sporting events and tournaments for all ages; and
Pursue economic development opportunities to capitalize on Westfield’s already-developing intergenerational sports niche. Examples include: (1) multiple championship quality sports facilities; (2) complementary health, recreation and technology related land uses; (3) supporting entertainment, dining and lodging land uses; and (4) other uses which would support and compliment the Westfield intergenerational sports initiative.
Conclusions of Sports Commission
As the Sports Commission concludes in its Report, creation and development of a family sports complex (the “Complex”) is a viable endeavor for the Westfield community. The Sports Commission recommends that the City of Westfield and HCCVB move forward with planning efforts for such facilities. The Sports Commission will be performing additional analyses as directed by the City to further this effort as well.

Sports Commission Findings
The City has a responsibility to provide appropriate facilities for Westfield youth and family sports. Currently, several youth sports are lacking adequate facilities, either because of growth or because currently utilized facilities may not be available in the long term. The City should consider collaborating with these youth programs to provide needed facilities.
There is a market demand for championship level facilities to host amateur tournaments and championships and the Complex can serve as a family sports destination. These tournaments and related revenue can help the City and Hamilton County to fund youth sports in the community. If done in a fiscally responsible way, the City has an opportunity to turn what is traditionally regarded as a fixed City cost (youth sports facilities) into a revenue-generating economic development initiative.
The City’s central geographic location (accessibility by visitors), availability of land and existing athletics and sports focus complement the City’s intergenerational sports concept. This concept aligns well with the economic development goals and objectives of the City.
The City could generate additional revenue to fund the Complex if it cooperates with professional or semi-professional sports teams. The City should evaluate whether any additional costs required to host such professional teams would be offset by additional revenues that would be generated from such an investment.
The Sports Capital of America Vision
The City wishes to provide for the development of a regional/national championship quality sports facility within the Westfield community with and intergenerational focus. As a result, the City desires to amend its comprehensive plan to include guidance, as included below, when considering possible locations for the Complex and proposals for the development of Complex components.
The Complex should be designed to at least support Westfield youth and family sports.
The Complex should be designed to accommodate at least the following: (1) field sports (including, but not limited to, soccer, lacrosse and rugby); (2) baseball; and (3) and indoor winter sports facility (including, but not limited to, basketball, volleyball and gymnastics).
The Complex likely may include facilities to support the hosting of championship level youth and amateur sports tournaments. Championship tournament facilities for the sport segments listed in the paragraph above are contemplated and encouraged, but not required.
Facilities to accommodate professional or semi-professional sports teams are also contemplated in the City’s long-term vision for the Complex and such proposals would be positively received if determined to be fiscally viable by the City.

It is contemplated that the Complex will ultimately consist of and include at least two hundred (200) acres of land and that it would not likely exceed a land area more than five hundred (500) acres in size initially.
The site should be located in a manner that provides direct access or close proximity to a Primary Arterial as defined in the Westfield-Washington Township Thoroughfare Plan.
In addition to the sports-related uses within the Complex, it is anticipated that other related and supporting land uses will be located within, adjacent to and nearby the Complex. Such land uses will likely include hotels, restaurants, healthcare and sports medicine facilities, professional offices, retail uses, higher density residential uses and other supporting commercial uses. It is contemplated that such other uses will be proposed and approved either in conjunction with the Complex or after development of the Complex has been initiated. The total additional land area to be utilized for such purposes is expected to exceed the size of the Complex and may likely include a land area many times the size of the Complex.


WESTFIELD FAMILY SPORTS CENTER
Westfield, Indiana
Economic Impact Analysis
TABLE OF CONTENTS
SUMMARY OF REPORT
REPORT METHODOLOGY
EXHIBIT A
EXHIBIT B
EXHIBITC
EXHIBIT 0
EXHIBITE
EXHIBIT F
EXHIBITG
APPENDIX A
APPENDIXB
APPENDIXC
Summary of Diamond Sports
Summary of Field Sports
Summary of All Sports (Total Visits)
Summary of Estimated Sports Visits (Direct Impact)
Summary of Estimated Total Direct and Indirect Impact
Summary of Estimated Annual Increase in Tax Revenue
Assumptions
Additional Analysis of Aurora Proposal
Additional Analysis of Estridge Proposal
Additional Analysis of Henke-Wilfong Proposal
1
2
4
7
8
9
10

WESTFIELD FAMILY SPORTS CENTER
Westfield, Indiana
SUMMARY OF REPORT
The City of Westfield (the "City") finds itself seeking to take the next step in thegoal of developing family sports facilities in the City. In our original 2008 report,where we had set out multiple tasks which the City needs to undertake in order tobecome the family sports capitol of the U.s., one task was the calculation of theeconomic impact of this type of facility. This report serves to set out that process.Currently, the City finds itself with three very good proposals for the development ofthe potential sports areas. Based upon the assumptions contained in our Report, wecalculate an estimated total annual economic impact of $27,861,023 for the proposedsports facility. In addition to the base facility, we estimate an additional annualeconomic impact, between $5,830,870 and $8,231,816, depending on which proposal isselected.
REPORT METHODOLOGY
The first proposal, by the Estridge Group, sets forth a site bordered by 146\h Street& Ditch Road. The second proposal has been developed and put together by theAurora Group. This site is generally bounded by 196th Street & Blank Road. The third& final proposal was presented by the Henke-Wilfong Group. This site is generallybounded by State Rd. 31 & Blank Road. The author of this report has toured each site,is generally aware of the site topography and is not considering any of the geographiclocations in our analysis. The purpose of this report is to analyze the economicdevelopment impacting the City and/ or Hamilton County.
The main portion of the report is based on the construction of a $15,000,000 youthsports facility including the following:
Field Sports
8 Turf Fields
24 Grass Fields
32 Total Fields
Diamond Sports
16 Total Fields
Diamond Sports is assumed to cover baseball, softball and similar activities.Field Sports is assumed to cover such activities as soccer, lacrosse, rugby, football andother similar sports.
One of the major assumptions in this report is the estimated annual usage of thefacility. The estimated annual number of visitors and type of visitors is based uponinformation received from the current Westfield youth sports organizations and otherinterested parties.

WESTFIELD FAMILY SPORTS CENTER
Westfield, Indiana
The two sports divisions known as Diamond Sports and Field Sports are analyzedon a visitor basis, based on 3 characteristic classifications. The characteristicclassifications will be segmented by the assumption of where the visitor will originatefrom.
The first segment will generally be described as the "home team", or Westfieldresidents. These visitors will come and go to the facilities on a more frequent basis,and are expected to consume very little additional services in and around the facility.
The second segment is considered to be visitors from the area. That area willencompass the metropolitan area and possible surrounding counties.
The third segmented group will be based on visitors whom are outside the area;therefore, they will be labeled as "outside the area" and are expected to consume afairly substantial amount of services in and around the facilities.
Based upon our discussions with potential users of the facility, and our work onother similar projects, we have prepared estimates of the potential number of annualvisitors to the proposed facility. We have also made assumptions regarding theorigination of the visitors, as discussed above. Based upon the estimated number ofvisitors, we have developed models to estimate the potential economic impact andtax revenue that could be generated by the proposed project.
There are a significant number of assumptions in this type of calculation, including:
•
•
•
•
•
The origin of visitors to events at the facility;
Spending, per visitor, on items inside and outside the facility, including food and beverage,hotel, transportation, retail and other items;
Payroll of employees at the facility and the amount that flows back into the community;
Demand for hotel rooms created by events at the facility; and
Increases in real and personal property assessed value at the facility and the surrounding area,needed to support demand created by the visitors to the facility.

WESTFIELD FAMILY SPORTS CENTER
Westfield, Indiana
In addition to the estimated direct spending, we have also estimated the following additionalimpacts:
Indirect - Indirect impact is the ripple effect that direct spending has on the local economy. A portionof a visitor's purchase, at a restaurant or retail store, will flow back into the local economy to purchaseother goods and services.
Induced - Induced impact is based upon the additional expenditures created by employees whoreceive additional income due to direct and indirect spending.
Tax Revenue Impact - We have estimated the potential increase in local tax revenue that could begenerated from the proposed project, including innkeeper's tax, food and beverage tax, county incometax and property tax.

WESTFIELD FAMILY SPORTS CENTER
Westfield, Indiana
Summary of Diamond Sports
Baseball Visits Number TotalHome Team (A) Participants per Week of Weeks Visits
(1) 638 3 12 22,968(2) 55 3 12 1,980(3) 24 2 12 576
Visits Number TotalVisitors (B) Participants per Week of Weeks Visits
(1) 55 3 4 660(2) 400 4 10 16,000(3)
Visits Number TotalOutside the Area (C) Participants per Week of Weeks Visits
(1) 88 3 4 1,056(2) 400 4 10 16,000(3)
Softball Visits Number TotalHome Team (A) Participants per Week of Weeks Visits
(1) 235 3 12 8,460(2) 33 3.0 12 1,188(3)
Visits Number TotalVisitors (B) Participants per Week of Weeks Visits
(1) 33 1 4 132(2) 400 4 5 8,000(3)
Visits Number TotalOutside the Area (C) Participants per Week of Weeks Visits
(1) 88 3 4 1,056(2) 400 4 5 8,000(3)
-1-
EXHIBIT A
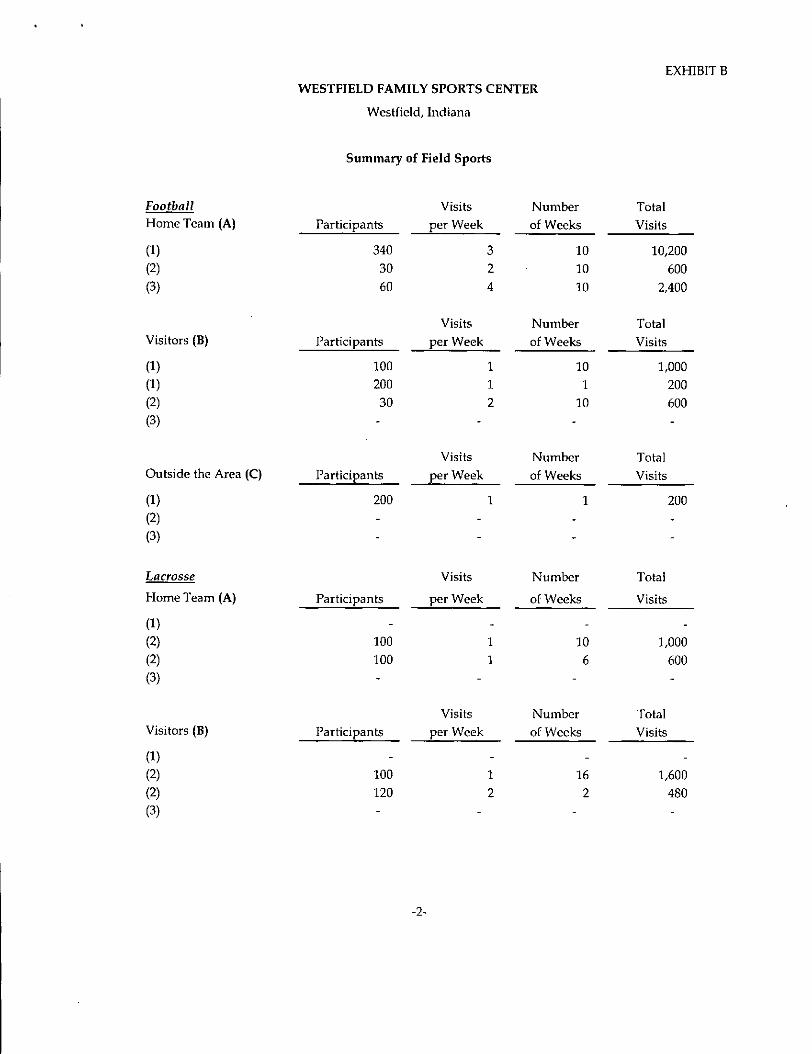
EXHIBITBWESTFIELD FAMILY SPORTS CENTER
Westfield, Indiana
Summary of Field Sports
Football Visits Number TotalHome Team (A) Participants per Week of Weeks Visils
(1) 340 3 10 10,200(2) 30 2 10 600(3) 60 4 10 2,400
Visits Number TotalVisitors (B) Participants per Week of Weeks Visits
(1) 100 1 10 1,000(1) 200 1 1 200(2) 30 2 10 600(3)
Visits Number TotalOulside the Area (C) Participants per Week of Weeks Visits
(1) 200 1 1 200(2)(3)
Lacrosse Visits Number Tolal
Home Team (A) Participants per Week of Weeks Visits
(1)(2) 100 1 10 1,000(2) 100 1 6 600(3)
Visits Number TolalVisilors (B) Participants per Week of Weeks Visits
(1)(2) 100 1 16 1,600(2) 120 2 2 480(3)
-2-
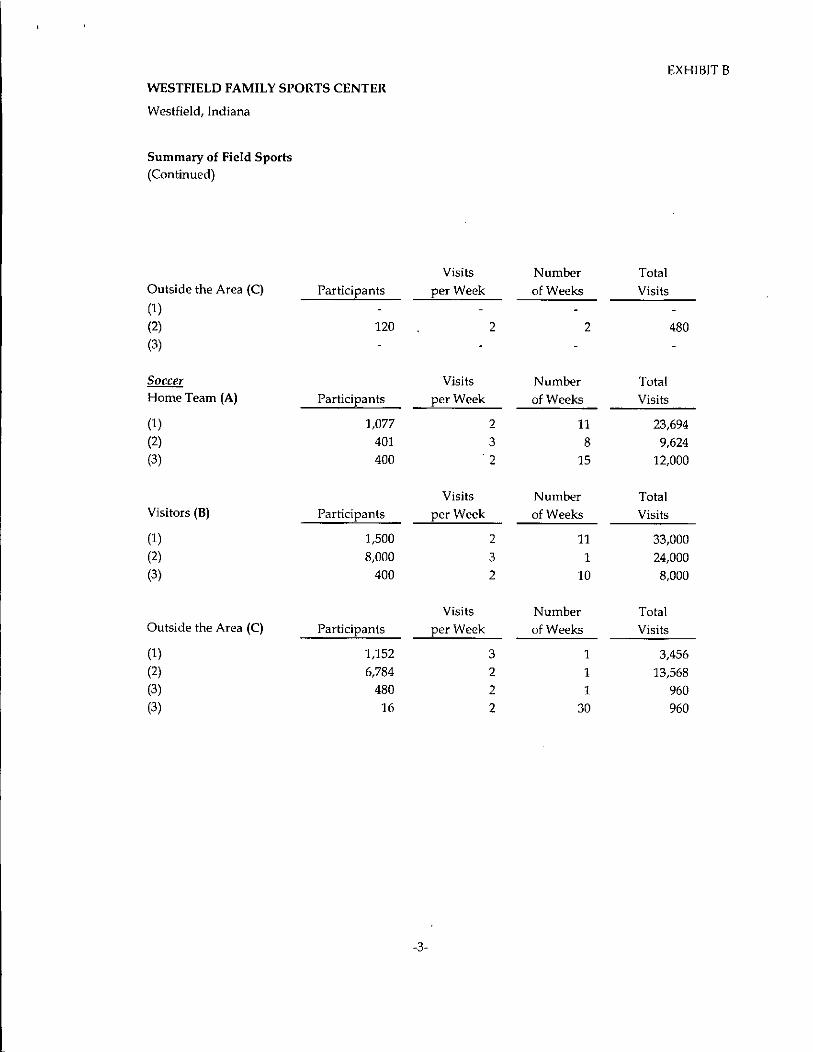
WESTFIELD FAMILY SPORTS CENTER
Westfield, Indiana
Summary of Field Sports(Continued)
EXHIBIT B
Visits Number TotalOutside the Area (C) Participants per Week of Weeks Visits(1)(2) 120 2 2 480(3)
Soccer Visits Number TotalHome Team (A) Participants per Week of Weeks Visits
(1) 1,077 2 11 23,694(2) 401 3 8 9,624(3) 400 2 15 12,000
Visits Number TotalVisitors (B) Participants per Week of Weeks Visits
(1) 1,500 2 11 33,000(2) 8,000 3 1 24,000(3) 400 2 10 8,000
Visits Number Tota!Outside the Area (C) Participants per Week of Weeks Visits
(1) 1,152 3 1 3,456(2) 6,784 2 1 13,568(3) 480 2 1 960(3) 16 2 30 960
-3-

WESTFIELD FAMILY SPORTS CENTERWestfield, Indiana
Summary of All Sports (Total Visits)
TotalBaseball Visits
Home Team(1) 22,968(2) 1,980(3) 576
Visitors(1) 660(2) 16,000(3)
Outside the Area(1) 1,056(2) 16,000(3)
TotalSoftball Visits
Home Team(1) 8,460(2) 1,188(3)
Visitors(1) 132(2) 8,000(3)
Outside the Area(1) 1,056(2) 8,000(3)
-4-
EXHIBITC

WESTFIELD FAMILY SPORTS CENTERWestfield, Indiana
Summary of All Sports (Total Visits)(Continued)
FootbaJl
Home Team(1)(2)(3)
Visitors(1)(1)(2)(3)
Outside the Area(1)(2)(3)
Lacrosse
Home Team(1)
(2)(2)(3)
Visitors(1)(2)(2)(3)
Outside the Area(1)(2)(3)
-5-
TotalVisits
10,2006002,400
1,000200600
200
TotalVisits
1,000600
1,600480
480
EXHIBITC

WESTFIELD FAMILY SPORTS CENTERWestfield, Indiana
Summary of All Sports (Total Visits)(Continued)
TotalSoccer Visits
Home Team(1) 23,694(2) 9,624(3) 12,000
Visitors(1) 33,000(2) 24,000(3) 8,000
Outside the Area(1) 3,456(2) 13,568(3) 960(3) 960
TotalGrand Total Visits
Home Team(1) 65,322(2) 14,992(3) 14,976
Visitors(1) 34,992(2) 50,680(3) 8,000
Outside the Area(1) 5,768(2) 38,048(3) 1,920
EXHIBITC
Grand Total
-6-
234,698

;:0,'-••
EXHIBIT 0
WESTFIELD FAMILY SPORTS CENTER
Westfield, Indiana
Summary of Estimated Sports Visits (Direct Impact)
Total Impact EstimatedType of Visit Visits per Visit Annual Impact
(A) 95,290 $ 32.16 $ 3,064,361(B) 93,672 66.28 6,208,177(C) 45,736 149.36 6,831,169
Total 234,698 $ 16,103,707
(A) Local visits; We have assumed a $32.16 impact per visit.(B) Visitors from the surrounding counties; We have assumed a $66.28 impact per visit.(C) Visitors from outside the surrounding area; We have assumed a $149.36 impact per visit.
Note: Estimated impact per visit based upon Certec Inc. report on tourism impactin Hamilton County, as adjusted for inflation to 2010 dollars.
-7-

~. lC,,@.ih . "'If:-.-, - -
WESTFIELD FAMILY SPORTS CENTER
Westfield, Indiana
Summary of Estimated Total Direct and Indirect Impact
Economic Impact - Annual
EXHIBIT E
Estimated Direct SpendingEstimated Indirect SpendingEstimated Induced Spending
Total Estimated Annual Economic Impact
Economic Impact - One Time Construction
Estimated Direct SpendingEstimated Indirect SpendingEstimated Induced Spending
Total Est. One Time Canst. Econ. Impact
-8-
$ 16,103,7076,995,4504,761,866
$ 27,861,023
$ 15,000,0007,302,0004,435,500
$ 26,737,500

WESTFIELD FAMILY SPORTS CENTER
Westfield, Indiana
Summary of Estimated Annual Increase in Tax Revenue
Type of Revenue Pessimistic Optimistic
Incremental Food and Beverage Tax $ 48,311 $ 80,519Incremental Innkeeper's Tax 32,207 48,311Incremental County Income Tax 111,583 122,742Incremental State Income Tax (1) 379,384 417,322Incremental State Sales Tax (1) 225,452 338,178Property Tax (2) 259,224
Totals $ 796,937 $ 1,266,295
Estimated tax revenue is based upon current tax rates, as follows:
1% Hamilton County Food & Beverage Tax and 1% Westfield Food & Beverage Tax5% Hamilton County Innkeeper's Tax1% Hamilton County Income Tax (Westfield's historical portion is 5.2% of County Total)3.4% State lncome Tax7.0% State Sales Tax$2.4688 Westfield Total District Property Tax Rate
No "Ticket Tax" has been assumed in this analysis.
(1) Incremental State tax revenue could be captured and used for the project ifnew legislation is approved allowing a "Sport District" currently in effect inseveral Indiana cities.
(2) Pessimistic assumes the facility is exempt from property taxes. Optimisticassumes facility is taxable.
-9-
EXHIBITF

.,EXHIBITG
WESTFIELD FAMILY SPORTS CENTER
Westfield, Il)diana
Assumptions
Number of Visitors by Sport - developed with assistance with City representatives
Type of Visitors by Sport - developed with assistance with City representatives
Dollar Impact per Visit- from Certec report (2005 dollars) grossed up to 2010 for inflation
Estimated Annual Direct Spending = Number of Visits X Dollar Impact per Visit
Multipliers are based upon proprietary model usin~ other similar facilitiesIndirect Spending = .4344 of direct spending
Induced Spending = .2957 of direct spending
Food and Bevera~e Tax RevenuePessimistic -15% of total annual spending is for food and beverage itemsOptimistic - 25% of total annual spending is for food and beverage items
Innkeeper's Tax RevenuePessimistic - 4% of total annual spending is for hotel staysOptimistic - 6% of total annual spending is for hotel stays
County and State Income Tax RevenuePessimistic - .4005 of total annual spending is realized as additional taxable wagesOptimistic - .4406 of total annual spending is realized as additional taxable wages
State Sales Tax RevenuePessimistic - 20% of total annual spending is for sales tax applicable itemsOptimistic - 30% of total annual spending is for sales tax applicable items
Property Tax RevenuePessimistic - Entire Facility is not taxableOptimistic - 70% of $15,000,000 investment is taxable assessed value
-10-

I.-~'A20.A¥4
'.r;>-
WESTFIELD FAMILY SPORTS CENTER
Westfield, Indiana
APPENDIX A
Additional Analysis ofAurora Proposal
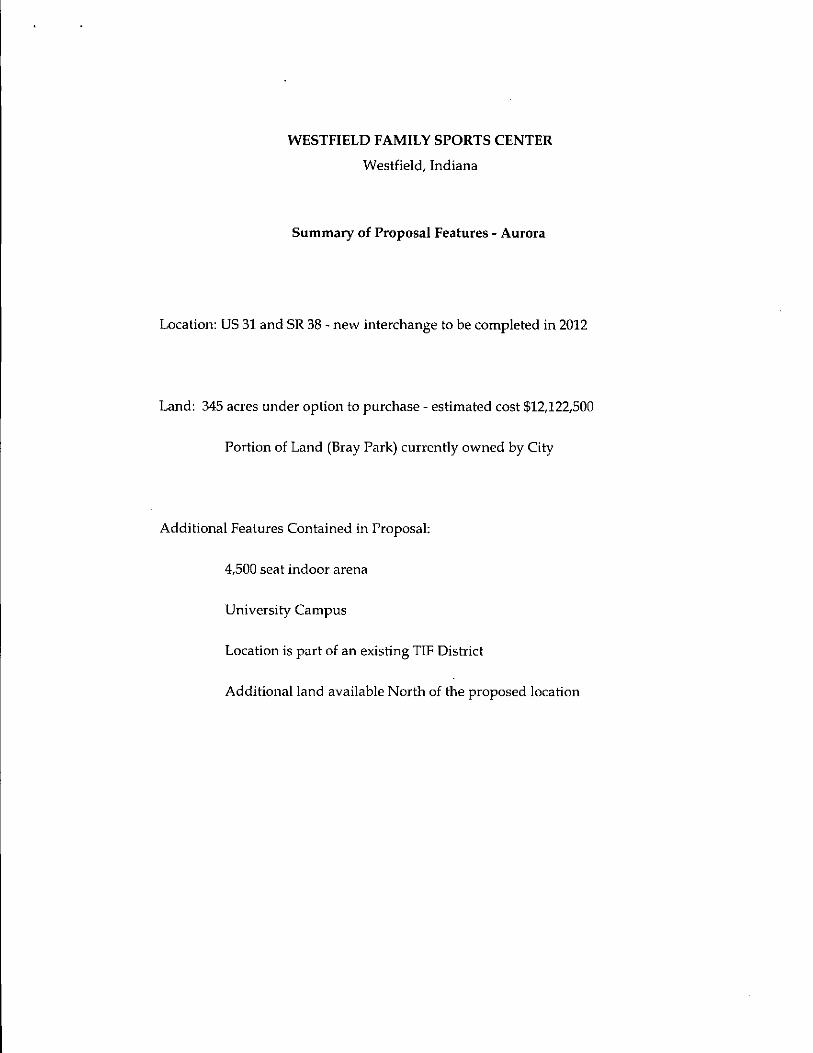
WESTFIELD FAMILY SPORTS CENTER
Westfield, Indiana
Summary of Proposal Features - Aurora
Location: US 31 and SR 38 • new interchange to be completed in 2012
Land: 345 acres under option to purchase - estimated cost $12,122,500
Portion of Land (Bray Park) currently owned by City
Additional Features Contained in Proposal:
4,500 seat indoor arena
University Campus
Location is part of an existing TIF District
Additional land available North of the proposed location
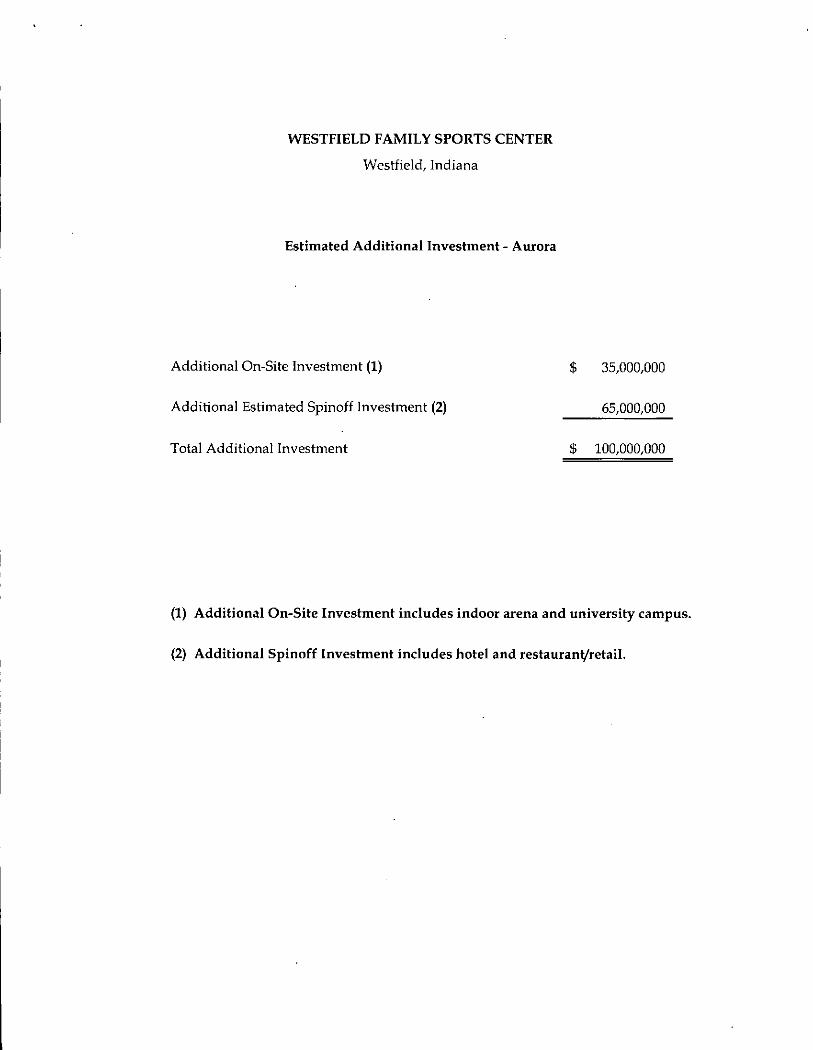
$
WESTFIELD FAMILY SPORTS CENTER
Westfield, Indiana
Estimated Additional Investment - Aurora
Additional On-Site Investment (1)
Additional Estimated Spinoff Investment (2)
Total Additional Investment
35,000,000
65,000,000
$ 100,000,000
(1) Additional On-Site Investment includes indoor arena and university campus.
(2) Additional Spinoff Investment includes hotel and restauranVretaiI.

WESTFIELD FAMILY SPORTS CENTER
Westfield, Indiana
Estimated Additional Economic Impact - Aurora
Estimated Direct SpendingEstimated Indirect SpendingEstimated Ind uced Spending
Total Estimated Additional Economic Impact
$
$
3,965,0001,722,3961,172,451
6,859,847
Estimated Economic Impact shown above is in addition to the mainyouth sports complex.

WESTFIELD FAMILY SPORTS CENTER
Westfield, Indiana
Estimated Additional Increase in Tax Revenue - Aurora
Type of Revenue Pessimistic Optimistic
Incremental Food and Beverage Tax $ 20,580 $ 34,299Incremental Innkeeper's Tax 34,299 51,449Incremental County Income Tax 27,474 30,221Property Tax (1) 864,080 1,728,160
Totals $ 946,432 $ 1,844,129
Estimated tax revenue is based upon current tax rales as follows:
1% Hamilton County Food and Beverage Tax and 1% Westfield Food and Beverage Tax5% Hamilton County Innkeeper's Tax1% Hamilton Counly Income Tax$2.4688 Westfield Tolal Dislrict Property Tax Rale
. (1) Pessimistic assumes a portion of the facility is exempl from property taxes. Optimisticassumes all additional investment is taxable.

WESTFIELD FAMILY SPORTS CENTER
Westfield, Indiana
Assumptions - Aurora
Estimated Investment Amounts based upon Review of Developer's ProposalAdditional On-Site Investment = $35,000,000Additional Spinoff Investment = $65,000,000
Estimated Annual Direct Spending = .03965 of estimated total investment
Multipliers are based upon Proprietary Model using Other Similar FacilitiesIndirect Spending = .4344 of direct spending
Induced Spending = .2957 of direct spending
Food and Beverage Tax RevenuePessimistic -15% of total annual spending is for food and beverage itemsOptimistic - 25% of total annual spending is for food and beverage items
Innkeeper's Tax RevenuePessimistic - 10% of total annual spending is for hotel staysOptimistic -15% of total annual spending is for hotel stays
Higher % of total spending related to hotel stays due to assumed construction of a new hotel
County Income Tax RevenuePessimistic - .4005 of total annual spending is realized as additional taxable wagesOptimistic - .4406 of total annual spending is realized as additional taxable wages
Property Tax RevenuePessimistic - 70% of $100,000,000 investment = assessed value, but 50% is not taxableOptimistic - 70% of $100,000,000 investment is taxable assessed value

WESTFIELD FAMILY SPORTS CENTER
Westfield, Indiana
APPENDIXB
Additional Analysis of Estridge Proposal

WESTFIELD FAMILY SPORTS CENTER
Westfield, Indiana
Summary of Proposal Features - Estridge
Location: Utilizes 2 sites - Symphony and Grand Junction
Land: 427 acres - Lowest land cost of all proposals
Majority of new development would be outside of City Center
Additional Features Contained in Proposal:
All Events Outdoor Stadium
Golf Gub and Academy
YMCA
Proposal states that there is no need for direct City funds or tax increases

WESTFIELD FAMILY SPORTS CENTER
Westfield, Indiana
Estimated Additional Investment - Estridge
Additional On-Site Investment (1)
Additional Estimated Spinoff Investment (2)
Total Additional Investment
$
$
25,000,000
60,000,000
85,000,000
(1) Additional On-Site Investment includes outdoor stadium, YMCA and golf course.
(2) Additional Spinoff Investment includes retail and mixed use developments.
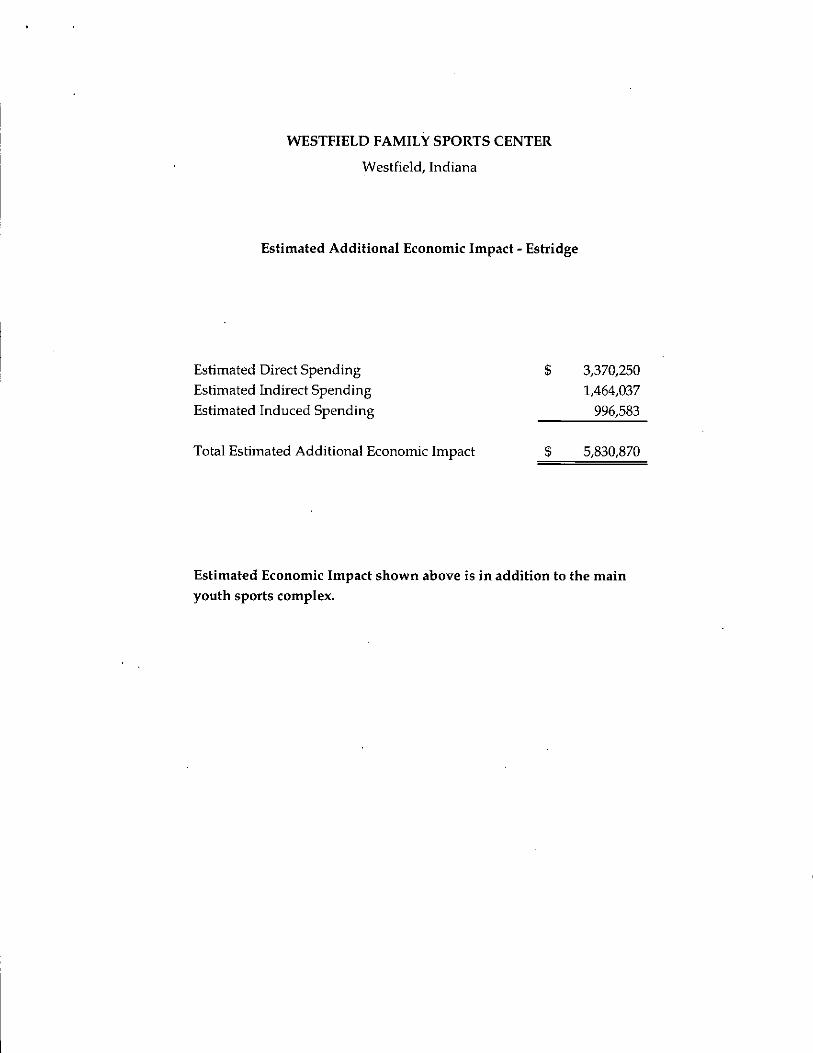
WESTFIELD FAMILY SPORTS CENTER
Westfield, Indiana
Estimated Additional Economic Impact - Estridge
Estimated Direct SpendingEstimated Indirect SpendingEstimated Induced Spending
Total Estimated Additional Economic Impact
$
$
3,370,2501,464,037996,583
5,830,870
Estimated Economic Impact shown above is in addition to the mainyouth sports complex.
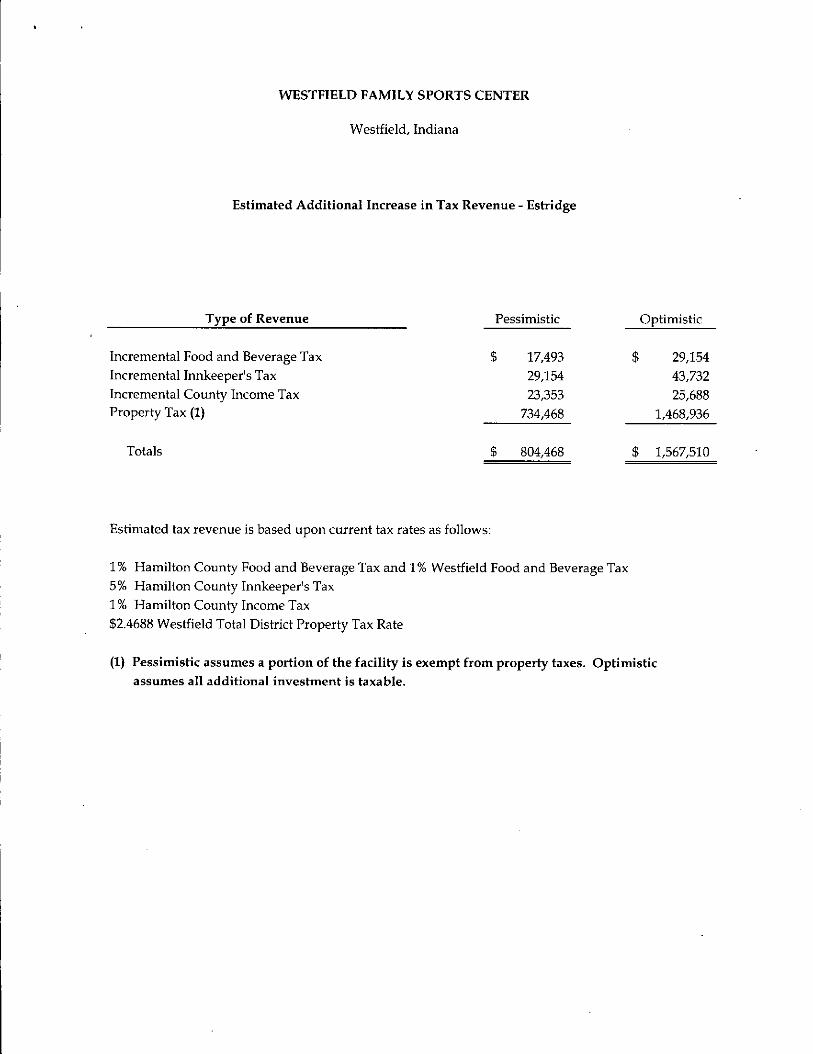
WESTFIELD FAMILY SPORTS CENTER
Westfield, Indiana
Estimated Additional Increase in Tax Revenue - Estridge
Type of Revenue Pessimistic Optimistic
Incremental Food and Beverage Tax $ 17,493 $ 29,154Incremental Innkeeper's Tax 29,154 43,732Incremental County Income Tax 23,353 25,688Property Tax (1) 734,468 1,468,936
Totals $ 804,468 $ 1,567,510
Estimated tax revenue is based upon current tax rates as follows:
1% Hamilton County Food and Beverage Tax and 1% Westfield Food and Beverage Tax5% Hamilton County Innkeeper's Tax1% Hamilton County Income Tax$2.4688 Westfield Total District Property Tax Rate
(1) Pessimistic assumes a portion of the facility is exempt from property taxes. Optimisticassumes all additional investment is taxable.

WESTFIELD FAMILY SPORTS CENTER
Westfield, Indiana
Assumptions - Estridge
Estimated Investment Amounts based upon Review of Developer's ProposalAdditional On-Site Investment = $25,000,000Additional Spinoff Investment = $60,000,000
Estimated Annual Direct Spending = .03965 of estimated total investment
Multipliers are based upon proprietary model using other Similar FacilitiesIndirect Spending = .4344 of direct spending
Induced Spending = .2957 of direct spending
Food and Beverage Tax RevenuePessimistic -15% of total annual spending is for food and beverage itemsOptimistic - 25% of total annual spending is for food and beverage items
Innkeeper's Tax RevenuePessimistic - 10% of total annual spending .is for hotel staysOptimistic - 15% of total annual spending is for hotel stays
Higher % of total spending related to hotel stays due to assumed construction of a new hotel
County Income Tax RevenuePessimistic - .4005 of total annual spending is realized as additional taxable wagesOptimistic - .4406 of total annual spending is realized as additional taxable wages
Property Tax RevenuePessimistic - 70% of $85,000,000 investment = assessed value, but 50% is not taxableOptimistic - 70% of $85,000,000 investment is taxable assessed value

WESTFIELD FAMILY SPORTS CENTER
Westfield, Indiana
APPENDIXC
Additional Analysis of Henke-Wilfong Proposal

WESTFIELD FAMILY SPORTS CENTER
Westfield, Indiana
Summary of Proposal Features - Henke-Wilfong
Location: US 31 and SR 32
Land: 465 acres - most expensive cost of land
Development is closest to downtown and integrates into the currentinfrastructure better than other proposals
Located on Monon Trail
Additional Features Contained in Proposal:
Ice Rink
YMCA
Outdoor Stadium

WESTFIELD FAMILY SPORTS CENTER
Westfield, Indiana
Estimated Additional Investment - Henke-Wilfong
Additional On-Site Investment (1)
Additional Estimated Spinoff Investment (2)
Total Additional Investment
$ 35,000,000
85,000,000
$ 120,000,000
(1) Additional On-Site Investment includes outdoor stadium, YMCA and ice rink.
(2) Additional Spinoff Investment includes retail, hotel, medical and officebuildings.

WESTFIELD FAMILY SPORTS CENTER
Westfield, Indiana
Estimated Additional Economic Impact - Henke-Wilfong
Estimated Direct SpendingEstimated Indirect SpendingEstimated Induced Spending
Total Estimated Additional Economic Impact
$
$
4,758,0002,066,8751,406,941
8,231,816
Estimated Economic Impact shown above is in addition to the mainyouth sports complex.

WESTFIELD FAMILY SPORTS CENTER
Westfield, Indiana
Estimated Additional Increase in Tax Revenue - Henke-Wilfong
Type of Revenue Pessimistic Optimistic
Incremental Food and Beverage Tax $ 24,695 $ 41,159Incremental Innkeeper's Tax 41,159 61,739Incremental County Income Tax 32,968 36,265Property Tax (1) 1,036,896 2,073,792
Totals $ 1,135,719 $ 2,212,955
Estimated tax revenue is based upon current tax rates as follows:
1% Hamilton County Food and Beverage Tax and 1% Westfield Food and Beverage Tax5% Hamilton County Innkeeper's Tax1% Hamilton County Income Tax$2.4688 Westfield Total District Property Tax Rate
(1) Pessimistic assumes a portion of the facility is exempt from property taxes. Optimisticassumes all additional investment is taxable.
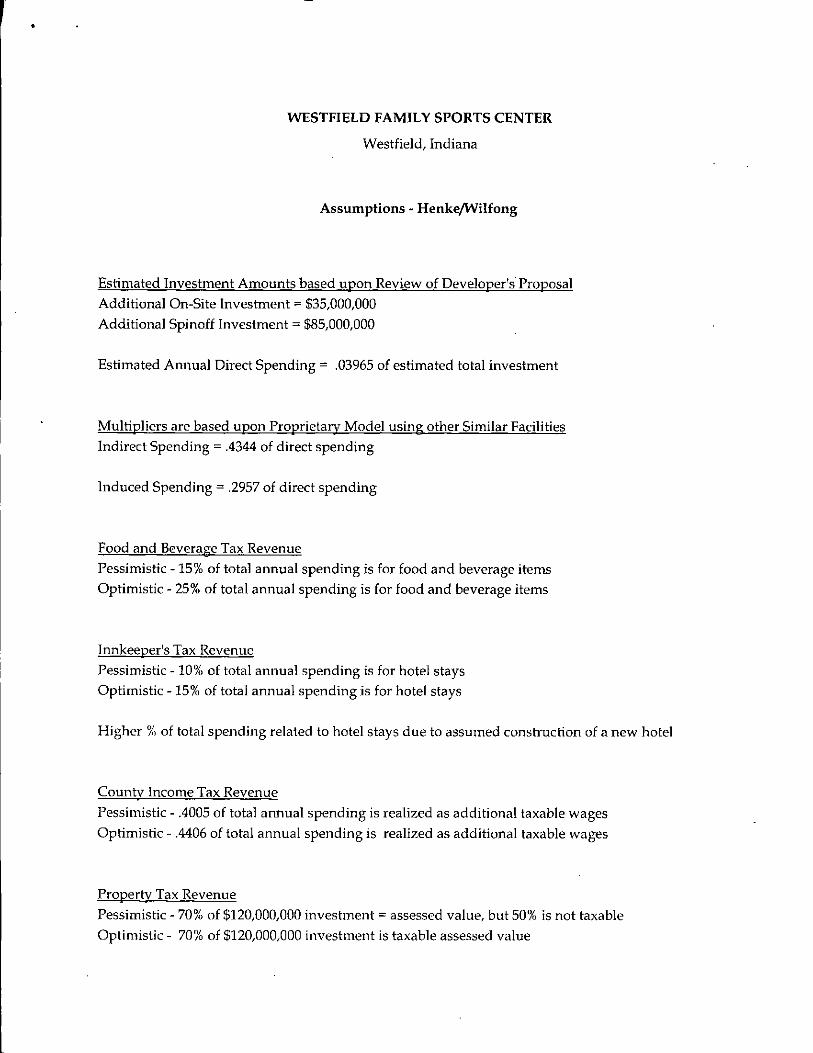
•
WESTFIELD FAMILY SPORTS CENTER
Westfield, Indiana
Assumptions - HenkejWilfong
Estimated Investment Amounts based upon Review of Developer's' ProposalAdditional On-Site Investment = $35,000,000Additional Spinoff Investment = $85,000,000
Estimated Annual Direct Spending = .03965 of estimated total investment
Multipliers are based upon Proprietary Model using other Similar FacilitiesIndirect Spending = .4344 of direct spending
Induced Spending = .2957 of direct spending
Food and Beverage Tax RevenuePessimistic - 15% of total annual spending is for food and beverage itemsOptimistic - 25% of total annual spending is for food and beverage items
Innkeeper's Tax RevenuePessimistic - 10% of total annual spending is for hotel staysOptimistic -15% of total annual spending is for hotel stays
Higher % of total spending related to hotel stays due to assumed construction of a new hotel
County Income Tax RevenuePessimistic - 04005 of total annual spending is realized as additional taxable wagesOptimistic - .4406 of total annual spending is realized as additional taxable wages
Property Tax RevenuePessimistic - 70% of $120,000,000 investment = assessed value, but 50% is not taxableOptimistic - 70% of $120,000,000 investment is taxable assessed value

Westfield Family Sports Complex
Phase II Executive Summary
September 28, 2010
\Çw|tÇt DKFG
“Old Town Charm, New City Style”
130 Penn Street • Westfield, IN 46074 • (317) 804-3000 • Fax (317) 804-3010 •
Website: www.westfield.in.gov
\Çw|tÇt DKFG
“Old Town Charm, New City Style”
Page 2 130 Penn Street • Westfield, IN 46074 • (317) 804-3000 • Fax (317) 804-3010 •
Website: www.westfield.in.gov
September 28, 2010 The Honorable Andy Cook Mayor 130 Penn Street Westfield, IN 46074 Dear Mr. Mayor, Enclosed is the executive summary report for Phase II from the Westfield Family Sports Commission (Commission). Thank you for allowing this Commission to continue to provide you and the City of Westfield (City) with information and our recommendations for the City’s consideration of a Family Sports Campus (Campus). Hopefully you find this report, and specifically our recommendations, beneficial in your final decision to move forward into the next phase of this initiative. The Commission recognizes the Campus represents an exciting opportunity for the City.
The Westfield Family Sports Commission cc: Mark Anderson, Commission Member Mike Deck, Commission Member John Dippel, Commission Member Dr. Mark Keen, Commission Member William Knox, Commission Member Karen Radcliff, Commission Member Steve Warner, Commission Member Nick Verhoff, Commission Member Dave Schmitz, Commission Member Chris Stice, Commission Member Melody Jones, Commission Member Matt Skelton, Commission Member Jennifer Miller, Commission Member Kevin Teder, Commission Chairman

\Çw|tÇt DKFG
“Old Town Charm, New City Style”
Page 3 130 Penn Street • Westfield, IN 46074 • (317) 804-3000 • Fax (317) 804-3010 •
Website: www.westfield.in.gov
Background The Commission formed certain subcommittees during Phase II. They included:
Location
Scope of Sports
Finance Each of the subcommittees was responsible for leading each of their respective areas. Each of the sections below summarized each subcommittee’s set of activities, related decisions and ‘deliverables’ from those committees.
Location Selection As part of the Commission’s Phase I findings, we recommended to the City that various locations be considered for the ultimate location of the Campus. We felt considering multiple locations would enable the best site to be selected, while creating a ‘competitive environment’ and enabling the City to negotiate favorable terms related to any site selected. Three developers submitted bids for site locations, including
Estridge – Symphony – a residential and commercial development northwest of 146th and Springmill Road
Chris White – Aurora – a residential and commercial development east of Highway 31 and south of Highway 38.
Steve Henke/Beau Wilfong – a primarily commercial development which originated specifically because of the Campus, west of Highway 31 and north of Highway 32.
The Location Subcommittee received proposals and listened to oral presentations from each developer. The subcommittee developed location criteria (attached to this report) that were used to evaluate each developer’s proposal. This criteria included various components of economic development criteria, access, suitability for the contemplated sports, ability to leverage existing City resources/investments and proximity to other locations/attractions favorable to the success or marketability of the campus. The subcommittee also leveraged a very extensive model prepared by the City which compared the economic development potential for each of the three sites. There was a significant exchange of information and Q&A between the subcommittee and developers to ensure all questions and considerations were addressed. During the process, Estridge requested their site be excluded from consideration.

\Çw|tÇt DKFG
“Old Town Charm, New City Style”
Page 4 130 Penn Street • Westfield, IN 46074 • (317) 804-3000 • Fax (317) 804-3010 •
Website: www.westfield.in.gov
The subcommittee has recommended the Steve Henke/Beau Wilfong as the site location for the Campus. We have attached a summary of the analysis done between the two remaining sites, using the location criteria. The decision by the subcommittee was unanimous. The subcommittee was comprised of the following members:
Karen Radcliff John Dipple Matt Skelton Jennifer Miller Mike Deck Melody Jones Dr. Keen Kevin Teder
Scope of Sports The scope of sports subcommittee determined what sports should be contemplated in the site based upon demand, mission, stakeholders, cost, and leverage of facilities across multiple sports, etc. The following sports and infrastructure were agreed to by the subcommittee:
Field Sports: o including soccer, football, lacrosse, rugby and field hockey. These sports were
specifically identified as they sports in demand by Westfield youth and tournament organizers and could leverage the same fields (if properly constructed).
o 32 total fields have been contemplated: 8 turf and 32 natural grass o The 8 turf fields and 6 of the grass fields would likely have lighting o These fields would likely comprise 145 acres
Diamond Sports: o 16 diamonds in total – all likely natural grass o The diamonds would be of different sizes (and be configurable to some degree)
to accommodate the smallest of youth through high school for both baseball and softball
o All 16 fields would likely including lighting o These diamonds would likely comprise 35 acres
Indoor Training Facility

\Çw|tÇt DKFG
“Old Town Charm, New City Style”
Page 5 130 Penn Street • Westfield, IN 46074 • (317) 804-3000 • Fax (317) 804-3010 •
Website: www.westfield.in.gov
o Used for all field and diamond sports for year‐round training – predominately by soccer, baseball and soccer league and travel teams, along with personal training and use.
o Approximately 50,000‐60,000 sq. ft. The scope of sports also contemplated facilities for tennis, as well as a larger indoor facility for basketball, volleyball, gymnastics and other indoor sports. These facilities were not anticipated as part of phase I development due to a combination of cost, demand and mission. The facility also contemplates 40‐50 acres of common area and amenities and growth/expansion of 50 acres. In total, approximately 300 acres are anticipated for the campus. The scope of sports group included:
William Knox
Dave Schmitz
Mark Anderson
Financial Viability The finance subcommittee has put together a summary set of financial projections for the campus. See attached. The financial projections include the following:
Balance Sheet
Various Detail Schedules for Balance Sheet Items
Debt/Interest Schedule
Income Statement
Various Detail Schedules for Income Statement Items A total of 17 schedules and statements Revenue/Funding items include the following:
Revenue from leagues and tournaments
Revenue from indoor training
Contributions/corporate sponsorships (One‐time capital campaign and ongoing)
Private party renting of the facility
Cash flow from property tax associated with Net AV increases Expenses/Uses of Funds include the following:

\Çw|tÇt DKFG
“Old Town Charm, New City Style”
Page 6 130 Penn Street • Westfield, IN 46074 • (317) 804-3000 • Fax (317) 804-3010 •
Website: www.westfield.in.gov
Maintenance costs for fields, diamonds, indoor and other common areas
General and administrative
Land Rent
Replacement reserve for repairs/maintenance/improvements
Other facility costs
Interest and debt repayment The summary projections show a positive cash flow beginning in year 3. Revenue from the facility should support payment of all annual operating costs, showing a positive cash flow on an annual basis beginning in year 3. Debt and interest repayments would be made through property tax cash flow resulting from economic development. Overall, positive cash flow after all funds/uses of cash results in Year 5‐6. Please see attachment for more details regarding the financial projections. In summary, the commission has determined the campus to be a financially viable initiative the City should seriously consider The finance subcommittee included:
Steve Warner Nick Verhoff John Dipple Kevin Teder Dave Schmitz

Westfield Sports Complex – Location Criteria Note the below criteria will be used to evaluate the sport criteria for the entire “Project” which would include not only the sports complex itself, but the surrounding area which would provide the business and commercial ancillary uses that we hope to attract near the sports complex.
Land Use and Planning Considerations 1. The extent of contiguity to existing urbanized areas (this supports the traditional “good
planning” notions of orderly and efficient development patterns; more contiguity is better).
2. The degree to which the Project is consistent with the future land use plan included in
the comprehensive plan (several of the City’s infrastructure systems have been planned based on this land use plan; more consistency with the future land use plan should reduce the waste of public resources and reduce the level of community concern with the Project’s proposed land uses).
3. The level of opportunity for good vehicular accessibility (both external to the Project and
within the Project; generally, the more accessibility the better).
4. The level of visibility from major thoroughfares, highways or streets (the more visibility the better; this will support economic sustainability of commercial and recreational uses within the Project).
5. The proximity of the Project to Westfield public investments (existing and planned) – e.g., water and sewer systems, appropriately designed/planned roads, pedestrian and bicycle trails, fiber optic systems, public amenity areas and parks, school locations and other significant public projects/investments (the closer the Project is to these types of existing and planned public facilities the more synergy there will be among the public investments and any future investments in the Project).
6. The extent to which the Project location is one that maximizes the City’s opportunity to capture the positive externalities that will be generated from the public and private investments in the Project (generally speaking, locations that are more centrally located within Washington Township, located within the corporate limits of Westfield – or readily annexable – would provide enhanced opportunities for capture). Access to the airport immediately west of Westfield should be considered.
7. The extent to which the Project location leaves room for future expansion as new Project growth needs to be accommodated.
8. The extent of opportunity for public benefit from the use of public finance tools (e.g., TIF districts, abatements, etc.).
9. The likelihood of success and likely timing for construction of a hotel/conference facility/hospitality and restaurant use (location needs to be commercially viable; the sooner the use is likely to be constructed the better).

Westfield Sports Complex – Location Criteria
10. The likelihood of success and likely timing for construction of supporting, sports, life science and and other medical uses (locations need to be commercially viable; the sooner the uses are likely to be constructed the better).
11. The extent to which the Project location creates a competitive real estate market environment within the Project (generally speaking, competition among developers and builders within the Project area is regarded as a positive condition for long-term success of the Project).
12. The location would be such that it could leverage other sports facilities in proximity to the considered location.
Cost, Need and Ease of Acquisition
1. Cost of land for the City. The cost of the land should not only include “out of pocket costs”, but also take into account the City’s ability to leverage various taxing authorities to offset the land cost
2. Ease of Acquisition. The ability of the City to acquire the land over a period of time that
aligns with the Project timeline. To the extent that multiple land owners/developers are involved, the ability to coordinate efforts in accordance with the timeline
3. Meets the needs of the project. The size and other aspects of the location would meet the needs of the scope of the project. Conversely, the amount of development or construction for one location vs. another location would need to be considered in the total cost calculation.
Developer / Owner Capabilities as Value Add
1. Certain or all of the locations will come with idea, proposals or offerings from developers or owners to distinguish one location from the others. These “Value Add” services or concepts should be considered in the overall determination of best location.

Family Sports Capital
Addendum II
to the Westfield – Washington Township Comprehensive Plan
December 2010

Introduction
This addendum (the “Addendum”) to the Westfield‐Washington Township Comprehensive Plan (the “Comprehensive Plan”) is designed to support and facilitate implementation of the recommendations of the Westfield Sports Commission (the “Sports Commission”). The Commission has extensively studied possible locations for a regional/national intergenerational sports facility within the City of Westfield. The Commission has completed its analysis and recommends the location identified in Exhibit A. To the extent that the policies and recommendations set forth in this Addendum conflict with the recommendations of the Comprehensive Plan, this Addendum shall supersede the Comprehensive Plan and previously adopted addenda.
The Family Sports Capital of America Vision
The City of Westfield (the “City”) wishes to provide for the development of a regional/national championship quality sports facility within the Westfield community with a multigenerational focus. As a result, the City desires to amend its comprehensive plan to include guidance, as included below, for the Sports Campus.
• The Sports Campus should be designed to at least support Westfield youth and family sports
• The Sports Campus should be designed to accommodate at least the following: (1) field sports (including, but not limited to, soccer, lacrosse and rugby); (2) diamond sports (including, but not limited to, baseball and softball); and (3) and indoor winter sports facility (including, but not limited to, basketball, volleyball and gymnastics).
• The Sports Campus should include facilities to support the hosting of championship level amateur sports tournaments.
• In addition to the sports‐related uses within the Sports Campus, it is anticipated that other related and supporting land uses will be located within, adjacent to and nearby the Sports Campus. Such land uses will likely include hotels, restaurants, healthcare and sports medicine facilities, professional offices, retail uses, higher density residential uses and other supporting commercial uses. It is contemplated that such other uses will be proposed and approved either in conjunction with the Sports Campus or after development of the Sports Campus has been initiated. The total additional land area to be utilized for such purposes will be many times the size of the Sports Campus as shown in Exhibit A attached hereto and made a part hereof. This area shall be referred to as the Family Sports Capital of America (the “Sports Capital”).
The Family Sports Capital of America Goals
The Sports Commission, in its report to the Mayor titled “Westfield Family Sports Complex, Phase I Report,” July 24, 2009 (the “Report I”), identifies the following goals for the Westfield community:

• Provide intergenerational health, recreation and sporting opportunities within the City and provide facilities for state, regional and national tournaments;
• Cooperate with the Hamilton County Convention and Visitor’s Bureau (the “HCCVB”) to make Westfield the “Family Sports Capital of America” – a regional and national destination for sporting events and tournaments for all ages; and
• Pursue economic development opportunities to capitalize on Westfield’s already‐developing intergenerational sports niche. Examples include: (1) multiple championship quality sports facilities; (2) complementary health, recreation and technology related land uses; (3) supporting entertainment, dining, lodging land uses; and (4) other uses which would support and compliment the Westfield intergenerational sports initiative.
Sports Commission Phase I Report
As the Sports Commission concludes in its Report I, creation and development of the Sports Campus is a viable endeavor for the City. The Sports Commission recommends that the City and HCCVB continue with planning efforts for such facilities. The Sports Commission plans to perform additional analyses as prompted by the City to further this effort as well.
Sports Commission Findings
• The City has a responsibility to provide appropriate facilities for Westfield youth and family sports. Currently, several youth sports are lacking adequate facilities, either because of growth or because currently utilized facilities may not be available in the long term. The City is collaborating with these youth programs to provide needed facilities.
• There is a market demand for championship level facilities to host amateur tournaments and championships and the Sports Campus can serve as a family sports destination. These tournaments and related revenue can help the City and Hamilton County fund youth sports in the community. If done in a fiscally responsible way, the City has an opportunity to turn what is traditionally regarded as a fixed City cost (youth sports facilities) into a revenue‐generating economic development initiative.
• The City’s central geographic location (accessibility by visitors), availability of land and existing athletics and sports focus complement the City’s multigenerational sports concept. This concept aligns well with the economic development goals and objectives of the City as well.

Sports Commission Phase II Report
The Sports Commission, in its report titled “Westfield Family Sports Complex, Phase II Report,” September 28, 2010 (the “Report II”), further defines the scope of initial sports to be offered at the Sports Campus, and identifies the Commission’s preferred location for the Sports Capital.
Sports Commission Findings
• The Scope of Sports Subcommittee of the Sports Commission determined that the sports to be initially offered within the Sports Campus should be selected based on demand, mission, stakeholders, cost and the ability of the Sports Campus to conduct multiple sports on fields designed to accommodate a variety of sport uses.
• The Sports Commission identified that the following field sports meet the requirements identified in the paragraph above soccer, football, lacrosse, rugby, field hockey, baseball, and softball; and, the following indoor training facility sports: all field and diamond sports with an emphasis on soccer, baseball and soccer league, travel and personal training use.
• The Location Subcommittee of the Sports Commission met with and exchanged information with developers several times during the Sports Capital siting process. The following primary criteria were used to identify the most appropriate location:
o Site Access; o Suitability for contemplated sports; o Proximity to other city investment; and o Potential for economic development.
• The Sports Commission has recommended, unanimously, that the area identified in Exhibit A should be selected for the Sports Capital. This area is generally described as the land south of 196th Street, east of Spring Mill Road, north of State Road 32 and west of US Highway 31
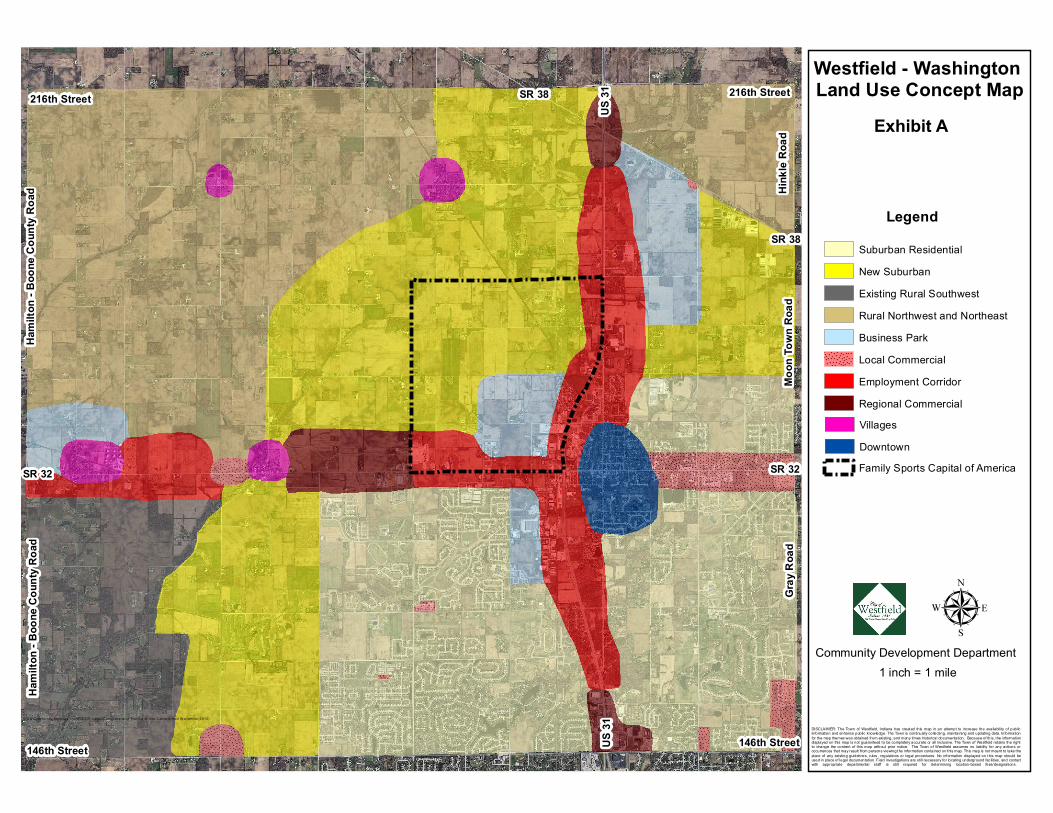
US 31
SR 38
SR 32SR 32
216th Street
Hami
lton -
Boo
ne C
ounty
Roa
d
146th Street146th Street
216th Street
Moon
Town
Roa
dGr
ay R
oad
SR 38
Hink
le Ro
ad
Hami
lton -
Boo
ne C
ounty
Roa
d
US 31
I:\CD \Com mu nity Se rvice s Sha re\GIS \Proje ct s\Com prehe nsive Plan \La nd Use Conce pt. mxd (No vem ber 2 01 0)
DISCLAIMER: The Town of Westfield, Indiana has created this map in an attempt to inc rease the availability of publicinformation and enhance public knowledge. The Town is continually collecting, maintaining and updat ing data. Informationfor the map themes was obtained from existing, and many times historical documentation. Because of this, the informationdisplayed on this map is not guaranteed to be completely accurate or all inclusive. The Town of Westfield retains the rightto change the content of this map without prior notice. The Town of Westfield assumes no liability for any actions oroccurrences that may result from persons viewing the information contained on this map. This map is not meant to take theplace of any existing guidelines, rules , regulat ions or legal procedures. No information displayed on this map should beused in place of legal documentation. Field investigations are still necessary for locat ing underground fac ilities, and contactwith appropriate departmental staff is still required for determining location-based fees/designations.
Legend
1 inch = 1 mile
µCommunity Development Department
Westfield - Washington Land Use Concept Map
Suburban ResidentialNew SuburbanExisting Rural Southwest
Business ParkLocal CommercialEmployment CorridorRegional CommercialVillagesDowntown
Rural Northwest and Northeast
Family Sports Capital of America
Exhibit A
Westfield Grand Park Sportsplex Feasibility and Business Plan Analysis
November 9, 2011

November 9, 2011 Mr. John Rogers City of Westfield 2728 E. 171st Westfield, IN 46074 Sent via Email to: [email protected] Dear Mr. Rogers:
The City of Westfield, Indiana (City) engaged Hunden Strategic Partners to conduct a study of the demand and financial performance of the proposed Grand Park sports complex over its first ten years of operation.
This report has been prepared under the following general assumptions and limiting conditions:
The findings presented herein reflect analysis of primary and secondary sources of information that are assumed to be correct. HSP utilized sources deemed to be reliable but cannot guarantee their accuracy.
The findings are highly dependent upon the performance of the primary tenants as it relates to annual contributions and generation of room nights. Any material change in the performance of tenants will result in a material change in the financial performance of the facility.
This report shall not be used for any other purpose other than the stated purpose.
We have enjoyed serving you on this engagement and look forward to providing you with continuing service.
Sincerely yours,
HUNDEN STRATEGIC PARTNERS

TABLE OF CONTENTS
Chapter 1 Introduction and Executive Summary
Chapter 2 Economic and Demographic Profile of Westfield and Hamilton County
Chapter 3 Youth and Recreational Sports Industry Trends
Chapter 4 Profile of the Project
Chapter 5 Competitive Assessment
Chapter 6 Comparable Facilities and Performance Impacts
Chapter 7 Demand and Financial Projection

Westfield Grand Park SportsPlex Analysis Chapter 1 – Page 2
INTRODUCTION AND EXECUTIVE SUMMARY
Introduction
The City of Westfield has contracted with Hunden Strategic Partners (HSP) to conduct an analysis of the proposed Grand Park Sports Complex (Grand Park), which would be one of the largest recreational sports facilities in the United States. The goals of the project include creating a sports campus for youth and recreational sports leagues and tournaments, as well as creating a facility that would create growth and business development opportunities at the complex and surrounding area. The City proposes to create a unique facility, one that offers a variety of venues for recreational team competition and practice.
The City of Westfield, Indiana, has become a growing and vibrant suburb of Indianapolis. The population has grown from 9,293 in the 2000 U.S. Census to 30,068 in the 2010 US Census. Full build out of the community is expected to exceed 100,000 in population over the next 30 years. With the significant growth has also come growth in responsibility for the city government, including providing adequate venues for recreation and youth sports as well as economic development for the community.
The initiative to develop a comprehensive sports campus began in 2009 to address the community’s needs due to the rapidly-growing youth sports programs in Westfield and surrounding communities. Westfield has created a plan that would not only meet the needs of the youth and recreational sports communities but will also attempt to create business and retail growth in the area around the facility. The Grand Park SportsPlex, located on approximately 300 acres in the area of Westfield north of State Road 32 and west of US highway 31, is planning to have 26 baseball and softball diamonds, 32 all-purpose fields, and a possible indoor facility for several sports. The City intends the facility to become a family sports destination for Indiana, the Midwest, and the nation.
Layout
The layout of this report will be focused on an analysis of the youth and recreational sports industry on a local, regional and national level and the implications for Grand Park. The emphasis will be on outdoor field sports, based on the outdoor components of Grand Park for all-purpose fields and baseball and softball diamonds.
In this report HSP provides a review of the economics and demographics of Westfield and Hamilton County as well as an overview of the trends impacting the recreational and youth sports industry. It reviews the Project and the proposed tenants and partners in the project, the existing facilities in the region, and the comparable facilities regionally and nationally. HSP then applies its findings in a detailed demand and financial projection of the project.
Below is the layout of this report, by chapter.
Chapter 1 – Introduction and Executive Summary

Westfield Grand Park SportsPlex Analysis Chapter 1 – Page 3
Chapter 2 - Economic and Demographic Profile of Westfield and Hamilton County
Chapter 3 - Youth and Recreational Sports Industry Trends
Chapter 4 - Profile of the Project
Chapter 5 - Competitive Assessment
Chapter 6 - Comparable Facilities and Performance Impacts
Chapter 7 – Demand and Financial Projection
Executive Summary
The City of Westfield and Hamilton County have seen expansive growth over the past two decades. Located on the northern edge of the City of Indianapolis, with easy access to the city by interstate highway, the county is home to the premiere bedroom communities of the Indianapolis area. The communities of the county, once small farming towns, are now thriving cities in their own right with their own economic bases. Major industry, medical centers and retail districts have made Hamilton County one of the most populous and affluent areas of the state and perennially ranked as one of the best counties in the nation. The City of Westfield, in the middle part of the county, appears to have the economic and population base to support a major recreational sports facility that would draw from the loca area, the region and occasionally, the nation.
The success of Grand Park is influenced by the current status and trends of the youth and recreational sports industry. The United States continues to see growth in some sports, while others have seen a decline in popularity. Soccer and baseball continue to be two of the most popular youth and recreational sports in the United States. Other sports, while still small, have seen a dramatic increase in popularity, including lacrosse and rugby. Softball is one sport that has seen a major decline in participation.
Several significant trends currently shape recreational sports, especially youth sports. These include:
The tremendous growth of participation by girls and women in the past three decades.
The continued popularity of certain sports, including the outdoor sports of soccer and baseball.
The recent growth in popularity of certain sports, such as lacrosse and rugby, as well as the decrease in popularity of adult softball.
The growth in popularity of regional and national tournaments for youth, creating travel and elite all-star teams.
The creation of multi-field and multi-discipline sports complexes to serve the local community and provide a venue for regional tournaments.
The trend toward less municipal and county involvement due to budget and financial concerns, corresponding with the rise in private, for-profit organizations that provide outlets for those who can pay for the use of the facilities.

Westfield Grand Park SportsPlex Analysis Chapter 1 – Page 4
These trends show that recreational and youth sports and athletics are still growing in popularity but often the growth outpaces the facilities and funding available. The trends also show that youth sports and recreational sports, historically a local, non-profit enterprise, has become more centralized, regional and sometimes national in scope. In many cases recreational and youth sports have become a business as well as an athletic endeavor.
The Project is located on a 300-acre site north of State Road 32 and west of U.S. 31. The following figure is a site plan of Grand Park.
Figure 1-1
The campus is designed to have a variety of championship-level outdoor facilities as well as a multi-purpose indoor facility. The development is designed to include:
12 baseball fields, including one championship field with spectator stands, synthetic turf and lights, as well as seven other fields with synthetic turf and lights;
14 dedicated baseball/softball fields with dirt infields;
32 soccer/football/lacrosse fields, including one championship field with spectator stands, synthetic turf and lights, as well as seven fields with synthetic turf and lights;
Multi-purpose indoor facility with a multi-use floor for basketball, volleyball, indoor soccer and other indoor uses.
The goal of the Project is to provide a recreational sports village that will host a wide range of athletic competitions, regional and national sports competitions, and a number of community sports events. Westfield seeks to become the Family Sports Capital of America through development of Grand Park.
An additional goal of the city is to encourage private development in the area surrounding Grand Park. The property surrounding the project will be an ideal location for a number of private business, hotel, restaurant and residential developments. The location between State Road 32 and
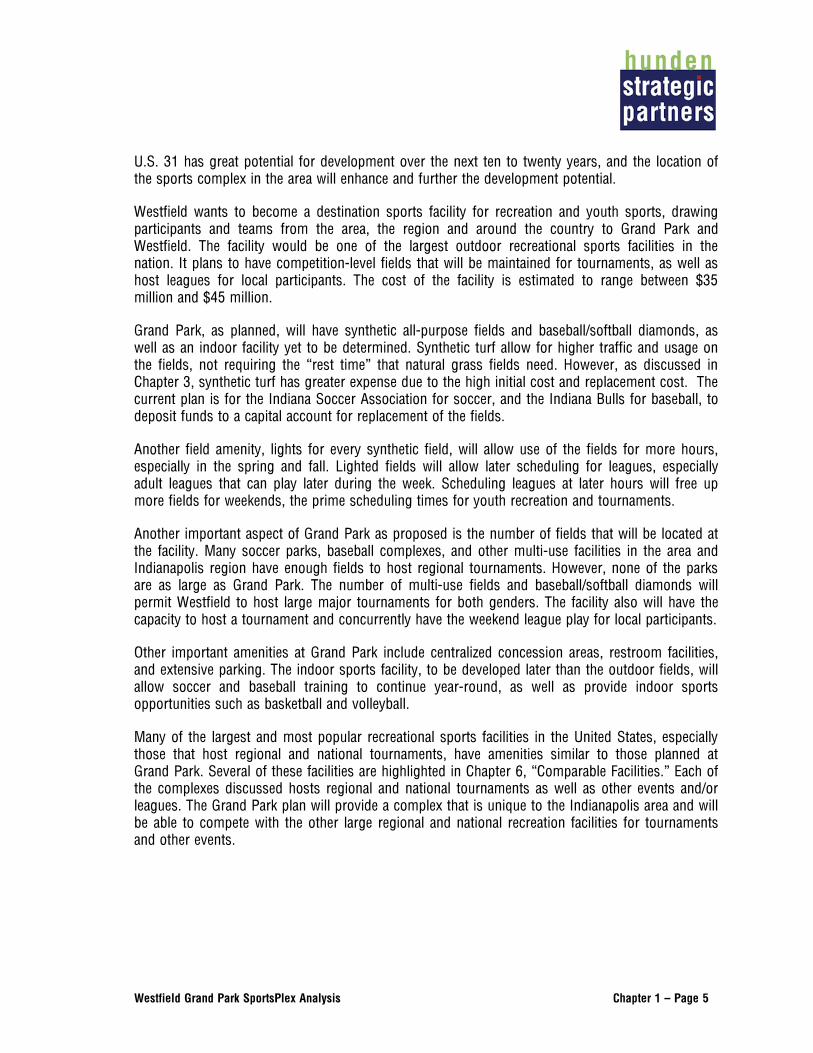
Westfield Grand Park SportsPlex Analysis Chapter 1 – Page 5
U.S. 31 has great potential for development over the next ten to twenty years, and the location of the sports complex in the area will enhance and further the development potential.
Westfield wants to become a destination sports facility for recreation and youth sports, drawing participants and teams from the area, the region and around the country to Grand Park and Westfield. The facility would be one of the largest outdoor recreational sports facilities in the nation. It plans to have competition-level fields that will be maintained for tournaments, as well as host leagues for local participants. The cost of the facility is estimated to range between $35 million and $45 million.
Grand Park, as planned, will have synthetic all-purpose fields and baseball/softball diamonds, as well as an indoor facility yet to be determined. Synthetic turf allow for higher traffic and usage on the fields, not requiring the “rest time” that natural grass fields need. However, as discussed in Chapter 3, synthetic turf has greater expense due to the high initial cost and replacement cost. The current plan is for the Indiana Soccer Association for soccer, and the Indiana Bulls for baseball, to deposit funds to a capital account for replacement of the fields.
Another field amenity, lights for every synthetic field, will allow use of the fields for more hours, especially in the spring and fall. Lighted fields will allow later scheduling for leagues, especially adult leagues that can play later during the week. Scheduling leagues at later hours will free up more fields for weekends, the prime scheduling times for youth recreation and tournaments.
Another important aspect of Grand Park as proposed is the number of fields that will be located at the facility. Many soccer parks, baseball complexes, and other multi-use facilities in the area and Indianapolis region have enough fields to host regional tournaments. However, none of the parks are as large as Grand Park. The number of multi-use fields and baseball/softball diamonds will permit Westfield to host large major tournaments for both genders. The facility also will have the capacity to host a tournament and concurrently have the weekend league play for local participants.
Other important amenities at Grand Park include centralized concession areas, restroom facilities, and extensive parking. The indoor sports facility, to be developed later than the outdoor fields, will allow soccer and baseball training to continue year-round, as well as provide indoor sports opportunities such as basketball and volleyball.
Many of the largest and most popular recreational sports facilities in the United States, especially those that host regional and national tournaments, have amenities similar to those planned at Grand Park. Several of these facilities are highlighted in Chapter 6, “Comparable Facilities.” Each of the complexes discussed hosts regional and national tournaments as well as other events and/or leagues. The Grand Park plan will provide a complex that is unique to the Indianapolis area and will be able to compete with the other large regional and national recreation facilities for tournaments and other events.
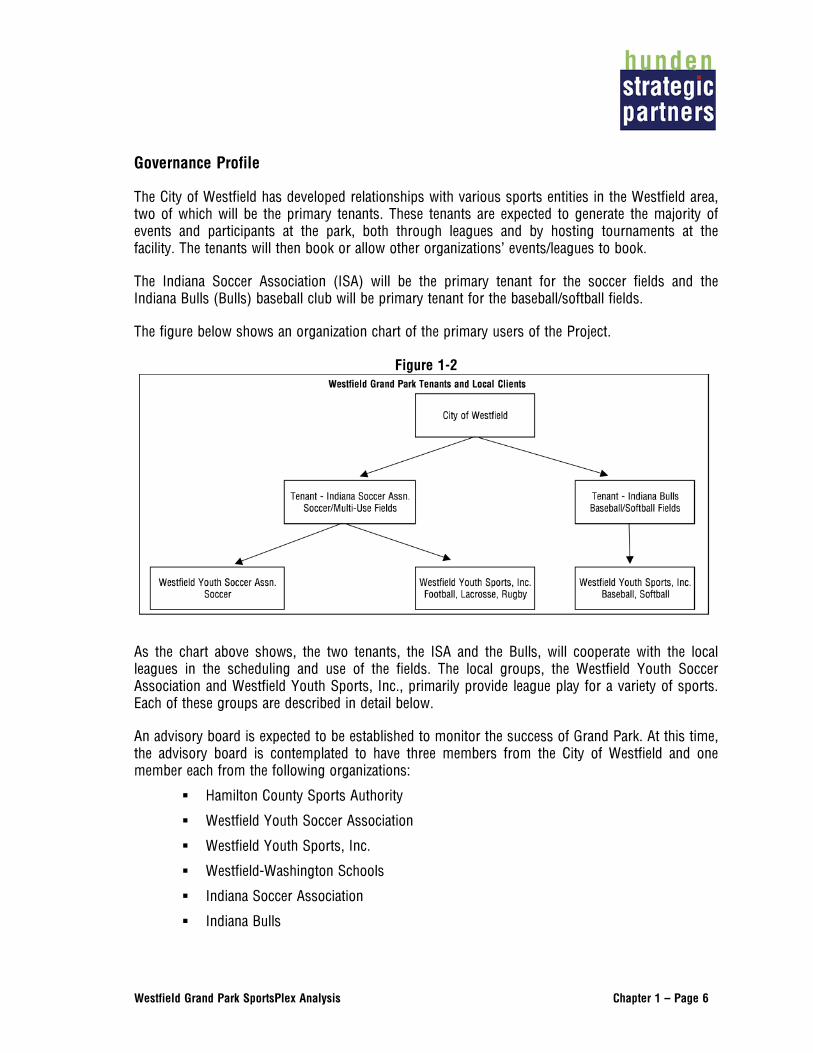
Westfield Grand Park SportsPlex Analysis Chapter 1 – Page 6
Governance Profile
The City of Westfield has developed relationships with various sports entities in the Westfield area, two of which will be the primary tenants. These tenants are expected to generate the majority of events and participants at the park, both through leagues and by hosting tournaments at the facility. The tenants will then book or allow other organizations’ events/leagues to book.
The Indiana Soccer Association (ISA) will be the primary tenant for the soccer fields and the Indiana Bulls (Bulls) baseball club will be primary tenant for the baseball/softball fields.
The figure below shows an organization chart of the primary users of the Project.
Figure 1-2
As the chart above shows, the two tenants, the ISA and the Bulls, will cooperate with the local leagues in the scheduling and use of the fields. The local groups, the Westfield Youth Soccer Association and Westfield Youth Sports, Inc., primarily provide league play for a variety of sports. Each of these groups are described in detail below.
An advisory board is expected to be established to monitor the success of Grand Park. At this time, the advisory board is contemplated to have three members from the City of Westfield and one member each from the following organizations:
Hamilton County Sports Authority
Westfield Youth Soccer Association
Westfield Youth Sports, Inc.
Westfield-Washington Schools
Indiana Soccer Association
Indiana Bulls

Westfield Grand Park SportsPlex Analysis Chapter 1 – Page 7
Facility Manager
The deal points surrounding the two tenant organizations include several key elements that are designed to limit Westfield’s risk and maximize usage. The highlights include:
The primary tenants will be responsible for the booking calendar for their respective fields.
The primary tenants will be responsible for the cost of maintenance and operation of their respective fields, including electricity for lighted fields. Revenues generated by the fields will accrue to the respective tenants.
Westfield will be responsible for the cost of maintenance and operation of common areas as well as the cost of new well pumps and electricity related to irrigating the fields. It will provide a small staff (through direct hiring or an independent management company) that will be responsible for managing the asset (primarily the common areas), selling advertising and sponsorships (including naming rights), managing the concessions contract and providing non-event related safety and security of the facility.
Revenue from all permanent (non-event) advertising and sponsorship as well as revenue from concessions and apparel will accrue to Westfield. The concessions and apparel are expected to be outsourced to a third party. Revenue from certain tournament apparel sales will accrue to the tenants. A management company that also specializes in selling facility sponsorship and advertising is expected to be hired.
The primary tenants will be responsible for contributing to a capital fund designed to replace the fields and any other related non-City controlled improvements. The amounts are currently contemplated to be $400,000 for the ISA and $320,000 for the Bulls annually.
The primary tenants will receive seventy percent of all parking revenue, while Westfield will receive thirty percent.
All events and tenants are expected to use the Hamilton County CVB for their lodging needs and a $15 per hotel room night fee will be assessed that will then be split by the following groups and amounts:
Hamilton County Convention and Visitors Bureau (the CVB) - $3.00.
The ISA for soccer events - $8.40 ($10.20 the first year).
The City of Westfield for facility operating costs - $3.60 for soccer events ($1.80 the first year) and $12.00 for baseball and softball events.
Local Competitive Facilities
The current facilities in Westfield, Hamilton County and the surrounding areas will have an effect on the success of the proposed sports complex at Grand Park. Westfield and the surrounding communities have facilities that youth sports groups use for their programming. No facility would

Westfield Grand Park SportsPlex Analysis Chapter 1 – Page 8
compare in scope or size to the planned Grand Park SportsPlex. Westfield Youth Soccer has two sets of fields that currently serve their leagues and Westfield Youth Sports uses fields and diamonds around the area to meet that group’s needs. Other communities have facilities that host leagues and tournaments, often located as part of the regional high school sports complex. The largest soccer complex is the Lawrence Soccer Complex, currently the home of the Indiana Soccer Association, with 21 fields.
A number of complexes exist in the area capable of hosting soccer, baseball/softball and other field sport tournaments in the surrounding region. While these facilities have hosted a number of tournaments, none are expected to compete with size and quality planned for Grand Park when completed. This, coupled with relationships with the Indiana Soccer Association/Westfield Youth Soccer Association and the Indiana Bulls, indicate that strong relationships will be in place to attract many premier tournaments. However, just because Grand Park will offer more fields than these competitors does not mean all tournaments will shift to Westfield. Existing tournaments and organizations often have a strong incentive to stay in their current setting, especially if they are locally-sponsored. Overall, HSP expects a shift of non-home league tournaments to Grand Park on a somewhat regular basis over time.
Comparable Facilities and Implications
HSP selected nine comparable facilities around the U.S. that provide implications (and competition) for Grand Park. Of the nine, two, Reach 11 in Phoenix, Arizona, and Rockford Sportscore in Rockford, Illinois, have both soccer and baseball/softball facilities. One, the Maryland SoccerPlex, is purely soccer-focused and three are baseball-focused. The National Sports Center emphasizes soccer and other field sports but also has a hockey facility, a velodrome, a golf course, and other amenities.
The following table provides an overview of the comparable facilities.

Westfield Grand Park SportsPlex Analysis Chapter 1 – Page 9
Table 1-1
Comparable Facilities - Overview
Facility Location Fields/DiamondsSynthetic
Fields/DiamondsLighted
Fields/DiamondsSoccer
Overland Park Soccer Complex Overland Park, KS 12 12 12Reach 11 Phoenix, AZ 18 1 18Rockford Sportscore Rockford, IL 40 1 1Maryland SoccerPlex Boyds, Maryland 23 3 23National Sports Center Blaine, MN 52 0 1
Average -- 29.0 3.4 11.0
Baseball/SoftballReach 11 Phoenix, AZ 4 2 0Rockford Sportscore Rockford, IL 8 0 8Snowden Grove Baseball Southaven, MS 17 0 17Ripken Experience
Aberdeen Facility Aberdeen, MD 10 4 2Myrtle Beach Facility Myrtle Beach, SC 7 7 7
East Cobb Baseball Marietta, GA 8 0 8Average -- 9.0 2.2 7.0
Source: HSP, Various Facilities
As shown, the number of fields in the soccer complexes ranges from 12 to 52, while baseball and softball complexes range from four to 17 diamonds. These complexes host a number of tournaments that attract participants and spectators. The majority of these large tournaments have a significant impact on the local hotel markets of each respective community.
While subtle differences are found between each facility, each complex’s business model is focused on scheduling large tournaments. These tournaments attract a significant number of non-local attendees and has a direct impact on the local hotel market through room nights generated (reported to be from 14,000 – 60,000 annually). These facilities also maintain a small local league to help supplement each facility’s usage and financials.
Scheduling priorities are a feature in nearly all comparable facilities. An emphasis is placed on tournaments while local groups are offered usage based on whether there is calendar availability after tournaments are scheduled. Some facilities have demonstrated the ability to attract more than just soccer and baseball events, further enhancing usage opportunities and financial performance.
The use of synthetic fields and lighting greatly expands a facility’s schedule flexibility. Complexes with these amenities are capable of hosting more events while maintaining a longer daily schedule. Natural grass fields require time to rest in order to maintain player safety and adequate playing conditions.
Grand Park’s success will depend on how well the facility’s schedulers and staff can meet the standards set by these comparable facilities. Not only do these complexes offer insight into Grand

Westfield Grand Park SportsPlex Analysis Chapter 1 – Page 10
Park’s usage and financial performance, they will also serve as competitors for many tournaments and events.
Discussion of Strengths, Weaknesses, Opportunities and Threats
HSP has used a SWOT (Strengths, Weaknesses, Opportunities and Threats) analysis to evaluate the proposed Grand Park. The analysis draws from the facts surrounding the concept, the City of Westfield and the surrounding community, the facilities and activities that may be considered as competitors in the region, and facilities throughout Indiana and the United States that would be considered comparable examples to the proposed concept.
The application of that analysis is as follows:
Strengths (Existing attributes that are helpful to Grand Park)
Population Base. While the population of the City of Westfield is approximately 30,000, historical population growth and expected future growth indicate the growing need for recreation facilities. Given that the current population has demonstrated a high demand for recreation services, continued population growth is expected to increase this demand and in turn increase the viability of new recreation facilities.
Viable and Stable Local Partners. The local sports organizations with which the City intends to partner are popular, successful groups that have provided sports and recreation services for the community for many years. The two groups, the Westfield Youth Soccer Association and the Westfield Youth Sports, Inc., have grown through the years to be the largest and most important youth sports organizations in the community.
Profitable and Successful Regional Partners/Tenants. Both the Indiana Soccer Association (ISA) and the Indiana Bulls have a history of many years of success in their respective sports. The ISA is part of the largest youth soccer organization in the United States and runs or sponsors many local, regional and state-wide tournaments. The Indiana Bulls is one of the most well-known private travel youth baseball teams in the United States, with a reputation of providing participants with the opportunity to improve their skills while playing before college and professional scouts.
Grand Park Sports Campus Plan. The physical plan of the Grand Park Sports Campus is ambitious, and if implemented will provide a venue for recreational sports that will be one of the best in the region and the nation.
Weaknesses (Existing attributes that may hurt the success of Grand Park)
Access. While the Grand Park site presently is within easy access to a four-lane highway, US 31, access to the facility will be a challenge until construction that improves the highway to interstate standards is complete in 2016 or 2017.

Westfield Grand Park SportsPlex Analysis Chapter 1 – Page 11
Lack of Services. Presently the Grand Park area and the City of Westfield generally do not have the hotels that would be able to fully support the major tournaments that Grand Park hopes to attract. These amenities may develop over time based on the facility and continued growth of the community as a whole, but presently the lack of services will lessen the impact of the tournaments on Westfield proper.
Lack of Four-Season Facilities. The present plan for Grand Park includes a future indoor facility, but immediate plans are for outdoor fields and diamonds. From November through March the facility will have very limited use.
Lack of Scheduling Flexibility. As proposed, the ISA and the Indiana Bulls will control Grand Park’s schedule. This may limit access to a segment of the local population, especially competing organizations such as groups associated with U.S. Club Soccer and the Roundtrippers.
Opportunities (External conditions that will help the feasibility of Grand Park)
Development of Tournaments and Leagues through Partners. The existing partners, especially the ISA and the Indiana Bulls, have the ability to develop, manage and conduct several regional tournaments per year that will bring participants and spectators from around the region and the United States.
Quality Existing Demand. The facility as planned will be one of the largest and highest-quality facilities in the country, with championship-caliber fields and diamonds, as well as concession stands, bathrooms and other facilities.
Economic Development of Surrounding Areas. Because of the potential for regional and national tournaments, as well as the traffic from leagues and other events, the area surrounding Grand Park has the opportunity to develop, especially services such as hotels and restaurants, retail, and potentially sports health facilities.
Trends for Travel Teams and Elite Tournaments. One major trend in recreation sports is the growth of travel teams and the tournaments and other competitions that those teams require. The Indiana Bulls is an organization that has many travel teams, and its tournaments will draw a large group of teams. Other travel team sports also create opportunities for tournaments, including rugby, lacrosse and softball.
Other Possible Partners. Westfield and the surrounding area are home to other organizations that may want to partner or use the facilities. Other local travel team baseball groups such as the Roundtrippers or the Westfield Indians may want to practice or play at the baseball diamonds, and other soccer teams not affiliated with the ISA may wish to play on the soccer fields.
Threats (External conditions that are a threat to the feasibility of Grand Park)
Market Saturation. Many tournaments around the state already exist, and the clubs and teams that sponsor and manage those tournaments make profits from the tournaments for their organizations. The ISA may not want to sanction tournaments at Grand Park on weekends that another sanctioned tournament is occurring in the area.

Westfield Grand Park SportsPlex Analysis Chapter 1 – Page 12
Baseball tournaments in Indianapolis will want to continue with their tournaments even though the Indiana Bulls wishes to hold a tournament on the same weekend.
Scheduling Conflicts. The facility wants to provide services to the local groups such as the Westfield Youth Soccer Association and Westfield Youth Sports. It also wants to host regional tournaments that will create economic opportunities and growth. The schedule of the facilities could become difficult due to these two conflicting goals.
Demand and Financial Projection
The City of Westfield has drafted proposed agreements with two primary tenants, the Indiana Bulls and the Indiana Soccer Association. Based on the assumptions associated with these agreements as well as the historical operations of the tenants and the other proposed users, HSP has generated a demand model that then assisted in creating a financial model.
The projection assumes only activity on the outdoor fields.
The following table shows the number of annual events assumed for each user group.

Westfield Grand Park SportsPlex Analysis Chapter 1 – Page 13
Table 1-2
Projected Number of Events - Grand Park
2013 2014 2015 2016 2017
Westfield Youth Soccer Assoc. - Tournaments 2 2 2 2 2Westfield Youth Soccer Assoc. - League (spring) 12 12 12 12 12Westfield Youth Soccer Assoc. - League (fall) 20 20 20 20 20Indiana Soccer Association - State Tournaments 10 11 12 12 12Indiana Soccer Association - Regional Camps 1 1 1 1 1Indiana Soccer Association - Regional Tournaments 3 3 3 3 3Indiana Soccer Association - National Clinics 1 1 1 1 1Indiana Bulls - Tournaments 11 12 14 14 14Indiana Bulls - Practice 120 120 120 120 120Indiana Bulls - Summer Camp 1 1 1 1 1Indiana Bulls - Clinics 8 9 10 10 10Westfield Youth Sports - Baseball 15 15 15 15 15Westfield Youth Sports - Softball 15 15 15 15 15Westfield Youth Sports - Footbal (Flag & Tackle) 9 9 9 9 9Westfield Youth Sports - Lacrosse 10 10 10 10 10Westfield Youth Sports - Adult Softball 14 14 14 14 14Westfield Youth Sports - Adult Soccer 7 7 7 7 7Hamilton County Sports Authority Event 3 4 5 5 5Other Non-Sport Event* 4 5 6 6 6High School Regional/State Soccer Tournaments 2 2 2 2 2High School Regional/State Baseball Tournaments 2 2 2 2 2High School Regional/State Softball Tournaments 1 1 1 1 1
Total 238 241 245 245 245
Events Less Bulls Practice 118 121 125 125 125
Tournaments (All Sports & Organizations) 34 37 41 41 41
Source: HSP, Various Sports Organizations
As shown, there are projected to be nearly 250 events in the stabilized year (120 of which are Bulls practices), including 41 tournaments. Each “League Event” is a day of league games. Local league practice days were not included.
The following provides brief descriptions of each event types.
Westfield Youth Soccer Association
Tournaments: Weekend tournaments for local youth soccer teams.
Spring League: In-house local youth league games.
Fall League: In-house local youth league games.
Indiana Soccer Association
State Tournaments: Weekend tournaments for traveling ISA teams.
Regional Camps: Weeklong instructional camp for players from across the Midwest.

Westfield Grand Park SportsPlex Analysis Chapter 1 – Page 14
Regional Tournaments: Weekend tournaments between traveling Midwest teams.
National Clinics: Coaching clinics that attract participations from across the U.S.
Indiana Bulls
Tournaments: Weekend tournaments for elite traveling Indiana and Midwest teams.
Practice: Regularly scheduled Bulls practices.
Summer Camp: Weeklong player development academy for elite Midwest players.
Clinics: Weeklong instructional camp for local and regional players.
Westfield Youth Sports: Local Westfield recreational sport leagues, including practices and competitions.
Hamilton County Events: Third party sporting events booked by the Hamilton County CVB.
Other Non-Sport Event: Third party non-sporting events booked by the tenants or the HCCVB.
High School Regional/State Tournaments: Indiana High School Athletic Association events.
The next table shows the number of expected teams, players and coaches using Grand Park annually.
Table 1-3 Projected Teams & Participation at Grand Park
TeamsYouth/ Team
Coaches/ Team Total
Stabilized Year # of Teams 2013 2014 2015 2016 2017
Westfield Youth Soccer Assoc. - Tournaments 85 18 2 20 170 3,400 3,400 3,400 3,400 3,400Westfield Youth Soccer Assoc. - League (spring) 35 18 2 20 35 8,400 8,610 8,825 9,046 9,272Westfield Youth Soccer Assoc. - League (fall) 65 18 2 20 65 26,000 26,000 26,000 26,000 26,000Indiana Soccer Association - State Tournaments 80 18 2 20 960 16,000 17,600 19,200 19,200 19,200Indiana Soccer Association - Regional Camps 14 17 1 18 14 252 252 252 252 252Indiana Soccer Association - Regional Tournaments 4 18 2 20 12 240 240 240 240 240Indiana Soccer Association - National Clinics 1 0 30 30 1 30 30 30 30 30Indiana Bulls - Tournaments 85 16.5 2.5 19 1,190 17,765 19,380 22,610 22,610 22,610Indiana Bulls - Practice 1 16.5 2.5 19 1 2,280 2,280 2,280 2,280 2,280Indiana Bulls - Summer Camp 1 100 0 100 1 100 100 100 100 100Indiana Bulls - Clinics 2.5 16.5 1.5 18 25 360 405 450 450 450Westfield Youth Sports - Baseball 34 18 2 20 34 10,200 10,200 10,200 10,200 10,200Westfield Youth Sports - Softball 13 18 2 20 13 3,900 3,900 3,900 3,900 3,900Westfield Youth Sports - Footbal (Flag & Tackle) 24 16.5 2.5 19 24 4,104 4,104 4,104 4,104 4,104Westfield Youth Sports - Lacrosse 6 16 2 18 6 1,080 1,080 1,080 1,080 1,080Westfield Youth Sports - Adult Softball 12 17 1 18 12 3,024 3,024 3,024 3,024 3,024Westfield Youth Sports - Adult Soccer 12 13 1 14 12 1,176 1,176 1,176 1,176 1,176Hamilton County Sports Authority Event 32 18 2 20 160 1,920 2,560 3,200 3,200 3,200Other Non-Sport Event* n/a n/a n/a 300 n/a 1,200 1,500 1,800 1,800 1,800High School Regional/State Soccer Tournaments 3 18 2 20 6 120 120 120 120 120High School Regional/State Baseball Tournaments 3 18 2 20 6 120 120 120 120 120High School Regional/State Softball Tournaments 7 18 2 20 7 140 140 140 140 140
Total 2,754 101,811 106,221 112,251 112,472 112,698
Tournaments, Clinics & Camps Only 2,552 40,447 44,347 49,862 49,862 49,862
* Total Attendees OnlySource: HSP, Various Sports Organizations
Westfield Grand Park SportsPlex Analysis Chapter 1 – Page 15
Based on the assumptions, it is projected that approximately 2,750 teams will use Grand Park annually, totaling 113,000 participants per year in the stabilized year. Most of those, 2,550, would be teams coming for tournaments, clinics and camps. For local teams, each player playing each league game counts as one participant (so one player playing spring soccer would be counted ten times if there are ten weeks in the season). Nearly 50,000 participants are projected for tournaments, clinics and camps.
Family and friends accompany most of the participants. While local league play is expected to only draw one to two family members per event, tournaments are assumed to bring more than two family members per event.
The table below shows the expected number of spectators (family and friends) coming to Grand Park annually for various events.
Table 1-4 Projection of Spectators at Grand Park
Others/ Participant 2013 2014 2015 2016 2017
Westfield Youth Soccer Assoc. - Tournaments 2.1 7,140 7,140 7,140 7,140 7,140Westfield Youth Soccer Assoc. - League (spring) 1.3 10,920 10,920 10,920 10,920 10,920Westfield Youth Soccer Assoc. - League (fall) 1.3 33,800 33,800 33,800 33,800 33,800Indiana Soccer Association - State Tournaments 2.1 33,600 36,960 40,320 40,320 40,320Indiana Soccer Association - Regional Camps 0.3 76 76 76 76 76Indiana Soccer Association - Regional Tournaments 2.1 504 504 504 504 504Indiana Soccer Association - National Clinics 0.3 9 9 9 9 9Indiana Bulls - Tournaments 2.1 37,307 40,698 47,481 47,481 47,481Indiana Bulls - Practice 0.5 1,140 1,140 1,140 1,140 1,140Indiana Bulls - Summer Camp 0.2 20 20 20 20 20Indiana Bulls - Clinics 0.5 180 203 225 225 225Westfield Youth Sports - Baseball 1.3 13,260 13,260 13,260 13,260 13,260Westfield Youth Sports - Softball 1.3 5,070 5,070 5,070 5,070 5,070Westfield Youth Sports - Footbal (Flag & Tackle) 1.3 5,335 5,335 5,335 5,335 5,335Westfield Youth Sports - Lacrosse 1.3 1,404 1,404 1,404 1,404 1,404Westfield Youth Sports - Adult Softball 0.3 907 907 907 907 907Westfield Youth Sports - Adult Soccer 0.3 353 353 353 353 353Hamilton County Sports Authority Event 1.3 2,496 3,328 4,160 4,160 4,160Other Non-Sport Event* 1 1,200 1,500 1,800 1,800 1,800High School Regional/State Soccer Tournaments 2.1 252 252 252 252 252High School Regional/State Baseball Tournaments 2.1 252 252 252 252 252High School Regional/State Softball Tournaments 2.1 294 294 294 294 294
Total 155,518 163,424 174,722 174,722 174,722
Tournaments, Clinics & Camps Only 82,129 89,735 100,733 100,733 100,733
Source: HSP, Various Sports Organizations
Based on the assumptions, HSP projects as many as 175,000 family and friends will attend events annually. Of these, approximately 100,000 are due to tournaments, clinics and camps, suggesting a significant tourism impact.
The next table shows the total number of participants (participants and spectators) expected at Grand Park.

Westfield Grand Park SportsPlex Analysis Chapter 1 – Page 16
Table 1-5
Projected Total Visitors (Players, Coaches, Families) at Grand Park
2013 2014 2015 2016 2017
Westfield Youth Soccer Assoc. - Tournaments 10,540 10,540 10,540 10,540 10,540Westfield Youth Soccer Assoc. - League (spring) 19,320 19,530 19,745 19,966 20,192Westfield Youth Soccer Assoc. - League (fall) 59,800 59,800 59,800 59,800 59,800Indiana Soccer Association - State Tournaments 49,600 54,560 59,520 59,520 59,520Indiana Soccer Association - Regional Camps 328 328 328 328 328Indiana Soccer Association - Regional Tournaments 744 744 744 744 744Indiana Soccer Association - National Clinics 39 39 39 39 39Indiana Bulls - Tournaments 55,072 60,078 70,091 70,091 70,091Indiana Bulls - Practice 3,420 3,420 3,420 3,420 3,420Indiana Bulls - Summer Camp 120 120 120 120 120Indiana Bulls - Clinics 540 608 675 675 675Westfield Youth Sports - Baseball 23,460 23,460 23,460 23,460 23,460Westfield Youth Sports - Softball 8,970 8,970 8,970 8,970 8,970Westfield Youth Sports - Footbal (Flag & Tackle) 9,439 9,439 9,439 9,439 9,439Westfield Youth Sports - Lacrosse 2,484 2,484 2,484 2,484 2,484Westfield Youth Sports - Adult Softball 3,931 3,931 3,931 3,931 3,931Westfield Youth Sports - Adult Soccer 1,529 1,529 1,529 1,529 1,529Hamilton County Sports Authority Event 4,416 5,888 7,360 7,360 7,360Other Non-Sport Event* 2,400 3,000 3,600 3,600 3,600High School Regional/State Soccer Tournaments 372 372 372 372 372High School Regional/State Baseball Tournaments 372 372 372 372 372High School Regional/State Softball Tournaments 434 434 434 434 434
Total 257,329 269,645 286,973 287,194 287,420
Tournaments, Clinics & Camps Only 122,576 134,082 150,595 150,595 150,595
Source: HSP, Various Sports Organizations
Total attendance is projected to increase from 257,000 to nearly 290,000 by stabilization, depending on the number of tournaments held. 150,000 attendees are projected from tournaments, clinics and camps in the stabilized year.
Based on the assumed distance traveled for tournaments and the number of people per hotel room, hotel room night assumptions and projections were determined and are shown below.
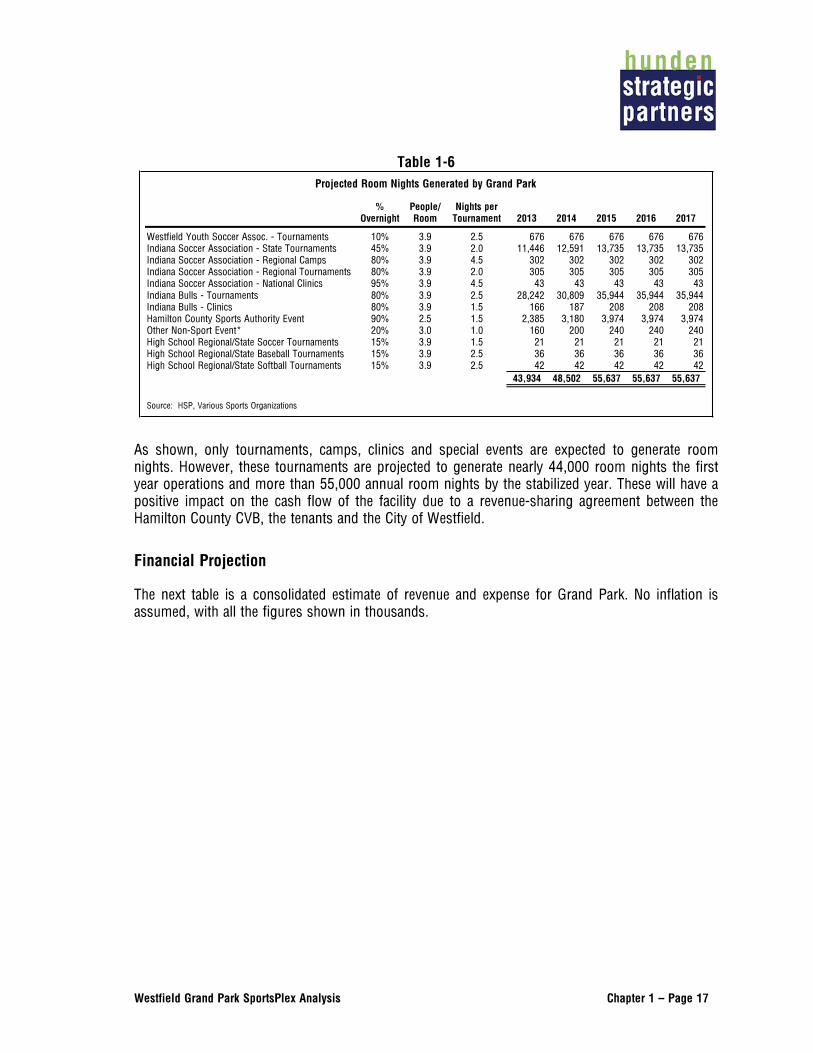
Westfield Grand Park SportsPlex Analysis Chapter 1 – Page 17
Table 1-6 Projected Room Nights Generated by Grand Park
% Overnight
People/ Room
Nights per Tournament 2013 2014 2015 2016 2017
Westfield Youth Soccer Assoc. - Tournaments 10% 3.9 2.5 676 676 676 676 676Indiana Soccer Association - State Tournaments 45% 3.9 2.0 11,446 12,591 13,735 13,735 13,735Indiana Soccer Association - Regional Camps 80% 3.9 4.5 302 302 302 302 302Indiana Soccer Association - Regional Tournaments 80% 3.9 2.0 305 305 305 305 305Indiana Soccer Association - National Clinics 95% 3.9 4.5 43 43 43 43 43Indiana Bulls - Tournaments 80% 3.9 2.5 28,242 30,809 35,944 35,944 35,944Indiana Bulls - Clinics 80% 3.9 1.5 166 187 208 208 208Hamilton County Sports Authority Event 90% 2.5 1.5 2,385 3,180 3,974 3,974 3,974Other Non-Sport Event* 20% 3.0 1.0 160 200 240 240 240High School Regional/State Soccer Tournaments 15% 3.9 1.5 21 21 21 21 21High School Regional/State Baseball Tournaments 15% 3.9 2.5 36 36 36 36 36High School Regional/State Softball Tournaments 15% 3.9 2.5 42 42 42 42 42
43,934 48,502 55,637 55,637 55,637
Source: HSP, Various Sports Organizations
As shown, only tournaments, camps, clinics and special events are expected to generate room nights. However, these tournaments are projected to generate nearly 44,000 room nights the first year operations and more than 55,000 annual room nights by the stabilized year. These will have a positive impact on the cash flow of the facility due to a revenue-sharing agreement between the Hamilton County CVB, the tenants and the City of Westfield.
Financial Projection
The next table is a consolidated estimate of revenue and expense for Grand Park. No inflation is assumed, with all the figures shown in thousands.

Westfield Grand Park SportsPlex Analysis Chapter 1 – Page 18
Table 1-7
Grand Park Sportsplex Financial Projection (thousands of constant dollars)
Fiscal Year
Item 2013 2014 2015 2016 2017
Operating RevenueNet Concessions $73 $79 $88 $88 $88Net Novelties $83 $90 $102 $102 $102Parking Share $28 $31 $35 $35 $35Advertising and Sponsorship $50 $70 $80 $80 $80Naming Rights $0 $0 $0 $0 $0Hotel Fee $293 $340 $393 $393 $393
Total Revenue $528 $611 $698 $698 $698
Operating Expense
Fixed
Salary - Permanent Staff $121 $121 $121 $121 $121Benefits - Permanent Staff $40 $40 $40 $40 $40General and Administrative $84 $84 $84 $84 $84Utilities $24 $24 $24 $24 $24Common Area Maintenance $125 $125 $125 $125 $125Security $15 $15 $15 $15 $15Insurance $22 $22 $22 $22 $22
Operating Expenses $430 $430 $430 $430 $430
Net Operating Income (Deficit) $98 $180 $268 $268 $268
Contribution to Cap Reserve - Bulls $320 $320 $320 $320 $320Contribution to Cap Reserve - ISA $400 $400 $400 $400 $400Deposit to Capital Reserve Account $720 $720 $720 $720 $720
Source: Hunden Strategic Partners
Based on the proposed agreements with the tenants, there will be no rent charged to the tenants and the tenants will have full responsibility for the maintenance of the facilities. As a result, the revenue items for the City will include net concessions and novelty sales, a 30 percent share of parking (which will only be charged at the largest tournaments), 100 percent of advertising/sponsorship/naming rights and the portion of the hotel fee. Total revenue is projected to range between $528,000 and $698,000 annually. On the expense side, most of the expenses will be related to certain utilities (wells will be drilled onsite to provide irrigation), a small staff dedicated especially to marketing and advertising sales, and providing asset management services, maintenance of common areas, security, insurance and general expenses.
The Bulls and the ISA will contribute a total of $720,000 annually to a capital reserve fund, which will not influence cash flow.

Westfield Grand Park SportsPlex Analysis Chapter 1 – Page 19
The projected operating income is projected to be $268,000 in the stabilized year. Changes in any of the assumptions will have a material impact on the results, especially changes in room nights generated.

Westfield Grand Park Sportsplex Analysis Chapter 2, Page 1
TABLE OF CONTENTS
Chapter 1 Introduction and Executive Summary
Chapter 2 Economic and Demographic Profile of Westfield and Hamilton County
Chapter 3 Youth and Recreational Sports Industry Trends
Chapter 4 Profile of the Project
Chapter 5 Competitive Assessment
Chapter 6 Comparable Facilities and Performance Impacts
Chapter 7 Demand and Financial Projection

Westfield Grand Park Sportsplex Analysis Chapter 2, Page 2
WESTFIELD ECONOMIC & DEMOGRAPHIC OVERVIEW
Hamilton County, named for Alexander Hamilton, the first Secretary of the U.S. Treasury, was organized in 1823. The County is located near the geographic center of Indiana, directly to the north of Marion County and Indianapolis, and has a population of approximately 275,000 people. Carmel, Fishers, and Noblesville are the county’s largest cities with populations of approximately 79,191, 76,794, and 51,969, respectively. Westfield, where the subject project is proposed, lies just north of Carmel and has a population of approximately 30,000. These communities are located 10 to 22 miles north of downtown Indianapolis. Hamilton County is part of the Indianapolis Metropolitan Statistical Area (MSA), which also includes Boone, Hancock, Hendricks, Johnson, Madison, Marion, Morgan, and Shelby County, and has a total population of approximately 1.7 million people.
The following figure shows the location of Westfield in relation to the Indianapolis MSA.

Westfield Grand Park Sportsplex Analysis Chapter 2, Page 3
Table 2-1
Westfield Grand Park Sportsplex Analysis Chapter 2, Page 4
Transportation
Because of its convenient location adjacent to Indianapolis, Hamilton County and Westfield are easily accessible via numerous means of transportation. The Indianapolis MSA is served by four Interstates: I-65, I-69, I-70, I-74, and the region’s beltway, I-465. These interstates connect the MSA directly to major cities such as Chicago, Fort Wayne, Columbus, Cincinnati, Louisville, and St. Louis. Westfield is directly served by the four-lane US 31 highway, which is the region’s link to South Bend and western Michigan, and is being upgraded to limited access (Interestate standard) in sections over the next two decades. In addition, the southwestern extension of Interstate 69 will connect the Indianapolis Metro Area to Evansville, Memphis, Little Rock, and eventually Houston. The Indiana portion of this highway is currently under construction, will open by 2014, and will increase cross-country traffic to Indianapolis and Hamilton County.
By train, Indianapolis is served by Amtrak’s Cardinal Train (Chicago, IL-Washington, DC), Kentucky Cardinal Train (Chicago, IL-Louisville, KY) and Hoosier State (Chicago). Amtrak and Greyhound share Indianapolis’ Union Station. Greyhound provides connections to points throughout the Midwest including Bloomington, Fort Wayne, Louisville, and St. Louis.
The Indianapolis International Airport is the main airport in the area. The growth of the metro area and its location has helped to make the airport a busy regional hub for air service. In 2010, the airport served approximately 7.6 million domestic and international travelers, over 2.1 billion pounds of cargo (making it the nation’s 8th busiest cargo airport) and 280 daily landings and take-offs. The facility is served by nine major airlines with nonstop flights to 35 destinations. The airport is home to the second largest hub for FedEx, only behind their world hub in Memphis.
The Indianapolis Executive Airport is located in Zionsville, Indiana, on State Route 32 six miles west of Westfield. This airport serves the business community of metropolitan Indianapolis and especially the northern suburban business districts in Carmel, Zionsville and Westfield. The airport provides excellent services to private and charter air travel and is especially popular during major sporting events in the Indianapolis area.
Economic and Demographic Data
The following text and tables summarize important characteristics of the local market in Hamilton County and specifically Westfield. These characteristics help to define the strength of the market and will support projections developed later in this report for Grand Park.
Population
In general, the size of a local population base can help determine the potential demand for many types of real estate developments. While some of the TIF area’s demand will be generated by out-of-town visitors, the local population will be relied on by real estate investors to support various commercial developments.

Westfield Grand Park Sportsplex Analysis Chapter 2, Page 5
The following table displays the historical population of Hamilton County and its largest cities, the MSA’s other component counties, the Indianapolis MSA, Indiana, and the U.S.
Table 2-2 City of Westfield, Hamilton County, Indianapolis MSA and State Population and Growth Rates
Population Percent Change 1990 2000 2010 2000-2010
United States 248,709,873 281,421,906 308,745,538 8.8%State of Indiana 5,544,159 6,080,485 6,483,802 6.6%
Indianapolis-Carmel MSA 1,380,491 1,607,486 1,756,241 9.3%Hamilton County 108,936 182,740 274,569 50.3%
Carmel 25,380 37,733 79,191 109.9%Fishers 7,508 37,835 76,794 103.0%Noblesville 17,655 28,590 51,969 81.8%City of Westfield 3,304 9,293 30,068 223.6%
City Pop. As % of County 3.0% 5.1% 11.0%
Source: U.S. Census Bureau, HSP
Overall, Hamilton County and the City of Westfield have experienced strong growth when compared to the Indianapolis MSA, Indiana, and the U.S. Hamilton County is ranked as the fastest growing county in the state of Indiana and ranks as one of the fastest growing in the country. The county currently ranks as the fourth most populous in the state. From 2000 through 2010, the population in Hamilton County grew by 50.3 percent and the City of Westfield an impressive 223.6 percent.
During the same period, the population in the Indianapolis MSA, Indiana, and the U.S. grew by 9.3 percent, 6.6 percent, and 8.8 percent, respectively. Of the 400,000 new people to Indiana in the past ten years, nearly 25 percent occurred in Hamilton County. More impressive, of the 150,000 net new residents to the MSA in the past ten years, 62 percent occurred in Hamilton County. While there has been a migration pattern from the center of the MSA population (Marion County and the City of Indianapolis) north to Hamilton County, Marion County also increased in population. Westfield accounted for 20,000 new residents and is expected to continue growing as Carmel, Noblesville and Fishers have less land upon which to build.
The table below sets out the population of the nation, the state, and the local area by age.
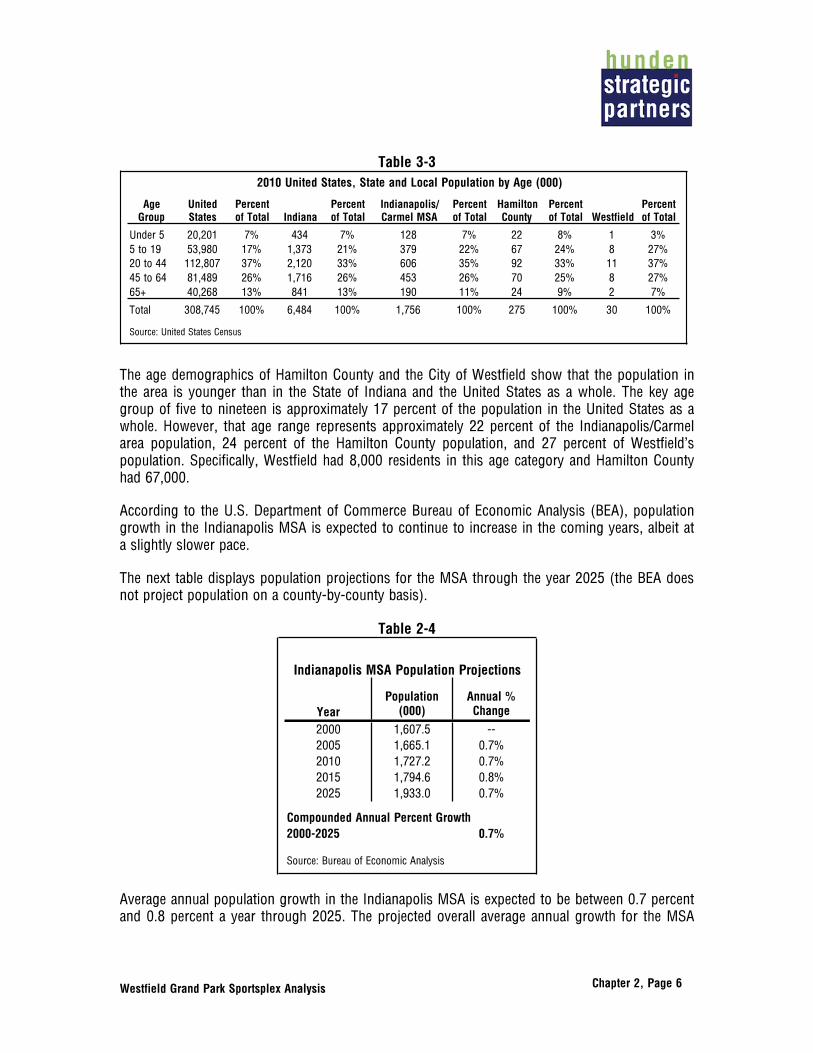
Westfield Grand Park Sportsplex Analysis Chapter 2, Page 6
Table 3-3 2010 United States, State and Local Population by Age (000)
Age Group
United States
Percent of Total Indiana
Percent of Total
Indianapolis/ Carmel MSA
Percent of Total
Hamilton County
Percent of Total Westfield
Percent of Total
Under 5 20,201 7% 434 7% 128 7% 22 8% 1 3%5 to 19 53,980 17% 1,373 21% 379 22% 67 24% 8 27%20 to 44 112,807 37% 2,120 33% 606 35% 92 33% 11 37%45 to 64 81,489 26% 1,716 26% 453 26% 70 25% 8 27%65+ 40,268 13% 841 13% 190 11% 24 9% 2 7%
Total 308,745 100% 6,484 100% 1,756 100% 275 100% 30 100%
Source: United States Census
The age demographics of Hamilton County and the City of Westfield show that the population in the area is younger than in the State of Indiana and the United States as a whole. The key age group of five to nineteen is approximately 17 percent of the population in the United States as a whole. However, that age range represents approximately 22 percent of the Indianapolis/Carmel area population, 24 percent of the Hamilton County population, and 27 percent of Westfield’s population. Specifically, Westfield had 8,000 residents in this age category and Hamilton County had 67,000.
According to the U.S. Department of Commerce Bureau of Economic Analysis (BEA), population growth in the Indianapolis MSA is expected to continue to increase in the coming years, albeit at a slightly slower pace.
The next table displays population projections for the MSA through the year 2025 (the BEA does not project population on a county-by-county basis).
Table 2-4
Indianapolis MSA Population Projections
YearPopulation
(000)Annual % Change
2000 1,607.5 --2005 1,665.1 0.7%2010 1,727.2 0.7%2015 1,794.6 0.8%2025 1,933.0 0.7%
Compounded Annual Percent Growth2000-2025 0.7%
Source: Bureau of Economic Analysis
Average annual population growth in the Indianapolis MSA is expected to be between 0.7 percent and 0.8 percent a year through 2025. The projected overall average annual growth for the MSA

Westfield Grand Park Sportsplex Analysis Chapter 2, Page 7
between 2005 and 2025 is 0.7 percent, and the population is expected to reach over 1.9 million by 2025. As in the past, much of that growth is expected to occur in Hamilton County. By 2040, Hamilton County’s population is expected to be 600,000, based on HSP estimates, nearly two-thirds the size of Indianapolis/Marion County. Total buildout of Westfield is estimated to be approximately 125,000 by 2045.
Income and Employment
The number of employed people and their income levels create a market for real estate developments, including housing as well as all manner of commercial developments. The next table summarizes the historical growth in farm and non-farm income and employment in the County from 2000 through 2009, which is the latest available data for counties from the BEA.
Table 2-5 Hamilton County Income and Employment
Year Non-Farm Income Non-Farm Employment Income/ Employed$ (000s) % Change Employed % Change % Change
2000 $8,143,583 -- 109,583 -- $74,314 --2001 $8,762,440 7.6% 122,642 10.6% $71,447 -3.9%2002 $8,918,431 1.8% 125,431 2.2% $71,102 -0.5%2003 $9,430,821 5.7% 131,325 4.5% $71,813 1.0%2004 $10,192,035 8.1% 137,159 4.3% $74,308 3.5%2005 $10,759,811 5.6% 145,086 5.5% $74,162 -0.2%2006 $11,637,185 8.2% 153,361 5.4% $75,881 2.3%2007 $12,412,794 6.7% 165,937 7.6% $74,804 -1.4%2008 $12,946,297 4.3% 168,519 1.5% $76,824 2.7%2009 $12,723,085 -1.7% 164,611 -2.4% $77,292 0.6%
Source: Bureau of Economic Analysis, HSP
Indiana State Income and EmploymentYear Non-Farm Income Non-Farm Employment Income/ Employed
$ (000s) % Change Employed % Change % Change2000 $166,425,274 -- 3,647,047 -- $45,633 --2001 $170,712,842 2.6% 3,588,104 -1.6% $47,577 4.3%2002 $174,864,227 2.4% 3,547,026 -1.2% $49,299 3.6%2003 $181,423,521 3.8% 3,547,659 0.0% $51,139 3.7%2004 $188,246,290 3.8% 3,586,423 1.1% $52,489 2.6%2005 $194,156,209 3.1% 3,626,252 1.1% $53,542 2.0%2006 $205,655,358 5.9% 3,665,740 1.1% $56,102 4.8%2007 $205,655,358 0.0% 3,715,676 1.3% $55,348 -1.3%2008 $220,948,619 7.4% 3,679,114 -1.0% $60,055 8.5%2009 $216,310,708 -2.1% 3,512,833 -4.7% $61,577 2.5%
Source: Bureau of Economic Analysis, HSP
As shown in the tables, employment peaked in Hamilton County at 168,500 in 2008, then declined by 2.4 percent due to the recession. However, income per employed person peaked

Westfield Grand Park Sportsplex Analysis Chapter 2, Page 8
during the latest year for available statistics (2009) at $77,292. This is approximately $16,000 more per employed person than the state of Indiana.
Effective Buying Income
Effective Buying Income is personal income (wages, salaries, interest, dividends, profits, rental income, and pension income) minus federal, state, and local taxes and nontax payments (such as personal contributions for social security insurance). Residents’ effective buying income also helps to demonstrate the amount of disposable income that is available locally, and this data is shown in the next table.
Table 2-6 Effective Buying Income (EBI) 2009
Hamilton County State of Indiana United States
Total EBI (000) $8,295,752 $120,375,575 $6,443,994,426Median Household EBI $62,116 $38,341 $42,303
% of Households by EBI Group
Less than $20,000 8.5% 21.2% 24.2% $20,000 - $34,999 12.6% 24.4% 23.6% $35,000 - $49,999 14.9% 21.1% 19.4% $50,000 & Over 64.0% 33.3% 32.8%
Source: Sales and Marketing Management, HSP
As the table shows, Hamilton County had a total effective buying income (EBI) of almost $8.3 billion in 2009. The median household EBI was $62,116, 63 percent higher than the state median and 47 percent above the U.S. median. 64 percent of the County has an EBI of $50,000 and over, approximately double the amount for the state and the U.S. Hamilton County had a larger share of households with higher income levels, allowing for a larger potential of buying income.
Employment Diversity
Employment diversity is a key factor in a long-term healthy local economy. Those areas with a reliance on one or two sectors can be very susceptible to changes in the fortunes of those sectors. For example, a community with a large industrial base is likely to suffer wider swings in employment than one with a mix of industries or those with more stable employment (such as government and education).
The next table displays the County’s employment by industry sector as of 2009.

Westfield Grand Park Sportsplex Analysis Chapter 2, Page 9
Table 2-7
This table shows that a substantial portion of the County’s workforce is employed in the financing and insurance sector as well as health services and government. Overall, there is a healthy diversity of employment sectors.

Westfield Grand Park Sportsplex Analysis Chapter 2, Page 10
Unemployment
The level of employment, as well as unemployment, has a large effect on the real estate market. The table shows the County’s unemployment rate in relation to Indiana and the U.S.
Table 2-8
The county has historically maintained a lower unemployment rate than the state and U.S. Unemployment in the county averaged around two percent for the period of 1990 to 2000 and rose to an average of 3.5 percent between 2000 and 2008, significantly lower than that of the Indiana and the U.S. Even as unemployment spiked across the nation due to the economic crisis in 2008, the county has maintained a lower rate of unemployment than that of Indiana and the U.S.
Education
The education level of a community’s residents is indicative of employment, income levels and long-term economic growth. The following table shows the educational attainment of adults in Westfield.

Westfield Grand Park Sportsplex Analysis Chapter 2, Page 11
Table 2-9 Westfield Educational Attainment
Age 25+ Population Westfield United StatesHigh School or Above 94.4% 84.9%Bachelors Degree 32.0% 17.6%Graduate Degree 14.7% 10.4%
Source: US Census Bureau, Decision Date, HSP
Westfield offers a very educated population. Over 94 percent of the city’s adult population (25 years and older) has completed high school or above, with 46.7 percent holding a bachelors or graduate degree. These factors, combined with strong growth in non-farm employment, have resulted in Westfield and Hamilton County’s low unemployment rate and high per capita income, as evidenced in the statistics shown in the above tables.
Corporate Presence
In general, a market’s corporations support local businesses, provide employment and provide the majority of sponsorship and advertising revenue for sports facilities with indoor signage, naming rights, and other opportunities. The next table shows the largest employers in Hamilton County, by number of full-time employees.

Westfield Grand Park Sportsplex Analysis Chapter 2, Page 12
Table 2-10
Hamilton County Top Private Employers
Company IndustryNumber of Employees
Sallie Mae Financial Services 2,500CNO Financial Group, Inc. Financial Services 1,800Liberty Mutual Group Insurance Services 1,200IU Health North Healthcare 1,200The Capital Group Financial Services 950Resort Condo International (RCI) Time Share Management 950Firestone Diversified Products 800St. Vincent Health Healthcare 800Midwest ISO Utilities 725Roche Diagnostics Medical Equipment 600Indiana Mills & Manufacturing Manufacturing 550ADT Customer Service 475Duke Realty Corp. Real Estate 475Ingersoll Rand Security Technology 425Go America Insurance Insurance Services 425Sony DADC Logistics 375ADESA Vehicle Auction Exchange Service 350Wiley Technology Computer Publishing 325King Systems Manufacturing/Technology 325Delta Faucet Co. Manufacturing 310Telamon Corporation Telecommunications 275Frontier Communications Financial Services 250Technicolor Technology/Entertainment 250Nightingale Home Healthcare Healthcare 225Consona Software Productions 175Porter Engineered Systems Manufacturing 175Walker Information Research and Marketing 160
Source: Hamilton County Alliance
As shown in the table, the county’s largest employers are represented by finance, healthcare, technology, services, manufacturing and other high wage employers.
Additionally, over the last several years, Hamilton County has established itself as the region’s largest suburban county employment center. The main locations include the following:
The Northeast Commerce Corridor - is one of the premier business locations in Hamilton County. The corridor consists of the County segments of I-69 and SR 37, anchored on the north by the City of Noblesville and the Town of Fishers on the south. Along the corridor are businesses such as Sallie Mae (2,500 employees), Firestone (800) and King Systems (325).
Westfield Grand Park Sportsplex Analysis Chapter 2, Page 13
The Meridian Corporate Corridor - is another premiere business location in Hamilton County. The corridor is directly accessible from I-465, and extends for 20 miles through the County segments of US 31, from the City of Carmel through the City of Westfield. Along the corridor are businesses such as Thomson Consumer Electronics, Macmillan Publishing, Delta Faucet, Conseco, Inc., CNO Insurance, IU North Hospital, St. Vincent Hospital, Indiana Insurance, Sylvania, One Call Communications, Integrated Information Services, Ritron, P.L. Porter, Indiana Mills and Manufacturing, Inc., and Firestone.
Colleges and Universities
There are no colleges or universities in Hamilton County, except the very small Union Bible College in Westfield. However, there are eight colleges and universities, four business and technical schools, and six bible colleges in the Indianapolis MSA, enrolling approximately 65,000 students. Most of these academic institutions are located in Indianapolis. The largest is Indiana University-Purdue University at Indianapolis (IUPUI), which topped 40,000 students for the first time in 2010. There are an additional six universities just outside the Indianapolis MSA, including the three largest state schools, Indiana University, Purdue University, and Ball State University. Combined, the schools within in an hour of Indianapolis enroll approximately 150,000 students.
Arts, Culture, Recreation, Entertainment, and Tourism
Hamilton County has a unique blend of urban and rural offerings in Indianapolis’ northern suburbs of Carmel, Fishers, Noblesville, Westfield, Cicero, Sheridan, Arcadia, and Atlanta. The County has a wide variety of attractions that add to its appeal. The area’s attractions include, but are not limited to:
Conner Prairie – a 1,400-acre living history museum located in Fishers on the Conner Estate. The attraction includes numerous events (including Symphony on the Prairie during the summer) and activities that include reenactment of the historic past of Hamilton County.
Carmel Center for the Performing Arts – The City of Carmel developed and opened the $175 million complex in 2011. The complex features a state-of-the-art 1,600-seat concert hall, the 300-seat Tarkington proscenium theater and a 200-seat blackbox theater. In its second season, the Center has scheduled more than 80 performances.
Julian Center’s Amish Country Market at the Hamilton County Fairgrounds - features over 200 fine art and craft booths and food vendors, live auctions of exhibitor items, quilt raffles, special entertainment and children’s games and activities, with all proceeds to benefit the Julian Center;
Country Treasures Folk Art and Craft Show - showcases more than 100 booths of handmade treasures featuring folk art, holiday items, furniture, floral, candles, gourmet foods, and wearable art;

Westfield Grand Park Sportsplex Analysis Chapter 2, Page 14
Verizon Wireless Music Center - formerly Deer Creek Music Center, is an outdoor, 228-acre semi-covered amphitheater owned by Clear Channel Communications and located in Noblesville. The facility contains 6,000 covered seats and a lawn that can accommodate an additional 18,000 people. Attendance in 2000 was 500,000. Camping is offered on site for certain events;
Canterbury Arabians - is a year-round working horse farm featuring more than 50 purebred Arabian horses, including “Real Mac,” the Indianapolis’ Colts former mascot;
Hamilton County Museum of History - is an 1875 museum of County history;
Indiana Transportation Museum - located in Noblesville, allows visitors to ride authentic steam or diesel trains and tour more the 50 rail cars. The museum features trolley rides, dinner train excursions, and as a unique tradition, operates the Indiana State Fairgrounds FairTrain that operates ten round trips daily during the Indiana State Fair in August.
Museum of Miniature Houses in Carmel - features dollhouses and other unrelated collections.
Hamilton County also offers quality golf facilities. There are 21 golf courses in the area, including four premiere golf clubs (Bear Slide Golf Club, Plum Creek Country Club, Purgatory Golf Club, and Robert Trent Jones, Jr.’s Prairie View Golf Club), and three golf schools and driving ranges.
As Hamilton County’s population swelled in the 1980s and 1990s, the residents clamored for more parks and recreation trails to add to the quality of life. During the 1990s and 2000s, both the county and individual cities began aggressively developing parks and paved bicycle trails. The wooded 90-acre Cool Creek Park in Westfield, along with Noblesville’s Forest Park and Potters Bridge Park, and Carmel’s Central Park, Coxhall Gardens, and the very popular Monon Trail, are the largest and most diverse of the county’s young park developments.
In addition, the County also features two of the only large bodies of water in the area, Geist Lake in Fishers and Morse Lake in Noblesville. Both are generally surrounded by large upscale homes, but include public access, boating, and water recreation activities, as well as restaurants.
The variety of recreation and entertainment opportunities in Hamilton County reflects how the community is evolving. As the population increases and more families move to the area, the demand for sports facilities will only increase as well as their supporting amenities.
Recent Initiatives in Hamilton County
Numerous developments in Hamilton County will continue to add to the infrastructure of the area, improving accessibility, destination appeal, and providing a foundation for future complementary development, including:
The reconstruction of US 31/Meridian Street through Carmel and Westfield will upgrade the road to a limited-access highway. This should have a net positive impact
Westfield Grand Park Sportsplex Analysis Chapter 2, Page 15
on the County as it will ease current congestion and allow for future growth in this important commercial corridor. This is discussed in more detail in Chapter 4.
Carmel City Center is a long-term project of the City of Carmel, that is creating an expanded downtown with apartments, restaurants, shops, civic uses, the recently opened Center for the Performing Arts, the completed Monon Trail and other amenities. Much has been developed in the past five years and a number of other projects are in planning stages, including a hotel, meeting facilities and more mixed-use projects.
Trails. A little more than a decade ago, the Monon Trail became a reality in Carmel and Indianapolis, converting an old abandoned railroad bed into a vital trail for residents to walk, bike or roller blade and connecting important communities such as Broad Ripple, Downtown Indianapolis and downtown Carmel together. The City of Westfield is extending the Monon Trail northward and connecting it with the Midland Trace Trail, which traverses east and west approximately 800 feet south of SR 32. A mile and half of the Monon is completed and sufficient right-of-way purchased to extend the Monon to the Westfield Post Office on SR 32 (an additional two miles) during the fall of 2010. Construction of one mile of the Midland began in May 2010 from the Kroger at Carey Road to Downtown Westfield. In 2013 the City and County will extend the Monon four miles northward. Additional TIF funding will provide for the extension of the Midland Trace Trail westward to Springmill and Ditch Roads as well as the construction of the actual Grand Junction in downtown Westfield.
The Grand Junction in downtown Westfield is emerging as a dynamic plan to memorialize the history and celebrate the future of the City of Westfield. The first phase of construction began in May 2010. The Grand Junction is based upon the twin “Railroad” themes upon which the City was established. Westfield served as an important participant in the Underground Railroad in the 1800’s and served as an actual railroad town as well. Both are being converted into walking and biking trails. The actual Grand Junction will be a destination at the crossroads of these trails in downtown Westfield. It will be a place for the residents and visitors to enjoy entertainment, recreation, dine, attend concerts and exercise.
Continuing road improvements throughout the county, especially in rapidly developing areas Noblesville, Fishers, Carmel, and Westfield.
Additional business parks and residential development throughout the southern half of the County and along the Meridian corridor.
These developments will increase Hamilton County’s competitive position to draw both business and social events and attendance to the area and increase the need for development around Grand Park.
Summary
Hamilton County is a success story like few other counties in the U.S. In nearly every measure, it excels, whether in terms of employment, income, education levels or business development. The

Westfield Grand Park Sportsplex Analysis Chapter 2, Page 16
County and the individual communities have more recently begun developing quality of life improvements, such as parks, trails, cultural facilities and related items. Each community, as it grows, has taken steps to create a unique identity. The Grand Park sports park development in Westfield is that community’s effort to differentiate itself and create economic development beyond the traditional suburban community. The growth of Westfield and the surrounding county should help create a base of users for the facilities as well as the commercial and residential development around it that will create TIF revenue over the next 25 years.

Westfield Grand Park Sportsplex Analysis Chapter 3, Page 1
TABLE OF CONTENTS
Chapter 1 Introduction and Executive Summary
Chapter 2 Economic and Demographic Profile of Westfield and Hamilton County
Chapter 3 Youth and Recreational Sports Industry Trends
Chapter 4 Profile of the Project
Chapter 5 Competitive Assessment
Chapter 6 Comparable Facilities and Performance Impacts
Chapter 7 Demand and Financial Projection
Westfield Grand Park Sportsplex Analysis Chapter 3, Page 2
YOUTH AND RECREATIONAL SPORTS INDUSTRY TRENDS
Sports Complex Industry Background
In the United States several types of sport facilities and complexes exist for youth and adults, for recreational, competitive, interscholastic and intercollegiate sports and fitness activities. High schools, colleges and universities have facilities for the students of their schools, and these facilities often allow non-students to use the sports and recreational facilities for a fee. Municipalities and other local government entities own and operate recreational facilities with a wide range of services. Private sports and fitness facilities provide the public with fee-based sports and recreation opportunities. The advent of large, multi-sport youth and recreation complexes has been driven by several factors: the increase in travel sport programs and the recognition by communities that such relatively inexpensive complexes can generate significant economic impacts in the form of room nights and related travel spending.
To examine the sports complex industry one must consider the sports and recreation that occurs at these facilities. The trends of the sports complex follow the sports and recreation trends of the public, as the facilities try to meet the growing needs and demands of those taking part in sports and recreational activities.
In many cases the popularity of individual recreation and athletic activity would be a consideration for the feasibility of a new multi-sport complex. However, in the case of Westfield’s Grand Park, most individual recreation and athletics will not be a factor. The facility’s model is for outdoor team sports, particularly those that use outdoor turf fields and baseball/softball diamonds. Therefore, individual sports and recreation will not be emphasized in this report.
Health and Activity Overview
The following tables provide an overview of U.S. health conditions on the basis of income, age and gender. By understanding the trends and metrics related to health and sports participation, the future performance of Grand Park can be placed into context.
The following table profiles perceived health by income level.
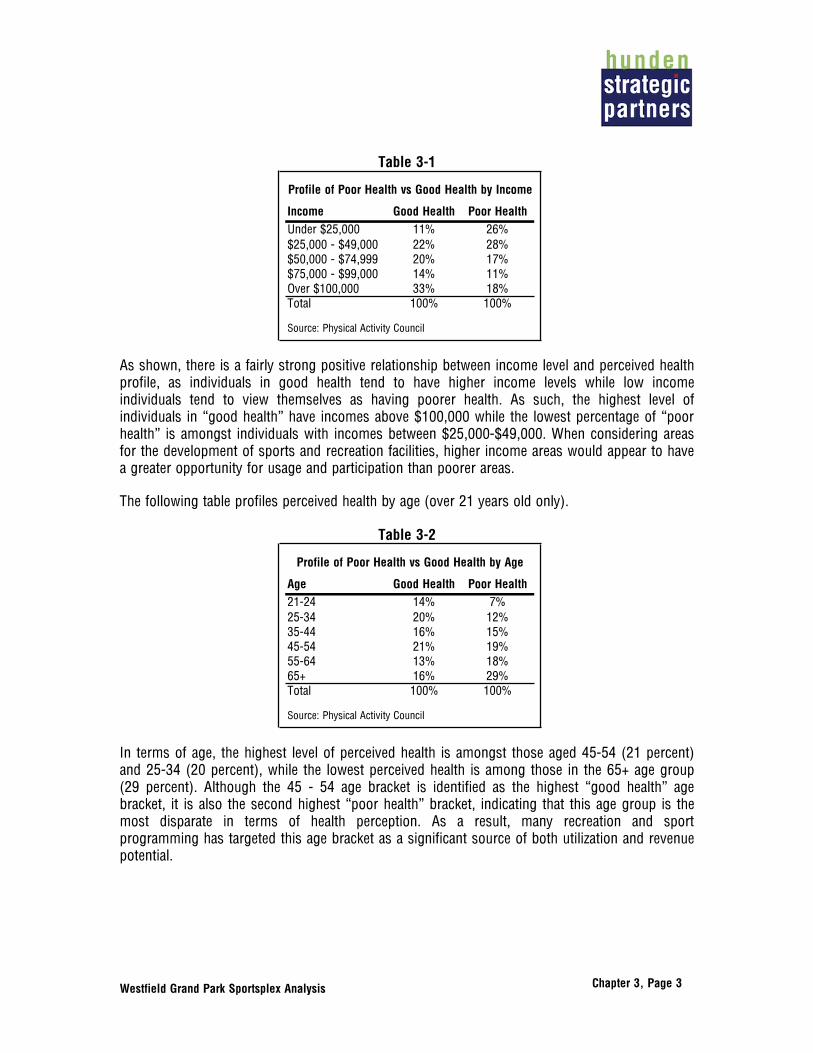
Westfield Grand Park Sportsplex Analysis Chapter 3, Page 3
Table 3-1
Profile of Poor Health vs Good Health by Income
Income Good Health Poor HealthUnder $25,000 11% 26%$25,000 - $49,000 22% 28%$50,000 - $74,999 20% 17%$75,000 - $99,000 14% 11%Over $100,000 33% 18%Total 100% 100%
Source: Physical Activity Council
As shown, there is a fairly strong positive relationship between income level and perceived health profile, as individuals in good health tend to have higher income levels while low income individuals tend to view themselves as having poorer health. As such, the highest level of individuals in “good health” have incomes above $100,000 while the lowest percentage of “poor health” is amongst individuals with incomes between $25,000-$49,000. When considering areas for the development of sports and recreation facilities, higher income areas would appear to have a greater opportunity for usage and participation than poorer areas.
The following table profiles perceived health by age (over 21 years old only).
Table 3-2
Profile of Poor Health vs Good Health by Age
Age Good Health Poor Health21-24 14% 7%25-34 20% 12%35-44 16% 15%45-54 21% 19%55-64 13% 18%65+ 16% 29%Total 100% 100%
Source: Physical Activity Council
In terms of age, the highest level of perceived health is amongst those aged 45-54 (21 percent) and 25-34 (20 percent), while the lowest perceived health is among those in the 65+ age group (29 percent). Although the 45 - 54 age bracket is identified as the highest “good health” age bracket, it is also the second highest “poor health” bracket, indicating that this age group is the most disparate in terms of health perception. As a result, many recreation and sport programming has targeted this age bracket as a significant source of both utilization and revenue potential.
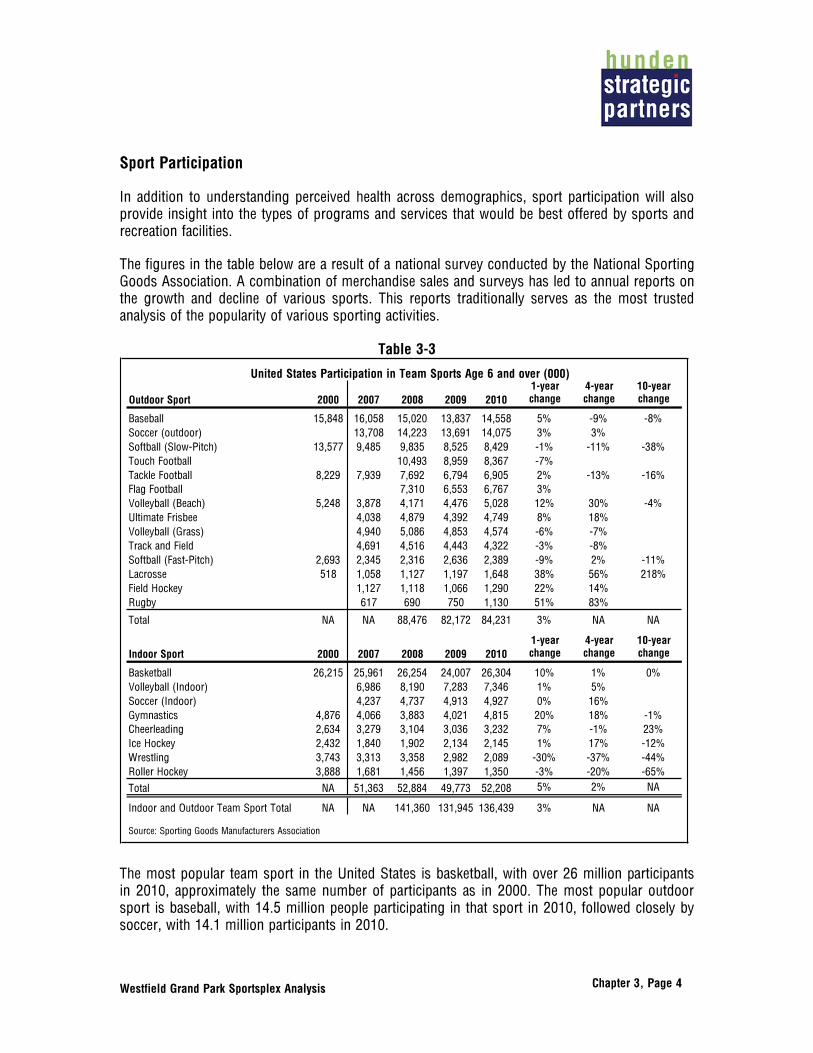
Westfield Grand Park Sportsplex Analysis Chapter 3, Page 4
Sport Participation
In addition to understanding perceived health across demographics, sport participation will also provide insight into the types of programs and services that would be best offered by sports and recreation facilities.
The figures in the table below are a result of a national survey conducted by the National Sporting Goods Association. A combination of merchandise sales and surveys has led to annual reports on the growth and decline of various sports. This reports traditionally serves as the most trusted analysis of the popularity of various sporting activities.
Table 3-3
United States Participation in Team Sports Age 6 and over (000)
Outdoor Sport 2000 2007 2008 2009 20101-year change
4-year change
10-year change
Baseball 15,848 16,058 15,020 13,837 14,558 5% -9% -8%Soccer (outdoor) 13,708 14,223 13,691 14,075 3% 3%Softball (Slow-Pitch) 13,577 9,485 9,835 8,525 8,429 -1% -11% -38%Touch Football 10,493 8,959 8,367 -7%Tackle Football 8,229 7,939 7,692 6,794 6,905 2% -13% -16%Flag Football 7,310 6,553 6,767 3%Volleyball (Beach) 5,248 3,878 4,171 4,476 5,028 12% 30% -4%Ultimate Frisbee 4,038 4,879 4,392 4,749 8% 18%Volleyball (Grass) 4,940 5,086 4,853 4,574 -6% -7%Track and Field 4,691 4,516 4,443 4,322 -3% -8%Softball (Fast-Pitch) 2,693 2,345 2,316 2,636 2,389 -9% 2% -11%Lacrosse 518 1,058 1,127 1,197 1,648 38% 56% 218%Field Hockey 1,127 1,118 1,066 1,290 22% 14%Rugby 617 690 750 1,130 51% 83%
Total NA NA 88,476 82,172 84,231 3% NA NA
Indoor Sport 2000 2007 2008 2009 20101-year change
4-year change
10-year change
Basketball 26,215 25,961 26,254 24,007 26,304 10% 1% 0%Volleyball (Indoor) 6,986 8,190 7,283 7,346 1% 5%Soccer (Indoor) 4,237 4,737 4,913 4,927 0% 16%Gymnastics 4,876 4,066 3,883 4,021 4,815 20% 18% -1%Cheerleading 2,634 3,279 3,104 3,036 3,232 7% -1% 23%Ice Hockey 2,432 1,840 1,902 2,134 2,145 1% 17% -12%Wrestling 3,743 3,313 3,358 2,982 2,089 -30% -37% -44%Roller Hockey 3,888 1,681 1,456 1,397 1,350 -3% -20% -65%
Total NA 51,363 52,884 49,773 52,208 5% 2% NA
Indoor and Outdoor Team Sport Total NA NA 141,360 131,945 136,439 3% NA NA
Source: Sporting Goods Manufacturers Association
The most popular team sport in the United States is basketball, with over 26 million participants in 2010, approximately the same number of participants as in 2000. The most popular outdoor sport is baseball, with 14.5 million people participating in that sport in 2010, followed closely by soccer, with 14.1 million participants in 2010.

Westfield Grand Park Sportsplex Analysis Chapter 3, Page 5
The total of all team sports has fallen from a high in 2008 of 141 million to 136 million in 2010. The outdoor sports’ participation decreased by four million over those three years, while the indoor sports decreased in 2009 but increased again in 2010 to almost the level of 2008.
The increase or decrease in popularity of a sport is also a key aspect for consideration in determining the type and size of a sports or recreation facility. As shown above, several outdoor team sports are increasing in popularity. Participation in lacrosse, while still at a low popularity level relative to other sports, increased from 518,000 to 1.6 million in ten years, an increase of over 200 percent. Rugby also increased in popularity, a four-year increase of 83 percent.
In comparison, several sports lost popularity during the same time period. Softball, both fast-pitch and slow-pitch, lost participants over the last ten years. Slow-pitch softball had 13.6 million participants in 2000, but only 8.4 million in 2010, a reduction of 38 percent. Baseball experienced an eight percent reduction, while tackle football had 16 percent fewer participants in 2010.
The reduction in participation in three popular outdoor sports is a concern for any facility that would market to those sports. Baseball and softball both still have a large participation base, but the sports declining in overall participation, despite the increase in travel programs (discussed elsewhere in this report). The developers of baseball and softball fields should take these trends into consideration when planning large-scale complexes.
In field sports, tackle football has declined in participation, as has touch football. Because these were such popular sports, any decline represents a significant number of participants. However, Lacrosse, although relatively small in participation, is surging in popularity. Soccer has seen a relatively small increase over the past ten years, but the total participation, 14.1 million, make it the third most popular sport overall and the second most popular outdoor team sport.
Participation by Gender
One of the most important trends in sports in the past fifty years is the growth of women’s sports and participation by girls and women in all areas of athletic activity. Once seen as a small subset of sports and athletics, current sports participation by girls and women has become close to, but not yet equal, with participation by boys and men. This major trend has increased the need for larger facilities, more leagues and more and larger tournaments at all levels and age groups of most sports.
Several factors have led to the increase in women’s sports participation, including the overall trend in society of equality for women in all areas of society. However, one of the most significant causes, and possibly the most significant reason, for the increases in women’s participation in athletics in general and team sports in particular was The United States Congress passing Title IX of the Education Amendments of 1972, more specifically described as “Title IX”. This law states:

Westfield Grand Park Sportsplex Analysis Chapter 3, Page 6
No person in the United States shall, on the basis of sex, be excluded from participation in, be denied the benefits of, or be subjected to discrimination under any education program or activity receiving Federal financial assistance...
The results of this law were profound, but especially in the area of high school and university sports. The result of the law was to require each school system to establish a sports program for females equivalent to the existing programs for males.
The results of the increased emphasis on girls’ and women’s sports were profound. The following table sets out the participation rates in high schools for girls in the past three decades.
Table 3-4 High School Sport Participation By Gender
Gender 1971-72 2010-11Percent Increase
Female 294,015 3,173,549 979%Male 3,666,917 4,494,406 23%
Source: National Federation of State High School Associations
The overall population of the U.S. increased by 52 percent from 1970 to 2010, yet male participation in high school sports increased only 23 percent during a similar period. Meanwhile, female participation increased by 979 percent, from less than 300,000 in 1971-72 to nearly 3.2 million in the 2010-11 school year.
Similar growth occurred in college sports, as shown by the table below.
Table 3-5 NCAA/College Sport Participation By Gender
Gender 1971-72 2009-10Percent Increase
Female 29,972 186,460 522%Male 170,384 249,307 46%
Source: ncwge.org, NCAA
While not as large as the gains for females in high schools, the college and university participation for females increased 522 percent, from 30,000 in 1971-72 to 186,460 in 2010-11.
The increase in popularity of women’s sports has moved into youth team sports as well. Before Title IX and in the early 1970s, organized girls’ youth sports were minimal at best, and in most areas did not exist on an organized level.

Westfield Grand Park Sportsplex Analysis Chapter 3, Page 7
The table below shows the level of sports involvement for both genders in elementary school, middle school and high school.
Table 3-6 Involvement in Sports by Gender and Grade Level
Gender Non-Athlete
Moderately Involved Athlete
Highly Involved Athlete
Total Athletes
3rd - 5th GradeGirls 30% 49% 21% 70%Boys 22% 43% 35% 78%
6th - 8th GradeGirls 28% 49% 23% 72%Boys 23% 41% 36% 77%
9th - 12th GradeGirls 34% 53% 14% 67%Boys 31% 48% 22% 70%
Source: Women's Sports Foundation
As shown by the table above, derived from a study of youth sports by the Women’s Sports Foundation in 2008, more than 70 percent of girls have some involvement in sports throughout elementary and middle school. The figures are higher for boys, especially for the highly involved athlete, which the study defined as playing more than two sports. The study also determined that by eleventh and twelfth grade the participation in organized sports declined to 69 percent of boys and 64 percent of girls.
The study also noted some concerns, including the finding that involvement in sports corresponded with schools having physical education programs. Those schools that had no or limited physical education programs had fewer participants in organized sports for both genders. Furthermore, the most underserved populations in organized sports were in urban areas. Girls’ sports especially had lower participation figures than their suburban or rural counterparts.
Team Sports and Age Groups
The age of an individual is an important characteristic to determine whether a person will participate in team sports, including the popular team sports of baseball, softball, football, soccer and lacrosse. Three age categories are important in the consideration of sport trends generally and the trends that will affect the proposed sports complex in Westfield: youth sports, high-school sports and adult recreational sports.
The table below sets out the population of the nation, the state, and the local area by age.

Westfield Grand Park Sportsplex Analysis Chapter 3, Page 8
Table 3-7 2010 United States, State and Local Population by Age (000)
Age Group
United States
Percent of Total Indiana
Percent of Total
Indianapolis/ Carmel MSA
Percent of Total
Hamilton County
Percent of Total Westfield
Percent of Total
Under 5 20,201 7% 434 7% 128 7% 22 8% 1 3%5 to 19 53,980 17% 1,373 21% 379 22% 67 24% 8 27%20 to 44 112,807 37% 2,120 33% 606 35% 92 33% 11 37%45 to 64 81,489 26% 1,716 26% 453 26% 70 25% 8 27%65+ 40,268 13% 841 13% 190 11% 24 9% 2 7%
Total 308,745 100% 6,484 100% 1,756 100% 275 100% 30 100%
Source: United States Census
The age demographics of Hamilton County and the City of Westfield show that the population in the area is younger than in the State of Indiana and the United States as a whole. The key age group of five to nineteen is approximately 17 percent of the population in the United States as a whole. However, that age range represents approximately 22 percent of the Indianapolis/Carmel area population, 24 percent of the Hamilton County population, and 27 percent of Westfield’s population. Specifically, Westfield had 8,000 residents in this age category and Hamilton County had 67,000.
The above table shows that a large portion of the Westfield area population, approximately one-quarter of the entire local population, fits in the demographic of youth sports that would use a facility like the planned Grand Park. Non-school youth sports create a large demand for fields, and this category will provide the largest group of participants and teams that might use the proposed facility. Many youth sports are highly organized and have developed teams that travel to regional and sometimes national tournaments.
Youth Sports
The table below shows the percentage of youth participation in team sports, based on a 2008 survey (the latest available), for those aged five to 19.
Table 3-8 Youth Participation in Team Sports
Within One Year of Survey*
Category Percent
Currently Participate 72%Participated within Past Year 12%Did not Participate 15%
*Both Genders
Source: Women's Sports Foundation

Westfield Grand Park Sportsplex Analysis Chapter 3, Page 9
As the table shows, 72 percent of youth currently participate in team sports, while another 12 percent have participated within the last year. Therefore, a total of 84 percent of youth had participated in some form of team sport within the past year of the survey. While some of these participants would be at the interscholastic level, a large percentage (unknown within that survey) would be in the non-school youth sports community.
Organization of youth sports throughout the United States historically has begun at the local community level. Recreational sports for children, especially those who do not yet attend high school, are organized for the most part by local volunteer organizations of concerned parents and organized sports enthusiasts who want to provide the opportunity for children to take part in team sports. The grass roots level of most organized sports for young children provides instruction, education, and the opportunity for the participants to be part of a team experience.
Non-scholastic youth sports at the local level generally have one of five types of governance structures:
1. Local non-profit volunteer organizations – This includes groups that offer one or several sports for youth in a locality, managed by a board of directors and rent or use public parks or public school facilities. These organizations provide all supervision and decisions on rules, officials, and administration without guidance and sanction from regional or national groups. Locally, Westfield Youth Sports, Inc (WYSI)., is a group using this model.
2. Local non-profit organizations that are subsidiaries of regional or national organizations – Some sports are more organized, such as soccer and baseball. Local volunteer organizations form using the model of a regional or national organization. The local league uses the standardized rules of the national organization, pays part of the fees it collects to the governing body, and often takes part in regional or national tournaments that the national body organizes and manages. Local examples of this type of model include the Westfield Youth Soccer Association (WYSA), a subdivision of the Indiana Soccer Association (ISA) and the US Youth Soccer Association (USYSA), as well as the Westfield Little League.
3. Municipal or other governmental recreation departments – Many local Parks and Recreation Departments in larger towns and cities provide youth recreational programs through the facilities in the locality. These programs are usually dependant on local volunteers to manage and coach teams and possibly provide management of the leagues, but the department employees supervise most of the leagues and manage many of the sports. The league games and practices usually take place at several smaller facilities throughout the area. Locally the Hamilton County Parks Department does not offer any youth sports, while the Indianapolis/Marion County Parks and Recreation Department offers youth football, volleyball, and basketball.
4. Facility-based programs – Larger sports complexes, both privately and publicly owned, often offer youth sports programming at the facility. Employees at the complex run the leagues, relying on volunteers to create and coach teams that take part in the league.

Westfield Grand Park Sportsplex Analysis Chapter 3, Page 10
Hamilton County does not offer any examples of this type of youth sports programming. Examples at large sports complexes include soccer leagues at the National Sports Center in Blaine, Minnesota, and lacrosse leagues at the SoccerPlex in Montgomery County, Maryland.
5. Private youth programs – A growing trend in many youth sports, discussed more fully below, is for private organizations to run leagues for youth, usually older children and junior high school teenagers. These leagues are usually for youth with better abilities, and the leagues and other programs develop youth for more elite “travel teams” that play other teams in similar organizations regionally, statewide, or for the most elite teams nationally. Examples locally are the Westfield-based Roundtrippers baseball program, which offers a developmental league for several age groups.
Based on interviews, research and review of the facilities throughout the region and the United States, the current trends in youth sports programs show that the programs and leagues are becoming more structured, using national and regional organizations to generate interest. As the budgets of municipalities become tighter, fewer funds are becoming available for recreation programming, so the sports leagues run by recreation departments are being cut. The areas that continue to grow are private and non-profit organizations.
The non-scholastic outdoor youth sports that appear to have the largest following, soccer and baseball, are also the sports that have national or international groups that standardize the sport. These are described below.
Soccer
One of the largest non-high school youth sports organizations is the United States Youth Soccer Association, a national not-for-profit group that promotes youth soccer. The Indiana Youth Soccer Association is an affiliate of the national group. Each state has an organization that oversees local recreational and competitive soccer leagues and teams within that state. The competitive teams then meet for state-wide tournaments, with the best teams advancing to the regional and then national tournament each year.
The table below is a listing of the number of national and Indiana registrants in the US Youth Soccer Association for the past three years.
Table 3-9 United States and Indiana Youth Soccer Association
Annual Registrations
Category 2007-08 2008-09 2009-10
United States 3,148,114 3,094,858 3,036,438Indiana 58,450 56,010 55,314
Source: US Youth Soccer Association

Westfield Grand Park Sportsplex Analysis Chapter 3, Page 11
As shown in the table above, over three million youth in the United States have registered each year in the United States Youth Soccer Association Programs. Indiana has had over 55,000 youth each year in the programs. While the number of registrations has declined slightly over the last three years, this is likely due to the downturn in the economy.
Baseball
The largest international youth sports organization is Little League Baseball and Softball, officially known as Little League Baseball, Incorporated. This organization oversees and standardizes rules and games for youth baseball, and more recently softball, for local groups throughout the United States, Canada, and internationally. Little League, begun in 1939, has a strong organization and name recognition for youth baseball. It recently has begun softball leagues for both boys and girls.
Little Leagues are organized at the community level through volunteers, both at the organizational level and as managers, coaches and umpires. Each community program provides leagues for different age levels, in both baseball and softball. In 2010, 7,123 Little League programs existed throughout the United States and in 78 other countries.
The leagues are organized as shown on the following table.
Table 3-10 Little League Participation 2010
Division Age Teams Participants Year Begun
Little League Baseball Under 12 100,000+ 1.9 Million 1939Junior League Baseball 13-14 9,735 146,025 1981Senior League Baseball 14-16 4,155 62,325 1961Big League Baseball 16-18 1,271 19,065 1968Girls Little League Softball under 12 18,320 274,800 1974Girls Junior League Softball 13-14 2,239 33,585 2000Girls Senior League Softball 13-16 2,035 30,525 1974Girls Major League Softball 14-18 400 6,000 1980
Source: Little League International
By far the largest division, as shown by the above table, and the division for which the Little League is most known, is the Little League Baseball Division. This division is for children younger than twelve. This division also includes a Tee Ball league for children four to eight years old, without live pitching. The Minor League is an instructional program for children under twelve, and the Major League is a more competitive division for eleven and twelve-year-olds. The Major League has local, state-wide and regional tournaments, leading to the Little League World Series at Williamsport, Pennsylvania each year.
This division uses a smaller field, with sixty feet between the base pads and a 46-foot pitcher’s mound. Both boys and girls can participate in the leagues. A new program has been introduced

Westfield Grand Park Sportsplex Analysis Chapter 3, Page 12
for twelve- and thirteen-year-olds, called the 50/70 Division. This program, using a fifty-foot pitching distance and seventy-foot base distances, has been added for some 11-12 age group teams as well. This effort is seen as trying to stem the loss of some players to more “elite travel teams” that use the larger fields at lower ages.
Little League also has established leagues for older players. The Junior League, the Senior League and the Big League baseball leagues are for junior high and high school aged players. These leagues have a considerably smaller number of participants. The largest is the Junior League, for the 13 - 14 year age group, with 146,000 participants in 2010, more than ten times smaller than the Little League Baseball division.
Little League has also established several girls’ softball leagues on the same model as the baseball leagues. These leagues do not have the participation levels of baseball. Little League has also begun boys’ softball leagues, the “Challenger Division” for children with developmental and physical challenges, and a “Second Season” developmental program for the fall and winter months.
In recent years Little League has received major visibility and publicity of its Little League World Series, the regional and international tournament for the Major League (11 – 12 year-old division), held every year at regional sites, culminating at the World Series site in Williamsport, Pennsylvania. ESPN and its affiliated stations broadcast the World Series, which consists of eight teams from the United States, Canada, Central and South America, Asia and Europe. Begun in 1947, the first non-Pennsylvania team to win was in 1949, the first international team, Mexico, won in 1957, and the first team from outside the Americas, Japan, won in 1967. Because of the television coverage the Little League World Series has become increasingly popular but also criticized for emphasizing elite teams over participation.
Travel Teams
A major and growing trend in youth sports is the growth of elite or travel teams throughout the United States. Begun as a way to play a chosen sport in the summer months for high school team sports participants, the trend has increasingly become less tied to high school programs and has included younger players. In some sports, such as basketball and baseball, independent travel teams have become the most important forum for college recruiting and scouting. This has placed more and more emphasis on travel team sports for those players seeking scholarships to major Division I colleges, and even in a few instances going directly to professional sports after high school.
The traditional youth team sport structure was to have younger children receive initial education and training in a sport through the recreational programs at the local level, either through local leagues or in a more structured environment such as Little League or US Youth Soccer. Children would play the sport of the season, soccer or football in the fall, indoor sports such as basketball, volleyball or wrestling in the winter, and baseball or softball in the spring. The youth would “graduate” from local recreational leagues and begin playing interscholastic sports in junior high school. Many teenagers would stop playing sports by high school, when teams began to become

Westfield Grand Park Sportsplex Analysis Chapter 3, Page 13
selective, taking the most elite players for the varsity high school teams. However, the best athletes often would play three or more sports in a year.
Throughout the last three decades youth team sports have gone through a transformation in structure and emphasis, and travel teams are the result, and sometimes part of the reason, for that change. Junior high schools became middle schools, with younger students, but with budgets that often did not permit a large team sports emphasis. Therefore youth that wanted to continue in a sport beyond the recreational level needed another venue to play. Also as competition became more intense, especially for college scholarships and the dream of professional sports, more and more players began choosing one sport and training in the off-season, instead of playing the sport of the season.
Travel teams began to form to give youth the ability to play sports at a higher level against better competition, and also to train in the traditional off-season for that sport. While each team sport has travel teams throughout the United States, the most organized and one of the earliest to become popular was the national governing body of non-scholastic youth basketball, the Amateur Athletic Union, or AAU.
Before 1978 the AAU was the de facto governing body of all amateur sports that were involved with the Olympics. Almost every Olympic athlete in the United States trained through and was governed by the sport’s division of the AAU. The organization did not emphasize youth sports until after 1978, when Congress established the United States Olympic Commission and a national governing body for each Olympic sport. Having lost its job as national Olympic organizer, the AAU turned to youth sports.
The AAU established the now-universal model of having youth compete in specific age levels against each other, the “U18, U17, U16...” teams, as well as establishing national tournaments for each age group. Basketball was the sport in which the AAU had the most success. By 1989 the AAU had national championships for thirteen age groups for boys and girls.
In the AAU model, a locality would create a team of players from around the area in a specific age group. That team would compete with other teams in the area. No rules existed on who the team could field other than age and location, so a team could select players from different high schools around the area to field a more competitive team. As competition became better and college recruiting began using the AAU regional and national tournaments as places to see more talented players in one place, teams began trying to get more local “all-star” or “elite player” teams instead of an extension of a high school team.
The AAU basketball system has become important in the development of young players and as a recruiting and scouting system for college coaches and professional scouts. The AAU summer programs may be more important to those coaches and scouts than the high school programs. Most elite team tournaments, now national tournaments sponsored by major shoe companies, are during the summer when college coaches can spend the majority of time recruiting, instead of during the high school basketball season which coincides with the college season. More “elite” players are brought together for one week or weekend, so that the coaches can see several

Westfield Grand Park Sportsplex Analysis Chapter 3, Page 14
players at once. Finally, several different age groups are spotlighted, so that players, even those who are not yet in high school, can play in games that Division I college coaches attend.
The travel team system, popularized by the AAU in basketball, has spread to most other team sports. The majority of travel teams are those who only compete against teams within a small region with participants who want to compete in the sport in the high school off-season. However, more and more teams are becoming “elite” or “all-star” teams that promise better instruction, higher levels of competition, and greater visibility.
Several sports have national bodies that oversee the travel schedule and tournaments, one of the largest and most organized being the United States Youth Soccer Association (USYSA), discussed above. The USYSA holds regional and national tournaments each year for U14 through U19 teams in both boys and girls programs. It works through state organizations that oversee the local teams.
In Indiana, the Indiana Soccer Association (ISA) is the statewide affiliate of USYSA. The table below is a list of the travel team participants in Indiana for the ISA for the past decade.
Table 3-11 Indiana Soccer Association
Travel Teams and Participants 2010-2011
Soccer Season (Fall/Spring)
Groups with Travel Teams
Percent Increase Participants
Percent Increase
2000-2001 120 15,2792005-2006 97 -19% 17,221 13%2010-2011 80 -18% 16,767 -3%
Source: Indiana Soccer Association
As the table shows, there are eighty different organizations in Indiana that have travel teams in the ISA for the 2010-2011 season. This figure is actually lower than the number that existed in the 2000-2001 season. However, the number of overall participants has increased, from 15,279 in 2000-2001 to 16,767 in 2010-2011. These local organizations might have one travel team or have one per gender per age group. The largest number of travel teams and participants is the Carmel United Soccer Club, with a total of 823 youth on travel teams in the 2010-2011 season.
Other regional and national youth soccer associations for travel teams have also formed. While not as organized as the USYSA or as successful in participation numbers, these other groups also create a venue for travel teams, providing tournaments and “national” championships for the teams. US Club Soccer is a large national group with annual regional and national championships for member teams, as well as sponsored tournaments throughout the year for teams U11 through U19.
Baseball also has a very strong travel team presence in youth baseball. However, baseball does not have one strong national organization that provides leadership, set rules and national

Westfield Grand Park Sportsplex Analysis Chapter 3, Page 15
tournaments. Several groups have competing tournaments and championships, both regionally and nationally. Local and regional travel teams and clubs are organized and play in national or regional events organized by many different groups.
Sports for girls such as softball and volleyball do not have as many travel teams and elite tournament opportunities, but they are growing in number. The current trend is that girls’ youth sports are organizing more travel teams. Sports with lower participation, such as lacrosse and rugby, have had travel teams for some time, because most localities do not have the participants to create leagues. These teams travel regionally to find competition. The current trend shows that these sports are also beginning to develop elite tournaments and regional all-star teams to compete on a national level.
What began as an outlet for high school athletes during the sport’s off-season has become a trend that has created travel teams for younger youth. Basketball has national tournaments for as young as U10 “elite” teams throughout the summer. The USYSA has a national championship for U14 boys and girls teams, while the national championships for US Club Soccer is for U13 teams. Baseball has “elite” travel teams that compete for players with the Little League in the 12 - 13 age group.
The travel team concept, while increasing in popularity, is also seeing increased scrutiny and criticism. At the highest levels the “elite” travel teams, especially in basketball, have become about sponsorships and money. International shoe and other companies sponsor tournaments and even teams, giving funds for travel and free clothing and shoes to players at younger and younger ages in the hopes of eventually having that brand linked to the next NBA star. Coaches sometimes receive pay from these companies.
With travel teams that do not receive major sponsorships, the time commitment and cost of the travel teams can be burdensome on parents, who have to pay fees to the teams plus all travel expenses for the children and themselves. A travel team might participate in several regional and one or two national tournaments per year, with the parents paying for all expenses.
Another major criticism is the emotional and psychological impact on the youth. Travel teams place more emphasis on winning and the “elite” or “all-star” status of the participants. The pressure to win and to succeed is heightened, especially with coaches who have no supervision or in many cases no training.
The trend of having travel teams and tournaments may be peaking, due to several factors. The criticism of some aspects of travel teams, along with the growing cost and time commitment, may grow to force a slowdown of youth sports travel teams. However, presently travel teams are a large part of the existing youth sports culture and those teams will continue to be a major aspect of youth team sports in the near future.

Westfield Grand Park Sportsplex Analysis Chapter 3, Page 16
High School Sports
High school sports have a large number of participants, but these sports usually have facilities at the schools. However, regional or state-wide tournaments seek larger complexes such as that planned for Westfield’s Grand Park. Also, the number of participants in high school sports would be an indicator of the participants in off-season team and club sports that would use the facilities.
The table below shows the field team sports participation in high schools throughout the United States.
Table 3-12
United States High School Field Sports Participation2002-2003 through 2009-2010
Year Football BaseballSlow-Pitch
SoftballFast-Pitch Softball
Soccer - Boys
Soccer - Girls
Lacrosse - Boys
Lacrosse - Girls
2002/2003 1,023,142 453,792 11,111 357,912 345,156 301,450 50,006 38,8852003/2004 1,032,682 457,146 10,645 362,468 349,785 309,032 53,436 43,0992004/2005 1,045,494 459,717 11,283 364,759 354,587 316,104 59,993 48,0862005/2006 1,071,775 470,671 10,793 369,094 358,935 321,555 65,044 51,9772006/2007 1,104,548 477,430 12,511 373,448 377,999 337,632 71,524 54,7712007/2008 1,108,286 478,029 13,705 371,293 383,561 346,545 82,860 61,0862008/2009 1,112,303 473,184 11,433 368,921 383,824 344,534 88,546 64,9292009/2010 1,109,278 472,644 13,565 378,211 391,839 356,116 90,670 68,768Percent Change 02/03 to 09/10
8% 4% 22% 6% 14% 18% 81% 77%
Source: National Federation of State High School Associations
As the table above shows, the most popular high school field sport is football, with over 1 million participants. Baseball is the second largest, with over 470,000 participants, while the combined totals for boys’ and girls’ soccer is approximately 750,000. Softball has almost 400,000 participants, while lacrosse is the smallest field sport, with approximately 160,000 total for both genders, however it has increased at the fastest rate.
Even though the sport has the fewest participants, the growth of lacrosse is significant. Boys’ lacrosse has grown 81 percent in seven years, while girls’ lacrosse has grown 77 percent. Baseball and fast-pitch softball have increased the least, at four and six percent respectively, while soccer is increasing dramatically, with fourteen percent increase in participation for boys and eighteen percent for girls.
The following table sets out the Indiana high school field sports participation for the last eight years.

Westfield Grand Park Sportsplex Analysis Chapter 3, Page 17
Table 3-13
Indiana High School Field Sports Participation2002-2003 through 2009-2010
Year Football BaseballSlow-Pitch Softball*
Fast-Pitch Softball
Soccer - Boys
Soccer - Girls
Lacrosse - Boys*
Lacrosse - Girls*
2002/2003 20,218 11,212 NA 8,750 7,349 5,737 NA NA2003/2004 21,609 11,868 NA 9,529 7,932 6,204 NA NA2004/2005 22,043 11,652 NA 10,070 8,227 6,687 NA NA2005/2006 22,576 11,402 NA 9,306 8,217 6,736 NA NA2006/2007 22,918 11,758 NA 9,763 8,478 6,905 NA NA2007/2008 23,106 11,659 NA 9,252 8,385 6,538 NA NA2008/2009 23,241 11,509 NA 8,918 8,465 6,554 NA NA2009/2010 23,023 11,350 NA 8,967 8,575 6,558 NA NA
Percent Change 02/03 to 09/10 14% 1% NA 2% 17% 14% NA NA
*No Indiana Data For Slow Pitch Softball and Lacrosse
Source: National Federation of State High School Associations
The National Federation of State High School Associations reported no data for lacrosse or slow-pitch softball in Indiana. The table shows that football is the most popular sport in the state, with 23,000 participants in the 2009-2010 school year, while the total of boys’ and girls’ soccer was second with over 15,000 team members. Baseball had 11,350 participants that year.
The increase in participations in the sport shows that soccer grew quickly, a seventeen percent increase for boys and a fourteen percent increase for girls. Football also grew significantly, with a fourteen percent increase in participants. Baseball and softball increased very little over the last eight years. When considering that the population of Indiana increased at a rate of 6.6 percent over the past ten years, baseball and softball are not growing as fast as the population.
Adult Recreational Sports
Adult recreational team sports provide a major potential uses of fields for an outdoor sports facility. The table below sets out the data for adult sports participation for the major outdoor team sports in the United States as of 2009, the latest available data.
Table 3-14 Adult Team Field Sport Participation (000) - 2009
Gender Age
Sport Total Male Female 7 to 12 13 to 17 18 - 24 25 - 34 35 - 44 45 - 54 55 - 64 65+
Baseball 11,507 9,314 2,193 3,971 2,727 1,078 776 1,412 727 502 316 4,811 42% Football--tackle 8,890 7,912 978 1,672 3,435 2,032 497 635 205 184 232 3,785 43% Soccer 13,578 7,732 5,846 5,129 3,228 1,692 1,223 1,398 608 171 130 5,222 38%
Softball 11,829 5,977 5,852 1,821 2,226 1,910 2,239 1,771 1,271 430 160 7,781 66%
Source: Sporting Goods Manufacturers Association, US Census
Percent of Total
Total Adult

Westfield Grand Park Sportsplex Analysis Chapter 3, Page 18
The table above shows that adults are the majority of participants of most of the major outdoor team sports. Adult participants in softball are 66 percent of all participants, while adult baseball players are 42 percent of all participants. Surprisingly, tackle football has a large group of adult participants as well, 43 percent of the total. The sport with the lowest level of participation is soccer, with adults comprising less than forty percent of the total. Soccer has the highest level of participation at the 7 to 12 age group, with over 5 million participants, so that high participation level creates a lower percentage for the adults.
For the specific sports reported in the table above, the majority of the participation is from two age groups, 18 to 24 and 25 to 34. The table below sets out the percentages of participants by age group.
Table 3-15 Adult Team Field Sport Participation Percentage (000) - 2009
Sport 18 - 24 25 - 34 35 - 44 45 - 54 55 - 64 65+ Total 18 - 34Percent of Total 35+
Percent of Total
Baseball 1,078 776 1,412 727 502 316 4,811 1,854 39% 2,957 61% Football--tackle 2,032 497 635 205 184 232 3,785 2,529 67% 1,256 33% Soccer 1,692 1,223 1,398 608 171 130 5,222 2,915 56% 2,307 44% Softball 1,910 2,239 1,771 1,271 430 160 7,781 4,149 53% 3,632 47%Population* 21,322 40,956 42,240 44,233 33,622 38,795 221,168 62,278 28% 158,890 72%
*Population age group is 20 - 24Source: Sporting Goods Manufacturers Association, US Census
As shown by the table above, the majority of all team field sport participants are under the age of 35. Football has a majority of young participants, with 67 percent under 35. Even though the adult population of the United States under age 35 is only 28 percent of the adult population, participation by those under 35 in each of the sports listed is over half of the total participants.
A broader review of adult team sports in general shows an even wider disparity in age categories. The following table sets out team sport participation by age category.
Table 3-16
United States Post-CollegeTeam Sports Participation
AgeParticipants
(Million)Percent of
Total
21 - 30 32.3 62%31-45 12.3 24%46+ 7.4 14%
Total 52 100%
Source: Sporting Goods Manufacturers Association

Westfield Grand Park Sportsplex Analysis Chapter 3, Page 19
The table above shows that 62 percent of all adult team sport participants are age 30 and younger. Of the 52 million participants over 32 million are in the 21 to 30 age group, and only 14 percent are over age 45.
Trends in Multi-Use Field Development
With the increase in popularity of soccer and other youth sports over the past decade, facilities have been constructed to fit trends in field development. The following are trends that have occurred in such developments.
Synthetic Turf Fields
With the increasing popularity of youth sports, developers and owners of multi-sports fields have turned to constructing synthetic turf athletic fields. The new synthetic turf differs from old artificial turf that was originally popular with the National Football League and other football fields. The synthetic turf appears more like natural grass and can extend the usage time of a field. However, negatives also exist with synthetic turf fields. The following are a short list of positives and negatives of synthetic turf fields.
Positives:
More available time for use because synthetic turf can absorb more wear and tear than grass fields.
Properly drained synthetic turf will dry faster after rain and can allow for play during inclement conditions without harming the field.
Synthetic fields hold paint longer and offer better permanent lines.
Negatives:
Synthetic fields absorb heat and can be very hot on sunny and hot days, requiring extra irrigation.
Maintenance issues such as cleaning, erasing temporary lines, and disinfecting the field can occur.
Annual maintenance costs, including replacement every six to ten years depending on usage, probably are higher than grass fields. A study by Dan Fresenburg in 2006, presented at the annual turf industry exposition, determined that using a 16-year time period (which would include the original purchase and replacements of synthetic fields) the annual cost of each field would be:
a. Natural soil-based field - $33,522
b. Sand-cap Grass Field - $49,318
c. Basic Synthetic Field - $65,846
d. Premium Synthetic Field - $109,013.

Westfield Grand Park Sportsplex Analysis Chapter 3, Page 20
Therefore, even though a synthetic field is a trend that might allow for greater use, it could also cost more to maintain and replace over the long run.
Multi-Field Sport Parks
One major trend in youth sports is the rise of travel teams that participate in regional, state-wide or multi-state tournaments. This trend has led to more youth being involved as a single-sport participant, especially as the participant ages and moves into higher skill levels above age 12 or 13. The result of this trend is that localities have begun to understand the economic benefits of hosting such tournaments. Therefore, more localities are developing sport parks with the intention of not only providing the local community with sport opportunities, but economic benefits as well. The sport parks are built with the intention to encourage regional, multi-day tournaments that will bring participants and families to the area to stay overnight and contribute to the local economy.
The demands on the new multi-field parks are increasing due to increased competition. To attract regional and even national tournaments, the sports parks are adding amenities such as championship-quality fields, an arena-type field for playoffs and finals, and higher levels of quality in bathrooms, concessions, and other facilities. These demands drive the costs of the facilities higher.
Localities that construct such multi-field facilities can take advantage of the travel teams of the sports, mainly soccer. However, at some point specific areas could become saturated with multi-use fields. Supply will overtake demand and to remain competitive facilities will have to provide more services and a lower cost. The convention center industry is a recent victim of creating an oversupply due to communities attempting to race to the top in terms of amenities and facilities, beyond what the economics of the industry could support. The industry now struggles due to the oversupply.
Growth of Private Theme and Travel-Team Parks
One trend that is occurring in youth and travel team baseball is the development of baseball facilities that host leagues and tournaments that are either publicly owned and privately managed or privately owned and managed. These facilities exist mostly in warm-weather areas of the country and provide high-quality fields, concessions and other amenities. The facilities are designed to attract travel-team tournaments and attempt to create a profit for the owners of the facilities.
The organization that exemplifies this type of facility is Big League Dreams. The private company Big League Dreams (BLD) works with localities to develop a certain type of multi-sports facility, with the emphasis on baseball and softball. Each field in the complex is a small replica of a specific Major League Baseball ballpark, which increases the appeal of the facility. The municipality pays to build the facility, but Big League Dreams provides the plans and oversees the construction. The company then manages the facility and pays a fee to the locality.
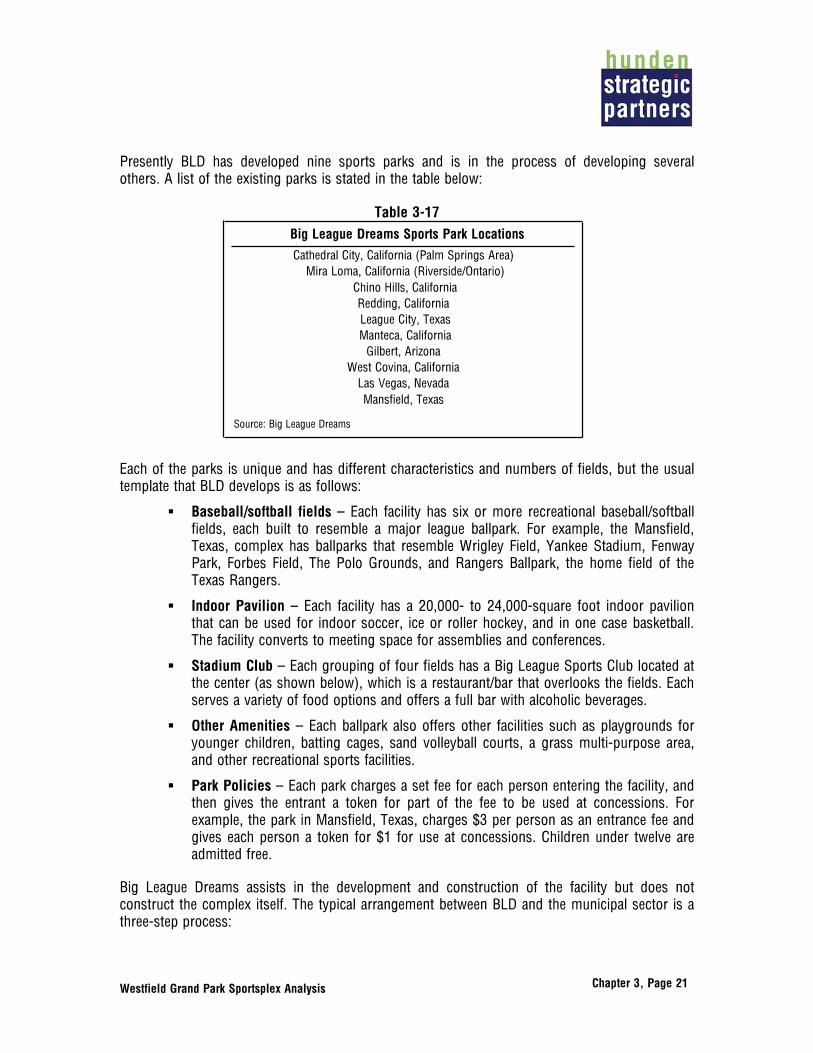
Westfield Grand Park Sportsplex Analysis Chapter 3, Page 21
Presently BLD has developed nine sports parks and is in the process of developing several others. A list of the existing parks is stated in the table below:
Table 3-17 Big League Dreams Sports Park Locations
Cathedral City, California (Palm Springs Area) Mira Loma, California (Riverside/Ontario)
Chino Hills, CaliforniaRedding, California League City, Texas Manteca, California
Gilbert, ArizonaWest Covina, California
Las Vegas, NevadaMansfield, Texas
Source: Big League Dreams
Each of the parks is unique and has different characteristics and numbers of fields, but the usual template that BLD develops is as follows:
Baseball/softball fields – Each facility has six or more recreational baseball/softball fields, each built to resemble a major league ballpark. For example, the Mansfield, Texas, complex has ballparks that resemble Wrigley Field, Yankee Stadium, Fenway Park, Forbes Field, The Polo Grounds, and Rangers Ballpark, the home field of the Texas Rangers.
Indoor Pavilion – Each facility has a 20,000- to 24,000-square foot indoor pavilion that can be used for indoor soccer, ice or roller hockey, and in one case basketball. The facility converts to meeting space for assemblies and conferences.
Stadium Club – Each grouping of four fields has a Big League Sports Club located at the center (as shown below), which is a restaurant/bar that overlooks the fields. Each serves a variety of food options and offers a full bar with alcoholic beverages.
Other Amenities – Each ballpark also offers other facilities such as playgrounds for younger children, batting cages, sand volleyball courts, a grass multi-purpose area, and other recreational sports facilities.
Park Policies – Each park charges a set fee for each person entering the facility, and then gives the entrant a token for part of the fee to be used at concessions. For example, the park in Mansfield, Texas, charges $3 per person as an entrance fee and gives each person a token for $1 for use at concessions. Children under twelve are admitted free.
Big League Dreams assists in the development and construction of the facility but does not construct the complex itself. The typical arrangement between BLD and the municipal sector is a three-step process:
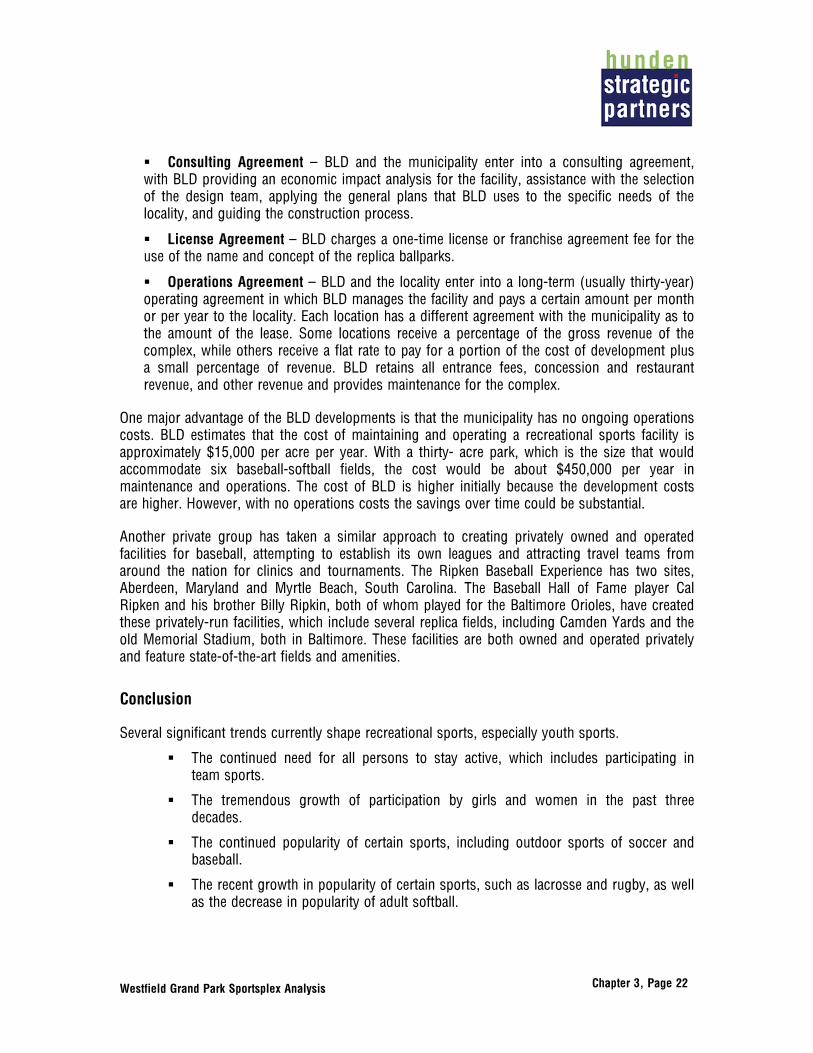
Westfield Grand Park Sportsplex Analysis Chapter 3, Page 22
Consulting Agreement – BLD and the municipality enter into a consulting agreement, with BLD providing an economic impact analysis for the facility, assistance with the selection of the design team, applying the general plans that BLD uses to the specific needs of the locality, and guiding the construction process.
License Agreement – BLD charges a one-time license or franchise agreement fee for the use of the name and concept of the replica ballparks.
Operations Agreement – BLD and the locality enter into a long-term (usually thirty-year) operating agreement in which BLD manages the facility and pays a certain amount per month or per year to the locality. Each location has a different agreement with the municipality as to the amount of the lease. Some locations receive a percentage of the gross revenue of the complex, while others receive a flat rate to pay for a portion of the cost of development plus a small percentage of revenue. BLD retains all entrance fees, concession and restaurant revenue, and other revenue and provides maintenance for the complex.
One major advantage of the BLD developments is that the municipality has no ongoing operations costs. BLD estimates that the cost of maintaining and operating a recreational sports facility is approximately $15,000 per acre per year. With a thirty- acre park, which is the size that would accommodate six baseball-softball fields, the cost would be about $450,000 per year in maintenance and operations. The cost of BLD is higher initially because the development costs are higher. However, with no operations costs the savings over time could be substantial.
Another private group has taken a similar approach to creating privately owned and operated facilities for baseball, attempting to establish its own leagues and attracting travel teams from around the nation for clinics and tournaments. The Ripken Baseball Experience has two sites, Aberdeen, Maryland and Myrtle Beach, South Carolina. The Baseball Hall of Fame player Cal Ripken and his brother Billy Ripkin, both of whom played for the Baltimore Orioles, have created these privately-run facilities, which include several replica fields, including Camden Yards and the old Memorial Stadium, both in Baltimore. These facilities are both owned and operated privately and feature state-of-the-art fields and amenities.
Conclusion
Several significant trends currently shape recreational sports, especially youth sports.
The continued need for all persons to stay active, which includes participating in team sports.
The tremendous growth of participation by girls and women in the past three decades.
The continued popularity of certain sports, including outdoor sports of soccer and baseball.
The recent growth in popularity of certain sports, such as lacrosse and rugby, as well as the decrease in popularity of adult softball.

Westfield Grand Park Sportsplex Analysis Chapter 3, Page 23
The growth in popularity of regional and national tournaments for youth, creating travel and elite all-star teams.
The creation of multi-field and multi-discipline sports complexes to serve the local community and provide a venue for regional tournaments.
The trend toward less municipal and county involvement due to budget and financial concerns, corresponding with the rise in private, for-profit organizations that provide outlets for those who can pay for the use of the facilities.
These trends show that recreational and youth sports and athletics are still growing in popularity. The trends also show that youth sports and recreational sports, historically a local, non-profit enterprise, has become more centralized, regional and sometimes national in scope. In many cases recreational and youth sports have become a business as well as an athletic endeavor.

Westfield Grand Park Sportsplex Analysis Chapter 4, Page 1
TABLE OF CONTENTS
Chapter 1 Introduction and Executive Summary
Chapter 2 Economic and Demographic Profile of Westfield and Hamilton County
Chapter 3 Youth and Amateur Sportsplex Industry Trends
Chapter 4 Profile of the Project
Chapter 5 Competitive Assessment
Chapter 6 Comparable Facilities and Performance Impacts
Chapter 7 Demand and Financial Projection
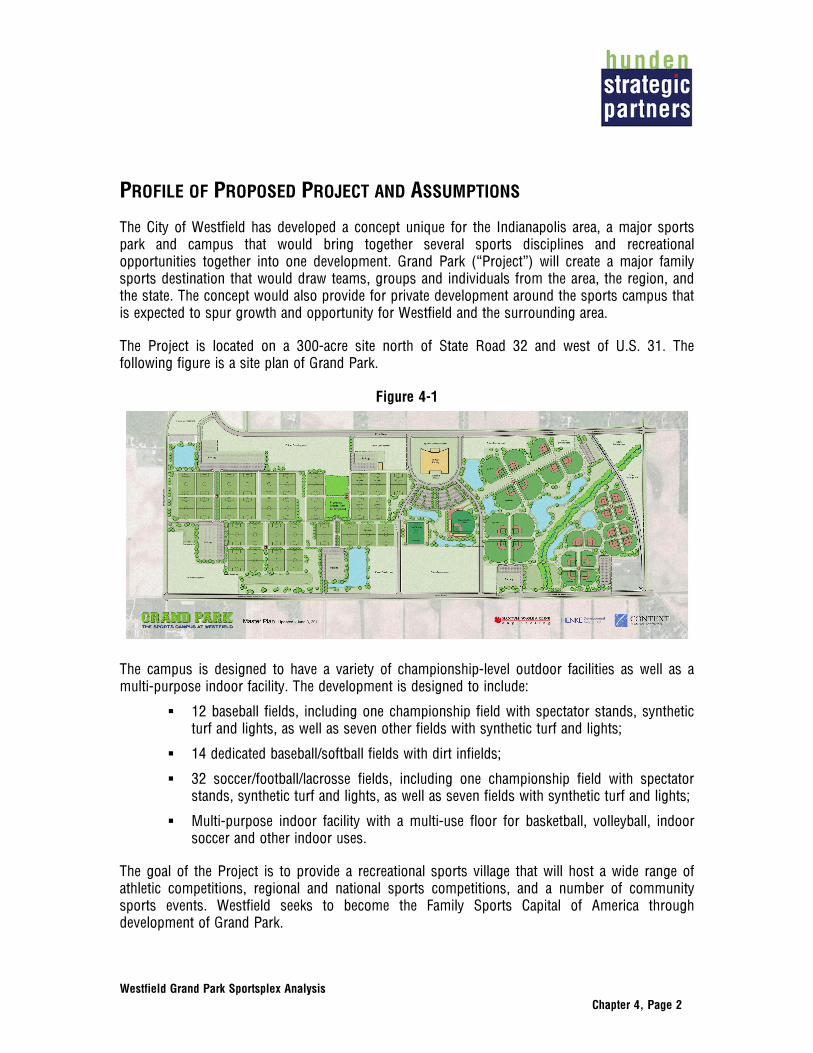
Westfield Grand Park Sportsplex Analysis Chapter 4, Page 2
PROFILE OF PROPOSED PROJECT AND ASSUMPTIONS
The City of Westfield has developed a concept unique for the Indianapolis area, a major sports park and campus that would bring together several sports disciplines and recreational opportunities together into one development. Grand Park (“Project”) will create a major family sports destination that would draw teams, groups and individuals from the area, the region, and the state. The concept would also provide for private development around the sports campus that is expected to spur growth and opportunity for Westfield and the surrounding area.
The Project is located on a 300-acre site north of State Road 32 and west of U.S. 31. The following figure is a site plan of Grand Park.
Figure 4-1
The campus is designed to have a variety of championship-level outdoor facilities as well as a multi-purpose indoor facility. The development is designed to include:
12 baseball fields, including one championship field with spectator stands, synthetic turf and lights, as well as seven other fields with synthetic turf and lights;
14 dedicated baseball/softball fields with dirt infields;
32 soccer/football/lacrosse fields, including one championship field with spectator stands, synthetic turf and lights, as well as seven fields with synthetic turf and lights;
Multi-purpose indoor facility with a multi-use floor for basketball, volleyball, indoor soccer and other indoor uses.
The goal of the Project is to provide a recreational sports village that will host a wide range of athletic competitions, regional and national sports competitions, and a number of community sports events. Westfield seeks to become the Family Sports Capital of America through development of Grand Park.

Westfield Grand Park Sportsplex Analysis Chapter 4, Page 3
An additional goal of the city is to encourage private development in the area surrounding Grand Park. The property surrounding the project will be an ideal location for a number of private business, hotel, restaurant and residential developments. The location between State Road 32 and U.S. 31 has great potential for development over the next ten to twenty years, and the location of the sports complex in the area will enhance and further the development potential.
Westfield wants to become a destination sports facility for recreation and youth sports, drawing participants and teams from the area, the region and around the country to Grand Park and Westfield. The facility would be one of the largest outdoor recreational sports facilities in the nation. It plans to have competition-level fields that will be maintained for tournaments, as well as host leagues for local participants. The cost of the facility is estimated to range between $35 million and $45 million.
Grand Park, as planned, will have synthetic all-purpose fields and baseball/softball diamonds, as well as an indoor facility yet to be determined. Synthetic turf allow for higher traffic and usage on the fields, not requiring the “rest time” that natural grass fields need. However, as discussed in Chapter 3, synthetic turf has greater expense due to the high initial cost and replacement cost. The current plan is for the Indiana Soccer Association for soccer, and the Indiana Bulls for baseball, to deposit funds to a capital account for replacement of the fields.
Another field amenity, lights for every synthetic field, will allow use of the fields for more hours, especially in the spring and fall. Lighted fields will allow later scheduling for leagues, especially adult leagues that can play later during the week. Scheduling leagues at later hours will free up more fields for weekends, the prime scheduling times for youth recreation and tournaments.
Another important aspect of Grand Park as proposed is the number of fields that will be located at the facility. Many soccer parks, baseball complexes, and other multi-use facilities in the area and Indianapolis region have enough fields to host regional tournaments. However, none of the parks are as large as Grand Park. The number of multi-use fields and baseball/softball diamonds will permit Westfield to host large major tournaments for both genders. The facility also will have the capacity to host a tournament and concurrently have the weekend league play for local participants.
Other important amenities at Grand Park include centralized concession areas, restroom facilities, and extensive parking. The indoor sports facility, to be developed later than the outdoor fields, will allow soccer and baseball training to continue year-round, as well as provide indoor sports opportunities such as basketball and volleyball.
Many of the largest and most popular recreational sports facilities in the United States, especially those that host regional and national tournaments, have amenities similar to those planned at Grand Park. Several of these facilities are highlighted in Chapter 6, “Comparable Facilities.” Each of the complexes discussed hosts regional and national tournaments as well as other events and/or leagues. The Grand Park plan will provide a complex that is unique to the Indianapolis area and will be able to compete with the other large regional and national recreation facilities for tournaments and other events.

Westfield Grand Park Sportsplex Analysis Chapter 4, Page 4
Governance Profile
The City of Westfield intends to develop relationships with various sports entities in the Westfield area, two of which will be the primary tenants. These tenants are expected to generate the majority of events and participants at the park, both through leagues and by hosting tournaments at the facility. The tenants will then book or allow other organizations’ events/leagues to book.
The Indiana Soccer Association (ISA) will be the primary tenant for the soccer fields and the Indiana Bulls (Bulls) baseball club will be primary tenant for the baseball/softball fields. The figure below shows an organization chart of the primary users of the Project.
Figure 4-2
As the chart above shows, the two tenants, the ISA and the Bulls, will cooperate with the local leagues in the scheduling and use of the fields. The local groups, the Westfield Youth Soccer Association and Westfield Youth Sports, Inc., primarily provide league play for a variety of sports. Each of these groups are described in detail below.
An advisory board is expected to be established to monitor the success of Grand Park. At this time, the advisory board is contemplated to have three members from the City of Westfield and one member each from the following organizations:
Hamilton County Sports Authority
Westfield Youth Soccer Association
Westfield Youth Sports, Inc.
Westfield-Washington Schools
Indiana Soccer Association
Indiana Bulls
Facility Manager

Westfield Grand Park Sportsplex Analysis Chapter 4, Page 5
The deal points surrounding the two tenant organizations include several key elements that are designed to limit Westfield’s risk and maximize usage. The highlights include:
The primary tenants will be responsible for the booking calendar for their respective fields.
The primary tenants will be responsible for the cost of maintenance and operation of their respective fields, including electricity for lighted fields. Revenues generated by the fields will accrue to the respective tenants.
Westfield will be responsible for the cost of maintenance and operation of common areas as well as the cost of new well pumps and electricity related to irrigating the fields. It will pay for the cost for hiring a small staff (with or without a management company contract) that will be responsible for managing the asset (primarily the common areas), selling advertising and sponsorships (including naming rights), managing the concessions contract and providing non-event related safety and security of the facility.
Revenue from all permanent (non-event) advertising and sponsorship as well as revenue from concessions and apparel will accrue to Westfield. The concessions and apparel sales are expected to be outsourced to a third party. Revenue from certain tournament apparel sales will accrue to the tenants. A management company that also specializes in selling facility sponsorship and advertising is expected to be hired.
The primary tenants will be responsible for contributing to a capital fund designed to replace the fields and any other related non-City controlled improvements. The amounts are currently contemplated to be $400,000 for the ISA and $320,000 for the Bulls annually.
The primary tenants will receive seventy percent of all parking revenue, while Westfield will receive thirty percent.
All events and tenants are expected to use the Hamilton County CVB for their lodging needs and a $15 per hotel room night fee will be assessed that will then be split by the following groups and amounts:
Hamilton County Convention and Visitors Bureau (the CVB) - $3.00.
The ISA for soccer events - $8.40 ($10.20 the first year).
The City of Westfield for facility operating costs - $3.60 for soccer events ($1.80 the first year) and $12.00 for baseball and softball events.
The following is a description of the primary users.
Indiana Soccer Association
The Indiana Soccer Association (ISA) is the state-wide governing body for most of the youth and adult soccer programs in Indiana and it has announced it will be a primary tenant at Grand Park, moving from the City of Lawrence in Marion County (an independent city surrounded by

Westfield Grand Park Sportsplex Analysis Chapter 4, Page 6
Indianapolis/Marion County). The ISA is an affiliate of United States Youth Soccer, as well as the United States Soccer Association and the United States Soccer Foundation. The ISA has a current membership base of over 56,000 youth players, 3,000 adult players, 8,000 active coaches, 3,800 referees and thousands of volunteers through its network of over 130 local member clubs across the state of Indiana.
The table below is a summary of the registrations for the ISA over the past four years.
Table 4-1 Indiana Soccer Association
Registration Summary Date Travel Rec+ Rec Total2007-08 17,449 3,220 37,861 58,5302008-09 16,565 3,573 35,872 56,0102009-10 17,081 3,690 34,543 55,3142010-11 16,767 4,477 34,001 55,245
Source: Indiana Soccer Association
Registration was highest in the 2007-08 season, before the economic downturn. The largest drop in registrations occurred in the recreational leagues, defined as leagues that have only inter-squad games without any local or regional travel. The travel teams, those that play games against other local teams outside the specific club, had a slight reduction in registrations, from 17,449 in 2007-08 to 16,767 in 2010-11. The small category of “Recreational+,” with teams that mostly play within the local league but also travel within the region, saw steady growth over the same time period.
In the 2010-11 soccer season the ISA had 128 member clubs within twenty districts. These clubs ranged in size from newly-formed travel clubs with thirty or fewer players to the largest club, Fishers, with over 1,800 registered participants. Most clubs include recreational leagues as well as travel teams for the older players and those who wanted to participate in more challenging and higher-level games.
Most of the 55,000 registrants live in the greater Indianapolis area or within 60 miles of Westfield. The table below shows the number of clubs and registrants outside the 60 mile-radius of Westfield, as well as those in the Indianapolis area.

Westfield Grand Park Sportsplex Analysis Chapter 4, Page 7
Table 4-2 Indiana Soccer Association 2010-11 Member Club Locations
Districts LocationNo. of Clubs
Percent of Total Registrants
Percent of Total
Districts 1-4, 8, 14-20 Outside Indianapolis Area* 73 57% 25,423 46%Districts 5-7, 9-13 Indianapolis Area* 55 43% 29,822 54%
Total 128 100% 55,245 100%
*Indianapolis Area considered within 60 miles of Indianapolis
Source: Indiana Soccer Association
The table above shows, most of the registered participants are within sixty miles of Westfield, 54 percent of the total. These figures become important when determining the number of participants that will possibly stay overnight at regional and state-wide tournaments. It is also important to determine the number of teams and participants in ISA-sanctioned local and regional tournaments for which most participants would be from within driving distance of the tournament site.
The ISA holds regional and state-wide competitions each summer. These tournaments include the Indiana State Cup, the President’s Cup and the Challenge Cup. The ISA staff organizes and manages all of these tournaments.
The Indiana State Cup is part of the US Youth Soccer National Championship Series. The top ranked 12 teams for age groups U13 to U19 will be selected to participate in the Indiana State Cup. The State Cup Champions will advance to the US Youth Soccer National Championship Series Region II event. Champions from the Region II event will advance to the National Finals.
The State Cup consists of two weekend tournaments. The preliminary rounds are held on the third weekend in May, to determine the top four teams in each age group that qualify for the final rounds, which are held the second weekend in June. The preliminary round games are held at several of the participating club facilities throughout the state, while the final rounds are held in one central location. In 2011 the State Cup final rounds were held at the ISA headquarters in Lawrence.
While the State Cup is a statewide competition for participants in all the ISA leagues, the President’s Cup is for travel teams playing at a more elite and challenging level. The format is the same, but boys’ and girls’ team age ranges are only U14 through U17. The preliminary rounds are also held the third weekend of May, with the final rounds the first weekend in June. Winners also qualify for regional and national rounds.
The Challenge Cup is the final statewide competition. It has been established for all teams wanting to participate, with the understanding that winners do not move on beyond the state level. This competition consists of boys and girls teams ages U11 through U17. The dates are the same as the State Cup. The number of teams is not limited, but if more than sixteen teams wish to participate, preliminary rounds may be held before the final two weekends.

Westfield Grand Park Sportsplex Analysis Chapter 4, Page 8
In addition to the statewide competitions described above, the ISA sanctions several tournaments each year that member clubs hold and manage.
The table below is a list of the tournaments that the ISA has sanctioned in the past seven years.
Table 4-3 Indiana Soccer Association Sanctioned Tournaments and Number of Teams Participating
2011 Date Tournament Name Club City 2005 2006 2007 2008 2009 2010 2011
May 1-2 Red Lion Invitational FC Pride Lawrence 125 100 X 104 Y 104 200April 16-18 Crossroads of America Showcase-Boys Carmel United SC Carmel X 40 50 53 73 129 150April 23-25 Crossroads of America Showcase-Girls Carmel United SC Carmel X 42 52 84 80 158 YApril 23-25 Midwest Soccer Classic Vigo County YS Terre Haute X X X X X 65 100Sept 4-5 Carmel Labor Day Classic Carmel United SC Carmel X X X X X 45 XSept 4-6 Circle City Labor Day Classic FC Pride Lawrence X X X X X X XAug 20-22 Pike Fest - Boys Pike Y. S. C. Indianapolis (Geisse Soccer Complex) 150 200 230 225 100 107 XAug 27-29 Pike Fest - Girls Pike Y. S. C. Indianapolis (Geisse Soccer Complex) 89 101 XAug 21-22 Fever Soccer Fest Fever Soccer Acad Ft. Wayne X X X X X 47 XJuly 24-25 Kick it 3 v 3 Noblesville YSC Littleton 210 250 X 180 200 175 XJune 4-6 Siege at St. Francis St. Francis SC Greenwood 141 103 136 123 127 173 180June 18-20 Ft. Wayne Invitational FWYSSL Ft. Wayne 115 120 112 109 105 62 53June 4-6 Classic at the Rock Center Grove SC Greenwood 160 115 140 X 198 143 140March 19-21 Dynamo Round Robin for Girls Dynamo FC Indianapolis (Dynamo Park) 114 118 X Y 158 108 120May 7-9 Shoot for a Cure Mother's Day Showcase Fever Soccer Acad Ft. Wayne X X X X X 50 45May 7-9 25th Annual SWISA Soccer Classic SWISA Newburgh 153 171 152 140 129 108 110May 29-31 TC Murray Memorial Cup Carmel United SC Carmel 229 240 220 195 235 233 XMay 29-31 Memorial Day Inviatational Jr. Irish SC Mishawaka 214 230 215 202 158 161 180May 29-31 Spring Best of the Midwest IN Magic/Hallmark Lowell X X X 245 X 169 150June 4-6 Tippco EXtreme Soccerfest Tippco SC W. Lafayette X X X X X 50 45May 7-9 White River Classic Noblesville YSC Noblesville 116 146 162 165 128 133 141Sept 17-19 Revolution Soccer Invitational HFC Noblesville X X X X X 66 XSept 17-18 A.L. Smith Inviational St. Francis SC Indianapolis X X X X X 48 100Sept 24-25 Mike Vogel MVP Dynamo FC Indianapolis (Dynamo Park) X X X X X X newNov 6-7 Halloween Festival Tournament Fusion SC Brownsburg 131 130 149 140 149 XNov 13-14 Veterans Invitational - Boys Evansville Soccer Club Evansville 225 200+ 290 Y 113 113 XNov 6-7 Veterans Invitational - Girls Evansville Soccer Club Evansville 170 154 154 XOct 29-31 Nightmare at the Rock Center Grove SC Bargersville X X X 112 116 151 XOct 8-10 The Socctoberfest Zionsville YS Zionsville 114 128 142 175 182 240 XOct 23-24 Fishers Halloween Classic-Girls Fishers FC Fishers 125 168 258 116 96 117 XOct 30-31 Fishers Halloween Classic-Boys Fishers FC Fishers 128 98 90 XOct 2-3 FC Pride Cup FC Pride Lawrence 175 X X 160 161 146 XSeptember 23,24 Best of the Midwest Boys Wildcats FC Lowell X X 200 150 100 150 XApril 9,10 Kapsalis Cup Pike Soccer Club Indianapolis (Geisse Soccer Complex) X X X X X X 210August 13,14 Westside United Invitational Westside United Avon X X X X X X 70August 13,14 NUSC Academy Invitational Noblesville YSC Noblesville X X X X X 41 47September 9-11 Indiana Invaders Fall Classic Indiana Invaders South Bend X X X X X 38 50no longer held Habig Classic Westfield YS Westfield 120 116 127 112 X X Xno longer held Shamrock Round Robin Westfield YS Westfield X X X 41 100 X Xno longer held Clark County Jam - rec+ event Clark Co. Jeffersonville 37 X 19 30 X X X
Average Number of Teams 148 142 155 138 132 116 116
Number of Tournaments 17 17 17 23 23 33 34X - Not Held or No Information
Y - Cancelled due to Weather
Source: Indiana Soccer Association
combined with boys
combined with boys
combined with boys
As the table above shows, the ISA has sanctioned 34 tournaments in 2011 and sanctioned 33 in 2010. The number of tournaments has grown in the past seven years. Most clubs have determined that tournaments make money for the club. If enough volunteers are willing to assist, a local club will host a tournament if it will attract enough teams to create a net profit for the club.
The ISA will be a primary tenant of Grand Park. As stated above, the ISA will be responsible for maintenance of the soccer/multi-use fields, the operation of those fields, the utilities for those fields, and will pay into a capital reserve fund for replacement of the turf fields. The ISA will receive all revenue that the fields themselves generate, including tournament fees and rental fees. Westfield retains all rights to revenue generated by the concessions, advertising, naming rights

Westfield Grand Park Sportsplex Analysis Chapter 4, Page 9
and other associated fees. The City and the ISA will split the portion of the $15.00 hotel use fee described above, each receiving funds from the non-CVB portion of the fee.
The ISA will also control and manage the calendar and use of the soccer/multi-use fields. It will try to coordinate the use between the local clients, the Westfield Youth Soccer Association and Westfield Youth Sports, Inc. The latter organization manages leagues and teams for lacrosse, football, and rugby, all of which would use the fields in Grand Park.
The ISA also plans to move its state headquarters to the complex. It hopes to develop an office/indoor sports facility that will both house the organization and provide space for indoor soccer, baseball training and batting cage areas, and basketball and volleyball courts.
Indiana Bulls
The Indiana Bulls, whose legal corporate name is the Carmel Youth Baseball Association, Inc., is a private, not-for-profit baseball organization that organizes, coaches and manages elite youth travel baseball teams from the Indianapolis area and will be the other primary tenant of Grand Park. Established in 1991, the Indiana Bulls organization has created one of the most competitive and popular elite youth travel baseball organizations in the United States. Indiana Bulls teams have multiple championships in several elite national tournaments, as well as a long list of alumni who moved on to Division I college baseball and a select list of current and former MLB players.
The stated goal and mission of the Indiana Bulls organization is to create elite baseball teams for boys, ages 7 through 18, to improve the skill level of the participants through coaching, year-round practice, and competition with other elite teams throughout the region and the nation. One clear and stated goal is to provide the players with an opportunity to expose the players to college coaches and scouts, as well as professional baseball scouts and organizations.
The current structure of the Indiana Bulls is to have a team for each age group from 8U to 18U, and two teams in the 9U, 10U and 11U age groups. Each team holds tryouts, and only a certain number of youth are chosen. Each of these teams practices weekly throughout most of the year and plays in several tournaments per year throughout the state and region. Each team will also participate in tournaments in the elite travel team circuit throughout the nation.
The following table is an example of the calendar of tournaments for one team in 2011, the 14U Indiana Bulls.
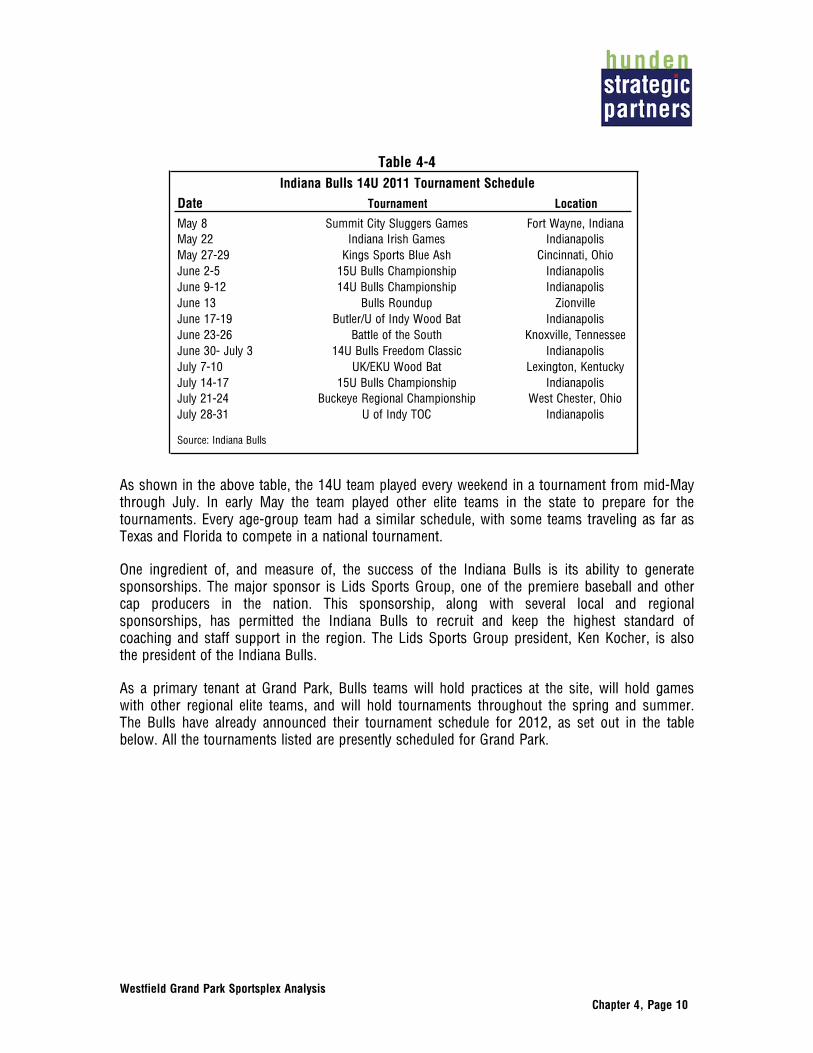
Westfield Grand Park Sportsplex Analysis Chapter 4, Page 10
Table 4-4 Indiana Bulls 14U 2011 Tournament Schedule
Date Tournament Location
May 8 Summit City Sluggers Games Fort Wayne, IndianaMay 22 Indiana Irish Games IndianapolisMay 27-29 Kings Sports Blue Ash Cincinnati, OhioJune 2-5 15U Bulls Championship IndianapolisJune 9-12 14U Bulls Championship IndianapolisJune 13 Bulls Roundup ZionvilleJune 17-19 Butler/U of Indy Wood Bat IndianapolisJune 23-26 Battle of the South Knoxville, TennesseeJune 30- July 3 14U Bulls Freedom Classic IndianapolisJuly 7-10 UK/EKU Wood Bat Lexington, KentuckyJuly 14-17 15U Bulls Championship IndianapolisJuly 21-24 Buckeye Regional Championship West Chester, OhioJuly 28-31 U of Indy TOC Indianapolis
Source: Indiana Bulls
As shown in the above table, the 14U team played every weekend in a tournament from mid-May through July. In early May the team played other elite teams in the state to prepare for the tournaments. Every age-group team had a similar schedule, with some teams traveling as far as Texas and Florida to compete in a national tournament.
One ingredient of, and measure of, the success of the Indiana Bulls is its ability to generate sponsorships. The major sponsor is Lids Sports Group, one of the premiere baseball and other cap producers in the nation. This sponsorship, along with several local and regional sponsorships, has permitted the Indiana Bulls to recruit and keep the highest standard of coaching and staff support in the region. The Lids Sports Group president, Ken Kocher, is also the president of the Indiana Bulls.
As a primary tenant at Grand Park, Bulls teams will hold practices at the site, will hold games with other regional elite teams, and will hold tournaments throughout the spring and summer. The Bulls have already announced their tournament schedule for 2012, as set out in the table below. All the tournaments listed are presently scheduled for Grand Park.
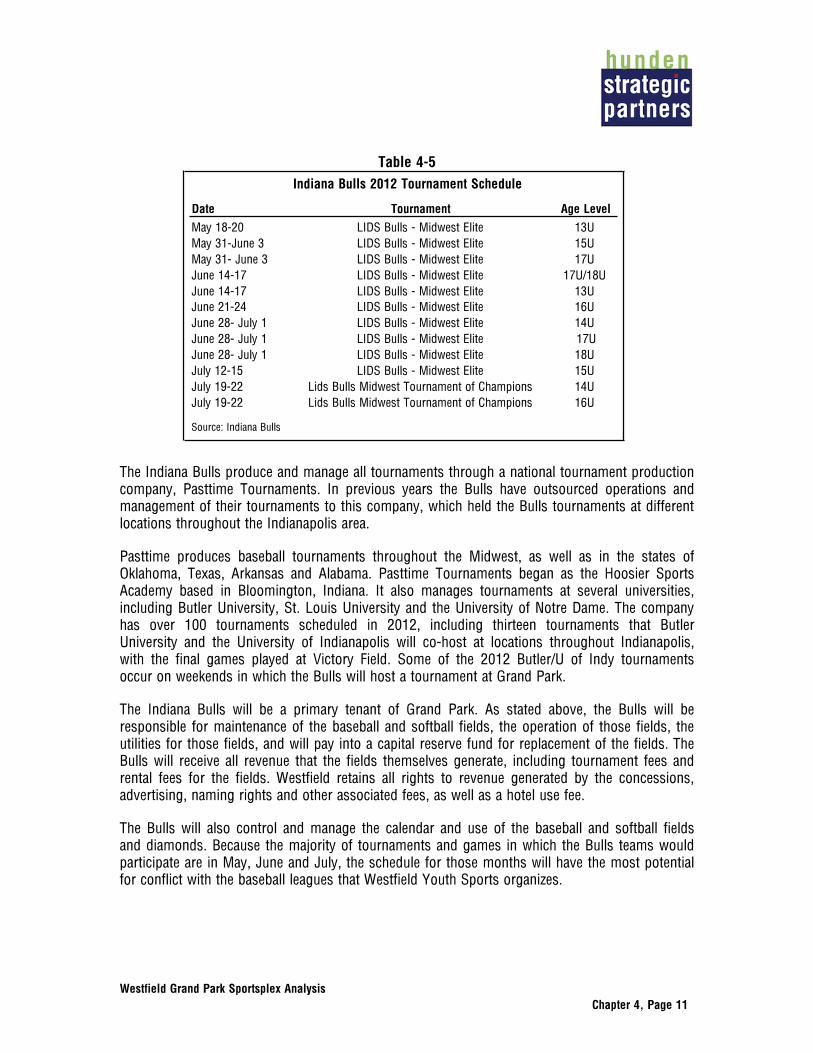
Westfield Grand Park Sportsplex Analysis Chapter 4, Page 11
Table 4-5 Indiana Bulls 2012 Tournament Schedule
Date Tournament Age Level
May 18-20 LIDS Bulls - Midwest Elite 13UMay 31-June 3 LIDS Bulls - Midwest Elite 15UMay 31- June 3 LIDS Bulls - Midwest Elite 17UJune 14-17 LIDS Bulls - Midwest Elite 17U/18UJune 14-17 LIDS Bulls - Midwest Elite 13UJune 21-24 LIDS Bulls - Midwest Elite 16UJune 28- July 1 LIDS Bulls - Midwest Elite 14UJune 28- July 1 LIDS Bulls - Midwest Elite 17UJune 28- July 1 LIDS Bulls - Midwest Elite 18UJuly 12-15 LIDS Bulls - Midwest Elite 15UJuly 19-22 Lids Bulls Midwest Tournament of Champions 14UJuly 19-22 Lids Bulls Midwest Tournament of Champions 16U
Source: Indiana Bulls
The Indiana Bulls produce and manage all tournaments through a national tournament production company, Pasttime Tournaments. In previous years the Bulls have outsourced operations and management of their tournaments to this company, which held the Bulls tournaments at different locations throughout the Indianapolis area.
Pasttime produces baseball tournaments throughout the Midwest, as well as in the states of Oklahoma, Texas, Arkansas and Alabama. Pasttime Tournaments began as the Hoosier Sports Academy based in Bloomington, Indiana. It also manages tournaments at several universities, including Butler University, St. Louis University and the University of Notre Dame. The company has over 100 tournaments scheduled in 2012, including thirteen tournaments that Butler University and the University of Indianapolis will co-host at locations throughout Indianapolis, with the final games played at Victory Field. Some of the 2012 Butler/U of Indy tournaments occur on weekends in which the Bulls will host a tournament at Grand Park.
The Indiana Bulls will be a primary tenant of Grand Park. As stated above, the Bulls will be responsible for maintenance of the baseball and softball fields, the operation of those fields, the utilities for those fields, and will pay into a capital reserve fund for replacement of the fields. The Bulls will receive all revenue that the fields themselves generate, including tournament fees and rental fees for the fields. Westfield retains all rights to revenue generated by the concessions, advertising, naming rights and other associated fees, as well as a hotel use fee.
The Bulls will also control and manage the calendar and use of the baseball and softball fields and diamonds. Because the majority of tournaments and games in which the Bulls teams would participate are in May, June and July, the schedule for those months will have the most potential for conflict with the baseball leagues that Westfield Youth Sports organizes.

Westfield Grand Park Sportsplex Analysis Chapter 4, Page 12
Westfield Youth Sports, Inc.
Westfield Youth Sports, Inc. (WYSI) is a 501(c)(3) organization that develops, produces and manages the majority of youth sports programs in Westfield. The WYSI has leagues in the following sports:
Baseball
Basketball
Cheer
Football
Lacrosse
Softball
Track & Field
Volleyball
Wrestling
The mission of WYSI is to promote amateur youth sports for school-age children in the Westfield Washington School District. The group’s major instructional tool is competition through recreational and competitive sports leagues. The ISA and Bulls have indicated they will rent the fields to the WYSI for its programming, making WYSI a key component of the success of the Project.
WYSI will benefit from Grand Park in several ways. The number of multi-use fields will provide both practice and competition fields for youth football, lacrosse and possible new sports such as rugby and ultimate Frisbee. The baseball/softball fields will provide practice and league play for those sports, especially before the summer months.
The table below sets out the participation figures for the WYSI for the last three years.
Table 4-6 Westfield Youth Sports
Outdoor Sports Participation Statistics
Sport 2009 2010 20113-Year Average
Percent Increase
2009-2011
Baseball 550 612 656 606 16%Football 322 386 421 376 24%Lacrosse 84 84 95 88 12%Softball 173 231 240 215 28%
Source: Westfield Youth Sports

Westfield Grand Park Sportsplex Analysis Chapter 4, Page 13
As shown in the table above, baseball has the most participants in the WYSI, with over 650 youth registered in 2011. All sports have seen major increases in participants in the last three years, with softball increasing the most, a 28 percent increase from 2009 to 2011.
Each sport except lacrosse has two types of leagues and participation. The WYSI offers recreational leagues, which WYSI calls “In-House Leagues,” for all youth in the area, focusing on fundamentals of the sport. These leagues have no tryouts, and all who participate will have playing time. The leagues break down into several divisions, always beginning with an Instructional League that stresses teaching basics instead of competition. The ages of the In-House Leagues are 4 through 12.
Each sport except lacrosse also has a travel team for specific age groups. The table below sets out the number of travel teams and ages for each sport.
Table 4-7 Westfield Youth Sports, Inc. Travel Teams
SportNo. of Teams Ages
Baseball 5 8U, 9U, 10U, 11U, and 12UFootball 1 5th - 6th GradeSoftball 2 10U and 12U
Source: Westfield Youth Sports
As shown in the table above, Baseball has the most travel teams, with five teams, the 8 and under team (8U)1 through 12U. Football has only one travel team, consisting of 5th and 6th graders, and softball has two teams, the 10U and 12U teams.
Each of these teams travels in the Indianapolis area for games, playing similar teams from other local clubs. For example, the football team is a member of the Indiana Elementary Football Association (IEFA), which has 17 teams throughout Indiana. The WYSI Shamrocks play in the northern division against teams such as the Carmel Pups and the Fishers Knights. At the end of each season the league hosts playoffs, consisting of three rounds plus the IEFA State Championship Game. Each year a team hosts the semifinals and another team, in the opposite division, hosts the finals.
The travel teams also participate in tournaments throughout the region. Different clubs host tournaments for these sports, so that the teams get to play competition other than that in their leagues. If WYSI hosts one of these tournaments, along with one or more playoff game for each sport, the events would bring in some overnight participants and accompanying family members.
1 The age groups for teams can be identified two different ways. WYSI and others label their teams “8 and Under” or “8U”. Most soccer organizations and other youth sports groups identify their age-group teams as “Under 8” or “U8”.
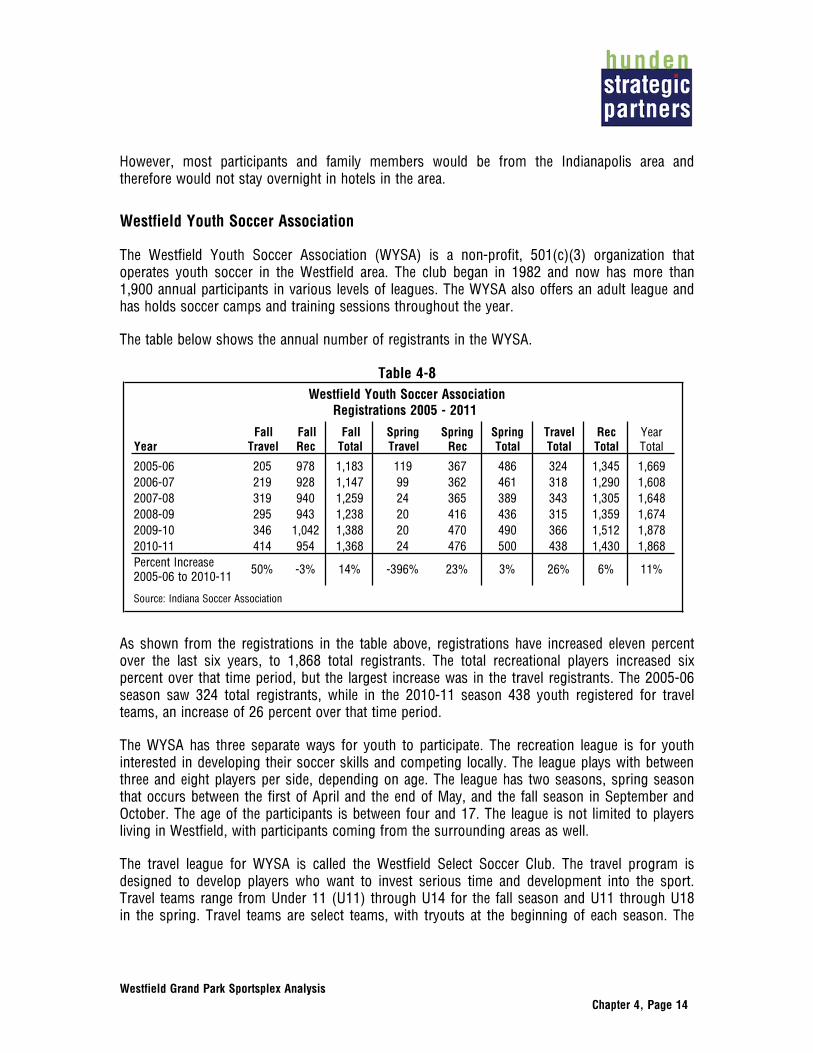
Westfield Grand Park Sportsplex Analysis Chapter 4, Page 14
However, most participants and family members would be from the Indianapolis area and therefore would not stay overnight in hotels in the area.
Westfield Youth Soccer Association
The Westfield Youth Soccer Association (WYSA) is a non-profit, 501(c)(3) organization that operates youth soccer in the Westfield area. The club began in 1982 and now has more than 1,900 annual participants in various levels of leagues. The WYSA also offers an adult league and has holds soccer camps and training sessions throughout the year.
The table below shows the annual number of registrants in the WYSA.
Table 4-8 Westfield Youth Soccer Association
Registrations 2005 - 2011
YearFall
TravelFall Rec
Fall Total
Spring Travel
Spring Rec
Spring Total
Travel Total
Rec Total
Year Total
2005-06 205 978 1,183 119 367 486 324 1,345 1,6692006-07 219 928 1,147 99 362 461 318 1,290 1,6082007-08 319 940 1,259 24 365 389 343 1,305 1,6482008-09 295 943 1,238 20 416 436 315 1,359 1,6742009-10 346 1,042 1,388 20 470 490 366 1,512 1,8782010-11 414 954 1,368 24 476 500 438 1,430 1,868Percent Increase 2005-06 to 2010-11
50% -3% 14% -396% 23% 3% 26% 6% 11%
Source: Indiana Soccer Association
As shown from the registrations in the table above, registrations have increased eleven percent over the last six years, to 1,868 total registrants. The total recreational players increased six percent over that time period, but the largest increase was in the travel registrants. The 2005-06 season saw 324 total registrants, while in the 2010-11 season 438 youth registered for travel teams, an increase of 26 percent over that time period.
The WYSA has three separate ways for youth to participate. The recreation league is for youth interested in developing their soccer skills and competing locally. The league plays with between three and eight players per side, depending on age. The league has two seasons, spring season that occurs between the first of April and the end of May, and the fall season in September and October. The age of the participants is between four and 17. The league is not limited to players living in Westfield, with participants coming from the surrounding areas as well.
The travel league for WYSA is called the Westfield Select Soccer Club. The travel program is designed to develop players who want to invest serious time and development into the sport. Travel teams range from Under 11 (U11) through U14 for the fall season and U11 through U18 in the spring. Travel teams are select teams, with tryouts at the beginning of each season. The

Westfield Grand Park Sportsplex Analysis Chapter 4, Page 15
teams compete against teams from other communities around Indianapolis, usually within a one-hour drive. The teams practice two to three days per week and have games on the weekends.
The WYSA travel teams also travel to weekend tournaments, usually between two and four throughout the year. The travel teams also participate in the State Cup, a tournament that the Indiana Soccer Association sponsors. This tournament is part of the US Youth Soccer National Championship Series.
The WYSA also has set up an “Academy Program” for youth in the U8, U9 and U10 age ranges. This program exists for youth that want to further develop their skills in soccer beyond the normal recreational level. The emphasis in the Academy Program is on development and fundamentals, with training twice per week and games, some within the academy and some against teams from other communities, occurring on weekends. The Academy Program accepts all participants without tryouts, but before placement on a team the program evaluates the participant to create balanced teams within the academy.
The WYSA also conducts summer camps for all levels and ages during the summer. In past years it also has held its own tournaments. The table below sets out the tournaments and the number of teams participating in the past five years.
Table 4-9 Westfield Youth Soccer Association
Tournament History
Year TournamentNo. of Teams
2005 Habig Classic 1202006 Habig Classic 1162007 Habig Classic 1272008 Habig Classic 1122008 Shamrock Round Robin 412009 Shamrock Round Robin 100
Source: Indiana Soccer Association
As shown in the table above, the WYSA has hosted several tournaments in past years. The Habig Classic had been an annual event since 1988, held in June each year with teams from around the state coming to Westfield. From 2005 to 2008 the tournament hosted around 120 teams. The tournament has not been offered since 2008. In 2008 and 2009 the WYSA produced the Shamrock Round Robin Tournament, a tournament held in August that drew 100 teams in 2009. That tournament has not occurred since 2009.
As more fully described in Chapter 3, the WYSA currently maintains and operates two major soccer field complexes in Westfield. The Habig Soccer Complex has 24 fields, ranging from small fields for U5 and U6 teams to full fields for older youth. These fields are mainly for the recreational league. WYSA reports that if it partners with Grand Park it will probably give the
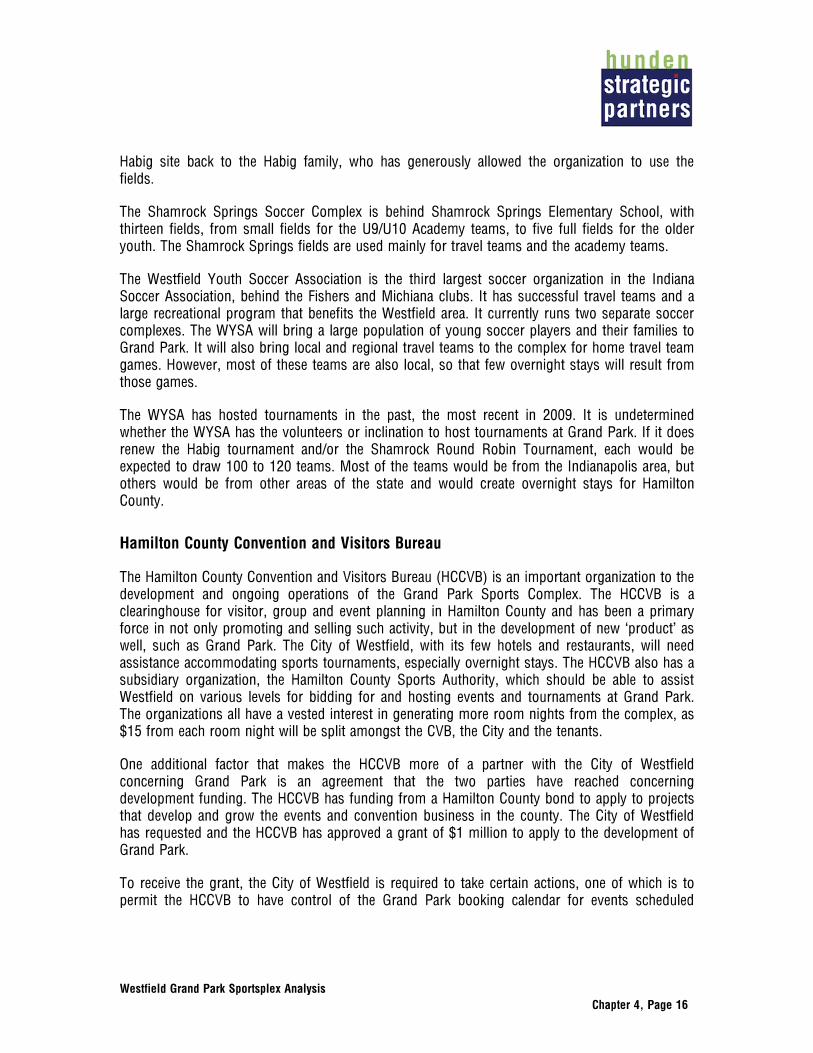
Westfield Grand Park Sportsplex Analysis Chapter 4, Page 16
Habig site back to the Habig family, who has generously allowed the organization to use the fields.
The Shamrock Springs Soccer Complex is behind Shamrock Springs Elementary School, with thirteen fields, from small fields for the U9/U10 Academy teams, to five full fields for the older youth. The Shamrock Springs fields are used mainly for travel teams and the academy teams.
The Westfield Youth Soccer Association is the third largest soccer organization in the Indiana Soccer Association, behind the Fishers and Michiana clubs. It has successful travel teams and a large recreational program that benefits the Westfield area. It currently runs two separate soccer complexes. The WYSA will bring a large population of young soccer players and their families to Grand Park. It will also bring local and regional travel teams to the complex for home travel team games. However, most of these teams are also local, so that few overnight stays will result from those games.
The WYSA has hosted tournaments in the past, the most recent in 2009. It is undetermined whether the WYSA has the volunteers or inclination to host tournaments at Grand Park. If it does renew the Habig tournament and/or the Shamrock Round Robin Tournament, each would be expected to draw 100 to 120 teams. Most of the teams would be from the Indianapolis area, but others would be from other areas of the state and would create overnight stays for Hamilton County.
Hamilton County Convention and Visitors Bureau
The Hamilton County Convention and Visitors Bureau (HCCVB) is an important organization to the development and ongoing operations of the Grand Park Sports Complex. The HCCVB is a clearinghouse for visitor, group and event planning in Hamilton County and has been a primary force in not only promoting and selling such activity, but in the development of new ‘product’ as well, such as Grand Park. The City of Westfield, with its few hotels and restaurants, will need assistance accommodating sports tournaments, especially overnight stays. The HCCVB also has a subsidiary organization, the Hamilton County Sports Authority, which should be able to assist Westfield on various levels for bidding for and hosting events and tournaments at Grand Park. The organizations all have a vested interest in generating more room nights from the complex, as $15 from each room night will be split amongst the CVB, the City and the tenants.
One additional factor that makes the HCCVB more of a partner with the City of Westfield concerning Grand Park is an agreement that the two parties have reached concerning development funding. The HCCVB has funding from a Hamilton County bond to apply to projects that develop and grow the events and convention business in the county. The City of Westfield has requested and the HCCVB has approved a grant of $1 million to apply to the development of Grand Park.
To receive the grant, the City of Westfield is required to take certain actions, one of which is to permit the HCCVB to have control of the Grand Park booking calendar for events scheduled

Westfield Grand Park Sportsplex Analysis Chapter 4, Page 17
eighteen months or more in the future. If the calendar has nothing scheduled within eighteen months, the other tenants can schedule events and tournaments for those dates.
This scheduling ability allows the HCCVB and its subsidiary, the Hamilton County Sports Authority, to bid on major tournaments outside the scope of the other partners of Grand Park. The other partners at the facility, Westfield Youth Sports, Inc., Westfield Youth Soccer, and especially the Indiana Soccer Association and the Indiana Bulls, will need to work closely with the HCCVB to insure that no conflicts occur.
Implications
The City of Westfield has planned a facility that will compete with the most successful and popular youth and team sports facilities in the nation. With the number of championship quality fields under consideration, it will become one of the largest soccer, baseball and multi-use field complexes in the country (essentially the second largest, behind Blaine, Minnesota), with immediate draws for tournaments and events. The number of fields will also allow for leagues and other local use, especially during off-peak times. The synthetic fields will allow for more use of those fields without the ongoing maintenance and rest that natural fields require. With the size and quality of the Grand Park plans, the cost of the facility has been estimated at between $35 million and $45 million.
The business concept for such a facility has gained traction over the past ten years as travel youth sports programs have blossomed across the country and parents see it as a chance to increase their child’s level of play as well as increase the chances of college scholarships or professional opportunities. The sponsoring organizations make enough money from the participation and tournament fees to support large networks of tournaments and programs. Having a venue in a location like Westfield, just outside of Indianapolis, makes it a very drive-able location for two-thirds of the U.S. population.
The planned partnerships with the Indiana Soccer Association and the Indiana Bulls have wide-ranging positive and potential negative implications. By entering into the agreements, the City of Westfield has delegated most ongoing maintenance costs to the tenants, as well as the capital improvement costs of the turf fields. Westfield will only have to maintain common areas in the park and provide infrastructure.
With the transfer of costs comes the transfer of control. The tenants will set the calendar for the fields, for their teams, for tournaments, and for league and other events for the local organizations. The fields will be used at least eight or nine months of the year, with a possibility of the synthetic turf fields being used year-round. However, the major tournament time period is during the summer, specifically the months of June and July. Local leagues may conflict with tournaments, and while the Grand Park plans call for a considerable number of fields and diamonds for both tenants’ use, the fields may become overcrowded or overscheduled. Due to the capital reserve funding requirements of the tenants, the emphasis will be to maximize revenue generated and therefore usage of the fields.

Westfield Grand Park Sportsplex Analysis Chapter 4, Page 18
In a broader perspective, the governance/operations model that the City of Westfield has proposed for Grand Park is similar to a model that most large cities use for an arena or stadium whose major tenant is a professional sports team. The municipality develops and constructs the facility with its own funds, then leases the facility to the professional team, which has control over the facility’s scheduling. If the team is not using the facility, it leases it to other entities. However, the team’s schedule takes precedence. The city develops the facility for reasons other than just sports, including civic pride, quality of life, economic impact and economic development. This model has been successful at times but has not in other instances, mainly based on the strength of the agreement between the city and the tenants. The City of Westfield should consider this perspective when finalizing the agreements with the tenants and setting out the terms of the agreements. Based on the current understanding of the agreements, the level of risk is minimized for the City so long as the tenant organizations are healthy and continue to generate a significant amount of room nights. As the hotel fee split is the single largest revenue item for the city’s Grand Park operating budget, the ability to induce these non-local visitors is key to the success of the concept.

Westfield Grand Park Sportsplex Analysis Chapter 5, Page 1
TABLE OF CONTENTS
Chapter 1 Introduction and Executive Summary
Chapter 2 Economic and Demographic Profile of Westfield and Hamilton County
Chapter 3 Youth and Recreational Sports Industry Trends
Chapter 4 Profile of the Project
Chapter 5 Competitive Assessment
Chapter 6 Comparable Facilities and Performance Impacts
Chapter 7 Demand and Financial Projection

Westfield Grand Park Sportsplex Analysis Chapter 5, Page 2
COMPETITIVE ASSESSMENT
HSP has evaluated the local and regional outdoor sports facilities to determine the level of competition and comparable facilities that exist. Larger regional/national facilities outside of the area that serve as competitors as well as comparable facilities are discussed in Chapter 6. Several sport field complexes and baseball/softball complexes exist in Hamilton County and in other suburban areas north of Indianapolis. These facilities may compete with the proposed Grand Park Sportsplex. Other facilities may complement the new sport park because they could be used for practice fields and substitute locations if a large tournament was taking place during a specific weekend. Grand Park will be the newest and largest facility, but it is unknown how Grand Park will compete on price and field availability for various organizations and tournaments.
The figure below shows Hamilton County and the general borders for the major communities. Counties in Indiana are divided into townships (typically nine per county, divided like a tic-tac-toe board). These townships generally also serve as the boundaries for school districts. So in Hamilton County, Carmel’s maximum city limits would generally be the boundaries of Clay Township (hence Carmel Clay school). Westfield is in Washington Township, hence Westfield Washington Schools, and so on.
The figure below shows the county, the cities within the county and the major sports facilities.

Westfield Grand Park Sportsplex Analysis Chapter 5, Page 3
Figure 5-1
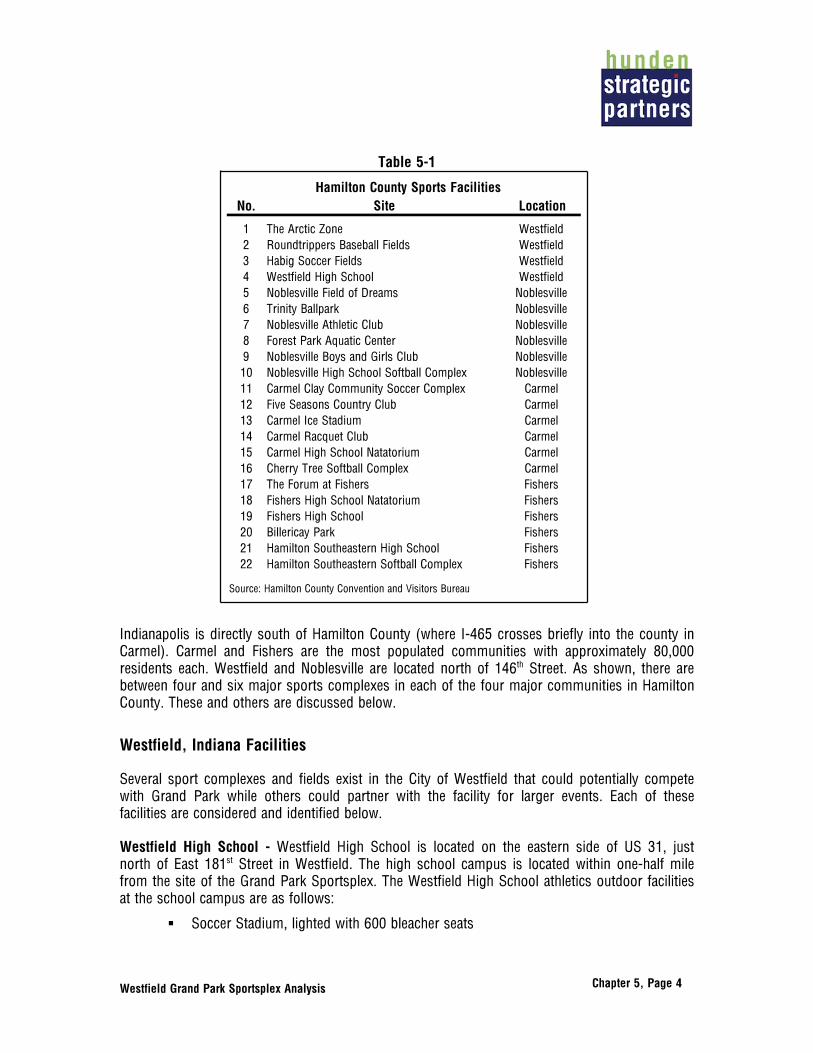
Westfield Grand Park Sportsplex Analysis Chapter 5, Page 4
Table 5-1
Hamilton County Sports FacilitiesNo. Site Location
1 The Arctic Zone Westfield2 Roundtrippers Baseball Fields Westfield3 Habig Soccer Fields Westfield4 Westfield High School Westfield5 Noblesville Field of Dreams Noblesville6 Trinity Ballpark Noblesville7 Noblesville Athletic Club Noblesville8 Forest Park Aquatic Center Noblesville9 Noblesville Boys and Girls Club Noblesville10 Noblesville High School Softball Complex Noblesville11 Carmel Clay Community Soccer Complex Carmel12 Five Seasons Country Club Carmel13 Carmel Ice Stadium Carmel14 Carmel Racquet Club Carmel15 Carmel High School Natatorium Carmel16 Cherry Tree Softball Complex Carmel17 The Forum at Fishers Fishers18 Fishers High School Natatorium Fishers19 Fishers High School Fishers20 Billericay Park Fishers21 Hamilton Southeastern High School Fishers22 Hamilton Southeastern Softball Complex Fishers
Source: Hamilton County Convention and Visitors Bureau
Indianapolis is directly south of Hamilton County (where I-465 crosses briefly into the county in Carmel). Carmel and Fishers are the most populated communities with approximately 80,000 residents each. Westfield and Noblesville are located north of 146th Street. As shown, there are between four and six major sports complexes in each of the four major communities in Hamilton County. These and others are discussed below.
Westfield, Indiana Facilities
Several sport complexes and fields exist in the City of Westfield that could potentially compete with Grand Park while others could partner with the facility for larger events. Each of these facilities are considered and identified below.
Westfield High School - Westfield High School is located on the eastern side of US 31, just north of East 181st Street in Westfield. The high school campus is located within one-half mile from the site of the Grand Park Sportsplex. The Westfield High School athletics outdoor facilities at the school campus are as follows:
Soccer Stadium, lighted with 600 bleacher seats

Westfield Grand Park Sportsplex Analysis Chapter 5, Page 5
Baseball Diamond, lighted, with dugouts, scoreboard, pressbox and 360 bleacher seats.
Softball Diamond, lighted, with dugouts, scoreboard, pressbox and 360 bleacher seats.
The following figure is an overhead view of Westfield High School’s athletic fields.
Figure 5-2
The Westfield High School football stadium is located at the northeastern corner of the intersection of US 31 and Road 32, south of the current high school campus beside the old high school, now Westfield Middle School. The old athletic fields also include a baseball diamond and two softball/practice diamonds.
Monon Trail Elementary School - Another school that is even closer to the proposed Grand Park Sportsplex, and within the TIF area surrounding Grand Park, is Monon Trail Elementary School. This school is next to the Monon Trail on Tomlinson Road, adjacent to the Grand Park site. Westfield Youth Sports worked with the school district and in 2010 developed and opened a “4-

Westfield Grand Park Sportsplex Analysis Chapter 5, Page 6
plex” of softball fields at the school. These softball fields could complement the Grand Park softball fields for tournaments and leagues, especially those in which Westfield Youth Sports is involved. At the present time Westfield Youth Sports has the duty to maintain and manage these softball fields.
Roundtrippers Academy – The Roundtripper Academy (RA) is a private baseball and softball facility that offers several opportunities for youth and adult baseball and softball players. Located at 16708 Southpark Drive, one mile south of the Grand Park complex, at 169th Street, the facility includes the following:
Full high school level championship baseball field with natural grass infield.
Two softball fields with dirt infields, can be used as practice baseball fields.
Concession stands and scoreboards for outdoor fields.
Indoor 130-foot by 150-foot sprint turf field with 35-foot ceiling.
12 Indoor batting cages.
Indoor pitcher’s mounds.
Pro Shop selling baseball and softball equipment and apparel.
Fitness Center with weight machines and free weights.
The following figures are pictures of the Roundtrippers baseball field, softball field and indoor facility.
Figure 5-3

Westfield Grand Park Sportsplex Analysis Chapter 5, Page 7
Figure 5-4
Figure 5-5
Roundtrippers Academy offers several programming options:
Baseball and softball classes and workshops offered year-round. Currently the RA offers hitting, pitching and fielding classes during the school year, weekdays in the evenings and weekends on Saturday mornings and Sunday evenings.
Summer and winter baseball and softball camps. In 2010 RA held a hitting camp over the Christmas break with Kevin Long, the current hitting coach of the New York Yankees. Over the same time period it held a pitching camp led by two current major-league pitchers.
Fall and spring baseball leagues for ages five through high school. Currently RA is hosting fall development baseball leagues for ages five to 12, as well as a league for high school players.

Westfield Grand Park Sportsplex Analysis Chapter 5, Page 8
Sponsor and home field of the Indiana Mustang travel baseball teams. The Indiana Mustangs is an organization that has several youth teams that travel to other local and regional locations. The affiliation with the Roundtrippers Academy allows all Mustang players to use the facilities as part of the team membership. Currently the Mustangs includes ten teams, each of which competes regionally and attempts to get exposure for the players from universities and professional baseball.
Host of several tournaments ranging from an elite team invitational to the Mustang Elite Showcase to Midwest regional tournaments. These tournaments range from U9 to U17 and many are held for each age division.
The Roundtripper Academy has a staff of six full or part-time staff, all of whom have been professional or college baseball players or high school/college/professional coaches. The staff also coaches and manages one or more of the Indiana Mustangs teams. The staff has not established a major softball program but has advertised that it plans to have more softball programs in the future.
The Roundtripper Academy will compete for baseball players, leagues and tournaments with any baseball programs at the Grand Park Sportsplex. The indoor facility at RA will keep the organization relevant. While it appears that the Indiana Mustangs program is not as elite as the Indiana Bulls teams, that program will provide some competition for the Bulls.
However, the Roundtripper Academy may also provide additional opportunities for rental of the baseball diamonds and tournament participation at the Grand Park Sportsplex. If the Indiana Bulls, Westfield Youth Sports and the city could create a partnership with RA, all parties might benefit. The participants and parties could have more field use, more practice field availability, and more local teams available for tournaments.
Indiana Soccer Academy – The Indiana Soccer Academy (ISA) is a private organization dedicated to training and teaching soccer. It is located at 17341 Westfield Park Drive, on the southwest corner of the US 31 intersection with State Road 32. Carlos Zavaleta, a former NCAA and professional soccer player, founded the academy in 2003.
The ISA has a natural grass outdoor field, 140 feet by 75 feet, for outdoor play, leagues and clinics. The facility also has an indoor facility, 210 feet by 150 feet, for indoor play, leagues, practices and clinics.
The following figure is a picture of the Indiana Soccer Academy.
Westfield Grand Park Sportsplex Analysis Chapter 5, Page 9
Figure 5-6
The ISA offers youth leagues during the winter on the indoor field. The academy also offers a winter adult league on Sunday evenings. The summer adult league in 2011 had six teams, which played eight games in league play.
The ISA stresses instruction, coaching and training for youth who want to improve soccer skills, especially during the winter season. The facility allows for indoor instruction and leagues for the year-round soccer player. The ISA is an alternate practice site for the Westfield Youth Soccer Association and provides coaching and training assistance to some of the WYSA teams if those teams request assistance. WYSA is a sponsor of the ISA.
Westfield Youth Sports - The local youth sports organization, Westfield Youth Sports, uses several other sports facilities in Westfield, including fields located at schools. The following table lists the locations and fields that Westfield Youth Sports uses at the present time.
Table 5-2
Westfield Youth Sports - Outdoor Sport SitesSport Location Fields
Baseball Shamrock Springs Elementary 4Softball Monon Trail Elementary 4Baseball/Softball Practice Freedom Trail Park 2Football/Lacrosse Freedom Trail Park 3Flag Football Westfield Washington Elementary 4
Source: Westfield Youth Sports, HSP
Westfield Youth Sports intends to use the fields at Grand Park for their programs. However, the fields listed above will still exist and could compete with the Grand Park fields.
Westfield Youth Soccer Association – The Westfield Youth Soccer Association (WYSA) uses the fields at the Habig Soccer Complex, located on Carey Road in southeastern Westfield, as well as the fields at Shamrock Springs Elementary School.
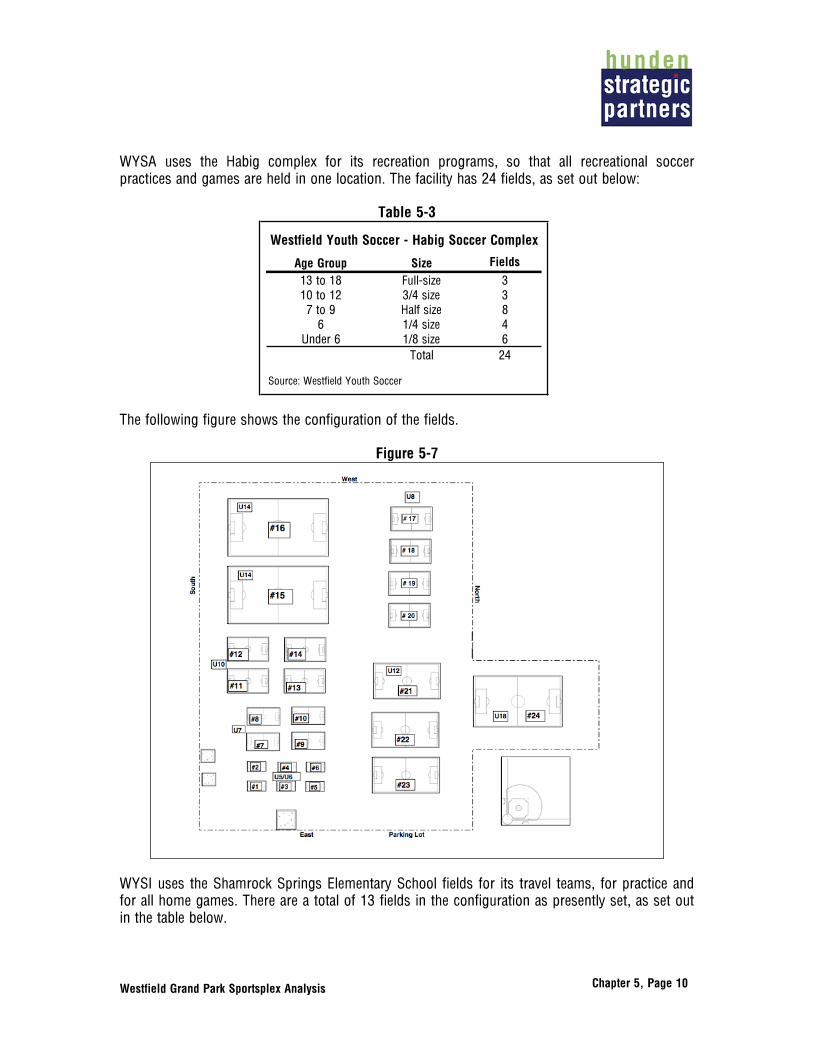
Westfield Grand Park Sportsplex Analysis Chapter 5, Page 10
WYSA uses the Habig complex for its recreation programs, so that all recreational soccer practices and games are held in one location. The facility has 24 fields, as set out below:
Table 5-3
Westfield Youth Soccer - Habig Soccer Complex
Age Group Size Fields
13 to 18 Full-size 310 to 12 3/4 size 37 to 9 Half size 8
6 1/4 size 4Under 6 1/8 size 6
Total 24
Source: Westfield Youth Soccer
The following figure shows the configuration of the fields.
Figure 5-7
WYSI uses the Shamrock Springs Elementary School fields for its travel teams, for practice and for all home games. There are a total of 13 fields in the configuration as presently set, as set out in the table below.

Westfield Grand Park Sportsplex Analysis Chapter 5, Page 11
Table 5-4
Westfield Youth Soccer - Shamrock Springs Complex
Age Group Size Fields
13 to 18 Full-size 510 to 12 3/4 size 4Under 10 Half size 4
Total 13
Source: Westfield Youth Soccer
The following figure shows the configuration of the fields.
Figure 5-8
WYSA anticipates moving all programming and teams to the new facility. It currently manages and maintains all of the above fields. The Shamrock Springs fields would return to the school system for its use. The Habig family owns the Habig fields and current discussions suggest that the acreage would return to the family.
Westfield has other baseball, softball and multi-use fields throughout the city, but these tend to be one or two fields in separate locations. Elementary and middle schools have some soccer/football fields and baseball/softball fields, and other single or dual fields exist on private land.

Westfield Grand Park Sportsplex Analysis Chapter 5, Page 12
Other Team Sports Organizations – Other outdoor team sports organizations exist in Westfield that could be potential partners or use the proposed facilities at Grand Park. Most of these organizations currently use school fields or diamonds for their leagues or events. These organizations include:
Indiana Youth Lacrosse Association – The Indiana Youth Lacrosse Association (IYLA) is a state-wide group that organizes and manages boys’ and girls’ leagues. Based in the Indianapolis area, the IYLA has teams in several communities in Hamilton County, including Westfield. Currently the IYLA has three boys’ leagues, 3rd and 4th Grade, 5th and 6th Grade, and 7th and 8th Grade, with the older two divisions having teams in Westfield. The IYLA also has a girls’ league with a Westfield team. The Westfield teams currently play and practice at the Westfield High School/Middle School fields.
Westfield Indians Baseball Club – The Westfield Indians is an independent travel baseball club that has a 13U and 15 U baseball team and is seeking organizers for teams in younger age groups. The teams play at the Habig fields baseball diamond in Westfield.
Westfield Shamrocks Rubgy Club – The Westfield Shamrocks Rugby Club is a newly organized group that is supporting youth travel rugby teams. The organization has U19, U15 and U12 Boys teams, a U19 Girls team, and a 2nd-4th grade coed team. The teams play at various locations around the area, including the Westfield High School/Middle School fields, The Westfield Shamrocks Elementary field, and St. Maria Goretti.
Hamilton County
The proposed Grand Park Sportsplex will compete with sports fields in other locations in Hamilton County. The table below sets out the major sports complexes in Hamilton County other than the City of Westfield.

Westfield Grand Park Sportsplex Analysis Chapter 5, Page 13
Table 5-5 Hamilton County - Non-Westfield Larger Outdoor Sports Sites
Venue Sports Field Amendities Amenities
Dia
mon
ds
Socc
er F
ield
s
Prac
tice
Fiel
ds
Foot
ball
Batti
ng C
ages
FishersBillericay Park Baseball/Softball 8 - - - 1 Grass Infields, lighted fields and concession stands.Cumberland Park Soccer - 7 - - - Grass fields, lighted.
Cyntheanne Park Soccer, Football, Lacrosse and Rugby
- 5 - - - Grass fields, lighted.
Fishers High School Baseball, Football, Soccer, Softball 1 3 5 1 - Grass infields, covered dugouts, press box, lighting, concessions, scoreboards, football field with 4,500 seats
Hamilton Proper Park Soccer and Lacrosse - 2 - - - Grass fields, lighted.
Hamilton Southeastern High School Baseball/Softball, Football, Soccer 1 1 7 1 - Grass infields, covered dugouts, lighting(some fields), press box. Seats: 300 soccer, 4,500 football, and 900 baseball.
Hamilton Southeastern Softball Complex
Baseball/Softball 8 - - - - Lighted stadium, scoreboard, press box, covered digouts.
Harrison Thomson Park Baseball/Softball, Soccer 2 1 3 - - Grass InfieldsHolland Park Baseball/Softball, Soccer 4 1 3 - - Grass fields, lighted.Mudsock Fields Football - - - 3 - Grass fields, lighted, electronic scoreboards and bleachers.Olio Fields Baseball/Softball 6 - 4 - - Lighted grass infield, concessions and covered dugouts.
Total Fishers 30 20 22 5 1Carmel
Mark Badger Park Baseball/Softball and Soccer 6 16 - 1 - Grass fields, lighted.
Carmel High School Baseball/Softball, football and Soccer
12 1 - 1 -Grass infield for baseball//softball and soccer, synthetic for football, lighted. Baseball seats 400, football seats 6,234 and soccer seats 3,500.
Carmel Soccer Complex/Shelborne Fields
Soccer - 18 - - - Grass fields, lighted, concessions.
Cherry Tree Softball Complex Softball 4 - - - - Grass fields, lighted, enclosed dugouts,scoreboards, press box, concessions. 500 seats on varsity field.
Wodock Fields Football and Baseball/Softball 4 - - - - Grass fields, lighted, 2 pitching lanesTotal Carmel 26 35 0 2 0
Noblesville
Noblesville High School Baseball/Softball, Football, and Soccer.
7 - - 1 -Press box, lighted , scoreboards, concessions, covered dugouts, baseball/softball seats 300, football seats 4,500 and soccer seats 1,100
Noblesville Soccer Club Soccer - 18 - - - Concession stand, lighted, grass fieldsNoblesville Youth Baseball Baseball 8 - - - - 8 lighted fields, 2 turf infields
Trinity Ball Park Baseball 4 - - - 5 Artificial turf indoors, grass outdoors. Concessions, press box, covered dugouts, scoreboards. 2 outdoor fields lighted.
Total Noblesville 19 18 0 1 5
Total Hamilton County 75 73 22 8 6
Source: Hamilton County Sports Authority, Individual Facilities
Outside of Westfield in Hamilton County’s other larger facilities there are 75 softball/baseball diamonds, 73 soccer fields, 22 practice fields, eight football fields and six batting cages. Several of the major complexes in Hamilton County will be the most important competition to the proposed park. The discussion of each of these facilities is below.
Billericay Park - Billericay Park, located at 126th Street and Promise Road in Fishers, Indiana, is a 44-acre park operated by the Fishers Parks and Recreation Department. The park has eight lighted baseball diamonds and a batting cage. The following figure shows the park’s configuration.

Westfield Grand Park Sportsplex Analysis Chapter 5, Page 14
Figure 5-9
The baseball fields are home to the Fishers-HSE Travel Baseball teams and have hosted a number of tournaments in the past few years, including the U-11 and U-13 USSSA Indiana State Championships for 2011.
The following figure is a picture of Billericay Park’s baseball fields.

Westfield Grand Park Sportsplex Analysis Chapter 5, Page 15
Figure 5-10
Cumberland Park - Cumberland Park in Fishers, Indiana, is a 40-acre recreational park covered by green areas and seven full size soccer fields. The Fisher Park and Recreation Department operates the park.
The following figure is a map of the seven soccer fields of Cumberland Park.
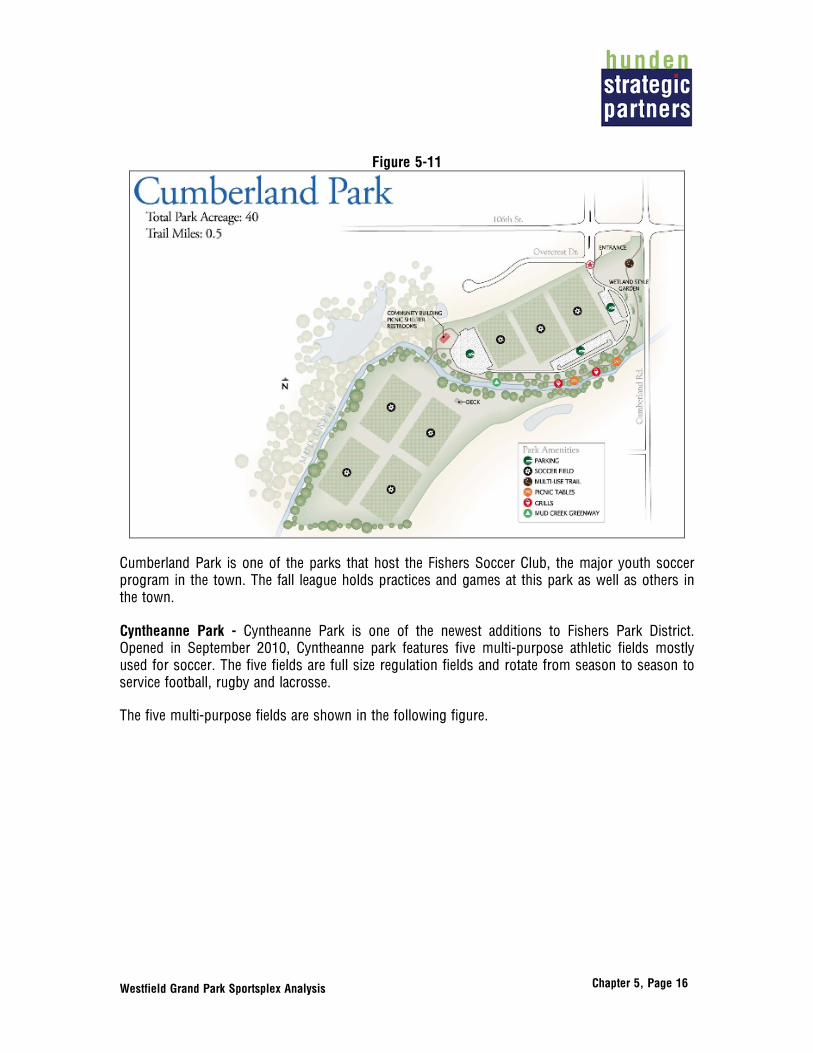
Westfield Grand Park Sportsplex Analysis Chapter 5, Page 16
Figure 5-11
Cumberland Park is one of the parks that host the Fishers Soccer Club, the major youth soccer program in the town. The fall league holds practices and games at this park as well as others in the town.
Cyntheanne Park - Cyntheanne Park is one of the newest additions to Fishers Park District. Opened in September 2010, Cyntheanne park features five multi-purpose athletic fields mostly used for soccer. The five fields are full size regulation fields and rotate from season to season to service football, rugby and lacrosse.
The five multi-purpose fields are shown in the following figure.

Westfield Grand Park Sportsplex Analysis Chapter 5, Page 17
Figure 5-12
Olio Fields - Olio Fields Park in Fishers is an 18-acre park shared by Hamilton Southeastern High School and Fall Creek Intermediate schools. The park has five full soccer fields that can be configured into smaller fields for younger players, as well as the Fishers Soccer Club stadium field, used for tournament and championship games.
The following figure shows the configuration of the soccer fields.

Westfield Grand Park Sportsplex Analysis Chapter 5, Page 18
Figure 5-13
Olio Fields also has five softball fields and one tournament-quality baseball field. These fields are shared with the Hamilton Southeastern High School athletics programs.
The following figure shows the configuration of the baseball and softball fields.

Westfield Grand Park Sportsplex Analysis Chapter 5, Page 19
Figure 5-14
The soccer club in Fishers, the Fishers Youth Soccer Club, has the most participants registered for soccer in the Indiana Soccer Association, with a total of 2,816 registrants for the 2010-2011 season. A large part of the registrations, 1,627, were for fall recreational soccer, and 544 for spring recreational soccer.
Noblesville United Soccer Fields - The Noblesville United Soccer Fields are the grounds for the Noblesville United Soccer Club. Established in 1978, the 18 soccer fields are located on thirty acres in Noblesville. The Noblesville United Soccer Club hosts three tournaments per year at the facility: the White River Classic, the Kick It, and the NUSC Academy Invitational.
The following figure shows the NUSC field layout.

Westfield Grand Park Sportsplex Analysis Chapter 5, Page 20
Figure 5-15
Noblesville Field of Dreams – Noblesville has developed one of the best and largest youth baseball complexes in the state. The Noblesville “Field of Dreams” is a baseball complex that has eight lighted fields, two of which have turf infields. The complex has eight batting cages and a permanent concession stand.
The following figure is a picture of the facility.

Westfield Grand Park Sportsplex Analysis Chapter 5, Page 21
Figure 5-16
The Noblesville fields are home to Noblesville Youth Baseball, the local sports group that organizes and runs several leagues for youth. Noblesville Youth Baseball has leagues for both recreational players and the more experienced “travel team” players, both in spring and fall leagues.
The fields also host several tournaments a year for youth, mainly teams that are 12 and under, including the Indiana State Games and the Midwest Rec League Championships. The fields hosted the 2001 CABA House World Series, and the complex has won several awards from the CABA. Because CABA is, in a sense, a competitor to the Indiana Bulls and WYSI and these tournaments are money makers, they will likely not shift to Grand Park.
Carmel Clay Community Soccer Complex/Shelborne Fields – The Carmel Clay Community Soccer Complex is a large soccer facility located in Carmel, Indiana. The soccer fields, also called the Shelborne Fields, consist of 18 fields of varying sizes. The complex is the home to the Carmel United Soccer Club, the organization that runs the travel youth soccer teams for the Carmel Clay area.
The following figure is the configuration of the fields at the soccer complex.
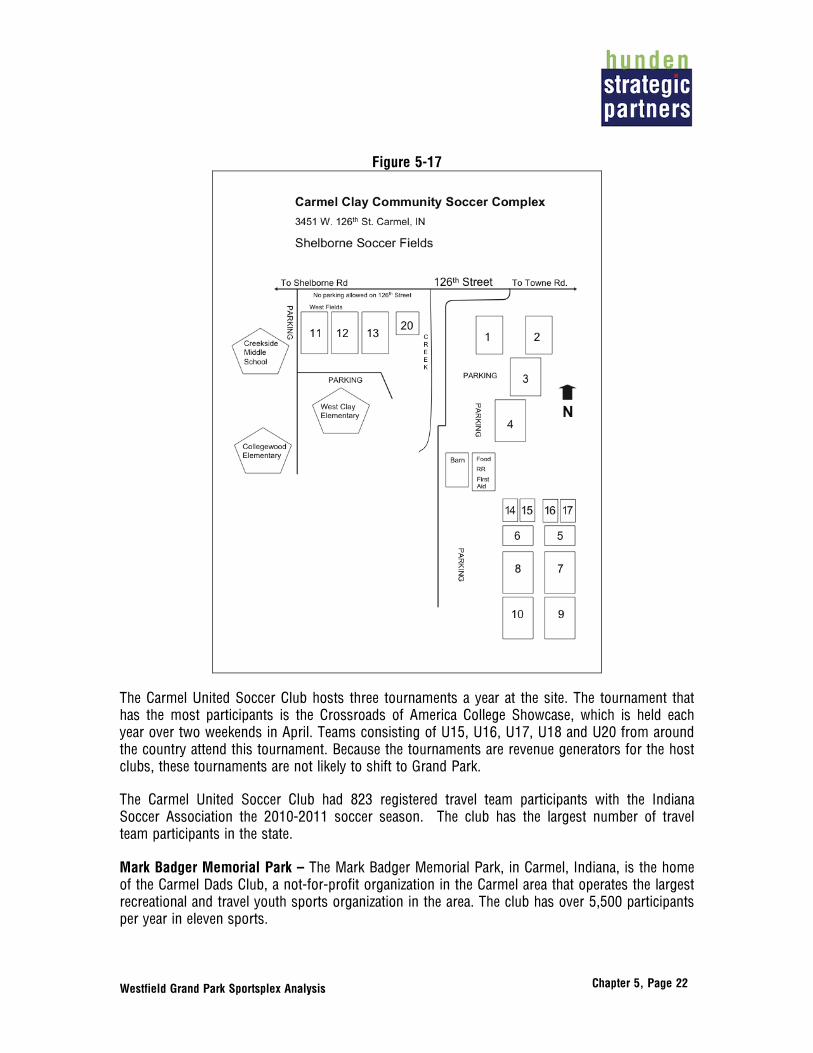
Westfield Grand Park Sportsplex Analysis Chapter 5, Page 22
Figure 5-17
The Carmel United Soccer Club hosts three tournaments a year at the site. The tournament that has the most participants is the Crossroads of America College Showcase, which is held each year over two weekends in April. Teams consisting of U15, U16, U17, U18 and U20 from around the country attend this tournament. Because the tournaments are revenue generators for the host clubs, these tournaments are not likely to shift to Grand Park.
The Carmel United Soccer Club had 823 registered travel team participants with the Indiana Soccer Association the 2010-2011 soccer season. The club has the largest number of travel team participants in the state.
Mark Badger Memorial Park – The Mark Badger Memorial Park, in Carmel, Indiana, is the home of the Carmel Dads Club, a not-for-profit organization in the Carmel area that operates the largest recreational and travel youth sports organization in the area. The club has over 5,500 participants per year in eleven sports.

Westfield Grand Park Sportsplex Analysis Chapter 5, Page 23
The Carmel Dads Club built the Mark Badger Memorial Park in the 1980s on 39 acres. The park has facilities as follows:
6 baseball diamonds.
16 soccer fields, with 1 full-size, 2 half fields, 5 quarter fields and 8 small fields.
1 dedicated football field
The following figure is an aerial view of the facility.
Figure 5-18
Mark Badger Park hosts the leagues in the various sports that the Carmel Dads Club offers. The park also plays host to a few tournaments per year through the Carmel Dads Club. Because the Carmel Dads Club is league-oriented, the majority of the tournaments held at the facility revolve around the local leagues. However, in the past few years the facility has hosted a 3-on-3 soccer tournament in July, the Kick in the Grass 3 v 3 Soccer Tournament.
Cherry Tree Softball Complex – The Cherry Tree Softball Complex, located behind Cherry Tree Elementary School in Carmel, Indiana, is one of the premier youth softball complexes in the state. The Carmel Clay School District owns and operates the facility. Originally opened in 1990, the four fields were completely renovated in 2009 for the 2010 season.

Westfield Grand Park Sportsplex Analysis Chapter 5, Page 24
The facility hosts the Carmel High School softball team, with a varsity field with enclosed dugouts and 500 permanent bleacher seats. The facility has hosted the ISAAA State Softball tournament finals and other tournaments.
The following figure is a picture of the varsity facility.
Figure 5-19
Indianapolis Area
Indianapolis is one of the central locations of sports activities in the United States. In addition to the Indianapolis Colts and the Indiana Pacers, the city is the home of the NCAA headquarters, several amateur sport governing bodies and has hosted dozens of NCAA, Big Ten and other major tournaments over the past 30 years. The area also has strong youth and adult recreational sports programs. Several sport complexes in the Indianapolis area will compete with the Grand Park Sportsplex.
Dynamo Park – Dynamo Park is the home park of the Dynamo FC soccer club in Indianapolis. Built on the northern edge of the city, just south of Hamilton County and along Interstate 465, the park hosts the teams of the Dynamo FC youth program. The park also hosts two soccer tournaments per year. The Dynamo Round Robin is for girls teams U-11 through U-19, and the Mike Vogel Premier Tournament is the last weekend of September, for boys’ teams U-9 through U-14.
Dynamo Park has ten full fields, two of which are divided into two junior fields and two of which are divided into four U-9 fields.

Westfield Grand Park Sportsplex Analysis Chapter 5, Page 25
Midwest Sports and Social Complex - Midwest Sports and Social Complex is a sports facility in Indianapolis housing a wide variety of sports and facilities. The outdoor fields consist of six softball/baseball fields and four soccer fields. The fields are next to a full service restaurant, restrooms and eight beach volleyball courts. While not the largest complex in the area, the facility is home to Indianapolis’ largest softball league. Over 500 teams participate in the complex in youth and adult leagues ranging from recreational and church leagues to competitive adult softball and fast pitch softball.
The Midwest Sports and Social Complex also hosts youth baseball tournaments in the spring and summer as well as basketball, flag football, and kickball leagues. It has the largest beach volleyball facilities in the area.
The following figure is a picture of the complex.
Figure 5-20
Indianapolis Sports Park - Indianapolis Sports Park is a recreational family owned sports facility that offers softball leagues, beach volleyball, kickball, flag football, and baseball. The facility is 25 years old, and provides the southern areas of Indianapolis with a major softball complex for leagues and tournaments.

Westfield Grand Park Sportsplex Analysis Chapter 5, Page 26
The Indianapolis Sports Park has six lighted softball diamonds and one NCAA baseball field, along with a press box, concession stands, and a multi-use soccer/football/lacrosse field.
A picture of the park is shown in the following figure.
Figure 5-21
Pastime Baseball Tournaments – Pastime Tournaments is a regional company that develops and manages tournaments throughout the Midwest for various youth baseball organizations. Established in 2006, the company now manages and produces youth baseball tournaments in 14 states. Pastime Tournaments has national championships for several age groups of elite baseball teams.
Pastime Tournaments is currently the subcontractor for the Indiana Bulls. The Indiana Bulls have partnered with Pastime Tournaments to host a U16 and U18 national tournament in Indianapolis. However, the city does not have one complex that can host all the teams participating in the tournament. Therefore, Pastime Tournaments uses the available championship-quality fields around the city for the tournaments. The baseball fields it has used for the tournaments include those located at:
Butler University
University of Indianapolis

Westfield Grand Park Sportsplex Analysis Chapter 5, Page 27
Franklin College
Marian University
Victory Field, the home of the AAA Indianapolis Indians
Pastime Tournaments may continue its partnership with the Indiana Bulls in the future. It has already listed the Grand Park Sportsplex as the host of the Bulls Midwest Elite tournament in June 2012 and the Bulls Freedom Classic in July 2012.
Lawrence Soccer Complex - The Lawrence Soccer Complex is the largest soccer complex in the Indianapolis area and one of the largest in the Midwest. The complex has 21 fields, three with lights, two full concession stands and parking for up to 8,000 vehicles. The Lawrence Soccer Complex is the present home of the Indiana Soccer Association and has hosted many local, regional and statewide tournaments. The facility was the location of the 2001 US Soccer Association National Championships.
The figures below are diagrams of the complex.
Figure 5-22

Westfield Grand Park Sportsplex Analysis Chapter 5, Page 28
Figure 5-23
The local soccer club that is part of the statewide Indiana Soccer Association is the FC Pride Soccer Club. This group hosts both leagues and travel teams for all age groups participating in youth soccer. The club hosts its own tournaments, such as the Red Lion Invitational, the Circle City Showcase, and the FC Pride Cup.
The Lawrence Soccer Complex also is the home field for three high school soccer teams. Bishop Chatard High School, Cathedral High School and the Lawrence Central High School all use the fields for practice and games.
Kuntz Memorial Soccer Stadium - Kuntz Memorial Soccer Stadium, located on the northwest side of downtown Indianapolis, is the premier outdoor soccer facility in the region and is owned by the City of Indianapolis. The Kuntz facility has two FIFA-quality regulated game fields. The championship field has seating capacity for 5,257 spectators.
The stadium also has four locker rooms, training rooms, a press box and a VIP conference room overlooking the championship field. The stadium has hosted several national and international tournaments including the 1987 Pan American Games and several NCAA games and tournaments.

Westfield Grand Park Sportsplex Analysis Chapter 5, Page 29
Indiana Complexes
The outdoor sports complexes throughout Indiana that would be competitive with the new Grand Park Sportsplex are few in number outside the greater Indianapolis area. The major facilities that would compete are complexes hosting major tournaments. Facilities outside greater Indianapolis would not compete with the sports complex for local leagues and participants. Therefore, the study focuses on complexes that host tournaments in the two major outdoor non-high school youth sports: baseball and soccer.
The table below lists the major baseball tournaments held in Indiana outside the Hamilton County and central Indianapolis area in 2011, and the location of each tournament.
Table 5-6
Indiana Youth Baseball - Tournament Sites
Location Site TournamentNo. of Fields
Crawfordsville Wabash College All American Classic 1Fort Wayne ASH Centre Hoosier Classic 4Lakeville Newton Park ETS Sports Tournaments 4Manchester Manchester & Grace College Manchester & Grace Summer Warmup 1Mishawaka Southwest Little League Fields Mishawaka Slugfest 4Portage Imagination Glen Park Midwest USSSA Championships 4Rockville Rockville Youth Baseball Fields Labor Day Tournament 2South Bend Notre Dame University Stadium TPT World Series 2South Bend East Side Baseball Softball Assn. Barnaby's Tournament 5Terre Haute Indiana State University Sycamore Invitational 1Valparaiso Valparaiso University Elite Baseball Wood Bat Championships 1
Source: Individual Locations, HSP
As shown in the table above, colleges and universities host many of the baseball tournaments held away from Indianapolis, including Notre Dame, Indiana State and Valparaiso University. None of the complexes have more than five fields.
The table below lists the major Indiana Youth Soccer tournaments in Indiana in 2011 but outside the Hamilton County and central Indianapolis area, and the location of each tournament.

Westfield Grand Park Sportsplex Analysis Chapter 5, Page 30
Table 5-7
Indiana Youth Soccer Tournament Sites
Location Site Tournament No. of Fields
Terre Haute Springhill Soccer Complex Midwest Soccer Classic Tournament 15Fort Wayne Kreager Park, Hefner Fields (IPFW) Fort Wayne Invitational 8, 14Bargersville Center Grove Soccer Complex Classic at the Rock 8Newburgh Southwest Indiana Soccer Club SWISA Soccer Classic 5Evansville Goebel Park Veterans Invitational 10Clarksville Fusion FC Fields Fusion Invitational 9West Lafayette Tippco FC Fields Tippco Soccer Extreme 5Avon Dan Jones Soccer Complex Westside United Invitational 4Lowell Indiana Magic Hallmark Sports Fields Best of the Midwest Fall Tournament 9South Bend Airport Fields Memorial Day Invitational 12
Source: Individual sites, HSP
As shown, the sites that exist outside the northern Indianapolis area are smaller, with at most fifteen fields.
Proposed Facilities
A public-private partnership proposal in Anderson, Indiana is moving forward with plans to develop a ten-field baseball/softball complex called “The Farm.” While financing has not been finalized, such an entry into the market would add to the competitive landscape. However, without additional detail about the tenants and proposed deal structure, it is difficult to determine at this time how much of a challenge this entry would be to Grand Park.
Implications
As this chapter has shown, there are a number of complexes capable of hosting soccer, baseball/softball and other field sport tournaments in the surrounding region. While these facilities have hosted a number of tournaments, none are expected to compete with size and quality planned for Grand Park when completed. This, coupled with relationships with the Indiana Soccer Association/Westfield Youth Soccer Association and the Indiana Bulls, indicate that strong relationships will be in place to attract many premier tournaments. However, just because Grand Park will offer more fields than these competitors does not mean all tournaments will shift to Westfield. Existing tournaments and organizations often have a strong incentive to stay in their current setting, especially if they are locally sponsored. Overall, HSP expects a shift of non-home league tournaments to Grand Park on a somewhat regular basis over time.

TABLE OF CONTENTS
Chapter 1 Introduction and Executive Summary
Chapter 2 Economic and Demographic Profile of Westfield and Hamilton County
Chapter 3 Youth and Recreational Sports Industry Trends
Chapter 4 Profile of the Project
Chapter 5 Competitive Assessment
Chapter 6 Comparable Facilities and Performance Impacts
Chapter 7 Demand and Financial Projection

Westfield Grand Park Sportsplex Analysis Chapter 6 – Page 2
COMPARABLE FACILITIES AND PERFORMANCE IMPACTS
This chapter will identify and profile several youth sports complexes that are similar in size to Grand Park. Each of these facilities provides quality athletic facilities for local youth sports while serving as a host for regional and national tournaments. Analysis of these facilities focuses on the physical program of each complex as well as the historical demand and financial performance (where available). In addition, hotel room night impact data was requested. Data collected from these complexes inform the demand and financial projections for Grand Park.
Nine comparable facilities are profiled. Of the nine, two, Reach 11 in Phoenix, Arizona, and Rockford Sportscore in Rockford, Illinois, have both soccer and baseball/softball facilities. One, the Maryland SoccerPlex, is purely soccer-focused and three are baseball-focused. The National Sports Center emphasizes soccer and other field sports but also has a hockey facility, a velodrome, a golf course, and other amenities.
The following table provides an overview of the comparable facilities.
Table 6-1
Comparable Facilities - Overview
Facility Location Fields/DiamondsSynthetic
Fields/DiamondsLighted
Fields/DiamondsSoccer
Overland Park Soccer Complex Overland Park, KS 12 12 12Reach 11 Phoenix, AZ 18 1 18Rockford Sportscore Rockford, IL 40 1 1Maryland SoccerPlex Boyds, Maryland 23 3 23National Sports Center Blaine, MN 52 0 1
Average -- 29.0 3.4 11.0
Baseball/SoftballReach 11 Phoenix, AZ 4 2 0Rockford Sportscore Rockford, IL 8 0 8Snowden Grove Baseball Southaven, MS 17 0 17Ripken Experience
Aberdeen Facility Aberdeen, MD 10 4 2Myrtle Beach Facility Myrtle Beach, SC 7 7 7
East Cobb Baseball Marietta, GA 8 0 8Average -- 9.0 2.2 7.0
Source: HSP, Various Facilities
As shown, the number of fields in the soccer complexes ranges from 12 to 52, while baseball and softball complexes range from four to 17 diamonds. These complexes host a number of tournaments that attract participants and spectators. The majority of these large tournaments have a significant impact on the local hotel markets of each respective community.
The comparable facilities are described below.

Westfield Grand Park Sportsplex Analysis Chapter 6 – Page 3
Reach 11 Sports Complex – Phoenix, Arizona
The Reach 11 Sports Complex is located in Phoenix, Arizona and is one of the largest facilities of its kind in the western United States. The complex consists of 18 soccer fields (one synthetic and all lighted) and four baseball/softball diamonds (two synthetic). The complex is owned by the City of Phoenix and operated and maintained by the Phoenix Parks and Recreation Department. The facility was completed in 2006.
The following figure shows a diagram of the Reach 11 Sports Complex.
Figure 6-1
Reach 11 is located on the northern edge of Phoenix, bordered to the north by several federal preserves and other public land. As a result, there has been minimal development surrounding the facility. Of the approximately 60,000 hotel rooms in the Phoenix market, nearly half are located within a 25-minute drive from the complex. Several small housing developments have been constructed within a mile of the facility, but the housing crisis in Phoenix has severely limited the occupancy of these residences.
The complex was developed in two phases; the first phase involved the initial development of the fields and support facilities while the second phase added lighting to each soccer field. Development costs for both phases totaled $26 million, including field lights installation of $800,000. Phase 1 was funded by a voter-supported parks initiative that authorized a modest sales tax (one-tenth of a cent). Phase 2 was funded through the department’s capital improvement fund.

Westfield Grand Park Sportsplex Analysis Chapter 6 – Page 4
The U.S. Bureau of Reclamation also contributed $3 million towards the project. This is because Reach 11 is on federal property, located on reclaimed land.
Reach 11 is a tournament-only facility for soccer events, meaning that the complex does not host local leagues, clinics or camps. This is a result of two factors:
The site is on federal property, which restricts management’s ability to charge admission or parking fees for events. Without this revenue, the facility is unable to generate enough funds to offset the operating expenses of most events.
The natural grass fields are meticulously maintained and have been identified as some of the highest quality playing surfaces in the region. Not hosting local events allows these fields to “rest” for larger tournaments. The only soccer field available for practices and training is the one synthetic championship field.
As stated above, the soccer portion of the complex includes 18 fields, all of which are lighted. There are 17 natural turf fields and one synthetic turf championship field. The complex is approximately 73 acres and contains a variety of support facilities such as an office and restroom building, playground and sitting area, maintenance and storage facilities, concession facilities and an office.
Reach 11’s baseball component is focused primarily on serving the local youth baseball community. A limited number of baseball tournaments are held at Reach 11. Instead the complex provides practice and competition facilities for local baseball and softball organizations. The baseball complex is sponsored by the Arizona Diamondbacks, the local Major League Baseball franchise, and is named as the Arizona Diamondbacks’ Field of Dreams. The Field of Dreams baseball component consists of four youth baseball fields, two of which feature synthetic turf. Adjacent to the fields are maintenance and storage facilities, restrooms and concession facilities.
The following table shows the 2010 Reach 11 Complex attendance.
Table 6-2
Reach 11 Complex - 2010 Attendance
Event Type Participants Spectators AttendanceTournaments 112,230 235,683 347,913Baseball/Softball (all local) 12,000 25,200 37,200Special Events* -- 853 853
Total 124,230 261,736 385,966
*Charity walk/run eventsSource: Phoenix Park District, HSP
In 2010 the facility attracted more than 124,000 participants and nearly 262,000 spectators, nearly all associated with tournaments that used the soccer facilities. Local baseball and softball attracted 37,200 attendees while other events, including small charity events, drew less than 1,000 primarily local attendees.

Westfield Grand Park Sportsplex Analysis Chapter 6 – Page 5
The facility’s tournament schedule is determined through a field allocation process. Priority is given to those events with regional, national and/or international implications. Additionally, there is a similar process for the one synthetic turf field. The Parks Department accepts applications three times a year from local clubs and groups. The Department then divides these requests equally among the groups.
An in-house staff of six full-time employees and multiple part-time staffers operate and program Reach 11, all of which are City employees within the Parks Department. The City of Phoenix collects all rentals, concessions and other revenue. When not hosting tournaments or events, the facility is available to the local community for various practices, competitions and physical education classes for local school districts and disability services agencies. These groups primarily use the Field of Dreams Complex or the one synthetic championship field for a minimal rental fee that covers staffing needs.
Reach 11’s revenue was not provided after several requests to the Phoenix Park District. The Reach 11 Complex is considered a component of a larger number of park and recreation facilities. As a result, revenue is reported as a combination of these facilities, not individually.
The following table shows Reach 11’s expense budget for 2010.
Table 6-3
Reach 11 - Budget (2010)Item Soccer Baseball TotalFull-Time Salaries $335,072 $115,750 $450,822Part-Time Salaries 74,087 60,560 134,647Benefits 168,986 51,911 220,897Services 4,495 3,894 8,389Supplies 2,004 6,865 8,869Telecommunications 14,376 2,000 16,376Water 34,694 194 34,888Electricity 119,750 19,780 139,530Misc. Maintenance 25,000 6,402 31,402Contracted Maintenance 107,491 0 107,491Equipment 61,828 3,066 64,894Security 20,298 0 20,298Other 27,060 0 27,060
Total Expense $995,141 $270,422 $1,265,563
Source: Reach 11
In 2010 Reach 11’s budget was $1.3 million, nearly $1 million of which was related to soccer operations. Personnel costs accounted for nearly 64 percent of total expenses. Other significant expenses include electrical utilities and contracted maintenance.

Westfield Grand Park Sportsplex Analysis Chapter 6 – Page 6
Hotel and Local Economic Impact
According to conversations with the Phoenix CVB, Reach 11 accounts for approximately 60,000 annual room nights. This large number of room nights has been directly attributed to the extended tournament season provided by the local climate. Reach 11 is capable of hosting tournaments in the late fall and early winter while other facilities are considered too cold to host these events. Nearly all room nights are attributed to tournaments. There is a lack of hotels surrounding the facility, forcing nearly all participants and spectators to stay in hotels near downtown Phoenix, approximately 20 miles from Reach 11.
Minimal economic development has occurred surrounding Reach 11. This because of the facility’s remote location on the far north side of Phoenix, the federally-owned lands surrounding much of the facility, as well as the local market’s difficulty recovery from the recent economic downturn.
Westfield Implications
Reach 11 has performed well as a tournament-only facility. This model results in only high impact events, but limits local participation. The model fits into the market due to a significant number of local soccer complexes in the surrounding area that can accommodate nearly all local groups. This allows Reach 11 to attract significant events with minimal scheduling conflicts.
Overland Park Soccer Complex – Overland Park, Kansas
Completed in September of 2009, the Overland Park Soccer Complex (the Complex) is a 96-acre soccer facility with 12 lighted synthetic fields, 1,100 square feet of indoor meeting space, multiple playgrounds, concessions and locker room facilities. Each field is equipped with electronic scoreboards, spectator seating and a field cooling systems used to minimize the effect of high temperatures on the playing surface. The Overland Park Parks and Recreation Department (the Parks Department) owns and operates the Complex.
The figure below shows an diagram of the Overland Park Soccer Complex.

Westfield Grand Park Sportsplex Analysis Chapter 6 – Page 7
Figure 6-2
The site of the complex was originally designed as a supplemental soccer complex for a proposed MLS stadium. After MLS stadium project fell through, the current facility was developed as a stand-alone entity. The City of Overland Park used a three percent hotel bed tax to repay a general obligation bond that the city issued to finance the Complex. The city developed the Complex along a retail thoroughfare, so that several hotels, multiple restaurants, shopping centers and other local attractions are within a few minutes’ drive of the Complex.
The Parks Department rents the Complex to various local, regional and national soccer organizations for leagues and tournaments. The Complex’s management markets and manages the calendar for the facility, determining which events and tournaments will be hosted based on the size, scope and expected impact on the local economy. When not hosting regional and national tournaments, the Complex leverages strong relationships with local youth soccer organizations to provide continuous programming through local games and smaller local tournaments. These soccer organizations pay a tournament rental fee as well as a management fee to the facility while collecting all revenue from fees collected from participating teams. In addition to hosting these events, the Complex allows hourly and daily rentals for individual training, practices and league games. Parking at the facility is free.
The following table shows attendance for the Complex in 2010, the first full year of operation.

Westfield Grand Park Sportsplex Analysis Chapter 6 – Page 8
Table 6-4
Overland Park Soccer Complex - 2010 Attendance
Event Type Participants Spectators Attendance
Tournaments 60,006 119,920 179,926Leagues 93,776 160,000 253,776
Total 153,782 279,920 433,702
Source: Overland Park Park District, HSP
The complex attracted 433,000 attendees in 2010, 59 percent of whom were associated with league events. This is attributed to the flexible schedule that results from the facility’s synthetic surfaces and lighting. These two elements allow operators to schedule events from March through November and at any hour of the day. This flexibility permits the Complex to maximize its 12 fields that would not be possible with a natural grass surface. Local demand is so high that during non-tournament dates the facility can schedule enough leagues and other events to fill each field each night and on free weekends. This scheduling flexibility is a direct result of Overland Parks’ all synthetic surface and lighting on all fields.
The Parks Department schedules the facility based on a priority system that favors large regional or national tournaments. Since the facility is still relatively new, management has indicated that it does not need to market the facility to attract new business. Instead many organizations contact them, hoping to obtain a tournament weekend date. When a tournament is not scheduled, each field is available for rental for any local club or team.
The Complex operates with two full time and 12 part-time employees. These employees are responsible for filling the facility’s schedule, serving as event managers and maintaining the fields and surrounding grounds. Additional part-time staff operates the facility’s three concession stands during larger events. The Park Department employs all of the staff of the Complex.
The following table shows a financial overview of the Overland Park Soccer Complex.

Westfield Grand Park Sportsplex Analysis Chapter 6 – Page 9
Table 6-5
Overland Park Soccer Complex - 2010 Budget
Item 2010Revenue
Field Rental $801,231Concessions 274,984Advertising/Sponsorship 62,121Other 3,168
Total Revenue $1,141,504
ExpensesPersonnel $419,225Administrative 87,390Supplies 38,360Repair & Maintenance Supply 131,420Services 24,247Repairs and Maintenance 52,734Utilities 206,265
Total Expenses $959,641
Net Income (Deficit) $181,863
Source: Overland Park Soccer Park District, HSP
As shown, in its first year of operation, the Overland Park Soccer Complex reported a profit. Field rentals accounted for $800,000 of the $1.1 million in revenue while the greatest expenses were personnel and utility costs. Gross concessions generated nearly $275,000.
Hotel and Local Economic Impact
Conversations with the Overland Park CVB indicate that the complex generates approximately 40,000 annual room nights. The synthetic fields and lighting allow for the facility to have a much wider event schedule without running the risk of destroying competition fields. Also, tournament teams are virtually guaranteed games on synthetic fields should there be inclement weather.
Minimal economic development has occurred surrounding the complex. The area around the facility was already well developed, which was a significant factor in the site selection. While some members of the CVB indicate that arguments have been made that several business have developed as a result of the complex, it is commonly believe that new development occurred as a response to population growth in the area, not the soccer facility.
Westfield Implications
The Overland Park Soccer Complex is an example of how synthetic turf fields and lighting can dramatically impact the capabilities of host both large tournaments and local groups. Facility operators have identified this scheduling flexibility as the most critical element of the complex. Westfield is expected to benefit from a similar scheduling philosophy for its synthetic and lighted
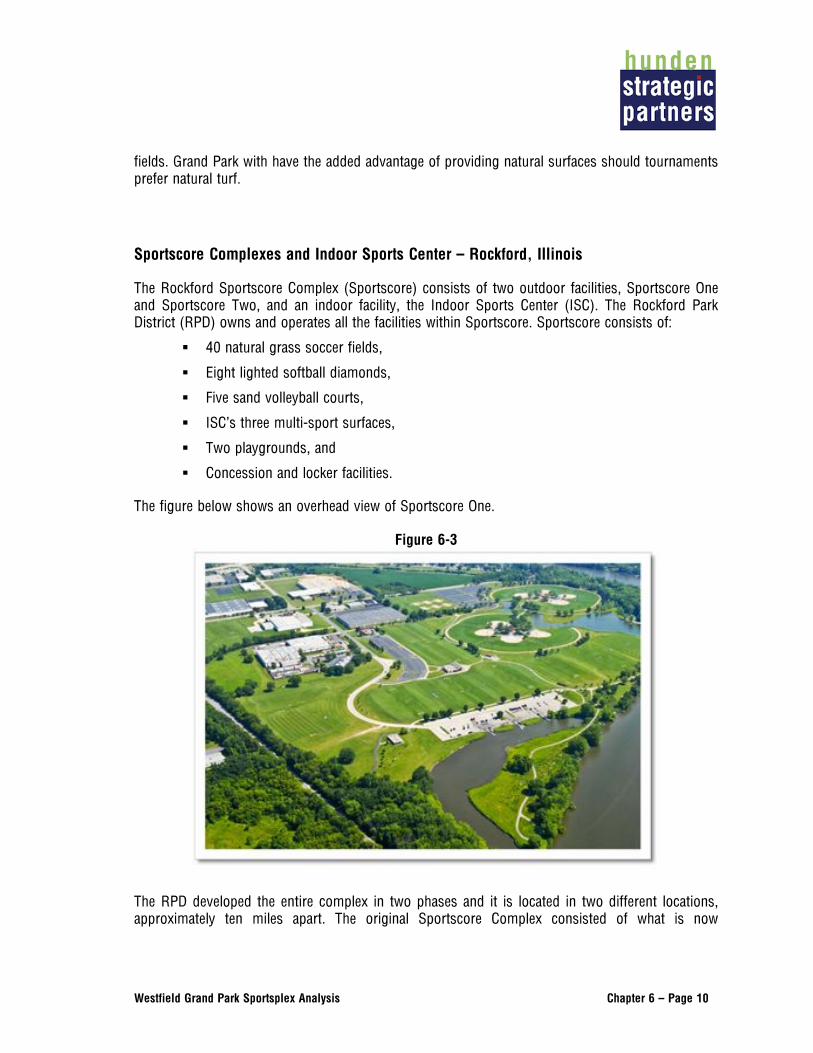
Westfield Grand Park Sportsplex Analysis Chapter 6 – Page 10
fields. Grand Park with have the added advantage of providing natural surfaces should tournaments prefer natural turf.
Sportscore Complexes and Indoor Sports Center – Rockford, Illinois
The Rockford Sportscore Complex (Sportscore) consists of two outdoor facilities, Sportscore One and Sportscore Two, and an indoor facility, the Indoor Sports Center (ISC). The Rockford Park District (RPD) owns and operates all the facilities within Sportscore. Sportscore consists of:
40 natural grass soccer fields,
Eight lighted softball diamonds,
Five sand volleyball courts,
ISC’s three multi-sport surfaces,
Two playgrounds, and
Concession and locker facilities.
The figure below shows an overhead view of Sportscore One.
Figure 6-3
The RPD developed the entire complex in two phases and it is located in two different locations, approximately ten miles apart. The original Sportscore Complex consisted of what is now
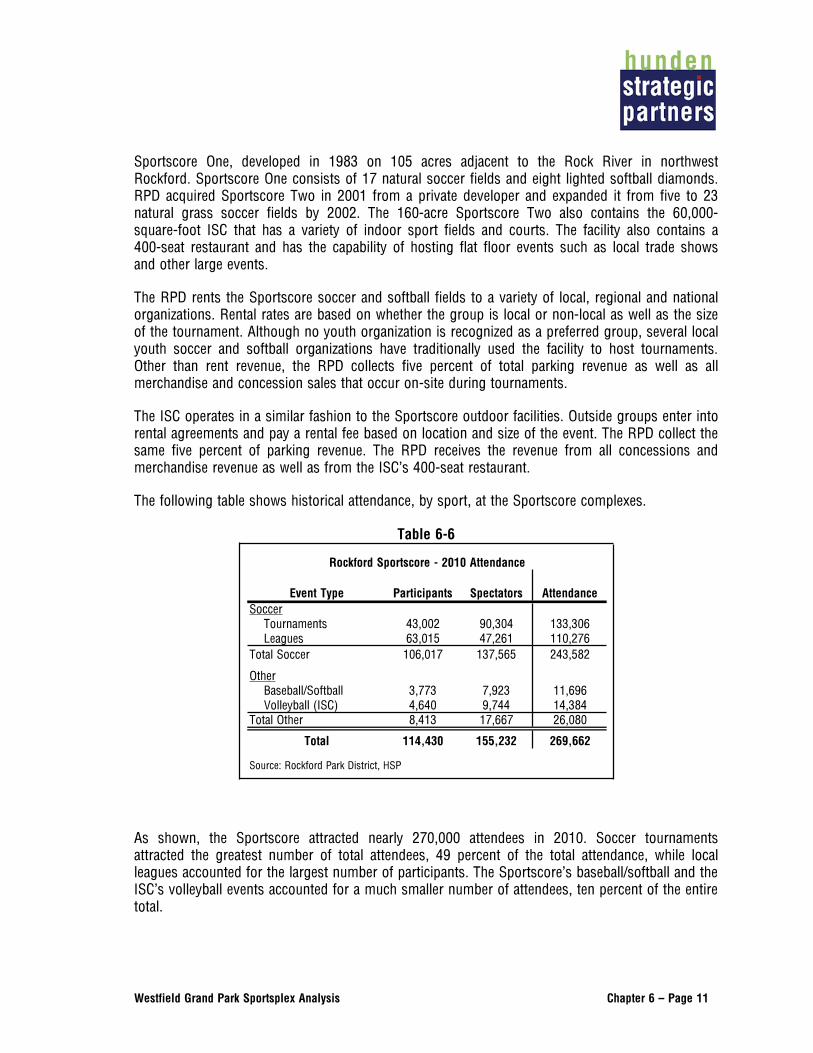
Westfield Grand Park Sportsplex Analysis Chapter 6 – Page 11
Sportscore One, developed in 1983 on 105 acres adjacent to the Rock River in northwest Rockford. Sportscore One consists of 17 natural soccer fields and eight lighted softball diamonds. RPD acquired Sportscore Two in 2001 from a private developer and expanded it from five to 23 natural grass soccer fields by 2002. The 160-acre Sportscore Two also contains the 60,000-square-foot ISC that has a variety of indoor sport fields and courts. The facility also contains a 400-seat restaurant and has the capability of hosting flat floor events such as local trade shows and other large events.
The RPD rents the Sportscore soccer and softball fields to a variety of local, regional and national organizations. Rental rates are based on whether the group is local or non-local as well as the size of the tournament. Although no youth organization is recognized as a preferred group, several local youth soccer and softball organizations have traditionally used the facility to host tournaments. Other than rent revenue, the RPD collects five percent of total parking revenue as well as all merchandise and concession sales that occur on-site during tournaments.
The ISC operates in a similar fashion to the Sportscore outdoor facilities. Outside groups enter into rental agreements and pay a rental fee based on location and size of the event. The RPD collect the same five percent of parking revenue. The RPD receives the revenue from all concessions and merchandise revenue as well as from the ISC’s 400-seat restaurant.
The following table shows historical attendance, by sport, at the Sportscore complexes.
Table 6-6
Rockford Sportscore - 2010 Attendance
Event Type Participants Spectators AttendanceSoccer
Tournaments 43,002 90,304 133,306Leagues 63,015 47,261 110,276
Total Soccer 106,017 137,565 243,582
OtherBaseball/Softball 3,773 7,923 11,696Volleyball (ISC) 4,640 9,744 14,384
Total Other 8,413 17,667 26,080
Total 114,430 155,232 269,662
Source: Rockford Park District, HSP
As shown, the Sportscore attracted nearly 270,000 attendees in 2010. Soccer tournaments attracted the greatest number of total attendees, 49 percent of the total attendance, while local leagues accounted for the largest number of participants. The Sportscore’s baseball/softball and the ISC’s volleyball events accounted for a much smaller number of attendees, ten percent of the entire total.

Westfield Grand Park Sportsplex Analysis Chapter 6 – Page 12
The following shows an overview of the Sportscore’s revenue and expense history for the past three years.

Westfield Grand Park Sportsplex Analysis Chapter 6 – Page 13
Table 6-7
Rockford Sportscore - 2008 through 2010 Budget
Item 2008 2009 2010
RevenueSoccer
Tournaments $50,261 $53,794 $56,000Individual Camp Fees 36,084 30,698 20,000Team League Fees 107,541 93,147 110,000Club Soccer 0 9,502 10,000Rentals 115,797 138,200 133,000
Total $309,683 $325,341 $329,000
SoftballTournaments $10,457 $24,988 $32,000Program Fees 95,093 106,490 113,300Ball Diamond Permits 14,433 19,565 20,900
Total $119,983 $151,043 $166,200
Other RevenueMen's Baseball League $5,740 $7,371 $6,000Concessions & Novelties 151,573 182,431 206,700Parking 143,035 111,264 112,500Advertising and Sponsorship 0 0 0Naming Rights 0 0 0
Total $300,348 $301,066 $325,200
Total Revenue 730,014 777,450 820,400
ExpensesAdministrative
Salary - Permanent Staff $143,464 $84,864 $84,393Benefits - Permanent Staff 37,803 16,077 15,245Seasonal Salaries 38,848 24,067 33,700
Total $220,115 $125,008 $133,338
ProgramSoccer Program $41,155 $34,812 $37,575Softball Program 72,641 86,229 119,075Men's Senior Baseball League 5,740 7,371 6,000
Total $119,536 $128,412 $162,650
OperationsConcessions $98,297 $185,649 $198,129Utilities 61,335 68,558 28,745Maintenance 555,724 537,698 481,312
Total $715,356 $791,905 $708,186
Total Expenses $1,055,007 $1,045,325 $1,004,174
Net Income (Deficit) ($324,993) ($267,875) ($183,774)
Source: Rockford Park District

Westfield Grand Park Sportsplex Analysis Chapter 6 – Page 14
Rockford’s Sportscore has operated at a deficit from 2008 to 2010. Soccer programming, primarily from league fees and rentals, accounted for 40 percent of the facility’s total revenue. The most significant expenses resulted from maintenance of the facility’s natural turf fields and common areas, 48 percent of total expense.
Hotel and Local Economic Impact
Conversations with the Rockford CVB indicate that the Sportscore generates approximately 65,000 annul room nights. This impact is from a combination of soccer, baseball/softball and volleyball events. The remaining events typically involve local residents. Sportscore management indicates that nearly 85 percent of all attendees are non-local and require lodging accommodations.
Economic development has been minimal surrounding Sportscore One, a result of the complex’s location along a river in a relatively remote area of Rockford. Sportscore Two however, has served as an anchor of a recent amateur sports campus near Rockford’s primary access to the interstate. This complex includes a YMCA and the local minor league baseball stadium. Retail and hotel developments are expected in the coming years.
Westfield Implications
Rockford’s Sportscore demonstrates a successful model of providing tournament quality facilities for both soccer and baseball/softball. While soccer accounts for the majority of attendees and revenue, baseball/softball (primarily softball) events provide a significant amount of revenue from tournament events.
The Sportscore’s physical specifications closely resemble Westfield, with a combination of synthetic turf and natural grass along with several fields with lighting. Sportscore attempts to attract both large tournaments as well as local events. Depending on the scheduling philosophies of both the ISA and Indiana Bulls, attendance figures for Westfield are expected to be similar to the Sportscore.
Snowden Grove Park– Southaven, Mississippi
Snowden Grove Park is a 17-field baseball-only facility located in Southaven, Mississippi, which is a suburb of Memphis, Tennessee. All diamonds are natural grass, have lighting and vary in size to accommodate all levels of youth baseball. Additional amenities include the Southaven Field of Dreams, a mini-complex for handicapped and mentally challenged children and adults. The Southaven Parks & Recreation Department owns and operates the facility.
The following figure shows an overhead view of the complex.

Westfield Grand Park Sportsplex Analysis Chapter 6 – Page 15
Figure 6-4
The Southaven Parks and Recreation Department (SPRD) is responsible for scheduling local events and rentals while larger tournament scheduling is the responsibility of the Director of Tournaments, a third party contractor whose primary responsibility is to attract and operate regional and national tournaments. The (SPRD) prioritizes events based on expected attendance, revenue projections and impact on the local economy. The Director of Tournaments is a contracted employee whose compensation is based on a percentage of revenue from tournaments.
Snowden Grove Baseball hosts all tournaments that are booked by the Director of Tournaments. As a result, the Southaven Park District collects all revenue resulting from registration, concessions and merchandise. The Director of Tournaments serves as the supervisor for these events while SRPD employees assists in each events operation. The SPRD is also responsible for all day-to-day operation and maintenance of the complex.
The following table shows Snowden Grove’s attendance in 2010.
Table 6-8
Snowden Grove - 2010 Attendance
Event Type Participants Spectators AttendanceTournaments 18,750 37,500 56,250Recreation Leagues 1,800 3,780 5,580
Total Attendance 20,550 41,280 61,830
Source: Overland Park Soccer Park District, HSP
In 2010, nearly all of the attendees were from tournaments. In total, nearly 62,000 attendees came to Snowden Grove. This is much fewer attendees than some of the other comparables. Additionally, Snowden Grove traditionally attracts non-elite tournaments and has no association

Westfield Grand Park Sportsplex Analysis Chapter 6 – Page 16
with a local elite baseball organization. These events are normally youth baseball leagues like Dizzy Dean and Babe Ruth Baseball and normally attract fewer teams than what is typically found in elite tournaments. Additionally, these events alternate between several sites. When not hosting tournaments, the complex is rented by local recreational organizations for adult and youth league games.
The following table shows the Snowden Grove Baseball’s budget for 2010.
[INSERT FINANCIAL INFORMATION]
Hotel and Local Economic Impact
The Southaven CVB indicated that Snowden Grove generates approximately 17,000 annual room nights. The majority of these room nights are a result of “super events,” large regional events that have an existing relationship with the complex. For example, the Dizzy Dean Youth Baseball League’s regional tournament is annually held in Southaven and generates approximately 2,500 total room nights in the local market.
Minimal economic development has occurred as a result of Snowden Grove. Several hotels and retail developments are located in close proximity to the complex, but were well established prior to Snowden Grove’s development.
Westfield Implications
Snowden Grove Baseball is one of the few community owned and operated baseball complexes in the country. The complex is scheduled to maximize tournament impact while it continues to provide recreation access to the local community. The lack of a relationship with an elite baseball organization (and associated tournament schedule) forces the complex to develop relationships with youth baseball groups. Westfield’s agreement with the Indiana Bulls will offer an established tournament schedule for larger elite teams.
National Sports Center – Blaine, Minnesota
The National Sports Center (NSC), located in Blaine, Minnesota, is a 600-acre amateur and recreational sports facility that hosts several sports. The NSC is the largest recreational sports complex in the United States. The NSC facilities draw over three million visitors each year to its numerous tournaments, leagues and other sporting events. The management at the NSC states that it is the most visited sports venue in the state, surpassing all of the professional sports venues in Minneapolis-St. Paul.
The NSC began through an initial appropriation of $14.7 million from the State of Minnesota in 1987, and opened in 1990 with 30 athletic fields, the velodrome, the stadium, the residence hall and sports hall.

Westfield Grand Park Sportsplex Analysis Chapter 6 – Page 17
The figure below is a map of the complex.
Figure 6-5
The facilities at the NSC include:
Fifty-two athletic fields, used for soccer, football, lacrosse, rugby and ultimate Frisbee.
NSC Stadium, with 12,000 fixed seats, holds events for soccer and other outdoor uses. It is the home of the Minnesota Thunder pro soccer team.
The Schwan Super Rink includes eight ice rinks, 32 locker rooms, a pro shop, restaurant and training center.
The National Youth Golf Center is a golf complex that includes an 18-hole course built for youth, with multiple tee boxes on every hole, an 18-hole grass putting green course, and a clubhouse and pro shop.
The velodrome holds track cycling events on a year-round basis, including Olympic trials and national championships.
Westfield Grand Park Sportsplex Analysis Chapter 6 – Page 18
The sports hall has over 58,000 square feet of activity area with a “FieldTurf” artificial surface, surrounded by an indoor track. The facility can be used for youth indoor soccer and track and field events, as well as non-sports events such as banquets and trade shows.
The NSC Residence Hall is a 180-bed dormitory and adjoining cafeteria, with two lounges.
The Schwan Center is an all-purpose events center with a total of over 15,000 square feet of meeting space,
Since opening, the National Sports Center Foundation (NSCF) has handled the operations of the complex. The non-profit foundation operates the facility on a self-supporting basis, so that no public funds are needed to pay for operations. Each facility charges a fee for use by leagues and tournaments.
The NSCF also develops sponsorships for the facility to supplement rental costs and fees. Sponsors of the complex include The Schwan Food Company, Coca-Cola, Farmers Insurance and several local companies. The NSCF also has fostered partnerships with municipalities and counties, as well as with non-profit groups and sports associations. These partnerships provide revenue through guaranteed group use and other assistance.
The 52 athletic fields offer many options for soccer and other field sports throughout the spring, summer and fall. All of the fields are natural grass, which has lower replacement costs but requires more ongoing maintenance. The fields must be “rested” or not used, several times throughout the year. The NSC has enough fields so that it can rotate use of the fields for daily and tournament use.
The NSC has established a five-year cycle for the fields, with the ongoing maintenance of mowing and lining and semi-annual grass seeding and herbicide. Once every five years the field is taken out of service and rehabilitated, with a cost of $30,000 for that work. The NSC estimates that including the rehabilitation costs within the five-year cycle, the average annual cost for each field is up to $10,000.
Attendance for individual tournaments was unavailable after a request was made to NSC administrators. However, the NSC’s tournament schedule offers insight into event types as well as the number of participating teams.

Westfield Grand Park Sportsplex Analysis Chapter 6 – Page 19
Table 6-9
National Sports Center
2011 Field Sports Events
Sport Event DatesNo. of Teams
Rugby USA Rugby Men's Division I College Playoffs April 29 - May 1 4Rugby USA Rugby Women's Division I College Playoffs April 29 - May 1 8Soccer NSC Spring Cup May 7 - 8 200Soccer NSC Cup Soccer Tournament May 28-30 240
Ultimate Minnesota High School Ultimate State Championships
June 4 - 5 16
Rugby Minnesota Amateur Rugby Foundation High School Championships
June 4 - 5 16
Soccer Adult Summer Coed League Sunday Evenings, June - August
NA
Soccer Wal-Mart All American Cup June 17 - 19 200Soccer Schwan's USA Cup Weekend Tournament July 15 - 17Soccer Schwan's USA Cup July 19 - 23Ultimate USA Ultimate Youth Club Championships August 13-14 16Soccer NSC Challenge Cup Sept. 7 - 10 8Soccer Fall 6 v 6 Soccer League Sundays Sept. - Oct. NALacrosse Hot Dish Classic Oct. 1 -2 UnknownSoccer NSC Fall Cup Oct. 8 - 9 250
Source: National Sports Center
1,000
The largest event at the NSC is the Schwan’s USA Cup soccer tournament, a large international youth soccer tournament held each year in July. With over 10,000 participants from eighteen countries and forty states, the NSC states that it is the largest youth soccer tournament in the world.
Some of the tournaments that the NSC sponsors only bring a limited number of teams to the facility. The USA Rugby Men’s Playoffs had four teams, and the Women’s Playoffs had eight. The Minnesota Amateur Rugby Championships brought sixteen teams, and the soccer Challenge Cup brought four of the best high school boys’ teams and four girls’ teams for an elite tournament.
While the tournaments fill the fields several weekends per year, the most use of the fields comes from the leagues that use the facility and other rentals. The NCS runs an adult summer league on Sunday evenings and a fall league, also held on Sundays. The facility also rents the fields to several major adult soccer leagues throughout the Minneapolis/St. Paul area, including the Minnesota Women’s Soccer League, the Minnesota Recreational Soccer League and the Minnesota Amateur League, a highly competitive adult league.
Based on the weekly calendar the NSC posts, the facility also rents several fields per day to the City of Blaine for different programs throughout the week. Every weekday afternoon during the months that permit outdoor use, the City of Blaine reserves several fields for its use. The Totino Grace High

Westfield Grand Park Sportsplex Analysis Chapter 6 – Page 20
School also rents the fields for its soccer teams. The Minneapolis/St. Paul professional soccer team, the NSC Minneapolis Stars, plays at the stadium and practices at the facility.
The State of Minnesota provided the initial funds to develop the NSC through a $14.7 million appropriation. Those funds paid for the land purchase and construction of the original complex of 25 athletic fields, the velodrome, residence hall, stadium and the sports hall. To date the total cost of all facilities total more than $55 million. Municipal and private funds paid for the majority of the other facilities, as follows:
Schwan Super Rink - A coalition of eight communities partnered with Ramsey and Anoka Counties and the Minnesota Amateur Sports Commission to pay the construction costs of $11 million for the initial facility, and several of the partners joined with the Herb Brooks Foundation and Bethel University to pay for the $10 million expansion.
National Youth Golf Center - Funding sources for the development of the center included $3.1 million from the State of Minnesota and more than $6 million from private sources, including the First Tee Foundation, a non-profit organization established to encourage youth participation in golf.
Schwan Center – The State of Minnesota issued $5.1 million in state bonds to pay for the construction of the $11 million Schwan Center. The remainder of the funds derived from private and non-profit sources, including sponsorships.
The NSC has an annual budget of approximately $13 million. Each year since it opened the NSC has met the budget without financial assistance from the state. with the NSC has a staff of over sixty and an offering of over 100 programs each year. The NSC does not break out the field sports or tournaments in a way that would be meaningful for this report.
Hotel and Local Economic Impact
The National Sports Center has partnered with Twin Cities Gateway, a regional Minneapolis Convention and Visitors Bureau (CVB), to place visitors in hotels in the area. Twin Cities Gateway is a consortium of 22 hotels that give a portion of the receipts back to the CVB based on proven room-nights that the NSC generates. The CVB then turns over the funds to the NSC to be applied to its marketing and hotel booking efforts.
The tournament teams are required to stay at official tournament hotels, all of which are part of the Twin Cities Gateway group. Hotel stays are coordinated in-house by a staff person of the NSC, who also tracks the hotel reservations and counts. For the USA Cup, which has over 1,000 teams, the NSC has recruited additional hotels that give a rebate directly to the facility. The NSC also has a residence hall on-site for participants, with rooms furnished with two sets of bunk beds. Several campgrounds in the area also serve the NSC. For the USA Cup the NSC works with the universities in Minneapolis/St. Paul to provide dormitories for the international teams.
Field sports events at NSC provide the area with approximately 21,000 room-nights per year, with more than half of those room-nights created from the annual USA Cup. The entire facility estimates
Westfield Grand Park Sportsplex Analysis Chapter 6 – Page 21
that it has a yearly economic impact of over $4 million, with the field sports and in particular the USA Cup creating approximately half of that economic activity.
Westfield Implications
A significant number of local and regional league events demonstrate that servicing these groups can be a financially viable option. While large tournaments are scheduled, these events do not account for as high as a percentage as other comparable facilities. This is due in part to the significant number of playing surfaces at the complex. While several surfaces are used for competition, others are resting. This rotation allows the NSC to continually use its facilities for any number of events.
Maryland SoccerPlex and Discovery Sports Center – Boyds, Maryland
The Maryland SoccerPlex and the adjacent Discovery Sports Center, located in Boyds, Maryland, are two adjacent facilities established through public and not-for-profit organizations. The facilities, both owned and operated by the Maryland Soccer Foundation, Inc., a non-profit, 501(c)(3) corporation, have been greatly successful in furthering the recreational sports opportunities of the metropolitan Washington, D.C., area.
The Maryland SoccerPlex (MSP) and Discovery Sports Center (DSC) are located in Boyds, Maryland, an incorporated town located in Montgomery County, 35 miles northeast of Washington, D.C. The MSP and DSC opened in 2000, through a joint venture between the Maryland Soccer Foundation and the Maryland-National Capital Park and Planning Commission, the regional parks and recreation commission for Montgomery and Prince George’s Counties, Maryland. The Maryland Soccer Foundation owns and manages the facilities, located on 162 acres within a 655-acre South Germantown Recreational Park.
The figure below is a diagram of the complex.

Westfield Grand Park Sportsplex Analysis Chapter 6 – Page 22
Figure 6-6
The facilities at the Maryland SoccerPlex include:
22 athletic fields, used for primarily for soccer, but also for football, lacrosse, rugby and ultimate Frisbee.
The Championship Stadium holds events for soccer and other outdoor uses, with fixed seating for 3,200, premier lighting system, a press box and electronic scoreboard.
75 parking spaces per field, based around field clusters.
Comfort stations, including restrooms centrally located around field clusters.

Westfield Grand Park Sportsplex Analysis Chapter 6 – Page 23
The Discovery Sports Center is a 64,000-square foot indoor multi-sport complex, located in the center of the MSP. It consists of:
Eight basketball/volleyball courts that could convert into two indoor soccer spaces.
Fixed seating for 150 spectators.
Discovery Sports Center Café with seating for 80 people.
The MSP has 19 natural grass fields and three artificial turf fields. The facility leases the turf fields year-round but only rents the natural fields in the spring and fall for weekend tournaments and throughout the summer, primarily for sports camps. The State of Maryland issued tax-exempt bonds in 1999 through the Maryland Economic Development Corporation to fund the project. The total cost was $19 million, with $8 million for the SoccerPlex, $6 million for the Discovery Sports Center, and $5 million for parking and other infrastructure. Montgomery County donated the land for the facilities.
Attendance for individual tournaments was unavailable after a request was made to local MSP administrators. However, the MSP’s tournament schedule offers insight into event types as well as the number of participating teams.
Table 6-10
Maryland SoccerPlex
2011 Field Sports Events
Sport Tournament Date No. of Teams
Lacrosse Breakout Lacrosse March Meltdown March 12-13 13Soccer MSC Cherry Blossom Classic March 26-27 120Soccer Kicks Against Breast Cancer April 9. unknownSoccer Maryland State Cup Finals May 21. 14Soccer Potomac Memorial Day Tournament May 27-30 332Soccer DC Scores Cup (Adult) June 11. 24Soccer TD Bank Mid-Atlantic Cup June 11-12 unknownLacrosse Nation’s Capitol Cup June 17-19 unknownLacrosse Adidas All American National Lacrosse Classic July 1-8 8Lacrosse Club National Championship July 14-17 80Lacrosse MadLax Summer Tour Finale July 23-24 40Soccer August Cup August 26-28 300Soccer Discovery Cup Soccer Tournament October 8-10 200Soccer Bethesda Girls Thanksgiving Tournament November 11-13 not determinedSoccer Bethesda Boys Thanksgiving Tournament November 18-20 not determined
Source: Maryland Soccer Foundation
As shown, the MSP attracts a significant number of lacrosse events in addition to soccer. This is geographically driven as lacrosse is much more popular in Maryland than it is in other parts of the country. These tournaments range from 15 teams to 300.

Westfield Grand Park Sportsplex Analysis Chapter 6 – Page 24
The facility has thirteen employees, three of which are devoted to marketing. The major emphasis is on soccer and other sporting events, but the facility also holds several non-sporting events each year. The complex markets for birthday parties, bar/bat mitzvahs, and trade shows.
The following table is a summary of the revenue and expenses of the Maryland Soccer Foundation for the 2010 Fiscal Year.
Table 6-11
Maryland Soccer Foundation
Revenue and Expense (2010)
Line Item AmountRevenue
Soccer Complex $3,357,501Other 1,074,258
Total Revenue $4,431,759
ExpenseFacilities $1,814,574Clinics and Camps 787,605Tournaments 462,574Other Actual 149,044
Total Expenses $3,213,797
Net Revenue $1,217,962
Source: Maryland Soccer Foundation
As the table shows, the Maryland Soccer Foundation reported 2010 revenue of $3.36 million from the soccer complex, with actual expenses of $3.21 million. The total revenue for the foundation was $4.4 million, with total expenses of $3.2 million. The foundation also reported receipt of a grant of $474,129 for the year, included in its overall revenue.
Hotel and Local Economic Impact
The fields support tournaments of up to 300 teams for soccer tournaments, as evidenced by the weekend tournaments over Memorial Day and the last weekend in August. Most of the teams participating in these tournaments are from the area and region around Washington, as well as Baltimore, so that most teams would not stay overnight. However, some teams at these tournaments, especially the more elite lacrosse and soccer tournaments, are from outside the immediate area and would stay in hotels in the Montgomery County area. Out-of-state teams must use the Conference and Visitors Bureau of Montgomery County to book hotels. The CVB estimated that in 2010 the SoccerPlex generated over 14,000 room nights.

Westfield Grand Park Sportsplex Analysis Chapter 6 – Page 25
Westfield Implications
The Maryland SoccerPlex demonstrates how a facility can attract sports other than soccer. While lacrosse is much more popular in Maryland than in Indiana, the MSP has shown the ability to diversify its scheduling practices to maximize the facility’s usage. Grand Park should also make an effort to attract non-soccer events to supplement the facility’s usage and finances.
Other Facilities – Private Baseball Complexes
In addition to the aforementioned facilities, other youth baseball complexes attract large tournaments but operate under a different business model. These facilities are elements of a larger business operation and are owned and operated by a parent company. The most significant difference between these facilities and those mentioned above is that these parent companies are responsible for all scheduling, operation and maintenance of these facilities. The organizations do not engage in third party rental agreements with local groups.
Two complexes, the Ripken Experience and East Cobb Baseball, are the best examples of this private business model. Both organizations host regional and national tournaments. Ripken Baseball also hosts local leagues and host a number of youth baseball events. East Cobb Baseball also supports its own elite travel baseball teams. These teams travel nationally and are considered some of the best players in the country.
Each complex is profiled below.
Ripken Experience – Aberdeen, Maryland
The Ripken Experience is a baseball-only facility that hosts tournaments, leagues and instructional camps in Aberdeen, Maryland. Amenities include ten diamonds (six baseball and four softball), batting cages and an infield practice field. Each baseball field is designed to replicate popular professional stadiums, including Oriole Park at Camden Yards, Fenway Park and Wrigley Field. The complex is the centerpiece of Ripken Baseball, a sales and marketing company based in Baltimore, MD that represents all business and philanthropic efforts of former professional baseball players, Cal Ripken, Jr. and Bill Ripken.
The following table shows the 2010 attendance statistics for the Ripken Experience.
Table 6-12
Ripken Experience - 2010 Attendance
Event Type Participants Spectators AttendanceTournaments 24,345 48,690 73,035Leagues 1,350 2,835 4,185
Total Attendance 25,695 51,525 77,220
Source: Overland Park Soccer Park District, HSP

Westfield Grand Park Sportsplex Analysis Chapter 6 – Page 26
As shown, the complex attracted 77,000 attendees in 2010. The majority of attendance resulted from tournaments.
The following figure shows an aerial view of the Ripken Experience’s Aberdeen complex.
Figure 6-7
The success of the Aberdeen, Maryland, complex led the Ripken Baseball Experience to open a second facility, in Myrtle Beach, South Carolina. This facility consists of consists of seven fields, two regulation-sized diamonds, and five youth diamonds. The fields are designed after historic ballparks from baseball history and include Griffith Field, Navin Field and The Polo Grounds.
The following picture is an aerial view of the Myrtle Beach Complex.
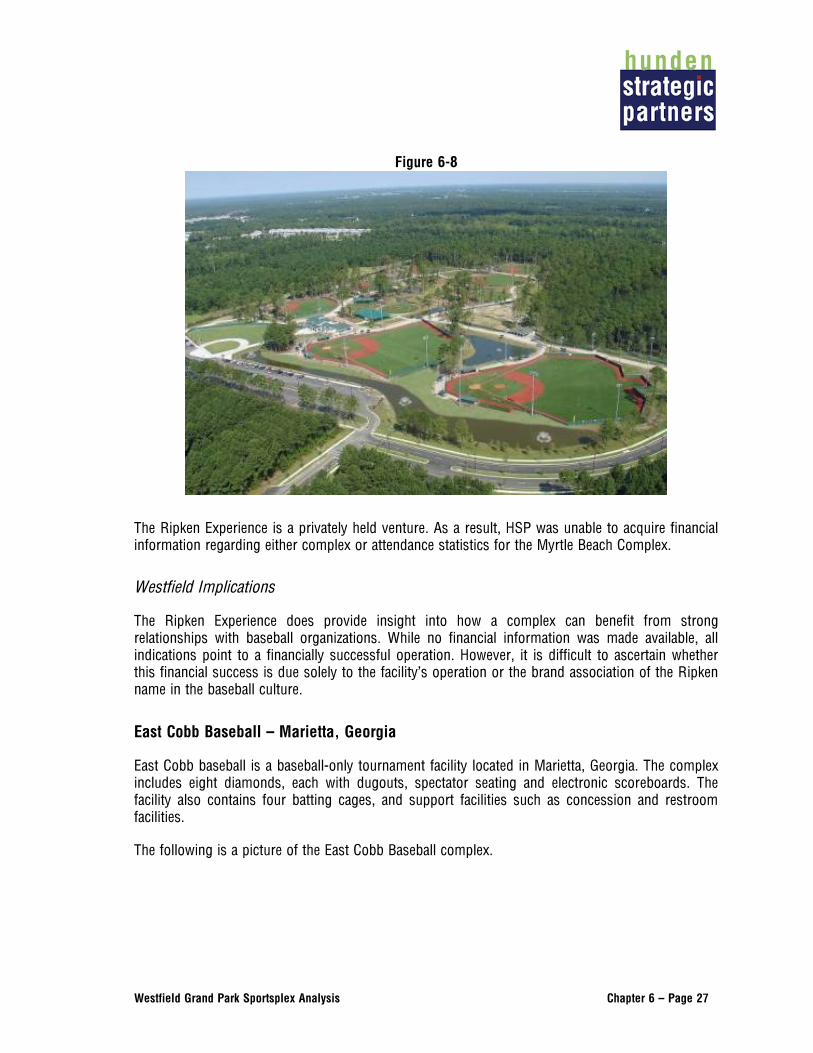
Westfield Grand Park Sportsplex Analysis Chapter 6 – Page 27
Figure 6-8
The Ripken Experience is a privately held venture. As a result, HSP was unable to acquire financial information regarding either complex or attendance statistics for the Myrtle Beach Complex.
Westfield Implications
The Ripken Experience does provide insight into how a complex can benefit from strong relationships with baseball organizations. While no financial information was made available, all indications point to a financially successful operation. However, it is difficult to ascertain whether this financial success is due solely to the facility’s operation or the brand association of the Ripken name in the baseball culture.
East Cobb Baseball – Marietta, Georgia
East Cobb baseball is a baseball-only tournament facility located in Marietta, Georgia. The complex includes eight diamonds, each with dugouts, spectator seating and electronic scoreboards. The facility also contains four batting cages, and support facilities such as concession and restroom facilities.
The following is a picture of the East Cobb Baseball complex.

Westfield Grand Park Sportsplex Analysis Chapter 6 – Page 28
Figure 6-9
The East Cobb Baseball complex serves as the center piece of an elite baseball organization that attracts the premier youth baseball talent from the surrounding community for travel baseball competitions. East Cobb Baseball teams play on a national level, traveling to many significant youth baseball tournaments. Each East Cobb team operates independently and is responsible for its own budget.
East Cobb Baseball hosts the premier elite youth baseball tournaments in the south at the facility. East Cobb Baseball or independent in-house teams host tournaments. East Cobb Baseball tournaments are typically large regional and national events where the organization collects all revenue resulting from admission, merchandise and concession sales. Independent teams collect the gate admission for hosted tournaments. Also, East Cobb Baseball offers each travel team the opportunity to raise money by selling web page sponsorships on the complex’s website. Teams also have the opportunity to sell sponsorship for the outfield fences and receive 15 percent of the proceeds
East Cobb Baseball also hosts a number of academies and clinics for elite youth baseball players. These events are marketed as opportunities to compete in front of influential coaches and scout for the opportunity to advance to collegiate baseball and beyond. A well-connected staff with a strong network of baseball evaluators and coaches assists East Cobb Baseball players and connects them with professional and college scouts. East Cobb Baseball can illustrate its history of success with a strong alumni base of collegiate and professional baseball players.
The non-profit corporation ECB, Inc., is the owner of the facility and the company that fields the travel teams. The most recent revenue and expense information for ECB, Inc., is set forth in the table below.

Westfield Grand Park Sportsplex Analysis Chapter 6 – Page 29
Table 6-13
ECB, Inc.
Revenue and Expense (2010)
Line Item AmountRevenue
Showcases/Tournaments $525,203Sponsorships 372,079Player Registration Fees 248,105Clinics 147,069Concessions 48,069Other 131,149
Total Revenue $1,471,674
ExpenseDirector Compensation $158,475Other Salaries 279,020Field Maintenance 287,234Tournaments 462,574Utilities 123,489Other Actual 137,699
Total Expenses $1,448,491
Net Revenue $23,183
Source: EBC, Inc.
As the table above shows, ECB had total revenue in 2010 of $1.5 million. The largest expenses were salaries, field maintenance, tournament costs and director compensation. ECB reported net income of $23,000 in 2010.
Westfield Implications
East Cobb Baseball demonstrates how elite baseball tournaments, clinics and academies can benefit a complex’s usage and financial performance. These organizations attract players seeking increased levels of competition, which results in tournaments on a regional and national level. While ECB does not provide adequate access to the local, non-elite, community, it is able to remain self-sufficient by continuing to brand itself as the premier youth baseball organization in the surrounding area. Grand Park’s association with the Indiana Bulls has the potential to be a similar relationship.
Summary
This chapter presents a range of youth sports complexes that all have similar characteristics to Grand Park. While subtle differences are found between each facility, each complex’s business model is focused on scheduling large tournaments. These tournaments attract a significant number of non-local attendees and has a direct impact on the local hotel market through room nights

Westfield Grand Park Sportsplex Analysis Chapter 6 – Page 30
generated. These facilities also maintain a small local league to help supplement each facility’s usage and financials.
Scheduling priorities are a feature in nearly all comparable facilities. An emphasis is placed on tournaments while local groups are offered usage based on whether there is calendar availability after tournaments are scheduled. Some facilities have demonstrated the ability to attract more than just soccer and baseball events, further enhancing usage opportunities and financial performance.
The use of synthetic fields and lighting greatly expands a facility’s schedule flexibility. Complexes with these amenities are capable of hosting more events while maintaining a longer daily schedule. Natural grass fields require time to rest in order to maintain player safety and adequate playing conditions.
Grand Park’s success will depend on how well the facility’s schedulers and staff can meet the standards set by these comparable facilities. Not only do these complexes offer insight into Grand Park’s usage and financial performance, they will also serve as competitors for many tournaments and events.

Westfield Grand Park Sportsplex Analysis Chapter 7, Page 1
TABLE OF CONTENTS
Chapter 1 Introduction and Executive Summary
Chapter 2 Economic and Demographic Profile of Westfield and Hamilton County
Chapter 3 Youth and Amateur Sportsplex Industry Trends
Chapter 4 Profile of the Project
Chapter 5 Competitive Assessment
Chapter 6 Comparable Facilities and Performance Impacts
Chapter 7 Demand and Financial Projection

Westfield Grand Park Sportsplex Analysis Chapter 7, Page 2
DEMAND AND FINANCIAL PROJECTION
Discussion of Strengths, Weaknesses, Opportunities and Threats
HSP has used a SWOT (Strengths, Weaknesses, Opportunities and Threats) analysis to evaluate the proposed Grand Park. The analysis draws from the facts surrounding the concept, the City of Westfield and the surrounding community, the facilities and activities that may be considered as competitors in the region, and facilities throughout Indiana and the United States that would be considered comparable examples to the proposed concept.
The application of that analysis is as follows:
Strengths (Existing attributes that are helpful to Grand Park)
Population Base. While the population of the City of Westfield is approximately 30,000, historical population growth and expected future growth indicate the growing need for recreation facilities. Given that the current population has demonstrated a high demand for recreation services, continued population growth is expected to increase this demand and in turn increase the viability of new recreation facilities.
Viable and Stable Local Partners. The local sports organizations with which the City intends to partner are popular, successful groups that have provided sports and recreation services for the community for many years. The two groups, the Westfield Youth Soccer Association and the Westfield Youth Sports, Inc., have grown through the years to be the largest and most important youth sports organizations in the community.
Profitable and Successful Regional Partners/Tenants. Both the Indiana Soccer Association (ISA) and the Indiana Bulls have a history of many years of success in their respective sports. The ISA is part of the largest youth soccer organization in the United States and runs or sponsors many local, regional and state-wide tournaments. The Indiana Bulls is one of the most well-known private travel youth baseball teams in the United States, with a reputation of providing participants with the opportunity to improve their skills while playing before college and professional scouts.
Grand Park Sports Campus Plan. The physical plan of the Grand Park Sports Campus is ambitious, and if implemented will provide a venue for recreational sports that will be one of the best in the region and the nation.
Weaknesses (Existing attributes that may hurt the success of Grand Park)
Access. While the Grand Park site presently is within easy access to a four-lane highway, US 31, access to the facility will be a challenge until construction that improves the highway to interstate standards is complete in 2016 or 2017.

Westfield Grand Park Sportsplex Analysis Chapter 7, Page 3
Lack of Services. Presently the Grand Park area and the City of Westfield generally do not have the hotels that would be able to fully support the major tournaments that Grand Park hopes to attract. These amenities may develop over time based on the facility and continued growth of the community as a whole, but presently the lack of services will lessen the impact of the tournaments on Westfield proper.
Lack of Four-Season Facilities. The present plan for Grand Park includes a future indoor facility, but immediate plans are for outdoor fields and diamonds. From November through March the facility will have very limited use.
Lack of Scheduling Flexibility. As proposed, the ISA and the Indiana Bulls will control Grand Park’s schedule. This may limit access to a segment of the local population, especially competing organizations such as groups associated with U.S. Club Soccer and the Roundtrippers.
Opportunities (External conditions that will help the feasibility of Grand Park)
Development of Tournaments and Leagues through Partners. The existing partners, especially the ISA and the Indiana Bulls, have the ability to develop, manage and conduct several regional tournaments per year that will bring participants and spectators from around the region and the United States.
Quality Existing Demand. The facility as planned will be one of the largest and highest-quality facilities in the country, with championship-caliber fields and diamonds, as well as concession stands, bathrooms and other facilities.
Economic Development of Surrounding Areas. Because of the potential for regional and national tournaments, as well as the traffic from leagues and other events, the area surrounding Grand Park has the opportunity to develop, especially services such as hotels and restaurants, retail, and potentially sports health facilities.
Trends for Travel Teams and Elite Tournaments. One major trend in recreation sports is the growth of travel teams and the tournaments and other competitions that those teams require. The Indiana Bulls is an organization that has many travel teams, and its tournaments will draw a large group of teams. Other travel team sports also create opportunities for tournaments, including rugby, lacrosse and softball.
Other Possible Partners. Westfield and the surrounding area are home to other organizations that may want to partner or use the facilities. Other local travel team baseball groups such as the Roundtrippers or the Westfield Indians may want to practice or play at the baseball diamonds, and other soccer teams not affiliated with the ISA may wish to play on the soccer fields.
Threats (External conditions that are a threat to the feasibility of Grand Park)
Market Saturation. Many tournaments around the state already exist, and the clubs and teams that sponsor and manage those tournaments make profits from the tournaments for their organizations. The ISA may not want to sanction tournaments

Westfield Grand Park Sportsplex Analysis Chapter 7, Page 4
at Grand Park on weekends that another sanctioned tournament is occurring in the area. Baseball tournaments in Indianapolis will want to continue with their tournaments even though the Indiana Bulls wishes to hold a tournament on the same weekend.
Scheduling Conflicts. The facility wants to provide services to the local groups such as the Westfield Youth Soccer Association and Westfield Youth Sports. It also wants to host regional tournaments that will create economic opportunities and growth. The schedule of the facilities could become difficult due to these two conflicting goals.
Demand and Financial Projection
The City of Westfield has drafted proposed agreements with two primary tenants, the Indiana Bulls and the Indiana Soccer Association. Based on the assumptions associated with these agreements as well as the historical operations of the tenants and the other proposed users, HSP has generated a demand model that then assisted in creating a financial model.
The projection assumes only activity on the outdoor fields.
The following table shows the number of annual events assumed for each user group.

Westfield Grand Park Sportsplex Analysis Chapter 7, Page 5
Table 7-1
Projected Number of Events - Grand Park
2013 2014 2015 2016 2017
Westfield Youth Soccer Assoc. - Tournaments 2 2 2 2 2Westfield Youth Soccer Assoc. - League (spring) 12 12 12 12 12Westfield Youth Soccer Assoc. - League (fall) 20 20 20 20 20Indiana Soccer Association - State Tournaments 10 11 12 12 12Indiana Soccer Association - Regional Camps 1 1 1 1 1Indiana Soccer Association - Regional Tournaments 3 3 3 3 3Indiana Soccer Association - National Clinics 1 1 1 1 1Indiana Bulls - Tournaments 11 12 14 14 14Indiana Bulls - Practice 120 120 120 120 120Indiana Bulls - Summer Camp 1 1 1 1 1Indiana Bulls - Clinics 8 9 10 10 10Westfield Youth Sports - Baseball 15 15 15 15 15Westfield Youth Sports - Softball 15 15 15 15 15Westfield Youth Sports - Footbal (Flag & Tackle) 9 9 9 9 9Westfield Youth Sports - Lacrosse 10 10 10 10 10Westfield Youth Sports - Adult Softball 14 14 14 14 14Westfield Youth Sports - Adult Soccer 7 7 7 7 7Hamilton County Sports Authority Event 3 4 5 5 5Other Non-Sport Event* 4 5 6 6 6High School Regional/State Soccer Tournaments 2 2 2 2 2High School Regional/State Baseball Tournaments 2 2 2 2 2High School Regional/State Softball Tournaments 1 1 1 1 1
Total 238 241 245 245 245
Events Less Bulls Practice 118 121 125 125 125
Tournaments (All Sports & Organizations) 34 37 41 41 41
Source: HSP, Various Sports Organizations
As shown, there are projected to be nearly 250 events in the stabilized year (120 of which are Bulls practices), including 41 tournaments. Each “League Event” is a day of league games. Local league practice days were not included.
The following provides brief descriptions of each event types.
Westfield Youth Soccer Association
Tournaments: Weekend tournaments for local youth soccer teams.
Spring League: In-house local youth league games.
Fall League: In-house local youth league games.
Indiana Soccer Association
State Tournaments: Weekend tournaments for traveling ISA teams.
Regional Camps: Weeklong instructional camp for players from across the Midwest.

Westfield Grand Park Sportsplex Analysis Chapter 7, Page 6
Regional Tournaments: Weekend tournaments between traveling Midwest teams.
National Clinics: Coaching clinics that attract participations from across the U.S.
Indiana Bulls
Tournaments: Weekend tournaments for elite traveling Indiana and Midwest teams.
Practice: Regularly scheduled Bulls practices.
Summer Camp: Weeklong player development academy for elite Midwest players.
Clinics: Weeklong instructional camp for local and regional players.
Westfield Youth Sports: Local Westfield recreational sport leagues, including practices and competitions.
Hamilton County Events: Third party sporting events booked by the Hamilton County CVB.
Other Non-Sport Event: Third party non-sporting events booked by the tenants or the HCCVB.
High School Regional/State Tournaments: Indiana High School Athletic Association events.
Based on the number of average days per event type, the following number of event-days was projected.

Westfield Grand Park Sportsplex Analysis Chapter 7, Page 7
Table 7-2
Projected Event Days at Grand Park
Days per Event 2013 2014 2015 2016 2017
Westfield Youth Soccer Assoc. - Tournaments 2.5 5 5 5 5 5Westfield Youth Soccer Assoc. - League (spring) 1 12 12 12 12 12Westfield Youth Soccer Assoc. - League (fall) 1 20 20 20 20 20Indiana Soccer Association - State Tournaments 2 20 22 24 24 24Indiana Soccer Association - Regional Camps 4.5 4.5 4.5 4.5 4.5 4.5Indiana Soccer Association - Regional Tournaments 2 6 6 6 6 6Indiana Soccer Association - National Clinics 4.5 4.5 4.5 4.5 4.5 4.5Indiana Bulls - Tournaments 2.5 27.5 30 35 35 35Indiana Bulls - Practice 1 120 120 120 120 120Indiana Bulls - Summer Camp 4.5 4.5 4.5 4.5 4.5 4.5Indiana Bulls - Clinics 1.5 12 13.5 15 15 15Westfield Youth Sports - Baseball 1 15 15 15 15 15Westfield Youth Sports - Softball 1 15 15 15 15 15Westfield Youth Sports - Footbal (Flag & Tackle) 1 9 9 9 9 9Westfield Youth Sports - Lacrosse 1 10 10 10 10 10Westfield Youth Sports - Adult Softball 1 14 14 14 14 14Westfield Youth Sports - Adult Soccer 1 7 7 7 7 7Hamilton County Sports Authority Event 1.5 4.5 6 7.5 7.5 7.5Other Non-Sport Event* 1 4 5 6 6 6High School Regional/State Soccer Tournaments 1.5 3 3 3 3 3High School Regional/State Baseball Tournaments 2.5 5 5 5 5 5High School Regional/State Softball Tournaments 2.5 2.5 2.5 2.5 2.5 2.5
Total 325 334 345 345 345
Event Days less Bulls Practice 165 171 180 180 180Tournament Event Days 74 80 88 88 88
Available Days per Year 275 275 275 275 275Events per Day 1.04 1.06 1.09 1.09 1.09
Source: HSP, Various Sports Organizations
As shown, Westfield can expect nearly 350 event-days per year. This is not just the number of fields in use; instead it is any use of the facility during any day of the year. Assuming the facility can be used nine months of the year, this is an average of more than one event per day, although it is most likely that multiple groups will be using Grand Park simultaneously, especially on weekends.
The next table shows the number of expected teams, players and coaches using Grand Park annually.

Westfield Grand Park Sportsplex Analysis Chapter 7, Page 8
Table 7-3 Projected Teams & Participation at Grand Park
TeamsYouth/ Team
Coaches/ Team Total
Stabilized Year # of Teams 2013 2014 2015 2016 2017
Westfield Youth Soccer Assoc. - Tournaments 85 18 2 20 170 3,400 3,400 3,400 3,400 3,400Westfield Youth Soccer Assoc. - League (spring) 35 18 2 20 35 8,400 8,610 8,825 9,046 9,272Westfield Youth Soccer Assoc. - League (fall) 65 18 2 20 65 26,000 26,000 26,000 26,000 26,000Indiana Soccer Association - State Tournaments 80 18 2 20 960 16,000 17,600 19,200 19,200 19,200Indiana Soccer Association - Regional Camps 14 17 1 18 14 252 252 252 252 252Indiana Soccer Association - Regional Tournaments 4 18 2 20 12 240 240 240 240 240Indiana Soccer Association - National Clinics 1 0 30 30 1 30 30 30 30 30Indiana Bulls - Tournaments 85 16.5 2.5 19 1,190 17,765 19,380 22,610 22,610 22,610Indiana Bulls - Practice 1 16.5 2.5 19 1 2,280 2,280 2,280 2,280 2,280Indiana Bulls - Summer Camp 1 100 0 100 1 100 100 100 100 100Indiana Bulls - Clinics 2.5 16.5 1.5 18 25 360 405 450 450 450Westfield Youth Sports - Baseball 34 18 2 20 34 10,200 10,200 10,200 10,200 10,200Westfield Youth Sports - Softball 13 18 2 20 13 3,900 3,900 3,900 3,900 3,900Westfield Youth Sports - Footbal (Flag & Tackle) 24 16.5 2.5 19 24 4,104 4,104 4,104 4,104 4,104Westfield Youth Sports - Lacrosse 6 16 2 18 6 1,080 1,080 1,080 1,080 1,080Westfield Youth Sports - Adult Softball 12 17 1 18 12 3,024 3,024 3,024 3,024 3,024Westfield Youth Sports - Adult Soccer 12 13 1 14 12 1,176 1,176 1,176 1,176 1,176Hamilton County Sports Authority Event 32 18 2 20 160 1,920 2,560 3,200 3,200 3,200Other Non-Sport Event* n/a n/a n/a 300 n/a 1,200 1,500 1,800 1,800 1,800High School Regional/State Soccer Tournaments 3 18 2 20 6 120 120 120 120 120High School Regional/State Baseball Tournaments 3 18 2 20 6 120 120 120 120 120High School Regional/State Softball Tournaments 7 18 2 20 7 140 140 140 140 140
Total 2,754 101,811 106,221 112,251 112,472 112,698
Tournaments, Clinics & Camps Only 2,552 40,447 44,347 49,862 49,862 49,862
* Total Attendees OnlySource: HSP, Various Sports Organizations
Based on the assumptions, it is projected that approximately 2,750 teams will use Grand Park annually, totaling 113,000 participants per year in the stabilized year. Most of those, 2,550, would be teams coming for tournaments, clinics and camps. For local teams, each player playing each league game counts as one participant (so one player playing spring soccer would be counted ten times if there are ten weeks in the season). Nearly 50,000 participants are projected for tournaments, clinics and camps.
Family and friends accompany most of the participants. While local league play is expected to only draw one to two family members per event, tournaments are assumed to bring more than two family members per event.
The table below shows the expected number of spectators (family and friends) coming to Grand Park annually for various events.

Westfield Grand Park Sportsplex Analysis Chapter 7, Page 9
Table 7-4 Projection of Spectators at Grand Park
Others/ Participant 2013 2014 2015 2016 2017
Westfield Youth Soccer Assoc. - Tournaments 2.1 7,140 7,140 7,140 7,140 7,140Westfield Youth Soccer Assoc. - League (spring) 1.3 10,920 10,920 10,920 10,920 10,920Westfield Youth Soccer Assoc. - League (fall) 1.3 33,800 33,800 33,800 33,800 33,800Indiana Soccer Association - State Tournaments 2.1 33,600 36,960 40,320 40,320 40,320Indiana Soccer Association - Regional Camps 0.3 76 76 76 76 76Indiana Soccer Association - Regional Tournaments 2.1 504 504 504 504 504Indiana Soccer Association - National Clinics 0.3 9 9 9 9 9Indiana Bulls - Tournaments 2.1 37,307 40,698 47,481 47,481 47,481Indiana Bulls - Practice 0.5 1,140 1,140 1,140 1,140 1,140Indiana Bulls - Summer Camp 0.2 20 20 20 20 20Indiana Bulls - Clinics 0.5 180 203 225 225 225Westfield Youth Sports - Baseball 1.3 13,260 13,260 13,260 13,260 13,260Westfield Youth Sports - Softball 1.3 5,070 5,070 5,070 5,070 5,070Westfield Youth Sports - Footbal (Flag & Tackle) 1.3 5,335 5,335 5,335 5,335 5,335Westfield Youth Sports - Lacrosse 1.3 1,404 1,404 1,404 1,404 1,404Westfield Youth Sports - Adult Softball 0.3 907 907 907 907 907Westfield Youth Sports - Adult Soccer 0.3 353 353 353 353 353Hamilton County Sports Authority Event 1.3 2,496 3,328 4,160 4,160 4,160Other Non-Sport Event* 1 1,200 1,500 1,800 1,800 1,800High School Regional/State Soccer Tournaments 2.1 252 252 252 252 252High School Regional/State Baseball Tournaments 2.1 252 252 252 252 252High School Regional/State Softball Tournaments 2.1 294 294 294 294 294
Total 155,518 163,424 174,722 174,722 174,722
Tournaments, Clinics & Camps Only 82,129 89,735 100,733 100,733 100,733
Source: HSP, Various Sports Organizations
Based on the assumptions, HSP projects as many as 175,000 family and friends will attend events annually. Of these, approximately 100,000 are due to tournaments, clinics and camps, suggesting a significant tourism impact.
The next table shows the total number of participants (participants and spectators) expected at Grand Park.

Westfield Grand Park Sportsplex Analysis Chapter 7, Page 10
Table 7-5
Projected Total Visitors (Players, Coaches, Families) at Grand Park
2013 2014 2015 2016 2017
Westfield Youth Soccer Assoc. - Tournaments 10,540 10,540 10,540 10,540 10,540Westfield Youth Soccer Assoc. - League (spring) 19,320 19,530 19,745 19,966 20,192Westfield Youth Soccer Assoc. - League (fall) 59,800 59,800 59,800 59,800 59,800Indiana Soccer Association - State Tournaments 49,600 54,560 59,520 59,520 59,520Indiana Soccer Association - Regional Camps 328 328 328 328 328Indiana Soccer Association - Regional Tournaments 744 744 744 744 744Indiana Soccer Association - National Clinics 39 39 39 39 39Indiana Bulls - Tournaments 55,072 60,078 70,091 70,091 70,091Indiana Bulls - Practice 3,420 3,420 3,420 3,420 3,420Indiana Bulls - Summer Camp 120 120 120 120 120Indiana Bulls - Clinics 540 608 675 675 675Westfield Youth Sports - Baseball 23,460 23,460 23,460 23,460 23,460Westfield Youth Sports - Softball 8,970 8,970 8,970 8,970 8,970Westfield Youth Sports - Footbal (Flag & Tackle) 9,439 9,439 9,439 9,439 9,439Westfield Youth Sports - Lacrosse 2,484 2,484 2,484 2,484 2,484Westfield Youth Sports - Adult Softball 3,931 3,931 3,931 3,931 3,931Westfield Youth Sports - Adult Soccer 1,529 1,529 1,529 1,529 1,529Hamilton County Sports Authority Event 4,416 5,888 7,360 7,360 7,360Other Non-Sport Event* 2,400 3,000 3,600 3,600 3,600High School Regional/State Soccer Tournaments 372 372 372 372 372High School Regional/State Baseball Tournaments 372 372 372 372 372High School Regional/State Softball Tournaments 434 434 434 434 434
Total 257,329 269,645 286,973 287,194 287,420
Tournaments, Clinics & Camps Only 122,576 134,082 150,595 150,595 150,595
Source: HSP, Various Sports Organizations
Total attendance is projected to increase from 257,000 to nearly 290,000 by stabilization, depending on the number of tournaments held. 150,000 attendees are projected from tournaments, clinics and camps in the stabilized year.
Based on the assumed distance traveled for tournaments and the number of people per hotel room, hotel room night assumptions and projections were determined and are shown below.

Westfield Grand Park Sportsplex Analysis Chapter 7, Page 11
Table 7-6 Projected Room Nights Generated by Grand Park
% Overnight
People/ Room
Nights per Tournament 2013 2014 2015 2016 2017
Westfield Youth Soccer Assoc. - Tournaments 10% 3.9 2.5 676 676 676 676 676Indiana Soccer Association - State Tournaments 45% 3.9 2.0 11,446 12,591 13,735 13,735 13,735Indiana Soccer Association - Regional Camps 80% 3.9 4.5 302 302 302 302 302Indiana Soccer Association - Regional Tournaments 80% 3.9 2.0 305 305 305 305 305Indiana Soccer Association - National Clinics 95% 3.9 4.5 43 43 43 43 43Indiana Bulls - Tournaments 80% 3.9 2.5 28,242 30,809 35,944 35,944 35,944Indiana Bulls - Clinics 80% 3.9 1.5 166 187 208 208 208Hamilton County Sports Authority Event 90% 2.5 1.5 2,385 3,180 3,974 3,974 3,974Other Non-Sport Event* 20% 3.0 1.0 160 200 240 240 240High School Regional/State Soccer Tournaments 15% 3.9 1.5 21 21 21 21 21High School Regional/State Baseball Tournaments 15% 3.9 2.5 36 36 36 36 36High School Regional/State Softball Tournaments 15% 3.9 2.5 42 42 42 42 42
43,934 48,502 55,637 55,637 55,637
Source: HSP, Various Sports Organizations
As shown, only tournaments, camps, clinics and special events are expected to generate room nights. However, these tournaments are projected to generate nearly 44,000 room nights the first year operations and more than 55,000 annual room nights by the stabilized year. These will have a positive impact on the cash flow of the facility due to a revenue-sharing agreement between the Hamilton County CVB, the tenants and the City of Westfield.
Financial Projection
The next table is a consolidated estimate of revenue and expense for Grand Park. No inflation is assumed, with all the figures shown in thousands.

Westfield Grand Park Sportsplex Analysis Chapter 7, Page 12
Table 7-7
Grand Park Sportsplex Financial Projection (thousands of constant dollars)
Fiscal Year
Item 2013 2014 2015 2016 2017
Operating RevenueNet Concessions $73 $79 $88 $88 $88Net Novelties $83 $90 $102 $102 $102Parking Share $28 $31 $35 $35 $35Advertising and Sponsorship $50 $70 $80 $80 $80Naming Rights $0 $0 $0 $0 $0Hotel Fee $293 $340 $393 $393 $393
Total Revenue $528 $611 $698 $698 $698
Operating Expense
Fixed
Salary - Permanent Staff $121 $121 $121 $121 $121Benefits - Permanent Staff $40 $40 $40 $40 $40General and Administrative $84 $84 $84 $84 $84Utilities $24 $24 $24 $24 $24Common Area Maintenance $125 $125 $125 $125 $125Security $15 $15 $15 $15 $15Insurance $22 $22 $22 $22 $22
Operating Expenses $430 $430 $430 $430 $430
Net Operating Income (Deficit) $98 $180 $268 $268 $268
Contribution to Cap Reserve - Bulls $320 $320 $320 $320 $320Contribution to Cap Reserve - ISA $400 $400 $400 $400 $400Deposit to Capital Reserve Account $720 $720 $720 $720 $720
Source: Hunden Strategic Partners
Based on the proposed agreements with the tenants, there will be no rent charged to the tenants and the tenants will have full responsibility for the maintenance of the facilities. As a result, the revenue items for the City will include net concessions and novelty sales, a 30 percent share of parking (which will only be charged at the largest tournaments), 100 percent of advertising/sponsorship/naming rights and the portion of the hotel fee. Total revenue is projected to range between $528,000 and $698,000 annually. On the expense side, most of the expenses will be related to certain utilities (wells will be drilled onsite to provide irrigation), a small staff dedicated especially to marketing and advertising sales, and providing asset management services, maintenance of common areas, security, insurance and general expenses.
The Bulls and the ISA will contribute a total of $720,000 annually to a capital reserve fund, which will not influence cash flow.

Westfield Grand Park Sportsplex Analysis Chapter 7, Page 13
The projected operating income is projected to be $268,000 in the stabilized year. Changes in any of the assumptions will have a material impact on the results, especially changes in room nights generated.
Individual Line Items
The following table shows the assumptions associated with concession sales.
Table 7-8 Per Capita Concessions Assumptions
Event Type Gross Amount
Westfield Youth Soccer Assoc. - Tournaments $1.00Westfield Youth Soccer Assoc. - League (spring) $0.10Westfield Youth Soccer Assoc. - League (fall) $0.10Indiana Soccer Association - State Tournaments $1.00Indiana Soccer Association - Regional Camps $1.00Indiana Soccer Association - Regional Tournaments $1.00Indiana Soccer Association - National Clinics $1.00Indiana Bulls - Tournaments $1.00Indiana Bulls - Practice $0.10Indiana Bulls - Summer Camp $0.50Indiana Bulls - Clinics $0.50Westfield Youth Sports - Baseball $0.10Westfield Youth Sports - Softball $0.10Westfield Youth Sports - Footbal (Flag & Tackle) $0.10Westfield Youth Sports - Lacrosse $0.10Westfield Youth Sports - Adult Softball $0.10Westfield Youth Sports - Adult Soccer $0.10High School Regional/State Soccer Tournaments $1.00High School Regional/State Baseball Tournaments $1.00High School Regional/State Softball Tournaments $1.00
Source: Hunden Strategic Partners
The per capita spending ranges from $0.10 to $1.25 for practices, leagues and tournaments. Most attendees will bring their own drinks and snacks and therefore the most revenue will be generated by spectators attending events. Net revenue to the facility is projected to be 25 percent of sales.
The next table shows the gross concession revenue expected.
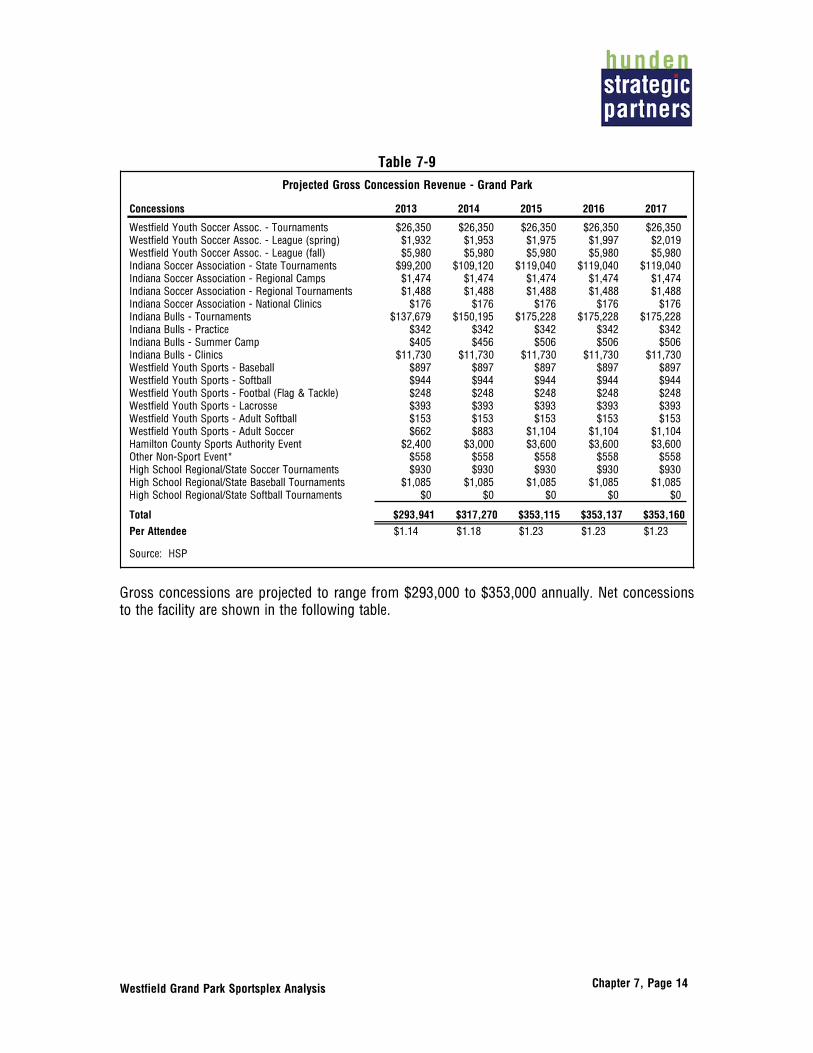
Westfield Grand Park Sportsplex Analysis Chapter 7, Page 14
Table 7-9 Projected Gross Concession Revenue - Grand Park
Concessions 2013 2014 2015 2016 2017
Westfield Youth Soccer Assoc. - Tournaments $26,350 $26,350 $26,350 $26,350 $26,350Westfield Youth Soccer Assoc. - League (spring) $1,932 $1,953 $1,975 $1,997 $2,019Westfield Youth Soccer Assoc. - League (fall) $5,980 $5,980 $5,980 $5,980 $5,980Indiana Soccer Association - State Tournaments $99,200 $109,120 $119,040 $119,040 $119,040Indiana Soccer Association - Regional Camps $1,474 $1,474 $1,474 $1,474 $1,474Indiana Soccer Association - Regional Tournaments $1,488 $1,488 $1,488 $1,488 $1,488Indiana Soccer Association - National Clinics $176 $176 $176 $176 $176Indiana Bulls - Tournaments $137,679 $150,195 $175,228 $175,228 $175,228Indiana Bulls - Practice $342 $342 $342 $342 $342Indiana Bulls - Summer Camp $405 $456 $506 $506 $506Indiana Bulls - Clinics $11,730 $11,730 $11,730 $11,730 $11,730Westfield Youth Sports - Baseball $897 $897 $897 $897 $897Westfield Youth Sports - Softball $944 $944 $944 $944 $944Westfield Youth Sports - Footbal (Flag & Tackle) $248 $248 $248 $248 $248Westfield Youth Sports - Lacrosse $393 $393 $393 $393 $393Westfield Youth Sports - Adult Softball $153 $153 $153 $153 $153Westfield Youth Sports - Adult Soccer $662 $883 $1,104 $1,104 $1,104Hamilton County Sports Authority Event $2,400 $3,000 $3,600 $3,600 $3,600Other Non-Sport Event* $558 $558 $558 $558 $558High School Regional/State Soccer Tournaments $930 $930 $930 $930 $930High School Regional/State Baseball Tournaments $1,085 $1,085 $1,085 $1,085 $1,085High School Regional/State Softball Tournaments $0 $0 $0 $0 $0
Total $293,941 $317,270 $353,115 $353,137 $353,160
Per Attendee $1.14 $1.18 $1.23 $1.23 $1.23
Source: HSP
Gross concessions are projected to range from $293,000 to $353,000 annually. Net concessions to the facility are shown in the following table.

Westfield Grand Park Sportsplex Analysis Chapter 7, Page 15
Table 7-10
Projected Net Concession Revenue - Grand Park
Concessions 2013 2014 2015 2016 2017
Westfield Youth Soccer Assoc. - Tournaments $6,588 $6,588 $6,588 $6,588 $6,588Westfield Youth Soccer Assoc. - League (spring) $483 $488 $494 $499 $505Westfield Youth Soccer Assoc. - League (fall) $1,495 $1,495 $1,495 $1,495 $1,495Indiana Soccer Association - State Tournaments $24,800 $27,280 $29,760 $29,760 $29,760Indiana Soccer Association - Regional Camps $369 $369 $369 $369 $369Indiana Soccer Association - Regional Tournaments $372 $372 $372 $372 $372Indiana Soccer Association - National Clinics $44 $44 $44 $44 $44Indiana Bulls - Tournaments $34,420 $37,549 $43,807 $43,807 $43,807Indiana Bulls - Practice $86 $86 $86 $86 $86Indiana Bulls - Summer Camp $101 $114 $127 $127 $127Indiana Bulls - Clinics $2,933 $2,933 $2,933 $2,933 $2,933Westfield Youth Sports - Baseball $224 $224 $224 $224 $224Westfield Youth Sports - Softball $236 $236 $236 $236 $236Westfield Youth Sports - Footbal (Flag & Tackle) $62 $62 $62 $62 $62Westfield Youth Sports - Lacrosse $98 $98 $98 $98 $98Westfield Youth Sports - Adult Softball $38 $38 $38 $38 $38Westfield Youth Sports - Adult Soccer $166 $221 $276 $276 $276Hamilton County Sports Authority Event $600 $750 $900 $900 $900Other Non-Sport Event* $140 $140 $140 $140 $140High School Regional/State Soccer Tournaments $233 $233 $233 $233 $233High School Regional/State Baseball Tournaments $271 $271 $271 $271 $271High School Regional/State Softball Tournaments $0 $0 $0 $0 $0
Total $73,485 $79,317 $88,279 $88,284 $88,290
Source: HSP
Between $73,000 and $88,000 is projected to flow to Grand Park from concessions based on an outsourced operation that provide a 25 percent share of revenue to the park.
Novelty item sales, including apparel, are shown in the next table.
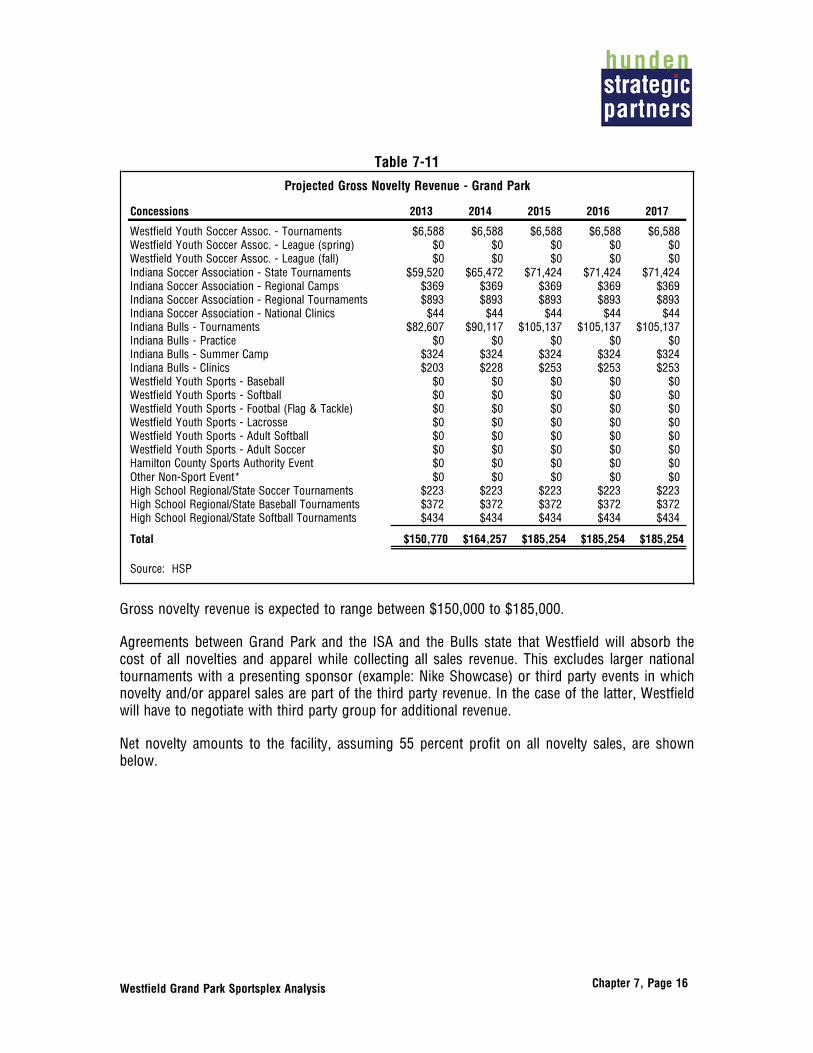
Westfield Grand Park Sportsplex Analysis Chapter 7, Page 16
Table 7-11
Projected Gross Novelty Revenue - Grand Park
Concessions 2013 2014 2015 2016 2017
Westfield Youth Soccer Assoc. - Tournaments $6,588 $6,588 $6,588 $6,588 $6,588Westfield Youth Soccer Assoc. - League (spring) $0 $0 $0 $0 $0Westfield Youth Soccer Assoc. - League (fall) $0 $0 $0 $0 $0Indiana Soccer Association - State Tournaments $59,520 $65,472 $71,424 $71,424 $71,424Indiana Soccer Association - Regional Camps $369 $369 $369 $369 $369Indiana Soccer Association - Regional Tournaments $893 $893 $893 $893 $893Indiana Soccer Association - National Clinics $44 $44 $44 $44 $44Indiana Bulls - Tournaments $82,607 $90,117 $105,137 $105,137 $105,137Indiana Bulls - Practice $0 $0 $0 $0 $0Indiana Bulls - Summer Camp $324 $324 $324 $324 $324Indiana Bulls - Clinics $203 $228 $253 $253 $253Westfield Youth Sports - Baseball $0 $0 $0 $0 $0Westfield Youth Sports - Softball $0 $0 $0 $0 $0Westfield Youth Sports - Footbal (Flag & Tackle) $0 $0 $0 $0 $0Westfield Youth Sports - Lacrosse $0 $0 $0 $0 $0Westfield Youth Sports - Adult Softball $0 $0 $0 $0 $0Westfield Youth Sports - Adult Soccer $0 $0 $0 $0 $0Hamilton County Sports Authority Event $0 $0 $0 $0 $0Other Non-Sport Event* $0 $0 $0 $0 $0High School Regional/State Soccer Tournaments $223 $223 $223 $223 $223High School Regional/State Baseball Tournaments $372 $372 $372 $372 $372High School Regional/State Softball Tournaments $434 $434 $434 $434 $434
Total $150,770 $164,257 $185,254 $185,254 $185,254
Source: HSP
Gross novelty revenue is expected to range between $150,000 to $185,000.
Agreements between Grand Park and the ISA and the Bulls state that Westfield will absorb the cost of all novelties and apparel while collecting all sales revenue. This excludes larger national tournaments with a presenting sponsor (example: Nike Showcase) or third party events in which novelty and/or apparel sales are part of the third party revenue. In the case of the latter, Westfield will have to negotiate with third party group for additional revenue.
Net novelty amounts to the facility, assuming 55 percent profit on all novelty sales, are shown below.

Westfield Grand Park Sportsplex Analysis Chapter 7, Page 17
Table 7-12
Projected Net Novelty Revenue - Grand Park
Concessions 2013 2014 2015 2016 2017
Westfield Youth Soccer Assoc. - Tournaments $3,623 $3,623 $3,623 $3,623 $3,623Westfield Youth Soccer Assoc. - League (spring) $0 $0 $0 $0 $0Westfield Youth Soccer Assoc. - League (fall) $0 $0 $0 $0 $0Indiana Soccer Association - State Tournaments $32,736 $36,010 $39,283 $39,283 $39,283Indiana Soccer Association - Regional Camps $203 $203 $203 $203 $203Indiana Soccer Association - Regional Tournaments $491 $491 $491 $491 $491Indiana Soccer Association - National Clinics $24 $24 $24 $24 $24Indiana Bulls - Tournaments $45,434 $49,564 $57,825 $57,825 $57,825Indiana Bulls - Practice $0 $0 $0 $0 $0Indiana Bulls - Summer Camp $178 $178 $178 $178 $178Indiana Bulls - Clinics $111 $125 $139 $139 $139Westfield Youth Sports - Baseball $0 $0 $0 $0 $0Westfield Youth Sports - Softball $0 $0 $0 $0 $0Westfield Youth Sports - Footbal (Flag & Tackle) $0 $0 $0 $0 $0Westfield Youth Sports - Lacrosse $0 $0 $0 $0 $0Westfield Youth Sports - Adult Softball $0 $0 $0 $0 $0Westfield Youth Sports - Adult Soccer $0 $0 $0 $0 $0Hamilton County Sports Authority Event $0 $0 $0 $0 $0Other Non-Sport Event* $0 $0 $0 $0 $0High School Regional/State Soccer Tournaments $123 $123 $123 $123 $123High School Regional/State Baseball Tournaments $205 $205 $205 $205 $205High School Regional/State Softball Tournaments $239 $239 $239 $239 $239
Total $82,923 $90,341 $101,889 $101,889 $101,889
Source: HSP
Net novelty revenue is projected to range from $83,000 to $102,000 annually.
Parking revenue is shown in the next table.

Westfield Grand Park Sportsplex Analysis Chapter 7, Page 18
Table 7-13
Projected Parking Revenue - Grand Park
2013 2014 2015 2016 2017
Total # of Spaces 4,000 4,000 4,000 4,000 4,000 Parking Fee $5.00 $5.00 $5.00 $5.00 $5.00Attendees per Car 3.5 3.5 3.5 3.5 3.5
Total Potential Parking Revenue 379,717$ 411,769$ 461,701$ 461,701$ 461,701$
% of Tournaments Charging for Parking 25% 25% 25% 25% 25%
Gross Expected Parking Revenue 94,929$ 102,942$ 115,425$ 115,425$ 115,425$
Net Parking Revenue to City 28,479$ 30,883$ 34,628$ 34,628$ 34,628$
% to City 30%
Source: HSP
Grand Park is scheduled to receive 30 percent of parking revenue, which should be only charged during certain tournament events. Total parking revenue is projected to be greater than $115,000 by stabilization, with more than $30,000 flowing to Grand Park.
A $15 per room-night fee is to be charged by hotels and will flow to the CVB ($3) and the City ($12). Of the City’s $12, the ISA receives 85 percent the first year and 70 percent thereafter from the room nights it generates. The City receives all non-CVB room night fee revenue from Bulls and HCSA events.
The following table shows the breakdown of the hotel fee expected to be generated.

Westfield Grand Park Sportsplex Analysis Chapter 7, Page 19
Table 7-14 Estimated Hotel Fees Generated
2013 2014 2015 2016 2017
Total Annual Hotel Room Night Generated 43,934 48,502 55,637 55,637 55,637Room Nights Due to ISA 12,954 14,138 15,323 15,323 15,323Room Nights Due to Bulls 28,596 31,184 36,340 36,340 36,340Room Nights Due to Hamilton County Sports Authority 2,385 3,180 3,974 3,974 3,974
Participation Rate 80% 80% 80% 80% 80%Total Participating Hotel Room Nights 35,148 38,802 44,510 44,510 44,510
Participating Room Nights to ISA 10,363 11,311 12,258 12,258 12,258Participating Rooms Nights to Bulls 22,877 24,948 29,072 29,072 29,072Participating Room Nights to Hamilton County Sports Authority 1,908 2,544 3,180 3,180 3,180
Hotel Fee for Service $15 $15 $15 $15 $15Total Fees $527,214 $582,026 $667,648 $667,648 $667,648
First Year ThereafterAmount to CVB $3 $3 $105,443 $116,405 $133,530 $133,530 $133,530Amount to City of Westfield $12 $12 $421,771 $465,621 $534,118 $534,118 $534,118Westfield Split to Grand Park Operations $293,177 $340,089 $392,994 $392,994 $392,994
Westfield Split to ISA 85% 70% $105,702 $95,009 $102,970 $102,970 $102,970Westfield Split to Bulls 0% 0% $0 $0 $0 $0 $0Westfield Split to Hamilton County Sports Authority 100% 100% $22,893 $30,523 $38,154 $38,154 $38,154
Source: HSP
The annual hotel room nights generated by Grand Park are projected to be nearly 56,000 by the stabilized year. However, due to the size of some events, not all will be accommodated in Hamilton County. In total, approximately $670,000 in annual fees is projected by stabilization from hotel stays. Of this amount, more than $390,000 is projected to flow to Grand Park’s operational budget.
Advertising and sponsorship revenue is a key source of revenue for the facility. The manager’s primary job will be to market advertising sales and obtain sponsorships. It is expected that a total inventory of $200,000 (or more) will be available for sale. Based on comparable facilities, only about 25 to 33 percent of this inventory is projected to be sold annually. Naming rights have not been successfully sold on the comparable facilities (due to the non-local nature of attendees, local companies have little reason to invest in these rights), although sale of naming rights is an opportunity at Grand Park. A national consumer brand for sports apparel or a beverage sponsor could be an appealing match for this facility. With a higher percentage of sponsorship inventory sold and a naming rights deal, the financials for Grand Park could improve dramatically.


Land Use Plan
Regional Retail & Hospitality
Sports & Recreation Mixed-Use
Sports Village Mixed-Use 1
Sports Village Mixed-Use 2
Sports Corporate Campus
Life Science Mixed-Use
School
Sports Residential
196th Street
US
31
SR 32
Grand Junction
Spri
ng M
ill R
oad
186th Street
181st Street
Oak
Rid
ge R
oad
Midland Trace Trail
191st Street
Mon
on
Trail
Monon Trail
Dar
tow
n R
oad
Kinsey Road
MononElementary
Cool Creek
Trail
Whe
eler
Roa
d
WheelerAirport
0 375' 750' 1500'
Scale: 1"=750' North