Glutathione S-Transferase A1 Genetic Variants Reduce Busulfan Clearance in Children Undergoing...
21
Glutathione S- Transferase A1 Genetic Variants Reduce Busulfan Clearance in Children Undergoing Hematopoietic Cell Transplantation Dr L’Aurelle Johnson, PhD, Dr Paul J. Orchard, MD, Dr K. Scott Baker, MD, MS, Dr Richard Brundage, PharmD, PhD, Ms Qing Cao, MS, Dr Xinjing Wang, MD, PhD, Ms Erica Langer, BS, Ms Sharein Farag-El Maasah, Dr Julie A. Ross, PhD, Dr Rory Remmel, PhD, and Dr Pamala A. Jacobson, PharmD Department of Experimental and Clinical Pharmacology, College of Pharmacy, University of Minnesota, Minneapolis (Dr Johnson, Dr Brundage, Ms Farag-El Maasah, Dr Remmel, Dr Jacobson); Department of Pediatrics, Division of Hematology and Oncology, Blood and Marrow Transplantation, University of Minnesota, Minneapolis (Dr Orchard, Dr Baker); Division of Biostatistics, University of Minnesota, Minneapolis (Ms Cao); Department of Laboratory Pathology and Medicine, University of Minnesota, Minneapolis (Dr Wang); and Department of Pediatrics, Division of Pediatric Epidemiology and Clinical Research, University of Minnesota, Minneapolis (Ms Langer, Dr Ross) Abstract The effect of glutathione S-transferase variants on pediatric busulfan metabolism was investigated by noncompartmental and population pharmacokinetic modeling. Twenty-nine children who underwent related or unrelated bone marrow or umbilical cord blood hematopoietic cell transplant were retrospectively studied. GSTA1, GSTP1, and GSTM1 variants were explored for their effects on busulfan exposures. Noncompartmental pharmacokinetic analyses showed that carriers of GSTA1*B had a 2.6-fold higher busulfan area under the curve and concentration at steady state compared with noncarriers (P ≤ .01). Population pharmacokinetic modeling demonstrated that carriers of GSTA1*B reduced busulfan clearance by 30%. Monte Carlo simulations were then performed to assess busulfan dosing regimens based on GSTA1 genotypes. Simulations determined that dosing based on GSTA1 genotype, weight, and age resulted in fewer children exceeding the upper therapeutic limit compared with dosing using age and weight only. Larger, prospective studies are needed to confirm these findings. Keywords Glutathione S-transferase; polymorphisms; busulfan; pharmacokinetics Busulfan is an alkylating agent commonly used in conditioning regimens prior to hematopoietic cell transplantation (HCT) for the treatment of hematologic malignancies and nonmalignant disorders. 1–3 Because busulfan exhibits an exposure-response relationship and high pharmacokinetic variability, therapeutic drug monitoring is standard clinical practice for patients receiving full-dose busulfan prior to transplantation, particularly in children. 4 © 2008 the American College of Clinical Pharmacology Address for correspondence: Pamala Jacobson, PharmD, Department of Experimental and Clinical Pharmacology, Weaver Densford Hall 7-151, 308 Harvard St SE, College of Pharmacy, University of Minnesota, Minneapolis, MN 55455; [email protected]. Financial disclosure: This work was supported by T32 CA099936 and the Children’s Cancer Research Fund, Minneapolis, Minnesota (LJ). NIH Public Access Author Manuscript J Clin Pharmacol. Author manuscript; available in PMC 2011 October 31. Published in final edited form as: J Clin Pharmacol. 2008 September ; 48(9): 1052–1062. doi:10.1177/0091270008321940. NIH-PA Author Manuscript NIH-PA Author Manuscript NIH-PA Author Manuscript
-
Upload
independent -
Category
Documents
-
view
8 -
download
0
Transcript of Glutathione S-Transferase A1 Genetic Variants Reduce Busulfan Clearance in Children Undergoing...

Glutathione S- Transferase A1 Genetic Variants ReduceBusulfan Clearance in Children Undergoing Hematopoietic CellTransplantation
Dr L’Aurelle Johnson, PhD, Dr Paul J. Orchard, MD, Dr K. Scott Baker, MD, MS, Dr RichardBrundage, PharmD, PhD, Ms Qing Cao, MS, Dr Xinjing Wang, MD, PhD, Ms Erica Langer,BS, Ms Sharein Farag-El Maasah, Dr Julie A. Ross, PhD, Dr Rory Remmel, PhD, and DrPamala A. Jacobson, PharmDDepartment of Experimental and Clinical Pharmacology, College of Pharmacy, University ofMinnesota, Minneapolis (Dr Johnson, Dr Brundage, Ms Farag-El Maasah, Dr Remmel, DrJacobson); Department of Pediatrics, Division of Hematology and Oncology, Blood and MarrowTransplantation, University of Minnesota, Minneapolis (Dr Orchard, Dr Baker); Division ofBiostatistics, University of Minnesota, Minneapolis (Ms Cao); Department of Laboratory Pathologyand Medicine, University of Minnesota, Minneapolis (Dr Wang); and Department of Pediatrics,Division of Pediatric Epidemiology and Clinical Research, University of Minnesota, Minneapolis(Ms Langer, Dr Ross)
AbstractThe effect of glutathione S-transferase variants on pediatric busulfan metabolism was investigatedby noncompartmental and population pharmacokinetic modeling. Twenty-nine children whounderwent related or unrelated bone marrow or umbilical cord blood hematopoietic cell transplantwere retrospectively studied. GSTA1, GSTP1, and GSTM1 variants were explored for their effectson busulfan exposures. Noncompartmental pharmacokinetic analyses showed that carriers ofGSTA1*B had a 2.6-fold higher busulfan area under the curve and concentration at steady statecompared with noncarriers (P ≤ .01). Population pharmacokinetic modeling demonstrated thatcarriers of GSTA1*B reduced busulfan clearance by 30%. Monte Carlo simulations were thenperformed to assess busulfan dosing regimens based on GSTA1 genotypes. Simulationsdetermined that dosing based on GSTA1 genotype, weight, and age resulted in fewer childrenexceeding the upper therapeutic limit compared with dosing using age and weight only. Larger,prospective studies are needed to confirm these findings.
KeywordsGlutathione S-transferase; polymorphisms; busulfan; pharmacokinetics
Busulfan is an alkylating agent commonly used in conditioning regimens prior tohematopoietic cell transplantation (HCT) for the treatment of hematologic malignancies andnonmalignant disorders.1–3 Because busulfan exhibits an exposure-response relationship andhigh pharmacokinetic variability, therapeutic drug monitoring is standard clinical practicefor patients receiving full-dose busulfan prior to transplantation, particularly in children.4
© 2008 the American College of Clinical PharmacologyAddress for correspondence: Pamala Jacobson, PharmD, Department of Experimental and Clinical Pharmacology, Weaver DensfordHall 7-151, 308 Harvard St SE, College of Pharmacy, University of Minnesota, Minneapolis, MN 55455; [email protected] disclosure: This work was supported by T32 CA099936 and the Children’s Cancer Research Fund, Minneapolis, Minnesota(LJ).
NIH Public AccessAuthor ManuscriptJ Clin Pharmacol. Author manuscript; available in PMC 2011 October 31.
Published in final edited form as:J Clin Pharmacol. 2008 September ; 48(9): 1052–1062. doi:10.1177/0091270008321940.
NIH
-PA Author Manuscript
NIH
-PA Author Manuscript
NIH
-PA Author Manuscript

Busulfan exposure is commonly measured by either area under the curve concentration(AUC) or steady-state plasma concentration (Css) and is associated with concentration-dependent toxicities, including hepatic veno-occlusive disease.5–7 A busulfan average Css >900 ng/mL is associated with greater toxicity in busulfan and cyclosphosphamidepreparative regimens,8–10 whereas a Css < 600 ng/mL is associated with poorer engraftmentand, in some settings, predicts graft rejection.1,11 Hence, the typical busulfan plasma targetis a Css of 600 to 900 ng/mL or AUC 221.5 to 369 mcg·mL/min (900–1500 μM·min).3,7,8,10
Consequently, plasma concentration targeting may improve clinical outcomes. Thus, bettertargeting strategies are needed to improve initial dosing and lessen the time that a subjectwould be exposed to sub- or supratherapeutic concentrations.
Busulfan is metabolized extensively in the liver through conjugation with glutathione byglutathione S-transferase (GST) enzymes.12–14 In vitro studies using liver and intestinalcytosols have demonstrated that busulfan is metabolized primarily by GSTA1, with minorcontributions by GSTM1 and GSTP1.15,16 In vitro studies have shown that variants inGSTP1 result in functional alterations in the activity of the GSTP1 enzymes conferringdecreased enzyme activity.17
Four variants in the promoter region of the GSTA1 gene, −631T>G, −567T>G, −69 C>T,and −52G>A, are in linkage disequilibrium and result in decreased enzyme expression,whereas the GSTM1*0 results in no enzyme production. Previous studies in HCT found asignificantly higher incidence of hepatic venoocclusive disease in thalassemic patientscarrying the GSTM1*0 genotype (GSTM1 null) compared with those who were GSTM1positive (46.5% vs 18.3%; P = .001), presumably due to higher busulfan exposure.18
Kusama et al19 examined the effects of the GSTA1 variant, GSTA1*B, on oral busulfanpharmacokinetics in a Japanese population (n = 9). They observed that individuals with theGSTA1*B variant had a lower busulfan clearance (0.118 ± 0.013 vs 0.196 ± 0.011 L/h/kg, P= .004) and higher busulfan plasma concentrations (1344 ± 158 vs 854 ± 44 ng/mL, P = .001) after the fifth dose of busulfan compared with subjects without the variant. However,the pharmacogenetic effect was confounded by oral administration and the high variabilityin busulfan bioavailability. To date, no studies have evaluated the clinical effect of theGSTA1, GSTP1, and GSTM1 variants on intravenous (IV) busulfan exposures in thepediatric population. Therefore, this study investigated the role of the GSTA1, GSTM1, andGSTP1 variants toward busulfan AUC and Css concentrations following the first dose of IVbusulfan using a noncompartmental pharmacokinetic analysis. In addition, a nonlinearmixed-effects population pharmacokinetic model was developed to quantify the effects ofage, body weight, and genotype on the pharmacokinetics of busulfan. Finally, Monte Carlosimulations of the final population pharmacokinetic model were used to evaluate variousdosing strategies in children with GSTA1 variants with respect to literature-based targetexposures.
METHODSPatients
Twenty-nine subjects who underwent related or unrelated bone marrow or umbilical cordblood HCT for malignant (n = 10) or nonmalignant diseases (n = 19) at the University ofMinnesota were studied. Patients included were <18 years of age who had undergone HCTat the University of Minnesota and underwent busulfan pharmacokinetic sampling with firstbusulfan dose as part of routine clinical management. This study protocol was approved bythe University of Minnesota Institutional Review Board. All patients or parents signedinformed consent or assent, as appropriate. Patient demographics are given in Table I. Themedian age (range) and weight was 5.58 years (0.08–18.25) and 16.70 kg (5.58–99.10),respectively. All children received intravenous busulfan. Children ≤12 kg received busulfan
Johnson et al. Page 2
J Clin Pharmacol. Author manuscript; available in PMC 2011 October 31.
NIH
-PA Author Manuscript
NIH
-PA Author Manuscript
NIH
-PA Author Manuscript

1.1 mg/kg IV every 6 hours and, if >12 kg, 0.8 mg/kg IV every 6 hours. The median dosewas 0.8 mg/kg (0.8–1.1 mg/kg) every 6 hours. Busulfan was infused over 2 hours at aconstant rate. Fosphenytoin was given for seizure prophylaxis from 1 day prior to initiationof the busulfan regimen and continuing through until 24 hours after the final dose ofbusulfan. All children received one of the following disease-specific conditioning regimens:busulfan 0.8 to 1.1 mg/kg/dose IV every 6 hours for 16 doses given on days −9, −8, −7, and−6 plus cyclophosphamide 50 mg/kg IV daily on days −4, −3, −2, and −1 (n = 21); busulfan0.8 mg/kg/dose IV every 12 hours for 8 doses on days −7 and −6 and IV fludarabine 35 mg/m2 daily for 4 days on days −5, −4, −3, and −2 (n = 1); busulfan 0.8 to 1.1 mg/kg/dose IVevery 6 hours for 16 doses given on days −8, −7, −6, and −5 and fludarabine 25 mg/m2 IVdaily for 3 days on days −4, −3, and −2 (n = 3); or busulfan 0.8 to 1.1 mg/kg/dose IV every6 hours for 16 doses given on days −7, −6, −5, and −4 plus cyclophosphamide 60 mg/kg IVdaily on days −3 and −2 (n = 4). No patients received total body irradiation. All patientsunderwent therapeutic monitoring with first dose of busulfan, and doses were adjusted toachieve a Css range of 600 to 900 ng/mL using dosage recommendations provided by theanalytical laboratory at the University of Pennsylvania.
Noncompartmental Pharmacokinetic AnalysisBusulfan concentrations were measured at 120, 135, 240, and 360 minutes after the start ofinfusion with the first dose of busulfan. At each time point, 2 mL of blood was collected andplaced on wet ice. Busulfan samples were converted to the 1,4-diiodobutane derivative andsubsequently measured using gas chromatography with electron capture as previouslydescribed.20 Briefly, the iodinated derivative of busulfan, 1,5-diiodopentane, was used as theinternal standard. The selective ion monitoring was used at m/z of 183 and 197. Thebusulfan assay was linear from 0.04 to 4.0 mg/L, with the lowest limit of quantificationbeing 0.04 mg/L. Accuracy and precision were within 6% of nominal values for allstandards.20
For purposes of this analysis, plasma concentration-time data were reanalyzed bynoncompartmental and population pharmacokinetic analyses. First, noncompartmentalanalyses were conducted using standard software (WinNonLin Professional 5.2, PharsightCorp, Mountain View, California). Area under curve (AUC0-∞), average steady-stateplasma concentration (Css), and Cmax were determined. The AUC was estimated using thetrapezoidal rule. Css was the ratio of AUC0-∞ and time between doses in minutes. Cmax wasthe highest observed concentration. AUC0-∞ and Css were adjusted for dose in mg prior tostatistical analysis.
Population Pharmacokinetic Modeling of BusulfanA nonlinear mixed-effects analysis was undertaken to characterize the populationpharmacokinetics of busulfan. NONMEM Version VI with PDxPop Version 2.2a (IconDevelopment Solutions, Ellicott City, Maryland) was used to define a 1-compartment modelparameterized in terms of clearance (CL) and volume of distribution (V). Busulfanclearances were modeled by creating a dichotomous variable of busulfan dosing by age (≤4years, >4 or <6 years, ≥6 years).21 Six years of age was chosen as a cut point because thiswas the median age of the population. Modeling based on the 6-year age cut point did notgenerate a sufficient model. Data were also modeled by creating a dichotomous variable forweight (≤12, >12 kg).21 This model was also not sufficient. Study population was modeledbased on GST1A*B carrier status. The only useful model was when data were stratified byGSTA1*B carrier status, whereby subjects who carried 1 or 2 of the GSTA1*B alleles weregrouped together and compared with noncarriers of the GSTA1*B allele. Additional modelswere also constructed to evaluate the effect of GSTM and GSTP polymorphisms on busulfanclearance with and without GST1A*B polymorphism, but these models were not significant.
Johnson et al. Page 3
J Clin Pharmacol. Author manuscript; available in PMC 2011 October 31.
NIH
-PA Author Manuscript
NIH
-PA Author Manuscript
NIH
-PA Author Manuscript

The final regression model was as follows:
TVCL is the population mean clearance, and θ(1) is the mixed-effects regression parameterof the population that is ≤4 years of age. θ(2) is the mixed-effects regression parameter ofthe population that is >4 years of age. θ(3) is the regression parameter of the populationmean volume. θ(4) is the mixed-effect regression parameter of the population that carries 1or 2 GSTA1*B alleles. SIZE is the ideal body weight (IBW).
The intersubject clearance variability was described by the exponential error model, where
η1 is an estimated vector of the individual-specific random effects of CL. η2 is an estimatedvector of the individual-specific random effects of V. The remainder of the variability wasestimated by the proportional error model, whereby
The first-order conditional estimation procedure with interaction was used in the analysis.Forward inclusion/backward elimination of each of the age, weight, and genotype groupswas used to develop the population pharmacokinetic model. The likelihood ratio test wasused to establish the level of significance of any covariate where alpha was set at 0.05 (χ2, df= 1). A decrease in objective function value of 3.8 was considered significant. Diagnosticplots and visual predictive checks were used as qualification steps in the evaluation of thefinal regression model. For the visual predictive check, 100 individuals were simulatedusing Monte Carlo sampling techniques from the parameter distributions defined by the finalmodel. The age, busulfan dose, and weight covariate triads were the same as the originaldistribution. Intuitively, if a model is reasonable, approximately 80% of the observedconcentrations should be contained within the 10th and 90th quantiles of the predictionsunder the model of these 100 in silico individuals. This is evaluated visually, rather thanstatistically, and is a useful tool in evaluating the appropriateness of populationpharmacokinetic models.
Johnson et al. Page 4
J Clin Pharmacol. Author manuscript; available in PMC 2011 October 31.
NIH
-PA Author Manuscript
NIH
-PA Author Manuscript
NIH
-PA Author Manuscript

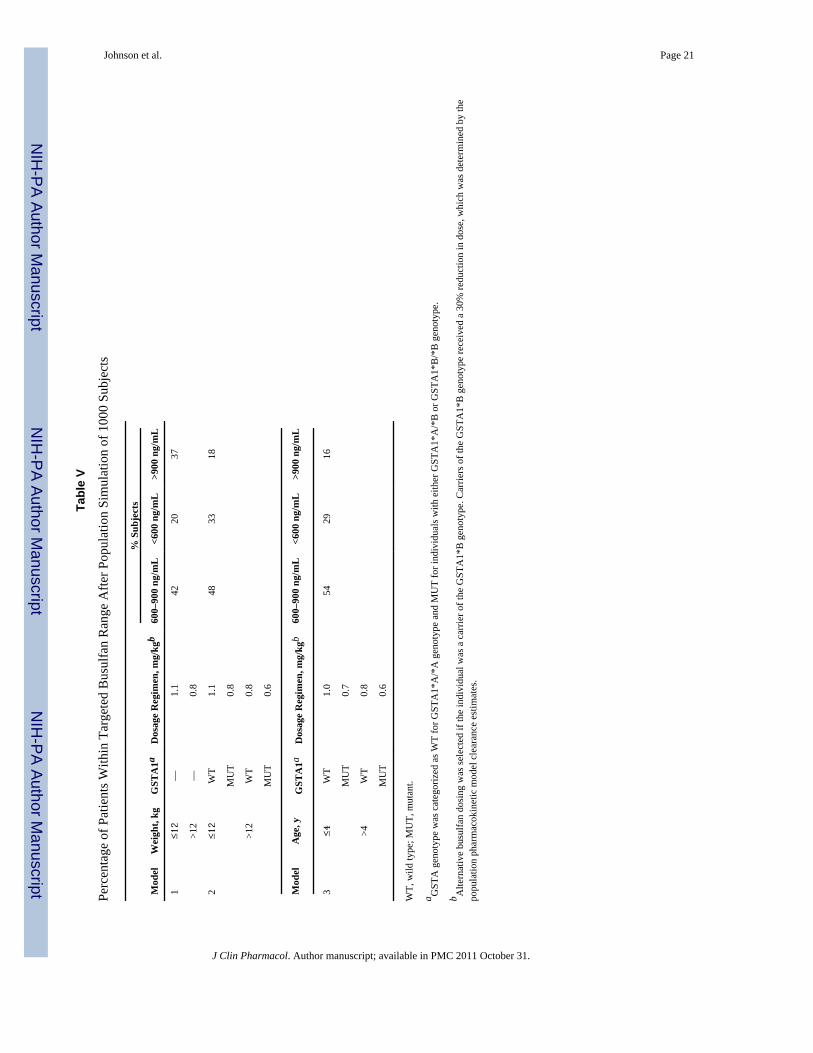
Dosing Regimen SimulationsUsing the original 29 subject data set, 1000 bootstrapped subjects were selected at randomwith replacement. This generated 1000 subjects with paired ages and weights in adistribution similar to the original 29 subjects. GSTA1 genotype classification of a carrier ornoncarrier was randomly assigned to each subject at the same fraction (0.52) found in theoriginal subjects. Given each subject’s age, weight, and genotype, a clearance was simulatedunder the derived population pharmacokinetic model. Age and weight stratifications wereselected based on the manufacturer’s dosing recommendations.21 Three dosing schemeswere developed and busulfan Css simulated based on clearance (derived from the populationpharmacokinetic model), GSTA1 variant status, age, and weight. Model 1 simulated theconventional busulfan dosing strategy based on weight, where genotype was not consideredin dose selection. If weight was ≤12 kg, then the simulated busulfan dose was 1.1 mg/kg;otherwise, a dose of 0.8 mg/kg was simulated. Model 2 simulated conventional busulfandosing based on weight but added a genotype effect. If an individual was a carrier of theGSTA variant, the simulated dose was reduced by 30% (≤12 kg = 0.8 mg/kg; >12 kg = 0.6mg/kg). The dose reduction was derived from the population pharmacokinetic model, whichshowed that children heterozygous or homozygous for GSTA1 had a 30% lower clearancecompared with noncarriers. Model 3 simulated an age-based dosing strategy along withGSTA1 carrier status. If age ≤4 years, then the simulated busulfan dose was 1.0 mg/kg;otherwise, a dose of 0.8 mg/kg was simulated. If an individual was also a carrier of theGSTA variant, the simulated dose was reduced by 30% (≤4 years = 0.7 mg/kg; >4 years =0.6 mg/kg). The simulated clearances were then used to compute the expected busulfansteady-state concentration (Css) for the 1000 simulated subjects. The percentages of subjectswithin, below, and above the target Css range of 600 to 900 ng/mL were calculated for the 3dosing models.
Diagnosis of Veno-Occlusive Disease, Treatment-Related Mortality, and EngraftmentVeno-occlusive disease (VOD) was diagnosed within 30 days posttransplant using theBaltimore clinical criteria,22 including presence of total bilirubin >2 mg/dL, plus 2 of thefollowing 3 findings: hepatomegaly, ascites, and weight gain >5%. Alternatively, VOD wasdiagnosed as reversal of portal blood flow on ultrasound plus 1 of the previous signs.Treatment-related mortality was characterized as death from any cause prior to day 100.Engraftment was defined as the first of 3 consecutive days of an absolute neutrophil count>500 cells/mm3.
DNA Isolation and Genotype DeterminationPretransplant genomic DNA was isolated from peripheral blood lymphocytes and extractedusing a Qiagen DNA extraction kit. The TaqMan allelic discrimination method was used forthe GSTM1 gene deletion and the GSTP1 p.I105V (c.A313G) and GSTP1 p.A114V(c.C341T) single-nucleotide polymorphisms (SNPs). Primer Express v1.5 software(PerkinElmer/Applied Biosystems, Inc, Foster City, California) was used to develop gene-specific primers for polymerase chain reaction (PCR) and a TaqMan fluorogenic probe forallelic discrimination for GSTM1. SNPs for GSTP1 I105V and A114V were analyzed usingTaqMan SNP Genotyping Assays (PerkinElmer/Applied Biosystems, Inc). These assayswere performed per kit instructions. The GSTA1-69 SNP C-69T was amplified by PCRfollowed by restriction fragment length polymorphism (RFLP) using the HinfI enzyme andvisualized on a 2% agarose gel by electrophoresis. Confirmation of genotyping results wasperformed on 10% of samples for each SNP by either TaqMan for GSTA1*B or DNAsequencing (Biomedical Genomics Center, University of Minnesota, Minneapolis) forGSTM1 and GSTP1.
Johnson et al. Page 5
J Clin Pharmacol. Author manuscript; available in PMC 2011 October 31.
NIH
-PA Author Manuscript
NIH
-PA Author Manuscript
NIH
-PA Author Manuscript

Statistical AnalysesComparisons of busulfan exposure measures derived from noncompartmental modeling(AUC0-∞ and Css) were made between GST wild-type, heterozygous, and homozygousindividuals. In addition, heterozygotes and homozygotes for the variant allele were groupedand compared with wild-type subjects. All statistical analyses were performed using theSAS software, Version 9.1 for Windows (SAS Institute, Cary, North Carolina). Statisticalcomparisons of genotype groups and demographics were made using 1-way analysis ofvariance (ANOVA). Adjustments for multiple comparisons were done using the Tukeymethod.
RESULTSPatient Characteristics and Frequency of GST Variants
Patient demographics are shown in Table I. Fourteen of the 29 (48.2%) children wereheterozygous (n = 7) or homozygous (n = 7) for GSTA1*B. The GSTM1*0 (null)homozygous genotype was observed in 16 of 29 patients (55%). Nineteen of the 29 children(65.5%) were heterozygous for GSTP1*2 variant, and 6 of 29 (20.6%) were heterozygousfor the GST P1*3. All variants were in Hardy-Weinberg equilibrium. The median number ofdays to achieve neutrophil engraftment was 17 (range, 11–36). Two (6.8%) individuals hadtreatment-related mortality by day 100. Overall, 11 (38%) patients were not within thetherapeutic range (Css 600–900 ng/mL) with the first IV dose of busulfan. Of the 11 patients,7 had plasma busulfan Css above 900 ng/mL, 3 (43%) of whom went on to develop VOD.These 3 individuals had a busulfan Css of 1236, 1123, and 928 ng/mL with the first dose.
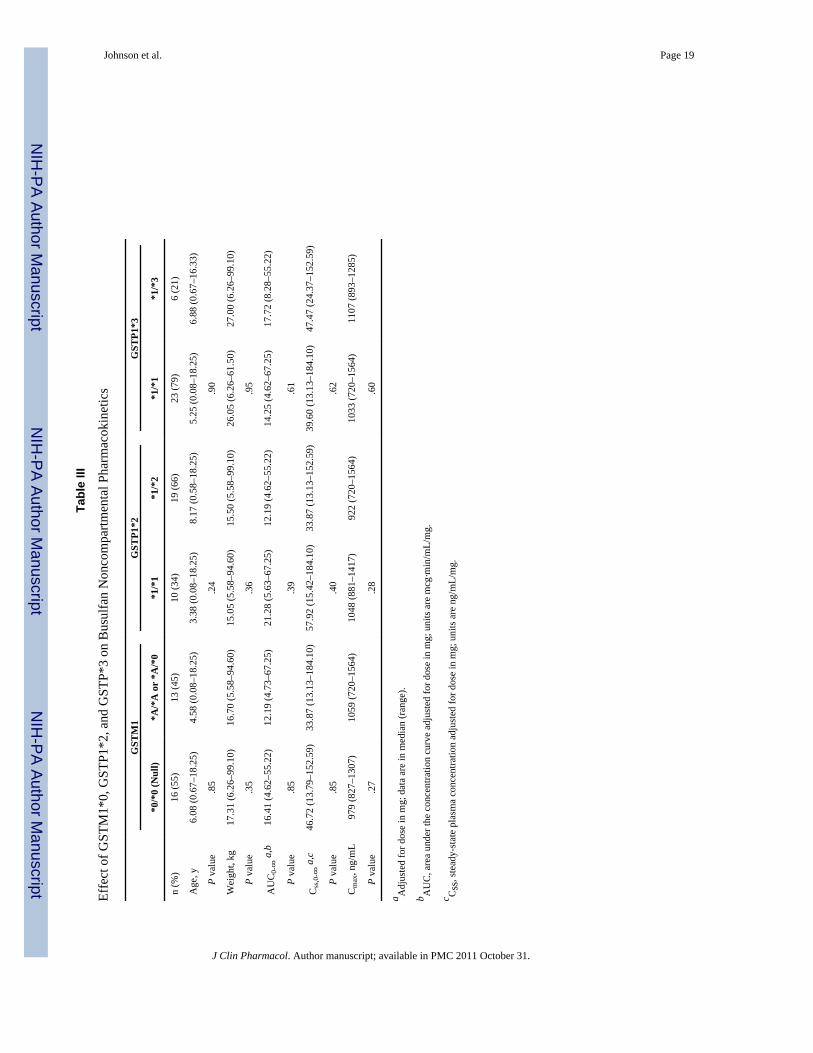
Effect of Variants on Busulfan Noncompartmental PharmacokineticsMedian busulfan concentrations at 120, 135, 240, and 360 minutes after the start of IVbusulfan infusion were 1034 (range, 720–1564), 938 (range, 635–1225), 595 (range, 271–990), and 362 (range, 113–627) ng/mL, respectively. The median AUC0-∞ and Css were302.6 (range, 155.3–518.9) mcg min/mL and 868.0 (range, 425.7–1753.2) ng/mL,respectively. Children heterozygous or homozygous (n = 14) for the GSTA1*B variant had a2.6-fold higher dose-corrected busulfan AUC0-∞ (P < .01) and and Css (P = .01)a 28%higher median Cmax (P = .02) compared with patients with the wild-type GSTA1 gene (n =15) (Table II). This relationship was independent of the number of variant GSTA1*B alleles,as there was no difference in busulfan exposure between children heterozygous orhomozygous for this mutation. There were also no significant differences in AUC0-∞, Css,or Cmax in children with or without the GSTM1*0, GSTP1*2, or GSTP1*3 variants (TableIII). Children with the GSTA1 variants (*A/*B, *B/*B) were significantly younger (P < .01)and weighed less (P = .02), confounding the genotype effect; therefore, a populationpharmacokinetic analysis was undertaken to control for the effect of these covariates onexposure.
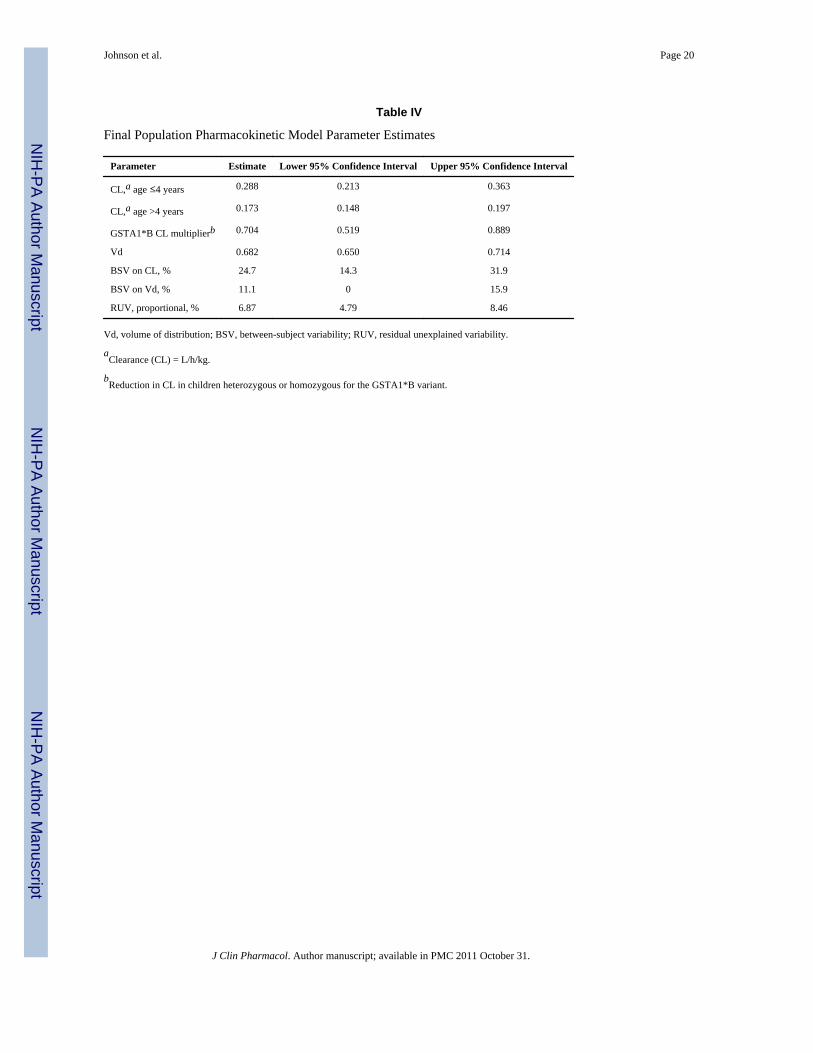
Effect of GST Variants on Busulfan Clearance Using Population PharmacokineticsThe busulfan population pharmacokinetic estimates are given in Table IV. Age wasconverted to a dichotomous variable for analysis. Children ≤4 years of age had asignificantly higher weight-normalized busulfan clearance than those >4 years (P < .0005).Regardless of age, clearance was reduced by ~30% if the child was heterozygous orhomozygous for the GSTA1*B variant (Figure 1). There was no effect of GSTM1 or P1variants on busulfan clearance. There was a strong relationship between observed busulfanconcentrations and those predicted by the population pharmacokinetic model (Figure 2).Figure 3 shows the weighted residual for time after dose and predicted busulfanconcentrations. The randomness of these diagnostic plots indicates that the population
Johnson et al. Page 6
J Clin Pharmacol. Author manuscript; available in PMC 2011 October 31.
NIH
-PA Author Manuscript
NIH
-PA Author Manuscript
NIH
-PA Author Manuscript
pharmacokinetic model is sufficient. In addition, the results from the visual predictive checkof the model also indicate the suitability of the final model and the estimated parameters(Figure 4). The observed concentrations are centered about the simulated 50th percentile,and approximately 12% are outside the simulated 10th and 90th quantiles. Finally, therelationship between the standard noncompartmental trapezoidal estimate of AUC andpopulation-predicted AUC was excellent and also supported model sufficiency (Figure 5).All these findings support the appropriateness of the final population model and parameterestimates.
Simulation of Busulfan Exposures Using GST Genotypes, Weight, and AgeSimulation modeling was performed to explore 3 dosing regimens. Using the demographicsdata from the original 29 subjects, 1000 bootstrap subjects were selected. Table V displaysthe percentage of patients within the targeted therapeutic range for busulfan after simulatingbusulfan dosing regimens based on weight alone, weight and GSTA1 genotype, and age andGSTA1 genotype. In the simulated data set, using weight alone to determine dose (model 1),approximately 42% of individuals were in the desired therapeutic range. With dosingregimens using weight and GSTA1 genotype (model 2) or age and GSTA1 genotype (model3), 48% and 54% of simulated subjects achieved the targeted concentration. Using weight orage plus GSTA1 genotype reduced the number of subjects with a Css over the therapeuticlimit from 37% to 19% and 21%, respectively; however, consequently, more subjects werebelow the therapeutic target.
DISCUSSIONTherapeutic monitoring of busulfan concentrations and dose adjustments in the pediatricpopulation is important for avoiding serious hepatic toxicity and possibly for enhancingstem cell engraftment. This study is the first study to describe the clinical importance ofGST variants on intravenous busulfan exposure in pediatric patients. Variability in busulfanconcentrations is well described, and 30% to 60% of children do not achieve the therapeutictarget with the initial dose and require dose adjustments.23 Previous simulation studies inchildren demonstrated that only 56% to 60% of pediatric patients achieved the targetedbusulfan concentration (AUC of 900–1350 μM·min) with the first dose using multipleweight cutoffs and dosing regimens.24 The authors concluded that an initial busulfan dose of0.8 mg/kg for children ≤12 kg and 1.1 mg/kg if >12 kg was clinically most optimal. Thesedata are now the dosing recommendations in the IV Busulfex product package insert and thedosing adopted by most US transplant centers. Recent European studies found that 76.4% ofchildren achieved an AUC of 900 to 1350 μM·min, and 91% achieved the broader AUCtarget of 900 to 1500 μM·min using doses based on 5 different strata of body weights.25,26
As of yet, this dosing strategy has not been adopted in the United States or approved by theFood and Drug Administration (FDA). In the United States, the use of weight cutoffs fordosing of busulfan in pediatric patients has reduced the variability in busulfan exposure andprovides safer therapeutics. However, 29% to 40% of individual patients, despite weight-orage-based dosing, as recommended by the package insert, do not achieve the therapeutictarget.21
Genetic variants in GST promoter or genes result in reduced enzyme expression (GSTA1),enzyme deletion (GSTM1), or reduced enzyme activity (GSTP1) and may explain asignificant portion of pharmacokinetic variability. We found that 48% of our primarilyCaucasian population were carriers of the GSTA1*B variant, resulting in a minor allelefrequency of 36%. This is similar to the frequencies reported by Robert et al27 (40%).Similarly, allele frequencies observed for the GSTM1*0, GSTP1*2, and GSTP1*3 variantwere comparable to those reported in the literature.28
Johnson et al. Page 7
J Clin Pharmacol. Author manuscript; available in PMC 2011 October 31.
NIH
-PA Author Manuscript
NIH
-PA Author Manuscript
NIH
-PA Author Manuscript

The pharmacokinetics of busulfan have been studied extensively in children.23,24,29–34 It iswell characterized that age and body weight are important covariates toward busulfanexposures in children,23,24,30–33 but they only partially explain the observed variation inpharmacokinetics. Therefore, we postulated that recipient genetic status may provideadditional explanation for the pharmacokinetic variability. In our noncomparmentalpharmacokinetic analysis, we found that the presence of 1 or more GSTA1*B variant alleleswas associated with a 2.6-fold increase in busulfan AUC and Css (Table II). However,children heterozygous or homozygous for GSTA1*B were significantly younger andweighed less, thereby confounding the interpretation. There was no effect of GSTM1,GSTP1*2, or GSTP1*3 on busulfan exposures, with age and weight being evenly distributedbetween genotype groups (Table III).
In the population pharmacokinetic analysis, children ≤4 years of age had a significantlyhigher weight-normalized busulfan clearance than those >4 years. These clearance valuesare in agreement with other studies evaluating IV busulfan pharmacokinetics inchildren.23,24,30–33 In addition, children who were heterozygous or homozygous for theGSTA1*B polymorphism (regardless of age) exhibited a 30% decrease in busulfanclearance (Table IV). Our data are consistent with a previous in vitro study in which humanliver samples, genotyped for the GSTA1*B variant, were associated with a reducedexpression of the GSTA1 enzyme.35 GST variants and busulfan pharmacokinetics also wereevaluated recently in a small number of adult HCT recipients (n = 12) with the first dose oforal busulfan.19 Kusama et al19 demonstrated that subjects who were heterozygous for theGSTA1*B variant (n = 3) had lower busulfan CL/F (~0.099 L/h/kg) compared withnoncarriers (~0.225 L/h/kg; n = 9; P ≤ .01). GSTP is a minor contributor in vitro to busulfanmetabolism, and we found that neither GSTP1*2 nor GSTP1*3 variants were importantcovariates, although in vitro studies have demonstrated that variants in the promoter regionof GSTP were 1.7-fold less efficient in conjugating antidiol epoxides of methylchrysenes.17
Veno-occlusive disease is one of the major dose-dependent toxicities occurring primarilywhen busulfan Css is greater than 900 ng/mL.1,6,8,10 Busulfan-induced VOD occurs inapproximately 20% (oral) and 5% (IV) of individuals, with an associated mortality ratebetween 20% (oral) and 3% (IV).36 In our population, 3 of 29 (10%) developed VOD. Weobserved that 2 of the 3 patients with VOD were carriers of the GSTA1*B variant. However,overall, 14 children were shown to have the GSTA1*B variant, and only 2 went on todevelop VOD. A greater number of children ultimately may have developed VOD, but giventhat dose adjustments were done on all children with out-of-range Css, this cannot bedetermined. Further studies are needed to confirm the relationship between the GSTA1genotype and VOD, but because most centers today perform therapeutic drug monitoring inchildren, this is unlikely confirmable. Conversely, correlative studies by Srivastava et al18
reported that thalassemic patients undergoing hematopoietic cell transplantation with theGSTM1*0 (null) genotype had a significant increase in the incidence of hepatic VODcompared with those who were GSTM1 positive (wildtype; 46.5% vs 18.3%; P = .001).Patients with the GSTM1*0 genotype had a higher busulfan clearance and lower plasmaconcentrations. This effect was hypothesized to be caused by the increased expression ofGSTA due to the absence of GSTM1, but the association between GSTA1 and VOD was notinvestigated.18 This latter study demonstrates that compensatory mechanisms might increasethe expression of GSTA1 when GSTM1 is absent. However, studies by Bredschneider etal37 demonstrated that neither GSTA1 protein expression nor conjugation activity wasaffected by GSTM1 status in human liver tissue. The combined effects of being a carrier ofmultiple GST variants were investigated in our study, but future studies should examinethese effects in a larger population.
Johnson et al. Page 8
J Clin Pharmacol. Author manuscript; available in PMC 2011 October 31.
NIH
-PA Author Manuscript
NIH
-PA Author Manuscript
NIH
-PA Author Manuscript
We found that the GSTA1 variant was associated with a 30% reduction in busulfanclearance and a 2.6-fold higher busulfan Css. GSTM and GSTP do not appear to contributesubstantially. Simulations to determine the potential effect of using genotype in addition toweight or age on busulfan exposure showed that fewer children would be expected to exceedthe upper therapeutic limit compared with dosing using age or weight only. As aconsequence, more children would fall below the lower limit. Our findings do not suggestelimination of therapeutic drug monitoring but that fewer children might have high busulfanexposures if genotype is used in the dosing decisions. Future studies in larger populationsare needed to validate these finding and to prospectively test busulfan dosing based ongenotype and weight. Such models have the potential to improve the safety of busulfantherapy.
References1. McCune JS, Gooley T, Gibbs JP, et al. Busulfan concentration and graft rejection in pediatric
patients undergoing hematopoietic stem cell transplantation. Bone Marrow Transplant. 2002;30:167–173. [PubMed: 12189535]
2. Vassal G, Koscielny S, Challine D, et al. Busulfan disposition and hepatic veno-occlusive disease inchildren undergoing bone marrow transplantation. Cancer Chemother Pharmacol. 1996; 37:247–253. [PubMed: 8529285]
3. Andersson BS, Thall PF, Madden T, et al. Busulfan systemic exposure relative to regimen-relatedtoxicity and acute graft-versus-host disease: defining a therapeutic window for i.v. BuCy2 inchronic myelogenous leukemia. Biol Blood Marrow Transplant. 2002; 8:477–485. [PubMed:12374452]
4. McCune JS, Gibbs JP, Slattery JT. Plasma concentration monitoring of busulfan: does it improveclinical outcome? Clin Pharmacokinet. 2000; 39:155–165. [PubMed: 10976660]
5. Copelan EA, Bechtel TP, Avalos BR, et al. Busulfan levels are influenced by prior treatment and areassociated with hepatic veno-occlusive disease and early mortality but not with delayedcomplications following marrow transplantation. Bone Marrow Transplant. 2001; 27:1121–1124.[PubMed: 11551021]
6. Slattery JT, Risler LJ. Therapeutic monitoring of busulfan in hematopoietic stem celltransplantation. Ther Drug Monit. 1998; 20:543–549. [PubMed: 9780133]
7. Slattery JT, Clift RA, Buckner CD, et al. Marrow transplantation for chronic myeloid leukemia: theinfluence of plasma busulfan levels on the outcome of transplantation. Blood. 1997; 89:3055–3060.[PubMed: 9108427]
8. Dix SP, Wingard JR, Mullins RE, et al. Association of busulfan area under the curve with veno-occlusive disease following BMT. Bone Marrow Transplant. 1996; 17:225–230. [PubMed:8640171]
9. Slattery JT, Sanders JE, Buckner CD, et al. Graft-rejection and toxicity following bone marrowtransplantation in relation to busulfan pharmacokinetics. Bone Marrow Transplant. 1995; 16:31–42.[PubMed: 7581127]
10. Grochow LB. Busulfan disposition: the role of therapeutic monitoring in bone marrowtransplantation induction regimens. Semin Oncol. 1993; 20:18–25. quiz 26. [PubMed: 8342071]
11. Bolinger AM, Zangwill AB, Slattery JT, et al. An evaluation of engraftment, toxicity and busulfanconcentration in children receiving bone marrow transplantation for leukemia or genetic disease.Bone Marrow Transplant. 2000; 25:925–930. [PubMed: 10800058]
12. Gibbs JP, Liacouras CA, Baldassano RN, Slattery JT. Up-regulation of glutathione S-transferaseactivity in enterocytes of young children. Drug Metab Dispos. 1999; 27:1466–1469. [PubMed:10570028]
13. Gibbs JP, Murray G, Risler L, Chien JY, Dev R, Slattery JT. Age-dependenttetrahydrothiophenium ion formation in young children and adults receiving high-dose busulfan.Cancer Res. 1997; 57:5509–5516. [PubMed: 9407960]
14. Hassan M, Ljungman P, Bolme P, et al. Busulfan bioavailability. Blood. 1994; 84:2144–2150.[PubMed: 7919328]
Johnson et al. Page 9
J Clin Pharmacol. Author manuscript; available in PMC 2011 October 31.
NIH
-PA Author Manuscript
NIH
-PA Author Manuscript
NIH
-PA Author Manuscript
15. Czerwinski M, Gibbs JP, Slattery JT. Busulfan conjugation by glutathione S-transferases alpha,mu, and pi. Drug Metab Dispos. 1996; 24:1015–1019. [PubMed: 8886613]
16. Gibbs JP, Czerwinski M, Slattery JT. Busulfan-glutathione conjugation catalyzed by human livercytosolic glutathione S-transferases. Cancer Res. 1996; 56:3678–3681. [PubMed: 8706007]
17. Hu X, Pal A, Krzeminski J, et al. Specificities of human glutathione S-transferase isozymes towardanti-diol epoxides of methylchrysenes. Carcinogenesis. 1998; 19:1685–1689. [PubMed: 9771942]
18. Srivastava A, Poonkuzhali B, Shaji RV, et al. Glutathione S-transferase M1 polymorphism: a riskfactor for hepatic venoocclusive disease in bone marrow transplantation. Blood. 2004; 104:1574–1577. [PubMed: 15142875]
19. Kusama M, Kubota T, Matsukura Y, et al. Influence of glutathione S-transferase A1 polymorphismon the pharmacokinetics of busulfan. Clin Chim Acta. 2006; 368:93–98. [PubMed: 16448639]
20. Lai WK, Pang CP, Law LK, Wong R, Li CK, Yuen PM. Routine analysis of plasma busulfan bygas chromatography–mass fragmentography. Clin Chem. 1998; 44:2506–2510. [PubMed:9836718]
21. Busulfex [package insert]. Redwood City, CA: PDL Bio Pharma, Inc; 2007.22. Jones RJ, Lee KS, Beschorner WE, et al. Venoocclusive disease of the liver following bone
marrow transplantation. Transplantation. 1987; 44:778–783. [PubMed: 3321587]23. Dalle JH, Wall D, Theoret Y, et al. Intravenous busulfan for allogeneic hematopoietic stem cell
transplantation in infants: clinical and pharmacokinetic results. Bone Marrow Transplant. 2003;32:647–651. [PubMed: 13130310]
24. Booth BP, Rahman A, Dagher R, et al. Population pharmacokinetic-based dosing of intravenousbusulfan in pediatric patients. J Clin Pharmacol. 2007; 47:101–111. [PubMed: 17192508]
25. Vassal G, Michel G, Esperou H, et al. Prospective validation of a novel IV busulfan fixed dosingfor paediatric patients to improve therapeutic AUC targeting without drug monitoring. CancerChemother Pharmacol. 2008; 61:113–123. [PubMed: 17393167]
26. Nguyen L, Fuller D, Lennon S, Leger F, Puozzo C. I.V. busulfan in pediatrics: a novel dosing toimprove safety/efficacy for hematopoietic progenitor cell transplantation recipients. Bone MarrowTransplant. 2004; 33:979–987. [PubMed: 15064687]
27. Robert J, Morvan VL, Smith D, Pourquier P, Bonnet J. Predicting drug response and toxicity basedon gene polymorphisms. Crit Rev Oncol Hematol. 2005; 54:171–196. [PubMed: 15890268]
28. Garte S, Gaspari L, Alexandrie AK, et al. Metabolic gene polymorphism frequencies in controlpopulations. Cancer Epidemiol Biomarkers Prev. 2001; 10:1239–1248. [PubMed: 11751440]
29. Takama H, Tanaka H, Nakashima D, Ueda R, Takaue Y. Population pharmacokinetics ofintravenous busulfan in patients undergoing hematopoietic stem cell transplantation. Bone MarrowTransplant. 2006; 37:345–351. [PubMed: 16400337]
30. Cremers S, Schoemaker R, Bredius R, et al. Pharmacokinetics of intravenous busulfan in childrenprior to stem cell transplantation. Br J Clin Pharmacol. 2002; 53:386–389. [PubMed: 11966670]
31. Schechter T, Finkelstein Y, Doyle J, et al. Pharmacokinetic disposition and clinical outcomes ininfants and children receiving intravenous busulfan for allogeneic hematopoietic stem celltransplantation. Biol Blood Marrow Transplant. 2007; 13:307–314. [PubMed: 17317584]
32. Zwaveling J, Bredius RG, Cremers SC, et al. Intravenous busulfan in children prior to stem celltransplantation: study of pharmacokinetics in association with early clinical outcome and toxicity.Bone Marrow Transplant. 2005; 35:17–23. [PubMed: 15502853]
33. Shaw PJ, Scharping CE, Brian RJ, Earl JW. Busulfan pharmacokinetics using a single daily high-dose regimen in children with acute leukemia. Blood. 1994; 84:2357–2362. [PubMed: 7919354]
34. Poonkuzhali B, Chandy M, Srivastava A, Dennison D, Krishnamoorthy R. Glutathione S-transferase activity influences busulfan pharmacokinetics in patients with beta thalassemia majorundergoing bone marrow transplantation. Drug Metab Dispos. 2001; 29:264–267. [PubMed:11181493]
35. Coles BF, Morel F, Rauch C, et al. Effect of polymorphism in the human glutathione S-transferaseA1 promoter on hepatic GSTA1 and GSTA2 expression. Pharmacogenetics. 2001; 11:663–669.[PubMed: 11692074]
36. Kashyap A, Wingard J, Cagnoni P, et al. Intravenous versus oral busulfan as part of a busulfan/cyclophosphamide preparative regimen for allogeneic hematopoietic stem cell transplantation:
Johnson et al. Page 10
J Clin Pharmacol. Author manuscript; available in PMC 2011 October 31.
NIH
-PA Author Manuscript
NIH
-PA Author Manuscript
NIH
-PA Author Manuscript

decreased incidence of hepatic venoocclusive disease (HVOD), HVOD-related mortality, andoverall 100-day mortality. Biol Blood Marrow Transplant. 2002; 8:493–500. [PubMed: 12374454]
37. Bredschneider M, Klein K, Murdter TE, et al. Genetic polymorphisms of glutathione S-transferaseA1, the major glutathione S-transferase in human liver: consequences for enzyme expression andbusulfan conjugation. Clin Pharmacol Ther. 2002; 71:479–487. [PubMed: 12087351]
Johnson et al. Page 11
J Clin Pharmacol. Author manuscript; available in PMC 2011 October 31.
NIH
-PA Author Manuscript
NIH
-PA Author Manuscript
NIH
-PA Author Manuscript

Figure 1.Post hoc intravenous busulfan clearance estimates in patients with GSTA1*A/*A,GSTA1*A/*B, and GSTA1*B/*B genotypes. Filled circles are the individual data forchildren age ≤ 4 years. Open circles are the individual data for children age > 4 years. Thesolid lines represent the means for each genotype.
Johnson et al. Page 12
J Clin Pharmacol. Author manuscript; available in PMC 2011 October 31.
NIH
-PA Author Manuscript
NIH
-PA Author Manuscript
NIH
-PA Author Manuscript

Figure 2.Observed versus population-predicted intravenous busulfan concentrations. Solid linerepresents the line of identity. The open circles are the population-predicted/observedconcentration pair.
Johnson et al. Page 13
J Clin Pharmacol. Author manuscript; available in PMC 2011 October 31.
NIH
-PA Author Manuscript
NIH
-PA Author Manuscript
NIH
-PA Author Manuscript
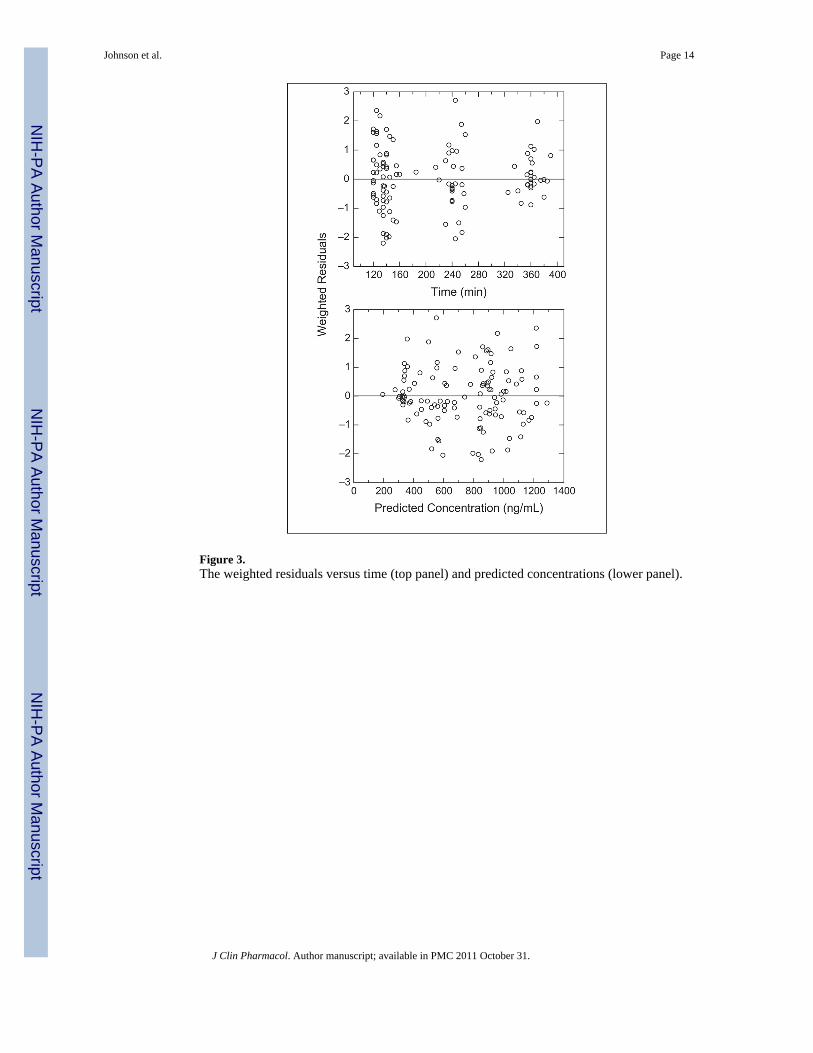
Figure 3.The weighted residuals versus time (top panel) and predicted concentrations (lower panel).
Johnson et al. Page 14
J Clin Pharmacol. Author manuscript; available in PMC 2011 October 31.
NIH
-PA Author Manuscript
NIH
-PA Author Manuscript
NIH
-PA Author Manuscript
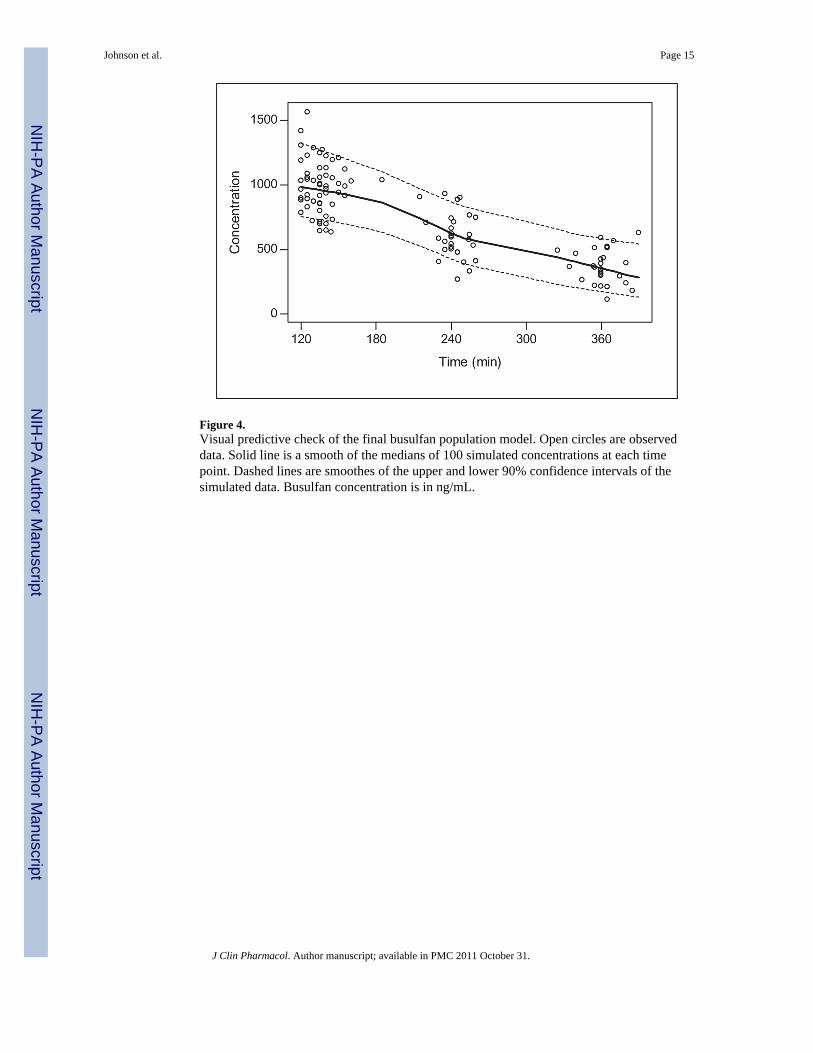
Figure 4.Visual predictive check of the final busulfan population model. Open circles are observeddata. Solid line is a smooth of the medians of 100 simulated concentrations at each timepoint. Dashed lines are smoothes of the upper and lower 90% confidence intervals of thesimulated data. Busulfan concentration is in ng/mL.
Johnson et al. Page 15
J Clin Pharmacol. Author manuscript; available in PMC 2011 October 31.
NIH
-PA Author Manuscript
NIH
-PA Author Manuscript
NIH
-PA Author Manuscript

Figure 5.Relationship between noncompartmental busulfan AUC and NONMEM-derived AUC.AUC is in mcg·min/mL.
Johnson et al. Page 16
J Clin Pharmacol. Author manuscript; available in PMC 2011 October 31.
NIH
-PA Author Manuscript
NIH
-PA Author Manuscript
NIH
-PA Author Manuscript

NIH
-PA Author Manuscript
NIH
-PA Author Manuscript
NIH
-PA Author Manuscript
Johnson et al. Page 17
Table I
Patient Demographics
Age, y, median (range) 5.58 (0.08–18.25)
Gender, male/female 17/12
Weight, kg, median (range) 16.70 (5.58–99.10)
Disease
ALD 6
AML 4
Hurler syndrome 4
ALL 2
I-cell disease (mucolipidosis) 2
JMML 2
Krabbe 2
MLD 2
Fanconi anemia/AML 1
T cell ALL 1
α-Thalassemia 1
Batten disease 1
Niemann-Pick disease 1
Race/ethnicity
Caucasian 17
African American 3
Unknown 3
Asian 2
Hispanic 2
Other 2
Donor type
Unrelated 22
Related 7
Stem cell source
Cord blood 21
Bone marrow 8
Preparative regimen
Busulfan, cyclophosphamide 25
Busulfan, fludarabine 4
ALL, acute lymphocytic leukemia; AML, acute myeloid leukemia; ALD, adrenoleukodystrophy; MDL, metachromatic leukodystrophy; JMML,juvenile myelomonocytic leukemia.
J Clin Pharmacol. Author manuscript; available in PMC 2011 October 31.

NIH
-PA Author Manuscript
NIH
-PA Author Manuscript
NIH
-PA Author Manuscript
Johnson et al. Page 18
Table II
Effect of GSTA1*B on Busulfan Noncompartmental Pharmacokinetics
GSTA1
*A/*A *A/*B *B/*B P Valuea
n (%) 15 (52) 7 (24) 7 (24)
Age, y 10.25 (2.08–18.25) 1.50 (0.58–10.08) 1.33 (0.08–13.75) <.01
Weight, kg 33.30 (9.30–99.10) 8.17 (6.26–33.80) 12.00 (5.58–53.20) .02
AUC0-∞b 11.22 (4.62–23.67) 33.42 (10.02–55.22) 24.02 (8.28–67.25) <.01
Css c 30.00 (13.13–64.84) 92.83 (27.46–152.59) 64.94 (24.37–184.10) .01
Cmax, ng/mL 922 (720–1274) 1129 (882–1307) 1246 (881–1564) .02
Data are in median (range).
aP is comparison of *A/*A (wild type) and *A/*B and *B/*B (heterozygous and homozygous mutant, respectively).
bAUC, area under the curve adjusted for dose in mg; units are mcg·min/mL/mg.
cCss, steady-state plasma concentration adjusted for dose in mg; units are ng/mL/mg.
J Clin Pharmacol. Author manuscript; available in PMC 2011 October 31.
NIH
-PA Author Manuscript
NIH
-PA Author Manuscript
NIH
-PA Author Manuscript
Johnson et al. Page 19
Tabl
e III
Effe
ct o
f GST
M1*
0, G
STP1
*2, a
nd G
STP*
3 on
Bus
ulfa
n N
onco
mpa
rtmen
tal P
harm
acok
inet
ics
GST
M1
GST
P1*2
GST
P1*3
*0/*
0 (N
ull)
*A/*
A o
r *A
/*0
*1/*
1*1
/*2
*1/*
1*1
/*3
n (%
)16
(55)
13 (4
5)10
(34)
19 (6
6)23
(79)
6 (2
1)
Age
, y6.
08 (0
.67–
18.2
5)4.
58 (0
.08–
18.2
5)3.
38 (0
.08–
18.2
5)8.
17 (0
.58–
18.2
5)5.
25 (0
.08–
18.2
5)6.
88 (0
.67–
16.3
3)
P
valu
e.8
5.2
4.9
0
Wei
ght,
kg17
.31
(6.2
6–99
.10)
16.7
0 (5
.58–
94.6
0)15
.05
(5.5
8–94
.60)
15.5
0 (5
.58–
99.1
0)26
.05
(6.2
6–61
.50)
27.0
0 (6
.26–
99.1
0)
P
valu
e.3
5.3
6.9
5
AU
C0-∞
a,b
16.4
1 (4
.62–
55.2
2)12
.19
(4.7
3–67
.25)
21.2
8 (5
.63–
67.2
5)12
.19
(4.6
2–55
.22)
14.2
5 (4
.62–
67.2
5)17
.72
(8.2
8–55
.22)
P
valu
e.8
5.3
9.6
1
Css
,0-∞
a,c
46.7
2 (1
3.79
–152
.59)
33.8
7 (1
3.13
–184
.10)
57.9
2 (1
5.42
–184
.10)
33.8
7 (1
3.13
–152
.59)
39.6
0 (1
3.13
–184
.10)
47.4
7 (2
4.37
–152
.59)
P
valu
e.8
5.4
0.6
2
Cm
ax, n
g/m
L97
9 (8
27–1
307)
1059
(720
–156
4)10
48 (8
81–1
417)
922
(720
–156
4)10
33 (7
20–1
564)
1107
(893
–128
5)
P
valu
e.2
7.2
8.6
0
a Adj
uste
d fo
r dos
e in
mg;
dat
a ar
e in
med
ian
(ran
ge).
b AU
C, a
rea
unde
r the
con
cent
ratio
n cu
rve
adju
sted
for d
ose
in m
g; u
nits
are
mcg
·min
/mL/
mg.
c Css
, ste
ady-
stat
e pl
asm
a co
ncen
tratio
n ad
just
ed fo
r dos
e in
mg;
uni
ts a
re n
g/m
L/m
g.
J Clin Pharmacol. Author manuscript; available in PMC 2011 October 31.
NIH
-PA Author Manuscript
NIH
-PA Author Manuscript
NIH
-PA Author Manuscript
Johnson et al. Page 20
Table IV
Final Population Pharmacokinetic Model Parameter Estimates
Parameter Estimate Lower 95% Confidence Interval Upper 95% Confidence Interval
CL,a age ≤4 years 0.288 0.213 0.363
CL,a age >4 years 0.173 0.148 0.197
GSTA1*B CL multiplierb 0.704 0.519 0.889
Vd 0.682 0.650 0.714
BSV on CL, % 24.7 14.3 31.9
BSV on Vd, % 11.1 0 15.9
RUV, proportional, % 6.87 4.79 8.46
Vd, volume of distribution; BSV, between-subject variability; RUV, residual unexplained variability.
aClearance (CL) = L/h/kg.
bReduction in CL in children heterozygous or homozygous for the GSTA1*B variant.
J Clin Pharmacol. Author manuscript; available in PMC 2011 October 31.
NIH
-PA Author Manuscript
NIH
-PA Author Manuscript
NIH
-PA Author Manuscript
Johnson et al. Page 21
Tabl
e V
Perc
enta
ge o
f Pat
ient
s With
in T
arge
ted
Bus
ulfa
n R
ange
Afte
r Pop
ulat
ion
Sim
ulat
ion
of 1
000
Subj
ects
Mod
elW
eigh
t, kg
GST
A1a
Dos
age
Reg
imen
, mg/
kgb
% S
ubje
cts
600–
900
ng/m
L<6
00 n
g/m
L>9
00 n
g/m
L
1≤1
2—
1.1
4220
37
>12
—0.
8
2≤1
2W
T1.
148
3318
MU
T0.
8
>12
WT
0.8
MU
T0.
6
Mod
elA
ge, y
GST
A1a
Dos
age
Reg
imen
, mg/
kgb
600–
900
ng/m
L<6
00 n
g/m
L>9
00 n
g/m
L
3≤4
WT
1.0
5429
16
MU
T0.
7
>4W
T0.
8
MU
T0.
6
WT,
wild
type
; MU
T, m
utan
t.
a GST
A g
enot
ype
was
cat
egor
ized
as W
T fo
r GST
A1*
A/*
A g
enot
ype
and
MU
T fo
r ind
ivid
uals
with
eith
er G
STA
1*A
/*B
or G
STA
1*B
/*B
gen
otyp
e.
b Alte
rnat
ive
busu
lfan
dosi
ng w
as se
lect
ed if
the
indi
vidu
al w
as a
car
rier o
f the
GST
A1*
B g
enot
ype.
Car
riers
of t
he G
STA
1*B
gen
otyp
e re
ceiv
ed a
30%
redu
ctio
n in
dos
e, w
hich
was
det
erm
ined
by
the
popu
latio
n ph
arm
acok
inet
ic m
odel
cle
aran
ce e
stim
ates
.
J Clin Pharmacol. Author manuscript; available in PMC 2011 October 31.