Global-Scale Relationships between Colonization Ability and Range Size in Marine and Freshwater Fish
8
Global-Scale Relationships between Colonization Ability and Range Size in Marine and Freshwater Fish Giovanni Strona 1 *, Paolo Galli 1 , Simone Montano 1 , Davide Seveso 1 , Simone Fattorini 1,2 1 Department of Biotechnology and Biosciences, University of Milano Bicocca, Milano, Italy, 2 Azorean Biodiversity Group and Platform for Enhancing Ecological Research & Sustainability (PEERS), Departamento de Cie ˆ ncias Agra ´ rias Universidade dos Ac ¸ores, Angra do Heroı ´smo, Portugal Abstract Although fish range sizes are expected to be associated with species dispersal ability, several studies failed to find a clear relationship between range size and duration of larval stage as a measure of dispersal potential. We investigated how six characteristics of the adult phase of fishes (maximum body length, growth rate, age at first maturity, life span, trophic level and frequency of occurrence) possibly associated with colonization ability correlate with range size in both freshwater and marine species at global scale. We used more than 12 million point records to estimate range size of 1829 freshwater species and 10068 marine species. As measures of range size we used both area of occupancy and extent of occurrence. Relationships between range size and species traits were assessed using Canonical Correlation Analysis. We found that frequency of occurrence and maximum body length had a strong influence on range size measures, which is consistent with patterns previously found (at smaller scales) in several other taxa. Freshwater and marine fishes showed striking similarities, suggesting the existence of common mechanisms regulating fish biogeography in the marine and freshwater realms. Citation: Strona G, Galli P, Montano S, Seveso D, Fattorini S (2012) Global-Scale Relationships between Colonization Ability and Range Size in Marine and Freshwater Fish. PLoS ONE 7(11): e49465. doi:10.1371/journal.pone.0049465 Editor: Christopher Fulton, The Australian National University, Australia Received July 17, 2012; Accepted October 9, 2012; Published November 21, 2012 Copyright: ß 2012 Strona et al. This is an open-access article distributed under the terms of the Creative Commons Attribution License, which permits unrestricted use, distribution, and reproduction in any medium, provided the original author and source are credited. Funding: This work has been supported by the Department of Biotechnology and Biosciences of University of Milano-Bicocca (grant number: 2-18-599000-6; U.A. 001; CUP: H47E11000010002). The funders had no role in study design, data collection and analysis, decision to publish, or preparation of the manuscript. Competing Interests: The authors have declared that no competing interests exist. * E-mail: [email protected] Introduction To enlarge its distributional range, a species must reach a new, previously unoccupied area, and then succeed in colonizing it. The first process (dispersal) is mainly related to the species ability to cross unfavorable areas [1], whereas, the second (colonization) is determined by environmental constraints and species ecological requirements [2,3]. Both processes are fundamental in determin- ing species range size, so that a species with a high dispersal ability, but with low adaptability to new environments, may have a restricted range. Dispersal potential of marine fishes can be confidently estimated through the length of the larval phase [4,5,6], whereas the identification of possible determinants of dispersal ability in freshwater fishes is less straightforward. Freshwater species distributions are subject to a variety of constraints (such as dendritic arrangement of riverine ecosystems, changes in drainage basin boundaries, human alterations of river courses, sea water barriers, etc.), as well as to biogeographic patterns (such as the geological history of the areas), which make it difficult to disentangle the role of dispersal from the effects of environmental (hydrographical) and human-induced processes potentially responsible for species range expansion [7]. Because fish larvae can be transported by sea currents for hundreds to thousands of kilometers [8], dispersal ability is considered much more important than colonization ability in determining fish range size in the marine realm. A positive relationship between dispersal potential and range size is expected [5], yet several studies failed in finding a clear relationship between duration of the larval stage and range size in marine fishes [9]. However, these studies investigated only reef fish communities, which are problematic for various reasons. First, reef fish communities may be significantly sustained by endogenous recruitment [10]. Second, it is possible that the lack of habitat isolation in reefs obscures the relationship between dispersal and range size [9]. Third, it is difficult to establish if results obtained for reef fishes can be comparable to those obtained for species with different ecology, such as migratory (oceanodromous, anadro- mous, catadromous, potamodromous, amphidromous), demersal, and pelagic species. On the other hand, range size expansion in freshwater fish species is generally attributed to geological changes to drainage basin boundaries, such as river captures and massive floods, and is therefore considered unrelated to species dispersal ability [7]. However, many freshwater species strictly associated with lentic waters could have virtually no connection with rivers. Moreover, river flow may afford excellent opportunity for long distance downstream dispersal of both larvae (during high discharge and directed water movement) and adults (as bi-directional migration routes).These difficulties in establishing robust theoretical linkages between fish dispersal ability and range size would lead to a serious reconsideration of the potential role of fish colonization ability in determining species distributions. Recent studies demonstrated that adult biology traits (especially environmental tolerance and body size) are important determinants of successful movements of reef fish across marine barriers [11] thus encouraging the possibility of relating range size to species traits at a global scale. The present paper makes use of the great amount of data on fish distribution and ecology provided respectively by Fishbase [12] and the Ocean Biogeographic System [13] to investigate how PLOS ONE | www.plosone.org 1 November 2012 | Volume 7 | Issue 11 | e49465
-
Upload
independent -
Category
Documents
-
view
3 -
download
0
Transcript of Global-Scale Relationships between Colonization Ability and Range Size in Marine and Freshwater Fish
Global-Scale Relationships between Colonization Abilityand Range Size in Marine and Freshwater FishGiovanni Strona1*, Paolo Galli1, Simone Montano1, Davide Seveso1, Simone Fattorini1,2
1 Department of Biotechnology and Biosciences, University of Milano Bicocca, Milano, Italy, 2 Azorean Biodiversity Group and Platform for Enhancing Ecological Research
& Sustainability (PEERS), Departamento de Ciencias Agrarias Universidade dos Acores, Angra do Heroısmo, Portugal
Abstract
Although fish range sizes are expected to be associated with species dispersal ability, several studies failed to find a clearrelationship between range size and duration of larval stage as a measure of dispersal potential. We investigated how sixcharacteristics of the adult phase of fishes (maximum body length, growth rate, age at first maturity, life span, trophic leveland frequency of occurrence) possibly associated with colonization ability correlate with range size in both freshwater andmarine species at global scale. We used more than 12 million point records to estimate range size of 1829 freshwaterspecies and 10068 marine species. As measures of range size we used both area of occupancy and extent of occurrence.Relationships between range size and species traits were assessed using Canonical Correlation Analysis. We found thatfrequency of occurrence and maximum body length had a strong influence on range size measures, which is consistent withpatterns previously found (at smaller scales) in several other taxa. Freshwater and marine fishes showed striking similarities,suggesting the existence of common mechanisms regulating fish biogeography in the marine and freshwater realms.
Citation: Strona G, Galli P, Montano S, Seveso D, Fattorini S (2012) Global-Scale Relationships between Colonization Ability and Range Size in Marine andFreshwater Fish. PLoS ONE 7(11): e49465. doi:10.1371/journal.pone.0049465
Editor: Christopher Fulton, The Australian National University, Australia
Received July 17, 2012; Accepted October 9, 2012; Published November 21, 2012
Copyright: � 2012 Strona et al. This is an open-access article distributed under the terms of the Creative Commons Attribution License, which permitsunrestricted use, distribution, and reproduction in any medium, provided the original author and source are credited.
Funding: This work has been supported by the Department of Biotechnology and Biosciences of University of Milano-Bicocca (grant number: 2-18-599000-6; U.A.001; CUP: H47E11000010002). The funders had no role in study design, data collection and analysis, decision to publish, or preparation of the manuscript.
Competing Interests: The authors have declared that no competing interests exist.
* E-mail: [email protected]
Introduction
To enlarge its distributional range, a species must reach a new,
previously unoccupied area, and then succeed in colonizing it. The
first process (dispersal) is mainly related to the species ability to
cross unfavorable areas [1], whereas, the second (colonization) is
determined by environmental constraints and species ecological
requirements [2,3]. Both processes are fundamental in determin-
ing species range size, so that a species with a high dispersal ability,
but with low adaptability to new environments, may have a
restricted range. Dispersal potential of marine fishes can be
confidently estimated through the length of the larval phase
[4,5,6], whereas the identification of possible determinants of
dispersal ability in freshwater fishes is less straightforward.
Freshwater species distributions are subject to a variety of
constraints (such as dendritic arrangement of riverine ecosystems,
changes in drainage basin boundaries, human alterations of river
courses, sea water barriers, etc.), as well as to biogeographic
patterns (such as the geological history of the areas), which make it
difficult to disentangle the role of dispersal from the effects of
environmental (hydrographical) and human-induced processes
potentially responsible for species range expansion [7].
Because fish larvae can be transported by sea currents for
hundreds to thousands of kilometers [8], dispersal ability is
considered much more important than colonization ability in
determining fish range size in the marine realm. A positive
relationship between dispersal potential and range size is expected
[5], yet several studies failed in finding a clear relationship between
duration of the larval stage and range size in marine fishes [9].
However, these studies investigated only reef fish communities,
which are problematic for various reasons. First, reef fish
communities may be significantly sustained by endogenous
recruitment [10]. Second, it is possible that the lack of habitat
isolation in reefs obscures the relationship between dispersal and
range size [9]. Third, it is difficult to establish if results obtained for
reef fishes can be comparable to those obtained for species with
different ecology, such as migratory (oceanodromous, anadro-
mous, catadromous, potamodromous, amphidromous), demersal,
and pelagic species.
On the other hand, range size expansion in freshwater fish
species is generally attributed to geological changes to drainage
basin boundaries, such as river captures and massive floods, and is
therefore considered unrelated to species dispersal ability [7].
However, many freshwater species strictly associated with lentic
waters could have virtually no connection with rivers. Moreover,
river flow may afford excellent opportunity for long distance
downstream dispersal of both larvae (during high discharge and
directed water movement) and adults (as bi-directional migration
routes).These difficulties in establishing robust theoretical linkages
between fish dispersal ability and range size would lead to a serious
reconsideration of the potential role of fish colonization ability in
determining species distributions. Recent studies demonstrated
that adult biology traits (especially environmental tolerance and
body size) are important determinants of successful movements of
reef fish across marine barriers [11] thus encouraging the
possibility of relating range size to species traits at a global scale.
The present paper makes use of the great amount of data on fish
distribution and ecology provided respectively by Fishbase [12]
and the Ocean Biogeographic System [13] to investigate how
PLOS ONE | www.plosone.org 1 November 2012 | Volume 7 | Issue 11 | e49465

species traits possibly associated with colonization ability affect
range size using a global scale approach and including also the
freshwater realm.
Materials and Methods
More than 12 million latitude/longitude point records for more
than 11,000 bony fish species were retrieved from The Ocean
Biogeographic Information System (OBIS) [13]. Biogeographic
accuracy of OBIS data has been previously questioned [14,15].
However, OBIS database is continuously updated with a constant
increase in the number of its records, which has grown from
around 15 million records in 2008 (the year it was heavily
criticized [14,15]), to almost 33 million records in 2012 [13]. This
improvement has recently facilitated its use in several macro-
ecological studies [16–19].
In the present paper, OBIS data were used to compile two geo-
referenced lists of freshwater and marine fish species, containing
1829 and 10068 species, respectively. Each species was assigned to
a realm (freshwater or marine) according to Fishbase [12].
Freshwater and marine datasets were analysed both simultaneous-
ly and separately. To evaluate the possible influence of species
introductions (human assisted translocations), we performed the
overall analyses also using a reduced dataset excluding introduced
species. Because we obtained results very similar to those achieved
including species subjected to introduction, we used the full data
sets for all analyses.
Range size for each species was estimated using measures of
area of occupancy (AOO) and extent of occurrence (EOO) [20].
AOOs were calculated as follows: for each species, we plotted all
available point records on a global grid of 161u Latitude/
longitude and then we counted the number of grid cells where the
species was present. For the EOO we alternatively tested two
different measures. In a first set of analyses, EOOs were expressed
as the number of 161u grid cells given by the product of species
latitudinal and longitudinal ranges. Latitudinal range (Lat) was
calculated as the difference between maximum and minimum
latitude of species occurrence. Longitudinal range (Lon) was
Figure 1. Frequency distribution plots of geographic range sizes expressed as area of occupancy (AOO, Number of occupied 1616Lat/Lon grid cells) in freshwater (A) and marine (B) fishes.doi:10.1371/journal.pone.0049465.g001
Figure 2. Frequency distribution plots of geographic range sizes expressed as extent of occurrence (EOO, number of grid cells of 16along the maximum latitudinal range 6 number of grid cells of 16 along the maximum longitudinal range of each species) infreshwater (A) and marine (B) fishes.doi:10.1371/journal.pone.0049465.g002
Fish Range Size and Colonization Ability
PLOS ONE | www.plosone.org 2 November 2012 | Volume 7 | Issue 11 | e49465
calculated as the difference between maximum and minimum
longitude of species occurrence. In a second set of analyses, we
used Lat and Lon as two separate measures of EOO instead of
combining them into a single measure of species range size. This
helped us to disentangle the possible effect of climate on latitudinal
species distribution [21] from the information provided by
longitudinal ranges, which are likely to be less influenced by
climatic gradients.
To express dispersal and colonization ability we considered the
following species traits of the adult phase of fishes: Maximum
length (L: larger fishes are expected to have high dispersal power
and to be less sensitive to predation than smaller fishes), growth
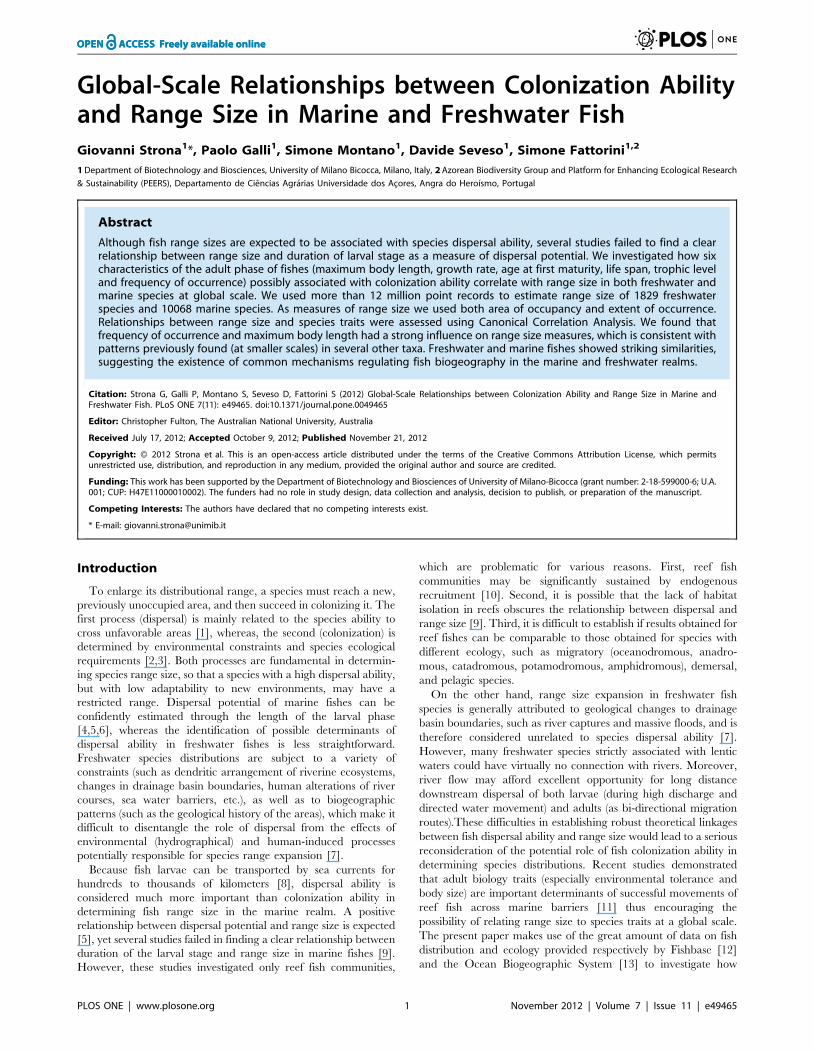
Figure 3. Frequency distribution plots of both maximum latitudinal (A and B) and longitudinal (C and D) ranges for freshwater (Aand C) and marine (B and D) fishes.doi:10.1371/journal.pone.0049465.g003
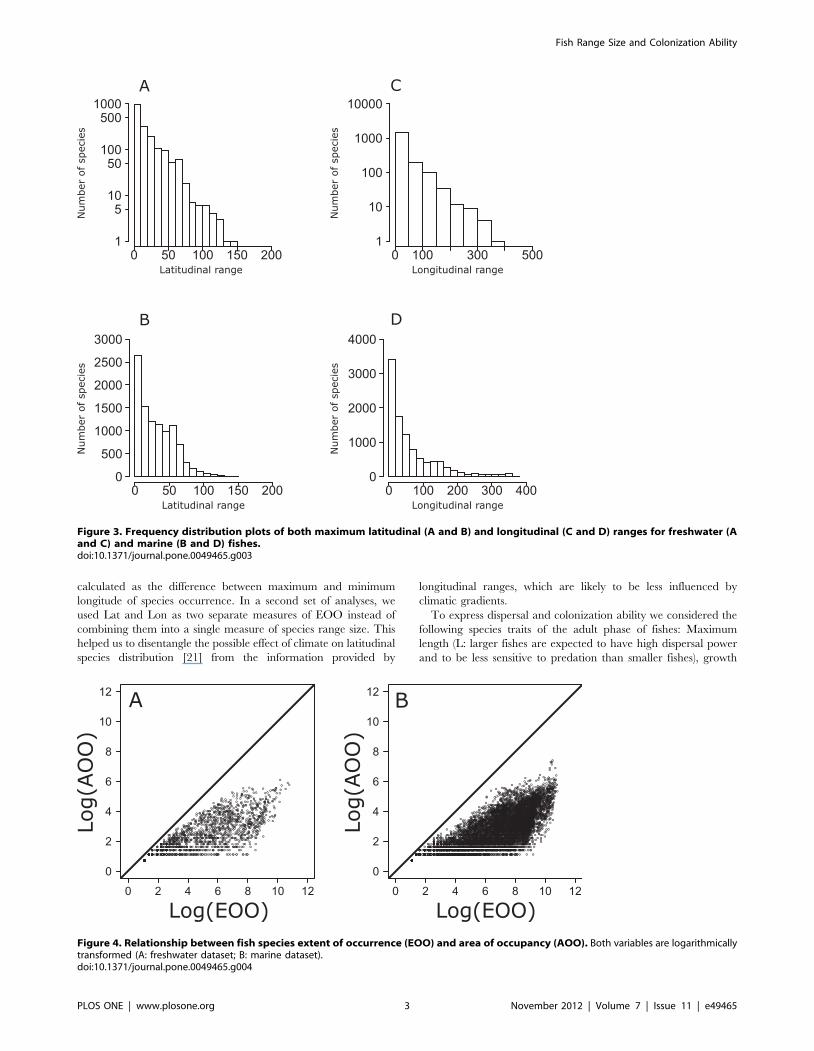
Figure 4. Relationship between fish species extent of occurrence (EOO) and area of occupancy (AOO). Both variables are logarithmicallytransformed (A: freshwater dataset; B: marine dataset).doi:10.1371/journal.pone.0049465.g004
Fish Range Size and Colonization Ability
PLOS ONE | www.plosone.org 3 November 2012 | Volume 7 | Issue 11 | e49465
rate coefficient of von Bertalanffy growth function (K: a low K
value indicates that the species lives for many years and reaches
slowly its maximum body size, whereas high K values are typical
of short lived species with rapid growth; rapid growth is also
characteristic of invasive species), age at first maturity (Ym: species
which need more time to reach their sexual maturity are expected
to travel more time before reproducing), life span (Y: the distance a
fish can travel in a lifetime should increase with life span) and
trophic level (T: species with higher trophic level are expected to
have larger range for predation). L, K, Ym, Y and T were
extracted for each species from Fishbase Species Ecology Matrices
using a script based on the Python HTML/XML parser Beautiful
Soup (http://www.crummy.com/software/BeautifulSoup). Spe-
cific details about these ecological parameters and the rationale
for their use as measures of dispersal and colonization ability can
be found in [22] and in Fishbase online documentation at http://
www.fishbase.org/manual/Key%20Facts.htm. We also calculated
for each species a measure of frequency of occurrence (W) as the
ratio between its total number of point records and the number of
grid cells where it occurs. This measure might reflect an estimate
of overall abundance. However, because of unequal sampling
among areas, this measure might also express differences in study
efforts.
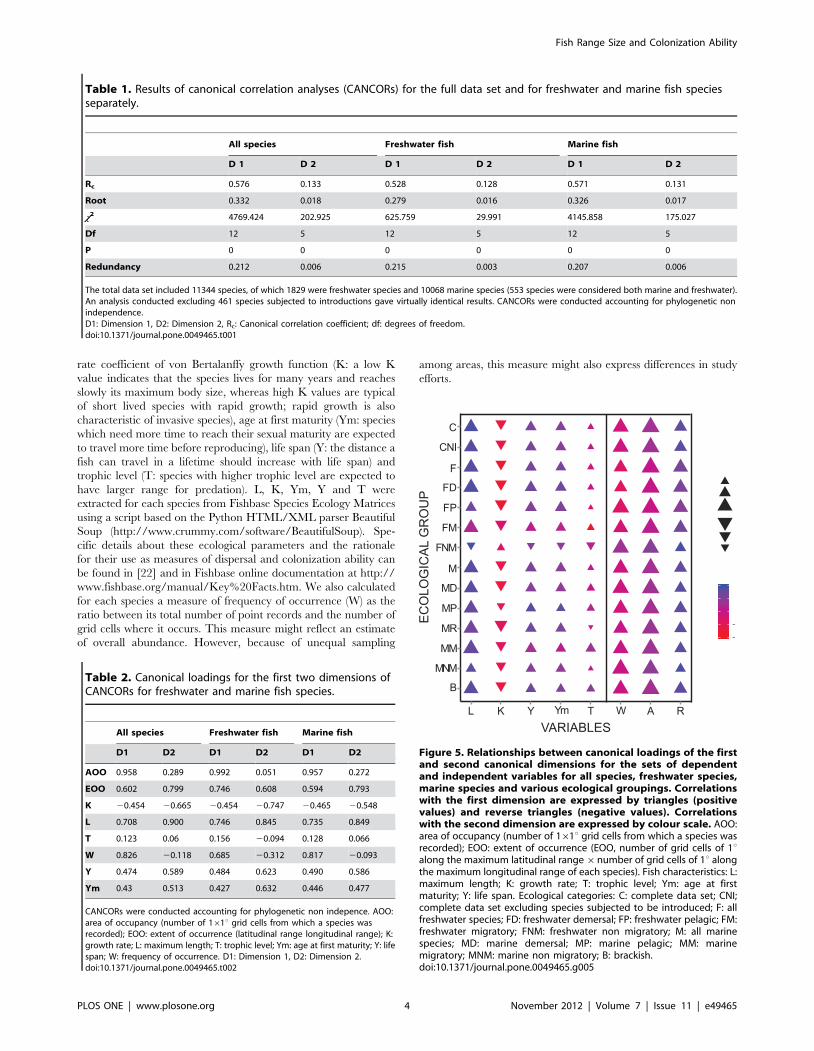
Table 1. Results of canonical correlation analyses (CANCORs) for the full data set and for freshwater and marine fish speciesseparately.
All species Freshwater fish Marine fish
D 1 D 2 D 1 D 2 D 1 D 2
Rc 0.576 0.133 0.528 0.128 0.571 0.131
Root 0.332 0.018 0.279 0.016 0.326 0.017
x2 4769.424 202.925 625.759 29.991 4145.858 175.027
Df 12 5 12 5 12 5
P 0 0 0 0 0 0
Redundancy 0.212 0.006 0.215 0.003 0.207 0.006
The total data set included 11344 species, of which 1829 were freshwater species and 10068 marine species (553 species were considered both marine and freshwater).An analysis conducted excluding 461 species subjected to introductions gave virtually identical results. CANCORs were conducted accounting for phylogenetic nonindependence.D1: Dimension 1, D2: Dimension 2, Rc: Canonical correlation coefficient; df: degrees of freedom.doi:10.1371/journal.pone.0049465.t001
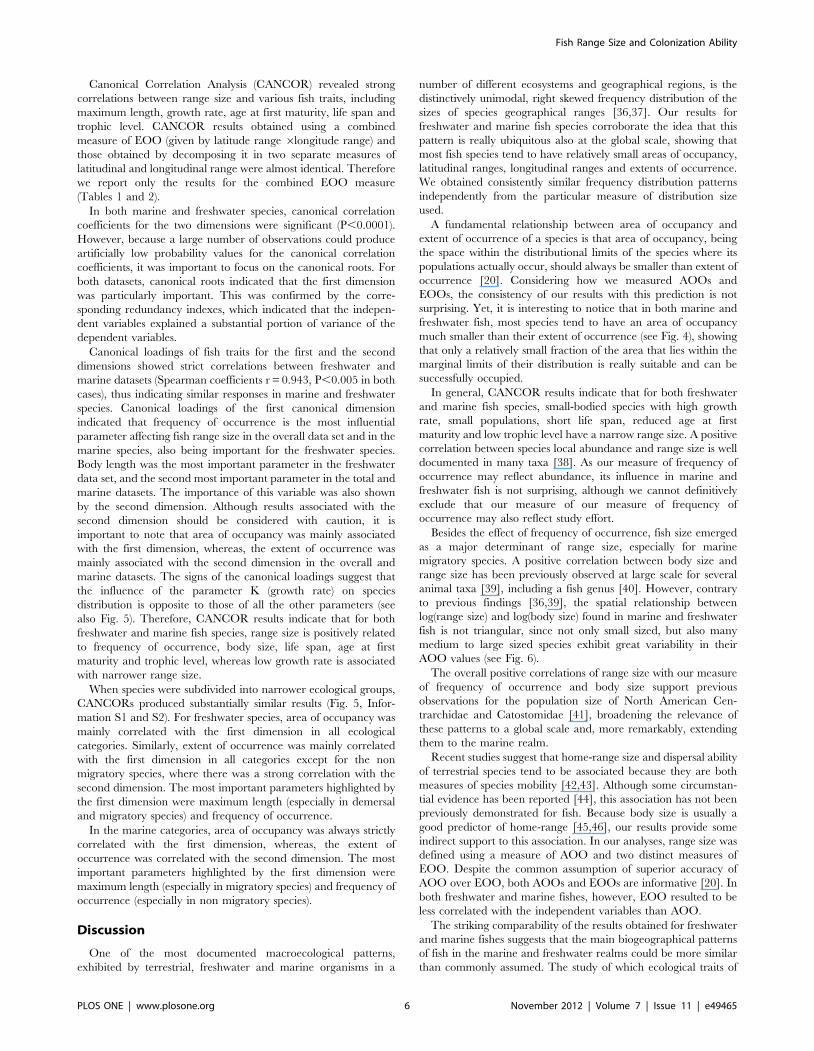
Table 2. Canonical loadings for the first two dimensions ofCANCORs for freshwater and marine fish species.
All species Freshwater fish Marine fish
D1 D2 D1 D2 D1 D2
AOO 0.958 0.289 0.992 0.051 0.957 0.272
EOO 0.602 0.799 0.746 0.608 0.594 0.793
K 20.454 20.665 20.454 20.747 20.465 20.548
L 0.708 0.900 0.746 0.845 0.735 0.849
T 0.123 0.06 0.156 20.094 0.128 0.066
W 0.826 20.118 0.685 20.312 0.817 20.093
Y 0.474 0.589 0.484 0.623 0.490 0.586
Ym 0.43 0.513 0.427 0.632 0.446 0.477
CANCORs were conducted accounting for phylogenetic non indepence. AOO:area of occupancy (number of 161u grid cells from which a species wasrecorded); EOO: extent of occurrence (latitudinal range longitudinal range); K:growth rate; L: maximum length; T: trophic level; Ym: age at first maturity; Y: lifespan; W: frequency of occurrence. D1: Dimension 1, D2: Dimension 2.doi:10.1371/journal.pone.0049465.t002
Figure 5. Relationships between canonical loadings of the firstand second canonical dimensions for the sets of dependentand independent variables for all species, freshwater species,marine species and various ecological groupings. Correlationswith the first dimension are expressed by triangles (positivevalues) and reverse triangles (negative values). Correlationswith the second dimension are expressed by colour scale. AOO:area of occupancy (number of 161u grid cells from which a species wasrecorded); EOO: extent of occurrence (EOO, number of grid cells of 1ualong the maximum latitudinal range6number of grid cells of 1u alongthe maximum longitudinal range of each species). Fish characteristics: L:maximum length; K: growth rate; T: trophic level; Ym: age at firstmaturity; Y: life span. Ecological categories: C: complete data set; CNI;complete data set excluding species subjected to be introduced; F: allfreshwater species; FD: freshwater demersal; FP: freshwater pelagic; FM:freshwater migratory; FNM: freshwater non migratory; M: all marinespecies; MD: marine demersal; MP: marine pelagic; MM: marinemigratory; MNM: marine non migratory; B: brackish.doi:10.1371/journal.pone.0049465.g005
Fish Range Size and Colonization Ability
PLOS ONE | www.plosone.org 4 November 2012 | Volume 7 | Issue 11 | e49465

We performed a Canonical Correlation Analysis (CANCOR),
using the aforementioned ecological parameters and the estimate
of frequency of occurrence as a set of dependent variables, and
range size measures (AOA and EOO) as a set of independent
variables. CANCOR has several advantages over other multivar-
iate techniques. Most notably, it enables the researcher to combine
into a composite measure what otherwise might be an unman-
ageably large number of bivariate correlations, thus limiting the
probability of committing Type I errors by using the same
variables for too many statistical tests [23]. CANCOR is also
particularly useful when the data researcher has little a priori
knowledge about relationships among the sets of variables.
Moreover, CANCOR is unique in developing multiple canonical
functions independent one from another and thus able to
represent different relationships among the sets of dependent
and independent variables [24]. Normal q-q plots showed
deviations from normality for all dependent and independent
variables [25] which were therefore log-transformed to achieve
normality [26]. Multivariate normal distribution in both depen-
dent and independent variables was assessed using R function
‘mvnorm.etest’ from the package ‘energy’ [27], which implements
a test based on Euclidean distance between sample elements [28].
Phylogentic relationships may generate pseudo-replication,
because taxa that are similar by common descent inflate the
sample size if they are counted as completely independent data
points. The most used method to account for phylogeny is that of
the independent contrasts [29]. To introduce the phylogenetic
information into CANCORs with independent contrasts, we used
the method called PCCA (Phylogenetic Canonical Correlation
Analysis), with l set at 1, which corresponds to a CANCOR
performed on the phylogenetically independent contrasts [30]. To
express phylogenetic relationships between species, we converted
taxonomic arrangements (species, genus, subfamily, family, order)
into a tree using the R library APE [31]. Branch lengths were
assigned using Grafen’s method based on number of descendant
observed taxonomic units, followed by Grafen’s r transform using
r= 1 [32]. For comparative purposes, we also performed standard
CANCORS (i.e. without accounting for phylogeny). All CAN-
CORs (both including and excluding phylogeny) were performed
using the R package ‘phytools’ [33]. Because we obtained similar
results, we report here only those achieved accounting for
phylogeny. Amount of variance in the set of dependent variables
explained by that of independent variables was evaluated using
redundancy analysis. Effects of dependent and independent
variables on the respective canonical variates were evaluated by
examining canonical loadings. To obtain robust CANCOR results
the observations:variables ratios should be of at least 10:1 [34,35].
This requirement was fully satisfied in our study, with a ratio
larger than 1000:1 for the marine dataset, and larger than 100:1
for the freshwater dataset.
In addition to the main subdivision between freshwater and
marine species, we used a more detailed ecological categorization
and performed separate CANCORs for each of the following ten
categories using data from Fishbase [12]:
1) Marine migratory (including oceanodromous, anadromous,
catadromous, potamodromous, amphidromous species);
2) Marine non migratory;
3) Marine demersal (including demersal, benthopelagic, and
bathydemersal);
4) Marine reef-associated;
5) Marine pelagic (including bathypelagic, pelagic-neritic and
pelagic-oceanic);
6) Freshwater migratory (including amphidromous, potamo-
dromous, anadromous, catadromous, oceanodromous);
7) Freshwater non migratory;
8) Freshwater demersal (including demersal and benthopela-
gic);
9) Freshwater pelagic (including pelagic-neritic and pelagic).
10) Brackish
Results
Frequency distribution plots of geographic range sizes expressed
as area of occupancy (AOO) revealed that most geographic ranges
tend to be relatively small in both marine and freshwater fish
species (Fig. 1). Similar patterns were observed using extent of
occurrences (EOO) (Fig. 2–3). Moreover, the use of the product of
longitudinal and latitudinal ranges of species distribution (Fig. 2) or
its decomposition in longitudinal and latitudinal ranges (Fig. 3)
produced similar right skewed distributions for both marine and
freshwater species. Plots of AOO against EOO for both marine
and freshwater fishes (Fig. 4) showed that most species tend to have
an AOO much smaller than the respective EOO.
Figure 6. Relationship between fish species maximum body length and area of occupancy (AOO). Both variables are logarithmicallytransformed (A: freshwater dataset; B: marine dataset).doi:10.1371/journal.pone.0049465.g006
Fish Range Size and Colonization Ability
PLOS ONE | www.plosone.org 5 November 2012 | Volume 7 | Issue 11 | e49465
Canonical Correlation Analysis (CANCOR) revealed strong
correlations between range size and various fish traits, including
maximum length, growth rate, age at first maturity, life span and
trophic level. CANCOR results obtained using a combined
measure of EOO (given by latitude range 6longitude range) and
those obtained by decomposing it in two separate measures of
latitudinal and longitudinal range were almost identical. Therefore
we report only the results for the combined EOO measure
(Tables 1 and 2).
In both marine and freshwater species, canonical correlation
coefficients for the two dimensions were significant (P,0.0001).
However, because a large number of observations could produce
artificially low probability values for the canonical correlation
coefficients, it was important to focus on the canonical roots. For
both datasets, canonical roots indicated that the first dimension
was particularly important. This was confirmed by the corre-
sponding redundancy indexes, which indicated that the indepen-
dent variables explained a substantial portion of variance of the
dependent variables.
Canonical loadings of fish traits for the first and the second
dimensions showed strict correlations between freshwater and
marine datasets (Spearman coefficients r = 0.943, P,0.005 in both
cases), thus indicating similar responses in marine and freshwater
species. Canonical loadings of the first canonical dimension
indicated that frequency of occurrence is the most influential
parameter affecting fish range size in the overall data set and in the
marine species, also being important for the freshwater species.
Body length was the most important parameter in the freshwater
data set, and the second most important parameter in the total and
marine datasets. The importance of this variable was also shown
by the second dimension. Although results associated with the
second dimension should be considered with caution, it is
important to note that area of occupancy was mainly associated
with the first dimension, whereas, the extent of occurrence was
mainly associated with the second dimension in the overall and
marine datasets. The signs of the canonical loadings suggest that
the influence of the parameter K (growth rate) on species
distribution is opposite to those of all the other parameters (see
also Fig. 5). Therefore, CANCOR results indicate that for both
freshwater and marine fish species, range size is positively related
to frequency of occurrence, body size, life span, age at first
maturity and trophic level, whereas low growth rate is associated
with narrower range size.
When species were subdivided into narrower ecological groups,
CANCORs produced substantially similar results (Fig. 5, Infor-
mation S1 and S2). For freshwater species, area of occupancy was
mainly correlated with the first dimension in all ecological
categories. Similarly, extent of occurrence was mainly correlated
with the first dimension in all categories except for the non
migratory species, where there was a strong correlation with the
second dimension. The most important parameters highlighted by
the first dimension were maximum length (especially in demersal
and migratory species) and frequency of occurrence.
In the marine categories, area of occupancy was always strictly
correlated with the first dimension, whereas, the extent of
occurrence was correlated with the second dimension. The most
important parameters highlighted by the first dimension were
maximum length (especially in migratory species) and frequency of
occurrence (especially in non migratory species).
Discussion
One of the most documented macroecological patterns,
exhibited by terrestrial, freshwater and marine organisms in a
number of different ecosystems and geographical regions, is the
distinctively unimodal, right skewed frequency distribution of the
sizes of species geographical ranges [36,37]. Our results for
freshwater and marine fish species corroborate the idea that this
pattern is really ubiquitous also at the global scale, showing that
most fish species tend to have relatively small areas of occupancy,
latitudinal ranges, longitudinal ranges and extents of occurrence.
We obtained consistently similar frequency distribution patterns
independently from the particular measure of distribution size
used.
A fundamental relationship between area of occupancy and
extent of occurrence of a species is that area of occupancy, being
the space within the distributional limits of the species where its
populations actually occur, should always be smaller than extent of
occurrence [20]. Considering how we measured AOOs and
EOOs, the consistency of our results with this prediction is not
surprising. Yet, it is interesting to notice that in both marine and
freshwater fish, most species tend to have an area of occupancy
much smaller than their extent of occurrence (see Fig. 4), showing
that only a relatively small fraction of the area that lies within the
marginal limits of their distribution is really suitable and can be
successfully occupied.
In general, CANCOR results indicate that for both freshwater
and marine fish species, small-bodied species with high growth
rate, small populations, short life span, reduced age at first
maturity and low trophic level have a narrow range size. A positive
correlation between species local abundance and range size is well
documented in many taxa [38]. As our measure of frequency of
occurrence may reflect abundance, its influence in marine and
freshwater fish is not surprising, although we cannot definitively
exclude that our measure of our measure of frequency of
occurrence may also reflect study effort.
Besides the effect of frequency of occurrence, fish size emerged
as a major determinant of range size, especially for marine
migratory species. A positive correlation between body size and
range size has been previously observed at large scale for several
animal taxa [39], including a fish genus [40]. However, contrary
to previous findings [36,39], the spatial relationship between
log(range size) and log(body size) found in marine and freshwater
fish is not triangular, since not only small sized, but also many
medium to large sized species exhibit great variability in their
AOO values (see Fig. 6).
The overall positive correlations of range size with our measure
of frequency of occurrence and body size support previous
observations for the population size of North American Cen-
trarchidae and Catostomidae [41], broadening the relevance of
these patterns to a global scale and, more remarkably, extending
them to the marine realm.
Recent studies suggest that home-range size and dispersal ability
of terrestrial species tend to be associated because they are both
measures of species mobility [42,43]. Although some circumstan-
tial evidence has been reported [44], this association has not been
previously demonstrated for fish. Because body size is usually a
good predictor of home-range [45,46], our results provide some
indirect support to this association. In our analyses, range size was
defined using a measure of AOO and two distinct measures of
EOO. Despite the common assumption of superior accuracy of
AOO over EOO, both AOOs and EOOs are informative [20]. In
both freshwater and marine fishes, however, EOO resulted to be
less correlated with the independent variables than AOO.
The striking comparability of the results obtained for freshwater
and marine fishes suggests that the main biogeographical patterns
of fish in the marine and freshwater realms could be more similar
than commonly assumed. The study of which ecological traits of
Fish Range Size and Colonization Ability
PLOS ONE | www.plosone.org 6 November 2012 | Volume 7 | Issue 11 | e49465

fish species may influence their distribution is generally hampered
by a number of factors, including species introductions and adult
migrations. Marine fish introductions are common and can lead to
severe ecological consequences [38], but in general are difficult to
track. For example, unrecognized introductions can lead the
researcher to erroneously consider as cosmopolitan a species
which, in fact, has been introduced [39]. To avoid the
confounding effect of adult migrations, researches dealing with
fish ranges have been mostly focused on reef fish species, because
most of them have a sedentary adult life style, and suitable habitats
are considered sufficiently isolated to make colonization processes
only possible through larval migration [5]. However, the
geographic distance between reefs may be small compared to
larval drift distances, and only species that have limited larval drift
are really isolated. Thus, internal recruitment [10] and the lack of
habitat isolation in reefs [9] may introduce important biases.
Freshwater species are even more problematic because of the role
played by geographical constraints and hydrographic events in
their range expansion [7] and by human introductions. However,
these problems did not affect the aim of our study. We were
interested in searching for those species traits which concur to
determine colonization ability and hence regulate range size. In
doing so, we were not concerned to establish if a given occurrence
was due to a native or an introduced population, or if it was due to
hydrographic events or adult migrations, because any species
which reaches a new area would face similar difficulties to succeed
in colonization independently from how it gets there. Thus, the
relationships between range size and species traits found in our
study cannot be associated with particular mechanisms of
dispersal, but reflect the influence of species colonization ability.
One might object that human assisted translocation has been an
overwhelmingly greater mechanism for dispersal in freshwater as
opposed to coastal marine fish communities, and that a
comparison of the colonization ability of these two groups of
fishes is confounded by that phenomenon. However our analysis
showed that omitting species known to be subject to introduction
does not alter the results, thus we think that the patterns found in
this study are ‘‘natural’’.
The amount of analysed freshwater fishes for pelagic and non
migratory categories was much smaller than the species used for
marine categories, which might have biased some particular results
of our study. Thus, it would be important, in the future, to test
especially freshwater fish data for potential bias in data accuracy,
for example using representative samples of continent specific and
lentic vs. lotic fish communities. However, the very large total
number of freshwater species considered in this study and the high
concordance of results obtained for freshwater species with
different ecologies, suggests that such biases do not have a strong
influence on our general conclusions.
Supporting Information
Information S1 Results of canonical correlation analy-sis (CANCOR) for freshwater fish species divided intoecological categories.(PDF)
Information S2 Results of canonical correlation analy-sis (CANCOR) for marine fish species divided intoecological categories.(PDF)
Acknowledgments
We are grateful to Christopher Fulton, Brendan Ebner, Julian Caley and
an anonymous reviewer for their very constructive comments on a previous
version of this paper.
Author Contributions
Conceived and designed the experiments: GS SF SM DS PG. Performed
the experiments: GS. Analyzed the data: GS. Wrote the paper: GS SF.
References
1. Brown J-H, Stevens GC, Kaufman DM (1996) The geographic range: size,
shape, boundaries, and internal structure. Annu Rev Ecol Evol S 27: 597–623.
2. Ruesink J-L (2005) Global analysis of factors affecting the outcome of freshwater
fish. Conserv Biol 19: 1883–1893.
3. Lasram FBR, Tomasini JA, Romdhane MH, Chi TD, Mouillot D (2009)
Historical colonization of the Mediterranean sea by Atlantic fishes: do biological
traits matter? Hydrobiologia 607: 51–62.
4. Riginos C, Victor BC (2001) Larval spatial distributions and other early life-
history characteristics predict genetic differentiation in eastern Pacific blennioid
fishes. P Roy Soc B-Biol Sci 268: 1931–1936.
5. Lester S, Ruttenberg B (2005) The relationship between pelagic larval duration
and range size in tropical reef fishes: a synthetic analysis. P Roy Soc B-Biol Sci
272: 585–591.
6. Kinlan BP, Gaines SD, Lester SE (2005) Propagule dispersal and the scales of
marine community process. Divers Distrib 11: 139–148.
7. Olden J, Kennard M, Leprieur F, Tedesco P, Winemiller K, et al. (2010)
Conservation biogeography of freshwater fishes: recent progress and future
challenges. Divers Distrib 16: 496–513.
8. Palumbi S (1999) The prodigal fish. Nature 402: 733–735.
9. Mora C, Treml E, Roberts J, Crosby K, Roy D, et al. (2012) High connectivity
among habitats precludes the relationship between dispersal and range size in
tropical reef fishes. Ecography 35: 89–96.
10. Mora C, Sale P (2002) Are populations of coral reef fishes open or closed?
Trends Ecol Evol 17: 422–428.
11. Luiz O, Madin J, Robertson D, Rocha L, Wirtz P, et al. (2011) Ecological traits
influencing range expansion across large oceanic dispersal barriers: insights from
tropical Atlantic reef fishes. P Roy Soc B-Biol Sci 279: 1033–1040.
12. Froese R, Pauly D (2011) FishBase. world wide web electronic publication.
Available: http://www.fishbase.org/. Accessed 2012 Aug 4.
13. Vanden-Berghe E (2011) The ocean biogeographic information system: web
pages. Available: http://www.iobis.org/. Accessed 2012 Aug 4.
14. Mora C, Tittensor DP, Myers RA (2008) The completeness of taxonomic
inventories for describing the global diversity and distribution of marine fishes.
P Roy Soc B-Biol Sci 275: 149–155.
15. Robertson DR (2008) Global biogeographical databases on marine fishes: caveatemptor. Divers Distrib 14: 891–892.
16. O’Dor R, Miloslavich P, Yarincik K (2010) Marine biodiversity and
biogeography regional comparisons of global volumes, an introduction. PLoSONE 5: e11871.
17. Tittensor DP, Mora C, Jetz W, Lotze HK, Ricard D, et al. (2010) Global
patterns and predictors of marine biodiversity across taxa. Nature 466: 1098–1101.
18. Webb TJ, Vanden Berghe E, O’Dor R (2010) Biodiversity’s big wet secret: The
global distribution of marine biological records reveals chronic under-
exploration of the deep pelagic ocean. PloS ONE 5: e10223.
19. Tyler EHM, Somerfield PJ, Vanden-Berghe E, Bremner J, Jackson E, et al.
(2012) Extensive gaps and biases in our knowledge of a well-known fauna:
implications for integrating biological traits into macroecology. Global EcolBiogeogr 21: 922–934.
20. Gaston KJ, Fuller RA (2009) The sizes of species geographic ranges. J Appl Ecol
46: 1–9.
21. Perry A, Low P, Ellis J, Reynolds J (2005) Change and distribution shifts in
marine fishes. Science 308: 1912.
22. Froese R, Pauly D (2000) Fishbase 2000: Concepts, Design and Data Sources.
ICLARM–Los Banos, Philippines.
23. Thompson B (1991) A primer on the logic and use of canonical correlation
analysis. Meas Eval Counsel Dev 24: 80–95.
24. Hair JF, Black WC, Babin BJ, Anderson RE (2006) Multivariate Data Analysis.Prentice Hall, NJ.
25. Wilk M, Gnanadesikan R (1968) Probability plotting methods for the analysis of
data. Biometria 55: 1–17.
26. Penas E, Gonzalez G (1983) Relationships between benthic infauna andenvironmental factors in three beaches of the Ria de Arosa embayment (Spain)
using canonical correlation analysis. J Exp Mar Biol Ecol 68: 245–256.
27. Rizzo ML, Szekely GJ (2011) energy: E-statistics (energy statistics). Available:http://CRAN.R-project.org/package = energy. R package version 1.4–0. Ac-
cessed 2012 Aug 4.
28. Rizzo M, Szekely G (2005) A new test for multivariate normality. J Multivariate
Anal 93: 58–80.
Fish Range Size and Colonization Ability
PLOS ONE | www.plosone.org 7 November 2012 | Volume 7 | Issue 11 | e49465

29. Felsenstein J (1985) Phylogenies and the comparative method. Am Nat 125: 1–
15.
30. Revell LJ, Harrison AS (2008) PCCA: a program for phylogenetic canonical
correlation analysis. Bioinformatics 24: 1018–1020.
31. Paradis E, Claude J, Strimmer K (2004) APE: analyses of phylogenetics and
evolution in R language. Bioinformatics 20: 289–290.
32. Grafen A (1989) The phylogenetic regression. Philos Trans R Soc Lond B Biol
Sci 326: 119–157.
33. Revell LJ (2012) phytools: an R package for phylogenetic comparative biology
(and other things). Methods Ecol Evol 3: 217–223.
34. Barcikowski R, Stevens JP (1975) A Monte Carlo study of the stability of
canonical correlations, canonical weights, and canonical variate-variable
correlations. Multivar Behav Res 10: 353–364.
35. Stevens J (1986) Applied multivariate statistics for the social sciences. Lawrence
Erlbaum Associates–Mahwah, NJ.
36. Jones GP, Caley MJ, Munday PL (2002) Rarity in communities of coral reef
fishes. In Sale PF, editor. Coral Reef Fishes: dynamics and diversity in a complex
ecosystem. Academic Press. 81–102.
37. Gaston KJ (2003) The structure and dynamics of geographic ranges. Oxford
University Press, Oxford, UK.
38. Holt RD, Lawton JH, Gaston KJ, Blackburn TM (1997) On the relationship
between range size and local abundance: back to basics. Oikos 78: 183–190.39. Gaston KJ, Blackburn TM (1996) Conservation implications of geographic
range size-body size relationships. Conserv Biol 10: 638–646.
40. Taylor C, Gotelli N (1994) The macroecology of Cyprinella: correlates ofphylogeny, body size and geographic range. Am Nat 144: 549–569.
41. Pyron M (1999) Relationships between geographical range size, body size, localabundance, and habitat breadth in north american suckers and sunfishes.
J Biogeogr 26: 549–558.
42. Bowman J, Jaeger JAG, Fahrig L (2002) Dispersal distance of mammals isproportional to home range size. Ecology 83: 2049–2055.
43. Bowman J (2003) Is dispersal distance of birds proportional to territory size?Can J Zool 81: 195–202.
44. Holt RD, Lawton JH, Gaston KJ, Blackburn TM (1997) On the relationshipbetween range size and local abundance: back to basics. Oikos 78: 183–190.
45. Minns CK (1995) Allometry of home range size in lake and river fishes.
Can J Fish Aquat Sci 52: 1499–1508.46. Woolnough DA, Downing JA, Newton TJ (2009) Fish movement and habitat
use depends on water body size and shape. Ecol Freshw Fish, 18: 83–91.47. McNab B (1963) Bioenergetics and the determination of home range size. Am
Nat 894: 33–140.
Fish Range Size and Colonization Ability
PLOS ONE | www.plosone.org 8 November 2012 | Volume 7 | Issue 11 | e49465