Growth efficiencies of freshwater bacterioplankton
16
Microb Ecol (1992) 24:145-160 MICROBIAL ECOLOGY © 1992Springer-VerlagNew York Inc. Growth Efficiencies of Freshwater Bacterioplankton Klaus Kristiansen, 1 Helle Nielsen,t Bo Riemann, 1 and Jed A. Fuhrman 2 1The International Agencyfor 14C Determination, The Water Quality Institute, DK-2970 Hcrsholm, Denmark; and 2Departmentof Biological Sciences, Universityof Southern California, Los Angeles, California 90089-0371 Received: October 11, 1991; Revised: March 9, 1992 Abstract. The growth efficiency of freshwater bacteria was examined in continuous cultures. One series of experiments was carried out using genera- tion times from 50 to 200 hours and aged, normal, and enriched media, all of natural origin. Another series of experiments examined the bacterial growth efficiency during the growth season in eutrophic Frederiksborg Slotss¢, in relation to changes in the planktonic communities and to factors controlling the bacterial incorporation of 3H-thymidine. Attachment of bacteria to the inner surfaces of the experimental flasks was examined using various types of bot- tles, adding glass tubes to the bottles, and measuring 3H-thymidine incorpora- tion and direct cell counts of attached and free-living bacteria. Attachment of bacteria varied, and in one example up to 36% of the thymidine incorporation was by attached bacteria after 4 days. It was calculated that 36% of attached bacteria caused an underestimation of the growth efficiency of 11%. The mean growth efficiency tended to decrease with generation time using enriched medium (47 to 19%) and aged medium (35 to 12%), and tended to decrease with medium quality (enriched > normal > aged media) from 37% to 27%. The only significant difference in growth efficiency occurred in relation to generation time, in samples with enriched medium (unpaired t-test, P < 0.05). The overall mean value for all generation times and media was 30% (SEM = 3%, n = 24). From April to October, the growth efficiency was determined 5 times in samples from Frederiksborg Slotss¢. The overall mean value was 31% (SEM = 3%, n = 30), and there was no significant change in the growth efficiency during the period measured. In June, three bioassay experiments revealed that carbon limitation controlled bacterial incorporation of~H-thymidine, whereas additions of phosphate and nitrate did not change the incorporation rates. The narrow range of growth efficiencies obtained in this study (mean 31%, SEM = 2%, n = 54) suggests that changes in substrate quality in the media applied and in the eutrophic samples examined causes only subtle changes in the growth efficiency. Introduction Heterotrophic bacteria are an important component of planktonic communities and represent a major pathway for the flux of organic matter in marine and limnic pelagic ecosystems [9]. Although the phytoplankton biomass dominates in many
-
Upload
independent -
Category
Documents
-
view
3 -
download
0
Transcript of Growth efficiencies of freshwater bacterioplankton

Microb Ecol (1992) 24:145-160 MICROBIAL ECOLOGY © 1992 Springer-Verlag New York Inc.
Growth Efficiencies of Freshwater Bacterioplankton
Klaus Kristiansen, 1 Helle Nielsen,t Bo Riemann, 1 and Jed A. Fuhrman 2
1The International Agency for 14C Determination, The Water Quality Institute, DK-2970 Hcrsholm, Denmark; and 2Department of Biological Sciences, University of Southern California, Los Angeles, California 90089-0371
Received: October 11, 1991; Revised: March 9, 1992
Abstract. The growth efficiency of freshwater bacteria was examined in continuous cultures. One series of experiments was carried out using genera- tion times from 50 to 200 hours and aged, normal, and enriched media, all of natural origin. Another series of experiments examined the bacterial growth efficiency during the growth season in eutrophic Frederiksborg Slotss¢, in relation to changes in the planktonic communities and to factors controlling the bacterial incorporation of 3H-thymidine. Attachment of bacteria to the inner surfaces of the experimental flasks was examined using various types of bot- tles, adding glass tubes to the bottles, and measuring 3H-thymidine incorpora- tion and direct cell counts of attached and free-living bacteria. Attachment of bacteria varied, and in one example up to 36% of the thymidine incorporation was by attached bacteria after 4 days. It was calculated that 36% of attached bacteria caused an underestimation of the growth efficiency of 11%. The mean growth efficiency tended to decrease with generation time using enriched medium (47 to 19%) and aged medium (35 to 12%), and tended to decrease with medium quality (enriched > normal > aged media) from 37% to 27%. The only significant difference in growth efficiency occurred in relation to generation time, in samples with enriched medium (unpaired t-test, P < 0.05). The overall mean value for all generation times and media was 30% (SEM = 3%, n = 24). From April to October, the growth efficiency was determined 5 times in samples from Frederiksborg Slotss¢. The overall mean value was 31% (SEM = 3%, n = 30), and there was no significant change in the growth efficiency during the period measured. In June, three bioassay experiments revealed that carbon limitation controlled bacterial incorporation of~H-thymidine, whereas additions of phosphate and nitrate did not change the incorporation rates. The narrow range of growth efficiencies obtained in this study (mean 31%, SEM = 2%, n = 54) suggests that changes in substrate quality in the media applied and in the eutrophic samples examined causes only subtle changes in the growth efficiency.
Introduction
Heterotrophic bacteria are an important component of planktonic communities and represent a major pathway for the flux of organic matter in marine and limnic pelagic ecosystems [9]. Although the phytoplankton biomass dominates in many
146 K. Kristiansen et al.
eutrophic environments [36], the bacterial biomass exceeds the phytoplankton biomass two to three times in oligotrophic oceanic waters [8]. This trophodynamic structure of the plankton communities has significant implications for our under- standing of the pelagic cycling of organic matter in microbial food webs.
Growth efficiency and net production must be determined to quantify the carbon demand for atrophic level. The growth efficiency for heterotrophic bacteria has not yet been well documented. Traditionally, carbon conversion efficiencies of 50- 60% have been used [13, 35, 36], but a much wider range of carbon conversion efficiencies (40-90%) have been reported when pure cultures were used [2, 22, 44]. Most of these values were based on measurements of bacterial uptake and respiration of radiolabeled substrates during few (2-6) hours of incubation [ 10].
Extrapolation of results from experiments using radiolabeled substrates is diffi- cult, because these substrates commonly constitute 10-25% (but in some cases only 0.1% of the dissolved matter) available for bacterial decomposition [29]. In addi- tion, the short time of incubation minimizes the respiration loss of carbon. Thus, the growth efficiencies of cultures grown on simple substrates are not necessarily identical to the overall growth efficiencies of cultures grown on complex natural substrates. Bacterial growth efficiencies in the range 6-33% have been obtained in microcosm experiments using natural seawater and a variety of plant debris [26, 30, 42]. BjCrnsen [6] obtained an average growth efficiency of 20% using a continuous culture setup, natural bacterioplankton, and natural seawater as medium. The continuous culture setup makes it possible to measure bacterial net production and respiration directly, independent of radiolabeled substrates. Furthermore, this con- cept allows the measurement of changes in bacterial growth rate, caused by chang- ing the medium flow to the bacterial assemblages. Bjcrnsen found increasing growth efficiency with increasing generation time [6]. From a theoretical point of view, however, it is expected that decreasing growth efficiency is linked to increas- ing generation time because of a constant maintenance carbon demand [39]. Exper- iments using natural substrates often lead to lower values for bacterial growth efficiency [5] than those based on single substrates. Linley and Newell [27] sug- gested a substrate quality hypothesis, that overall bacterial growth efficiency is coupled to the quality of the substrate (i.e., the C:N-ratio and the molecular complexity) and the supply of inorganic nutrients (particularly nitrogen).
The aim of this study was to evaluate the carbon conversion efficiency of natural populations of freshwater bacteria by means of a direct method (continuous culture).
The following experiments were carried out: (a) Bacterial attachment to the walls of the experimental bottles was evaluated (b) An experiment was designed to evaluate the correlation between the growth efficiency and the quality of the medium; (c) The experiment also examined the correlation between growth effi- ciency and generation time of the culture; (d) A series of continuous cultures were run to evaluate seasonal changes in the growth efficiency of bacteria in eutrophic Fredericksborg Slotss¢.
Materials and Methods
Locations
Frederiksborg Slotss¢ is a small eutrophic lake situated in the city of HillerCd, Denmark (12°18'E, 55°57'N). The surface area is 21 ha, and the volume is 640,000

Growth Efficiency of Freshwater Bacterioplankton 147
0 100 200m x : s t a t i o n I . Fig. 1. Diagram of Frederiks- borg Slotss¢ with station I.
m 3. The average depth is 3.1 m, the maximum depth is 8 m (Fig. 1), and 75% of the lake is less than 4 m deep. The lake receives water from a drainage area of approximately 660 ha. A temperature stratification usually occurs at 4-5 m during May-September [1]. Samples from three other localities were used in a bacterial attachment experiment (see below): Lake Sjmls0, a small eutrophic lake (12°25'E, 55°52'N), and two coastal marine stations: Rungsted (12°32'E, 55°53'N) and Hundested (11°51 'E, 55°58'N).
Water samples were collected from Frederiksborg Slotss¢, station I (Fig. 1) from 1 m depth using a 5-liter Plexiglas water sampler, between 10 and 11A.M. every two weeks from April to September. Temperature and oxygen were measured every meter from the surface to 8 m, with a temperature/oxygen probe (Yellow Spring Instruments model 58).
Experimental Setup
The experimental setup was that described by Bj0rnsen [6] with minor modifica- tions. Water samples were taken from Frederiksborg Slotss¢, station I at 1 m depth (Fig. 1). Water for inocula preparation was filtered through 1-txm Nuclepore filters at low vacuum (< 150 mmHg), and treated with cycloheximide (I00 mg liter- 1) for 2 hours to prevent growth of eucaryotes [16]. A 30-ml subsample was used as inoculum for each culture.
Water for media preparation was filtered through Whatman GF/C-filters and then through a 0.2 Ixm Gelman Minicapsule filter within 2 hours after sampling. To convert all DIC to free CO2, pH was lowered to 2.5 using 1N H2SO 4. The acidified water was bubbled with CO2-free air for 3 hours until total DIC was below 0.05 mM. The water was then adjusted to the ambient pH with a dilute Tris buffer

148 K. Kristiansen et al.
(Trizma Base No. T-1503) and finally filtered through a 0.2-~m Gelman Minicapsule filter or autoclaved (20 rain, 121°C, 1 atm. superpressure). Autoclaving was used in August and September. Three media were prepared: (a) An enriched medium, with added inorganic nitrogen (KNO3) and phosphorus (KHzPO4) and organic carbon (glucose), to give a C:N:P ratio of 8:2:1. (b) An aged medium, filtered through Whatman GF/C filters, then placed in the dark at 20°C for 6 days. The water was refiltered through Whatman GF/C filters and placed in the dark at 20°C for 4 days, before the 0.2-1xm filtration, to reduce the labile pool of dissolved organic carbon. (c) A normal medium, kept untreated except for filtering and lowering of DIC. We assumed that the treatment of the media did not affect the growth of the bacteria.
Continuous Culture System
Two 300-ml culture bottles (each containing 30 ml of inoculum and 270 ml medium) for each medium were incubated in a shaking bath (100 agitations per min) at the in situ temperature. Medium inflow to the culture bottles was controlled by peristaltic pumps (Ismatec IPS8). The cultures were allowed to grow as batches for two days before the flow was turned on. The cultures were checked for steady state growth by counting cell numbers using epifluorescent microscopy. If cell number varied more than 10% between two samples, the culture was considered to be out of steady state. No sonification [6] was used to prevent bacterial attachment to the walls of the experimental bottles. Instead, an experiment was designed to quantify the attachment.
Inorganic and Particulate Carbon
Samples for inorganic carbon were taken from medium (blanks) and culture bottles with 1 ml syringes. Triplicates of 100 p3 were injected into a chamber containing 3% HNO 3, bubbled by a nitrogen flow that led the released CO2 to an infrared gas analyzer (model 225 MK 3, Analytical Development Company). The signal was integrated over periods of 75 sec from the injection of the sample. The measure- ments were calibrated with solutions of KHCO 3. Because it was necessary to preserve DIC samples for as long as 20 days, a preservation method was developed. Among different fixatives tested, HgCI 2 (>5 <7 mg liter-1) was chosen, and was used for preservation of samples for up to 20 days. Samples for particulate organic carbon (POC) analysis were taken from medium and overflow accumulation bot- tles. Triplicate subsamples of 5 ml were filtered onto precombusted Whatman GF/F filters (l 3 ram) and kept frozen until the POC determination could be carried out. No correction were made for possible losses of bacteria passing through the filters. We assumed that these losses did not affect the measurements significantly [25]. The dry filters were combusted at 600°C in a quartz tube furnace in an oxygen flow leading to the infrared gas analyzer. The measurements were calibrated against solutions of glucose or sodium hydrogen phthalate.
The growth efficiency Y was calculated according to the formula:
APOC y = APOC + ADIC

Growth Efficiency of Freshwater Bacterioplankton 149
where APOC is the difference in particulate organic carbon between medium and overflow collection bottles, ADIC is the difference in inorganic carbon between medium and culture bottles. Leakage of CO2 through the tygon tubes has been estimated to 38 ~gC hour-1 m-1 [6], and would in the worst example change the growth efficiency 1.6%, so no corrections for leakage were carried out.
Two experiments were carried out. In the first experiment, a series of flowrates, 12.0, 5.5, 3.2, and 1.5 ml hour -1 , were run for each culture to achieve generation times of 25, 55, 95, and 195 hours, respectively, for the bacterial cultures. En- riched, normal, and aged media were used in this experiment. In the second experiment, only the normal medium was used, and the generation time was kept constant. The generation time was chosen from the ambient temperature, according to [35], and the chemical and biological parameters measured in Frederiksborg Slotss¢ were used to characterize medium quality.
Attachment of Bacteria to the Walls of the Experimental Bottles
Batch cultures of 0.8 ~xm filtered water from Frederiksborg Slotss¢, Lake Sj~els¢, Rungsted, and Hundested (May 1989) were incubated in four glass bottles. Start and end values (after 48 hours) of the number of bacteria and CO2 concentration were measured. The 3H-thymidine incorporation rates of free-living3and attached bacteria were measured according to the following procedure: 10 nM H-thymidine was added to each bottle, and after 30 min of incubation, the water was extracted into ice-cold TCA and into hot TCA, according to Fuhrman and Azam [14], and as slightly modified by Riemann [37]. After the experimental water was removed from the bottles, the bottles were rinsed with agitation three times with 0.8 txm filtered lake water, and the radioactivity in the attached bacteria as extracted in ice-cold 5% TCA for 5 rain. Subsamples from the total TCA precipitate were removed, and the remaining TCA was heated to 95°C for 1 hour. All samples were filtered onto 0.45 Ixm Sartorius cellulose-acetate membrane filters 25 mm in diam- eter, rinsed with ice-cold TCA, and put into glass vials to which was added 1 ml of ethyl acetate. After 10 min in the dark, 10 ml of scintillation cocktail (Lumac, Aqualyte) was added, and radioactivity was measured after 24 hours of storage in the scintillation counter (Rackbeta LKB Vallac). Quench correction was carried out by the external standard ratio. The calculated growth efficiency was corrected for attached bacteria by correcting the number of cells produced by the percentage of attached bacteria found by the distribution of 3H-thymidine. In a subsequent exper- iment, the percentage distribution of the 3H-thymidine incorporation was compared with the distribution of the number of cells found on the inner surface of the experimental bottles, which were broken with a hammer after the experiment. Small glass pieces were stained with Acridine Orange, and the number of bacteria were determined by epifluorescence microscopy. In a final series of experiments, small glass tubes with a surface area 1.7% of that of the bottles were added to 0.8 Ixm lake water filtrates added to 100-ml glass bottles and incubated for periods up to 96 hours. 3H-thymidine (10 nM) was added after 2 days and 4 days, and incorpora- tion into cold TCA in the water and on the glass tubes were measured, and total attached radioactivity was calculated in proportion to the surface areas of tubes and flasks.

150 K. Kristiansen et al.
Inorganic Nutrients
Ammonia [41], nitrate [11], and phosphate [28] were analyzed by published meth- ods. All chemical analyses were initiated within 2 hours after sampling and carried out in duplicate.
Phytoplankton
Chlorophyll a was extracted from the phytoplankton overnight in 96% ethanol and measured spectrophotometrically without correction for degradation products [21 ]. Water samples 100 ml from each depth, were fixed with Lugol's fixative (0.4% final concentration) and later used for taxonomic identification of phytoplankton using an inverted microscope.
Zooplankton
Zooplankton > 140 txm were collected by selective filtration from 2 liter samples taken from 1 m, 3 m, 5 m, and 7 m depth through a 140-1xm mesh size plankton net and fixed with 70% ethanol. Generally, two to three subsamples were counted in an inverted microscope, but when less than 100 individuals were counted, the animals in the entire sample were enumerated. Animals were identified as to species, and the dry weight was determined by weighing 100 individuals on an electrobalance after drying at 60°C for 24 hours. Carbon was assumed to constitute 50% of the dry weight.
Bacterioplankton
Enumeration of bacteria was carried out by means of epifluorescence microscopy using acridine orange staining [19]. Cell number was converted to carbon biomass by multiplying by an average cell volume of 0.11 ixm 3 [K. Christoffersen, B. Riemann, A. Klysner, and M. SCndergaard, submitted], and a carbon content of 0.35 pg txm -3 [7].
In a nutrient-limiting experiment, carried out 18 April, 16 May, 30 May, 13 June, and 27 June, three batches of natural bacterial assemblages (lake water, 1 Ixm filtered at low vacuum: < 150 mmHg), were enriched with C (350 txg C liter-~ as glucose), N (87.5 ixg N liter-1 as KNO3), and P (43.75 ~g P liter-~ as KH2PO4) in the ratio 8:2:1 and in the combinations of C + N, C + P, and N + P. In this way, it could be determined whether organic C, inorganic N, or inorganic P was the limiting nutrient for bacterial secondary production. One batch with no nutrient addition was used as a control. Bacterial secondary production was determined from 3H-thymidine incorporation into bacterial DNA [14]. On two occasions, production was measured at t = 0 (immediately after filtration) and t = 24 hours. On two occasions, production was measured at t = 0, and nine times with regular intervals during the subsequent three days, and on one occasion at t = 0 and t = 48 hours. 3H-thymidine was added to a final concentration of 15 nM and incubated at
Growth Efficiency of Freshwater Bacterioplankton 151
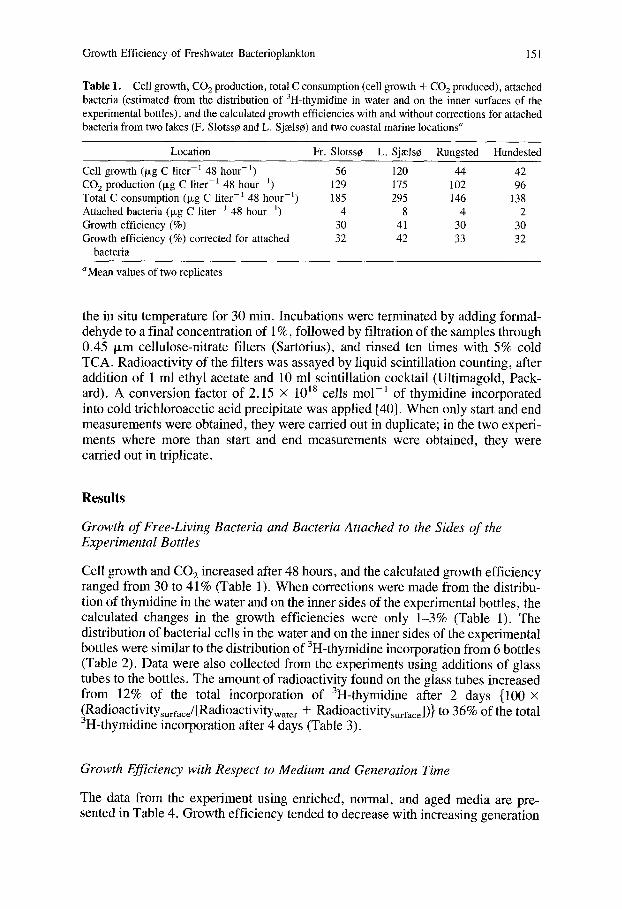
Table 1. Cell growth, CO 2 production, total C consumption (cell growth + CO 2 produced), attached bacteria (estimated from the distribution of 3H-thymidine in water and on the inner surfaces of the experimental bottles), and the calculated growth efficiencies with and without corrections for attached bacteria from two lakes (F, Slotss0 and L. Sjzels¢) and two coastal marine locations"
Location Fr. Slotss0 L. Sj~els¢ Rungsted Hundested
Cell growth (Ixg C liter -I 48 hour -L) 56 120 44 42 CO 2 production (Ixg C liter -1 48 hour -1) 129 175 102 96 Total C consumption (~g C liter -~ 48 hour 1) 185 295 146 138 Attached bacteria (p~g C liter -1 48 hour 1) 4 8 4 2 Growth efficiency (%) 30 41 30 30 Growth efficiency (%) corrected for attached 32 42 33 32
bacteria
aMean values of two replicates
the in situ temperature for 30 min. Incubations were terminated by adding formal- dehyde to a final concentration of 1%, followed by filtration of the samples through 0.45 Ixm cellulose-nitrate filters (Sartorius), and rinsed ten times with 5% cold TCA. Radioactivity of the filters was assayed by liquid scintillation counting, after addition of 1 ml ethyl acetate and 10 ml scintillation cocktail (Ultimagold, Pack- ard). A conversion factor of 2.15 x 10¹⁸ cells tool -a of thymidine incorporated into cold trichloroacetic acid precipitate was applied [40]. When only start and end measurements were obtained, they were carried out in duplicate; in the two experi- ments where more than start and end measurements were obtained, they were carried out in triplicate.
Results
Growth of Free-Living Bacteria and Bacteria Attached to the Sides of the Experimental Bottles
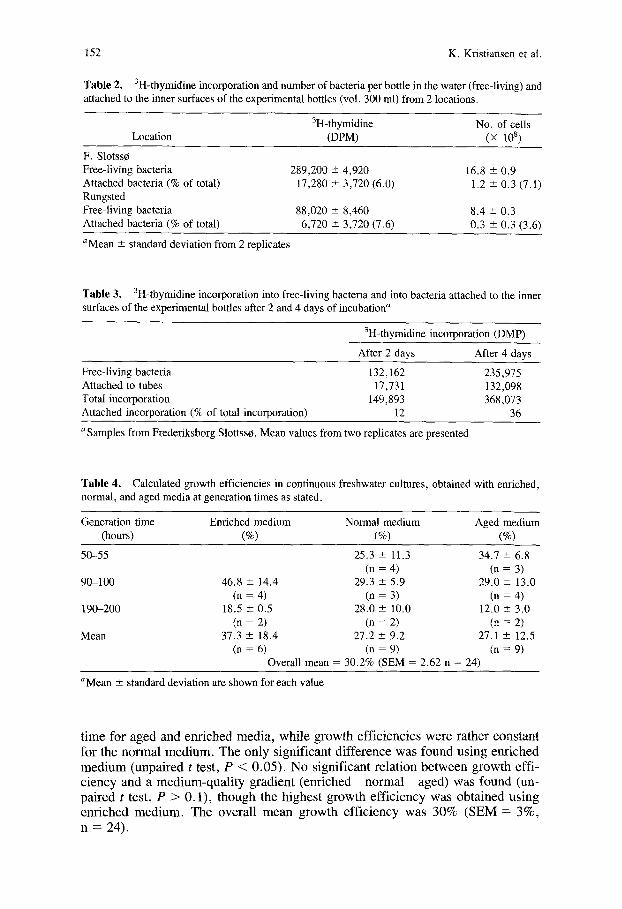
Cell growth and CO2 increased after 48 hours, and the calculated growth efficiency ranged from 30 to 41% (Table 1). When corrections were made from the distribu- tion of thymidine in the water and on the inner sides of the experimental bottles, the calculated changes in the growth efficiencies were only 1-3% (Table 1). The distribution of bacterial cells in the water and on the inner sides of the experimental bottles were similar to the distribution of 3H-thymidine incorporation from 6 bottles (Table 2). Data were also collected from the experiments using additions of glass tubes to the bottles. The amount of radioactivity found on the glass tubes increased from 12% of the total incorporation of 3H-thymidine after 2 days {100 × (Radioactivitysurrace/[Radioactivitywater + RadioactivitysurfaJ)} to 36% of the total 3H-thymidine incorporation after 4 days (Table 3).
Growth Efficiency with Respect to Medium and Generation Time
The data from the experiment using enriched, normal, and aged media are pre- sented in Table 4. Growth efficiency tended to decrease with increasing generation
152 K. Kristiansen et al.
Table 2. 3H-thymidine incorporation and number of bacteria per bottle in the water (free-living) and attached to the inner surfaces of the experimental bottles (vol. 300 ml) from 2 locations.
3H-thymidine No. of cells Location (DPM) (x 108)
F. Slotss¢~ Free-living bacteria 289,200 + 4,920 16.8 ± 0.9 Attached bacteria (% of total) 17,280 - 3,720 (6.0) 1.2 ± 0.3 (7.1) Rungsted Free-living bacteria 88,020 ± 8,460 8.4 ± 0.3 Attached bacteria (% of total) 6,720 -+ 3,720 (7.6) 0.3 ± 0.3 (3.6)
Mean ± standard deviation from 2 replicates
Table 3. 3H-thymidine incorporation into free-living bacteria and into bacteria attached to the inner surfaces of the experimental bottles after 2 and 4 days of incubation a
3H-thymidine incorporation (DMP)
After 2 days After 4 days
Free-living bacteria Attached to tubes Total incorporation Attached incorporation (% of total incorporation)
132,162 235,975 17,731 132,098
149,893 368,073 12 36
a Samples from Frederiksborg Slottss~. Mean values from two replicates are presented
Table 4. Calculated growth efficiencies in continuous freshwater cultures, obtained with enriched, normal, and aged media at generation times as stated.
Generation time Enriched medium Normal medium Aged medium (hours) (%) (%) (%)
50-55 25.3 --- 11.3 34.7 ± 6.8 (n = 4) (n = 3)
90-100 46.8 ± 14.4 29.3 --- 5.9 29.0 ~ 13.0 (n = 4) (n = 3) (n = 4)
190-200 18.5 ± 0.5 28.0 ± 10.0 12.0 ± 3.0 (n = 2) (n = 2) (n = 2)
Mean 37.3 ± 18.4 27.2 ± 9.2 27.1 +- 12.5 (n = 6) (n = 9) (n = 9)
Overall mean = 30.2% (SEM = 2.62 n = 24)
aMean ± standard deviation are shown for each value
t i m e fo r a g e d and en r i ched m e d i a , wh i l e g rowth e f f i c i enc i e s w e r e ra ther cons tan t fo r the n o r m a l m e d i u m . T h e on ly s ign i f ican t d i f f e rence was found us ing e n r i c h e d m e d i u m (unpa i red t test , P < 0 .05) . N o s ign i f i can t re la t ion b e t w e e n g rowth eff i - c i e n c y and a m e d i u m - q u a l i t y g rad ien t ( en r i ched n o r m a l aged) was found (un- pa i red t test , P > 0 .1) , t h o u g h the h ighes t g rowth e f f i c i e n c y was ob ta ined us ing e n r i c h e d m e d i u m . T h e ove ra l l m e a n g r o w t h e f f i c i ency was 30% ( S E M = 3 % ,
n = 24).

Growth Efficiency of Freshwater Bacterioplankton 153
T
20 Oxygen
5 i i i i i
0 A M J d A S 0 4OO
7_o1:~ 2O0 3O0 ~ ~ NOs - N
0
T
o~ CL
5O0
4OO
3O0
200
100
200
A M d d A S 0
NH,~ - N
A M d J A S 0
T
¢;n
150
100
50
i i i i i f
A M d d A S
Fig. 2. Seasonal changes in oxygen content, ammonia, nitrate, and phosphate at 1 m depth in Frederiksborg Slotss¢.
Oxygen, Temperature, Nutrients
The lake was stratified from the middle of May through August, with a thermocline around 5 m (Fig. 2) (Klans Kristiansen and Helle Nielsen, unpubl, data). Oxygen depletion was found below 5 m during the stratified period. The oxygen content varied from 8 to 16 mg O 2 liter-a during the sampling period, and the temperature was, except in April, greater than 10°C (Klaus Kristiansen and Helle Nielsen, unpubl, data). Low values of ammonia (<50 txg NH4 liter-a) occurred along with low values of nitrate. The average phosphate concentration during the season was 103 p~g P O 4 liter -1, ranging from 31 to 164 txg PO 4 liter -1.
Plankton
Chlorophyll a was below 50 txg liter-1 (Fig. 3) during April, May, and June and peaked in late July (189 Fxg liter-I). Diatoms (Stephanodiscus, Asterionella,

154 K. Kristiansen et al.
T
m
g L 0
6
C)
3 o E o
2OO
100
50
0
~ on
A M d d A S 0
8OO
6OO
4OO
200
0
1.000
~ Bacterla
i i i i i i A M d d A S 0
750
5OO
250
onkton
i i i i ~ i A M J d A S 0
Fig. 3. Seasonal changes in phytoplankton biomass (chlorophyll a concentration) and bacterial biomass at 1 m depth, and biomass of mesozooplankton > 140 p~m, integrated from 1, 3, 5, and 7 m depth in Frederiksborg Slotss¢.
Fragellaria) dominated during April. From May to the middle of June small green algae (Chlamydomonas, Scenedesmus, Pediastrum) dominated, followed by dom- inance of cyanobacteria (Microcystis > Aphanizomenon > Anaebaena) from July. Late in August, the cyanobacteria bloom decreased, and small green algae became more abundant.
The biomass of zooplankton (> 140 p~m) was calculated as the mean value for the entire water column (Fig. 3). The zooplankton biomass showed maximum values in April (914 Ixg C liter - ~), followed by a decrease until late June (116 ~zg C liter - ~). From July to September, the zooplankton biomass ranged between 200 and 400 Ixg C liter- ~. In April, May, and August, Cladocerans (Daphnia, Bosmina, Chydorus) dominated the community and constituted more than 50% of the zooplankton biomass. In June and July, Copepodes (Eudiaptomus, Cyclops, Diaptomus, nau- plia) dominated the biomass.
Bacterial biomass varied between 128 and 880 txg C liter-~ through the sampling period, with the largest fluctuations during April and May (Fig. 3). The limiting nutrient on May 30, June 13, and June 27 was found to be organic carbon (Fig. 4). The batch cultures with added carbon achieved, after 48 hours incubation, cell production rates (measured as 3H-thymidine incorporation) 1.8, 3.0, and 1.4 times higher than those with no carbon added (Fig. 4a, b, c, respectively). During incubation, the cell number increased from 5 × 10⁹ to 20--35 × 109 cells liter -~ (May 30, June 13) and from 17 x l 0 9 to 20-29 × l 0 9 cells liter- ~ (June 27). It was necessary to incubate for 48 hours, as a lag period of about 24 hours was found.

Growth Efficiency of Freshwater Bacterioplankton t55
4oo6°°2oo ~May 30. _
20 30 40 50
1.600 to o
1.200
X
..£2
'T 400
{0 -~ o U
600
400
200
June 13.
10 20 30 40 50
June 2 7 . ~
i i ;o 20 A ~o so Control C+N Hours C+P N+P D ---4b--- 0 x .
Fig. 4. Bioassays for determination of the limiting nutrient for bacterial growth. Bacterial secondary production measured by 3H-thymidine incorporation during 48 hours incubation in batch cultures with samples from Frederiksborg SlotssO. Combinations of inorganic P, inorganic N, and organic C were added on 30 May, 13 June, and 27 June.
The five calculated mean values of bacterial growth efficiencies obtained in Frederiksborg Slotss¢ (Fig. 5) ranged from 22 to 47%, but were not significantly different (unpaired t test P > 0, 1). The overall mean growth efficiency was 31% (SEM = 3%, n = 30). A high number of replicates (n = 14) were obtained in April because steady-state conditions during this experiment were established ear- lier than in the other experiments, where 3-5 replicates were obtained.
Discussion
In this study, we emphasize (a) experimental evidence for attachment of bacteria in the experimental setup, (b) the relationship between growth efficiency and genera- tion time, (c) the relationship between growth efficiency and the quality of the substrate, and (d) changes in the growth efficiency of bacteria from eutrophic Frederiksborg Slotss¢.
The continuous culture system is independent of any empirically determined and varying conversion factor, because net production and respiration are measured

50
4O
"-" 30
"U
20
10
o A M d d A S 0
Months
156 K. Kristiansen et al.
Fig. 5. Calculated mean growth efficiencies obtained from continuous cultures with samples from Frederiksborg Slotss¢ during April to October. Bars indicate SEM (n = 3-14).
directly. However, treatment of media (filtration, pH-lowering), inocula (addition of cycloheximide), and also attachment of bacteria to the walls of the experimental bottles might influence the bacterial assemblages.
Only minor attachment was found during 48 hours of incubation of glass bottles, at least with respect to the consequences for the calculated growth efficiency (Table 1). In the experiments using glass tubes, bacterial attachment, assumed to be represented by 3H-thymidine incorporation (Table 3), increased and comprised 36% of total incorporation after 4 days of incubation. Assuming a net carbon growth of 127 Ixg C and CO 2 production to be 175 Ixg C (Table 3), then 36% attachment would increase the net carbon growth to 198 Ixg C and the calculated growth efficiency from 42 to 53%. We did not correct our measured growth efficiencies for the presence of attached bacteria. In the worst example of attach- ment, the calculated growth efficiencies were underestimated by 11%.
Bacterial growth efficiency tended to decrease with increasing generation time, using enriched and aged media (Table 4). However, the normal medium showed no correlation between growth efficiency and generation time. Further, we do recog- nize the possibility that the lower values for bacterial growth efficiency, obtained at the longest generation times, possibly could be explained as an effect of bacterial attachment to the inner surfaces of the culture bottles. In fact, it was demonstrated (Table 3) that 12% and 36% of the 3H-thymidine incorporation was by attached

Growth Efficiency of Freshwater Bacterioplankton 157
bacteria after 2 and 4 days, respectively. Some of our experiments ran for 11 days, and we cannot rule out the possibility that bacterial attachment caused a severe underestimation of the bacterial growth efficiency. If this is the case, the tendency toward decreasing growth efficiency with increasing generation time would not be as pronounced. Thus, the theoretical chemostat model (one-species cultures), which suggests that growth efficiency decreases with increasing generation time, assuming constant carbon demand for maintenance [39], cannot be confirmed from our mixed cultures. It has been demonstrated that marine bacteria under starvation conditions are able to reduce their endogenous respiration rate to less than 1% of normal [31, 32, 33]. In natural systems, carbon demand for maintenance is thus not necessarily constant. Payne and Wiebe [34] showed in a chemostat setup that two species of bacteria had different affinities to the same limiting substrate with increasing generation time. In natural systems, changes in the substrate supply induce succession, favoring the bacteria best adapted to the actual medium compo- sition. The theory mentioned by Slater [39] is therefore not necessarily valid for natural systems.
The bacterial growth efficiency within the medium quality gradient present in this study did not change significantly, and the overall mean growth efficiency in both experiments was 31% (SEM = 2%, n = 54). Bacterial attachment, as dis- cussed above, would not change this narrow range of growth efficiency values. A microbial response to nutrient limitation is to utilize the limiting nutrient more efficiently [ 18]. We found organic carbon to be limiting for bacterial growth in June (Fig. 4). If that is the case throughout the summer, the growth efficiencies obtained in this period must be expected to be maximum values, according to [ 18].
From a theoretical point of view, bacterial growth efficiency is expected to vary with generation (heterotrophic as well as autotrophic) of labile DOC compounds, because simple compounds can be utilized without any investment of energy for the production of extracellular enzymes [22]. Growth efficiencies in the range of 60 to 90% obtained from experiments using 14C-labeled glucose and single amino acids [4, 10, 20, 43] confirm this expectation. Linley and Newell [27] suggested a substrate quality hypothesis, in which bacterial growth efficiency increased with improved substrate quality (i.e., the C:N-ratio and molecular complexity) and the supply of inorganic nutrients (especially nitrogen). However, measurements of bacterial growth efficiency from oxygen consumption and bacterial production (3H-thymidine incorporation) have given values ranging from 20 to 40% in two eutrophic lakes [38]. In the same study, however, a wide range of growth efficien- cies (9-66%) were obtained from enclosures, supplied with planktivorous fish and inorganic nutrients. In our second experiment, an increased release of labile DOC in August was assumed, because the bloom of cyanobacteria declined (Fig. 3). It has been demonstrated that cyanobacteria can lose up to 43% of their cellular carbon content as dissolved carbon within 24 hours after death [17]. In May, on the contrary, a low phytoplankton biomass, decreasing zooplankton biomass, and a low bacterial secondary production (Fig. 3) suggested a relatively lower release of labile DOC. A review of 70 studies [9] showed that bacterial production was significantly correlated to the phytoplankton biomass. Fuhrman et al. [15] con- cluded that zooplankton grazing plays a dominant role in supplying labile DOC for bacterial growth. The same conclusion was reached by Jumars et al. [23]. From this point of view, a higher growth efficiency could be expected in August than in May.

158 K. Kristiansen et al.
Nevertheless, the five mean growth efficiencies obtained from Frederiksborg Slotss¢ (Fig. 5) showed no significant differences. In addition, the results obtained in the experiment using enriched, normal, and aged media did not give any cou- pling between medium quality and growth efficiency (Table 4). Our results, and those presented in [38], suggest that the medium quality gradient [27] in the eutrophic lake examined here was not large enough to give significant differences in bacterial growth efficiencies.
The calculated mean growth efficiency of 31% obtained in this study is consistent with other measured mean bacterial growth efficiencies in the range of 20 to 30% [3, 5, 6, 38]. These studies used natural lake or seawater as substrate, except for one in which dissolved compounds of phytoplankton detritus, simulating the crash of a phytoplankton bloom, was used [3]. A carbon conversion efficiency of 50- 60% has frequently been used as a conservative estimate to calculate the bacterial carbon demand [13, 35, 36]. Our results, together with those cited above, suggest that a growth efficiency close to 30% is more reasonable in many aquatic environ- ments.
In conclusion, the role of attached bacteria in the experimental setup varied, suggesting that they can account for a substantial source of error in measurements of bacterial growth efficiencies. In our experiments, a maximum of 29% of the total bacterial thymidine incorporation was caused by attached bacteria. Such an error will result in a 9% underestimation of the growth efficiency. Our examination of the magnitude of growth efficiencies of natural bacterial assemblages suggests a nar- row range of variation with an overall mean value of 31% (SEM = 2, n = 54). This is lower than the 50% that is traditionally used in many ecological studies and implies that the bacterial carbon demand is higher than hitherto believed.
Acknowledgments. We thank W. Martinsen for technical assistance and K. G. Jensen for linguistic suggestions.
References
1. Andersen JM, Jacobsen OS (1979) Production and decomposition of organic matter in eutrophic Lake Frederiksborg Slotss¢, Denmark. Arch Hydrobiol 85:511-542
2. Azam F, Fenchel T, Gray JS, Meyer-Rell LA, Thingstad F (1983) The ecological role of water-column microbes in the sea. Mar Ecol Prog Ser 10:257-263
3. Baueffeind S (1985) Degradation of phytoplankton detritus by bacteria: Estimation of bacterial consumption and respiration in an oxygen chamber. Mar. Ecol. Prog. Ser. 21:27-36
4. Bell WH, Sakshaug E (1980) Bacterial utilization of algal extracellular products. 2. A kinetic study of natural populations. Limnol Oceanogr 25:1021-1033
5. Bell RT, Kuparinen J (1984) Assessing phytoplankton and bacterioplankton production during early spring in Lake Erken, Sweden. Appl Environ Microbiol 48:1221-1230
6. Bjcrnsen PK (1986a) Bacterioplankton growth yield in continuous seawater cultures. Mar Ecol Prog Ser 30:191-196
7. Bjcrnsen PK (1986b) Automatic determination of bacterioplankton biomass by means of image analysis. Appl Environ Microbiol 51:1099-1104
8. Cho BC, Azam F (1990) Biogeochemical significance of bacterial biomass in the ocean's euphotic zone. Mar Ecol Prog Ser 63:253-259

Growth Efficiency of Freshwater Bacterioplankton 159
9. Cole JJ, Findlay S, Pace ML (1988) Bacterial production in fresh and saltwater ecosystems: A cross-system overview. Mar Ecol Prog Ser 43; 1-10
10. Crawford CC, Hobbie GE, Webb KL (1974) The utilization of dissolved free amino acids by estuarine organisms. Ecology 55:551-563
1 l. Crosby NT (1967) The determination of nitrite in water using Cleve's acid, 1-naphtylamine-7- sulphonic acid. Proc Soc Wat Treat Exam 16:51
12. Fenchel T (1988) Marine plankton food chains. Ann Rev Ecol Syst 19:1%38 13. Fuhrman JA, Azam F (1982) thymidine incorporation as a measure of heterotrophic bacterioplank-
ton production in marine surface waters: Evaluation and field results. Mar Biol 66:109-120 14. Fuhrman JA, Azam F (1980) Bacterioplankton secondary production estimates for coastal waters
of British Columbia, Antarctica and California. Appl Environ Microbiol 39:1085-1095 15. Fuhrman JA, Ammerman JW, Azam F (1980) Bacterioplankton in the coastal euphotic zone:
Distribution, activity, and possible relationships with phytoplankton. Mar Biol 60:201-207 16. Fuhrman JA, McManus GB (1984) Do bacteria-sized marine eucaryotes consume significant
bacterial production? Nature (Lond) 310" 1257-1260 17. Hansen L, Krogh GF, SCndergaard M (1986) Decomposition of lake phytoplankton. 1. Dynamics
of short-term decomposition. OIKOS 46:37~-5 18. Harder W, Dijkhuizen L (1983) Physiological responses to nutrient limitation. Ann Rev Microbiol
37:1-23 19. Hobbie JE, Daley RJ, Jasper S (1977) Use of nucleopore filters for counting bacteria by fluores-
cence microscopy. Appl Environ Microbiol 33:1225-1228 20. Itturiaga R, Hoppe H-G (1977) Observations of heterotrophic activity on photoassimilated matter.
Mar Bio140:101-108 21. Jespersen A-M, Christoffersen K (1987) Measurements of chlorophyll a from phytoplankton using
ethanol as extraction solvent. Arch Hydrobiol 109:445-454 22. Joint IR, Morris RJ (1982) The role of bacteria in the turnover of organic matter in the sea.
Oceanogr Mar Biol Ann Rev 20:65-118 23. Jumars PA, Penry DL, Baross JA, Perry MJ, Frost BW (1989) Closing the microbial loop:
Dissolved carbon pathway to heterotrophic bacterial from incomplete ingestion, digestion and absorption in animals. Deep-Sea Res 36:483-495
24. Lampert W (1978)Release ofdissolvedorganic carbon by grazing zooplankton. Limnol Oceanogr 23:831-834
25. Lee S, Fuhrman JA (1987) Relationships between biovolume and biomass of naturally derived marine bacterioplankton. Appl Environ Microbiol 53:1298-1303
26. Linley EAS, Newell RC (1981) Microheterotrophic communities associated with the degration of kelp debris. Kieler Meeresforsch 5:345-355
27. Linley EAS, Newell RC (1984) Estimates of bacterial growth yields based on plant detritus. Bull Mar Sci 35:409-425
28. Murphy J, Rieley JP (1962) A modified single solution method for the determination of phosphate in natural waters. Anal Chim Acta 27:21-26
29. Newell RC, Moloney CL, Field JG, Lucas MI, Probyn TA (1988) Nitrogen models at the community level: Plant-animal-microbe interactions. In: Blackburn TH, SCrensen J (eds) Nitro- gen cycling in coastal marine environments. SCOPE, John Wiley & Sons, New York, pp 381-4 14
30. Newell RC, Lucas MI, Linley EAS (1981) Rate of degradation and efficiency of conversion of phytoplankton debris by marine micro-organisms. Mar Ecol Prog Ser 6:123-136
31. Novitsky JA, Morita RY (1978) Possible strategy for the survival of marine bacteria under starvation conditions. Mar Biol 48:289-295
32. Novitsky JA, Morita RY (1976) Morphological characterization of small cells resulting from nutrient starvation of a psycrophilic marine vibrio. Appl Environ Microbiol 32:617-622
33. Novitsky JA, Morita RY (1977) Survival of a psycrophilic marine vibrio under long-term nutrient starvation. Appl Environ Microbiol 33:635-641
34. Payne WJ, Wiebe WJ (1978) Growth yield and efficiency. Ann Rev Microbio132:155-183 35. Riemann B (1983) Biomass and production of phyto- and bacterioplankton in eutrophic Lake
Tystrup, Denmark. Freshwater Biol 13:38%398

160 K. Kristiansen et al.
36. Riemann B, SCndergaard M (1986) Regulation of bacterial secondary production in two eutrophic lakes and in experimental enclosures. Plankt Res 8(3):519-536
37. Riemann B (1984) Determining growth rates of natural assemblages of freshwater bacteria by means of 3H-thymidine incorporation into DNA. Comments on methodology. Ergeb Limnol 19:67-80
38. Schwaeter S, SCndergaard M, Riemann B, Jensen LM (1988) Respiration in eutrophic lakes: The contribution of bacterioplankton and bacterial growth yield. Plankt Res 10:515-531
39. Slater JH (1979) Principles of micxzobial behaviour in ecosystems. In: Lynch JM, Poole NJ (eds) Microbial ecology, a conceptual approach. Blackwell, Oxford, pp 5 ~ 3
40. Smits JD, Riemann B (1988) Calculation of cell production from [3H]thymidine incorporation with freshwater bacteria. Appl Environ Microbiol 54:2213-2219
41. Sol6rzano L (1969) Determination of ammonia in natural waters by the phenolhypochlorite method. Limnol Oceanogr 14:799-801
42. Stuart V, Lucas MI, Newell RC (1982) Conversion of kelp debris and faecal material from the mussel Aulacomya ater by marine micro-organisms. Mar Ecol Prog Ser 7:47-57
43. Williams PJLeB (1970) Heterotrophic utilization of dissolved organic compounds in the sea. I. Size distribution of population and relationship between respiration and incorporation of growth substrates. J Mar Biol Assoc UK 50:859-870
44. Williams PJLeB (1981) Incorporation of microheterotrophic processes into the classical paradigm of the marine food web. Kieler Meeresforsch 5:1-28