Novel Phenotypic and Genotypic Findings in X-Linked Retinoschisis
Upload
independentCategory
view
4download
0
Accepted for publication in Science
1
Genotypic Diversity within a Natural Coastal
Bacterioplankton Population
Janelle R. Thompson 1,2, Sarah Pacocha1,2, Chanathip Pharino1, Vanja Klepac-
Ceraj1,2, Dana E. Hunt1, Jennifer Benoit1,2, Ramahi Sarma-Rupavtarm1, Daniel L.
Distel3, Martin F. Polz1†
1Department of Civil and Environmental Engineering, Massachusetts Institute of
Technology, Cambridge, MA 02139, USA, 2Department of Biology, Woods Hole
Oceanographic Institution, Woods Hole, Massachusetts 02543, USA, 3Ocean Genome
Legacy, New England Biolabs, MA 01915, USA
† To whom correspondence should be addressed. E-mail [email protected]

Accepted for publication in Science
2
ABSTRACT:
The genomic diversity and relative importance of unique genotypes within natural
bacterial populations has remained largely unknown. Here, we analyze the diversity
and annual dynamics of a group of coastal bacterioplankton (>99% 16S rRNA
identity to Vibrio splendidus). We show that this group consists of at least a thousand
distinct genotypes, each occurring at extremely low environmental concentrations
(on average <1 cell/ml). Overall, the genomes show extensive allelic diversity and
size variation. Individual genotypes rarely recurred in samples and allelic
distribution did not show spatial or temporal substructure. Ecological
considerations suggest that much genotypic and possibly phenotypic variation
within natural populations should be considered neutral.

Accepted for publication in Science
3
Molecular evidence increasingly demonstrates the remarkable genetic diversity of the
microbial world (1, 2) yet ecological interpretation of this diversity remains elusive. This
is largely because microbiologists rely on studies of clonal isolates or environmental gene
libraries to infer biogeochemical and pathogenic functions of natural bacterial
populations. What is missing, however, is quantitative information regarding the
environmental prevalence of individual genotypes that would allow inference of their
ecological significance or competitive success. On the one hand, it may be expected that
ecologically distinct populations display relatively high clonality because bacterial
genomes have a high potential for adaptive mutations, which may lead to purging of
genotypic diversity from within the population by selective sweeps (3, 4). On the other
hand, this view is increasingly difficult to reconcile with recent observation of high levels
of differentiation among closely related genomes [e.g. (5, 6)] and the recovery of vast
numbers of similar but non-identical homologous genes from environmental samples
(microdiversity) (7-9). It may therefore be questioned whether competition among
individual strains is strong enough to result in frequent selective sweeps or instead
whether natural populations may accumulate large neutral allelic and perhaps even
genomic variation (8). However, the diversity and prevalence of individual variants
within environmental bacterial populations has not been extensively explored and so
questions regarding the ecological significance of genotypic variation remain
unanswered.
To analyze genotypic diversity and overall population size quantitatively, we combined
culture-dependent and independent methods to assess the number, extent of variation, and

Accepted for publication in Science
4
relative frequency of genotypes within a well-defined natural bacterial population. We
chose a coastal assemblage of Vibrio splendidus, previously identified as a
phylogenetically discrete cluster denoted by nearly identical (<1% divergent) 16S rRNA
sequences in an analysis of bacterioplankton community structure (8). We have proposed
that such ribotype clusters represent ecologically differentiated units, i.e., ecotypes or
populations (8). Thus, we defined the V. splendidus cluster as a population of naturally
co-occurring genomes that can be tracked quantitatively in the environment and
identified in strain collections by their distinct rRNA genes.
Quantification of the V. splendidus population over an annual cycle by QPCR (10)
revealed that it is consistently present as a member of the coastal bacterioplankton
community and displays seasonal variation in abundance (Fig. 1A). Concomitant with
quantification, we isolated strains from five temporal samples on Vibrio-selective media
and identified strains by 16S rRNA sequence analysis (Fig. 1B) (11). Overall, 20 distinct
Vibrio (and closely related Photobacterium) taxa grew on the media (Fig. 1B and C) but
the majority of isolates (232 of 333) were identified as members of the V. splendidus
population (red sectors in Fig. 1B). This dominance in all collections, except the cold-
water sample (March 03) (Fig. 1B), roughly parallels the culture-independent
quantification by QPCR (Fig. 1A).
Determination of sequence diversity of a universally distributed protein-coding gene
(Hsp60) among all 333 Vibrio isolates showed high heterogeneity but confirmed the
monophyly of the V. splendidus population detected by the rRNA sequence analysis (data
Accepted for publication in Science
5
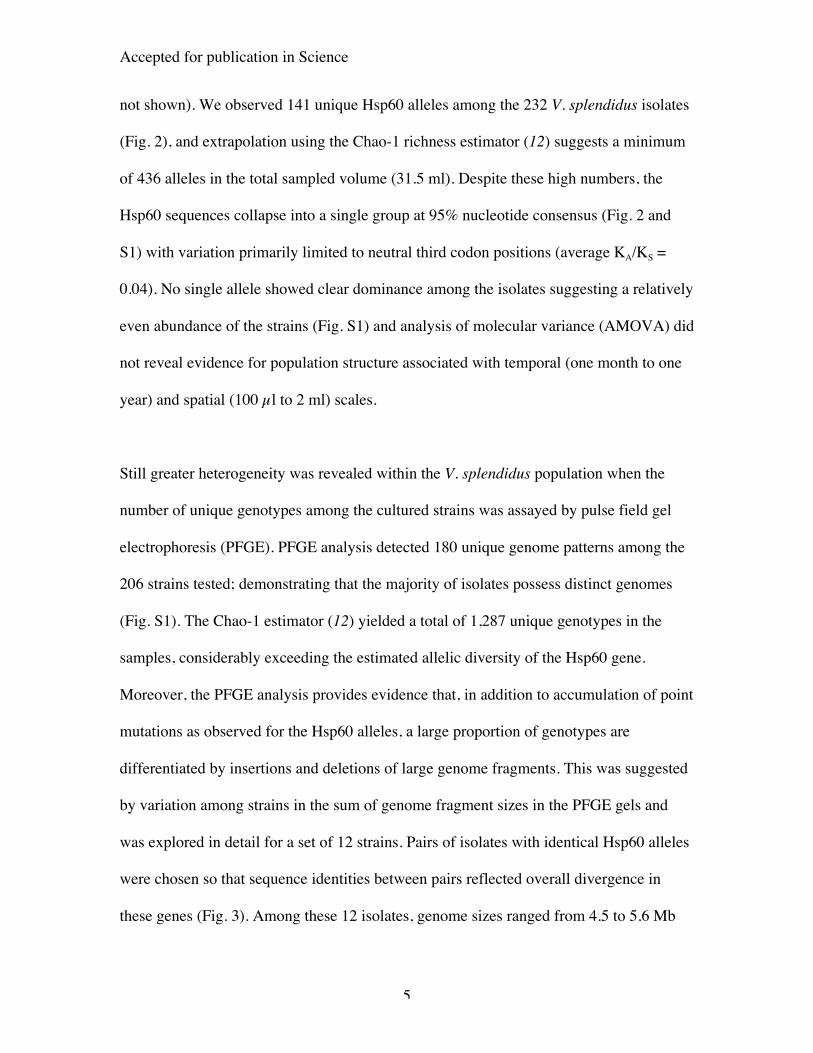
not shown). We observed 141 unique Hsp60 alleles among the 232 V. splendidus isolates
(Fig. 2), and extrapolation using the Chao-1 richness estimator (12) suggests a minimum
of 436 alleles in the total sampled volume (31.5 ml). Despite these high numbers, the
Hsp60 sequences collapse into a single group at 95% nucleotide consensus (Fig. 2 and
S1) with variation primarily limited to neutral third codon positions (average KA/KS =
0.04). No single allele showed clear dominance among the isolates suggesting a relatively
even abundance of the strains (Fig. S1) and analysis of molecular variance (AMOVA) did
not reveal evidence for population structure associated with temporal (one month to one
year) and spatial (100 µl to 2 ml) scales.
Still greater heterogeneity was revealed within the V. splendidus population when the
number of unique genotypes among the cultured strains was assayed by pulse field gel
electrophoresis (PFGE). PFGE analysis detected 180 unique genome patterns among the
206 strains tested; demonstrating that the majority of isolates possess distinct genomes
(Fig. S1). The Chao-1 estimator (12) yielded a total of 1,287 unique genotypes in the
samples, considerably exceeding the estimated allelic diversity of the Hsp60 gene.
Moreover, the PFGE analysis provides evidence that, in addition to accumulation of point
mutations as observed for the Hsp60 alleles, a large proportion of genotypes are
differentiated by insertions and deletions of large genome fragments. This was suggested
by variation among strains in the sum of genome fragment sizes in the PFGE gels and
was explored in detail for a set of 12 strains. Pairs of isolates with identical Hsp60 alleles
were chosen so that sequence identities between pairs reflected overall divergence in
these genes (Fig. 3). Among these 12 isolates, genome sizes ranged from 4.5 to 5.6 Mb

Accepted for publication in Science
6
with only weak correlation of genome size difference to Hsp60 sequence divergence (R =
0.37) and only minor contribution to size estimates by plasmids (data not shown). Even
when comparing strains with identical Hsp60 alleles, most (four of the six pairwise
comparisons) showed significant genome size differences (Student’s t-test, p<0.01; ~170
to 800 kb variation) indicating that specific alleles may be poor markers for distinct
genomes.
The high degree of heterogeneity observed among the V. splendidus genomes suggests
that the average concentration of individual genotypes is astoundingly small in the
sampled environment. To illustrate this, we divided the QPCR-based estimates of
population size of V. splendidus in samples taken in Aug 03, Sept 03, and Oct 03 (1,890,
600, and 640 cells/ml, respectively) (Fig. 1A) by the Chao-1 estimates for the number of
Hsp60 alleles (125, 94 and 279) and genotypes (465, 553 and 901) in those same
samples. The result suggests that unique Hsp60 alleles occurred in the monthly samples
at average concentrations of 2 to 15 cells per ml (or at a frequency of 0.3 to 1%) while
unique genotypes were present at ~10-fold lower frequency (average concentration for all
samples estimated at <1 cell per ml). If the possibility of isolation bias is taken into
account the estimated concentrations (population size/richness) would be even lower;
because isolation bias would lead to an underestimation of richness but would not affect
population size estimates by QPCR.
What could explain such high diversity of V. splendidus genotypes in this environment?
The observed pattern suggests that purging of genotypes from within the population

Accepted for publication in Science
7
(operationally defined as a ribotype cluster) is rare compared to processes introducing
variation, and that variation persists because it is either favored by selection (e.g. by
balancing selection or niche differentiation) or is neutral. Indeed, some proportion of the
observed genotypic diversity may reflect the differentiation of (sub)populations that are
specialized to particular environmental conditions in the complex life-style of vibrios
(including free-living and animal or particle associated states). However, ecological
considerations suggest that much of the observed genotypic diversity has little adaptive
significance in the context of the water column. Given their low estimated concentration
(<1 cell/ml), individual genotypes would occupy much less than a trillionth of the volume
of a ml of seawater. Because resources are thought to arise in small patches that are
unpredictable relative to the location of any given cell (13), access by unique genotypes
to conditions allowing rapid growth may be largely stochastic, relegating strong
competitive interactions between genotypes to ephemeral microzones. In addition, top-
down interactions, like predation (14), may quickly erase any localized dominance of
genotypes. Thus, although individual genotypes may achieve rapid growth in microzones
or microcolonies, averaged over the water column their differences do not result in
lasting growth advantage (i.e., they are effectively neutral) and so the observed vast
genotypic diversity can coexist.
Previous studies have shown that significant variation in gene content and genome size
may occur among closely related genomes (albeit drawn from separate environments) (6,
15-17). Such variation can arise via gene duplication, insertion, and deletion or by
horizontal gene transfer (HGT) mediated by phages, plasmid-borne transposons and

Accepted for publication in Science
8
integrons (18). In fact, HGT is now regarded as a major source of innovation in bacterial
evolution (19-21) and several cases of environmental differentiation have been linked to
specific gene addition or loss (22-24). However, it has also been suggested that most
acquired sequences do not confer a selective advantage on their host and can be neutral
targets for deletion and mutational events leading to a dynamic genome (25, 26). Indeed,
model results indicate that such neutral genome segments are likely to be
transient elements represented in only a small fraction of a population (27). Our results
expand such previous considerations to indicate that large genome modifications,
possibly including HGT, are observed with high frequency in genomes that contain
identical rRNA and Hsp60 sequences and coexist within the same natural population.
It will be important to ask whether such extensive genomic variation is a general feature
of natural bacterial populations. We have recently observed that two microbial
communities are composed of hundreds of microdiverse ribotype clusters (8, 9) and have
proposed that these denote bacterial populations, which arise by rare selective sweeps
followed by effectively neutral diversification (8). Consistent with this hypothesis, we
show that one such cluster occurs predictably in the bacterioplankton community and
contains extensive diversity, much of which may be neutral in the ecological context of
the water column. If similar patterns of diversity are common to bacterial communities
caution should be exercised in interpreting the extent to which gene complements or even
metabolic traits of individual isolates may reflect the overall properties of populations
(28-30). Indeed our results suggest that not only the gene content, but also quantitative

Accepted for publication in Science
9
abundance and dynamics of individual traits should be considered when evaluating the
ecological significance of differences among coexisting genotypes.
References and Notes
1. M. S. Rappé, S. J. Giovannoni, Annu. Rev. Microbiol. 57, 369-394 (2003).
2. E. F. DeLong, Current Opin. Microbiol. 5, 520-524 (2002).
3. T. Palys, L. K. Nakamura, F. M. Cohan, International Journal of Systematic
Bacteriology 47, 1145-1156 (1997).
4. S. F. Elena, R. E. Lenski, Nat. Rev. Genet. 4, 457-469 (2003).
5. E. A. Joyce, K. Chan, N. R. Salama, S. Falkow, Nat. Rev. Genet. 3, 462-473
(2002).
6. U. Bergthorsson, H. Ochman, Mol. Biol. Evol. 15, 6-16 (JAN, 1998).
7. C. J. Venter et al., Science 304, 66-74 (2004).
8. S. G. Acinas et al., Nature 430, 551-554 (2004).
9. V. Klepac-Ceraj et al., Environ. Microbiol. 6, 686-698 (2004).
10. J. R. Thompson et al., Appl. Environ. Microbiol. 70, 4103-4110 (2004).
11. Materials and methods are available as supporting material on Science online.
12. J. B. Hughes, J. J. Hellmann, T. H. Ricketts, B. J. M. Bohannan, Appl. Environ.
Microbiol. 67, 4399-4406 (2001).
13. N. Blackburn, T. Fenchel, Marine. Ecol. Progr. Ser. 189, 1-7 (1999).
14. T. F. Thingstad, Limnol. Oceanogr. 45, 1320-1328 (2000).
15. R. A. Welch et al., Proc. Natl. Acad. Sci. U S A 99, 17020-17024 (2002).

Accepted for publication in Science
10
16. R. A. Alm et al., Nature 397, 176-180 (1999).
17. J. A. Lindsay, M. T. G. Holden, Trends Microbiol. 12, 378-385 (2004).
18. J. Hacker, E. Carniel, EMBO Reports 2, 376-381 (2001).
19. Y. Boucher et al., Annu. Rev. Genet. 37, 283-328 (2003).
20. J. G. Lawrence, H. Ochman, Trends Microbiol 10, 1-4. (2002).
21. H. Ochman, J. G. Lawrence, E. A. Groisman, Nature 405, 299-304 (2000).
22. N. T. Perna et al., Infect. Immun. 66, 3810-3817 (1998).
23. S. D. Reid, C. J. Herberlin, A. C. Bumbaugh, R. K. Selander, T. S. Whittam,
Nature 406, 64-67 (2000).
24. G. Rocap et al., Nature 424, 1042-1047 (2003).
25. A. Mira, H. Ochman, N. A. Moran, Trends. Genet. 17, 589-96 (Oct, 2001).
26. J. G. Lawrence, H. Ochman, Proc. Natl. Acad. Sci. U S A 95, 9413-9417 (1998).
27. O. G. Berg, C. G. Kurland, Mol. Biol. Evol. 19, 2265-76 (Dec, 2002).
28. G. E. Fox, J. D. Wisotzkey, J. P. Jurtshuk, Int. J. Syst. Bact. 42, 166-170 (1992).
29. H. Sass, E. Wieringa, H. Cypionka, H. D. Babenzien, J. Overmann, Arch.
Microbiol. 170, 243-251 (1998).
30. E. Jaspers, J. Overmann, Appl. Environ. Microbiol. 70, 4831-4839 (2004).
31. We thank S. Chisholm, E. DeLong (both MIT) and F. Doolittle (Dalhousie) for
careful readings and comments on the manuscript, S. G. Acinas (MIT) for help
with data analysis, J. Fontana and A. Stout (Massachusetts Department of Public
Health) for instructions in PFGE optimization, and two anonymous reviewers for
their insightful suggestions. This work was supported by grants from the
Department of Energy Genomes to Life program and the National Science

Accepted for publication in Science
11
Foundation. Sequences have been submitted to Genbank under accession numbers
AY836800-AY837464.
Supporting Online Material
www.sciencemag.org
Materials and Methods
Fig. S1

Accepted for publication in Science
12
Figure legends
Fig. 1. Diversity and abundance of coastal vibrioplankton (Plum Island Sound, MA) in
monthly samples taken over an entire year. (A) Quantification of V. splendidus (red) and
total vibrio (black) populations by culture independent QPCR. (B) Relative proportion of
Vibrio and Photobacterium isolates by phylogenetic association. Color-coding as in (C).
(C) Phylogenetic relationships among representative Vibrio and Photobacterium isolates
inferred from distance analysis of partial 16S rRNA sequences (bootstrap proportions
>50% are indicated above nodes).
Fig. 2. Number of unique Hsp60 clusters among V. splendidus isolates observed as
cluster cutoff values are decreased from 100 to 95%.
Fig. 3. Genome size estimates and phylogenetic relationships of Hsp60 sequences for 12
V. splendidus isolates chosen as pairs with identical Hsp60 alleles, encompassing all
levels of Hsp60 variation observed in the strain collection. (A) Genome sizes determined
by PFGE as averages of six independent estimates, each obtained from single enzyme
digests run to resolve large, medium and small-sized bands, respectively, and repeated
three times for each of two enzymes (NotI/SfiI or NotI/AscI) per isolate. (B)
Phylogenetic relationships of Hsp60 alleles inferred from maximum likelihood analysis
with assumption of molecular clock from partial gene sequences. Isolate identifiers
correspond to month (12 = 8/12/03; 13 = 9/10/03; 14 = 10/11/03) of isolation and strain
name.

Accepted for publication in Science
13
Figure 1

Accepted for publication in Science
14
Figure 2

Accepted for publication in Science
15
Figure 3

Accepted for publication in Science
16
SUPPLEMENTAL ONLINE MATERIAL
Materials and Methods
Study Site, sampling and strain isolation.Samples for strain isolation and nucleic acid extraction were collected monthly at
high tide from the marine end of the Plum Island Sound estuary (northeasternMassachusetts) (1). Strains were isolated by subsampling each of four 1-liter watersamples by direct plating onto TCBS (Difco) agar plates containing 2% NaCl. From the9/18/02 samples, aliquots of 0.1 ml were plated directly; for all other samples,bacterioplankton was concentrated on filters (0.2 µm) (Supor); these were placed ontoplates and incubated at room temperature. For samples taken on 8/12/03, 9/10/03 and10/11/03 aliquots of 100 µl to 2 ml were concentrated, while for 3/7/03, 10 to 20 ml wereused. The total volumes sampled were 12.1, 8, 8, and 140 ml for 8/12/03, 9/10/03,10/11/03 and 3/7/03, respectively. Single colonies were picked and purified by serialsubculture onto TCBS and 2216 agar (Difco) and were stored in glycerol at –80°C. Forculture-independent estimation of total vibrioplankton and V. splendidus abundance (2),bacterioplankton was concentrated onto duplicate 0.2 µm filters (Sterivex or Poretics) inaliquots of 300 to 700 ml and stored at –20°C. Water temperatures for the dates of strainisolation were (16, 16, 16, 13.5 and 1.5˚ C respectively) and salinity was between 30-33ppt.
Estimation of Population Abundance.Nucleic acids were extracted from filter-concentrated bacterioplankton with a
bead-beating method (2). The abundance of V. splendidus was determined by QPCR withVibrio-specific 16S rRNA primers using a competitive internal standard, followed byseparation and quantification of the resulting amplicons by constant denaturing capillaryelectrophoresis (CDCE) (2). V. splendidus populations were identified as amplicons co-migrating in CDCE spectra with amplicons from V. splendidus isolates obtained from thestudy site and from cloned 16S rRNA genes obtained from a previous investigation (2).Total vibrioplankton abundance was obtained by summing all Vibrio-specific CDCE-peaks observed (2). Cell numbers were inferred based on an average of 9 rRNA operonsper genome for V. splendidus determined by Southern blot analysis of several strains; fortotal vibrioplankton the average operon number for the genus Vibrio was used (2).
DNA extraction from strains and sequence analysis.DNA from bacterial isolates was purified using the PureGene kit (Gentra
Systems). The 16S rRNA and Hsp60 genes were PCR amplified using conditionsdescribed previously (2) with primers 27F and 1492R (3), and H279 and H280 (4),respectively. Sequences were determined using primers 27F and 789R (16S rRNA) (3),and H279 and H280 (Hsp60). All unique alleles were confirmed by reamplification andsequencing. Neither the 16S rRNA nor the Hsp60 gene fragments of the V. splendidusstrains contained any length heterogeneity resulting in unambiguous alignments of 723and 541 nucleotides, which were used for all further analysis. The 16S rRNA sequencescontained multiple, clustered ambiguities, which likely stem from sequence heterogeneityamong the 8-10 rRNA operons we have detected by Southern hybridization of

Accepted for publication in Science
17
representative isolates (data not shown). However, overall sequence divergence remained<1% even when ambiguities were counted as differences. This is, consistent withprevious analysis of operon heterogeneity in published genomes (5).
Sequences were compared to establish relationships and test populationsubstructure in the samples. Percent sequence similarity groups of 16S rRNA and Hsp60alleles were calculated using Clusterer (1). All phylogenetic analyses were performedusing programs contained in PAUP* (Phylogenetic Analysis Using Parsimony) [providefull citation] (6). Neighbor Joining trees were used as a preliminary tool to identifymicrodiverse ribotype clusters (with roughly ≥99% internal 16S rRNA sequence identity)from among all 333 Vibrio and (closely-related) Photobacterium isolates. The resultingclusters were named according to the closest sequence identified by Seqmatchimplemented in the RDPII (Ribosomal Database Project) website (7). A representativesubtree, including one sequence from each cluster, was constructed using Distancemethods with Jukes-Cantor correction and 100 Bootstrap replicates. Relationships amongHsp60 alleles from strains used for detailed genome size determination were inferred bymaximum-likelihood (PAUP, default parameters except with molecular clock enforced),and 100 Bootstrap replicates were performed. The ratio of nonsynonymous tosynonymous mutations (KA/KS) among Hsp60 sequences was determined using DNASPv. 4.0 (8). For each sampling date, and for all sampling dates combined, three hierarchicalcomponents of Hsp60 allelic diversity (within date(s), within date(s) among sub-samplesand within sub-samples) were tested using Analysis of Molecular Variance (AMOVA)[implemented in Arlequin 2.0 (9)]. For estimation of allelic and genotypic richness in thesamples, the Chao-1 non-parametric richness estimator was used (10, 11) because it doesnot assume a specific abundance distribution model.
Genotypic diversity, genome size determination and identification of plasmids.Pulsed field gel electrophoresis (PFGE) was used as a robust method for
determining whole genome differentiation (genotyping) and genome sizes. All digestswere run using the Chef II and Chef mapper (Biorad) and analyzed using the Gel ComparII software package (Biomathematica). For genotyping, Not I digests of whole genomicDNA were separated (6V/cm with a 5.3 to 34.9 second switch time for 19 hours at 14˚C)and 50-500kb fragments were normalized to the lambda ladder (BioRad) and comparedto each other. Patterns were replicated for ~25% of the strains. RAPD-PCR with primersOPD11 and OPD20 (12) was used as an independent genotyping method to confirmPFGE results and also for routine checks of strain identity. Genome sizes weredetermined for 12 strains. These were selected to form six pairs such that within pairsHsp60 alleles were identical while between pair differences reflected the total range ofdivergence observed among strains. Genome sizes were determined as averages of sixindependent estimates, each obtained from single enzyme digests run using conditionsoptimized to resolve large, medium and small-sized bands and repeated three times foreach of two enzymes (NotI/SfiI or NotI/AscI) per genome. Fragments >500kb, between500 and 50, and <50kb were sized using conditions recommended to resolve theSaccharomyces cerevisae ladder (BioRad), lambda ladder (BioRad), and the lowmolecular weight PFGE ladder (New England Biolabs), respectively. Co-migrating bandsnot resolved under the three PFGE conditions were identified by band intensity. For

Accepted for publication in Science
18
detection of plasmid DNA, alkaline lysis preps were performed to exclude genomic DNAand these were resolved on agarose gels (13).
Supplemental References
S1. S. G. Acinas et al., Nature 430, 551-554 (2004).S2. J. R. Thompson et al., Appl. Environ. Microbiol. 70, 4103-4110 (2004).S3. D. J. Lane, in Nucleic Acid Techniques in Bacterial Systematics E. Stackebrandt,
M. Goodfellow, Eds. (Wiley & Sons, Chichester, 1991) pp. 115-175.S4. S. H. Goh et al., Journal of Clinical Microbiology 34, 818-823 (Apr, 1996).S5. S. G. Acinas, L. A. Marcelino, V. Klepac-Ceraj, M. F. Polz, J. Bacteriol. 186
(2004).S6. D. L. Swofford. (Sinauer Associates, Sunderland, Massachussetts, 2002).S7. J. R. Cole et al., Nucleic Acids Res. 31, 442-443 (2003).S8. J. Rozas, J. C. Sanchez-DelBarrio, X. Messeguer, R. Rozas, Bioinformatics 19,
2496-2497 (2003).S9. S. Schneider, D. Roessli, L. Excoffier. (http://lgb.unige.ch/arlequin/) (Genetics
and Biometry Lab, Dept. of Anthropology, University of Geneva, 2000).S10. A. Chao, Scand. J. Stat. 11, 265-270 (1984).S11. J. B. Hughes, J. J. Hellmann, T. H. Ricketts, B. J. M. Bohannan, Appl. Environ.
Microbiol. 67, 4399-4406 (2001).S12. P. S. Sudheesh, K. Jie, H. S. Xu, Aquacult. 207, 11-17 (2002).S13. C. I. Kado, S. T. Liu, J. Bacteriol. 145, 1365-1373 (1981).

Accepted for publication in Science
19
Fig. S1 Comparison of allelic and genotypic variation among V. splendidus strains witheach row denoting a unique strain. (A) Hsp60 alleles grouped by increasing sequenceidentity cut-off values (95 to 100%, left to right). Colored boxes delineate sequenceidentity groups (strains with alleles not differentiated at the specified cut-off value).White boxes identify unique alleles at the specified cut-off value. (B) Genotypesidentified by PFGE profiles arranged to match corresponding Hsp60 alleles. Strains fromwhich no PFGE pattern could be obtained are indicated by X. Note that strains withidentical Hsp60 alleles frequently have different PFGE patterns; however, strains withidentical PFGE patterns almost always have identical Hsp60 allele.
Copyright © 2022 FDOKUMEN