Nanobarcoding: detecting nanoparticles in biological samples ...
Upload
independentCategory
view
3download
0
ORIGINAL ARTICLE
Genotypic testing for HIV-1 drug resistance using dried bloodsamples
Rosalia Lira • Hilda Valdez-Salazar • Guillermo Vazquez-Rosales • Othon Rojas-Montes •
Martha Ruiz-Tachiquin • Rocio Torres-Ibarra • Carlos Cano-Dominguez •
Angelica Maldonado-Rodrıguez • Alejandro Gomez • Onofre Munoz • Ma-Teresa Alvarez-Munoz
Received: 19 November 2009 / Accepted: 10 May 2010! Springer-Verlag 2010
Abstract In third-world countries, dried blood samples(DBS) are a convenient alternative to plasma for moni-
toring viral load during HIV-1 therapy. In this study, we
evaluated the feasibility of using DBS to perform HIV-1drug resistance genotyping in a ViroSeq assay in which the
protease and reverse transcriptase regions of the pol geneare analyzed. Fifty-seven antiretroviral genotypes fromplasma samples were tested, and drug resistance genotypes
were determined. Only 38.6% paired DBS samples were
sequenced. Failure to amplify DNA from DBS samplesgenerally correlated with plasma viral loads below log105.1. The majority of the mutations identified in plasma polsequences were also found in their DBS counterpart, with aconcordance in genotype interpretation of 96.4%. Several
factors were identified that could potentially improve both
the sensitivity and the quality of genotype data, such as
sample storage conditions and sequence analysis. There-fore, DBS sampling is useful to determine viral load and
drug resistance genotypes in HIV patients.
AbbreviationsDBS Dried blood sampleP Plasma
HAART Highly active antiretroviral therapy
FDA Federal Drug AdministrationPR Protease
RT Reverse transcriptase
NRTI Nucleoside/nucleotide RT inhibitorNNRTI Non-nucleoside RT inhibitor
PI Protease inhibitor
VL Viral loadIMSS Instituto Mexicano del Seguro Social
This work was supported by Consejo Nacional de Ciencia yTecnologıa SALUD/CONACYT grant 2004-01-008.
R. Lira ! H. Valdez-Salazar ! G. Vazquez-Rosales !O. Rojas-Montes ! M. Ruiz-Tachiquin ! A. Maldonado-Rodrıguez ! A. Gomez ! O. Munoz ! M.-T. Alvarez-Munoz (&)Unidad de Investigacion Medica en Enfermedades Infecciosas yParasitarias, Hospital de Pediatria, Centro Medico NacionalSiglo XXI, Instituto Mexicano del Seguro Social, Cuauhtemoc330 Col. Doctores, Delegacion Cuauhtemoc, Mexico City06720, Mexicoe-mail: [email protected]
R. Lirae-mail: [email protected]
H. Valdez-Salazare-mail: [email protected]
G. Vazquez-Rosalese-mail: [email protected]
O. Rojas-Montese-mail: [email protected]
M. Ruiz-Tachiquine-mail: [email protected]
A. Maldonado-Rodrıgueze-mail: [email protected]
A. Gomeze-mail: [email protected]
O. Munoze-mail: [email protected]
R. Torres-Ibarra ! C. Cano-DominguezCentro Medico Nacional La Raza, IMSS, Clinica de Hepatitis,Hospital de Infectologia, Mexico City, Mexicoe-mail: [email protected]
C. Cano-Domingueze-mail: [email protected]
123
Arch Virol
DOI 10.1007/s00705-010-0696-y

Introduction
Highly active antiretroviral therapy (HAART) has sig-
nificantly reduced the rate of HIV-1/AIDS-related
mortality, but its clinical benefit is compromised andlimited because the exposure to antiretroviral drugs
has resulted in the emergence of drug-resistant viral
populations. The drugs most commonly used for treat-ment are protease inhibitors (PIs), nucleoside/nucleotide
reverse transcriptase inhibitors (NRTIs), and non-
nucleoside inhibitors (NNRTIs). In this context, it isimportant analyze the protease (PR) and reverse trans-
criptase (RT) genes in the patient undergoing treatment
in order to identify mutations associated with resistance.It has been demonstrated that resistance genotyping
results in better treatment guidelines for the patient,
improving treatment and reducing costs [1]. TheViroSeq system (Celera Diagnostics), a commercial kit
available for HIV-1 subtype B drug resistance geno-
typing, is used for the amplification, sequencing andanalysis of a 1.8-kb fragment from the HIV-pol region(containing the entire PR and the region encoding for
the first 335 amino acids of the RT open readingframe). Although plasma is considered the ideal speci-
men for viral load (VL) and genotypic drug resistance
testing, collection and shipment of plasma are notalways possible in settings where resources are limited.
It has been suggested that dried blood samples (DBS)carry less biohazard risk than liquid samples, facilitate
shipment to a centralized laboratory for testing, and
require only minimal storage facilities, since the nucleicacids are stable at room temperature [2–4]. Efforts have
been made to validate the use of DBS samples to
minimize cost in VL and drug resistance testing forHIV patients. Masciotra and colleagues [5] have
reported a high concordance between resistance geno-
types from plasma and DBS, using the ViroSeq geno-typing system and one in-house method for drug
resistance testing. Several other in house methods have
also been assayed for drug resistance testing with DBSsamples [6–11]. In third-world countries, the DBS
sampling method is increasingly used for diagnosis and
monitoring of HIV-1 infection [3, 7, 12]. In Mexico,where HIV-1 subtype B is predominant [13, 14], vali-
dation of DBS as a method of specimen collection for
drug resistance testing is urgently needed. In our labo-ratory, which is a reference center for monitoring HIV-1
patients, we have already validated the utility of DBS
samples for VL testing [2]. The aim of this study was toevaluate the sensitivity and reproducibility of DBS
sampling in the characterization of HIV-1 drug resis-
tance mutations in Mexican HIV-1 patients, using theViroSeq genotyping system.
Materials and methods
Patients
For this study, samples of blood and plasma from HIV-1patients at the Instituto Mexicano del Seguro Social
(IMSS) were collected over a period of 6 months. Because
the sensitivity of the genotyping assay has a limit of2,000 copies/mL, only 57 HIV-1 patients with viral loads
above this limit were included in this study. Matched
samples from patients of five States of Mexico, DistritoFederal (25), Veracruz (10), Jalisco (9), Yucatan (9), and
Nuevo Leon (4), were obtained. Informed consent was
obtained from all study participants. The study wasapproved by the local Committee of Research and Ethics
from the IMSS. Clinical and demographic data were
obtained for 51 patients, but no data were obtained for 6 ofthem. The age range was 24–66 years, 78.9% were men,
and 84.5% were undergoing HAART treatment (Table 1).
Samples
Two tubes of EDTA-containing whole blood specimens(5 mL/tube) were taken from each HIV-infected patient.
One tube was used to separate plasma by centrifugation at
4,000 rpm for 20 min. The plasma supernatant was ali-quoted and stored at -70"C until use. The second tube was
used to prepare DBS samples as follows: four cards werespotted with 6 9 50 lL of whole blood applied to filter
paper (Schleicher & Schuell 903, Keene, NH, USA).
Samples from each patient were collected on the same dayand allowed to dry at room temperature for 4 h, placed in a
zip-locked bag with a non-indicating silica gel desiccant
sachet (WA Hammond Drierite Co., Ltd, USA), andshipped from the different regions of the Mexican Republic
at room temperature to Hospital de Pediatria, CMN Siglo
XXI, IMSS in Mexico City and stored at -70"C until use.The range of storage time for DBS samples at room tem-
perature at collection sites before shipment was 5–7 days,
and the average time at -70"C was 12 months.
Table 1 Demographic and virological patient data
Number of patients n = 57
Ratio M:F 45:12
Age range (years) 24–66
VL range in plasma (RNA copies/mL) 2,290–958,000
log10 3.36–5.98
VL range in DBS (RNA copies/mL) 470–950,000
log10 2.67–5.98
CD4? range (cells/mm3) 4–878
R. Lira et al.
123

Plasma and DBS VL determinations
Two different methods were used to measure the HIV-1RNA VL of paired samples. Plasma samples were pro-
cessed by Cobas Amplicor HIV-1 MonitorTM test, version
1.5 (Roche Diagnostics, IN, USA), and DBS by Nucli-Sens# HIV-1 QT assay, NASBA Diagnostics (Organon
Teknika, Bostel, the Netherlands), according to manufac-
turer’s instructions. The Amplicor Monitor assay has asensitivity of 50 copies/mL and uses 500 lL of plasma.
Once the VL from plasma was determined, the DBS
samples were used for VL comparison. For DBS HIV-RNAVL determination, two circles of dried blood spots (100 lLof whole blood) were transferred to a tube containing 9 mL
of lysis buffer NucliSens# (Organon Teknika, Durham,NC, USA) and incubated for 2 h at room temperature with
rotation. Nucleic acids were then extracted, resuspended in
50 lL elution buffer and stored at -70"C until use. Theextracted nucleic acids were used for VL determination,
following the manufacturer’s instructions (NASBA).
HIV-1 genotyping from paired DBS and plasma
samples
HIV-1 genotyping from 57 matched plasma and DBS
samples was performed using the Celera Diagnostics
ViroSeq HIV-1 Genotyping System (version 2.0, AbbottMolecular, Des Plains, Illinois, USA). The ViroSeq assay
amplifies a 1.8-kb fragment of the pol gene (containing the
entire protease region and the region encoding the first335 amino acids of the RT open reading frame) and has
a sensitivity of detection of 2,000 RNA copies/mL of
plasma.
Plasma
For HIV RNA extraction, 500 lL of sample was used, and
RNA was eluted in a final volume of 50 lL dH2O, fol-
lowing the manufacturer’s instructions. Ten microliter ofHIV RNA (equivalent to 100 lL of starting material) was
used to perform retrotranscription with Moloney murine
leukemia virus RT, followed by amplification of the 1.8-kbpol fragment using two different sequence-specific primers,
following the manufacturer’s instructions. The amplified
product was purified using spin columns and analyzed by1% agarose gel electrophoresis. The whole PCR product
was sequenced in both the sense and antisense orientations
using the seven different overlapping sequence-specificprimers (A–H) included in the kit, with AmpliTaq Gold
DNA polymerase. All amplifications were performed in aBiometra T3 thermocycler (Biometry GmbH, Goettingen,
Germany).
DBS samples
We decided to extract the RNA from DBS samples withNucliSens# lysis buffer instead of ViroSeq lysis buffer
because RNA extraction with ViroSeq had not been vali-
dated for dried blood specimens. Four DBS circles,equivalent to 200 lL blood (50 lL/circle), were used for
HIV-1 RNA extraction as described above for VL deter-
minations and eluted in 50 ll of water. Twenty to 50 lL ofthe eluted HIV RNA (equivalent to 80–200 lL of the ini-
tial whole blood sample) was used for the amplification of
the 1.8-kb DNA product. Because the kit’s amplificationreaction allows a maximum volume of 10 lL of RNA per
reaction, it was necessary to concentrate the sample to the
required volume, using an Eppendorf Model 5301Vacu-Fuge Concentrator.
Analysis of sequences
Protease and RT genotypes were analyzed and interpreted
using the ViroSeq Celera Diagnostic ViroSeq HIV-1 Geno-typing System version 2.8 software. The reports of drug
resistance were sent to the patients and their physicians.
Sequences from matched samples (22) were also editedmanually with CLC bio 5.02-version software (CLC bio).
The genotypes were interpreted from the sequences using
the Stanford Genotypic Resistance Interpretation Algo-rithm (Version 5.0 beta), available at http://surveillance.
stanford.edu/cpr/servlet/CPR. This bioinformatic software
was also used to detect mixtures of nucleotide (nt)sequences in the consensus HIV pol sequences from mat-
ched sequences.
The nt sequences of the PR and RT regions (1,302 bp)were aligned using the Mega 4.0 program [15] to calculate
the percentages of amino acid and nt similarity. A phylo-
genetic tree was constructed by the neighbor-joiningmethod, using the sequences from paired plasma and DBS
samples, and the reliability of branching orders was
assessed by using the bootstrap approach with CLC bio5.02 version software (CLC bio). All sequences were
analyzedwith theGenotyping program from theNCBI (http://
www.ncbi.nlm.nih.gov/projects/genotyping/formpage.cgi) todetermine the HIV-1 subtype.
Statistical analysis
Statistical analysis was performed using SPSS software,
version 10.0 (SPSS Chicago IL). Pearson correlation wasused to determine the association between VL from DBS
and plasma, and a paired-samples t test (two-tailed) wasused to compare VL between groups. A p value of\0.05
was considered statistically significant.
Testing for HIV-1 drug resistance using dried blood samples
123

Results
Correlation of HIV-1 RNA VL in plasma and DBS
samples
To further support our previous findings, which suggested a
good correlation of VL between plasma and DBS samples
[2], we determined the VL from the plasma and DBSsamples. The correlation data from the 57 paired specimens
tested is shown in Fig. 1. In plasma samples, a range of VL
from 3.36 to 5.98 log10 was obtained, and for DBS, therange was 2.67–5.98. The mean value ± SD of HIV-1
RNA levels in plasma and DBS were 4.64 ± 0.69 and
4.58 ± 0.73 log10 copies/mL, respectively. Linear regres-sion analysis of log-transformed RNA measurements
(copies/mL) for paired specimens showed a very good
correlation between HIV-1 RNA VL in liquid plasma andDBS. The Pearson correlation between paired samples was
0.9; this correlation is significant at the 0.01 level (2-tailed
analysis).
Efficiency of amplification of the 1.8-kb pol fragment
in plasma and DBS samples
All plasma samples were successfully genotyped using the
ViroSeq assay. Of the 57 DBS specimens, only 24 (42.1%)could be amplified. However, there were two samples that
could not be evaluated with the software, and for thisreason, only 22 paired samples (38.6%) were successfully
edited. To determine if VL affected the probability of a
successful amplification, we classified the samples intothree groups according to the estimated plasma VL. For
group I (VL range 3.2–4.1 log10), none of the samples were
amplified (0/17), for group II (4.2–5.0 log10) a 42.8%
(9/21) amplification rate was obtained, and for group III(5.1–6.0 log10) 79% (15/19) of the samples were sequenced
and successfully genotyped.
Comparison of drug resistance mutations in paired
samples
The mutations associated with drug resistance and geno-
type interpretation generated from 22 paired plasma- andDBS-derived PR and RT gene sequences are shown in
Table 2. Of the paired samples, 77% (17/22) contained
mutations associated with drug resistance in the PR and RTgenes. In the first analysis, we realized that 7 out of 22
sequences showed some degree of discordance in drug
resistance mutations between plasma and DBS.Therefore, to review the nature of these discordances,
we decided to reanalyze the sequence data using a different
edition of the software. The CLC bio software allowsmanual alignment and editing of the sequences. Once we
obtained the pol consensus sequences, they were analyzed
with the Stanford University genotyping tool for theidentification of drug resistance mutations. Using this
software, six of the seven discordances were resolved.
Therefore, the concordance in resistance-associated muta-tions as well as interpretation of drug resistance genotypes
was 95.4% (21/22) between plasma and DBS. The
remaining sample (7V) showed two mutations in theplasma sample that were not identified in its DBS coun-
terpart. The plasma PR resistance mutation (G73S) resulted
in resistance to ATV/r, and the RT mutation (M184V)resulted in 3TC and FTC resistance. It is interesting to note
that this patient had been treated with RTV, SQV and 3TC.
Therefore, the presence of a mixed infection could not beruled out.
Detection of genotypic mixtures
Samples containing mixtures of wild type and drug-resis-
tance mutations (Table 2, underlined mutations) were alsodetected using the Stanford program. In four cases, wild
type and mutation mixtures were detected in both samples,
and in another four cases, a mixture was detected in onlyone of the samples.
Analysis of consensus pol sequences
The pol consensus sequences corresponding to 1,302 bp
of the 1.8-kb amplified fragment were analyzed to determinethe similarity of the nucleotide sequences between plasma
and DBS. The mean (±SD) similarity between nucleotide
pol sequences from plasma and DBS was 98.3 ± 0.94%and ranged between 95 and 99%. A phylogenetic tree
Fig. 1 Log10–log10 graph showing a linear regression comparing VLdata obtained from 57 matched samples of DBS versus plasma. Log10measurements of the HIV-1 RNA in DBS were made using NASBANucliSens, and in plasma samples, using COBAS AMPLICOR HIV-1Monitor. The values for the DBSs are plotted against the values forthe matched plasma samples. A linear correlation between the twosamples is shown (R2 = 0.79). The Pearson correlation coefficientwas 0.9
R. Lira et al.
123

Tab
le2
Drugresistance
mutationsandgenotypeinterpretationfrom
pairedsamplesofplasm
aandDBS
Sam
ple
IDPlasm
aVL
(copies/mL)
PR
mutations
RTmutations
Genotyperesistance
interpretation
Plasm
aDBS
Plasm
aDBS
Plasm
aDBS
11DF
168,000
None
None
None
None
None
None
19DF
249,000
I54V,G73S,
V82F,I84V,
L90M
I54V,G73S,
V82F,I84V,
L90M
M41L,D67N,T69D,
Y181C,G190A,L210W,
T215D
M41L,D67N,T69D,
Y181C,G190A,L210W,
T215D
ATV/r,DRV/r,FVP/r,ID
V/r,
LPV/r,NFV,SQV/r,TPV/r.
ABC,AZT,D4T,DDI,TDF,
DLV,EFV,ETR,NVP
ATV/r,DRV/r,FVP/r,ID
V/r,
LPV/r,NFV,SQV/r,TPV/r.
ABC,AZT,D4T,DDI,TDF,
DLV,EFV,ETR,NVP
28DFa
500,000
D30N,M46IM
,F53L,I54VL,
N88D,L90M
D30N,M46I,
F53L,I54VL,
N88D,L90M
M41L,D67N,K70R,
K103N,F116Y,Q151M,
G190A,T215V,K219E
M41L,D67N,K70R,
K103N,F116Y,Q151M,
G190A,T215V,K
219E
ATV/r,FVP/r,ID
V/r,LPV/r,
NFV,SQV/r.ABC,AZT,
D4T,DDI,TDF,DLV,EFV,
ETR,NVP.
ATV/r,FVP/r,ID
V/r,LPV/r,
NFV,SQV/r.ABC,AZT,
D4T,DDI,TDF,DLV,EFV,
ETR,NVP.
29DF
363,000
M46I,F53L,
I54V,V82A,
I84V,L90M
M46I,F53L,
I54V,V82A,
I84V,L90M
M41L,D67N,V75M,
K103M,M184V,L210W,
T215Y
M41L,D67N,V75M,
K103M,M184V,L210W,
T215Y
ATV/r,DRV/r,FVP/r,ID
V/r,
LPV/r,NFV,SQV/r,TPV/r.
3TC,ABC,AZT,D4T,DDI,
FTC,TDF,DLV,EFV,NVP
ATV/r,DRV/r,FVP/r,ID
V/r,
LPV/r,NFV,SQV/r,TPV/r.
3TC,ABC,AZT,D4T,DDI,
FTC,TDF,DLV,EFV,NVP
30DFa
93,000
L24I,G48M,
F53L,I54V,
G73CG,V82S
L24I,G48M,
F53L,I54V,
G73C,V82S
M184V,T215Y
M184V,T215Y
ATV/r,FVP/r,ID
V/r,LPV/r,
NFV,SQV/r,TPV/r.3TC,
ABC,FTC
ATV/r,FVP/r,ID
V/r,LPV/r,
NFV,SQV/r,TPV/r.3TC,
ABC,FTC
32DF
129,000
L90M
L90M
M4IL,M104V,L210W,
T215D
M4IL,M104V,L210W,
T215D
IDV/r,NFV,SQV/r.3TC,
ABC,AZT,D4T,DDI,FTC,
TDF.
IDV/r,NFV,SQV/r.3TC,
ABC,AZT,D4T,DDI,FTC,
TDF.
34DFa
155,000
L24I,M46I,
I54L,G73C,
V82A
L24I,M46I,
I54L,G73C,
V82A
M41L,D67N,V75M,
M184MV,L210W,
T215Y,G190S
M41L,D67N,V75M,
M184MV,L210W,
T215Y,G190S
ATV/r,FVP/r,ID
V/r,LPV/r,
NFV,SQV/r.3TC,ABC,
AZT,D4T,DDI,FTC,TDF,
EFV,NVP
ATV/r,FVP/r,ID
V/r,LPV/r,
NFV,SQV/r.3TC,ABC,
AZT,D4T,DDI,FTC,TDF,
EFV,NVP
38DFb
207,000
M46IM
,I54M,
I84V,L90M
M46IM
,I54M,
I84V,L90M
D67G,K70R,V75T,
T215F,K219E
D67G,K70R,V75T,
T215F,K219E
ATV/r,DRV/r,FVP/r,ID
V/r,
LPV/r,NFV,SQV/r,TPV/r.
ABC,AZT,D4T,DDI,TDF.
ATV/r,DRV/r,FVP/r,ID
V/r,
LPV/r,NFV,SQV/r,TPV/r.
ABC,AZT,D4T,DDI,TDF.
40DF
229,000
None
None
None
None
None
None
1J
435,000
None
None
Y188L,V118I
Y188L,V118I
DLV,EFV,NVP
DLV,EFV,NVP
10J
958,000
M46I
M46I
None
None
NFV
NFV
16Jb
83,200
None
None
K103N,Y181C,T215Y
K103N,Y181C,T215Y
AZT,D4T,DLV,EFV,ETR,
NVP.
AZT,D4T,DLV,EFV,ETR,
NVP.
19J
310,000
None
None
None
None
None
None
21J
70,600
None
None
None
None
None
None
22Ja
24,000
M46I,F53L,
V82T,I84V,
L90M
M46I,F53L,
V82T,I84V,
L90M
M41L,D67N,T69D,L74I,
M184V,L210W,T215D,
G190GRS,K103N
M41L,D67N,T69D,L74I,
M184V,L210W,T215D,
G190S,K103N
ATV/r,FVP/r,ID
V/r,LPV/r,
NFV,SQV/r,TPV/r.3TC,
ABC,AZT,D4T,DDI,FTC,
TDF,DLV,EFV,NVP.
ATV/r,FVP/r,ID
V/r,LPV/r,
NFV,SQV/r,TPV/r.3TC,
ABC,AZT,D4T,DDI,FTC,
TDF,DLV,EFV,NVP.
23J
84,000
None
None
M184V
M184V
3TC,FTC.
3TC,FTC.
Testing for HIV-1 drug resistance using dried blood samples
123

Tab
le2
continued
Sam
ple
IDPlasm
aVL
(copies/mL)
PR
mutations
RTmutations
Genotyperesistance
interpretation
Plasm
aDBS
Plasm
aDBS
Plasm
aDBS
15Yb
432,000
D30N,V82A,
L90M,N88D
D30N,V82A,
L90M,N88D
None
None
ATV/r,FVP/r,ID
V/r,LPV/r,
NFV,SQV/r.
ATV/r,FVP/r,ID
V/r,LPV/r,
NFV,SQV/r.
20Y
50,000
None
None
None
None
None
None
?7Va,b
28,000
G73S,L90M
L90M
M41L,M184V,K219R
M41L,K219KR
ATV/r,ID
V/r,NFV,SQV/r.
3TC,ABC,FTC.
IDV/r,N
FV,S
QV/r.A
ZT,D
4T
10V
275,000
I84V,N88D
I84V,N88D
None
None
ATV/r,FVP/r,ID
V/r,NFV,
SQV/r.
ATV/r,FVP/r,ID
V/r,NFV,
SQV/r.
12Vb
635,000
V32I,M46I,
V82A
V32I,M46I,
V82A
M184V
M184V
ATV/r,FVP/r,ID
V/r,LPV/r,
NFV.3TC,FTC
ATV/r,FVP/r,ID
V/r,LPV/r,
NFV.3TC,FTC
1NLa
499,000
M46I,I47V,
I54AS,V82F,
L90M
M46I,I47V,
I54AS,V82F,
L90M
M41L,D67N,L74I,
V106A,G190A,T215D
M41L,D67N,L74I,
V106A,G190A,T215D
ATV/r,DRV/r,FVP/r,ID
V/r,
LPV/r,NFV,SQV/r,TPV/r.
ABC,AZT,D4T,DDI,FTC,
TDF,DLV,EFV,ETR,NVP.
ATV/r,DRV/r,FVP/r,ID
V/r,
LPV/r,NFV,SQV/r,TPV/r.
ABC,AZT,D4T,DDI,FTC,
TDF,DLV,EFV,ETR,NVP.
Sam
plesweream
plified
andsequencedusingtheCeleraDiagnosticsViroSeq
HIV
-1GenotypingSystem
(version2.0).Sequence
analysiswas
perform
edwithCLCbio
5.1software.Residues
inplain
textindicatecodonsin
thePRandtheRTgenes.Residues
inbold
arecodonsthat
differin
thepairedplasm
aandDBSsamples.ARV
drugsin
bold
arethose
that
differedin
thepaired
plasm
aandDBSsamples
DFDistritoFederal,JJalisco,YYucatan,VVeracruz,
NLNuevoLeon
aMixture,wildtypeandmutation
bForthesesamples,discordanceswereobserved
withViroSeq
software.
?A
proteaseresistance
mutationwas
detectedin
aDBSspecim
enbutnotin
itsplasm
acounterpart,oraprotease
resistance
mutationwas
detectedin
theplasm
aspecim
en,butnotin
itsDBScounterpart,partially
changingthegenotypeinterpretationin
theRTI
R. Lira et al.
123
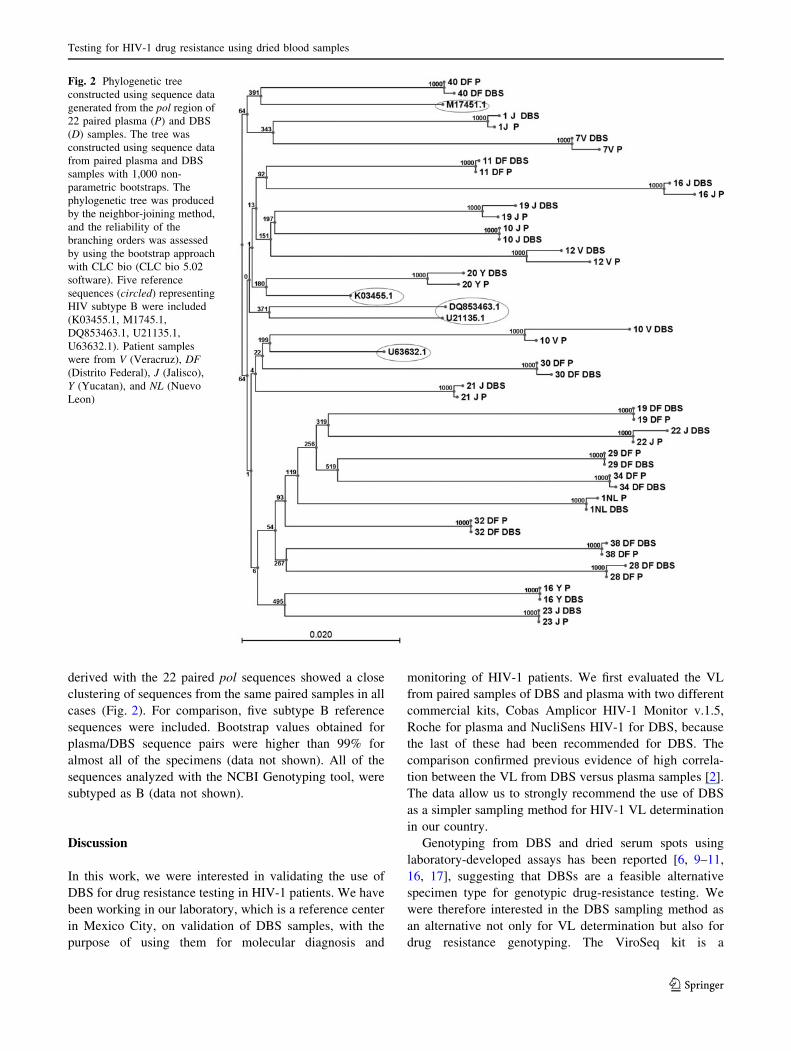
derived with the 22 paired pol sequences showed a closeclustering of sequences from the same paired samples in all
cases (Fig. 2). For comparison, five subtype B reference
sequences were included. Bootstrap values obtained forplasma/DBS sequence pairs were higher than 99% for
almost all of the specimens (data not shown). All of the
sequences analyzed with the NCBI Genotyping tool, weresubtyped as B (data not shown).
Discussion
In this work, we were interested in validating the use ofDBS for drug resistance testing in HIV-1 patients. We have
been working in our laboratory, which is a reference center
in Mexico City, on validation of DBS samples, with thepurpose of using them for molecular diagnosis and
monitoring of HIV-1 patients. We first evaluated the VLfrom paired samples of DBS and plasma with two different
commercial kits, Cobas Amplicor HIV-1 Monitor v.1.5,
Roche for plasma and NucliSens HIV-1 for DBS, becausethe last of these had been recommended for DBS. The
comparison confirmed previous evidence of high correla-
tion between the VL from DBS versus plasma samples [2].The data allow us to strongly recommend the use of DBS
as a simpler sampling method for HIV-1 VL determination
in our country.Genotyping from DBS and dried serum spots using
laboratory-developed assays has been reported [6, 9–11,
16, 17], suggesting that DBSs are a feasible alternativespecimen type for genotypic drug-resistance testing. We
were therefore interested in the DBS sampling method as
an alternative not only for VL determination but also fordrug resistance genotyping. The ViroSeq kit is a
Fig. 2 Phylogenetic treeconstructed using sequence datagenerated from the pol region of22 paired plasma (P) and DBS(D) samples. The tree wasconstructed using sequence datafrom paired plasma and DBSsamples with 1,000 non-parametric bootstraps. Thephylogenetic tree was producedby the neighbor-joining method,and the reliability of thebranching orders was assessedby using the bootstrap approachwith CLC bio (CLC bio 5.02software). Five referencesequences (circled) representingHIV subtype B were included(K03455.1, M1745.1,DQ853463.1, U21135.1,U63632.1). Patient sampleswere from V (Veracruz), DF(Distrito Federal), J (Jalisco),Y (Yucatan), and NL (NuevoLeon)
Testing for HIV-1 drug resistance using dried blood samples
123

commercial assay that amplifies a 1.8-kb pol region frag-
ment and has a sensitivity of detection of 2,000 HIV-1RNA copies/mL of plasma [9]. From the 57 paired samples
tested with the ViroSeq assay, the amplification rate of the
1.8-kb pol-fragment falls within the range of 4.2–5.0 log10and increases for viral loads greater than 5.1 log10 copies/
mL, resulting in amplification of 79% (15/19) of the
samples. We therefore conclude from this study that sam-ples with VL above 5.1 log10 were successfully amplified
with the ViroSeq kit. The rates of successful amplificationusing laboratory-developed genotyping assays with com-
mercial and in-house methods have a reported range of
7.82–93.1%, indicating that DBSs are a feasible alternativespecimen type for genotypic drug-resistance testing [6, 11,
18]. In our study, 38.6% of the DBS samples were
amplified, suggesting that improved assay sensitivity is stillneeded for the routine use of DBS for monitoring of ART-
treated individuals for drug resistance using the ViroSeq
system. Technical solutions offering better elution andextraction efficiencies with DBS samples should improve
the sensitivity of the method. Elution from the filter paper
is likely to be one of the most sensitive steps, but this doesnot rule out some other problems, such as correct storage of
the samples, errors in sequencing, and reagent or kit
variability.The use of equivalent volumes of sample could be an
important factor involved in amplification failure. In this
study, the volume of plasma present in four DBS spots(50 lL/spot), considering an initial volume of 200 lL of
whole blood with a hematocrit value of 40% was approxi-
mately equivalent to 100 lL of plasma required for oneViroSeq assay. In the case where all of the volume eluted
from four spots was needed, equivalent volumes of both
samples were used. However, several unsuccessful attemptswere made to assay samples that were not amplified,
including increasing the number of spots to eight. We
therefore suggest that for those sample, the storage condi-tions, mainly the humidity, could be a determining factor.
With regard to DBS storage conditions, some authors
have reported that HIV-1 RNA from DBS samples wasstable at room temperature and -70"C for at least 1 year,
and possibly longer [18–20]. It has also been reported the
HIV-1 RNA degradation may occur under suboptimalstorage conditions [19, 20]. We were interested in testing if
the failure to amplify some samples could be due to
inappropriate storage conditions. For this purpose, weamplified a smaller fragment, a 700-bp fragment from the
PR region, using an in-house PCR method. Two different
DBS samples that had not been amplified with ViroSeqwere used, and amplification of the 700-bp fragment was
observed with both samples (data not shown), suggesting
that maybe some partial degradation of HIV RNA couldhave occurred, resulting in the inability of the ViroSeq
system to amplify a longer fragment (1.8 kb). Unfortu-
nately, it was not possible to test this with the rest of thesamples because they had been used up during multiple
attempts at amplification with the ViroSeq kit. Youngpairoj
et al. [20] evaluated humidity in DBS after 6 months ofstorage and found that half of the samples had evidence of
humidity. They recommend changing the desiccant bag,
during long-term storage. It is also important to mentionthat our samples were stored in a non-frost freezer, and the
desiccant sachet did not contain a humidity indicator, norwas it changed during the time of storage (more than
6 months). Therefore, we suggest that partial degradation
of the RNA may have occurred during long-term storage at-70"C, possibly due to suboptimal storage temperature,
humidity or both. Therefore, the presence of a mixed
infection cannot be ruled out.We identified discordances in some of the samples
analyzed using ViroSeq software (version 2.8) that could
be due to the low level of resolution of the eight sequences.We demonstrated that edition problems were resolved
when a consensus pol sequence was obtained using CLC
bio software and the Stanford Genotypic ResistanceInterpretation Algorithm. The majority of samples with
previous discordances in the genotype were resolved,
except for one of them. We suggest that mixed populationswere present in the same sample. We were able to identify
mixtures of wild-type and resistant viruses using the
Stanford University HIV drug resistance database. Analysiswith this bioinformatic tool gives a report that shows
mutations when a mixture is present in the amplified
fragment. Evidence of wild-type and resistant populationsbeing present in the same sample was also reported in this
study. Finally, the 22 pol nucleotide and deduced amino
acid sequences that were obtained showed a high degree ofsimilarity, indicating a high sequence concordance (95–
99%). A good concordance was also obtained in resistance-
associated mutations as well as in interpretation of drugresistance genotypes (94.5%). The validation of DBS as a
sampling method for drug resistance genotyping is still
very important, especially in highly immunosuppressedpatients and children from whom fluid blood specimens are
scarce. It has been reported that children have higher rates
of virological failure than adults [21] and a broad range ofviremia (VL 193 to 3 million HIV-1 RNA copies/mL).
Higher rates of drug resistance and failure have been
reported in resource-limited settings than in well-resourcedsettings because, often, only one or few treatment regimens
are available for prophylaxis and patient management. This
is a serious problem and a reason why the validation of lessexpensive sampling methods for drug resistance testing is
needed in our country.
In conclusion, our results demonstrate that DBS samplesare a potential alternative to plasma as a good specimen
R. Lira et al.
123

source for HIV-1 resistance genotyping. Factors were
identified that could potentially improve both the sensi-tivity and the quality of genotype data, such as storage of
sample and sequence analysis. Therefore, DBS sampling is
useful for determining viral load and drug resistancegenotypes in Mexican HIV-1 patients.
Acknowledgments This work was supported by Consejo Nacionalde Ciencia y Tecnologia (CONACYT-SALUD 2004-01-008). Wethank Dr. Ana Ma. Cevallos for valuable comments and reviewing themanuscript, and Dr. Margarita Dehesa for inclusion of patients.
Conflict of interest statement The authors declare that they haveno conflict of interest.
References
1. Zolopa AR (2006) Incorporating drug-resistance measurementsinto the clinical management of HIV-1 infection. J Infect Dis194(Suppl 1):S59–S64
2. Alvarez-Munoz MT, Zaragoza-Rodriguez S, Rojas-Montes O,Palacios-Saucedo G, Vazquez-Rosales G, Gomez-Delgado A,Torres J, Munoz O (2005) High correlation of human immuno-deficiency virus type-1 viral load measured in dried-blood spotsamples and in plasma under different storage conditions. ArchMed Res 36:382–386
3. Cassol SA, Read S, Weniger BG, Gomez P, Lapointe N, Ou CY,Babu PG (1996) Dried blood spots collected on filter paper: aninternational resource for the diagnosis and genetic character-ization of human immunodeficiency virus type-1. Mem InstOswaldo Cruz 91:351–358
4. Uttayamakul S, Likanonsakul S, Sunthornkachit R, KuntiranontK, Louisirirotchanakul S, Chaovavanich A, Thiamchai V,Tanprasertsuk S, Sutthent R (2005) Usage of dried blood spots formolecular diagnosis and monitoring HIV-1 infection. J VirolMethods 128:128–134
5. Masciotra S, Garrido C, Youngpairoj AS, McNulty A, ZahoneroN, Corral A, Heneine W, De MC, Garcia-Lerma JG (2007) Highconcordance between HIV-1 drug resistance genotypes generatedfrom plasma and dried blood spots in antiretroviral-experiencedpatients. AIDS 21:2503–2511
6. Bertagnolio S, Soto-Ramirez L, Pilon R, Rodriguez R, ViverosM, Fuentes L, Harrigan PR, Mo T, Sutherland D, Sandstrom P(2007) HIV-1 drug resistance surveillance using dried wholeblood spots. Antivir Ther 12:107–113
7. Buckton AJ (2008) New methods for the surveillance of HIVdrug resistance in the resource poor world. Curr Opin Infect Dis21:653–658
8. Buckton AJ, Bissett SL, Myers RE, Beddows S, Edwards S, CanePA, Pillay D (2008) Development and optimization of an inter-nally controlled dried blood spot assay for surveillance of humanimmunodeficiency virus type-1 drug resistance. J AntimicrobChemother 62:1191–1198
9. McNulty A, Jennings C, Bennett D, Fitzgibbon J, Bremer JW,Ussery M, Kalish ML, Heneine W, Garcia-Lerma JG (2007)Evaluation of dried blood spots for human immunodeficiencyvirus type 1 drug resistance testing. J Clin Microbiol 45:517–521
10. Plantier JC, Dachraoui R, Lemee V, Gueudin M, Borsa-Lebas F,Caron F, Simon F (2005) HIV-1 resistance genotyping on driedserum spots. AIDS 19:391–397
11. Ziemniak C, George-Agwu A, Moss WJ, Ray SC, Persaud D(2006) A sensitive genotyping assay for detection of drug resis-tance mutations in reverse transcriptase of HIV-1 subtypes B andC in samples stored as dried blood spots or frozen RNA extracts.J Virol Methods 136:238–247
12. Beck IA, Drennan KD, Melvin AJ, Mohan KM, Herz AM,Alarcon J, Piscoya J, Velazquez C, Frenkel LM (2001) Simple,sensitive, and specific detection of human immunodeficiencyvirus type 1 subtype B DNA in dried blood samples for diagnosisin infants in the field. J Clin Microbiol 39:29–33
13. Rivera-Morales LG, Novitsky VA, Trujillo JR, Lavalle-MontalvoC, Cano-Dominguez C, Ramos-Jimenez J, Jimenez-Rios E,Flores-Flores L, Lopez-Guillen P, Gilbert P, Vannberg F, Tamez-Guerra R, Rodriguez-Padilla C, Essex M (2001) The molecularepidemiology of HIV type 1 of men in Mexico. AIDS Res HumRetroviruses 17:87–92
14. Gomez-Carrillo M, Pampuro S, Duran A, Losso M, Harris DR,Read JS, Duarte G, De SR, Soto-Ramirez L, Salomon H (2006)Analysis of HIV type 1 diversity in pregnant women from fourLatin American and Caribbean countries. AIDS Res Hum Ret-roviruses 22:1186–1191
15. Tamura K, Dudley J, Nei M, Kumar S (2007) MEGA4: Molec-ular evolutionary genetics analysis (MEGA) software version 4.0.Mol Biol Evol 24:1596–1599
16. Nyambi PN, Fransen K, De BH, Chomba EN, Temmerman M,Ndinya-Achola JO, Piot P, Van der GG (1994) Detection ofhuman immunodeficiency virus type 1 (HIV-1) in heel prickblood on filter paper from children born to HIV-1-seropositivemothers. J Clin Microbiol 32:2858–2860
17. Steegen K, Luchters S, Demecheleer E, Dauwe K, Mandaliya K,Jaoko W, Plum J, Temmerman M, Verhofstede C (2007) Feasi-bility of detecting human immunodeficiency virus type 1 drugresistance in DNA extracted from whole blood or dried bloodspots. J Clin Microbiol 45:3342–3351
18. Hallack R, Doherty LE, Wethers JA, Parker MM (2008) Evalu-ation of dried blood spot specimens for HIV-1 drug-resistancetesting using the Trugene HIV-1 genotyping assay. J Clin Virol41:283–287
19. O’Shea S, Mullen J, Corbett K, Chrystie I, Newell ML, BanatvalaJE (1999) Use of dried whole blood spots for quantification ofHIV-1 RNA. AIDS 13:630–631
20. Youngpairoj AS, Masciotra S, Garrido C, Zahonero N, De MC,Garcia-Lerma JG (2008) HIV-1 drug resistance genotyping fromdried blood spots stored for 1 year at 4"C. J Antimicrob Che-mother 61:1217–1220
21. Shearer WT, Quinn TC, LaRussa P, Lew JF, Mofenson L, AlmyS, Rich K, Handelsman E, Diaz C, Pagano M, Smeriglio V,Kalish LA (1997) Viral load and disease progression in infantsinfected with human immunodeficiency virus type 1. Women andInfants Transmission Study Group. N Engl J Med 336:1337–1342
Testing for HIV-1 drug resistance using dried blood samples
123
Copyright © 2022 FDOKUMEN