Inter- and Intra-subtype genotypic differences that differentiate Mycobacterium avium subspecies...
12
RESEARCH ARTICLE Open Access Inter- and Intra-subtype genotypic differences that differentiate Mycobacterium avium subspecies paratuberculosis strains Franck Biet 1*† , Iker A Sevilla 2† , Thierry Cochard 1 , Louise H Lefrançois 1 , Joseba M Garrido 2 , Ian Heron 3 , Ramón A Juste 2 , Joyce McLuckie 3 , Virginie C Thibault 1 , Philip Supply 4,5,6,7 , Desmond M Collins 8 , Marcel A Behr 9 and Karen Stevenson 3 Abstract Background: Mycobacterium avium subspecies paratuberculosis (Map) is the aetiological agent of Johne’s disease or paratuberculosis and is included within the Mycobacterium avium complex (MAC). Map strains are of two major types often referred to as ‘Sheep’ or ‘S-type’ and ‘Cattle’ or ‘C-type’. With the advent of more discriminatory typing techniques it has been possible to further classify the S-type strains into two groups referred to as Type I and Type III. This study was undertaken to genotype a large panel of S-type small ruminant isolates from different hosts and geographical origins and to compare them with a large panel of well documented C-type isolates to assess the genetic diversity of these strain types. Methods used included Mycobacterial Interspersed Repetitive Units - Variable-Number Tandem Repeat analysis (MIRU-VNTR), analysis of Large Sequence Polymorphisms by PCR (LSP analysis), Single Nucleotide Polymorphism (SNP) analysis of gyr genes, Pulsed-Field Gel Electrophoresis (PFGE) and Restriction Fragment Length Polymorphism analysis coupled with hybridization to IS900 (IS900-RFLP) analysis. Results: The presence of LSP A 4 and absence of LSP A 20 was confirmed in all 24 Map S-type strains analysed. SNPs within the gyr genes divided the S-type strains into types I and III. Twenty four PFGE multiplex profiles and eleven different IS900-RFLP profiles were identified among the S-type isolates, some of them not previously published. Both PFGE and IS900-RFLP segregated the S-type strains into types I and III and the results concurred with those of the gyr SNP analysis. Nine MIRU-VNTR genotypes were identified in these isolates. MIRU-VNTR analysis differentiated Map strains from other members of Mycobacterium avium Complex, and Map S-type from C-type but not type I from III. Pigmented Map isolates were found of type I or III. Conclusion: This is the largest panel of S-type strains investigated to date. The S-type strains could be further divided into two subtypes, I and III by some of the typing techniques (IS900-RFLP, PFGE and SNP analysis of the gyr genes). MIRU-VNTR did not divide the strains into the subtypes I and III but did detect genetic differences between isolates within each of the subtypes. Pigmentation is not exclusively associated with type I strains. Background The aetiologic agent of Johne’ s disease or paratuberculo- sis, M. avium subsp. paratuberculosis (Map), is one of the subspecies included in the Mycobacterium avium Complex (MAC). Based on the comparison of whole- genomes of Map, a biphasic evolution scheme has been proposed distinguishing two major lineages, a sheep lineage and a cattle lineage [1]. In addition to genotypic differences [2,3], strains belonging to these two lineages exhibit phenotypic differences including growth rate [2-4], utilization of different iron metabolic pathways [4], pro- file of cytokine responses induced in bovine macrophages [5] or transcriptional profiles in a human macrophage model [6]. The association of each lineage with either the sheep or cattle host is not exclusive since strains representative of either lineage can cause disease in all types of ruminants. Historically, strains belonging * Correspondence: [email protected] † Equal contributors 1 INRA, UMR1282, Infectiologie Santé Publique (ISP-311), Nouzilly F-37380, France Full list of author information is available at the end of the article © 2012 Biet et al.; licensee BioMed Central Ltd. This is an Open Access article distributed under the terms of the Creative Commons Attribution License (http://creativecommons.org/licenses/by/2.0), which permits unrestricted use, distribution, and reproduction in any medium, provided the original work is properly cited. Biet et al. BMC Microbiology 2012, 12:264 http://www.biomedcentral.com/1471-2180/12/264
-
Upload
independent -
Category
Documents
-
view
2 -
download
0
Transcript of Inter- and Intra-subtype genotypic differences that differentiate Mycobacterium avium subspecies...

Biet et al. BMC Microbiology 2012, 12:264http://www.biomedcentral.com/1471-2180/12/264
RESEARCH ARTICLE Open Access
Inter- and Intra-subtype genotypic differencesthat differentiate Mycobacterium aviumsubspecies paratuberculosis strainsFranck Biet1*†, Iker A Sevilla2†, Thierry Cochard1, Louise H Lefrançois1, Joseba M Garrido2, Ian Heron3,Ramón A Juste2, Joyce McLuckie3, Virginie C Thibault1, Philip Supply4,5,6,7, Desmond M Collins8, Marcel A Behr9
and Karen Stevenson3
Abstract
Background: Mycobacterium avium subspecies paratuberculosis (Map) is the aetiological agent of Johne’s disease orparatuberculosis and is included within the Mycobacterium avium complex (MAC). Map strains are of two majortypes often referred to as ‘Sheep’ or ‘S-type’ and ‘Cattle’ or ‘C-type’. With the advent of more discriminatory typingtechniques it has been possible to further classify the S-type strains into two groups referred to as Type I and TypeIII. This study was undertaken to genotype a large panel of S-type small ruminant isolates from different hosts andgeographical origins and to compare them with a large panel of well documented C-type isolates to assess thegenetic diversity of these strain types. Methods used included Mycobacterial Interspersed Repetitive Units -Variable-Number Tandem Repeat analysis (MIRU-VNTR), analysis of Large Sequence Polymorphisms by PCR (LSPanalysis), Single Nucleotide Polymorphism (SNP) analysis of gyr genes, Pulsed-Field Gel Electrophoresis (PFGE) andRestriction Fragment Length Polymorphism analysis coupled with hybridization to IS900 (IS900-RFLP) analysis.
Results: The presence of LSPA4 and absence of LSPA20 was confirmed in all 24 Map S-type strains analysed. SNPswithin the gyr genes divided the S-type strains into types I and III. Twenty four PFGE multiplex profiles and elevendifferent IS900-RFLP profiles were identified among the S-type isolates, some of them not previously published.Both PFGE and IS900-RFLP segregated the S-type strains into types I and III and the results concurred with those ofthe gyr SNP analysis. Nine MIRU-VNTR genotypes were identified in these isolates. MIRU-VNTR analysis differentiatedMap strains from other members of Mycobacterium avium Complex, and Map S-type from C-type but not type Ifrom III. Pigmented Map isolates were found of type I or III.
Conclusion: This is the largest panel of S-type strains investigated to date. The S-type strains could be furtherdivided into two subtypes, I and III by some of the typing techniques (IS900-RFLP, PFGE and SNP analysis of the gyrgenes). MIRU-VNTR did not divide the strains into the subtypes I and III but did detect genetic differences betweenisolates within each of the subtypes. Pigmentation is not exclusively associated with type I strains.
BackgroundThe aetiologic agent of Johne’s disease or paratuberculo-sis, M. avium subsp. paratuberculosis (Map), is one ofthe subspecies included in the Mycobacterium aviumComplex (MAC). Based on the comparison of whole-genomes of Map, a biphasic evolution scheme has been
* Correspondence: [email protected]†Equal contributors1INRA, UMR1282, Infectiologie Santé Publique (ISP-311), Nouzilly F-37380,FranceFull list of author information is available at the end of the article
© 2012 Biet et al.; licensee BioMed Central LtdCommons Attribution License (http://creativecreproduction in any medium, provided the or
proposed distinguishing two major lineages, a sheeplineage and a cattle lineage [1]. In addition to genotypicdifferences [2,3], strains belonging to these two lineagesexhibit phenotypic differences including growth rate [2-4],utilization of different iron metabolic pathways [4], pro-file of cytokine responses induced in bovine macrophages[5] or transcriptional profiles in a human macrophagemodel [6]. The association of each lineage with eitherthe sheep or cattle host is not exclusive since strainsrepresentative of either lineage can cause disease inall types of ruminants. Historically, strains belonging
. This is an Open Access article distributed under the terms of the Creativeommons.org/licenses/by/2.0), which permits unrestricted use, distribution, andiginal work is properly cited.

Biet et al. BMC Microbiology 2012, 12:264 Page 2 of 12http://www.biomedcentral.com/1471-2180/12/264
to the sheep lineage have been referred to as ‘Sheep orS-type’ and those of the cattle lineage ‘Cattle or C-type’according to the species from which they were first iso-lated. As the technologies for molecular typing advancedand more genotyping studies were undertaken, greatergenetic diversity was detected within both the S- and C-type strains. Pulsed-field gel electrophoresis (PFGE)revealed three strain types designated Types I, II and III[7,8]. Type II is synonymous with C-type and types I andIII comprise the S-type. In this paper we will use theterm S-type to describe collectively type I and III strainsand have designated the types I and III as subtypes. S-typestrains have not been characterized to the same extentas C-type strains due to the difficulty in culturing thestrains in vitro resulting in a limited number of strainsavailable for such studies. Here we undertook the firstcomprehensive genotyping study of a large representa-tive panel of S-type strains using various typing meth-ods that have been applied to Map strains, individually orin combinations, to draw a portrait of S-type strains. Westudied both inter and intra-subtype genotypic straindifferences using restriction fragment length polymor-phism analysis coupled with hybridization to IS900 (IS900RFLP), PFGE and various PCRs based on variable-numbertandem repeat (VNTR) loci and mycobacterial inter-spersed repetitive units (MIRUs) [9,10] MIRU-VNTRtyping [11], the presence or absence of large sequencepolymorphisms (LSPs) [12] and the gyrA and B genes[13]. Our panel of S-type strains comprised strainsfrom different geographic origins with different restrictionenzyme profiles and includes pigmented strains. We alsoincorporated typing data obtained for additional MapC-type isolates to represent the all diversity of the geno-types described and Mycobacterium. avium subsp. avium(Maa) Mycobacterium. avium subsp. silvaticum (Mas)and Mycobacterium avium subsp. hominissuis (Mah)for comparison.
MethodsPanel of strainsA total of 24 Map S-type isolates were obtained fromScotland (n = 6), Spain (n = 11), Canada (n = 2), NewZealand (n = 2), Faroe Islands (n = 2) and Iceland (n = 1),isolated from sheep, goats and a pig (see Table 1 andAdditional file 1: Table S1). Isolates were propagated onslopes of one of the following media depending on whatwas used routinely in the supply laboratories: modifiedMiddlebrook 7H11 supplemented with 20% (vol/vol) heat-inactivated newborn calf serum, 2.5% (vol/vol) glycerol,2 mM asparagine, 10% (vol/vol) Middlebrook oleic acid-al-bumin-dextrose-catalase (OADC) enrichment medium(Becton Dickinson, Oxford, Oxfordshire, United Kingdom),Selectatabs (code MS 24; MAST Laboratories Ltd., Mer-seyside, United Kingdom), and 2 μg ml-1 mycobactin J
(Allied Monitor, Fayette, Mo.); Herrold’s egg yolk mediumwith 2 μg ml−1 mycobactin J or Lowenstein-Jensenmedium with 2 μg ml−1 mycobactin J. In addition, geno-typing information obtained previously [11,18,19] from 148Map C-type strains, 31 Maa isolates, 4 Mas isolates and 82Mah isolates were used for comparison and phylogeneticanalyses and are described in Additional file 1: Table S1.
IS900-RFLP methodMap strains were typed by IS900-RFLP as described pre-viously [11]. Profiles were designated according to no-menclature previously described [17,20-22]. Profileswere analysed using Bionumerics™ software version 6.5(Applied Maths, Belgium).
PFGE analysisPFGE analysis was carried out using SnaBI and SpeIaccording to the published standardized procedure ofStevenson et al. [8] with the following modifications.Plugs were prepared to yield a density of 1.2 × 10¹⁰ cellsml-1 and the incubation time in lysis buffer wasincreased to 48 hr. The concentration of lysozyme wasincreased to 4 mg ml-1. Incubation with proteinase Kwas carried out for a total of seven days and the enzymewas refreshed after four days. Restriction of plug DNAby SpeI was performed with 10U overnight after whichthe enzyme was refreshed and incubated for a further6 hr. The parameters for electrophoresis of SpeI restric-tion fragments were changed to separate fragments ofbetween 20 and 250Kb as determined by the CHEFMAPPER and electrophoresis was performed for 40 hr.Gel images were captured using an Alphaimager 2200(Alpha Innotech). Profiles were analysed using Bionu-merics™ software version 6.5 (Applied Maths, Belgium).
SNP analysis of gyrA and gyrB genesPrimers (Additional file 2: Table S2) were designed forboth gyrA (GenBank accession no. 2720426 [Genomenumber: NC_002944.2]) and gyrB genes (GenBank acces-sion no. 2717659 [Genome number: NC_002944.2]). ThePCR mixture was composed as follows using the GoTaqFlexi DNA polymerase (Promega). Two microliters ofDNA solution was added to a final volume of 50 μl con-taining 0.2 μl of GoTaq Flexi DNA polymerase (5 U/μl),2 mM (each) dATP, dCTP, dGTP, and dTTP (Promega);10 μl of 5x PCR buffer supplied by the manufacturer;1 μM of each primers; and 1.5 mM of MgCl2. The reac-tions were carried out using a TC-512 thermal cycler(Techne). PCR conditions were as follows: 1 cycle of5 min at 94°C; 30 cycles of 30 s at 94°C, 30 s at 58°C, and30 s at 72°C; and 1 cycle of 7 min at 72°C. PCR productswere visualized by electrophoresis using 1.5% agarose gels(agarose electrophoresis grade; Invitrogen), purified usingNucleoSpinW Extract II (Macherey-Nagel) and sequenced

Table 1 Synthesis of information and genotyping data of S strains of Map by subtype
Strain Subtype Origin Profile MIRU-VNTR
Patterns5
SNPGyrA & B
LSP6
A20 4
Pigmentation StrainsReferencesHost Country1
regionsRFLP2 PFGE3 MIRU-
VNTR4
6756 Ovine NZ S1 nd INMV 72 41331118 A/C C/C - + [14]
6759 Ovine NZ S1 nd INMV 72 41331118 A/C C/C - + [14]
P133/79 Ovine FO S2 nd INMV 70 71331118 A/C C/C - + [15]
21P Ovine FO S2 [9] INMV 70 71331118 A/C C/C - + + [8]
235 G I Ovine UK, Shetland S2 [75–8] INMV 70 71331118 A/C C/C - + + [8]
M189 Ovine UK, Scotland S2 [7] INMV 21 51331118 A/C C/C - + + [8]
M15/04 Ovine UK, Scotland S2 [nd-70] INMV 70 71331118 A/C C/C - + + [8]
M254/04 Ovine UK, Scotland S2 nd INMV 32 61331118 A/C C/C - + + This study
M71/03 Ovine UK, Scotland S2 [80–71] INMV 70 71331118 A/C C/C - + + This study
M72/03 Ovine UK, Scotland S2 [77–70] INMV 70 71331118 A/C C/C - + + This study
22 G Ovine ES, Basque A [69–50] INMV 84 91331118 A/T C/T - + [16]
OVICAP16 Caprine ES, Andalucia A [65–61] INMV 85 (11)1331118 A/T C/T - + [16]
OVICAP49 Ovine ES, Navarra A [57–57] INMV 70 71331118 A/T C/T - + + This study
21I Ovine ES, Basque B [61–47] INMV 70 71331118 A/T C/T - + [16]
PCR311 Caprine ES, Balearic B [16–47] INMV 70 71331118 A/T C/T - + [16]
19I Ovine ES, Basque C [79–55] INMV 70 71331118 A/T C/T - + [16]
85/14 III Ovine CA C nd INMV 27 81331118 A/T C/T - + [14]
OVICAP34 Ovine ES, Basque D [66–62] INMV 21 51331118 A/T C/T - + This study
18I Ovine ES, Basque E [67–51] INMV 84 91331118 A/T C/T - + [16]
FO21 Ovine ES, Aragon F [56–56] INMV 84 91331118 A/T C/T - + + This study
LN20 Porcine CA I1 nd INMV 71 51131118 A/T C/T - + [14]
269OV Ovine ES, Basque I10 [69–54] INMV 72 41331118 A/T C/T - + [16]
M284/08 Ovine ES, Basque I10 [71–64] INMV 72 41331118 A/T C/T - + [16]
P465 Ovine IS I2 nd INMV 73 20331118 A/T C/T - + This study1 Country and regions: ES, Spain; CA, Canada; UK, United Kingdom; FO, Faroe Island; IS, Iceland; NZ, New Zealand.2 nd, not determined; alphanumeric nomenclature as defined by Pavlik et al., 1999 [17], alphabetic nomenclature correspond to new profiles identified in this study.3 Nomenclature as defined by Stevenson et al., 2002 [8].4 Nomenclature as defined by Thibault et al., 2007 [11].5 Number of repeats at locus 292-X3-25-47-3-7-10-32 defined by Thibault et al., 2007 [11].6 +, presence; -, absence.
Biet et al. BMC Microbiology 2012, 12:264 Page 3 of 12http://www.biomedcentral.com/1471-2180/12/264
by GenomExpress (Grenoble, France). Sequence analysisand SNP detection were performed by using the Bionu-merics™ software version 6.5 (Applied Maths, Belgium).
LSP analysisPrimers were used according to Semret et al. [12] anddescribed in Additional file 2: Table S2. The PCR mix-ture comprised 2 μl of DNA solution added to a finalvolume of 50 μl containing 0.2 μl of GoTaq Flexi DNApolymerase (5 U/μl Promega), 2 mM (each) dATP, dCTP,dGTP, and dTTP (Promega); 10 μl of 5x PCR buffer sup-plied by the manufacturer; 1 μM of each primers; 1 μLof dimethyl sulfoxide (Sigma) and 1.5 mM of MgCl2.The reactions were carried out using a TC-512 thermalcycler (Techne). PCR conditions were as follows: 1 cycleof 5 min at 94°C; 30 cycles of 30 s at 94°C, 30 s at 55°C,and 30 s at 72°C; and 1 cycle of 7 min at 72°C. To detect
presence or absence of each LSP, PCR products wereanalyzed by electrophoresis using 1.5% agarose gels.
MIRU-VNTR analysisDNA in agarose plugs prepared for PFGE analysis wasused for MIRU-VNTR analysis according to Stevensonet al. [23]. Small pieces of agarose plug, approximately2 mm thick, were washed in TE buffer (pH 8) to removeresidual EDTA in the storage buffer. One hundredmicrolitres of TE buffer were added to the agarose andthe sample boiled for 10 min to melt the agarose. Fivemicrolitres were used for PCR and MIRU-VNTR ana-lysis interrogating eight polymorphic loci was performedas described by Thibault et al. [11]. The allelic diversity(h) at a locus was calculated by using Nei’s index (seeAdditional file 3: Table S4) h = 1 −
Pxi
2 [n/(n − 1)],

Biet et al. BMC Microbiology 2012, 12:264 Page 4 of 12http://www.biomedcentral.com/1471-2180/12/264
where xi is the frequency of the ith allele at the locus,and n the number of isolates [24].
Calculation of the discriminatory powerThe Simpson Discrimination Index (DI) described byHunter and Gaston [25] was used as a numerical index forthe discriminatory power of each typing method PFGE,IS900-RFLP and MIRU-VNTR and combinations of thetyping methods (see Table 2 and Additional file 3: TableS4). The DI was calculated using the following formula:
DI ¼ 1� 1N N�ð Þ
Xs
j¼1
nj nj � 1� �" #
Where N is the total number of isolates in the typ-ing scheme, s is the total number of distinct patternsdiscriminated by each typing method and strategy, andnj is the number of isolates belonging to the jthpattern.
ResultsLSP analysisThe existence of two major Map lineages was previouslysupported by the distribution of two LSPs specific forMap as described by Semret et al. [12,26,27]: the regioncorresponding to LSPA20 is specifically absent fromstrains of the sheep lineage whereas that correspondingto LSPA4 is specifically absent from strains of the cat-tle lineage. The distribution of these LSPs was thusinvestigated across our representative panel of MapS-type strains from various origins. As shown in Fig-ure 1, analysis by PCR supports the association of theLSPA20 region with C-type strains whereas the LSPA4region is present in all S-type strains. Presence of the
Table 2 Discriminatory Index of IS900 RFLP, MIRU-VNTR and
Typing methods
Subtypes I
IS900 RFLP No.2 10
DI 0.356
PFGE SnaB1 No. 5
DI 1.000
PFGE Spe1 No. 5
DI 1.000
PFGE (SnaB1-Spe1) No. 5
DI 1.000
MIRU-VNTR No. 10
DI 0.644
IS900 RFLP +MIRU-VNTR No. 10
DI 0.6441: Panel of strains selected to represented the whole diversity of RFLP and MIRU-VN2: No. Number of strains analyzed.
LSPA4 region was not related to PFGE subtype I ver-sus III, of the country of origin and pigmentation sta-tus (Table 1).
SNP analysisSince SNPs found in gyrA and B genes have beenreported to be subtype (I, II, III)-specific, the panel ofMap S-type strains was subjected to SNP analysis andcompared to C type K-10 strain. As shown in Table 3,consensus sequences obtained matched those previ-ously published and distinguished types I, II and IIIof Map.
PFGE typingPFGE analysis results were obtained for 15 S-type and24 C-type strains (Figure 2A and 2B). The sequencedK10 type II strain was also included. SnaB1 or SpeI ana-lyses segregated strains according to the two sheep andcattle lineages and at the subtype level I, II and III. WithSnaBI and SpeI individually, 5 different profiles wereobtained for the 5 type I strains and 9 different profilesfor the 10 type III strains. The type II strains exhibited15 different SnaBI profiles, with profile [2] being themost frequent (8 strains) and 14 different SpeI profileswith profile [1] being the most frequent (11 strains). TheDI of the subtype I and subtype III were respectively 1and 0.956 for SnaB1 and 1 and 0.978 for SpeI and thatof C-type (Type II) was 0.895 for SnaBI and 0.801 forSpeI (see Table 2 and Additional file 3: Table S4). DI of0.96 and 0.924 for SnaBI and SpeI respectively wasachieved for the 39 Map strains presented in Figure 2Aand 2B. The combination of both enzymes gave 39unique multiplex profiles (see Table 1 and Additional file1: Table S1).
SnaB1, Spe1 PFGE typing used alone and in combination
S type C type1 All types
III I + III II
14 24 35 59
0.934 0.873 0.644 0.856
10 15 24 39
0.956 0.990 0.895 0.960
10 15 24 39
0.978 0.990 0.801 0.924
10 15 24 39
1.000 1.000 1.000 1.000
14 24 35 59
0.89 0.801 0.876 0.925
14 24 35 59
0.736 0.935 0.965 0.977
TR profiles of type C strains.

LSPA4
FO
21
22G
18I
M25
4/04
OV
ICA
P49
M72
/03
M71
/03
M15
/04
21P
21I
19I
OV
ICA
P34
M28
4/08
PC
R31
1
OV
ICA
P16
K10
K10
100
pb
100
pb
LN
20
85/1
4
P13
3/79
235G
P46
5
6759
6756
269O
V
K10
100
pb
462 bp 540 bp
197 bp
306 bp
LN
20
85/1
4
P13
3/79
235G
P46
5
6759
6756
K10
100
pb
FO
21
22G
18I
M25
4/04
OV
ICA
P49
M72
/03
M71
/03
M15
/04
21P
21I
19I
OV
ICA
P34
M28
4/08
PC
R31
1
OV
ICA
P16
K10
100
pb
269O
V
LSPA20
LSPA4 present = PCR product of 540 bp
LSPA4 absent = PCR product of 462 bp
mbtA
LSPA 4
mbtA
A
LSPA20 present = PCR product of 197 bp
LSPA20 absent = PCR product of 306 bp
BLSPA 20
Type S signature
Type C signature
M18
9 M
189
K10
Figure 1 Detection of types and subtypes of strains based on of the absence or presence of large sequences LSPA4 (A) and LSPA20 (B)investigated by PCR.
Biet et al. BMC Microbiology 2012, 12:264 Page 5 of 12http://www.biomedcentral.com/1471-2180/12/264
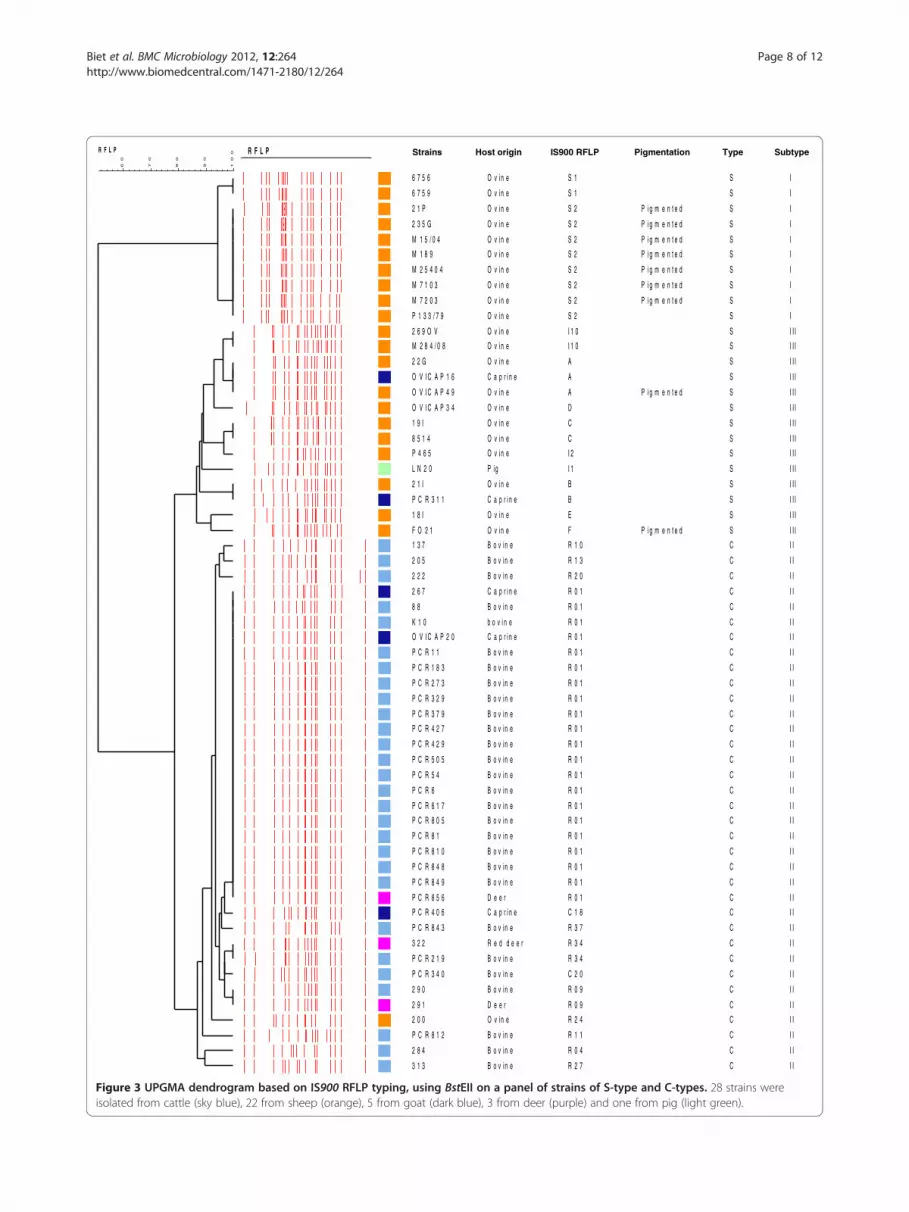
IS900-RFLP typingIS900-RFLP typing clearly separated the strains intothree groups that correlate with the PFGE subtypes I, IIand III (Figure 3). Ten strains of S-type, subtype I clusterinto two groups of profiles S1 (n = 2) and S2 (n = 8). The14 strains of S-type, subtype III display more poly-morphism with 9 profiles, including 6 new ones. Profilespreviously described included I1 (n = 1), I2 (n = 1) andI10 (n = 2). The new profiles were called A (n = 3), B(n = 2), C (n = 2), D, E and F (n = 1 each) (indicated inthe Additional file 4: Figure S1). The strains of C-typewere well distinguished from S-type and were not highlypolymorphic. In this panel of strains the most widelydistributed profile R01 was found for 21 strains, thenR09 (n = 2) and R34 (n = 2) and 10 profiles were identi-fied in only one isolate, R04, R10, R11, R13, R20, R24,R27, R37, C18 and C20. With this Map panel of strainsthe discrimination index (DI) of RFLP was shown veryvariable depending on the type and the subtype of thestrains. The DI of the subtype I was very low (0.356), forthe subtype III high (0.934) and that of C-type (Type II)was low (0.644) (Table 2). A DI of 0.856 was achievedfor the 59 Map strains presented in Figure 3.
MIRU-VNTR typingThe result of MIRU-VNTR typing of the S-type strainsis shown in Table 1. MIRU-VNTR data from 148 C-type(type II) strains previously described [11,18,19] wereincluded in the analysis (see Additional file 1: Table S1).MIRU-VNTR using the eight markers described previ-ously [11] could differentiate between S- and C-typestrains but not between the subtypes I and III. On thispanel of strains, type III strains were the most poly-morphic with a DI of 0.89 compared to 0.644 for type Istrains and 0.876 for type II strains selected to representthe diversity of INMV profiles described. INMV profiles21, 70 and 72 were shared by both type I and III strains.As described previously [11] IS900 RFLP and MIRU-VNTR typing may be used in combination to gainhigher resolution. This was verified also on this panel ofstrains including S-type. In total, the combination of thetwo methods distinguished 32 distinct patterns compris-ing 59 isolates. Therefore, using carefully on the sameset of strains, a DI of 0.977 was achieved for this panelby using IS900 RFLP and MIRU-VNTR typing incombination compared to 0.856 for IS900 RFLP typingalone and 0.925 for MIRU-VNTR typing (Table 2 and
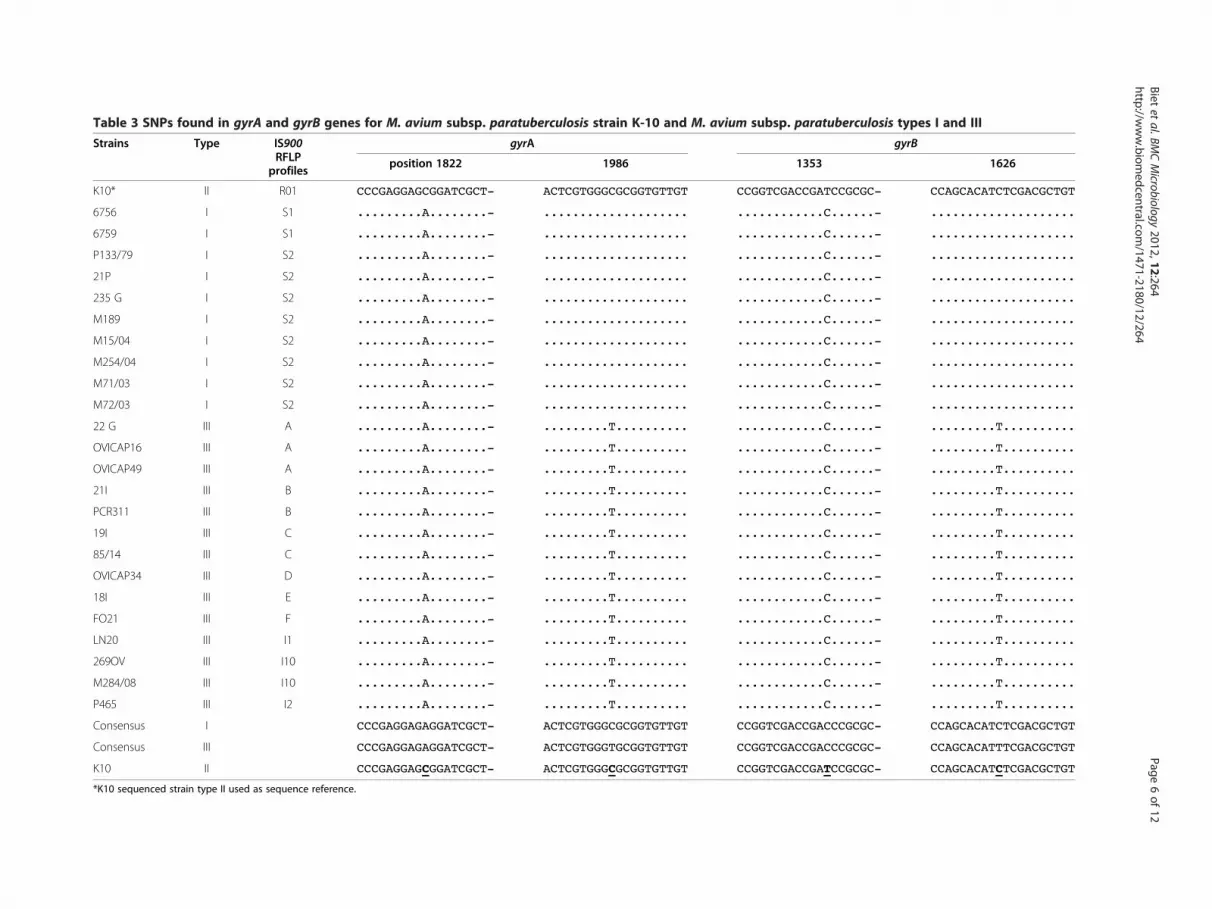
Table 3 SNPs found in gyrA and gyrB genes for M. avium subsp. paratuberculosis strain K-10 and M. avium subsp. paratuberculosis types I and III
Strains Type IS900RFLP
profiles
gyrA gyrB
position 1822 1986 1353 1626
K10* II R01 CCCGAGGAGCGGATCGCT- ACTCGTGGGCGCGGTGTTGT CCGGTCGACCGATCCGCGC- CCAGCACATCTCGACGCTGT
6756 I S1 .........A........- .................... ............C......- ....................
6759 I S1 .........A........- .................... ............C......- ....................
P133/79 I S2 .........A........- .................... ............C......- ....................
21P I S2 .........A........- .................... ............C......- ....................
235 G I S2 .........A........- .................... ............C......- ....................
M189 I S2 .........A........- .................... ............C......- ....................
M15/04 I S2 .........A........- .................... ............C......- ....................
M254/04 I S2 .........A........- .................... ............C......- ....................
M71/03 I S2 .........A........- .................... ............C......- ....................
M72/03 I S2 .........A........- .................... ............C......- ....................
22 G III A .........A........- .........T.......... ............C......- .........T..........
OVICAP16 III A .........A........- .........T.......... ............C......- .........T..........
OVICAP49 III A .........A........- .........T.......... ............C......- .........T..........
21I III B .........A........- .........T.......... ............C......- .........T..........
PCR311 III B .........A........- .........T.......... ............C......- .........T..........
19I III C .........A........- .........T.......... ............C......- .........T..........
85/14 III C .........A........- .........T.......... ............C......- .........T..........
OVICAP34 III D .........A........- .........T.......... ............C......- .........T..........
18I III E .........A........- .........T.......... ............C......- .........T..........
FO21 III F .........A........- .........T.......... ............C......- .........T..........
LN20 III I1 .........A........- .........T.......... ............C......- .........T..........
269OV III I10 .........A........- .........T.......... ............C......- .........T..........
M284/08 III I10 .........A........- .........T.......... ............C......- .........T..........
P465 III I2 .........A........- .........T.......... ............C......- .........T..........
Consensus I CCCGAGGAGAGGATCGCT- ACTCGTGGGCGCGGTGTTGT CCGGTCGACCGACCCGCGC- CCAGCACATCTCGACGCTGT
Consensus III CCCGAGGAGAGGATCGCT- ACTCGTGGGTGCGGTGTTGT CCGGTCGACCGACCCGCGC- CCAGCACATTTCGACGCTGT
K10 II CCCGAGGAGCGGATCGCT- ACTCGTGGGCGCGGTGTTGT CCGGTCGACCGATCCGCGC- CCAGCACATCTCGACGCTGT
*K10 sequenced strain type II used as sequence reference.
Bietet
al.BMCMicrobiology
2012,12:264Page
6of
12http://w
ww.biom
edcentral.com/1471-2180/12/264

A SnaB1
100
959085807570
.
.
Isolate
235G
M189
M72/03
21P
M71/03
PCR219
PCR810
PCR805
PCR848
PCR6
PCR11
PCR427
PCR505
PCR617
PCR81
PCR812
PCR843
PCR429
PCR849
PCR273
PCR340
PCR406
PCR54
PCR379
ovicap20
PCR856
PCR183
269ov
22G
19I
PCR311
18I
ovicap49
ovicap16
FO21
PCR 21I
ovicap34
SnaB1 profile
75
9
77
11
80
53
1
62
71
52
2
2
2
2
2
2
2
2
63
51
58
60
54
59
15
68
55
69
69
79
16
67
57
65
56
61
66
Host
Ovine
Ovine
Ovine
Ovine
Ovine
Bovine
Bovine
Bovine
Bovine
Bovine
Bovine
Bovine
Bovine
Bovine
Bovine
Bovine
Bovine
Bovine
Bovine
Bovine
Bovine
Caprine
Bovine
Bovine
Caprine
Deer
Bovine
Ovine
Ovine
Ovine
Caprine
Ovine
Ovine
Caprine
Ovine
Ovine
Ovine
K10 1 Bovine
PCR329 64 Bovine
Type
S Pigmented
S
S Pigmented
S Pigmented
S Pigmented
C
C
C
C
C
C
C
C
C
C
C
C
C
C
C
C
C
C
C
C
C
C
S
S
S
S
S
S Pigmented
S
S Pigmented
S
S
C
C
Subtype
I
I
I
I
I
II
II
II
II
II
II
II
II
II
II
II
II
II
II
II
II
II
II
II
II
II
II
III
III
III
III
III
III
III
III
III
III
II
II
Spe1
100
908070 Isolate
21P
M189
M72/03
M71/03
235G
19 I
ovicap16
FO21
PCR 21I
PCR311
22G
269ov
ovicap49
18I
ovicap34
Spe1 profile
9
7
70
71
8
55
61
56
47
47
50
54
57
51
62
Host
Ovine
Ovine
Ovine
Ovine
Ovine
Ovine
Caprine
Ovine
Ovine
Caprine
Ovine
Ovine
Ovine
Ovine
Ovine
Type
S Pigmented
S
S Pigmented
S Pigmented
S Pigmented
S
S
S Pigmented
S
S
S
S
S Pigmented
S
S
Subtype
I
I
I
I
I
III
III
III
III
III
III
III
III
III
III
PCR379
PCR843
PCR340
PCR81
PCR617
PCR427
PCR183
PCR54
63
41
59
58
48
19
52
49
Bovine
Bovine
Bovine
Bovine
Bovine
Bovine
Bovine
Bovine
C
C
C
C
C
C
C
C
II
II
II
II
II
II
II
II
PCR849
ovicap20
PCR11
PCR505
PCR805
PCR848
PCR856
PCR329
PCR6
PCR812
PCR810
PCR406
PCR429
PCR273
1
1
12
5
1
1
1
1
1
46
53
1
1
60
Bovine
Caprine
Bovine
Bovine
Bovine
Bovine
Deer
Bovine
Bovine
Bovine
Bovine
Caprine
Bovine
Bovine
C
C
C
C
C
C
C
C
C
C
C
C
C
C
II
II
II
II
II
II
II
II
II
II
II
II
II
II
K10 1 Bovine C IIPCR219 1 Bovine C
II
B
Figure 2 UPGMA Dendrogram showing the profiles of Mapstrain obtained by PFGE using SnaB1 (A) or (B) Spe1. Thenumbering codes of the profiles obtained for each enzyme wereassigned according to the nomenclature available at http://www.moredun.org.uk/PFGE-mycobacteria. The colored squares indicatethe animal origin of strains: cattle (sky blue), sheep (orange), goat(dark blue) and deer (purple).
Biet et al. BMC Microbiology 2012, 12:264 Page 7 of 12http://www.biomedcentral.com/1471-2180/12/264
Additional file 3: Table S4). Because MIRU-VNTR is ap-plicable to all members of the MAC, we wanted to knowhow the INMV profiles segregated within the MAC.None of the INMV profiles identified in the S-typestrains matched those of other MAC members. Theresults presented by the minimum spanning tree in Fig-ure 4, show that Map S-type strains are clearly separatedfrom Map C-type strains, including 113 strains previ-ously typed, and also from any strains belonging to theother subspecies hominissuis, avium or silvaticum. Theallelic diversities of the various loci are shown in Add-itional file 5: Table S3. Five markers were monomorphicin Map S subtype III and 7 in Map S subtype I. In termsof the discriminatory hierarchy, locus 292 displayed thehighest allelic diversity for both S- and C-type strains.This study shows that genotyping with MIRU-VNTRcan distinguish MAC isolates to the species level andalso distinguish with MAP subspecies to the strain typelevel.
DiscussionIn comparison to Map C-type strains, investigation ofthe epidemiology and genetics of S-type strains has beenhampered due to difficulties in their isolation and theirextremely slow growth-rate in laboratory culture [28,29].Indeed, the isolation and maintenance of Map S-typestrains continues to be a challenge for laboratoriesworldwide and relative to Map C-type strains a paltrynumber are available for study. Nowadays representativegenome sequences are available for both C- and S-typesubtype III Map strains [30,31]. This has facilitated theidentification of specific genetic elements that can beused to identify isolates and discriminate between typesand, in some cases subtypes of strains [14,16,22,32-34].In this study we assembled a panel of S-type strainsfrom different geographic origins and host species andundertook extensive molecular typing to improve ourknowledge on the genetic diversity of these strains andtheir phylogenetic relationship with respect to Map C-type strains and other members of MAC. This is thelargest panel of S-type strains investigated to date.Additionally, the study also permitted identification ofthe most efficient typing techniques for S-type strains.The results of the study coupled with previous resultson genotypic and phenotypic characterization of Mapstrains concur with the division of this subspecies into
Strains Host origin Subtype Type IS900 RFLP Pigmentation R F L P
10
0
90
80
70
60
R F L P
6 7 5 6
6 7 5 9
2 1 P
2 3 5 G
M 1 5 / 0 4
M 1 8 9
M 2 5 4 0 4
M 7 1 0 3
M 7 2 0 3
P 1 3 3 / 7 9
2 6 9 O V
M 2 8 4 / 0 8
2 2 G
O V I C A P 1 6
O V I C A P 4 9
O V I C A P 3 4
1 9 I
8 5 1 4
P 4 6 5
L N 2 0
2 1 I
P C R 3 1 1
1 8 I
F O 2 1
1 3 7
2 0 5
2 2 2
2 6 7
8 8
K 1 0
O V I C A P 2 0
P C R 1 1
P C R 1 8 3
P C R 2 7 3
P C R 3 2 9
P C R 3 7 9
P C R 4 2 7
P C R 4 2 9
P C R 5 0 5
P C R 5 4
P C R 6
P C R 6 1 7
P C R 8 0 5
P C R 8 1
P C R 8 1 0
P C R 8 4 8
P C R 8 4 9
P C R 8 5 6
P C R 4 0 6
P C R 8 4 3
3 2 2
P C R 2 1 9
P C R 3 4 0
2 9 0
2 9 1
2 0 0
P C R 8 1 2
2 8 4
3 1 3
O v in e
O v in e
O v in e
O v in e
O v in e
O v in e
O v in e
O v in e
O v in e
O v in e
O v in e
O v in e
O v in e
C a p r i n e
O v in e
O v in e
O v in e
O v in e
O v in e
P ig
O v in e
C a p r i n e
O v in e
O v in e
B o v in e
B o v in e
B o v in e
C a p r i n e
B o v in e
b o v i n e
C a p r i n e
B o v in e
B o v in e
B o v in e
B o v in e
B o v in e
B o v in e
B o v in e
B o v in e
B o v in e
B o v in e
B o v in e
B o v in e
B o v in e
B o v in e
B o v in e
B o v in e
D e e r
C a p r i n e
B o v in e
R e d d e e r
B o v in e
B o v in e
B o v in e
D e e r
O v in e
B o v in e
B o v in e
B o v in e
S 1
S 1
S 2
S 2
S 2
S 2
S 2
S 2
S 2
S 2
I 1 0
I 1 0
A
A
A
D
C
C
I 2
I 1
B
B
E
F
R 1 0
R 1 3
R 2 0
R 0 1
R 0 1
R 0 1
R 0 1
R 0 1
R 0 1
R 0 1
R 0 1
R 0 1
R 0 1
R 0 1
R 0 1
R 0 1
R 0 1
R 0 1
R 0 1
R 0 1
R 0 1
R 0 1
R 0 1
R 0 1
C 1 8
R 3 7
R 3 4
R 3 4
C 2 0
R 0 9
R 0 9
R 2 4
R 1 1
R 0 4
R 2 7
P i g m e n t e d
P i g m e n t e d
P i g m e n t e d
P i g m e n t e d
P i g m e n t e d
P i g m e n t e d
P i g m e n t e d
P i g m e n t e d
P i g m e n t e d
S
S
S
S
S
S
S
S
S
S
S
S
S
S
S
S
S
S
S
S
S
S
S
S
C
C
C
C
C
C
C
C
C
C
C
C
C
C
C
C
C
C
C
C
C
C
C
C
C
C
C
C
C
C
C
C
C
C
C
I
I
I
I
I
I
I
I
I
I
I I I
I I I
I I I
I I I
I I I
I I I
I I I
I I I
I I I
I I I
I I I
I I I
I I I
I I I
I I
I I
I I
I I
I I
I I
I I
I I
I I
I I
I I
I I
I I
I I
I I
I I
I I
I I
I I
I I
I I
I I
I I
I I
I I
I I
I I
I I
I I
I I
I I
I I
I I
I I
I I
Figure 3 UPGMA dendrogram based on IS900 RFLP typing, using BstEII on a panel of strains of S-type and C-types. 28 strains wereisolated from cattle (sky blue), 22 from sheep (orange), 5 from goat (dark blue), 3 from deer (purple) and one from pig (light green).
Biet et al. BMC Microbiology 2012, 12:264 Page 8 of 12http://www.biomedcentral.com/1471-2180/12/264

M. avium subsp. paratuberculosis C type
M. avium subsp. avium
M. avium subsp. silvaticum
M. avium subsp. paratuberculosis S type
M. avium subsp. hominissuis
Figure 4 (See legend on next page.)
Biet et al. BMC Microbiology 2012, 12:264 Page 9 of 12http://www.biomedcentral.com/1471-2180/12/264

(See figure on previous page.)Figure 4 Minimum spanning tree based on MIRU-VNTR genotypes among Mycobacterium avium subsp. paratuberculosis of types S and C,Mycobacterium avium subsp. avium, Mycobacterium avium subsp. hominissuis, and Mycobacterium avium subsp. silvaticum. 135 strains wereisolated from cattle (sky blue), 23 strains from sheep (orange), 17 strains from goat (dark blue), 63 strains from pigs (light green), 17 strains frombirds (yellow), 17 strains from humans (white), 6 strains from deer (purple), 5 strains from other sources (red), 4 strains from wood pigeons(brown), and 2 different vaccine strains (316 F from France and United Kingdom) (light blue). Each genotype is displayed as a pie chart, the sizeof which is proportional to the number of strains, with color-coded distribution of the strain origins. The number of loci differing between thegenotypes is indicated by the style of the connecting lines: thick and short, 1 difference; intermediate, 2 differences; thin and long: 3 differences.
Biet et al. BMC Microbiology 2012, 12:264 Page 10 of 12http://www.biomedcentral.com/1471-2180/12/264
two major lineages comprising S-type and C-typestrains. However, the results of IS900-RFLP, PFGE andSNP analysis of the gyr genes clearly divide Map strainsinto three subtypes, Type II or C strains, Type I andType III strains. But from the data available on thesestrains, the two subtypes do not seem to be associatedwith a particular phenotype and may just reflect regionalgenetic differences. Type I was first proposed to describea group of ovine pigmented Map strains with distinctivePFGE profiles [8]. However, as more ovine strains weretyped by PFGE, it became apparent that there was an-other cluster of non-pigmented ovine Map strains thatwere designated Type III strains [7]. The pigmentedphenotype consequently became associated with theType I strains. However, in this study we included twopigmented strains originating from different geographiclocations, which were typed as type III by SNP analysisof the gyr genes, IS900 RFLP and PFGE. The pigmenta-tion phenotype is not therefore restricted to type I andthere is no other obvious phenotype currently known todifferentiate between types I and III. MIRU-VNTR, des-pite being highly discriminatory between strains did notseparate the S-type strains into the two types I and III.There is therefore an argument for simplifying thecurrent nomenclature for Map strain grouping [14]. Dueto the historical nomenclature, to the absence of othercomprehensive studies including all strain types andtyping methods, to the inability of several techniquesto distinguish between Type I and III and to thegenetic and phenotypic similarities found betweenthem in previous studies, we propose that S- and C-type nomenclature could be used to denote the twomajor groups or lineages and the Type I and III usedto distinguish subtypes within S-type strains as wehave done in this paper. In agreement with previousstudies both PFGE and IS900-RFLP revealed littleheterogeneity between isolates of the S subtype I. Bycomparison, this study shows that strains of S sub-type III are more polymorphic. Diverse genotypesclustered within S subtype III have been identifiedcirculating in small regional areas in Spain or evenin the same farm [34], making more evident thehigher heterogeneity of these strains. Interestingly, asfar as we know no evidence of S subtype I strainshas been found in Spain, a country with a significant
sample of S-type strains in our panel and in previousworks [8,16].For molecular epidemiology (i.e. strain tracking), of
the typing techniques used MIRU-VNTR would be thepreferred technique for studying S-type strains. Thistechnique gave a high discriminatory index with theeight loci employed in this study and could segregate thedifferent members of MAC and the Map S- and C-typestrains, although it has limitations in that it cannot dif-ferentiate between the subtypes I and III. For detectinggenetic variability between S-type strains the number ofloci used could be reduced to 3 (292, X3 and 25). Thegreatest genetic variation occurred at locus 292 with S-type strains typically having a much higher number ofrepeats than C-type strains (up to 11 were detected inthis study). No more than 4 repeats at locus 292 weredetected in C-type strains. The locus 292 locus is flankedby loci MAP2920c and MAP2921c referenced as acetyl-transferase and quinone oxidoreductase, respectively.There has been only one other report of MIRU-VNTRtyping of S-type strains [22]. In the latter study MIRU-VNTR loci 3 and 7 were thought to be of special import-ance for identifying subtype III strains but only twosubtype III strains were typed. In our study all 14 sub-type III and 10 subtype I strains had the same, one-repeat unit alleles at each of these two loci, as found inthe two strains typed previously [22]. Although uncom-mon, a few C-type strains in this study were also foundwith a single copy at these loci so this is even not uniqueto S-type strains. All Mah, Maa and Mas strains testedin this study also had one repeat unit at locus 3 and allMaa and 61% of Mah strains had a single copy at locus7. The discriminatory power of MIRU-VNTR to differ-entiate between the subtypes I and III could be improvedby identifying additional loci. Although MIRU-VNTR can-not distinguish between the subtypes I and III, currently itis the only PCR-based typing technique to reveal signifi-cant genetic diversity between S-type strains useful forepidemiological investigations. The technique requiresonly a small amount of DNA and can therefore be carriedout on single colonies as well as cell pellets from liquidculture systems. LSP analysis rapidly differentiates the S-type from C-type strains by the absence of LSPA20 andpresence of LSPA4 but provides no information regardinggenetic diversity within S-type strains. SNP analysis of the

Biet et al. BMC Microbiology 2012, 12:264 Page 11 of 12http://www.biomedcentral.com/1471-2180/12/264
gyr genes is more complex requiring sequencing of thePCR product to differentiate between S- and C-types andbetween subtypes I and III [13]. However, the S subtypeinformation would be of limited value for epidemiologicalstudies and tracing the source of infection. Furthermore,as we become better at isolating S-type strains and typemore strains it is likely that further S subtypes will becomeapparent. PFGE and IS900-RFLP both give good discrim-ination between the Map strain types and subtypes but re-quire larger amounts of high quality DNA, whichnecessitates in vitro growth of the strains and therefore isnot ideal for S-type strains.
ConclusionsThis is the largest panel of S-type strains investigated todate. The S-type strains can be further divided into twotypes, I and III, by some (IS900-RFLP, PFGE and SNPanalysis of the gyr genes) but not all (not by MIRU-VNTR typing) of the typing techniques. Pigmentation isnot exclusively associated with S subtype I strains.Therefore, a simplified nomenclature is proposed desig-nating types I and III as subtypes of S-type strains. Theepidemiological and phylogenetic significance of S typesubdivision into I and III subtypes needs, however, to befurther clarified. Molecular typing using IS900-RFLP,PFGE and MIRU-VNTR demonstrates that S-typestrains are genetically diverse, subtype III being themost heterogeneous group. Due to the scarcity of S-type strains in culture, typing techniques have beenlargely optimized using C-type strains. Further gen-omic sequencing of S-type strains should reveal vari-able genetic loci unique to S-type strains that could beexploited to further improve discrimination of S-typestrains. Genome sequence data of isolates belonging tosubtypes I and III should ultimately clarify the phyl-ogeny and provide a framework to classify differentphenotypic, pathogenic and epidemiological character-istics of Map strains.
Additional files
Additional file 1: Table S1. Description of the strains used in this studyindicating their origins and details of their genotypes and phenotypesdata.
Additional file 2: Table S2. The table shows the primers sequencesused in this study.
Additional file 3: Table S4. The table details the calculation of theDiscriminatory Index for each typing methods including IS900 RFLP,MIRU-VNTR and PFGE (SnaB1, Spe1) used alone and in combination. Thetable details the calculation of the allelic diversity (h) at a locus MIRU-VNTR using Nei’s index.
Additional file 4: Figure S1. The figure shows the new IS900 RFLPprofiles obtained from analysis with strains S of subtype III.
Additional file 5: Table S3. The table describes the MIRU-VNTR allelicdistribution among the strains of Map of type S and C and other Macmembers.
Competing interestsThe authors have no competing interests.
Authors’ contributionsFB, IS and KS conceived of the study, participated in its design andcoordination, collated and analysed the data and drafted the manuscript. TC,LL, JG, IH, JM and VT participated in the laboratory and field work. RJ, TC, LL,PS participated in analysing the data. All authors read, criticized andapproved the final manuscript.
AcknowledgementsFB, TC, LL and VT were supported by the Institut National de la RechercheAgronomique. KS, IH and JM were funded by the Scottish Government Ruraland Environment Science and Analytical Services Division. The work of IS, JGand RJ was supported by the Departamento de Medio Ambiente,Planificación Territorial, Agricultura y Pesca del Gobierno Vasco.
Author details1INRA, UMR1282, Infectiologie Santé Publique (ISP-311), Nouzilly F-37380,France. 2Neiker-tecnalia, Dpto. de Producción y Sanidad Animal, Berreaga 1,Derio, Bizkaia 48160, Spain. 3Moredun Research Institute, Pentlands SciencePark, Bush Loan, Penicuik, Scotland EH26 0PZ, UK. 4INSERM, Lille U1019,France. 5CNRS UMR, Lille 8204, France. 6Institut Pasteur de Lille, Center forInfection and Immunity of Lille, Lille, France. 7Univ Lille Nord de France, Lille,France. 8AgResearch, Wallaceville, Upper HuttP.O. Box 40063New Zealand.9McGill University, Montreal, Quebec H3G 1A4, Canada.
Received: 29 June 2012 Accepted: 5 November 2012Published: 19 November 2012
References1. Alexander DC, Turenne CY, Behr MA: Insertion and deletion events that
define the pathogen mycobacterium avium subsp. Paratuberculosis.J Bacteriol 2009, 19(3):1018–1025.
2. Collins DM, Gabric DM, de Lisle GW: Identification of two groups ofmycobacterium paratuberculosis strains by restriction endonucleaseanalysis and DNA hybridization. J Clin Microbiol 1990, 28(7):1591–1596.
3. De Lisle GW, Collins DM, Huchzermeyer HF: Characterization of ovinestrains of mycobacterium paratuberculosis by restriction endonucleaseanalysis and DNA hybridization. Onderstepoort J Vet Res 1992,59(2):163–165.
4. Janagama HK, Kumar S, Bannantine JP, Kugadas A, Jagtap P, Higgins L,Witthuhn B, Sreevatsan S: Iron-sparing response of mycobacterium aviumsubsp. Paratuberculosis is strain dependent. BMC Microbiol 2010,10(1):268.
5. Janagama HK, Jeong K, Kapur V, Coussens P, Sreevatsan S: Cytokineresponses of bovine macrophages to diverse clinical mycobacteriumavium subspecies paratuberculosis strains. BMC Microbiol 2006, 6:10.
6. Motiwala AS, Janagama HK, Paustian ML, Zhu X, Bannantine JP, Kapur V,Sreevatsan S: Comparative transcriptional analysis of humanmacrophages exposed to animal and human isolates of mycobacteriumavium subspecies paratuberculosis with diverse genotypes. Infect Immun2006, 74(11):6046–6056.
7. de Juan L, Alvarez J, Aranaz A, Rodriguez A, Romero B, Bezos J, Mateos A,Dominguez L: Molecular epidemiology of types I/III strains ofmycobacterium avium subspecies paratuberculosis isolated from goatsand cattle. Vet Microbiol 2006, 115(1–3):102–110.
8. Stevenson K, Hughes VM, de Juan L, Inglis NF, Wright F, Sharp JM:Molecular characterization of pigmented and nonpigmented isolates ofmycobacterium avium subsp. Paratuberculosis. J Clin Microbiol 2002,40(5):1798–1804.
9. Supply P, Magdalena J, Himpens S, Locht C: Identification of novelintergenic repetitive units in a mycobacterial two-component systemoperon. Mol Microbiol 1997, 26:991–1003.
10. Supply P, Mazars E, Lesjean S, Vincent V, Gicquel B, Locht C: Variablehuman minisatellite-like regions in the mycobacterium tuberculosisgenome. Mol Microbiol 2000, 36(3):762–771.
11. Thibault VC, Grayon M, Boschiroli ML, Hubbans C, Overduin P, Stevenson K,Gutierrez MC, Supply P, Biet F: New variable number tandem repeatmarkers for typing M. avium subsp. paratuberculosis and M. avium

Biet et al. BMC Microbiology 2012, 12:264 Page 12 of 12http://www.biomedcentral.com/1471-2180/12/264
strains: comparison with IS900 RFLP and IS1245 RFLP typing. J ClinMicrobiol 2007, 45(8):2404–2410.
12. Semret M, Turenne CY, de Haas P, Collins DM, Behr MA: Differentiatinghost-associated variants of mycobacterium avium by PCR for detectionof large sequence polymorphisms. J Clin Microbiol 2006, 44(3):881–887.
13. Castellanos E, Aranaz A, Romero B, de Juan L, Alvarez J, Bezos J, RodriguezS, Stevenson K, Mateos A, Dominguez L: Polymorphisms in gyrA and gyrBgenes among mycobacterium avium subsp. Paratuberculosis type I, II,and III isolates. J Clin Microbiol 2007, 45(10):3439–3442.
14. Turenne CY, Collins DM, Alexander DC, Behr MA: Mycobacterium aviumsubsp. paratuberculosis and M. avium subsp. avium are independentlyevolved pathogenic clones of a much broader group of M. aviumorganisms. J Bacteriol 2008, 190(7):2479–2487.
15. de Lisle GW, Yates GF, Collins DM: Paratuberculosis in farmed deer: casereports and DNA characterization of isolates of Mycobacteriumparatuberculosis. J Vet Diagn Invest 1993, 5(4):567–571.
16. Sevilla I, Garrido JM, Geijo M, Juste RA: Pulsed-field gel electrophoresisprofile homogeneity of Mycobacterium avium subsp. paratuberculosisisolates from cattle and heterogeneity of those from sheep and goats.BMC Microbiol 2007, 7:18.
17. Pavlik I, Horvathova A, Dvorska L, Bartl J, Svastova P, du Maine R, Rychlik I:Standardisation of restriction fragment length polymorphism analysis formycobacterium avium subspecies paratuberculosis. J Microbiol Methods1999, 38(1–2):155–167.
18. Radomski N, Thibault VC, Karoui C, de Cruz K, Cochard T, Gutierrez C, SupplyP, Biet F, Boschiroli ML: Determination of genotypic diversity ofmycobacterium avium subspecies from human and animal origins bymycobacterial interspersed repetitive-unit-variable-number tandem-repeat and IS1311 restriction fragment length polymorphism typingmethods. J Clin Microbiol 2010, 48(4):1026–1034.
19. Thibault VC, Grayon M, Boschiroli ML, Willery E, Allix-Beguec C, Stevenson K,Biet F, Supply P: Combined multilocus short-sequence-repeat andmycobacterial interspersed repetitive unit-variable-number tandem-repeat typing of mycobacterium avium subsp. Paratuberculosis isolates.J Clin Microbiol 2008, 46(12):4091–4094.
20. Collins DM, Cavaignac S, de Lisle GW: Use of four DNA insertionsequences to characterize strains of the mycobacterium avium complexisolated from animals. Mol Cell Probes 1997, 11(5):373–380.
21. Overduin P, Schouls L, Roholl P, van der Zanden A, Mahmmod N,Herrewegh A, van Soolingen D: Use of multilocus variable-numbertandem-repeat analysis for typing mycobacterium avium subsp.Paratuberculosis. J Clin Microbiol 2004, 42(11):5022–5028.
22. Mobius P, Fritsch I, Luyven G, Hotzel H, Kohler H: Unique genotypes ofMycobacterium avium subsp. paratuberculosis strains of Type III. VetMicrobiol 2009, 139(3–4):398–404.
23. Stevenson K, Alvarez J, Bakker D, Biet F, de Juan L, Denham S, Dimareli Z,Dohmann K, Gerlach GF, Heron I, et al: Occurrence of mycobacteriumavium subspecies paratuberculosis across host species and europeancountries with evidence for transmission between wildlife and domesticruminants. BMC Microbiol 2009, 9:212.
24. Nei M: Estimation of average heterozygosity and genetic distance from asmall number of individuals. Genetics 1978, 89(3):583–590.
25. Hunter PR, Gaston MA: Numerical index of the discriminatory ability oftyping systems: an application of Simpson's index of diversity. J ClinMicrobiol 1988, 26(11):2465–2466.
26. Semret M, Alexander DC, Turenne CY, de Haas P, Overduin P, van SoolingenD, Cousins D, Behr MA: Genomic polymorphisms for Mycobacteriumavium subsp. paratuberculosis diagnostics. J Clin Microbiol 2005,43(8):3704–3712.
27. Semret M, Zhai G, Mostowy S, Cleto C, Alexander D, Cangelosi G, Cousins D,Collins DM, van Soolingen D, Behr MA: Extensive genomic polymorphismwithin mycobacterium avium. J Bacteriol 2004, 186(18):6332–6334.
28. Cousins DV, Evans RJ, Francis BR: Use of BACTEC radiometric culturemethod and polymerase chain reaction for the rapid screening of faecesand tissues for mycobacterium paratuberculosis. Aust Vet J 1995,72(12):458–462.
29. Whittington RJ, Marsh I, Turner MJ, McAllister S, Choy E, Eamens GJ, MarshallDJ, Ottaway S: Rapid detection of Mycobacterium paratuberculosis inclinical samples from ruminants and in spiked environmental samplesby modified BACTEC 12B radiometric culture and direct confirmation byIS900 PCR. J Clin Microbiol 1998, 36(3):701–707.
30. Bannantine JP, Wu CW, Hsu C, Zhou S, Schwartz DC, Bayles DO, PaustianML, Alt DP, Sreevatsan S, Kapur V, et al: Genome sequencing of ovineisolates of mycobacterium avium subspecies paratuberculosis offersinsights into host association. BMC Genomics 2012, 13(1):89.
31. Li L, Bannantine JP, Zhang Q, Amonsin A, May BJ, Alt D, Banerji N, Kanjilal S,Kapur V: The complete genome sequence of mycobacterium aviumsubspecies paratuberculosis. Proc Natl Acad Sci USA 2005,102(35):12344–12349.
32. Castellanos E, Aranaz A, Gould KA, Linedale R, Stevenson K, Alvarez J,Dominguez L, de Juan L, Hinds J, Bull TJ: Discovery of stable and variabledifferences in the mycobacterium avium subsp. Paratuberculosis type I,II, and III genomes by pan-genome microarray analysis. Appl EnvironMicrobiol 2009, 75(3):676–686.
33. Castellanos E, Romero B, Rodriguez S, de Juan L, Bezos J, Mateos A,Dominguez L, Aranaz A: Molecular characterization of mycobacteriumavium subspecies paratuberculosis types II and III isolates by acombination of MIRU-VNTR loci. Vet Microbiol 2010, 144(1–2):118–126.
34. Sevilla I, Li L, Amonsin A, Garrido JM, Geijo MV, Kapur V, Juste RA:Comparative analysis of Mycobacterium avium subsp. paratuberculosisisolates from cattle, sheep and goats by short sequence repeat andpulsed-field gel electrophoresis typing. BMC Microbiol 2008, 8:204.
doi:10.1186/1471-2180-12-264Cite this article as: Biet et al.: Inter- and Intra-subtype genotypicdifferences that differentiate Mycobacterium avium subspeciesparatuberculosis strains. BMC Microbiology 2012 12:264.
Submit your next manuscript to BioMed Centraland take full advantage of:
• Convenient online submission
• Thorough peer review
• No space constraints or color figure charges
• Immediate publication on acceptance
• Inclusion in PubMed, CAS, Scopus and Google Scholar
• Research which is freely available for redistribution
Submit your manuscript at www.biomedcentral.com/submit