Revision of Rupicapra Genus. I. A statistical re-evaluation of Couturier's data on the morphometry...
14
This article was downloaded by: [223.86.6.219] On: 31 March 2014, At: 11:00 Publisher: Taylor & Francis Informa Ltd Registered in England and Wales Registered Number: 1072954 Registered office: Mortimer House, 37-41 Mortimer Street, London W1T 3JH, UK Bolletino di zoologia Publication details, including instructions for authors and subscription information: http://www.tandfonline.com/loi/tizo19 Revision of Rupicapra Genus. I. A statistical re-evaluation of Couturier's data on the morphometry of six chamois subspecies Sandro Lovari a & Claudio Scala b a Cattedra di Biologia e Zoologia Generale , Università di Parma , Via Gramsci 14, 43100, Parma, Italy b Istituto di Statistica, Università di Siena , Piazza S. Francesco 17, 53100, Siena, Italy Published online: 14 Sep 2009. To cite this article: Sandro Lovari & Claudio Scala (1980) Revision of Rupicapra Genus. I. A statistical re-evaluation of Couturier's data on the morphometry of six chamois subspecies, Bolletino di zoologia, 47:1-2, 113-124 To link to this article: http://dx.doi.org/10.1080/11250008009440328 PLEASE SCROLL DOWN FOR ARTICLE Taylor & Francis makes every effort to ensure the accuracy of all the information (the “Content”) contained in the publications on our platform. However, Taylor & Francis, our agents, and our licensors make no representations or warranties whatsoever as to the accuracy, completeness, or suitability for any purpose of the Content. Any opinions and views expressed in this publication are the opinions and views of the authors, and are not the views of or endorsed by Taylor & Francis. The accuracy of the Content should not be relied upon and should be independently verified with primary sources of information. Taylor and Francis shall not be liable for any losses, actions, claims, proceedings, demands, costs, expenses, damages, and other liabilities whatsoever or howsoever caused arising directly or indirectly in connection with, in relation to or arising out of the use of the Content. This article may be used for research, teaching, and private study purposes. Any substantial or systematic reproduction, redistribution, reselling, loan, sub-licensing, systematic supply, or distribution in any form to anyone is expressly forbidden. Terms
Transcript of Revision of Rupicapra Genus. I. A statistical re-evaluation of Couturier's data on the morphometry...

This article was downloaded by: [223.86.6.219]On: 31 March 2014, At: 11:00Publisher: Taylor & FrancisInforma Ltd Registered in England and Wales Registered Number: 1072954Registered office: Mortimer House, 37-41 Mortimer Street, London W1T 3JH, UK
Bolletino di zoologiaPublication details, including instructions for authors andsubscription information:http://www.tandfonline.com/loi/tizo19
Revision of Rupicapra Genus.I. A statistical re-evaluation ofCouturier's data on the morphometryof six chamois subspeciesSandro Lovari a & Claudio Scala ba Cattedra di Biologia e Zoologia Generale , Università diParma , Via Gramsci 14, 43100, Parma, Italyb Istituto di Statistica, Università di Siena , Piazza S.Francesco 17, 53100, Siena, ItalyPublished online: 14 Sep 2009.
To cite this article: Sandro Lovari & Claudio Scala (1980) Revision of Rupicapra Genus. I. Astatistical re-evaluation of Couturier's data on the morphometry of six chamois subspecies,Bolletino di zoologia, 47:1-2, 113-124
To link to this article: http://dx.doi.org/10.1080/11250008009440328
PLEASE SCROLL DOWN FOR ARTICLE
Taylor & Francis makes every effort to ensure the accuracy of all the information (the“Content”) contained in the publications on our platform. However, Taylor & Francis,our agents, and our licensors make no representations or warranties whatsoeveras to the accuracy, completeness, or suitability for any purpose of the Content. Anyopinions and views expressed in this publication are the opinions and views of theauthors, and are not the views of or endorsed by Taylor & Francis. The accuracyof the Content should not be relied upon and should be independently verifiedwith primary sources of information. Taylor and Francis shall not be liable for anylosses, actions, claims, proceedings, demands, costs, expenses, damages, and otherliabilities whatsoever or howsoever caused arising directly or indirectly in connectionwith, in relation to or arising out of the use of the Content.
This article may be used for research, teaching, and private study purposes. Anysubstantial or systematic reproduction, redistribution, reselling, loan, sub-licensing,systematic supply, or distribution in any form to anyone is expressly forbidden. Terms

& Conditions of access and use can be found at http://www.tandfonline.com/page/terms-and-conditions
Dow
nloa
ded
by [
223.
86.6
.219
] at
11:
00 3
1 M
arch
201
4

Boll. 2001. 47: 113-124 (1980)
Revision of Rupicapra Genus. I. A statistical re-evaluation of Couturier’s data on the morphometry of six chamois subspecies * SANDRO LOVARI ** Cattedra di Biologia e Zoologia Generale, Universiti di Parma, Via Gramsci 14, 43100 Parma (Italy) and CLAUD10 SCALA lstituto di Statistica, Universitj d i Siena, Piazza S. Francesco 17, 53100 Siena (Italy)
ABSTRACT hfeasurements of skull and horns in six sub-
species of Rupicapra rtrpicapra L. (pyrenaico, or- nata, cartrrsiana, balcanica, carpatica, carrcasica) have been evaluated statistically. R. t. pyretraica and ornata have the smallest skulls, the closest horn bases, and obliterated frontomaxillary fon- tanelles. They have also simiIarIy patterned win- ter coats. O n the basis of such features pyre- naica and ornata are separate from the other subspecies which do not seem to differentiate much from each other. O n the other hand, pyre- naica has a much smaller body size than ornafa as well as the shortest and thinnest horns, whe- reas ornata has the longest and stoutest horns of all the subspecies examined. Furthermore, the ornata’s frontomaxillary fontanelle is much lon- ger than pyrenaica’s.
R. r. carttrsiana has several features interme- diate between the pyrenaira-ornata group and the other subspecies.
O n the basis of some palaeontologic evidence we advance the hypothesis that the chamois
. living on the Riss glaciation belonged to the pyrenaira-ornata type. During the \Viirm, the Rissian chamois may have come into contact with an eastern population of chamois belonging to the “Alpine” type which had developed fea- tures of its own during the Eem interglacial. Such a Wurmian popuIation could have absorbed the remaining Rissian chamois, but it could have failed to reach the Central Apennines (Abruzzo)
* Contributo scientific0 alla Conoscenza del Parco Nazionale di Abruzzo. Serie Speciale N. 8.
** Present address: Istituto di Zoologia, Universiti di Parma, Strada dell’Universiti, 12 - 43100 Parma (Italy). (Received 10 Deceinber 1979)
INTRODUCTION
The present world distribution of Ru- picaprini includes one genus (Oreamrzos) in North-West America, two genera (Ne- tizorhaedus, Capricornis) in Asia, and one genus (Ruppicapru) in Europe and the Near East. Pachygazetta, a Pliocenic genus from China, is usually regarded as the possible “ ancestor” of the Rupicaprini (Thenius & Hofer, 1960, in Schaller, 1977). From Central Asia the Rupicaprini spread probably to the South, East and North-\Vest, finally reaching their present ranges and separating into the living forms in the Pleistocene (Fig. 1). The chamois antelope Procamptoreras and the Euro- pean goral Gallogoral appeared in Europe in the Upper-middle Villafranchian (Lo- wer Pleistocene). A goral, Nemorhaedus, and the cave goat, Myotragus, occurred respectively in Sardinia and the Balearic Islands from the Middle Pleistocene to the Postglacial (Kurtin, 1968). The first fossile chamois appear in Riss 2 (Middle Pleistocene) (Delpech & Heintz, 1976), but bones of this rupicaprid are only com- mon from Wurm 2 onward (Chaline, 1972).
Literature on the systematics of the chamois (Rrrpicapra rupicapra L.) is scant.
and the Pyrenees, where the last Rissian chamois survive till now. The long separation of these two isolated populations may account for their differences.
ACKNOWLEDGEMENTS We are indebted to Dr. Wolfgang Schroder
and Dr. Fabio Cassola for constructive discus- sions on the first draft of this paper. In parti- cular we are very grateful to Prof. Valerius Geist for his stimulating comments on the second draft and for kindly revising the English. We wish to thank also Prof. Bjorn Kurt& for reading the manuscript and for his valuable suggestions. Finally, we are deeply indebted to Dr. Albert0 Giani, Director of the Computing Centre, Uni- versity of Siena, for all facilities kindly extended to us in the course of our research, and to hir. Franco Parlanti for his help in programming and computing. This study was supported by a grant awarded to C.S. by the Ministry of Education.
Dow
nloa
ded
by [
223.
86.6
.219
] at
11:
00 3
1 M
arch
201
4

@
Pli
oce
nic
R
up
icap
rid
(P
ach
ygaz
ella
?);
@
N
emor
haed
us)
@I R
up
icap
ra
Fig.
1. - T
enta
tive
map
of
Rup
icap
rid
radi
atio
n.
Dow
nloa
ded
by [
223.
86.6
.219
] at
11:
00 3
1 M
arch
201
4

REVISION OF ‘RUPICAPRA’ GEKUS. I. A STATISTICAL RE-EVALUATION OF COUTURIER’S DATA 115
Usually ten subspecies of this rupicaprid are recognised, distributed over the highest mountains from the Cantabrian Mts., in Northern Spain, to the Caucasus, in Sou- thern Russia (Knaus & Schroder, 1973) (Fig. 2). The Pyrenean (Rzipicapra rripica- p y a pyreizaica Bonaparte 1845), and the Abruzzian (Rripicapra rripicapra ornatn Neumann 1899) chamois are separate so- mewhat from the other subspecies by a
All other subspecies (cartttsiana Coutu- rier 1937, tatrica Blahout 1971, balca- rzicn Bolkay ‘1925, carpatica Couturier 1937, cazrcasica Lydekker 1910, asiatica Lydekker 1908) resemble more or less closely the nominal subspecies, the Alpine chamois, Rzipicapra rupicapra rripicapra (L.) 1758.
I n this first paper, as a preliminary step in the revision of the Rrtpicapra genus,
Fig. 2. - Distribution range of the chamois Rirpicapru rrrpicupru ssp. (from Couturier 1938. mGdified).
cranial feature (obliteration of the fronto- maxillary fontanelle) as well as by a parti- cular pattern in their winter coats of wide whitish patches on the neck, shoulder and rump (Couturier, 1938). The latter sub- species is much larger with exceptionally long horns and a slimmer figure (Lovari, unpublished observations). The Cantabrien chamois (Riipicapra rupicapra parva Ca- brera 1910) is very closely related to the Pyrenean and i t may be considered as a subpopulation (Couturier, 1938).
some measurements of skulls and horns of six chamois subspecies (pyremica, OY-
ria fa, cartusiana, balcartica, carpatica, CCIZI- sica) have been evaluated statistically to try to clarify the systematics of these groups.
Because of the difficulty in obtaining samples of the eastern subspecies we re- sorted to the material already available in Couturier (1938). Most of his data were recorded by himself or by L. Came- rano, reducing the danger of different ope- rational techniques in measuring. More-
Dow
nloa
ded
by [
223.
86.6
.219
] at
11:
00 3
1 M
arch
201
4

116 S. LOVARI, C. SCALA
TABLE I - Basic descriptive sfatistics for sku6 sdniples. Dafa in rnillitnefrer. Dimension of sample in hackers.
Sample Statistics 1 2 3 4 5 6 7
I ornata
(9)
pyrenaica (19)
I1
I11 carpatica
(5)
balcanica (7 1
IV
V caucasica
(6) *-
V I car tusiana
(15)
m+mum minimum
mean stand. deviation
maximum minimum
mean stand. deviation
maximum minimum
mean stand. deviation
maximum minimum
mean stand. deviation
maximum minimum
mean stand. deviation
maximum minimum
mean stand. deviation
206.00 178.00 195.11
7.86
205.00 189.00 198.26
4.00
224.00 215.00 219.60
3.82
219.00 206.00 212.00
3.96
213.00 207.00 208.33
2.13
216.00 195.00 208.93
5.71
65.00 52.00 59.00 4.62
72.00 54.50 64.02 4.81
74.00 62.00 69.30 4.68
81.00 57.00 67.50 6.71
74.00 67.00 70.66 2.92
77.00 54.00 65.96 6.75
61.50 59.00 61.28
1.78
62.00 57.50 60.18
1.16
66.00 63.00 61.50 1 .oo
67.00 61.00 63.33 2.03
68.00 62.00 64.33 2.05
63.00 58.50 60.60 1.15
109.00 96.00
101.89 4.28
120.00 98.00
103.55 4.71
117.00 109.50 113.20
2.69
111.00 101.00 107.41
1.93
112.00 100.00 107.50
3.93
114.00 100.00 107.13
4.07
20.00 15.00 16.89 1.35
14.00 3.00 7.18 2.87
7.00 3.00 6.00 1.55
10.00 2.00 6.24 2.58
12.50 6.00 7.9 1 2.13
16.00 4.00
10.20 3.32
38.00 33.00 35.22
1.39
38.00 34.00 36.31
1.14
42.00 38.00 40.00 1.41
40.00 38.50 39.00 0.46
39.00 36.00 37.16
1.06
39.00 36.00 37.60 0.75
35.50 33.00 34.41 0.86
37.50 32.00 34.73
1.28
38.00 35.00 36.30
1.08
38.50 36.00 36.81 0.77
38.50 37.00 37.91 0.45
39.50 35.00 j7.06 1.31
Identification of variables (variables chosen for further investigation are labelled with<:) - 1: length of skull;:; 2: length of nasal bone 3: maximum width of skull at parietal level"; 4: maximum interorbital width at frontal bone 5: frontornaxillary fontanelle length;>; 6: antero- posterior diameter of eye-socket" ; 7: transver e diameter of eye-socket.
over, adequate statistical treatment of the data has decreased the flaws in Couturier's material (see the following section).
hlATERIALS AND hlETHODS Only measurements of sexually mature animals
(i.e. > 2 year old) were used for analysis, and logarithmic transformations of the data help- ed to reduce the heterogeneity of samples caused by differences in age and sex of the individuals sampled.
Our analysis developed thus: A - Seven mor- phometric variables for the skull (Table I) and seven for the horns (Table 11) were used for descriptive analysis. Some relevant statistical measures were calculated on the original data in 111111. The computer outputs may be obtained from one of us (C.S.). Additional information, not given here, can be extracted from these (va-
riance-covariance matrices, skewness and kurtosis measures, multivariate normality analyses, prin- cipal component and canonical variable vectors, partial correlation coefficients, and so on).
As we depended on the data collected by Couturier (1938), we could not extend our ana- lysis to a larger number of suitable variables. Couturier's data concern mainly phenotypic characters, whereas more genotypic variables, from which to draw frequencies of alleles, would have been desirable to evaluate systematic distances.
B - Only four variables were finally selected to work out positive definite matrices. We cal- culated the correlation matrices for each set of observations, thus finding out the degrees of correlation between variables. When two or more variables were highly correlated with one another, only the genotypica1 variable apparently more important was retained. A natural loga- rithmic transformation was used before calcu-
Dow
nloa
ded
by [
223.
86.6
.219
] at
11:
00 3
1 M
arch
201
4
REVISION OF 'RUPICAPRA' GENUS. I. A STATISTICAL RE-EVALUATION OF COUTURIER'S DATA
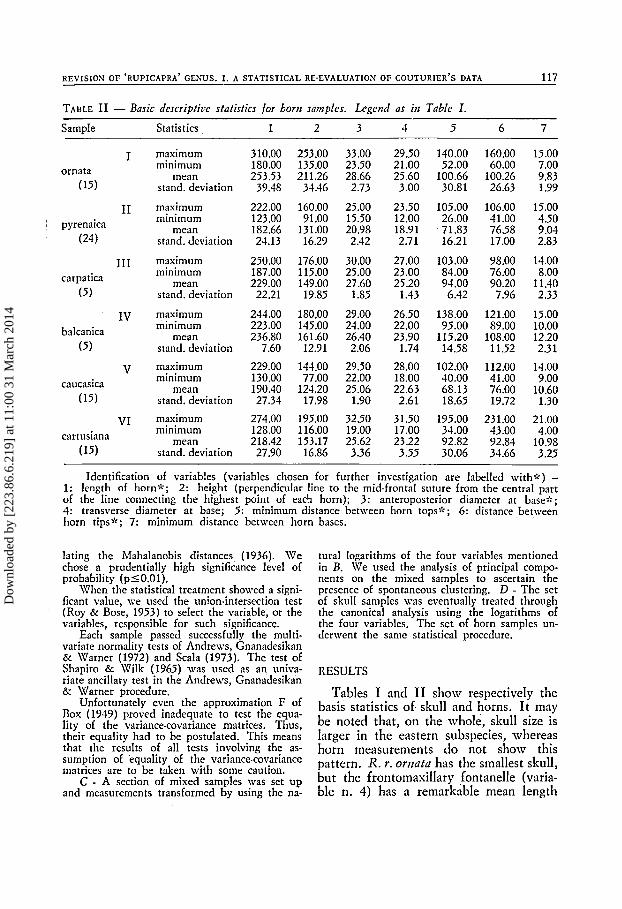
TABLE I1 - Basic descripfice stafisfics for horri samples. Legend as irr Table I .
117
Sample Statistics 1 2 3 4 5 6 7
I ornata
(15)
I1 ' pyrenaica
(24)
I11 carpatica
(5)
IV balcanica
( 5 )
V caucasica
(15)
VI cartusiana
(15)
maximum minimum
mean stand. deviation
maximum minimum
mean stand. deviation
maximum minimum
mean stand. deviation
maximum minimum
mean stand. deviation maximum minimum
mean stand. deviation maximum minimum
mean stand. deviation
310.00 253.00 180.00 135.00 253.53 211.26
39.48 34.46
222.00 160.00 123.00 91.00 182.66 131.00 24.13 16.29
250.00 176.00 187.00 115.00 229.00 149.00 22.21 19.85
244.00 180.00 223.00 145.00 236.80 161.60
7.60 12.91
229.00 143.00 130.00 77.00 190.40 123.20 27.34 17.98
274.00 195.00 128.00 116.00 218.42 153.17 27.90 16.86
33.00 23.50 28.66 2.73
25.00 15.50 20.98 2.42
30.00 25.00 27.60
1.85
29.00 24.00 26.40 2.06
29.50 22.00 25.06
1.90
32.50 19.00 25.62 3.36
29.50 21.00 25.60 3.00
23.50 12.00 18.91 2.71
27.00 23.00 25.20
1.43
26.50 22.00 23.90
1.74
28.00 18.00 22.63 2.61
31.50 17.00 23.22 3.55
140.00 52.00
100.66 30.81
105.00 26.00 71.83 16.21
103.00 84.00 94.00 6.42
138.00 95.00
115.20 14.58
102.00 40.00 68.13 18.65
195.00 34.00 92.82 30.06
160.00 60.00
100.26 26.63
106.00 4 1 .OO 76.58 17.00
98.00 76.00 90.20 7.96
121.00 89.00
108.00 11.52
112.00 41.00 76.00 19.72
23 1 .OO 43.00 92.83 33.66
15.00 7.00 9.83 1.99
15.00 4.50 9.04 2.83
14.00 8.00
11.40 2.33
15.00 10.00 12.20 2.31
14.00 9.00
10.60 1.30
21.00 4.00
10.98 3.25
Identification of variables (variables chosen for further investigation are labelled with") - 1: length of horn;':; 2: height (perpendicular line to the mid-frontal suture from the central part of the line connecting the highest point of eac'l horn); 3: anteroposterior diameter at base;':; 4: transverse diameter at base; 5: minimum distance between horn tops;':; 6: distance betmeen horn tips^; 7: minimum distance between horn bases.
lating the hlahalanobis distances (1936). We chose a prudentially high significance level of probability (~50.01).
When the statistical treatment showed a signi- ficant value, we used the union-intersection test (Roy & Bose, 1953) to select the variable, or the variables, responsible for such significance.
Each sample passed successfully the multi- variate normality tests of Andrews, Gnanadesikan & Warner (1972) and Scala (1973). The test of Shapiro & \Vilk (1965) was used as an univa- riate ancillary test in the Andrews, Gnanadesikan & Warner procedure.
Unfortunately even the approximation F of Box (1949) proved inadequate to test the equa- lity of the variance-covariance matrices. Thus, their equality had to be postulated. This means that the results of all tests involving the as- sumption of equality of the variance-covariance matrices are to be taken with some caution.
C - A section of mixed samples was set up and measurements transformed by using the na-
tural logarithms of the four variables mentioned in B. We used the analysis of principal compo- nents on the mixed samples to ascertain the presence of spontaneous clustering. D - The set of skull samples was eventually treated through the canonical analysis using the logarithms of the four variables. The set of horn samples un- derwent the same statistical procedure.
RESULTS
Tables I and I1 show respectively the basis statistics of. skull and horns. It may be noted that, on the whole, skull size is larger in the eastern subspecies, whereas horn measurements do not show this pattern. R. r. orrzata has the smallest skull, but the frontomaxillary fontanelle (varia- ble n. 4) has a remarkable mean length
Dow
nloa
ded
by [
223.
86.6
.219
] at
11:
00 3
1 M
arch
201
4

118 S. LOVARI, C. SCALA
TABLE I11 - Alahalanobis distances (squared) between skull samples. Diniensiorz of samples in brackets. W h e n the distances are significant (pzO.01) the variables whose means are signi- ficantly different betzceen samples are shown in the corresponding cells.
(19) (5) (7) (6) (15) I1 I11 I V v V I
(9) I 6.630 10.953 9.463 10.991 7.500 x3 XI XI XI XI x4
(19) I1 13.256 9.920 8.935 7.581
(5) 111 3.184 7.411 7.687
(7) I V 3.862 5.998 5.337 (6 ) V
XI xzx4 XIXZ x4 XIXZ XI
XI
XZ
Identification of samples - I: ornata; 11: py- renaica; 111: carpatica; IV: balcanica; V: cau- casica; VI: cartusiana.
Identification of variables - 1: log (length of skull); 2: log (maximum width of skull at pa- rietal level); 3: lop, (frontomaxillary fontanelle length); 4: log (anteroposterior diameter of eye- socket).
in respect to those of the other groups, all but one bearing fontanelles less than half the size of orizata’s. Only cartzisiana shows a mean length a little more than half the ornata’s value and it appears from literature (Blahout, 1971) that tatrica has a greater mean length, 15.25 mm, greater than cartmiaim, but lesser than omata. !-lowever, the fontanelle of tafrica is open, whereas it is always sutured in ornafa. Horn length (variable n. 1) of orlzata is also clearly more than in the other subspecies, in one case being up to cm 31 against a maximum of cm 27.4 of one individual belonging to the car- tzisiana subspecies. On the other hand, the distance between the horn bases (variable n. 7) of orrzata is exceedingly small, only pyreizaica showing a smaller value. R. r. pyreiiaica and cazicasica have nearly equal minimum distances between the tops of the.horn (variable n. 5 ) and distances between horn tips (variable n. 6). Variables n. 3 and 4, relevant to horn
thickness, indicate that pyreizaica bears by far the thinnest horns, whereas orizatn shows the thickest, followed closely by carpatica.
Significant (p I 0.01) group differences between variables, in logarithms, are pointed out in Tables I11 (skulls) and IV (horns). The frontomaxillary fonta- nelle length is confirmed as a discriminant variable between orizata and all but one (cartusiana) of the other subspecies. How- ever, orizata and cartzisiarza differ strongly in skull length and in the anteroposterior diameter of the eye-socket. R. r. pyreizaica shows definite characters such as length of skull, maximum width of skull at the parietals and the anteroposterior diameter of the eye-socket. Also carttrsiaria shows some significant skull differences from the other subspecies, balcarzica excepted. If one compares the Mahalanobis distan- ces of orizata from the other subspecies (Table 111), pyreiraica is the nearest group, followed closely by cartzisiuiza and farther on by balcarzica, carpatica and cazicasica. The same trend is confirmed by Figures 3-6 in spite of an apparently closer position of carttisiaiza than pyrerzaica to orizata.
TABLE I V - Alahalanobis distances (squared) between horn samples. Legend as in Tab. I I I .
(24) ( 5 ) (5) (15) (63) I1 111 I V v VI
(15) I 13.086 1.961 2.410 5.200 3.771
(24) I1 9.387 9.313 9.990 9.874 XlX4 XI Xt XI
( 5 ) I11 2.651 3.768 1.802 4.636 2.007
(15) v 3.892
XI XI XI
(5) I V
Idenfification of saiizples - I: ornata; 11: py- renaica; 111: carpatica; IV: balcanica; V: cau- casica; VI: cartusiana.
Idegification of variables - 1: log (length of horn); 2: log (anteroposterior diameter at base); 3: log (distance between horn tips); 4: log (mi- nimum distance between horn bases).
Dow
nloa
ded
by [
223.
86.6
.219
] at
11:
00 3
1 M
arch
201
4

REVISION OF ‘RUPICAPRA’ GENUS. I. A STATISTICAL RE-EVALUATION OF COUTURIER’S DATA 119
TABLE V - Variabi!ity expIatiatiorr for skalls.
Mixed samples First First+Second Rzipicapra rrrpicapra principal principal ssp. component components
orriala + pyrenaira 99.22 99.67 orriala + carpatica 98.63 99.61 orrzafa + balcaiiica 98.97 99.67 orriafa + carrcasica 97.83 99.12 ornata + carlusiana 98.01 99.30
However, the Mahalanobis distances are of course to be preferred for the purpose of comparison because they exploit the full information contained in the data, whereas the maps (plotted as they are by crossing two components only) have less exhaustive contents. Statistically signifi- cant horn variables (Table IV) are scant. Only pyrenaica and, to a lesser extent, orriata and catrcasica show some signifi- cant differences in variables.
I t is worth pointing out that the va- riable n. 3 (Tab. IV) suggests a signifi- cant difference between pyreriaica and caricasica, whereas the data reported in Table I1 indicate the opposite as to the same variable. This lack of congruence is probably due to the different pattern of the variance-covariance matrices of the two subspecies. Table 11, based on’actual
, I s,&--. ~ * I ! I
A 0 1 _ _ --
~ F,RJT ~ I N C I P ” L mUPZNLfl1 umu--- *- -0-
lo- 1.1111 M 2 . l I,-, US?.* %Dux)
Fig. 3. - Principal component clusterings inside the skull mixed sample of ornafa + pjretzaica.
Fig. 4. - Principal component clustering inside the skull mixed sample of ornata + cartusiarra.
data, is more likely to yield reliable infor- mation than Table IV which is the result of a statistical treatment postulating theo- retical assumptions (see Materials and Methods).
Figures 3-7 show graphically by cross- ing the first two principal components the results of the analysis of spontaneous clustering relevant to the skull data. Mix- ed samples comparing the ornata group with each of the other subspecies were treated statistically using four skull va- riables. The orriata subspecies resulted clearly separated from the other groups
7 %do3 LOW- nym tmsoi -I* LOU- tzslt
Fig. 5. - PrincipaI component clusterings inside the skull mixed sample of ortiafa + balcanica.
Dow
nloa
ded
by [
223.
86.6
.219
] at
11:
00 3
1 M
arch
201
4

120 S. LOVARI, C. SCALA
Fig. 6. - Principal component clusterings inside the skull mixed sample of ornata + carpnfica.
in all cases, although to different extents. This is consistent with the results shown in Table 111. Table IV summarizes the excellent level of discrimination of the overall variability.
Figs. 8-12 show the results of the same statistical treatment for horns. R. r. or- izata horns are not clearly different from those of the other subspecies. Table 6 summarizes the poor level of explanation of the overall variability.
The results of the multiple discriminant analysis (canonical analysis) for skull and horns are respectively set out in Figures 13 and 14. The discriminant powers asso- ciated with the canonical variables are charted in Table VII. The level curves of the frequency surfaces (traced at the 50% level on the assumption of the mul- tivariate normality of the set of variables) enhance the representativeness of the gra- phical picture of the maps, showing the crossing of the first and second canonical components. Data for horns (Fig. 14) do not differentiate satisfactorily between subspecies, the pyrerzaica group being the only one clearly distant from all the others. Yet Figure 13, for skull measures, shows a fine spacing of the subspecies studied with orrzata and pyreriaica set well apart from the other groups.
Table VII points out that, although the powers of canonical components associa- ted with horns are higher than those as- sociated with skulls, horn measurements cannot be used to discriminate the sam- ples, whereas skull measurements are neatly spaced. This confirms that measu- rements on skulls are preferable to those on horns for taxonomy.
A more accurate evaluation in proba- bilistic terms of the systematic distance between these subspecies may be obtained from Tables IV and V. But, results set out in Tables I11 and IV and those shown in Figs. 13 and 14 are discordant in some cases, which may be due to an imperfect overall equality of the matrices in the variance-covariance of the samples.
DISCUSSION
Our results suggest a rather close re- lationship for pyrerzaica and orrzata; the other subspecies form a separate group. R. r. pyrenaica and orrzata have the small- est skulls, the closest horn bases, oblite- rated frontomaxillary fontanelles (Coutu- rier, 1938) and a similarly patterned min- ter coat.
The Mahalanobis distances for skull variables (Table 111) confirm that pyre- mica is closest to ontata. On the other
Dow
nloa
ded
by [
223.
86.6
.219
] at
11:
00 3
1 M
arch
201
4
REVISION OF 'RUPICAPRA' GENUS. I. A STATISTICAL RE-EVALUATION OF COUTURIER'S DATA 121
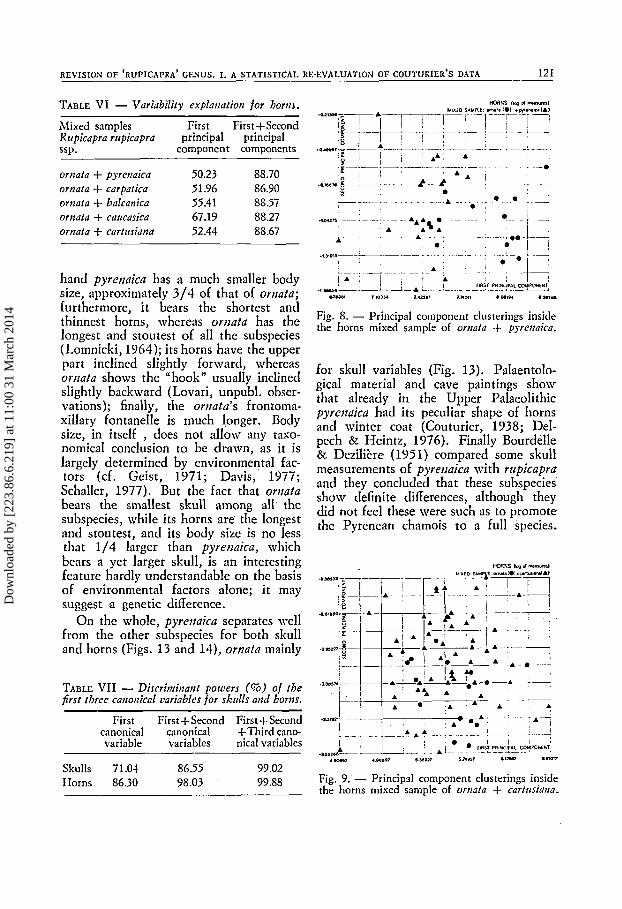
TABLE V I - Variability explanation for horns.
Mixed samples First First+Second Rrrpicapra rtrpicapra principal principal ssp. component components
ornafa i- pyrenaica 50.23 88.70 ornata + carpafica 51.96 86.90 ornata + balcanica 55.41 88.57 ornafa + caticasica 67.19 88.27 ornata + cartrrsiama 52.44 88.67
hand pyreizaica has a much smaller body size, approximately 3/4 of that of orirata; furthermore, i t bears the shortest and thinnest horns, whereas orizata has the longest and stoutest of all the subspecies (Lomnicki, 1964); its horns have the upper part inclined slightly forward, whereas ornata shows the hook" usually inclined slightly backward (Lovari, unpubl. obser- vations); finally, the orizata's frontoma- xillary fontanelle is much longer. Body size, in itself , does not allow any taxo- nomical conclusion to be drawn, as it is largely determined by environmental fac- tors (cf. Geist, 1971; Davis, 1977; Schaller, 1977). But the fact that orizata bears the smallest skull among all the subspecies, while its horns are the longest and stoutest, and its body size is no less that 1/4 larger than pyreizaica, which bears a yet larger skull, is an interesting feature hardly understandable on the basis of environmental factors alone; it may suggest a genetic difference.
On the whole, pyreitaka separates well from the other subspecies for both skull and horns (Figs. 13 and 14), orizata mainly
TABLE VII - Discriminant powers ((75) of /he first three canonical uariables for sktills and horns.
First First+Second First+Second canonical canonical +Third cano- variable variables nical variables
Skulls 71.01 86.55 99.02 Horns 86.30 98.03 99.88
for skull variables (Fig. 13). Palaentolo- gical material and cave paintings show that already in the Upper Palaeolithic pyreizaica had its peculiar shape of horns and winter coat (Couturier, 1938; Del- pech & Heintz, 1976). Finally Bourdelle & Dezilitre (1951) compared some skull measurements of pyreizaica with riipicapra and they concluded that these subspecies show definite differences, although they did not feel these were such as to promote the Pyrenean chamois to a full species.
Fig. 9. - Principal component clusterings inside the horns mixed sample of ornafa + cartusiana.
Dow
nloa
ded
by [
223.
86.6
.219
] at
11:
00 3
1 M
arch
201
4

122 S . LOVARI, C. SCALA
Fig. 10. - Principal component chsterings inside the horns mixed sample of ornata + balcanica.
Fig. 12. - Principal component clusterings inside the horns mixed sample of ornata + caucarica.
Table I11 suggests that carttisiatza may also be recognized as rather different from pyretiaica, ortrata and the other subspecies as well. R. Y. cartitsiatza holds a somewhat “intermediate” position between the group pyretzaica-ortzata and the more eastern subspecies (variables n. 2 and 4, Table I; Fig. 13; to which perhaps one should add the narrowness of its frontomaxillary fon- tanelle, cf. Couturier, 1938), as well as pos- sibly between pyretzaica and ortrata (va- riable n. 3, Table I). Moreover, it shows significant Mahalanobis distances for skulls
-** ,I- M5M .seu. II.7.. 1-
Fig. 11. -Principal component clusterings inside the horns mixed sample of ornata + carpatica.
(Table 111) from all other subspecies, bal- catzica excepted. On the other hand, the pattern of its winter coat belongs defini- tely to the “Alpine” type (Couturier, 1938).
On the basis of our results, little com- ment can be made on the other subspecies, which do not seem to differentiate much from each other.
The final picture we may draw from our results would indicate that the Pyre- nean and the Abruzzian chamois are well differentiated from all the others, and showing also some interesting differences between themselves. R. Y. carttisiatza is closer to the eastern subspecies, but i t
W M--_
1 - I T ) 110 13% 2x2 PI a 4 23s 236
Fig. 13. - Canonical variables mapping for skulls.
Dow
nloa
ded
by [
223.
86.6
.219
] at
11:
00 3
1 M
arch
201
4

123 REVISION OF ‘RUPICAPRA’ GESUS. I. A STATISTICAL RE-EVALUATION OF COUTURIER’S DATA
-16-
-17-
-10-
-19,
4 HORNS (log of meacurcs)
; caucasce
a. 5 3
pyremica
x
Means 01 canonid cornponenls 49 4’ 42 43 4.4
first cononicd ccrnponenf
Fig. 14. - Canonical variables mapping for horns.
bears a few “intermediate” characters between the pyreriaica-orriata group and the others.
Unfortunately Couturier’s data do not report any expIoitabIe morphometric mea- sure for the Alpine subspecies, which most likely holds a “key-position’’ in the understanding of the taxonomical history of chamois subspecies, given its interme- diate geographical location among pyre- riaica, oriiata, cartrrsiatia, and the eastern groups. Yet, one may assume that rrrpi- capra cannot be very different from car- ftrsiama, being so close geographically.
The picture we have given above on subspecific differences of the chamois may have two possible explanations, although much more biometrical, palaeontological, behavioural and possibly serological infor- mation is needed before granting any of them. The chamois could have reached the Pyrenees and the Southern Apepnines already during the Riss glaciation. Ac- tually, to our knowledge, there is no reason why it should not have done so. The retreat of the ice during the Eem interglacial may have left two relict “Riss” populations in the Pyrenees and Apen- nines. These might have developed con- vergent features during the time they re- mained isolated, whereas the more north- ern chamois populations could still have had reciprocal contacts. Later during the
Wurm stadia1 the Pyrenean and the Abruz- zian “Riss” chamois might have been in touch with the northern group, but not long enough to lose the features they had acquired in the Riss-Wurm interglacial. On the other hand, this hypothesis pre- sumes that the “Riss)) chamois left in both the Pyrenees and the Apennines evolved separately the same pattern of winter coat, close horn bases and small skull. This is rather hard to believe. Another explanation may be that the Ris- sian chamois already belonged to the type pyreriaica - orriata, whereas the Wurmian belonged to a wave coming possibly from the East, or the North-East, where it had evolved some population features of its own. Such a Wurmian chamois might have absorbed the remains of‘ the Rissian group where the two came into contact, but the Wurmian could have failed to reach the Pyrenean and Apennine ‘ I Riss ’) remnants, or perhaps to be in touch with them long enough to change permanently some of their features. This hypothesis might also explain why the geographically closest cartrrsiaria bears some “interme- diate” morphometric variables, and why some rare individuals have been recorded showing winter coat features comparable with those of pyreriaica- orriata chamois in populations belonging to rrrpicapra and balcuriica subspecies (Camerano, 19 14). We think the second explanation is much more likely than the first, convergent evo- lution of the winter coat pattern being an improbable occurrence.
One must postulate that there has been a lot of geographic differentiation as early as in the first (Rissian) chamois and all this has been repeatedly “stirred” by population movements in the course of glaciation and deglaciation. In general, it would seem that the “glacial time” populations, which were then pushed away from the higher mountain ranges, were more nearly contiguous than those of the present day (KurtEn,in litt.). Thus, there should occur a rhythm of near-pan-
Dow
nloa
ded
by [
223.
86.6
.219
] at
11:
00 3
1 M
arch
201
4

124 S. LOVARI, C. SCALA
mixia and isolation. But of course gla- ciation brought other barriers than those existing at the present day. The whole story must be immensely complicated.
Whatever hypothesis may be true, all subspecies here examined, but for pyre- ~ a i c a and omata, show such “ juvenile” features as the unsutured frontomaxillary fontanelle and the skull larger than in py- rertaica-ornata. Little is known on beha- vioural differences between the subspecies of chamois, but preliminary data mould indicate that omata has a richer behaviour- a1 repertoire and a less conspicuous overtly aggressive “ territorial behaviour than ru- picapra. If the neotenisation hypothesis proposed by Geist (1971) for the evo- lution of wild sheep is true, these features of pyreriaica and orrrafa would support the view of their “older” age in compa- rison with the other subspecies. Further- more, if a primitive group of chamois did give rise to an advanced one via neoteni- sation, then a relatively drab coat - like that of the “Alpine” races - could be expected in the advanced subspecies. One could also expect the body to show ad- vances in combat adaptations. A larger, more sturdy skull does fit into the picture, as may do the shorter and stout horns of the “Alpine” forms. In fact, stout, short horns break less frequently than long ones. Finally, the “Alpine” subspecies seem to be the more highly evolved figh- ters: they bear a stocky, muscular body structure and their combats are spectacular.
A detailed behavioural and morpholo- gical comparison of the “Rissian” and some “ Wiirmian” races is in progress and should be helpful.
REFERENCES
Andrews D. F., Gnanadesikan R. & Warner J. L., 1973 - hlethods for assessing multivariate normality. Proc. 3rd Int. Symp. on hiultiv.
Analysis, Daton, Ohio. In “ hlultivariate Ana- lysis 111”, 95-115. P. R. Ktishnaian (ed.), New York & London: Academic Press.
Blahout hl., 1971 - Zur Taxonomie der Popula- . tion von Rrrpicapra rrrpicapra (Linn6, 1758)
in der Hohen Tatra. Zoologicke Listy, 21:
Boutdelle E. & Dezilikre hl., 1951 - Caractstes osteologiques et ost6om6triques de la tCte de l’isard, comparativement i la tCte du chamois. Bull. SOC. Nat. Toulouse, 86: 117-121.
Box G. E. P., 1949 - A general distribution theory for a class of likelihood criteria. Bio- metrika. 36: 317-346.
Camerano L., 1914 - Ricerche intorno ai camosci. hiem. R. Accad. Sci. Totino (Classe Scienze Fisiche, hlatem, e Natur., s. 11), 65: 1-82.
Chaline J., 1972 - La Quatetnaire. Paris, Doin. Couturier hI., 1938 - Le chamois. Grenoble, Ar-
thaud. Davis S., 1977 - Size variation of the fox Vrrlpes
urrlpes in the Palaearctic region today, and in Israel during the late Quaternary. J. Zool., Lond., 182, 343-351.
Delpech F. & Heintz E., 1976 - Les artiodacty- les: Bovidks. In “La Prehistoire Frangaise”, vol. 1: 386-394. H. de Lumley (ed.). Paris, E.C .N .R .S .
Geist V., 1971 - hiountain sheep: a study in behaviour and evolution. Chicago & London, The University of Chicago Press.
Knaus W. & Schroder W., 1975 - Das Gams- wild. Hamburg, Paul Patey.
Kurt& B., 1968 - Pleistocene mammals of Euro- pe. London, Weidenfeld & Nicolson.
Lomnicki A., 1964 - Analiza rog6w kozicy Rzr- picapra rtrpicapra (L . 1758) z Tatt. Ochrony Przyrody, 30: 141-156.
hfahalanobis P. C.. 1936 - O n the eeneralised
115-132.
distance in Stitistics. Proc. Natn.-Inst. Sci. India, 1936: 49-55.
Roy S.N. & Bose R.C., 1953 - Simultaneous confidence interval estimation. Annals hiath. Stat., 24: 513-536.
Scala C., 1973 - Un semplice test di multinorma- liti. Studi di Economia, 4 : 3-12.
Schaller G., 1977 - hiountain monarchs: wild sheep and goats of the Himalaya. Chicago & London, The University of Chicago Press.
Shapiro S.S. & Wilk hI.B., 1965 - An analysis of variance test for normality (complete sam- ples). Biometrika, 52: 591-611.
Dow
nloa
ded
by [
223.
86.6
.219
] at
11:
00 3
1 M
arch
201
4