Chironomids from Southern Alpine Running Waters: Ecology, Biogeography
Upload
oregonstateCategory
view
1download
0
Ecology, 88(6), 2007, pp. 1365–1378� 2007 by the Ecological Society of America
BIOGEOGRAPHY OF BACTERIOPLANKTON IN LAKES AND STREAMSOF AN ARCTIC TUNDRA CATCHMENT
BYRON C. CRUMP,1,4 HEATHER E. ADAMS,2 JOHN E. HOBBIE,3 AND GEORGE W. KLING2
1University of Maryland Center for Environmental Science, Horn Point Laboratory, Cambridge, Maryland 21613 USA2University of Michigan, Ann Arbor, Michigan 48109 USA
3The Ecosystems Center, Marine Biological Laboratory, Woods Hole, Massachusetts 02543 USA
Abstract. Bacterioplankton community composition was compared across 10 lakes and14 streams within the catchment of Toolik Lake, a tundra lake in Arctic Alaska, during sevensurveys conducted over three years using denaturing gradient gel electrophoresis (DGGE) ofPCR-amplified rDNA. Bacterioplankton communities in streams draining tundra were verydifferent than those in streams draining lakes. Communities in streams draining lakes weresimilar to communities in lakes. In a connected series of lakes and streams, the streamcommunities changed with distance from the upstream lake and with changes in waterchemistry, suggesting inoculation and dilution with bacteria from soil waters or hyporheiczones. In the same system, lakes shared similar bacterioplankton communities (78% similar)that shifted gradually down the catchment. In contrast, unconnected lakes containedsomewhat different communities (67% similar). We found evidence that dispersal influencesbacterioplankton communities via advection and dilution (mass effects) in streams, and viainoculation and subsequent growth in lakes. The spatial pattern of bacterioplanktoncommunity composition was strongly influenced by interactions among soil water, stream,and lake environments. Our results reveal large differences in lake-specific and stream-specificbacterial community composition over restricted spatial scales (,10 km) and suggest thatgeographic distance and connectivity influence the distribution of bacterioplanktoncommunities across a landscape.
Key words: Arctic; bacteria; bacterial production; bacterioplankton; biogeography; diversity;denaturing gradient gel electrophoresis; DGGE; metacommunity.
INTRODUCTION
Freshwater ecosystems are networks of distinct lake,
stream, soil water, and groundwater environments that
are linked within catchments by downslope water flow.
Limnologists incorporate the role of catchments in lake
and stream studies, but in the last decade this approach
has expanded to include hydrological networks and
concepts in landscape ecology. The spatial arrangement
of lakes and streams on the landscape can predict
various chemical and biological characteristics (Magnu-
son et al. 1990, Soranno et al. 1999, Riera et al. 2000)
and in part the interactions among aquatic habitats
control their individual functioning (Kling et al. 2000).
Spatial controls have long been central to the study of
metapopulations (Levins 1969, Hanski and Gilpin 1991)
and more recently metacommunities (Leibold et al.
2004), but most studies of bacterial community compo-
sition have focused only on single environment types
such as lakes or streams. Comparisons across environ-
ments are less common (e.g., Dolan 2005) and interac-
tions among organisms populating these environments
are rarely investigated (e.g., Crump et al. 2004). To gain
a better understanding of bacterial community compo-
sition across a landscape, we analyzed bacterioplankton
(i.e., bacteria suspended in water) in lakes and streams
of an arctic catchment in order to describe how spatial
patterns in diversity are related to geographic position,
water flow, habitat connectivity, and physical and
chemical variability of these waters.
Variations in bacterioplankton community composi-
tion, characterized with PCR-based community finger-
printing techniques, often correlate with physical,
chemical, and biological factors (Muylaert et al. 2002,
Simek et al. 2002, Yannarell and Triplett 2004).
Recently, a few studies indirectly looked at dispersal of
bacterioplankton by including the spatial distribution of
habitats as an independent variable. They found that
bacterioplankton communities were more similar in
lakes that were closer together than in lakes farther
apart (Reche et al. 2005), that communities in two
adjacent but non-intersecting river systems were nearly
identical (Crump and Hobbie 2005), and that commu-
nities in lakes from the same catchment were more
similar than in lakes across catchments, including
isolated lakes in which these similarities could not be
caused by water transport of bacterial cells (Lindstrom
and Bergstrom 2005). In contrast to these studies, one
study showed that the distribution of lake bacterial
Manuscript received 6 March 2006; revised 12 July 2006;accepted 17 July 2006. Corresponding Editor: R. B. Jackson.For reprints of this Special Feature, see footnote 1, p. 1343.
4 E-mail: [email protected]
1365
SPECIALFEATURE
communities was unrelated to geographic location and
not influenced by stream flow between lakes (Konopka
et al. 1999). Although studies on this topic are still few, it
is probable that a gradient of potential controls on
community composition exists, with one endpoint
governed by high dispersal rates leading to similar local
communities in nearby sites and the opposite endpoint
governed by various edaphic or environmental condi-
tions such as DOM chemistry at local sites which select
for particular community members. This latter control
has been demonstrated experimentally, where variations
in DOM composition led to changes in aquatic bacterial
community structure (Findlay et al. 2003, Judd 2004,
Judd et al. 2006).
In the context of metacommunity dynamics, interac-
tions among communities in specific habitats can be set
by mass dispersal effects, followed by species sorting.
For aquatic bacteria, the mass effect is dominated by
advection of large numbers of cells by rivers or during
storm events, but can also include the process of cross-
inoculation of small numbers of cells (e.g., via small
streams or wind) between habitats. For example,
advection of bacterial cells into lakes from land via
streams can be very high (Bergstrom and Jansson 2000),
and in some cases can exceed in situ rates of bacterial
cell production. Such advection can also influence
community composition in lakes (Crump et al. 2003,
Lindstrom and Bergstrom 2004) and estuaries (Crump et
al. 1999, 2004), and is most important in systems with
short water residence times (Lindstrom et al. 2005),
which increase the probability of a strong mass effect.
By comparison, when small numbers of cells are
transferred between habitats their influence on bacterial
community composition is less clear. Upstream envi-
ronments are metacommunities for downstream habi-
tats, and these metacommunities are theoretically
enormous (Finlay 2002, Fenchel 2003) because bacteria
are extremely abundant and fast growing. Thus the
probability of their dispersal is very high and the
probability of extinction low; this leads to the long-
standing hypothesis that ‘‘everything is everywhere, but
the environment selects’’ (Baas-Becking 1934). Certainly
this hypothesis is limited in the literal sense because
severe environments can eliminate even bacterial resting
stages, and recent studies also challenge this hypothesis
by identifying geographic isolation in some microbial
taxa (Hollibaugh et al. 2002, Papke et al. 2003, Whitaker
et al. 2003). However, widespread functional redundan-
cy among bacteria makes it difficult to predict which
organisms from a metacommunity will become abun-
dant in any particular environment (Curtis and Sloan
2004).
Therefore, the data currently available suggest that
bacterial community composition in freshwaters is
controlled by dispersal (biogeography) or environment
(habitat quality), or both, and that these controls
operate across a spatial range from local to regional.
Our goals here are to (1) describe the spatial patterns of
bacterioplankton community composition in a complex
catchment with both connected and isolated lakes and
streams, (2) determine whether environmental factors
predict community composition, and (3) investigate the
mechanisms and potential influence of dispersal by
downslope water flow on patterns of community
composition.
METHODS
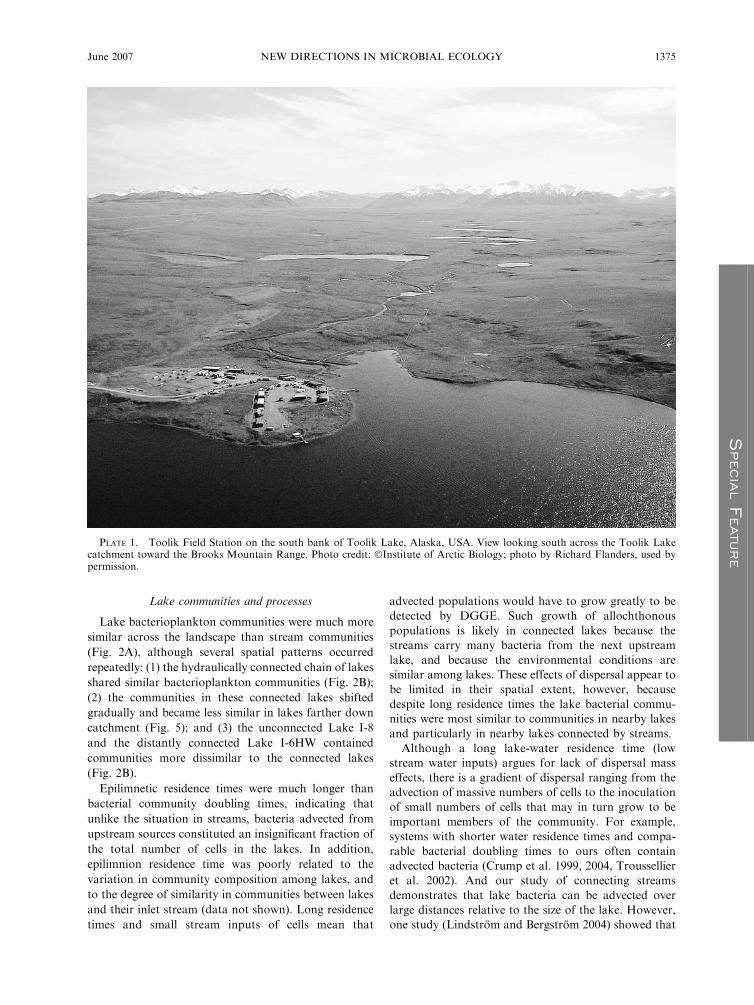
Toolik Lake (1.5 km2) is located on the North Slope
of Alaska (6883800000 N, 14983601500 W) about 180 km
south of the Arctic Ocean (see Plate 1). The Toolik Lake
catchment (6690 ha) is a research site for the Arctic
Long-Term Ecological Research program, and is an
archetype of regional tundra terrain (Fig. 1). The main
inlet stream to Toolik Lake drains 75% of the catchment
and is formed by the merger of two streams, each
draining large catchments similar in area but with
different lake–stream configurations (Fig. 1). One
contains a chain of nine lakes while the other contains
only one lake near its base fed by a large network of
headwater streams (Table 1). Stream flow begins in May
and quickly reaches peak flow from snowmelt runoff
(Hobbie et al. 1983). The lakes usually become ice-free
and thermally stratified by late June, and remain that
way until early October when ice forms.
The length of streams in the Toolik catchments varies
(Fig. 1). Connecting streams flow between lakes, and, at
least initially, contain lake water and lake bacteria.
Lake-less streams are those that have no upstream lakes
and thus contain water and bacteria from the upland
tundra and stream habitats. Lakes and streams were
sampled once in 2000 (6–7 July), three times in 2001 (29–
30 June, 17–18 July, 7–8 August), and three times in
2002 (25–26 June, 16–17 July, 6–8 August). Samples
were collected from the lake middle at a depth of 1 m,
from inlet streams just upstream of lakes, and from two
other streams (I-8 headwaters and Milky Way). Outlet
streams of each lake were also sampled for physical and
chemical measurements. Note that inlet streams to
Lakes I-4 and I-7 are very short and were not sampled.
Also, ‘‘Lake’’ I-9 was not sampled because it is a small
mixing pool for two streams.
Lake sampling included samples for dissolved organic
carbon (DOC) as well as depth profiles of temperature,
pH, specific conductivity (lS/cm), and dissolved oxygen
(mg/L) measured with a Hydrolab SVR3-DL Surveyor 3
H20-BT multiprobe (Hach Company, Loveland, Colo-
rado, USA). Streams (at lake inlets and lake outlets)
were sampled for temperature, specific conductivity, pH,
CO2, CH4, DOC, PO43�, Ca2þ, Mg2þ, Naþ, Cl�, and Si.
Variables beginning with DOC in the previous list were
measured in samples filtered in the field through
Whatman GF/F filters (nominal pore size 0.6 lm) and
analyzed within 24 hours (PO43�), kept cold and dark
until analysis (Cl�), or preserved with acid in the field
and kept cold and dark until analysis. All other methods
BYRON C. CRUMP ET AL.1366 Ecology, Vol. 88, No. 6
SPECIALFEATURE
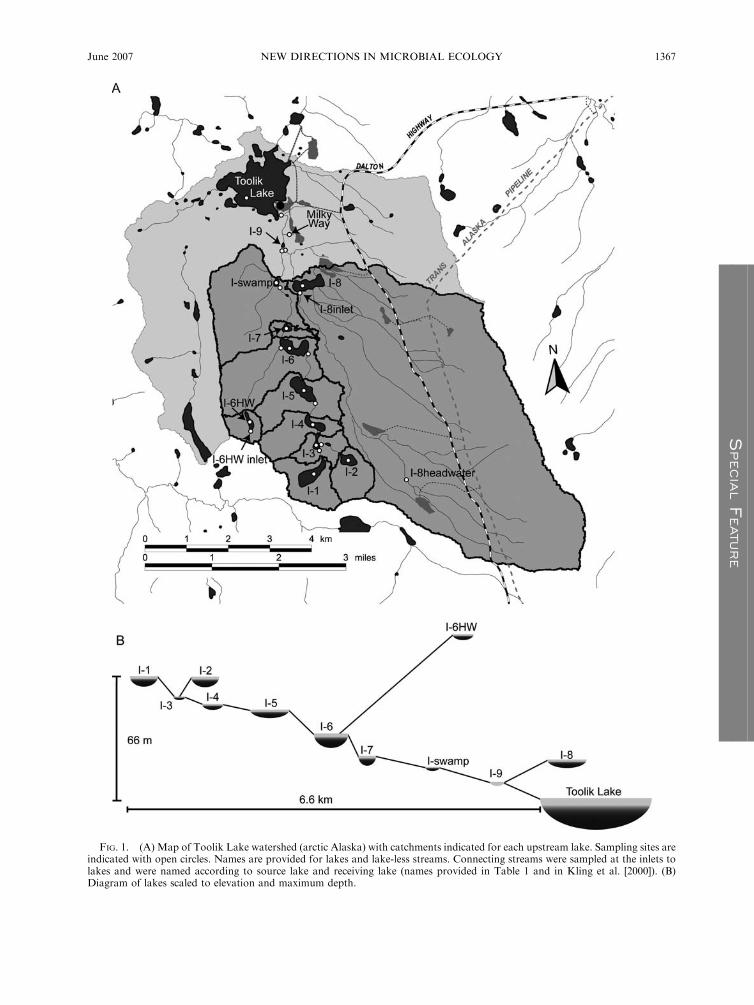
FIG. 1. (A) Map of Toolik Lake watershed (arctic Alaska) with catchments indicated for each upstream lake. Sampling sites areindicated with open circles. Names are provided for lakes and lake-less streams. Connecting streams were sampled at the inlets tolakes and were named according to source lake and receiving lake (names provided in Table 1 and in Kling et al. [2000]). (B)Diagram of lakes scaled to elevation and maximum depth.
June 2007 1367NEW DIRECTIONS IN MICROBIAL ECOLOGY
SPECIALFEATURE
of collection, processing, and analysis are detailed in
Kling et al. (2000).
Epilimnion water residence time was estimated by
multiplying whole-lake residence times (Kling et al.
2000) by the volumetric fraction contained in the
epilimnion (Table 1). Epilimnion volume was calculated
using the mean pycnocline depth (based on profiles of
temperature and conductivity) for the summer season
and the depth-volume relationship of each lake. In cases
where the depth-volume relationship was unknown (I-
swamp, I-6HW), epilimnion volume was calculated as
the frustum of an inverted cone with volume and surface
area equal to that of each lake with the lower frustum
level taken as pycnocline depth.
Stream water residence times were calculated using
discharge data collected in summer 2005 from all
streams, sampled continuously for I-8 inlet, I-8 to I-9,
and I-7 to I-9, and three times per summer for all other
streams. The average residence time of stream water was
calculated as the length of stream in meters divided by
the mean, volume-weighted water velocity in meters per
second.
Bacterial production was determined in the field by
measuring the incorporation of 14C-labeled l-leucine (30
nmol/L final concentration) into the cold trichloroacetic
acid (TCA) insoluble fraction of macromolecules in two
subsamples incubated for 2–4 hours at in situ temper-
atures in the dark (because we have no separate measure
of Archaeal abundance, this determination is more
specifically the prokaryotic production). Incubations
were conducted in sterile plastic 20-mL scintillation vials
packed in stainless steel thermoses containing freshly
collected sample water. Vials were capped with sterile
Teflon-silicone septa so that incubations could be ended
via syringe injection of a 50/50 mass/volume solution of
TCA (5% final concentration). Procedures for extracting
TCA-insoluble macromolecules are described elsewhere
(Crump et al. 2003). Bacterial carbon production (BP)
was calculated from leucine incorporation following
Kirchman (1993).
Doubling times of bacterial communities were calcu-
lated from bacterial production (BP) and bacterial
biomass (BB). BB was assumed to be 20 lg C/L, which
was calculated from typical cell concentrations in these
systems (13109 cells/L [Hobbie et al. 1983, Crump et al.
2003]) and an experimentally determined conversion
factor (20 fg C/cell [Lee and Fuhrman 1987]). Doubling
time is DT ¼ (ln 2)/l, where l ¼ (BP/BB) (Kirchman
2002). These doubling times are averages for all bacterial
cells and populations in each community regardless of
relative activity.
Water samples were collected in clean, sample-rinsed
opaque plastic bottles filled by hand (streams) or from a
Van Dorn sampler (lakes), and were immediately
processed for DNA samples. Samples were kept on ice
during the sampling day, and subsequently stored at
�808C until processed. DNA sampling and extraction
procedures were previously described (Crump et al.
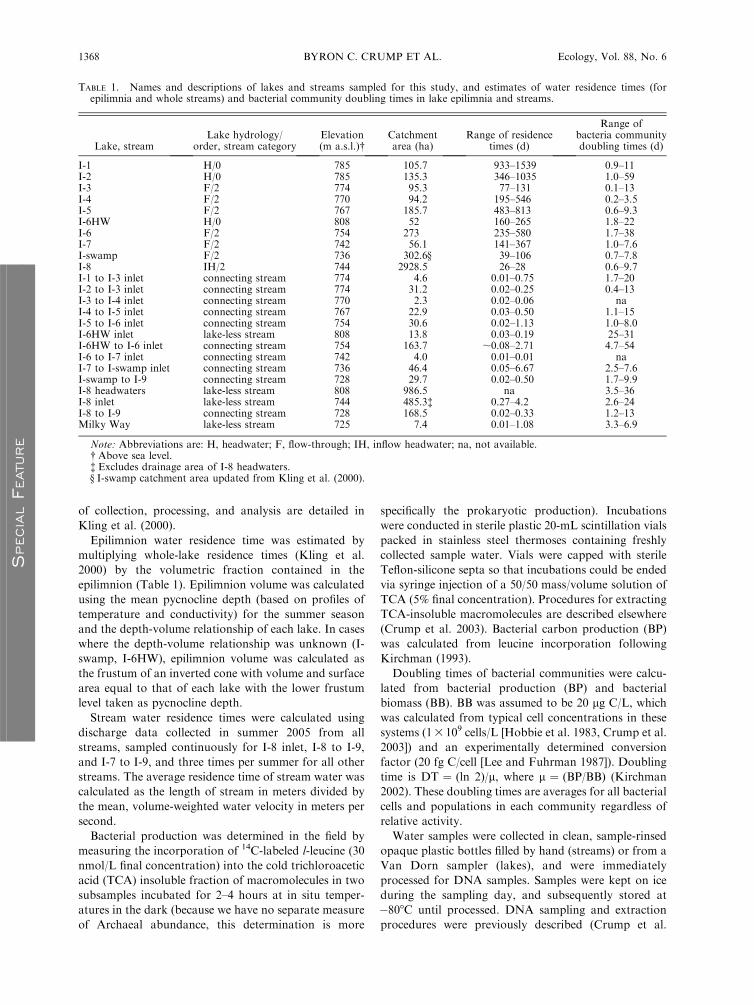
TABLE 1. Names and descriptions of lakes and streams sampled for this study, and estimates of water residence times (forepilimnia and whole streams) and bacterial community doubling times in lake epilimnia and streams.
Lake, streamLake hydrology/
order, stream categoryElevation(m a.s.l.)�
Catchmentarea (ha)
Range of residencetimes (d)
Range ofbacteria communitydoubling times (d)
I-1 H/0 785 105.7 933–1539 0.9–11I-2 H/0 785 135.3 346–1035 1.0–59I-3 F/2 774 95.3 77–131 0.1–13I-4 F/2 770 94.2 195–546 0.2–3.5I-5 F/2 767 185.7 483–813 0.6–9.3I-6HW H/0 808 52 160–265 1.8–22I-6 F/2 754 273 235–580 1.7–38I-7 F/2 742 56.1 141–367 1.0–7.6I-swamp F/2 736 302.6§ 39–106 0.7–7.8I-8 IH/2 744 2928.5 26–28 0.6–9.7I-1 to I-3 inlet connecting stream 774 4.6 0.01–0.75 1.7–20I-2 to I-3 inlet connecting stream 774 31.2 0.02–0.25 0.4–13I-3 to I-4 inlet connecting stream 770 2.3 0.02–0.06 naI-4 to I-5 inlet connecting stream 767 22.9 0.03–0.50 1.1–15I-5 to I-6 inlet connecting stream 754 30.6 0.02–1.13 1.0–8.0I-6HW inlet lake-less stream 808 13.8 0.03–0.19 25–31I-6HW to I-6 inlet connecting stream 754 163.7 ;0.08–2.71 4.7–54I-6 to I-7 inlet connecting stream 742 4.0 0.01–0.01 naI-7 to I-swamp inlet connecting stream 736 46.4 0.05–6.67 2.5–7.6I-swamp to I-9 connecting stream 728 29.7 0.02–0.50 1.7–9.9I-8 headwaters lake-less stream 808 986.5 na 3.5–36I-8 inlet lake-less stream 744 485.3� 0.27–4.2 2.6–24I-8 to I-9 connecting stream 728 168.5 0.02–0.33 1.2–13Milky Way lake-less stream 725 7.4 0.01–1.08 3.3–6.9
Note: Abbreviations are: H, headwater; F, flow-through; IH, inflow headwater; na, not available.� Above sea level.� Excludes drainage area of I-8 headwaters.§ I-swamp catchment area updated from Kling et al. (2000).
BYRON C. CRUMP ET AL.1368 Ecology, Vol. 88, No. 6
SPECIALFEATURE
2003). Denaturing gradient gel electrophoresis (DGGE)
procedures and methods of analysis followed Muyzer et
al. (1993) and were described in detail elsewhere (Crump
and Hobbie 2005).
All variables for statistical tests were transformed to
correct for deviations from normality and homoscedas-
ticity. Transformations were unsuccessful for stream
variables conductivity, PO43�, Ca2þ, Mg2þ, and Cl�,
meaning that the stepwise regression models using P
values for these variables may be biased. Variability in
environmental factors among streams and lakes were
identified using one-way ANOVA with Bonferroni
corrections for multiple comparisons. For each sampling
date, canonical correspondence analysis (CCA, CAN-
OCO 4.5; Microcomputer Power, Ithaca, New York,
USA) was applied to determine the extent to which
environmental variables explained patterns of similarity
in community composition across the landscape (see
Table 2). The CCA analyses used elevation, tempera-
ture, conductivity, pH, and DOC as explanatory
variables, and for lakes one qualitative variable was
coded as three binary dummy variables based on lake
hydrology (headwater, inflow headwater, and flow-
through). Variables were added by forward selection
until model improvement failed (P , 0.05).
Stepwise multiple regression was used to characterize
spatial patterns across all sampling dates using DGGE
similarity values as dependent variables; comparisons
were made within and not between sampling dates in
order to focus on spatial patterns in community
composition. To investigate the potential causes of
community change along stream lengths, DGGE simi-
larity values between every connecting stream and its
source lake were used as dependent variables and
environmental measurements as independent variables,
including calculated changes in chemistry between lake
inlets and lake outlets (downstream inlet minus up-
stream outlet; see Table 3). The chemistry of outlet
stream samples was always very similar to epilimnetic
lake samples in temperature, conductivity and pH, as
found previously (Kling et al. 2000). Difference data
were shifted to positive non-zero numbers prior to
transformation by subtracting the most negative value
and adding one. To investigate the potential causes of
community variability among lakes, a similar regression
analysis was done using geographic distance and
pairwise differences in environmental measurements as
independent variables.
RESULTS
Flow rate of the Toolik inlet stream represents well
the relative stream flow rates throughout the catchment.
Daily mean flow of Toolik inlet stream during sampling
was 1.00 m3/s, similar to a mean of 1.34 m3/s for the
entire ice-free seasons of 2000 to 2002. Rain storms
causing small spikes in stream flow occurred one to two
days prior to sampling campaigns on 6–7 July 2000 and
29–30 June 2001, raising daily mean flow rates to 1.65
m3/s and 1.71 m3/s, respectively. Inlet stream flow was
exceptionally low (,0.01 m3/s) during sampling from 6–
7 August 2002.
One-way ANOVAs of environmental factors identi-
fied significant variability among lakes for conductivity
and DOC, and among streams for all variables except
DOC and PO43�. Lake I-8 had elevated conductivity
relative to Lakes I-1 through I-5 (P , 0.001), but was
not significantly different from lakes I-6, I-7, or I-
swamp. Lake-less streams and the very long stream I-
6HW to I-6 were elevated in conductivity, Ca2þ, Mg2þ,
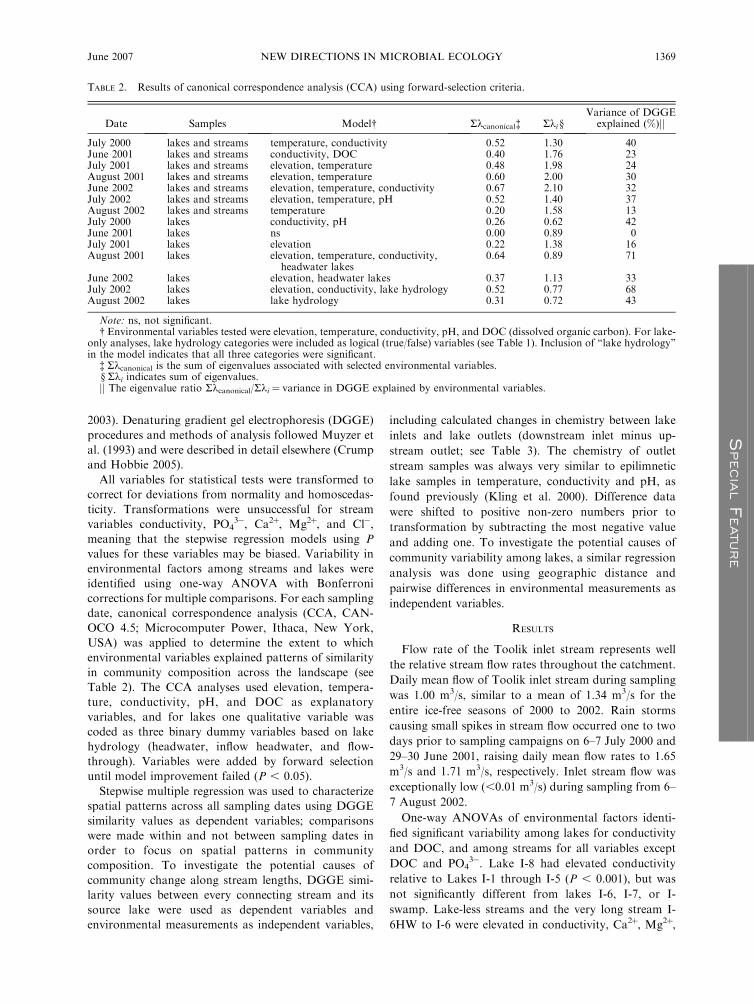
TABLE 2. Results of canonical correspondence analysis (CCA) using forward-selection criteria.
Date Samples Model� Rkcanonical� Rki §Variance of DGGE
explained (%)jj
July 2000 lakes and streams temperature, conductivity 0.52 1.30 40June 2001 lakes and streams conductivity, DOC 0.40 1.76 23July 2001 lakes and streams elevation, temperature 0.48 1.98 24August 2001 lakes and streams elevation, temperature 0.60 2.00 30June 2002 lakes and streams elevation, temperature, conductivity 0.67 2.10 32July 2002 lakes and streams elevation, temperature, pH 0.52 1.40 37August 2002 lakes and streams temperature 0.20 1.58 13July 2000 lakes conductivity, pH 0.26 0.62 42June 2001 lakes ns 0.00 0.89 0July 2001 lakes elevation 0.22 1.38 16August 2001 lakes elevation, temperature, conductivity,
headwater lakes0.64 0.89 71
June 2002 lakes elevation, headwater lakes 0.37 1.13 33July 2002 lakes elevation, conductivity, lake hydrology 0.52 0.77 68August 2002 lakes lake hydrology 0.31 0.72 43
Note: ns, not significant.� Environmental variables tested were elevation, temperature, conductivity, pH, and DOC (dissolved organic carbon). For lake-
only analyses, lake hydrology categories were included as logical (true/false) variables (see Table 1). Inclusion of ‘‘lake hydrology’’in the model indicates that all three categories were significant.
� Rkcanonical is the sum of eigenvalues associated with selected environmental variables.§ Rki indicates sum of eigenvalues.jj The eigenvalue ratio Rkcanonical/Rki ¼ variance in DGGE explained by environmental variables.
June 2007 1369NEW DIRECTIONS IN MICROBIAL ECOLOGY
SPECIALFEATURE
Naþ, and Si, and depleted in Kþ and Cl� relative to other
streams.
Hydraulic retention times of lake epilimnia were
variable, although most were longer than the entire
ice-free season (Table 1). Bacterial community doubling
time was much shorter than epilimnion water residence
times (Table 1), implying that under low or mean flow
conditions the advection of bacterial cells via inlet
streams and groundwater is minor compared to
autochthonous production of new cells. In contrast,
average water residence times in streams were shorter
than bacterial doubling times, especially during high
flow (Table 1), implying that streams act as conduits of
communities and not as reactors producing new
communities through growth of populations better-
adapted to local environmental conditions.
The number of DGGE bands averaged 35 for lakes
(range 21–55), 35 for connecting streams (15–58), and 30
for lake-less streams (11–52) with an overall average of
34. Similar numbers of bands were found in an earlier
study of Toolik Lake (Crump et al. 2003), and were also
found in a temperate river, an estuary, and the Gulf of
Maine (Crump et al. 2004); these comparisons are
conservative because they use the same DGGE tech-
nique, primers, PCR conditions, and band selection
criteria. In lakes, number of DGGE bands was
uncorrelated with environmental measures on individual
sampling dates except in July 2002 when band number
and conductivity were related (Spearman’s rank corre-
lation, P¼ 0.015). In streams, number of DGGE bands
correlated with temperature in July 2000 (P , 0.001)
and July 2002 (P ¼ 0.03). Across lakes and streams
together, number of DGGE bands correlated positively
with temperature (P , 0.02) in July 2000, August 2001,
and August 2002, and negatively with temperature in
July 2001. Band number also correlated negatively with
conductivity (P , 0.02) in August 2001 and 2002. These
relationships were driven by colder temperatures, higher
conductivity, and fewer DGGE bands (except July 2001
when there were more) in lake-less streams. Also,
pairwise differences in number of DGGE bands
calculated on each sampling date were unrelated to
pairwise DGGE similarity values or to pairwise differ-
ences in environmental factors.
Bacterial community composition varied across lakes
and streams during each sampling campaign. Lake
communities tended to be very similar to one another
(average similarity 0.73; i.e., 73% similar, Fig. 2A).
Communities in connecting streams, sampled at lake
inlets, were similar to communities in lakes (average
similarity 0.67 for all pairwise comparisons). In contrast,
lake-less stream communities were almost always very
different than lake communities (average similarity 0.30
for all pairwise comparisons). Similarity values among
lake-less stream communities were low except between
the hydraulically connected I-8 headwaters and I-8 inlet
(same stream, two different sampling points had average
similarity of 0.66, n ¼ 4). MDS ordinations of DGGE
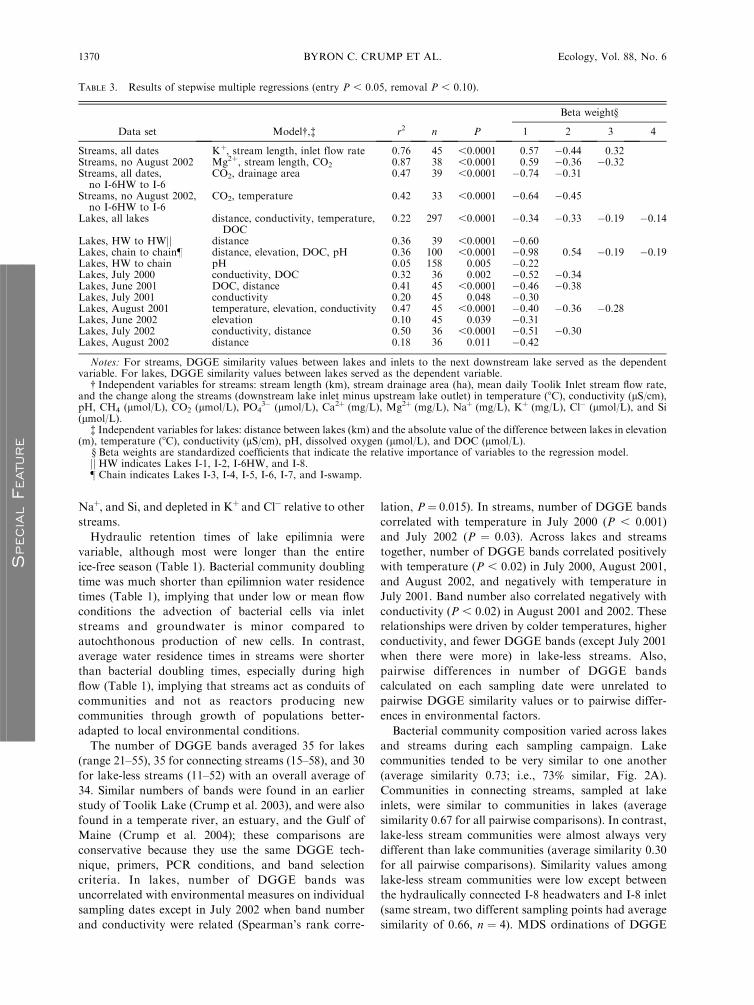
TABLE 3. Results of stepwise multiple regressions (entry P , 0.05, removal P , 0.10).
Data set Model�,� r2 n P
Beta weight§
1 2 3 4
Streams, all dates Kþ, stream length, inlet flow rate 0.76 45 ,0.0001 0.57 �0.44 0.32Streams, no August 2002 Mg2þ, stream length, CO2 0.87 38 ,0.0001 0.59 �0.36 �0.32Streams, all dates,no I-6HW to I-6
CO2, drainage area 0.47 39 ,0.0001 �0.74 �0.31
Streams, no August 2002,no I-6HW to I-6
CO2, temperature 0.42 33 ,0.0001 �0.64 �0.45
Lakes, all lakes distance, conductivity, temperature,DOC
0.22 297 ,0.0001 �0.34 �0.33 �0.19 �0.14
Lakes, HW to HWjj distance 0.36 39 ,0.0001 �0.60Lakes, chain to chain} distance, elevation, DOC, pH 0.36 100 ,0.0001 �0.98 0.54 �0.19 �0.19Lakes, HW to chain pH 0.05 158 0.005 �0.22Lakes, July 2000 conductivity, DOC 0.32 36 0.002 �0.52 �0.34Lakes, June 2001 DOC, distance 0.41 45 ,0.0001 �0.46 �0.38Lakes, July 2001 conductivity 0.20 45 0.048 �0.30Lakes, August 2001 temperature, elevation, conductivity 0.47 45 ,0.0001 �0.40 �0.36 �0.28Lakes, June 2002 elevation 0.10 45 0.039 �0.31Lakes, July 2002 conductivity, distance 0.50 36 ,0.0001 �0.51 �0.30Lakes, August 2002 distance 0.18 36 0.011 �0.42
Notes: For streams, DGGE similarity values between lakes and inlets to the next downstream lake served as the dependentvariable. For lakes, DGGE similarity values between lakes served as the dependent variable.
� Independent variables for streams: stream length (km), stream drainage area (ha), mean daily Toolik Inlet stream flow rate,and the change along the streams (downstream lake inlet minus upstream lake outlet) in temperature (8C), conductivity (lS/cm),pH, CH4 (lmol/L), CO2 (lmol/L), PO4
3� (lmol/L), Ca2þ (mg/L), Mg2þ (mg/L), Naþ (mg/L), Kþ (mg/L), Cl� (lmol/L), and Si(lmol/L).
� Independent variables for lakes: distance between lakes (km) and the absolute value of the difference between lakes in elevation(m), temperature (8C), conductivity (lS/cm), pH, dissolved oxygen (lmol/L), and DOC (lmol/L).
§ Beta weights are standardized coefficients that indicate the relative importance of variables to the regression model.jj HW indicates Lakes I-1, I-2, I-6HW, and I-8.} Chain indicates Lakes I-3, I-4, I-5, I-6, I-7, and I-swamp.
BYRON C. CRUMP ET AL.1370 Ecology, Vol. 88, No. 6
SPECIALFEATURE
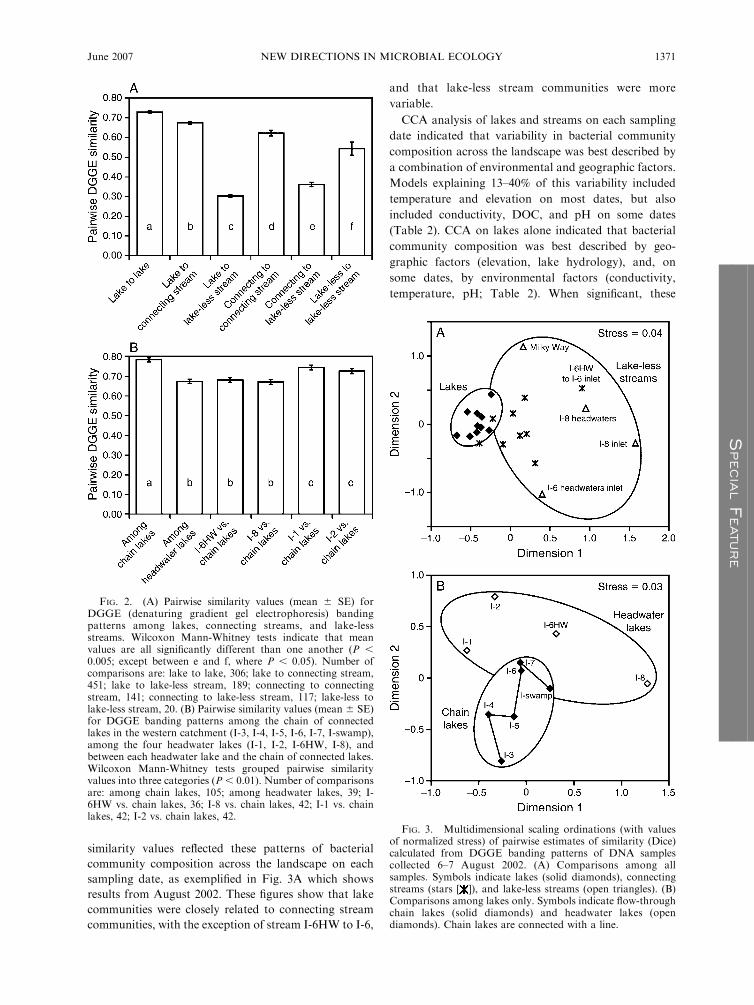
similarity values reflected these patterns of bacterial
community composition across the landscape on each
sampling date, as exemplified in Fig. 3A which shows
results from August 2002. These figures show that lake
communities were closely related to connecting stream
communities, with the exception of stream I-6HW to I-6,
and that lake-less stream communities were more
variable.
CCA analysis of lakes and streams on each sampling
date indicated that variability in bacterial community
composition across the landscape was best described by
a combination of environmental and geographic factors.
Models explaining 13–40% of this variability included
temperature and elevation on most dates, but also
included conductivity, DOC, and pH on some dates
(Table 2). CCA on lakes alone indicated that bacterial
community composition was best described by geo-
graphic factors (elevation, lake hydrology), and, on
some dates, by environmental factors (conductivity,
temperature, pH; Table 2). When significant, these
FIG. 2. (A) Pairwise similarity values (mean 6 SE) forDGGE (denaturing gradient gel electrophoresis) bandingpatterns among lakes, connecting streams, and lake-lessstreams. Wilcoxon Mann-Whitney tests indicate that meanvalues are all significantly different than one another (P ,0.005; except between e and f, where P , 0.05). Number ofcomparisons are: lake to lake, 306; lake to connecting stream,451; lake to lake-less stream, 189; connecting to connectingstream, 141; connecting to lake-less stream, 117; lake-less tolake-less stream, 20. (B) Pairwise similarity values (mean 6 SE)for DGGE banding patterns among the chain of connectedlakes in the western catchment (I-3, I-4, I-5, I-6, I-7, I-swamp),among the four headwater lakes (I-1, I-2, I-6HW, I-8), andbetween each headwater lake and the chain of connected lakes.Wilcoxon Mann-Whitney tests grouped pairwise similarityvalues into three categories (P , 0.01). Number of comparisonsare: among chain lakes, 105; among headwater lakes, 39; I-6HW vs. chain lakes, 36; I-8 vs. chain lakes, 42; I-1 vs. chainlakes, 42; I-2 vs. chain lakes, 42.
FIG. 3. Multidimensional scaling ordinations (with valuesof normalized stress) of pairwise estimates of similarity (Dice)calculated from DGGE banding patterns of DNA samplescollected 6–7 August 2002. (A) Comparisons among allsamples. Symbols indicate lakes (solid diamonds), connectingstreams (stars [ ]), and lake-less streams (open triangles). (B)Comparisons among lakes only. Symbols indicate flow-throughchain lakes (solid diamonds) and headwater lakes (opendiamonds). Chain lakes are connected with a line.
June 2007 1371NEW DIRECTIONS IN MICROBIAL ECOLOGY
SPECIALFEATURE
models explained 16–68% of variability in bacterial
community composition among lakes.
Connecting streams often contained bacterial com-
munities that were very similar to those in their source
lake, but the degree of similarity varied with stream and
with sampling date. When all connecting streams were
analyzed, variability in the degree of bacterial commu-
nity change was well described by changes in Kþ
concentration (from lake outlet down the stream reach),
stream length (measured from the nearest upstream
lake), and flow rate (Table 3). According to this model,
bacterial communities changed more in longer streams
in which Kþ decreased, and also changed more on days
that the streams were flowing slowly (Table 3). Omitting
the results from August 2002, when stream flow was
extremely low, improved the model slightly, and the
important factors in the model changed. We found,
however, that these relationships were strongly driven
by changes in the very long stream I-6HW to I-6. When
this stream was removed from the analysis, changes in
bacterial community composition were best described by
variability in CO2, drainage area, and temperature. In
these models, communities changed more in streams
that experienced large increases in CO2 along the reach.
These results are consistent with the fact that streams
leaving lakes lose their ‘‘lake-like’’ characteristics as a
function of downstream distance (e.g., Kling et al. 2000).
Overall, these correlations of communities and environ-
mental factors in streams indicate that inputs of bacteria
from land may be important.
MDS ordinations of lakes only, exemplified in Fig. 3B
for August 2002, suggested that lakes in the central
chain (I-3 to I-swamp) shared a similar bacterial
community that was different than those in unconnected
Lake I-8, distantly connected Lake I-6HW, and in some
cases headwater Lakes I-1 and I-2. We tested the
significance of this by comparing pairwise similarity
values among the chain of connected lakes (I-3 through
I-swamp) with pairwise similarity values between the
chain lakes and Lakes I-6HW, I-8, I-1 and I-2. Similarity
among chain lakes (0.78) was significantly higher than
between chain lakes and these other lakes (average of
0.67 for I-6HW and I-8, and 0.73 for I-1 and I-2),
suggesting that closely connected lakes share similar
bacterioplankton communities (Fig. 2B).
Environmental variables only weakly described vari-
ability in community composition among all lake-to-
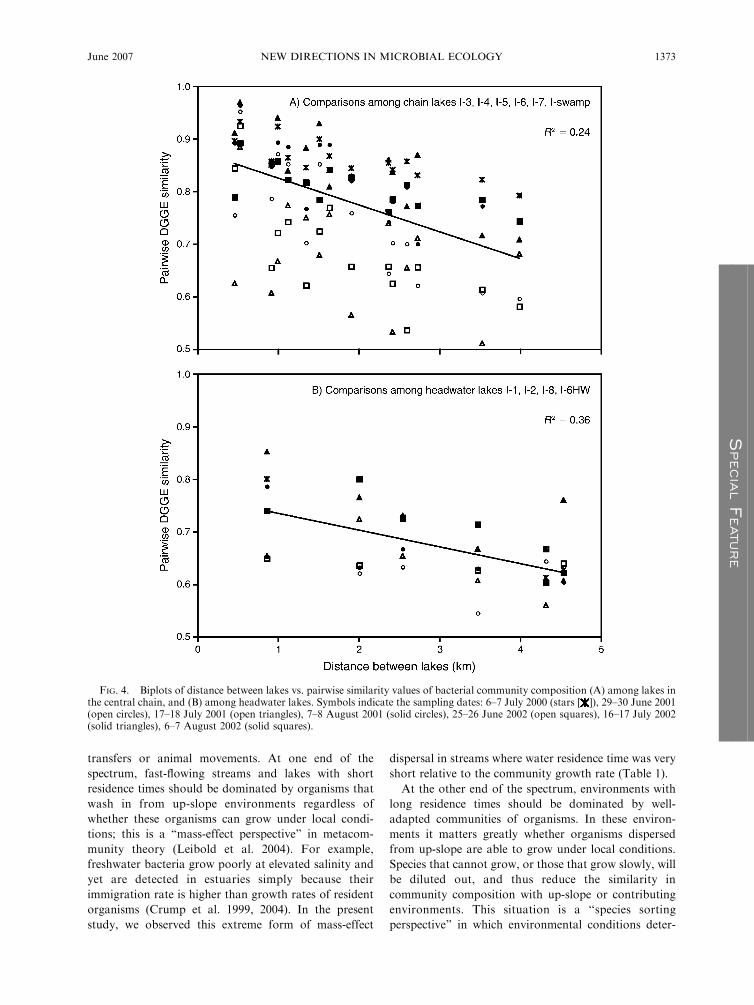
lake comparisons (Table 3). However, when headwater
lakes (I-1, I-2, I-6HW and I-8) and chain lakes (I-3, I-4,
I-5, I-6, I-7, I-swamp) were considered separately, the
geographic distance between the lakes explained a
significant fraction of the variability in DGGE similarity
values such that more distant lakes contained less similar
communities (Fig. 4). Similarly, when sampling cam-
paigns were analyzed individually, environmental vari-
ables only weakly described variability in lake-to-lake
community similarity (Table 3). Distances between lakes
or differences in elevation improved the regression
models and were significant factors for five of seven
sampling dates.
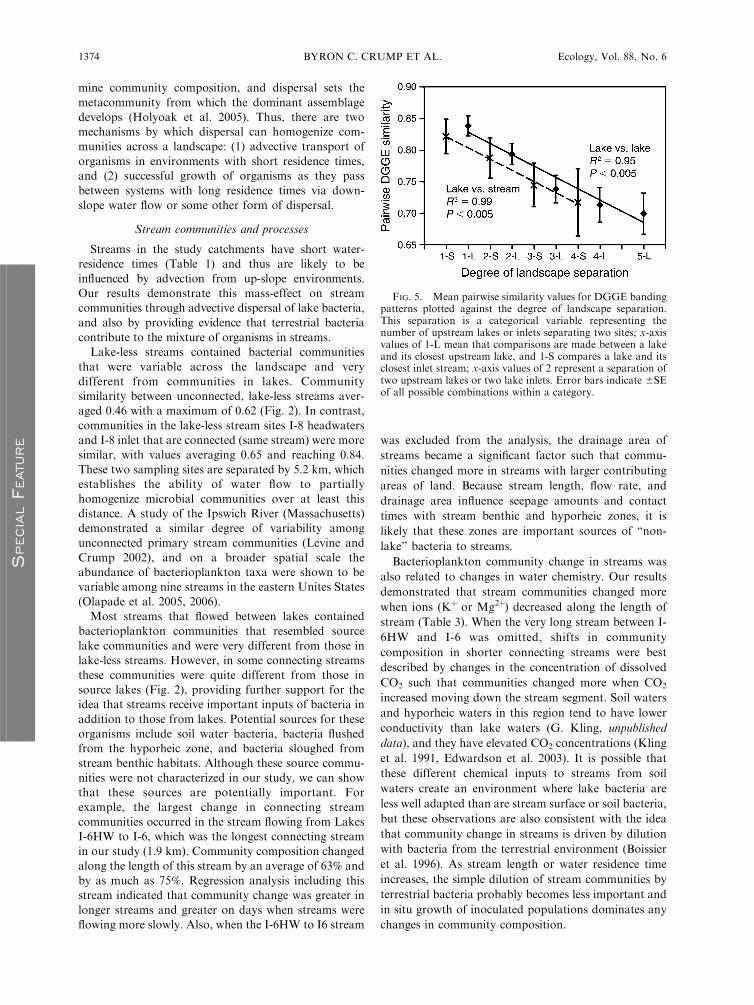
Patterns of relatedness among the connected chain of
lakes and streams were investigated by averaging
pairwise DGGE similarity values between lakes and
up-slope environments. Each lake in the chain was
compared to the first upstream lake, then to the second
upstream lake, and so forth regardless of the starting
position of the lake within the chain (Fig. 5). In
addition, each lake was compared to its inlet stream
(first upstream inlet), to the second inlet stream above
the lake, and so forth. This analysis shows a trend of
decreasing relatedness among lakes that are more
distant in the chain, and a similar pattern among lakes
and up-slope streams.
DISCUSSION
It is clear from our results and other recent studies
that microbial communities show non-random patterns
in beta diversity (increasing spatial heterogeneity of
diversity), and thus have biogeography (Papke et al.
2003, Whitaker et al. 2003, Horner-Devine et al. 2004).
For aquatic bacteria, one study identified a relationship
between distance and diversity patterns (Reche et al.
2005), one suggested the potential importance of
dispersal via water flow within catchments (Lindstrom
and Bergstrom 2005), one found no relationship
between diversity and distance or dispersal (Konopka
et al. 1999), and another found that both distance and
environment were correlated with observed patterns of
diversity (Yannarell and Triplett 2005). Despite this
range of findings on the importance of environment or
geographic separation, few if any studies have identified
or tested the specific mechanisms leading to these
patterns. Here, we discuss these mechanisms, and show
that environmental characteristics and inoculation by
dispersal are important in determining lake communi-
ties, and that ‘‘mass effects’’ through advection are
important in stream communities.
A recent review of microbial biogeography (Martiny et
al. 2006) compares the potential effects of dispersal and
other ‘‘historical’’ controls with the influence of ‘‘con-
temporary environmental variation,’’ and concludes that
at smaller scales dispersal forces may be so far-reaching
as to exclude biogeographic provinces. However, it
remains a challenge to determine whether dispersal
affects the composition of bacterial communities over
and above the influence of environmental conditions.
This is because accounting for all potentially important
environmental factors is difficult, but also because many
environmental factors co-vary with dispersal. For
example, when rainstorms increase the rate of dispersal
of microbes from riparian soil waters into a stream, they
also alter stream chemistry by flushing organic materials
from soils. In addition, the degree to which different
environments and their microbial communities interact
depends on geography and downslope water flow, and
may also depend on other mechanisms such as aerosol
BYRON C. CRUMP ET AL.1372 Ecology, Vol. 88, No. 6
SPECIALFEATURE
transfers or animal movements. At one end of the
spectrum, fast-flowing streams and lakes with short
residence times should be dominated by organisms that
wash in from up-slope environments regardless of
whether these organisms can grow under local condi-
tions; this is a ‘‘mass-effect perspective’’ in metacom-
munity theory (Leibold et al. 2004). For example,
freshwater bacteria grow poorly at elevated salinity and
yet are detected in estuaries simply because their
immigration rate is higher than growth rates of resident
organisms (Crump et al. 1999, 2004). In the present
study, we observed this extreme form of mass-effect
dispersal in streams where water residence time was very
short relative to the community growth rate (Table 1).
At the other end of the spectrum, environments with
long residence times should be dominated by well-
adapted communities of organisms. In these environ-
ments it matters greatly whether organisms dispersed
from up-slope are able to grow under local conditions.
Species that cannot grow, or those that grow slowly, will
be diluted out, and thus reduce the similarity in
community composition with up-slope or contributing
environments. This situation is a ‘‘species sorting
perspective’’ in which environmental conditions deter-
FIG. 4. Biplots of distance between lakes vs. pairwise similarity values of bacterial community composition (A) among lakes inthe central chain, and (B) among headwater lakes. Symbols indicate the sampling dates: 6–7 July 2000 (stars [ ]), 29–30 June 2001(open circles), 17–18 July 2001 (open triangles), 7–8 August 2001 (solid circles), 25–26 June 2002 (open squares), 16–17 July 2002(solid triangles), 6–7 August 2002 (solid squares).
June 2007 1373NEW DIRECTIONS IN MICROBIAL ECOLOGY
SPECIALFEATURE
mine community composition, and dispersal sets the
metacommunity from which the dominant assemblage
develops (Holyoak et al. 2005). Thus, there are two
mechanisms by which dispersal can homogenize com-
munities across a landscape: (1) advective transport of
organisms in environments with short residence times,
and (2) successful growth of organisms as they pass
between systems with long residence times via down-
slope water flow or some other form of dispersal.
Stream communities and processes
Streams in the study catchments have short water-
residence times (Table 1) and thus are likely to be
influenced by advection from up-slope environments.
Our results demonstrate this mass-effect on stream
communities through advective dispersal of lake bacteria,
and also by providing evidence that terrestrial bacteria
contribute to the mixture of organisms in streams.
Lake-less streams contained bacterial communities
that were variable across the landscape and very
different from communities in lakes. Community
similarity between unconnected, lake-less streams aver-
aged 0.46 with a maximum of 0.62 (Fig. 2). In contrast,
communities in the lake-less stream sites I-8 headwaters
and I-8 inlet that are connected (same stream) were more
similar, with values averaging 0.65 and reaching 0.84.
These two sampling sites are separated by 5.2 km, which
establishes the ability of water flow to partially
homogenize microbial communities over at least this
distance. A study of the Ipswich River (Massachusetts)
demonstrated a similar degree of variability among
unconnected primary stream communities (Levine and
Crump 2002), and on a broader spatial scale the
abundance of bacterioplankton taxa were shown to be
variable among nine streams in the eastern Unites States
(Olapade et al. 2005, 2006).
Most streams that flowed between lakes contained
bacterioplankton communities that resembled source
lake communities and were very different from those in
lake-less streams. However, in some connecting streams
these communities were quite different from those in
source lakes (Fig. 2), providing further support for the
idea that streams receive important inputs of bacteria in
addition to those from lakes. Potential sources for these
organisms include soil water bacteria, bacteria flushed
from the hyporheic zone, and bacteria sloughed from
stream benthic habitats. Although these source commu-
nities were not characterized in our study, we can show
that these sources are potentially important. For
example, the largest change in connecting stream
communities occurred in the stream flowing from Lakes
I-6HW to I-6, which was the longest connecting stream
in our study (1.9 km). Community composition changed
along the length of this stream by an average of 63% and
by as much as 75%. Regression analysis including this
stream indicated that community change was greater in
longer streams and greater on days when streams were
flowing more slowly. Also, when the I-6HW to I6 stream
was excluded from the analysis, the drainage area of
streams became a significant factor such that commu-
nities changed more in streams with larger contributing
areas of land. Because stream length, flow rate, and
drainage area influence seepage amounts and contact
times with stream benthic and hyporheic zones, it is
likely that these zones are important sources of ‘‘non-
lake’’ bacteria to streams.
Bacterioplankton community change in streams was
also related to changes in water chemistry. Our results
demonstrated that stream communities changed more
when ions (Kþ or Mg2þ) decreased along the length of
stream (Table 3). When the very long stream between I-
6HW and I-6 was omitted, shifts in community
composition in shorter connecting streams were best
described by changes in the concentration of dissolved
CO2 such that communities changed more when CO2
increased moving down the stream segment. Soil waters
and hyporheic waters in this region tend to have lower
conductivity than lake waters (G. Kling, unpublished
data), and they have elevated CO2 concentrations (Kling
et al. 1991, Edwardson et al. 2003). It is possible that
these different chemical inputs to streams from soil
waters create an environment where lake bacteria are
less well adapted than are stream surface or soil bacteria,
but these observations are also consistent with the idea
that community change in streams is driven by dilution
with bacteria from the terrestrial environment (Boissier
et al. 1996). As stream length or water residence time
increases, the simple dilution of stream communities by
terrestrial bacteria probably becomes less important and
in situ growth of inoculated populations dominates any
changes in community composition.
FIG. 5. Mean pairwise similarity values for DGGE bandingpatterns plotted against the degree of landscape separation.This separation is a categorical variable representing thenumber of upstream lakes or inlets separating two sites; x-axisvalues of 1-L mean that comparisons are made between a lakeand its closest upstream lake, and 1-S compares a lake and itsclosest inlet stream; x-axis values of 2 represent a separation oftwo upstream lakes or two lake inlets. Error bars indicate 6SEof all possible combinations within a category.
BYRON C. CRUMP ET AL.1374 Ecology, Vol. 88, No. 6
SPECIALFEATURE
Lake communities and processes
Lake bacterioplankton communities were much more
similar across the landscape than stream communities
(Fig. 2A), although several spatial patterns occurred
repeatedly: (1) the hydraulically connected chain of lakes
shared similar bacterioplankton communities (Fig. 2B);
(2) the communities in these connected lakes shifted
gradually and became less similar in lakes farther down
catchment (Fig. 5); and (3) the unconnected Lake I-8
and the distantly connected Lake I-6HW contained
communities more dissimilar to the connected lakes
(Fig. 2B).
Epilimnetic residence times were much longer than
bacterial community doubling times, indicating that
unlike the situation in streams, bacteria advected from
upstream sources constituted an insignificant fraction of
the total number of cells in the lakes. In addition,
epilimnion residence time was poorly related to the
variation in community composition among lakes, and
to the degree of similarity in communities between lakes
and their inlet stream (data not shown). Long residence
times and small stream inputs of cells mean that
advected populations would have to grow greatly to be
detected by DGGE. Such growth of allochthonous
populations is likely in connected lakes because the
streams carry many bacteria from the next upstream
lake, and because the environmental conditions are
similar among lakes. These effects of dispersal appear to
be limited in their spatial extent, however, because
despite long residence times the lake bacterial commu-
nities were most similar to communities in nearby lakes
and particularly in nearby lakes connected by streams.
Although a long lake-water residence time (low
stream water inputs) argues for lack of dispersal mass
effects, there is a gradient of dispersal ranging from the
advection of massive numbers of cells to the inoculation
of small numbers of cells that may in turn grow to be
important members of the community. For example,
systems with shorter water residence times and compa-
rable bacterial doubling times to ours often contain
advected bacteria (Crump et al. 1999, 2004, Troussellier
et al. 2002). And our study of connecting streams
demonstrates that lake bacteria can be advected over
large distances relative to the size of the lake. However,
one study (Lindstrom and Bergstrom 2004) showed that
PLATE 1. Toolik Field Station on the south bank of Toolik Lake, Alaska, USA. View looking south across the Toolik Lakecatchment toward the Brooks Mountain Range. Photo credit: �Institute of Arctic Biology; photo by Richard Flanders, used bypermission.
June 2007 1375NEW DIRECTIONS IN MICROBIAL ECOLOGY
SPECIALFEATURE
a bacterioplankton community in a lake with a four
month epilimnetic residence time resembled the com-
munity in its inlet stream. They estimated that the inlet
stream supplied 0.03–0.4% of the bacterial cells in the
epilimnion. The fact that this level is at or below the
detection limit for PCR-based community fingerprinting
methods argues against a strong mass-effect influence
and for a weaker inoculation effect where some of the
advected populations must grow to detectable size.
These authors also studied a second lake with a 10-year
residence time and found much lower similarity between
inlet stream and lake communities. Thus, this lake falls
even further down the gradient of mass effects, away
from where advected cells dominate in number and
toward weak inoculation where growth of introduced
populations determines the similarity between adjoining
landscape patches or habitats.
We observed patterns in environmental variation that
were correlated with spatial patterns in bacterioplankton
community composition. The clearest pattern of envi-
ronmental variation was in conductivity, with lowest
values in the upper chain lakes (including I-1 and I-2),
higher values in the lower chain lakes, and maximum
values in I-8 and I-6HW (pattern also found by Kling et
al. [2000]). Community composition shifted together
with conductivity moving downslope in the chain of
lakes, and both were significantly different than those in
Lakes I-8 and I-6HW. For individual sampling dates,
conductivity contributed significantly to CCA and
multiple regression models for samples from July 2000
and 2002, and August 2001 (Tables 2 and 3). Across all
sampling dates, conductivity and other environmental
variables were significant in regression models, but only
when I-8 and I-6HW were included in the analyses
(Table 3). These results suggest that conductivity or
some co-varying environmental factor influences the
composition of lake bacterioplankton communities.
The roles of dispersal and environment can be better
understood by studying the patterns of community
change across space. For example, environmental
conditions were often subordinate to geographic dis-
tance or difference in elevation in predicting variability
in bacterial community composition (Tables 2 and 3). In
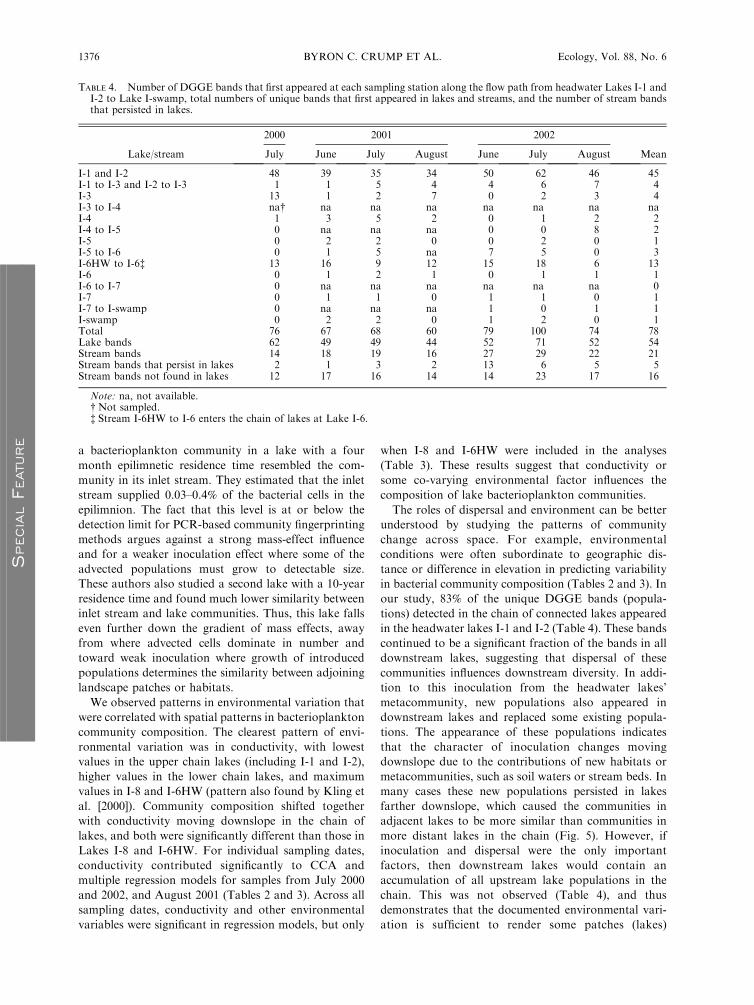
our study, 83% of the unique DGGE bands (popula-
tions) detected in the chain of connected lakes appeared
in the headwater lakes I-1 and I-2 (Table 4). These bands
continued to be a significant fraction of the bands in all
downstream lakes, suggesting that dispersal of these
communities influences downstream diversity. In addi-
tion to this inoculation from the headwater lakes’
metacommunity, new populations also appeared in
downstream lakes and replaced some existing popula-
tions. The appearance of these populations indicates
that the character of inoculation changes moving
downslope due to the contributions of new habitats or
metacommunities, such as soil waters or stream beds. In
many cases these new populations persisted in lakes
farther downslope, which caused the communities in
adjacent lakes to be more similar than communities in
more distant lakes in the chain (Fig. 5). However, if
inoculation and dispersal were the only important
factors, then downstream lakes would contain an
accumulation of all upstream lake populations in the
chain. This was not observed (Table 4), and thus
demonstrates that the documented environmental vari-
ation is sufficient to render some patches (lakes)
TABLE 4. Number of DGGE bands that first appeared at each sampling station along the flow path from headwater Lakes I-1 andI-2 to Lake I-swamp, total numbers of unique bands that first appeared in lakes and streams, and the number of stream bandsthat persisted in lakes.
Lake/stream
2000 2001 2002
MeanJuly June July August June July August
I-1 and I-2 48 39 35 34 50 62 46 45I-1 to I-3 and I-2 to I-3 1 1 5 4 4 6 7 4I-3 13 1 2 7 0 2 3 4I-3 to I-4 na� na na na na na na naI-4 1 3 5 2 0 1 2 2I-4 to I-5 0 na na na 0 0 8 2I-5 0 2 2 0 0 2 0 1I-5 to I-6 0 1 5 na 7 5 0 3I-6HW to I-6� 13 16 9 12 15 18 6 13I-6 0 1 2 1 0 1 1 1I-6 to I-7 0 na na na na na na 0I-7 0 1 1 0 1 1 0 1I-7 to I-swamp 0 na na na 1 0 1 1I-swamp 0 2 2 0 1 2 0 1Total 76 67 68 60 79 100 74 78Lake bands 62 49 49 44 52 71 52 54Stream bands 14 18 19 16 27 29 22 21Stream bands that persist in lakes 2 1 3 2 13 6 5 5Stream bands not found in lakes 12 17 16 14 14 23 17 16
Note: na, not available.� Not sampled.� Stream I-6HW to I-6 enters the chain of lakes at Lake I-6.
BYRON C. CRUMP ET AL.1376 Ecology, Vol. 88, No. 6
SPECIALFEATURE
unsuitable for certain populations. Our data suggest that
even over restricted spatial scales (,10 km) variable
inoculation and dispersal play a role in establishing the
metacommunities from which lake bacterial communi-
ties develop, while contemporary environmental condi-
tions, including those predicted by metrics of landscape
position, further control the composition of communi-
ties in our lakes.
Lake–stream interactions
It is clear that lakes and streams host different
microbial communities, and that these two environment
types and their microflora interact across the landscape.
On average, more than a quarter of the total DGGE
bands first appeared in connecting streams, suggesting
that they originated from the stream bottom or from soil
or hyporheic water (Table 4). We also found that a
substantial fraction of these stream populations persist-
ed in lakes; on average 10 new populations appeared in
lakes below I-1 and I-2, and of those persistent
populations 5 of them (50%) came from streams (Table
4). The sources of the remaining new populations in
lakes are unknown, but may include seepage flow and
transfers from the littoral zone or upward mixing from
deep-water communities in lakes with persistent hypo-
limnia. The persistence of stream populations in lakes,
despite long hydraulic residence times, indicates that
terrestrial inputs influence lake bacterial communities
not only by modifying the chemical conditions of lakes,
but also by introducing organisms that thrive under
those conditions. These and other potential interactions
between lakes, streams, and other aquatic environments
indicate that understanding the mechanisms controlling
microbial biogeography requires knowledge of the
linkages among environments on heterogeneous land-
scapes.
ACKNOWLEDGMENTS
We thank A. Balser and L. Rogan for map preparation andgeographic information, and A. Anstead, M. Bahr, L. Barske,N. Bettez, M. Booth, M. Brahce, C. Crockett, M. Evans, A.Field, A. Floyd, C. Johnson, K. Judd, K. Keller, K. Lavigne, K.Riseng, D. Scanlon, and C. Wallace for assistance in the fieldand lab. This research was supported in part by the Universityof Michigan and University of Maryland, and by NationalScience Foundation grants OPP-0408371, OPP-9911681, OPP-9911278, DEB-0423385, DEB-9810222, and ATM-0423385.
LITERATURE CITED
Baas-Becking, L. G. M. 1934. Geobiologie of Inleiding Tot deMilieukunde. Van Stockum and Zoon, The Hague, TheNetherlands.
Bergstrom, A. K., and M. Jansson. 2000. Bacterioplanktonproduction in humic Lake Ortrasket in relation to input ofbacterial cells and input of allochthonous organic carbon.Microbial Ecology 39:101–115.
Boissier, J. M., P. Marmonier, C. Claret, D. Fontvieille, and P.Blanc. 1996. Comparison of solutes, nutrients, and bacteriainputs from two types of groundwater to the Rhone riverduring an artificial drought. Hydrobiologia 319:65–72.
Crump, B. C., E. V. Armbrust, and J. A. Baross. 1999.Phylogenetic analysis of particle-attached and free-living
bacterial communities in the Columbia River, its estuary, andthe adjacent coastal ocean. Applied and EnvironmentalMicrobiology 65:3192–3204.
Crump, B. C., and J. E. Hobbie. 2005. Synchrony andseasonality of bacterioplankton communities in two temper-ate rivers. Limnology and Oceanography 50:1718–1729.
Crump, B. C., C. S. Hopkinson, M. L. Sogin, and J. E. Hobbie.2004. Microbial biogeography along an estuarine salinitygradient: combined influences of bacterial growth andresidence time. Applied and Environmental Microbiology70:1494–1505.
Crump, B. C., G. W. Kling, M. Bahr, and J. E. Hobbie. 2003.Bacterioplankton community shifts in an arctic lake correlatewith seasonal changes in organic matter source. Applied andEnvironmental Microbiology 69:2253–2268.
Curtis, T. P., and W. T. Sloan. 2004. Prokaryotic diversity andits limits: microbial community structure in nature andimplications for microbial ecology. Current Opinion inMicrobiology 7:221–226.
Dolan, J. R. 2005. An introduction to the biogeography ofaquatic microbes. Aquatic Microbial Ecology 41:39–48.
Edwardson, K. J., W. B. Bowden, C. Dahm, and J. Morrice.2003. The hydraulic characteristics and geochemistry ofhyporheic and parafluvial zones in Arctic tundra streams,north slope, Alaska. Advances in Water Resources 26:907–923.
Fenchel, T. 2003. Biogeography for bacteria. Science 301:925–926.
Findlay, S. E. G., R. L. Sinsabaugh, W. V. Sobczak, and M.Hoostal. 2003. Metabolic and structural response of hypo-rheic microbial communities to variations in supply ofdissolved organic matter. Limnology and Oceanography 48:1608–1617.
Finlay, B. J. 2002. Global dispersal of free-living microbialeukaryote species. Science 296:1061–1063.
Hanski, I., and M. Gilpin. 1991. Metapopulation dynamics—brief history and conceptual domain. Biological Journal ofthe Linnaean Society 42:3–16.
Hobbie, J. E., T. L. Corliss, and B. J. Peterson. 1983. Seasonalpatterns of bacterial abundance in an arctic lake. Arctic andAlpine Research 15:253–259.
Hollibaugh, J. T., N. Bano, and H. W. Ducklow. 2002.Widespread distribution in polar oceans of a 16S rRNA genesequence with affinity to Nitrosospira-like ammonia-oxidiz-ing bacteria. Applied and Environmental Microbiology 68:1478–1484.
Holyoak, M., M. A. Leibold, and R. D. Holt. 2005.Metacommunities. University of Chicago Press, Chicago,Illinois, USA.
Horner-Devine, M. C., M. Lage, J. B. Hughes, and B. J. M.Bohannan. 2004. A taxa-area relationship for bacteria.Nature 432:750–753.
Judd, K. E. 2004. Dissolved organic matter dynamics in anarctic tundra catchment: linking DOM chemistry, bioavail-ability, and microbial community composition. Dissertation.University of Michigan, Ann Arbor, Michigan, USA.
Judd, K. E., B. C. Crump, and G. W. Kling. 2006. Variation indissolved organic matter controls bacterial production andcommunity composition. Ecology 87:2068–2079.
Kirchman, D. L. 1993. Leucine incorporation as a measure ofbiomass production by heterotrophic bacteria. Pages 509–512in P. F. Kemp, B. F. Sherr, E. B. Sherr, and J. J. Cole,editors. Handbook of methods in aquatic microbial ecology.Lewis Publishers, Boca Raton, Florida, USA.
Kirchman, D. L. 2002. Calculating microbial growth rates fromdata on production and standing stocks. Marine Ecology-Progress Series 233:303–306.
Kling, G. W., G. W. Kipphut, and M. C. Miller. 1991. Arcticlakes and streams as gas conduits to the atmosphere:implications for tundra carbon budgets. Science 251:298–301.
June 2007 1377NEW DIRECTIONS IN MICROBIAL ECOLOGY
SPECIALFEATURE
Kling, G. W., G. W. Kipphut, M. C. Miller, and W. J. O’Brien.2000. Integration of lakes and streams in a landscapeperspective: the importance of material processing on spatialpatterns and temporal coherence. Freshwater Biology 43:477–497.
Konopka, A., T. Bercot, and C. Nakatsu. 1999. Bacterioplank-ton community diversity in a series of thermally stratifiedlakes. Microbial Ecology 38:126–135.
Lee, S., and J. A. Fuhrman. 1987. Relationships betweenbiovolume and biomass of naturally derived marine bacte-rioplankton. Applied and Environmental Microbiology 53:1298–1303.
Leibold, M. A., M. Holyoak, N. Mouquet, P. Amarasekare,J. M. Chase, M. F. Hoopes, R. D. Holt, J. B. Shurin, R. Law,D. Tilman, M. Loreau, and A. Gonzalez. 2004. Themetacommunity concept: a framework for multi-scalecommunity ecology. Ecology Letters 7:601–613.
Levine, U. Y., and B. C. Crump. 2002. Bacterioplanktoncommunity composition in flowing waters of the IpswichRiver watershed. Biological Bulletin 203:251–252.
Levins, R. 1969. Effect of random variations of different typeson population growth. Proceedings of the National Academyof Sciences (USA) 62:1061–1065.
Lindstrom, E. S., and A. K. Bergstrom. 2004. Influence of inletbacteria on bacterioplankton assemblage composition inlakes of different hydraulic retention time. Limnology andOceanography 49:125–136.
Lindstrom, E. S., and A. K. Bergstrom. 2005. Communitycomposition of bacterioplankton and cell transport in lakesin two different drainage areas. Aquatic Sciences 67:210–219.
Lindstrom, E. S., M. P. Kamst-Van Agterveld, and G. Zwart.2005. Distribution of typical freshwater bacterial groups isassociated with pH, temperature, and lake water retentiontime. Applied and Environmental Microbiology 71:8201–8206.
Magnuson, J. J., B. J. Benson, and T. K. Kratz. 1990. Temporalcoherence in the limnology of a suite of lakes in Wisconsin,USA. Freshwater Biology 23:145–159.
Martiny, J. B. H., et al. 2006. Microbial biogeography: puttingmicroorganisms on the map. Nature Reviews Microbiology4:102–112.
Muylaert, K., K. Van der Gucht, N. Vloemans, L. De Meester,M. Gillis, and W. Vyverman. 2002. Relationship betweenbacterial community composition and bottom-up versus top-down variables in four eutrophic shallow lakes. Applied andEnvironmental Microbiology 68:4740–4750.
Muyzer, G., E. C. Dewaal, and A. G. Uitterlinden. 1993.Profiling of complex microbial populations by denaturing
gradient gel-electrophoresis analysis of polymerase chainreaction-amplified genes coding for 16s ribosomal-RNA.Applied and Environmental Microbiology 59:695–700.
Olapade, O. A., A. Brothers, M. Crissman, X. Q. Gao, andL. G. Leff. 2006. Comparison of planktonic microbialcommunities among nine North American streams. ArchivFur Hydrobiologie 165:221–239.
Olapade, O. A., X. Gao, and L. G. Leff. 2005. Abundance ofthree bacterial populations in selected streams. MicrobialEcology 49:461–467.
Papke, R. T., N. B. Ramsing, M. M. Bateson, and D. M. Ward.2003. Geographical isolation in hot spring cyanobacteria.Environmental Microbiology 5:650–659.
Reche, I., E. Pulido-Villena, R. Morales-Baquero, and E. O.Casamayor. 2005. Does ecosystem size determine aquaticbacterial richness? Ecology 86:1715–1722.
Riera, J. L., J. J. Magnuson, T. K. Kratz, and K. E. Webster.2000. A geomorphic template for the analysis of lake districtsapplied to the Northern Highland Lake District, Wisconsin,USA. Freshwater Biology 43:301–318.
Simek, K., J. Nedoma, J. Pernthaler, T. Posch, and J. R. Dolan.2002. Altering the balance between bacterial production andprotistan bacterivory triggers shifts in freshwater bacterialcommunity composition. Antonie Van Leeuwenhoek Inter-national Journal of General and Molecular Microbiology 81:453–463.
Soranno, P. A., K. E. Webster, J. L. Riera, T. K. Kratz, J. S.Baron, P. A. Bukaveckas, G. W. Kling, D. S. White, N.Caine, R. C. Lathrop, and P. R. Leavitt. 1999. Spatialvariation among lakes within landscapes: ecological organi-zation along lake chains. Ecosystems 2:395–410.
Troussellier, M., H. Schafer, N. Batailler, L. Bernard, C.Courties, P. Lebaron, G. Muyzer, P. Servais, and J. Vives-Rego. 2002. Bacterial activity and genetic richness along anestuarine gradient (Rhone River plume, France). AquaticMicrobial Ecology 28:13–24.
Whitaker, R. J., D. W. Grogan, and J. W. Taylor. 2003.Geographic barriers isolate endemic populations of hyper-thermophilic archaea. Science 301:976–978.
Yannarell, A. C., and E. W. Triplett. 2004. Within- andbetween-lake variability in the composition of bacterioplank-ton communities: investigations using multiple spatial scales.Applied and Environmental Microbiology 70:214–223.
Yannarell, A. C., and E. W. Triplett. 2005. Geographic andenvironmental sources of variation in lake bacterial commu-nity composition. Applied and Environmental Microbiology71:227–239.
BYRON C. CRUMP ET AL.1378 Ecology, Vol. 88, No. 6
SPECIALFEATURE
Copyright © 2022 FDOKUMEN