Physical short-term changes after a tussock tundra fire, Seward Peninsula, Alaska
13
Physical short-term changes after a tussock tundra fire, Seward Peninsula, Alaska Anna Liljedahl, 1 Larry Hinzman, 1 Robert Busey, 1 and Kenji Yoshikawa 2 Received 9 May 2006; revised 14 March 2007; accepted 30 April 2007; published 26 June 2007. [1] The Kougarok area, situated on the central Seward Peninsula, Alaska, experienced a severe fire in August 2002. This may be the only tundra fire where high-quality prefire (1999–2002) and postfire (2003–2006) active layer and meteorology measurements have been collected in the same locations. After fire, near-surface soil showed increased moisture at the burned tussock site, remaining close to saturation throughout the thawed season 2003–2006. Despite wetter soil after the fire, freezing occurred earlier at the burned tussock site than at the control, indicating the importance of a reduced organic layer. Severe combustion of lichen and moss left 15–25 cm high tussocks, resulting in a doubling of the surface roughness coefficient. Average September temperature at the tussock site increased 2.3 ± 0.7°C throughout the 1 m soil profile, doubling the active layer depth, although this is due partly to favorable meteorological conditions. The shrubby control station experienced a mean annual temperature increase of 1.1 ± 0.3°C in the upper 0.5 m. A similar annual change was found at the burned tussock site. Cooler weather conditions in 2006 stagnated the soil-warming trend, which occurred after 2002. How the thermal and moisture regimes in tundra will be affected after fire is highly influenced by weather, fire severity, vegetation regrowth, prefire vegetation, and ground ice conditions. Citation: Liljedahl, A., L. Hinzman, R. Busey, and K. Yoshikawa (2007), Physical short-term changes after a tussock tundra fire, Seward Peninsula, Alaska, J. Geophys. Res., 112, F02S07, doi:10.1029/2006JF000554. 1. Introduction [2] The Arctic and sub-Arctic are particularly sensitive to climate change [Manabe et al., 1991; Houghton et al., 1996; Watson et al., 1998]. Increased fire frequency, severity, and area burned are among the anticipated effects of climate warming [Stocks et al., 1998; Rupp et al., 2000; Flannigan et al., 2001; McCoy and Burn, 2005]. The historical and potential future extent, effects, and feed- backs of fires in the boreal forest are better known [Kasischke and Turetsky , 2006; Lynch et al., 2002; Valeo et al., 2003] than in tundra regions [Chambers et al., 2005; Racine, 2004]. Dramatic changes may follow in the Arctic and sub-Arctic, where short-term thawing/freezing processes and longer-term permafrost dynamics shape the ecosystem through plant growth, evapotranspiration, infil- tration, runoff, wetland dynamics [Hinzman et al., 2003], biogenic gas fluxes to the atmosphere [Waelbroeck and Monfray , 1997], and export of carbon and nutrients to rivers and seas [Vo ¨ro ¨smarty et al., 2001]. [3] In Arctic regions, many physical and biological processes are confined to the active layer, the near-surface layer above permafrost that thaws each summer. Critical microclimatic variables interactively controlling the active layer include surface temperature, snow cover, the nature of the vegetation canopy, organic horizon thickness, soil moisture content, and ground ice conditions [Kane et al., 1992; Burn, 1997; Hinzman et al., 2003]. Previous studies have shown that short-term (<10 years) postfire effects on surface characteristics include (1) depletion of the insula- ting organic layer, increasing the near-surface soil thermal conductivity and heat flow into the ground [Yoshikawa et al., 2002]; (2) reduced albedo, increasing the energy absorption; and (3) increased insolation on the ground surface [Kasischke et al., 1995] and reduction in the surface-atmosphere coupling [Chambers et al., 2005] due to changes in the canopy structure. These fire effects are known to increase the active layer thickness [Heginbottom, 1976; Viereck, 1982; Mackay , 1995; Burn, 1997]. Contin- ued degradation of permafrost over longer periods can result in drier near-surface soils [Swanson, 1996; Yoshikawa et al., 2002] due to increased storage capacity. Fire-induced changes can therefore have broad effects hydrological, biological, and morphological systems and land-atmosphere interactions in the Arctic. [4] This study examines the short-term (4 years) post- fire changes on the thermal and moisture regimes of the active layer. Unlike most previous studies, observations were made at fixed locations before and after the fire. Ground and surface temperatures, near-surface soil mois- ture, freezing and thawing degree-day sums, and seasonal JOURNAL OF GEOPHYSICAL RESEARCH, VOL. 112, F02S07, doi:10.1029/2006JF000554, 2007 Click Here for Full Articl e 1 International Arctic Research Center, University of Alaska Fairbanks, Fairbanks, Alaska, USA. 2 Water and Environmental Research Center, Institute of Northern Engineering, University of Alaska Fairbanks, Fairbanks, Alaska, USA. Copyright 2007 by the American Geophysical Union. 0148-0227/07/2006JF000554$09.00 F02S07 1 of 13
Transcript of Physical short-term changes after a tussock tundra fire, Seward Peninsula, Alaska

Physical short-term changes after a tussock tundra fire,
Seward Peninsula, Alaska
Anna Liljedahl,1 Larry Hinzman,1 Robert Busey,1 and Kenji Yoshikawa2
Received 9 May 2006; revised 14 March 2007; accepted 30 April 2007; published 26 June 2007.
[1] The Kougarok area, situated on the central Seward Peninsula, Alaska, experienced asevere fire in August 2002. This may be the only tundra fire where high-qualityprefire (1999–2002) and postfire (2003–2006) active layer and meteorologymeasurements have been collected in the same locations. After fire, near-surface soilshowed increased moisture at the burned tussock site, remaining close to saturationthroughout the thawed season 2003–2006. Despite wetter soil after the fire, freezingoccurred earlier at the burned tussock site than at the control, indicating the importance ofa reduced organic layer. Severe combustion of lichen and moss left 15–25 cm hightussocks, resulting in a doubling of the surface roughness coefficient. Average Septembertemperature at the tussock site increased 2.3 ± 0.7�C throughout the 1 m soil profile,doubling the active layer depth, although this is due partly to favorable meteorologicalconditions. The shrubby control station experienced a mean annual temperature increaseof 1.1 ± 0.3�C in the upper 0.5 m. A similar annual change was found at the burnedtussock site. Cooler weather conditions in 2006 stagnated the soil-warming trend, whichoccurred after 2002. How the thermal and moisture regimes in tundra will be affectedafter fire is highly influenced by weather, fire severity, vegetation regrowth, prefirevegetation, and ground ice conditions.
Citation: Liljedahl, A., L. Hinzman, R. Busey, and K. Yoshikawa (2007), Physical short-term changes after a tussock tundra fire,
Seward Peninsula, Alaska, J. Geophys. Res., 112, F02S07, doi:10.1029/2006JF000554.
1. Introduction
[2] The Arctic and sub-Arctic are particularly sensitiveto climate change [Manabe et al., 1991; Houghton et al.,1996; Watson et al., 1998]. Increased fire frequency,severity, and area burned are among the anticipated effectsof climate warming [Stocks et al., 1998; Rupp et al., 2000;Flannigan et al., 2001; McCoy and Burn, 2005]. Thehistorical and potential future extent, effects, and feed-backs of fires in the boreal forest are better known[Kasischke and Turetsky, 2006; Lynch et al., 2002; Valeoet al., 2003] than in tundra regions [Chambers et al.,2005; Racine, 2004]. Dramatic changes may follow in theArctic and sub-Arctic, where short-term thawing/freezingprocesses and longer-term permafrost dynamics shape theecosystem through plant growth, evapotranspiration, infil-tration, runoff, wetland dynamics [Hinzman et al., 2003],biogenic gas fluxes to the atmosphere [Waelbroeck andMonfray, 1997], and export of carbon and nutrients torivers and seas [Vorosmarty et al., 2001].[3] In Arctic regions, many physical and biological
processes are confined to the active layer, the near-surface
layer above permafrost that thaws each summer. Criticalmicroclimatic variables interactively controlling the activelayer include surface temperature, snow cover, the nature ofthe vegetation canopy, organic horizon thickness, soilmoisture content, and ground ice conditions [Kane et al.,1992; Burn, 1997; Hinzman et al., 2003]. Previous studieshave shown that short-term (<10 years) postfire effects onsurface characteristics include (1) depletion of the insula-ting organic layer, increasing the near-surface soil thermalconductivity and heat flow into the ground [Yoshikawaet al., 2002]; (2) reduced albedo, increasing the energyabsorption; and (3) increased insolation on the groundsurface [Kasischke et al., 1995] and reduction in thesurface-atmosphere coupling [Chambers et al., 2005] dueto changes in the canopy structure. These fire effects areknown to increase the active layer thickness [Heginbottom,1976; Viereck, 1982; Mackay, 1995; Burn, 1997]. Contin-ued degradation of permafrost over longer periods canresult in drier near-surface soils [Swanson, 1996; Yoshikawaet al., 2002] due to increased storage capacity. Fire-inducedchanges can therefore have broad effects hydrological,biological, and morphological systems and land-atmosphereinteractions in the Arctic.[4] This study examines the short-term (4 years) post-
fire changes on the thermal and moisture regimes of theactive layer. Unlike most previous studies, observationswere made at fixed locations before and after the fire.Ground and surface temperatures, near-surface soil mois-ture, freezing and thawing degree-day sums, and seasonal
JOURNAL OF GEOPHYSICAL RESEARCH, VOL. 112, F02S07, doi:10.1029/2006JF000554, 2007ClickHere
for
FullArticle
1International Arctic Research Center, University of Alaska Fairbanks,Fairbanks, Alaska, USA.
2Water and Environmental Research Center, Institute of NorthernEngineering, University of Alaska Fairbanks, Fairbanks, Alaska, USA.
Copyright 2007 by the American Geophysical Union.0148-0227/07/2006JF000554$09.00
F02S07 1 of 13

n-factors were observed before and after the fire in 2002at burned (K2) and control (K3) sites, to determinewhether fire-induced effects, weather variations, or bothexplain postfire changes in the active layer. We alsoexamine prefire and postfire radiation efficiency, albedo,surface roughness at K2, and broader scale (1 km2) thaw-depth observations. Information obtained about ground iceand snow conditions during the study period was limited,restricting the discussion of their contribution to observedchanges.
2. Site Description
[5] The Kougarok area (also known as Quartz Creek),occupies an area of transition between the continuous anddiscontinuous permafrost zones [Brown and Pewe, 1973] inthe central part of the Seward Peninsula, northwesternAlaska (Figure 1). Kougarok (65�250N, 164�380W), appro-ximately 140 km north of Nome, has a continental climateand is locally underlain by thin (15–50 m) continuouspermafrost (>90% areal cover). The rolling landscapesupports low Arctic tundra dominated by sedge tussockcommunities, with shrubs in the valley bottoms. TheRuptic-Histic Aquiturbel soils are of eolian origin [Sturmet al., 2005], with thickness of a half-meter on the ridges toa few meters in the valleys. Frost boils, circular featuresresulting from freeze and thaw processes, exist in the area.
[6] The Seward Peninsula has a relatively high firefrequency compared to other tundra regions [Racine etal., 1987] but longer return intervals than the boreal forestof Interior Alaska [Stocks et al., 2002]. The annual areaburned in Seward Peninsula was episodic during 1954–2006 (Figure 2), consistent with previous studies ofAlaska [Kasischke et al., 2002] but without the trendsobserved in the boreal regions of Alaska and Canada[Kasischke and Turetsky, 2006]. The largest fire yearwas 1977, both in number of fires larger than 2 ha (13)and area burned (471,578 ha) (http://agdc.usgs.gov/data/blm/fire/index.html).[7] The Kougarok area experienced three fires in the last
35 years: 1971, 1997, and 2002. Three meteorologicalstations (K1, K2, and K3) were installed in the area during1999 under the Arctic Transitions in the Land-AtmosphereSystem (ATLAS) program [Sturm et al., 2005; http://www.uaf.edu/water/projects/atlas/atlas.htm] (Figure 3).Tables 1 and 2 contain background information about thesesites. All three stations are located on land affected by the1971 fire. The 1997 fire (311 km2, 22 July to 25 August)burned the location of the meteorological station K1 whilethe 2002 fire (87 km2, 4 August to 19 August) destroyedinstrumentation at the K2 site. Instrumentation was replacedin October 2002. A principal component analysis of twoLandsat images (band 3, 4, and 7) acquired in July 1997 andOctober 2002 shows the spatial distribution of the 1997 and
Figure 1. (left) Location of Kougarok area (65�250N, 164�380W), central Seward Peninsula,northwestern Alaska. (center) Topographic map showing Mauze Gulch and Niagara Creek watershed,with the three meteorological stations, K1, K2, and K3, and the Circumpolar Active Layer Monitoring(CALM) grid.
F02S07 LILJEDAHL ET AL.: PHYSICAL FIRE EFFECTS AT A TUNDRA SITE
2 of 13
F02S07

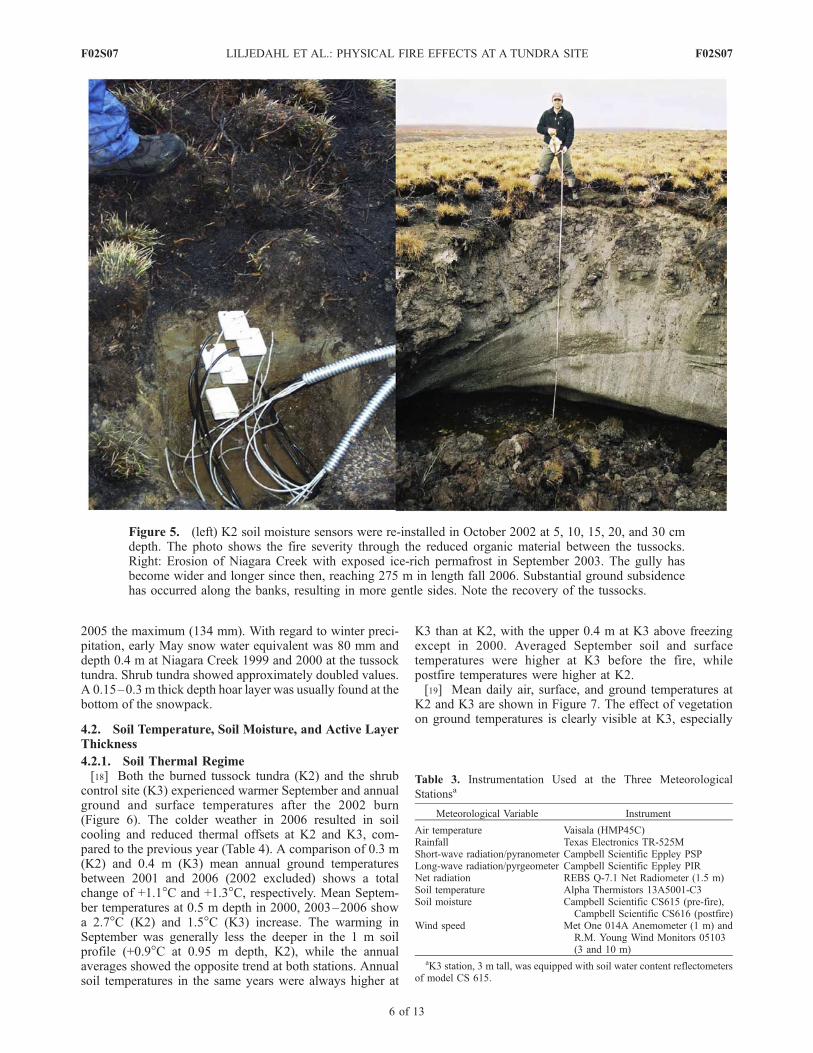
2002 burns (Figure 4). On the basis of the fire severityclassification system of Viereck et al. [1979], the 2002 fireresulted in severe (soil organic material completely ornearly consumed down to mineral soil) to moderate burns(organic layer partially consumed) with a few unburnedpatches. Approximately 5–7 cm of the organic layerremained after the fire in August 2002, where the K2thermistors and water content reflectometers were installed(Figure 5). The surface below the long- and short-waveradiation instrument experienced a partial burning, leavingunburned patches. Thermal and mechanical erosion initiatedby the 2002 fire were observed 400 m to the east of K2 inthe Niagara Creek streambed (Figure 5), resulting in a>3500 m3 gully by September 2006. The erosion exposedice-rich permafrost and ice wedges, with active thermokarstprocesses extending several meters away from the bank.The ice wedges probably formed during the Holocene,although the ice-rich permafrost is of older age (V. E.Romanovsky, personal communication, 2006).[8] A Circumpolar Active Layer Monitoring (CALM)
grid [Brown et al., 2000] was installed in 1999 adjacent
to K3 in the Mauze Gulch watershed (Figures 1 and 4).The 1 km2 grid, with nodes at 100 m spacing, extends overthe creek and includes both a south- and a north-facingslope. The 2002 fire burned 90 grid nodes, mainly repre-sented by tussock communities. Most of the 31 controlnodes (unburned in 2002) were in the moist valley bottomand vegetated by high shrubs (<2 m). A few unburned sitesoccupied areas of moss and lichen at the northwest corner ofthe grid, on a south-facing slope shoulder.
3. Methods
[9] Thaw-depth observations on the 1 km2 CALM sitewere made manually at the 121 nodes locations by insertinga metal probe to the depth of refusal during the end ofSeptember or early October. The CALM grid results weredivided into two groups, burned and control.[10] Meteorological and soil variables were collected
from 1999 through 2006. Temperature, wind speed, precipi-tation, radiation, and moisture instruments are summarizedin Table 3. Meteorological measurements were made every
Figure 3. (left) K2 station before fire, showing rain gauge, 10 m tower and radiation instruments inJune 2001. (right) The 3 m high K3 station summer 2005 at Mauze Gulch watershed.
Figure 2. Annual area burned at Seward Peninsula 1954 through 2006 based on fires larger than 2 km2
(http://agdc.usgs.gov/data/blm/fire/index.html). Although most of Seward Peninsula is represented byopen tundra, some spruce forest exists in the east [Thayer-Snyder, 2002].
F02S07 LILJEDAHL ET AL.: PHYSICAL FIRE EFFECTS AT A TUNDRA SITE
3 of 13
F02S07

minute and averaged into hourly intervals at K1, K2, and K3.Soil temperature and moisture were measured every 5 minand recorded as a 3-hour mean at K2 and K3. Informationwas stored in a Campbell Scientific CR10X data logger. Thedepth of each ground sensor was defined as the distancefrom the surface at the time of observation. Therefore near-surface prefire and postfire data from K2 represent differentsoil material. Unfrozen soil moisture was estimated fromvolumetric water content (VWC) observations. Spring peakin VWC was assumed to represent saturated conditions (allmicro and macro pore spaces filled with liquid water) andfor winter conditions, organic and mineral soil was set to8% and 10% saturation, respectively [Hinzman et al., 1991].[11] Thermistors were calibrated each fall following the
method described by Romanovsky and Osterkamp [1995]using the phase equilibrium temperature between 0�C and�0.1�C during freezing. Mean daily ground temperaturesprovided information about the beginning of thaw, freeze,freeze-up dates, and the length of thawing and freezingseasons. The beginnings of the thawing and freezing periodswere defined by ground surface temperatures remainingconsistently above and below 0�C, respectively. Thefreeze-up date for the 1 m profile represented the day whenall temperatures began to decrease sharply after the ‘‘zerocurtain’’ disappeared [Romanovsky and Osterkamp, 1995].[12] The n-factor, the ratio of the accumulated seasonal
ground surface thawing or freezing degree-day sums to theseasonal air freezing and thawing indexes, is a generalizedrepresentation of the various climatic and vegetative varia-bles affecting the soil thermal regime. Originally developedfor engineering purposes [Carlson, 1952], the n-factor hasalso been used to examine the surface energy balance innatural regimes [Klene et al., 2001; Karunaratne and Burn,
2004; Kade et al., 2006] and for active layer mapping[Shiklomanov and Nelson, 2002]. Because of continuoustemperature records, the n-factor was approximated usingmeasurements 5 cm below surface (K2) and directly undergreen vegetation (0 cm) at K3. The K2 n-factor calculationsshould therefore be seen as a modified parameter similar tothat employed by Kade et al. [2006].[13] Owing to the limited number of soil temperature
measurements, permafrost table temperatures (Tps) wereestimated following Romanovsky and Osterkamp [1995,equation (13)] where:
Tps ¼Kt � It � Kf � If
Kf � P� 0 ð1Þ
where Kt and Kf are the bulk thawed and frozen thermalconductivities, It and If are the ground surface thawing andfreezing indices (degree-days), and P is the annual period(365 days). Information about active layer depth wasinterpolated from soil temperature measurements. Thethermal offset, the difference between the mean annualpermafrost and ground surface temperatures, was alsocalculated.[14] End-of-winter snow observations were made in 1999
and 2000 between K2 and the Niagara Creek streambed.Snow depth was obtained by 50 probed measurementsalong a transect at 1 m intervals. Snow water equivalentswere based on five samples using an Adirondack tube.Tussock and shrub tundra were observed separately.[15] Net all-wave radiation (Q*) represents the amount of
energy available at the surface, described during daytime as:
Q* ¼ K# � K" þ L# � L" ð2Þ
where K#, K", L#, and L" represent incident and reflectedshort-wave radiation, incoming long-wave radiation emittedby the atmosphere, and outgoing long-wave from thesurface, respectively [Oke, 1987]. A slight negative feed-back mechanism is present because a surface with lowalbedo absorbs energy well, increasing emission of long-wave radiation from the surface unless there is rapid heatdissipation [Oke, 1987]. An approach used by Chamberset al. [2005] was applied to reduce the influence ofincoming short-wave radiation differences, energy budgetcomponents, and climatic conditions on the net all-waveradiation: (1) the net all-wave radiation was treated in termsof radiation efficiency (Re), which is net-radiation normal-ized to incoming short-wave radiation; (2) the period of
Table 1. Site Descriptions of Meteorological Stations K1, K2, and
K3
Site Description K1 K2 K3
Latitude 6500 26.420 6500 25.700 6500 27.580
Longitude 16400 34.710 16400 38.610 16400 38.290
Elevation 290 m 110 m 260 mAspect None SW SSlope Level 3 deg. 6.5 deg.Landform Ridge Broad, alluvial fan SlopeVegetation Moss, lichens Eriphorum Tussocks ShrubParent material Loess Loess LoessFires 1971, 1997 1971, 2002 1971Watershed Niagara Cr.
(6.5 km2)No name Mauze Gulch
(4.5 km2)
Table 2. Soil Classification Scheme of K2 and K3 Stations From Sturm et al. [2005] With Frozen Thermal Conductivities by Hinzman et
al. [1991]
Horizon Depth, cm Clay <2 mm Silt Sand >2 mmSaturation,% by wt
Bulk Density,g cm�3 Soil Class
ThermalConductivity
k_thawW/mK
k_frozenW/mK
Tussock Oi/Oe 0–4 518.3 0.08 Organic 0.695 1(K2) O/A 4–14 336.8 0.24 Organic 0.695 1
Bg/Ajj 14+ 21.6 57.6 20.8 35.7 1.52 Fine 1.535 2.689Shrub Oi 0–15 724.5 0.05 Organic 0.745 1(K3) O/A 15–18 64 34.4 1.6 157.8 0.58 Organic 0.695 1
AB 18–25 16.4 42.4 41.2 13 80 0.94 Fine 0.843 2.919BA 25+ 21.6 39.6 38.8 Fine 0.843 2.919
F02S07 LILJEDAHL ET AL.: PHYSICAL FIRE EFFECTS AT A TUNDRA SITE
4 of 13
F02S07

interest was restricted to local noon ±2 hours; and (3) onlydata obtained during clear-sky conditions (>500 Wm�2) andnot directly following rain were included. A wind speedcooling effect algorithm [Campbell Scientific Inc., 1996]was applied to the net-radiation observations, which weremade early June to late September.[16] The height and spacing of the microroughness and
macroroughness elements of the surface, i.e., the surfaceroughness length (zo) was obtained under neutral conditions,defined as the Richardson number (Ri) lying between �0.01and 0.01. The Ri relates the relative roles of free and forcedconvection and is positive for stable and negative duringunstable atmospheric conditions [Oke, 1987]. FollowingBraun [1985], calculations of Ri and, roughness length (zo)were based on a wind speed and temperature profile betweenthe surface and 10 m, calculated as:
Ri ¼ g*z*2 Ta � Tsurf� �h i
= u*z2 Ta þ 273:15ð Þh i
ð3Þ
z0 ¼ exp u*z2 ln z1ð Þ� �
� u*z1 ln z2ð Þ� �n o
= uz2 � uz1f gh i
where zo is in meters, g is the gravitational constant (m s�2),z is the height of the wind-speed and temperature
measurement (m), Ta is air temperature at height z (�C),Tsurf is the effective surface temperature (�C), and uz1 anduz2 are wind-speed (m s�1) at heights 1 and 2. Emitted long-wave radiation represented effective surface temperature insurface roughness and air stability estimations, assuming anemissivity equal to one.
4. Result
4.1. Weather
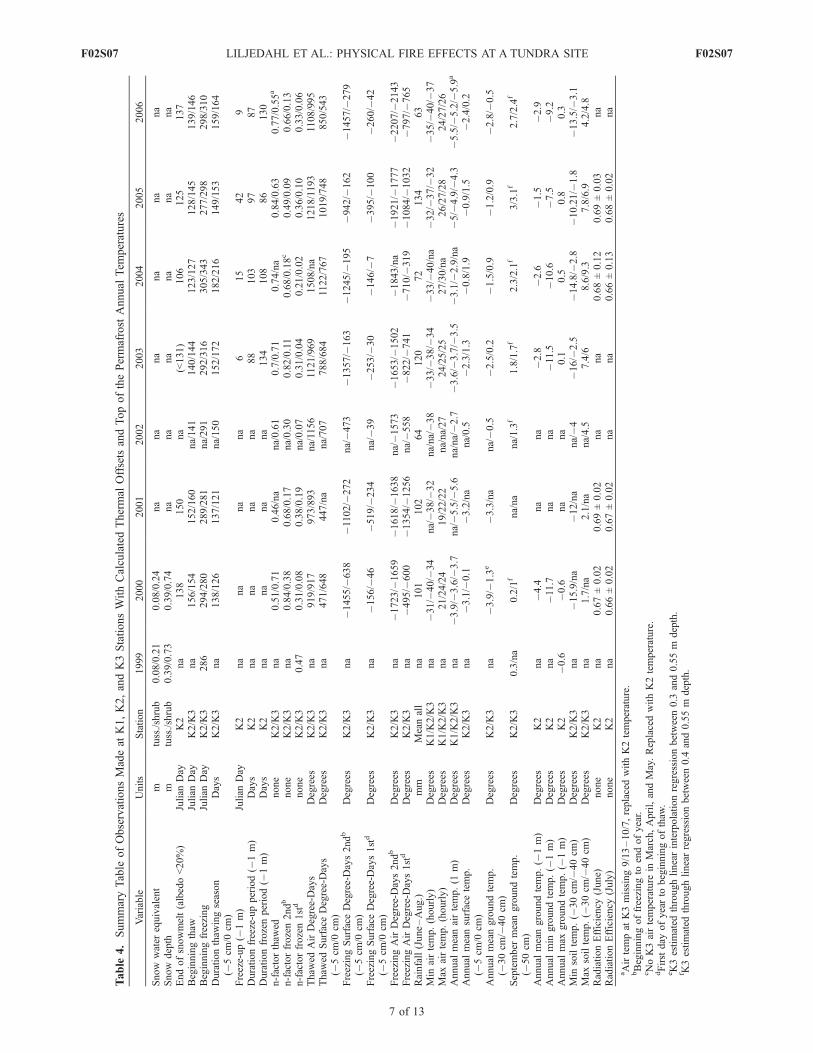
[17] The area experienced a period of warmer weatherbeginning in 2002. The warmest mean annual air temper-ature was �3�C (2002 and 2004), while 2001 and 2006were cooler (�5.5�C) (Table 4). Longer thaw seasons wereobserved at the control site (K3) in the 2002–2006 periodthan in 2000 and 2001. The warmest year (2004) experi-enced a thaw season nearly 100 days longer than in 2001.The cooler mean annual temperatures in 2001 and 2006resulted primarily to lower summer temperatures. Hourlyair temperatures in the 2000–2006 period ranged from�40�C to 30�C, with postfire mean daily temperature atK2 and K3 strongly correlated (R2 0.93, p < 0.001).Average rainfall from June through August during thestudy period was 94 mm, with the largest monthly propor-tion falling in August. The 2002 and 2006 summersexperienced the minimum rainfall amounts (64 mm) and
Figure 4. A multispectral principal component analysis (PCA) based on Landsat (band 3, 4, and 7) oftwo overlaid images acquired in early July 1997 and October 2002. The 1997 and 2002 burns are shownin nonnatural colors. Also marked are the year of fire, the three meteorological stations (K1, K2, and K3),and the 1 km2 CALM grid. Darker lines across the area show ATV and truck trails.
F02S07 LILJEDAHL ET AL.: PHYSICAL FIRE EFFECTS AT A TUNDRA SITE
5 of 13
F02S07
2005 the maximum (134 mm). With regard to winter preci-pitation, early May snow water equivalent was 80 mm anddepth 0.4 m at Niagara Creek 1999 and 2000 at the tussocktundra. Shrub tundra showed approximately doubled values.A 0.15–0.3 m thick depth hoar layer was usually found at thebottom of the snowpack.
4.2. Soil Temperature, Soil Moisture, and Active LayerThickness
4.2.1. Soil Thermal Regime[18] Both the burned tussock tundra (K2) and the shrub
control site (K3) experienced warmer September and annualground and surface temperatures after the 2002 burn(Figure 6). The colder weather in 2006 resulted in soilcooling and reduced thermal offsets at K2 and K3, com-pared to the previous year (Table 4). A comparison of 0.3 m(K2) and 0.4 m (K3) mean annual ground temperaturesbetween 2001 and 2006 (2002 excluded) shows a totalchange of +1.1�C and +1.3�C, respectively. Mean Septem-ber temperatures at 0.5 m depth in 2000, 2003–2006 showa 2.7�C (K2) and 1.5�C (K3) increase. The warming inSeptember was generally less the deeper in the 1 m soilprofile (+0.9�C at 0.95 m depth, K2), while the annualaverages showed the opposite trend at both stations. Annualsoil temperatures in the same years were always higher at
K3 than at K2, with the upper 0.4 m at K3 above freezingexcept in 2000. Averaged September soil and surfacetemperatures were higher at K3 before the fire, whilepostfire temperatures were higher at K2.[19] Mean daily air, surface, and ground temperatures at
K2 and K3 are shown in Figure 7. The effect of vegetationon ground temperatures is clearly visible at K3, especially
Table 3. Instrumentation Used at the Three Meteorological
Stationsa
Meteorological Variable Instrument
Air temperature Vaisala (HMP45C)Rainfall Texas Electronics TR-525MShort-wave radiation/pyranometer Campbell Scientific Eppley PSPLong-wave radiation/pyrgeometer Campbell Scientific Eppley PIRNet radiation REBS Q-7.1 Net Radiometer (1.5 m)Soil temperature Alpha Thermistors 13A5001-C3Soil moisture Campbell Scientific CS615 (pre-fire),
Campbell Scientific CS616 (postfire)Wind speed Met One 014A Anemometer (1 m) and
R.M. Young Wind Monitors 05103(3 and 10 m)
aK3 station, 3 m tall, was equipped with soil water content reflectometersof model CS 615.
Figure 5. (left) K2 soil moisture sensors were re-installed in October 2002 at 5, 10, 15, 20, and 30 cmdepth. The photo shows the fire severity through the reduced organic material between the tussocks.Right: Erosion of Niagara Creek with exposed ice-rich permafrost in September 2003. The gully hasbecome wider and longer since then, reaching 275 m in length fall 2006. Substantial ground subsidencehas occurred along the banks, resulting in more gentle sides. Note the recovery of the tussocks.
F02S07 LILJEDAHL ET AL.: PHYSICAL FIRE EFFECTS AT A TUNDRA SITE
6 of 13
F02S07
Table
4.SummaryTable
ofObservationsMadeat
K1,K2,andK3StationsWithCalculatedThermal
OffsetsandTopofthePermafrostAnnual
Tem
peratures
Variable
Units
Station
1999
2000
2001
2002
2003
2004
2005
2006
Snow
water
equivalent
mtuss./shrub
0.08/0.21
0.08/0.24
na
na
na
na
na
na
Snow
depth
mtuss./shrub
0.39/0.73
0.39/0.74
na
na
na
na
na
na
Endofsnowmelt(albedo<20%)
Julian
Day
K2
na
138
150
na
(<131)
106
125
137
Beginningthaw
Julian
Day
K2/K3
na
156/154
152/160
na/141
140/144
123/127
128/145
139/146
Beginningfreezing
Julian
Day
K2/K3
286
294/280
289/281
na/291
292/316
305/343
277/298
298/310
Durationthaw
ingseason
(�5cm
/0cm
)Days
K2/K3
na
138/126
137/121
na/150
152/172
182/216
149/153
159/164
Freeze-up(�
1m)
Julian
Day
K2
na
na
na
na
615
42
9Durationfreeze-upperiod(�
1m)
Days
K2
na
na
na
na
88
103
97
87
Durationfrozenperiod(�
1m)
Days
K2
na
na
na
na
134
108
86
130
n-factorthaw
ednone
K2/K3
na
0.51/0.71
0.46/na
na/0.61
0.7/0.71
0.74/na
0.84/0.63
0.77/0.55a
n-factorfrozen2ndb
none
K2/K3
na
0.84/0.38
0.68/0.17
na/0.30
0.82/0.11
0.68/0.18c
0.49/0.09
0.66/0.13
n-factorfrozen1std
none
K2/K3
0.47
0.31/0.08
0.38/0.19
na/0.07
0.31/0.04
0.21/0.02
0.36/0.10
0.33/0.06
Thaw
edAirDegree-Days
Degrees
K2/K3
na
919/917
973/893
na/1156
1121/969
1508/na
1218/1193
1108/995
Thaw
edSurfaceDegree-Days
(�5cm
/0cm
)Degrees
K2/K3
na
471/648
447/na
na/707
788/684
1122/767
1019/748
850/543
FreezingSurfaceDegree-Days2ndb
(�5cm
/0cm
)Degrees
K2/K3
na
�1455/�
638
�1102/�
272
na/�473
�1357/�
163
�1245/�
195
�942/�
162
�1457/�
279
FreezingSurfaceDegree-Days1std
(�5cm
/0cm
)Degrees
K2/K3
na
�156/�
46
�519/�
234
na/�39
�253/�
30
�146/�
7�395/�
100
�260/�
42
FreezingAirDegree-Days2ndb
Degrees
K2/K3
na
�1723/�
1659
�1618/�
1638
na/�1573
�1653/�
1502
�1843/na
�1921/�
1777
�2207/�
2143
FreezingAirDegree-Days1std
Degrees
K2/K3
na
�495/�
600
�1354/�
1256
na/�558
�822/�
741
�710/�
319
�1084/�
1032
�797/�
765
Rainfall(June–Aug.)
mm
Meanall
na
101
102
64
120
72
134
63
Min
airtemp.(hourly)
Degrees
K1/K2/K3
na
�31/�
40/�
34
na/�38/�
32
na/na/�38
�33/�
38/�
34
�33/�
40/na
�32/�
37/�
32
�35/�
40/�
37
Max
airtemp.(hourly)
Degrees
K1/K2/K3
na
21/24/24
19/22/22
na/na/27
24/25/25
27/30/na
26/27/28
24/27/26
Annual
meanairtemp.(1
m)
Degrees
K1/K2/K3
na
�3.9/�
3.6/�
3.7
na/�5.5/�
5.6
na/na/�2.7
�3.6/�
3.7/�
3.5
�3.1/�
2.9/na
�5/�
4.9/�
4.3
�5.5/�
5.2/�
5.9a
Annual
meansurfacetemp.
(�5cm
/0cm
)Degrees
K2/K3
na
�3.1/�
0.1
�3.2/na
na/0.5
�2.3/1.3
�0.8/1.9
�0.9/1.5
�2.4/0.2
Annual
meangroundtemp.
(�30cm
/�40cm
)Degrees
K2/K3
na
�3.9/�
1.3
e�3.3/na
na/�0.5
�2.5/0.2
�1.5/0.9
�1.2/0.9
�2.8/�
0.5
September
meangroundtemp.
(�50cm
)Degrees
K2/K3
0.3/na
0.2/1
fna/na
na/1.3f
1.8/1.7
f2.3/2.1f
3/3.1f
2.7/2.4f
Annual
meangroundtemp.(�
1m)
Degrees
K2
na
�4.4
na
na
�2.8
�2.6
�1.5
�2.9
Annual
min
groundtemp.(�
1m)
Degrees
K2
na
�11.7
na
na
�11.5
�10.6
�7.5
�9.2
Annual
max
groundtemp.(�
1m)
Degrees
K2
�0.6
�0.6
na
na
0.1
0.5
0.8
0.3
Min
soiltemp.(�
30cm
/�40cm
)Degrees
K2/K3
na
�15.9/na
�12/na
na/�4
�16/�
2.5
�14.8/�
2.8
�10.21/�
1.8
�13.5/�
3.1
Max
soiltemp.(�
30cm
/�40cm
)Degrees
K2/K3
na
1.7/na
2.1/na
na/4.5
7.4/6
8.6/9.3
7.8/6.9
4.2/4.8
RadiationEfficiency
(June)
none
K2
na
0.67±0.02
0.69±0.02
na
na
0.68±0.12
0.69±0.03
na
RadiationEfficiency
(July)
none
K2
na
0.66±0.02
0.67±0.02
na
na
0.66±0.13
0.68±0.02
na
aAirtempat
K3missing9/13–10/7,replacedwithK2temperature.
bBeginningoffreezingto
endofyear.
cNoK3airtemperature
inMarch,April,andMay.ReplacedwithK2temperature.
dFirstday
ofyearto
beginningofthaw
.eK3estimated
throughlinearinterpolationregressionbetween0.3
and0.55m
depth.
f K3estimated
throughlinearregressionbetween0.4
and0.55m
depth.
F02S07 LILJEDAHL ET AL.: PHYSICAL FIRE EFFECTS AT A TUNDRA SITE
7 of 13
F02S07

during the winter season. K3 never experienced tempera-tures colder than �4�C at 0.4 m depth, compared to �16�Cat K2 (0.3 m). K2 reached a summer maximum of 2.1�C at0.3 m before the fire, while the postfire maximum was 8�Cin 2004. Similar changes between the summers can befound at K3 station at 0.4 m depth. The cumulative thawingdegree-days at the surface can be seen as a measure of thetotal amount of energy received at the ground surface duringthe thawed season (Table 4). During all 4 years after the fire,K2 has higher cumulative thawed surface degree-days thanK3, despite a shorter thaw season as a result of an earlierfreezing.[20] The thaw season n-factor shows a higher prefire
value at K3 than at K2 (Table 4). After the burn, the K2n-factor was equal to or higher than K3. When averagingall years, the K2 winter/spring n-factor (first day ofthe year until beginning of thaw) shows a higher valueof (0.70 ± 0.12) than fall/winter (0.32 ± 0.06). K3experienced similar partitioning but with lower ratiosand relatively higher interannual variation 0.18 ± 0.11(winter/spring) and 0.08 ± 0.06 (fall/winter). No signifi-
cant difference was evident between prefire and postfireyears.[21] The postfire freeze-up date at K2 occurred in
January, except after the warm summer of 2004, whichresulted in freeze-up on 11 February 2005. The duration ofthe freeze-up period ranged between 87 to 130 days, alength similar to the frozen period of 86 to 134 days.Calculated mean annual temperature at the top of thepermafrost was �3.7�C (K2) before the fire and reached�2.1�C in 2004 and 2005, with a cooling in 2006(�3.4�C). K3 showed similar trends, but under thawingconditions at 1 m depth (Table 4). Thermal offsets variedaround �1�C at K2. The negative offset was usually largerat K3.4.2.2. Soil Moisture[22] The fire resulted in relatively wetter near-surface
soils. Before the fire and directly following the spring peaksaturation, observations of near-surface soil moisture at K2showed a drastic decrease to 40% saturation of unfrozenwater content (Figure 8), which remained relatively stableduring the rest of summer. After the fire, the near-surface
Figure 6. Mean annual and September ground temperatures at K2 (burn) and K3 (control) stationduring year 1999 through 2005 of prefire (gray) and postfire (black) observations. The depth is relative tothe surface at the time of observation.
F02S07 LILJEDAHL ET AL.: PHYSICAL FIRE EFFECTS AT A TUNDRA SITE
8 of 13
F02S07

soil was nearly saturated throughout the thawed season(70–100% saturation). This clear prefire and postfire dif-ference did not occur at the control site (K3). A rapidincrease during the beginning of thaw was observed postfirea month earlier at both stations. After the 2002 fire thedecrease in unfrozen moisture content due to soil freezingoccurred 19–30 days (K2) and approximately a month (K3)later than prior the burn.4.2.3. Active Layer Thickness[23] Active layer depths at control and burned grid nodes,
exhibit a similar trend from 2000 to 2002 (Figure 9) withthe control 0.11 to 0.16 m deeper than the burned group.The control showed an active layer depth of 0.55, 0.67, and
0.64 m, while the group that later would be affected by fire0.44, 0.53, and 0.48 m. Fall 2003, 1 year after the burn,resulted in a 0.11 m shallower thaw in the control groupcompared to 2002, while the burned area active layer depthincreased with 0.06 m. The years following the tundra firewere characterized by consecutive deepening of the activelayer over the entire CALM grid in 2004–2005 (control0.68, 0.75 m, burned 0.60, 0.75 m) with a slight reductionafter the cooler summer of 2006 (control 0.72 m, burned0.70 m). The prefire difference (0.11–0.16 m) betweenmean of the two groups was reduced drastically after fireto �0.02 m, except in 2004 with 0.08 m deeper thaw in thecontrol. Standard deviations indicate larger variability of
Figure 7. Mean daily air, surface, and ground temperatures at K2 and K3 stations 1999–2006.
Figure 8. Mean daily unfrozen soil moisture presented as percent saturation at K2 (�10 cm) and thecontrol K3 (�5 cm) 2000–2006. Gray and black lines represent observations made before and after 2002.
F02S07 LILJEDAHL ET AL.: PHYSICAL FIRE EFFECTS AT A TUNDRA SITE
9 of 13
F02S07

thaw depths within the control group (�0.21 m) than in theburned (�0.15 m). In the shrubby valley, a few control thawdepth observations exceeded the 1.23 m long probe in2004–2006. In the NW corner of the CALM grid, somecontrol sites had rocks present, complicating thaw depthmeasurements.
4.3. Surface Observations
4.3.1. Albedo[24] Short-wave noontime absorbed insolation at K2
increased slightly after the fire, owing to reduced albedo.Mean albedo from the end of snowmelt to solstice was16% (2000), 15% (2001) 11% (2004), 13% (2005), and14% (2006) with standard deviation of ±2. From solsticeto end of August, the observations were 17% and 16%before fire and 13%, 15%, and 17% in 2004–2006,respectively. A 5-week earlier snowmelt in 2004 comparedto 2001 at K2 (Table 4) was evident through the drasticreduction in surface albedo. Despite the disappearance ofsnow cover on Julian day 106 in 2004, the thaw did notstart until day 123.4.3.2. Radiation Efficiency and the RichardsonNumber[25] At K2, there was no prefire to postfire difference in
radiation efficiency, Re, which varied between 0.66 and 0.69(Table 4). More pronounced air instability was found afterfire through lower Richardson numbers. The average forJune was �0.45 (2000–2001) and �0.75 (2004–2005) andJuly changed from �0.39 to �0.67. Surface roughnessincreased after fire, from a June-July average of 0.02 in2000–2001 to 0.04 m 2004–2005, enhancing turbulentmixing.
5. Discussion
5.1. Soil Thermal and Moisture Regime
[26] Four major factors influencing spatial and temporalchanges in the thermal and hydrological regimes are weath-er, vegetation, fire effects, and ground ice conditions. Theeffect of fire on the sub-Arctic physical and biologicalsystems is influenced by the presence of permafrost. Ice-rich permafrost promotes thermal stability at depth owing tolatent-heat effects, while thawing of the ice-rich transition
zone (the uppermost permafrost that alternates in statusbetween seasonally frozen ground and permafrost oversubdecadal to centennial timescales) results in release ofwater to the active layer [Shur et al., 2005]. Unfortunately,information about ground ice conditions was not obtained inthis study. The potential response of permafrost to fire, andthe dependence of surface conditions on ground ice, willtherefore be discussed through observed changes in theactive layer.[27] The increased thaw depths and warmer soils at both
burned and control sites after the fire show the dependenceon weather. Although the changes in mean annual soiltemperature 2001–2006 were very similar in the upper halfmeter of the soil, the change in September was nearly twicelarger at K2 than at K3. Higher vegetation resulting in moreefficient snow trapping and winter insulation [Sturm et al.,2001] at K3, offset the warming fire effects during summerat K2, on the annual scale.[28] The postfire soil warming at K2 can be explained by
several factors: (1) Approximately 50% of the 14 cmorganic layer was destroyed by fire, causing drastic changesin near-surface thermal conductivity. Destruction of theinsulating organic layer increased the heat conducted intothe ground during summer, resulting in deeper thaw andincreased n-factors. (2) Earlier snowmelt and onset of thawafter the fire was confirmed by albedo observations (K2)and ground surface temperature (K2 and K3). In a period ofhigh incoming short-wave radiation, such a shift in snow-melt can have a significant effect on the energy available forsoil heating and sensible heat flux. To what degree theearlier snowmelt was caused by warmer weather or reducedsnow cover cannot be evaluated due to lack of postfire snowobservations. (3) Summer albedo decreased after the fire(2004–2006) but not as drastically as observed in previousstudies [Rouse and Mills, 1977], reducing the possiblemagnitude in soil temperature change. The limited burnand efficient regrowth of the well-developed tussocksresulted in little change in albedo, with the canopy shadingmoderately to severely burned ground between tussocks. Noinformation on albedo during the first summer followingfire existed, a time period that most likely experienced thelowest value. It is possible that a low albedo was a strong
Figure 9. Observed mean CALM grid active layer depths acquired in late September or early October2000–2006 of control (gray) and 2002 burned sites (black).
F02S07 LILJEDAHL ET AL.: PHYSICAL FIRE EFFECTS AT A TUNDRA SITE
10 of 13
F02S07

factor in 2003. This due to the largest postfire differencebetween K2 and K3 in 2003 September soil temperatures,and the increase in active layer thickness from the previousyear in the burned CALM grid group compared to adecrease in the control group.[29] A negative correlation should be expected between
snow depth and n-factors, with lower ratios in the latterhalf of the winter as snow depth increases. However,lower n-factors were usually observed during the first halfof the winter (beginning of freezing to end of year) thanthe second half, indicating a strong and efficient dissipa-tion of heat from the ground toward the surface. Unfor-tunately, there were no postfire observations of snowdepth, density, and timing to evaluate the influence ofpostfire snow, which plays a significant role through itsinsulating effects [Sturm et al., 2001; Stieglitz et al.,2003].[30] The thaw season was longer at K3 than at K2 after
the fire (the reverse was true before the burn), through aconsistently earlier freezing of K2 near-surface soil. K2experienced an earlier postfire thaw than K3, which alsooccurred in 2000. The observations were somewhat diffe-rent compared to those of Burn [1998], who found a longerthaw period after the fire, which was explained by a moreeffective heat transfer (depletion of surficial organic soil),increased energy absorption (earlier thaw and reducedalbedo), and increased heat capacity (wetter soils). Reducedorganic layer and increased soil moisture may be competingmechanisms during freezing of the near-surface soil. At K2,reduced thermal conductivity was the dominant factor overthe increased latent heat storage, resulting in relativelyearlier freezing at K2 than K3. To what degree K2 wasaffected by a larger ice volume in the near-surface soilsduring thaw cannot be determined through these observa-tions. Increased soil moisture favors a higher ice content,which can slow the descent of the thawing front [Woo,1986].[31] Possible contributors to the more moist postfire near-
surface include modified soil properties at 10 cm depth,thawing of the upper part of the transition zone, and reducedevapotranspiration. (1) Soil moisture was presented asrelative saturation of unfrozen water, which does not des-cribe the absolute change in total volume of water. Beforethe fire, a porous organic layer represented the soil at 10 cmdepth. After the fire, the observations were made in anorganic-rich mineral soil, with a relatively larger surfacearea per volume and different pore shape, resulting inhigher water-retaining efficiency. (2) The fire resulted indeepening of the active layer and partial thaw of the ice-richtransition zone. Owing to the enrichment of ice in thetransition zone relative to the active layer, a disturbance (fire)may be accompanied by increased moisture throughout thethawed soil profile. (3) The fire combusted vegetationbetween tussocks, resulting in reduced evapotranspirationcapacity. Mosses and lichens will probably require manydecades to regenerate [Racine, 2004], while the tussocksrecovered well within the 4-year post-fire observationperiod.
5.2. Boundary Layer and Radiation Efficiency
[32] The postfire soil warming at K2 caused increasedconvective heat loss from the surface to the atmosphere
during local noon throughout the summer, as shown by theRichardson number (Ri). A 40% and 43% reduction afterfire in Ri occurred in June and July, respectively, resulting instronger buoyancy forces. This change in Ri indicates anincreased partitioning of net radiation into sensible heat,seen at both burned spruce stands and tundra surfaces[Chambers et al., 2005]. At local scales, this may haveresulted in a warming of unburned areas from adjacentburned areas. With stronger buoyancy forces, a large burnarea can produce local to regional circulation patterns[Vidale et al., 1997], which include the potential to affectthe overall atmospheric heat and water budgets even abovethe atmospheric boundary layer [Eugster et al., 2000].[33] Postfire June-July surface roughness length (z0)
doubled. Prefire estimates of z0 (0.02 m) are in agreementwith studies made in northern Alaska tussock tundra of0.02 m [Hinzman et al., 1996]. Field observations support apost-fire increase in microscale surface topography, sincethe fire-affected landscape was composed of 15–25 cmhigh tussocks separated by predominantly bare soil, owingto an efficient burn between the tussocks. Chambers et al.[2005] found a decrease in fire-affected, sedge-dominatedtundra.[34] Radiation efficiency (Re) was relatively stable
throughout the observation period (66–69%), differing fromprevious studies. Directly after fire, boreal forest has showna decrease [Yoshikawa et al., 2002; Chambers et al., 2005;Liu et al., 2005], while Chambers et al. [2005] found a Re
increase at a tundra regime. The slight decrease in albedo atK2 might have been balanced by increased emitted long-wave radiation, which may be partly explained by a higheremissivity of the surface due to wetter conditions andrelatively bare ground. Further, the inconsistency in Re andz0 compared to the study of Chambers et al. [2005] may bedue to the different observation times after fire and thevegetation type and recovery. Observed increases in groundtemperatures, buoyancy forces, and wetter near-surface soilsare all indicators of changed partitioning in the net radiationamong sensible, latent, and ground heat fluxes.
6. Conclusions
[35] Short-term fire effects at a sub-Arctic tussock tundraarea included increased soil temperatures and near-surfacesoil moisture, altered energy partitioning through increasedground heat and sensible heat flux, changes in surfacecharacteristics such as increased roughness length andslightly reduced albedo. The soil warming after the firewas the combined result of weather and the thermal evolu-tion of the system induced by the fire. Reduction in theorganic layer was a dominating mechanism during near-surface freezing in fall, despite the increased latent heat ofwetter soil. The study shows the importance of postfireeffects in influencing the physical status of the tundraecosystem. Continuing long-term observations of the areawould better characterize both fire impacts and recovery, aswell as give insight to the future of tundra systems under awarming climate when fire frequency may increase.
[36] Acknowledgments. Financial support for this research was pro-vided through the National Science Foundation, grants OPP-03332964 andOPP-0328686. Any opinions, findings, conclusions, or recommendationsexpressed are those of the authors and do not necessarily reflect the views
F02S07 LILJEDAHL ET AL.: PHYSICAL FIRE EFFECTS AT A TUNDRA SITE
11 of 13
F02S07

of NSF. Mention of specific product names does not constitute endorsementby NSF. Ken Irving, Stefan Kooman, Crane Johnson, Matt Stone, KristinSusens, Andy Monaghan, Jeremy Kasper, and Robert Bolton provided fieldassistance. The authors are grateful to Claude Duguay for advice in remotesensing and the Alaska Fire Service for providing information. Tworeviewers and Associate Editor made many helpful suggestions thatimproved the paper.
ReferencesBraun, L. N. (1985), Simulation of snowmelt-runoff in lowland and loweralpine regions of Switzerland, Zuricher Geogr. Schr. 21, Geogr. Inst.Eidgenossische Technische Hochschule, Zurich, Switzerland.
Brown, J., K. M. Hinkel, and F. E. Nelson (2000), The circumpolar activelayer monitoring (CALM) program: Research designs and initial results,Polar Geogr., 24(3), 165–258.
Brown, R. J. E., and T. L. Pewe (1973), Distribution of permafrost inNorth America and its relationship to environment: A review, 1963–1971, paper presented at North American Contribution, Permafrost SecondInternational Conference, Natl. Acad. of Sci., Washington, D. C.
Burn, C. R. (1997), The response (1958–1997) of permafrost and near-surface ground temperatures to forest fire, Takhini River Valley, southernYukon Territory, Can. J. Earth Sci., 35, 184–199.
Burn, C. R. (1998), The active layer, Permafrost Periglacial Proc., 59,411–416.
Campbell Scientific Inc. (1996), Instruction Manual Q-7.1 Net Radiometer,Revision: 5/96, 12 pp., Logan, Utah.
Carlson, H. (1952), Calculation of depth of thaw in frozen ground, inFrost Action in Soils: A Symposium, Highway Res. Board Spec. Rep. 2,pp. 192–223, Natl. Res. Council, Washington, D. C.
Chambers, D. S., J. Beringer, T. J. Randerson, and S. F. Chapin III (2005),Fire effects on net-radiation and energy partitioning: Contrastingresponses of tundra and boreal forest ecosystems, J. Geophys. Res.,110, D09106, doi:10.1029/2004JD005299.
Eugster, W., et al. (2000), Land-atmosphere energy exchange in Arctictundra and boreal forest: Available data and feedbacks to climate, GlobalChange Biol., 6, 84–115.
Flannigan, M., I. Cambell, M. Wotton, P. R. Carcaillet, and Y. Bergeon(2001), Future changes in Canada’s boreal forest: Paleoecology resultsand general circulation model – regional climate model simulations,Can. J. For. Res., 31, 854–864.
Heginbottom, J. A. (1976), Some effects of a forest fire on the permafrostactive layer at Inuvik, N. W. T, Report 73-16, 29 pp., Task Force onNorthern Oil Dev., Ottawa, Can.
Hinzman, L. D., D. L. Kane, R. E. Gieck, and K. R. Everett (1991),Hydrologic and thermal properties of the active layer in the AlaskanArctic, Cold Regions Sci. Technol., 19, 95–110.
Hinzman, L. D., D. L. Kane, C. Benson, and K. R. Everett (1996), Energybalance and hydrological processes in an Arctic watershed, in EcologicalStudies: Analysis and Synthesis, vol. 120, edited by J. F. Reynolds andJ. D. Tenhunen, pp. 131–154, Springer, New York.
Hinzman, L. D., D. L. Kane, and K. Yoshikawa (2003), Soil moistureresponse to a changing climate in Arctic regions (extended abstract),Tohoku Geophys. J., 36(4), 369–373.
Houghton, J. T., L. G. M. Filho, B. A. Callandar, N. Harris, A. Kattenberg,and K. Maskell (1996), Climate change 1995, in Contribution of WorkingGroup 1 to the Second Assessment Report of the Intergovernmental Panelon Climate Change, Cambridge Univ. Press, New York.
Kade, A., V. E. Romanovsky, and D. A. Walker (2006), The n-factor ofnonsorted circles along a climate gradient in Arctic Alaska, PermafrostPeriglacial Proc., 17, 279–289.
Kane, D. L., L. D. Hinzman, M. Woo, and K. R. Everett (1992), Arctichydrology and climate change, inArctic Ecosystem in a ChangingClimate,pp. 35–57, Academic, San Diego, Calif.
Karunaratne, K. C., and C. Burn (2004), Relations between air and sur-face temperature in discontinuous permafrost terrain near Mayo, YukonTerritory, Can. J. Earth Sci., 41, 1437–1451.
Kasischke, E. S., and M. R. Turetsky (2006), Recent changes in the fireregime across the North American boreal region: Spatial and temporalpatterns of burning across Canada and Alaska, Geophys. Res. Lett., 111,L09703, doi:10.1029/2006GL025677.
Kasischke, E. S., N. L. Christensen Jr., and B. J. Stocks (1995), Fire globalwarming, and the carbon balance of boreal forests, Ecol. Appl., 5, 437–451.
Kasischke, E. S., D. Williams, and B. Donald (2002), Analysis of thepatterns of large fires in the boreal forest region of Alaska, Int. J. Wild-land Fire, 11, 14–131.
Klene, A. E., F. E. Nelson, and N. I. Shiklomanov (2001), The n-factorin natural landscapes: Variability of air and soil-surface temperatures,Kuparuk River basin, Alaska, U.S.A., Arct. Antarct. Alpine Res., 33(2),140–148.
Liu, H., J. T. Randerson, J. Lindfors, and S. F. Chapin III (2005), Changesin the surface energy budget after fire in boreal ecosystems of interiorAlaska: An annual perspective, J. Geophys. Res., 110, D13101,doi:10.1029/2004JD005158.
Lynch, J. A., J. S. Clark, N. H. Bigelow, M. E. Edwards, and B. P. Finney(2002), Geographic and temporal variations in fire history in boreal eco-systems of Alaska, J. Geophys. Res., 107, 8152, doi:10.1029/2001JD000332. [printed 108(D1), 2003]
Mackay, R. J. (1995), Active layer changes (1968–1993) following theforest-tundra fire near Inuvik, N.W.T, Canada, Arct. Alpine Res., 27,323–336.
Manabe, S., R. J. Stouffer, M. J. Spelman, and K. Bryan (1991), Transientresponses of a coupled ocean-atmosphere model to gradual changes ofatmospheric CO2. part I: Annual mean response, J. Climate, 4(8), 785–818.
McCoy, V. M., and C. R. Burn (2005), Potential alteration by climatechange of the forest-fire regime in the boreal forest of central YukonTerritory, Arctic, 58, 276–285.
Oke, T. R. (1987), Boundary Layer Climates, 2nd ed., 435 pp., Routledge,New York.
Racine, C. H. (2004), Tundra fire effects on soils and three plant commu-nities along a hillslope gradient in the Seward Peninsula, Alaska, Arctic,34(1), 71–84.
Racine, C. H., L. A. Johnson, and L. A. Viereck (1987), Patterns of vegeta-tion recovery after tundra fires in Northwestern Alaska, U.S.A, Arct.Alpine Res., 19(4), 461–469.
Romanovsky, V. E., and T. E. Osterkamp (1995), Interannual variations ofthe thermal regime of the active layer and near-surface permafrost inNorthern Alaska, Permafrost Periglacial Proc., 6, 313–335.
Rouse, W. R., and P. F. Mills (1977), A classification of fire effects on themicroclimate of forests and tundra ecosystems, Final Rep. R71–19/2,21 pp., Minister of Indian and Northern Affairs, Ottawa, Can.
Rupp, S. T., S. F. Chapin III, and A. M. Starfield (2000), Response ofsubarctic vegetation to transient climatic change on the Seward Peninsulain north-west Alaska, Global Change Biol., 6, 541–555.
Shiklomanov, N. I., and F. E. Nelson (2002), Active layer mapping atregional scales: A 13-year spatial time series for the Kuparuk region,North-Central Alaska, Permafrost Periglacial Proc., 13, 219–230.
Shur, Y., K. M. Hinkel, and F. E. Nelson (2005), The transient layer:Implications for geocryology and climate-change science, PermafrostPeriglacial Proc., 16, 5–17.
Stieglitz, M., S. J. Dery, V. E. Romanovsky, and T. E. Osterkamp (2003),The role of snow cover in the warming of arctic permafrost, Geophys.Res. Lett., 30(13), 1721, doi:10.1029/2003GL017337.
Stocks, B. J., et al. (1998), Climate change and forest fire potential inRussian and Canadian boreal forests, Climate Change, 38, 1–13.
Stocks, B. J., et al. (2002), Large forest fires in Canada, 1959–1997,J. Geophys. Res., 107, 8149, doi:10.1029/2001JD000484. [printed108(D1), 2003]
Sturm, M., J. P. McFadden, G. E. Liston, S. F. Chapin III, and C. H. Racine(2001), Snow-shrub interactions in arctic tundra: A hypothesis with cli-mate implications, J. Climate, 14, 336–344.
Sturm, M., et al. (2005), Seward Peninsula data and documentation 2CD-ROM set: Arctic transitions in the land atmosphere system (ATLAS)project, produced by D. Stott, G. Stossmeister, and J. A. Moore, NSF Off.of Polar Progr., Boulder, Colo.
Swanson, D. K. (1996), Susceptibility of permafrost soils to deep thaw afterforest fires in Interor Alaska, U.S.A., and some ecologic implications,Arct. Alpine Res., 28(2), 217–227.
Thayer-Snyder, C. R. (2002), ATLAS vegetation studies: Seward Peninsula,Alaska, 2000, ARCCS-ATLAS-AGC data report, Univ. of Alaska,Fairbanks, Alaska.
Valeo, C., K. Beaty, and R. Hesslein (2003), Influence of forest fires onclimate change studies in the central boreal forest of Canada, J. Hydrol.,280, 91–104.
Vidale, P. I., R. A. Pielke, L. T. Steyaert, and A. Barr (1997), Case studymodeling of turbulent and mesoscale fluxes over the BOREAS region,J. Geophys. Res., 102(D24), 29,167–29,188.
Viereck, L. A. (1982), Effects of fire and firelines on active layer thicknessand soil temperatures in Interior Alaska, in Proceedings of the FourthCanadian Permafrost Conference, Calgary, The Roger J. E. Brown Mem-orial Volume, 20124, pp. 123–135, Natl. Res. Council of Can., Alberta,Can.
Viereck, L. A., J. Foote, C. T. Dyrness, K. Van Cleve, D. Kane, andR. Seiveret (1979), Preliminary results of experimental fires in the blackspruce type of Interior Alaska, Res. Not. PNW-332, 27 pp., Pacific North-west and Range Exp. Station, U. S. Dep. of Agric., Portland, Or.
Vorosmarty, C. J., L. D. Hinzman, B. J. Peterson, D. H. Bromwich, L. C.Hamilton, J. Morison, V. E. Romanovsky, M. Sturm, and R. S. Webb(2001), The hydrologic cycle and its role in Arctic and global envir-
F02S07 LILJEDAHL ET AL.: PHYSICAL FIRE EFFECTS AT A TUNDRA SITE
12 of 13
F02S07

onmental change: A rationale and strategy for synthesis study, report,84 pp., Arct. Res. Consortium of the U.S., Fairbanks, Alaska.
Waelbroeck, C., and P. Monfray (1997), The impact of permafrost thawingon the carbon dynamics of tundra, Geophys. Res. Lett., 24(3), 229–232.
Watson, R. T., M. Zinyowera, and R. H. Moss (1998), The Regional Im-pacts of a Climate Change: An Assessment of Vulnerability, CambridgeUniversity Press, Cambridge, U.K.
Woo, M. K. (1986), Permafrost hydrology in North America, Atmos.Ocean, 24, 201–234.
Yoshikawa, K., W. R. Bolton, V. E. Romanovsky, M. Fukuda, and L. D.Hinzman (2002), Impacts of wildfire on the permafrost in the boreal
forests of Interior Alaska, J. Geophys. Res., 107, 8148, doi:10.1029/2001JD000438. [printed 108(D1), 2003]
�����������������������R. Busey, L. Hinzman, and A. Liljedahl, International Arctic Research
Center, University of Alaska Fairbanks, P. O. Box 757340, Fairbanks,AK 99775-7340, USA. ([email protected]; [email protected]; [email protected])K. Yoshikawa, Water and Environmental Research Center, Institute of
Northern Engineering, University of Alaska Fairbanks, P. O. Box 755860,Fairbanks, AK 99775-55860, USA. ([email protected])
F02S07 LILJEDAHL ET AL.: PHYSICAL FIRE EFFECTS AT A TUNDRA SITE
13 of 13
F02S07