MapTEACH - Alaska Native Knowledge Network
210
MapTEACH PLACE-BASED GEOSPATIAL LEARNING AND APPLICATIONS IN ALASKA Mapping Technology Experiences with Alaska's Cultural Heritage www.mapteach.org Place-Based Geospatial Education for Alaska Teacher and Student Guide Grades 6-12
-
Upload
khangminh22 -
Category
Documents
-
view
1 -
download
0
Transcript of MapTEACH - Alaska Native Knowledge Network

MapTEACHPLACE-BASED GEOSPATIAL LEARNING
AND APPLICATIONS IN ALASKA
Mapping Technology Experiences with Alaska's Cultural Heritage
www.mapteach.org
Place-Based Geospatial Education for AlaskaTeacher and Student GuideGrades 6-12
MapTEACH: PLACE-BASED GEOSPATIAL LEARNING AND APPLICATIONS IN ALASKA Place Based Geospatial Education for Alaska Teacher and Student Guide Grades 6-12 De Anne Stevens Alaska Division of Geological & Geophysical Surveys Alaska Department of Natural Resources Sidney Stephens UA Geography Program School of Natural Resources and Agricultural Sciences University of Alaska-Fairbanks Patty Burns GeoData Center, Geophysical Institute University of Alaska-Fairbanks Sam Batzli Space Science and Engineering Center University of Wisconsin-Madison Timothy Olsen Space Science and Engineering Center University of Wisconsin-Madison
2008
With assistance from: Emma Walton - project evaluator
Kim Streeter and Bil Aldrich - MapTEACH interns Jackie Fenno - PI Emeritus
MapTEACH Advisory Board:
Andy Angaiak, Ray Barnhardt, Neal Brown, Shirley Holloway, Martin Jeffries, June McAtee and Elena Sparrow
Funding by: The National Science Foundation ITEST Program
(Grant Numbers ESI-0322980, ESI-0322958 and ESI-0323191) and
UA Geography Program, University of Alaska-Fairbanks GeoData Center, Geophysical Institute, University of Alaska-Fairbanks

MapTEACH thanks the following teachers for their piloting, review, and feedback:
Bonnie Hauschka, Cantwell School, Cantwell Chuck Hugny, Nenana High School and Living Center, Nenana Debbie Chalmers, Mendenhall River Community School, Juneau Denis Gardella, Top of the Kuskoswim School, Nicholai Diane "Molly" Hale, Hooper Bay School, Hooper Bay Frida Shroyer, Hutchison High School, Fairbanks Geoff Buerger, Anderson School, Anderson Gladys Abraham, Hooper Bay School, Hooper Bay John Carlson, Fairbanks North Star Borough School District Katie Kennedy, University of Alaska, Geography Program, Fairbanks Michael Warren, Central Middle School, Anchorage Olga Skinner, Effie Kokrine Charter School, Fairbanks Sheryl Meierotto, Effie Kokrine Charter School, Fairbanks
MapTEACH also thanks the following for their involvement and cooperation:
Albert Kowchee Alaska Humanities Forum Barb Pungowiyi Alaska Native Science and Engineering Program (ANSEP) Bergman Silas Barnette Magnet School Carl Aschenfelter Bering Strait Native Association Eleanor Laughlin Bering Strait School District Elizabeth Marino Cultural Heritage Education Center Elsie Titus Effie Kokrine Charter School Geraldine Charlie Eskimo Heritage Program Gilbert Ketzler Gaalee’ya Spirit Camp Howard Luke Geographic Information Network of Alaska (GINA) Hugo Lindfors Kawerak Elders Advisory Committee Irene Anderson Kawerak, Inc. Jacob Ahwinona Lighthouse Community Christian School Jason Mayrand Minto School Jeff Selvey Native Knowledge Network John Wehde Nenana Living Center Josephine Riley Nenana Public Schools Josh Wisniewski Nenana Senior Center Ken Charlie Nenana Tribal Council Lige Charlie Nenana Wellness Coalition Lincoln Trigg Nome-Beltz High School Mamie Maloney Northwest Alaska Career and Technical Center (NACTEC) Margaret Saunders Northwest Arctic Borough School District Mark Ebels Old Minto Culture Camp Mary Alexander Sitnasuak Native Corporation Matt Ganley XYZ Club Senior Center Matt Gilbert The communities of Fairbanks, Nome, Nenana, and Minto Moses Paul And many others… Neal Charlie Phoebe Omilak Robert Charlie Ruth Emmons Sam Demientieff Tom Heinrichs Vernel Titus Wes Alexander
Very special thanks to all the wonderful students we have worked with in
developing MapTEACH!

TABLE OF CONTENTS
MapTEACH Curriculum Overview. ........................................................... i
Lesson Summaries by Module.. .............................................................. iii
Sample Lesson Groupings...................................................................... vii
Place Names and Landmarks (PNL)
PNL 1 Introducing the Unit and Mental Maps ..................................... 1
PNL 2 Simon Paneak's Sketch Maps .................................................. 5
PNL 3 Working with Local Experts – Mental Maps............................... 21
PNL 4 What's in a Name? ................................................................. 25
PNL 5 Picking Points off a Paper Map ................................................ 39
PNL 6 Field Trip Guide ..................................................................... 51
Remote Sensing/Geology (RSG)
RSG 1 Air Photo Interpretation.......................................................... 57
RSG 2 Seeing in Stereo and Route Finding ......................................... 65
RSG 3 Evaluating Erosion.................................................................. 109
RSG 4 Change Over Time ................................................................. 115
Global Positioning System (GPS)
GPS 1 Introduction to GPS with Geocaching....................................... 125
GPS 2 Field Data Collection for GPS Data and Digital Photo Documentation ............................................................. 137
GPS 3 Using Your Own Field Trip Data............................................... 145
GPS 4 Hotlinking to a Field Trip Data Document ................................. 173
GPS 5 Using a GPS to Collect Track Logs ........................................... 187

Geographic Information Systems (GIS)
GIS 1 Many Layers Make a Map........................................................ 213
GIS 2 Introduction to GIS using AEJEE.............................................. 215
GIS 3 Working with GIS Data: View, Label, Measure and Indentify...... 237
GIS 4 Maps with Raster Images I: Statewide Shaded Relief ................ 257
GIS 5 Maps with Raster Images II: Local Shaded Reflief Base Map...... 269
GIS 6 Maps with Raster Images III: Satellite Imagery ........................ 283
GIS 7 Community GIS: Geologic Hazards .......................................... 295
GIS 8 Community GIS: Natural Resources ......................................... 309
GIS 9 Community GIS: Land Management......................................... 319
GIS 10 “Good Map - Bad Map” ........................................................... 335
GIS 11 Community GIS: Map Layouts ................................................. 341
GIS 12 Adding Coordinate Locations into a GIS ................................... 359
GIS 13 Hotlinking.............................................................................. 373
GIS 14 Change Over Time: Shorefast Sea Ice...................................... 381
Technical Appendices
A. Preparing Alaska Base Map Imagery for Local Mapping Projects ........ 395
B. Preparing Raster Imagery in ArcGIS for AEJEE ................................ 403
Digital versions of this Teacher and Student Guide, as well as additional maps, PowerPoint Presentations, Software, and Data are available on DVD or online
from MapTEACH at:
www.mapteach.org

i
MapTEACH: PLACE-BASED GEOSPATIAL LEARNING AND APPLICATIONS IN ALASKA
MapTEACH (Mapping Technology Experiences with Alaska’s Cultural Heritage) is an educational curriculum for middle and high school students designed to help them both (1) understand the physical and cultural features of their environment, and (2) use mapping technologies to enhance and portray that new understanding. As such, it emphasizes the integration of three focus areas: geoscience, local landscape knowledge, and geographic information science (GPS, GIS and remotely sensed imagery). MapTEACH gives Alaskan students the opportunity to make a connection between traditional ways of viewing the landscape, scientific ways of making observations about the landscape, and the process of using cutting-edge information technologies to gather and disseminate information about the landscape. At its core, this curriculum is place-based and interdisciplinary in nature, and seeks to connect students, teachers, community members and scientists in an exploration of the local landscape from multiple perspectives. Lessons are organized into the following sections for ease of use: Section 1: Place Names and Landmarks These lessons seek to answer the question “How do you know where you are?” by grounding students in an appreciation of their own mental maps and then expanding this to include understanding and documentation of the place names and landscape knowledge of local experts. This work is based on the belief that there are many ways to “know” where you are and that each way of knowing contributes to our overall understanding of the landscape. Section 2: Remote Sensing and Geology These hands-on lessons introduce students to remotely sensed imagery by exploring local air photo imagery, stereo pair photographs and topographic maps and by using these maps and imagery to evaluate river erosion and change over time. These lessons are not only interesting and relevant in their own right, but provide a solid introduction to the imagery used in several of the GIS lessons. Section 3: Global Positioning System These lessons guide students through the basic uses of handheld Global Positioning System (GPS) units by finding and placing geocaches, documenting waypoints, and downloading location information into a computer in order to create a map of a place or a journey. Section 4: Geographic Information Systems These lessons enable students to use GIS mapping technology to enhance and portray their understanding of the world around them by: (1) exploring the fundamental concept that maps are made of layers of data and a computer

ii
allows us to stack these layers in many different ways; and (2) manipulating existing data layers and adding their own data to generate original maps of personal, cultural or scientific interest. As can be seen in Tables 1 – 4 below, each section has a coherent set of goals and, with a few exceptions, lessons in each section are sequential so that they can be worked through in part or in whole in the order presented. In practice, however, the lessons are intended to be used in a variety of combinations, mixing and matching lessons from several sections to achieve desired learning outcomes and timeframes. Table 5 demonstrates how different elements of this curriculum might be adapted to suit unique classroom needs by describing several potential lesson sequences. Several of the lessons included in the MapTEACH curriculum involve making digital maps using GPS and other data collected locally by students. Satellite imagery can be a useful and informative base map layer upon which students can display their own data. It is not feasible for MapTEACH to be able to anticipate every possible area that any given student project would need satellite base map data for, therefore we have developed two procedures so teachers (or advanced students) can generate their own image layers for use in their local-area digital mapping projects. These procedures can be found in the Appendix. We expect and hope that as you become more familiar with this curriculum, you will find new ways to use and adapt these lessons and make them your own. We hope you will share these adaptations with us and also let us know what we might do next to make this curriculum more responsive to your needs.

iii
Table 1 – Place Names and Landmarks Lessons
Lesson Name Lesson Summary PNL 1 - Mental Maps
This activity introduces the essential question for the unit: "How do we know where we are?" and sets the stage for the unit through a mental map activity and class discussion.
PNL 2 - Simon Paneak Sketch Maps
Students examine and discuss the sketch maps and life story of Simon Paneak, a Nunamiut hunter from Anaktuvuk Pass, as an example of the extensive landscape knowledge often held by mature Alaska Native hunters and travelers.
PNL 3 - Working with Local Experts
Students become more familiar with local landmarks, place names and stories as they listen to and work with a local landscape expert.
PNL 4 - What's in a Name?
Students study an Inupiaq place names map of the John River area, read the accompanying stories, discuss their significance and then brainstorm a list of place names for their own area.
PNL 5 - Picking Points off a Paper Map
Students identify place names or landmarks on a topographic map and use TopoZone, a web-based mapping program, to determine the latitude and longitude of these sites. These coordinate locations can then be used in digital map-making or way-finding with a GPS.
PNL 6 - Place Names Field Trip
Students complete classroom preparation and go on a field trip to document local place names and landmarks.

iv
Table 2 – Remote Sensing/Geology Lessons
Lesson Name Lesson Summary RSG 1 – Air Photo Interpretation
This activity introduces students to color infrared (CIR) air photo interpretation. Students examine a CIR air photo of their community, identify prominent features and interpret what those features might be through use of an air photo key.
RSG 2 - Seeing in Stereo and Route Finding
At stations set up around the room, students view and interpret stereo pair air photos in three dimensions (3-D), compare them with topographic maps of the same area and determine which route is "best." Students also discuss the advantages and disadvantages of each image with regard to finding your way.
RSG 3 – Evaluating Erosion
Students examine several air photos of Alaskan rivers and identify areas of erosion and deposition.
RSG 4 – Change Over Time
Students study a chronological series of images and maps of Fairbanks or Nenana, looking for evidence of changes over time
Table 3 – Global Positioning System Lessons
Lesson Name Lesson Summary GPS 1 – Introduction to GIS with Geocaching
Students learn how to use GPS units to perform a variety of tasks. They learn how to: adjust the settings of the units; enter and mark waypoint information; find geocaches; and place a geocache.
GPS 2 – Field Data Collection for GPS Data and Digital Photo Documentation
Students go on a field trip to collect geospatial data and other useful information to document sites of interest they encounter.
GPS 3 – Using Your Own Field Trip Data
Students make GIS maps using data they have collected on a local field trip with their GPS units and digital cameras. They download their photos and GPS waypoints into a CSV file and then make a map of their sites that includes photos they took on their field trip.
GPS 4 – Hotlinking to a Field Trip Data Document
Students create Word documents describing their field trip sites and then learn how to hotlink the points in a GIS project to these Word documents thus creating an interactive map.
GPS 5 – Using Track Log Data Students make GIS maps using track log /trail data they have collected on a local field trip with their GPS units and digital cameras.

v
Table 4 – Geographic Information Systems Lessons
Lesson Name Lesson Summary GIS 1 – Many Layers Make a Map
Students brainstorm a list of information portrayed on topographic maps sort that information into categories or themes and then trace a few layers onto mylar in imitation of GIS layers/themes.
GIS 2 – Introduction to GIS Using AEJEE
Students are introduced to the use of GIS as a way to make customized maps. Students learn to: add layers, set projection, modify the appearance of the map and label features on it.
GIS 3 – Working with GIS Data: View, Label, Measure and Identify
Students learn some of the key qualities of GIS that make it more dynamic and powerful than paper maps. They learn new ways to view the information held in a GIS, and begin asking questions and solving problems.
GIS 4 – Maps with Raster Images I: Statewide Shaded Relief
Students work with a shaded relief image of Alaska and answer questions about what they can observe.
GIS 5 – Maps with Raster Images II: Local Shaded Relief Base Map
Students use a shaded relief raster layer and several vector layers to make a base map, centered on their community. The base map they construct during this exercise will be used as a starting point for several future GIS lessons.
GIS 6 – Maps with Raster Images III: Satellite Imagery
Students use GIS to load and view true-color and enhanced satellite images of Alaska. Based on their knowledge of Alaskan geography and recent image interpretation experiences, they interpret features found in the satellite images.
GIS 7 – Community GIS: Geologic Hazards
By choosing an Alaskan community as a starting point, students investigate and map geologic hazards that may affect that community directly. In turn, students begin to see how the geology and climate of a place sets the stage for specific hazardous events.
GIS 8 – Community GIS: Natural Resources
Geological resources often play a critical role in the economies of Alaskan communities. During this lesson, students investigate the distribution of resources regionally and locally. The maps students make can help them explore current and potential resource use by their project communities.
GIS 9 – Community GIS: Land Management
Who decides what is done with land in Alaska? Using GIS tools and information, the students investigate land ownership and management units and the distribution of resources beginning with their project community and expanding outward. The maps students make can help them explore current and potential resource use by their project communities.

vi
GIS 10 – Good Map – Bad Map The teacher reviews basic cartographic guidelines, and then shows an example AEJEE map that is cartographically incorrect, incomplete, and poorly designed. Students critique the map. A correct, complete, and attractively designed map is then reviewed for comparison.
GIS 11 – Community GIS: Map Layouts
Beginning with the base map created in GIS 7 -Community GIS: Geologic Hazards, students make map layouts that can be saved and printed as paper maps and used for reports or presentations.
GIS 12 – Adding Coordinate Locations into a GIS
Students use Serpentine Hot Springs on the Seward Peninsula as an example site to learn how to manually add coordinate data into a GIS project by creating a comma separated values file (.csv) and importing it into an AEJEE project
GIS 13 - Hotlinking Students modify the Serpentine Hot Springs csv file created in GIS 12 as an example site to learn how to hotlink data in a GIS project to a website about the hot springs, thus creating an interactive map.
GIS 14 – Change Over Time – Shorefast Sea Ice
Students use GIS to analyze changes in the extent of shorefast sea ice. They extract information from multi-year and single year data and look for trends over time.

vii
Table 5 - Sample MapTEACH Lesson Groupings
Goal
Tim
e (H
ours
)
Fiel
d W
ork
Equipment
Lessons
Brief introduction to Native place names
3 No None PNL 1 – Mental Maps PNL 2 – Simon Paneak Sketch Maps PNL 4 – What’s in a Name?
Brief introduction to GPS receivers
3 Yes • GPS Receivers
• Digital Cameras
GPS 1 – Introduction to GPS with Geocaching
GPS 2 – Field Data Collection Using a GPS and Digital Camera
Brief introduction to GIS
3 No Computers* GIS 1 – Many Layers Make a Map GIS 2 – Introduction to GIS using AEJEE GIS 3 – Working with GIS Data
Landscape change over time
4 No Computers* RSG 1 – Air Photo Interpretation RSG 4 – Change Over Time GIS 2 – Introduction to GIS using AEJEE GIS 14 – Change Over Time – Shorefast
Ice
Using GIS to create local maps
8+ Yes • Computers** • GPS
Receivers • Digital
Cameras
GIS 1 – Many Layers Make a Map GIS 2 - Introduction to GIS using AEJEE GPS 1 – Introduction to GPS with
Geocaching GPS 2 – Field Data Collection Using a
GPS and Digital Camera GIS 10 – Good Map/Bad Map GPS 3 – Using Your Own Field Trip Data GPS 4 – Hotlinking to a Field Trip
Document
Using GIS for community planning
10 No Computers* GIS 1 – Many Layers Make a Map GIS 2 - Introduction to GIS using AEJEE GIS 3 – Working with GIS Data GIS 4 – Statewide Shaded Relief GIS 5 – Local Shaded Relief GIS 6 – Satellite Images GIS 7 – Geologic Hazards GIS 8 – Natural Resources GIS 9 – Land Management GIS 10 – Good Map/Bad Map GIS 11 – Map Layouts
* Loaded with AEJEE software and data ** Loaded with AEJEE software and GPS Babel

viii
Goal
Tim
e (H
ours
)
Fiel
d W
ork
Equipment
Lessons
Using GIS to create local place names maps
15 Yes •Computers** • GPS
Receivers • Digital
Cameras
PNL 1 – Mental Maps PNL 2 – Simon Paneak Sketch Maps PNL 3 – Working with Local Experts PNL 4 – What’s in a Name? GPS 1 – Introduction to GPS with
Geocaching GPS 2 – Field Data Collection Using a
GPS and Digital Camera GIS 1 – Many Layers Make a Map GIS 2 – Introduction to GIS using AEJEE PNL 6 – Field Trip Guide GIS 10 – Good Map, Bad Map GPS 3 – Using Your Own Field Trip Data GPS 4 – Hotlinking to a Field Trip
Document

MapTEACH:
Geographic Information Systems (GIS)

www.mapteach.org Geographic Information Systems Lesson 1 Many Layers Make a Map
Page 213
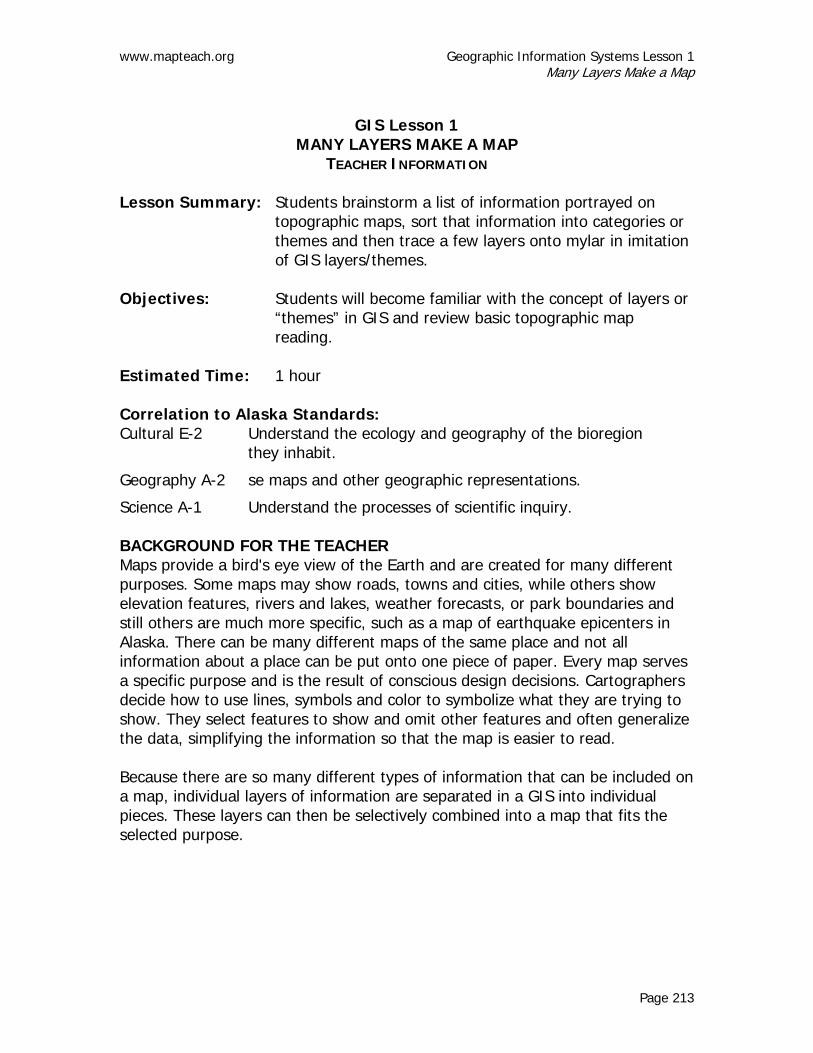
GIS Lesson 1
MANY LAYERS MAKE A MAP TEACHER INFORMATION
Lesson Summary: Students brainstorm a list of information portrayed on
topographic maps, sort that information into categories or themes and then trace a few layers onto mylar in imitation of GIS layers/themes.
Objectives: Students will become familiar with the concept of layers or
“themes” in GIS and review basic topographic map reading.
Estimated Time: 1 hour Correlation to Alaska Standards: Cultural E-2 Understand the ecology and geography of the bioregion
they inhabit.
Geography A-2 se maps and other geographic representations.
Science A-1 Understand the processes of scientific inquiry. BACKGROUND FOR THE TEACHER Maps provide a bird's eye view of the Earth and are created for many different purposes. Some maps may show roads, towns and cities, while others show elevation features, rivers and lakes, weather forecasts, or park boundaries and still others are much more specific, such as a map of earthquake epicenters in Alaska. There can be many different maps of the same place and not all information about a place can be put onto one piece of paper. Every map serves a specific purpose and is the result of conscious design decisions. Cartographers decide how to use lines, symbols and color to symbolize what they are trying to show. They select features to show and omit other features and often generalize the data, simplifying the information so that the map is easier to read. Because there are so many different types of information that can be included on a map, individual layers of information are separated in a GIS into individual pieces. These layers can then be selectively combined into a map that fits the selected purpose.
Geographic Information Systems Lesson 1 www.mapteach.org Many Layers Make a Map
Page 214
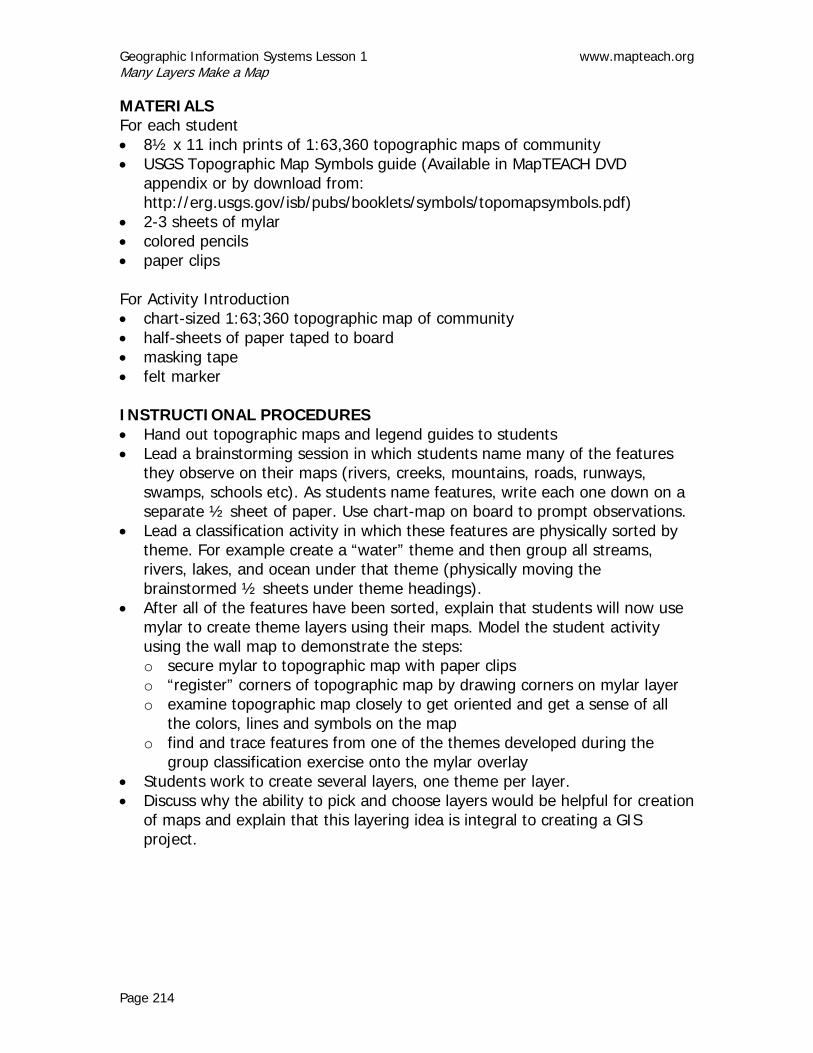
MATERIALS For each student • 8½ x 11 inch prints of 1:63,360 topographic maps of community • USGS Topographic Map Symbols guide (Available in MapTEACH DVD
appendix or by download from: http://erg.usgs.gov/isb/pubs/booklets/symbols/topomapsymbols.pdf)
• 2-3 sheets of mylar • colored pencils • paper clips For Activity Introduction • chart-sized 1:63;360 topographic map of community • half-sheets of paper taped to board • masking tape • felt marker INSTRUCTIONAL PROCEDURES • Hand out topographic maps and legend guides to students • Lead a brainstorming session in which students name many of the features
they observe on their maps (rivers, creeks, mountains, roads, runways, swamps, schools etc). As students name features, write each one down on a separate ½ sheet of paper. Use chart-map on board to prompt observations.
• Lead a classification activity in which these features are physically sorted by theme. For example create a “water” theme and then group all streams, rivers, lakes, and ocean under that theme (physically moving the brainstormed ½ sheets under theme headings).
• After all of the features have been sorted, explain that students will now use mylar to create theme layers using their maps. Model the student activity using the wall map to demonstrate the steps: o secure mylar to topographic map with paper clips o “register” corners of topographic map by drawing corners on mylar layer o examine topographic map closely to get oriented and get a sense of all
the colors, lines and symbols on the map o find and trace features from one of the themes developed during the
group classification exercise onto the mylar overlay • Students work to create several layers, one theme per layer. • Discuss why the ability to pick and choose layers would be helpful for creation
of maps and explain that this layering idea is integral to creating a GIS project.
www.mapteach.org Geographic Information Systems Lesson 2 Introduction to GIS Using AEJEE
Page 215
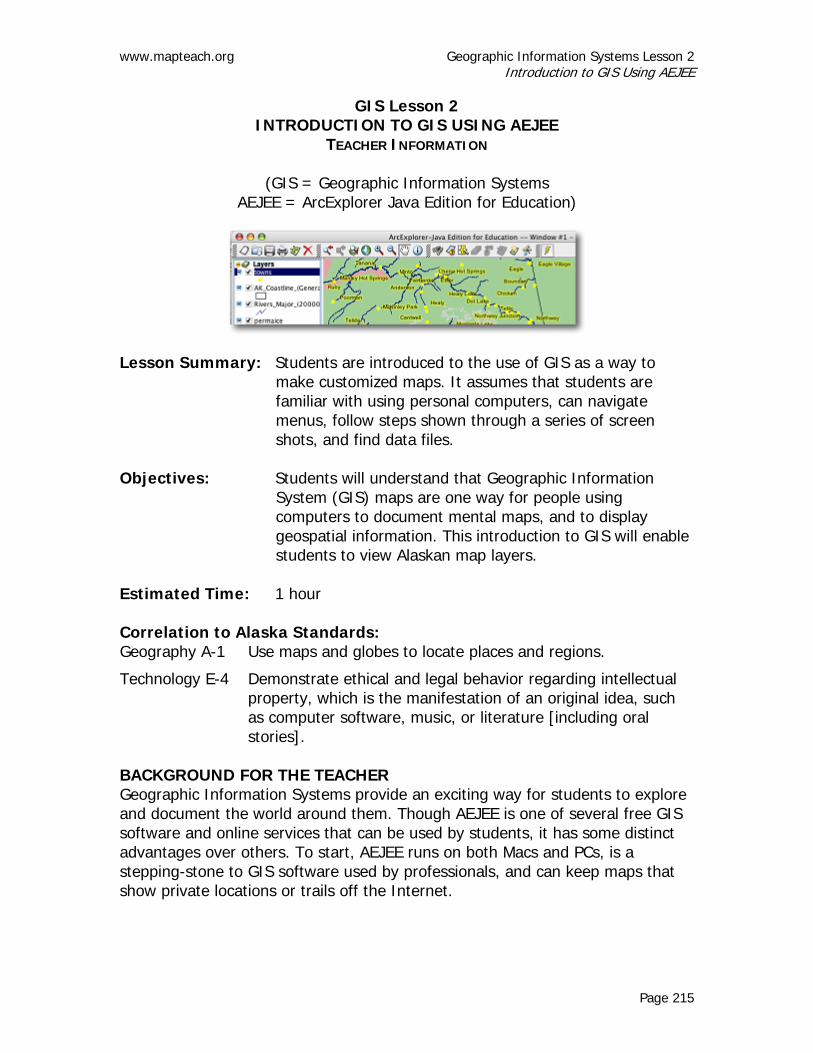
GIS Lesson 2 INTRODUCTION TO GIS USING AEJEE
TEACHER INFORMATION
(GIS = Geographic Information Systems AEJEE = ArcExplorer Java Edition for Education)
Lesson Summary: Students are introduced to the use of GIS as a way to
make customized maps. It assumes that students are familiar with using personal computers, can navigate menus, follow steps shown through a series of screen shots, and find data files.
Objectives: Students will understand that Geographic Information
System (GIS) maps are one way for people using computers to document mental maps, and to display geospatial information. This introduction to GIS will enable students to view Alaskan map layers.
Estimated Time: 1 hour Correlation to Alaska Standards: Geography A-1 Use maps and globes to locate places and regions.
Technology E-4 Demonstrate ethical and legal behavior regarding intellectual property, which is the manifestation of an original idea, such as computer software, music, or literature [including oral stories].
BACKGROUND FOR THE TEACHER Geographic Information Systems provide an exciting way for students to explore and document the world around them. Though AEJEE is one of several free GIS software and online services that can be used by students, it has some distinct advantages over others. To start, AEJEE runs on both Macs and PCs, is a stepping-stone to GIS software used by professionals, and can keep maps that show private locations or trails off the Internet.

Geographic Information Systems Lesson 2 www.mapteach.org Introduction to GIS Using AEJEE
Page 216
Maps provide a graphic way to help tell stories about the land and about important places. These stories can come from traditional elders, local sourdoughs, geoscientists, other experts, and the students themselves. MATERIALS • Computers - one for each student is best or two students can share. The
computers must meet the following specifications to run AEJEE: o Macintosh: MacOS 10.3 or above, 100 MB hard drive space, Internet
connection; recommend G4 or faster processor and more than 64 MB RAM. We recommend: Mac OS 10.4 or above, 500 MB hard drive space (400
MB for data). o Windows: Win2000 or WinXP, 100 MB (plus 400 MB for data) hard drive
space, Internet connection; recommend Pentium III or faster processor and more than 64 MB RAM
• AEJEE software can be provided by MapTEACH on a CD delivered to you, or you can download the correct version from our website at http://www.mapteach.org
• MapTEACH GIS data can also be sent on a CD or downloaded from our website at http://www.mapteach.org • Copies of student lesson activity-directions • USB flash drive (optional), a.k.a. thumb drive, with 1 GB+ RAM, for storing
and transferring files
INSTRUCTIONAL PROCEDURES
Getting Ready The preparations required to set up GIS experiences for students are both substantial and rewarding. The first critical step is to obtain computer administrative privileges and/or install software and data many days in advance. Being assured that computers, applications and networks are working well allows you to focus on more rewarding tasks. And once the resources are set up, students and teacher have powerful tools at hand for learning. • Check and maintain student computers so they are working well: update
operating systems and software, clean out temporary and/or unnecessary files or applications.
• Check for, and uninstall any earlier versions of AEJEE. • Install the current version of AEJEE (2.3 as of this writing) using the
instructions below. • Transfer GIS data into each computer by copying the folder
Data_MapTEACH_WGS84 into the /ESRI/AEJEE/Data folder. If your

www.mapteach.org Geographic Information Systems Lesson 2 Introduction to GIS Using AEJEE
Page 217
computers are not part of a fast network, a USB ‘thumb drive’ can store and copy MapTEACH data.
• Set up a user account called “student” that does not have administrative privileges.
• Make a new folder for the “student” user named MapTEACH_Work as users/student/MapTEACH_Work.
• Prepare materials for the lesson and try out all the activities well before the students work through them.
How to Download and Install AEJEE: ArcExplorer Java Edition for Education for Macs or PCs AEJEE GIS software is developed by ESRI for educational use. Download the latest version of the software from ESRI per the instructions below, or contact us via www.mapteach.org and we will mail you a copy on a CD. The following instructions for installation are copied from ESRI’s “Intro to AEJEE” PDF document. We thank ESRI for their generous support. Installing ArcExplorer—Java Edition for Education AEJEE is a stand-alone package of software that includes a Java Runtime Engine in the installation. AEJEE is a free tool designed for use particularly in education environments. It is meant to be installed and used on individual computers rather than from a server. 1. Check the system specifications a. Windows: Win2000 or WinXP, 100 MB hard drive space, Internet
connection; recommend Pentium III or faster processor and more than 64 MB RAM
b. Macintosh: MacOS 10.3 or above, 100 MB hard drive space, Internet connection; recommend G4 or faster processor and more than 64 MB RAM
c. On both platforms, AEJEE will install its own Java Runtime Engine. d. See also www.esri.com/software/mojava/about/sys-reqs.html for fullest
detail. 2. Before installing a new version of AEJEE, uninstall any previous
version. Navigate to the software location (typically [hard drive]/ESRI/AEJEE), open the folder UNINSTALL_AEJEE, and engage the uninstaller. The uninstaller will delete only the core files, not any user-installed files such as data or projects.
3. Download AEJEE from www.esri.com/software/arcexplorer/download-education.html Choose Windows or Macintosh. Use your file compression software to uncompress the downloaded installer, placing it in a folder where you can

Geographic Information Systems Lesson 2 www.mapteach.org Introduction to GIS Using AEJEE
Page 218
find it. To install, you must be logged in to the computer with administrative privileges.
4. WINDOWS INSTALLATION a. Using Windows Explorer, navigate to the uncompressed installation
file,”install.exe”. b. Double-click the installer and follow the instructions. AEJEE defaults to
install in C:\ESRI\AEJEE. The text in this tutorial will use the default directory.
5. MACINTOSH INSTALLATION a. Using Finder, navigate to the uncompressed installation file “Install.” b. Double-click the installer and follow the instructions. AEJEE defaults to
install in [hard drive]/ESRI/AEJEE. The text in this tutorial will use the default directory.
Gear-up • Welcome your students to the world of computer mapping and GIS! By
jumping straight into working with GIS, they will start out using the technology, not just seeing it or hearing about it.
• Explain to the students that very few students have done a course like this one. Rarely have students their age been able to focus this technology on Alaskan issues, using Alaskan data to explore Alaskan problems. Almost all the GIS lessons available for secondary students focus on the Lower 48. If they want to learn more about where corn grows, there are other GIS lessons for that. If they want to use new technology to show challenges, resources and possibilities for their own Alaskan communities, this is a better way to go. These lessons are designed just to get them started on a path that can lead to new ways to explore their own world.
• Remind your students to follow the instructions carefully, even painstakingly in the beginning. In that way, they will be able to minimize effort and maximize their progress. As they become comfortable with GIS, it will be easier to be creative with it.
• As you hand out lesson exercise worksheets, make sure the students know that you or another teacher must sign off at the end of each activity when it has been completed successfully

www.mapteach.org Geographic Information Systems Lesson 2 Introduction to GIS Using AEJEE
Page 219
Tips: • Monitor students’ progress at the back of the room where you can see
where they are on their monitors. This also cuts down on the temptation for them to engage in Internet social networking (Facebook, MySpace, chat or just email).
• When you need them all to pay attention at the same time, have them turn off their monitors.
TEACHER RESOURCES The MapTEACH web site has a gallery of student maps and pictures, career and job information, a FAQ page (Frequently Asked Questions with answers to AEJEE questions), resources, an overview and contact information. Email us with questions, comments or suggestions. We always appreciate your help and expertise in challenging us to do better, especially with the insights you have from working day to day with students all over Alaska. MapTEACH: Mapping Technology Experiences with Alaska’s Cultural Heritage project at www.mapteach.org ESRI’s “Introduction to ArcExplorer—Java Edition for Education” available as an Adobe Acrobat PDF: http://www.esri.com/software/arcexplorer/download.html GIS Education Community: ArcExplorer Java Edition for Education (AEJEE) - includes overview/introduction, tutorials, selected lessons, support FAQ and user forum http://edcommunity.esri.com/software/aejee/ Information privacy is an important issue! We recommend that teachers and students follow the Guidelines for Educators found within the Guidelines for Respecting Cultural Knowledge published by the Alaskan Native Knowledge Network. ANKN has a wealth of resources at www.ankn.uaf.edu While the use, and usefulness, of geospatial information technology continues to grow rapidly, its power to share and display information requires that it be applied with care. Many people will not want their personal knowledge or stories about the land recorded and made freely available via the Internet or by other means. Hunters, gold miners and Traditional Elders are all groups who have good reasons to keep some information private and for protecting their intellectual property rights. Before recording information and stories about land and resources in digital form on a computer, students and teachers need to act in accordance with the rights of those who are sources of this information. In MapTEACH lessons, specific

Geographic Information Systems Lesson 2 www.mapteach.org Introduction to GIS Using AEJEE
Page 220
guidance is provided to teachers and students on how to respect rights and protect privacy. For example, students should ask Elders’ permission before sharing their stories about the land, whether it is recorded in writing or on a map. On the other hand, government agencies share out information and GIS data for public use to everyone. This is the source of most information used by students during MapTEACH lessons.

www.mapteach.org Geographic Information Systems Lesson 2 Introduction to GIS Using AEJEE
Page 221
Name: ____________________
GIS Lesson 2 INTRODUCTION TO GIS USING AEJEE
STUDENT EXERCISE
(GIS = Geographic Information Systems AEJEE = ArcExplorer Java Edition for Education)
Explore 1: Starting up an AEJEE GIS There are two steps to start an AEJEE map, adding a first layer and selecting a projection. I. Add a first layer 1. To add a layer first start up ArcExplorer-Java Edition for Education
(AEJEE) You can launch AEJEE from the dock on a Mac, or from its icon on your desktop. Or you can find it in the “ESRI” folder at the root level of your hard drive. On a Mac, look in the Finder and click on the AEJEE icon. On a PC, click start and find it listed in Programs.

Geographic Information Systems Lesson 2 www.mapteach.org Introduction to GIS Using AEJEE
Page 222
Once started, the window should look like the first one. (Mac and PC versions look slightly different from each other.)
2. Make your window bigger by clicking on the green button in the top left of the window.
3. Add data to your map by finding the base layer you want and opening
it. One way to open a new map layer is to click the Content Chooser button .
The “Content Chooser” window will appear.
4. Navigate to the folder /ESRI/AEJEE/Data/Data_MapTEACH_WGS84 and
choose Base_Data. Below are detailed steps if you are not sure how to do this.

www.mapteach.org Geographic Information Systems Lesson 2 Introduction to GIS Using AEJEE
Page 223
Click on the blue arrow to get the dropdown menu for “Look in:”
Then Double-click on the to open the root directory.
From here, double-click to open the ESRI folder,
double-click , double-click , double-click , and select the data folder we are looking for with a double-click on
.

Geographic Information Systems Lesson 2 www.mapteach.org Introduction to GIS Using AEJEE
Page 224
5. Inside the Base_Data folder select the file Coastline_Simple.shp. This is a shapefile, a special kind of data type used by GIS to contain geographic information. Shapefiles have the extension .shp at the end of the file name. A shapefile is a data layer that is made of points, lines, or polygons (shapes).
6. Finally, click on the “OK” button.
When the ArcExplorer window looks similar to the one here, you have added your first GIS map layer!
II. Select a projection This second essential step makes sure that your map is oriented to an Alaska point of view. Selecting a common projection will make your map layers line up neatly, one on top of another.

www.mapteach.org Geographic Information Systems Lesson 2 Introduction to GIS Using AEJEE
Page 225
1. Start by clicking on “Projection” in the Tools menu. The “Select Coordinate System” window will appear.
2. Choose Regional Projections/Albers Equal Area (Ellipsoid)/Alaska in
Systems. 3. Click the blue arrow button under the “Datum” heading to get a dropdown
list and scroll way down to select WGS84 (World Geod. Sys. 1984).
Click “OK” and you are set.
The map in the ArcExplorer window still looks the same but you have improved it in a very important way - by giving it a base projection. All it takes is two first steps before doing anything else: choose a base layer and a projection.
Show your projected map and the Select Coordinate System window to a teacher.
Teacher sign-off: ___________________________
Geographic Information Systems Lesson 2 www.mapteach.org Introduction to GIS Using AEJEE
Page 226
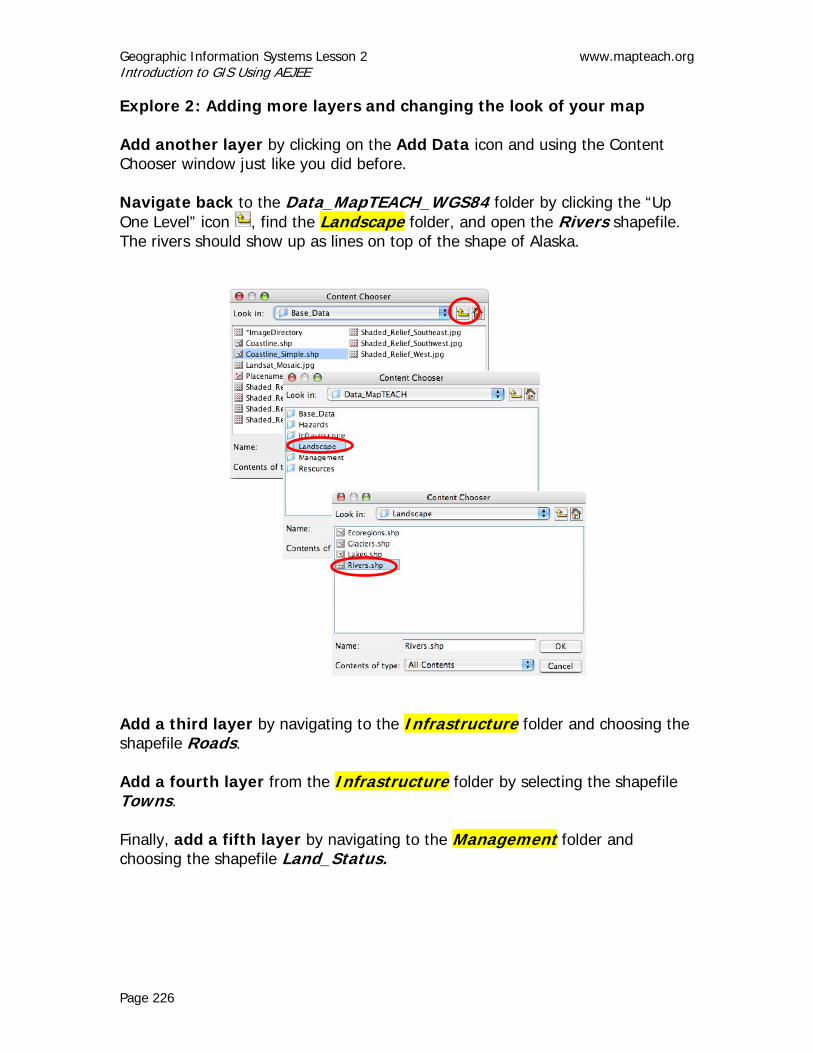
Explore 2: Adding more layers and changing the look of your map Add another layer by clicking on the Add Data icon and using the Content Chooser window just like you did before. Navigate back to the Data_MapTEACH_WGS84 folder by clicking the “Up One Level” icon , find the Landscape folder, and open the Rivers shapefile. The rivers should show up as lines on top of the shape of Alaska.
ß Add a third layer by navigating to the Infrastructure folder and choosing the shapefile Roads. Add a fourth layer from the Infrastructure folder by selecting the shapefile Towns. Finally, add a fifth layer by navigating to the Management folder and choosing the shapefile Land_Status.
www.mapteach.org Geographic Information Systems Lesson 2 Introduction to GIS Using AEJEE
Page 227
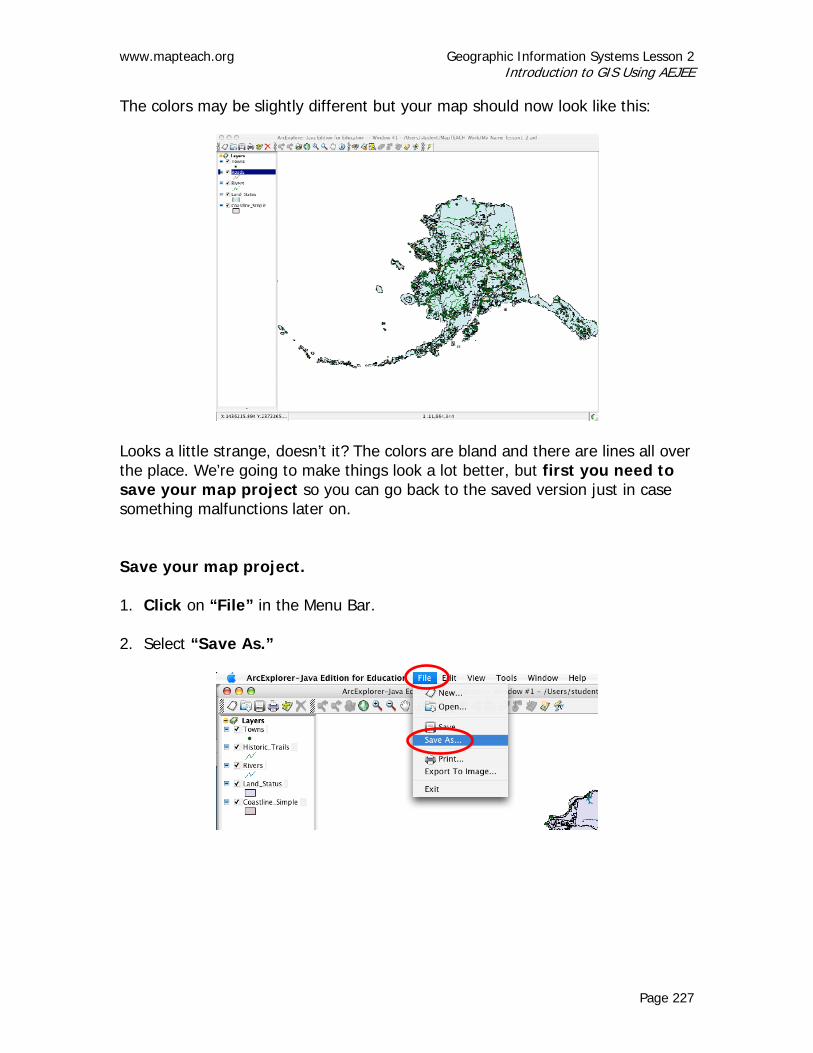
The colors may be slightly different but your map should now look like this:
Looks a little strange, doesn’t it? The colors are bland and there are lines all over the place. We’re going to make things look a lot better, but first you need to save your map project so you can go back to the saved version just in case something malfunctions later on. Save your map project. 1. Click on “File” in the Menu Bar. 2. Select “Save As.”

Geographic Information Systems Lesson 2 www.mapteach.org Introduction to GIS Using AEJEE
Page 228
3. Navigate to the users/student/MapTEACH_Work folder.
4. Name the project using your full name and the lesson name:
firstname_lastname_lesson2. 5. Click “Save.”
Remember to save your map often as you work. If the computer crashes or AEJEE freezes, you will always be able to start again from the last saved version of your map.
Substitute your name here2

www.mapteach.org Geographic Information Systems Lesson 2 Introduction to GIS Using AEJEE
Page 229
Explore 3: Improve the appearance of your map
Challenge: This map shows the ways that rivers, towns and historic trails are connected around the State of Alaska. Can you make your map look like this map by:
• finding ways to move the layers up and down, • changing symbols for each layer in the properties window, and • labeling the features in layers within the properties window?
Go to the next page to find out how to do these tasks!

Geographic Information Systems Lesson 2 www.mapteach.org Introduction to GIS Using AEJEE
Page 230
Here are the steps to make the map: 1. In the Table of Contents frame on the left side of the ArcExplorer window:
Ctrl-Click on the Coastline_Simple layer, navigate to “Move Layer” and click on “Move to Top.” This moves the coastline layer on top of the other layers. Because the entire area within the coastline of Alaska is filled in with a color, this layer covers up the other layers right now. In the next step we will change it so the filled-in part becomes transparent (see-through) and the layer only shows the lines for the coast.
2. Ctrl-Click on the Coastline_Simple layer, but this time open the
Properties window.
In the Properties window, use the Style box and its pull-down menu to choose “Transparent Fill” and click on the “OK” button.

www.mapteach.org Geographic Information Systems Lesson 2 Introduction to GIS Using AEJEE
Page 231
3. Now let’s make the rivers appear as heavy blue lines. Ctrl-Click on the
Rivers layer and open the Properties window. In the Properties window, use the Symbols box and the pull-down menu for Color to scroll up to “Blue.” While still in the Rivers Properties window, make the Size of the rivers “2” and click the “OK” button. The window will close and make the changes on your map.
Use the slider bar to see more colors

Geographic Information Systems Lesson 2 www.mapteach.org Introduction to GIS Using AEJEE
Page 232
4. The roads will be heavy red lines. Ctrl-Click on the Roads layer and open
the Properties window. In the Properties window, use the Symbols tab and the pull-down menu for Color to choose “Red,” change the Size to “2” and then click on the “OK” button.
5. The towns will be black squares. Ctrl-Click on the Towns layer and open
the Properties window. In the Properties window, use the Symbols tab and the pull-down menu for Style to choose “Square,” and for Color to choose “Black.” Click on the “Apply” button to apply the change without exiting out of the Properties window (this saves you the step of re-opening the Properties window to make the next change in step 6, below).
6. Now let’s label the town names. Click the Labels tab at the top to open the Labels box. To label each town, you can choose Name from the “Label features using” drop down menu. Click the “OK” button.

www.mapteach.org Geographic Information Systems Lesson 2 Introduction to GIS Using AEJEE
Page 233
7. Finally, Ctrl-click on the Land_Status layer. To color each stakeholder (landowner) group differently:
a) On the Symbols page use the pull-down menu for “Draw features using:” to select “Unique Symbols.”
b) In the “Field for values” box, choose to symbolize “Status” instead of “None.” A warning message will appear. Click “Yes.”
c) For “Color Scheme,” choose “Minerals,” and for “Style” choose “Solid Fill.” Last, make sure the “Remove Outline” box is checked – this will make the map easier to read. When your map looks like the one at the beginning of this section, you’re done!
8. Save the map and show it to your teacher. Teacher sign-off: ___________________________

www.mapteach.org Geographic Information Systems Lesson 2 Introduction to GIS Using AEJEE
Page 235
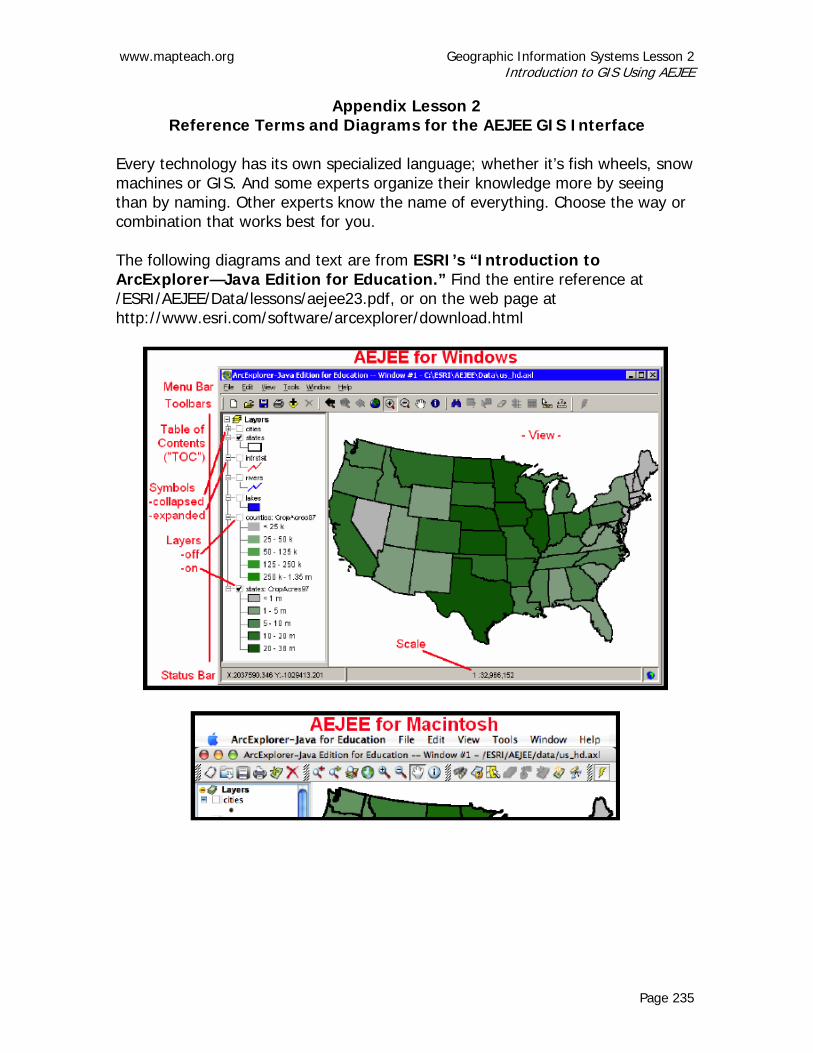
Appendix Lesson 2 Reference Terms and Diagrams for the AEJEE GIS Interface
Every technology has its own specialized language; whether it’s fish wheels, snow machines or GIS. And some experts organize their knowledge more by seeing than by naming. Other experts know the name of everything. Choose the way or combination that works best for you. The following diagrams and text are from ESRI’s “Introduction to ArcExplorer—Java Edition for Education.” Find the entire reference at /ESRI/AEJEE/Data/lessons/aejee23.pdf, or on the web page at http://www.esri.com/software/arcexplorer/download.html

Geographic Information Systems Lesson 2 www.mapteach.org Introduction to GIS Using AEJEE
Page 236
All AEJEE interfaces in “Map” view use the same set of toolbars, with about 20 buttons.
The “Layout” view (shown here from a Windows PC in “Metal” mode) includes special tools for customizing output.

www.mapteach.org Geographic Information Systems Lesson 3 Working with GIS Data: View, Label, Measure and Identify
Page 237
GIS Lesson 3 WORKING WITH GIS DATA:
VIEW, LABEL, MEASURE AND IDENTIFY TEACHER INFORMATION
Lesson Summary: During this lesson students learn some of the key qualities
of GIS that make it more dynamic and powerful than paper maps. They learn new ways to view the information held in a GIS, and begin asking questions and solving problems. While the lesson is written in language more accessible to the students, the reality is that as they view, measure and identify information they are also starting to make queries of a relational database with user-friendly tools. Little by little they are building a foundation of geospatial information technology skills and knowledge.
Objectives: Students will view, label, measure and identify information
in GIS data layers. They will apply these skills to answer questions about unique characteristics of Alaskan geography.
Estimated Time: 1 hour Correlation to Alaska Standards: Geography A-6 Use spatial (geographic) tools and technologies to analyze and
develop explanations and solutions to geographic problems. BACKGROUND FOR THE TEACHER Students begin to practice basic competencies in interpreting and displaying geospatial information through the skills and operations they learn in this lesson. While the students can follow the directions mechanically and obtain desired results, they will likely not find the GIS ‘interface’ very intuitive, in spite of any previous experiences with online mapping. Working with GIS data requires many new skills not found in the usual ‘what you see is what you get’ (WYSIWYG) interfaces of more popular software. We help students to become more comfortable with GIS by working within a familiar and meaningful context, i.e. Alaskan geography, and by helping students

Geographic Information Systems Lesson 3 www.mapteach.org Working with GIS Data: View, Label, Measure and Identify
Page 238
to find out information about their own communities within this context. Simply put, we are trying to help them build from what they know to what they can do with GIS data and techniques. We also connect the more technical and accurate terminology of GIS to the students’ everyday use of terms like view, label or identify. Abundant screenshots provide graphic cues for how to carry out each step needed to interpret and display information contained in the GIS data layers. This is especially helpful to students with strong visual learning orientations. As the teacher, one of the best ways you can help the students is to ask them to show and describe what they are doing and trying to do with the computer and AEJEE as they work through the lesson. As with other laboratory learning, whenever a student physically ‘shows and tells’ you or other students, he or she will be moved to greatly improve and organize his or her own understanding. MATERIALS • Computers - one for each student is best or two students can share. The
computers must meet the following specifications to run AEJEE: o Macintosh: MacOS 10.3 or above, 100 MB hard drive space, Internet
connection; recommend G4 or faster processor and more than 64 MB RAM o Windows: Win2000 or WinXP, 100 MB hard drive space, Internet
connection; recommend Pentium III or faster processor and more than 64 MB RAM
• AEJEE software can be provided by MapTEACH on a CD delivered to you, or you can download the correct version from our website at http://www.mapteach.org • MapTEACH GIS data can also be sent on a CD or downloaded from our website at http://www.mapteach.org • Copies of student directions for the lesson
INSTRUCTIONAL PROCEDURES
Getting Ready Try out all the student activities on a classroom computer before they do. You will better anticipate tasks your students might find challenging, and feel much more comfortable giving directions and answering questions. Make any modifications needed to cope with the way your computers are set up and organized. Gear-up • Encourage the students to look forward to finding out new ways to make
sense of GIS and to use it to make interesting Alaskan maps.

www.mapteach.org Geographic Information Systems Lesson 3 Working with GIS Data: View, Label, Measure and Identify
Page 239
• Remind the students to follow the instructions carefully. Explain that today they will also begin to use GIS to answer questions and to solve problems.
TEACHER RESOURCES GIS and Geography. eSchool News presents a collection of news stories, best practices, and other resources--all designed to help teachers integrate GIS and other geospatial technologies into classrooms. http://www.eschoolnews.com/resources/reports/gis/ GIS Education Community: ArcExplorer Java Edition for Education (AEJEE) - includes overview/introduction, tutorials, selected lessons, support FAQ and user forum http://edcommunity.esri.com/software/aejee/ Geospatial Education for 4-H. Geospatial education modules (GIS project books) for 4-H participants cover the fundamental concepts of GIS including map making principles, GIS data types basics, GIS application in every day life and the basic GIS program interface. This module uses the free GIS software called ArcExplorer 9 [Note: not AEJEE] as the primary program for its exercises and activities. http://lal.cas.psu.edu/Research/edTraining/4h_GISprojectBooks.htm ESRI’s “Introduction to ArcExplorer—Java Edition for Education” for AEJEE 2.3 available as an Adobe Acrobat PDF: http://www.esri.com/software/arcexplorer/download.html TEACHER REFERENCES GIS Dictionary. Online at ESRI Support, includes ArcExplorer terms and an exhaustive, technical list of GIS terms, some with graphics. www.esri.com/library/glossary/glossary.html


www.mapteach.org Geographic Information Systems Lesson 3 Working with GIS Data: View, Label, Measure and Identify
Page 241
Name: ____________________
GIS Lesson 3 WORKING WITH GIS DATA:
VIEW, LABEL, MEASURE AND IDENTIFY STUDENT EXERCISE
Explore 1: Open a Saved Project 1. Start up the AEJEE application. 2. To open the map project you saved at the end of the last lesson, choose
Open from the File menu or click on the icon in the toolbar. 3. Navigate to users/student/MapTEACH_Work and open the AEJEE
project file labeled with your full name and the lesson number: firstname_lastname_lesson2.
4. Take time now to “Save As” your project file as
firstname_lastname_lesson3.
Open your lesson2 project

Geographic Information Systems Lesson 3 www.mapteach.org Working with GIS Data: View, Label, Measure and Identify
Page 242
Explore 2: Looking at the Data 1. Notice that there is a list of information in the Table of Contents window
for Land_Status on the left side of the AEJEE screen. 2. This is the data you symbolized and labeled on your map at the end of
the last lesson. The colors and symbols correspond to the colors on the map. 3. You can make the Table of Contents window wider by click-dragging on
the little tab in the middle of the bar separating the Table of Contents from the map window.
Click-drag this tab to make the Table of Contents box wider.
Substitute your name here 3

www.mapteach.org Geographic Information Systems Lesson 3 Working with GIS Data: View, Label, Measure and Identify
Page 243
What are the major stakeholder groups included in the Land_Status data set for the State of Alaska (these groups are represented by the different colors)?
1. 6.
2. 7.
3. 8.
4. 9.
5. Challenge: This map shows the distribution of Native Corporation boundaries around Cantwell. Can you make your map look like this one by:
• adding a layer and turning layers on or off, • symbolizing and labeling the features in layers using the properties
window, and • changing the scale and location of your map view by using the zoom and
pan tools?
Here’s how to make this map: 1. You can speed up the time taken to redraw the map by unchecking the
box next to the Land Status layer in the Table of Contents window. This is a really big data set and will slow down the computer if you leave it on while you are zooming and panning. You can turn it back on later by checking the box next to the name.
Geographic Information Systems Lesson 3 www.mapteach.org Working with GIS Data: View, Label, Measure and Identify
Page 244
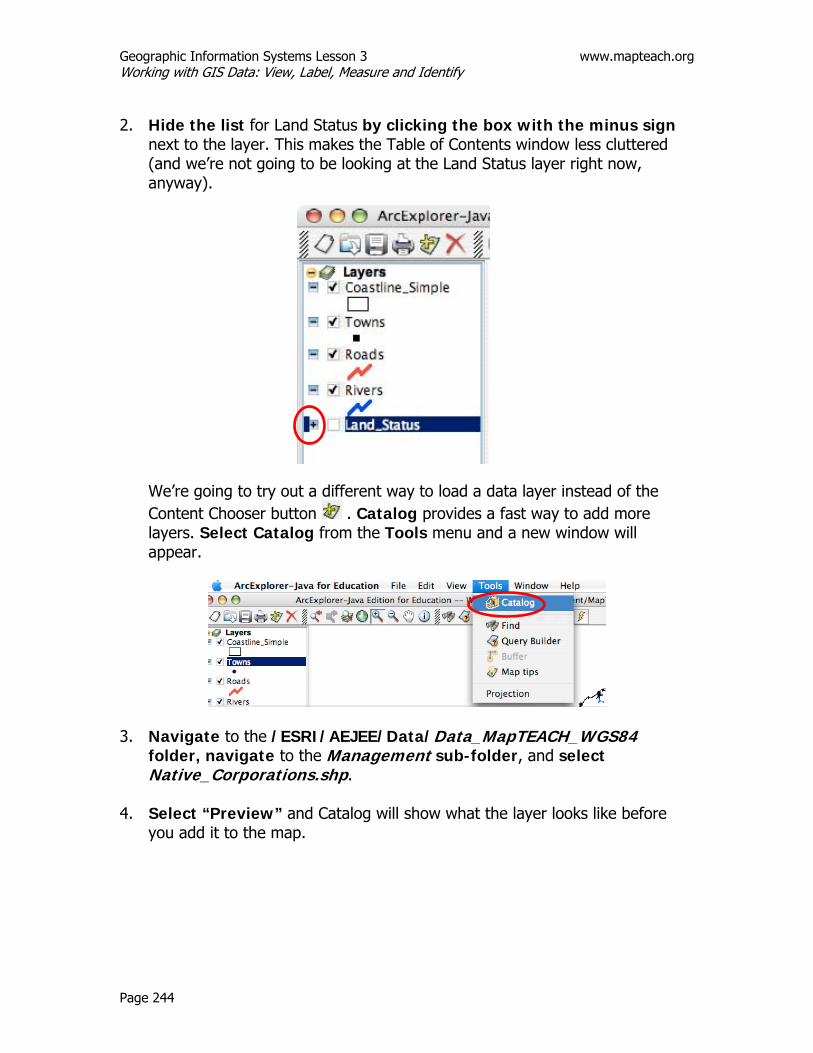
2. Hide the list for Land Status by clicking the box with the minus sign
next to the layer. This makes the Table of Contents window less cluttered (and we’re not going to be looking at the Land Status layer right now, anyway).
We’re going to try out a different way to load a data layer instead of the Content Chooser button . Catalog provides a fast way to add more layers. Select Catalog from the Tools menu and a new window will appear.
3. Navigate to the /ESRI/AEJEE/Data/Data_MapTEACH_WGS84 folder, navigate to the Management sub-folder, and select Native_Corporations.shp.
4. Select “Preview” and Catalog will show what the layer looks like before you add it to the map.

www.mapteach.org Geographic Information Systems Lesson 3 Working with GIS Data: View, Label, Measure and Identify
Page 245
5. Drag and drop the icon for Native_Corporations.shp onto the AEJEE map. The Native Corporations layer will be added at the top of the Table of Contents.
Tip: If you would like to pan and zoom in the Catalog Preview window, select View, Toolbars and then Pan-Zoom. Have you taken time to save your map? Do so now. Exit the Catalog window by clicking the red dot on the top left of the window.
6. Move the Native Corporations layer to the
bottom using Ctrl-Click on the layer name to get to Move Layer.
7. Use Ctrl-Click to get to Properties and assign
colors using “Unique Symbols”: use NAT_CORP as the “Field for values,” and Pastels for “Color Scheme.”
… 2) And drop it onto your main AEJEE map.
1) Click-drag the icon (small box)…

Geographic Information Systems Lesson 3 www.mapteach.org Working with GIS Data: View, Label, Measure and Identify
Page 246
Click “OK.”
(Remember to save your map often.) To fine-tune the appearance of labels for features on a map, you can also adjust the font, color, effects, placement and rotation angle. We will work with some of these options in the next steps.
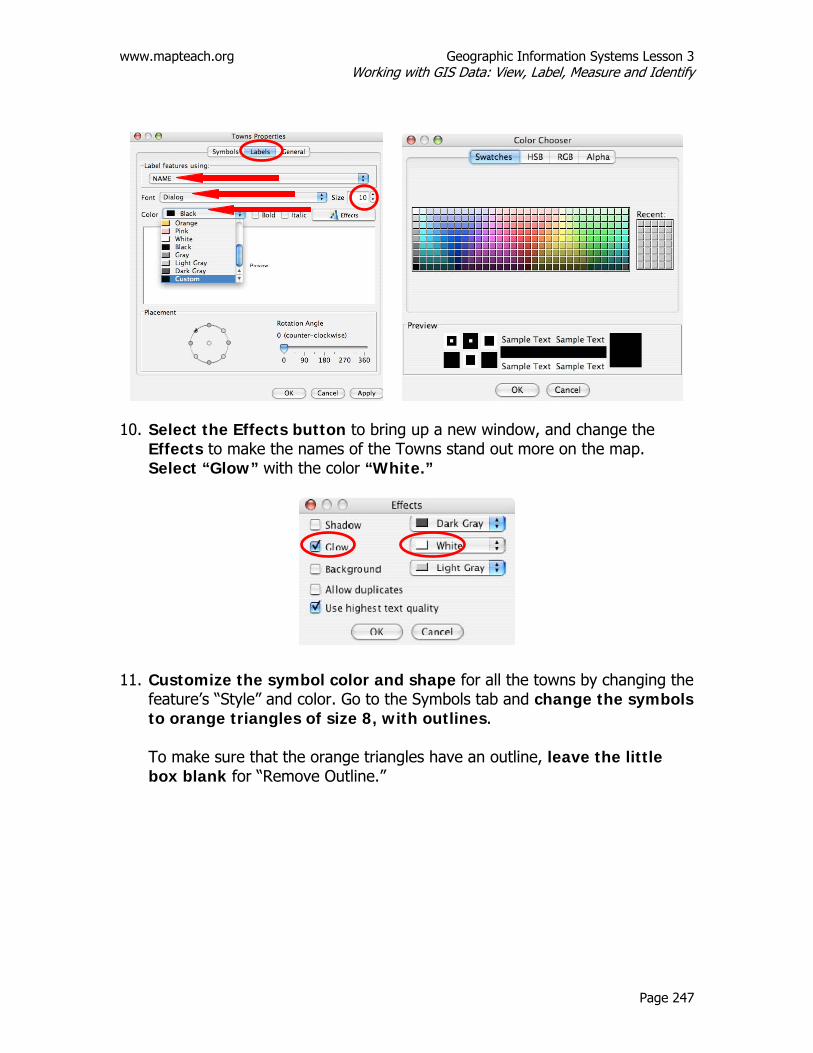
8. Open the Properties Window for Towns by Ctrl-Clicking on the layer
to get started. Choose the Labels tab.
Here the feature is being labeled by “NAME,” the Font is Dialog, the Size is 10 and the Color is Black.
Use the “Apply” button to preview your changes.
9. Before you click “OK” try making a custom color for the label by
choosing the color at the very bottom of the scroll-down menu (Custom).
The Color Chooser window will open. On the rainbow palette, select a dark color of your choice.
www.mapteach.org Geographic Information Systems Lesson 3 Working with GIS Data: View, Label, Measure and Identify
Page 247
10. Select the Effects button to bring up a new window, and change the Effects to make the names of the Towns stand out more on the map. Select “Glow” with the color “White.”
11. Customize the symbol color and shape for all the towns by changing the feature’s “Style” and color. Go to the Symbols tab and change the symbols to orange triangles of size 8, with outlines. To make sure that the orange triangles have an outline, leave the little box blank for “Remove Outline.”

Geographic Information Systems Lesson 3 www.mapteach.org Working with GIS Data: View, Label, Measure and Identify
Page 248
NAVIGATING AROUND THE MAP Your Alaska map should now look like this one.
12. Here are some ways to meet the challenge of zooming in on the Cantwell area, 107 miles SW of Fairbanks: a) You can zoom quickly to the full extent of the coastline shapefile by
control-clicking on the Coastline_Simple layer in the Table of Contents, and then selecting “Zoom to Layer.”

www.mapteach.org Geographic Information Systems Lesson 3 Working with GIS Data: View, Label, Measure and Identify
Page 249
b) You can show everything from every layer on the map by clicking on the blue ‘world’ icon on the Tool Menu to “Zoom to Full Extent.”
c) To zoom in to a specific area, use the magnifying glass with the “+” sign
to click on the place that you want to be the center of your “zoomed in” view, or to draw a box around the area you want to zoom in on.
d) To zoom out, use the magnifying glass with the “-″ sign and click on the area that you want to be the center of your “zoomed out” view.
e) If you make a mistake zooming, you can always go back to where you
were by using the previous extent button .
f) Use the hand pan icon to pan around the map, the same way that panning is done with other image and graphics applications.
13. To meet the challenge, zoom and pan until you can make your map look
very similar to this one. Note that there may be some differences in the area of your map depending on the size of the entire AEJEE window. Have a teacher inspect your carefully symbolized map of the Cantwell area showing the location of Native Corporation Boundaries. Teacher sign-off: ___________________________

Geographic Information Systems Lesson 3 www.mapteach.org Working with GIS Data: View, Label, Measure and Identify
Page 250
Explore 3: GIS Information One of the great things about GIS is that you can not only make maps, but you can find out information from the data stored inside the GIS layers. In this section of the lesson, you will find new ways to gather information with GIS. IDENTIFY TOOL – Find out more about your data 1. First, turn off the Coastline_Simple layer by unchecking the box next to the
layer name. We aren’t going to use it for the rest of this lesson and it will get in the way because it’s on the top of the stack of layers.
2. Make the Native_Corporations data layer “active” by selecting the
layer in the table of contents. The layer name will turn blue.
3. Click on the “Identify” tool and put the pointer on one of the colored areas with no writing or roads and click to “Identify Results” of your information query. The selected feature will flash a different color.
You will get a box with the name of the Native Corporation that your click was in.
Click on the name of the layer to highlight (select) it.

www.mapteach.org Geographic Information Systems Lesson 3 Working with GIS Data: View, Label, Measure and Identify
Page 251
What Native Corporation has jurisdiction over the area including Cantwell? _____________________________________________________________
What Native Corporation has jurisdiction over the area including Denali National Park? _____________________________________________________________
What Native Corporation has jurisdiction over the area including Petersville? _____________________________________________________________
4. Now make the Towns layer active and click on Cantwell to “Identify
Results” of your information query. You may have to click more than once to get the point right at Cantwell. By confirming the name field and the population field (in what GIS terminology is an attribute table), you can see that the population of Cantwell is listed as 144 people.
Click the box next to the layer name to turn the layer off.

Geographic Information Systems Lesson 3 www.mapteach.org Working with GIS Data: View, Label, Measure and Identify
Page 252
Zoom around and use the identify tool to find out the population of a village or town in Alaska that you are interested in. Town/Village (NAME):______________________ Population (POP): _________________________ Do you think this number is accurate?_________
Why or why not?________________________________________________ _____________________________________________________________
Where do you think these numbers came from? ______________________ _____________________________________________________________
Another piece of information that is attached to the Towns layer is the location in latitude and longitude. What are the coordinates of your chosen community? Longitude: _______________________________ Latitude: ________________________________

www.mapteach.org Geographic Information Systems Lesson 3 Working with GIS Data: View, Label, Measure and Identify
Page 253
Evaluating Data Quality 1. Zoom and pan around until you have Fairbanks, Cantwell, Lake
Minchumina, and Manley Hot Springs all in your map view. Can you drive from Fairbanks to Cantwell? ___________________________ Can you drive from Fairbanks to Lake Minchumina? ____________________ How do you know? ______________________________________________ _____________________________________________________________
_____________________________________________________________
_____________________________________________________________

Geographic Information Systems Lesson 3 www.mapteach.org Working with GIS Data: View, Label, Measure and Identify
Page 254
What other ways could you get there?_______________________________ _____________________________________________________________
_____________________________________________________________
_____________________________________________________________
Trick Question: Can you drive from Fairbanks to Manley Hot Springs? _____ Why is this a trick question? ______________________________________ _____________________________________________________________
_____________________________________________________________
_____________________________________________________________
What does that tell you about the Roads data layer? ___________________ _____________________________________________________________
_____________________________________________________________
Measuring Distances Use the Measure icon on the Tool Bar to measure the straight-line distance between places.
1. Click on icon that looks like a ruler with a question mark . Choose miles for the units.

www.mapteach.org Geographic Information Systems Lesson 3 Working with GIS Data: View, Label, Measure and Identify
Page 255
2. Click on Fairbanks and, while holding down the button, stretch the line out to Cantwell and release the button. You should get a segment distance of approximately 107 miles. You can clear the measurement screen by clicking on the measure tool button again and selecting “Clear Measure Totals.”
How far is it from Fairbanks to Nome?_______________ miles (The total length of almost every other state in the union is smaller than that!)
How far is it from Fairbanks to your selected community? _______________ Community: ______________ is _________ miles away. Can you drive there?_____________
Teacher sign-off: ___________________________


www.mapteach.org Geographic Information Systems Lesson 4 Maps with Raster Images I: Statewide Shaded Relief
Page 257
GIS Lesson 4 MAPS WITH RASTER IMAGES I:
STATEWIDE SHADED RELIEF TEACHER INFORMATION
Lesson Summary: A shaded relief image of Alaska will be loaded into AEJEE
and students will answer questions about what they can observe.
Objectives: Students will learn to use raster imagery in AEJEE. Estimated Time: 30 minutes Correlation to Alaska Standards: Geography A-6 Use spatial (geographic) tools and technologies to analyze and
develop explanations and solutions to geographic problems BACKGROUND FOR THE TEACHER A “pixel” (short for “picture element”) is the smallest discrete component of an image or picture on a computer screen. A “raster image” is an image that is composed of a collection of pixels arranged in a rectangular array, with each pixel having a separate color value. The image on a television screen is a good example of a raster image, where the picture you see is composed of thousands of tiny squares of different colors arranged in a grid that together form an image. Raster images such as digital air photos and satellite images are pictures of the earth from above. Raster images bring GIS alive in wonderful ways. They are often used to reveal landscape features or situate vector layers - points, lines and polygons - on a map. Image layers are typically used as the bottom or “base layer” in a GIS map, providing a rich visual context for making sense of vector layers. In AEJEE, a user can see a raster image in or under the rest of the map, but not change the appearance of the pixels that make up the picture. Images are often large files made up of thousands of pixels and, since each pixel must be precisely located by the computer, careful technique is required to add them into the GIS. The sheer size of raster files and the number of calculations required for AEJEE to precisely locate each pixel on the map makes a school

Geographic Information Systems Lesson 4 www.mapteach.org Maps with Raster Images I: Statewide Shaded Relief
Page 258
computer work very hard. This means that there may be long pauses when a raster layer is added, or when it is projected into a new coordinate system. The raster images included in MapTEACH data are carefully prepared and tested so they will work well when using a school computer. If it takes more than two or three minutes to redraw a map, you may need to quit AEJEE and start over, quit other programs, or use a different (smaller) raster file during your lesson. Some Important Concepts and Tips for Success: • Shaded relief images are raster files that display hills, mountains, valleys and
flat areas, that is, the topography of the landscape. The images are generated from elevation data.
• Vector layers are GIS data stored as points, lines or shapes. For example, towns, rivers and states are each stored in separate vector layers.
• Shapefiles are a specific kind of vector data file that can be read and displayed by ArcExplorer and other GIS software produced by ESRI.
• Raster image layers are stored like digital pictures - as a rectangular grid of pixels stored in rows and columns. Raster files are generally larger than vector files.
• AEJEE can only handle raster files up to about 4 MB in size, or 2500 by 2500 pixels in size.
• If the total size of files making up a set of data layers being used to make a map in AEJEE exceeds 10 MB, the program may freeze up. This capacity varies greatly depending on the version of AEJEE being used, RAM, CPU speed and other factors. The only way to find out for sure is to try it out.
• The statewide shaded relief image data set used in this lesson is stretching the capability of AEJEE about as far as it will go. Students will not be setting a projection for the project like they would usually do. This is all right for this particular lesson because they will not be using any other data layers with the statewide shaded relief raster.
• Because a projection is not being set in this lesson, the image doesn’t know where it is or what scale it is; therefore, the scale displayed at the bottom of the AEJEE window is not correct, and the measure tool can not be used.
MATERIALS • Computers - one for each student is best or two students can share. The
computers must meet the following specifications to run AEJEE: o Macintosh: MacOS 10.3 or above, 100 MB hard drive space, Internet
connection; recommend G4 or faster processor and more than 64 MB RAM o Windows: Win2000 or WinXP, 100 MB hard drive space, Internet
connection; recommend Pentium III or faster processor and more than 64 MB RAM

www.mapteach.org Geographic Information Systems Lesson 4 Maps with Raster Images I: Statewide Shaded Relief
Page 259
• AEJEE software can be provided by MapTEACH on a CD delivered to you, or you can download the correct version from our website at http://www.mapteach.org• MapTEACH GIS data can also be sent on a CD or downloaded from our website at http://www.mapteach.org • Copies of student directions for the lesson
INSTRUCTIONAL PROCEDURES
Getting Ready As always, try out the lesson on a classroom computer ahead of time. Jot down a list of questions that students might have, questions they should have, and questions that they can answer using lesson resources that we haven’t thought of. Gear-up • Ask students if they have ever worked with digital images before – say,
pictures taken with a digital camera, or the image on a television screen. Ask them what the picture looks like when they zoom way in, or get really close to the TV screen. If they get zoomed far enough in, the picture will be seen to be made up of many small squares, or pixels, each of which is a different color. A digital photograph is a raster image. So are satellite images and digital aerial photographs.
• Explain that raster images such as satellite pictures can be used in GIS if the image has information that the computer can understand that tells it where the image is located on the surface of the earth. Vector data layers can be combined with the raster data layer to make really useful maps.
• Explain that the data set they will be using in this lesson is stretching the capability of AEJEE about as far as it will go. They will not be setting a projection for the project like they would usually do. They don’t need to because they will not be using any other data layers with the statewide shaded relief raster.
• Caution the students that some patience may be required when dealing with raster layers. Adding or projecting a raster image layer may take a while, maybe several minutes. In most AEJEE lessons we will turn off the raster layer until we are almost done making the map so we don’t have to wait so long for the computer to redraw with each step.
TEACHER RESOURCES Raster and vector data are succinctly described and contrasted in Wikipedia at http://en.wikipedia.org/wiki/Geographic_information_system#Data_representation and in ESRI’s “Introduction to ArcExplorer—Java Edition for Education” for AEJEE 2.3, available as an Adobe Acrobat PDF: http://www.esri.com/software/arcexplorer/download.html

Geographic Information Systems Lesson 4 www.mapteach.org Maps with Raster Images I: Statewide Shaded Relief
Page 260
MORE RESOURCES FOR STUDENTS OR TEACHERS Geomorphology from Space is an out of print 1986 NASA publication edited by Nicholas M. Short, Sr. and Robert W. Blair, Jr. designed for use by the remote sensing science and educational communities to study landforms and landscapes. The core of this online collection is a gallery of space imagery consisting of 237 plates, each showing a geographic region where a particular landform theme is exemplified. Commentary, photographs, locator maps, and sometimes a geologic map accompany each plate at http://disc.gsfc.nasa.gov/geomorphology/index.shtml Visible Earth: A catalog of NASA images and animations of our home planet http://visibleearth.nasa.gov/ Earth Observatory (NASA) provides public access to new satellite imagery (raster data) and scientific information about our home planet [search for Alaskan images] at http://earthobservatory.nasa.gov/ Remote Sensing Resources from the Remote Sensing & Geographic Information Facility: American Museum of Natural History (thorough and comprehensive account of resources) at http://cbc.rs-gis.amnh.org/remote_sensing/index.html The interactive tools provided at the bottom right of the home page provide great ways to illustrate basic remote sensing concepts. GIS Dictionary. Online at ESRI Support - includes ArcExplorer terms and an exhaustive, technical list of GIS terms, some with graphics. www.esri.com/library/glossary/glossary.html

www.mapteach.org Geographic Information Systems Lesson 4 Maps with Raster Images I: Statewide Shaded Relief
Page 261
Name: ____________________
GIS Lesson 4
MAPS WITH RASTER IMAGES I: STATEWIDE SHADED RELIEF
STUDENT EXERCISE
Objectives: Students will learn to use raster imagery in AEJEE. Estimated Time: 30 minutes Base Maps Base maps are maps that have some very basic information on them to help you locate and orient yourself, but don’t necessarily have a theme. Topographic maps are often used as base maps, and people then add additional information onto them that is of particular interest to them. For example, wildlife biologists draw arrows showing caribou migration routes on topographic base maps. We are going to explore another kind of base map using image data available in GIS: a shaded relief base map. A shaded relief map is a pictorial representation of the topography, or land surface, on which you can easily see hills, mountains, valleys, and other landforms that make up the landscape. Image files like the shaded relief map used in this lesson are not shapefiles like you have been using in AEJEE so far. They are called raster data sets, and are more like digital photographs instead of the simple lines, dots, and shapes that you have worked with already. These raster data sets are quite large, so you need to be patient while AEJEE is loading, processing, and drawing them.
Geographic Information Systems Lesson 4 www.mapteach.org Maps with Raster Images I: Statewide Shaded Relief
Page 262
Explore 1: Load the Shaded Relief Raster Image Start up ArcExplorer-Java Edition for Education (AEJEE) 1. Open AEJEE and then make your window bigger by clicking on the green
button in the top left of the window.
2. Click the Add Data button and open the Content Chooser window, or use Tools/Catalog to open the Catalog.
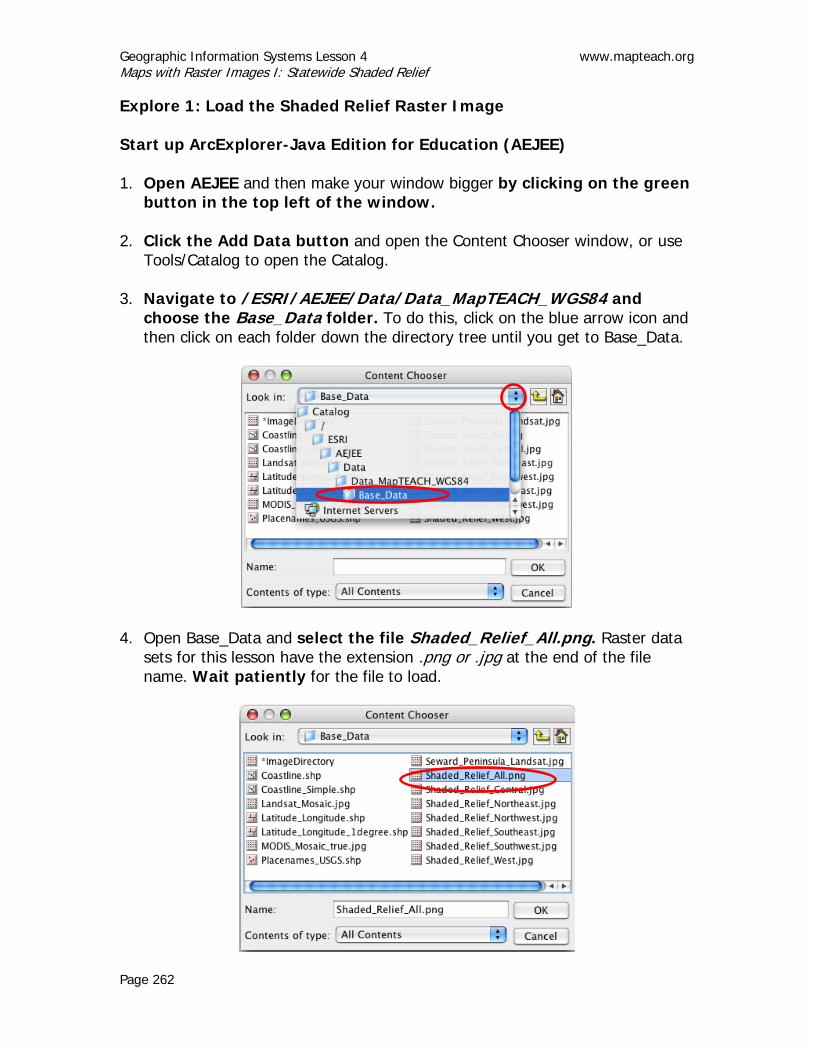
3. Navigate to /ESRI/AEJEE/Data/Data_MapTEACH_WGS84 and choose the Base_Data folder. To do this, click on the blue arrow icon and then click on each folder down the directory tree until you get to Base_Data.
4. Open Base_Data and select the file Shaded_Relief_All.png. Raster data
sets for this lesson have the extension .png or .jpg at the end of the file name. Wait patiently for the file to load.

www.mapteach.org Geographic Information Systems Lesson 4 Maps with Raster Images I: Statewide Shaded Relief
Page 263
Your screen should look like this:
IF the map does NOT show all of Alaska, Clear the Projection It may be necessary to clear the projection because AEJEE handles raster data differently from the way it handles shapefiles. This file is especially large and difficult to process. We are going to use it anyway because it shows some really interesting things about Alaska. Normally, you would always set a projection!
1. If you need to clear the projection, start by clicking on “Projection” in the
Tools menu. 2. The “Select Coordinate System” window will appear: Click on the
“Clear” button. Click “OK.”

Geographic Information Systems Lesson 4 www.mapteach.org Maps with Raster Images I: Statewide Shaded Relief
Page 264
To make the map display correctly with the projection cleared, you may need to SAVE and RE-OPEN your project.
Save your map project:
• Select “Save As” from the File Menu
• Navigate to the student/MapTEACH_Work folder • Name the project using your full name followed by “basemap”:
firstname_lastname_basemap
Substitute your name here
www.mapteach.org Geographic Information Systems Lesson 4 Maps with Raster Images I: Statewide Shaded Relief
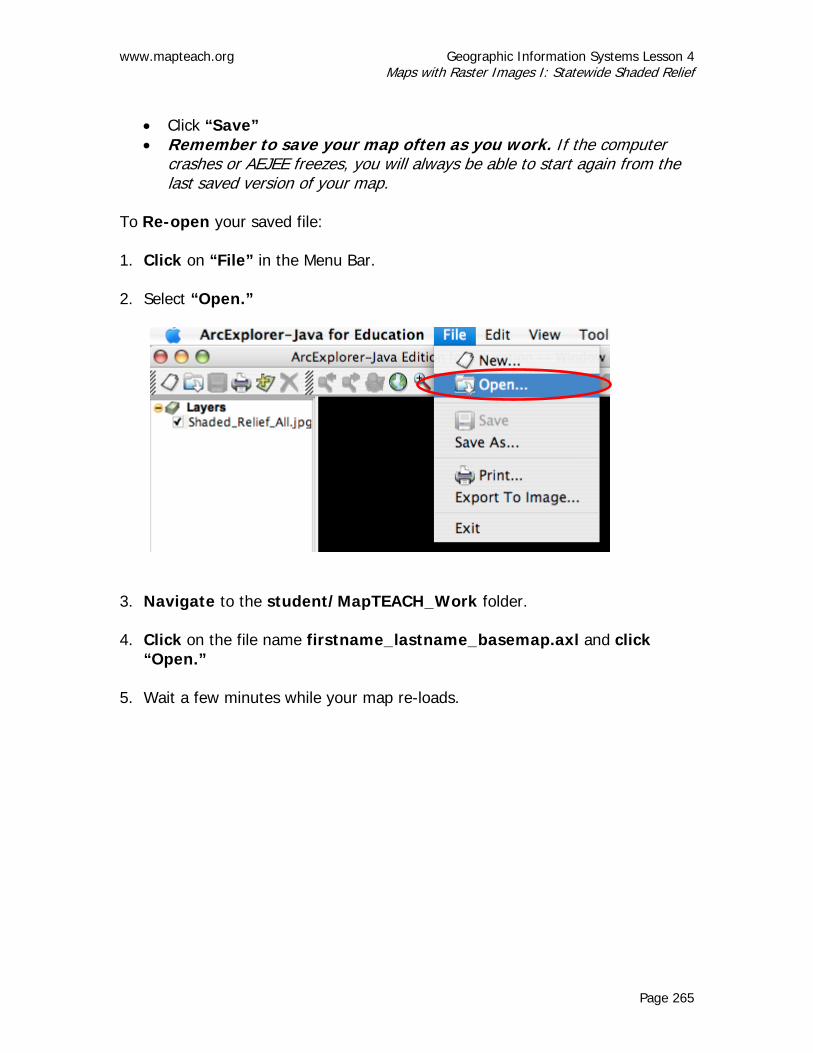
Page 265
• Click “Save” • Remember to save your map often as you work. If the computer
crashes or AEJEE freezes, you will always be able to start again from the last saved version of your map.
To Re-open your saved file: 1. Click on “File” in the Menu Bar. 2. Select “Open.”
3. Navigate to the student/MapTEACH_Work folder. 4. Click on the file name firstname_lastname_basemap.axl and click
“Open.” 5. Wait a few minutes while your map re-loads.

Geographic Information Systems Lesson 4 www.mapteach.org Maps with Raster Images I: Statewide Shaded Relief
Page 266
Explore 2: Interpreting the Shaded Relief Raster Image Zoom in to the Alaska Range by using the Zoom tool to drag a box around the mountains. (Hint: The Alaska Range is the big east-west trending mountain range in the south half of Alaska) Remember, this is a really big data set, so the computer will be pretty slow. You also can’t zoom in much farther than this because the data layer doesn’t have very much detail (the resolution is low). Your map should look something like this:
The Alaska Range has the tallest mountains in Alaska, and includes Mount McKinley (Denali), which is the highest peak in North America. There is a large fault (a break in the ground where big pieces of the earth’s surface are sliding past each other) that is very visible in this shaded relief map. Can you see the fault?______________ Trace it or pencil a line around it. What does it look like? ______________________________________________ _________________________________________________________________

www.mapteach.org Geographic Information Systems Lesson 4 Maps with Raster Images I: Statewide Shaded Relief
Page 267
Can you see any other possible faults in this view? ________________________ Save your map project. Show a teacher some of the other faults you think you can see. Teacher sign-off: ___________________________


www.mapteach.org Geographic Information Systems Lesson 5 Maps with Raster Images II: Local Shaded Relief Base Map
Page 269
GIS Lesson 5 MAPS WITH RASTER IMAGES II:
LOCAL SHADED RELIEF BASE MAP TEACHER INFORMATION
Lesson Summary Base maps locate, orient and generally describe an area of
interest. During this lesson, students learn how to make a base map, centered on their community, using a shaded relief raster layer and several vector layers. Students use the base map to make observations and answer questions centered on the local geography of a chosen community. The base map they construct during this exercise will be used as a starting point for several later GIS lessons.
Objectives: Students will create a customized base map made from a
local shaded relief raster image and a set of standard Alaska GIS data layers.
Estimated Time: 1 hour Correlation to Alaska Standards: Geography A-6 Use spatial (geographic) tools and technologies to analyze and
develop explanations and solutions to geographic problems. BACKGROUND FOR THE TEACHER Building a base map to orient, inform and answer general questions centered on a community enables students to make good progress exploring ‘their own place’ with GIS. This lesson is exciting for many reasons. First, the students have the chance to make some of their own decisions by choosing a project community, selecting the local raster image best suited to exploring their community, and then choosing how to best symbolize the map layers to make an engaging map. Our experience is that students really enjoy making their map look good. As the teacher you can leverage this motivation by guiding them to also use techniques
Geographic Information Systems Lesson 5 www.mapteach.org Maps with Raster Images II: Local Shaded Relief Base Map
Page 270
that help the GIS work smoothly and that make the map informative from a geographic perspective. The lesson is also interesting because processing raster images with AEJEE on a school computer pushes the envelope on capacity and performance. Using strategies like turning off the raster layer(s) while working with other layers will greatly speed things up. MATERIALS • Computers - one for each student is best or two students can share. The
computers must meet the following specifications to run AEJEE: o Macintosh: Mac OS 10.3 or above, 100 MB hard drive space, Internet
connection; recommend G4 or faster processor and more than 64 MB RAM o -Windows: Win2000 or WinXP, 100 MB hard drive space, Internet
connection; recommend Pentium III or faster processor and more than 64 MB RAM
• AEJEE software can be provided by MapTEACH on a CD delivered to you, or you can download the correct version from our website at http://www.mapteach.org • MapTEACH GIS data also can be sent on a CD or downloaded from our website at http://www.mapteach.org • Copies of student directions for the lesson
INSTRUCTIONAL PROCEDURES
Getting Ready As always, try out the lesson on a classroom computer ahead of time. Jot down a list of questions that students might have, questions they should have, and questions that they can answer using lesson resources that we haven’t thought of. Gear-up • Explain to students that they will be making maps with a personal focus,
centered on one Alaskan community of their choice. They will learn how to combine data layers to build custom maps that show where a chosen community is, and what is unique about that place. Have each student choose one Alaskan community that interests them and have them write it down in the space provided at the top of the first page of the student instructions. You can also write the names of students and their chosen communities on the board. You might ask each student why they are interested in their chosen community. This community will be the focus of this lesson and several later lessons in which GIS is used as a tool to learn more about that community.

www.mapteach.org Geographic Information Systems Lesson 5 Maps with Raster Images II: Local Shaded Relief Base Map
Page 271
• Use the map on page 2 of the student instructions to help students figure out what region they should be using as a shaded relief raster layer.
• Some communities may be located near the boundary between two or more regions; in these cases, students may need to load several shaded relief layers in order to adequately cover the community area at a scale of 1:1,000,000. These students will need to be especially patient while waiting for the computer to redraw after each command. Be sure that these students know that they can speed up the redraw process by turning off the raster layers (but don’t remove the layers from the project!). They can turn them on again once they have symbolized all their vector data the way they like it.
• Briefly run through the key concepts listed at the beginning of the student exercise section. One way to show the students the difference between raster images and vector data is to use AEJEE to zoom in on an image until it is pixilated, and then zoom in on point, line or polygon features to show that they never become pixilated. You can also show them the size of the files in Finder.
• Caution the students that some patience may be required when dealing with raster layers. Adding or projecting a raster image layer may take a while, maybe several minutes. In most AEJEE lessons we will turn off the raster layer until we are almost done making the map so we don’t have to wait so long for the computer to redraw with each step. Let them know that they will be working with smaller rasters than the one used in the last lesson, and that these will process much faster.
• Students love to see their maps in hard copy print. If the computers are connected to a printer, have them print their final base map by going to “File” in the AEJEE menu and clicking on “Print.” It’s even more fun for students if you have access to a color printer!
MORE EXPLORATIONS Have students take time to get up, walk around and compare how others have organized and symbolized their base maps. Encourage or require them to describe to another student what they did on their own maps. Then send them back to improve their own maps. TEACHER RESOURCES Raster and vector data are succinctly described and contrasted in Wikipedia at http://en.wikipedia.org/wiki/Geographic_information_system#Data_representation ESRI’s “Introduction to ArcExplorer—Java Edition for Education” for AEJEE 2.3 available as an Adobe Acrobat PDF: http://www.esri.com/software/arcexplorer/download.html

Geographic Information Systems Lesson 5 www.mapteach.org Maps with Raster Images II: Local Shaded Relief Base Map
Page 272
MORE RESOURCES FOR STUDENTS OR TEACHERS “Geomorphology from Space” is an out-of-print 1986 NASA publication edited by Nicholas M. Short, Sr. and Robert W. Blair, Jr. designed for use by the remote sensing science and educational communities to study landforms and landscapes. The core of this online collection is a gallery of space imagery consisting of 237 plates, each treating a geographic region where a particular landform theme is exemplified. Commentary, photographs, locator maps, and sometimes a geologic map accompany each plate at http://disc.gsfc.nasa.gov/geomorphology/index.shtml Visible Earth: A catalog of NASA images and animations of our home planet http://visibleearth.nasa.gov/ Earth Observatory (NASA) provides public access to new satellite imagery (raster data) and scientific information about our home planet [search for Alaskan images] at http://earthobservatory.nasa.gov/ Remote Sensing Resources from the Remote Sensing & Geographic Information Facility: American Museum of Natural History (thorough and comprehensive account of resources) at http://cbc.rs-gis.amnh.org/remote_sensing/index.html The interactive tools provided at the bottom right of the home page provide great experiences to illustrate basic remote sensing concepts.

www.mapteach.org Geographic Information Systems Lesson 5 Maps with Raster Images II: Local Shaded Relief Base Map
Page 273
Name: ____________________ Project Community: ____________________
GIS Lesson 5 MAPS WITH RASTER IMAGES II:
LOCAL SHADED RELIEF BASE MAP STUDENT EXERCISE
Objectives: Students will create a customized base map made from a
local shaded relief raster image and a set of standard Alaska GIS data layers, and will use it to answer questions about their community.
Estimated Time: 1 hour Key Concepts Project community is the village, town or other place in Alaska that you will choose to focus on while making maps. Base maps are maps that have basic information on them to help you orient yourself and answer general questions. Vector layers are GIS data stored as points, lines or shapes. For example, towns, rivers and land status are each stored in separate vector layers. Raster image layers are stored like digital pictures; a rectangular grid of thousands of points called pixels. During this lesson you will use a shaded relief raster image as the bottom layer for your project and then add vector layers to make a customized base map.

Geographic Information Systems Lesson 5 www.mapteach.org Maps with Raster Images II: Local Shaded Relief Base Map
Page 274
Explore 1: Load Your Data We can improve the computer’s performance by using a smaller piece of the raster data layer used during the last lesson before. 1. Choose a good raster data layer for your base map and project
community by looking at the picture below. Your teacher can help you. What is your Project Community? __________________________________ What region is your Project Community in? __________________________
2. Start a new AEJEE project. If you have a previous AEJEE map displayed,
you can start a new one by clicking on “New” in the File menu.
Central
NorthwestNortheast
West
Southwest Southeast
Use “New” if you already have a project open and want to open a different one instead.

www.mapteach.org Geographic Information Systems Lesson 5 Maps with Raster Images II: Local Shaded Relief Base Map
Page 275
3. Use the Content Chooser or Tools/Catalog to navigate to /ESRI/AEJEE/Data/Data_MapTEACH_WGS84 and choose the Base_Data folder.
4. In the Base_Data folder, use the Content Chooser or Tools/Catalog to add only the shaded relief raster layer for your Project Community region:
If your region is Central, load Shaded_Relief_Central.jpg If your region is Northeast, load Shaded_Relief_Northeast.jpg If your region is Northwest, load Shaded_Relief_Northwest.jpg If your region is Southeast, load Shaded_Relief_Southeast.jpg If your region is Southwest, load Shaded_Relief_Southwest.jpg If your region is West, load Shaded_Relief_West.jpg
5. Use Tools/Projection to open the Select Coordinate Systems window
to set your projection to Regional Projections/Albers Equal Area (Ellipsoid)/Alaska, and leave the “Datum” as “NAD83 (North American Datum 1983).”
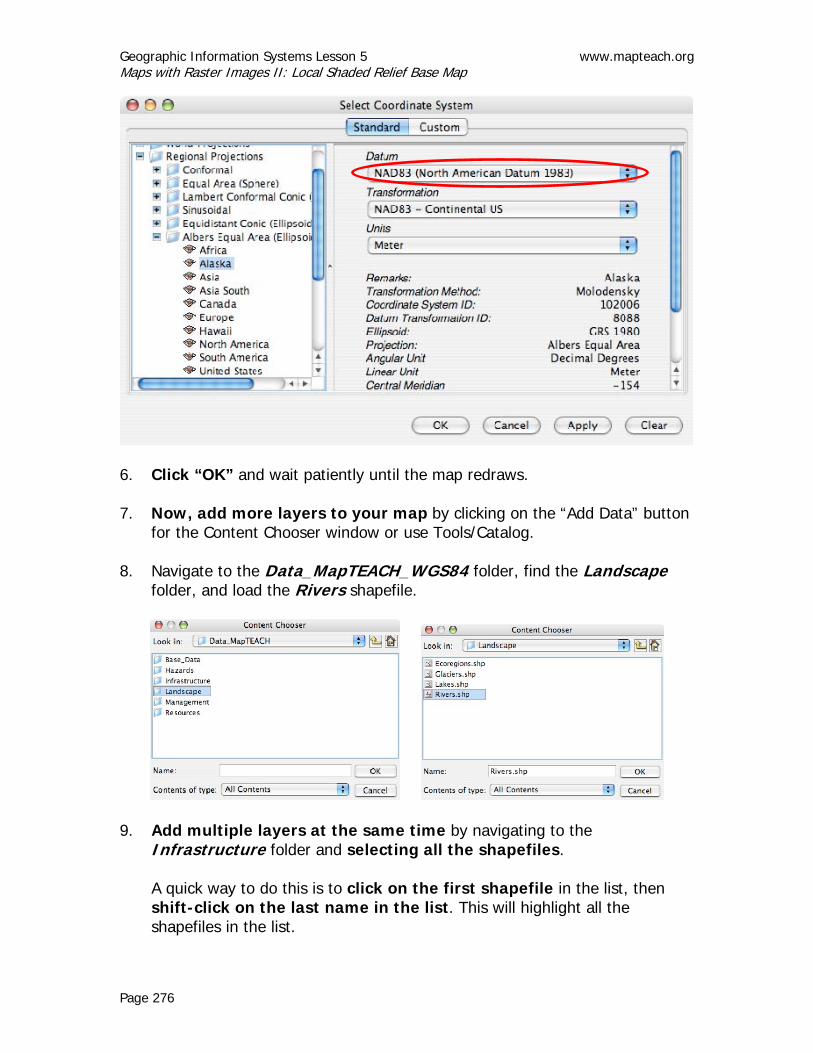
Geographic Information Systems Lesson 5 www.mapteach.org Maps with Raster Images II: Local Shaded Relief Base Map
Page 276
6. Click “OK” and wait patiently until the map redraws. 7. Now, add more layers to your map by clicking on the “Add Data” button
for the Content Chooser window or use Tools/Catalog.
8. Navigate to the Data_MapTEACH_WGS84 folder, find the Landscape folder, and load the Rivers shapefile.
9. Add multiple layers at the same time by navigating to the Infrastructure folder and selecting all the shapefiles. A quick way to do this is to click on the first shapefile in the list, then shift-click on the last name in the list. This will highlight all the shapefiles in the list.

www.mapteach.org Geographic Information Systems Lesson 5 Maps with Raster Images II: Local Shaded Relief Base Map
Page 277
Click “OK” and wait for the layers to load. 10. Move the Shaded_Relief_All layer to the bottom. (Remember to cntrl-
click on the layer, and select “Move Layer” and “Move Layer to Bottom”)
Your map might look something like this:
Geographic Information Systems Lesson 5 www.mapteach.org Maps with Raster Images II: Local Shaded Relief Base Map
Page 278
11. Look at your map closely. Pay especially close attention to where your rivers
are located with respect to the hills, mountains and valleys on the shaded relief layer. If your map includes a coastal area, look hard at where the vector layers are lining up on top of the shaded relief layer along the coast.
Does your map look weird? ____________ What do you see that’s wrong with it? ______________________________ _____________________________________________________________
_____________________________________________________________
This is because we are using two different kinds of data together – shapefiles and raster imagery. We can fix this “problem” by saving the map, closing it, and then re-opening it again.
12. Save your map project:
• Select “Save As” from the File Menu • Navigate to the student/MapTEACH_Work folder • Name the project using your full name followed by “projectbase”:
firstname_lastname_projectbase • Click “Save”
13. Open your saved map project:
• Select “Open” from the File Menu • Navigate to the student/MapTEACH_Work folder • Select the project you just saved”:
firstname_lastname_projectbase • Click “Open”
14. Zoom around and look at your map. Your layers should line up now. If not,
ask your teacher for help.
Show your map to a teacher. Teacher sign-off: ___________________________ (Check to see that the raster and vector data layers line up)

www.mapteach.org Geographic Information Systems Lesson 5 Maps with Raster Images II: Local Shaded Relief Base Map
Page 279
Explore 2: Improve the Appearance of Your Map 1. Zoom in to a scale of 1:1,000,000 by clicking “Zoom To Scale” in the
View menu. This scale is a good scale to see the shaded relief and to show the regional setting of your Project Community.
2. Type in “1,000,000” in the Set Scale box and click on the magnifying
glass icon.
3. Pan around until your Project Community is near the center of your map. If
you chose a coastal community, you may want to pan the map to include more land than water.
4. Now rearrange and symbolize your layers so the map looks the way
you want it. Make sure that it is clear and legible so someone else can read it and see what you are showing. Remember that it helps to turn off raster layers to speed up redrawing while you work on symbols and labels for the vector data layers.

Geographic Information Systems Lesson 5 www.mapteach.org Maps with Raster Images II: Local Shaded Relief Base Map
Page 280
• Towns Layer
o make the symbols a style, color, and size you like o label the towns with a font style, color and size you like
• Ferry_Ports Layer
o make the symbol a style, size and color that you like o choose a symbol you can see underneath or on top of the Towns
symbol • Remaining Layers
o Rivers o Trans-Alaska Pipeline o Roads o Railroads o Marine_Highways o Iditarod_Trail o Historic_Trails
Your map might look something like this, but showing a different part of Alaska:
Choose line styles/colors that help each feature stand out from the rest of the map.

www.mapteach.org Geographic Information Systems Lesson 5 Maps with Raster Images II: Local Shaded Relief Base Map
Page 281
Summarize the Geography of your Project Community Project Community Name: ___________________________________________ What is the nearest town to your Project Community? _____________________ How far away is the nearest town? _________________________ miles (Use the Measure tool) Are there any roads into your Project Community _________________________ Is your Project Community a ferry port?_________________________________ How far away is the Trans-Alaska Pipeline from your Community?________ miles (Use the Measure tool) [Hint: You may have to zoom way out.] Are there any marine highways or railroads near your Project Community?_____ Does the Iditarod Trail go through your Project Community? ________________ Use the Identify tool to name two historic trails that go nearest to your Project Community: Trail (TRAIL_NAME): ________________________ Trail (TRAIL_NAME): ________________________ Look at the shaded relief base map and describe the physical setting of your Project Community: (For example: My Project Community is right next to a big river in a valley with mountains to the north and flatter land to the south. The valley runs north-south at this town. The river my Project Community is next to starts in mountains to the north and ends in the ocean to the west.) _________________________________________________________________ _________________________________________________________________ _________________________________________________________________ _________________________________________________________________ Save your community base map. Teacher sign-off: ___________________________


www.mapteach.org Geographic Information Systems Lesson 6 Maps with Raster Images III: Satellite Imagery
Page 283
GIS Lesson 6 MAPS WITH RASTER IMAGES III:
SATELLITE IMAGERY TEACHER INFORMATION
Lesson Summary: During this lesson students use GIS to load and view true-
color and enhanced satellite images of Alaska. Based on their knowledge of Alaskan geography and recent image interpretation experiences in RSG Lesson 1, they interpret features found in the satellite images.
Objectives: Students will learn how to load and display satellite
imagery in AEJEE and will answer questions about what they see in the images.
Estimated Time: 30 minutes Correlation to Alaska Standards: Geography A-6 Use spatial (geographic) tools and technologies to analyze and
develop explanations and solutions to geographic problems. BACKGROUND FOR THE TEACHER Images taken from satellites have been used by GIS and remote sensing researchers to make environmental observations from space for many years. There are many different satellites collecting many different kinds of data from all across the energy spectrum into wavelengths far beyond what the human eye can see. Students tend to like the ‘true color’ images for their more familiar views of the earth, and of local community areas from space. Other kinds of enhanced images can be derived from satellite data and often provide important information, even though the color combinations take some getting used to. A common enhancement of satellite imagery is designed to approximate the appearance of CIR (Color Infrared) aerial photographs. (For a more thorough discussion of CIR, refer back to RSG Lesson 1.) The Landsat image used in this lesson has been enhanced to highlight some of the diverse landscape features. In this statewide summertime image, areas

Geographic Information Systems Lesson 6 www.mapteach.org Maps with Raster Images III: Satellite Imagery
Page 284
covered by snow and ice are light blue, clear water is dark blue, vegetation is green, and bare rock, exposed soils and sand dunes are various shades of pink. Many areas that have been burned show up in tones of black and red. Students will find that the larger the area covered by the image, the lower the resolution, and the larger the size of each pixel. These statewide images are actually made from many individual satellite images ‘mosaiced’ together so that the edge of each smaller image fits the next like pieces of a puzzle. Since individual satellite images are typically hundreds of megabytes in size, the whole image must be reprocessed to a lower resolution to create a manageable file size of a few megabytes. It is tempting to want to use very high resolution satellite image data or digital air photos for a close-up view of an area of interest. These kinds of high resolution images can be very difficult or expensive to procure and cover only very small areas. The file sizes of these images are also extremely large. For our purposes, coarser-resolution data like the MODIS and Landsat imagery used in this lesson are still visually attractive choices for base maps and have the benefit of much smaller file sizes that function well with AEJEE. MATERIALS • Computers - one for each student is best or two students can share. The
computers must meet the following specifications to run AEJEE: o Macintosh: Mac OS 10.3 or above, 100 MB hard drive space, Internet
connection; recommend G4 or faster processor and more than 64 MB RAM o Windows: Win2000 or WinXP, 100 MB hard drive space, Internet
connection; recommend Pentium III or faster processor and more than 64 MB RAM
• AEJEE software can be provided by MapTEACH on a CD delivered to you, or you can download the correct version from our website at http://www.mapteach.org• MapTEACH GIS data also can be sent on a CD or downloaded from our website at http://www.mapteach.org • Copies of student directions for the lesson INSTRUCTIONAL PROCEDURES
Getting Ready As always, try out the lesson on a classroom computer ahead of time.
Gear-up Ask students if they have ever seen satellite images before. Have they ever used Google Earth? Google Earth uses satellite images as base map data for their maps. Do they think Google Earth uses GIS?

www.mapteach.org Geographic Information Systems Lesson 6 Maps with Raster Images III: Satellite Imagery
Page 285
Explain to students that this lesson gives them an opportunity to use pictures taken from space to look at the Alaska landscape in GIS. You can whet their appetites by showing them some interesting images of Alaska from the USGS Landsat Image Gallery (see the link in the resources section below).
MORE EXPLORATIONS Have students explore Landsat images of Alaska by searching through the USGS Landsat Image Gallery. They can also use Google Earth to view places all over the world, as well as their own home communities or other areas of interest in Alaska. TEACHER RESOURCES The Landsat Education Program (NASA) http://landsat.gsfc.nasa.gov/education/resources.html MORE RESOURCES FOR STUDENTS OR TEACHERS USGS Landsat Image Gallery: An easy-to-browse array of images including such Earth features as volcanoes, floods, cities and more. http://landsat.usgs.gov/gallery.php Visible Earth: A catalog of NASA images and animations of our home planet http://visibleearth.nasa.gov/ Google Earth: An online interactive map site that uses satellite imagery to bring geography alive: http://earth.google.com/ Remote Sensing Resources from the Remote Sensing & Geographic Information Facility: American Museum of Natural History (thorough and comprehensive account of resources) at http://cbc.rs-gis.amnh.org/remote_sensing/index.html The interactive tools provided at the bottom right of the home page provide great experiences to illustrate basic remote sensing concepts.


www.mapteach.org Geographic Information Systems Lesson 6 Maps with Raster Images III: Satellite Imagery
Page 287
Name: ____________________
GIS Lesson 6
MAPS WITH RASTER IMAGES III: SATELLITE IMAGERY
STUDENT EXERCISE
Objectives: Students will learn how to load and display satellite imagery
in AEJEE and will answer questions about what they see in the images.
Estimated Time: 30 minutes In the last lesson you used shaded relief raster images as base layers to start building a map of your Project Community. We’re going to take a break from the Project Community map right now to look at a different kind of raster layer, a satellite image. As you saw in class, satellite images can show many different kinds of features. The satellite images we are going to use in this lesson are pretty low resolution in order to make data files that will work in AEJEE. We won’t be able to see much detail, but we can still see plenty of features when we are zoomed out to large areas of Alaska. During this lesson you will use a MODIS satellite image and a Landsat satellite image to look for features that stand out in the Alaskan landscape. Explore 1: MODIS Satellite Image 1. Open AEJEE and make your window bigger by clicking on the green
button in the top left of the window.
2. Navigate to the Base_Data folder and load the raster file MODIS_Mosaic_true.jpg. The “true” in the name is to indicate that the colors in the image are real-life colors.

Geographic Information Systems Lesson 6 www.mapteach.org Maps with Raster Images III: Satellite Imagery
Page 288
IF the map does NOT show all of Alaska, Clear the Projection Remember when we were working with the statewide shaded relief image and we did not set a projection? This satellite data set is also very big and complicated, so we will not be setting a projection for it. It may be necessary to clear the projection. Remember: Normally, you would always set a projection! (Note: Because you have not set a projection, you will not be able to use the measure tool or the “Zoom To Scale” function)
• If you need to clear the projection, start by clicking on “Projection” in
the Tools menu.
• The “Select Coordinate System” window will appear: Click on the “Clear” button. Click “OK.”
Your map should look something like this:
3. Save your map as firstname_lastname_satellite in the
student/MapTEACH_Work folder. 4. Zoom around and look at what the MODIS image shows.

www.mapteach.org Geographic Information Systems Lesson 6 Maps with Raster Images III: Satellite Imagery
Page 289
MODIS Image Interpretation How is this satellite raster image different from the shaded relief rasters? _________________________________________________________________ _________________________________________________________________ _________________________________________________________________ In general, what do you think the green areas are? _______________________ In general, what do you think the dark blue areas are? ____________________ In general, what do you think the light blue areas are? ____________________ In general, what do you think the white areas are?________________________ What time of year do you think this satellite image was taken, and why? _________________________________________________________________ _________________________________________________________________ _________________________________________________________________ Do you think that this particular satellite image would be a good base map for a community planning project? _____________________ Why or why not? ___________________________________________________ _________________________________________________________________ _________________________________________________________________
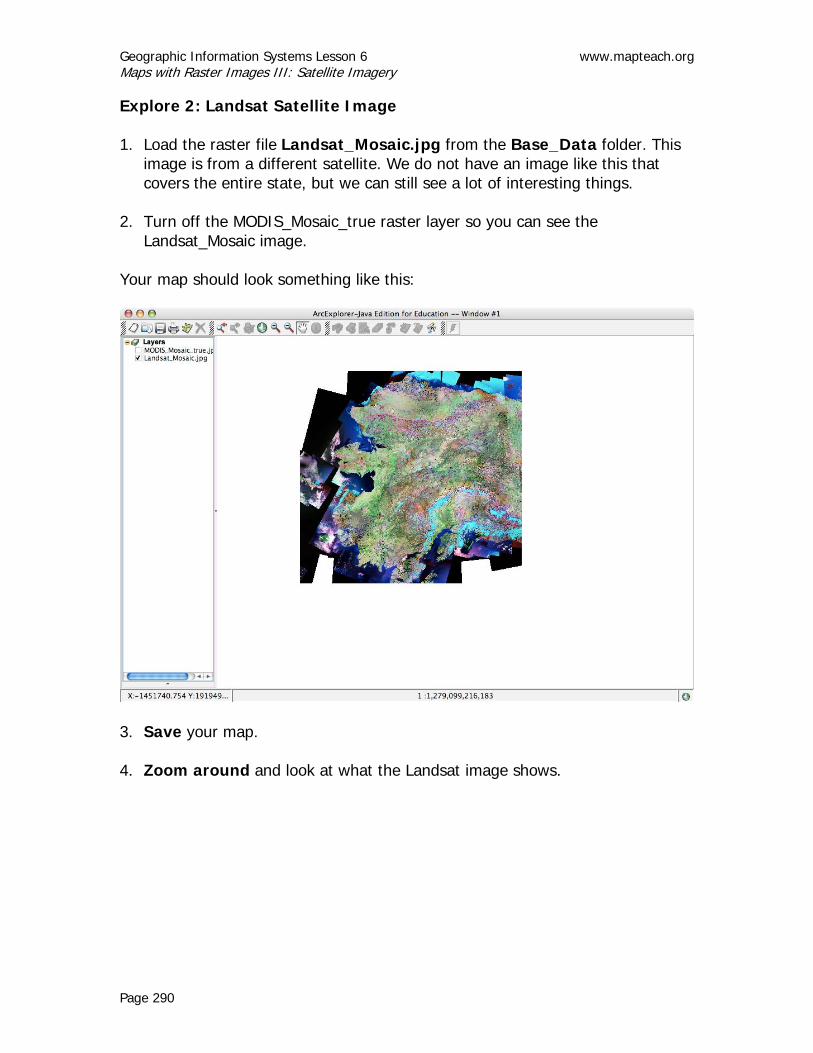
Geographic Information Systems Lesson 6 www.mapteach.org Maps with Raster Images III: Satellite Imagery
Page 290
Explore 2: Landsat Satellite Image 1. Load the raster file Landsat_Mosaic.jpg from the Base_Data folder. This
image is from a different satellite. We do not have an image like this that covers the entire state, but we can still see a lot of interesting things.
2. Turn off the MODIS_Mosaic_true raster layer so you can see the
Landsat_Mosaic image. Your map should look something like this:
3. Save your map. 4. Zoom around and look at what the Landsat image shows.

www.mapteach.org Geographic Information Systems Lesson 6 Maps with Raster Images III: Satellite Imagery
Page 291
Landsat Image Interpretation How is this raster image different from the MODIS image? _________________________________________________________________ _________________________________________________________________ In general, what do you think the pink areas are?_________________________ In general, what do you think the light blue areas are? ____________________ In general, what do you think the dark blue areas are? ____________________ Add the Towns shapefile from the Infrastructure folder and label the towns with their names. Find the communities of Selawik, Huslia and Ambler and zoom in until you barely have all three in your map. You should be zoomed in to the approximate extent shown here:
(The arrows on this map are pointing to places referred to in the next few questions)

Geographic Information Systems Lesson 6 www.mapteach.org Maps with Raster Images III: Satellite Imagery
Page 292
Turn the MODIS_Mosaic_true layer on and off by checking and unchecking the box next to the layer name in the Table of Contents. This allows you to flicker between the two types of satellite image. Now, try to answer the following questions. In the Landsat image, there is a light pink blob just west of Ambler and a light pink blob just west of Huslia. What do you think these could be? (Hint: you may have seen one of these on an air photo in a PowerPoint presentation during a MapTEACH lesson; also, you might find these sorts of things in the Sahara Desert of Africa!) _________________________________________________________________ _________________________________________________________________ What do these blobs look like in the MODIS image? _________________________________________________________________ Turn off the MODIS image and use the Landsat image to look at the large lake that is just southeast of Selawik. What color is the lake in the Landsat image?_____________________________ Based on your previous interpretations of the colors in the Landsat image, what does this color indicate about the water? _________________________________________________________________ _________________________________________________________________ What color is the lake in the MODIS image? _____________________________ Based on your previous interpretations of the colors in the MODIS image, what does this color indicate about the water? _________________________________________________________________ _________________________________________________________________ The Landsat image is from 1990, and the MODIS image is from 2001.

www.mapteach.org Geographic Information Systems Lesson 6 Maps with Raster Images III: Satellite Imagery
Page 293
Based on your observations of the satellite imagery, what do you think might have happened to the lake between 1990 and 2001? _________________________________________________________________ _________________________________________________________________ Do you think that a Landsat satellite image would be a good base map for a community planning project? _____________________ Why or why not? ___________________________________________________ _________________________________________________________________ Show your map to a teacher. Teacher sign-off: ___________________________


www.mapteach.org Geographic Information Systems Lesson 7 Community GIS: Geologic Hazards
Page 295
GIS Lesson 7 COMMUNITY GIS: GEOLOGIC HAZARDS
TEACHER INFORMATION
Lesson Summary: By choosing an Alaskan community as a starting point,
students are able to investigate and map geologic hazards that may affect them directly. In turn they begin to see how the geology and climate of a place sets the stage for specific hazardous events.
Objectives: Students will explore a variety of GIS data sets relating to
geologic hazards. Estimated Time: 1 hour Correlation to Alaska Standards: Geography E-6 Evaluate the impact of physical hazards on human systems. BACKGROUND FOR THE TEACHER Though Alaskan students are inundated with warnings about local hazards, and regaled with stories of epic natural disasters, hazards are given little explicit emphasis in current state standards. Clearly, students are interested in hazards and enjoy describing experiences with them from personal, community and historic perspectives. This lesson presents them with opportunities to explore local and regional geologic hazards using scientific data and mapping tools. Mitigating the effects of hazards in communities first requires an understanding of how and where events occur. Maps are often integral to plans for avoiding hazards or taking actions to make possible outcomes less severe. During this lesson, each student will be able to focus in on hazards that threaten a particular community. However, many kinds of hazards are covered during the lesson and together they serve as a foundation for understanding the distribution and effects of hazards throughout Alaska.

Geographic Information Systems Lesson 7 www.mapteach.org Community GIS: Geologic Hazards
Page 296
Some Important Concepts and Tips for Success: • The project community chosen as a focus by the student should be one that
he or she knows very well. Questions in the lesson ask the students to compare their personal observations and the information presented on their maps. The community does not need to be same as their school’s community.
• Geologic hazards are natural geologic events that can endanger human lives and threaten human property. Earthquakes, tsunamis, floods, volcanic eruptions and permafrost all can cause significant and sometimes catastrophic damage in Alaska.
• Permafrost is ground whose temperature remains below freezing for two or more years in a row.
• Geographic extent is displayed on a map as an area that is characterized by a particular quality. For example, an area subject to permafrost is shown as permafrost extent.
• To supplement or extend this activity, bring in local people who have experience with hazards. They will inform and inspire students as they work on their maps. The homeowner who must cope with building on permafrost, a local government planner who maps flood zones, and a roads (transportation) engineer are all people who can share hazards expertise.
MATERIALS • Computers - one for each student is best or two students can share. The
computers must meet the following specifications to run AEJEE: o Macintosh: MacOS 10.3 or above, 100 MB hard drive space, Internet
connection; recommend G4 or faster processor and more than 64 MB RAM o Windows: Win2000 or WinXP, 100 MB hard drive space, Internet
connection; recommend Pentium III or faster processor and more than 64 MB RAM
• AEJEE software can be provided by MapTEACH on a CD delivered to you, or you can download the correct version from our website at http://www.mapteach.org• MapTEACH GIS data also can be sent on a CD or downloaded from our website at http://www.mapteach.org • Copies of student directions for the lesson
INSTRUCTIONAL PROCEDURES
Getting Ready As always, try out the lesson on a classroom computer ahead of time. Jot down a list of questions that students might have, questions they should have, and questions that they can answer using lesson resources that we haven’t thought of.

www.mapteach.org Geographic Information Systems Lesson 7 Community GIS: Geologic Hazards
Page 297
Gear-up • This lesson presents students with tools and information for finding out
more about hazards that affect their own community. One way to prime the pump for students to share their personal knowledge is to start with a list of temperate zone geologic hazards, e.g. hurricanes, tornadoes, karst sinkholes and tropical desert sand storms. Follow up by asking, “What geologic hazards affect Alaskans?” Check in on students’ progress throughout the lesson to keep them on track to finish on time. For example, to complete 10 pages in an hour, the students need to be finished with page 5 after 30 minutes. Stand at the back of the room to watch computer monitors, and periodically ask questions like, “How many people have finished the “Explore” section on earthquakes? Raise your hand.”
• Restrict or prevent student access to distracting activities like chat, email or social networking sites.
• Point out that this is an activity where they can begin to bring their GIS skills ‘home’. As they work, they can also be thinking ahead to how they can make maps that would help people in their project community better understand hazards, and plan how to mitigate their effects.
TEACHER RESOURCES The presentation Geologic_Hazards_PowerPoint file included in the MapTEACH geology unit curriculum materials provides an engaging introduction and spectacular images to Natural Hazards in Alaska. See included materials or search the web site at www.mapteach.org. The article Lessons Learned While Teaching Earth Science with GIS includes relevant observations and insights made while using hazards as a content area focus. As a chapter of the AAAS publication Invention and Impact: Building Excellence in Undergraduate Science, Technology, Engineering and Mathematics (STEM) Education it can be downloaded as a .pdf from http://www.aaas.org/publications/books_reports/CCLI/PDFs/05_Vis_Ed_Hall.pdf RESOURCES FOR STUDENTS OR TEACHERS Guide to Geologic Hazards in Alaska – Introduction from the Division of Geological & Geophysical Surveys provides an online overview. Alaska hosts a long list of hazards including earthquakes, tsunamis, volcanic eruptions, permafrost, avalanches, floods and more. Each hazard is organized in a taxonomy and linked to many helpful resources via http://www.dggs.dnr.state.ak.us/index.php?menu_link=engineering&link=geohazards&sub_link=hazards

Geographic Information Systems Lesson 7 www.mapteach.org Community GIS: Geologic Hazards
Page 298
USGS Educational Resources For Secondary Grades Middle School and High School is organized by topic, e.g. volcanoes, and by resource type at http://education.usgs.gov/common/secondary.htm Natural Hazards Gateway is a comprehensive introduction to hazards found nationwide as presented by the US Geological Survey at http://www.usgs.gov/hazards/ The Geologic Hazards article at Nationalatlas.gov offers descriptions, pictures and links to maps and map layers. See http://nationalatlas.gov/articles/geology/a_geohazards.html

www.mapteach.org Geographic Information Systems Lesson 7 Community GIS: Geologic Hazards
Page 299
Name: ____________________ Project Community: ____________________
GIS Lesson 7 COMMUNITY GIS: GEOLOGIC HAZARDS
STUDENT EXERCISE
Objectives: Students will explore a variety of GIS data sets relating to
geologic hazards. Estimated Time: 1 hour By the end of this lesson, you will be able work with different kinds of data layers to answer questions about geologic hazards that are important for community planning projects. Explore 1: How Does Permafrost Affect Towns? First, start up ArcExplorer-Java Edition for Education (AEJEE) Make your window bigger by clicking on the green button in the top left of the window. Open your project base map: • Click on “File” in the Menu Bar • Select “Open” • Navigate to the student/MapTEACH_Work folder • Click on the file name firstname_lastname_projectbase.axl and click
“Open” • Wait up to a few minutes while your map re-loads 1. Choose an Alaskan community that you know well as the focus for this
lesson. Zoom and pan to the area around your community. 2. Add the layer Permafrost from the Hazards folder in Data_MapTEACH.

Geographic Information Systems Lesson 7 www.mapteach.org Community GIS: Geologic Hazards
Page 300
3. Move the Permafrost layer up one level by Ctrl-Clicking and selecting “Move Layer” and “Move Up.” We want to be able to see it on top of the shaded relief layer.
Your map might look something like this:
4. Symbolize the Permafrost layer using the Properties menu. Assign colors
with “Unique Symbols” using the value of “PF_EXTENT,” and pick any color scheme that you like. For “Style,” you need to pick anything EXCEPT “Solid fill” or “Transparent fill.” By selecting one of the patterns, you will be able to see the shaded relief layer through the permafrost layer.
You can change these colors individually by clicking on the colored bars and selecting a color you like from the resulting palette window.
Pick any Style EXCEPT “Solid fill” or “Transparent fill.”

www.mapteach.org Geographic Information Systems Lesson 7 Community GIS: Geologic Hazards
Page 301
5. Check the “Remove Outline” box. 6. When it looks the way you like it, save your map in the MapTEACH_Work
directory as firstname_lastname_hazards. Your map might look something like this:
Permafrost is ground whose temperature remains below freezing for two or more years in a row. In this data set, permafrost extent (how much of the area is subject to permafrost) is represented as continuous, discontinuous, sporadic, isolated patches, and none. Ice content (amount of actual ice likely to be present in the ground in the permafrost areas) is represented as high, medium, low, or none.
For your selected community, what is the permafrost type shown on the map? ______________________________________________________________ Do you think that this is true? ___________ Why or why not? ________________________________________________ ______________________________________________________________

Geographic Information Systems Lesson 7 www.mapteach.org Community GIS: Geologic Hazards
Page 302
Do you think melting permafrost could be hazardous to your community? __________________ Why or why not? ________________________________________________ ______________________________________________________________
7. Turn off your shaded relief layer and zoom out to the whole state.
Based on what you see on your map, name two communities that would have a VERY difficult time digging outhouse holes because the ground is frozen. Use the Identify tool. (Hint: Sometimes it seems to take more than one click of the cursor with the “Identify Results” window open to make the tool work. Also, make sure the right layer is active - in this case the Permafrost layer.)
1. ________________________________ 2. ________________________________
Are there parts of the state that don’t have permafrost? ________________ Based on what you know and have learned so far, do you think that permafrost affects the location of roads? __________________ Why or in what way? ____________________________________________ _____________________________________________________________
Have your teacher review your work. Teacher sign-off: ___________________________

www.mapteach.org Geographic Information Systems Lesson 7 Community GIS: Geologic Hazards
Page 303
Explore 2: Flooding and Erosion Hazards 1. For this exercise, turn off the Towns layer. 2. Add the layer Flood_Erosion_Towns from the Hazards folder in
Data_MapTEACH. 3. Symbolize the layer using the Properties menu.
In the Symbols tab, assign Circle for “Style,” Orange for “Color,” 6 for “Size,” and uncheck “Remove Outline.”
4. In the Labels tab, “Label features using:” NAME, and assign Helvetica
for “Font,” 10 for “Size,” and put in a “Background” effect using Gray.

Geographic Information Systems Lesson 7 www.mapteach.org Community GIS: Geologic Hazards
Page 304
If you zoom to full extent, your map might look something like this:
5. Zoom around the State and look at the distribution of the towns in
this data layer.
See if you can figure out a relationship between the locations of the towns and any other features or data layers displayed on your map. (Hint: Think about the name of this data set, and what kinds of places you might expect to find towns like these) What is the relationship, and with what other layer or layers? ______________________________________________________________ ______________________________________________________________ ______________________________________________________________ ______________________________________________________________ Is your project community included in this data layer? __________________ If it is included, there is potential for flooding and/or erosion in your community.

www.mapteach.org Geographic Information Systems Lesson 7 Community GIS: Geologic Hazards
Page 305
If present, do you think your project community’s flooding and erosion hazard is due to coastal processes or is it due to river processes? ________________________________________ What is the GIS evidence to support this conclusion? ___________________ ______________________________________________________________
Have your teacher review your work. Teacher sign-off: ___________________________ Explore 3: Earthquake Hazards 1. Turn off the Flood_Erosion_Towns layer and turn on the Towns layer. 2. Add Earthquakes2000 from the Hazards folder. This layer shows Alaskan
earthquakes that occurred in 2000.
3. Symbolize Earthquakes any way you like. Here’s one example that shows
how to use graduated symbols as food for thought, but it’s up to you!

Geographic Information Systems Lesson 7 www.mapteach.org Community GIS: Geologic Hazards
Page 306
Are there many earthquakes recorded near your Project Community? _______________________ How far away is the nearest earthquake? ____________________ (Use the Measure tool, in miles or kilometers) Use the Identify tool to answer the following questions: What is the date of the nearest earthquake (DATE)?____________________ What is the depth (DEPTH)? _______________________________________ (Units are kilometers) What is the magnitude (MAG)? _____________________________________ Based on your experience, is this a big earthquake? ____________________ Based on the number of earthquakes near your Project Community, do you think earthquake hazards are a problem? __________________
www.mapteach.org Geographic Information Systems Lesson 7 Community GIS: Geologic Hazards
Page 307
Explore 4: Tsunami Hazards 1. Turn off the Towns layer. 2. Add Tsunami_Towns from the Hazards folder. This layer shows Alaskan
communities that are believed to have tsunami hazards. 3. Symbolize and label the Tsunami_Towns the way you like them.
Is there potential for tsunamis in your Project Community? ______________
Explore 5: Volcanoes 1. Turn off the Tsunami_Towns layer and turn on the Towns layer. 2. Add Volcanoes from the Hazards folder. This layer shows Alaskan active
volcanoes. 3. Symbolize Volcanoes the way you like them.
Are there any active volcanoes near your Project Community? ____________ How far away is the nearest volcano?________________________________ (Use the Measure tool, in miles or kilometers) What is the name of the nearest volcano? ____________________________ (Use the Identify tool) Do you think that the closest volcano might be a hazard for your Project Community? __________________ Why or why not? ________________________________________________ ______________________________________________________________ Do you think it is important for planners to know what natural hazards affect communities? __________________ Why or why not? ________________________________________________ ______________________________________________________________

Geographic Information Systems Lesson 7 www.mapteach.org Community GIS: Geologic Hazards
Page 308
At this point, your map may look something like this:
Save your map project. You now have a project that contains all the hazards layers. If you decide you want to make a hazards map of your Project Community for your final project, this is the GIS project file that you can use to start with. Have your teacher review your work. Teacher sign-off: ___________________________

www.mapteach.org Geographic Information Systems Lesson 8 Community GIS: Natural Resources
Page 309
GIS Lesson 8 COMMUNITY GIS: NATURAL RESOURCES
TEACHER INFORMATION
Lesson Summary: Geological resources often play a critical role in the
economies of Alaskan communities. During this lesson, students are able to investigate the distribution of resources regionally and locally. The maps students make can help them explore current and potential resource use by their project communities.
Objectives: Students will use GIS to map and identify geologic
resources near their Project Communities. Estimated Time: 30 minutes Correlation to Alaska Standards: Geography E-2 Recognize and assess local, regional, and global patterns of
resource use. BACKGROUND FOR THE TEACHER Alaska is known around the world for its wealth of geological resources. Fuels in the form of oil and natural gas, and minerals that include gold and silver are fundamental to the health of the state and local economies. Some resources are less appreciated, like the gravel needed for road and building construction, but are just as essential to communities and commerce. Resources like geothermal energy are just beginning to be tapped. Students need to learn about the distribution of these natural resources to understand their influence on Alaskan history and their potential for continuing to fuel the state’s future. This lesson helps students to visualize the general statewide geography of geological resources and to identify which resources are close to their project communities. GIS tools draw upon scientific mapping data gathered by MapTEACH, but originally made available to the public from state and federal sources (primarily the Alaska State Geospatial Data Clearinghouse).

Geographic Information Systems Lesson 8 www.mapteach.org Community GIS: Natural Resources
Page 310
Some Important Concepts and Tips for Success: • Community planners promote the best use of a community’s land and
resources for residential, commercial, institutional, and recreational purposes. They address environmental, economic, and social health issues of a community as it grows and changes.
• If possible, bring in a local expert to talk about their work with geological resources, and the role maps play in it.
• Oil and natural gas are often found together, in fields up to several hundred kilometers across, often dotted by wells that extract these resources. The slow decay of ancient organic matter deep under the Earth's surface creates these fields.
• Coal deposits can also be found in fields covering large areas. This energy resource is extracted from both surface and underground mines.
• A mineral is any substance created through geological processes that is chemically distinct from others, unlike rocks that are a mixture of minerals. Mining minerals for commercial value is an important economic activity in many Alaskan communities. The non-fuel minerals of interest are metals that include: gold, zinc, lead, silver, and copper.
• Placer gold mining, or the extraction of gold concentrated in gravel and sand deposits, takes place in operations that range from very large to very small. Most Alaskans and many visitors have tried their hand at panning for gold.
MATERIALS • Computers - one for each student is best or two students can share. The
computers must meet the following specifications to run AEJEE: o Macintosh: MacOS 10.3 or above, 100 MB hard drive space, Internet
connection; recommend G4 or faster processor and more than 64 MB RAM o Windows: Win2000 or WinXP, 100 MB hard drive space, Internet
connection; recommend Pentium III or faster processor and more than 64 MB RAM
• AEJEE software can be provided by MapTEACH on a CD delivered to you, or you can download the correct version from our website at http://www.mapteach.org• MapTEACH GIS data also can be sent on a CD or downloaded from our website at http://www.mapteach.org • Copies of student directions for the lesson
INSTRUCTIONAL PROCEDURES
Getting Ready As always, try out the lesson on a classroom computer ahead of time. Gear-up • Many students (and teachers!) have spent some amount of time out
’looking for color’ and panning for gold is a good practical point of reference to talking about the distribution of geologic resources. Students

www.mapteach.org Geographic Information Systems Lesson 8 Community GIS: Natural Resources
Page 311
can describe the kinds of places and general locations that may produce significant amounts of precious metals. This lesson’s topic can also be introduced by asking student where relatives or friends are working in the oil or gas industry, or by talking about recent big finds or developments. The important goal here is to help students correlate their personal and anecdotal knowledge of resources with a systematic mapping of geologic resources based on the work and research of geoscientists.
• Restrict or prevent student access to distracting activities like chat, email
or social networking sites. • Point out to students that this is another activity where they bring their
GIS skills ‘home’. Encourage them to think ahead to how maps can help their project communities make best use of land and resources.
TEACHER RESOURCES Secondary level education resources identified or developed by the US Geological Survey can be found at http://education.usgs.gov/common/secondary.htm The GEODE educational project hosts an online map of worldwide geological resources and hazards at http://geode.usgs.gov RESOURCES FOR STUDENTS OR TEACHERS Guide to Alaska Geologic and Mineral Information (2004) states that it is “intended to be a jumping-off point for basic and specialized research into the geology of Alaska, and the resources and issues involved in exploration for metallic mineral deposits in Alaska. It is designed to give users a broad overview of the many resources available to them—from library facilities and holdings to State and Federal agencies that publish research and oversee mining and exploration activities to online databases, publications, and catalogs.” http://wwwdggs.dnr.state.ak.us/pubs/pubs?reqtype=citation&ID=3318 Alaskan Oil and Gas Studies website at the US Geological Survey lays out an overview of several energy-related efforts currently under way in Alaska. Geographically, these range from the Alaska Peninsula to the North Slope. Several are collaborative efforts with Federal and State agencies and Alaska Native villages. Links to GIS data are included. http://energy.usgs.gov/alaska/ Alaska’s North Slope is an online interactive map from National Geographic (Sep. 2006). Some see Alaska's North Slope as a lush ecosystem that needs more protecting. Others see it as a storehouse of oil—up to 48 billion barrels—waiting to be tapped, and needed for economic development and national security. The

Geographic Information Systems Lesson 8 www.mapteach.org Community GIS: Natural Resources
Page 312
Arctic National Wildlife Refuge has been at the center of the debate, but leases have spread westward on the North Slope. http://ngm.nationalgeographic.com/ngm/0605/feature1/map.html The Alaska Science Center site leads to a comprehensive overview of natural resources (including geological) issues and natural hazards assessments in Alaska and circumpolar regions. See their interactive map portal for information and reports about places in Alaska. http://alaska.usgs.gov/index.php To learn more about Coal Resources, which account for more than 50% of the nation’s electrical energy, start at the USGS site. http://energy.usgs.gov/coal.html USGS Mineral Resources Data System (MRDS) describes metallic and nonmetallic mineral resources throughout the world and a smaller data set for North America, including Alaska. Included are deposit name, location, commodity, deposit description, geologic characteristics, production, reserves, resources, and references. Requires selectively downloading data sets as shapefiles. http://tin.er.usgs.gov/mrds/ The Planning and Land Management Section for the state Division of Community and Regional Affairs includes links to Community Profile Maps (require installation of Mr. SID format viewer) See http://www.commerce.state.ak.us/dca
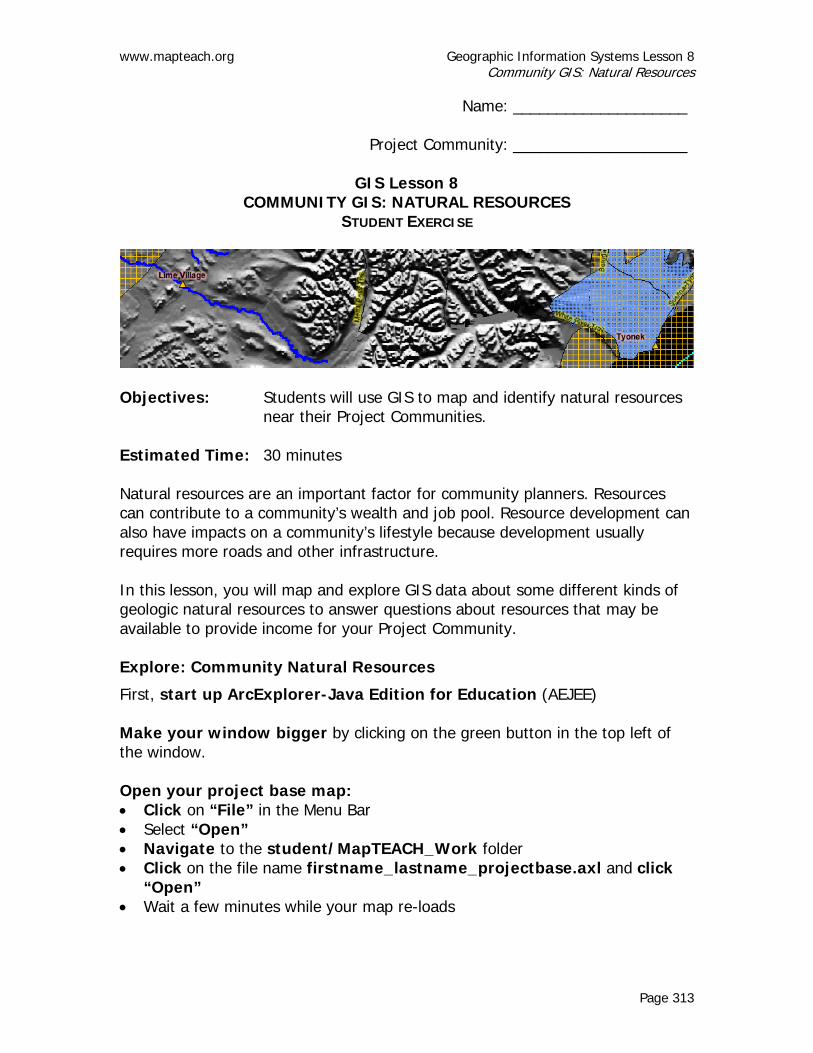
www.mapteach.org Geographic Information Systems Lesson 8 Community GIS: Natural Resources
Page 313
Name: ____________________ Project Community: ____________________
GIS Lesson 8
COMMUNITY GIS: NATURAL RESOURCES STUDENT EXERCISE
Objectives: Students will use GIS to map and identify natural resources near their Project Communities.
Estimated Time: 30 minutes Natural resources are an important factor for community planners. Resources can contribute to a community’s wealth and job pool. Resource development can also have impacts on a community’s lifestyle because development usually requires more roads and other infrastructure. In this lesson, you will map and explore GIS data about some different kinds of geologic natural resources to answer questions about resources that may be available to provide income for your Project Community. Explore: Community Natural Resources
First, start up ArcExplorer-Java Edition for Education (AEJEE) Make your window bigger by clicking on the green button in the top left of the window. Open your project base map: • Click on “File” in the Menu Bar • Select “Open” • Navigate to the student/MapTEACH_Work folder • Click on the file name firstname_lastname_projectbase.axl and click
“Open” • Wait a few minutes while your map re-loads

Geographic Information Systems Lesson 8 www.mapteach.org Community GIS: Natural Resources
Page 314
1. Add Oil_and_Gas_Basins from the Resources folder. This polygon layer shows Alaskan oil and gas deposits. • Move Oil_and_Gas_Basins so it is on top of the shaded relief layer. • Symbolize the oil and gas layer any way you like so it looks good on
your map – since this is a polygon layer, you may want to use a pattern instead of a solid color so you can see the shaded relief that is underneath it.
Your map might look something like this:
Is your Project Community located in an oil and gas basin? ______________ How far away is the nearest oil and gas basin? ___________ miles (Use the Measure tool.) Do you think that oil and gas are potential resources for your Project Community? __________________ Why or why not? ________________________________________________ ______________________________________________________________
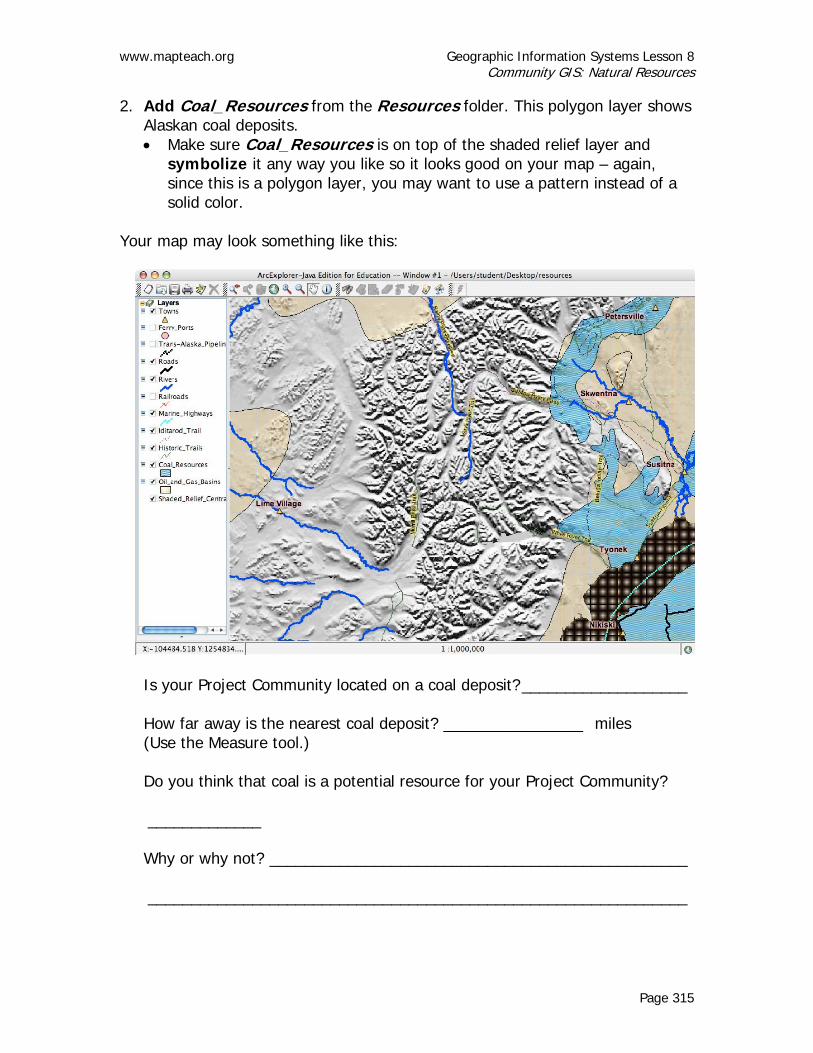
www.mapteach.org Geographic Information Systems Lesson 8 Community GIS: Natural Resources
Page 315
2. Add Coal_Resources from the Resources folder. This polygon layer shows Alaskan coal deposits. • Make sure Coal_Resources is on top of the shaded relief layer and
symbolize it any way you like so it looks good on your map – again, since this is a polygon layer, you may want to use a pattern instead of a solid color.
Your map may look something like this:
Is your Project Community located on a coal deposit? ___________________ How far away is the nearest coal deposit? ________________ miles (Use the Measure tool.) Do you think that coal is a potential resource for your Project Community? _____________ Why or why not? ________________________________________________ ______________________________________________________________
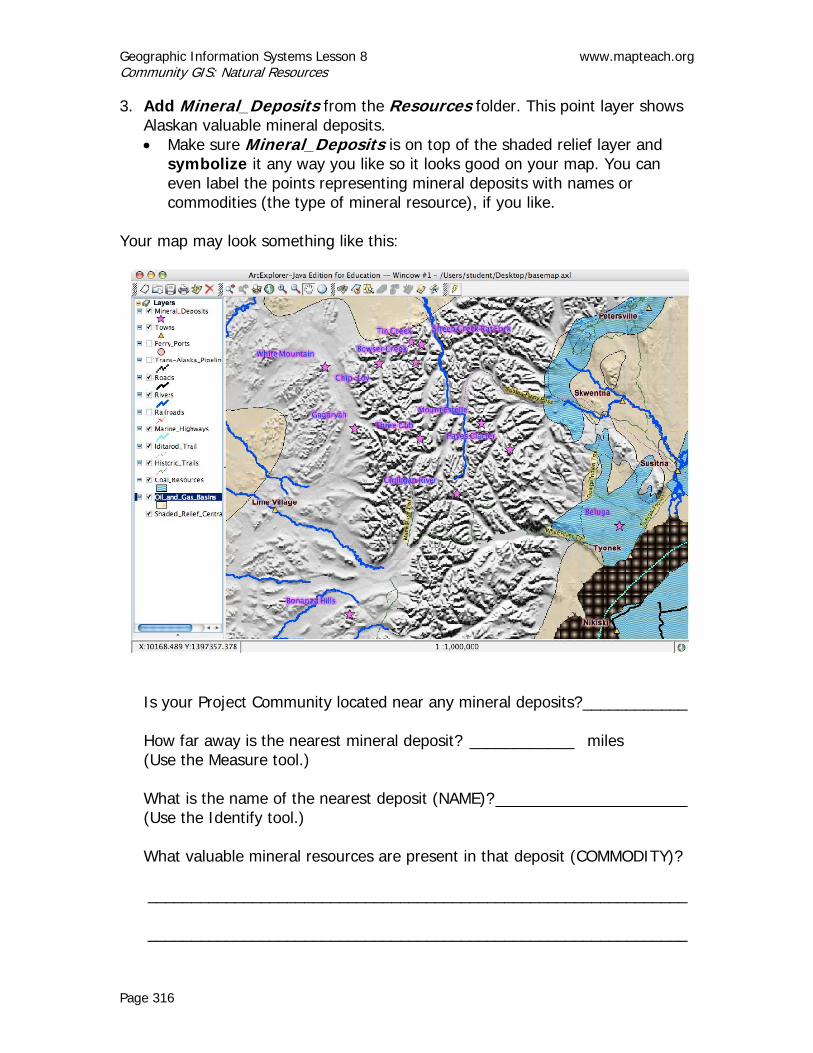
Geographic Information Systems Lesson 8 www.mapteach.org Community GIS: Natural Resources
Page 316
3. Add Mineral_Deposits from the Resources folder. This point layer shows Alaskan valuable mineral deposits. • Make sure Mineral_Deposits is on top of the shaded relief layer and
symbolize it any way you like so it looks good on your map. You can even label the points representing mineral deposits with names or commodities (the type of mineral resource), if you like.
Your map may look something like this:
Is your Project Community located near any mineral deposits?____________ How far away is the nearest mineral deposit? ____________ miles (Use the Measure tool.) What is the name of the nearest deposit (NAME)?______________________ (Use the Identify tool.) What valuable mineral resources are present in that deposit (COMMODITY)? ______________________________________________________________ ______________________________________________________________

www.mapteach.org Geographic Information Systems Lesson 8 Community GIS: Natural Resources
Page 317
Use this list of most of the industrial minerals found in Alaska to help answer the question above. A complete, official list of Mineral Map Symbols can be found by searching on the USGS site at http://minerals.usgs.gov/minerals/pubs/country/maps/mapkey.html Silver Ag Carbonatite C Jade J Tin Sn Aluminum Al Calcium
Carbonate CaCO3 Molybdenum Mo Tantalum Ta
Arsenic As Coal Coal Niobium Nb Thorium Th Asbestos Asb Chromium Cr Nickel Ni Titanium Ti Gold Au Copper Cu Lead Pb Uranium U Barite Ba Iron Fe Platinum
Group Elements*
PGE Vanadium V
Beryllium Be Fluorine Fl Rare Earth Elements**
REE Tungsten W
Bismuth Bi Mercury Hg Antimony Sb Zinc Zn * The six platinum group metallic elements are Platinum (Pt), Palladium (Pa), Iridium (Ir), Osmium (Os), Rhodium (Rh), and Ruthenium (Ru). ** Rare Earth Elements include thirty elements in the Lanthanide and Actinide Series. You can learn more about the worldwide supply, demand, and flow of minerals and materials essential to the U.S. economy, national security, and protection of the environment by starting at http://minerals.usgs.gov/minerals/pubs/commodity/ and by searching online.
Do you think that mineral deposits are potential resources for your Project Community? __________________________ Why or why not? ________________________________________________ ______________________________________________________________ This GIS lesson has dealt only with geologic natural resources. Based on your knowledge about Alaska and your Project Community, what other kinds of natural resources do you think might be available for your community? ______________________________________________________________ ______________________________________________________________ ______________________________________________________________

Geographic Information Systems Lesson 8 www.mapteach.org Community GIS: Natural Resources
Page 318
Do you think these other types of natural resources could be mapped using GIS? __________________
4. Save your map project:
• Click on “File” in the Menu Bar • Select “Save As” • Navigate to the student/MapTEACH_Work folder • Name the project using your full name followed by “resources”:
firstname_lastname_resources You now have a project that contains all the resources layers. If you decide you want to make a geologic natural resources map of your Project Community for your final project, this is the GIS project file that you can use to start with. Have your teacher review your work. Teacher sign-off: ___________________________ (REMEMBER TO SAVE YOUR PROJECT!!)

www.mapteach.org Geographic Information Systems Lesson 9 Community GIS: Land Management
Page 319
GIS Lesson 9 COMMUNITY GIS: LAND MANAGEMENT
TEACHER INFORMATION
Lesson Summary: Who decides what is done with land in Alaska? This lesson
provides students with a way to see some of the perspectives different stakeholders use to manage the land. Using GIS tools and information, the students are able to investigate the distribution of resources both regionally and locally by starting from their project community or game management units and moving outward. The maps students make can help them explore current and potential resource use by their project communities.
Objectives: Students will explore a variety of GIS data sets that can be
helpful for community planning, and answer questions relevant to their Project Communities. They will also learn to use more GIS tools to analyze data.
Estimated Time: 1 hour Correlation to Alaska Standards: Geography A-4 Use graphic tools and technologies to depict and interpret
the world’s human and physical systems.
Geography F-6 Utilize geographic knowledge and skills to support interdisciplinary learning and build competencies required of citizens.
BACKGROUND FOR THE TEACHER The relative abundance of land in Alaska relative to the number of residents only makes individual understanding and participation in land management more essential and influential. At the same time, huge tracts of land are already spoken for; often controlled by governmental, non-governmental and private

Geographic Information Systems Lesson 9 www.mapteach.org Community GIS: Land Management
Page 320
entities that are geographically and culturally distant from local communities. The better students understand the status of land and the many stakeholders who have roles in making decisions about the land, the better they can participate as citizens. This lesson is just one way for students to begin to understand what is going on from a mapping perspective. For broader and deeper perspectives that can inform other curricular activities, resources available through the Planning and Land Management Section of the state Division of Community and Regional Affairs provide information for Alaska communities at: http://www.commerce.state.ak.us/dca/planning/planning.htm Some Important Concepts and Tips for Success: • Community planners promote the best use of a community’s land and
resources for local residents, businesses, government organizations and native corporations. They address environmental, economic, and social health issues of a community as it grows and changes.
• If time and the curriculum allow, bringing in a local expert or other active stakeholder to talk with students about the maps they are making is an excellent supplementary activity.
MATERIALS • Computers - one for each student is best or two students can share. The
computers must meet the following specifications to run AEJEE: o Macintosh: MacOS 10.3 or above, 100 MB hard drive space, Internet
connection; recommend G4 or faster processor and more than 64 MB RAM o Windows: Win2000 or WinXP, 100 MB hard drive space, Internet
connection; recommend Pentium III or faster processor and more than 64 MB RAM
• AEJEE software can be provided by MapTEACH on a CD delivered to you, or you can download the correct version from our website at http://www.mapteach.org• MapTEACH GIS data also can be sent on a CD or downloaded from our website at http://www.mapteach.org • Copies of student directions for the lesson
INSTRUCTIONAL PROCEDURES
Getting Ready This is an interesting lesson to try out ahead of time, since you as a teacher can learn some new things about how land is managed for and around the community where you teach, or any other place of interest to you in Alaska. Gear-up • Everyone spends time out on the land for many different reasons, so this
is another lesson where students can describe personal observations and
www.mapteach.org Geographic Information Systems Lesson 9 Community GIS: Land Management
Page 321
experiences that bring meaning to the lesson. The lesson can be introduced by asking students questions about how local land status has affected them, their families and friends - all stakeholders with valuable insights to share.
• The “buffer” concept may be worth introducing, to help ready the student for using a GIS buffer in this lesson. A buffer is an area of specified distance (radius) around a map feature or features.
• Check in on students’ progress throughout the lesson to keep them on track to finish on time. Restrict or prevent student access to distracting activities like chat, email or social networking sites.
• Point out to students that this is another activity where they bring their GIS skills ‘home’. Encourage them to think ahead to how maps can help their project communities make the best use of land and of stakeholder participation in community decisions.
TEACHER RESOURCES The Alaska Economic Development Resource Guide is designed to bring together in one place an inventory of programs and services which can provide economic development assistance to Alaska communities and businesses. http://www.commerce.state.ak.us/dca/edrg/EDRG.htm Get the word out about your students’ Alaskan community projects by contacting staff at MapTEACH or by submitting projects to the ESRI Community Atlas program. http://www.esri.com/industries/k-12/atlas/index.html RESOURCES FOR STUDENTS OR TEACHERS The Planning and Land Management Section for the state Division of Community and Regional Affairs provides assistance to Alaska communities on regional and local land issues. http://www.commerce.state.ak.us/dca/planning/planning.htm High water lines from historic floods are one of the features included in Alaskan Community Profile Maps. These maps can be viewed over the internet after the installation of a Mr. SID format viewer. These maps cannot be viewed using AEJEE. http://www.commerce.state.ak.us/dca/profiles/profile-maps.htm The Alaska Dept. of Commerce provides information and overviews for communities via the Community Database Online at http://www.commerce.state.ak.us/dca/commdb/CF_COMDB.htm An extensive collection of community photos throughout Alaska recognize the uniqueness of life in Alaska, and offer a glimpse of communities, their environment, events and everyday life. Find photos of your community at http://www.commerce.state.ak.us/dca/photos/comm_list.cfm

Geographic Information Systems Lesson 9 www.mapteach.org Community GIS: Land Management
Page 322
To see economic information by borough or census area, click on the Alaska map at http://www.commerce.state.ak.us/dca/AEIS/AEIS_Home.htm Community plan documents can be found in the Plans Library and can provide students with background information, history and current plans for their project communities. http://www.commerce.state.ak.us/dca/commdb/CF_Plans.cfm

www.mapteach.org Geographic Information Systems Lesson 9 Community GIS: Land Management
Page 323
Name: ____________________ Project Community: ____________________
GIS Lesson 9 COMMUNITY GIS: LAND MANAGEMENT
STUDENT EXERCISE
Objectives: Students will explore a variety of GIS data sets that can be helpful for community planning, and answer questions relevant to their Project Communities. They will also learn to use more GIS tools to analyze data.
Estimated Time: 45 minutes By the end of this lesson, you will be able to work with data layers of land ownership and management and use some new GIS tools to answer questions that are important for community planning projects. Young people like you are among the many different kinds of stakeholders who want to influence how land is managed. Stakeholders are people who will be impacted by decisions made about the land, and may include individuals, communities, and governments. These stakeholders may be local residents, landowners, leaseholders, managers, or other people who have other relationships with community land. Planners need to be aware of who the stakeholders are in their area so they can work with everyone and make sure that important concerns and issues are addressed. First, start up ArcExplorer-Java Edition for Education (AEJEE) Make your window bigger by clicking on the green button in the top left of the window.

Geographic Information Systems Lesson 9 www.mapteach.org Community GIS: Land Management
Page 324
Open your project base map: • Click on “File” in the Menu Bar • Select “Open” • Navigate to the student/MapTEACH_Work folder • Click on the file name firstname_lastname_projectbase.axl and click
“Open” • Wait a few minutes while your map re-loads The data layers we are going to be working with will be easier and faster to work with if we turn off the shaded relief raster image, so do so now. Explore 1: Game Management Units 1. Add Game_Management_Units from the Management folder. This layer
shows the Game Management Units from the Alaska hunting and fishing regulations. It tells a community what the seasons and bag limits are on fish and game in their area.
2. Symbolize the Game_Management_Units the way you like them, using
“UNIT” as your Field for values. • Notice that there are some “extra” lines within the Game Management
Units. This is because each unit in this data set is also broken into subunits.
• You can make the map draw more neatly if you check the “Remove Outline” box in the Properties window.
Use the “Identify” tool to answer these questions: What Game Management Unit is your Project Community in (UNIT)? _____________________________

www.mapteach.org Geographic Information Systems Lesson 9 Community GIS: Land Management
Page 325
What Game Management Subunit is your Project Community in (SUB)? __________________ When you have more time, you might be interested in looking up your Project Community’s hunting and fishing regulations online at the Alaska Department of Fish and Game website: http://www.adfg.state.ak.us/
Save your map project: • Click on “File” in the Menu Bar • Select “Save As” • Navigate to the student/MapTEACH_Work folder • Name the project using your full name followed by “management”:
firstname_lastname_management Explore 2: Native Corporations 1. Turn off Game_Management_Units. 2. Add Native_Corporations from the Management folder. This layer shows
the Native Corporation boundaries. 3. Symbolize the Native_Corporations the way you like them, using
“NAT_CORP” as your Field for values.
What Native Corporation is your Project Community in (NAT_CORP)? (Use the “Identify” tool) _____________________________
Explore 3: Wildlife Refuges 1. Turn off Native_Corporations. 2. Add Wildlife_Refuges from the Management folder. This layer shows the
boundaries of Alaska’s special use areas including Parks, Preserves, Monuments, Wildlife Refuges, and Conservation Areas.
3. Symbolize the Wildlife_Refuges the way you like them, using “NAME” as
your Field for values. If you want, you can also label the areas in this layer using “NAME.”

Geographic Information Systems Lesson 9 www.mapteach.org Community GIS: Land Management
Page 326
What special use area is your Project Community closest to (NAME)? (Use the “Identify” tool) ______________________________________________________________ How far away is the nearest special use area? ____________________ miles (Use the “Measure” tool)
Explore 4: Using the Buffer Tool to Query Land Status Up until now, we have used the Info tool to find out information about features in our AEJEE projects. Now we’re going to do something a little more advanced to ask questions about, or query, our data. We will do a special kind of query using the AEJEE Buffer tool to answer the question “Who are the owner-stakeholders for the area within 25 miles of my Project Community?” First, let’s set up our map data: 1. Turn off Wildlife_Refuges. 2. Add Land_Status from the Management folder. This layer shows general
land ownership for Alaska. This is a really large data set, so it will be somewhat slow to draw.
3. Symbolize Land_Status the way you like it, using “STATUS” as your
Field for values.
A warning message will appear on the screen because this is a very big data set. Click “Yes.”

www.mapteach.org Geographic Information Systems Lesson 9 Community GIS: Land Management
Page 327
Change the colors until you like the way they look. Here is an example – you don’t have to do it exactly like this:
Let’s get the map area set up a little better before we begin our query: 1. First, refresh the projection for your map. Use Tools/Projection to open
the Select Coordinate Systems window to set your projection to Regional Projections/Albers Equal Area (Ellipsoid)/Alaska, and leave the “Datum” as “NAD83 (North American Datum 1983).” Set the “Transformation” to NAD83 – Alaska
If you want to assign custom colors to individual values, click on the colored box and you will get the rainbow palette to choose from

Geographic Information Systems Lesson 9 www.mapteach.org Community GIS: Land Management
Page 328
2. Click “OK” and wait patiently until the map redraws.
3. Zoom in to your Project Community at a scale of 1:500,000 using the “Zoom To Scale” tool in the View menu. Remember to click the magnifying glass button to apply the scale setting.
4. Pan so your Project Community is in the center of your screen. It’s time to begin the query process: 1. Click on Towns in the Table of Contents to highlight it blue (this means it
has been selected as the layer we are going to be querying).
2. Click on the “Select Features” button
on the menu bar and select “Rectangle” from the menu.

www.mapteach.org Geographic Information Systems Lesson 9 Community GIS: Land Management
Page 329
3. Click and drag a small box on your map just around the symbol for
your Project Community. The symbol representing your Project Community should become highlighted on your map.
Have your teacher check your selection. Teacher sign-off: ___________________________ (Confirm that only the student’s Project Community is highlighted) Use the Buffer tool: 1. Now, click on the “Buffer” button on the menu bar.
2. In the Buffer window, type in “25” for Buffer Distance and keep “Miles”
for Buffer Units.
3. Click “Apply.”

Geographic Information Systems Lesson 9 www.mapteach.org Community GIS: Land Management
Page 330
4. Your screen should look something like this (but with your project
community in the center):
You could use this 25-mile radius circle to visually determine who the stakeholders are within 25 miles of your Project Community, but GIS has a better way:
5. In the Buffer window, click the box for “Use buffer to select features
from this layer” and select “Land_Status” from the drop-down menu.
6. Click “OK.” All the Land_Status blocks within 25 miles of your Target
Community should now be highlighted. You might need to wait a minute or two for it to find all the areas and highlight them.

www.mapteach.org Geographic Information Systems Lesson 9 Community GIS: Land Management
Page 331
7. Click on Land_Status in the Table of Contents to highlight it.
8. Now, click on the “Attributes” button on the menu bar.
The Attributes window will appear, listing all the Land_Status information for the blocks within 25 miles of your Project Community.
Have your teacher check your project. Teacher sign-off: ___________________________ (Confirm that the student has an appropriate Attributes window)

Geographic Information Systems Lesson 9 www.mapteach.org Community GIS: Land Management
Page 332
Scroll down the list of features in the Attributes window to see the land status of the area you selected with the buffer. Based on the results in your Attributes window, list the stakeholders for the area within 25 miles of your Project Community (you probably won’t need all the spaces below): 1. _______________________________________________________________
2. _______________________________________________________________
3. _______________________________________________________________
4. _______________________________________________________________
5. _______________________________________________________________
6. _______________________________________________________________
7. _______________________________________________________________
8. _______________________________________________________________
Close the Attributes window by clicking the red button on the top left of the window. Now, click on the “Clear All Selections” button on the menu bar. This will clear the highlights from your screen. This ‘eraser’ resets the map.

www.mapteach.org Geographic Information Systems Lesson 9 Community GIS: Land Management
Page 333
Explore 5: Finishing the Land Status Map The shaded relief base layer may not display well with all this polygon data. You can try it out, but will need to use patterns for your land status for the shaded relief to show through your data. An alternative way to have a map with enough geographic features to make it informative is to add Lakes and Glaciers from the Landscape folder. If your area does not have any lakes or glaciers, you can turn those layers off or remove them. You can also turn off any other layers that do not appear in your map view, since you won’t see them in your map anyway. Only if you are on the coast:
• Add Coastline from the Base_Data folder. • Move Coastline to just below Towns in the Table of Contents. • Ctrl-Click on the Coastline layer to open the Properties window, use the
Style box and its pull-down menu to choose “Transparent Fill” and click on the “OK” button.
Symbolize the remaining visible layers to make them look the way you like them. Your map might look something like this:

Geographic Information Systems Lesson 9 www.mapteach.org Community GIS: Land Management
Page 334
You now have a project that contains all the management layers. If you decide you want to make a land management, land status, or stakeholders map of your Project Community for your final project, this is the GIS project file that you can use to start with. Save your personalized “Community GIS: Land Management” map project. Show your map to a teacher. Teacher sign-off: ___________________________ (REMEMBER TO SAVE YOUR PROJECT!!)

www.mapteach.org Geographic Information Systems Lesson 10 Good Map – Bad Map
Page 335
GIS Lesson 10 GOOD MAP – BAD MAP
TEACHER INFORMATION
Lesson Summary: The teacher reviews the basic cartographic guidelines, and
then shows an example AEJEE map that is cartographically incorrect, incomplete, and poorly designed. Students critique the map. A correct, complete, and attractively designed map is then reviewed for comparison.
Objectives: Students will apply the principles of good cartography to
critically evaluate maps for completeness, correctness, and aesthetic appeal.
Estimated Time: 30 minutes Correlation to Alaska Standards: Arts C-1 Know the criteria used to evaluate the arts; these may
include craftsmanship, function, organization, originality, technique, and theme.
Arts C-3 Accept and offer constructive criticism.
Arts C-4 Recognize and consider an individual’s artistic expression.
Arts C-5 Exhibit appropriate audience skills.
Geography A Make and use maps, globes, and graphs to gather, analyze, and report spatial (geographic) information.
BACKGROUND FOR THE TEACHER Cartography is defined as the science of making maps, but it is also an art. There are many different kinds of maps, and how map information is depicted is highly dependent on the type of information and the intent of the map. The cartography “Student Checklist for Success” sheet provides a good overview of elements that are desirable in cartographically-correct AEJEE maps, as well as some guidelines to help make good decisions about cartographic design elements.

Geographic Information Systems www.mapteach.org Good Map – Bad Map
Page 336
This exercise can be used before students have done a layout in AEJEE to help them think about what constitutes a “good” map as they begin working on their own map. It can also be used very effectively after students have already had the experience of making a layout of their own and are ready to take their cartography skills up to the next level. MATERIALS • At least one example each of a good AEJEE map and a bad AEJEE map,
preferably prepared by the teacher, for use as an overhead or as part of a PowerPoint that can be projected on the screen; or, use the examples provided in the “Map Layouts and Cartography” PowerPoint.
• "Map Layouts and Cartography" PowerPoint, available from MapTEACH • Copies of cartography handout Student Checklist for Success • Blackboard/whiteboard or flip-chart, with appropriate chalk or markers INSTRUCTIONAL PROCEDURES
Getting Ready If you wish, prepare your own good and bad map layouts in AEJEE, export them to JPG format, and print as overheads or place in the “Map Layouts and Cartography” PowerPoint to use instead of (or in addition to) the examples that are provided. Gear-up • Ask students what sorts of things they would expect or want to see on a
professional map. Prompt them with questions that will guide them to recognize that it would be important to have things like a scale, title, north arrow, author, date, etc.
• Explain that cartography is the science of making maps, and that people who professionally make maps are called “cartographers.” Cartography has a lot of rules and guidelines, but the biggest mission for mapmakers is to make their maps attractive and easy to understand by their audience. A well-made map is a work of art as much as it is a product of science.
• Use the “Map Layouts and Cartography” PowerPoint cartographic basics slides to review all the things that should be included on a map, and design guidelines that will help students succeed in making professional-looking map products. (Note: you may choose to wait to show this until after the students have first critiqued the maps using their own ideas and opinions of what makes a map “good” or “bad.”)
• Explain that you have been making maps in AEJEE just like they have (or will be), and that you are anxious to show them what you can do. In this exercise they will get a chance to evaluate some maps that you, the teacher, made in AEJEE!

www.mapteach.org Geographic Information Systems Lesson 10 Good Map – Bad Map
Page 337
Explore • Project the “bad” map on the screen and ask students what they think of
your fine map example. Use the flip-chart or the board to write down each item the students find that is bad. As they make their criticisms, ask them what could be done to correct each problem. Write each “fix” next to the problem. o Students love it when you ham it up – if they say something is wrong
on the map, prompt them to elaborate by saying things like “What’s wrong with my map title? My cool MaPe is a perfectly good title – it’s my map, and it’s cool!” or “What do you mean there’s no north arrow? It’s right there in the middle of the map – it just happens to be the same color as the feature it’s sitting on top of…”
• Project the “good” map on the screen and ask students what they think of this one. Use the flip-chart or the board to record their observations.
Generalize Pass out the cartography “Student Checklist for Success” handout and ask them if there is anything that they would change if the “good map” were their map. Explain that good cartography is an art as well as a science, and that many design decisions are based on personal preference. You do not expect or want everybody’s maps to look the same! Apply/Assess GIS lesson “Map Layouts.”
TEACHER RESOURCES Guidance for very basic map design principles can be found at ESRI at: http://www.esri.com/industries/k-12/download/docs/intrcart.pdf A very interesting book that investigates how maps have been used to control perceptions and interpretations of geospatial information: Monmonier, Mark. 1996. How to Lie with Maps. University of Chicago Press. The classic handbook of cartography: Robinson, Arthur H., Morrison, Joel L., Muehrcke, Phillip C., and Kimerling, A. Jon. 1995. Elements of Cartography. Wiley, John & Sons, Incorporated.


www.mapteach.org Geographic Information Systems Lesson 10 Good Map – Bad Map
Page 339
Date: ____________________ Name: ______________________
Student Checklist for Success: Cartography and Map Layout for Final Project
Check off every item in this list to make sure you have a complete final map that follows good cartographic principles. Before You Start
Map has a clearly defined theme – what is the message you are trying to get across to the viewer? This theme will be reflected in your title, your descriptive text, and the data you choose to represent on the map.
In Map View
If appropriate, map includes a suitable raster base layer (topographic map, SPOT5 satellite image, or Landsat satellite image)
You can only choose one for your layout, so think about:
• Your map theme: which base layer will help you get your message across best?
• How large an area your data points spread out over: if your points cover a small area, use a base layer with lots of detail; if your points cover a large area, use a base layer with less detail.
• Legibility and ease of reading: which base layer allows you to see your data better when you plot your points on top of it?
Map includes your selected data points, symbolized and labeled so they are legible and informative. • Symbol sizes and colors show up well on the base layer and don’t interfere
with each other.
• Label text is a legible font style, color, and size, and shows up well on the base layer.
Map area is zoomed in on your selected data points and whatever other features you want to show on your map.
******************************************************** You need to get this all figured out and finalized BEFORE you go on to
the next step – you may have problems with AEJEE if you try to go back and change any of these after you have begun your layout
********************************************************

Geographic Information Systems Lesson 10 www.mapteach.org Good Map – Bad Map
Page 340
In Layout View
Map balance: elements are placed on the page so you there is an even distribution of elements covering the page and there isn’t a lot of white space.
Fonts for text and titles are carefully selected:
• Choose fonts that are easy-to-read, attractive, and fit your theme.
• Try to limit yourself to no more than two fonts; this helps your map look more uniform and professional.
• The title is usually the largest font size on the map.
Map includes the basic elements essential to a good map layout:
• Data Frame: should be large enough to adequately show the
data/features of your map.
• Title and Text: title and text should reflect your map theme - text should provide additional information about your map and data and how it relates to your map theme; it is also helpful to the viewer if you provide information about your map projection and datum.
• Legend: make sure it is legible.
• Scale: choose units that make sense for your map, usually miles or kilometers; typically placed right below the data frame.
• North Arrow: make sure it is easy to see, but not too large; typically placed next to the scale, right below the data frame.
• Author: full name, spelled out the way you would want someone to cite you if they were referencing your work.
• Date: date the map was completed; using a smaller text size, you could also include the date of the base map (if known) and date(s) that data were collected.
• Citation/Credit: give thanks and/or credit to anyone who has contributed to the data on the map, including gathering the data and sharing information or resources with you.
• Photograph: use one or more photographs that relate to your map theme and the data you are representing; be sure to include text explaining what the photo shows and who the photographer was.
• Optional overview map (also called a location map): this map shows a larger area with an outline of where your map fits into it and gives the viewer an overview of where your map area is located.

www.mapteach.org Geographic Information Systems Lesson 11 Community GIS: Map Layouts
Page 341
GIS Lesson 11 COMMUNITY GIS: MAP LAYOUTS
TEACHER INFORMATION
Lesson Summary: Students make map layouts that can be used to print paper
maps and to make graphics for reports or presentations. The lesson begins by opening the hazards project from GIS Lesson 7 “Community GIS: Geologic Hazards.” Once the hazards project is set up carefully, AEJEE is used in layout mode to add required elements and build up a cartographically complete map. The resulting layout is exported as a JPG graphics file to create a permanent map document that can be printed or used in a variety of other computer applications. The map JPG is imported into MS Word and printed.
Objectives: Students will learn to use GIS tools to produce
cartographically complete map layouts using Alaskan GIS data sets helpful for community planning.
Estimated Time: 1 hour Correlation to Alaska Standards: Geography A-6 Use spatial (geographic) tools and technologies to analyze
and develop explanations and solutions to geographic problems.
Technology A-1 Use a computer to enter and retrieve information. BACKGROUND FOR THE TEACHER Students really like working on map layouts, in spite of technical challenges, exacting instructions and nearly inevitable ‘AEJEE layout crashes’ that require them to go back and start over from their original (saved!) project. Student time and task management must be closely monitored as they enthusiastically devote so much time to tweaking the appearance of their layouts, work carefully

Geographic Information Systems Lesson 11 www.mapteach.org Community GIS: Map Layouts
Page 342
through many small steps, and try to complete and export their layout in one sitting. During the lesson students learn how to prepare a layout for their map following standard mapping conventions. These conventions include use of a scale bar, a legend, a title, and a north arrow, among other things. Up until now, we have worked with the “Map View” interface for AEJEE where all we worked with was the representation of the map data in layers. Now we will use the “Layout View” to provide a context for the map layers. In essence, the final “Map View” will be imbedded in a designed map document or layout. The Layout View mode allows students to design and print real maps that can include photographs and text to accompany the map portion of the document. However, the Layout View mode comes with a number of limitations and quirky software obstacles that this lesson will try to help you and your students navigate around. Some important concepts and tips for success: • Layouts in AEJEE cannot be reliably saved and MUST be done in a single
session! Do not let students begin working on a layout if they do not have enough time to finish it to your satisfaction, or their work will be lost.
• Make a backup copy (or do a Save As…) of your final map view starting point before switching to Layout View. This will allow you to start over should your map layout become corrupted.
• Symbology and labels should appear exactly the way the student wants them to look before switching to Layout View in AEJEE. Changing the symbology and labels after entering layout view can cause problems.
• Students should simplify their maps in Map View by removing unnecessary layers BEFORE moving into Layout View.
• Do not switch back and forth between Layout View and Map View. Once you are in Layout View, stay there.
• Photos placed in an AEJEE layout will default to a square shape. Resizing the photo using the corners of the square will stretch or squash the image, so students should be observant of what their photos look like in their final layouts.
• Students should not change the scale of their map document after they enter Layout View in AEJEE. Redraw times are very long if the scale is changed, and it is much better to leave the document at the default scale.
• If the student is having trouble selecting a map element (scale bar, north arrow, text, etc.) that is on top of the map data frame, have them click on the white space around the map (called the “collar”), then click on the map

www.mapteach.org Geographic Information Systems Lesson 11 Community GIS: Map Layouts
Page 343
data frame, and then move the data frame out of the way. The map element can then be selected and moved well off to the side. The map data frame can then be selected and moved back into place, and the map element can be selected and placed where the student wants it to be.
• If the student moves a map element too far off to the side of the layout page, AEJEE may not be able to select the element. If the map element is far off to the side and the student is unable to select it, use the “Fixed zoom out” tool to expand the view of the layout page. You can then select the out-of-bounds map element and move it back into the work area. Then use the “Fixed zoom in” tool to return to the original view of the page
• Keep in mind the general guidelines for cartography and working with map
layouts in AEJEE: • Map should have a clearly defined subject, or theme – a purpose for the map,
or the story that the map is meant to tell • Map should include data points that are symbolized and labeled so they are
legible and informative o Symbol sizes and colors should show up well on the base layer and
shouldn’t interfere with each other o Label text should be a legible font style, color, and size, and show up well
on the base layer o Important Tip: When working in AEJEE layouts, make text and
symbols for points much bigger than you think they should be; they end up looking smaller in the final printed map
• Map area should be zoomed in on the selected data points and whatever other features that should be included on the map
• Map balance o Elements should be placed on the page so there is an even distribution of
elements covering the page and there isn’t a lot of white space • Fonts for text and titles should be carefully selected
o Fonts should be chosen that are easy-to-read, attractive, and fit the theme of the map
o Try to limit fonts to no more than two; this helps the map look more uniform and professional
o The title is usually the largest font size on the map
First, use “Fixed zoom out” to expand the view, then select the map element and move it
Then use “Fixed zoom in” to return the layout page to the original view

Geographic Information Systems Lesson 11 www.mapteach.org Community GIS: Map Layouts
Page 344
MATERIALS • Computers: one for each student is best or two students can share. The
computers must meet the following specifications to run AEJEE: o Macintosh: MacOS 10.3 or above, 100 MB hard drive space, Internet
connection; recommend G4 or faster processor and more than 64 MB RAM o Windows: Win2000 or WinXP, 100 MB hard drive space, Internet
connection; recommend Pentium III or faster processor and more than 64 MB RAM
• AEJEE software can be provided by MapTEACH on a CD delivered to you, or you can download the correct version from our website at http://www.mapteach.org• MapTEACH GIS data also can be sent on a CD or downloaded from our website at http://www.mapteach.org • Copies of student directions for the lesson • One or more saved AEJEE map projects that students have saved from
previous GIS lessons. INSTRUCTIONAL PROCEDURES
Getting Ready • Have a strategy for saving and/or printing the students’ Layout View
outputs. Since saving AEJEE layout files is problematic and unreliable, you will use AEJEE to export and save layouts as JPG files in this lesson.
• Check, update and/or maintain all student equipment including computers so everything works as smoothly as possible.
• Prepare materials for the lesson and try out all the activities well in advance before the students work through them.
Gear-up • Inform students that this lesson is typically a big favorite. However, while
it is fun and satisfying to make a good layout and print out your very own custom map, the only way to be successful is to follow all the instructions very carefully.
• Ask students what sorts of things they would expect or want to see on a
generic map. Prompt them with questions that will guide them to recognize that it would be important to have things like a scale, title, north arrow, author, date, etc.
• Explain that cartography is the science of making maps, and that people
who make maps professionally are called “cartographers.” Cartography has a lot of rules and guidelines, but the biggest mission for mapmakers is to make their maps attractive and easy to understand. A well-made map is a work of art as much as it is a product of science.
• Go over the general guidelines for cartography and working with map
layouts in AEJEE. These guidelines appear on page 1 of the student

www.mapteach.org Geographic Information Systems Lesson 11 Community GIS: Map Layouts
Page 345
lesson. You can do the “Good Map – Bad Map” activity at this time, or you may wish to wait until after students have had the experience of making their first layout. Have fun with the “Good Map – Bad Map” activity. Students enjoy playing the role of critic and are sure to see important ways to improve the map layouts.
• Explain that in this lesson they will make cartographically complete maps
using the “layout” function of AEJEE. They will need to follow the instructions very carefully so they don’t leave something out or do something that will make AEJEE malfunction.
• Emphasize to students that layouts need to be completed in a single
computer session because they cannot be reliably saved and reopened later. The only permanent record of their final map will be the JPG file they generate from their layout.
TEACHER RESOURCES Guidance for map design principles can be found in this PDF from ESRI that covers the basics of map design: http://www.esri.com/industries/k-12/download/docs/intrcart.pdf TEACHER REFERENCES ESRI’s “Introduction to ArcExplorer—Java Edition for Education” available as an Adobe Acrobat PDF: http://www.esri.com/software/arcexplorer/download.html


www.mapteach.org Geographic Information Systems Lesson 11 Community GIS: Map Layouts
Page 347
Name: ____________________ Project Community: ____________________
GIS Lesson 11
COMMUNITY GIS: MAP LAYOUTS STUDENT EXERCISE
Objectives: Using GIS data sets, students will produce maps that can be helpful for community planning. They will learn to use GIS tools to produce final map layouts.
Estimated Time: 1 hour By the end of this lesson, you will be able to make map layouts in GIS to represent information that is important for community planning projects. Explore 1: Making a Layout Cartography: Cartography is the science of making maps. Planners need to be aware of good cartographic principles so they can make maps that communicate effectively with members of the community and government. Some general guidelines for good cartography include:
• The map has a clearly defined subject, or theme – a purpose for the map or the story that the map is meant to tell
• The map includes data points that are symbolized and labeled so they are legible and informative o Symbol sizes and colors show up well on the base layer and don’t
interfere with each other o Label text is a legible font style, color, and size, and shows up well on
the base layer

Geographic Information Systems Lesson 11 www.mapteach.org Community GIS: Map Layouts
Page 348
Tip: When working in AEJEE, make text and symbols for points bigger than you think they should be; they end up looking smaller on the final printed map • The map area is zoomed in on your selected data points and whatever
other features you want to show on your map • Map balance
o Elements are placed on the page so there is an even distribution of elements covering the page and there isn’t a lot of white space
• Fonts for text and titles are carefully selected o Choose fonts that are easy-to-read, attractive, and fit your theme o Try to limit yourself to no more than two fonts; this helps your map
look more uniform and professional o The title is usually the largest font size on the map
With these principles in mind, let’s make a map layout with a theme of “Geologic hazards near your Project Community.” You will use your hazards project from GIS Lesson 7 to make this layout. First, start up ArcExplorer-Java Edition for Education (AEJEE) Make your window bigger by clicking on the green button in the top left of the window. Navigate to your MapTEACH_Work folder and Open your hazards project.

www.mapteach.org Geographic Information Systems Lesson 11 Community GIS: Map Layouts
Page 349
Prepare your project to move into Layout mode: 1. Remove all extra layers that you are not using in your map. Be sure to get
rid of all layers that you have turned off because you didn’t want them to show on your map, and get rid of layers that you may have in your Table of Contents where none of the features in that layer are present in your map view (for example, remove the Volcanoes layer if there are no volcanoes in your area).
2. Make sure that everything looks just the way you want it to look on
your final map. THIS IS REALLY IMPORTANT!!! a) Make sure you are zoomed in to the area of the map that you want to
show on your map layout. If you are zoomed too far out, there won’t be enough detail to see your data very well. If you are zoomed too far in, some of your area of interest may be outside the map, and your base map image (if it is a raster data set) will look really fuzzy.
b) This is your last chance to fiddle with your fonts and symbols. It is not a good idea to change symbology in AEJEE once you’ve started the layout process.
c) Remember to make your labels and symbols for points bigger than you think they should be – they’ll show up better in the final map. The symbols for lines will show up pretty much the way they look in the regular map view.
Your map might look something like this:

Geographic Information Systems Lesson 11 www.mapteach.org Community GIS: Map Layouts
Page 350
3. Save your project. This saved file will be your backup in case something goes wrong during the layout process. You will be able to start the layout over again with everything still looking just the way you want it.
Now, let’s do the layout: 4. Start the layout process by selecting View from the main menu, and
selecting “Layout View.”
5. Wait patiently for AEJEE to redraw the map. Your map data frame will
appear to be drawn on a standard sheet of paper, measuring 8½ by 11 inches.
IMPORTANT TIP: Do not change the scale while you are working in layout view. Doing this will make your map take a REALLY long time to redraw.
Don’t change this number!
This box is called the “data frame”

www.mapteach.org Geographic Information Systems Lesson 11 Community GIS: Map Layouts
Page 351
You can check your map symbols and fonts at this point by clicking on “File” and “Export to Image.”
• Use 150 dpi for Input. • Examine your map carefully in the Export window. • If you like what you see, click “Close” and continue with the map layout
instructions below. • If you don’t like the symbols and fonts, click “Close,” exit AEJEE (don’t
save), and re-open your project to make the changes you want. The basic elements required in your final map layout include:
• Data Frame • Title and text • Legend • North Arrow • Scale Bar • Author • Date • Citation/Credit • Photograph (optional)
Follow along with these steps to add the required elements to your layout: Data Frame (this is the AEJEE “map” that you’ve been seeing all along up to this point)
• You can leave the data frame where it is, or move and change the size by selecting and dragging, or by grabbing the corner handles to change the size. Before you resize the data frame, control-click on it to choose “Properties,” go to the “Size and Position” tab, and click the box next to “Preserve Aspect Ratio.” This will maintain your map area so it doesn’t get stretched or squashed.
Title and Text • Every finished map needs a title. The title provides a very brief
introduction and overview to what the map describes. The title will most often describe the subject and location of the map.
• First click on an empty space on the layout to deselect any other elements.
• Select , the Add Text button, to insert a text box o A small box will appear on the page that says “Text.” o Drag this box to a position you like on the page.

Geographic Information Systems Lesson 11 www.mapteach.org Community GIS: Map Layouts
Page 352
o Control-Click the box and choose “Properties.” The Text Properties window will appear.
o Type in your text. You can also change the font, size and color of text by selecting the “Change Properties …” button.
More text boxes can be added using a smaller font to describe more information about your map. You should also add text to make captions for any photos you include on your map (see “Photograph” section below).
Legend • The map legend is a small table that explains the symbols used on the
map. Legends are often called “keys.” • First click on the data frame to ‘turn on’ the buttons that can add
elements that relate to the map, including the legend.
• Select , the Add Map Legend button. The map legend graphic will appear on the page and can be dragged and resized.
• Control-Click the legend element and choose “Properties” to access the options available for customizing the legend.
North Arrow
• The North Arrow orients the viewer to determine the direction of North on the map.
• First click on the data frame to ‘turn on’ the buttons that can add elements that relate to the map, including the north arrow.
• Select , the Add north arrow button. The North arrow selector window opens and presents many different styles to choose from. Choose one, drag, drop and alter the size and color so that it looks good on the layout.
Type your title or other text in here

www.mapteach.org Geographic Information Systems Lesson 11 Community GIS: Map Layouts
Page 353
Scale Bar • First click on the data frame to ‘turn on’ the buttons that can add
elements that relate to the map, including the scale bar.
• Select , the Add map scale bar button. Choose the bar you like and place it on the map. Control-Click on the scale bar element, and use “Properties” to select miles or kilometers for the units shown.
Author • Make a text box and add the author’s name. This entry may also
include where the author works or goes to school. Date
• Make a text box and add the date when the map was completed. This may be appended to the author.
Citation/Credit
• The citation tells the viewer where data for the map came from. The citation includes any necessary or important information about sources of data for the map, when data was gathered, projection information and any thing else that seems important for a person reading the map.
• Make a text box to add a citation. Some citations are brief. Photograph
• A photograph or other picture can be added when you select , the Add image button.
o If you have a digital picture of your community, you can include it on your map.
o You can resize your photo image by grabbing and using the corner
handles. Pay attention to what you’re doing, since you can stretch or squash your picture this way.
o Make sure to use the Text tool to add a caption describing the
photograph and giving credit to the photographer or source of the photo.
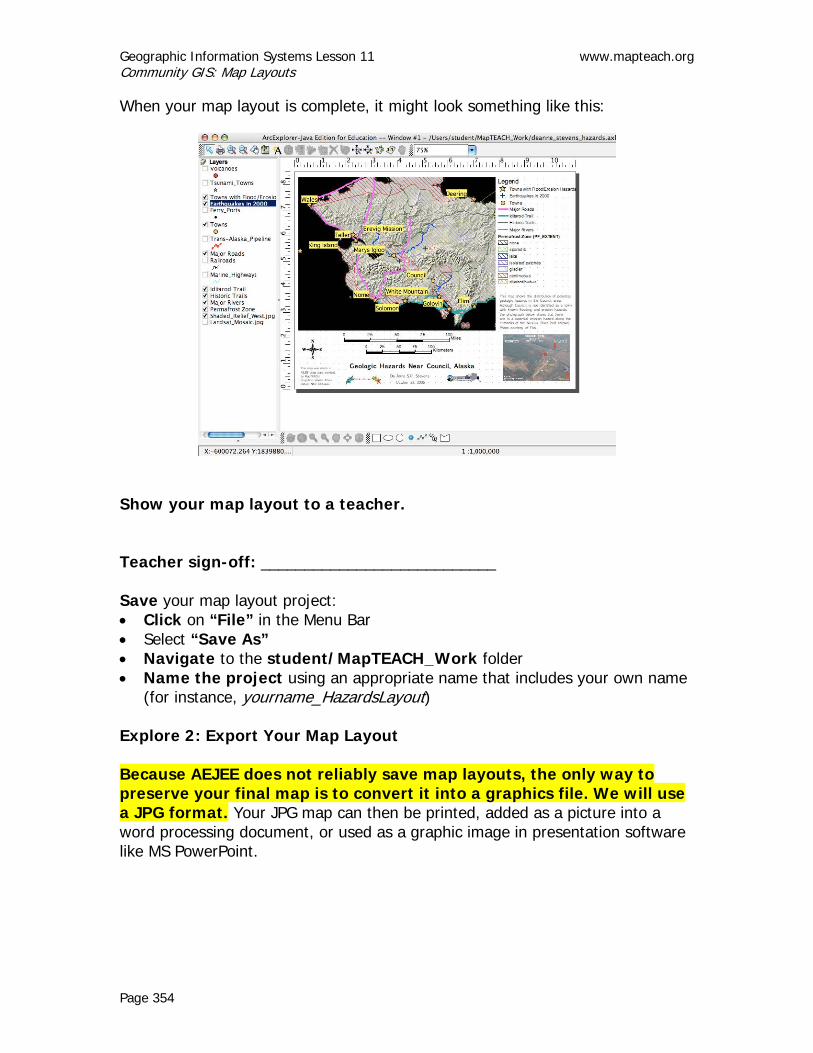
Geographic Information Systems Lesson 11 www.mapteach.org Community GIS: Map Layouts
Page 354
When your map layout is complete, it might look something like this:
Show your map layout to a teacher. Teacher sign-off: ___________________________ Save your map layout project: • Click on “File” in the Menu Bar • Select “Save As” • Navigate to the student/MapTEACH_Work folder • Name the project using an appropriate name that includes your own name
(for instance, yourname_HazardsLayout) Explore 2: Export Your Map Layout Because AEJEE does not reliably save map layouts, the only way to preserve your final map is to convert it into a graphics file. We will use a JPG format. Your JPG map can then be printed, added as a picture into a word processing document, or used as a graphic image in presentation software like MS PowerPoint.
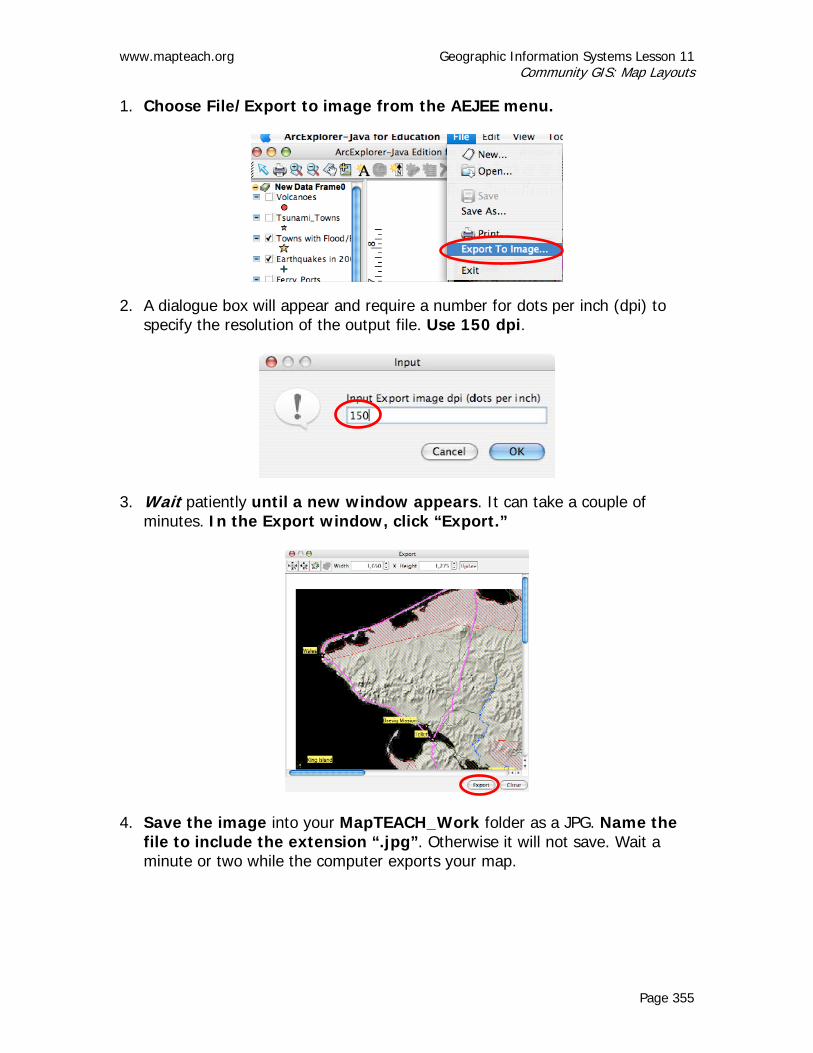
www.mapteach.org Geographic Information Systems Lesson 11 Community GIS: Map Layouts
Page 355
1. Choose File/Export to image from the AEJEE menu.
2. A dialogue box will appear and require a number for dots per inch (dpi) to specify the resolution of the output file. Use 150 dpi.
3. Wait patiently until a new window appears. It can take a couple of minutes. In the Export window, click “Export.”
4. Save the image into your MapTEACH_Work folder as a JPG. Name the file to include the extension “.jpg”. Otherwise it will not save. Wait a minute or two while the computer exports your map.

Geographic Information Systems Lesson 11 www.mapteach.org Community GIS: Map Layouts
Page 356
5. Wait a moment to allow AEJEE to complete the export process, then close the Export window and exit AEJEE.
Explore 3: Print Your Map Layout Once the map image is saved, it can be imported into word processing documents (MS Word), graphics presentations (MS PowerPoint) or any image processing application. The exported map can also be emailed anywhere as an attachment. You may be able to open your JPG map directly by double-clicking on the file, and then print it from your computer’s picture viewer. If you import it into a Word document, however, you can have some added flexibility for resizing and orienting the map on the printed page. 1. Start up MS Word.
2. Select Page Setup from the File pull-down menu.
Don’t forget the “.jpg” extension!
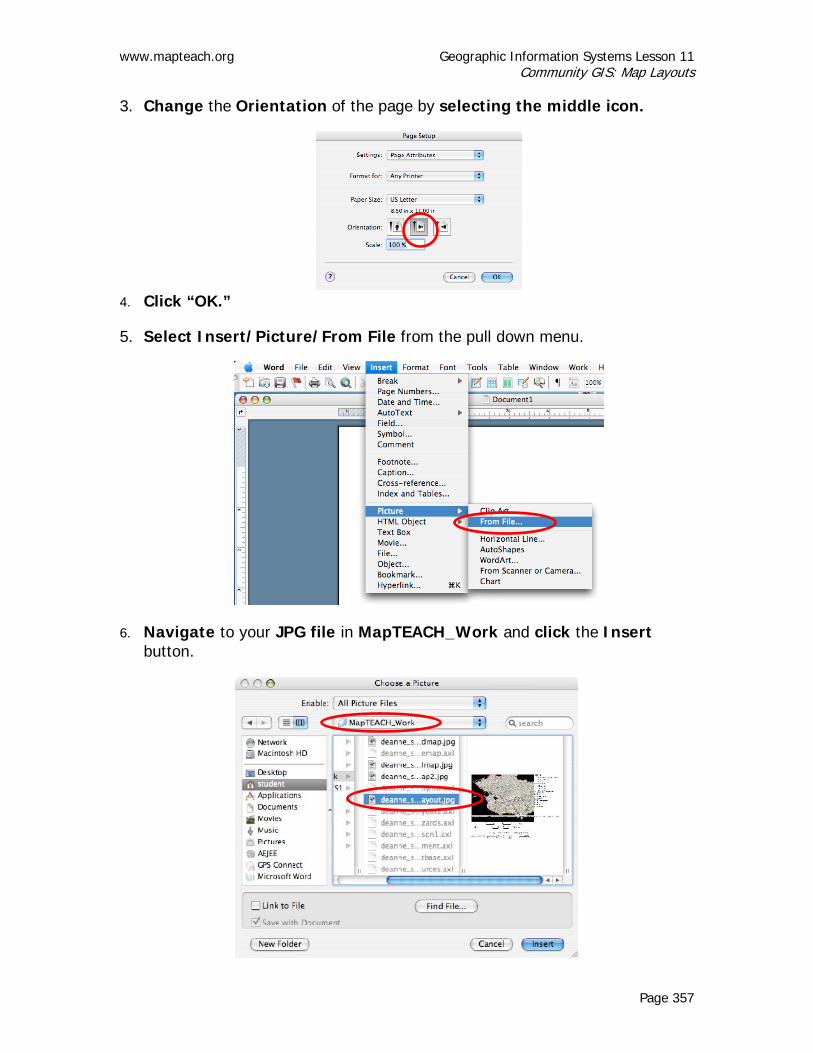
www.mapteach.org Geographic Information Systems Lesson 11 Community GIS: Map Layouts
Page 357
3. Change the Orientation of the page by selecting the middle icon.
4. Click “OK.”
5. Select Insert/Picture/From File from the pull down menu.
6. Navigate to your JPG file in MapTEACH_Work and click the Insert button.
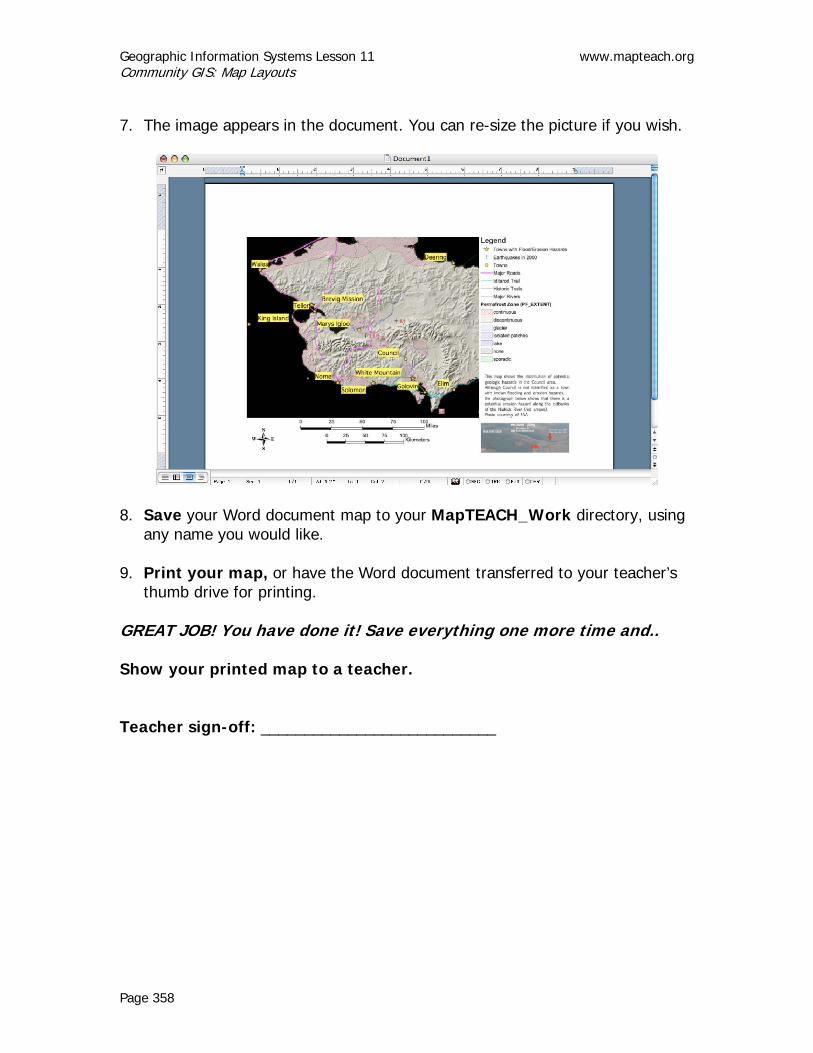
Geographic Information Systems Lesson 11 www.mapteach.org Community GIS: Map Layouts
Page 358
7. The image appears in the document. You can re-size the picture if you wish.
8. Save your Word document map to your MapTEACH_Work directory, using any name you would like.
9. Print your map, or have the Word document transferred to your teacher’s thumb drive for printing.
GREAT JOB! You have done it! Save everything one more time and.. Show your printed map to a teacher. Teacher sign-off: ___________________________

www.mapteach.org Geographic Information Systems Lesson 12 Adding Coordinate Locations into a GIS
Page 359
GIS Lesson 12 ADDING COORDINATE LOCATIONS INTO A GIS
TEACHER INFORMATION
Lesson Summary: During this lesson students use Serpentine Hot Springs on
the Seward Peninsula as an example site to learn how to manually add coordinate data into a GIS project. Geographic coordinates for the hot springs are provided, and the students set up a Mac TextEdit document and type in these coordinates according to a strictly-defined format. The file is saved as a comma separated values file (.csv), and the data is then imported into an AEJEE project using the “Add Event Theme” tool.
Objectives: Students will learn to manually add coordinate locations
into a GIS project. Estimated Time: Thirty minutes Correlation to Alaska Standards: Geography A-6 Use spatial (geographic) tools and technologies to analyze
and develop explanations and solutions to geographic problems.
Technology A-1 Use a computer to enter and retrieve information. BACKGROUND FOR THE TEACHER Remember where you went to kindergarten? Remember the first place someone let you drive the boat to? Your GIS map doesn’t, but it can. You have to tell it where and you have tell it what. “Adding a point” is how you and your students can make a GIS tell about a place. A GIS can understand where places are if you provide the locations in latitude and longitude coordinates. The “adding a point” process is fundamental for students to understand how to take their field observations and map them with GIS.

Geographic Information Systems Lesson 12 www.mapteach.org Adding Coordinate Locations into a GIS
Page 360
The lesson is written so that students can accomplish this initial process without first being forced to learn technical vocabulary that defines data tables, a database format and shapefiles. In this way they will eventually be able to bring field observations located by GPS into a GIS map. This will give them the power to make unique observations about their local area, and map this information like a GIS professional. For this to work, students must be very exacting in carrying out each step. Indirectly, the students are learning that they can be creative and have a good time with doing real work with computers, but that attention to detail is required to make software work reliably. Some important concepts and tips for success: • AEJEE requires comma separated values files (.csv, or CSV), which can be
generated using the TextEdit application that is standard on Mac computers. • Comma separated values files are very simple data files in which commas are
used to separate individual data values that would equate to column entries in a spreadsheet, and individual lines of data equate to rows in a spreadsheet:
SPREADSHEET .CSV FILE • Coordinates must be added as latitude and longitude in decimal degrees. • The location accuracy will be affected by the number of decimal places
included in the coordinates: the more decimal places, the closer the point generated from the coordinates will be to the actual site location. We recommend a minimum of three significant digits, but four is better.
• Longitudes for the western hemisphere, including Alaska, are preceded by a minus sign (-). Longitudes for the eastern hemisphere would not include a sign.
• The first line in the CSV file equates to column headings in a spreadsheet, and is required for AEJEE to read all the data points. If you do not include a line of column headings (for instance, “Site,Lat,Lon,Name”), it will read the first line of data as the column headings and cause much confusion!

www.mapteach.org Geographic Information Systems Lesson 12 Adding Coordinate Locations into a GIS
Page 361
• Each line of data should include entries for each of the column headings, in the same order as they are listed in the first line. In the example above, “Site” is “1”, “Lat” is “68.858”, “Lon” is “-164.71”, and “Name” is “Serpentine Hot Springs.”
• Older versions of AEJEE did not allow spaces on either side of the commas in the CSV files, although the newest version seems more tolerant. To avoid possible confusion, the lesson retains instructions for the older versions of AEJEE.
• There can be no “empty returns” at the end of the CSV document. If you click your pointer in the blank white area below your last line of data and a cursor appears below your last line of data, you must backspace or delete until the cursor is exactly after (to the right of) your last piece of data.
MATERIALS • Computers - one for each student is best or two students can share. The
computers must meet the following specifications to run AEJEE: o Macintosh: MacOS 10.3 or above, 100 MB hard drive space, Internet
connection; recommend G4 or faster processor and more than 64 MB RAM o Windows: Win2000 or WinXP, 100 MB hard drive space, Internet
connection; recommend Pentium III or faster processor and more than 64 MB RAM
• AEJEE software can be provided by MapTEACH on a CD delivered to you, or you can download the correct version from our website at http://www.mapteach.org• MapTEACH GIS data also can be sent on a CD or downloaded from our website at http://www.mapteach.org • Copies of student directions for the lesson.
INSTRUCTIONAL PROCEDURES
Getting Ready As always, try out the lesson on a classroom computer ahead of time. You will better anticipate tasks that your students might find challenging, and feel much more comfortable giving directions and answering questions. Make any modifications that will help your students be more successful.
2: Cursor should be here
1: When you click here…
If it isn’t, backspace until it is!

Geographic Information Systems Lesson 12 www.mapteach.org Adding Coordinate Locations into a GIS
Page 362
Gear-up • Ask a student to tell you where he went to kindergarten, or where she
first drove a snowmachine, or any good question about a “where” and a “what.” Then ask him or her to point to the place on a map of Alaska, or anywhere in the world. Explain that a GIS knows nothing about this place unless the student chooses to tell it. This lesson will show how to tell a GIS about a where and a what.
• Explain to the students that computers are not actually ‘smart’. Computers need to be told about things in ways they can understand - very simple, very specific ways. Otherwise, the computer will just sit there like a bump on a log.
• For your GIS to know anything about a place, we have to tell it where by giving it a latitude and a longitude, and we have to tell it what by giving it some text. So if you went to kindergarten at the school in Hooper Bay, the GIS would need to know the latitude is 61.5311, the longitude is -166.09656 (the minus sign means it’s a west longitude), and the name of the school is Hooper Bay. You would need to tell the computer in a very particular way that looks like this (write on the board): Lat,Lon,Name 61.5311,-166.09656,Hooper Bay But if you tell this to the computer in a way it doesn’t understand, if you so much as even include a space after a comma, the computer won’t get it. The computer will just sit there like a bump on a log. You can tell the computer more about the place, but this is the minimum you need to tell it so it can do anything with the information.
• Explain to the students that they will now get the chance to tell the GIS about a place, and doing it will make more sense than talking about it. Have them get started with the exercise. Depending on the students’ previous experiences with computers, you can mention that in computer terms we call the categories “fields” and the numbers and text “data.” When the two are put together as above, in a format the computer can understand, you have created a data table with one data record in it. This format is called CSV (comma-separated values). A data table is a simple kind of database.

www.mapteach.org Geographic Information Systems Lesson 12 Adding Coordinate Locations into a GIS
Page 363
Students have likely done this many times before and just didn’t know it. For instance, when you enter a name and number in a cell phone, you have just created a new data record in a database. The fields are name and number.
• One of the things students may recognize is that they can be creative in making a GIS database and the records that could go in it. For example, they could make a list of where friends live, their names, nicknames, emails and favorite songs. This “list” is actually the beginning of a database.
• So what is being creative with databases good for? Some would say fun.
We would also say jobs: http://www.mapteach.org/job_search.php The guys who own Facebook would say money, lots of money: http://developers.facebook.com/
TEACHER RESOURCES Specific instructions on creating CSV files with Macs and PCs to make point shapefiles can be found in ESRI’s “Introduction to ArcExplorer—Java Edition for Education” for AEJEE 2.3 available as an Adobe Acrobat PDF: http://www.esri.com/software/arcexplorer/download.html Wikipedia provides information about Comma-Separated Values (CSV) files at http://en.wikipedia.org/wiki/Comma-separated_values MORE RESOURCES FOR STUDENTS OR TEACHERS An on-line spreadsheet with location information for 108 Alaskan hot springs and fumaroles has been compiled by the National Geophysical Data Center Listings, and is provided at http://www.hotspringsenthusiast.com/AK.asp Latitude and longitudes for many Alaskan schools can be found at the GLOBE Schools web site. A current list of Globe Schools in Alaska can be obtained from the Globe website at http://www.globe.gov . Carry out a “School Search” on http://viz.globe.gov/viz-bin/zoom.cgi?C=US&rg=n&l=en to find out how many Alaskan schools are participating on the program. Some 195 schools or more may be listed.


www.mapteach.org Geographic Information Systems Lesson 12 Adding Coordinate Locations into a GIS
Page 365
Name: ____________________
GIS Lesson 12 ADDING COORDINATE LOCATIONS INTO A GIS
STUDENT EXERCISE
Objectives: Students will learn to manually add a coordinate location into a GIS project.
Estimated Time: 30 minutes
By the end of this lesson, you will be able to add sites (points) to a GIS map. AEJEE makes it possible to input information about places by attaching data to points. You do this in two steps by:
• Making a data file in a text editor program, and • Making a new map layer from that data file in AEJEE itself.
The data file will be transformed to a “point” layer in your map later. We are going to make a single point on your map where Serpentine Hot Springs is. Explore 1: Enter Point Data 1. Start up the Mac text editing application TextEdit.
(If it is not on the dock of your computer desktop, you can access TextEdit by going to Macintosh HD/Applications and double-clicking on TextEdit)
2. Type in the exact same text shown below, with NO spaces before or after commas. “Lat” stands for latitude and “Lon” for longitude.
This data file contains a single point, the location of Serpentine Hot Springs.

Geographic Information Systems Lesson 12 www.mapteach.org Adding Coordinate Locations into a GIS
Page 366
3. Check carefully that you do not have any mistakes in your typing, then save
this data in a format that AEJEE can understand. a) Change the file into plain text using the Format menu in TextEdit. The
default save format is not plain text but “rich text format” and AEJEE will not understand that format.
b) Save the data as a .csv file, with the name typed in as “Location.csv”. The .csv extension at the end of the file name tells AEJEE that this is a comma separated values file. This is a special kind of file that AEJEE can read and make point data with. When using the Mac and TextEdit, the screen will look something like this:
Make sure you include the .csv extension!!

www.mapteach.org Geographic Information Systems Lesson 12 Adding Coordinate Locations into a GIS
Page 367
When TextEdit gives you a choice, click on “Use .csv”.
Show your CSV file to a teacher. Teacher sign-off: ___________________________ Explore 2: Set Up the Base Map and Projection As always, the first two steps to start any AEJEE map project are:
• Add a map layer • Define a projection
1. Add the layer Coastline_Simple -- located at
/ESRI/AEJEE/Data_MapTEACH_WGS84/Base_Data/Coastline_Simple.shp 2. Set the map projection
a) Go to the menu bar and choose Tools, then select Projection. b) In the Select Coordinate System window, choose Regional
Projections/Albers Equal Area (Ellipsoid) and select Alaska. c) Select NAD 83 from the “Datum” dropdown menu and click “OK.” (If it
helps, review the detailed steps provided in previous lessons)
3. To make this an informative base map, add two more data layers from the Base_Data folder in Data_MapTEACH_WGS84. a) Latitude_Longitude b) Seward_Peninsula_Landsat (a satellite image of the Seward Peninsula)

Geographic Information Systems Lesson 12 www.mapteach.org Adding Coordinate Locations into a GIS
Page 368
Your map should look something like this:
4. Save your map project: • Click on “File” in the Menu Bar • Select “Save As” • Navigate to the student/MapTEACH_Work folder • Name the project using your full name followed by “lesson12”:
firstname_lastname_lesson12
Save again throughout the lesson so you can start from the most recent save if the computer or AEJEE freezes up.
12 Substitute your name here

www.mapteach.org Geographic Information Systems Lesson 12 Adding Coordinate Locations into a GIS
Page 369
5. Make the fill for the Coastline_Simple layer transparent • Do this by control-clicking on the layer name, and choosing the style
to be transparent fill from the properties window.
6. Zoom in to the Seward Peninsula.
7. Save your project.
8. Now you’re ready to begin adding point locations to your GIS project.
Show your map to a teacher. Teacher sign-off: ___________________________

Geographic Information Systems Lesson 12 www.mapteach.org Adding Coordinate Locations into a GIS
Page 370
Explore 3: Add Event Theme 1. In the View menu, select Add Event Theme.
2. Browse to Location.csv in the Table field. Next set the X Field to be “Lon”
(longitude) and the Y Field to be “Lat” (longitude). Choose a symbol style, color and size that will stand out on your map.

www.mapteach.org Geographic Information Systems Lesson 12 Adding Coordinate Locations into a GIS
Page 371
3. Click “OK” and AEJEE will add in “Location” as a layer and redraw your map. Find the point location for Serpentine Hot Springs (yellow circle in our example) in the northern part of the Seward Peninsula.
4. If the new point does not appear on your map or is in the wrong place, carefully check your CSV file for errors and make sure you are using the correct entries in the Add Event Theme box.
5. If you want, label the point with its name by control-clicking on the layer name and going to Properties/Labels and selecting “Name” under the “Label features using” drop-down menu.
6. Save your project. Show your map to a teacher. Teacher sign-off: ___________________________


www.mapteach.org Geographic Information Systems Lesson 13 Hotlinking
Page 373
GIS Lesson 13 HOTLINKING
TEACHER INFORMATION
Lesson Summary: During this lesson students use Serpentine Hot Springs on
the Seward Peninsula as an example site to learn how to hotlink data in a GIS project. The CSV file created in GIS Lesson 12 is modified to include the web url of a National Park Service website describing the hot springs. The revised CSV file is loaded into the existing AEJEE project and the hotlink is activated, allowing the user to click on the point representing Serpentine Hot Springs in the GIS and connect to the informative web site.
Objectives: Students will learn to hotlink a website to a point in their
AEJEE map. Estimated Time: 30 minutes Correlation to Alaska Standards: Geography A-6 Use spatial (geographic) tools and technologies to analyze
and develop explanations and solutions to geographic problems.
Technology A-1 Use a computer to enter and retrieve information. BACKGROUND FOR THE TEACHER Some important concepts and tips for success: • AEJEE uses comma separated values files (.csv, or CSV) to generate
shapefiles of points that can be hotlinked. • The attribute name in the first line of the CSV file that equates to the hotlink
must be HOTLINK, all in capital letters. See example:

Geographic Information Systems Lesson 13 www.mapteach.org Hotlinking
Page 374
• This lesson constructs a hotlink to connect to a web site (using the site url).
Hotlinks can also connect to any kind of file your computer can open. This includes pictures, text documents, video clips, sound files, etc. o The syntax to connect a point to a web site is http:// followed by the
web site name. Example: http://www.nps.gov/bela/html/serpent.htm
o The syntax to connect to a file on your computer is file:/// followed by the pathname and document name. Example: File:///Users/student/MapTEACH_Work/FieldTripSite1.doc (This connects to a Word document named FieldTripSite1.doc that is located in the MapTEACH_Work folder in the Users/student directory of a Mac computer; if you want to hotlink to a file or document that is saved somewhere else, remember that the syntax must exactly match the pathname so AEJEE can find your file)
• Older versions of AEJEE did not allow spaces on either side of the commas in the CSV files, although the newest version seems more tolerant. To avoid possible confusion, the lesson retains instructions for the older versions of AEJEE.
• There can be no “empty returns” at the end of the CSV document. If you click your pointer in the blank white area below your last line of data and a cursor appears below your last line of data, you must backspace or delete until the cursor is exactly after (to the right of) your last piece of data.
• Working with CSV files and hotlinks can be very frustrating for students, who
are often rushing and not paying close attention to what they are typing. Any
2: Cursor should be here
1: When you click here…
If it isn’t, backspace until it is!
Must be HOTLINK, all capitals!

www.mapteach.org Geographic Information Systems Lesson 13 Hotlinking
Page 375
typographical error, extra space or misplaced comma will cause the process to malfunction. If the hotlink is not working, work patiently with the student to very carefully check their file for errors.
• When activating hotlinks, there are some critical items that must be kept in mind: o MapTips must be set to reference HOTLINK in the point shapefile that the
hotlink is generated from o The shapefile containing the hotlink(s) must be selected (highlighted) in
the Table of Contents on the left side of the AEJEE window o The Hotlink lightning bolt tool must be used to select the point in the map
project o Hover the Hotlink lightning bolt tool over the point until the MapTip info
appears next to point (either the url if linking to a web site, or the pathname and file name if linking to a file or document); do not click until you can see this information
o If you can see the MapTip info next to the point but are having trouble clicking on it, try zooming in a little so you can better target the point
o If you can see the MapTip info and can successfully click the point, but nothing happens, it means that you have set up everything correctly but there is a typographical error in the url, pathname, or file name in your CSV file and AEJEE can not find your hotlinked web site or file; check for typos!
MATERIALS • Computers - one for each student is best or two students can share. The
computers must meet the following specifications to run AEJEE: o Macintosh: MacOS 10.3 or above, 100 MB hard drive space, Internet
connection; recommend G4 or faster processor and more than 64 MB RAM o Windows: Win2000 or WinXP, 100 MB hard drive space, Internet
connection; recommend Pentium III or faster processor and more than 64 MB RAM
• AEJEE software can be provided by MapTEACH on a CD delivered to you, or you can download the correct version from our website at http://www.mapteach.org• MapTEACH GIS data also can be sent on a CD or downloaded from our website at http://www.mapteach.org • Copies of student directions for the lesson INSTRUCTIONAL PROCEDURES
Getting Ready As always, try out the lesson on a classroom computer ahead of time. You will better anticipate tasks that your students might find challenging, and feel much more comfortable giving directions and answering questions. Make any modifications that will help your students be more successful.

Geographic Information Systems Lesson 13 www.mapteach.org Hotlinking
Page 376
Gear-up Bring out a map of your choice and let students describe places on it that they are familiar with. Ask them if the map by itself has enough information in it about all the things about a place that they would like to share with someone else – stories, sights, sounds? How much more informative would a map be if you could actually connect the places on it to photographs, documents, web sites and videos describing those places and why they are important or interesting? Hotlinking allows us to do just that, creating a richer, multidimensional map experience.
TEACHER RESOURCES Specific instructions on creating CSV files with Macs and PCs to make point shapefiles and hotlinks can be found in ESRI’s “Introduction to ArcExplorer—Java Edition for Education” for AEJEE 2.3 available as an Adobe Acrobat PDF: http://www.esri.com/software/arcexplorer/download.html Wikipedia provides information about Comma-Separated Values (CSV) files at: http://en.wikipedia.org/wiki/Comma-separated_values And on hyperlinks at: http://en.wikipedia.org/wiki/Hyperlink MORE RESOURCES FOR STUDENTS OR TEACHERS The State of Alaska Division of Community Advocacy maintains an extensive online database of information and photographs for Alaskan communities at http://www.commerce.state.ak.us/dca/commdb/CF_COMDB.htm . The community summaries include latitudes and longitudes (typically embedded in the text of the first paragraph) for all communities listed. An on-line spreadsheet with location information for 108 Alaskan hot springs and fumaroles has been compiled by the National Geophysical Data Center Listings, and is provided at http://www.hotspringsenthusiast.com/AK.asp Latitudes and longitudes for many Alaskan schools can be found at the GLOBE Schools web site. A current list of Globe Schools in Alaska can be obtained from the Globe website at http://www.globe.gov . Carry out a “School Search” on http://viz.globe.gov/viz-bin/zoom.cgi?C=US&rg=n&l=en to find out how many Alaskan schools are participating on the program. Some 195 schools or more may be listed.

www.mapteach.org Geographic Information Systems Lesson 13 Hotlinking
Page 377
Name: ____________________
GIS Lesson 13 HOTLINKING
STUDENT EXERCISE
Objectives: Students will learn to add coordinate locations into a GIS project and to use GIS tools to make hotlinks to web sites.
Estimated Time: 30 minutes
By the end of this lesson, you will be able to add points with hotlinks to your GIS map. Hotlinking provides a way to add a hyperlink to a point on your map. By clicking on a hyperlinked point, a new document will open up. The new document can be a web page, photo, movie, text document or whatever you choose. Explore 1: Enter Point Data AEJEE makes it possible to hotlink to documents and web sites by attaching instructions to the points in your map project about where to find those documents or web sites. You do this in two steps by:
• Making a data file in a text editor program that includes the field HOTLINK, and
• Making a new map layer from that data file in AEJEE itself. As before, the data file will be transformed into a “point” layer in your map. We are going to use your Serpentine Hot Springs map project and “hotlink” (also known as “hyperlink”) your point to a web site that has information about Serpentine Hot Springs. 1. Use TextEdit to open the CSV file you created in GIS Lesson 12. Start
up the TextEdit application and open the Location.csv file you saved in your MapTEACH_Work directory.

Geographic Information Systems Lesson 13 www.mapteach.org Hotlinking
Page 378
2. Modify your CSV file to include HOTLINK and the web url of a web site about Serpentine Hot Springs. Just after “Name,” add a comma and the new field called “HOTLINK” all in capital letters. Remember - do not include any extra spaces in this file. Then, just after the name of the location, add a comma and http://www.nps.gov/archive/bela/html/serpent.htm
Save this file as “Location_Hotlink.csv” in your MapTEACH_Work directory.
Explore 2: Add a Hotlinked Point 1. Start up AEJEE and open your GIS Lesson 12 project. This project
should be named firstname_lastname_lesson12, and is found in the student/MapTEACH_Work folder.
2. Use the Add Event Theme process to make a new shapefile called Location_Hotlink. (If it helps, review the detailed steps provided in GIS Lesson 12)
3. On the AEJEE menu, use Tools/Map tips to open the MapTips dialogue
box. This will help AEJEE to find the hot spot for the link on the map.
Must be HOTLINK, all capitals!
http://www.nps.gov/archive/bela/html/serpent.htm
Must be typed exactly like this!

www.mapteach.org Geographic Information Systems Lesson 13 Hotlinking
Page 379
4. In the MapTips box, select Location_Hotlink for the layer and HOTLINK as the field. Click Set MapTips and then click “OK.”
5. Make sure that Location _Hotlink is highlighted in your Table of Contents window.
6. Select the “Hot Link” lightning bolt from the tool bar. Hover the cursor right over the dot at Serpentine Hot Springs until the MapTip info pops up and shows the web site address. Click and your browser will open to a National Park Service web page with information about Serpentine Hot Springs.
Click only when you can see the MapTip info
Make sure your hotlink layer is highlighted
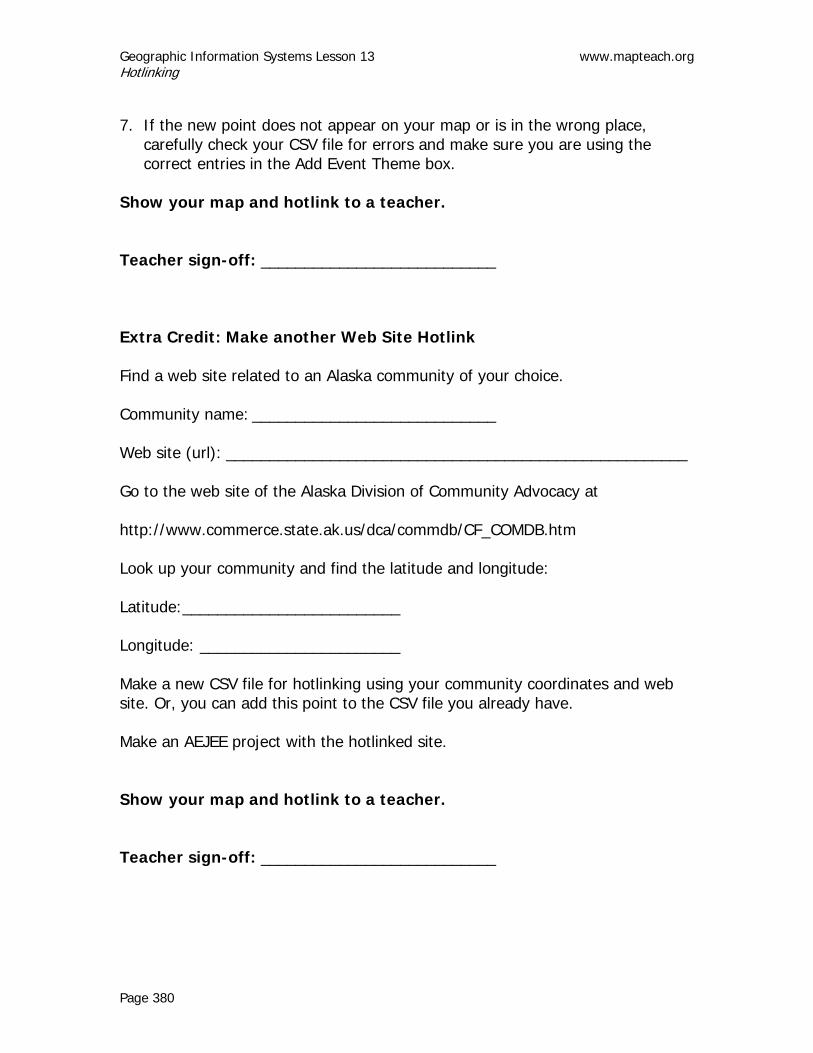
Geographic Information Systems Lesson 13 www.mapteach.org Hotlinking
Page 380
7. If the new point does not appear on your map or is in the wrong place,
carefully check your CSV file for errors and make sure you are using the correct entries in the Add Event Theme box.
Show your map and hotlink to a teacher. Teacher sign-off: ___________________________
Extra Credit: Make another Web Site Hotlink Find a web site related to an Alaska community of your choice. Community name: ____________________________ Web site (url): _____________________________________________________ Go to the web site of the Alaska Division of Community Advocacy at http://www.commerce.state.ak.us/dca/commdb/CF_COMDB.htm Look up your community and find the latitude and longitude: Latitude:_________________________ Longitude: _______________________ Make a new CSV file for hotlinking using your community coordinates and web site. Or, you can add this point to the CSV file you already have. Make an AEJEE project with the hotlinked site. Show your map and hotlink to a teacher. Teacher sign-off: ___________________________

www.mapteach.org Geographic Information Systems Lesson 14 Change Over Time: Shorefast Sea Ice
Page 381
GIS Lesson 14 CHANGE OVER TIME: SHOREFAST SEA ICE
TEACHER INFORMATION
Lesson Summary: During this lesson students use GIS to analyze changes in
the extent of shorefast sea ice. They extract information from multi-year and single year data and look for trends over time.
Objectives: Students will learn how to load and display multiple data
layers in AEJEE and will use the measure tool to answer questions about what they see.
Estimated Time: 1 hour Correlation to Alaska Standards Geography A-6 Use spatial (geographic) tools and technologies to analyze
and develop explanations and solutions to geographic problems.
Science E-1 Develop an understanding of how scientific knowledge and technology are used in making decisions about issues, innovations, and responses to problems and everyday events.
BACKGROUND FOR THE TEACHER For a discussion of shorefast (landfast) sea ice and to learn more about the data used in this lesson, see the Alaska Satellite Facility newsletter article “Examining Landfast Sea Ice on Alaska’s Northern Coast” at: http://www.asf.alaska.edu/publications/newsletter/ASFNNV.2No.2.pdf MATERIALS • Computers - one for each student is best or two students can share. The
computers must meet the following specifications to run AEJEE:
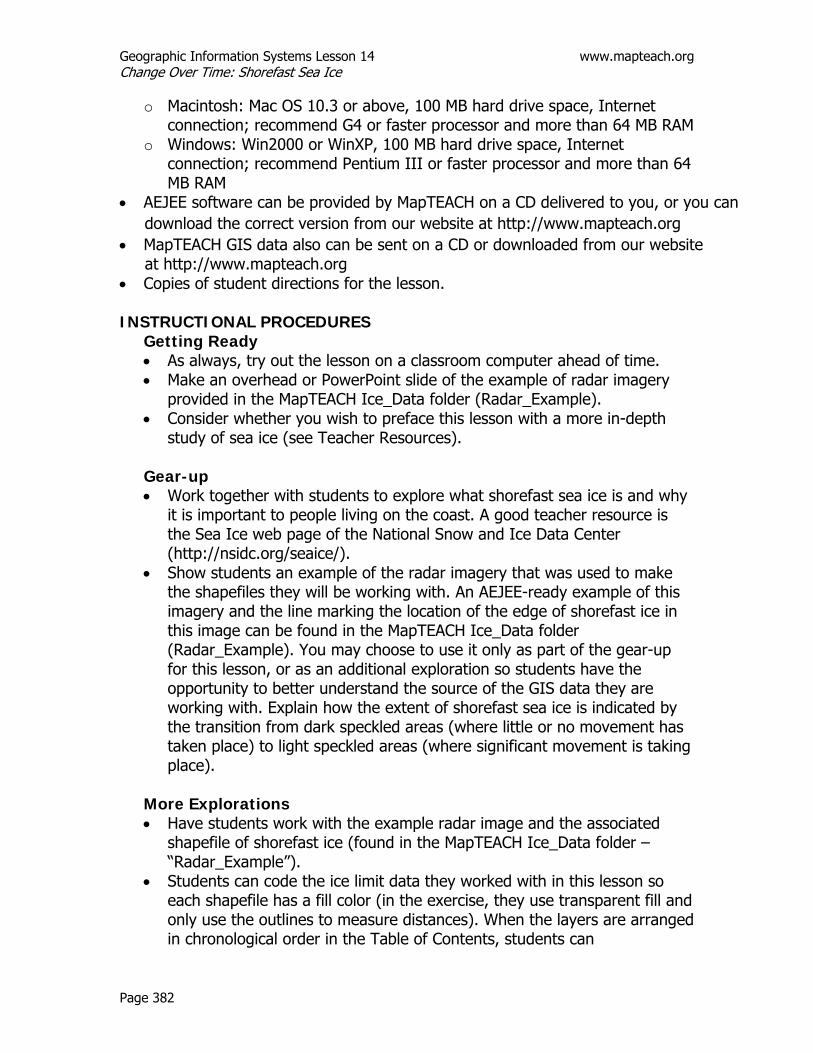
Geographic Information Systems Lesson 14 www.mapteach.org Change Over Time: Shorefast Sea Ice
Page 382
o Macintosh: Mac OS 10.3 or above, 100 MB hard drive space, Internet connection; recommend G4 or faster processor and more than 64 MB RAM
o Windows: Win2000 or WinXP, 100 MB hard drive space, Internet connection; recommend Pentium III or faster processor and more than 64 MB RAM
• AEJEE software can be provided by MapTEACH on a CD delivered to you, or you can download the correct version from our website at http://www.mapteach.org• MapTEACH GIS data also can be sent on a CD or downloaded from our website at http://www.mapteach.org • Copies of student directions for the lesson.
INSTRUCTIONAL PROCEDURES
Getting Ready • As always, try out the lesson on a classroom computer ahead of time. • Make an overhead or PowerPoint slide of the example of radar imagery
provided in the MapTEACH Ice_Data folder (Radar_Example). • Consider whether you wish to preface this lesson with a more in-depth
study of sea ice (see Teacher Resources).
Gear-up • Work together with students to explore what shorefast sea ice is and why
it is important to people living on the coast. A good teacher resource is the Sea Ice web page of the National Snow and Ice Data Center (http://nsidc.org/seaice/).
• Show students an example of the radar imagery that was used to make the shapefiles they will be working with. An AEJEE-ready example of this imagery and the line marking the location of the edge of shorefast ice in this image can be found in the MapTEACH Ice_Data folder (Radar_Example). You may choose to use it only as part of the gear-up for this lesson, or as an additional exploration so students have the opportunity to better understand the source of the GIS data they are working with. Explain how the extent of shorefast sea ice is indicated by the transition from dark speckled areas (where little or no movement has taken place) to light speckled areas (where significant movement is taking place).
More Explorations • Have students work with the example radar image and the associated
shapefile of shorefast ice (found in the MapTEACH Ice_Data folder – “Radar_Example”).
• Students can code the ice limit data they worked with in this lesson so each shapefile has a fill color (in the exercise, they use transparent fill and only use the outlines to measure distances). When the layers are arranged in chronological order in the Table of Contents, students can

www.mapteach.org Geographic Information Systems Lesson 14 Change Over Time: Shorefast Sea Ice
Page 383
systematically turn the layers off and on to make a sort of time-lapse sequence of the extent of shorefast ice. Students can make observations about how the ice limit changes across the entire extent of the map area, as well as in specific locations.
• You may wish to have your students use graph paper to graph the measurements they make in this exercise, with time as one axis and distance from shore as the other axis.
MORE RESOURCES FOR STUDENTS OR TEACHERS Background information on the University of Alaska Geophysical Institute’s project that generated the data used in this lesson can be found at: http://mms.gina.alaska.edu/ The National Snow and Ice Data Center’s web page on Sea Ice offers a great deal of useful information for teachers or advanced students: http://nsidc.org/seaice/ The “Environments” tab includes a section on indigenous peoples’ knowledge of sea ice and how it impacts them. The web site of the Barrow Ice Observatory, including a live webcam, can be found at: http://www.gi.alaska.edu/snowice/sea-lake-ice/Barrow_observatory.html


www.mapteach.org Geographic Information Systems Lesson 14 Change Over Time: Shorefast Sea Ice
Page 385
Name: ____________________
GIS Lesson 14 CHANGE OVER TIME: SHOREFAST SEA ICE
STUDENT EXERCISE
Objectives: Students will learn how to load and display multiple data layers in AEJEE and will use the measure tool to answer questions about what they see.
Estimated Time: 1 hour As you have seen in class and in earlier lessons, satellite images can show many different kinds of features. Today you will be working with shapefiles that scientists have made by using computers to interpret radar imagery. The shapefiles you will be using show the extent of shorefast sea ice along the northern coast of Alaska during different years and during different times of the year. Explore 1: One Year of Ice Data 1. Open AEJEE and make your window bigger by clicking on the green button
in the top left of the window.
2. Navigate to the Ice_Data folder, open the folder Monthly_Ice_2003-2004, and load all of the shapefiles into your project. The easiest way to do this is to click on the top file name in the Content Chooser and then shift-click on the bottom file name to highlight all the file names.

Geographic Information Systems Lesson 14 www.mapteach.org Change Over Time: Shorefast Sea Ice
Page 386
Each of these shapefiles marks the extent of shorefast sea ice during one month between October 2003 and June 2004, which is almost a full 1-year cycle. You can tell the date of the ice limit by looking at the name of the shapefile, which includes the year and the month of that data. For instance, ShorefastIce_2004_03 is the shorefast ice limit in March (the 3rd month) of 2004.
3. Set your map projection to Regional Projections/Albers Equal Area
(Ellipsoid)/Alaska in Systems, with a Datum of NAD83 (North American Datum 1983) and a Transformation of NAD83 – Alaska.
4. Add NorthernCoastDetailed.shp from the North_Alaska_Coast folder
in Ice_Data. 5. Add Towns from the Infrastructure folder. 6. Symbolize NorthernCoastDetailed any way you like. 7. Symbolize Towns any way you like, and label it with the town names. 8. Symbolize all the ShorefastIce layers so that the Style is Transparent
fill and the line colors are all different so you can easily tell the difference between the different layers.
Load all the ShorefastIce layers.

www.mapteach.org Geographic Information Systems Lesson 14 Change Over Time: Shorefast Sea Ice
Page 387
Your map might look something like this:
9. Zoom in on an area of the coast that interests you, making sure that your
view includes all the shorefast ice extent lines that extend out to sea from that area.
Make each ShorefastIce layer a different Outline Color.
Make all of your ShorefastIce layers have “Transparent fill.”

Geographic Information Systems Lesson 14 www.mapteach.org Change Over Time: Shorefast Sea Ice
Page 388
10. Make your Table of Contents screen a little wider so you can see the full
names of all your data layers. Do this by click-dragging the tiny button you can barely see in the middle of the bar separating the Table of Contents from the map screen.
11. Pick a point on the coast as your starting point and use the Measure tool
to measure the distance from that point on the coast to the edge of the shorefast sea ice for each of the months of data you have in your project. Try to make all your measurements along a single, imaginary straight line extending out from the point you have chosen as your starting point. Use Kilometers as your units, and record your measurements in the space provided below:
October 2003 __________________ November 2003 __________________ December 2003 __________________ January 2004 __________________ February 2004 __________________ March 2004 __________________ April 2004 __________________ May 2004 __________________ June 2004 __________________
Click-drag this little handle to the right to make your Table of Contents screen wider, so you can read the names of your layers.
Try to make all your measurements along one straight line

www.mapteach.org Geographic Information Systems Lesson 14 Change Over Time: Shorefast Sea Ice
Page 389
Interpreting Data Which month had the most shorefast sea ice for your chosen location on the coast? _____________________ Which month had the least? ________________________ In general, was there any pattern or trend to the extent of shorefast sea ice over time for your chosen location on the coast? _____________________ If you observed a pattern or trend, please describe it: _________________________________________________________________ _________________________________________________________________ Compare your results with someone else in your class who chose a different part of the coast. Did you get the same results? _____________________ What is your best guess about why or why not? _________________________________________________________________ _________________________________________________________________ _________________________________________________________________ Save your project in your MapTEACH_work directory. Show your project to a teacher. Teacher sign-off: ___________________________

Geographic Information Systems Lesson 14 www.mapteach.org Change Over Time: Shorefast Sea Ice
Page 390
Explore 2: Multiple Years of Ice Data 1. Start a new AEJEE project. 2. Navigate to the Ice_Data folder, open the folder March_Shorefast_Ice,
and load all of the shapefiles into your project.
These shapefiles show the extent of shorefast sea ice during March for each year from 1997 to 2004. You can tell the date of the ice limit by looking at the name of the shapefile, which includes the year and the month of that data. For instance, ShorefastIce_1999_03 is the shorefast ice limit in March (the 3rd month) of 1999.
3. Set your map projection to Regional Projections/Albers Equal Area
(Ellipsoid)/Alaska in Systems, with a Datum of NAD83 (North American Datum 1983) and a Transformation of NAD83 – Alaska.
4. Add NorthernCoastDetailed.shp from the North_Alaska_Coast folder
in Ice_Data. 5. Add Towns from the Infrastructure folder. 6. Symbolize NorthernCoastDetailed any way you like. 7. Symbolize Towns any way you like, and label it with the town names.
Load all the ShorefastIce layers.
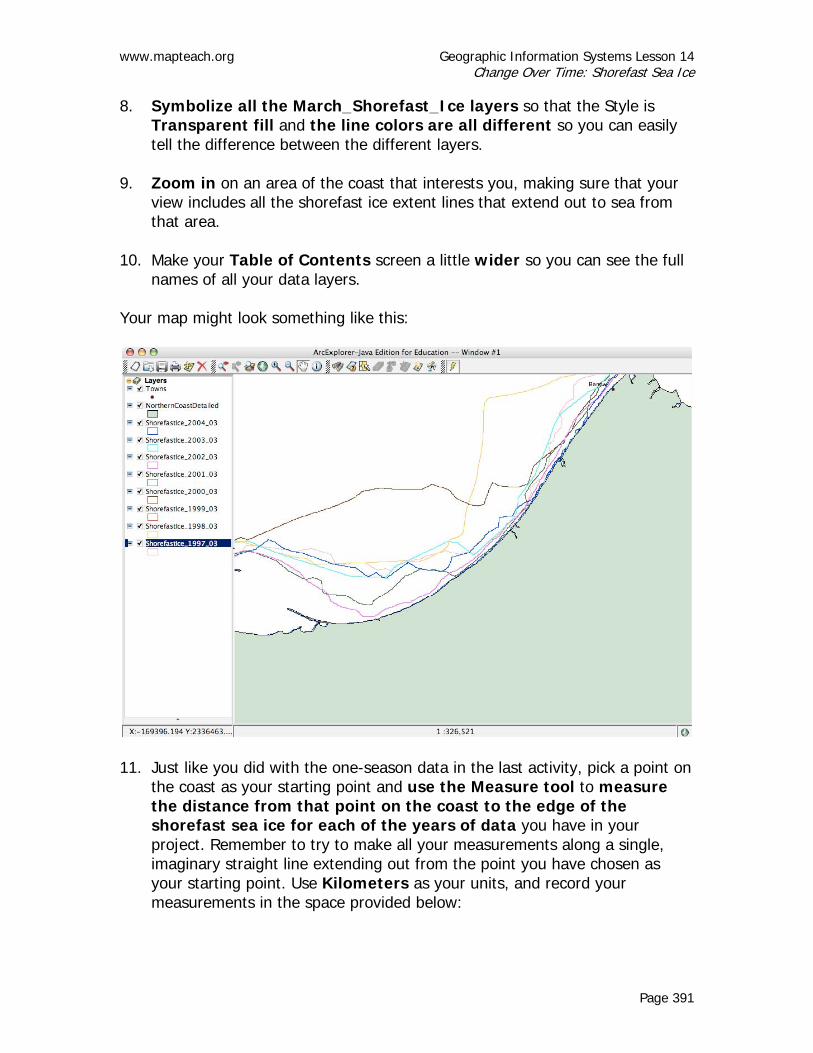
www.mapteach.org Geographic Information Systems Lesson 14 Change Over Time: Shorefast Sea Ice
Page 391
8. Symbolize all the March_Shorefast_Ice layers so that the Style is Transparent fill and the line colors are all different so you can easily tell the difference between the different layers.
9. Zoom in on an area of the coast that interests you, making sure that your
view includes all the shorefast ice extent lines that extend out to sea from that area.
10. Make your Table of Contents screen a little wider so you can see the full
names of all your data layers. Your map might look something like this:
11. Just like you did with the one-season data in the last activity, pick a point on
the coast as your starting point and use the Measure tool to measure the distance from that point on the coast to the edge of the shorefast sea ice for each of the years of data you have in your project. Remember to try to make all your measurements along a single, imaginary straight line extending out from the point you have chosen as your starting point. Use Kilometers as your units, and record your measurements in the space provided below:
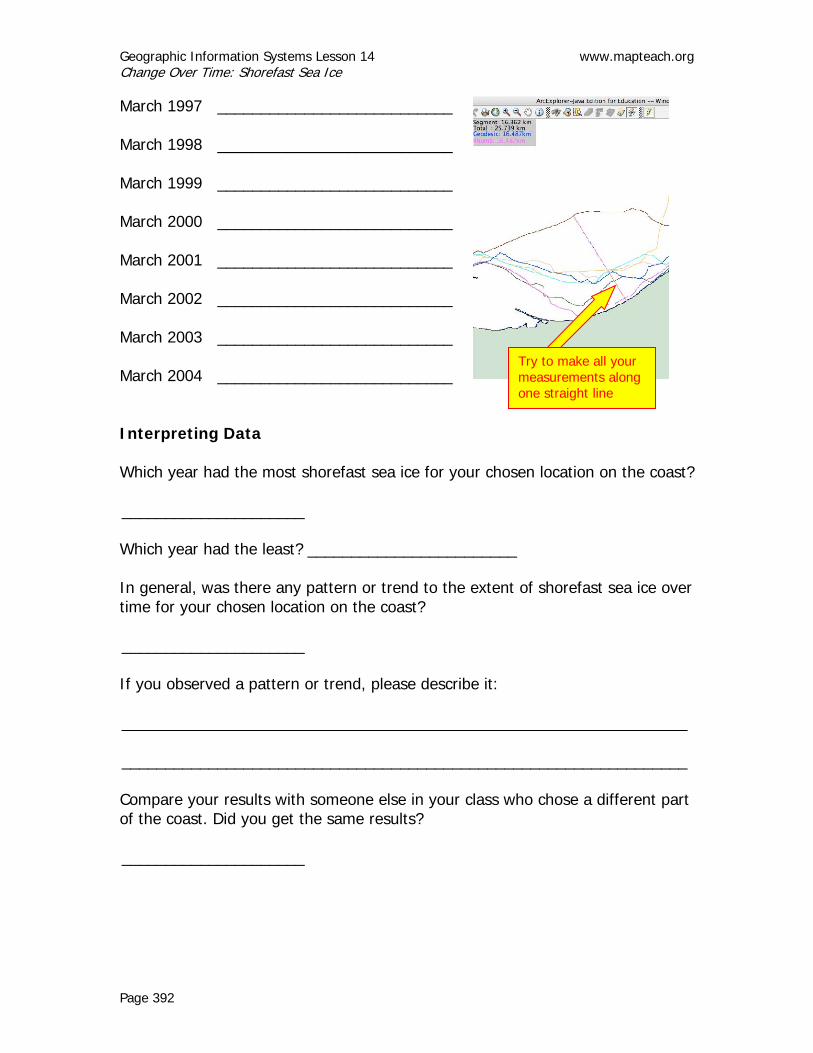
Geographic Information Systems Lesson 14 www.mapteach.org Change Over Time: Shorefast Sea Ice
Page 392
March 1997 ___________________________ March 1998 ___________________________ March 1999 ___________________________ March 2000 ___________________________ March 2001 ___________________________ March 2002 ___________________________ March 2003 ___________________________ March 2004 ___________________________ Interpreting Data Which year had the most shorefast sea ice for your chosen location on the coast? _____________________ Which year had the least? ________________________ In general, was there any pattern or trend to the extent of shorefast sea ice over time for your chosen location on the coast? _____________________ If you observed a pattern or trend, please describe it: _________________________________________________________________ _________________________________________________________________ Compare your results with someone else in your class who chose a different part of the coast. Did you get the same results? _____________________
Try to make all your measurements along one straight line

www.mapteach.org Geographic Information Systems Lesson 14 Change Over Time: Shorefast Sea Ice
Page 393
What is your best guess about why or why not? _________________________________________________________________ _________________________________________________________________ _________________________________________________________________ If global warming is real, what would you expect the data to look like? _________________________________________________________________ _________________________________________________________________ _________________________________________________________________ Do your results tend to support or refute global warming? _____________________ Do you think this is enough data to prove or disprove global warming? _____________________ Why or why not? _________________________________________________________________ _________________________________________________________________ _________________________________________________________________ _________________________________________________________________ _________________________________________________________________ Save your project in your MapTEACH_work directory. Show your project to a teacher. Teacher sign-off: ___________________________

MapTEACH:
Appendices


www.mapteach.org Preparing Alaska Base Map Imagery Technical Appendix A1
Page 395
Technical Appendix A Preparing Alaska Base Map Imagery for Local Mapping Projects
TEACHER INFORMATION
Summary: This document shows how to download and prepare a
satellite base map image and its accompanying “worldfile” and “projection file” for local mapping projects in AEJEE using the free website tool “Alaska Mapped.” (If you need assistance with extracting data from Alaska Mapped, go to the user forum at http://forum.gina.alaska.edu/forums/5/topics/38 and post your concern.)
Objectives: Teachers (or advanced students) will prepare an AEJEE-
ready satellite image using “Alaska Mapped.” Estimated Time: 30 minutes Correlation to Alaska Standards: Geography A-6 Use spatial (geographic) tools and technologies to analyze
and develop explanations and solutions to geographic problems.
Technology A-1 Use a computer to enter and retrieve information. BACKGROUND FOR THE TEACHER Several of the lessons included in the MapTEACH curriculum involve making AEJEE maps using GPS and other data collected locally by students. Satellite imagery can be a useful and informative base map layer upon which students can display their own data. It is not feasible for MapTEACH to be able to anticipate every possible area that any given student project would need satellite base map data for, therefore we have developed a procedure so teachers and advanced students can generate their own image layers for use in their local-area AEJEE projects. Good imagery makes a map more interesting. However, imagery pushes the limits of AEJEE and there are limits on file sizes and formats. Also, to allow

Preparing Alaska Base Map Imagery www.mapteach.org Technical Appendix A1
Page 396
imagery to align correctly with vector data and other images, users must prepare a “worldfile” and a “projection file” to accompany the image file. This document shows how to download and prepare local raster imagery and its accompanying files for AEJEE using the free website tool “Alaska Mapped.” The website is part of the Alaska Statewide Digital Mapping Initiative and is run out of GINA (Geographic Information Network of Alaska) at the University of Alaska - Fairbanks. GINA is currently in the process of updating the “Alaska Mapped” website. As a result, please be aware that in the near future the “Alaska Mapped” web interface will have a different look and feel than it does in this document. If you need assistance with extracting data from “Alaska Mapped” go to the user forum at http://forum.gina.alaska.edu/forums/5/topics/38 and post your concern. Some important concepts and tips for success: • Different browsers behave differently with regard to saving files off of
websites. We suggest Firefox because it behaves most predictably across computing platforms (Mac, PC, Linux) and requires fewer steps. However, this lesson also works with Internet Explorer on Windows and Safari on Mac.
• The three files that comprise an AEJEE-ready image (image file, projection file, worldfile) need to share identical file names differing only in their three-letter file extensions. o The projection file always has the extension “.prj” o The worldfile has an extension specific to the image format. Here’s the
formula: worldfile extension = image file extension with middle letter removed and appending a “w” Example: worldfile for a JPEG image (.jpg) = .jgw Example: worldfile for a GIF image (.gif) = .gfw Example: worldfile for a TIFF image (.tif) = .tfw
So an AEJEE-ready JPEG image would be a collection of three files like this: imagename.jpg, imagename.jgw, imagename.prj (where imagename is the name of the image)
MATERIALS • Computers - one for each student is best or two students can share. The
computers must meet the following specifications to run AEJEE: o Macintosh: MacOS 10.3 or above, 100 MB hard drive space, Internet
connection; recommend G4 or faster processor and more than 64 MB RAM o Windows: Win2000 or WinXP, 100 MB hard drive space, Internet
connection; recommend Pentium III or faster processor and more than 64 MB RAM
• AEJEE software can be provided by MapTEACH on a DVD delivered to you, or you can download the latest version from ESRI at http://www.esri.com/software/arcexplorer/index.html
• MapTEACH GIS data also can be sent to you on a DVD.

www.mapteach.org Preparing Alaska Base Map Imagery Technical Appendix A1
Page 397
INSTRUCTIONAL PROCEDURES (if used as a class lesson)
Getting Ready If you choose to use this as a lesson in class, try it out on a classroom computer ahead of time. You will better anticipate tasks that your students might find challenging, and feel much more comfortable giving directions and answering questions. Make any modifications that will help your students be more successful. Gear-up You can search for locations for which you would like imagery by place name or by latitude and longitude. If your location of interest does not have a common place name, you may need to use another source to determine the latitude and longitude. We suggest using Topozone, GoogleMaps or YahooMaps ahead of time if place name searches don’t work.
TEACHER RESOURCES Wikipedia provides information about worldfiles at: http://en.wikipedia.org/wiki/World_file MORE RESOURCES FOR STUDENTS OR TEACHERS MapTEACH has also produced a document for preparing other kinds of AEJEE-ready imagery for GIS professionals or advanced practitioners with access to ArcGIS 9.x software. The document is included as Technical Appendix B.

Preparing Alaska Base Map Imagery www.mapteach.org Technical Appendix A1
Page 398
Technical Appendix A
Preparing Alaska Base Map Imagery for Local Mapping Projects STUDENT EXERCISE
Step A: Browse to Website 1. Open a browser like Firefox or Safari, or Internet Explorer. 2. Browse to http://browse.alaskamapped.org 3. Note the interface includes four options on the left side (Search, MakeMap,
Open View Elsewhere, and Show Available Data). Each has “help” information available by clicking the “?” button. We will focus on the “Search” and “Make Map” functions.
The site should look like this when first opened:
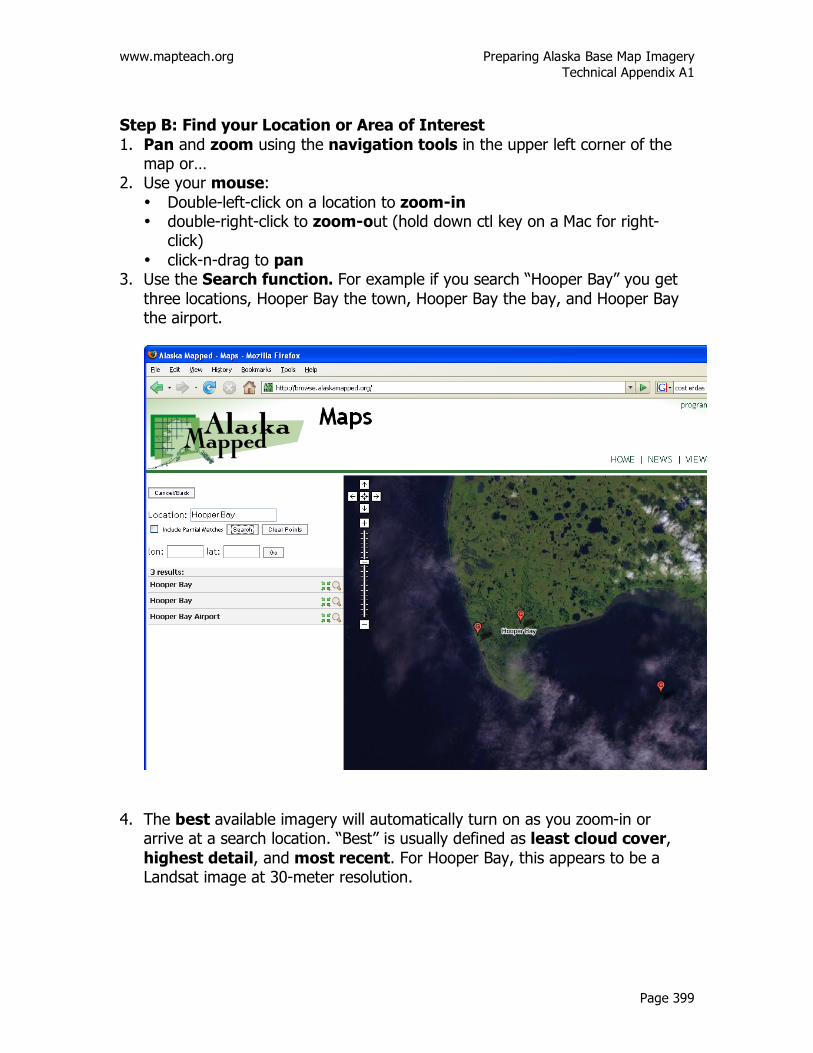
www.mapteach.org Preparing Alaska Base Map Imagery Technical Appendix A1
Page 399
Step B: Find your Location or Area of Interest 1. Pan and zoom using the navigation tools in the upper left corner of the
map or… 2. Use your mouse:
• Double-left-click on a location to zoom-in • double-right-click to zoom-out (hold down ctl key on a Mac for right-
click) • click-n-drag to pan
3. Use the Search function. For example if you search “Hooper Bay” you get three locations, Hooper Bay the town, Hooper Bay the bay, and Hooper Bay the airport.
4. The best available imagery will automatically turn on as you zoom-in or
arrive at a search location. “Best” is usually defined as least cloud cover, highest detail, and most recent. For Hooper Bay, this appears to be a Landsat image at 30-meter resolution.

Preparing Alaska Base Map Imagery www.mapteach.org Technical Appendix A1
Page 400
Step C: Generate the Image for AEJEE 1. First turn off the labels by clicking the “Imagery” button in the upper right of
the map. This makes it an Imagery-only map suitable for use as a base map. [Note: If you need the labels or roads, by all means keep them on but be aware that they will be a permanent part of your image once you download it]. If you did not use the search feature to arrive at your location of interest, proceed to step “D.”
2. If you used the search feature to find your location, turn off the search result points by clicking the “Clear Points” button. If you arrived by pan and zoom you will not need to do this.
3. If you used the search feature to find your location, exit search mode by clicking the “Cancel/Back” button. Note: DO NOT click the browser’s Back button! It will reset the map to the starting page or will leave the site all together. If you arrived by pan and zoom you will not need to do this step.
4. Now click “Make Map” on the left side of the browser window. 5. You will be given options for size in pixel dimensions. Select 1600 x 1200. For
Image format select JPEG. 6. Click the “Make” button. Step D: Save the Image to your Computer 1. The browser window should look something like this:

www.mapteach.org Preparing Alaska Base Map Imagery Technical Appendix A1
Page 401
2. The three files you need have been generated for you and now must be saved to your hard drive on your computer. Since different browsers handle this task differently, the directions have been separated into either “Firefox and Internet Explorer” or “Safari”. Follow the directions for the browser you are using.
Firefox and Internet Explorer Directions a. Right-click the “JPEG Image” link (or ctl-click on a one-button Mac mouse).
If you are using Firefox, select “Save Link As…”; if you are using Internet Explorer on Windows select “Save Target As…”.
b. Firefox and Internet Explorer will ask where you want to put the file and what you want to call it. You can name the files anything you want and put them anywhere you want as long as all three share the same exact name, are grouped together, and use the appropriate extensions (For example: fairbanks.jpg, fairbanks.jgw, fairbanks.prj)
c. Repeat step “a” for the “GIS Worldfile.” d. Firefox and Internet Explorer will ask where you want to put the file and what
you want to call it. Change the extension of the file from “.wld” to “.jgw”. Be sure to select “All Files” from the Save As menu, and click “Save”.
e. Repeat steps “a” and “b” for the “Projection File.” Safari Directions a. Right-click the “JPEG Image” link (or ctl-click on a one-button Mac mouse).
Select “Download Linked File As…” b. Safari will ask where you want to put the file and what you want to call it.
You can name the files anything you want and put them anywhere you want
Name it whatever you like, just be sure you use the same name for all three files
Must have jgw extension!

Preparing Alaska Base Map Imagery www.mapteach.org Technical Appendix A1
Page 402
as long as all three share the same exact name, are grouped together, and use the appropriate extensions (For example: fairbanks.jpg, fairbanks.jgw, fairbanks.prj) .
c. Repeat steps “a” and “b” for the “GIS Worldfile.” You will need to change this file name later to make it work with the .jpg file in AEJEE. (Steps e-f below)
d. Repeat steps “a” and “b” for the “Projection File” using the “.prj” extension.
e. Start Applications/TextEdit on your computer and then open the downloaded “.wld” file (Notice that it has automatically been renamed with the extension “.wld.txt” which will not work in AEJEE.).
f. Do a “Save As” and rename the “wld.txt” file with your image name and the extension “.jgw”.
g. Uncheck the box that says “If no extension is provided, use “.txt”.” h. Click “Save”. Step E: Test your Image in AEJEE 1. Open a new AEJEE map. 2. Navigate to /ESRI/AEJEE/Data/Data_MapTEACH_WGS84/Base_Data/ and add
Coastline_Simple.shp to your map. 3. Add your newly created image. 4. Set the Tools/Projection to Regional Projections/Albers Equal Area/Alaska
(with WGS84 datum). 5. Zoom-in on your area of interest. 6. It might look something like this:
Name it whatever you like, just be sure you use the same name for all three files Must have jgw extension!
NO check in the box

www.mapteach.org Preparing Alaska Base Map Imagery Technical Appendix A1
Page 403
7. If you can’t see your image, it could be because you are not zoomed in close enough, or because it is hidden by another layer, or because you forgot to set the projection. Check all of these factors first. If your image still does not appear or appears distorted, chances are your world file has the wrong extension or your three file names do not match exactly. Here the worldfile has the default extension “.wld” ( Oops, needs to be “.jgw”!):

www.mapteach.org Preparing Raster Imagery Technical Appendix B
Page 403
TECHNICAL APPENDIX B Preparing Raster Imagery in ArcGIS for AEJEE
(ArcExplorer Java Education Edition – for Mac/Win) To use projections in an AEJEE map with raster file imagery, you must assign projection information to the raster imagery you wish to use. Unlike ArcMap or ArcCatalog .aux files or world files for JPEGS or other raster formats. AEJEE relies on “PRJ files” like those used by shapefiles. Until version 2.3, GeoTIFF header tags were not recognized but now are. AEJEE also has performance limitations with large raster images. We suggest using pixel dimensions of 2500 or less (in either direction) and using JPEG or PNG-24 compressed format. While PNG has the advantage of supporting transparency, be aware that PNG format exported from ArcMap often alters image color values significantly. Performance is adversely affected when AEJEE needs to re-project raster imagery. We suggest pre-processing imagery to the projection that you will use in AEJEE. However, we also suggest using WGS_84 exclusively as the datum for your work in AEJEE if you intend to save your projects. This is because upon reopening a saved map in AEJEE, the datum is automatically reset to WGS_84 regardless of the datum it was saved with. This can cause long delays in opening a map as AEJEE re-projects your raster images. This is a known bug (CQ00308198) in AEJEE and one would expect that it will be subject to change in future versions. Vector data re-projects quickly and is not a factor in this discussion. [Most of these issues can be avoided if ArcIMS image services are used in AEJEE rather than local raster files. However, in many cases that is not an option as it requires a well-formed and highly available ArcIMS image service and user access to the Internet.] This is the protocol we are currently using with ArcGIS 9.2: A. Checking Native projection
1. Open ArcCatalog 2. Right-click image icon in the “Catalog Tree” (use the “Window” menu to
open the Catalog Tree if it is not visible) 3. Scroll-down to check “Spatial reference” and datum to confirm (if no
spatial reference is defined additional steps are required – see “defining spatial reference” below.)

Preparing Raster Imagery www.mapteach.org Technical Appendix B
Page 404
B. Re-project the raster image 1. Open the “ArcToolbox” panel (use the “Window” menu or toolbox icon). 2. Expand “Data Management Tools/Projections and Transformations/Raster” 3. Double-click “Project” 4. Set “Input raster” (input coordinate system should auto-fill) 5. Set “Output raster” note the comments in the Help panel. You must
specify an extension or the output will default to a GRID format. We suggest .tif
6. Set “Output coordinate system.” For example, to set UTM_6N_WGS84, use the “Select” button, and then double-click on Projected Coordinate Systems/UTM/WGS 1984/WGS 1984 UTM Zone 6N.prj. Click “Apply” and click “OK”
7. If you are moving from one datum to another, you will need to pick a transformation method [see list at end of this document].
8. Choose “CUBIC” for the resembling technique for smoother feature representation in the imagery.
9. We suggest leaving the Output cell size at the default setting. 10. Click “OK” to start the processing.
C. Convert the new GeoTIFF to a JPEG 1. Open ArcMap 2. Add the new GeoTIFF to a blank map. Allow pyramids to be made,
though AEJEE may not use them. If the projection worked, you should get no errors and you should see the units of measurement (e.g. “Meters” or “Degrees”) in the lower right corner of the map where cursor coordinates are reported.
3. If necessary, adjust contrast of the image using the “Symbology” properties of the image layer (right-click the layer name and select “properties”).
4. From the “File” menu, select “Export Map…” 5. Choose an output location. 6. Enter a file name 7. Select a file type (there are 10 options), we recommend JPEG 8. Enter a resolution (we recommend at least 200 dpi) but let Width and
Height guide your choice of resolution since the size of your map also influences the number of pixels. We recommend arranging less than 2,500 pixels as the longest dimension.
9. Select the “Write World File” option for possible future. 10. Click the “Save” button.

www.mapteach.org Preparing Raster Imagery Technical Appendix B
Page 405
D. Assigning Spatial Reference Info 1. Open ArcCatalog 2. Right-click image icon in the “Catalog Tree” (use the “Window” menu to
open the Catalog Tree if it is not visible) 3. Scroll-down to check “Spatial reference” and datum to confirm. If no
spatial reference is defined, click on the “Edit…” button and use the “Select…” button to navigate to the projection file you need. For example, to set UTM_6N_WGS84, use the “Select” button, and then double-click on Projected Coordinate Systems/UTM/WGS 1984/WGS 1984 UTM Zone 6N.prj. Click “Apply” and click “OK”. Then repeat “Apply” and “OK”.
4. Now ArcCatalog and ArcMap will recognize the spatial reference info. However, for AEJEE, you need to make a .PRJ file to match the new projection. Do this in Windows Explorer.
5. Navigate to a copy of the correct PRJ file (on most systems this will be here: C:\Program Files\ArcGIS\Coordinate Systems\Projected Coordinate Systems\UTM\WGS 1984\
6. Highlight the correct PRJ file, right-click and select “Copy” 7. Navigate to the directory containing your newly created JPEG or other file
from Step “C” above and paste the PRJ file (right-click, Paste). 8. Change the name of the PRJ file to match (exactly) the name of your
image file but keep the extension .prj [It is not a bad idea to keep a copy of the original PRJ file in the directory for future reference].
*Most Common Alaska Datum Transformations NAD_1927_To_WGS_1984_7 1176 Alaska NAD_1927_To_WGS_1984_21 1249 Alaska - Aleutians east of 180 E NAD_1927_To_WGS_1984_22 1250 Alaska - Aleutians west of 180 E NAD_1927_To_NAD_1983_Alaska 1243 Alaska NAD_1983_To_WGS_1984_1 1188 Alaska NAD_1983_To_WGS_1984_2 1251 Alaska - Aleutians