Western Alaska Salmon Stock Identification Program
107
Western Alaska Salmon Stock Identification Program Technical Document: 1 6 1 Title: Selection of the 96 SNP marker set for sockeye salmon Version: 1.0 2 Authors: T. Dann, J. Jasper, H. Hoyt, H. Hildebrand, and C. Habicht 3 Date: June 15, 2010 4 5 Introduction 6 7 The WASSIP Advisory Panel requested that 96 single nucleotide polymorphism (SNP) markers 8 be incorporated into the baselines for both sockeye salmon (Oncorhynchus nerka) and chum 9 salmon (O. keta) to improve the precision and accuracy of stock composition estimates (March 10 24, 2008). To meet this request for sockeye salmon, we contracted the development of at least 11 55 SNP markers that were targeted to differentiate among populations spawning within western 12 Alaska and the Alaska Peninsula drainages (forthcoming SNP Discovery Technical Document) 13 and we requested novel SNPs developed by other laboratories. Through these sources, we 14 received a total of 79 novel SNPs. Here we present the methodology for how the best- 15 performing SNP markers for sockeye salmon were selected for WASSIP. These selected 16 markers are being screened in baseline collections at this time and the new baseline genotypes 17 should be complete by the end of July, 2010. 18 19 The purpose of this technical document is to describe the methods that the Gene Conservation 20 Laboratory (GCL) used to choose the set of SNPs to be assayed in sockeye salmon for the 21 WASSIP project. We intend to gather feedback from the Technical Committee on the 22 methodology for marker selection in chum salmon. We anticipate having more markers to select 23 from in chum salmon (i.e., 240 SNPs) than we did for sockeye salmon (i.e., 124 SNPs). For 24 sockeye salmon, laboratory performance, conformance to Hardy-Weinberg expectations, linkage 25 among loci, and discrimination among pairs of populations of interest were the primary judges 26 used in marker selection. For chum salmon, we anticipate that population-discrimination factors 27 1 This document serves as a record of communication between the Alaska Department of Fish and Game Commercial Fisheries Division and the Western Alaska Salmon Stock Identification Program Technical Committee. As such, these documents serve diverse ad hoc information purposes and may contain basic, uninterpreted data. The contents of this document have not been subjected to review and should not be cited or distributed without the permission of the authors or the Commercial Fisheries Division.
-
Upload
khangminh22 -
Category
Documents
-
view
0 -
download
0
Transcript of Western Alaska Salmon Stock Identification Program
Western Alaska Salmon Stock Identification Program Technical
Document:1
6
1
Title: Selection of the 96 SNP marker set for sockeye salmon Version: 1.0 2
Authors: T. Dann, J. Jasper, H. Hoyt, H. Hildebrand, and C. Habicht 3
Date: June 15, 2010 4
5
Introduction 6
7
The WASSIP Advisory Panel requested that 96 single nucleotide polymorphism (SNP) markers 8
be incorporated into the baselines for both sockeye salmon (Oncorhynchus nerka) and chum 9
salmon (O. keta) to improve the precision and accuracy of stock composition estimates (March 10
24, 2008). To meet this request for sockeye salmon, we contracted the development of at least 11
55 SNP markers that were targeted to differentiate among populations spawning within western 12
Alaska and the Alaska Peninsula drainages (forthcoming SNP Discovery Technical Document) 13
and we requested novel SNPs developed by other laboratories. Through these sources, we 14
received a total of 79 novel SNPs. Here we present the methodology for how the best-15
performing SNP markers for sockeye salmon were selected for WASSIP. These selected 16
markers are being screened in baseline collections at this time and the new baseline genotypes 17
should be complete by the end of July, 2010. 18
19
The purpose of this technical document is to describe the methods that the Gene Conservation 20
Laboratory (GCL) used to choose the set of SNPs to be assayed in sockeye salmon for the 21
WASSIP project. We intend to gather feedback from the Technical Committee on the 22
methodology for marker selection in chum salmon. We anticipate having more markers to select 23
from in chum salmon (i.e., 240 SNPs) than we did for sockeye salmon (i.e., 124 SNPs). For 24
sockeye salmon, laboratory performance, conformance to Hardy-Weinberg expectations, linkage 25
among loci, and discrimination among pairs of populations of interest were the primary judges 26
used in marker selection. For chum salmon, we anticipate that population-discrimination factors 27
1 This document serves as a record of communication between the Alaska Department of Fish and Game
Commercial Fisheries Division and the Western Alaska Salmon Stock Identification Program Technical Committee.
As such, these documents serve diverse ad hoc information purposes and may contain basic, uninterpreted data. The
contents of this document have not been subjected to review and should not be cited or distributed without the
permission of the authors or the Commercial Fisheries Division.
WASSIP Technical Document 6: Locus selection for sockeye salmon
2
will contribute to the marker selection to a greater degree because we will be starting from a 28
larger pool of markers and the genetic divergence among chum salmon populations within the 29
WASSIP study area is less than that for sockeye salmon in the current baselines. 30
31
Methods 32
33
Choice of test populations 34
35
We chose 24 populations from across the species range to represent the regions that produce the 36
majority of sockeye salmon as well as the geographic and genetic diversity observed in previous 37
analyses (Habicht et al. 2010). In addition to these production and diversity criteria, we included 38
populations where collections met the following criteria: 1) fin, heart or liver tissue was 39
available, 2) 8-10 DNA extractions worth of tissue was available for future analyses, and 3) 95 40
individuals were available for adequate estimates of allele frequencies. We intended this set of 41
24 populations to serve as a set of test populations for all laboratories interested in the population 42
genetics of Pacific Rim sockeye salmon. In addition to one pair of populations in the set of 24 43
test populations, we included an additional 6 pairs of populations that were of interest to 44
ADF&G for a total of 36 populations. Each pair of populations represented two regions which 45
the Department desired greater genetic divergence between to aid in mixed stock analyses 46
(MSA) for management purposes. Populations were assigned to fine- and broad-scale regions for 47
use in regional measures of diversity. 48
49
Laboratory measures 50
51
Assaying Genotypes 52
53
Genomic DNA for more recent collections was extracted using a DNeasy® 96 Tissue Kit by 54
QIAGEN® (Valencia, CA), while an inorganic method was used for some older collections. We 55
screened the 45 current sockeye salmon SNP markers as well as 77 new SNP markers performed 56
using Fluidigm®
96.96 Dynamic Arrays (http://www.fluidigm.com) and 1 current and 1 new 57
marker on the Applied Biosystems platform. The Fluidigm® 96.96 Dynamic Array contains a 58

WASSIP Technical Document 6: Locus selection for sockeye salmon
3
matrix of integrated channels and valves housed in an input frame. On one side of the frame are 59
96 inlets to accept the sample DNA from each individual fish and on the other are 96 inlets to 60
accept the assays for each SNP marker. Once in the wells, the components are pressurized into 61
the chip using the IFC Controller HX (Fluidigm). The 96 samples and 96 assays are then 62
systematically combined into 9,216 parallel reactions. In this study, 122 assays were loaded on 63
two separate arrays. Each reaction is a mixture of 4µl of assay mix (1x DA Assay Loading 64
Buffer (Fluidigm), 10x TaqMan® SNP Genotyping Assay (Applied Biosystems), and 2.5x ROX 65
(Invitrogen)) and 5µl of sample mix (1x TaqMan® Universal Buffer (Applied Biosystems), 0.05x 66
AmpliTaq® Gold DNA Polymerase (Applied Biosystems), 1x GT Sample Loading Reagent 67
(Fluidigm) and 60-400ng/µl DNA) combined in a 7.2nL chamber. Thermal cycling was 68
performed on an Eppendorf IFC Thermal Cycler as follows: 70°C for 30 min for “Hot-Mix” 69
step, initial denaturation of 10 min at 96°C followed by 40 cycles of 96° for 15 s and 60° for 1 70
min. The Dynamic Arrays were read on a Fluidigm®
EP1TM
System after amplification and 71
scored using Fluidigm® SNP Genotyping Analysis software. 72
73
The 2 assays genotyped on the Applied Biosystems platform was performed in 384-well reaction 74
plates. Each reaction was conducted in a 5µL volume consisting of 5-40ng/μl of template DNA, 75
1x TaqMan® Universal PCR Master Mix (Applied Biosystems), and 1x TaqMan® SNP 76
Genotyping Assay (Applied Biosystems). Thermal cycling was performed on a Dual 384-Well 77
GeneAmp® PCR System 9700 (Applied Biosystems) as follows: an initial denaturation of 10 78
min at 95°C followed by 50 cycles of 92°C for 1s and annealing/extension temperature for 1 79
min. The plates were scanned on an Applied Biosystems Prism 7900HT Sequence Detection 80
System after amplification and scored using Applied Biosystems‟ Sequence Detection Software 81
(SDS) version 2.2. 82
83
Scoring Genotypes and Rating Assays 84
85
The most important measure of an assay‟s utility was the genotyping performance on our 86
platform. We assessed the performance of these assays in our laboratory to determine their utility 87
as markers used in the future for MSA. 88
89

WASSIP Technical Document 6: Locus selection for sockeye salmon
4
Dynamic Arrays that experienced the same DNA and assay loading and PCR process were 90
combined for scoring purposes, and are referred to as combined chip runs. Two Dynamic Arrays 91
always experienced these same conditions on our platform, and so we scored 18 combined chip 92
runs independently that serve as repeated measures for further laboratory performance judges. 93
We entered collected genotypes into the GCL Oracle database, LOKI, for access for further 94
analyses. 95
96
During the scoring process, we rated each combined chip run for 3 measures to judge laboratory 97
performance. These measures were: 1) the spread of, 2) the space between, and 3) the alignment 98
of genotype clusters. The spread of a genotype cluster was a measure of the variation among 99
individuals of a genotype; an assay with very little variability in genotype clusters spread had 100
tight genotype clusters that were easier to score and produced more reliable data (Figure 2). The 101
space between genotype clusters was a measure of the distance between the edges of genotype 102
clusters; an assay with large spacing between clusters had distinct clusters that were easier to 103
score and produced more reliable data (Figure 3). The alignment of genotype clusters was a 104
measure of the alignment of genotype clusters relative to the origin; an assay with separated 105
cluster alignment from the origin had distinct genotype clusters. This measure is correlated with 106
the space between clusters but can differ depending upon the distance from the origin (Figure 4). 107
108
For each of these measures, we gave each combined chip run a subjective score ranging between 109
1 (worst) and 5 (best). To avoid scoring and rating bias, each combined chip run was scored and 110
rated by two people, one of which was always our most senior laboratory staff member for 111
consistency and the other was one of the three other laboratory staff members involved with this 112
project. In addition to these measures, we also calculated the success rate of an assay as the 113
number of successfully genotyped individuals divided by the total number amplified. We 114
tabulated the mean, variance and coefficient of variation (CV) for each of these measures of each 115
assay and ranked each assay by its mean and CV for each measure. Rankings for all judges in 116
this study were corrected for ties when necessary. 117
118
119
WASSIP Technical Document 6: Locus selection for sockeye salmon
5
Population genetics measures 120
121
Conformance to Hardy-Weinberg Expectations 122
123
We tested population genotype frequencies at each marker for conformance to Hardy-Weinberg 124
expectations (HWE) using GDA (Lewis and Zaykin 2001). We tabulated the number of 125
populations that failed to conform to HWE for three levels of significance (α = 0.05, 0.01, and 126
0.001), and ranked each marker based upon the number of populations that failed to conform to 127
HWE for α = 0.05. The number of the 36 test populations expected to fail to conform to HWE by 128
chance at these three criteria are approximately 2, 0 and 0, respectively. 129
130
Linkage disequilibrium 131
132
We tested all pairs of nuclear markers for gametic disequilibrium within each collection using 133
GDA (Lewis and Zaykin 2001). We defined a pair of markers to be significantly out of gametic 134
equilibrium if tests for gametic disequilibrium were significant (P < 0.01) for greater than half of 135
all collections. When gametic linkage was significant, we examined the distribution of the 136
linkage across the range of the test populations to determine if there was a pattern to the phase of 137
linkage that might be useful for MSA. We used the measure of linkage r (Hedrick 2005), which 138
is D as described by Hill (1975) but corrected for allele frequency, to assess the phasing of 139
linkage. We also estimated the haplotype frequencies as described by Hill (1975), and, if a 140
haplotype was missing, we interpreted this as indicating the loci were in phase, in which case one 141
locus provides the same amount of information as both linked loci. When a pair of loci were 142
linked, and no pattern in the phase of linkage was observed, we chose which locus to keep for 143
further analyses based upon ratings for the laboratory measures described above and observed 144
heterozygosities. We did not rank markers based upon linkage; rather, we treated this measure as 145
a “gating measure” beyond which only unlinked or usefully linked markers were allowed to 146
continue on for ranking in further analyses. 147
148
149
WASSIP Technical Document 6: Locus selection for sockeye salmon
6
Principal component analysis 150
151
We conducted a principal component analysis as a measure of how much of the overall genetic 152
variation each marker explained. We calculated the contribution of each marker to the first and 153
second principal components (PC1 and PC2, respectively), as well as the average contribution to 154
the principal components that explained 80% of total variation. We ranked each marker based 155
upon these three judges of informational content. 156
157
Measures of population divergence based upon FST 158
159
We calculated three measures of FST to assess how each marker described differentiation among 160
populations and regions using the Weir and Cockerham measure of FST (θ) calculated in GDA 161
(Lewis and Zaykin 2001). These measured variation partitioned among populations within fine-162
scale regions (θS), among fine-scale regions within broad-scale regions (θP), and between 163
populations within pairs of populations of interest (θPairs). We ranked each marker based upon 164
each of these three FST measures; the marker with the highest FST value received the top rank. 165
166
Measures of population divergence among pairs of populations of interest 167
168
We used two measures to examine the divergence among pairs of populations of interest to 169
assess how each marker differentiated populations of interest to ADF&G. These measures were 170
the log likelihood ratio G statistic (Sokal and Rohlf 1995) from a test of the homogeneity of 171
allele frequencies and fORCA. fORCA is a measure of informativeness described by Rosenberg 172
(2005; Rosenberg et al. 2003) that indicates how well each marker assigns individuals back to 173
their population of origin. The two measures differ in that the G test is based solely upon 174
differences in population allele frequencies of a marker while fORCA measures a markers utility 175
for population assignment. 176
177
178

WASSIP Technical Document 6: Locus selection for sockeye salmon
7
Overall fORCA 179
180
We implemented the univariate accumulation algorithm described by Rosenberg (2005), using 181
the Optimal Rate of Correct Assignment as a performance function (fORCA; Rosenberg et al. 2003; 182
Rosenberg 2005). While the univariate accumulation method does not consider synergies 183
between markers, Rosenberg (2005) demonstrated that it performs as well as methods that do 184
consider synergies. 185
186
Sum of rankings and selection of final marker set 187
188
We investigated a nonparametric approach to determine how concordant rankings among 189
differing measures of marker performance were. Specifically, we examined Kendall‟s coefficient 190
of concordance (W), which measures the agreement among rankings of different judges (Sokal 191
and Rohlf 1995). It is calculated as: 192
(Eq. 1) 193
where k is the number of variables or judges, n is the number of items per variable or items being 194
ranked, and X 2 is a component of Friedman‟s method for randomized blocks, the nonparametric 195
analog of a randomized block ANOVA (Sokal and Rohlf 1995). The statistic X 2 is calculated as: 196
(Eq. 2) 197
where a is the number of treatments and is equal to n in Equation 1, b is the number of blocks 198
and is equal to k in Equation 1, and Rij is the sum of ranks across b blocks. 199
200
We were more interested in an overall measure of performance across many different judges, so 201
we chose the Rij of Equation 2 as our overall measure of marker performance. Markers were 202
ranked based upon their Rij values with the lowest value receiving the highest ranking. Some 203
Markers lacked scores for some judges for various reasons (e.g., G tests when the marker was 204
fixed between the populations being tested), and these markers were given rankings equal to the 205
worst ranking for these judges. In contrast, mitochondrial SNPs (One_CO1, One_Cytb_17, and 206
One_Cytb_26) were given rankings equal to the highest ranking for our Hardy-Weinberg judge, 207
and both the mitochondrial SNPs and the two linked MHC SNPs (One_MHC2_190 and 208

WASSIP Technical Document 6: Locus selection for sockeye salmon
8
One_MHC2_251) were given the rankings that their combined haplotype/phenotype marker 209
received. 210
211
We examined the top-ranked 96 markers from this final list with senior laboratory staff to ensure 212
that their performance in the lab would produce reliable data. When it was deemed necessary, we 213
replaced SNPs that performed very poorly with the next highest ranked SNP that we believed 214
would produce reliable data. 215
216
The final consideration in choosing 96 markers was correspondence with stakeholder 217
laboratories. We distributed our methodology and final list of 96 SNPs to these laboratories to 218
see if any of the SNPs we chose to remove were highly valuable to other laboratories and could 219
be easily replaced to maximize the efficiency of SNP data collection and standardize data sets 220
across the Pacific Rim. 221
222
Population genetics measures not included in the ranking of SNPs 223
224
We conducted three other analyses of genetic variation among test populations that we ultimately 225
did not include as judges for final rankings and marker selection. We present those analyses here 226
for completeness and to help guide the methodology to be employed for chum salmon marker 227
selection. 228
229
Backward elimination locus selection 230
231
We examined the marker contribution to correct individual assignment with the backward 232
elimination locus selection algorithm incorporated in the program BELS (Bromaghin 2008). We 233
did not define reporting groups as our regional groupings and numbers of populations within 234
regions for this project were not representative of the reporting groups we have used in the past 235
or intend to use with the sockeye baseline currently in production. Instead, we chose to maximize 236
the mean individual assignment accuracy as our measure of performance and set a minimum 237
performance of 0. We chose to resample baseline data, with equal baseline collection sample 238
sizes of 95 individuals, to accurately represent our baseline for sockeye salmon. We chose to 239
WASSIP Technical Document 6: Locus selection for sockeye salmon
9
simulate genotypes for individual assignment from baseline allele frequencies with a fixed 240
number of individuals per population. We set this number of individuals to be 190, which is 241
representative of our desired minimum sample size for mixtures, and conducted 250 replications. 242
Since the analysis took 54 days to complete with these parameters, and was not nearing 243
completion when we chose our marker set, we did not include BELS rankings as a judge but 244
report them here for completeness. 245
246
Hierarchical log-likelihood analysis 247
248
We examined the homogeneity of allele frequencies among populations within 9 fine-scale 249
regions (Table 1) using a hierarchical log-likelihood ratio test (G test; Sokal and Rohlf, 1995). 250
We included data from all independent nuclear markers and haplotype data for the mitochondrial 251
SNPs and the two linked MHC SNPs. As the number of populations within regions differed 252
greatly (i.e., 3 populations in the North Peninsula region, 7 populations in the Cook Inlet region), 253
we divided G statistics by degrees of freedom to examine a measure of regional diversity less 254
biased by sampling effort. 255
256
Nei’s gene diversity analysis 257
258
Finally, we examined how diversity was distributed among the different hierarchical levels 259
described above with Nei‟s Gene Diversity analysis (Nei 1987). We tabulated the percentage of 260
variation attributable to allele frequency differences within populations (GWP), among 261
populations within fine-scale regions (GPF), among fine-scale regions within broad-scale regions 262
(GFB), and among broad-scale regions within the total (GBT) for each of the 124 SNPs (Tables 2 263
and 3) screened for 36 test populations (Table 1) of sockeye salmon. 264
265
Results 266
Choice of test populations 267
268
The 36 populations chosen as test populations represent regions producing the majority of 269
sockeye salmon (Bristol Bay – 8 populations; Kamchatka Peninsula – 4 populations; Eggers and 270

WASSIP Technical Document 6: Locus selection for sockeye salmon
10
Irvine 2007; Bugaev et al. 2008), much of the genetic diversity that has been observed (6 271
populations from the Alaska Peninsula and Kodiak; 8 populations from Southeast Alaska and 272
British Columbia; Habicht et al. 2010), and a broad expanse of the species‟ range (Table 1; 273
Figure 1). The pairs of populations of interest include 3 pairs of populations from Bristol Bay 274
where the GCL has noted a lack of genetic divergence between reporting groups in the past (i.e., 275
Igushik and Wood rivers, Egegik and Ugashik rivers, and Ugashik and Meshik rivers; Habicht et 276
al. 2007; Dann et al. 2009), and where we hoped to find new discriminating markers. Similar 277
reporting group overlap was identified in the Chignik River system (i.e., Black and Chignik 278
lakes; Creelman et al. In Prep), in Cook Inlet (i.e., Yentna and Susitna river sloughs; Larson and 279
Mama and Papa Bear lakes; Barclay et al. 2010), and in southern Southeast Alaska (i.e., 280
McDonald and Hugh Smith lakes; GCL unpublished data). With the exception of Glacial Lake in 281
the Norton Sound region, all of our regional groupings are represented by multiple populations; 282
Norton Sound was subsequently included with the western Bristol Bay region. 283
284
Laboratory measures 285
286
Assaying Genotypes 287
288
A total of 3,447 fish from the 36 test populations (Table 1) were genotyped for the 124 markers 289
included in this study (Table 2). When all markers were included, individuals were genotyped 290
with a failure rate of 4.11%, but this is inflated artificially high because some markers failed in 291
the laboratory and their genotypes for all individuals were zeroed out during the scoring process 292
(see Scoring Genotypes and Rating Assays below). After correcting for these two markers, 293
individuals were genotyped with a failure rate of 2.52%, which is common for our laboratory. A 294
comparison of genotypes for the 45 SNPs previously genotyped for these collections and 295
genotypes produced in this project revealed a low discrepancy rate of 0.30%. Assuming an equal 296
error rate in the original and current genotyping process, and that this project accurately 297
represents our genotyping process, these collections were genotyped with a process that 298
produced genotypes with an error rate of 0.15%. 299
300
301
WASSIP Technical Document 6: Locus selection for sockeye salmon
11
Scoring Genotypes and Rating Assays 302
303
A majority of assays performed well in our laboratory. The average cluster tightness was 3.7, and 304
in general, ratings were normally distributed. Five assays were always rated 5 (best), few were 305
rated very poorly (i.e., 5 assays rated < 3), and many assays were rated intermediate producing a 306
„broad shoulder‟ of intermediate ratings (Table 4; Figure 5). A more left-skewed distribution was 307
observed for the measure of space between genotype clusters. (i.e. 26 assays rated < 3), with an 308
average rating of 3.3 (Table 4; Figure 6). In contrast, a majority of assays produced genotype 309
clusters with good alignment from the origin, with an average rating of 4.3, 34 with a rating of 5 310
and only 8 with a rating below 3 (Table 4; Figure 7). Three assays failed in the laboratory; two 311
that exhibited multiple clusters, indicative of multiple SNPs (One_PPM1K-118 and One_U1207-312
231) and one due to massive drop-outs (One_UCA-24). These assays were removed from further 313
analyses. 314
315
Population genetics measures 316
317
Conformance to Hardy-Weinberg Expectations 318
319
Forty-one markers conformed to HWE in all populations, 38 for all but 1 population, and 26 for 320
all but 2 populations at α = 0.05 (Table 5; Figure 9). The few variates observed for this measure 321
resulted in many tied ranks (e.g., markers out of HWE for 1 population were ranked 60.5). While 322
12 markers failed to conform to HWE at more than 2 populations (α = 0.05), only one showed a 323
considerable departure indicative of major problems (i.e., One_ U1021-57; 14 populations). As a 324
result, we removed this SNP from further analyses. 325
326
Linkage disequilibrium 327
328
Three pairs of SNPs exhibited significant linkage disequilibrium in a majority of populations. 329
These were One_aldB-152/One_ALDOB-135 (36 populations at α = 0.05), One_GPH-414/ 330
One_GTHa (36 populations at α = 0.05), and One_MHC2_190/ One_MHC2_251 (26 331
populations at α = 0.05) (Table 6). The linked MHC SNPs exhibit a pattern of linkage that is 332

WASSIP Technical Document 6: Locus selection for sockeye salmon
12
useful for MSA (i.e., a different phasing of linkage across regions) whereas the other two pairs 333
do not (Figure 10; Supplement A.113). For the two pairs of SNPs without a useful pattern of 334
linkage, we chose one SNP to retain for further analyses based upon laboratory ratings and 335
observed heterozygosity (One_aldB-152 and One_GTHa). For the remaining pair of linked 336
nuclear SNPs and the triplet of mitochondrial SNPs (One_CO1, One_Cytb_17, and 337
One_Cytb_26), genotypes from each locus were pooled to form phenotype/haplotype markers: 338
One_MHC2_190_251 and One_CO1_Cytb17_26, respectively. 339
340
Principal component analysis 341
342
The first 2 principal components, PC1 and PC2, explained 25% and 10% of the overall variation, 343
respectively, while the first 12 principal components explained 80% of total variation. Marker 344
contributions to PC1 and PC2 exhibited similar distributions, with few markers contributing 345
greater than 2% to each PC (9 and 10 markers, respectively) and a sharply dropping tail of 346
marker contribution (Table 7; Figures 11 and 12). In contrast, most markers had a similar 347
contribution to the 12 PC‟s that explained 80% of the overall variation (64 markers 0.5-1%), 348
with one exception: the combined MHC marker contributed 3.9% (Table 7; Figure 13). 349
350
Measures of population divergence based upon FST 351
352
The distribution of marker FST values among populations within fine-scale region and among 353
fine-scale regions within broad-scale regions were very similar, with few markers having 354
relatively high values, a rapidly declining tail to many intermediate values, and some very small 355
values (Table 8; Figures 14 and 15). FST values were greater among populations than among 356
regions, and the distribution of FST values reflect marked differences of allele frequencies among 357
populations and regions for a few markers and small differences for many markers. For example, 358
One_U1103 exhibited nearly fixed allele frequencies west of the Copper River but highly 359
variable frequencies among populations in the Eastern Gulf region (θP = 0.261; rank = 1; 360
Supplement A.82). 361
362
WASSIP Technical Document 6: Locus selection for sockeye salmon
13
The distribution of marker FST values between populations within pairs of populations was 363
different from the other two measures in that one marker had a high FST while most were of 364
intermediate values (Table 8; Figure 16). One_U1004-184 exhibited substantial variation 365
between these pairs of populations and had an FST of 0.49 (Rank = 1; Supplement A.71), while 366
87 markers had an FST between 0 and 0.1. However, some markers (e.g., One_U404-229) 367
showed highly divergent allele frequencies between some pairs of populations (McDonald Lake 368
minor allele frequency (MAF) = 0.214, Hugh Smith Lake MAF = 0.096), but were either fixed 369
(Ualik – Pick) or showed very small differences in MAF for other pairs of populations 370
(maximum MAF difference for other 5 pairs = 0.035; Supplement A.101). 371
372
Measures of population divergence among pairs of populations of interest 373
374
Log-likelihood ratio (G) statistics and fORCA generally gave very similar marker rankings (Tables 375
9 and 10). Markers were generally either good at discriminating between pairs of populations or 376
they were not; that is, markers were either ranked in the top 96 for many population 377
discriminating judges or they were ranked in the top 96 for very few (Figure 17). Notably, 378
One_U1004-184 exhibited substantial allele frequency differences between populations in 5 of 379
the 7 pairs, and was the top ranked marker in 6 judges (both G-statistic and fORCA for Ualik-Pick, 380
Deer-Cinder, and Broadway-Hatchery comparisons; Supplement A.71). 381
382
Overall fORCA 383
384
The combined MHC and mtDNA markers were the top and second-ranked markers as measured 385
by overall fORCA, and One_U1004-183 ranked third (Table 11). This may be explained by the fact 386
that MHC and mtDNA, the top and second-ranked markers, were the only two with more than 387
two alleles. 388
389
Sum of rankings and selection of final marker set 390
391
Some of our judges produced very different rankings, and so the nonparametric measure of 392
concordance suggested little agreement among judges (e.g., Figure 18). For example, measures 393
WASSIP Technical Document 6: Locus selection for sockeye salmon
14
of laboratory performance were often not highly correlated with measures of diversity across 394
broad-scale regions. 395
396
One hundred fifteen markers passed each of the gating judges and were ranked for each of the 30 397
judges. The distribution of the summed rankings was approximately normal with an average of 398
1,704 (SD = 363), and ranged from a low of 704.5 (One_MHC2_251) to a high of 2,697 399
(One_serpin) (Table 12; Figure 19). The top-ranked markers (i.e., those with the lowest sum of 400
ranks) included 5 markers with sum of ranks lower than 1,000, 10 markers with sum of ranks 401
between 1,000 and 1,500, and 81 markers with sum of ranks greater than 1,500. 402
403
The final examination of the 96 markers with the lowest sum of ranks revealed 2 that performed 404
poorly in the laboratory. These were: One_dds-529 (original rank 90; loose, poorly separated 405
genotype clusters) and One_psme2-354 (original rank 91; indistinct separation between 406
heterozygote and minor allele homozygote clusters). We replaced these with markers originally 407
ranked 97 and 99 (One_U1205-57 and One_c3-98; sum of ranks 2,064 and 2,083, respectively), 408
which performed much better in the laboratory and will likely produce much more accurate and 409
repeatable genotypic data. 410
411
Following our correspondence with stakeholder laboratories, we exchanged 1 SNP with its 412
linked complementary SNP to maximize marker set alignment with other laboratories. This 413
exchange was of One_GPH-414 for One_GTHa, which was a relatively benign transition, as the 414
2 SNPs had very similar observed heterozygosities (0.38 for both) and average cluster tightness 415
(3.2 and 3.6, respectively), space between (3.9 and 4.2, respectively), alignment (4.4 and 4.7, 416
respectively), and success rate (98% for both) ratings. 417
418
Population genetics measures not included in the ranking of SNPs 419
420
Backward elimination locus selection 421
422
The BELS analysis indicated that the average individual assignment accuracy was 89% with all 423
114 markers included in the analysis (Table 13; Figure 14). The first markers dropped 424
WASSIP Technical Document 6: Locus selection for sockeye salmon
15
contributed little to individual assignment accuracy, with 5 contributing less than 1% 425
individually and 87 contributing 1%. Only 2 markers contributed greater than 7% (combined 426
One_MHC2-190_251 = 14%) and the mitochondrial marker contributed 7% 427
(One_CO1_Cytb17_26). 428
429
Hierarchical log-likelihood analysis 430
431
The G statistics scaled by degrees of freedom varied considerably among markers within a 432
region and among regions (Table 14). As measured by this scaled G, the greatest diversity was 433
observed in the British Columbia – Washington region (average G/df across markers of 23.72), 434
while the least diversity was observed in the Eastern Bristol Bay region (4.31; average across all 435
markers and all regions = 10.94). When averaged across regions for individual markers, the 436
distribution of G/df was approximately normal and One_U1004-183 exhibited the greatest intra-437
regional allele frequency diversity (28.9; Supplement A.71). 438
439
Nei’s gene diversity analysis 440
441
Overall, 88% of total allele frequency variation was attributed to within populations, with 6% 442
among populations within fine-scale regions, 2% among fine-scale regions within broad-scale 443
regions and 5% among broad-scale regions within the total. One_ppie-74 had the largest percent 444
of variation attributable to among populations within regions (25%), although this was largely 445
due to a drastically different allele frequency for the Issaquah population relative to other British 446
Columbia/Washington populations (Table 15; Supplement A.44). The combined One_MHC2-447
190_251 (18%), One_U1214-107 (15%), the combined One_CO1_Cytb17_26 (14%), 448
One_metA-253 (11%), and One_U1004-183 (11%) were the other markers with greater than 449
10% attributable to frequency variation among populations within regions. One_HpaI-99 (11%), 450
One_metA-253 (6%), One_STC-410 (5%) and One_STR07 (5%) were the markers that varied the 451
most among fine-scale regions within broad-scale regions. 452
453
454

WASSIP Technical Document 6: Locus selection for sockeye salmon
16
Discussion 455
456
Laboratory performance, conformance to Hardy-Weinberg expectations, and linkage among 457
SNPs were the primary factors in marker selection for sockeye salmon. These factors played the 458
dominant role in marker selection because they were gating factors and we were selecting from a 459
small set of markers (124 SNPs) that was only 29% larger than our targeted number of 96 SNPs 460
to run for the full baseline. In other words, after exclusion based on these factors, there were few 461
loci to exclude based on other factors to achieve our target of 96 SNPs. Of the 124 SNPs we 462
screened, 6 were excluded outright based on these 3 factors and 3 SNPs were excluded due to 463
fixation. An additional 10 markers were excluded primarily due to low rankings heavily 464
influenced by poor laboratory performance (Figures 18 and 19). 465
466
Other factors that influenced marker selection included both positive and negative factors. The 467
positive factors included large allele frequency differences at both wide and narrow geographic 468
scales and a premium on selecting markers that would allow standardization among laboratories. 469
The two MHC SNPs (One_MHC2-190 and One_MHC2-251), for example, had relatively poor 470
but acceptable laboratory performance, yet rated at the top based on high measures of genetic 471
variation both on the wide (FST and overall fORCA) and narrow (pairwise G and fORCA) geographic 472
scales (Figure 18). We also selected One_GPH-414, which was the lower laboratory-ranked 473
locus of the linked locus pair that included One_GTHa. We selected One_GPH-414 because it is 474
part of the standard set used by Canadian Department of Fisheries and Oceans (CDFO). CDFO 475
is one of the stakeholder laboratories that analyze SNPs in sockeye salmon. Both of these two 476
loci had acceptable laboratory performance, and this change would allow for data sharing across 477
laboratories. 478
479
Aside from the three primary factors, the largest negative factor that affected marker selection 480
was low levels of genetic variation. Low variation at all levels was the main factor in the 481
exclusion of an additional 8 markers (Tables 7, 8, 14, and 15). These excluded markers either 482
had very low levels of variability within populations, among populations within fine-scale 483
regions, among fine-scale regions within broad-scale regions, and/or among broad-scale regions 484
within the total. Little variation also heavily influenced some measures as divergent allele 485
WASSIP Technical Document 6: Locus selection for sockeye salmon
17
frequencies for „outlier‟ populations provided great contrast from most populations. For 486
example, One_metA-253 was the highest ranking SNP as measured by PC1 due to near fixation 487
for all populations west and north of the Copper River, but a frequency of approximately 0.2 for 488
Meziadin Beach in British Columbia (Supplement A.36). 489
490
The choice of populations to test SNPs on could impact the ranking of loci due to differences in 491
genetic variation at each of these levels based on different test populations. We chose 492
populations that represented large sockeye salmon producing regions (e.g., Bristol Bay and the 493
Kamchatka Peninsula) and genetic diversity on different geographic scales (e.g., North Alaska 494
Peninsula and the Eastern Gulf of Alaska). Some populations were chosen to ensure that the full 495
Pacific Rim was represented so that we could identify loci that might differentiate among 496
populations from throughout the range of the species. Other collections were included to 497
identify loci that were likely to provide discriminating power between specific populations. How 498
these populations are chosen and how they are grouped into regional groups clearly has 499
substantial influence on marker selection based upon differing population and regional allele 500
frequencies. For example, we included the Glacial Lake population from the Seward Peninsula 501
for geographic representation but did not include other Norton Sound area populations. So we 502
grouped that population with others from the nearest regional group (western Bristol Bay) for 503
analyses of measures based upon regional diversity. This may have artificially inflated the 504
relative intra-regional diversity for that region, and corresponding rankings for measures based 505
upon this diversity, due to this necessary inclusion of a distantly related population. 506
507
Similarly, the methodology used for the final selection of loci can introduce potential bias. Test 508
statistics and scores for the 30 judges we chose to include were on different scales, and instead of 509
ranking each independently and summing ranks we could have unitized all scores to a common 510
range. Some of our judges exhibited very little variability (e.g., the number of populations failing 511
to conform to HWE at α = 0.05), so a difference of one variate had profound consequences on 512
rankings when corrections for ties were made. Such a unitizing across judges would have 513
allowed us to include a weighting scheme if we wanted. 514
515
WASSIP Technical Document 6: Locus selection for sockeye salmon
18
After gating judges were considered, we weighted our sockeye salmon SNP selection 516
methodology based upon the number of judges from a category of analyses. For example, 517
because the genetic diversity among populations in Western Alaska is greater for sockeye 518
salmon (e.g., Technical Document 5) than that for chum salmon (e.g., Technical Document 4), 519
we focused our sockeye salmon SNP selection on discriminating between populations from the 520
few reporting groups that still misallocate to one another. By defining half of our judges (i.e., 15 521
of 30) to be measures of discrimination between these pairs of populations, we weighted our 522
methodology heavily towards this effort (Figures 18 and 20). Our next most important focus was 523
laboratory performance (8 judges) and, lastly, information content of genetic variation among 524
populations, regional groupings and overall (6 judges). Our thinking was that if we selected the 525
loci with the most genetic variation between populations within fine-scale regions, we would 526
select loci that would also be useful at the larger geographic scales. This hypothesis seems to be 527
graphically borne out in Figure 18, where the distribution of good (green) and poor (red) 528
performing loci appear to be correlated between the PCA and FST columns and the “Pairs of 529
population measures” columns. Cases where these measures scored high but the loci scored low 530
overall were driven by poor laboratory performance scores. 531
532
The set of 96 SNPs we have chosen appear very useful for our needs. The new marker set 533
performs much better in our laboratory than our previous set of 45 SNPs, which will create more 534
consistent, reliable data to base analyses on. Similarly, the new marker set distinguishes among 535
populations and regions better than the old set, and improves the correct assignment as measured 536
by fORCA (Figure 20). The rate of improvement to correct assignment with each additional SNP 537
was slightly greater for our chosen 96 SNPs than it was for the original 45 SNPs, indicating that 538
the intermediate SNPs in the 96 SNP set contributed to correct assignment more than the 539
intermediate SNPs in the 45 SNP set. Furthermore, the correct-assignment curve asymptotes at a 540
much higher correct assignment (i.e., 91% compared to ~72%; Figure 20). In general, it appears 541
as though this set of SNPs should provide adequate power to correctly identify reporting groups 542
in mixed stock analyses of WASSIP area fisheries. 543
544
545

WASSIP Technical Document 6: Locus selection for sockeye salmon
19
Incorporating lessons on SNP selection from sockeye salmon to chum salmon 546
547
The development and application of methods to select SNP loci in sockeye salmon provides 548
insights into the most appropriate methods to select SNP loci for chum salmon. Higher numbers 549
of loci available for selection for chum salmon, differences among life histories between the two 550
species that lead to different population structure, and different management needs will all factor 551
into the best methodology. One of the likely parallels between these two methods will be the 552
incorporation of first gating judges (including Hardy-Weinberg equilibrium expectations, linkage 553
disequilibrium, acceptable laboratory performance) and then ranking judges (including 554
laboratory performance, principal component analysis, measures of population divergence based 555
upon FST, measures of population divergence among pairs of populations of interest, overall 556
fORCA, backward elimination locus selection, hierarchical log-likelihood analysis, and Nei‟s gene 557
diversity analysis). The likely differences will be in the focus and weighting of the ranking 558
variables. These ranking judges will be more important for chum salmon than sockeye salmon 559
SNP selection because of the larger number of loci likely available to chose from in chum 560
salmon. Retaining markers to increase correspondence of marker sets among stakeholder 561
laboratories will affect the final marker selection process but only for markers with intermediate 562
scores (all critical top-scoring markers will be retained and markers that do not pass gating 563
judges will be excluded). 564
565
We anticipate focusing the selection of test populations based on a hierarchy of discrimination. 566
At the highest level of the hierarchy, we will score loci based on their among-continent variation 567
(Asia, North America), then move to among coast-wide areas (Japan, Russia, Western Alaska, 568
Alaska Peninsula, Cook Inlet and Prince William Sound, Southeast Alaska, British Columbia, 569
Washington), then among Western Alaska/Alaska Peninsula regions (Alaska Peninsula, eastern 570
Bristol Bay, western Bristol Bay, Kuskokwim River summer, Kuskokwim River fall, Yukon 571
River summer, Yukon River fall, Norton Sound, Kotzebue Sound) and finally within Western 572
Alaska/Alaska Peninsula regions (two populations within each region). Based on known 573
population structure of chum salmon, we expect to find adequate genetic differentiation for the 574
two levels of this hierarchy and to distinguish among the Yukon River fall, Kuskokwim River 575
fall and Alaska Peninsula regions and coastal Western Alaska combined regions. Therefore we 576
WASSIP Technical Document 6: Locus selection for sockeye salmon
20
propose to emphasize loci that are particularly powerful at discriminating among coastal Western 577
Alaska regions (eastern Bristol Bay, western Bristol Bay, Kuskokwim River summer, Yukon 578
River summer, Norton Sound and Kotzebue Sound). The proposed list of test populations along 579
with our objectives will be shared with the Advisory Panel for comment. 580
581
One other change we might propose for chum salmon is to change the methods for the scored 582
variables from the ranking method used in sockeye salmon (1 for the best to 124 for the worst) to 583
a rating based on the score for the variable scaled to 1. Let us take the measures of population 584
divergence based upon FST among populations within fine-scale regions (Table 8; Figure 14) to 585
demonstrate the difference in methods. For sockeye, we simply ranked each marker and gave a 586
rank value to each marker. However, in looking at the distribution of FST across ranked markers, 587
we do not see a linear increase in FST from the poorest to best-performing loci. Rather the curve 588
is S-shaped with an initial steep increase in FST, followed by a much flatter increase through the 589
middle-raked markers followed by a steep increase in FST for the highest-ranked markers. The 590
ranking method used for sockeye salmon does not take this non-linear information into account. 591
For example the 19th
ranked marker is ranked 92 rankings higher than the 111th
marker (111-19), 592
even though it only had a 32% higher scaled FST value ((0.163-0.036)/0.398). On the other hand, 593
the highest ranked marker was ranked only slightly higher (110 rankings higher) than the 19th
594
marker even though it has a 91% higher scaled FST value ((0.398-0.036)/0.398). Using the scaled 595
FST values will add this information into the marker rating methods. Most of the scored variables 596
did not have linear relationships (see Figures 5-8 and 11-17) and should benefit from the scaled 597
rating method. 598
599
Future analyses 600
601
1. Finish running the baseline. We have currently genotyped approximately 30,500 602
individuals from 324 populations, and have approximately another 5,700 from 60 603
populations to genotype. 604
2. Identify changes to the marker selection methodology used for sockeye salmon to be 605
employed for chum salmon. 606
607
608
WASSIP Technical Document 6: Locus selection for sockeye salmon
21
Literature Cited 609
610
Barclay, A.W., C. Habicht, W.D. Templin, H.A. Hoyt, T. Tobias, and T.M. Willette. 2010 611
Genetic stock identification of Upper Cook Inlet sockeye salmon harvest, 2005-2008. 612
Alaska Department of Fish and Game, Fishery Manuscript No. 10-01, Anchorage. 613
614
Bromaghin J. F. 2008. BELS: backward elimination locus selection for studies of mixture 615
composition or individual assignment. Molecular Ecology Resources, 8:568-571. 616
617
Bugaev, A. V., I. I. Glevov, E. V. Golub, K. W. Myers, J. E. Seeb, and M. Foster. 2008. Origin 618
and distribution of sockeye salmon Oncorhynchus nerka local stocks in the western 619
Bering Sea in August-October 2006. Izv. TINRO 153:88-108. 620
621
Creelman, E. L. Hauser, R. Simmons, W.D. Templin, and L.W. Seeb. In prep. Temporal and 622
geographic genetic divergence: Characterizing sockeye salmon populations in the 623
Chignik watershed, Alaska using single nucleotide polymorphisms. Transactions of the 624
American Fisheries Society. 625
626
Dann, T.H., C. Habicht, J.R. Jasper, H.A. Hoyt, A.W. Barclay, W.D. Templin, T.T. Baker, F.W. 627
West, and L.F. Fair. 2009. Genetic stock composition of the commercial harvest of 628
sockeye salmon in Bristol Bay, Alaska, 2006-2008. Alaska Department of Fish and 629
Game, Fishery Manuscript Series No. 09-06, Anchorage. 630
631
Eggers, D. M., and J. R. Irvine. 2007. Trends in abundance and biological characteristics for 632
North Pacific sockeye salmon. North Pacific Anadromous Fish Commission Bulletin 633
4:53-75. 634
635
Elfstrom, C. M., C. T. Smith, and J. E. Seeb. 2006. Thirty-two single nucleotide polymorphism 636
markers for high-throughput genotyping of sockeye salmon. Molecular Ecology Notes 637
6(4):1255-1259. 638
639
Habicht, C., L. W. Seeb, and J. E. Seeb. 2007. Genetics and ecological divergence defines 640
population structure of sockeye salmon populations returning to Bristol Bay, Alaska, and 641
provides a tool for admixture analysis. Transactions of the American Fisheries Society 642
136:82-94. 643
644
Habicht, C., L. W. Seeb, K. W. Myers, E. V. Farley, and J. E. Seeb 2010. Summer–fall 645
distribution of stocks of immature sockeye salmon in the Bering Sea as revealed by 646
single-nucleotide polymorphisms. Transactions of the American Fisheries Society 647
139:1171–1191. 648
649
Hedrick, P.W. 2005. Genetics of Populations, Third Edition. Jones and Bartlett Publishers, 650
Sudbury, Massachusetts. 651
652
Hill, W.G. 1974. Estimation of linkage disequilibrium in randomly mating populations. Heredity 653
33(2):229-239. 654
WASSIP Technical Document 6: Locus selection for sockeye salmon
22
655
Lewis, P.O. and D. Zaykin. 2001. Genetic data analysis: computer program for the analysis of 656
allelic data. Version 1.0. URL http://lewis.eeb.uconn.edu/lewishome/software.html. 657
658
Nei, M. 1987. Molecular Evolutionary Genetics. Columbia University Press, New York, New 659
York. 660
661
Rosenberg, N.A., L.M. Li, R. Ward, and J.K. Pritchard. 2003. Informativeness of genetic 662
markers for inference of ancestry. American Journal of Human Genetics 73:1402-1422. 663
664
Rosenberg, N.A. 2005. Algorithms for selecting informative marker panels for population 665
assignment. Journal of Computational Biology 12(9):1183-1201. 666
667
Smith, C. T., C. M. Elfstrom, L. W. Seeb, and J. E. Seeb. 2005. Use of sequence data from 668
rainbow trout and Atlantic salmon for SNP detection in Pacific salmon. Molecular 669
Ecology 14(13):4193-4203. 670
671
Sokal, R.R. and F.J. Rohlf. 1995. Biometry. 3rd
Edition. Freeman, San Francisco, CA. 672
673
Weir, B.S. and C.C. Cockerham. 1984. Estimating F-statistics for the analysis of population 674
structure. Evolution 38:1358-1370. 675
676
677
WASSIP Technical Document 6: Locus selection for sockeye salmon
23
Technical Committee review and comments 678
Document 6: Selection of the 96 SNP marker set for sockeye salmon 679
680
Comments on this document appear to be somewhat moot, as the 96-locus panel has already 681
been selected and implemented for sockeye. However, many of the issues are relevant for the 682
parallel exercise for chum. 683
684
In general, the approach seems logical and well thought out. Each of the „judges‟ has some 685
potential value in helping to screen candidate loci, but the criteria differ in the types of 686
information they provide. Some criteria are directly relevant only to local WASSIP issues, while 687
others address issues of broader coastwide relevance. It should be recognized that the number of 688
criteria used for each category produces a de facto weighting scheme, and those involved should 689
carefully examine this to ensure that the results adequately reflect the relative importance of 690
different overlapping goals. We believe that substantial coastwide benefits, at little cost to local 691
resolution within WASSIP, can be achieved by giving some consideration to loci that are 692
strongly divergent around the Pacific Rim but relatively homogeneous within WASSIP. 693
694
We agree with the general idea that an important initial screening should eliminate from 695
consideration loci that cannot reliably be resolved in the laboratory. From the information 696
presented, however, it is difficult to determine exactly how the tolerance level for error was set. 697
698
We also agree with the idea to create a common scale for each of the criteria (e.g., each locus 699
gets a score from 0 to 1). This should facilitate a quantitative rating scale that summarizes 700
information across criteria. 701
702
Specific comments keyed to line number: 703
704
Line 183: It is not clear why this would be a general result 705
706
WASSIP Technical Document 6: Locus selection for sockeye salmon
24
291: failure rate of ~2.5% in getting genotypes. The key is whether this is random or whether 707
the probability of failure depends on the genotype. If, for example, heterozygotes are more 708
likely to be scored as “failed,” this would bias genotypic and allele frequencies. 709
710
299: estimated error rate of 0.15%. Actually, this is not a measure of absolute error rate, which 711
would require knowing what the true genotype is. What has been quantified is a measure of 712
consistency. For example, independent runs or scorers could get the same answer but both be 713
wrong. 714
715
318, and Table 5: How many total HWE departures were there? How does this compare with 716
the number expected by chance? 717
718
423: BELS appears to be an appropriate method to select informative loci from a larger set of 719
candidate loci. However, because they do not implement proper cross-validation, BELS and 720
other commonly used programs provide an overly optimistic assessment of assignment success 721
of the selected loci; see Anderson (2010). 722
723
WASSIP Technical Document 6: Locus selection for sockeye salmon
25
Tables 724
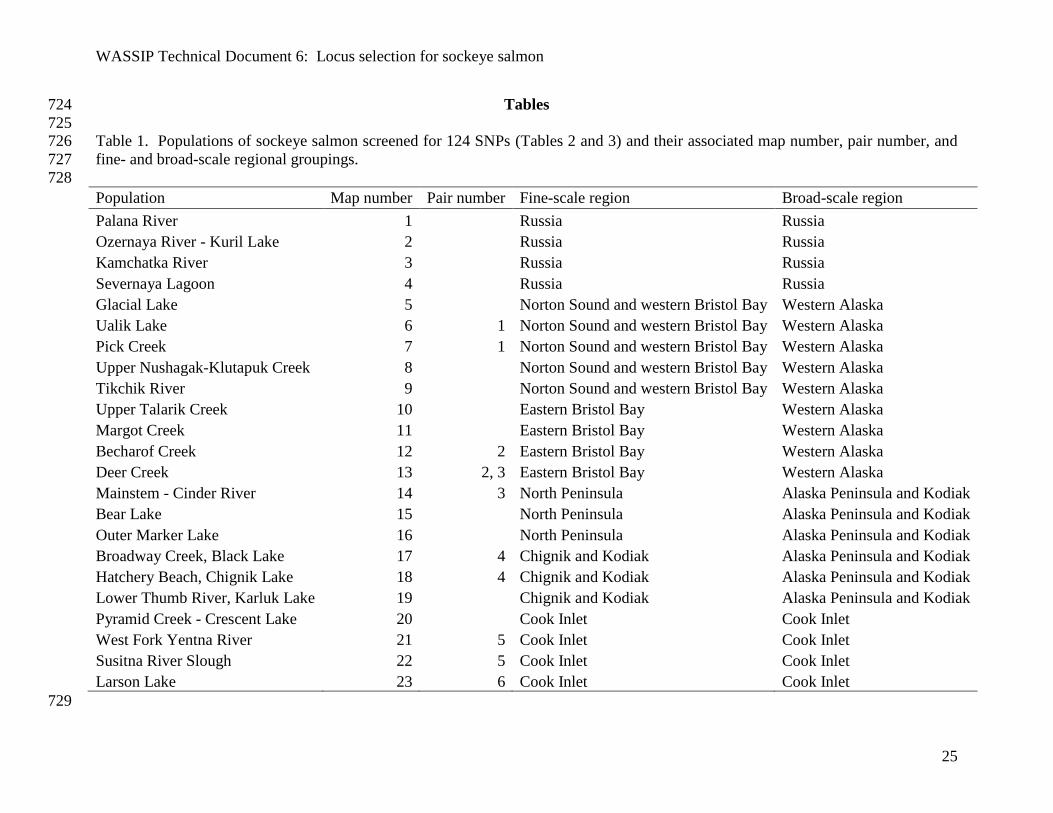
725 Table 1. Populations of sockeye salmon screened for 124 SNPs (Tables 2 and 3) and their associated map number, pair number, and 726
fine- and broad-scale regional groupings. 727
728
Population Map number Pair number Fine-scale region Broad-scale region
Palana River 1 Russia Russia
Ozernaya River - Kuril Lake 2
Russia Russia
Kamchatka River 3
Russia Russia
Severnaya Lagoon 4
Russia Russia
Glacial Lake 5
Norton Sound and western Bristol Bay Western Alaska
Ualik Lake 6 1 Norton Sound and western Bristol Bay Western Alaska
Pick Creek 7 1 Norton Sound and western Bristol Bay Western Alaska
Upper Nushagak-Klutapuk Creek 8
Norton Sound and western Bristol Bay Western Alaska
Tikchik River 9
Norton Sound and western Bristol Bay Western Alaska
Upper Talarik Creek 10
Eastern Bristol Bay Western Alaska
Margot Creek 11
Eastern Bristol Bay Western Alaska
Becharof Creek 12 2 Eastern Bristol Bay Western Alaska
Deer Creek 13 2, 3 Eastern Bristol Bay Western Alaska
Mainstem - Cinder River 14 3 North Peninsula Alaska Peninsula and Kodiak
Bear Lake 15
North Peninsula Alaska Peninsula and Kodiak
Outer Marker Lake 16
North Peninsula Alaska Peninsula and Kodiak
Broadway Creek, Black Lake 17 4 Chignik and Kodiak Alaska Peninsula and Kodiak
Hatchery Beach, Chignik Lake 18 4 Chignik and Kodiak Alaska Peninsula and Kodiak
Lower Thumb River, Karluk Lake 19
Chignik and Kodiak Alaska Peninsula and Kodiak
Pyramid Creek - Crescent Lake 20
Cook Inlet Cook Inlet
West Fork Yentna River 21 5 Cook Inlet Cook Inlet
Susitna River Slough 22 5 Cook Inlet Cook Inlet
Larson Lake 23 6 Cook Inlet Cook Inlet
729
WASSIP Technical Document 6: Locus selection for sockeye salmon
26
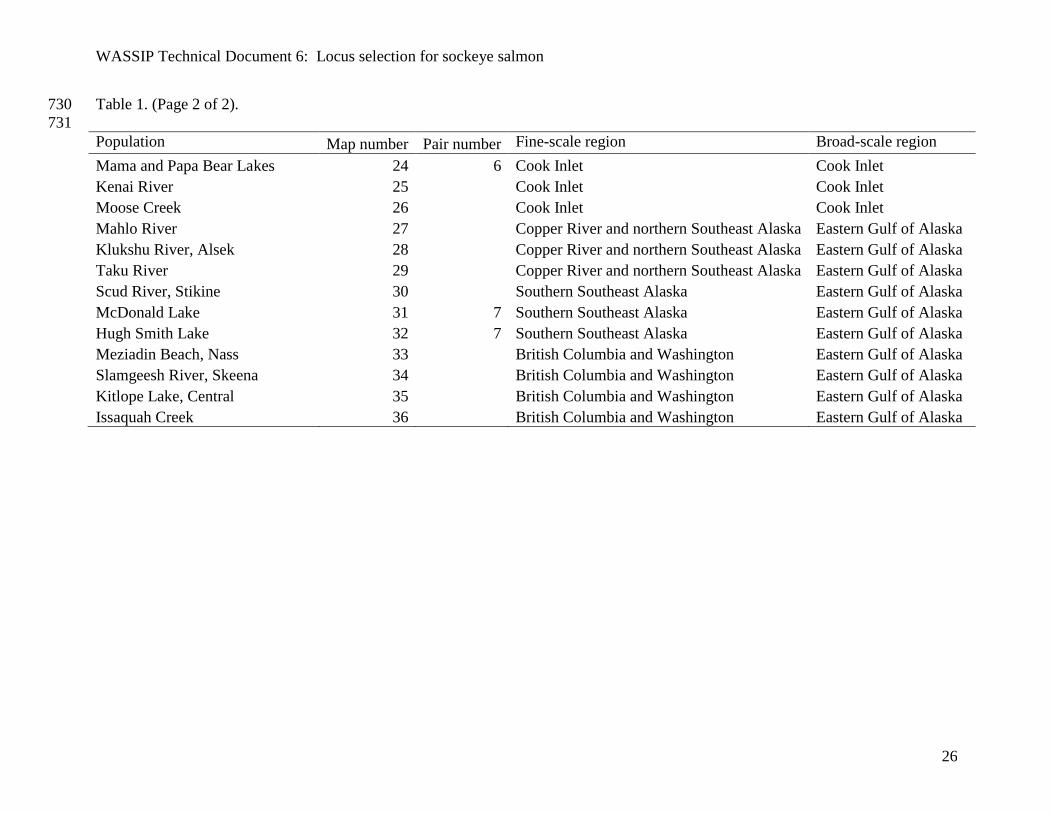
Table 1. (Page 2 of 2). 730
731
Population Map number Pair number Fine-scale region Broad-scale region
Mama and Papa Bear Lakes 24 6 Cook Inlet Cook Inlet
Kenai River 25
Cook Inlet Cook Inlet
Moose Creek 26
Cook Inlet Cook Inlet
Mahlo River 27
Copper River and northern Southeast Alaska Eastern Gulf of Alaska
Klukshu River, Alsek 28
Copper River and northern Southeast Alaska Eastern Gulf of Alaska
Taku River 29
Copper River and northern Southeast Alaska Eastern Gulf of Alaska
Scud River, Stikine 30
Southern Southeast Alaska Eastern Gulf of Alaska
McDonald Lake 31 7 Southern Southeast Alaska Eastern Gulf of Alaska
Hugh Smith Lake 32 7 Southern Southeast Alaska Eastern Gulf of Alaska
Meziadin Beach, Nass 33
British Columbia and Washington Eastern Gulf of Alaska
Slamgeesh River, Skeena 34
British Columbia and Washington Eastern Gulf of Alaska
Kitlope Lake, Central 35
British Columbia and Washington Eastern Gulf of Alaska
Issaquah Creek 36 British Columbia and Washington Eastern Gulf of Alaska

WASSIP Technical Document 6: Locus selection for sockeye salmon
27
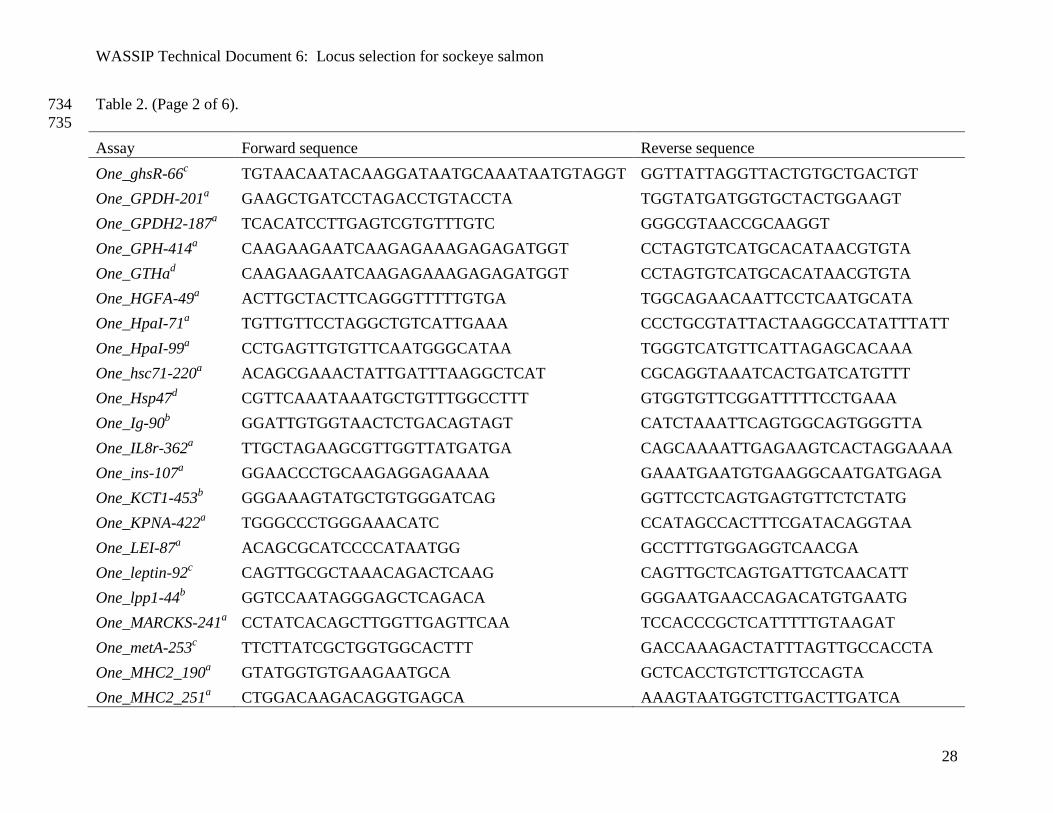
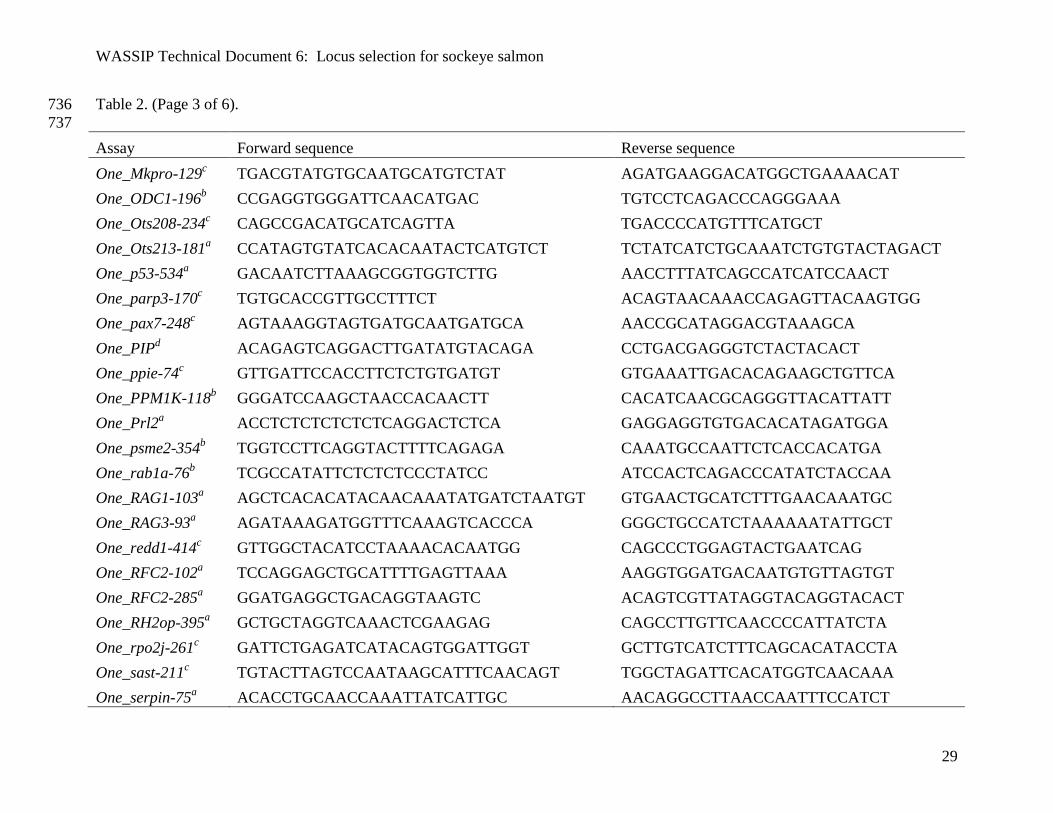
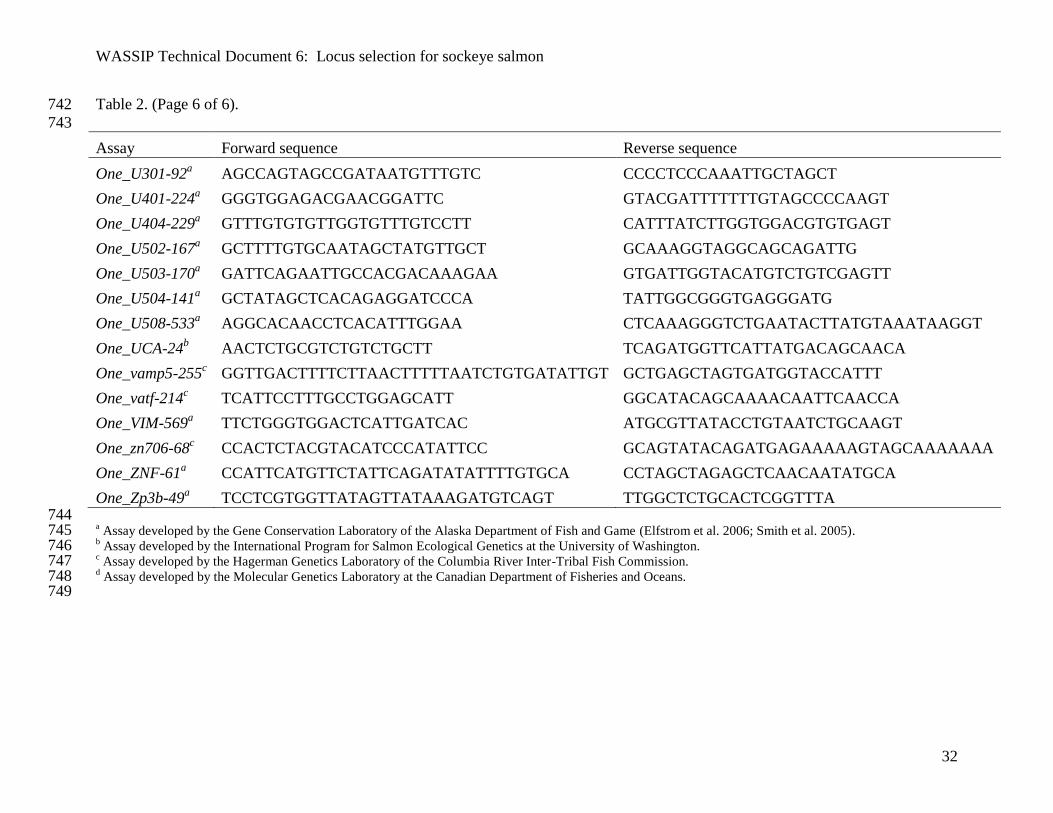
Table 2. Forward and reverse primer sequences for 124 SNP assays screened for 36 test populations (Table 1). 732
733
Assay Forward sequence Reverse sequence
One_ACBP-79a GAGGTGTGGGCTGACCA TCGACCGCTGGCAGTG
One_agt-132b GACCCAGATCAACAACTTCATCCA TGGTTGAGCTAAGGTCCTTGAAC
One_aldB-152c CGATCAGGTGACGCTAAAATTAACTC GTGGCTTCCTCTTCACTCTGA
One_ALDOB-135a CCCGTGCCGGACTTGTT TCAGCCATGTCAATTGGAATGTGA
One_apoe-83b CGCCATGGACAAGGTCAAG GGCACAGTGCTTCCAAACC
One_bckB-137c TCATCTCTCCCTCTCACCAATATCTC CATTGGGCGGAGTGTATTTCC
One_c3-98b GAGTGTGGAACTGGTTCTTGTTG GCCGGCAGGGCATCA
One_ccd16-131b CCGTGACCTGTTGAACTTTGTTTAG TCACGTTCTTGGAAAACAGC
One_CD9-269b ACGCTCTGAGGTGATATGAAACAC CATCCGACGTCAACATCCAAAC
One_cetn1-167b CAGAAATCCTGACTGTTAAAACAATGCA CTGCTCGTTGATCTCTCCATCTC
One_CFP1d CGCAGGTCAAAGTAGTACTTAGCAT GAGCGTCACTTCCTGGAACTT
One_cin-177c CCTCAGACTAGTGACCGTACCTA CGCTCACCGTGGTTACGT
One_CO1a CATAGTAATGCCTGCTGCTAGGA CCACTTTTTGTTTGAGCTGTGCTAA
One_ctgf-301a AAGGACAGAAACATATATGCGTATATTCAATGT CTGTCTTTCGTCCCCTCTTTAGG
One_Cytb_17a CCTGGGAGATCCAGACAATTTTA CGTAAGCGAAAAGGAAGTATCACTCT
One_Cytb_26a CCTGGGAGATCCAGACAATTTTA CGTAAGCGAAAAGGAAGTATCACTCT
One_dds-529c CATAATGCTCCCCATCTTGAATTGG CACTCAGCCCTTTAGGGAAGA
One_DDX5-86b CTCCCACATTGATCTGGACGTA TGCCACTTGGCCCAAAGAG
One_E2-65a GTGGCACCCCCTTTCTCT TGCAAACCTCAGTGGAGAACC
One_gadd45-269c AGTTCTCATCCTCTGCGGAAAG CCAAAATGGCTGGGCAAACAG
One_gdh-212c CCTGTGTTGAAGTGGAGTAGGTTAA GCTTTATACTGTAAGTGGACTGACCTT
One_GHII-2165a GGCATCAACCTGCTCATCGA TGCACAAAGTGCGGCAC
WASSIP Technical Document 6: Locus selection for sockeye salmon
28
Table 2. (Page 2 of 6). 734
735
Assay Forward sequence Reverse sequence
One_ghsR-66c TGTAACAATACAAGGATAATGCAAATAATGTAGGT GGTTATTAGGTTACTGTGCTGACTGT
One_GPDH-201a GAAGCTGATCCTAGACCTGTACCTA TGGTATGATGGTGCTACTGGAAGT
One_GPDH2-187a TCACATCCTTGAGTCGTGTTTGTC GGGCGTAACCGCAAGGT
One_GPH-414a CAAGAAGAATCAAGAGAAAGAGAGATGGT CCTAGTGTCATGCACATAACGTGTA
One_GTHad CAAGAAGAATCAAGAGAAAGAGAGATGGT CCTAGTGTCATGCACATAACGTGTA
One_HGFA-49a ACTTGCTACTTCAGGGTTTTTGTGA TGGCAGAACAATTCCTCAATGCATA
One_HpaI-71a TGTTGTTCCTAGGCTGTCATTGAAA CCCTGCGTATTACTAAGGCCATATTTATT
One_HpaI-99a CCTGAGTTGTGTTCAATGGGCATAA TGGGTCATGTTCATTAGAGCACAAA
One_hsc71-220a ACAGCGAAACTATTGATTTAAGGCTCAT CGCAGGTAAATCACTGATCATGTTT
One_Hsp47d CGTTCAAATAAATGCTGTTTGGCCTTT GTGGTGTTCGGATTTTTCCTGAAA
One_Ig-90b GGATTGTGGTAACTCTGACAGTAGT CATCTAAATTCAGTGGCAGTGGGTTA
One_IL8r-362a TTGCTAGAAGCGTTGGTTATGATGA CAGCAAAATTGAGAAGTCACTAGGAAAA
One_ins-107a GGAACCCTGCAAGAGGAGAAAA GAAATGAATGTGAAGGCAATGATGAGA
One_KCT1-453b GGGAAAGTATGCTGTGGGATCAG GGTTCCTCAGTGAGTGTTCTCTATG
One_KPNA-422a TGGGCCCTGGGAAACATC CCATAGCCACTTTCGATACAGGTAA
One_LEI-87a ACAGCGCATCCCCATAATGG GCCTTTGTGGAGGTCAACGA
One_leptin-92c CAGTTGCGCTAAACAGACTCAAG CAGTTGCTCAGTGATTGTCAACATT
One_lpp1-44b GGTCCAATAGGGAGCTCAGACA GGGAATGAACCAGACATGTGAATG
One_MARCKS-241a CCTATCACAGCTTGGTTGAGTTCAA TCCACCCGCTCATTTTTGTAAGAT
One_metA-253c TTCTTATCGCTGGTGGCACTTT GACCAAAGACTATTTAGTTGCCACCTA
One_MHC2_190a GTATGGTGTGAAGAATGCA GCTCACCTGTCTTGTCCAGTA
One_MHC2_251a CTGGACAAGACAGGTGAGCA AAAGTAATGGTCTTGACTTGATCA
WASSIP Technical Document 6: Locus selection for sockeye salmon
29
Table 2. (Page 3 of 6). 736
737
Assay Forward sequence Reverse sequence
One_Mkpro-129c TGACGTATGTGCAATGCATGTCTAT AGATGAAGGACATGGCTGAAAACAT
One_ODC1-196b CCGAGGTGGGATTCAACATGAC TGTCCTCAGACCCAGGGAAA
One_Ots208-234c CAGCCGACATGCATCAGTTA TGACCCCATGTTTCATGCT
One_Ots213-181a CCATAGTGTATCACACAATACTCATGTCT TCTATCATCTGCAAATCTGTGTACTAGACT
One_p53-534a GACAATCTTAAAGCGGTGGTCTTG AACCTTTATCAGCCATCATCCAACT
One_parp3-170c TGTGCACCGTTGCCTTTCT ACAGTAACAAACCAGAGTTACAAGTGG
One_pax7-248c AGTAAAGGTAGTGATGCAATGATGCA AACCGCATAGGACGTAAAGCA
One_PIPd ACAGAGTCAGGACTTGATATGTACAGA CCTGACGAGGGTCTACTACACT
One_ppie-74c GTTGATTCCACCTTCTCTGTGATGT GTGAAATTGACACAGAAGCTGTTCA
One_PPM1K-118b GGGATCCAAGCTAACCACAACTT CACATCAACGCAGGGTTACATTATT
One_Prl2a ACCTCTCTCTCTCTCAGGACTCTCA GAGGAGGTGTGACACATAGATGGA
One_psme2-354b TGGTCCTTCAGGTACTTTTCAGAGA CAAATGCCAATTCTCACCACATGA
One_rab1a-76b TCGCCATATTCTCTCTCCCTATCC ATCCACTCAGACCCATATCTACCAA
One_RAG1-103a AGCTCACACATACAACAAATATGATCTAATGT GTGAACTGCATCTTTGAACAAATGC
One_RAG3-93a AGATAAAGATGGTTTCAAAGTCACCCA GGGCTGCCATCTAAAAAATATTGCT
One_redd1-414c GTTGGCTACATCCTAAAACACAATGG CAGCCCTGGAGTACTGAATCAG
One_RFC2-102a TCCAGGAGCTGCATTTTGAGTTAAA AAGGTGGATGACAATGTGTTAGTGT
One_RFC2-285a GGATGAGGCTGACAGGTAAGTC ACAGTCGTTATAGGTACAGGTACACT
One_RH2op-395a GCTGCTAGGTCAAACTCGAAGAG CAGCCTTGTTCAACCCCATTATCTA
One_rpo2j-261c GATTCTGAGATCATACAGTGGATTGGT GCTTGTCATCTTTCAGCACATACCTA
One_sast-211c TGTACTTAGTCCAATAAGCATTTCAACAGT TGGCTAGATTCACATGGTCAACAAA
One_serpin-75a ACACCTGCAACCAAATTATCATTGC AACAGGCCTTAACCAATTTCCATCT

WASSIP Technical Document 6: Locus selection for sockeye salmon
30
Table 2. (Page 4 of 6). 738
739
Assay Forward sequence Reverse sequence
One_spf30-207c AGCATTTCAGTTTTGTACATTTACAGTAAAACA ACCTACTCGTAATTTCAGGGCAAAA
One_srp09-127c CGGAGCTGGAATGACGACAT AGGTTCAGCAAATCCCTCTTTAGAG
One_ssrd-135c TGGAAACTCCTAGTGTACTTCATTCTCA CGTTCCACGCTCCCTAGAATAGA
One_STC-410a CAACACAACATCAACATCATTAATAAACATTCTG AACATCCCCGTTTTGACCACTTAT
One_STR07a CACACCTGAGGCACAAGCT GTATGTCTACCAGAGAGGTCAAGGA
One_SUMO1-6c GCACAAGCCAAAAAGTTTTCTCCAT GGACATAGTTGGAGGCAGACAAAA
One_sys1-230c CTACCTGTCTAACAGTGAATGCTAACTT TGAAACCATTAAGCTCTTTGTAGGACAA
One_taf12-248c ACCTTCAATATGGTGGTGGTTACC ACTAAACGCACAACAGCAAACG
One_Tf_ex11-750a AGCAGGTGTAAGCATGTGTACTT CCTGCTCTGCCTCAACAATGTTAA
One_Tf_in3-182a GCCCTTAGCACTTCAGTTGCA CAGACAGAAACCATTTGATCCGATTC
One_tshB-92c GCATTGTCGTACTCGTGTGTTTG CACAACAGCAACAATACATGTCACA
One_txnip-401c GCCAGATCCCTTCAGTTGGA GGCCATTTCAAAAGGCTGCAT
One_U1002-101b GCCAACCCTATACTGTACGGATTTTT TCCGTTGCATTGTCCATCCA
One_U1003-75b TCACGAGCCCCAGTCAGA CGGGTTTCGGTGGTTTAGTATTCTA
One_U1004-183b GGTGTGACTGCTGTGTTTAATTGC ACCATCATTACACAGCAATTCTGAGT
One_U1009-91b CTCTGTCCTTGAACTGTTGTCTGTT GCCGCTGCTACTCTTCCT
One_U1010-81b CAGCCCCTCGAGGTAACTG GTTGAGACAACAAAACGTCTACTGT
One_U1012-68b TCTATTACCATACAGGCCCAGTACA CCTTTTGTGTCTTCCAGTCATGTGA
One_U1013-108b TCTGTGCTCTCCTCCAGGAT CGAAACTGAGGAGTGCTCTGA
One_U1014-74b TCCCCTGCAGCAACTGTTTT GGCAGAGACGGCATCCT
One_U1016-115b GGATTTTTGACTTGACCGTTTTGTGT ATTAACATGTGCAAAGGGAGAATGC
One_U1017-62b CAGAGAAGGACGTACCATTGATACAT CCGGTAGATTGGCGTTGCT

WASSIP Technical Document 6: Locus selection for sockeye salmon
31
Table 2. (Page 5 of 6). 740
741
Assay Forward sequence Reverse sequence
One_U1021-57b ACAGTGCTACAGGGAGAGAGATTT GATGGTCAGCGTAGAGAAGCAA
One_U1024-197b CTGAACTGATCTACCGCTCTGT GGAACAGATACTCCAGGAGAGATGA
One_U1101b CTATGACATGTTTATTTTAATTAGCCACCAACT AGTATAGCTAGGGAACCTTTCGATCTT
One_U1102-220b TCCCTCTGCTGGAGAACTACAG GGAACAGCAGTCCTGAGTACAG
One_U1103b CCCAGCCGCCATGTGTA TGTAGTTCAGCCACCATCTTTGG
One_U1104-138b GGAACAGAACACTGAGAATGAATGC GGGAATATGTCGACTGCTCACT
One_U1105b GCCTTAATAGTGTCTTCTGATCCCTTT CCCTCTGTTGTCCAGACTCTTAG
One_U1201-492b GCTTATGACGGAGAAGAGATGCA AGGATACTGAAGCCCAGAGACA
One_U1202-1052b CGATTTGAGTCTCCAATGGTCTCT ATTCCTATGGTTAACATCAATTCTATAAAGTCAT
One_U1203-175b CCCGGAGACATACTTGATGCA GGAGGACCTGCAGGATCAC
One_U1204-53b GTAAAACCCTTCATGTTGGCCATT CTCCATGTCTGAATGTCCCATCA
One_U1205-57b AGTAAATGGTTATTCACGTAACGGATAAG CAGGACAGTTCCACATTCTAACAGA
One_U1206-108b CTGAGATGGTGCTTTCTGAGGATA TGGATGAAAGGGAAATTCTGTCAACA
One_U1207-231b GGCCAAACTGACAGGGATCTATTAA GGGTCCAGTCTGTACACCATCTAT
One_U1208-67b ACTTGAATGTCTGTTTCGTAGGTGAT ACACAGTTGACAGTGGAGCAA
One_U1209-111b GTCACGTAATCACGAGAAAGATACTAAATGT TCTGCGTCTCCAGAGAGGTT
One_U1210-173b ACAAAGTCTCTCTCTGAGTAGGAGTAC CAAAGTATCTCAGAGTGCTGATCTAGGA
One_U1211-97b GCGTGTCCTCCCATTAGAAGA CTGCAGAAGTACAGCATCTATCTGA
One_U1212-106b CGTAATGACCTACCACCATATCAGT TGGCATGACTTTAACAATTCCCAAAAAA
One_U1214-107b CCAAATGTACTCCATGTTGGTTAGC TGCCTGAGTATTAAGCTATATCATTGAAGTTTT
One_U1215-82b GTTGCTTGGTTTCGTTTGGAGTAG CTCCAGAAGAGGAATACCACAGTTC
One_U1216-230b TGGGATCGGACGTCAATAGATTTC GTAATACAGAGTGAGCGTGATACATTGT
WASSIP Technical Document 6: Locus selection for sockeye salmon
32
Table 2. (Page 6 of 6). 742
743
Assay Forward sequence Reverse sequence
One_U301-92a AGCCAGTAGCCGATAATGTTTGTC CCCCTCCCAAATTGCTAGCT
One_U401-224a GGGTGGAGACGAACGGATTC GTACGATTTTTTTGTAGCCCCAAGT
One_U404-229a GTTTGTGTGTTGGTGTTTGTCCTT CATTTATCTTGGTGGACGTGTGAGT
One_U502-167a GCTTTTGTGCAATAGCTATGTTGCT GCAAAGGTAGGCAGCAGATTG
One_U503-170a GATTCAGAATTGCCACGACAAAGAA GTGATTGGTACATGTCTGTCGAGTT
One_U504-141a GCTATAGCTCACAGAGGATCCCA TATTGGCGGGTGAGGGATG
One_U508-533a AGGCACAACCTCACATTTGGAA CTCAAAGGGTCTGAATACTTATGTAAATAAGGT
One_UCA-24b AACTCTGCGTCTGTCTGCTT TCAGATGGTTCATTATGACAGCAACA
One_vamp5-255c GGTTGACTTTTCTTAACTTTTTAATCTGTGATATTGT GCTGAGCTAGTGATGGTACCATTT
One_vatf-214c TCATTCCTTTGCCTGGAGCATT GGCATACAGCAAAACAATTCAACCA
One_VIM-569a TTCTGGGTGGACTCATTGATCAC ATGCGTTATACCTGTAATCTGCAAGT
One_zn706-68c CCACTCTACGTACATCCCATATTCC GCAGTATACAGATGAGAAAAAGTAGCAAAAAAA
One_ZNF-61a CCATTCATGTTCTATTCAGATATATTTTGTGCA CCTAGCTAGAGCTCAACAATATGCA
One_Zp3b-49a TCCTCGTGGTTATAGTTATAAAGATGTCAGT TTGGCTCTGCACTCGGTTTA
744 a Assay developed by the Gene Conservation Laboratory of the Alaska Department of Fish and Game (Elfstrom et al. 2006; Smith et al. 2005). 745
b Assay developed by the International Program for Salmon Ecological Genetics at the University of Washington. 746
c Assay developed by the Hagerman Genetics Laboratory of the Columbia River Inter-Tribal Fish Commission. 747
d Assay developed by the Molecular Genetics Laboratory at the Canadian Department of Fisheries and Oceans. 748
749
WASSIP Technical Document 6: Locus selection for sockeye salmon
33
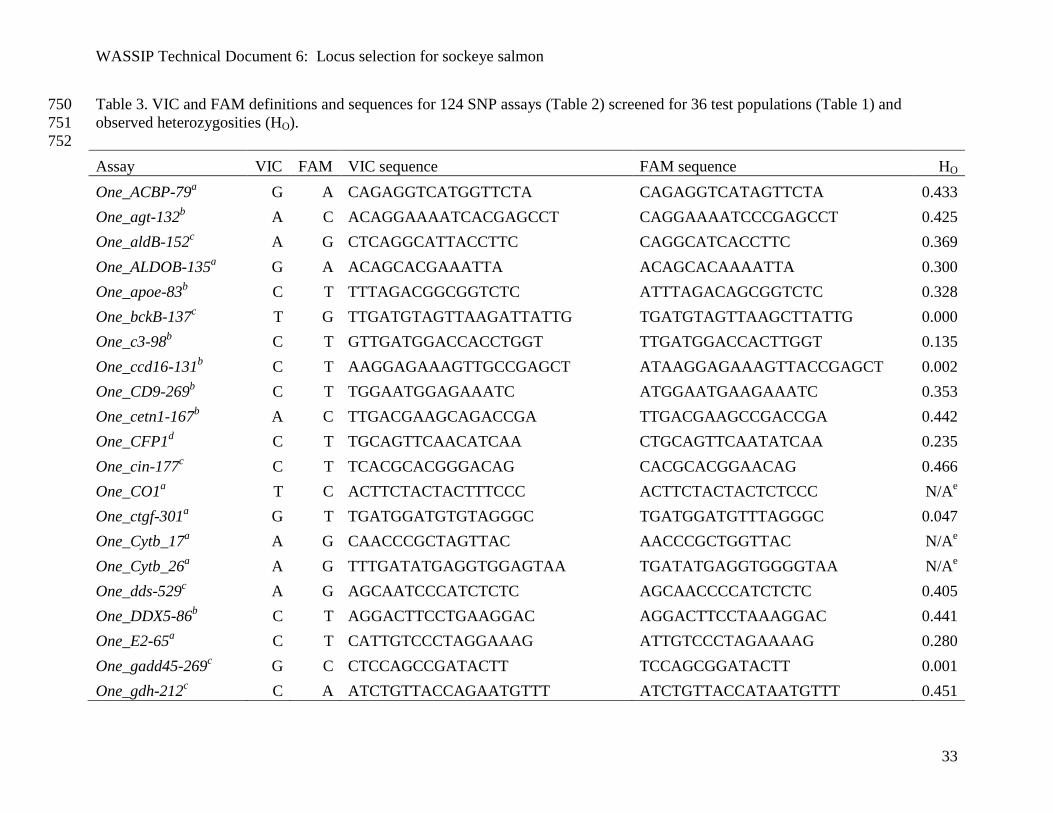
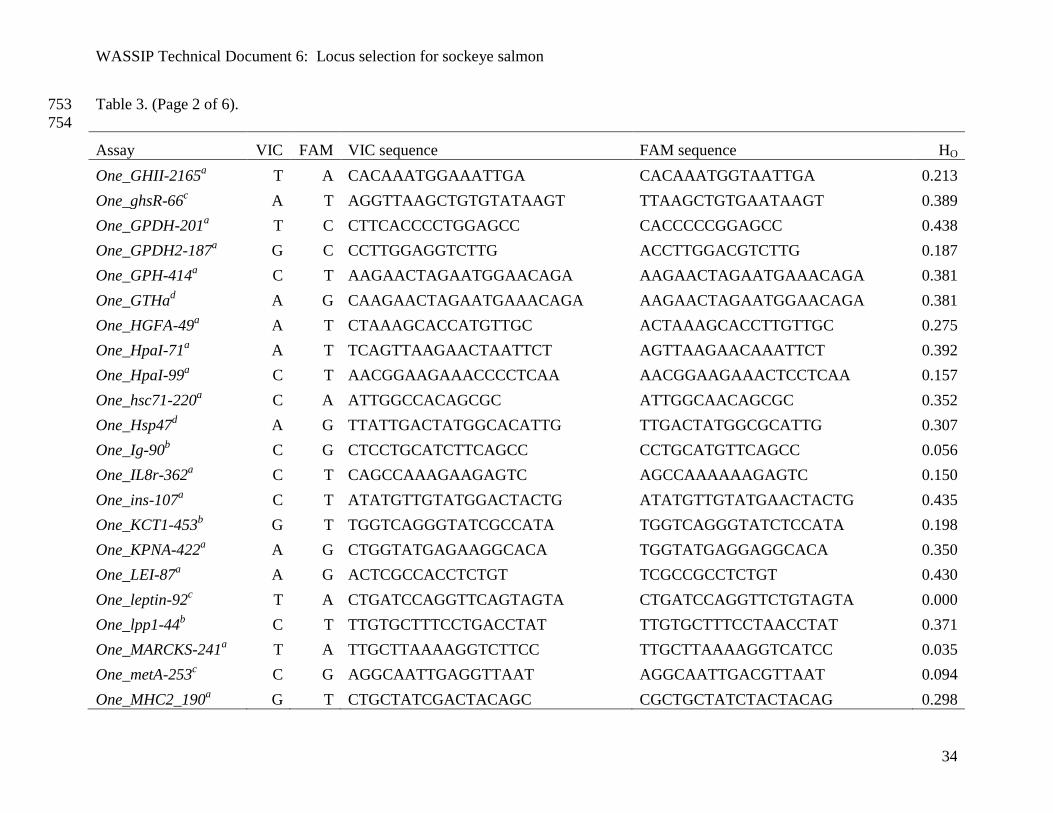
Table 3. VIC and FAM definitions and sequences for 124 SNP assays (Table 2) screened for 36 test populations (Table 1) and 750
observed heterozygosities (HO).
751
752
Assay VIC FAM VIC sequence FAM sequence HO
One_ACBP-79a G A CAGAGGTCATGGTTCTA CAGAGGTCATAGTTCTA 0.433
One_agt-132b A C ACAGGAAAATCACGAGCCT CAGGAAAATCCCGAGCCT 0.425
One_aldB-152c A G CTCAGGCATTACCTTC CAGGCATCACCTTC 0.369
One_ALDOB-135a G A ACAGCACGAAATTA ACAGCACAAAATTA 0.300
One_apoe-83b C T TTTAGACGGCGGTCTC ATTTAGACAGCGGTCTC 0.328
One_bckB-137c T G TTGATGTAGTTAAGATTATTG TGATGTAGTTAAGCTTATTG 0.000
One_c3-98b C T GTTGATGGACCACCTGGT TTGATGGACCACTTGGT 0.135
One_ccd16-131b C T AAGGAGAAAGTTGCCGAGCT ATAAGGAGAAAGTTACCGAGCT 0.002
One_CD9-269b C T TGGAATGGAGAAATC ATGGAATGAAGAAATC 0.353
One_cetn1-167b A C TTGACGAAGCAGACCGA TTGACGAAGCCGACCGA 0.442
One_CFP1d C T TGCAGTTCAACATCAA CTGCAGTTCAATATCAA 0.235
One_cin-177c C T TCACGCACGGGACAG CACGCACGGAACAG 0.466
One_CO1a T C ACTTCTACTACTTTCCC ACTTCTACTACTCTCCC N/A
e
One_ctgf-301a G T TGATGGATGTGTAGGGC TGATGGATGTTTAGGGC 0.047
One_Cytb_17a A G CAACCCGCTAGTTAC AACCCGCTGGTTAC N/A
e
One_Cytb_26a A G TTTGATATGAGGTGGAGTAA TGATATGAGGTGGGGTAA N/A
e
One_dds-529c A G AGCAATCCCATCTCTC AGCAACCCCATCTCTC 0.405
One_DDX5-86b C T AGGACTTCCTGAAGGAC AGGACTTCCTAAAGGAC 0.441
One_E2-65a C T CATTGTCCCTAGGAAAG ATTGTCCCTAGAAAAG 0.280
One_gadd45-269c G C CTCCAGCCGATACTT TCCAGCGGATACTT 0.001
One_gdh-212c C A ATCTGTTACCAGAATGTTT ATCTGTTACCATAATGTTT 0.451
WASSIP Technical Document 6: Locus selection for sockeye salmon
34
Table 3. (Page 2 of 6). 753
754
Assay VIC FAM VIC sequence FAM sequence HO
One_GHII-2165a T A CACAAATGGAAATTGA CACAAATGGTAATTGA 0.213
One_ghsR-66c A T AGGTTAAGCTGTGTATAAGT TTAAGCTGTGAATAAGT 0.389
One_GPDH-201a T C CTTCACCCCTGGAGCC CACCCCCGGAGCC 0.438
One_GPDH2-187a G C CCTTGGAGGTCTTG ACCTTGGACGTCTTG 0.187
One_GPH-414a C T AAGAACTAGAATGGAACAGA AAGAACTAGAATGAAACAGA 0.381
One_GTHad A G CAAGAACTAGAATGAAACAGA AAGAACTAGAATGGAACAGA 0.381
One_HGFA-49a A T CTAAAGCACCATGTTGC ACTAAAGCACCTTGTTGC 0.275
One_HpaI-71a A T TCAGTTAAGAACTAATTCT AGTTAAGAACAAATTCT 0.392
One_HpaI-99a C T AACGGAAGAAACCCCTCAA AACGGAAGAAACTCCTCAA 0.157
One_hsc71-220a C A ATTGGCCACAGCGC ATTGGCAACAGCGC 0.352
One_Hsp47d A G TTATTGACTATGGCACATTG TTGACTATGGCGCATTG 0.307
One_Ig-90b C G CTCCTGCATCTTCAGCC CCTGCATGTTCAGCC 0.056
One_IL8r-362a C T CAGCCAAAGAAGAGTC AGCCAAAAAAGAGTC 0.150
One_ins-107a C T ATATGTTGTATGGACTACTG ATATGTTGTATGAACTACTG 0.435
One_KCT1-453b G T TGGTCAGGGTATCGCCATA TGGTCAGGGTATCTCCATA 0.198
One_KPNA-422a A G CTGGTATGAGAAGGCACA TGGTATGAGGAGGCACA 0.350
One_LEI-87a A G ACTCGCCACCTCTGT TCGCCGCCTCTGT 0.430
One_leptin-92c T A CTGATCCAGGTTCAGTAGTA CTGATCCAGGTTCTGTAGTA 0.000
One_lpp1-44b C T TTGTGCTTTCCTGACCTAT TTGTGCTTTCCTAACCTAT 0.371
One_MARCKS-241a T A TTGCTTAAAAGGTCTTCC TTGCTTAAAAGGTCATCC 0.035
One_metA-253c C G AGGCAATTGAGGTTAAT AGGCAATTGACGTTAAT 0.094
One_MHC2_190a G T CTGCTATCGACTACAGC CGCTGCTATCTACTACAG 0.298

WASSIP Technical Document 6: Locus selection for sockeye salmon
35
Table 3. (Page 3 of 6). 755
756
Assay VIC FAM VIC sequence FAM sequence HO
One_MHC2_251a C T CACTTACAGGCCCCTG CACTTACAGGCCTCTG 0.322
One_Mkpro-129c A G ATGCATATACATGTAATATAT TGCATATACATGTAACATAT 0.432
One_ODC1-196b C T CCACCTCCGATGTCC CACCTCCAATGTCC 0.416
One_Ots208-234c - A CACACGTTACATCAGATAACT CACACAATGTTACATCAGATAAC 0.192
One_Ots213-181a T A CTTTGAATTAAAAACATTTTT CTTTGAATTAAAAACTTTTTT 0.267
One_p53-534a C A ATGTCCAAAGATCTGG AATGTCCAAATATCTGG 0.059
One_parp3-170c T A ACACAGGAAAAGTTG ACACAGGTAAAGTTG 0.000
One_pax7-248c C A AATTCAAAACGAAATGTG TGAATTCAAAACTAAATGTG 0.212
One_PIPd C T AACACACATTTCTCAACACA ACACACATTTTTCAACACA 0.448
One_ppie-74c - A TGCAAACACTTTTTTTATAATG TGCAAACACTTTTTTTTATAATG 0.033
One_PPM1K-118b G T ATCTCACTTATGGTGCTTC ATATCTCACTTATTGTGCTTC N/A
f
One_Prl2a G T ACCAATGGGACGAGTG CCACCAATTGGACGAG 0.448
One_psme2-354b A G TGATGCAGTAGCTAAAG ATGCAGTGGCTAAAG 0.373
One_rab1a-76b G T TGTGGAGCAAGGTAACT TGTGGAGCAATGTAACT 0.193
One_RAG1-103a T A CGAATCTCAACAATAAGT CTCGAATCTCAACTATAAGT 0.079
One_RAG3-93a C T CATTTTGGACTTCGGGACC CATTTTGGACTTTGGGACC 0.148
One_redd1-414c T C CCTAAGTCAGTCACTGTAG CCCAAGTCAGTCACTGTA 0.410
One_RFC2-102a A G ATCACGTTGTATTTCTTT CACGTTGTGTTTCTTT 0.290
One_RFC2-285a A T CACGACATCTAAGCTGAA CACGACATCTATGCTGAA 0.064
One_RH2op-395a G T TGGGAACATCATTTTTTAA TTGGGAACATAATTTTTTAA 0.016
One_rpo2j-261c G T CACATGTTTTACTCATTTGA CACATGTTTTACTAATTTGA 0.312
One_sast-211c G T CATCATTTGCATTATTG CATCATTTGAATTATTG 0.073

WASSIP Technical Document 6: Locus selection for sockeye salmon
36
Table 3. (Page 4 of 6). 757
758
Assay VIC FAM VIC sequence FAM sequence HO
One_serpin-75a G T CAGTGTGTAATTTAATGATATAT ACAGTGTGTAATTTAATTATATAT 0.039
One_spf30-207c G T AGGGACATCTTACCTCAAAA AGGGACATCTTACCTAAAAA 0.295
One_srp09-127c T A CAGCGAAGGATATGCT CAGCGAAGGTTATGCT 0.082
One_ssrd-135c - T CTGCGGCTTTGTCTTG TGCGGCTTTTGTCTTG 0.475
One_STC-410a T C CCGATGGGTATATTATTATA CCGATGGGTATATTGTTATA 0.336
One_STR07a G C ACGCACACTGTCCTT ACGCACACTCTCCTT 0.399
One_SUMO1-6c C A CAAGATTGAAATTGGTTTGC CAAGATTGAAATTTGTTTGC 0.297
One_sys1-230c T G CAAAGCAAGTGATATATTAGTG AAAGCAAGTGATATCTTAGTG 0.413
One_taf12-248c C T CCAGACAAAATCAAATTA CCAGACAAAATAAAATTA 0.047
One_Tf_ex11-750a G A CAGGGTCGCTGCAC CCAGGGTCACTGCAC 0.380
One_Tf_in3-182a A G AACAGAAAGTCTACACTTT ACAGAAAGTCTGCACTTT 0.109
One_tshB-92c A C ACCACCCTGTAGCTCA CACCCTGGAGCTCA 0.111
One_txnip-401c C T TGACTGCACTAGTTTAGAC TGACTGCACTAATTTAGAC 0.047
One_U1002-101b G T TCGTTCCAAAGAATGTTGTG CGTTCCAAAGAATTTTGTG 0.009
One_U1003-75b C T AGAGACTACTTCCTTTTTG AGAGACTACTTCTTTTTTG 0.294
One_U1004-183b A G AAGTTCCCTGTATTTCTT TCCCTGCATTTCTT 0.345
One_U1009-91b A G CATGTTCTGTATGGACCC TGTTCTGTGTGGACCC 0.283
One_U1010-81b A G CACACCAACGTTATGTAGAG CACCAACGTTGTGTAGAG 0.064
One_U1012-68b C T TGACGGGTGTTCCTGATAA TGACGGGTGTTCTTGATAA 0.251
One_U1013-108b G T ACGGAATTCCTGTTGCCCT ACGGAATTCCTTTTGCCCT 0.250
One_U1014-74b C T TTGACCTGCGCCAGTAT TTTTGACCTGCACCAGTAT 0.212
One_U1016-115b - T AATGGCAGTTTTTTATTTGA ATGGCAGTTTTTTTATTTGA 0.402

WASSIP Technical Document 6: Locus selection for sockeye salmon
37
Table 3. (Page 5 of 6). 759
760
Assay VIC FAM VIC sequence FAM sequence HO
One_U1017-62b A T CAGAAAAACTGGTACTTGTT CAGAAAAACTGGTTCTTGTT 0.031
One_U1021-57b A G AGTTGAACGTTTGGTTTGA GTTGAACGTTCGGTTTGA 0.414
One_U1024-197b G T ACCTGACCCAACAAA ACCTGACACAACAAA 0.199
One_U1101b C A TGGACGTATGTCATATTT TGGACGTATGTAATATTT 0.303
One_U1102-220b C T CCAGTAGTGTTTTCTG CAGTAGTGCTTTCTG 0.168
One_U1103b G A TCGGCGAAAACT TCGGCAAAAACT 0.050
One_U1104-138b G T CCTTCTCAGAGGGTAGAGA CCTTCTCAGAGGTTAGAGA 0.009
One_U1105b T A CCTGTTTTTTTTAAAAGAC TCCTGTTTTTTTTTAAAGAC 0.332
One_U1201-492b A G AAGACTTCCTCCAGGCTC ACTTCCCCCAGGCTC 0.445
One_U1202-1052b T C CAAACTTTTTCATCTACATTTA ACTTTTTCATCCACATTTA 0.370
One_U1203-175b G A CCATAGTTGCTGGGCTT CTCCATAGTTACTGGGCTT 0.397
One_U1204-53b C T ATGCATACACGCTGATGC ATGCATACACACTGATGC 0.318
One_U1205-57b A G AGTTATCATGGTCATCTCT AGTTATCATGGTCGTCTCT 0.049
One_U1206-108b G T AACATTGAGCTTCCC ATAACATTGATCTTCCC 0.300
One_U1207-231b C T ACATTCCTTGGCATTGC CATTCCTTGACATTGC N/A
f
One_U1208-67b A C CCCAATGTGATTGTCAC CCAATGTGCTTGTCAC 0.398
One_U1209-111b C T CTCACATCGAGATGATC TCACATCGAAATGATC 0.170
One_U1210-173b A G CCCTCCTATTCATTATGATTGT CCTCCTATTCATTACGATTGT 0.149
One_U1211-97b C T CTGTTTCAGTGTGCTTG CTGTTTCAGTATGCTTG 0.165
One_U1212-106b A G TTTTGACATACAAAAAATA TTTGACATACAGAAAATA 0.445
One_U1214-107b A C TAGTGACCTATTAAATTGC TGACCTATTCAATTGC 0.137
One_U1215-82b A C AATGAGACAAAGTATTTGGT AATGAGACAAAGTCTTTGGT 0.469
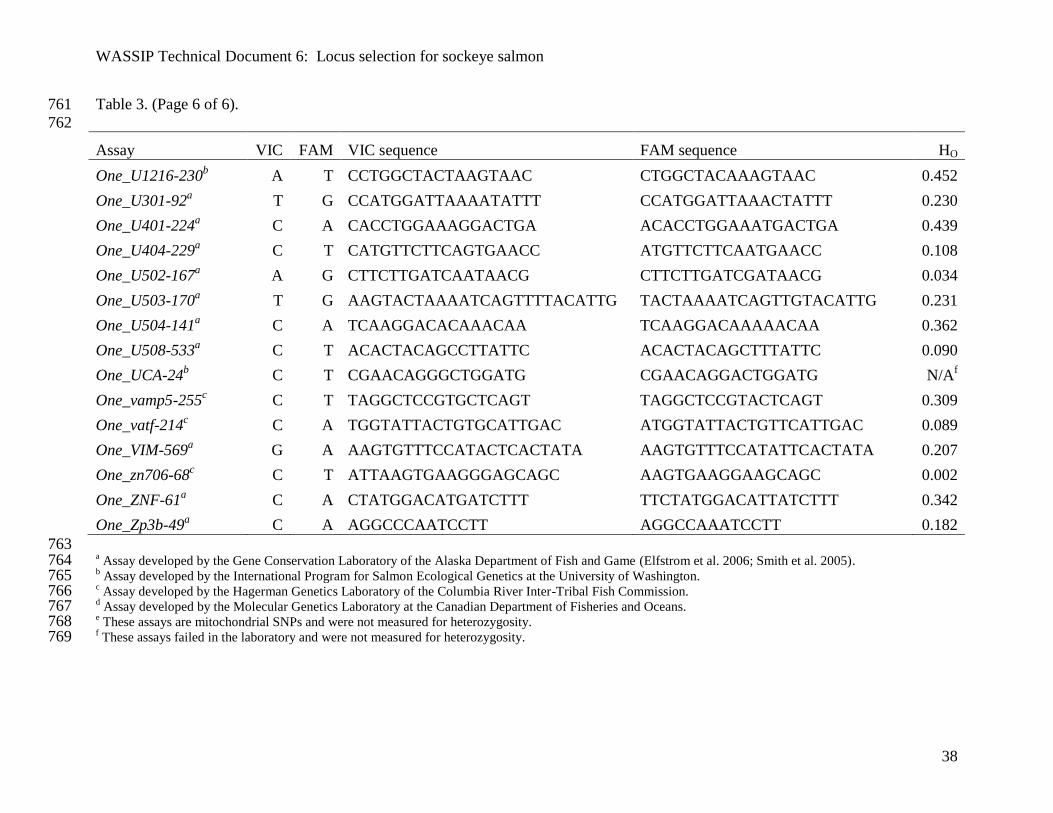
WASSIP Technical Document 6: Locus selection for sockeye salmon
38
Table 3. (Page 6 of 6). 761
762
Assay VIC FAM VIC sequence FAM sequence HO
One_U1216-230b A T CCTGGCTACTAAGTAAC CTGGCTACAAAGTAAC 0.452
One_U301-92a T G CCATGGATTAAAATATTT CCATGGATTAAACTATTT 0.230
One_U401-224a C A CACCTGGAAAGGACTGA ACACCTGGAAATGACTGA 0.439
One_U404-229a C T CATGTTCTTCAGTGAACC ATGTTCTTCAATGAACC 0.108
One_U502-167a A G CTTCTTGATCAATAACG CTTCTTGATCGATAACG 0.034
One_U503-170a T G AAGTACTAAAATCAGTTTTACATTG TACTAAAATCAGTTGTACATTG 0.231
One_U504-141a C A TCAAGGACACAAACAA TCAAGGACAAAAACAA 0.362
One_U508-533a C T ACACTACAGCCTTATTC ACACTACAGCTTTATTC 0.090
One_UCA-24b C T CGAACAGGGCTGGATG CGAACAGGACTGGATG N/A
f
One_vamp5-255c C T TAGGCTCCGTGCTCAGT TAGGCTCCGTACTCAGT 0.309
One_vatf-214c C A TGGTATTACTGTGCATTGAC ATGGTATTACTGTTCATTGAC 0.089
One_VIM-569a G A AAGTGTTTCCATACTCACTATA AAGTGTTTCCATATTCACTATA 0.207
One_zn706-68c C T ATTAAGTGAAGGGAGCAGC AAGTGAAGGAAGCAGC 0.002
One_ZNF-61a C A CTATGGACATGATCTTT TTCTATGGACATTATCTTT 0.342
One_Zp3b-49a C A AGGCCCAATCCTT AGGCCAAATCCTT 0.182
763
a Assay developed by the Gene Conservation Laboratory of the Alaska Department of Fish and Game (Elfstrom et al. 2006; Smith et al. 2005). 764
b Assay developed by the International Program for Salmon Ecological Genetics at the University of Washington. 765
c Assay developed by the Hagerman Genetics Laboratory of the Columbia River Inter-Tribal Fish Commission. 766
d Assay developed by the Molecular Genetics Laboratory at the Canadian Department of Fisheries and Oceans. 767
e These assays are mitochondrial SNPs and were not measured for heterozygosity. 768
f These assays failed in the laboratory and were not measured for heterozygosity.769
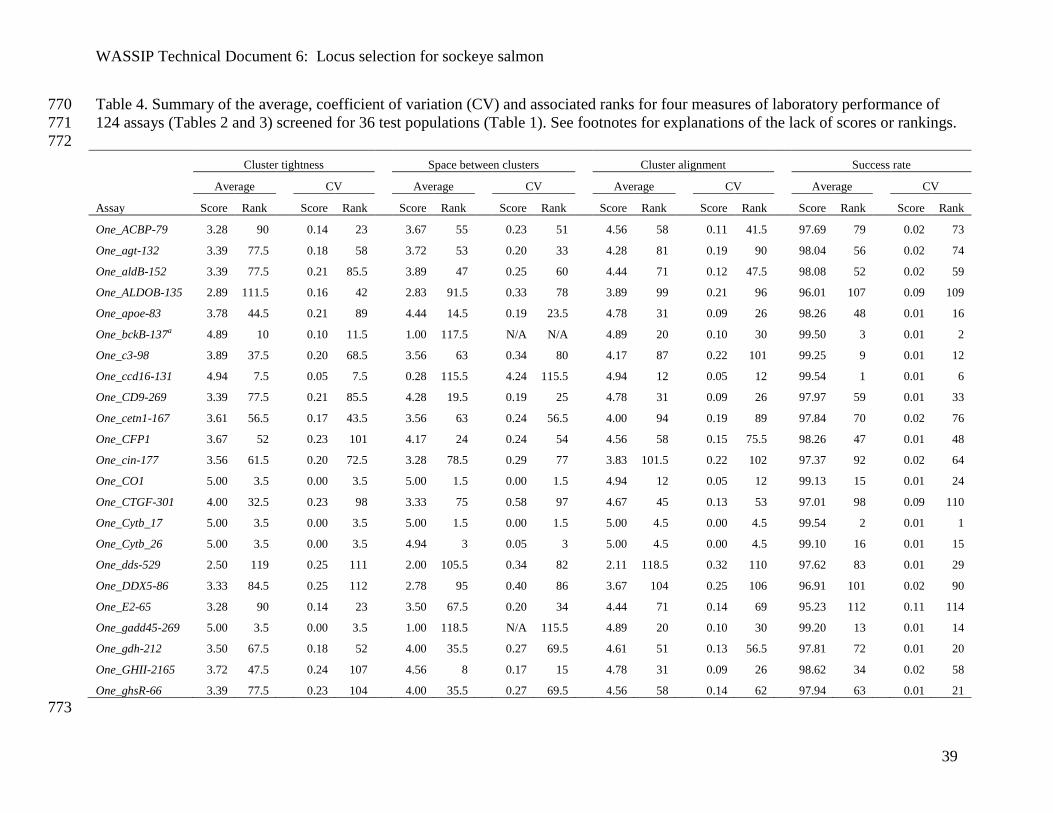
WASSIP Technical Document 6: Locus selection for sockeye salmon
39
Table 4. Summary of the average, coefficient of variation (CV) and associated ranks for four measures of laboratory performance of 770
124 assays (Tables 2 and 3) screened for 36 test populations (Table 1). See footnotes for explanations of the lack of scores or rankings. 771
772
Cluster tightness Space between clusters Cluster alignment Success rate
Average
CV
Average
CV
Average
CV
Average
CV
Assay Score Rank
Score Rank
Score Rank
Score Rank
Score Rank
Score Rank
Score Rank
Score Rank
One_ACBP-79 3.28 90 0.14 23 3.67 55 0.23 51 4.56 58 0.11 41.5 97.69 79 0.02 73
One_agt-132 3.39 77.5
0.18 58
3.72 53
0.20 33
4.28 81
0.19 90
98.04 56
0.02 74
One_aldB-152 3.39 77.5
0.21 85.5
3.89 47
0.25 60
4.44 71
0.12 47.5
98.08 52
0.02 59
One_ALDOB-135 2.89 111.5
0.16 42
2.83 91.5
0.33 78
3.89 99
0.21 96
96.01 107
0.09 109
One_apoe-83 3.78 44.5
0.21 89
4.44 14.5
0.19 23.5
4.78 31
0.09 26
98.26 48
0.01 16
One_bckB-137a 4.89 10
0.10 11.5
1.00 117.5
N/A N/A
4.89 20
0.10 30
99.50 3
0.01 2
One_c3-98 3.89 37.5
0.20 68.5
3.56 63
0.34 80
4.17 87
0.22 101
99.25 9
0.01 12
One_ccd16-131 4.94 7.5
0.05 7.5
0.28 115.5
4.24 115.5
4.94 12
0.05 12
99.54 1
0.01 6
One_CD9-269 3.39 77.5
0.21 85.5
4.28 19.5
0.19 25
4.78 31
0.09 26
97.97 59
0.01 33
One_cetn1-167 3.61 56.5
0.17 43.5
3.56 63
0.24 56.5
4.00 94
0.19 89
97.84 70
0.02 76
One_CFP1 3.67 52
0.23 101
4.17 24
0.24 54
4.56 58
0.15 75.5
98.26 47
0.01 48
One_cin-177 3.56 61.5
0.20 72.5
3.28 78.5
0.29 77
3.83 101.5
0.22 102
97.37 92
0.02 64
One_CO1 5.00 3.5
0.00 3.5
5.00 1.5
0.00 1.5
4.94 12
0.05 12
99.13 15
0.01 24
One_CTGF-301 4.00 32.5
0.23 98
3.33 75
0.58 97
4.67 45
0.13 53
97.01 98
0.09 110
One_Cytb_17 5.00 3.5
0.00 3.5
5.00 1.5
0.00 1.5
5.00 4.5
0.00 4.5
99.54 2
0.01 1
One_Cytb_26 5.00 3.5
0.00 3.5
4.94 3
0.05 3
5.00 4.5
0.00 4.5
99.10 16
0.01 15
One_dds-529 2.50 119
0.25 111
2.00 105.5
0.34 82
2.11 118.5
0.32 110
97.62 83
0.01 29
One_DDX5-86 3.33 84.5
0.25 112
2.78 95
0.40 86
3.67 104
0.25 106
96.91 101
0.02 90
One_E2-65 3.28 90
0.14 23
3.50 67.5
0.20 34
4.44 71
0.14 69
95.23 112
0.11 114
One_gadd45-269 5.00 3.5
0.00 3.5
1.00 118.5
N/A 115.5
4.89 20
0.10 30
99.20 13
0.01 14
One_gdh-212 3.50 67.5
0.18 52
4.00 35.5
0.27 69.5
4.61 51
0.13 56.5
97.81 72
0.01 20
One_GHII-2165 3.72 47.5
0.24 107
4.56 8
0.17 15
4.78 31
0.09 26
98.62 34
0.02 58
One_ghsR-66 3.39 77.5
0.23 104
4.00 35.5
0.27 69.5
4.56 58
0.14 62
97.94 63
0.01 21
773

WASSIP Technical Document 6: Locus selection for sockeye salmon
40
Table 4. (Page 2 of 6). 774
775
Cluster tightness Space between clusters Cluster alignment Success rate
Average
CV
Average
CV
Average
CV
Average
CV
Assay Score Rank Score Rank Score Rank Score Rank Score Rank Score Rank Score Rank Score Rank
One_GPDH-201 3.72 47.5
0.22 93
3.94 40.5
0.24 55
4.44 71
0.14 69
98.41 43
0.01 46
One_GPDH2-187 3.11 99.5
0.24 109
2.78 95
0.42 89
4.11 88.5
0.20 93
98.74 32
0.01 8
One_GPH-414 3.22 94
0.13 19
3.89 47
0.20 27
4.39 75.5
0.16 79
97.95 61
0.01 38
One_GTHa 3.61 56.5
0.22 91
4.17 24
0.17 13
4.72 38.5
0.10 34
98.06 54
0.01 41
One_HGFA-49 2.94 109
0.14 26
3.28 78.5
0.23 52
4.56 58
0.14 62
97.60 86
0.05 100
One_HpaI-71 2.89 112.5
0.11 14
2.89 90
0.20 31.5
3.83 101.5
0.16 80
96.11 106
0.04 96
One_HpaI-99 3.39 77.5
0.21 85.5
3.56 63
0.20 29
3.94 98
0.22 100
95.71 111
0.10 111
One_hsc71-220 3.61 56.5
0.17 43.5
2.33 103
0.36 83
3.28 111
0.34 112
98.24 49
0.02 52
One_Hsp47 3.83 41.5
0.22 95.5
4.06 32
0.25 59
4.33 78
0.19 91
98.46 41
0.01 42
One_Ig-90 4.50 16.5
0.21 82
1.78 107
1.23 111
4.67 45
0.15 72
99.34 7
0.01 7
One_IL8r-362 3.83 41.5
0.22 95.5
4.44 14.5
0.18 17
4.72 38.5
0.10 34
99.02 18
0.01 27
One_ins-107 3.00 105
0.16 41
3.28 78.5
0.27 71.5
4.00 94
0.17 82
95.12 113
0.06 104
One_KCT1-453 3.89 37.5
0.15 31
3.89 47
0.21 42.5
4.28 81
0.22 103
98.48 40
0.02 71
One_KPNA-422 3.22 94
0.17 45
3.94 40.5
0.20 35
4.67 45
0.13 53
97.96 60
0.02 57
One_LEI-87 3.89 37.5
0.20 68.5
3.61 58
0.32 78
4.50 64.5
0.17 84
98.29 45
0.02 53
One_leptin-92a 5.00 3.5
0.00 3.5
1.00 117.5
N/A N/A
5.00 4.5
0.00 4.5
99.49 4
0.01 9
One_lpp1-44 3.67 52
0.23 101
4.56 8
0.15 9
4.83 26
0.08 22.5
98.01 57
0.01 32
One_MARCKS-241 3.22 94
0.27 115
2.50 101
0.48 92
3.00 113
0.36 114
95.77 110
0.12 115
One_metA-253 4.56 14.5
0.17 47
3.17 85
0.74 105
4.94 12
0.05 12
98.84 23
0.01 44
One_MHC2_190 2.78 116.5
0.20 70
2.78 95
0.36 84
3.56 106
0.22 99
94.95 115
0.07 106
One_MHC2_251 3.94 34.5
0.18 59.5
3.89 47
0.21 42.5
4.22 84.5
0.19 87.5
97.93 64
0.02 85
One_Mkpro-129 3.33 84.5
0.23 105
3.67 55
0.26 66
4.50 64.5
0.14 65
96.75 102
0.04 99
One_ODC1-196 3.06 103
0.08 10
3.22 83
0.23 49
4.06 90.5
0.13 59.5
97.89 67
0.02 79
One_Ots208-234b N/A 61.5
N/A 60.5
N/A 63
N/A 58.5
N/A 58
N/A 60.75
N/A 60.5
N/A 60.5

WASSIP Technical Document 6: Locus selection for sockeye salmon
41
Table 4. (Page 3 of 6). 776
777
Cluster tightness Space between clusters Cluster alignment Success rate
Average
CV
Average
CV
Average
CV
Average
CV
Assay Score Rank Score Rank Score Rank Score Rank Score Rank Score Rank Score Rank Score Rank
One_Ots213-181 3.50 67.5
0.18 52
3.89 47
0.21 42.5
4.61 51
0.13 56.5
96.35 104
0.08 107
One_p53-534 4.22 25.5
0.19 64
2.83 92.5
0.84 107
4.89 20
0.07 18.5
95.99 108
0.10 113
One_parp3-170a 5.00 3.5
0.00 3.5
1.00 117.5
N/A N/A
5.00 4.5
0.00 4.5
98.82 25
0.02 66
One_pax7-248 4.22 25.5
0.17 48.5
4.50 11
0.27 67
4.89 20
0.07 18.5
98.74 31
0.02 65
One_PIP 3.11 99.5
0.15 33
3.50 67.5
0.18 18
4.06 90.5
0.13 59.5
97.04 96
0.03 91
One_ppie-74 4.06 30.5
0.27 116
1.22 111
1.21 110
3.61 105
0.40 117
93.63 117
0.25 118
One_PPM1K-118c 1.72 N/A
0.65 N/A
1.33 N/A
0.68 N/A
2.11 N/A
0.58 N/A
5.44 N/A
4.24 N/A
One_Prl2 3.11 99.5
0.15 33
3.56 63
0.24 56.5
4.56 58
0.14 62
96.93 100
0.02 82
One_psme2-354 2.94 109
0.27 114
2.56 99.5
0.52 95
3.28 111
0.33 111
97.01 97
0.04 97
One_rab1a-76 3.28 90
0.23 103
4.06 32
0.20 28
4.44 71
0.12 47.5
97.62 84
0.02 51
One_RAG1-103 4.33 22
0.18 54
3.94 40.5
0.47 91
4.89 20
0.07 18.5
98.08 53
0.04 98
One_RAG3-93 3.50 67.5
0.22 97
3.39 73
0.34 81
4.00 94
0.24 105
96.13 105
0.10 112
One_redd1-414 3.33 84.5
0.18 55.5
2.89 90
0.26 65
3.28 111
0.31 109
97.75 75
0.02 61
One_RFC2-102 4.00 32.5
0.17 46
4.11 28
0.22 45.5
4.50 64.5
0.16 77
98.61 35
0.01 28
One_RFC2-285 4.39 20
0.16 40
3.94 40.5
0.40 87
4.61 51
0.15 73
99.36 6
0.01 10
One_RH2op-395 4.50 16.5
0.16 38
3.11 86
0.74 104
4.78 31
0.11 44.5
97.81 71
0.06 103
One_rpo2j-261 3.56 61.5
0.20 72.5
4.11 28
0.16 12
4.72 38.5
0.10 34
97.61 85
0.01 36
One_sast-211 3.56 61.5
0.28 117
4.11 28
0.29 76
4.72 38.5
0.12 50.5
98.87 22
0.01 25
One_serpin-75 2.83 114.5
0.39 119
1.72 108
0.77 106
2.50 116.5
0.42 118
85.94 120
0.31 120
One_spf30-207 3.56 61.5
0.20 72.5
4.22 21.5
0.19 22
4.61 51
0.11 39.5
98.52 39
0.01 40
One_srp09-127 4.22 25.5
0.17 48.5
3.67 55
0.56 96
4.94 12
0.05 12
98.91 21
0.01 49
One_ssrd-135 3.44 72
0.20 80.5
4.11 28
0.18 21
4.61 51
0.11 39.5
97.56 88
0.02 78
One_STC-410 2.94 109
0.25 110
1.67 109
0.41 88
2.61 115
0.37 115
90.47 119
0.13 116
One_STR07 2.78 116.5
0.15 36
3.28 78.5
0.27 71.5
3.94 98
0.16 81
97.20 93
0.02 80
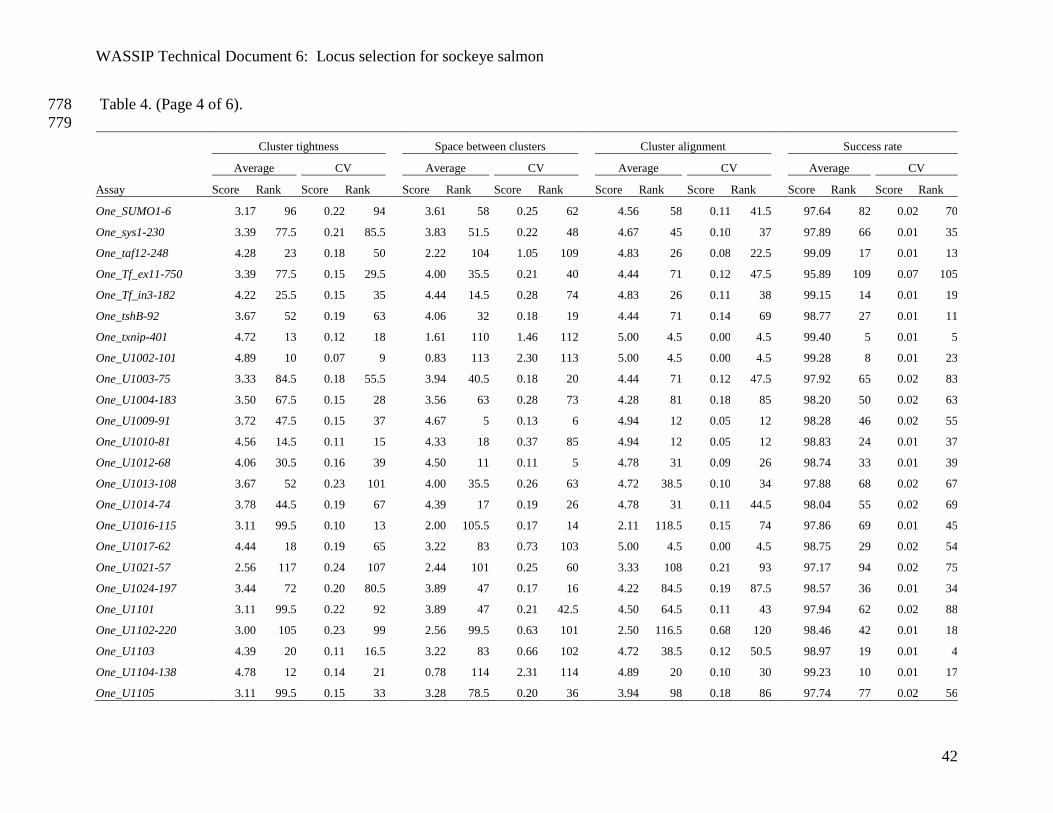
WASSIP Technical Document 6: Locus selection for sockeye salmon
42
Table 4. (Page 4 of 6). 778
779
Cluster tightness Space between clusters Cluster alignment Success rate
Average
CV
Average
CV
Average
CV
Average
CV
Assay Score Rank Score Rank Score Rank Score Rank Score Rank Score Rank Score Rank Score Rank
One_SUMO1-6 3.17 96
0.22 94
3.61 58
0.25 62
4.56 58
0.11 41.5
97.64 82
0.02 70
One_sys1-230 3.39 77.5
0.21 85.5
3.83 51.5
0.22 48
4.67 45
0.10 37
97.89 66
0.01 35
One_taf12-248 4.28 23
0.18 50
2.22 104
1.05 109
4.83 26
0.08 22.5
99.09 17
0.01 13
One_Tf_ex11-750 3.39 77.5
0.15 29.5
4.00 35.5
0.21 40
4.44 71
0.12 47.5
95.89 109
0.07 105
One_Tf_in3-182 4.22 25.5
0.15 35
4.44 14.5
0.28 74
4.83 26
0.11 38
99.15 14
0.01 19
One_tshB-92 3.67 52
0.19 63
4.06 32
0.18 19
4.44 71
0.14 69
98.77 27
0.01 11
One_txnip-401 4.72 13
0.12 18
1.61 110
1.46 112
5.00 4.5
0.00 4.5
99.40 5
0.01 5
One_U1002-101 4.89 10
0.07 9
0.83 113
2.30 113
5.00 4.5
0.00 4.5
99.28 8
0.01 23
One_U1003-75 3.33 84.5
0.18 55.5
3.94 40.5
0.18 20
4.44 71
0.12 47.5
97.92 65
0.02 83
One_U1004-183 3.50 67.5
0.15 28
3.56 63
0.28 73
4.28 81
0.18 85
98.20 50
0.02 63
One_U1009-91 3.72 47.5
0.15 37
4.67 5
0.13 6
4.94 12
0.05 12
98.28 46
0.02 55
One_U1010-81 4.56 14.5
0.11 15
4.33 18
0.37 85
4.94 12
0.05 12
98.83 24
0.01 37
One_U1012-68 4.06 30.5
0.16 39
4.50 11
0.11 5
4.78 31
0.09 26
98.74 33
0.01 39
One_U1013-108 3.67 52
0.23 101
4.00 35.5
0.26 63
4.72 38.5
0.10 34
97.88 68
0.02 67
One_U1014-74 3.78 44.5
0.19 67
4.39 17
0.19 26
4.78 31
0.11 44.5
98.04 55
0.02 69
One_U1016-115 3.11 99.5
0.10 13
2.00 105.5
0.17 14
2.11 118.5
0.15 74
97.86 69
0.01 45
One_U1017-62 4.44 18
0.19 65
3.22 83
0.73 103
5.00 4.5
0.00 4.5
98.75 29
0.02 54
One_U1021-57 2.56 117
0.24 107
2.44 101
0.25 60
3.33 108
0.21 93
97.17 94
0.02 75
One_U1024-197 3.44 72
0.20 80.5
3.89 47
0.17 16
4.22 84.5
0.19 87.5
98.57 36
0.01 34
One_U1101 3.11 99.5
0.22 92
3.89 47
0.21 42.5
4.50 64.5
0.11 43
97.94 62
0.02 88
One_U1102-220 3.00 105
0.23 99
2.56 99.5
0.63 101
2.50 116.5
0.68 120
98.46 42
0.01 18
One_U1103 4.39 20
0.11 16.5
3.22 83
0.66 102
4.72 38.5
0.12 50.5
98.97 19
0.01 4
One_U1104-138 4.78 12
0.14 21
0.78 114
2.31 114
4.89 20
0.10 30
99.23 10
0.01 17
One_U1105 3.11 99.5
0.15 33
3.28 78.5
0.20 36
3.94 98
0.18 86
97.74 77
0.02 56

WASSIP Technical Document 6: Locus selection for sockeye salmon
43
Table 4. (Page 5 of 6). 780
781
Cluster tightness Space between clusters Cluster alignment Success rate
Average
CV
Average
CV
Average
CV
Average
CV
Assay Score Rank Score Rank Score Rank Score Rank Score Rank Score Rank Score Rank Score Rank
One_U1201-492 3.33 84.5
0.21 83
3.44 70
0.27 68
4.22 84.5
0.17 83
97.67 80
0.02 81
One_U1202-1052 2.83 114.5
0.14 20
2.89 90
0.20 31.5
3.50 107
0.26 108
97.55 89
0.02 86
One_U1203-175 3.44 72
0.18 57
4.17 24
0.21 37
4.89 20
0.07 18.5
98.36 44
0.02 68
One_U1204-53 3.50 67.5
0.20 77
4.22 21.5
0.21 39
4.78 31
0.09 26
97.77 74
0.02 84
One_U1205-57 4.11 28.5
0.23 106
3.28 78.5
0.59 99
4.33 78
0.21 96
98.94 20
0.01 22
One_U1206-108 2.94 109
0.14 26
3.39 73
0.21 38
3.78 103
0.25 107
92.54 118
0.25 119
One_U1207-231c 1.56 N/A
0.63 N/A
1.72 N/A
0.74 N/A
2.67 N/A
0.66 N/A
5.32 N/A
4.24 N/A
One_U1208-67 3.67 52
0.21 88
4.56 8
0.14 8
4.89 20
0.07 18.5
97.38 91
0.02 62
One_U1209-111 3.83 41.5
0.18 61.5
4.72 4
0.10 4
4.72 38.5
0.10 34
98.77 26
0.01 43
One_U1210-173 3.56 61.5
0.20 72.5
3.61 58
0.24 53
4.00 94
0.23 104
98.76 28
0.01 31
One_U1211-97 3.33 84.5
0.29 118
2.67 98
0.50 93
3.44 108
0.35 113
97.74 76
0.02 89
One_U1212-106 3.28 90
0.14 23
3.56 63
0.22 47
4.39 75.5
0.14 67
96.97 99
0.03 94
One_U1214-107 3.61 56.5
0.19 66
4.28 19.5
0.29 75
4.50 64.5
0.14 65
98.56 38
0.01 47
One_U1215-82 2.11 120
0.46 120
1.17 112
0.61 100
1.94 120
0.54 119
95.12 114
0.03 92
One_U1216-230 3.28 90
0.20 79
4.11 28
0.22 45.5
4.67 45
0.13 53
97.44 90
0.02 87
One_U301-92 3.94 34.5
0.18 59.5
4.44 14.5
0.19 23.5
4.72 38.5
0.14 71
96.64 103
0.08 108
One_U401-224 3.39 77.5
0.15 29.5
3.83 51.5
0.24 58
4.50 64.5
0.14 65
97.57 87
0.01 50
One_U404-229 4.11 28.5
0.20 78
3.44 70
0.51 94
4.56 58
0.15 75.5
98.75 30
0.02 77
One_U502-167 4.94 7.5
0.05 7.5
2.72 97
0.92 108
4.94 12
0.05 12
99.21 11
0.01 30
One_U503-170 4.39 20
0.11 16.5
4.61 6
0.13 7
4.61 51
0.13 56.5
97.73 78
0.05 101
One_U504-141 2.94 109
0.14 26
3.44 70
0.23 50
4.33 78
0.16 78
97.66 81
0.02 60
One_U508-533d 3.00 105
0.2 75
3.00 87
0.2 30
4.00 94
0.2 92
93.7 116
0.2 117
One_UCA-24c 3.39 N/A
0.27 N/A
3.28 N/A
0.29 N/A
3.06 N/A
0.38 N/A
67.08 N/A
0.18 N/A
One_vamp5-255 3.50 67.5
0.18 52
3.56 63
0.26 64
4.11 88.5
0.22 98
97.79 73
0.02 72

WASSIP Technical Document 6: Locus selection for sockeye salmon
44
Table 4. (Page 6 of 6). 782
783
Cluster tightness Space between clusters Cluster alignment Success rate
Average
CV
Average
CV
Average
CV
Average
CV
Assay Score Rank Score Rank Score Rank Score Rank Score Rank Score Rank Score Rank Score Rank
One_vatf-214 3.89 37.5
0.21 90
3.39 73
0.58 98
4.61 51
0.13 56.5
99.21 12
0.01 3
One_VIM-569 3.83 41.5
0.18 61.5
3.94 40.5
0.16 11
4.22 84.5
0.21 95
98.14 51
0.03 93
One_zn706-68 4.89 10
0.10 11.5
0.28 115.5
4.24 115.5
5.00 4.5
0.00 4.5
98.00 58
0.03 95
One_ZNF-61 3.72 47.5
0.20 76
4.50 11
0.16 10
4.89 20
0.07 18.5
97.16 95
0.05 102
One_Zp3b-49 3.56 61.5 0.26 113 2.94 88 0.46 90 2.78 114 0.40 116 98.56 37 0.01 26
784 a This marker was excluded from subsequent analyses due to fixation in 36 test populations. 785
b This marker was screened on the ABI platform for the 36 test populations and was given median rankings for each laboratory measure. 786
c These markers were not given ratings or included in subsequent analyses due to massive laboratory failure or the appearance of excessive clusters. 787
d This marker was screened on the ABI platform for the 36 test populations and was given ratings based upon previous analyses of other populations on the 788
Biomark platform.789
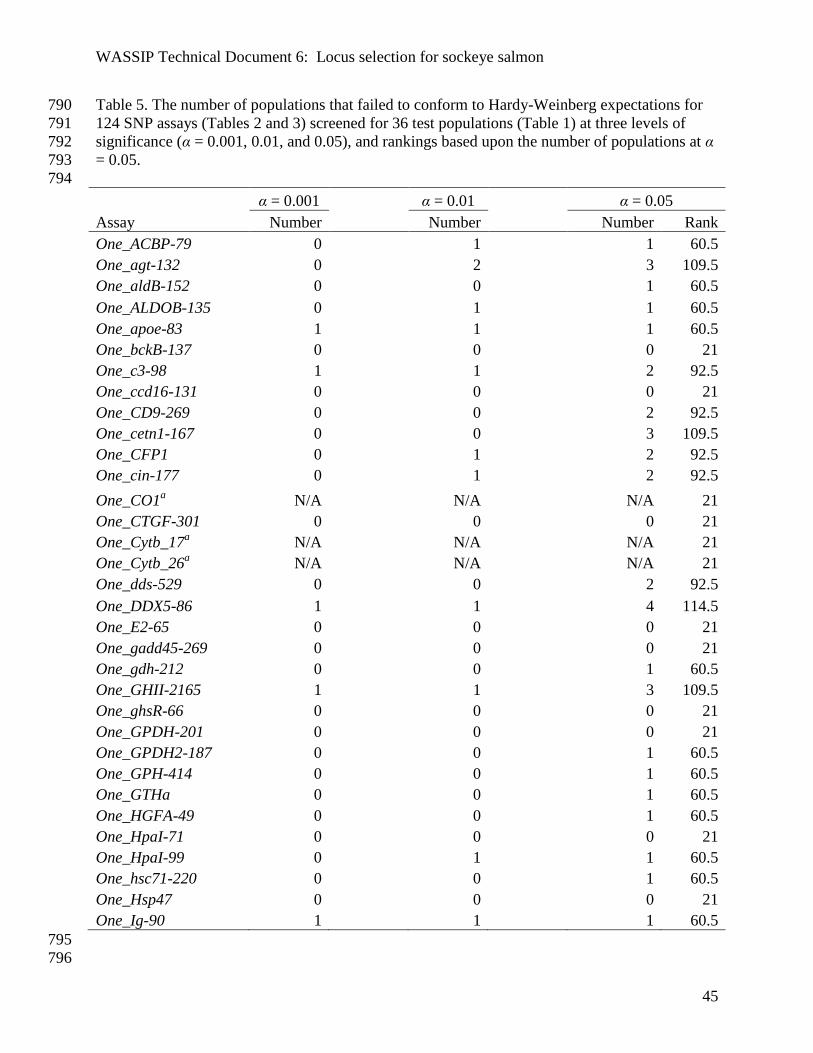
WASSIP Technical Document 6: Locus selection for sockeye salmon
45
Table 5. The number of populations that failed to conform to Hardy-Weinberg expectations for 790
124 SNP assays (Tables 2 and 3) screened for 36 test populations (Table 1) at three levels of 791
significance (α = 0.001, 0.01, and 0.05), and rankings based upon the number of populations at α 792
= 0.05. 793
794
α = 0.001 α = 0.01 α = 0.05
Assay Number Number Number Rank
One_ACBP-79 0
1
1 60.5
One_agt-132 0
2
3 109.5
One_aldB-152 0
0
1 60.5
One_ALDOB-135 0
1
1 60.5
One_apoe-83 1
1
1 60.5
One_bckB-137 0
0
0 21
One_c3-98 1
1
2 92.5
One_ccd16-131 0
0
0 21
One_CD9-269 0
0
2 92.5
One_cetn1-167 0
0
3 109.5
One_CFP1 0
1
2 92.5
One_cin-177 0
1
2 92.5
One_CO1a N/A
N/A
N/A 21
One_CTGF-301 0
0
0 21
One_Cytb_17a N/A
N/A
N/A 21
One_Cytb_26a N/A
N/A
N/A 21
One_dds-529 0
0
2 92.5
One_DDX5-86 1
1
4 114.5
One_E2-65 0
0
0 21
One_gadd45-269 0
0
0 21
One_gdh-212 0
0
1 60.5
One_GHII-2165 1
1
3 109.5
One_ghsR-66 0
0
0 21
One_GPDH-201 0
0
0 21
One_GPDH2-187 0
0
1 60.5
One_GPH-414 0
0
1 60.5
One_GTHa 0
0
1 60.5
One_HGFA-49 0
0
1 60.5
One_HpaI-71 0
0
0 21
One_HpaI-99 0
1
1 60.5
One_hsc71-220 0
0
1 60.5
One_Hsp47 0
0
0 21
One_Ig-90 1
1
1 60.5
795
796
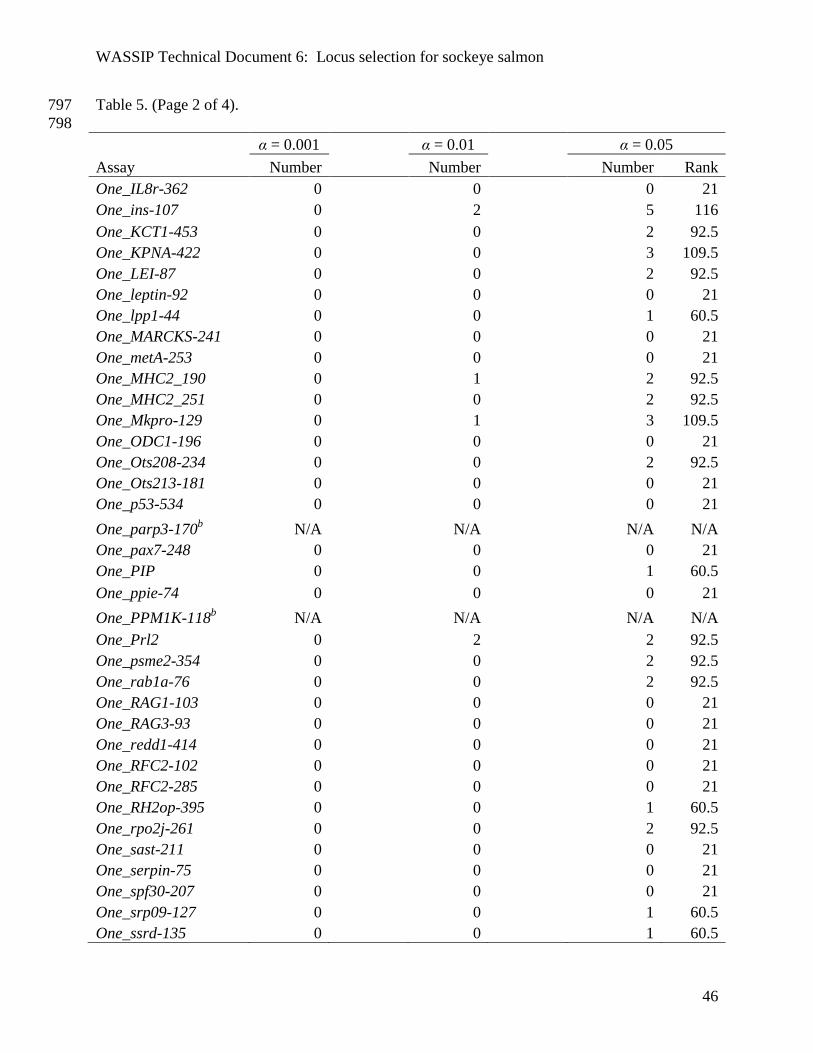
WASSIP Technical Document 6: Locus selection for sockeye salmon
46
Table 5. (Page 2 of 4). 797
798
α = 0.001 α = 0.01 α = 0.05
Assay Number Number Number Rank
One_IL8r-362 0
0
0 21
One_ins-107 0
2
5 116
One_KCT1-453 0
0
2 92.5
One_KPNA-422 0
0
3 109.5
One_LEI-87 0
0
2 92.5
One_leptin-92 0
0
0 21
One_lpp1-44 0
0
1 60.5
One_MARCKS-241 0
0
0 21
One_metA-253 0
0
0 21
One_MHC2_190 0
1
2 92.5
One_MHC2_251 0
0
2 92.5
One_Mkpro-129 0
1
3 109.5
One_ODC1-196 0
0
0 21
One_Ots208-234 0
0
2 92.5
One_Ots213-181 0
0
0 21
One_p53-534 0
0
0 21
One_parp3-170b N/A
N/A
N/A N/A
One_pax7-248 0
0
0 21
One_PIP 0
0
1 60.5
One_ppie-74 0
0
0 21
One_PPM1K-118b N/A
N/A
N/A N/A
One_Prl2 0
2
2 92.5
One_psme2-354 0
0
2 92.5
One_rab1a-76 0
0
2 92.5
One_RAG1-103 0
0
0 21
One_RAG3-93 0
0
0 21
One_redd1-414 0
0
0 21
One_RFC2-102 0
0
0 21
One_RFC2-285 0
0
0 21
One_RH2op-395 0
0
1 60.5
One_rpo2j-261 0
0
2 92.5
One_sast-211 0
0
0 21
One_serpin-75 0
0
0 21
One_spf30-207 0
0
0 21
One_srp09-127 0
0
1 60.5
One_ssrd-135 0
0
1 60.5

WASSIP Technical Document 6: Locus selection for sockeye salmon
47
Table 5. (Page 3 of 4). 799
800
α = 0.001 α = 0.01 α = 0.05
Assay Number Number Number Rank
One_STC-410 0
1
2 92.5
One_STR07 0
0
1 60.5
One_SUMO1-6 0
0
1 92.5
One_sys1-230 0
1
2 92.5
One_taf12-248 0
0
2 60.5
One_Tf_ex11-750 0
0
0 21
One_Tf_in3-182 0
0
0 21
One_tshB-92 0
0
2 92.5
One_txnip-401 1
1
1 60.5
One_U1002-101 0
0
0 21
One_U1003-75 0
0
0 21
One_U1004-183 0
0
4 114.5
One_U1009-91 0
0
0 21
One_U1010-81 0
0
0 21
One_U1012-68 0
0
1 60.5
One_U1013-108 1
1
2 92.5
One_U1014-74 1
1
1 60.5
One_U1016-115 0
0
1 60.5
One_U1017-62 0
0
0 21
One_U1021-57 8
12
14 117
One_U1024-197 0
0
2 92.5
One_U1101 0
0
2 92.5
One_U1102-220 2
2
3 109.5
One_U1103 0
0
0 21
One_U1104-138 0
0
0 21
One_U1105 1
1
1 60.5
One_U1201-492 0
0
2 92.5
One_U1202-1052 1
1
1 60.5
One_U1203-175 1
1
1 60.5
One_U1204-53 0
0
2 92.5
One_U1205-57 0
0
2 92.5
One_U1206-108 0
0
1 60.5
One_U1207-231b N/A
N/A
N/A N/A
One_U1208-67 0
0
2 92.5
One_U1209-111 0
0
0 21
One_U1210-173 0
1
1 60.5
One_U1211-97 0
0
1 60.5

WASSIP Technical Document 6: Locus selection for sockeye salmon
48
Table 5. (Page 4 of 4). 801
802
α = 0.001 α = 0.01 α = 0.05
Assay Number Number Number Rank
One_U1212-106 0
1
1 60.5
One_U1214-107 0
0
2 92.5
One_U1215-82 0
0
1 60.5
One_U1216-230 0
0
3 109.5
One_U301-92 0
1
1 60.5
One_U401-224 0
0
1 60.5
One_U404-229 0
1
1 60.5
One_U502-167 0
0
0 21
One_U503-170 0
0
0 21
One_U504-141 0
0
1 60.5
One_U508-533 0
0
1 60.5
One_UCA-24b N/A
N/A
N/A N/A
One_vamp5-255 0
0
1 60.5
One_vatf-214 0
0
0 21
One_VIM-569 0
0
1 60.5
One_zn706-68 0
0
0 21
One_ZNF-61 0
0
3 109.5
One_Zp3b-49 0 0 0 21 803 a These mitochondrial assays were not included in tests of conformance to Hardy-Weinberg expectations, and were 804
given rankings equal to the highest rank for this judge. 805 b These assays were not included in tests of conformance to Hardy-Weinberg expectations due to poor laboratory 806
performance.807
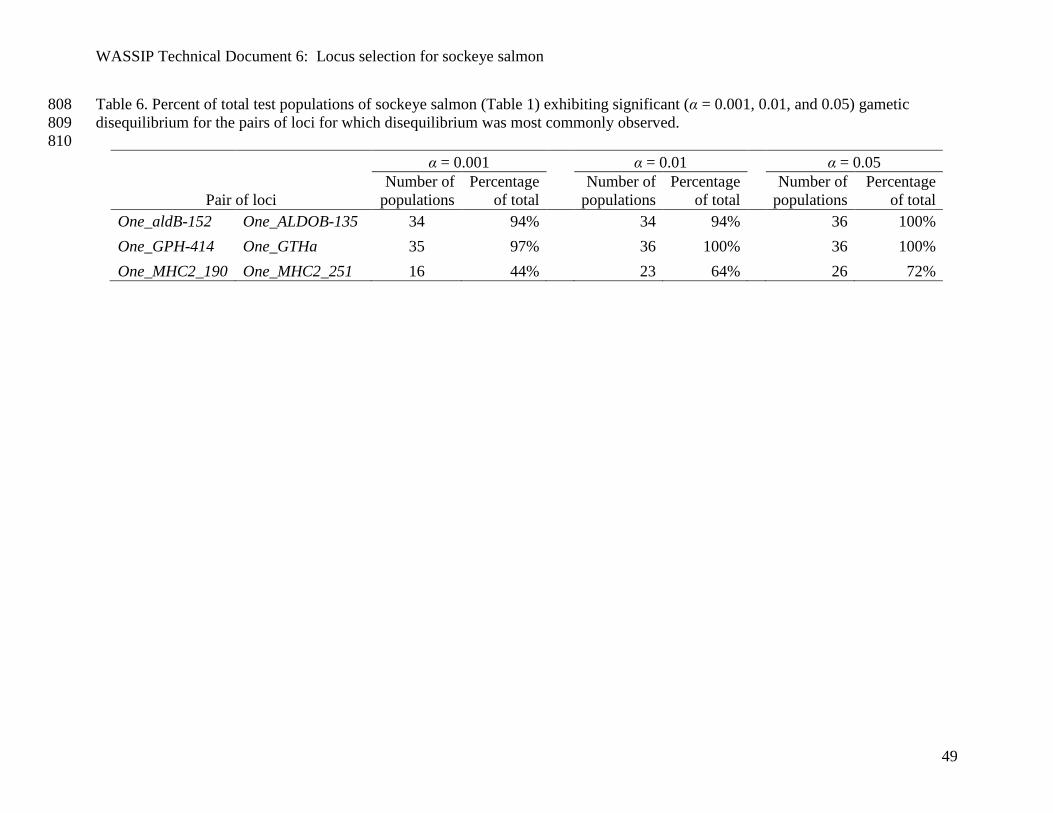
WASSIP Technical Document 6: Locus selection for sockeye salmon
49
Table 6. Percent of total test populations of sockeye salmon (Table 1) exhibiting significant (α = 0.001, 0.01, and 0.05) gametic 808
disequilibrium for the pairs of loci for which disequilibrium was most commonly observed. 809
810
α = 0.001
α = 0.01
α = 0.05
Pair of loci
Number of
populations
Percentage
of total
Number of
populations
Percentage
of total
Number of
populations
Percentage
of total
One_aldB-152 One_ALDOB-135 34 94%
34 94%
36 100%
One_GPH-414 One_GTHa 35 97%
36 100%
36 100%
One_MHC2_190 One_MHC2_251 16 44% 23 64% 26 72%
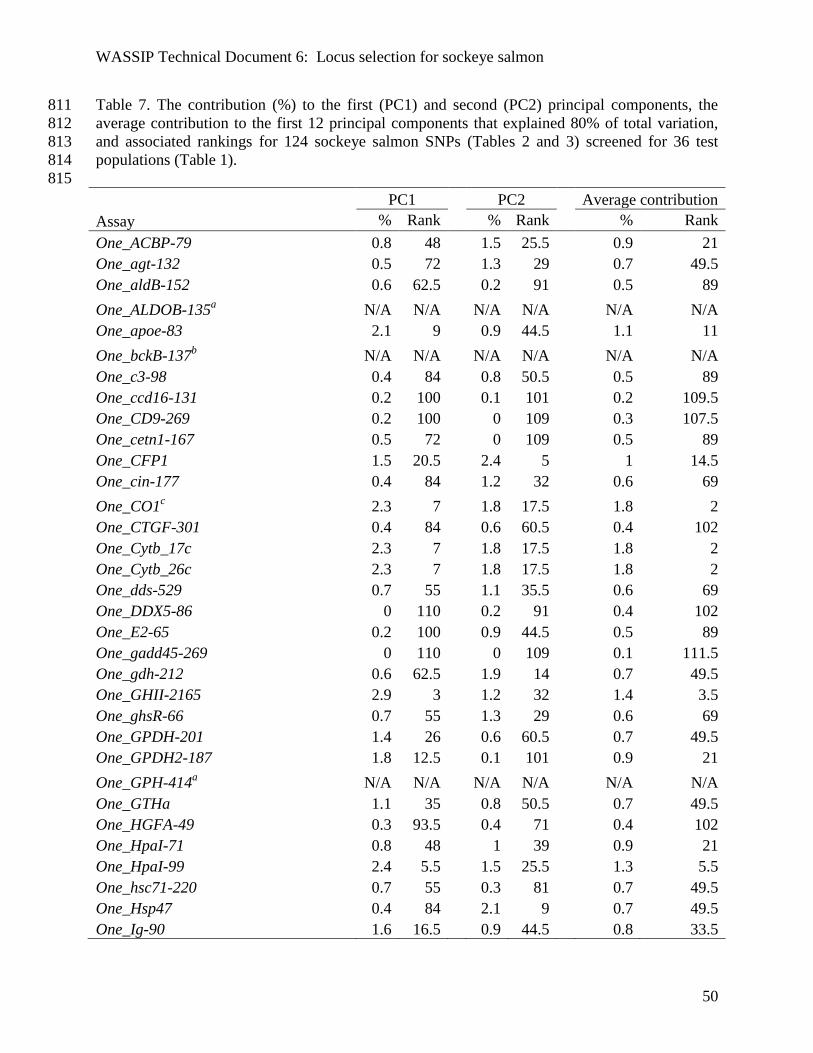
WASSIP Technical Document 6: Locus selection for sockeye salmon
50
Table 7. The contribution (%) to the first (PC1) and second (PC2) principal components, the 811
average contribution to the first 12 principal components that explained 80% of total variation, 812
and associated rankings for 124 sockeye salmon SNPs (Tables 2 and 3) screened for 36 test 813
populations (Table 1). 814
815
PC1
PC2
Average contribution
Assay % Rank % Rank % Rank
One_ACBP-79 0.8 48
1.5 25.5
0.9 21
One_agt-132 0.5 72
1.3 29
0.7 49.5
One_aldB-152 0.6 62.5
0.2 91
0.5 89
One_ALDOB-135a N/A N/A
N/A N/A
N/A N/A
One_apoe-83 2.1 9
0.9 44.5
1.1 11
One_bckB-137b N/A N/A
N/A N/A
N/A N/A
One_c3-98 0.4 84
0.8 50.5
0.5 89
One_ccd16-131 0.2 100
0.1 101
0.2 109.5
One_CD9-269 0.2 100
0 109
0.3 107.5
One_cetn1-167 0.5 72
0 109
0.5 89
One_CFP1 1.5 20.5
2.4 5
1 14.5
One_cin-177 0.4 84
1.2 32
0.6 69
One_CO1c 2.3 7
1.8 17.5
1.8 2
One_CTGF-301 0.4 84
0.6 60.5
0.4 102
One_Cytb_17c 2.3 7
1.8 17.5
1.8 2
One_Cytb_26c 2.3 7
1.8 17.5
1.8 2
One_dds-529 0.7 55
1.1 35.5
0.6 69
One_DDX5-86 0 110
0.2 91
0.4 102
One_E2-65 0.2 100
0.9 44.5
0.5 89
One_gadd45-269 0 110
0 109
0.1 111.5
One_gdh-212 0.6 62.5
1.9 14
0.7 49.5
One_GHII-2165 2.9 3
1.2 32
1.4 3.5
One_ghsR-66 0.7 55
1.3 29
0.6 69
One_GPDH-201 1.4 26
0.6 60.5
0.7 49.5
One_GPDH2-187 1.8 12.5
0.1 101
0.9 21
One_GPH-414a N/A N/A
N/A N/A
N/A N/A
One_GTHa 1.1 35
0.8 50.5
0.7 49.5
One_HGFA-49 0.3 93.5
0.4 71
0.4 102
One_HpaI-71 0.8 48
1 39
0.9 21
One_HpaI-99 2.4 5.5
1.5 25.5
1.3 5.5
One_hsc71-220 0.7 55
0.3 81
0.7 49.5
One_Hsp47 0.4 84
2.1 9
0.7 49.5
One_Ig-90 1.6 16.5
0.9 44.5
0.8 33.5

WASSIP Technical Document 6: Locus selection for sockeye salmon
51
Table 7. (Page 2 of 4). 816
817
PC1 PC2 Average contribution
Assay % Rank % Rank % Rank
One_IL8r-362 0.4 84
0.6 60.5
0.6 69
One_ins-107 0.7 55
0.6 60.5
0.5 89
One_KCT1-453 0.6 62.5
0.7 55
0.6 69
One_KPNA-422 0.3 93.5
0.8 50.5
0.4 102
One_LEI-87 1.3 30
0.3 81
0.9 21
One_leptin-92b N/A N/A
N/A N/A
N/A N/A
One_lpp1-44 0.7 55
0.4 71
0.8 33.5
One_MARCKS-241 0.4 84
0.6 60.5
0.4 102
One_metA-253 3.3 1
2.7 4
1.4 3.5
One_MHC2_190d 3.1 2
3.7 1.5
3.9 1
One_MHC2_251d 3.1 2
3.7 1.5
3.9 1
One_Mkpro-129 1.0 37
1.7 20.5
1 14.5
One_ODC1-196 0.3 93.5
1.8 17.5
0.6 69
One_Ots208-234 2.4 5.5
0.4 71
0.9 21
One_Ots213-181 1.6 16.5
0.2 91
0.7 49.5
One_p53-534 1.4 26
2.1 9
0.8 33.5
One_parp3-170b N/A N/A
N/A N/A
N/A N/A
One_pax7-248 0.7 55
0.1 101
0.6 69
One_PIP 0 110
0.7 55
0.5 89
One_ppie-74 1.4 26
3.4 3
1.3 5.5
One_PPM1K-118e N/A N/A
N/A N/A
N/A N/A
One_Prl2 0.1 105.5
2.0 11.5
0.7 49.5
One_psme2-354 0.4 84
0.3 81
0.6 69
One_rab1a-76 0.4 84
0.9 44.5
0.6 69
One_RAG1-103 0.1 105.5
1.5 25.5
0.7 49.5
One_RAG3-93 0.5 72
0.6 60.5
0.6 69
One_redd1-414 1.6 16.5
0.4 71
1 14.5
One_RFC2-102 0.5 72
0.5 64.5
0.5 89
One_RFC2-285 0.6 62.5
0.9 44.5
0.5 89
One_RH2op-395 0 110
0 109
0.2 109.5
One_rpo2j-261 0.4 84
1.8 17.5
0.6 69
One_sast-211 0.5 72
0.2 91
0.5 89
One_serpin-75 0.2 100
0 109
0.3 107.5
One_spf30-207 0.7 55
1.1 35.5
0.6 69
One_srp09-127 1.7 14
0.5 64.5
0.7 49.5
818
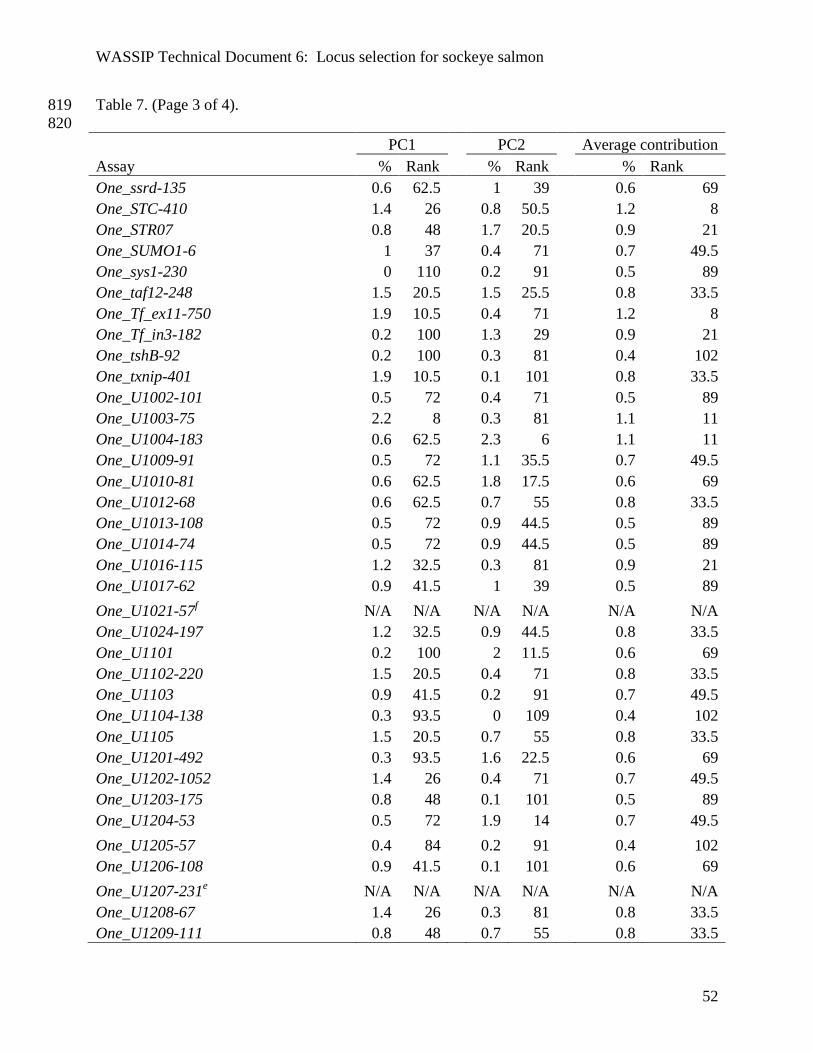
WASSIP Technical Document 6: Locus selection for sockeye salmon
52
Table 7. (Page 3 of 4). 819
820
PC1 PC2 Average contribution
Assay % Rank % Rank % Rank
One_ssrd-135 0.6 62.5
1 39
0.6 69
One_STC-410 1.4 26
0.8 50.5
1.2 8
One_STR07 0.8 48
1.7 20.5
0.9 21
One_SUMO1-6 1 37
0.4 71
0.7 49.5
One_sys1-230 0 110
0.2 91
0.5 89
One_taf12-248 1.5 20.5
1.5 25.5
0.8 33.5
One_Tf_ex11-750 1.9 10.5
0.4 71
1.2 8
One_Tf_in3-182 0.2 100
1.3 29
0.9 21
One_tshB-92 0.2 100
0.3 81
0.4 102
One_txnip-401 1.9 10.5
0.1 101
0.8 33.5
One_U1002-101 0.5 72
0.4 71
0.5 89
One_U1003-75 2.2 8
0.3 81
1.1 11
One_U1004-183 0.6 62.5
2.3 6
1.1 11
One_U1009-91 0.5 72
1.1 35.5
0.7 49.5
One_U1010-81 0.6 62.5
1.8 17.5
0.6 69
One_U1012-68 0.6 62.5
0.7 55
0.8 33.5
One_U1013-108 0.5 72
0.9 44.5
0.5 89
One_U1014-74 0.5 72
0.9 44.5
0.5 89
One_U1016-115 1.2 32.5
0.3 81
0.9 21
One_U1017-62 0.9 41.5
1 39
0.5 89
One_U1021-57f N/A N/A
N/A N/A
N/A N/A
One_U1024-197 1.2 32.5
0.9 44.5
0.8 33.5
One_U1101 0.2 100
2 11.5
0.6 69
One_U1102-220 1.5 20.5
0.4 71
0.8 33.5
One_U1103 0.9 41.5
0.2 91
0.7 49.5
One_U1104-138 0.3 93.5
0 109
0.4 102
One_U1105 1.5 20.5
0.7 55
0.8 33.5
One_U1201-492 0.3 93.5
1.6 22.5
0.6 69
One_U1202-1052 1.4 26
0.4 71
0.7 49.5
One_U1203-175 0.8 48
0.1 101
0.5 89
One_U1204-53 0.5 72
1.9 14
0.7 49.5
One_U1205-57 0.4 84
0.2 91
0.4 102
One_U1206-108 0.9 41.5
0.1 101
0.6 69
One_U1207-231e N/A N/A
N/A N/A
N/A N/A
One_U1208-67 1.4 26
0.3 81
0.8 33.5
One_U1209-111 0.8 48
0.7 55
0.8 33.5
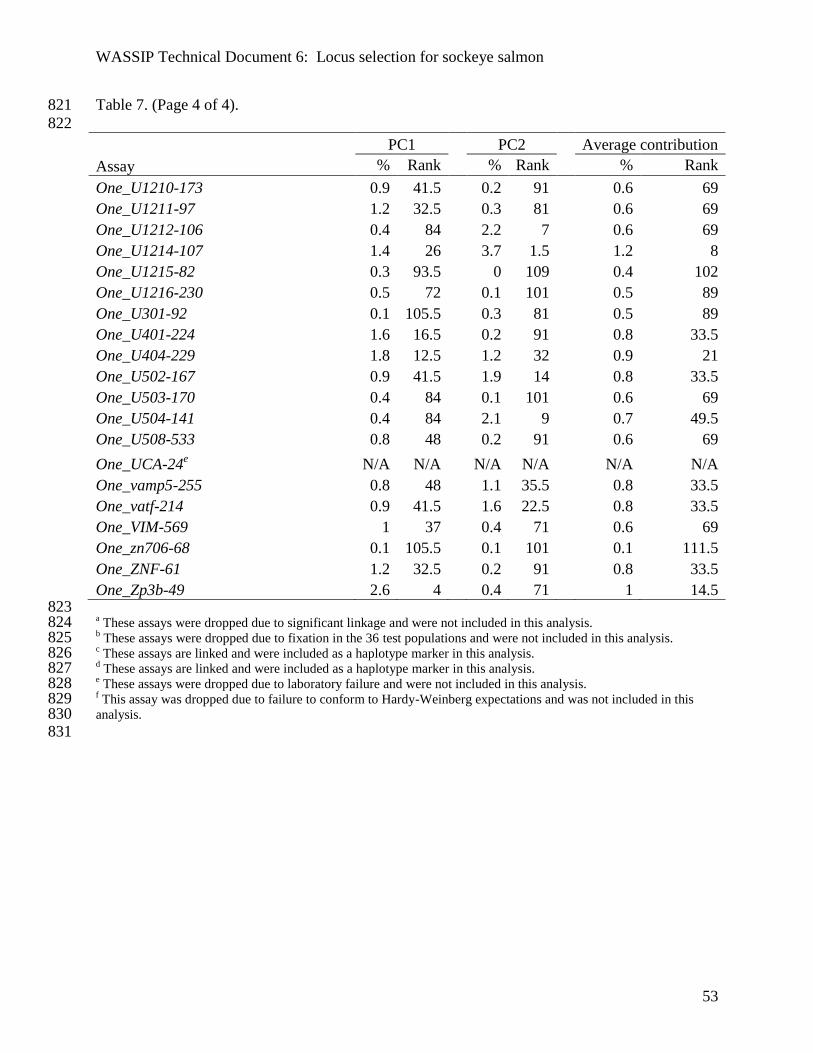
WASSIP Technical Document 6: Locus selection for sockeye salmon
53
Table 7. (Page 4 of 4). 821
822
PC1 PC2 Average contribution
Assay % Rank % Rank % Rank
One_U1210-173 0.9 41.5
0.2 91
0.6 69
One_U1211-97 1.2 32.5
0.3 81
0.6 69
One_U1212-106 0.4 84
2.2 7
0.6 69
One_U1214-107 1.4 26
3.7 1.5
1.2 8
One_U1215-82 0.3 93.5
0 109
0.4 102
One_U1216-230 0.5 72
0.1 101
0.5 89
One_U301-92 0.1 105.5
0.3 81
0.5 89
One_U401-224 1.6 16.5
0.2 91
0.8 33.5
One_U404-229 1.8 12.5
1.2 32
0.9 21
One_U502-167 0.9 41.5
1.9 14
0.8 33.5
One_U503-170 0.4 84
0.1 101
0.6 69
One_U504-141 0.4 84
2.1 9
0.7 49.5
One_U508-533 0.8 48
0.2 91
0.6 69
One_UCA-24e N/A N/A
N/A N/A
N/A N/A
One_vamp5-255 0.8 48
1.1 35.5
0.8 33.5
One_vatf-214 0.9 41.5
1.6 22.5
0.8 33.5
One_VIM-569 1 37
0.4 71
0.6 69
One_zn706-68 0.1 105.5
0.1 101
0.1 111.5
One_ZNF-61 1.2 32.5
0.2 91
0.8 33.5
One_Zp3b-49 2.6 4 0.4 71 1 14.5 823 a These assays were dropped due to significant linkage and were not included in this analysis. 824
b These assays were dropped due to fixation in the 36 test populations and were not included in this analysis. 825
c These assays are linked and were included as a haplotype marker in this analysis. 826
d These assays are linked and were included as a haplotype marker in this analysis. 827
e These assays were dropped due to laboratory failure and were not included in this analysis. 828
f This assay was dropped due to failure to conform to Hardy-Weinberg expectations and was not included in this 829 analysis. 830
831
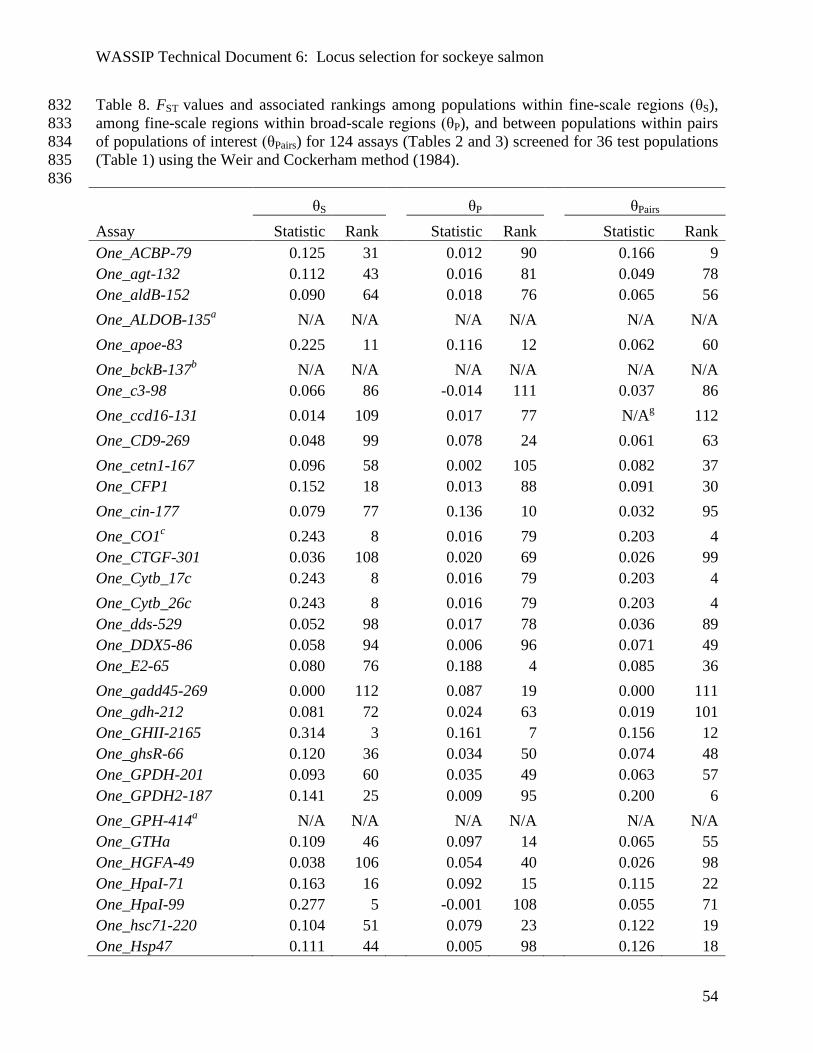
WASSIP Technical Document 6: Locus selection for sockeye salmon
54
Table 8. FST values and associated rankings among populations within fine-scale regions (θS), 832
among fine-scale regions within broad-scale regions (θP), and between populations within pairs 833
of populations of interest (θPairs) for 124 assays (Tables 2 and 3) screened for 36 test populations 834
(Table 1) using the Weir and Cockerham method (1984). 835
836
θS θP θPairs
Assay Statistic Rank Statistic Rank Statistic Rank
One_ACBP-79 0.125 31
0.012 90
0.166 9
One_agt-132 0.112 43
0.016 81
0.049 78
One_aldB-152 0.090 64
0.018 76
0.065 56
One_ALDOB-135a N/A N/A
N/A N/A
N/A N/A
One_apoe-83 0.225 11
0.116 12
0.062 60
One_bckB-137b N/A N/A
N/A N/A
N/A N/A
One_c3-98 0.066 86
-0.014 111
0.037 86
One_ccd16-131 0.014 109
0.017 77
N/Ag 112
One_CD9-269 0.048 99
0.078 24
0.061 63
One_cetn1-167 0.096 58
0.002 105
0.082 37
One_CFP1 0.152 18
0.013 88
0.091 30
One_cin-177 0.079 77
0.136 10
0.032 95
One_CO1c 0.243 8
0.016 79
0.203 4
One_CTGF-301 0.036 108
0.020 69
0.026 99
One_Cytb_17c 0.243 8
0.016 79
0.203 4
One_Cytb_26c 0.243 8
0.016 79
0.203 4
One_dds-529 0.052 98
0.017 78
0.036 89
One_DDX5-86 0.058 94
0.006 96
0.071 49
One_E2-65 0.080 76
0.188 4
0.085 36
One_gadd45-269 0.000 112
0.087 19
0.000 111
One_gdh-212 0.081 72
0.024 63
0.019 101
One_GHII-2165 0.314 3
0.161 7
0.156 12
One_ghsR-66 0.120 36
0.034 50
0.074 48
One_GPDH-201 0.093 60
0.035 49
0.063 57
One_GPDH2-187 0.141 25
0.009 95
0.200 6
One_GPH-414a N/A N/A
N/A N/A
N/A N/A
One_GTHa 0.109 46
0.097 14
0.065 55
One_HGFA-49 0.038 106
0.054 40
0.026 98
One_HpaI-71 0.163 16
0.092 15
0.115 22
One_HpaI-99 0.277 5
-0.001 108
0.055 71
One_hsc71-220 0.104 51
0.079 23
0.122 19
One_Hsp47 0.111 44
0.005 98
0.126 18
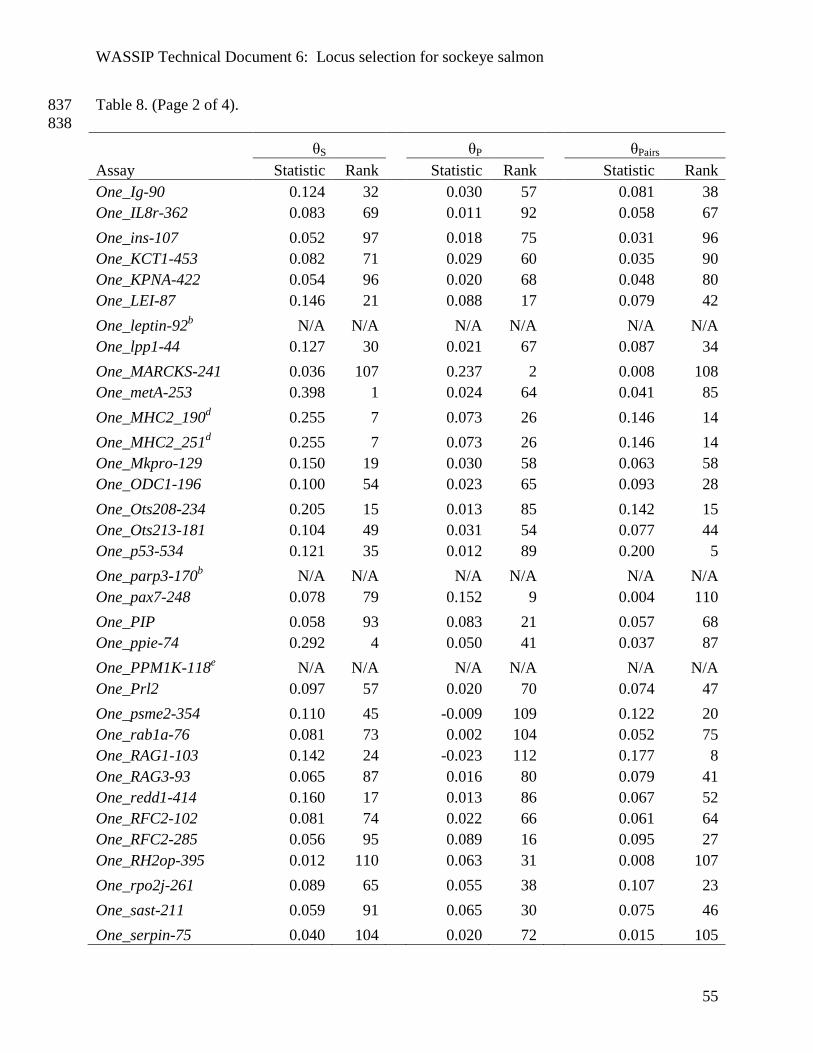
WASSIP Technical Document 6: Locus selection for sockeye salmon
55
Table 8. (Page 2 of 4). 837
838
θS θP θPairs
Assay Statistic Rank Statistic Rank Statistic Rank
One_Ig-90 0.124 32
0.030 57
0.081 38
One_IL8r-362 0.083 69
0.011 92
0.058 67
One_ins-107 0.052 97
0.018 75
0.031 96
One_KCT1-453 0.082 71
0.029 60
0.035 90
One_KPNA-422 0.054 96
0.020 68
0.048 80
One_LEI-87 0.146 21
0.088 17
0.079 42
One_leptin-92b N/A N/A
N/A N/A
N/A N/A
One_lpp1-44 0.127 30
0.021 67
0.087 34
One_MARCKS-241 0.036 107
0.237 2
0.008 108
One_metA-253 0.398 1
0.024 64
0.041 85
One_MHC2_190d 0.255 7
0.073 26
0.146 14
One_MHC2_251d 0.255 7
0.073 26
0.146 14
One_Mkpro-129 0.150 19
0.030 58
0.063 58
One_ODC1-196 0.100 54
0.023 65
0.093 28
One_Ots208-234 0.205 15
0.013 85
0.142 15
One_Ots213-181 0.104 49
0.031 54
0.077 44
One_p53-534 0.121 35
0.012 89
0.200 5
One_parp3-170b N/A N/A
N/A N/A
N/A N/A
One_pax7-248 0.078 79
0.152 9
0.004 110
One_PIP 0.058 93
0.083 21
0.057 68
One_ppie-74 0.292 4
0.050 41
0.037 87
One_PPM1K-118e N/A N/A
N/A N/A
N/A N/A
One_Prl2 0.097 57
0.020 70
0.074 47
One_psme2-354 0.110 45
-0.009 109
0.122 20
One_rab1a-76 0.081 73
0.002 104
0.052 75
One_RAG1-103 0.142 24
-0.023 112
0.177 8
One_RAG3-93 0.065 87
0.016 80
0.079 41
One_redd1-414 0.160 17
0.013 86
0.067 52
One_RFC2-102 0.081 74
0.022 66
0.061 64
One_RFC2-285 0.056 95
0.089 16
0.095 27
One_RH2op-395 0.012 110
0.063 31
0.008 107
One_rpo2j-261 0.089 65
0.055 38
0.107 23
One_sast-211 0.059 91
0.065 30
0.075 46
One_serpin-75 0.040 104
0.020 72
0.015 105

WASSIP Technical Document 6: Locus selection for sockeye salmon
56
Table 8. (Page 3 of 4). 839
840
θS θP θPairs
Assay Statistic Rank Statistic Rank Statistic Rank
One_spf30-207 0.085 68
0.028 61
0.090 31
One_srp09-127 0.120 37
0.027 62
0.086 35
One_ssrd-135 0.059 92
0.154 8
0.016 103
One_STC-410 0.233 9
0.046 43
0.196 7
One_STR07 0.135 27
0.082 22
0.135 17
One_SUMO1-6 0.097 56
0.060 32
0.034 93
One_sys1-230 0.094 59
0.032 53
0.056 70
One_taf12-248 0.109 47
0.088 18
0.121 21
One_Tf_ex11-750 0.233 10
0.039 47
0.251 3
One_Tf_in3-182 0.212 13
0.084 20
0.295 2
One_tshB-92 0.045 101
0.200 3
0.046 81
One_txnip-401 0.149 20
0.010 93
0.147 13
One_U1002-101 0.045 103
0.014 84
0.049 79
One_U1003-75 0.221 12
-0.009 110
0.061 62
One_U1004-183 0.323 2
0.068 29
0.490 1
One_U1009-91 0.090 63
0.055 39
0.096 26
One_U1010-81 0.063 88
0.036 48
0.052 77
One_U1012-68 0.107 48
0.032 52
0.097 25
One_U1013-108 0.076 82
0.068 28
0.032 94
One_U1014-74 0.061 90
0.019 73
0.034 92
One_U1016-115 0.142 23
0.059 35
0.135 16
One_U1017-62 0.062 89
0.020 71
0.009 106
One_U1021-57f N/A N/A
N/A N/A
N/A N/A
One_U1024-197 0.083 70
0.058 36
0.088 33
One_U1101 0.075 83
0.168 5
0.053 73
One_U1102-220 0.116 38
0.002 103
0.037 88
One_U1103 0.135 28
0.261 1
0.062 61
One_U1104-138 0.045 102
0.060 33
0.060 65
One_U1105 0.135 26
0.005 99
0.090 32
One_U1201-492 0.092 62
-0.001 107
0.046 82
One_U1202-1052 0.115 40
0.130 11
0.078 43
One_U1203-175 0.072 85
0.031 56
0.053 74
One_U1204-53 0.078 81
0.059 34
0.065 54
One_U1205-57 0.039 105
0.106 13
0.034 91
One_U1206-108 0.088 66
0.077 25
0.071 50
841
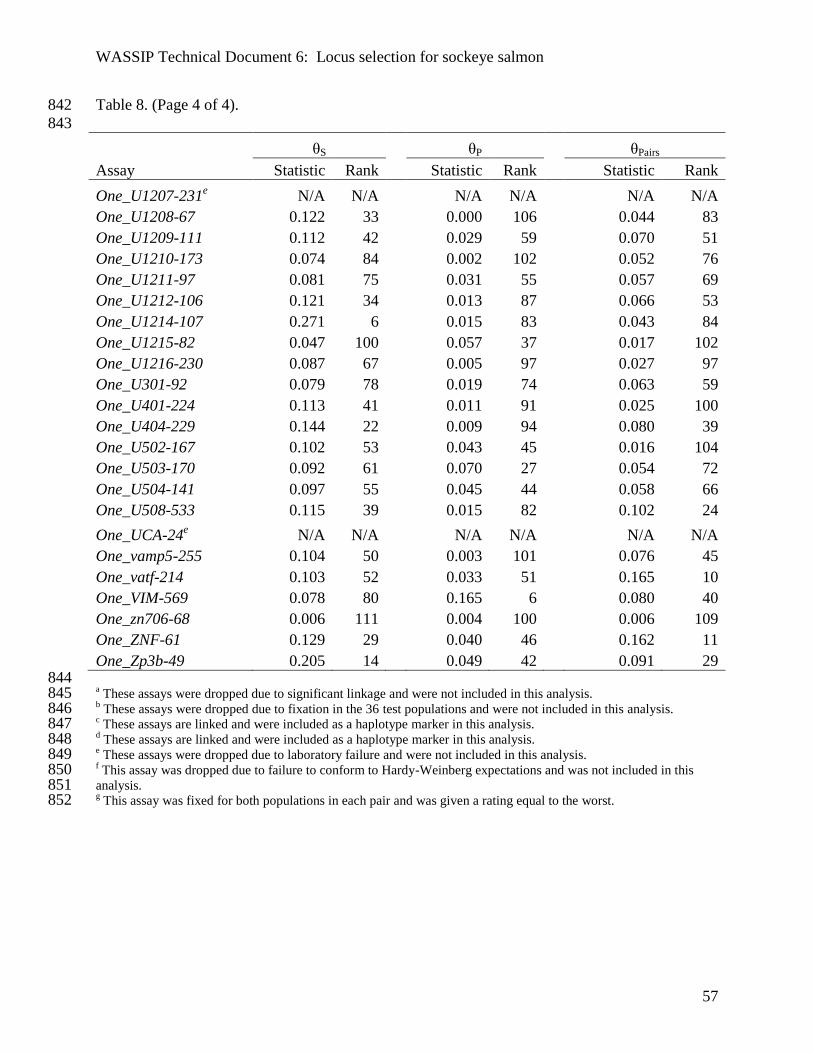
WASSIP Technical Document 6: Locus selection for sockeye salmon
57
Table 8. (Page 4 of 4). 842
843
θS θP θPairs
Assay Statistic Rank Statistic Rank Statistic Rank
One_U1207-231e N/A N/A
N/A N/A
N/A N/A
One_U1208-67 0.122 33
0.000 106
0.044 83
One_U1209-111 0.112 42
0.029 59
0.070 51
One_U1210-173 0.074 84
0.002 102
0.052 76
One_U1211-97 0.081 75
0.031 55
0.057 69
One_U1212-106 0.121 34
0.013 87
0.066 53
One_U1214-107 0.271 6
0.015 83
0.043 84
One_U1215-82 0.047 100
0.057 37
0.017 102
One_U1216-230 0.087 67
0.005 97
0.027 97
One_U301-92 0.079 78
0.019 74
0.063 59
One_U401-224 0.113 41
0.011 91
0.025 100
One_U404-229 0.144 22
0.009 94
0.080 39
One_U502-167 0.102 53
0.043 45
0.016 104
One_U503-170 0.092 61
0.070 27
0.054 72
One_U504-141 0.097 55
0.045 44
0.058 66
One_U508-533 0.115 39
0.015 82
0.102 24
One_UCA-24e N/A N/A
N/A N/A
N/A N/A
One_vamp5-255 0.104 50
0.003 101
0.076 45
One_vatf-214 0.103 52
0.033 51
0.165 10
One_VIM-569 0.078 80
0.165 6
0.080 40
One_zn706-68 0.006 111
0.004 100
0.006 109
One_ZNF-61 0.129 29
0.040 46
0.162 11
One_Zp3b-49 0.205 14 0.049 42 0.091 29 844 a These assays were dropped due to significant linkage and were not included in this analysis. 845
b These assays were dropped due to fixation in the 36 test populations and were not included in this analysis. 846
c These assays are linked and were included as a haplotype marker in this analysis. 847
d These assays are linked and were included as a haplotype marker in this analysis. 848
e These assays were dropped due to laboratory failure and were not included in this analysis. 849
f This assay was dropped due to failure to conform to Hardy-Weinberg expectations and was not included in this 850 analysis. 851 g This assay was fixed for both populations in each pair and was given a rating equal to the worst.852
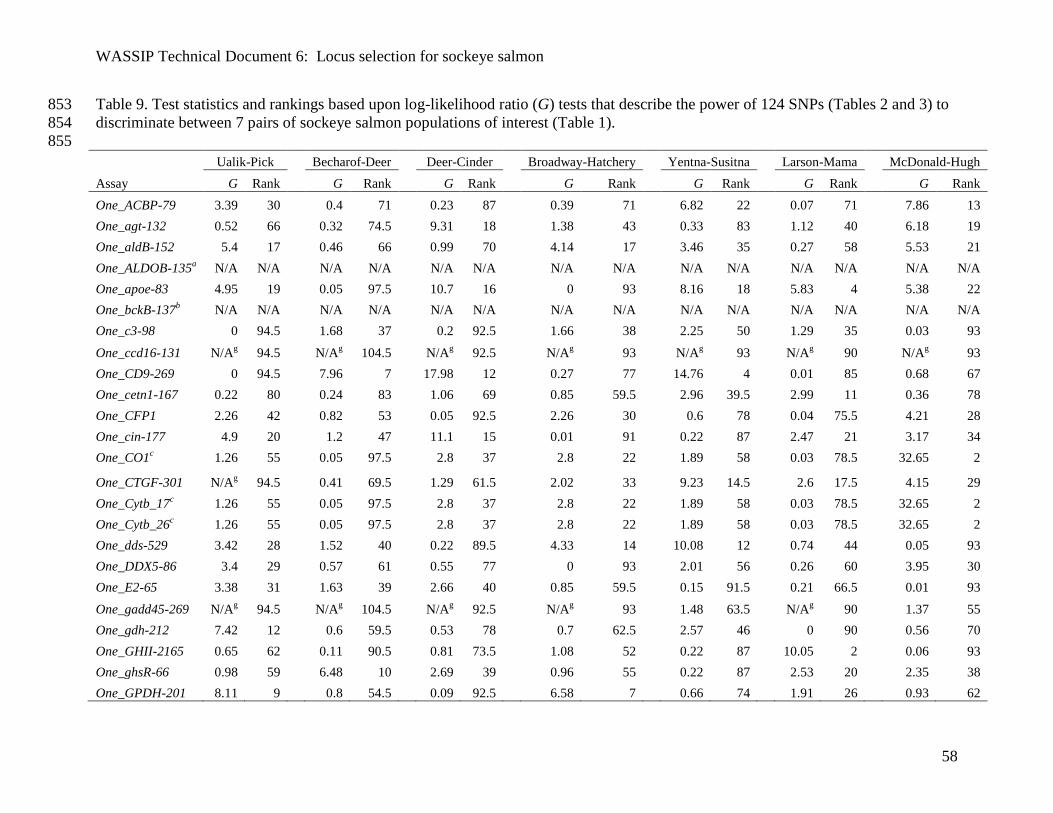
WASSIP Technical Document 6: Locus selection for sockeye salmon
58
Table 9. Test statistics and rankings based upon log-likelihood ratio (G) tests that describe the power of 124 SNPs (Tables 2 and 3) to 853
discriminate between 7 pairs of sockeye salmon populations of interest (Table 1). 854
855
Ualik-Pick
Becharof-Deer
Deer-Cinder
Broadway-Hatchery
Yentna-Susitna
Larson-Mama
McDonald-Hugh
Assay G Rank G Rank G Rank G Rank G Rank G Rank G Rank
One_ACBP-79 3.39 30
0.4 71
0.23 87
0.39 71
6.82 22
0.07 71
7.86 13
One_agt-132 0.52 66
0.32 74.5
9.31 18
1.38 43
0.33 83
1.12 40
6.18 19
One_aldB-152 5.4 17
0.46 66
0.99 70
4.14 17
3.46 35
0.27 58
5.53 21
One_ALDOB-135a N/A N/A
N/A N/A
N/A N/A
N/A N/A
N/A N/A
N/A N/A
N/A N/A
One_apoe-83 4.95 19
0.05 97.5
10.7 16
0 93
8.16 18
5.83 4
5.38 22
One_bckB-137b N/A N/A
N/A N/A
N/A N/A
N/A N/A
N/A N/A
N/A N/A
N/A N/A
One_c3-98 0 94.5
1.68 37
0.2 92.5
1.66 38
2.25 50
1.29 35
0.03 93
One_ccd16-131 N/Ag 94.5
N/Ag 104.5
N/Ag 92.5
N/Ag 93
N/Ag 93
N/Ag 90
N/Ag 93
One_CD9-269 0 94.5
7.96 7
17.98 12
0.27 77
14.76 4
0.01 85
0.68 67
One_cetn1-167 0.22 80
0.24 83
1.06 69
0.85 59.5
2.96 39.5
2.99 11
0.36 78
One_CFP1 2.26 42
0.82 53
0.05 92.5
2.26 30
0.6 78
0.04 75.5
4.21 28
One_cin-177 4.9 20
1.2 47
11.1 15
0.01 91
0.22 87
2.47 21
3.17 34
One_CO1c 1.26 55
0.05 97.5
2.8 37
2.8 22
1.89 58
0.03 78.5
32.65 2
One_CTGF-301 N/Ag 94.5
0.41 69.5
1.29 61.5
2.02 33
9.23 14.5
2.6 17.5
4.15 29
One_Cytb_17c 1.26 55
0.05 97.5
2.8 37
2.8 22
1.89 58
0.03 78.5
32.65 2
One_Cytb_26c 1.26 55
0.05 97.5
2.8 37
2.8 22
1.89 58
0.03 78.5
32.65 2
One_dds-529 3.42 28
1.52 40
0.22 89.5
4.33 14
10.08 12
0.74 44
0.05 93
One_DDX5-86 3.4 29
0.57 61
0.55 77
0 93
2.01 56
0.26 60
3.95 30
One_E2-65 3.38 31
1.63 39
2.66 40
0.85 59.5
0.15 91.5
0.21 66.5
0.01 93
One_gadd45-269 N/Ag 94.5
N/Ag 104.5
N/Ag 92.5
N/Ag 93
1.48 63.5
N/Ag 90
1.37 55
One_gdh-212 7.42 12
0.6 59.5
0.53 78
0.7 62.5
2.57 46
0 90
0.56 70
One_GHII-2165 0.65 62
0.11 90.5
0.81 73.5
1.08 52
0.22 87
10.05 2
0.06 93
One_ghsR-66 0.98 59
6.48 10
2.69 39
0.96 55
0.22 87
2.53 20
2.35 38
One_GPDH-201 8.11 9
0.8 54.5
0.09 92.5
6.58 7
0.66 74
1.91 26
0.93 62

WASSIP Technical Document 6: Locus selection for sockeye salmon
59
Table 9. (Page 2 of 6). 856
857
Ualik-Pick
Becharof-Deer
Deer-Cinder
Broadway-Hatchery
Yentna-Susitna
Larson-Mama
McDonald-Hugh
Assay G Rank G Rank G Rank G Rank G Rank G Rank G Rank
One_GPDH2-187 0.48 68
1.92 36
6.11 22
2.76 23
5.81 27.5
0.06 72.5
6.46 18
One_GPH-414a N/A N/A
N/A N/A
N/A N/A
N/A N/A
N/A N/A
N/A N/A
N/A N/A
One_GTHa 8.26 8
8.29 6
18.52 11
0.11 81
4.47 32
0 90
13.85 5
One_HGFA-49 0.46 69.5
0.38 72
3.5 32
5.73 8
6.52 24
0.54 49
8.89 11
One_HpaI-71 1.44 50
0.41 69.5
1.54 52
1.77 36
5 30
0.02 82
1.11 58.5
One_HpaI-99 0.2 82
1.19 48
2.54 42
1.01 54
0.37 81.5
1.34 32
3.81 32
One_hsc71-220 4.73 21
0.07 95
1.14 65
1.72 37
4.52 31
2.76 16
0.15 89.5
One_Hsp47 0.06 88
0.02 100
3.74 30
2.41 25
31.91 1
1.19 38
1.56 50
One_Ig-90 N/Ag 94.5
N/Ag 104.5
N/Ag 92.5
N/Ag 93
N/Ag 93
N/Ag 90
1.07 61
One_IL8r-362 5.12 18
30.05 2
34.25 4
3.85 18
1.83 59
0 90
2.1 43
One_ins-107 2.93 32
1.13 49.5
0 92.5
4.41 13
2.1 55
0.02 82
1.09 60
One_KCT1-453 0.03 89.5
2.89 21.5
3.34 34
1.14 50.5
3.78 34
4.55 7
0.13 91.5
One_KPNA-422 3.54 27
0.14 86
3.6 31
0.54 65
3.16 38
0.1 70
8.68 12
One_LEI-87 2.53 38
3.18 15
0.91 71
0.01 91
1.77 60.5
0.51 50
6.65 17
One_leptin-92b N/A N/A
N/A N/A
N/A N/A
N/A N/A
N/A N/A
N/A N/A
N/A N/A
One_lpp1-44 1.14 56
16.31 3
10.27 17
0.05 83
1 70
2.91 14
0.32 80
One_MARCKS-241 N/Ag 94.5
2.68 26.5
0 92.5
N/Ag 93
3.99 33
N/Ag 90
3.09 35
One_metA-253 N/Ag 94.5
1.34 45
1.37 58
N/Ag 93
2.23 51.5
5.96 3
4.67 26
One_MHC2_190d 20.19 3
158.28 1
37.4 3
53.39 2
9.29 13
14.01 1
37.13 1
One_MHC2_251d 20.19 3
158.28 1
37.4 3
53.39 2
9.29 13
14.01 1
37.13 1
One_Mkpro-129 7.57 11
0.52 63
1.47 53
3.81 19
0.03 93
1.71 28
0.3 81.5
One_ODC1-196 25.2 2
0.01 101.5
0.17 92.5
8.78 6
1.48 63.5
0.62 47
2.12 42
One_Ots208-234 0.99 58
1.21 46
0.52 79
4.22 15
2.8 43
0.33 55
0.02 93
One_Ots213-181 2.12 44
2.22 30.5
1.24 63
1.28 47
6.78 23
1.96 23
0.04 93
One_p53-534 N/Ag 94.5
2.89 21.5
1.41 54.5
N/Ag 93
N/Ag 93
N/Ag 90
0.39 76

WASSIP Technical Document 6: Locus selection for sockeye salmon
60
Table 9. (Page 3 of 6). 858
859
Ualik-Pick Becharof-Deer Deer-Cinder Broadway-Hatchery Yentna-Susitna Larson-Mama McDonald-Hugh
Assay G Rank G Rank G Rank G Rank G Rank G Rank G Rank
One_parp3-170b N/A N/A
N/A N/A
N/A N/A
N/A N/A
N/A N/A
N/A N/A
N/A N/A
One_pax7-248 0.15 84
2.84 24
0.81 73.5
1.88 35
9.05 16
1.03 42
0.07 93
One_PIP 0.56 64
0.64 56
23.14 9
0.02 88
2.79 44
0.35 54
3.89 31
One_ppie-74 N/Ag 94.5
2.78 25
1.32 60
1.39 41.5
0.01 93
N/Ag 90
0.23 85
One_PPM1K-118e N/A N/A
N/A N/A
N/A N/A
N/A N/A
N/A N/A
N/A N/A
N/A N/A
One_Prl2 0.66 61
0.11 90.5
6.86 20
0.04 85
0 93
0.72 45
0.41 73
One_psme2-354 0.01 92
7.71 8
15.93 13
4.91 12
0.16 90
0 90
10.57 6
One_rab1a-76 0.22 80
0 104.5
0.2 92.5
0.19 78
0.01 93
0.03 78.5
0 93
One_RAG1-103 2.87 33
1.35 43.5
1.08 67.5
4.15 16
14.11 6
1.51 29
1.27 57
One_RAG3-93 4.65 22
6.65 9
1.08 67.5
1.36 44
0.02 93
2.97 12.5
5.86 20
One_redd1-414 8.52 7
0.12 88.5
0.38 82
0.9 57.5
7.48 21
1.25 37
0.52 72
One_RFC2-102 1.82 46
2.92 19.5
1.2 64
0.01 91
17.87 2
0.03 78.5
9.33 10
One_RFC2-285 2.7 36
4.35 13.5
30.81 5
1.14 50.5
2.96 39.5
N/Ag 90
1.92 46
One_RH2op-395 0 94.5
0.36 73
1.4 56
N/Ag 93
1.31 66
N/Ag 90
7.22 16
One_rpo2j-261 4.38 23
1.48 41
1.36 59
1.15 49
10.98 10
0.6 48
0.12 93
One_sast-211 0.29 78
2.15 33
5.29 24
0 93
9.23 14.5
0.26 60
2.85 36
One_serpin-75 1.1 57
0.18 84.5
0.66 76
13.02 4
0 93
N/Ag 90
0.74 65
One_spf30-207 0.5 67
0 104.5
2.31 45.5
0 93
14.65 5
0.04 75.5
0.29 83
One_srp09-127 1.36 53
4.43 12
1.29 61.5
0.34 74
1.11 69
1.3 34
0.4 74.5
One_ssrd-135 1.28 54
3.1 17
0.9 72
1.34 45
5.28 29
1.86 27
4.71 25
One_STC-410 5.87 15
0.49 65
24.82 7
0.92 56
0.04 93
3.52 8
1.59 49
One_STR07 5.95 14
0.54 62
44.39 2
0.35 72.5
10.27 11
0.01 85
0.35 79
One_SUMO1-6 0.33 77
2.34 29
0.02 92.5
0.02 88
2.54 48
0.25 62
0.68 67
One_sys1-230 0.02 91
1.13 49.5
5.27 25
3.37 20
0 93
0.05 74
0.68 67
One_taf12-248 N/Ag 94.5
N/Ag 104.5
1.41 54.5
0.35 72.5
N/Ag 93
0.31 56
0.57 69
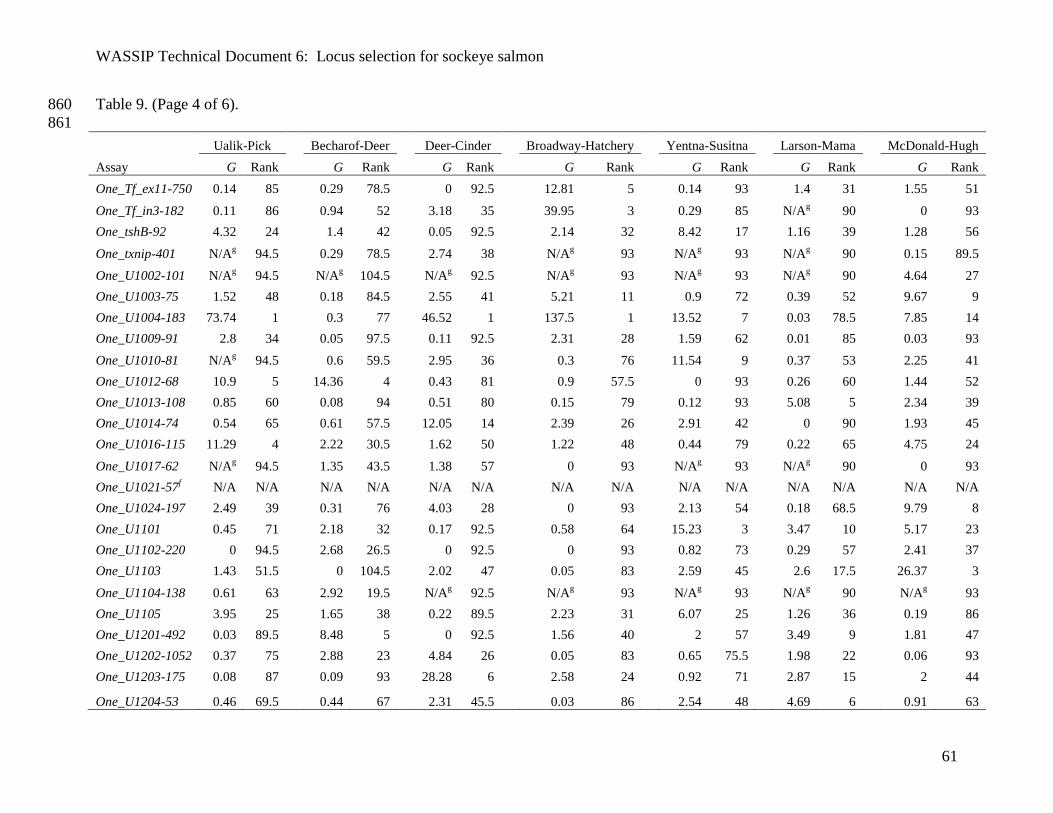
WASSIP Technical Document 6: Locus selection for sockeye salmon
61
Table 9. (Page 4 of 6). 860
861
Ualik-Pick
Becharof-Deer
Deer-Cinder
Broadway-Hatchery
Yentna-Susitna
Larson-Mama
McDonald-Hugh
Assay G Rank G Rank G Rank G Rank G Rank G Rank G Rank
One_Tf_ex11-750 0.14 85
0.29 78.5
0 92.5
12.81 5
0.14 93
1.4 31
1.55 51
One_Tf_in3-182 0.11 86
0.94 52
3.18 35
39.95 3
0.29 85
N/Ag 90
0 93
One_tshB-92 4.32 24
1.4 42
0.05 92.5
2.14 32
8.42 17
1.16 39
1.28 56
One_txnip-401 N/Ag 94.5
0.29 78.5
2.74 38
N/Ag 93
N/Ag 93
N/Ag 90
0.15 89.5
One_U1002-101 N/Ag 94.5
N/Ag 104.5
N/Ag 92.5
N/Ag 93
N/Ag 93
N/Ag 90
4.64 27
One_U1003-75 1.52 48
0.18 84.5
2.55 41
5.21 11
0.9 72
0.39 52
9.67 9
One_U1004-183 73.74 1
0.3 77
46.52 1
137.5 1
13.52 7
0.03 78.5
7.85 14
One_U1009-91 2.8 34
0.05 97.5
0.11 92.5
2.31 28
1.59 62
0.01 85
0.03 93
One_U1010-81 N/Ag 94.5
0.6 59.5
2.95 36
0.3 76
11.54 9
0.37 53
2.25 41
One_U1012-68 10.9 5
14.36 4
0.43 81
0.9 57.5
0 93
0.26 60
1.44 52
One_U1013-108 0.85 60
0.08 94
0.51 80
0.15 79
0.12 93
5.08 5
2.34 39
One_U1014-74 0.54 65
0.61 57.5
12.05 14
2.39 26
2.91 42
0 90
1.93 45
One_U1016-115 11.29 4
2.22 30.5
1.62 50
1.22 48
0.44 79
0.22 65
4.75 24
One_U1017-62 N/Ag 94.5
1.35 43.5
1.38 57
0 93
N/Ag 93
N/Ag 90
0 93
One_U1021-57f N/A N/A
N/A N/A
N/A N/A
N/A N/A
N/A N/A
N/A N/A
N/A N/A
One_U1024-197 2.49 39
0.31 76
4.03 28
0 93
2.13 54
0.18 68.5
9.79 8
One_U1101 0.45 71
2.18 32
0.17 92.5
0.58 64
15.23 3
3.47 10
5.17 23
One_U1102-220 0 94.5
2.68 26.5
0 92.5
0 93
0.82 73
0.29 57
2.41 37
One_U1103 1.43 51.5
0 104.5
2.02 47
0.05 83
2.59 45
2.6 17.5
26.37 3
One_U1104-138 0.61 63
2.92 19.5
N/Ag 92.5
N/Ag 93
N/Ag 93
N/Ag 90
N/Ag 93
One_U1105 3.95 25
1.65 38
0.22 89.5
2.23 31
6.07 25
1.26 36
0.19 86
One_U1201-492 0.03 89.5
8.48 5
0 92.5
1.56 40
2 57
3.49 9
1.81 47
One_U1202-1052 0.37 75
2.88 23
4.84 26
0.05 83
0.65 75.5
1.98 22
0.06 93
One_U1203-175 0.08 87
0.09 93
28.28 6
2.58 24
0.92 71
2.87 15
2 44
One_U1204-53 0.46 69.5 0.44 67 2.31 45.5 0.03 86 2.54 48 4.69 6 0.91 63
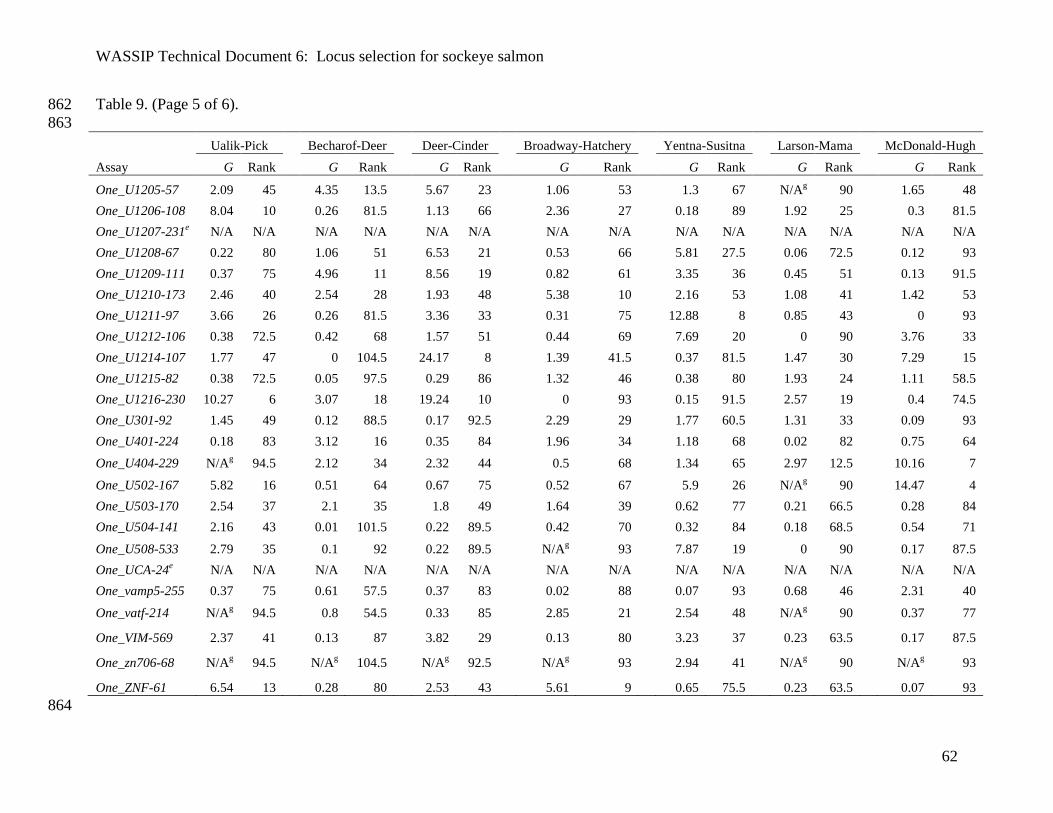
WASSIP Technical Document 6: Locus selection for sockeye salmon
62
Table 9. (Page 5 of 6). 862
863
Ualik-Pick Becharof-Deer Deer-Cinder Broadway-Hatchery Yentna-Susitna Larson-Mama McDonald-Hugh
Assay G Rank G Rank G Rank G Rank G Rank G Rank G Rank
One_U1205-57 2.09 45
4.35 13.5
5.67 23
1.06 53
1.3 67
N/Ag 90
1.65 48
One_U1206-108 8.04 10
0.26 81.5
1.13 66
2.36 27
0.18 89
1.92 25
0.3 81.5
One_U1207-231e N/A N/A
N/A N/A
N/A N/A
N/A N/A
N/A N/A
N/A N/A
N/A N/A
One_U1208-67 0.22 80
1.06 51
6.53 21
0.53 66
5.81 27.5
0.06 72.5
0.12 93
One_U1209-111 0.37 75
4.96 11
8.56 19
0.82 61
3.35 36
0.45 51
0.13 91.5
One_U1210-173 2.46 40
2.54 28
1.93 48
5.38 10
2.16 53
1.08 41
1.42 53
One_U1211-97 3.66 26
0.26 81.5
3.36 33
0.31 75
12.88 8
0.85 43
0 93
One_U1212-106 0.38 72.5
0.42 68
1.57 51
0.44 69
7.69 20
0 90
3.76 33
One_U1214-107 1.77 47
0 104.5
24.17 8
1.39 41.5
0.37 81.5
1.47 30
7.29 15
One_U1215-82 0.38 72.5
0.05 97.5
0.29 86
1.32 46
0.38 80
1.93 24
1.11 58.5
One_U1216-230 10.27 6
3.07 18
19.24 10
0 93
0.15 91.5
2.57 19
0.4 74.5
One_U301-92 1.45 49
0.12 88.5
0.17 92.5
2.29 29
1.77 60.5
1.31 33
0.09 93
One_U401-224 0.18 83
3.12 16
0.35 84
1.96 34
1.18 68
0.02 82
0.75 64
One_U404-229 N/Ag 94.5
2.12 34
2.32 44
0.5 68
1.34 65
2.97 12.5
10.16 7
One_U502-167 5.82 16
0.51 64
0.67 75
0.52 67
5.9 26
N/Ag 90
14.47 4
One_U503-170 2.54 37
2.1 35
1.8 49
1.64 39
0.62 77
0.21 66.5
0.28 84
One_U504-141 2.16 43
0.01 101.5
0.22 89.5
0.42 70
0.32 84
0.18 68.5
0.54 71
One_U508-533 2.79 35
0.1 92
0.22 89.5
N/Ag 93
7.87 19
0 90
0.17 87.5
One_UCA-24e N/A N/A
N/A N/A
N/A N/A
N/A N/A
N/A N/A
N/A N/A
N/A N/A
One_vamp5-255 0.37 75
0.61 57.5
0.37 83
0.02 88
0.07 93
0.68 46
2.31 40
One_vatf-214 N/Ag 94.5
0.8 54.5
0.33 85
2.85 21
2.54 48
N/Ag 90
0.37 77
One_VIM-569 2.37 41
0.13 87
3.82 29
0.13 80
3.23 37
0.23 63.5
0.17 87.5
One_zn706-68 N/Ag 94.5
N/Ag 104.5
N/Ag 92.5
N/Ag 93
2.94 41
N/Ag 90
N/Ag 93
One_ZNF-61 6.54 13 0.28 80 2.53 43 5.61 9 0.65 75.5 0.23 63.5 0.07 93
864

WASSIP Technical Document 6: Locus selection for sockeye salmon
63
Table 9. (Page 6 of 6). 865
866
Ualik-Pick Becharof-Deer Deer-Cinder Broadway-Hatchery Yentna-Susitna Larson-Mama McDonald-Hugh
Assay G Rank G Rank G Rank G Rank G Rank G Rank G Rank
One_Zp3b-49 1.43 51.5 0.32 74.5 4.22 27 0.7 62.5 2.23 51.5 N/Ag 90 1.41 54
867 a These assays were dropped due to significant linkage and were not included in this analysis. 868
b These assays were dropped due to fixation in the 36 test populations and were not included in this analysis. 869
c These assays are linked and were included as a haplotype marker in this analysis. 870
d These assays are linked and were included as a haplotype marker in this analysis. 871
e These assays were dropped due to laboratory failure and were not included in this analysis. 872
f This assay was dropped due to failure to conform to Hardy-Weinberg expectations and was not included in this analysis. 873
g Some SNPs were homozygous for both populations in some G tests and lack a test statistic. These SNPs were given a ranking equal to the worst rank for the 874
test in question. 875 876
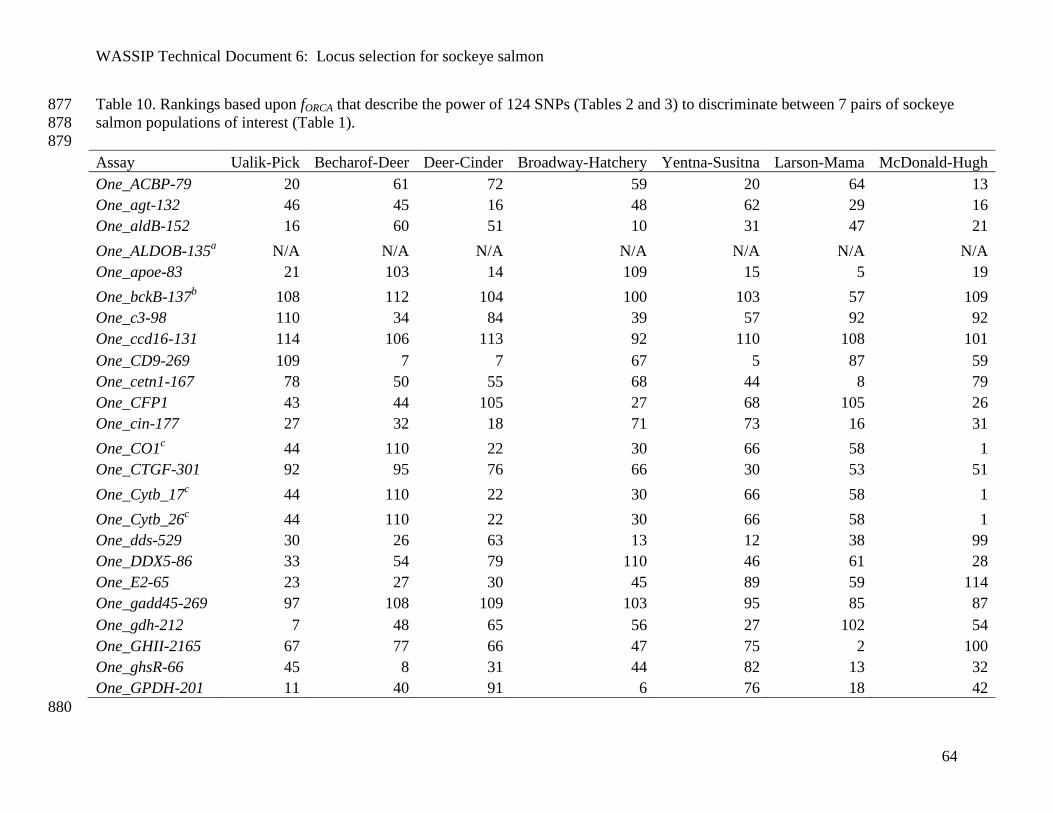
WASSIP Technical Document 6: Locus selection for sockeye salmon
64
Table 10. Rankings based upon fORCA that describe the power of 124 SNPs (Tables 2 and 3) to discriminate between 7 pairs of sockeye 877
salmon populations of interest (Table 1). 878
879
Assay Ualik-Pick Becharof-Deer Deer-Cinder Broadway-Hatchery Yentna-Susitna Larson-Mama McDonald-Hugh
One_ACBP-79 20 61 72 59 20 64 13
One_agt-132 46 45 16 48 62 29 16
One_aldB-152 16 60 51 10 31 47 21
One_ALDOB-135a N/A N/A N/A N/A N/A N/A N/A
One_apoe-83 21 103 14 109 15 5 19
One_bckB-137b 108 112 104 100 103 57 109
One_c3-98 110 34 84 39 57 92 92
One_ccd16-131 114 106 113 92 110 108 101
One_CD9-269 109 7 7 67 5 87 59
One_cetn1-167 78 50 55 68 44 8 79
One_CFP1 43 44 105 27 68 105 26
One_cin-177 27 32 18 71 73 16 31
One_CO1c 44 110 22 30 66 58 1
One_CTGF-301 92 95 76 66 30 53 51
One_Cytb_17c 44 110 22 30 66 58 1
One_Cytb_26c 44 110 22 30 66 58 1
One_dds-529 30 26 63 13 12 38 99
One_DDX5-86 33 54 79 110 46 61 28
One_E2-65 23 27 30 45 89 59 114
One_gadd45-269 97 108 109 103 95 85 87
One_gdh-212 7 48 65 56 27 102 54
One_GHII-2165 67 77 66 47 75 2 100
One_ghsR-66 45 8 31 44 82 13 32
One_GPDH-201 11 40 91 6 76 18 42
880
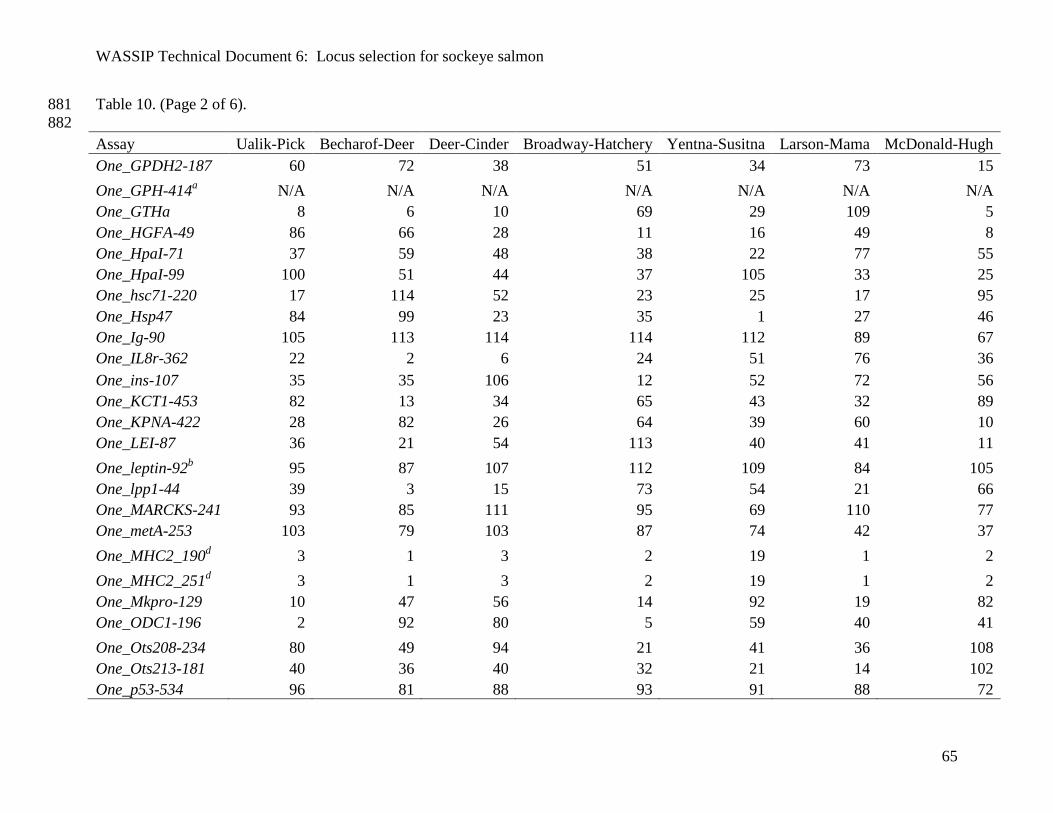
WASSIP Technical Document 6: Locus selection for sockeye salmon
65
Table 10. (Page 2 of 6). 881
882
Assay Ualik-Pick Becharof-Deer Deer-Cinder Broadway-Hatchery Yentna-Susitna Larson-Mama McDonald-Hugh
One_GPDH2-187 60 72 38 51 34 73 15
One_GPH-414a N/A N/A N/A N/A N/A N/A N/A
One_GTHa 8 6 10 69 29 109 5
One_HGFA-49 86 66 28 11 16 49 8
One_HpaI-71 37 59 48 38 22 77 55
One_HpaI-99 100 51 44 37 105 33 25
One_hsc71-220 17 114 52 23 25 17 95
One_Hsp47 84 99 23 35 1 27 46
One_Ig-90 105 113 114 114 112 89 67
One_IL8r-362 22 2 6 24 51 76 36
One_ins-107 35 35 106 12 52 72 56
One_KCT1-453 82 13 34 65 43 32 89
One_KPNA-422 28 82 26 64 39 60 10
One_LEI-87 36 21 54 113 40 41 11
One_leptin-92b 95 87 107 112 109 84 105
One_lpp1-44 39 3 15 73 54 21 66
One_MARCKS-241 93 85 111 95 69 110 77
One_metA-253 103 79 103 87 74 42 37
One_MHC2_190d 3 1 3 2 19 1 2
One_MHC2_251d 3 1 3 2 19 1 2
One_Mkpro-129 10 47 56 14 92 19 82
One_ODC1-196 2 92 80 5 59 40 41
One_Ots208-234 80 49 94 21 41 36 108
One_Ots213-181 40 36 40 32 21 14 102
One_p53-534 96 81 88 93 91 88 72
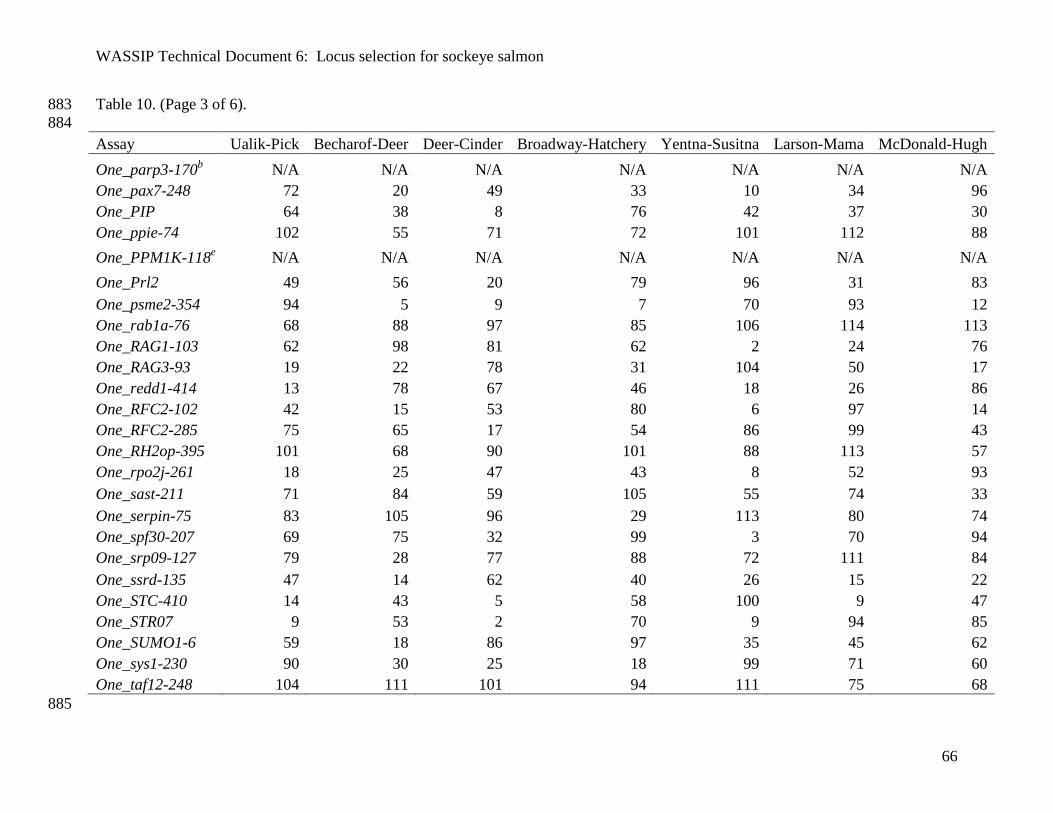
WASSIP Technical Document 6: Locus selection for sockeye salmon
66
Table 10. (Page 3 of 6). 883
884
Assay Ualik-Pick Becharof-Deer Deer-Cinder Broadway-Hatchery Yentna-Susitna Larson-Mama McDonald-Hugh
One_parp3-170b N/A N/A N/A N/A N/A N/A N/A
One_pax7-248 72 20 49 33 10 34 96
One_PIP 64 38 8 76 42 37 30
One_ppie-74 102 55 71 72 101 112 88
One_PPM1K-118e N/A N/A N/A N/A N/A N/A N/A
One_Prl2 49 56 20 79 96 31 83
One_psme2-354 94 5 9 7 70 93 12
One_rab1a-76 68 88 97 85 106 114 113
One_RAG1-103 62 98 81 62 2 24 76
One_RAG3-93 19 22 78 31 104 50 17
One_redd1-414 13 78 67 46 18 26 86
One_RFC2-102 42 15 53 80 6 97 14
One_RFC2-285 75 65 17 54 86 99 43
One_RH2op-395 101 68 90 101 88 113 57
One_rpo2j-261 18 25 47 43 8 52 93
One_sast-211 71 84 59 105 55 74 33
One_serpin-75 83 105 96 29 113 80 74
One_spf30-207 69 75 32 99 3 70 94
One_srp09-127 79 28 77 88 72 111 84
One_ssrd-135 47 14 62 40 26 15 22
One_STC-410 14 43 5 58 100 9 47
One_STR07 9 53 2 70 9 94 85
One_SUMO1-6 59 18 86 97 35 45 62
One_sys1-230 90 30 25 18 99 71 60
One_taf12-248 104 111 101 94 111 75 68
885
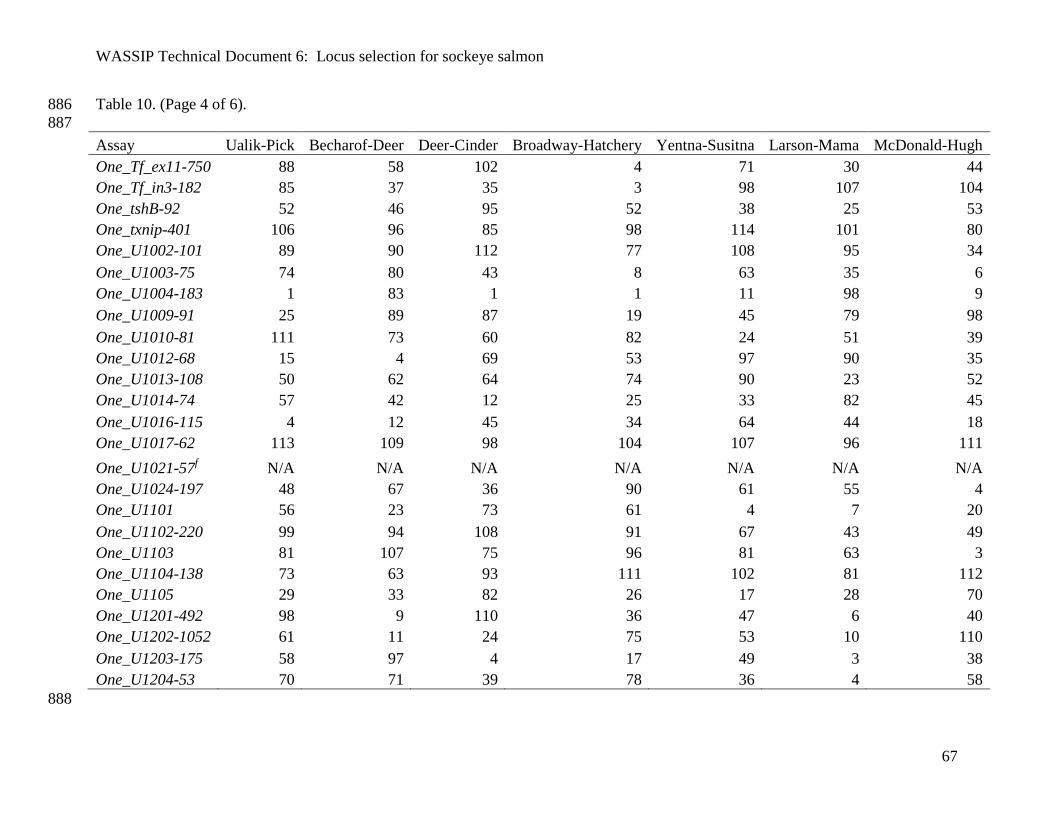
WASSIP Technical Document 6: Locus selection for sockeye salmon
67
Table 10. (Page 4 of 6). 886
887
Assay Ualik-Pick Becharof-Deer Deer-Cinder Broadway-Hatchery Yentna-Susitna Larson-Mama McDonald-Hugh
One_Tf_ex11-750 88 58 102 4 71 30 44
One_Tf_in3-182 85 37 35 3 98 107 104
One_tshB-92 52 46 95 52 38 25 53
One_txnip-401 106 96 85 98 114 101 80
One_U1002-101 89 90 112 77 108 95 34
One_U1003-75 74 80 43 8 63 35 6
One_U1004-183 1 83 1 1 11 98 9
One_U1009-91 25 89 87 19 45 79 98
One_U1010-81 111 73 60 82 24 51 39
One_U1012-68 15 4 69 53 97 90 35
One_U1013-108 50 62 64 74 90 23 52
One_U1014-74 57 42 12 25 33 82 45
One_U1016-115 4 12 45 34 64 44 18
One_U1017-62 113 109 98 104 107 96 111
One_U1021-57f N/A N/A N/A N/A N/A N/A N/A
One_U1024-197 48 67 36 90 61 55 4
One_U1101 56 23 73 61 4 7 20
One_U1102-220 99 94 108 91 67 43 49
One_U1103 81 107 75 96 81 63 3
One_U1104-138 73 63 93 111 102 81 112
One_U1105 29 33 82 26 17 28 70
One_U1201-492 98 9 110 36 47 6 40
One_U1202-1052 61 11 24 75 53 10 110
One_U1203-175 58 97 4 17 49 3 38
One_U1204-53 70 71 39 78 36 4 58
888
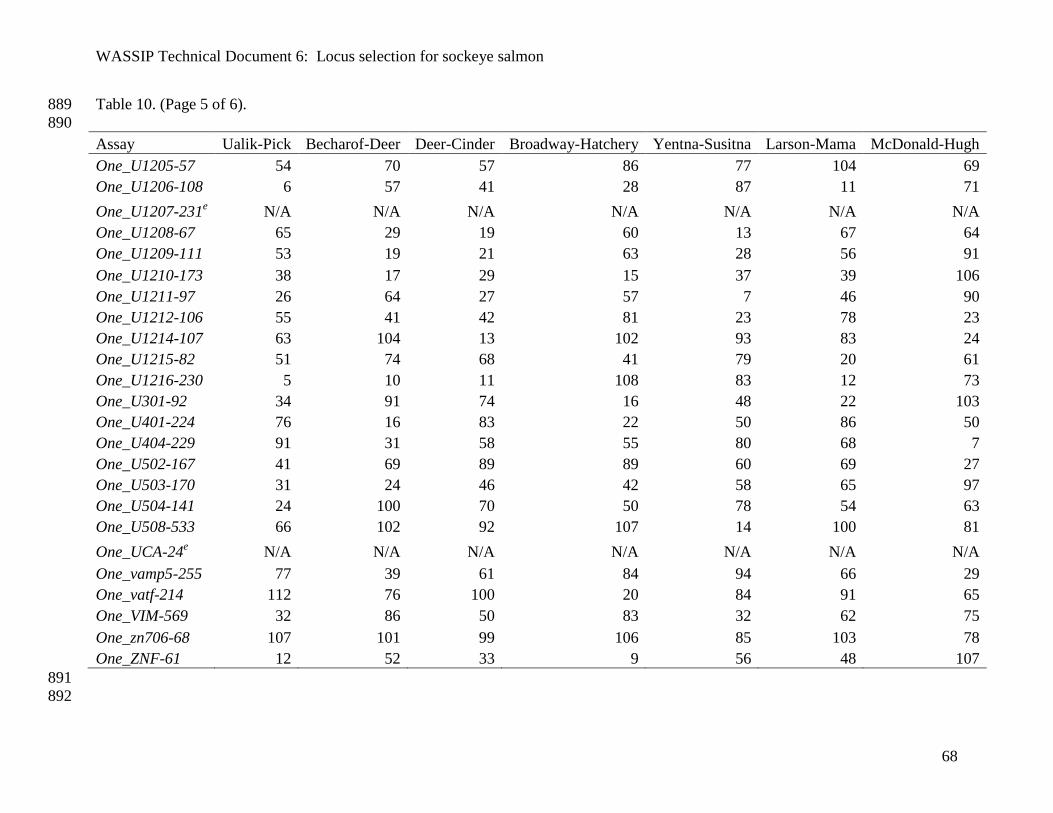
WASSIP Technical Document 6: Locus selection for sockeye salmon
68
Table 10. (Page 5 of 6). 889
890
Assay Ualik-Pick Becharof-Deer Deer-Cinder Broadway-Hatchery Yentna-Susitna Larson-Mama McDonald-Hugh
One_U1205-57 54 70 57 86 77 104 69
One_U1206-108 6 57 41 28 87 11 71
One_U1207-231e N/A N/A N/A N/A N/A N/A N/A
One_U1208-67 65 29 19 60 13 67 64
One_U1209-111 53 19 21 63 28 56 91
One_U1210-173 38 17 29 15 37 39 106
One_U1211-97 26 64 27 57 7 46 90
One_U1212-106 55 41 42 81 23 78 23
One_U1214-107 63 104 13 102 93 83 24
One_U1215-82 51 74 68 41 79 20 61
One_U1216-230 5 10 11 108 83 12 73
One_U301-92 34 91 74 16 48 22 103
One_U401-224 76 16 83 22 50 86 50
One_U404-229 91 31 58 55 80 68 7
One_U502-167 41 69 89 89 60 69 27
One_U503-170 31 24 46 42 58 65 97
One_U504-141 24 100 70 50 78 54 63
One_U508-533 66 102 92 107 14 100 81
One_UCA-24e N/A N/A N/A N/A N/A N/A N/A
One_vamp5-255 77 39 61 84 94 66 29
One_vatf-214 112 76 100 20 84 91 65
One_VIM-569 32 86 50 83 32 62 75
One_zn706-68 107 101 99 106 85 103 78
One_ZNF-61 12 52 33 9 56 48 107
891
892
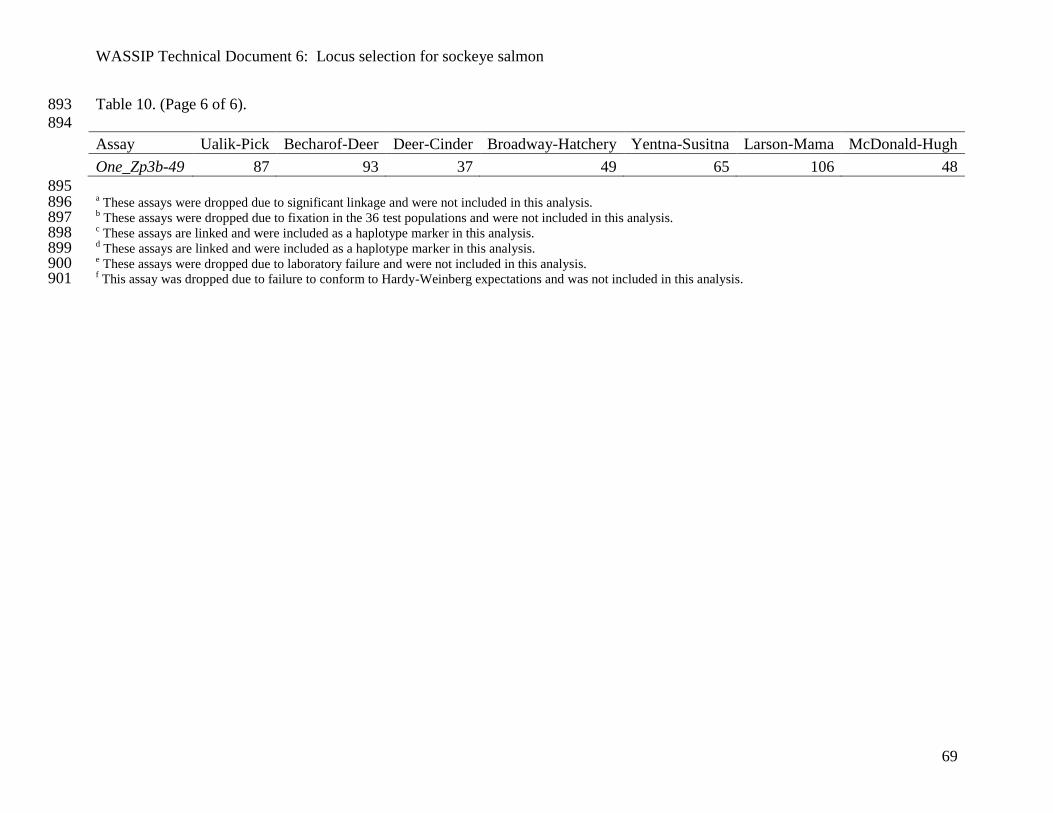
WASSIP Technical Document 6: Locus selection for sockeye salmon
69
Table 10. (Page 6 of 6). 893
894
Assay Ualik-Pick Becharof-Deer Deer-Cinder Broadway-Hatchery Yentna-Susitna Larson-Mama McDonald-Hugh
One_Zp3b-49 87 93 37 49 65 106 48
895 a These assays were dropped due to significant linkage and were not included in this analysis. 896
b These assays were dropped due to fixation in the 36 test populations and were not included in this analysis. 897
c These assays are linked and were included as a haplotype marker in this analysis. 898
d These assays are linked and were included as a haplotype marker in this analysis. 899
e These assays were dropped due to laboratory failure and were not included in this analysis. 900
f This assay was dropped due to failure to conform to Hardy-Weinberg expectations and was not included in this analysis. 901

WASSIP Technical Document 6: Locus selection for sockeye salmon
70
Table 11. Rankings based upon fORCA that describe the power of each of 124 SNPs (Tables 2 and 902
3) to discriminate among 36 sockeye salmon populations of interest (Table 1). 903
904
Assay fORCA rank Assay fORCA rank
One_ACBP-79 41
One_KCT1-453 83
One_agt-132 25
One_KPNA-422 58
One_aldB-152 47
One_LEI-87 17
One_ALDOB-135a N/A
One_leptin-92b 114
One_apoe-83 12
One_lpp1-44 26
One_bckB-137b 112
One_MARCKS-241 104
One_c3-98 78
One_metA-253 7
One_ccd16-131 113
One_MHC2_190d 1
One_CD9-269 74
One_MHC2_251d 1
One_cetn1-167 56
One_Mkpro-129 11
One_CFP1 16
One_ODC1-196 29
One_cin-177 18
One_Ots208-234 38
One_CO1c 2
One_Ots213-181 48
One_CTGF-301 105
One_p53-534 97
One_Cytb_17c 2
One_parp3-170b N/A
One_Cytb_26c 2
One_pax7-248 75
One_dds-529 79
One_PIP 84
One_DDX5-86 71
One_ppie-74 30
One_E2-65 86
One_PPM1K-118e N/A
One_gadd45-269 110
One_Prl2 43
One_gdh-212 42
One_psme2-354 21
One_GHII-2165 4
One_rab1a-76 73
One_ghsR-66 27
One_RAG1-103 90
One_GPDH-201 33
One_RAG3-93 93
One_GPDH2-187 63
One_redd1-414 6
One_GPH-414a N/A
One_RFC2-102 81
One_GTHa 28
One_RFC2-285 103
One_HGFA-49 69
One_RH2op-395 106
One_HpaI-71 14
One_rpo2j-261 64
One_HpaI-99 24
One_sast-211 100
One_hsc71-220 65
One_serpin-75 107
One_Hsp47 70
One_spf30-207 76
One_Ig-90 92
One_srp09-127 77
One_IL8r-362 62
One_ssrd-135 57
One_ins-107 61
One_STC-410 9
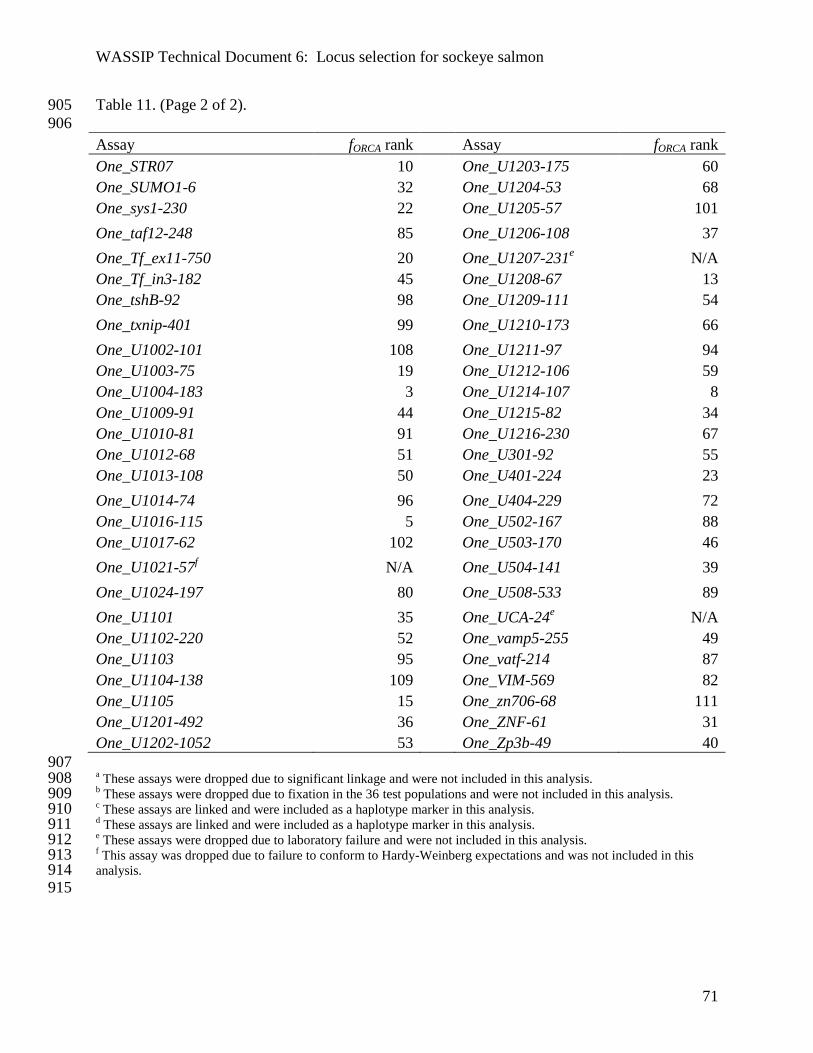
WASSIP Technical Document 6: Locus selection for sockeye salmon
71
Table 11. (Page 2 of 2). 905
906
Assay fORCA rank Assay fORCA rank
One_STR07 10
One_U1203-175 60
One_SUMO1-6 32
One_U1204-53 68
One_sys1-230 22
One_U1205-57 101
One_taf12-248 85
One_U1206-108 37
One_Tf_ex11-750 20
One_U1207-231e N/A
One_Tf_in3-182 45
One_U1208-67 13
One_tshB-92 98
One_U1209-111 54
One_txnip-401 99
One_U1210-173 66
One_U1002-101 108
One_U1211-97 94
One_U1003-75 19
One_U1212-106 59
One_U1004-183 3
One_U1214-107 8
One_U1009-91 44
One_U1215-82 34
One_U1010-81 91
One_U1216-230 67
One_U1012-68 51
One_U301-92 55
One_U1013-108 50
One_U401-224 23
One_U1014-74 96
One_U404-229 72
One_U1016-115 5
One_U502-167 88
One_U1017-62 102
One_U503-170 46
One_U1021-57f N/A
One_U504-141 39
One_U1024-197 80
One_U508-533 89
One_U1101 35
One_UCA-24e N/A
One_U1102-220 52
One_vamp5-255 49
One_U1103 95
One_vatf-214 87
One_U1104-138 109
One_VIM-569 82
One_U1105 15
One_zn706-68 111
One_U1201-492 36
One_ZNF-61 31
One_U1202-1052 53 One_Zp3b-49 40
907 a These assays were dropped due to significant linkage and were not included in this analysis. 908
b These assays were dropped due to fixation in the 36 test populations and were not included in this analysis. 909
c These assays are linked and were included as a haplotype marker in this analysis. 910
d These assays are linked and were included as a haplotype marker in this analysis. 911
e These assays were dropped due to laboratory failure and were not included in this analysis. 912
f This assay was dropped due to failure to conform to Hardy-Weinberg expectations and was not included in this 913 analysis. 914 915
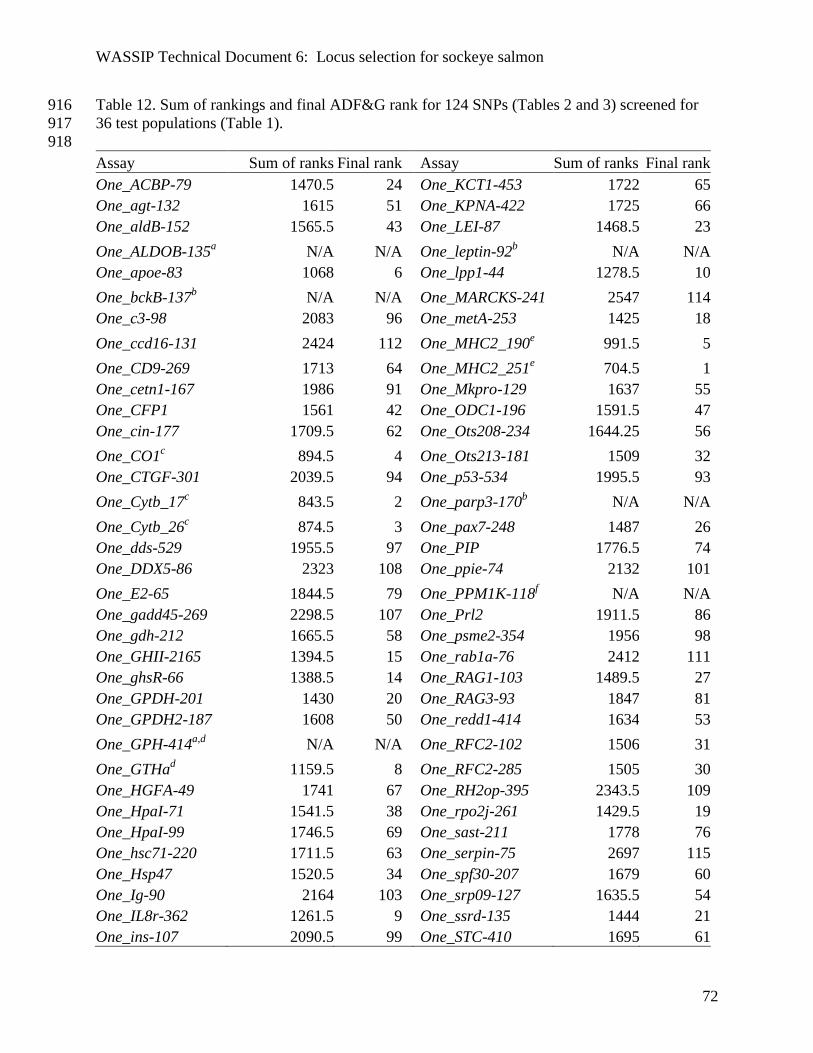
WASSIP Technical Document 6: Locus selection for sockeye salmon
72
Table 12. Sum of rankings and final ADF&G rank for 124 SNPs (Tables 2 and 3) screened for 916
36 test populations (Table 1). 917
918
Assay Sum of ranks Final rank Assay Sum of ranks Final rank
One_ACBP-79 1470.5 24 One_KCT1-453 1722 65
One_agt-132 1615 51 One_KPNA-422 1725 66
One_aldB-152 1565.5 43 One_LEI-87 1468.5 23
One_ALDOB-135a N/A N/A One_leptin-92
b N/A N/A
One_apoe-83 1068 6 One_lpp1-44 1278.5 10
One_bckB-137b N/A N/A One_MARCKS-241 2547 114
One_c3-98 2083 96 One_metA-253 1425 18
One_ccd16-131 2424 112 One_MHC2_190e 991.5 5
One_CD9-269 1713 64 One_MHC2_251e 704.5 1
One_cetn1-167 1986 91 One_Mkpro-129 1637 55
One_CFP1 1561 42 One_ODC1-196 1591.5 47
One_cin-177 1709.5 62 One_Ots208-234 1644.25 56
One_CO1c 894.5 4 One_Ots213-181 1509 32
One_CTGF-301 2039.5 94 One_p53-534 1995.5 93
One_Cytb_17c 843.5 2 One_parp3-170
b N/A N/A
One_Cytb_26c 874.5 3 One_pax7-248 1487 26
One_dds-529 1955.5 97 One_PIP 1776.5 74
One_DDX5-86 2323 108 One_ppie-74 2132 101
One_E2-65 1844.5 79 One_PPM1K-118f N/A N/A
One_gadd45-269 2298.5 107 One_Prl2 1911.5 86
One_gdh-212 1665.5 58 One_psme2-354 1956 98
One_GHII-2165 1394.5 15 One_rab1a-76 2412 111
One_ghsR-66 1388.5 14 One_RAG1-103 1489.5 27
One_GPDH-201 1430 20 One_RAG3-93 1847 81
One_GPDH2-187 1608 50 One_redd1-414 1634 53
One_GPH-414a,d
N/A N/A One_RFC2-102 1506 31
One_GTHad 1159.5 8 One_RFC2-285 1505 30
One_HGFA-49 1741 67 One_RH2op-395 2343.5 109
One_HpaI-71 1541.5 38 One_rpo2j-261 1429.5 19
One_HpaI-99 1746.5 69 One_sast-211 1778 76
One_hsc71-220 1711.5 63 One_serpin-75 2697 115
One_Hsp47 1520.5 34 One_spf30-207 1679 60
One_Ig-90 2164 103 One_srp09-127 1635.5 54
One_IL8r-362 1261.5 9 One_ssrd-135 1444 21
One_ins-107 2090.5 99 One_STC-410 1695 61

WASSIP Technical Document 6: Locus selection for sockeye salmon
73
Table 12. (Page 2 of 2). 919
920
Assay Sum of ranks Final rank Assay Sum of ranks Final rank
One_STR07 1528 36 One_U1203-175 1520 33
One_SUMO1-6 1858 82 One_U1204-53 1626 52
One_sys1-230 1844.5 80 One_U1205-57 2064 95
One_taf12-248 1915.5 87 One_U1206-108 1824 77
One_Tf_ex11-750 1538.5 37 One_U1207-231f N/A N/A
One_Tf_in3-182 1410 16 One_U1208-67 1543.5 39
One_tshB-92 1666 59 One_U1209-111 1291.5 11
One_txnip-401 1959 90 One_U1210-173 1646 57
One_U1002-101 2111.5 100 One_U1211-97 1992 92
One_U1003-75 1417.5 17 One_U1212-106 1758.5 72
One_U1004-183 1123 7 One_U1214-107 1550 41
One_U1009-91 1504.5 29 One_U1215-82 2393.5 110
One_U1010-81 1500.5 28 One_U1216-230 1831 78
One_U1012-68 1317.5 12 One_U301-92 1888 85
One_U1013-108 1876 83 One_U401-224 1753.5 70
One_U1014-74 1606.5 48 One_U404-229 1579 46
One_U1016-115 1334 13 One_U502-167 1471 25
One_U1017-62 2221.5 104 One_U503-170 1567.5 44
One_U1021-57g N/A N/A One_U504-141 1925.5 88
One_U1024-197 1607 49 One_U508-533 2286.5 106
One_U1101 1547 40 One_UCA-24f N/A N/A
One_U1102-220 2241 105 One_vamp5-255 1933 89
One_U1103 1579 45 One_vatf-214 1757.5 71
One_U1104-138 2151.5 102 One_VIM-569 1768.5 73
One_U1105 1521 35 One_zn706-68 2472 113
One_U1201-492 1884.5 84 One_ZNF-61 1457.5 22
One_U1202-1052 1741.5 68 One_Zp3b-49 1777 75 921 a These assays were dropped due to significant linkage and were not included in this analysis. 922
b These assays were dropped due to fixation in the 36 test populations and were not included in this analysis. 923
c These assays are linked and were included as a haplotype marker in some analyses. 924
d These two linked assays have nearly identical allele frequencies for the 36 test populations and are expected to 925
provide similar test statistics and rankings for all measures except laboratory performance. These were exchanged to 926 provide additional overlap among markers run by stakeholder laboratories (i.e., CDFO). See text for details. 927 e These assays are linked and were included as a haplotype marker in some analyses. 928
f These assays were dropped due to laboratory failure and were not included in this analysis. 929
g This assay was dropped due to failure to conform to Hardy-Weinberg expectations and was not included in this 930
analysis.931
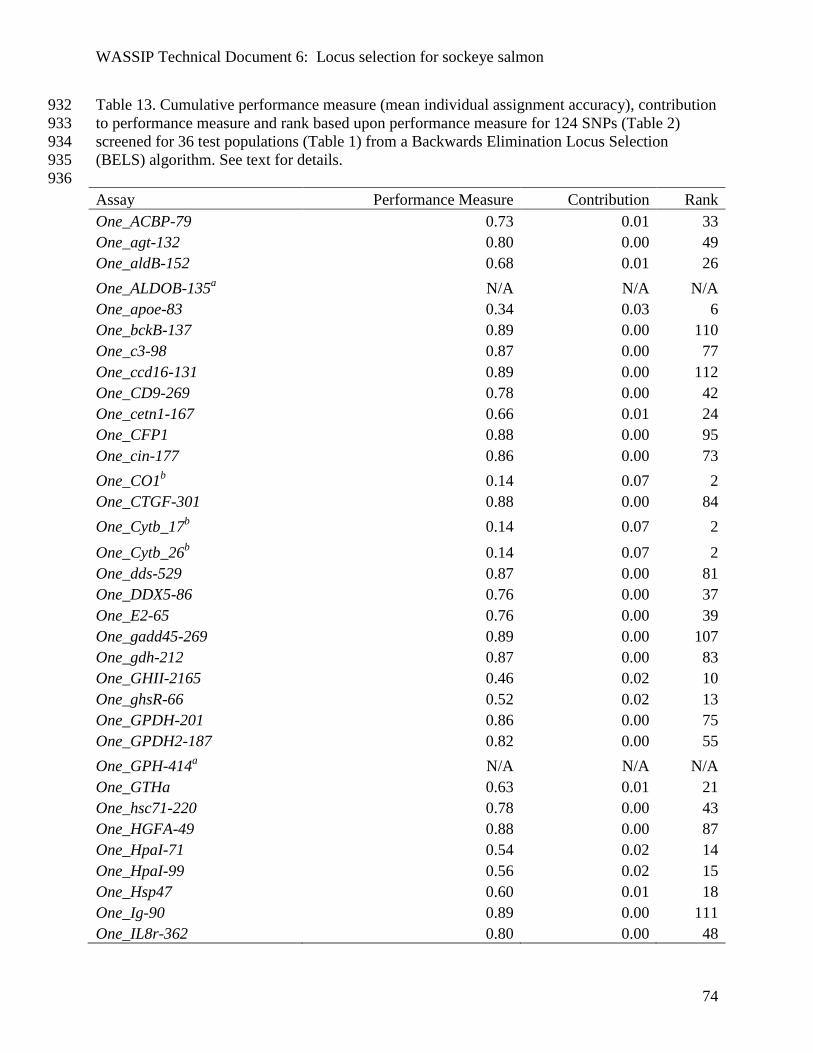
WASSIP Technical Document 6: Locus selection for sockeye salmon
74
Table 13. Cumulative performance measure (mean individual assignment accuracy), contribution 932
to performance measure and rank based upon performance measure for 124 SNPs (Table 2) 933
screened for 36 test populations (Table 1) from a Backwards Elimination Locus Selection 934
(BELS) algorithm. See text for details. 935
936
Assay Performance Measure Contribution Rank
One_ACBP-79 0.73 0.01 33
One_agt-132 0.80 0.00 49
One_aldB-152 0.68 0.01 26
One_ALDOB-135a N/A N/A N/A
One_apoe-83 0.34 0.03 6
One_bckB-137 0.89 0.00 110
One_c3-98 0.87 0.00 77
One_ccd16-131 0.89 0.00 112
One_CD9-269 0.78 0.00 42
One_cetn1-167 0.66 0.01 24
One_CFP1 0.88 0.00 95
One_cin-177 0.86 0.00 73
One_CO1b 0.14 0.07 2
One_CTGF-301 0.88 0.00 84
One_Cytb_17b 0.14 0.07 2
One_Cytb_26b 0.14 0.07 2
One_dds-529 0.87 0.00 81
One_DDX5-86 0.76 0.00 37
One_E2-65 0.76 0.00 39
One_gadd45-269 0.89 0.00 107
One_gdh-212 0.87 0.00 83
One_GHII-2165 0.46 0.02 10
One_ghsR-66 0.52 0.02 13
One_GPDH-201 0.86 0.00 75
One_GPDH2-187 0.82 0.00 55
One_GPH-414a N/A N/A N/A
One_GTHa 0.63 0.01 21
One_hsc71-220 0.78 0.00 43
One_HGFA-49 0.88 0.00 87
One_HpaI-71 0.54 0.02 14
One_HpaI-99 0.56 0.02 15
One_Hsp47 0.60 0.01 18
One_Ig-90 0.89 0.00 111
One_IL8r-362 0.80 0.00 48
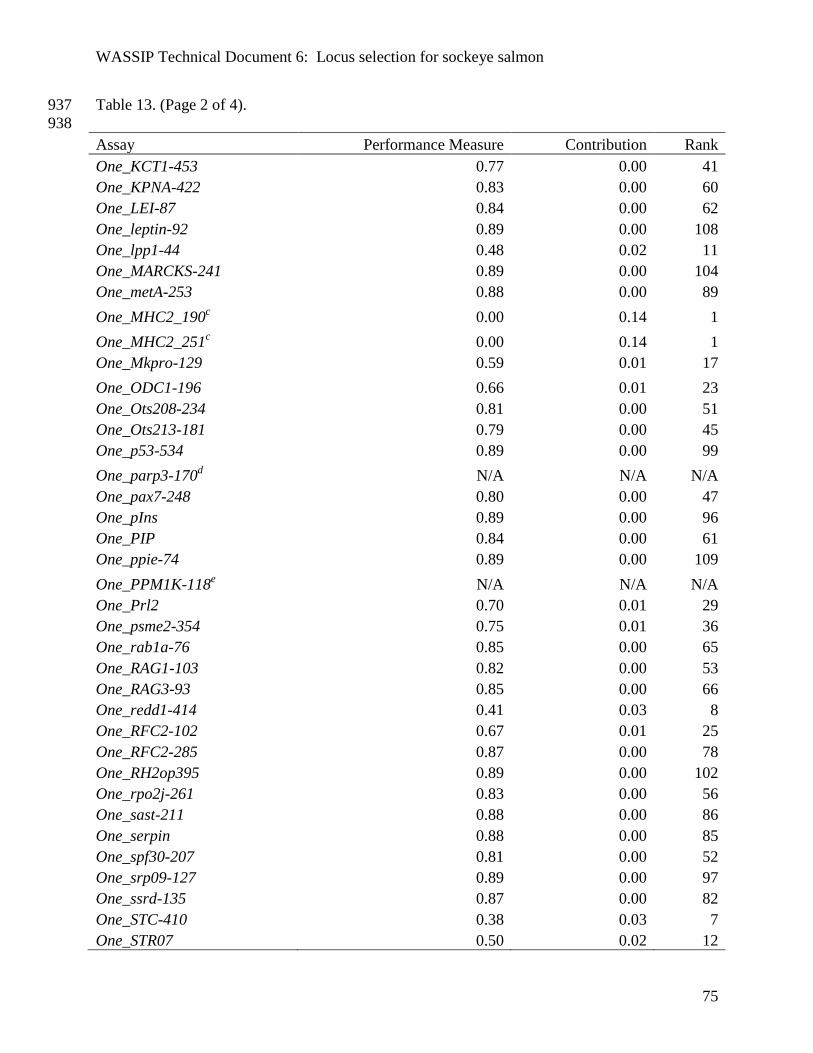
WASSIP Technical Document 6: Locus selection for sockeye salmon
75
Table 13. (Page 2 of 4). 937
938
Assay Performance Measure Contribution Rank
One_KCT1-453 0.77 0.00 41
One_KPNA-422 0.83 0.00 60
One_LEI-87 0.84 0.00 62
One_leptin-92 0.89 0.00 108
One_lpp1-44 0.48 0.02 11
One_MARCKS-241 0.89 0.00 104
One_metA-253 0.88 0.00 89
One_MHC2_190c 0.00 0.14 1
One_MHC2_251c 0.00 0.14 1
One_Mkpro-129 0.59 0.01 17
One_ODC1-196 0.66 0.01 23
One_Ots208-234 0.81 0.00 51
One_Ots213-181 0.79 0.00 45
One_p53-534 0.89 0.00 99
One_parp3-170d N/A N/A N/A
One_pax7-248 0.80 0.00 47
One_pIns 0.89 0.00 96
One_PIP 0.84 0.00 61
One_ppie-74 0.89 0.00 109
One_PPM1K-118e N/A N/A N/A
One_Prl2 0.70 0.01 29
One_psme2-354 0.75 0.01 36
One_rab1a-76 0.85 0.00 65
One_RAG1-103 0.82 0.00 53
One_RAG3-93 0.85 0.00 66
One_redd1-414 0.41 0.03 8
One_RFC2-102 0.67 0.01 25
One_RFC2-285 0.87 0.00 78
One_RH2op395 0.89 0.00 102
One_rpo2j-261 0.83 0.00 56
One_sast-211 0.88 0.00 86
One_serpin 0.88 0.00 85
One_spf30-207 0.81 0.00 52
One_srp09-127 0.89 0.00 97
One_ssrd-135 0.87 0.00 82
One_STC-410 0.38 0.03 7
One_STR07 0.50 0.02 12
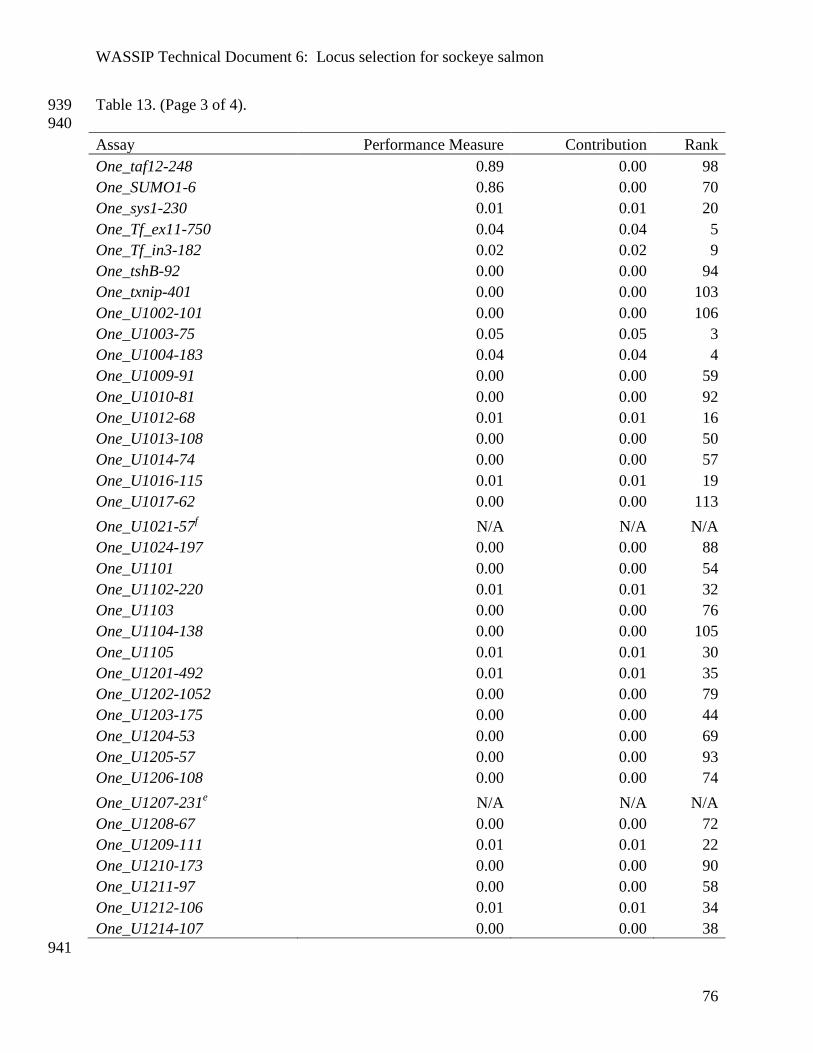
WASSIP Technical Document 6: Locus selection for sockeye salmon
76
Table 13. (Page 3 of 4). 939
940
Assay Performance Measure Contribution Rank
One_taf12-248 0.89 0.00 98
One_SUMO1-6 0.86 0.00 70
One_sys1-230 0.01 0.01 20
One_Tf_ex11-750 0.04 0.04 5
One_Tf_in3-182 0.02 0.02 9
One_tshB-92 0.00 0.00 94
One_txnip-401 0.00 0.00 103
One_U1002-101 0.00 0.00 106
One_U1003-75 0.05 0.05 3
One_U1004-183 0.04 0.04 4
One_U1009-91 0.00 0.00 59
One_U1010-81 0.00 0.00 92
One_U1012-68 0.01 0.01 16
One_U1013-108 0.00 0.00 50
One_U1014-74 0.00 0.00 57
One_U1016-115 0.01 0.01 19
One_U1017-62 0.00 0.00 113
One_U1021-57f N/A N/A N/A
One_U1024-197 0.00 0.00 88
One_U1101 0.00 0.00 54
One_U1102-220 0.01 0.01 32
One_U1103 0.00 0.00 76
One_U1104-138 0.00 0.00 105
One_U1105 0.01 0.01 30
One_U1201-492 0.01 0.01 35
One_U1202-1052 0.00 0.00 79
One_U1203-175 0.00 0.00 44
One_U1204-53 0.00 0.00 69
One_U1205-57 0.00 0.00 93
One_U1206-108 0.00 0.00 74
One_U1207-231e N/A N/A N/A
One_U1208-67 0.00 0.00 72
One_U1209-111 0.01 0.01 22
One_U1210-173 0.00 0.00 90
One_U1211-97 0.00 0.00 58
One_U1212-106 0.01 0.01 34
One_U1214-107 0.00 0.00 38
941
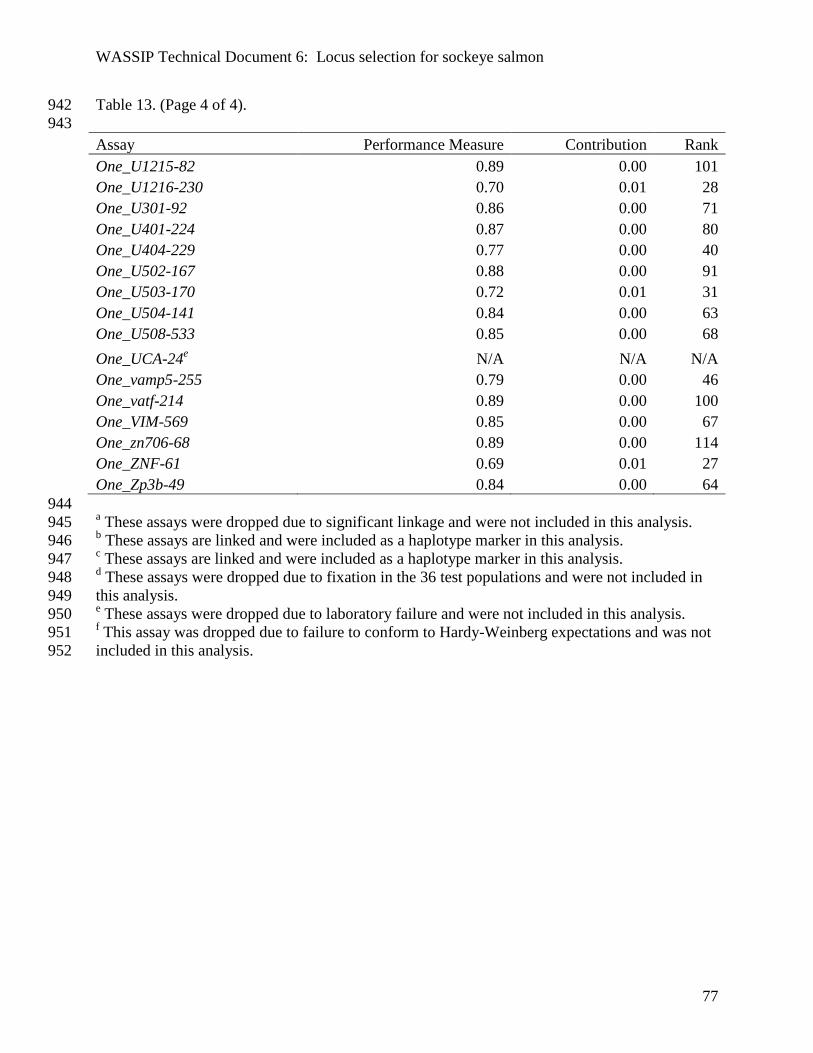
WASSIP Technical Document 6: Locus selection for sockeye salmon
77
Table 13. (Page 4 of 4). 942
943
Assay Performance Measure Contribution Rank
One_U1215-82 0.89 0.00 101
One_U1216-230 0.70 0.01 28
One_U301-92 0.86 0.00 71
One_U401-224 0.87 0.00 80
One_U404-229 0.77 0.00 40
One_U502-167 0.88 0.00 91
One_U503-170 0.72 0.01 31
One_U504-141 0.84 0.00 63
One_U508-533 0.85 0.00 68
One_UCA-24e N/A N/A N/A
One_vamp5-255 0.79 0.00 46
One_vatf-214 0.89 0.00 100
One_VIM-569 0.85 0.00 67
One_zn706-68 0.89 0.00 114
One_ZNF-61 0.69 0.01 27
One_Zp3b-49 0.84 0.00 64
944 a These assays were dropped due to significant linkage and were not included in this analysis. 945
b These assays are linked and were included as a haplotype marker in this analysis. 946
c These assays are linked and were included as a haplotype marker in this analysis. 947
d These assays were dropped due to fixation in the 36 test populations and were not included in 948
this analysis. 949 e These assays were dropped due to laboratory failure and were not included in this analysis. 950
f This assay was dropped due to failure to conform to Hardy-Weinberg expectations and was not 951
included in this analysis. 952
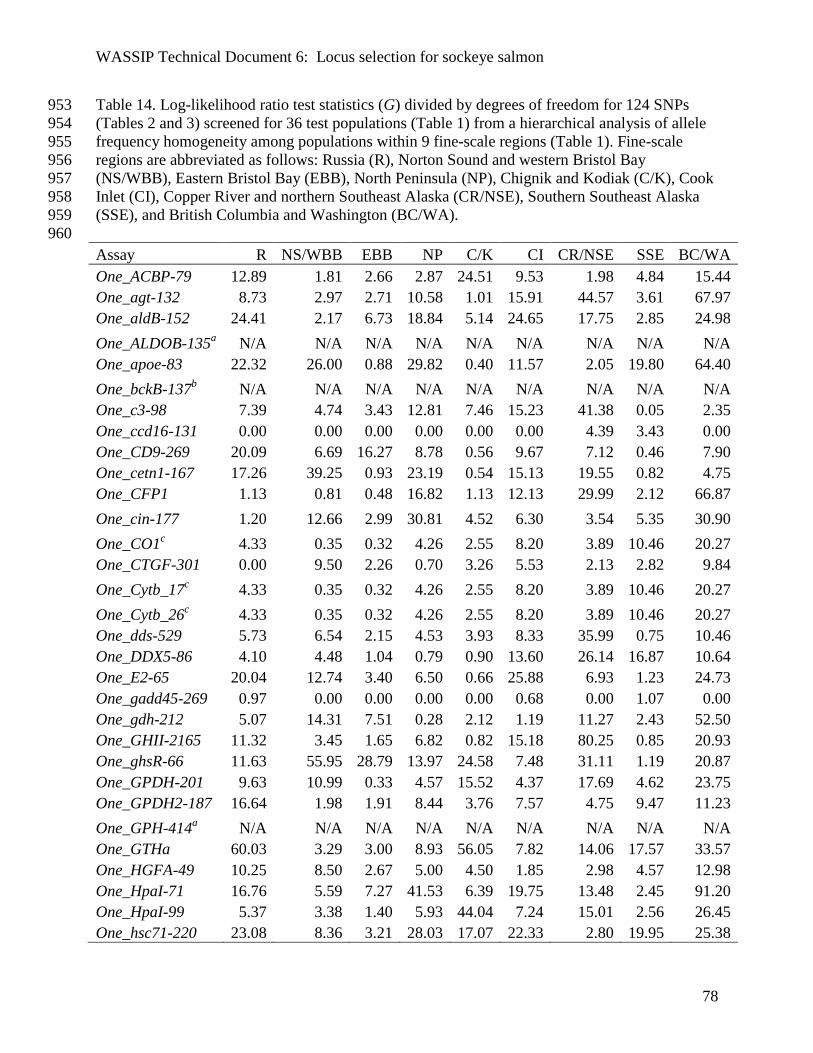
WASSIP Technical Document 6: Locus selection for sockeye salmon
78
Table 14. Log-likelihood ratio test statistics (G) divided by degrees of freedom for 124 SNPs 953
(Tables 2 and 3) screened for 36 test populations (Table 1) from a hierarchical analysis of allele 954
frequency homogeneity among populations within 9 fine-scale regions (Table 1). Fine-scale 955
regions are abbreviated as follows: Russia (R), Norton Sound and western Bristol Bay 956
(NS/WBB), Eastern Bristol Bay (EBB), North Peninsula (NP), Chignik and Kodiak (C/K), Cook 957
Inlet (CI), Copper River and northern Southeast Alaska (CR/NSE), Southern Southeast Alaska 958
(SSE), and British Columbia and Washington (BC/WA). 959
960
Assay R NS/WBB EBB NP C/K CI CR/NSE SSE BC/WA
One_ACBP-79 12.89 1.81 2.66 2.87 24.51 9.53 1.98 4.84 15.44
One_agt-132 8.73 2.97 2.71 10.58 1.01 15.91 44.57 3.61 67.97
One_aldB-152 24.41 2.17 6.73 18.84 5.14 24.65 17.75 2.85 24.98
One_ALDOB-135a N/A N/A N/A N/A N/A N/A N/A N/A N/A
One_apoe-83 22.32 26.00 0.88 29.82 0.40 11.57 2.05 19.80 64.40
One_bckB-137b N/A N/A N/A N/A N/A N/A N/A N/A N/A
One_c3-98 7.39 4.74 3.43 12.81 7.46 15.23 41.38 0.05 2.35
One_ccd16-131 0.00 0.00 0.00 0.00 0.00 0.00 4.39 3.43 0.00
One_CD9-269 20.09 6.69 16.27 8.78 0.56 9.67 7.12 0.46 7.90
One_cetn1-167 17.26 39.25 0.93 23.19 0.54 15.13 19.55 0.82 4.75
One_CFP1 1.13 0.81 0.48 16.82 1.13 12.13 29.99 2.12 66.87
One_cin-177 1.20 12.66 2.99 30.81 4.52 6.30 3.54 5.35 30.90
One_CO1c 4.33 0.35 0.32 4.26 2.55 8.20 3.89 10.46 20.27
One_CTGF-301 0.00 9.50 2.26 0.70 3.26 5.53 2.13 2.82 9.84
One_Cytb_17c 4.33 0.35 0.32 4.26 2.55 8.20 3.89 10.46 20.27
One_Cytb_26c 4.33 0.35 0.32 4.26 2.55 8.20 3.89 10.46 20.27
One_dds-529 5.73 6.54 2.15 4.53 3.93 8.33 35.99 0.75 10.46
One_DDX5-86 4.10 4.48 1.04 0.79 0.90 13.60 26.14 16.87 10.64
One_E2-65 20.04 12.74 3.40 6.50 0.66 25.88 6.93 1.23 24.73
One_gadd45-269 0.97 0.00 0.00 0.00 0.00 0.68 0.00 1.07 0.00
One_gdh-212 5.07 14.31 7.51 0.28 2.12 1.19 11.27 2.43 52.50
One_GHII-2165 11.32 3.45 1.65 6.82 0.82 15.18 80.25 0.85 20.93
One_ghsR-66 11.63 55.95 28.79 13.97 24.58 7.48 31.11 1.19 20.87
One_GPDH-201 9.63 10.99 0.33 4.57 15.52 4.37 17.69 4.62 23.75
One_GPDH2-187 16.64 1.98 1.91 8.44 3.76 7.57 4.75 9.47 11.23
One_GPH-414a N/A N/A N/A N/A N/A N/A N/A N/A N/A
One_GTHa 60.03 3.29 3.00 8.93 56.05 7.82 14.06 17.57 33.57
One_HGFA-49 10.25 8.50 2.67 5.00 4.50 1.85 2.98 4.57 12.98
One_HpaI-71 16.76 5.59 7.27 41.53 6.39 19.75 13.48 2.45 91.20
One_HpaI-99 5.37 3.38 1.40 5.93 44.04 7.24 15.01 2.56 26.45
One_hsc71-220 23.08 8.36 3.21 28.03 17.07 22.33 2.80 19.95 25.38
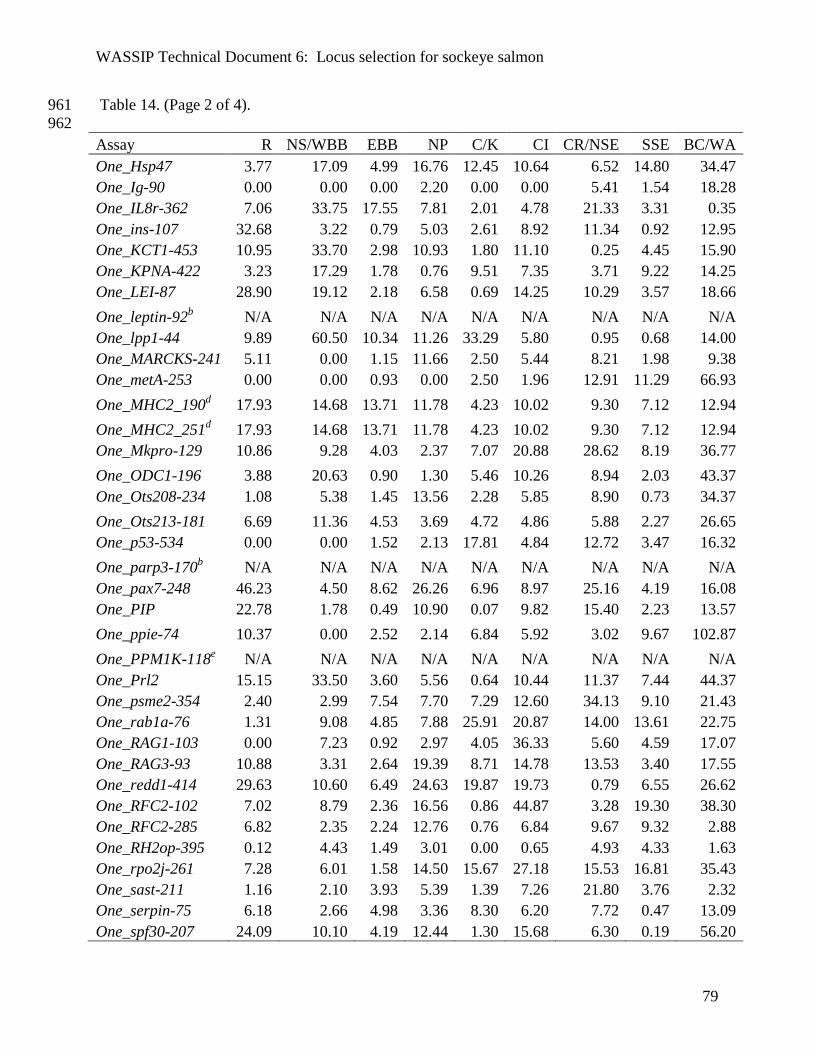
WASSIP Technical Document 6: Locus selection for sockeye salmon
79
Table 14. (Page 2 of 4). 961
962
Assay R NS/WBB EBB NP C/K CI CR/NSE SSE BC/WA
One_Hsp47 3.77 17.09 4.99 16.76 12.45 10.64 6.52 14.80 34.47
One_Ig-90 0.00 0.00 0.00 2.20 0.00 0.00 5.41 1.54 18.28
One_IL8r-362 7.06 33.75 17.55 7.81 2.01 4.78 21.33 3.31 0.35
One_ins-107 32.68 3.22 0.79 5.03 2.61 8.92 11.34 0.92 12.95
One_KCT1-453 10.95 33.70 2.98 10.93 1.80 11.10 0.25 4.45 15.90
One_KPNA-422 3.23 17.29 1.78 0.76 9.51 7.35 3.71 9.22 14.25
One_LEI-87 28.90 19.12 2.18 6.58 0.69 14.25 10.29 3.57 18.66
One_leptin-92b N/A N/A N/A N/A N/A N/A N/A N/A N/A
One_lpp1-44 9.89 60.50 10.34 11.26 33.29 5.80 0.95 0.68 14.00
One_MARCKS-241 5.11 0.00 1.15 11.66 2.50 5.44 8.21 1.98 9.38
One_metA-253 0.00 0.00 0.93 0.00 2.50 1.96 12.91 11.29 66.93
One_MHC2_190d 17.93 14.68 13.71 11.78 4.23 10.02 9.30 7.12 12.94
One_MHC2_251d 17.93 14.68 13.71 11.78 4.23 10.02 9.30 7.12 12.94
One_Mkpro-129 10.86 9.28 4.03 2.37 7.07 20.88 28.62 8.19 36.77
One_ODC1-196 3.88 20.63 0.90 1.30 5.46 10.26 8.94 2.03 43.37
One_Ots208-234 1.08 5.38 1.45 13.56 2.28 5.85 8.90 0.73 34.37
One_Ots213-181 6.69 11.36 4.53 3.69 4.72 4.86 5.88 2.27 26.65
One_p53-534 0.00 0.00 1.52 2.13 17.81 4.84 12.72 3.47 16.32
One_parp3-170b N/A N/A N/A N/A N/A N/A N/A N/A N/A
One_pax7-248 46.23 4.50 8.62 26.26 6.96 8.97 25.16 4.19 16.08
One_PIP 22.78 1.78 0.49 10.90 0.07 9.82 15.40 2.23 13.57
One_ppie-74 10.37 0.00 2.52 2.14 6.84 5.92 3.02 9.67 102.87
One_PPM1K-118e N/A N/A N/A N/A N/A N/A N/A N/A N/A
One_Prl2 15.15 33.50 3.60 5.56 0.64 10.44 11.37 7.44 44.37
One_psme2-354 2.40 2.99 7.54 7.70 7.29 12.60 34.13 9.10 21.43
One_rab1a-76 1.31 9.08 4.85 7.88 25.91 20.87 14.00 13.61 22.75
One_RAG1-103 0.00 7.23 0.92 2.97 4.05 36.33 5.60 4.59 17.07
One_RAG3-93 10.88 3.31 2.64 19.39 8.71 14.78 13.53 3.40 17.55
One_redd1-414 29.63 10.60 6.49 24.63 19.87 19.73 0.79 6.55 26.62
One_RFC2-102 7.02 8.79 2.36 16.56 0.86 44.87 3.28 19.30 38.30
One_RFC2-285 6.82 2.35 2.24 12.76 0.76 6.84 9.67 9.32 2.88
One_RH2op-395 0.12 4.43 1.49 3.01 0.00 0.65 4.93 4.33 1.63
One_rpo2j-261 7.28 6.01 1.58 14.50 15.67 27.18 15.53 16.81 35.43
One_sast-211 1.16 2.10 3.93 5.39 1.39 7.26 21.80 3.76 2.32
One_serpin-75 6.18 2.66 4.98 3.36 8.30 6.20 7.72 0.47 13.09
One_spf30-207 24.09 10.10 4.19 12.44 1.30 15.68 6.30 0.19 56.20

WASSIP Technical Document 6: Locus selection for sockeye salmon
80
Table 14. (Page 3 of 4). 963
964
Assay R NS/WBB EBB NP C/K CI CR/NSE SSE BC/WA
One_srp09-127 4.51 0.81 4.80 6.99 1.19 4.52 9.87 0.77 10.54
One_ssrd-135 7.13 9.21 2.37 19.05 2.98 5.07 20.38 9.98 19.79
One_STC-410 27.25 8.26 19.24 26.89 3.60 11.39 0.43 39.58 1.43
One_STR07 3.39 5.54 10.34 3.50 1.66 15.12 54.10 24.02 27.15
One_SUMO1-6 22.02 18.09 1.64 3.01 0.01 4.39 4.74 0.65 24.43
One_sys1-230 36.93 2.86 4.12 13.53 3.74 5.66 29.15 0.36 8.88
One_taf12-248 0.92 1.45 2.87 0.81 3.86 1.82 6.66 1.30 11.92
One_Tf_ex11-750 45.93 15.14 8.82 19.24 6.86 21.73 7.87 2.94 9.74
One_Tf_in3-182 2.75 2.88 17.15 11.36 22.07 2.72 2.80 0.03 23.19
One_tshB-92 7.64 31.63 0.50 1.58 1.67 9.93 5.93 0.77 8.73
One_txnip-401 0.00 0.91 1.06 0.00 0.00 0.65 13.36 13.63 7.38
One_U1002-101 0.00 0.00 0.00 0.00 0.00 0.00 7.96 8.60 0.00
One_U1003-75 58.23 6.22 3.39 11.79 14.06 18.25 14.33 6.11 20.80
One_U1004-183 27.21 24.10 1.91 14.74 74.95 68.95 20.16 5.87 22.06
One_U1009-91 18.37 11.24 7.64 15.54 2.78 3.02 30.25 15.31 33.67
One_U1010-81 7.34 0.00 6.05 0.26 2.53 7.36 4.30 6.96 19.85
One_U1012-68 14.50 13.21 11.78 0.09 5.07 35.02 39.50 5.42 48.40
One_U1013-108 23.55 0.56 2.77 11.14 1.35 13.98 2.26 25.82 13.63
One_U1014-74 8.18 9.69 2.53 7.98 4.21 7.77 6.85 1.01 17.62
One_U1016-115 38.40 7.13 2.72 5.11 11.40 18.82 26.83 16.03 36.37
One_U1017-62 5.54 0.00 0.91 2.20 0.68 12.27 5.68 1.64 11.22
One_U1021-57f N/A N/A N/A N/A N/A N/A N/A N/A N/A
One_U1024-197 10.94 4.51 1.50 5.51 0.49 2.21 12.96 9.64 32.59
One_U1101 13.18 7.55 7.30 2.21 2.73 7.11 4.35 10.77 74.97
One_U1102-220 8.86 4.16 14.34 19.23 6.28 8.19 0.37 9.31 10.15
One_U1103 6.32 0.82 0.92 4.41 3.48 2.37 36.34 19.26 10.94
One_U1104-138 0.00 7.32 1.89 1.10 0.00 0.00 0.00 0.00 0.00
One_U1105 32.03 17.16 11.44 7.54 1.33 26.95 3.65 8.15 8.00
One_U1201-492 22.33 9.76 12.18 7.78 10.80 13.86 3.10 2.54 75.70
One_U1202-1052 33.23 5.67 3.97 4.05 0.92 11.92 2.67 0.28 18.21
One_U1203-175 12.56 1.97 0.39 0.24 3.79 14.07 0.85 16.19 17.19
One_U1204-53 7.83 11.95 1.28 1.74 0.98 17.05 0.22 15.51 14.31
One_U1205-57 2.63 3.13 6.25 1.00 8.75 2.51 26.65 3.86 7.50
One_U1206-108 41.67 9.01 0.59 1.23 1.35 6.19 21.16 25.49 26.41
One_U1207-231e N/A N/A N/A N/A N/A N/A N/A N/A N/A
One_U1208-67 3.36 7.40 3.09 13.18 16.55 15.60 31.43 0.07 24.71
One_U1209-111 1.38 30.75 6.80 13.85 14.12 4.00 13.92 0.51 19.76
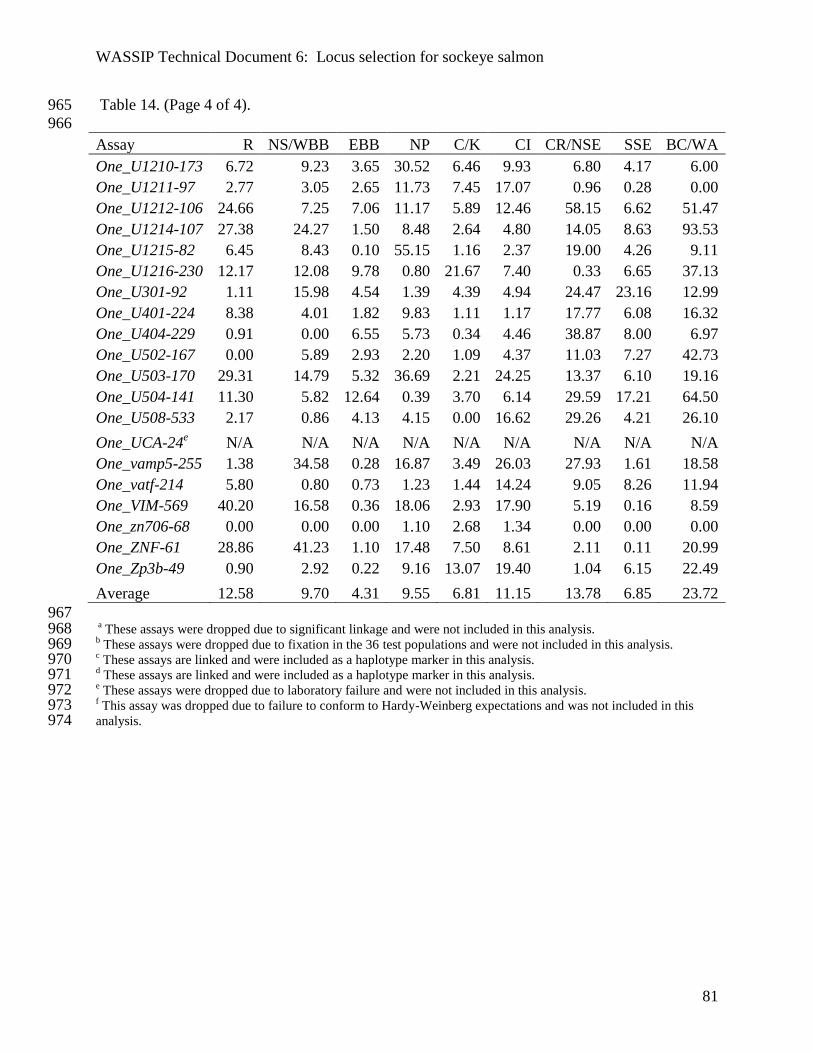
WASSIP Technical Document 6: Locus selection for sockeye salmon
81
Table 14. (Page 4 of 4). 965
966
Assay R NS/WBB EBB NP C/K CI CR/NSE SSE BC/WA
One_U1210-173 6.72 9.23 3.65 30.52 6.46 9.93 6.80 4.17 6.00
One_U1211-97 2.77 3.05 2.65 11.73 7.45 17.07 0.96 0.28 0.00
One_U1212-106 24.66 7.25 7.06 11.17 5.89 12.46 58.15 6.62 51.47
One_U1214-107 27.38 24.27 1.50 8.48 2.64 4.80 14.05 8.63 93.53
One_U1215-82 6.45 8.43 0.10 55.15 1.16 2.37 19.00 4.26 9.11
One_U1216-230 12.17 12.08 9.78 0.80 21.67 7.40 0.33 6.65 37.13
One_U301-92 1.11 15.98 4.54 1.39 4.39 4.94 24.47 23.16 12.99
One_U401-224 8.38 4.01 1.82 9.83 1.11 1.17 17.77 6.08 16.32
One_U404-229 0.91 0.00 6.55 5.73 0.34 4.46 38.87 8.00 6.97
One_U502-167 0.00 5.89 2.93 2.20 1.09 4.37 11.03 7.27 42.73
One_U503-170 29.31 14.79 5.32 36.69 2.21 24.25 13.37 6.10 19.16
One_U504-141 11.30 5.82 12.64 0.39 3.70 6.14 29.59 17.21 64.50
One_U508-533 2.17 0.86 4.13 4.15 0.00 16.62 29.26 4.21 26.10
One_UCA-24e N/A N/A N/A N/A N/A N/A N/A N/A N/A
One_vamp5-255 1.38 34.58 0.28 16.87 3.49 26.03 27.93 1.61 18.58
One_vatf-214 5.80 0.80 0.73 1.23 1.44 14.24 9.05 8.26 11.94
One_VIM-569 40.20 16.58 0.36 18.06 2.93 17.90 5.19 0.16 8.59
One_zn706-68 0.00 0.00 0.00 1.10 2.68 1.34 0.00 0.00 0.00
One_ZNF-61 28.86 41.23 1.10 17.48 7.50 8.61 2.11 0.11 20.99
One_Zp3b-49 0.90 2.92 0.22 9.16 13.07 19.40 1.04 6.15 22.49
Average 12.58 9.70 4.31 9.55 6.81 11.15 13.78 6.85 23.72
967 a These assays were dropped due to significant linkage and were not included in this analysis. 968
b These assays were dropped due to fixation in the 36 test populations and were not included in this analysis. 969
c These assays are linked and were included as a haplotype marker in this analysis. 970
d These assays are linked and were included as a haplotype marker in this analysis. 971
e These assays were dropped due to laboratory failure and were not included in this analysis. 972
f This assay was dropped due to failure to conform to Hardy-Weinberg expectations and was not included in this 973 analysis. 974
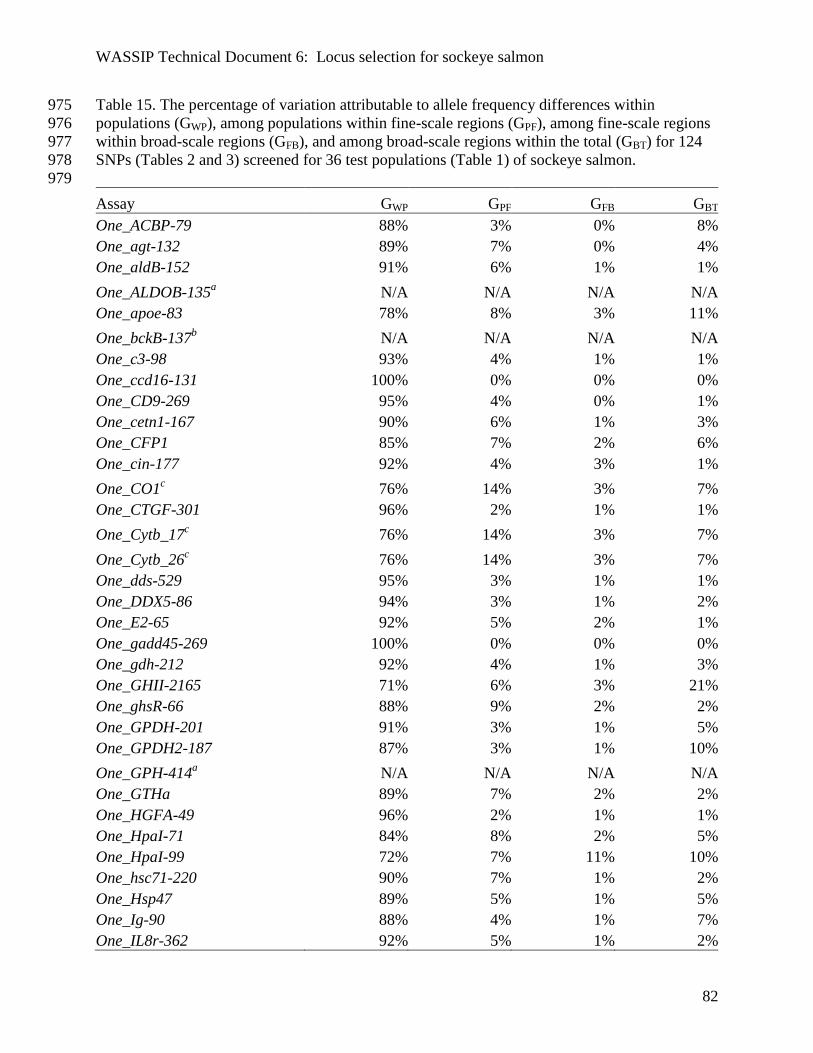
WASSIP Technical Document 6: Locus selection for sockeye salmon
82
Table 15. The percentage of variation attributable to allele frequency differences within 975
populations (GWP), among populations within fine-scale regions (GPF), among fine-scale regions 976
within broad-scale regions (GFB), and among broad-scale regions within the total (GBT) for 124 977
SNPs (Tables 2 and 3) screened for 36 test populations (Table 1) of sockeye salmon. 978
979
Assay GWP GPF GFB GBT
One_ACBP-79 88% 3% 0% 8%
One_agt-132 89% 7% 0% 4%
One_aldB-152 91% 6% 1% 1%
One_ALDOB-135a N/A N/A N/A N/A
One_apoe-83 78% 8% 3% 11%
One_bckB-137b N/A N/A N/A N/A
One_c3-98 93% 4% 1% 1%
One_ccd16-131 100% 0% 0% 0%
One_CD9-269 95% 4% 0% 1%
One_cetn1-167 90% 6% 1% 3%
One_CFP1 85% 7% 2% 6%
One_cin-177 92% 4% 3% 1%
One_CO1c 76% 14% 3% 7%
One_CTGF-301 96% 2% 1% 1%
One_Cytb_17c 76% 14% 3% 7%
One_Cytb_26c 76% 14% 3% 7%
One_dds-529 95% 3% 1% 1%
One_DDX5-86 94% 3% 1% 2%
One_E2-65 92% 5% 2% 1%
One_gadd45-269 100% 0% 0% 0%
One_gdh-212 92% 4% 1% 3%
One_GHII-2165 71% 6% 3% 21%
One_ghsR-66 88% 9% 2% 2%
One_GPDH-201 91% 3% 1% 5%
One_GPDH2-187 87% 3% 1% 10%
One_GPH-414a N/A N/A N/A N/A
One_GTHa 89% 7% 2% 2%
One_HGFA-49 96% 2% 1% 1%
One_HpaI-71 84% 8% 2% 5%
One_HpaI-99 72% 7% 11% 10%
One_hsc71-220 90% 7% 1% 2%
One_Hsp47 89% 5% 1% 5%
One_Ig-90 88% 4% 1% 7%
One_IL8r-362 92% 5% 1% 2%
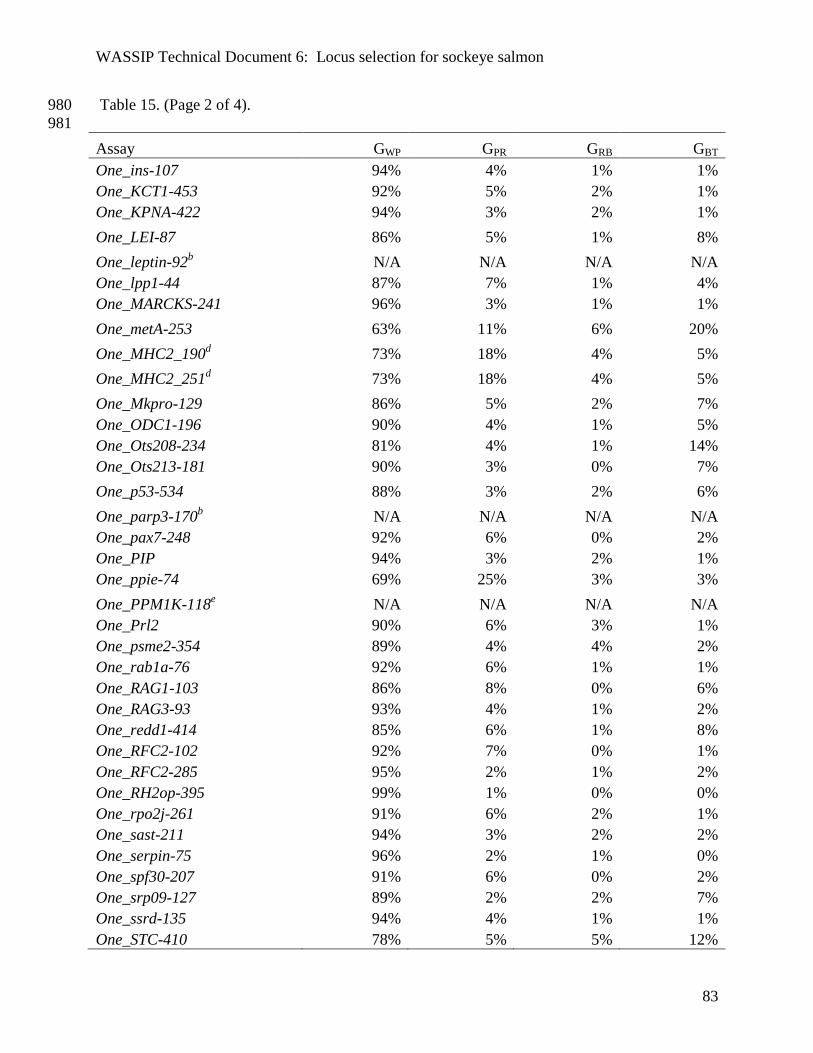
WASSIP Technical Document 6: Locus selection for sockeye salmon
83
Table 15. (Page 2 of 4). 980
981
Assay GWP GPR GRB GBT
One_ins-107 94% 4% 1% 1%
One_KCT1-453 92% 5% 2% 1%
One_KPNA-422 94% 3% 2% 1%
One_LEI-87 86% 5% 1% 8%
One_leptin-92b N/A N/A N/A N/A
One_lpp1-44 87% 7% 1% 4%
One_MARCKS-241 96% 3% 1% 1%
One_metA-253 63% 11% 6% 20%
One_MHC2_190d 73% 18% 4% 5%
One_MHC2_251d 73% 18% 4% 5%
One_Mkpro-129 86% 5% 2% 7%
One_ODC1-196 90% 4% 1% 5%
One_Ots208-234 81% 4% 1% 14%
One_Ots213-181 90% 3% 0% 7%
One_p53-534 88% 3% 2% 6%
One_parp3-170b N/A N/A N/A N/A
One_pax7-248 92% 6% 0% 2%
One_PIP 94% 3% 2% 1%
One_ppie-74 69% 25% 3% 3%
One_PPM1K-118e N/A N/A N/A N/A
One_Prl2 90% 6% 3% 1%
One_psme2-354 89% 4% 4% 2%
One_rab1a-76 92% 6% 1% 1%
One_RAG1-103 86% 8% 0% 6%
One_RAG3-93 93% 4% 1% 2%
One_redd1-414 85% 6% 1% 8%
One_RFC2-102 92% 7% 0% 1%
One_RFC2-285 95% 2% 1% 2%
One_RH2op-395 99% 1% 0% 0%
One_rpo2j-261 91% 6% 2% 1%
One_sast-211 94% 3% 2% 2%
One_serpin-75 96% 2% 1% 0%
One_spf30-207 91% 6% 0% 2%
One_srp09-127 89% 2% 2% 7%
One_ssrd-135 94% 4% 1% 1%
One_STC-410 78% 5% 5% 12%
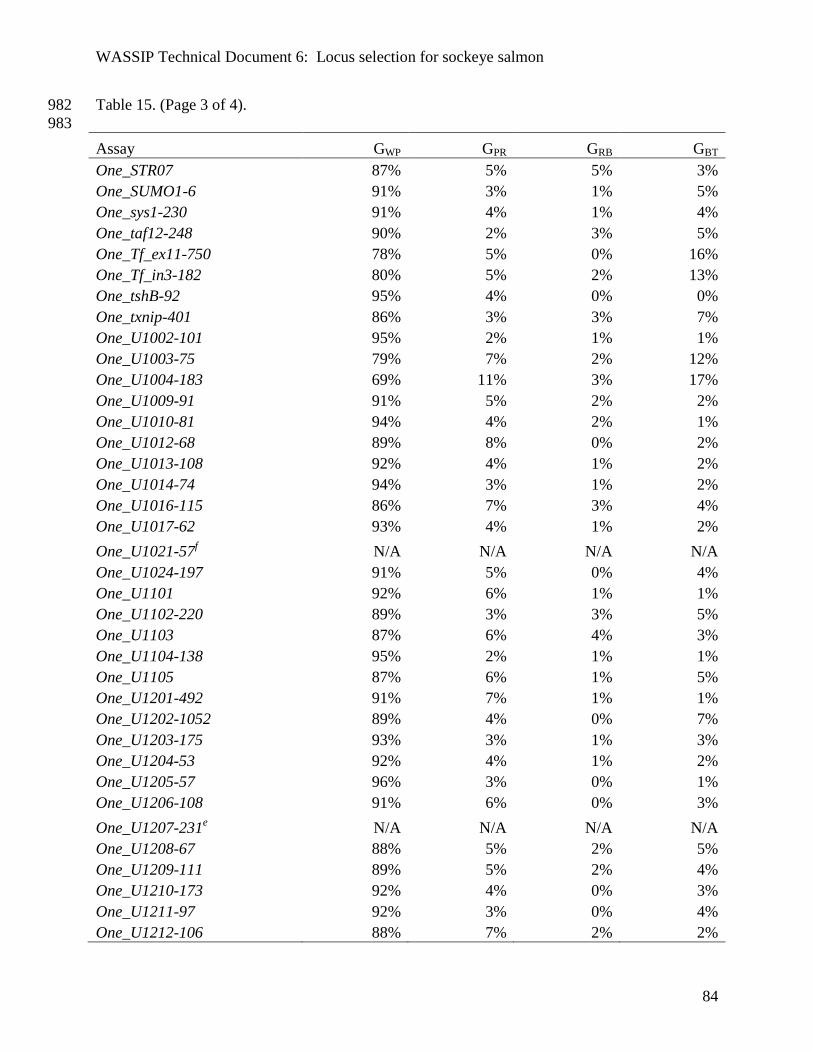
WASSIP Technical Document 6: Locus selection for sockeye salmon
84
Table 15. (Page 3 of 4). 982
983
Assay GWP GPR GRB GBT
One_STR07 87% 5% 5% 3%
One_SUMO1-6 91% 3% 1% 5%
One_sys1-230 91% 4% 1% 4%
One_taf12-248 90% 2% 3% 5%
One_Tf_ex11-750 78% 5% 0% 16%
One_Tf_in3-182 80% 5% 2% 13%
One_tshB-92 95% 4% 0% 0%
One_txnip-401 86% 3% 3% 7%
One_U1002-101 95% 2% 1% 1%
One_U1003-75 79% 7% 2% 12%
One_U1004-183 69% 11% 3% 17%
One_U1009-91 91% 5% 2% 2%
One_U1010-81 94% 4% 2% 1%
One_U1012-68 89% 8% 0% 2%
One_U1013-108 92% 4% 1% 2%
One_U1014-74 94% 3% 1% 2%
One_U1016-115 86% 7% 3% 4%
One_U1017-62 93% 4% 1% 2%
One_U1021-57f N/A N/A N/A N/A
One_U1024-197 91% 5% 0% 4%
One_U1101 92% 6% 1% 1%
One_U1102-220 89% 3% 3% 5%
One_U1103 87% 6% 4% 3%
One_U1104-138 95% 2% 1% 1%
One_U1105 87% 6% 1% 5%
One_U1201-492 91% 7% 1% 1%
One_U1202-1052 89% 4% 0% 7%
One_U1203-175 93% 3% 1% 3%
One_U1204-53 92% 4% 1% 2%
One_U1205-57 96% 3% 0% 1%
One_U1206-108 91% 6% 0% 3%
One_U1207-231e N/A N/A N/A N/A
One_U1208-67 88% 5% 2% 5%
One_U1209-111 89% 5% 2% 4%
One_U1210-173 92% 4% 0% 3%
One_U1211-97 92% 3% 0% 4%
One_U1212-106 88% 7% 2% 2%
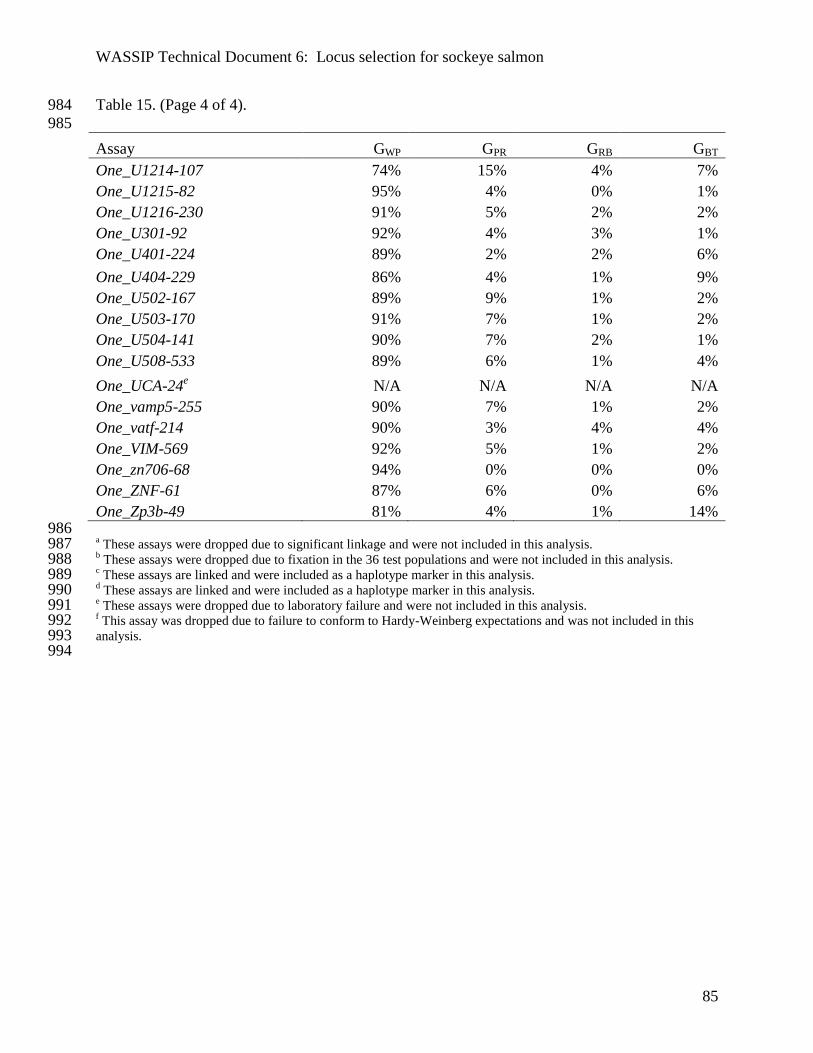
WASSIP Technical Document 6: Locus selection for sockeye salmon
85
Table 15. (Page 4 of 4). 984
985
Assay GWP GPR GRB GBT
One_U1214-107 74% 15% 4% 7%
One_U1215-82 95% 4% 0% 1%
One_U1216-230 91% 5% 2% 2%
One_U301-92 92% 4% 3% 1%
One_U401-224 89% 2% 2% 6%
One_U404-229 86% 4% 1% 9%
One_U502-167 89% 9% 1% 2%
One_U503-170 91% 7% 1% 2%
One_U504-141 90% 7% 2% 1%
One_U508-533 89% 6% 1% 4%
One_UCA-24e N/A N/A N/A N/A
One_vamp5-255 90% 7% 1% 2%
One_vatf-214 90% 3% 4% 4%
One_VIM-569 92% 5% 1% 2%
One_zn706-68 94% 0% 0% 0%
One_ZNF-61 87% 6% 0% 6%
One_Zp3b-49 81% 4% 1% 14% 986 a These assays were dropped due to significant linkage and were not included in this analysis. 987
b These assays were dropped due to fixation in the 36 test populations and were not included in this analysis. 988
c These assays are linked and were included as a haplotype marker in this analysis. 989
d These assays are linked and were included as a haplotype marker in this analysis. 990
e These assays were dropped due to laboratory failure and were not included in this analysis. 991
f This assay was dropped due to failure to conform to Hardy-Weinberg expectations and was not included in this 992 analysis. 993 994

WASSIP Technical Document 6: Locus selection for sockeye salmon
86
Table 16. Proposed test collections for marker selection in chum salmon. 995
996
Region Population Collection Sample size Lat. Long.
Japan
Tokachi River CMTOKA02 80 42.6950 -143.6653
Gakko River early CMGAKK03E 80 39.0525 -139.8864
Russia
Amur River summer CMAMU01 95 53.1100 -140.7400
Palana River CMPALA98 95 59.0667 -159.8333
Kotzebue Sound
Kiana River CMKIAN04 95 66.9728 -160.4269
Kelly Lake CMKEL91 95 67.9187 -162.3501
Norton Sound
American River CMAMER04 95 65.4245 -165.7849
Unalakleet River CMUNAL04 95 63.8703 -160.7859
Yukon summer
Anvik River CMOTT93 95 63.2425 -160.6972
Nulato River CMNUL03 95 64.7356 -158.1870
Yukon fall
Pelly River CMPEL93 84 62.5500 -136.7500
Kluane River CMKLUA01 95 61.6222 -139.3912
Kuskokwim summer
George River CMGEO96 95 61.8975 -157.7135
Goodnews River weir CMGOO91 95 59.1028 -161.5610
Kuskokwim fall
Windy Fork CMWINDF08 95 62.6944 -154.5926
Big River CMBIGR08 95
62.6063 -155.0135
Western Bristol Bay
Togiak River CMTOG93 95 59.0783 -160.3372
Mulchatna River CMMUL94 95 59.6449 -157.1168
Eastern Bristol Bay
Naknek River (Big Cr) CMBRIB93 80 58.2926 -157.5340
Meshik River CMMES92 78 56.7910 -158.6617
Alaska Peninsula
Frosty Creek CMFRO92 95 55.1933 -162.8604
Canoe Bay Creek CMCAN92 95 55.7250 -161.2188
Southcentral Alaska
Lake Creek CMLAK96 95 61.9060 -150.9089
Olsen Creek CMPWS95A 95 60.7596 -146.1747
Southeast Alaska
Chilkat River - 24Mile CM24MI06 95 59.4204 -135.9495
North Arm Creek CMNARM06S 95 56.6855 -132.3081
British Columbia
Kitimat River CMKITIM06 95 54.0000 -128.6667
Kitwanga River CMKITW06 95 55.1000 -128.0834
Washington
Nisqually River Hatchery CMNISQ04 95 47.0959 -122.6960
Elwha River CMELWH04 95 48.1452 -123.5640
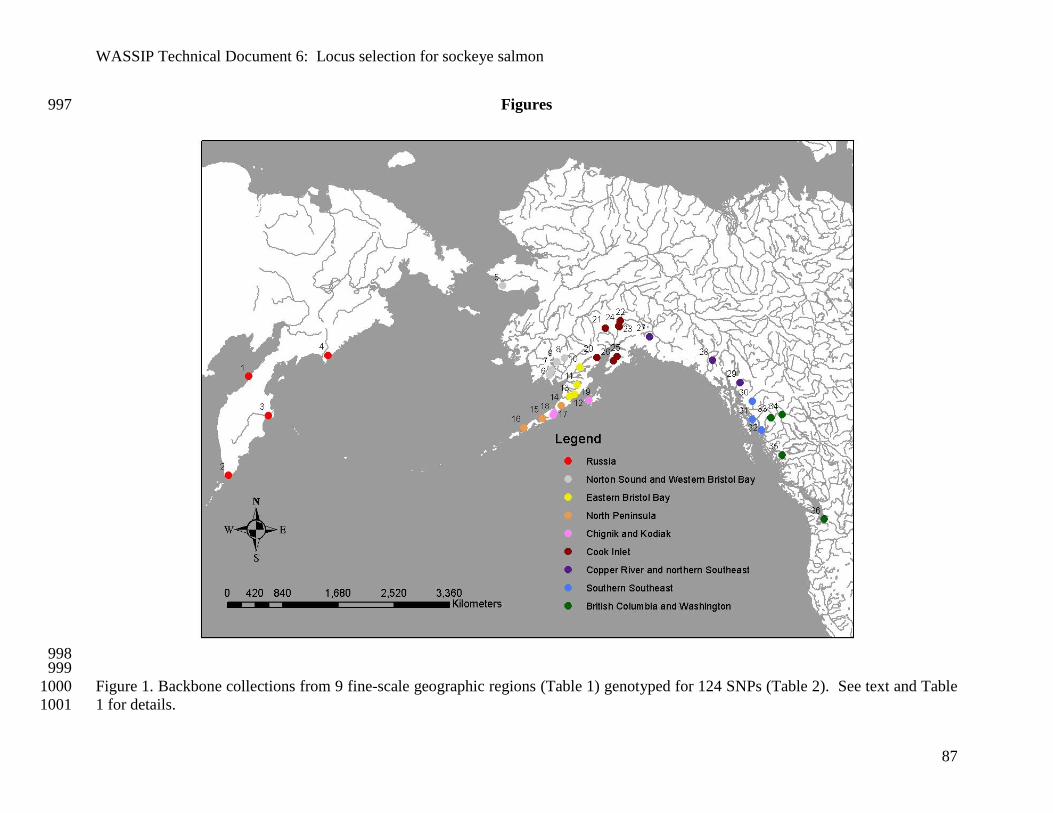
WASSIP Technical Document 6: Locus selection for sockeye salmon
87
Figures 997
998 999
Figure 1. Backbone collections from 9 fine-scale geographic regions (Table 1) genotyped for 124 SNPs (Table 2). See text and Table 1000
1 for details. 1001
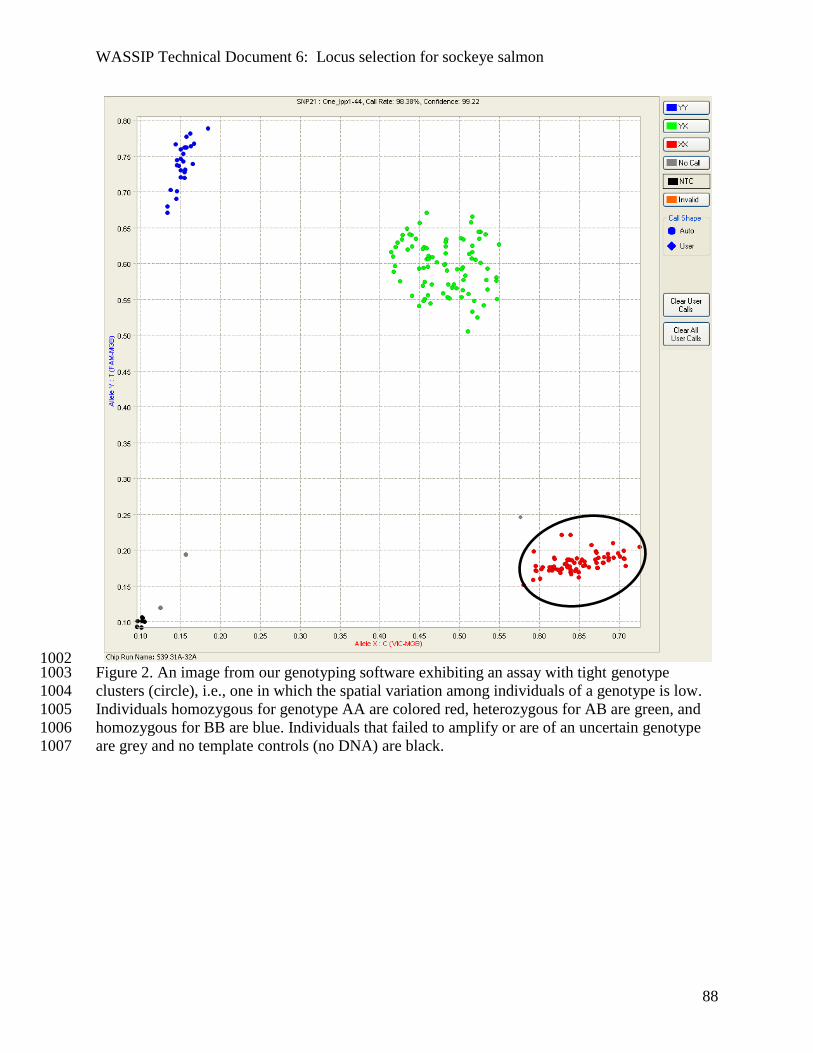
WASSIP Technical Document 6: Locus selection for sockeye salmon
88
1002 Figure 2. An image from our genotyping software exhibiting an assay with tight genotype 1003
clusters (circle), i.e., one in which the spatial variation among individuals of a genotype is low. 1004
Individuals homozygous for genotype AA are colored red, heterozygous for AB are green, and 1005
homozygous for BB are blue. Individuals that failed to amplify or are of an uncertain genotype 1006
are grey and no template controls (no DNA) are black.1007

WASSIP Technical Document 6: Locus selection for sockeye salmon
89
1008 Figure 3. An image from our genotyping software exhibiting an assay with widely separated 1009
genotype clusters, i.e., one in which the separation between cluster edges (X) is high.1010
X
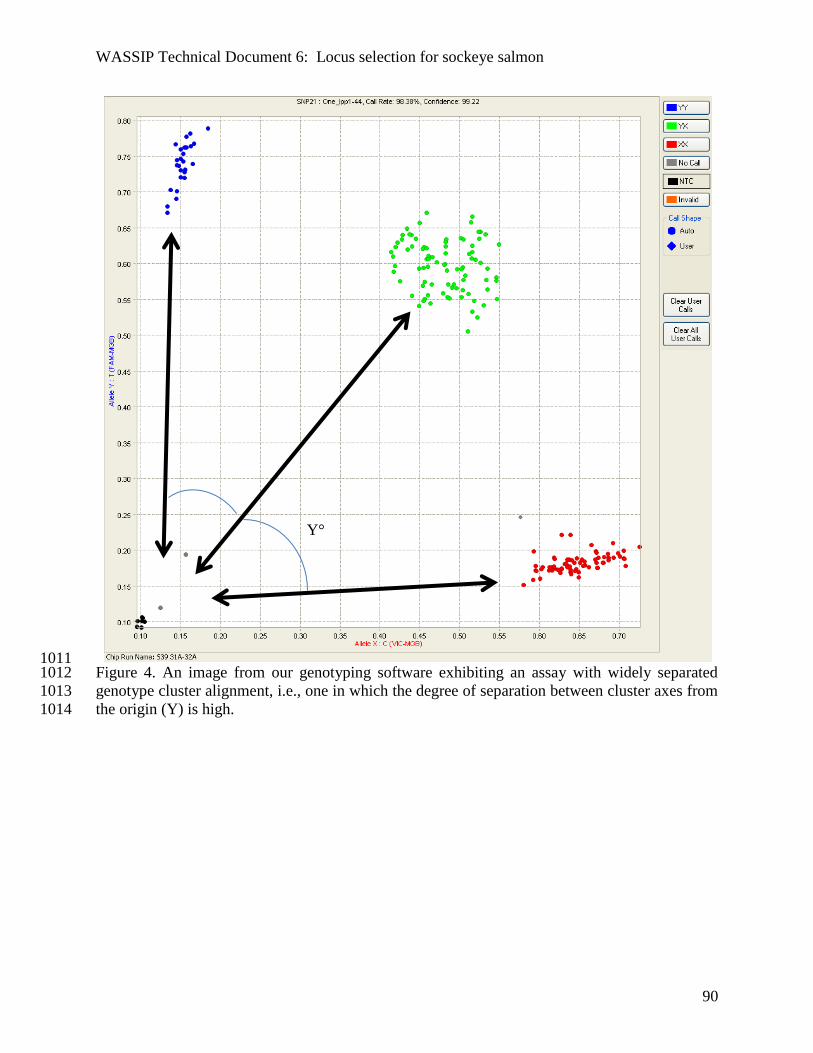
WASSIP Technical Document 6: Locus selection for sockeye salmon
90
1011 Figure 4. An image from our genotyping software exhibiting an assay with widely separated 1012
genotype cluster alignment, i.e., one in which the degree of separation between cluster axes from 1013
the origin (Y) is high. 1014
Y°

WASSIP Technical Document 6: Locus selection for sockeye salmon
91
1015 Figure 5. The average cluster tightness rating of 124 SNPs (Tables 2 and 3) screened for 36 test populations (Table 1) ordered from 1016
lowest rating (Left) to highest rating (Right). 1017
1018
1
2
3
4
5
U1
21
58
2
dd
s52
9
U1
02
15
7
STR
07
MH
C2
19
0
U1
20
21
05
2
serp
in
Hp
aI4
36
ALD
OB
13
5
U5
04
14
1
psm
e23
54
HG
FA
STC
41
0
U1
20
61
08
U1
10
22
20
pIn
s
UC
A2
4
GP
DH
2
U1
01
61
15
U1
10
5
Prl
2
U1
10
1
PIP
SUM
O1
6
GP
H4
14
KP
NA
42
2
MA
RC
KS2
41
rab
1a7
6
AC
BP
79
U1
21
62
30
U1
21
21
06
E2
red
d1
41
4
U1
20
14
92
U1
00
37
5
U1
21
19
7
DD
X5
86
Mkp
ro1
29
ghsR
66
CD
92
69
sys1
23
0
U4
01
22
4
ald
B1
52
agt1
32
Tfex
10
75
0
Hp
aI9
9
U1
02
41
97
U1
20
31
75
ssrd
13
5
gdh
21
2
U1
00
41
83
vam
p5
25
5
U1
20
45
3
Ots
21
31
81
RA
G3
93
sast
21
1
zP3
b
U1
21
01
73
rpo
2j2
61
spf3
02
07
cin
17
7
GTH
a
U1
21
41
07
hcs
71
22
0
cetn
11
67
tsh
B9
2
lpp
14
4
CFP
1
U1
20
86
7
U1
01
31
08
GP
DH
U1
00
99
1
GH
II24
61
ZNF6
1
apo
e83
U1
01
47
4
IL8
r36
2
Hsp
47
U1
20
91
11
VIM
56
9
vatf
21
4
c39
8
LEI8
7
KC
T14
53
MH
C2
25
1
U3
01
92
RF1
12
CTG
F30
1
U1
01
26
8
pp
ie7
4
U1
20
55
7
U4
04
22
9
Tfex
31
82
srp
09
12
7
pax
72
48
p5
35
76
taf1
22
48
RA
G1
10
3
U1
10
3
RF2
95
U5
03
17
0
U1
01
76
2
Ig9
0
RH
2o
p3
95
U1
01
08
1
met
A2
53
txn
ip4
01
U1
10
41
38
bck
B1
37
U1
00
21
01
zn7
06
68
ccd
16
13
1
U5
02
16
7
Cyt
b1
7
lep
tin
92
gad
d4
52
69
Cyt
b2
6
CO
1
par
p3
17
0
Ass
ay c
lust
er
rati
ng
Locus

WASSIP Technical Document 6: Locus selection for sockeye salmon
92
1019 Figure 6. The average space between cluster rating of 124 SNPs (Tables 2 and 3) screened for 36 test populations (Table 1) ordered 1020
from lowest rating (Left) to highest rating (Right). 1021
1
2
3
4
5
bck
B1
37
lep
tin
92
gad
d4
52
69
par
p3
17
0
zn7
06
68
ccd
16
13
1
U1
10
41
38
U1
00
21
01
U1
21
58
2
pp
ie7
4
txn
ip4
01
STC
41
0
serp
in
Ig9
0
dd
s52
9
U1
01
61
15
taf1
22
48
hcs
71
22
0
U1
02
15
7
MA
RC
KS2
41
psm
e23
54
U1
10
22
20
U1
21
19
7
U5
02
16
7
MH
C2
19
0
GP
DH
2
DD
X5
86
ALD
OB
13
5
p5
35
76
U1
20
21
05
2
Hp
aI4
36
red
d1
41
4
zP3
b
RH
2o
p3
95
met
A2
53
UC
A2
4
U1
10
3
U1
01
76
2
STR
07
HG
FA
pIn
s
U1
10
5
cin
17
7
U1
20
55
7
CTG
F30
1
U1
20
61
08
RA
G3
93
vatf
21
4
U5
04
14
1
U1
20
14
92
U4
04
22
9
PIP E2
Prl
2
U1
21
21
06
Hp
aI9
9
U1
00
41
83
vam
p5
25
5
cetn
11
67
c39
8
SUM
O1
6
U1
21
01
73
LEI8
7
AC
BP
79
Mkp
ro1
29
srp
09
12
7
agt1
32
sys1
23
0
U4
01
22
4
U1
10
1
GP
H4
14
ald
B1
52
U1
02
41
97
Ots
21
31
81
KC
T14
53
MH
C2
25
1
KP
NA
42
2
U1
00
37
5
GP
DH
VIM
56
9
RA
G1
10
3
RF2
95
ghsR
66
Tfex
10
75
0
gdh
21
2
U1
01
31
08
rab
1a7
6
tsh
B9
2
Hsp
47
U1
21
62
30
ssrd
13
5
sast
21
1
rpo
2j2
61
RF1
12
U1
20
31
75
GTH
a
CFP
1
U1
20
45
3
spf3
02
07
CD
92
69
U1
21
41
07
U1
01
08
1
U1
01
47
4
apo
e83
IL8
r36
2
U3
01
92
Tfex
31
82
ZNF6
1
U1
01
26
8
pax
72
48
lpp
14
4
U1
20
86
7
GH
II24
61
U5
03
17
0
U1
00
99
1
U1
20
91
11
Cyt
b2
6
Cyt
b1
7
CO
1
Ass
ay s
pac
e b
etw
ee
n r
atin
g
Locus
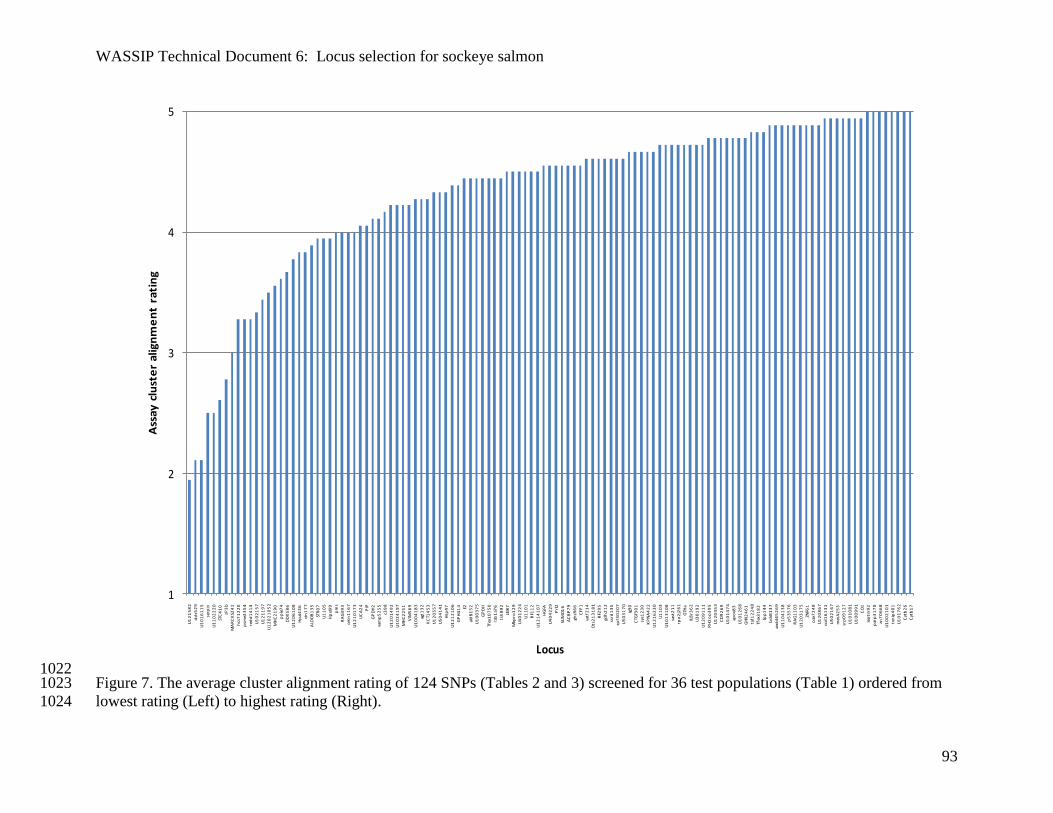
WASSIP Technical Document 6: Locus selection for sockeye salmon
93
1022 Figure 7. The average cluster alignment rating of 124 SNPs (Tables 2 and 3) screened for 36 test populations (Table 1) ordered from 1023
lowest rating (Left) to highest rating (Right). 1024
1
2
3
4
5
U1
21
58
2
dd
s52
9
U1
01
61
15
serp
in
U1
10
22
20
STC
41
0
zP3
b
MA
RC
KS2
41
hcs
71
22
0
psm
e23
54
red
d1
41
4
U1
02
15
7
U1
21
19
7
U1
20
21
05
2
MH
C2
19
0
pp
ie7
4
DD
X5
86
U1
20
61
08
Hp
aI4
36
cin
17
7
ALD
OB
13
5
STR
07
U1
10
5
Hp
aI9
9
pIn
s
RA
G3
93
cetn
11
67
U1
21
01
73
UC
A2
4
PIP
GP
DH
2
vam
p5
25
5
c39
8
U1
20
14
92
U1
02
41
97
MH
C2
25
1
VIM
56
9
U1
00
41
83
agt1
32
KC
T14
53
U1
20
55
7
U5
04
14
1
Hsp
47
U1
21
21
06
GP
H4
14 E2
ald
B1
52
U1
00
37
5
GP
DH
Tfex
10
75
0
rab
1a7
6
tsh
B9
2
LEI8
7
Mkp
ro1
29
U4
01
22
4
U1
10
1
RF1
12
U1
21
41
07
HG
FA
U4
04
22
9
Prl
2
SUM
O1
6
AC
BP
79
ghsR
66
CFP
1
vatf
21
4
Ots
21
31
81
RF2
95
gdh
21
2
ssrd
13
5
spf3
02
07
U5
03
17
0
Ig9
0
CTG
F30
1
sys1
23
0
KP
NA
42
2
U1
21
62
30
U1
10
3
U1
01
31
08
sast
21
1
rpo
2j2
61
GTH
a
IL8
r36
2
U3
01
92
U1
20
91
11
RH
2o
p3
95
U1
20
45
3
CD
92
69
U1
01
47
4
apo
e83
U1
01
26
8
GH
II24
61
taf1
22
48
Tfex
31
82
lpp
14
4
bck
B1
37
gad
d4
52
69
U1
10
41
38
p5
35
76
RA
G1
10
3
U1
20
31
75
ZNF6
1
pax
72
48
U1
20
86
7
ccd
16
13
1
U5
02
16
7
met
A2
53
srp
09
12
7
U1
01
08
1
U1
00
99
1
CO
1
lep
tin
92
par
p3
17
0
zn7
06
68
U1
00
21
01
txn
ip4
01
U1
01
76
2
Cyt
b2
6
Cyt
b1
7
Ass
ay c
lust
er
alig
nm
en
t ra
tin
g
Locus
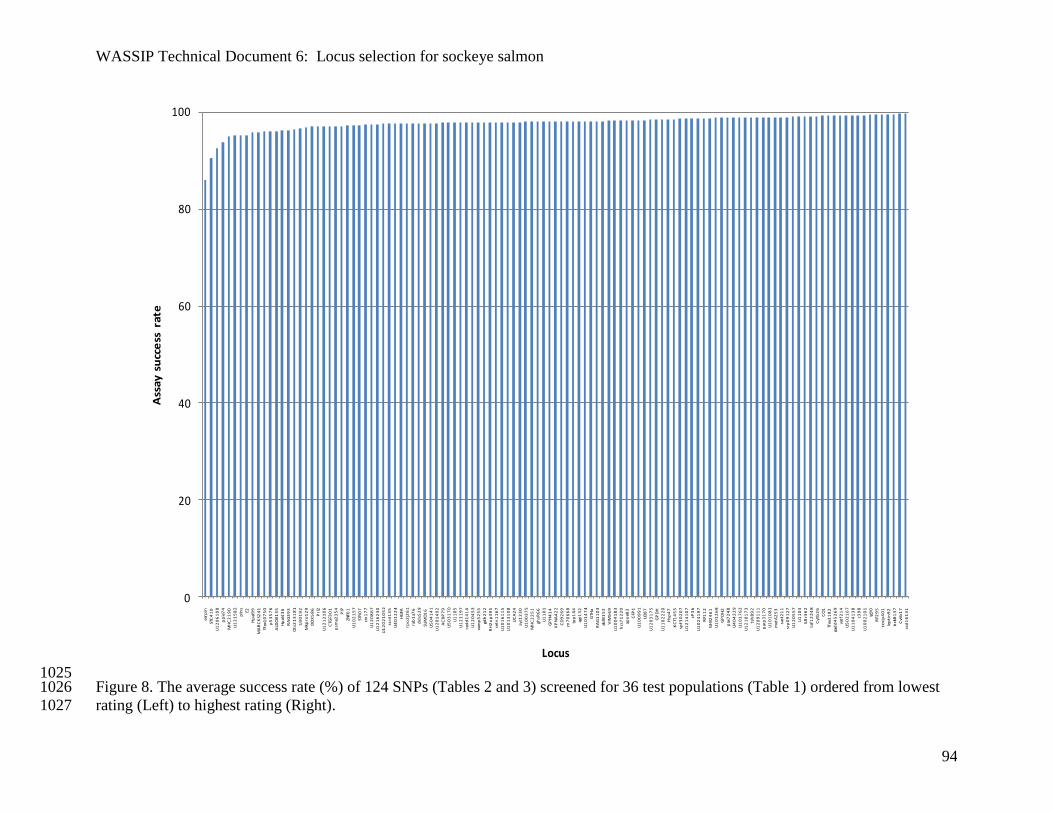
WASSIP Technical Document 6: Locus selection for sockeye salmon
94
1025 Figure 8. The average success rate (%) of 124 SNPs (Tables 2 and 3) screened for 36 test populations (Table 1) ordered from lowest 1026
rating (Left) to highest rating (Right). 1027
0
20
40
60
80
100
serp
in
STC
41
0
U1
20
61
08
pp
ie7
4
MH
C2
19
0
U1
21
58
2
pIn
s
E2
Hp
aI9
9
MA
RC
KS2
41
Tfex
10
75
0
p5
35
76
ALD
OB
13
5
Hp
aI4
36
RA
G3
93
Ots
21
31
81
U3
01
92
Mkp
ro1
29
DD
X5
86
Prl
2
U1
21
21
06
CTG
F30
1
psm
e23
54
PIP
ZNF6
1
U1
02
15
7
STR
07
cin
17
7
U1
20
86
7
U1
21
62
30
U1
20
21
05
2
ssrd
13
5
U4
01
22
4
HG
FA
rpo
2j2
61
rab
1a7
6
dd
s52
9
SUM
O1
6
U5
04
14
1
U1
20
14
92
AC
BP
79
U5
03
17
0
U1
10
5
U1
21
19
7
red
d1
41
4
U1
20
45
3
vam
p5
25
5
gdh
21
2
RH
2o
p3
95
cetn
11
67
U1
01
61
15
U1
01
31
08
UC
A2
4
sys1
23
0
U1
00
37
5
MH
C2
25
1
ghsR
66
U1
10
1
GP
H4
14
KP
NA
42
2
CD
92
69
zn7
06
68
lpp
14
4
agt1
32
U1
01
47
4
GTH
a
RA
G1
10
3
ald
B1
52
VIM
56
9
U1
00
41
83
hcs
71
22
0
apo
e83
CFP
1
U1
00
99
1
LEI8
7
U1
20
31
75
GP
DH
U1
10
22
20
Hsp
47
KC
T14
53
spf3
02
07
U1
21
41
07
zP3
b
U1
02
41
97
RF1
12
GH
II24
61
U1
01
26
8
GP
DH
2
pax
72
48
U4
04
22
9
U1
01
76
2
U1
21
01
73
tsh
B9
2
U1
20
91
11
par
p3
17
0
U1
01
08
1
met
A2
53
sast
21
1
srp
09
12
7
U1
20
55
7
U1
10
3
IL8
r36
2
taf1
22
48
Cyt
b2
6
CO
1
Tfex
31
82
gad
d4
52
69
vatf
21
4
U5
02
16
7
U1
10
41
38
c39
8
U1
00
21
01
Ig9
0
RF2
95
txn
ip4
01
lep
tin
92
bck
B1
37
Cyt
b1
7
ccd
16
13
1
Ass
ay
su
cce
ss r
ate
Locus
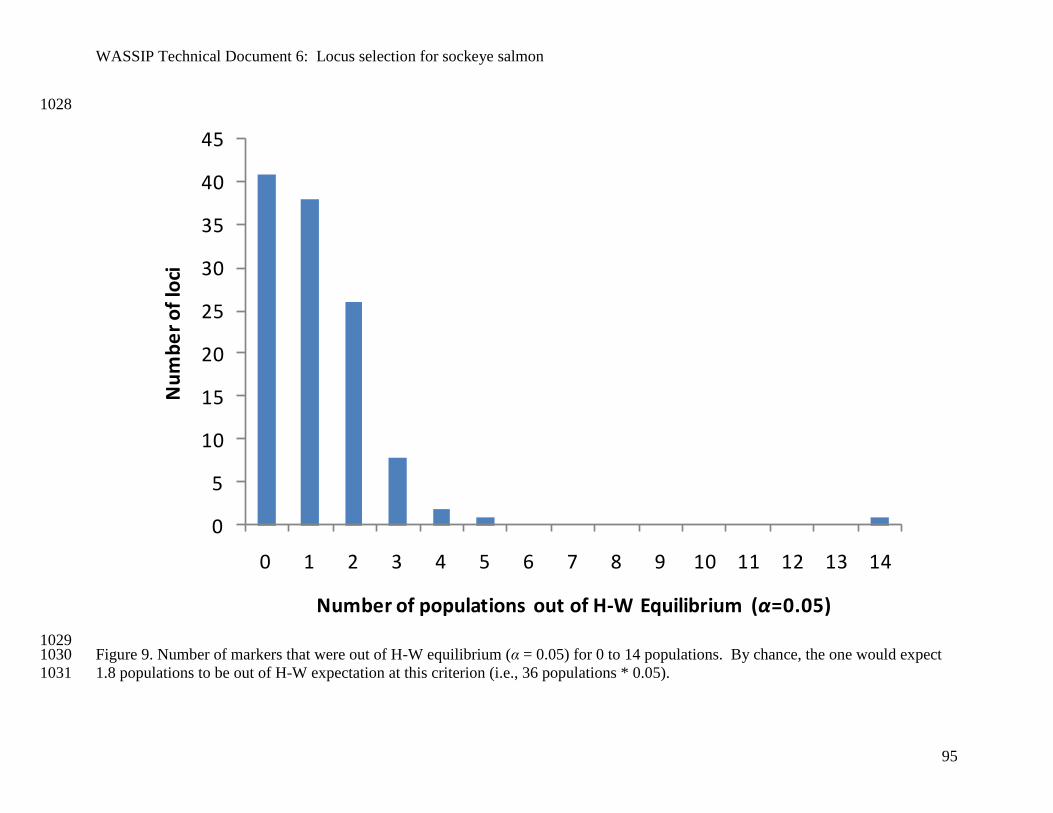
WASSIP Technical Document 6: Locus selection for sockeye salmon
95
1028
1029 Figure 9. Number of markers that were out of H-W equilibrium (α = 0.05) for 0 to 14 populations. By chance, the one would expect 1030
1.8 populations to be out of H-W expectation at this criterion (i.e., 36 populations * 0.05).1031
0
5
10
15
20
25
30
35
40
45
0 1 2 3 4 5 6 7 8 9 10 11 12 13 14
Nu
mb
er
of
loci
Number of populations out of H-W Equilibrium (α=0.05)
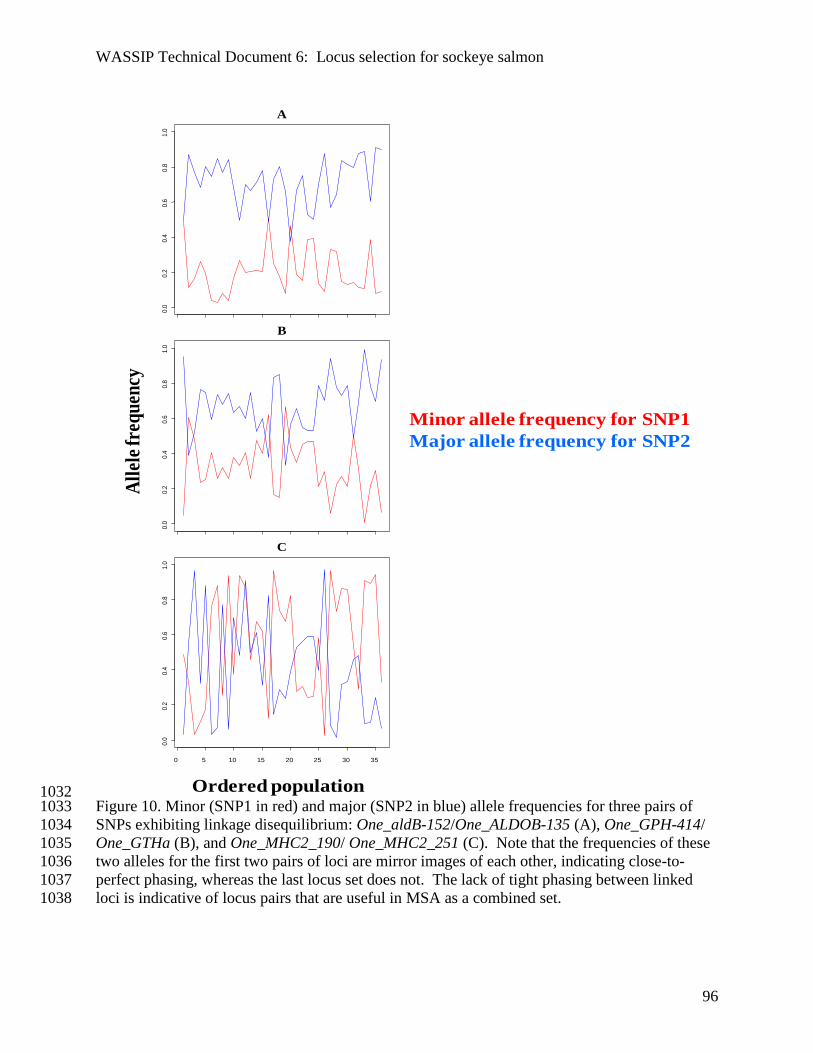
WASSIP Technical Document 6: Locus selection for sockeye salmon
96
1032 Figure 10. Minor (SNP1 in red) and major (SNP2 in blue) allele frequencies for three pairs of 1033
SNPs exhibiting linkage disequilibrium: One_aldB-152/One_ALDOB-135 (A), One_GPH-414/ 1034
One_GTHa (B), and One_MHC2_190/ One_MHC2_251 (C). Note that the frequencies of these 1035
two alleles for the first two pairs of loci are mirror images of each other, indicating close-to-1036
perfect phasing, whereas the last locus set does not. The lack of tight phasing between linked 1037
loci is indicative of locus pairs that are useful in MSA as a combined set.1038
Minor allele frequency for SNP1
Major allele frequency for SNP2
Ordered population
All
ele
freq
uen
cy
0 5 10 15 20 25 30 35
0.0
0.2
0.4
0.6
0.8
1.0
C
0.0
0.2
0.4
0.6
0.8
1.0
B
0.0
0.2
0.4
0.6
0.8
1.0
A
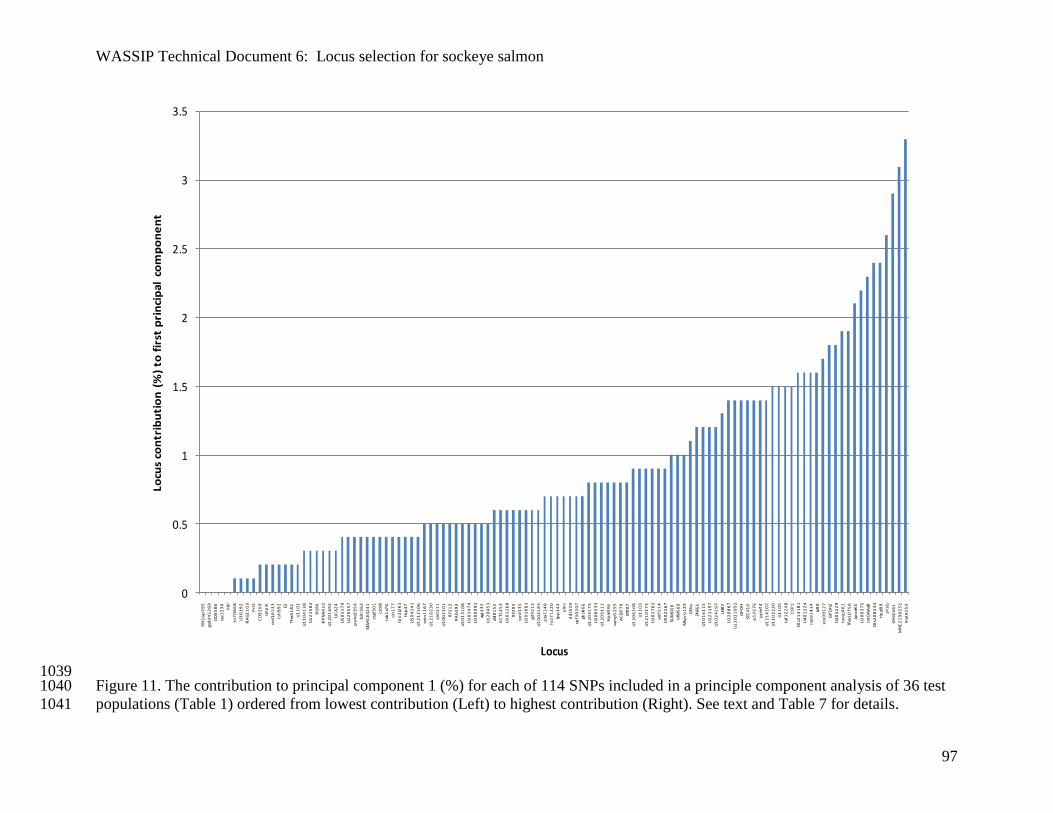
WASSIP Technical Document 6: Locus selection for sockeye salmon
97
1039 Figure 11. The contribution to principal component 1 (%) for each of 114 SNPs included in a principle component analysis of 36 test 1040
populations (Table 1) ordered from lowest contribution (Left) to highest contribution (Right). See text and Table 7 for details. 1041
0
0.5
1
1.5
2
2.5
3
3.5
RH
2o
p3
95
gad
d4
52
69
DD
X5
86
sys1
23
0
PIP
zn7
06
68
U3
01
92
RA
G1
10
3
Prl
2
CD
92
69
serp
in
ccd
16
13
1
tsh
B9
2 E2
Tfex
31
82
U1
10
1
U1
10
41
38
U1
21
58
2
HG
FA
KP
NA
42
2
U1
20
14
92
UC
A2
4
U5
03
17
0
U1
20
55
7
psm
e23
54
IL8
r36
2
MA
RC
KS2
41
ctgf
30
1
c39
8
rab
1a7
6
cin
17
7
rpo
2j2
61
Hsp
47
U5
04
14
1
U1
21
21
06
cetn
11
67
U1
21
62
30
sast
21
1
U1
00
21
01
RF1
12
RA
G3
93
U1
01
31
08
U1
01
47
4
U1
00
99
1
agt1
32
U1
20
45
3
ald
B1
52
KC
T14
53
U1
01
26
8
RF2
95
ssrd
13
5
U1
01
08
1
gdh
21
2
U1
00
41
83
pax
72
48
hcs
71
22
0
lpp
14
4
pIn
s
dd
s52
9
spf3
02
07
ghsR
66
U1
20
31
75
U5
08
53
3
U1
20
91
11
Hp
aI4
36
vam
p5
25
5
AC
BP
79
STR
07
U1
20
61
08
U1
10
3
U1
21
01
73
U1
01
76
2
vatf
21
4
U5
02
16
7
SUM
O1
6
VIM
56
9
Mkp
ro1
29
GTH
a
ZNF6
1
U1
01
61
15
U1
21
19
7
U1
02
41
97
LEI8
7
U1
20
86
7
U1
20
21
05
2
GP
DH
STC
41
0
p5
35
76
pp
ie7
4
U1
21
41
07
U1
10
22
20
U1
10
5
taf1
22
48
CFP
1
Ots
21
31
81
U4
01
22
4
red
d1
41
4
Ig9
0
srp
09
12
7
GP
DH
2
U4
04
22
9
txn
ip4
01
Tfex
10
75
0
apo
e83
U1
00
37
5
mtD
NA
all
Ots
20
82
34
Hp
aI9
9
zP3
b
GH
II24
61
MH
C2
19
02
51
met
A2
53
Lo
cus
con
trib
uti
on
(%
) to
fir
st p
rin
cip
al
com
po
ne
nt
Locus
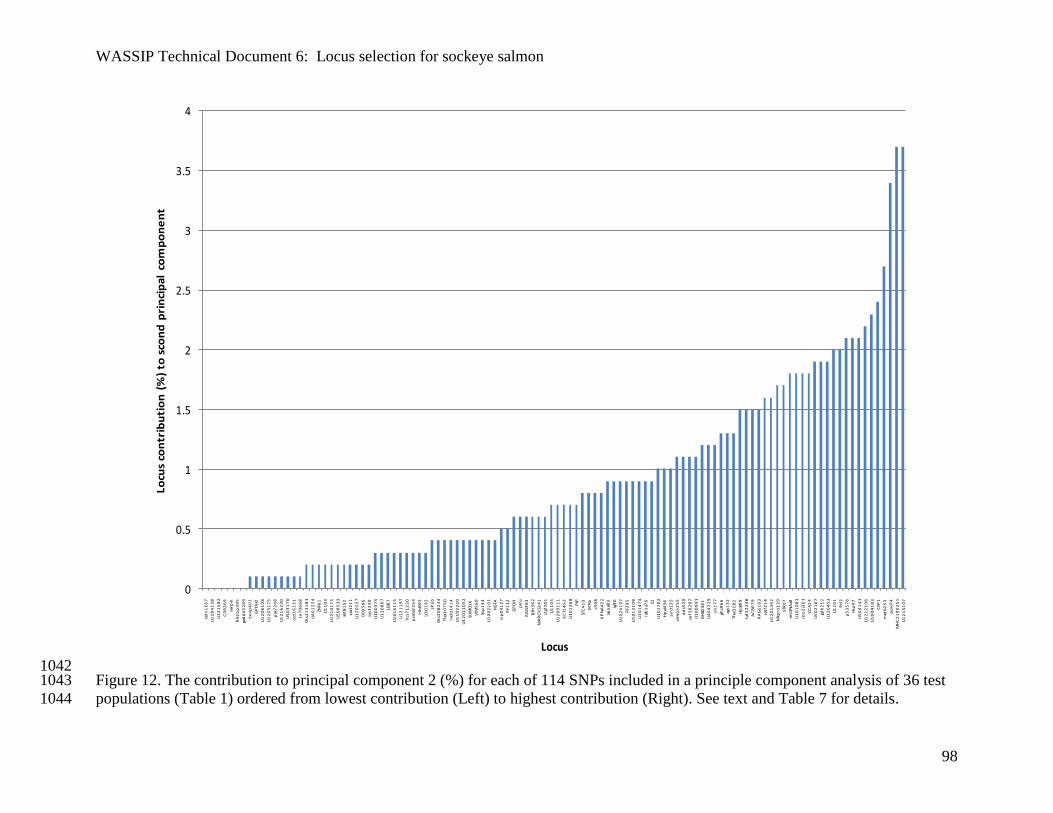
WASSIP Technical Document 6: Locus selection for sockeye salmon
98
1042 Figure 12. The contribution to principal component 2 (%) for each of 114 SNPs included in a principle component analysis of 36 test 1043
populations (Table 1) ordered from lowest contribution (Left) to highest contribution (Right). See text and Table 7 for details. 1044
0
0.5
1
1.5
2
2.5
3
3.5
4
cetn
11
67
U1
10
41
38
U1
21
58
2
CD
92
69
serp
in
RH
2o
p3
95
gad
d4
52
69
txn
ip4
01
GP
DH
2
U1
20
61
08
U1
20
31
75
pax
72
48
U1
21
62
30
U5
03
17
0
ccd
16
13
1
zn7
06
68
Ots
21
31
81
U4
01
22
4
ZNF6
1
U1
10
3
U1
21
01
73
U5
08
53
3
ald
B1
52
sast
21
1
U1
20
55
7
DD
X5
86
sys1
23
0
U1
00
37
5
U1
20
86
7
LEI8
7
U1
01
61
15
U1
21
19
7
hcs
71
22
0
psm
e23
54
tsh
B9
2
U3
01
92
zP3
b
Ots
20
82
34
Tfex
10
75
0
red
d1
41
4
U1
10
22
20
U1
20
21
05
2
SUM
O1
6
VIM
56
9
lpp
14
4
U1
00
21
01
HG
FA
srp
09
12
7
RF1
12
GP
DH
pIn
s
RA
G3
93
IL8
r36
2
MA
RC
KS2
41
ctgf
30
1
U1
10
5
U1
20
91
11
KC
T14
53
U1
01
26
8
PIP
STC
41
0
GTH
a
c39
8
KP
NA
42
2
apo
e83
Ig9
0
U1
02
41
97
RF2
95
U1
01
31
08
U1
01
47
4
rab
1a7
6 E2
U1
01
76
2
Hp
aI4
36
ssrd
13
5
vam
p5
25
5
dd
s52
9
spf3
02
07
U1
00
99
1
GH
II24
61
U4
04
22
9
cin
17
7
ghsR
66
agt1
32
Tfex
31
82
Hp
aI9
9
taf1
22
48
AC
BP
79
RA
G1
10
3
vatf
21
4
U1
20
14
92
Mkp
ro1
29
STR
07
mtD
NA
all
U1
01
08
1
rpo
2j2
61
UC
A2
4
U5
02
16
7
gdh
21
2
U1
20
45
3
U1
10
1
Prl
2
p5
35
76
Hsp
47
U5
04
14
1
U1
21
21
06
U1
00
41
83
CFP
1
met
A2
53
pp
ie7
4
MH
C2
19
02
51
U1
21
41
07
Lo
cus
con
trib
uti
on
(%
) to
sco
nd
pri
nci
pa
l co
mp
on
en
t
Locus
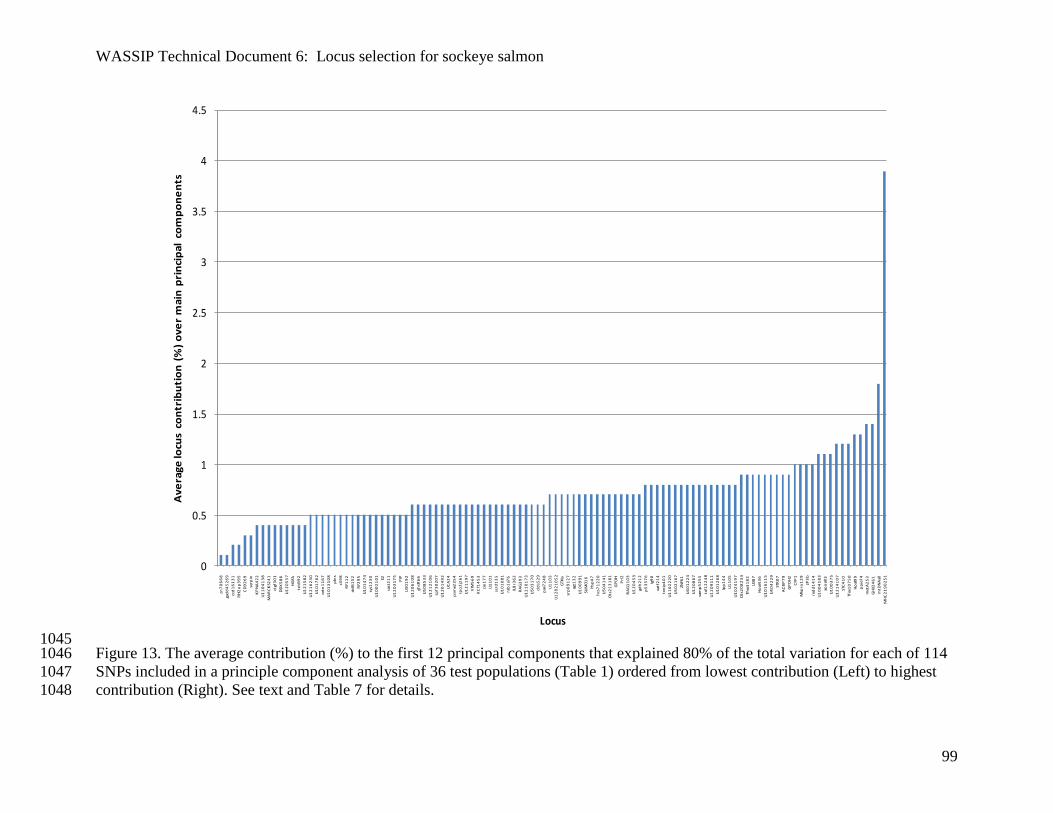
WASSIP Technical Document 6: Locus selection for sockeye salmon
99
1045 Figure 13. The average contribution (%) to the first 12 principal components that explained 80% of the total variation for each of 114 1046
SNPs included in a principle component analysis of 36 test populations (Table 1) ordered from lowest contribution (Left) to highest 1047
contribution (Right). See text and Table 7 for details. 1048
0
0.5
1
1.5
2
2.5
3
3.5
4
4.5
zn7
06
68
gad
d4
52
69
ccd
16
13
1
RH
2o
p3
95
CD
92
69
serp
in
KP
NA
42
2
U1
10
41
38
MA
RC
KS2
41
ctgf
30
1
DD
X5
86
U1
20
55
7
HG
FA
tsh
B9
2
U1
21
58
2
U1
21
62
30
U1
01
76
2
cetn
11
67
U1
01
31
08
pIn
s
c39
8
RF1
12
ald
B1
52
RF2
95
U1
01
47
4
sys1
23
0
U1
00
21
01
E2
sast
21
1
U1
20
31
75
PIP
U3
01
92
U1
20
61
08
ghsR
66
U5
08
53
3
U1
21
21
06
spf3
02
07
U1
20
14
92
UC
A2
4
psm
e23
54
rpo
2j2
61
U1
21
19
7
VIM
56
9
KC
T14
53
cin
17
7
U1
10
1
ssrd
13
5
U1
01
08
1
rab
1a7
6
IL8
r36
2
RA
G3
93
U1
21
01
73
U5
03
17
0
dd
s52
9
pax
72
48
U1
10
3
U1
20
21
05
2
GTH
a
srp
09
12
7
agt1
32
U1
00
99
1
SUM
O1
6
Hsp
47
hcs
71
22
0
U5
04
14
1
Ots
21
31
81
GP
DH
Prl
2
RA
G1
10
3
U1
20
45
3
gdh
21
2
p5
35
76
Ig9
0
vatf
21
4
txn
ip4
01
U1
10
22
20
U5
02
16
7
ZNF6
1
U4
01
22
4
U1
20
86
7
vam
p5
25
5
taf1
22
48
U1
20
91
11
U1
01
26
8
lpp
14
4
U1
10
5
U1
02
41
97
Ots
20
82
34
Tfex
31
82
LEI8
7
Hp
aI4
36
U1
01
61
15
U4
04
22
9
STR
07
AC
BP
79
GP
DH
2
CFP
1
Mkp
ro1
29
zP3
b
red
d1
41
4
U1
00
41
83
apo
e83
U1
00
37
5
U1
21
41
07
STC
41
0
Tfex
10
75
0
Hp
aI9
9
pp
ie7
4
met
A2
53
GH
II24
61
mtD
NA
all
MH
C2
19
02
51
Av
era
ge
locu
s co
ntr
ibu
tio
n (
%)
ov
er
ma
in p
rin
cip
al
com
po
ne
nts
Locus

WASSIP Technical Document 6: Locus selection for sockeye salmon
100
1049 Figure 14. Weir and Cockerham‟s FST (1984) among populations within fine-scale regions (θS) of 36 test populations (Table 1) 1050
ordered from lowest (Left) to highest (Right). See text and Table 8 for details. 1051
-0.05
0
0.05
0.1
0.15
0.2
0.25
0.3
0.35
0.4
0.45
gad
d4
52
69
zn7
06
68
RH
2o
p3
95
ccd
16
13
1
ctgf
30
1
MA
RC
KS2
41
HG
FA
U1
20
55
7
serp
in
U1
00
21
01
U1
10
41
38
tsh
B9
2
U1
21
58
2
CD
92
69
dd
s52
9
pIn
s
KP
NA
42
2
RF2
95
DD
X5
86
PIP
ssrd
13
5
sast
21
1
U1
01
47
4
U1
01
76
2
U1
01
08
1
RA
G3
93
c39
8
U1
20
31
75
U1
21
01
73
U1
10
1
U1
01
31
08
U1
20
45
3
VIM
56
9
pax
72
48
U3
01
92
cin
17
7
E2
U1
21
19
7
RF1
12
rab
1a7
6
gdh
21
2
KC
T14
53
U1
02
41
97
IL8
r36
2
spf3
02
07
U1
21
62
30
U1
20
61
08
rpo
2j2
61
ald
B1
52
U1
00
99
1
U1
20
14
92
U5
03
17
0
GP
DH
sys1
23
0
cetn
11
67
Prl
2
SUM
O1
6
U5
04
14
1
UC
A2
4
U5
02
16
7
vatf
21
4
hcs
71
22
0
vam
p5
25
5
Ots
21
31
81
U1
01
26
8
taf1
22
48
GTH
a
psm
e23
54
Hsp
47
agt1
32
U1
20
91
11
U4
01
22
4
U1
20
21
05
2
U5
08
53
3
U1
10
22
20
srp
09
12
7
ghsR
66
p5
35
76
U1
21
21
06
U1
20
86
7
Ig9
0
AC
BP
79
lpp
14
4
ZNF6
1
U1
10
3
STR
07
U1
10
5
GP
DH
2
RA
G1
10
3
U1
01
61
15
U4
04
22
9
LEI8
7
txn
ip4
01
Mkp
ro1
29
CFP
1
red
d1
41
4
Hp
aI4
36
Ots
20
82
34
zP3
b
Tfex
31
82
U1
00
37
5
apo
e83
Tfex
10
75
0
STC
41
0
mtD
NA
all
MH
C2
19
02
51
U1
21
41
07
Hp
aI9
9
pp
ie7
4
GH
II24
61
U1
00
41
83
met
A2
53
Ove
rall
FST
am
on
g p
op
ula
tio
ns
wit
hin
re
gio
ns
Locus
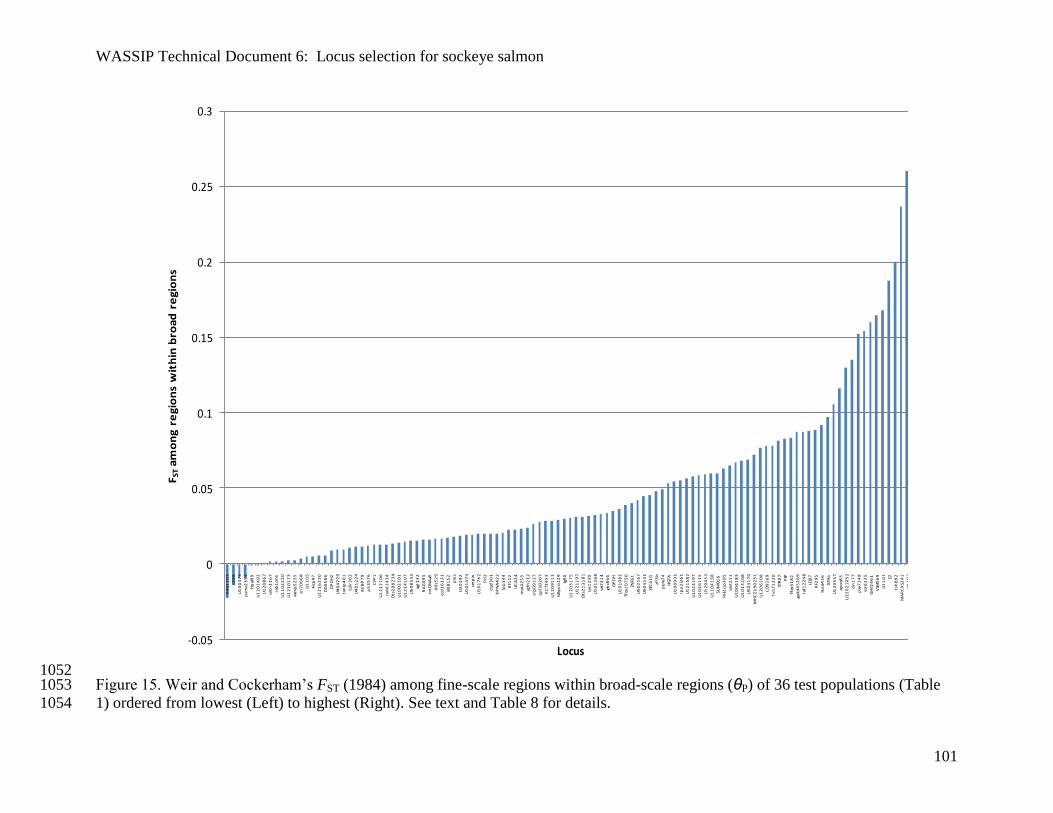
WASSIP Technical Document 6: Locus selection for sockeye salmon
101
1052 Figure 15. Weir and Cockerham‟s FST (1984) among fine-scale regions within broad-scale regions (θP) of 36 test populations (Table 1053
1) ordered from lowest (Left) to highest (Right). See text and Table 8 for details. 1054
-0.05
0
0.05
0.1
0.15
0.2
0.25
0.3
RA
G1
10
3
c39
8
U1
00
37
5
psm
e23
54
Hp
aI9
9
U1
20
14
92
U1
20
86
7
cetn
11
67
rab
1a7
6
U1
10
22
20
U1
21
01
73
vam
p5
25
5
zn7
06
68
U1
10
5
Hsp
47
U1
21
62
30
DD
X5
86
GP
DH
2
U4
04
22
9
txn
ip4
01
IL8
r36
2
U4
01
22
4
AC
BP
79
p5
35
76
CFP
1
U1
21
21
06
red
d1
41
4
Ots
20
82
34
U1
00
21
01
U1
21
41
07
U5
08
53
3
agt1
32
RA
G3
93
mtD
NA
all
dd
s52
9
ccd
16
13
1
ald
B1
52
pIn
s
U3
01
92
U1
01
47
4
serp
in
U1
01
76
2
Prl
2
ctgf
30
1
KP
NA
42
2
lpp
14
4
RF1
12
UC
A2
4
met
A2
53
gdh
21
2
srp
09
12
7
spf3
02
07
KC
T14
53
U1
20
91
11
Mkp
ro1
29
Ig9
0
U1
20
31
75
U1
21
19
7
Ots
21
31
81
sys1
23
0
U1
01
26
8
vatf
21
4
ghsR
66
GP
DH
U1
01
08
1
Tfex
10
75
0
ZNF6
1
U5
02
16
7
U5
04
14
1
STC
41
0
zP3
b
pp
ie7
4
HG
FA
U1
00
99
1
rpo
2j2
61
U1
21
58
2
U1
02
41
97
U1
01
61
15
U1
20
45
3
U1
10
41
38
SUM
O1
6
RH
2o
p3
95
sast
21
1
U1
00
41
83
U1
01
31
08
U5
03
17
0
MH
C2
19
02
51
U1
20
61
08
CD
92
69
hcs
71
22
0
STR
07
PIP
Tfex
31
82
gad
d4
52
69
taf1
22
48
LEI8
7
RF2
95
Hp
aI4
36
GTH
a
U1
20
55
7
apo
e83
U1
20
21
05
2
cin
17
7
pax
72
48
ssrd
13
5
GH
II24
61
VIM
56
9
U1
10
1
E2
tsh
B9
2
MA
RC
KS2
41
U1
10
3
Ove
rall
FST
am
on
g r
eg
ion
s w
ith
in b
roa
d r
eg
ion
s
Locus

WASSIP Technical Document 6: Locus selection for sockeye salmon
102
1055 Figure 16. Weir and Cockerham‟s FST (1984) between populations within pairs of populations (θPairs) of 36 test populations (Table 1) 1056
ordered from lowest (Left) to highest (Right). See text and Table 8 for details. 1057
-0.1
0
0.1
0.2
0.3
0.4
0.5
0.6
gad
d4
52
69
pax
72
48
zn7
06
68
MA
RC
KS2
41
RH
2o
p3
95
U1
01
76
2
serp
in
U5
02
16
7
ssrd
13
5
U1
21
58
2
gdh
21
2
U4
01
22
4
ctgf
30
1
HG
FA
U1
21
62
30
pIn
s
cin
17
7
U1
01
31
08
SUM
O1
6
U1
01
47
4
U1
20
55
7
KC
T14
53
dd
s52
9
U1
10
22
20
pp
ie7
4
c39
8
met
A2
53
U1
21
41
07
U1
20
86
7
U1
20
14
92
tsh
B9
2
KP
NA
42
2
U1
00
21
01
agt1
32
U1
01
08
1
U1
21
01
73
rab
1a7
6
U1
20
31
75
U1
10
1
U5
03
17
0
Hp
aI9
9
sys1
23
0
U1
21
19
7
PIP
IL8
r36
2
U5
04
14
1
U1
10
41
38
RF1
12
CD
92
69
U1
00
37
5
U1
10
3
apo
e83
U3
01
92
Mkp
ro1
29
GP
DH
ald
B1
52
GTH
a
U1
20
45
3
U1
21
21
06
red
d1
41
4
U1
20
91
11
U1
20
61
08
DD
X5
86
ghsR
66
Prl
2
sast
21
1
vam
p5
25
5
Ots
21
31
81
U1
20
21
05
2
LEI8
7
RA
G3
93
VIM
56
9
U4
04
22
9
Ig9
0
cetn
11
67
E2
srp
09
12
7
lpp
14
4
U1
02
41
97
U1
10
5
spf3
02
07
CFP
1
zP3
b
UC
A2
4
RF2
95
U1
00
99
1
U1
01
26
8
U5
08
53
3
rpo
2j2
61
Hp
aI4
36
taf1
22
48
psm
e23
54
hcs
71
22
0
Hsp
47
STR
07
U1
01
61
15
Ots
20
82
34
MH
C2
19
02
51
txn
ip4
01
GH
II24
61
ZNF6
1
vatf
21
4
AC
BP
79
RA
G1
10
3
STC
41
0
GP
DH
2
p5
35
76
mtD
NA
all
Tfex
10
75
0
Tfex
31
82
U1
00
41
83
Ove
rall
FST
am
on
g p
op
ula
tio
ns
wit
hin
pa
irs
of
po
pu
lati
on
s o
f in
tere
st t
o A
DF
&G
Locus

WASSIP Technical Document 6: Locus selection for sockeye salmon
103
1058 Figure 17. The number of measures of differentiation (of 14 total) between 7 pairs of populations (Table 1) that each of 124 SNPs 1059
(Table 2) ranked in the top 96 for, ordered from lowest (Left) to highest (Right). See text and Tables 9 and 10 for details. 1060
0
2
4
6
8
10
12
14
16
bck
B1
37
ccd
16
13
1
Ig9
0
lep
tin9
2
zn7
06
68
U1
01
76
2
gad
d4
52
69
txn
ip4
01
U1
00
21
01
U1
10
41
38
rab
1a7
6
taf1
22
48
MA
RC
KS
24
1
pp
ie7
4
RH
2o
p3
95
Tfe
x3
18
2
apo
e83
met
A2
53
p5
35
76
serp
in
U5
08
53
3
vat
f21
4
CF
P1
spf3
02
07
U1
00
99
1
U1
10
22
20
U1
20
14
92
U1
21
41
07
c39
8
dd
s52
9
E2
GH
II2
46
1
Hp
aI9
9
Hsp
47
mtD
NA
all
Ots
20
82
34
Ots
21
31
81
pIn
s
RA
G3
93
RF
29
5
sast
21
1
SU
MO
16
sys1
23
0
Tfe
x1
07
50
U1
01
08
1
U1
01
26
8
U1
10
3
U1
20
21
05
2
U1
20
55
7
U1
21
62
30
U5
04
14
1
ZN
F6
1
zP3
b
CD
92
69
ctg
f30
1
DD
X5
86
gd
h2
12
GP
DH
GT
Ha
hcs
71
22
0
LE
I87
Mk
pro
12
9
Prl
2
RA
G1
10
3
RF
11
2
srp
09
12
7
ST
C4
10
tsh
B9
2
U1
00
41
83
U1
20
31
75
U1
21
01
73
U1
21
19
7
U1
21
58
2
U3
01
92
U4
04
22
9
U5
02
16
7
U5
03
17
0
UC
A2
4
AC
BP
79
agt1
32
ald
B1
52
cetn
11
67
cin
17
7
gh
sR6
6
GP
DH
2
HG
FA
Hp
aI4
36
IL8
r36
2
KC
T1
45
3
KP
NA
42
2
lpp
14
4
MH
C2
19
02
51
pax
72
48
PIP
psm
e23
54
red
d1
41
4
rpo
2j2
61
ssrd
13
5
ST
R0
7
U1
00
37
5
U1
01
31
08
U1
01
47
4
U1
01
61
15
U1
02
41
97
U1
10
1
U1
10
5
U1
20
45
3
U1
20
61
08
U1
20
86
7
U1
20
91
11
U1
21
21
06
U4
01
22
4
vam
p5
25
5
VIM
56
9
Nu
mb
er o
f m
easu
res
in t
he
top
ra
nk
ed 9
6
Locus

WASSIP Technical Document 6: Locus selection for sockeye salmon
104
1061 Figure 18. A color-coded representation of rankings ordered by sum of ranks vertically (Top – Bottom: lowest sum of ranks to highest 1062
sum of ranks) and category of judges horizontally (Left – Right: Laboratory measures, Hardy-Weinberg, principle component 1063
analyses, FSTs and measures of differentiation between pairs of populations of interest) for the 115 SNPs that were not removed from 1064
consideration. Note the horizontal break separating the 96 SNPs with the lowest sum of ranks above and the 19 SNPs selected for 1065
removal below the break.1066
34.5 47 84.5 64 59.5 42.5 87.5 85 92.5 2 1.5 1 7 26 14 1 3 3 1 1 3 3 2 2 13 19 1 1 1 2
3.5 1.5 4.5 2 3.5 1.5 4.5 1 21 7 17.5 2 8 79 4 2 55 44 97.5 110 37 22 22 30 58 66 78.5 58 2 1
3.5 3 4.5 16 3.5 3 4.5 15 21 7 17.5 2 8 79 4 2 55 44 97.5 110 37 22 22 30 58 66 78.5 58 2 1
3.5 1.5 12 15 3.5 1.5 12 24 21 7 17.5 2 8 79 4 2 55 44 97.5 110 37 22 22 30 58 66 78.5 58 2 1
116.5 95 106 115 70 84 99 106 92.5 2 1.5 1 7 26 14 1 3 3 1 1 3 3 2 2 13 19 1 1 1 2
44.5 14.5 31 48 89 23.5 26 16 60.5 9 44.5 11 11 12 60 12 19 21 97.5 103 16 14 93 109 18 15 4 5 22 19
67.5 63 81 50 28 73 85 63 114.5 62.5 6 11 2 29 1 3 1 1 77 83 1 1 1 1 7 11 78.5 98 14 9
56.5 24 38.5 54 91 13 34 41 60.5 35 50.5 49.5 46 14 55 28 8 8 6 6 11 10 81 69 32 29 90 109 5 5
41.5 14.5 38.5 18 95.5 17 34 27 21 84 60.5 69 69 92 67 62 18 22 2 2 4 6 18 24 59 51 90 76 43 36
52 8 26 57 101 9 22.5 32 60.5 55 71 33.5 30 67 34 26 56 39 3 3 17 15 83 73 70 54 14 21 80 66
41.5 4 38.5 26 61.5 4 34 43 21 48 55 33.5 42 59 51 54 75 53 11 19 19 21 61 63 36 28 51 56 91.5 91
30.5 11 31 33 39 5 26 39 60.5 62.5 55 33.5 48 52 25 51 5 15 4 4 81 69 57.5 53 93 97 60 90 52 35
99.5 105.5 118.5 69 13 14 74 45 60.5 32.5 81 21 23 35 16 5 4 4 30.5 12 50 45 48 34 79 64 65 44 24 18
77.5 35.5 58 63 104 69.5 62 21 21 55 29 69 36 50 48 27 59 45 10 8 39 31 55 44 87 82 20 13 38 32
47.5 8 31 34 107 15 26 58 109.5 3 32 3.5 3 7 12 4 62 67 90.5 77 73.5 66 52 47 87 75 2 2 93 100
25.5 14.5 26 14 35 74 38 19 21 100 29 21 13 20 2 45 86 85 52 37 35 35 3 3 85 98 90 107 93 104
84.5 40.5 71 65 55.5 20 47.5 83 21 8 81 11 12 110 62 19 48 74 84.5 80 41 43 11 8 72 63 52 35 9 6
14.5 85 12 23 47 105 12 44 21 1 4 3.5 1 64 85 7 94.5 103 45 79 58 103 93 87 51.5 74 3 42 26 37
61.5 28 38.5 85 72.5 12 34 36 92.5 84 17.5 69 65 38 23 64 23 18 41 25 59 47 49 43 10 8 48 52 93 93
47.5 40.5 71 43 93 55 69 46 21 26 60.5 49.5 60 49 57 33 9 11 54.5 40 92.5 91 7 6 74 76 26 18 62 42
72 28 51 88 80.5 21 39.5 78 60.5 62.5 39 69 92 8 103 57 54 47 17 14 72 62 45 40 29 26 27 15 25 22
47.5 11 20 95 76 10 18.5 102 109.5 32.5 91 33.5 29 46 11 31 13 12 80 52 43 33 9 9 75.5 56 63.5 48 93 107
37.5 58 64.5 45 68.5 78 84 53 92.5 30 81 21 21 17 42 17 38 36 15 21 71 54 91 113 60.5 40 50 41 17 11
90 55 58 79 23 51 41.5 73 60.5 48 25.5 21 31 90 9 41 30 20 71 61 87 72 71 59 22 20 71 64 13 13
7.5 97 12 11 7.5 108 12 30 21 41.5 14 33.5 53 45 104 88 16 41 64 69 75 89 67 89 26 60 90 69 4 27
25.5 11 20 31 48.5 67 18.5 65 21 55 101 69 79 9 110 75 84 72 24 20 73.5 49 35 33 16 10 42 34 93 96
22 40.5 20 53 54 91 18.5 98 21 105.5 25.5 49.5 24 112 8 90 33 62 43.5 98 67.5 81 16 62 6 2 29 24 57 76
14.5 18 12 24 15 85 12 37 21 62.5 17.5 69 88 48 77 91 94.5 111 59.5 73 36 60 76 82 9 24 53 51 41 39
47.5 5 12 46 37 6 12 55 21 72 35.5 49.5 63 39 26 44 34 25 97.5 89 92.5 87 28 19 62 45 85 79 93 98
20 40.5 51 6 40 87 73 10 21 62.5 44.5 89 95 16 27 103 36 75 13.5 65 5 17 50.5 54 39.5 86 90 99 46 43
32.5 28 64.5 35 46 45.5 77 28 21 72 64.5 89 74 66 64 81 46 42 19.5 15 64 53 91 80 2 6 78.5 97 10 14
67.5 47 51 104 52 42.5 56.5 107 21 16.5 91 49.5 49 54 44 48 44 40 30.5 36 63 40 47 32 23 21 23 14 93 102
72 24 20 44 57 37 18.5 68 60.5 48 101 89 85 56 74 60 87 58 93 97 6 4 24 17 71 49 15 3 44 38
41.5 32 78 41 95.5 59 91 42 21 84 9 49.5 44 98 18 70 88 84 100 99 30 23 25 35 1 1 38 27 50 46
99.5 78.5 98 77 33 36 86 56 60.5 20.5 55 33.5 26 99 32 15 25 29 38 33 89.5 82 31 26 25 17 36 28 86 70
116.5 78.5 98 93 36 71.5 81 80 60.5 48 20.5 21 27 22 17 10 14 9 62 53 2 2 72.5 70 11 9 85 94 79 85
77.5 35.5 71 109 29.5 40 47.5 105 21 10.5 71 8 10 47 3 20 85 88 78.5 58 92.5 102 5 4 93 71 31 30 51 44
112.5 90 101.5 106 14 31.5 80 96 21 48 39 21 16 15 22 14 50 37 69.5 59 52 48 36 38 30 22 82 77 58.5 55
52 8 20 91 88 8 18.5 62 92.5 26 81 33.5 33 106 83 13 80 65 51 29 21 19 66 60 27.5 13 72.5 67 93 64
99.5 47 64.5 62 92 42.5 43 88 92.5 100 11.5 69 83 5 73 35 71 56 32 23 92.5 73 64 61 3 4 10 7 23 20
56.5 19.5 64.5 38 66 75 65 47 92.5 26 1.5 8 6 83 84 8 47 63 104.5 104 8 13 41.5 102 81.5 93 30 83 15 24
52 24 58 47 101 54 75.5 48 92.5 20.5 5 14.5 18 88 30 16 42 43 53 44 92.5 105 30 27 78 68 75.5 105 28 26
77.5 47 71 52 85.5 60 47.5 59 60.5 62.5 91 89 64 76 56 47 17 16 66 60 70 51 17 10 35 31 58 47 21 21
20 6 51 78 16.5 7 56.5 101 21 84 101 69 61 27 72 46 37 31 35 24 49 46 39 42 77 58 66.5 65 84 97
20 83 38.5 19 16.5 102 50.5 4 21 41.5 91 49.5 28 1 61 95 51.5 81 104.5 107 47 75 83 96 45 81 17.5 63 3 3
28.5 70 58 30 78 94 75.5 77 60.5 12.5 32 21 22 94 39 72 94.5 91 34 31 44 58 68 55 65 80 12.5 68 7 7
103 83 90.5 67 10 49 59.5 79 21 93.5 17.5 69 54 65 28 29 2 2 101.5 92 92.5 80 6 5 63.5 59 47 40 42 41
44.5 17 31 55 67 26 44.5 69 60.5 72 44.5 89 90 73 92 96 65 57 57.5 42 14 12 26 25 42 33 90 82 45 45
72 47 84.5 36 80.5 16 87.5 34 92.5 32.5 44.5 33.5 70 36 33 80 39 48 76 67 28 36 93 90 54 61 68.5 55 8 4
99.5 95 88.5 32 109 89 93 8 60.5 12.5 101 21 25 95 6 63 68 60 36 72 22 38 23 51 27.5 34 72.5 73 18 15
77.5 53 81 56 58 33 90 74 109.5 72 29 49.5 43 81 78 25 66 46 74.5 45 18 16 43 48 83 62 40 29 19 16
67.5 21.5 31 74 77 39 26 84 92.5 72 14 49.5 81 34 54 68 69.5 70 67 71 45.5 39 86 78 48 36 6 4 63 58
84.5 90 111 75 55.5 65 109 61 21 16.5 71 14.5 17 86 52 6 7 13 88.5 78 82 67 57.5 46 21 18 37 26 72 86
25.5 55 12 21 48.5 96 12 49 60.5 14 64.5 49.5 37 62 35 77 53 79 12 28 61.5 77 74 88 69 72 34 111 74.5 84
84.5 55 64.5 102 105 66 65 99 109.5 37 20.5 14.5 19 58 58 11 11 10 63 47 53 56 19 14 93 92 28 19 81.5 82
61.5 63 58 60.5 60.5 58.5 60.75 60.5 92.5 5.5 71 21 15 85 15 38 58 80 46 49 79 94 15 21 43 41 55 36 93 108
61.5 58 94 28 72.5 53 104 31 60.5 41.5 91 69 84 102 76 66 40 38 28 17 48 29 10 15 53 37 41 39 53 106
67.5 35.5 51 72 52 69.5 56.5 20 60.5 62.5 14 49.5 72 63 101 42 12 7 59.5 48 78 65 62.5 56 46 27 90 102 70 54
52 32 71 27 63 19 69 11 92.5 100 81 102 101 3 81 98 24 52 42 46 92.5 95 32 52 17 38 39 25 56 53
61.5 21.5 51 39 72.5 22 39.5 40 21 55 35.5 69 68 61 31 76 67 69 104.5 75 45.5 32 93 99 5 3 75.5 70 83 94
109 109 115 119 110 88 115 116 92.5 26 50.5 8 9 43 7 9 15 14 65 43 7 5 56 58 93 100 8 9 49 47
61.5 78.5 101.5 92 72.5 77 102 64 92.5 84 32 69 77 10 95 18 20 27 47 32 15 18 91 71 87 73 21 16 34 31
56.5 103 111 49 43.5 83 112 52 60.5 55 81 49.5 51 23 19 65 21 17 95 114 65 52 37 23 31 25 16 17 89.5 95
77.5 19.5 31 59 85.5 25 26 33 92.5 100 109 107.5 99 24 63 74 94.5 109 7 7 12 7 77 67 4 5 85 87 67 59
37.5 47 81 40 31 42.5 103 71 92.5 62.5 55 69 71 60 90 83 89.5 82 21.5 13 34 34 50.5 65 34 43 7 32 91.5 89
94 40.5 45 60 45 35 53 57 109.5 93.5 50.5 102 96 68 80 58 27 28 86 82 31 26 65 64 38 39 70 60 12 10
109 78.5 58 86 26 52 62 100 60.5 93.5 71 102 106 40 98 69 69.5 86 72 66 32 28 8 11 24 16 49 49 11 8
114.5 90 107 89 20 31.5 108 86 60.5 26 71 49.5 40 11 43 53 75 61 23 11 26 24 83 75 75.5 53 22 10 93 110
77.5 63 98 111 85.5 29 100 111 60.5 5.5 25.5 5.5 5 108 71 24 82 100 48 51 42 44 54 37 81.5 105 32 33 32 25
77.5 51.5 64.5 87 29.5 58 65 50 60.5 16.5 91 33.5 41 91 100 23 83 76 16 16 84 83 34 22 68 50 82 86 64 50
37.5 73 51 12 90 98 56.5 3 21 41.5 22.5 33.5 52 51 10 87 94.5 112 54.5 76 85 100 21 20 48 84 90 91 77 65
90 63 75.5 99 23 47 67 94 60.5 84 7 69 34 87 53 59 72.5 55 68 41 51 42 69 81 20 23 90 78 33 23
41.5 40.5 84.5 51 61.5 11 95 93 60.5 37 71 69 80 6 40 82 41 32 87 86 29 50 80 83 37 32 63.5 62 87.5 75
99.5 67.5 90.5 96 33 18 59.5 91 60.5 110 55 89 93 21 68 84 64 64 56 38 9 8 88 76 44 42 54 37 31 30
61.5 88 114 37 113 90 116 26 21 4 71 14.5 14 42 29 40 51.5 87 74.5 93 27 37 62.5 49 51.5 65 90 106 54 48
61.5 28 38.5 22 117 76 50.5 25 21 72 91 89 91 30 46 100 78 71 33 84 24 59 93 105 14.5 55 60 74 36 33
109 73 103 118 26 38 107 119 60.5 41.5 101 69 66 25 50 37 10 6 81.5 57 66 41 27 28 89 87 25 11 81.5 71
90 28 45 90 79 45.5 53 87 109.5 72 101 89 67 97 97 67 6 5 18 10 10 11 93 108 91.5 83 19 12 74.5 73
90 67.5 71 112 23 34 69 114 21 100 44.5 89 76 4 36 86 31 23 39 27 40 30 59.5 45 91.5 89 66.5 59 93 114
77.5 51.5 45 66 85.5 48 37 35 92.5 110 91 89 59 53 70 22 91 90 49.5 30 25 25 20 18 93 99 74 71 67 60
67.5 73 94 105 97 81 105 112 21 72 60.5 69 87 80 41 93 22 19 9 22 67.5 78 44 31 93 104 12.5 50 20 17
96 58 58 82 94 62 41.5 70 60.5 37 71 49.5 56 32 93 32 77 59 29 18 92.5 86 88 97 48 35 62 45 67 62
52 35.5 38.5 68 101 63 34 67 92.5 72 44.5 89 82 28 94 50 60 50 94 62 80 64 79 74 93 90 5 23 39 52
84.5 70 84.5 80 83 68 83 81 92.5 93.5 22.5 69 62 107 82 36 89.5 98 5 9 92.5 110 40 36 57 47 9 6 47 40
34.5 14.5 38.5 103 59.5 23.5 71 108 60.5 105.5 81 89 78 74 59 55 49 34 88.5 91 92.5 74 29 16 60.5 48 33 22 93 103
99.5 63 58 100 33 56.5 62 82 92.5 105.5 11.5 49.5 57 70 47 43 61 49 90.5 56 20 20 85 79 93 96 45 31 73 83
23 104 26 17 50 109 22.5 13 92.5 20.5 25.5 33.5 47 18 21 85 94.5 104 104.5 111 54.5 101 72.5 94 93 111 56 75 69 68
109 70 78 81 26 50 78 60 60.5 84 9 49.5 55 44 66 39 43 24 101.5 100 89.5 70 70 50 84 78 68.5 54 71 63
67.5 63 88.5 73 52 64 98 72 60.5 48 35.5 33.5 50 101 45 49 75 77 57.5 39 83 61 88 84 93 94 46 66 40 29
13 110 4.5 5 18 112 4.5 5 60.5 10.5 101 33.5 20 93 13 99 94.5 106 78.5 96 38 85 93 98 93 114 90 101 89.5 80
56.5 63 94 70 43.5 56.5 89 76 109.5 72 109 89 58 105 37 56 80 78 83 50 69 55 59.5 68 39.5 44 11 8 78 79
84.5 98 108 76 118 93 113 89 60.5 32.5 81 69 75 55 69 94 26 26 81.5 64 33 27 75 57 8 7 43 46 93 90
25.5 92.5 20 108 64 107 18.5 113 21 26 9 33.5 35 89 5 97 94.5 96 21.5 81 54.5 88 93 93 93 91 90 88 76 72
32.5 75 45 98 98 97 53 110 21 84 60.5 102 108 69 99 105 94.5 92 69.5 95 61.5 76 33 66 14.5 30 17.5 53 29 51
28.5 78.5 78 20 106 99 96 22 92.5 84 91 102 105 13 91 101 45 54 13.5 70 23 57 53 86 67 77 90 104 48 69
37.5 63 87 9 68.5 80 101 12 92.5 84 50.5 89 86 111 86 78 94.5 110 37 34 92.5 84 38 39 50 57 35 92 93 92
119 105.5 118.5 83 111 82 110 29 92.5 55 35.5 69 98 78 89 79 28 30 40 26 89.5 63 14 13 12 12 44 38 93 99
109 99.5 111 97 114 95 111 97 92.5 84 81 69 45 109 20 21 92 94 8 5 13 9 12 7 90 70 90 93 6 12
105 78.5 94 113 41 71.5 82 104 116 55 60.5 89 97 75 96 61 32 35 49.5 35 92.5 106 13 12 55 52 82 72 60 56
10 113 4.5 8 9 113 4.5 23 21 72 71 89 103 84 79 108 94.5 89 104.5 90 92.5 112 93 77 93 108 90 95 27 34
30.5 111 105 117 116 110 117 118 21 26 3 5.5 4 41 87 30 94.5 102 25 55 60 71 41.5 72 93 101 90 112 85 88
12 114 20 10 21 114 30 17 21 93.5 109 102 102 33 65 109 63 73 19.5 63 92.5 93 93 111 93 102 90 81 93 112
16.5 107 45 7 82 111 72 7 60.5 16.5 44.5 33.5 32 57 38 92 94.5 105 104.5 113 92.5 114 93 114 93 112 90 89 61 67
18 83 4.5 29 65 103 4.5 54 21 41.5 39 89 89 71 106 102 94.5 113 43.5 109 57 98 93 104 93 107 90 96 93 111
105 99.5 116.5 42 99 101 120 18 109.5 20.5 71 33.5 38 103 88 52 94.5 99 26.5 94 92.5 108 93 91 73 67 57 43 37 49
105 87 94 116 75 30 92 117 60.5 48 91 69 39 82 24 89 35 92 92 66 89.5 102 93 14 19 100 90 81 87.5 107
3.5 118.5 20 13 3.5 115.5 30 14 21 110 109 111.5 112 19 111 110 94.5 97 104.5 108 92.5 109 93 103 63.5 95 90 85 55 87
84.5 95 104 101 112 86 106 90 114.5 110 91 102 94 96 49 71 29 33 61 54 77 79 93 110 56 46 60 61 30 28
16.5 86 31 71 38 104 44.5 103 60.5 110 109 109.5 110 31 107 106 94.5 101 73 68 56 90 93 101 66 88 90 113 16 57
120 112 120 114 120 100 119 92 60.5 93.5 109 102 100 37 102 34 72.5 51 97.5 74 86 68 46 41 80 79 24 20 58.5 61
90 32 71 84 103 28 47.5 51 92.5 84 44.5 69 73 104 75 73 80 68 104.5 88 92.5 97 78 85 93 106 78.5 114 93 113
7.5 115.5 12 1 7.5 115.5 12 6 21 100 101 109.5 109 77 112 113 94.5 114 104.5 106 92.5 113 93 92 93 110 90 108 93 101
10 115.5 4.5 58 11.5 115.5 4.5 95 21 105.5 101 111.5 111 100 109 111 94.5 107 104.5 101 92.5 99 93 106 41 85 90 103 93 78
94 101 113 110 115 92 114 115 21 84 60.5 102 107 2 108 104 94.5 93 26.5 85 92.5 111 93 95 33 69 90 110 35 77
114.5 108 116.5 120 119 106 118 120 21 100 109 107.5 104 72 105 107 57 83 84.5 105 76 96 4 29 93 113 90 80 65 74
Hig
hes
t su
m o
f ran
ks –
Low
est
sum
of
ran
ks
Laboratory measures HW PCA FSTs Pairs of populations measures
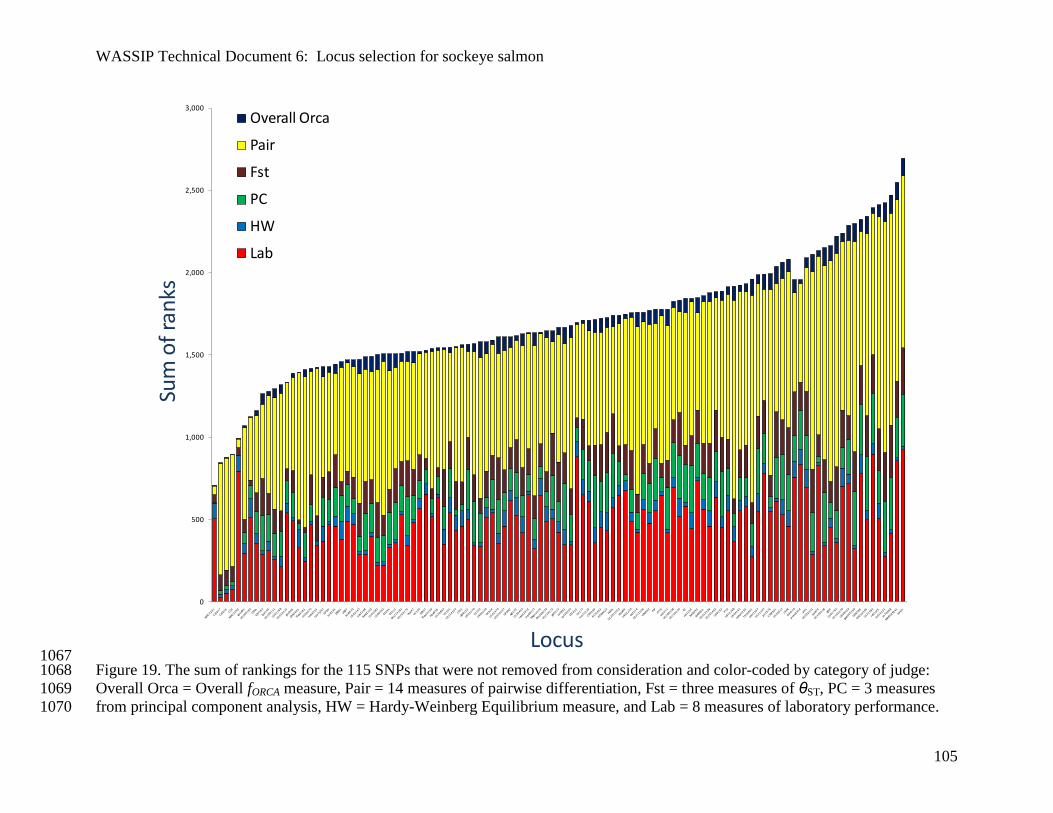
WASSIP Technical Document 6: Locus selection for sockeye salmon
105
1067 Figure 19. The sum of rankings for the 115 SNPs that were not removed from consideration and color-coded by category of judge: 1068
Overall Orca = Overall fORCA measure, Pair = 14 measures of pairwise differentiation, Fst = three measures of θST, PC = 3 measures 1069
from principal component analysis, HW = Hardy-Weinberg Equilibrium measure, and Lab = 8 measures of laboratory performance.1070
0
500
1,000
1,500
2,000
2,500
3,000
Overall Orca
Pair
Fst
PC
HW
Lab
Locus
Sum
of
ran
ks
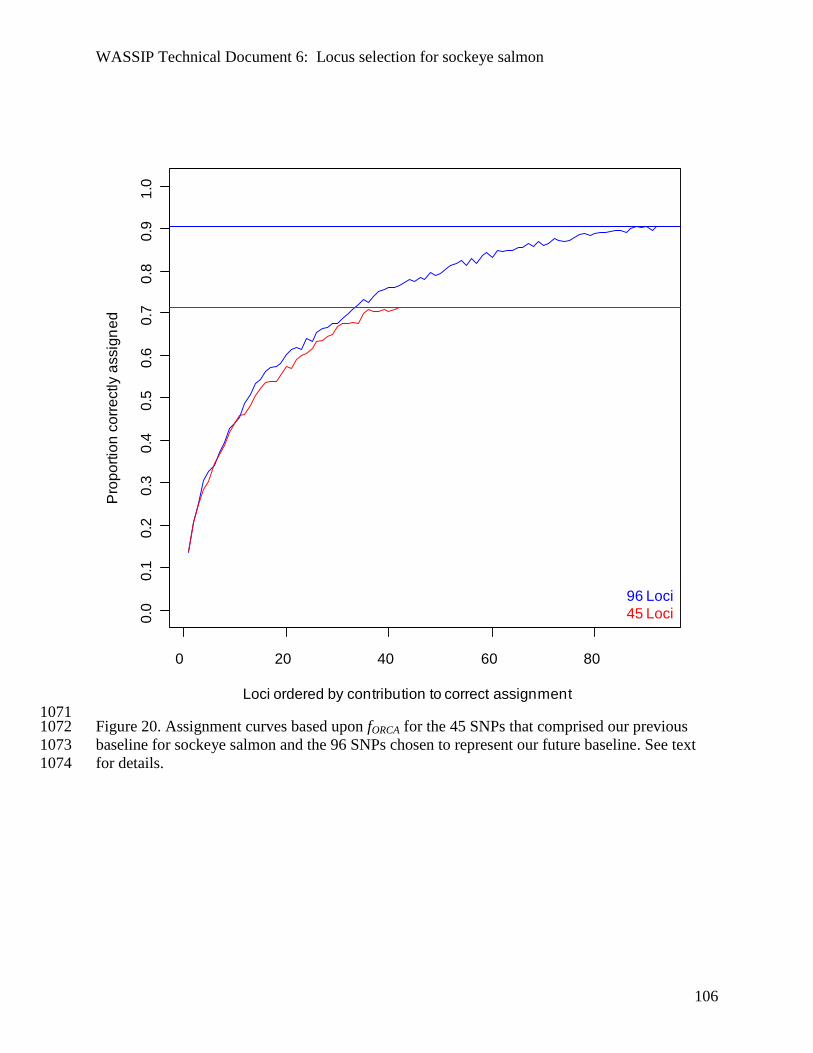
WASSIP Technical Document 6: Locus selection for sockeye salmon
106
1071 Figure 20. Assignment curves based upon fORCA for the 45 SNPs that comprised our previous 1072
baseline for sockeye salmon and the 96 SNPs chosen to represent our future baseline. See text 1073
for details. 1074
0 20 40 60 80
0.0
0.1
0.2
0.3
0.4
0.5
0.6
0.7
0.8
0.9
1.0
Loci ordered by contribution to correct assignment
Pro
po
rtio
nco
rre
ctly a
ssig
ne
d
96 Loci
45 Loci
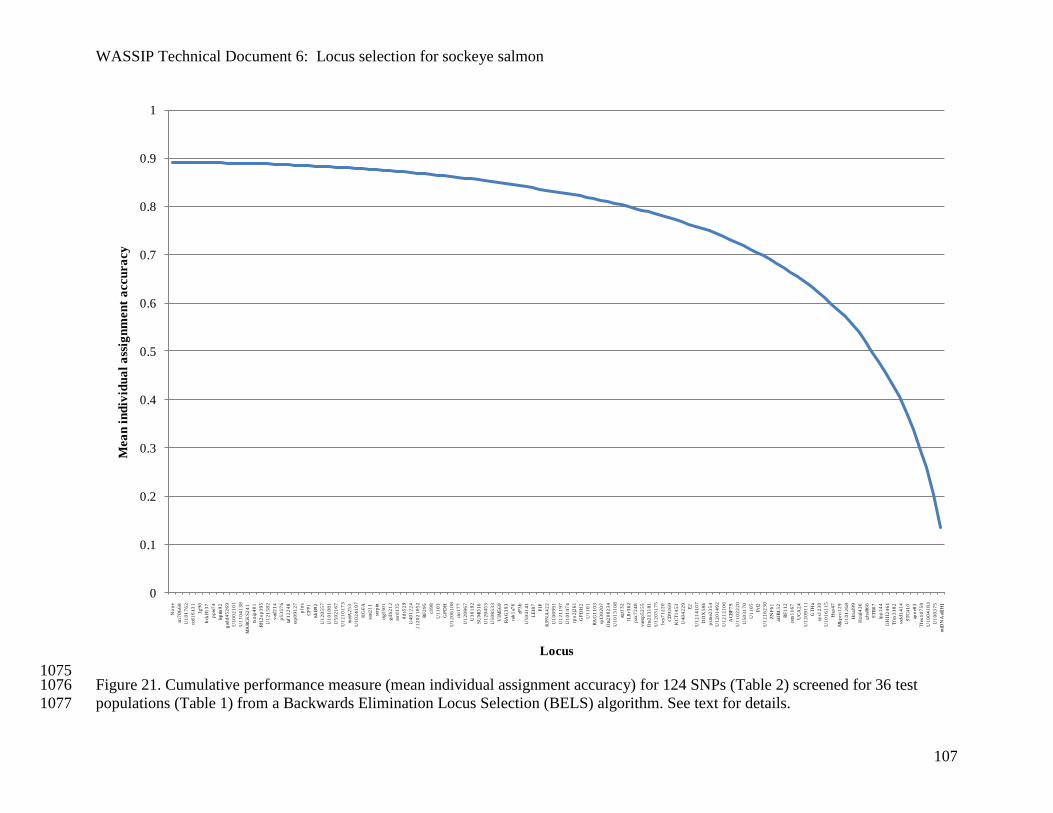
WASSIP Technical Document 6: Locus selection for sockeye salmon
107
1075 Figure 21. Cumulative performance measure (mean individual assignment accuracy) for 124 SNPs (Table 2) screened for 36 test 1076
populations (Table 1) from a Backwards Elimination Locus Selection (BELS) algorithm. See text for details. 1077
0
0.1
0.2
0.3
0.4
0.5
0.6
0.7
0.8
0.9
1
No
ne
zn7
06
68
U1
01
76
2
ccd
16
13
1
Ig9
0
bck
B1
37
pp
ie7
4
lep
tin9
2
gad
d4
52
69
U1
00
21
01
U1
10
41
38
MA
RC
KS
24
1
txn
ip4
01
RH
2o
p3
95
U1
21
58
2
vat
f21
4
p5
35
76
taf1
22
48
srp
09
12
7
pIn
s
CF
P1
tsh
B9
2
U1
20
55
7
U1
01
08
1
U5
02
16
7
U1
21
01
73
met
A2
53
U1
02
41
97
HG
FA
sast
21
1
serp
in
ctg
f30
1
gd
h2
12
ssrd
13
5
dd
s52
9
U4
01
22
4
U1
20
21
05
2
RF
29
5
c39
8
U1
10
3
GP
DH
U1
20
61
08
cin
17
7
U1
20
86
7
U3
01
92
SU
MO
16
U1
20
45
3
U5
08
53
3
VIM
56
9
RA
G3
93
rab
1a7
6
zP3
b
U5
04
14
1
LE
I87
PIP
KP
NA
42
2
U1
00
99
1
U1
21
19
7
U1
01
47
4
rpo
2j2
61
GP
DH
2
U1
10
1
RA
G1
10
3
spf3
02
07
Ots
20
82
34
U1
01
31
08
agt1
32
IL8
r36
2
pax
72
48
vam
p5
25
5
Ots
21
31
81
U1
20
31
75
hcs
71
22
0
CD
92
69
KC
T1
45
3
U4
04
22
9
E2
U1
21
41
07
DD
X5
86
psm
e23
54
U1
20
14
92
U1
21
21
06
AC
BP
79
U1
10
22
20
U5
03
17
0
U1
10
5
Prl
2
U1
21
62
30
ZN
F6
1
ald
B1
52
RF
11
2
cetn
11
67
UC
A2
4
U1
20
91
11
GT
Ha
sys1
23
0
U1
01
61
15
Hsp
47
Mk
pro
12
9
U1
01
26
8
Hp
aI9
9
Hp
aI4
36
gh
sR6
6
ST
R0
7
lpp
14
4
GH
II2
46
1
Tfe
x3
18
2
red
d1
41
4
ST
C4
10
apo
e83
Tfe
x1
07
50
U1
00
41
83
U1
00
37
5
mtD
NA
all[
H]
Mea
n i
nd
ivid
ua
l a
ssig
nm
en
t a
ccu
ra
cy
Locus