Global Mapping of Structural Solutions Provided by the Extended X-ray Absorption Fine Structure ab...
10
Global Mapping of Structural Solutions Provided by the Extended X-ray Absorption Fine Structure ab Initio Code FEFF 6.01: Structure of the Cryogenic Photoproduct of the Myoglobin-Carbon Monoxide Complex ² Mark R. Chance,* Lisa M. Miller, Robert F. Fischetti, Eva Scheuring, Wu-Xin Huang, Bianca Sclavi, Yang Hai, and Michael Sullivan Regional Center for Time-ResolVed Synchrotron Spectroscopy, Department of Physiology and Biophysics, Albert Einstein College of Medicine of YeshiVa UniVersity, 1300 Morris Park AVenue, Bronx, New York 10461, and National Synchrotron Light Source, BrookhaVen National Laboratory, Upton, New York 11973 ReceiVed March 6, 1996 X ABSTRACT: X-ray methods based on synchrotron technology have the promise of providing time-resolved structural data based on the high flux and brightness of the X-ray beams. One of the most closely examined problems in this area of time-resolved structure determination has been the examination of intermediates in ligand binding to myoglobin. Recent crystallographic experiments using synchrotron radiation have identified the protein tertiary and heme structural changes that occur upon photolysis of the myoglobin- carbon monoxide complex at cryogenic temperatures [Schlichting, I., Berendzen, J., Phillips, G., & Sweet, R. (1994) Nature 371, 808-812]. However, the precision of protein crystallographic data (∼0.2 Å) is insufficient to provide precise metrical details of the iron-ligand bond lengths. Since bond length changes on this scale can trigger reactivity changes of several orders of magnitude, such detail is critical to a full understanding of metalloprotein structure-function relationships. Extended X-ray absorption fine structure (EXAFS) spectroscopy has the potential for analyzing bond distances to a precision of 0.02 Å but is hampered by its relative insensitivity to the geometry of the backscattering atoms. Thus, it is often unable to provide a unique solution to the structure without ancillary structural information. We have developed a suite of computer programs that incorporate this ancillary structural information and compute the expected experimental spectra for a wide ranging series of Cartesian coordinate sets (global mapping). The programs systematically increment the distance of the metal to various coordinating ligands (along with their associated higher shells). Then, utilizing the ab initio EXAFS code FEFF 6.01, simulated spectra are generated and compared to the actual experimental spectra, and the differences are computed. Finally, the results for hundreds of simulations can be displayed (and compared) in a single plot. The power of this approach is demonstrated in the examination of high signal to noise EXAFS data from a photolyzed solution sample of the myoglobin-carbon monoxide complex at 10 K. Evaluation of these data using our global mapping procedures placed the iron to pyrrole nitrogen average distances close to the value for deoxymyoglobin (2.05 ( 0.01 Å), while the distance from iron to the proximal histidine nitrogen is seen to be 2.20 ( 0.04 Å. It is also shown that one cannot uniquely position the CO ligand on the basis of the EXAFS data alone, as a number of reasonable minima (from the perspective of the EXAFS) are observed. This provides a reasonable explanation for the multiplicity of solutions that have been previously reported. The results presented here are seen to be in complete agreement with the crystallographic results of Schlichting et al. (1994) within the respective errors of the two techniques; however, the extended X-ray absorption fine structure data allow the iron-ligand bond lengths to be precisely defined. An examination of the available spectroscopic data, including EXAFS, shows that the crystallographic results of Schlichting et al. (1994) are highly relevant to the physiological solution state and must be taken into account in any attempt to understand the incomplete relaxation process of the heme iron for the Mb*CO photoproduct at low temperature. Structural information on the solution states of biomol- ecules has been of paramount importance in determining biological function, and structural spectroscopic techniques have been instrumental in defining these structure-function relationships for many years. The application of techniques like resonance Raman, FTIR, EPR, NMR, and X-ray spectroscopy to solution samples of biomolecules has revolutionized our understanding of the structure-function relationships controlling biological chemistry. Time-resolVed methods of structural spectroscopy have been particularly valuable in investigating the dynamics of key structures. A major objective of time-resolved structure-function studies is to gain a better understanding of the structure of intermediate states and thus elucidate the nature of dynamic changes in structure that bridge the static end points provided ² This work is supported by NIH Grants HL-45892 and RR-01633. M.R.C. is the holder of the Joseph and Anne Wunsch Fellowship in Biophysical Engineering from the Albert Einstein College of Medicine. L.M.M., R.F.F., E.S., and W.-X.H. contributed equally to this paper. The construction and operation of beamline X9B is supported by the Biotechnology Research Resource program of the National Institutes of Health, P41-RR01633. The NSLS is supported by the Department of Energy, Division of Materials Sciences. * Author to whom correspondence should be addressed at the Albert Einstein College of Medicine of Yeshiva University. Phone, 718-430- 4136; Fax, 718-430-8819; e-mail, [email protected]. X Abstract published in AdVance ACS Abstracts, June 15, 1996. 9014 Biochemistry 1996, 35, 9014-9023 S0006-2960(96)00550-8 CCC: $12.00 © 1996 American Chemical Society
Transcript of Global Mapping of Structural Solutions Provided by the Extended X-ray Absorption Fine Structure ab...

Global Mapping of Structural Solutions Provided by the Extended X-ray AbsorptionFine Structureab Initio Code FEFF 6.01: Structure of the Cryogenic Photoproduct
of the Myoglobin-Carbon Monoxide Complex†
Mark R. Chance,* Lisa M. Miller, Robert F. Fischetti, Eva Scheuring, Wu-Xin Huang, Bianca Sclavi,Yang Hai, and Michael Sullivan
Regional Center for Time-ResolVed Synchrotron Spectroscopy, Department of Physiology and Biophysics, Albert EinsteinCollege of Medicine of YeshiVa UniVersity, 1300 Morris Park AVenue, Bronx, New York 10461, and National Synchrotron
Light Source, BrookhaVen National Laboratory, Upton, New York 11973
ReceiVed March 6, 1996X
ABSTRACT: X-ray methods based on synchrotron technology have the promise of providing time-resolvedstructural data based on the high flux and brightness of the X-ray beams. One of the most closely examinedproblems in this area of time-resolved structure determination has been the examination of intermediatesin ligand binding to myoglobin. Recent crystallographic experiments using synchrotron radiation haveidentified the protein tertiary and heme structural changes that occur upon photolysis of the myoglobin-carbon monoxide complex at cryogenic temperatures [Schlichting, I., Berendzen, J., Phillips, G., & Sweet,R. (1994)Nature 371, 808-812]. However, the precision of protein crystallographic data (∼0.2 Å) isinsufficient to provide precise metrical details of the iron-ligand bond lengths. Since bond length changeson this scale can trigger reactivity changes of several orders of magnitude, such detail is critical to a fullunderstanding of metalloprotein structure-function relationships. Extended X-ray absorption fine structure(EXAFS) spectroscopy has the potential for analyzing bond distances to a precision of 0.02 Å but ishampered by its relative insensitivity to the geometry of the backscattering atoms. Thus, it is often unableto provide a unique solution to the structure without ancillary structural information. We have developeda suite of computer programs that incorporate this ancillary structural information and compute the expectedexperimental spectra for a wide ranging series of Cartesian coordinate sets (global mapping). The programssystematically increment the distance of the metal to various coordinating ligands (along with theirassociated higher shells). Then, utilizing theab initio EXAFS code FEFF 6.01, simulated spectra aregenerated and compared to the actual experimental spectra, and the differences are computed. Finally,the results for hundreds of simulations can be displayed (and compared) in a single plot. The power ofthis approach is demonstrated in the examination of high signal to noise EXAFS data from a photolyzedsolution sample of the myoglobin-carbon monoxide complex at 10 K. Evaluation of these data usingour global mapping procedures placed the iron to pyrrole nitrogen average distances close to the valuefor deoxymyoglobin (2.05( 0.01 Å), while the distance from iron to the proximal histidine nitrogen isseen to be 2.20( 0.04 Å. It is also shown that one cannot uniquely position the CO ligand on the basisof the EXAFS data alone, as a number of reasonable minima (from the perspective of the EXAFS) areobserved. This provides a reasonable explanation for the multiplicity of solutions that have been previouslyreported. The results presented here are seen to be in complete agreement with the crystallographic resultsof Schlichting et al. (1994) within the respective errors of the two techniques; however, the extendedX-ray absorption fine structure data allow the iron-ligand bond lengths to be precisely defined. Anexamination of the available spectroscopic data, including EXAFS, shows that the crystallographic resultsof Schlichting et al. (1994) are highly relevant to the physiological solution state and must be taken intoaccount in any attempt to understand the incomplete relaxation process of the heme iron for the Mb*COphotoproduct at low temperature.
Structural information on thesolution states of biomol-ecules has been of paramount importance in determining
biological function, andstructural spectroscopictechniqueshave been instrumental in defining these structure-functionrelationships for many years. The application of techniqueslike resonance Raman, FTIR, EPR, NMR, and X-rayspectroscopy to solution samples of biomolecules hasrevolutionized our understanding of the structure-functionrelationships controlling biological chemistry.Time-resolVedmethodsof structural spectroscopy have been particularlyvaluable in investigating the dynamics of key structures. Amajor objective of time-resolved structure-function studiesis to gain a better understanding of the structure ofintermediate states and thus elucidate the nature of dynamicchanges in structure that bridge the static end points provided
† This work is supported by NIH Grants HL-45892 and RR-01633.M.R.C. is the holder of the Joseph and Anne Wunsch Fellowship inBiophysical Engineering from the Albert Einstein College of Medicine.L.M.M., R.F.F., E.S., and W.-X.H. contributed equally to this paper.The construction and operation of beamline X9B is supported by theBiotechnology Research Resource program of the National Institutesof Health, P41-RR01633. The NSLS is supported by the Departmentof Energy, Division of Materials Sciences.* Author to whom correspondence should be addressed at the Albert
Einstein College of Medicine of Yeshiva University. Phone, 718-430-4136; Fax, 718-430-8819; e-mail, [email protected].
X Abstract published inAdVance ACS Abstracts,June 15, 1996.
9014 Biochemistry1996,35, 9014-9023
S0006-2960(96)00550-8 CCC: $12.00 © 1996 American Chemical Society
+ +
+ +

by crystallographic or thermodynamic analysis. Crystal-lographic structural information is not precise enough tocharacterize small bond lengths changes (<0.2 Å) that areoften significant in regulating protein reactivity. In thispaper, we provide a logical extension to the prior uses oftheoretical multiple scattering codes wherein EXAFS1 ex-perimental data can be compared to a series of potentialstructural solutions. The advantage afforded by the programswe have developed is that a number of potential solutionsare simultaneously compared in an even-handed fashion, andboth the errors intrinsic to the fit and potential multipleminima can be easily visualized.The biological process of interest is ligand binding to
myoglobin, which has been intensely studied by the biophys-ics community. This is due, in part, to its intrinsic interestas a carrier of oxygen in the heart muscle (Wittenberg &Wittenberg, 1989) as well as its role as a model protein forexamining both the chemistry of heme proteins (Chance,1986; Springer et al., 1994) and theories of protein dynamicsin general (Austin et al., 1987; Frauenfelder & Wolynes,1985; Srajer et al., 1986). The binding of ligands tomyoglobin involves both an outer barrier, where the ligandmust traverse the protein matrix, and an inner barrier at theheme. Below 160 K the ligand cannot escape from theprotein matrix (Austin et al., 1975), so the rebinding reactioncan be characterized by the following:
Photolysis effects a conversion from A states (ligand on)to B states (ligand off), with the ligand trapped in the vicinityof the heme. Elapsed time or increases in temperature leadto rebinding of the ligand with the heme and thus, re-formation of A states. Below 20 K, when the ligand iscarbon monoxide (CO), 100% conversion to B states isachieved with little rebinding (Alben et al., 1982; Iizuka etal., 1974). The A states (different conformations of ligandedMbCO) are characterized by the infrared stretching frequencyof the bound CO ligand as it is sensitive to the CO bondstrength. These frequencies are observed in the range of1920-1970 cm-1 (Caughey et al., 1981; Makinen et al.,1979). The rates of interconversion between the differentA states at temperatures below 160 K are so low thatinterconversions between the A states are not observed as aresult of photolysis and recombination cycles (Ansari et al.,1987; Chance et al., 1987). The B states, generated byphotolysis of the myoglobin-carbon monoxide complex(MbCO), also have (weak) infrared signatures seen from2120 to 2140 cm-1 (Alben et al., 1982). The variation ininfrared properties of the different A and B states areassumed to arise from distinct interactions of the CO ligandwith the distal heme pocket residues. In fact, site-directedmutagenesis of the His E7 and Val E11 residues providesconsiderable alteration in infrared properties of both A andB states, and these alterations are reasonably correlated with
changes in the polarity of the heme pocket (Braunstein etal., 1993; Quillin et al., 1995; Ray et al., 1994; Springer etal., 1994).Understanding the structure of B states using a variety of
spectroscopic techniques has been of long-standing interest(Chance, 1993), since these states represent a potential waystation for the ligand along its functional trajectory, es-sentially providing a frozen snapshot of the reaction betweenthe well-established end points. The visualization of thissnapshot became a reality with the recent crystallographicdetermination of the MbCO photoproduct (Mb*CO) at 20K to 1.5 Å resolution (Schlichting et al., 1994). The excitingfeatures of this structure were (1) the ligand was located inthe heme pocket 3-4 Å from the iron atom essentiallyparallel to the heme and (2) the proximal histidine-ironcoordinate had moved close the deoxy structure but wasessentially relaxed only 75% toward the deoxy coordinates.This provided reasonable structural interpretations for boththe infrared signature of the B states, which are close to thefree gas value of the CO stretching frequency (Alben et al.,1982; Ansari et al., 1987), and the high-spin (S) 2), out-of-plane spectroscopic assignment for the iron atom basedon optical, Mossbauer, magnetic susceptibility, and X-rayabsorption spectroscopy (XAS) data (Chance, 1993; Iizukaet al., 1974; Marcolin et al., 1979; Miller & Chance, 1995;Roder et al., 1984; Spartalian et al., 1976). In addition, recenttime-resolved photoselection spectroscopy experiments haveprovided additional details about the CO ligand geometryin the bound state and its trajectory upon photolysis (Lim etal., 1995).Multiple scattering EXAFS codes have been developed
to evaluate the complex scattering interactions of naturalligands in metalloproteins. The relevant applications havesteadily grown, from simulations of scattering groups likesimple histidines to complex porphyrin macrocycles (Black-burn et al., 1988; Co & Hodgson, 1981; Hasnain & Strange,1990; Knowles et al., 1989; Liu et al., 1994; Mustre de Leonet al., 1991; Nordlander et al., 1993; Rehr & Albers, 1990;Rehr et al., 1991, 1992; Strange et al., 1987; Westre et al.,1994). We chose to utilize the FEFF program version 6.01,which has had considerable testing and success relative toknown structures (O’Day et al., 1994). The developmentof refinement techniques coupled to multiple scattering codes(Binstead et al., 1992), where crystal structure data (generallyfrom a database of small molecule data) are explicitly utilizedto reduce the number of degrees of freedom in the structure,allows the entire EXAFS spectrum as opposed to Fourier-filtered shells to be analyzed to provide a solution. Thistechnique is also frequently utilized to refine protein crystalstructure data (Brunger, 1987). Such refinement proceduresdiffer from multiple scattering based fitting procedures,where models are generated using the multiple scatteringformalisms and then used in nonlinear least squares fittingprocedures to provide the “best fit” to the experimental data.However, both methods provide excellent simulations of theunfiltered EXAFS data in the range of the wave vector (k,Å-1) from 4 and higher.We have further explored constrained refinement (Bin-
stead, 1992), focusing on global mapping where a grid ofhundreds of simulations are directly compared to theexperimental data with minimal use of nonlinear least squaresfitting procedures to find the interatomic distances. Eachsimulation is performed with different interatomic distances.
1 Abbreviations: CO, carbon monoxide; EXAFS, extended X-rayabsorption fine structure; MbCO, myoglobin-carbon monoxide com-plex; Mb*CO, photolyzed myoglobin-carbon monoxide complex; Ne,proximal histidine nitrogen; Np, pyrrole nitrogen; XAS, X-ray absorptionspectroscopy.
MbCOA i
798hν
Mb*COBj
Global Mapping of XAS Solutions to Heme Proteins Biochemistry, Vol. 35, No. 28, 19969015
+ +
+ +
The advent of fast, inexpensive Pentium and Power PCcomputers makes such calculations within the reach of anylaboratory. The emphasis of our approach is to map the localand global minima and provide a detailed visual picture anderror analysis in the comparison of alternative structures. Thethree-dimensional structural coordinates utilized in thesimulations are based on crystal structure models derivedfrom structural databases. Thus, a particular geometry forthe metal site is incorporated in this choice. Alternativestructures with different geometries can also be selected,processed, and compared. This makes the structural as-sumptions about the site explicit, and they must be justifiedon the basis of ancillary structural information. Our suiteof programs (called AUTOFIT 1.0) start with the selectedstructure file, vary selected bond distances, compare theresultingab initio simulations to the experimental data, andcompute and plot a figure that displays 400-500 alternativesolutions simultaneously. We settled on a pseudo-three-dimensional representation whereinx andy values representparticular bond distances that are varied (for example, iron-histidine nitrogen and iron-pyrrole nitrogen distances), whilethe color of the intersecting squares indicates the adequacyof the fit. Yellow indicates the best fit of the grid, rangingto red, blue, green, and black.Several previous EXAFS investigations (Chance et al.,
1983; Powers et al., 1987; Teng et al., 1987) have providedconflicting values for the iron-pyrrole nitrogen distancesand the distance to CO in the heme pocket. We utilizedglobal mapping methods to investigate the possible reasonsfor the variations in observed solutions. We also collectednew experimental data that are extremely high in signal-noise so that the fitting can be carried over ak range of 4-15Å-1. In addition, the intermediate state has been verifiedwith respect to sample occupancy by low-temperature opticalspectroscopy before and after EXAFS data collection. Theresults presented here demonstrate that the EXAFS spectracan accurately determine a number of important structuralparameters for heme proteins; however, the presence ofmultiple minima invites caution in the structural interpreta-tions.
METHODS
Sample Occupancy. Horse skeletal muscle myoglobin waspurchased from Sigma. MbCO was prepared at 0.5 mMconcentration, and the sample was adjusted to pH 9.0 with100 mM potassium phosphate buffer as described previously(Miller & Chance, 1994, 1995). We have recently shownthat, at low temperature, horse skeletal muscle myoglobinexhibits a single A state at pH 9.0 [A1, 1946 cm-1 (Miller& Chance, 1995)] and a single B state subsequent tophotolysis (unpublished observation). Thus, we consider itpreferable for these investigations. It should be noted thateach previous determination of the B-state structure may haveinadvertently utilized a different population of substates. Thecrystallographic result (recombinant sperm whale) is likelybased on an A0 substate (Zhu et al., 1992). The EXAFSinvestigations of Powers et al. (1987) used sperm whaleMbCO at pH 6.4, which has a mixture of A1 and A0 states,while those of Teng et al. (1987), which utilized a driedMbCO film, were also likely based on the A0 substate(Brown et al., 1983). The different A states give rise todifferent B states, and the effect of this on the results ofthese different investigations is of significant interest. Opti-
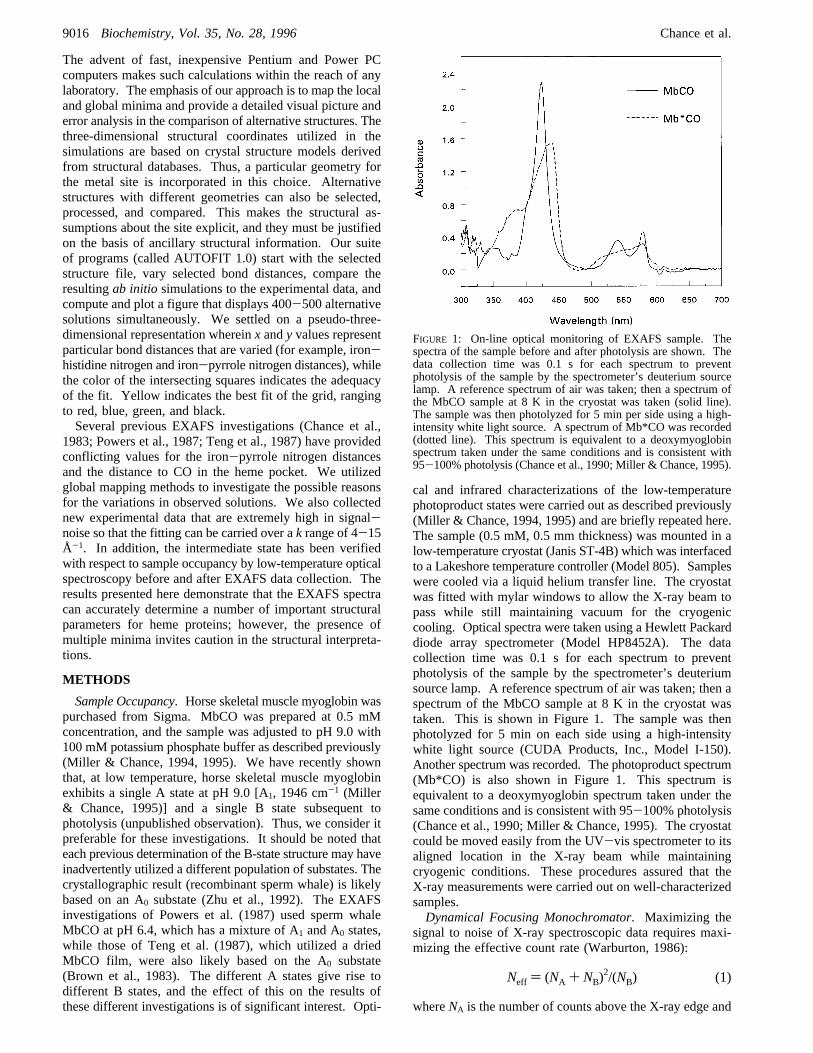
cal and infrared characterizations of the low-temperaturephotoproduct states were carried out as described previously(Miller & Chance, 1994, 1995) and are briefly repeated here.The sample (0.5 mM, 0.5 mm thickness) was mounted in alow-temperature cryostat (Janis ST-4B) which was interfacedto a Lakeshore temperature controller (Model 805). Sampleswere cooled via a liquid helium transfer line. The cryostatwas fitted with mylar windows to allow the X-ray beam topass while still maintaining vacuum for the cryogeniccooling. Optical spectra were taken using a Hewlett Packarddiode array spectrometer (Model HP8452A). The datacollection time was 0.1 s for each spectrum to preventphotolysis of the sample by the spectrometer’s deuteriumsource lamp. A reference spectrum of air was taken; then aspectrum of the MbCO sample at 8 K in the cryostat wastaken. This is shown in Figure 1. The sample was thenphotolyzed for 5 min on each side using a high-intensitywhite light source (CUDA Products, Inc., Model I-150).Another spectrum was recorded. The photoproduct spectrum(Mb*CO) is also shown in Figure 1. This spectrum isequivalent to a deoxymyoglobin spectrum taken under thesame conditions and is consistent with 95-100% photolysis(Chance et al., 1990; Miller & Chance, 1995). The cryostatcould be moved easily from the UV-vis spectrometer to itsaligned location in the X-ray beam while maintainingcryogenic conditions. These procedures assured that theX-ray measurements were carried out on well-characterizedsamples.Dynamical Focusing Monochromator. Maximizing the
signal to noise of X-ray spectroscopic data requires maxi-mizing the effective count rate (Warburton, 1986):
whereNA is the number of counts above the X-ray edge and
FIGURE 1: On-line optical monitoring of EXAFS sample. Thespectra of the sample before and after photolysis are shown. Thedata collection time was 0.1 s for each spectrum to preventphotolysis of the sample by the spectrometer’s deuterium sourcelamp. A reference spectrum of air was taken; then a spectrum ofthe MbCO sample at 8 K in the cryostat was taken (solid line).The sample was then photolyzed for 5 min per side using a high-intensity white light source. A spectrum of Mb*CO was recorded(dotted line). This spectrum is equivalent to a deoxymyoglobinspectrum taken under the same conditions and is consistent with95-100% photolysis (Chance et al., 1990; Miller & Chance, 1995).
Neff ) (NA + NB)2/(NB) (1)
9016 Biochemistry, Vol. 35, No. 28, 1996 Chance et al.
+ +
+ +
NB is the number of counts below the edge. This formulaexplicitly acknowledges the degradation of the XAS spec-troscopy signal caused by increasing backgrounds. Thedevelopment of energy-resolving detectors as common placetools has reducedNB considerably for typical experiments;however, the count rate limitations of the detectors limit theNA values that are attainable (Cramer et al., 1988; Warburton,1986). Due to the need to assure adequate photolysis andoptical monitoring of the myoglobin sample, we settled ona concentration of 0.5 mM. At metal concentrations lessthan 1 mM the ratio of signal to background needs to beimproved for high signal to noise data to be acquired. Toincrease the available X-ray flux to optimize these experi-ments, hardware modifications were made to the X-rayspectroscopy beamline X-9B at NSLS.
The monochromator on beamline X-9B at the NationalSynchrotron Light Source is a double crystal design.Horizontal focusing can be achieved by replacing the flat,second crystal with a thin crystal which is mounted in abending stage and is elastically bent to a cylindrical or conicalcross section (Habenschuss et al., 1988). The crystal hassteel ribs (0.6 mm thick) glued to the back side of the crystalat a spacing of 3 mm in order to reduce the effect ofanticlastic bending (Sparks et al., 1982). The Si(111) crystalis 65 mm wide and can collect up to 3.9 mrad of synchrotronradiation in the horizontal direction. The horizontal focalsize ranges from 0.3 to 0.7 mm full width at half-maximum.The smallest focal sizes are observed at the highest X-rayenergies and shortest monochromator to focus distances(focal lengths). The current X-ray energy range for thesagittal focusing monochromator is 4.0-11.9 keV. An 800mm long nickel mirror collects all of the vertical divergencefrom the source and can provide vertical focusing whenelastically bent to an elliptical cross section. However, forthese experiments the mirror was flat and held at an angleof 4.5 mrad to reject higher harmonics. The measured X-rayflux at the beamline with the sagittal monochromatorinstalled, primary apertures (X-ray beam defining slits beforethe optics) and the hutch apertures (X-ray beam defining slitsafter the optics) fully open, and the mirror set at an angle toprovide harmonic rejection is in the range of 1.8-3.1× 10¹¹
photons s-1 per 100 mA of beam current per 3.9 mrad ofhorizontal acceptance per 0.1% bandwidth for 6-11 keV.The experiments of this paper were carried out with verticalslits set at 1.5 mm and approximately 2× 10¹¹ photons s-1
of beam flux. This is four times the flux delivered to thespecimen over the alternative flat crystal monochromator (fora typical sample size of 15 mm width).
For these spectroscopic experiments, since the sample was6 mm in diameter, only a 1 mm focus was maintained onthe sample. The sample was mounted at the usual 45°incidence, and the germanium detector viewed the sampleat 90° relative to the incident X-ray beam. A calibrationchannel with an iron foil was also utilized to account forany energy shifts in the monochromator. Due to the highflux, incident count rates on the detector were high enoughto cause dead time losses that were significant (Cramer etal., 1988). The detector incident count rate was reduced to40 000 counts s-1 channel-1 by placing a vacuum flight tubein front of the cryostat and guard slits in front of the sample.In addition, the detector was carefully shielded with lead.The small, well-defined beam and a detection geometry close
to ideal (90°) for all channels of the 13-element detectorimproved theNeff. TheNeff for the experiments was increased3-4-fold relative to the running conditions with the flatcrystal monochromator.Sixteen EXAFS scans of the Mb*CO photoproduct sample
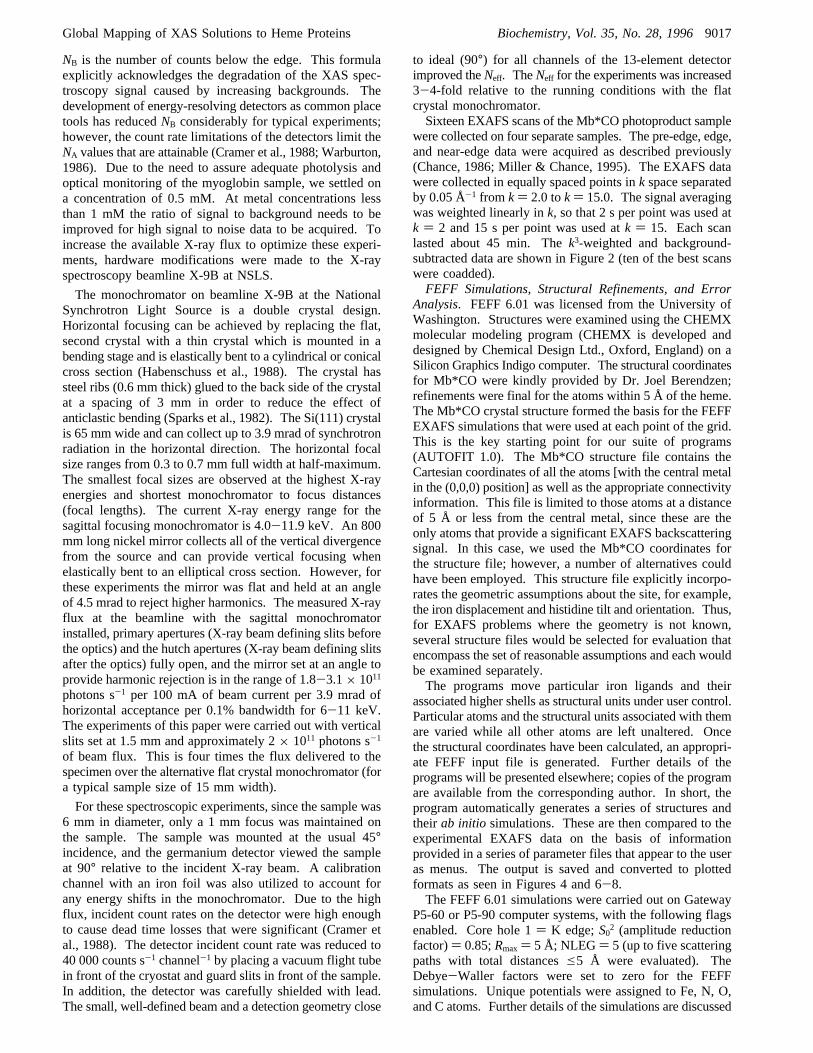
were collected on four separate samples. The pre-edge, edge,and near-edge data were acquired as described previously(Chance, 1986; Miller & Chance, 1995). The EXAFS datawere collected in equally spaced points ink space separatedby 0.05 Å-1 from k) 2.0 tok) 15.0. The signal averagingwas weighted linearly ink, so that 2 s per point was used atk ) 2 and 15 s per point was used atk ) 15. Each scanlasted about 45 min. Thek3-weighted and background-subtracted data are shown in Figure 2 (ten of the best scanswere coadded).FEFF Simulations, Structural Refinements, and Error
Analysis. FEFF 6.01 was licensed from the University ofWashington. Structures were examined using the CHEMXmolecular modeling program (CHEMX is developed anddesigned by Chemical Design Ltd., Oxford, England) on aSilicon Graphics Indigo computer. The structural coordinatesfor Mb*CO were kindly provided by Dr. Joel Berendzen;refinements were final for the atoms within 5 Å of the heme.The Mb*CO crystal structure formed the basis for the FEFFEXAFS simulations that were used at each point of the grid.This is the key starting point for our suite of programs(AUTOFIT 1.0). The Mb*CO structure file contains theCartesian coordinates of all the atoms [with the central metalin the (0,0,0) position] as well as the appropriate connectivityinformation. This file is limited to those atoms at a distanceof 5 Å or less from the central metal, since these are theonly atoms that provide a significant EXAFS backscatteringsignal. In this case, we used the Mb*CO coordinates forthe structure file; however, a number of alternatives couldhave been employed. This structure file explicitly incorpo-rates the geometric assumptions about the site, for example,the iron displacement and histidine tilt and orientation. Thus,for EXAFS problems where the geometry is not known,several structure files would be selected for evaluation thatencompass the set of reasonable assumptions and each wouldbe examined separately.The programs move particular iron ligands and their
associated higher shells as structural units under user control.Particular atoms and the structural units associated with themare varied while all other atoms are left unaltered. Oncethe structural coordinates have been calculated, an appropri-ate FEFF input file is generated. Further details of theprograms will be presented elsewhere; copies of the programare available from the corresponding author. In short, theprogram automatically generates a series of structures andtheir ab initio simulations. These are then compared to theexperimental EXAFS data on the basis of informationprovided in a series of parameter files that appear to the useras menus. The output is saved and converted to plottedformats as seen in Figures 4 and 6-8.The FEFF 6.01 simulations were carried out on Gateway
P5-60 or P5-90 computer systems, with the following flagsenabled. Core hole 1) K edge;S02 (amplitude reductionfactor)) 0.85;Rmax) 5 Å; NLEG) 5 (up to five scatteringpaths with total distancese5 Å were evaluated). TheDebye-Waller factors were set to zero for the FEFFsimulations. Unique potentials were assigned to Fe, N, O,and C atoms. Further details of the simulations are discussed
Global Mapping of XAS Solutions to Heme Proteins Biochemistry, Vol. 35, No. 28, 19969017
+ +
+ +
in Results and Discussion. Data processing, where specified,was carried out using a PC-based Bell Labs EXAFS packagecompiled with Microsoft FORTRAN 77 (Rowlett et al.,1994; Scheuring et al., 1994). For Figures 4 and 6-8 theexperimental data and the simulations werek3 weighted,Fourier transformed, filtered from 0.8 to 4.8 Å, back-transformed, and processed by using the Bell Labs EXAFSpackage. All evaluations of∑R2 were carried out in therange of 4-15 Å-1. A series of 400 simulations takes 10-12 h of computation on the Pentium PCs.The EXAFS data resulting from the FEFF simulations are
k3 weighted, compared to the experimental data, and the sumof residuals squared is calculated:
In cases where particular shells are emphasized, and the datais Fourier filtered, identical data ranges and filter windowswere utilized for the FEFF simulation and the experimentaldata. For each grid position the∑R2 is minimized withrespect to∆E0 and∆σ2 values in a one atom type refinementto assure that a stable solution is obtained; the values werepermitted to vary up to 10 eV and 0.01 Å2, respectively(Chance, 1986; Chance et al., 1992; Lee et al., 1981; Rowlettet al., 1994). In practice, the maximum values observed forthese parameters were typically half these limits for thesimulations reported here. Thus, the Bell Labs package wasessentially used mainly to process data with equivalentkgrids and to compute sum of residuals squared.Figure 3a shows the structural coordinates for the Mb*CO
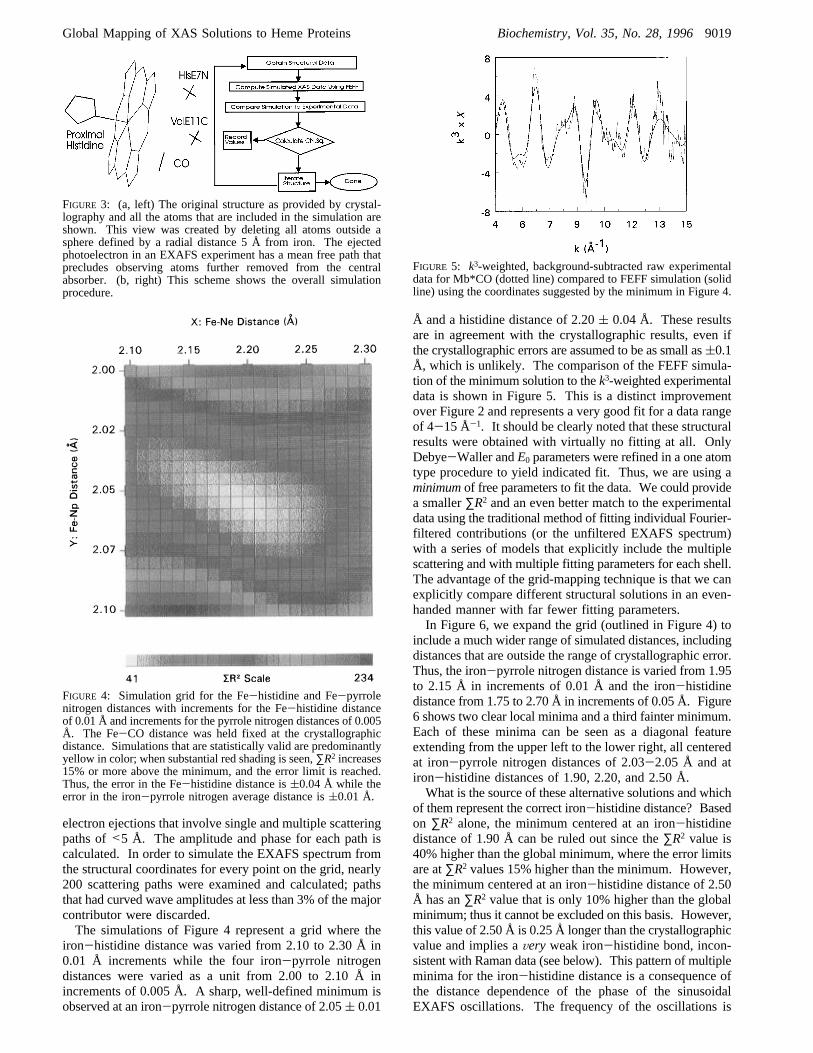
photoproduct after cutting out all atoms further than 5 Åfrom the iron atom. Notice that this excludes the vinyl andother peripheral groups of the heme, and it includes onlythe imidazole parts of the proximal histidine, the nitrogenfrom the distal histidine (His E7), and a carbon atom fromvaline (Val E11). Thirty-four atoms overall are included inthe simulation of this structure. Figure 3b outlines softwaresteps that automatically calculate the grid with user-definedranges and increments.Error analysis is carried out by a variation of the methods
outlined by Lytle et al. (1989) and further developed in depthby Powers and Kincaid (1989). The number of degrees offreedom of EXAFS data,Ndf, is calculated as follows (Leeet al., 1981; Powers & Kincaid, 1989):
Thus, for a∆r of 4 Å and ak range from 4 to 15 Å-1 therefinement of nearly 30 independent parameters can besupported. For Fourier-filtered data, the number of freeparameters in the fit (Nff) is simply the number of degreesof freedom (Ndf) in the filtered data minus the number ofparameters (Np) in the fitting procedure:
The error for a particular parameter (of particular interestare the bond distances) can be evaluated by examining thesystematic variation of that parameter with respect to thebehavior of the sum of residuals squared (∑R2) around theminimum value such that when∑R2 increases by a factor of[1 + (1/Nff)], the error limit has been reached. This equationadjusts the error limits appropriately if theNff value is high(due to an excess of free parameters in the filtered data
relative to the number of parameters in the fit) so that smallchanges inΣR2 become significant. We have modified theequation so that when the sum of residuals squared increasesto
the error limit is reached. The number of degrees of freedomare 28 for Figures 4 and 6-8. There are two distances variedon each grid, and each intersection point is minimized withrespect toE0 and∆σ2; thus the effective number of refinableparameters (Np) is 4, and the error limit is reached when∑R2 increases 15% above the minimum value for Figures 4and 6-8. In practical terms this means errors in the iron-pyrrole nitrogen average distance of(0.01 Å and errors inthe iron-histidine nitrogen distance of(0.04 Å, which arereasonable on the basis of previous analysis and the signalto noise of the data (Chance, 1986; Powers et al., 1987).
RESULTS AND DISCUSSION
Global Mapping of the Mb*CO Structure by EXAFS. TheEXAFS spectrum predicted from the crystallographic coor-dinates for the Mb*CO photoproduct was calculated and iscompared to the experimentally collected data in Figure 2.A cursory examination shows a mismatch in the phaserelationships, with the experimental data exhibiting a higheroverall frequency than the simulation, implying that thecrystallographic coordinates have an overall average of theinteratomic distances that is too short to adequately modelthe data. In addition, the amplitude of the simulation isnearly 2 times too large. A longer average distance fromiron to the pyrrole rings would be predicted to reduce theamplitude of the simulation and increase the frequency,allowing a better match to the experimental data. In orderto refine the structure to better model the EXAFS data, thepositions of atoms were varied in a systematic fashion.Figure 3a shows the original structure as provided bycrystallography and the atoms that are included in thesimulation. The calculation of the global grid was carriedout according to the overall procedure outlined in Figure 3b.The FEFF program calculates scattering paths for photo-
∑R2 ) ∑i{(k3Ìi)experimental- (k3Ìi)simulation}
2 (2)
Ndf ) (2× ∆r × ∆k)/π (3)
Nff ) Ndf - Np (4)
FIGURE 2: k3-weighted, background-subtracted raw experimentaldata for Mb*CO (dotted line) compared to FEFF simulation usingthe crystallographic coordinates of Schlichting et al. (1994) (solidline). A cursory examination shows a mismatch in the phaserelationships; in addition, the amplitude of the simulation is 2 timestoo large.
∑R2minimum× [1 + (Np/Ndf)] (5)
9018 Biochemistry, Vol. 35, No. 28, 1996 Chance et al.
+ +
+ +
electron ejections that involve single and multiple scatteringpaths of<5 Å. The amplitude and phase for each path iscalculated. In order to simulate the EXAFS spectrum fromthe structural coordinates for every point on the grid, nearly200 scattering paths were examined and calculated; pathsthat had curved wave amplitudes at less than 3% of the majorcontributor were discarded.The simulations of Figure 4 represent a grid where the
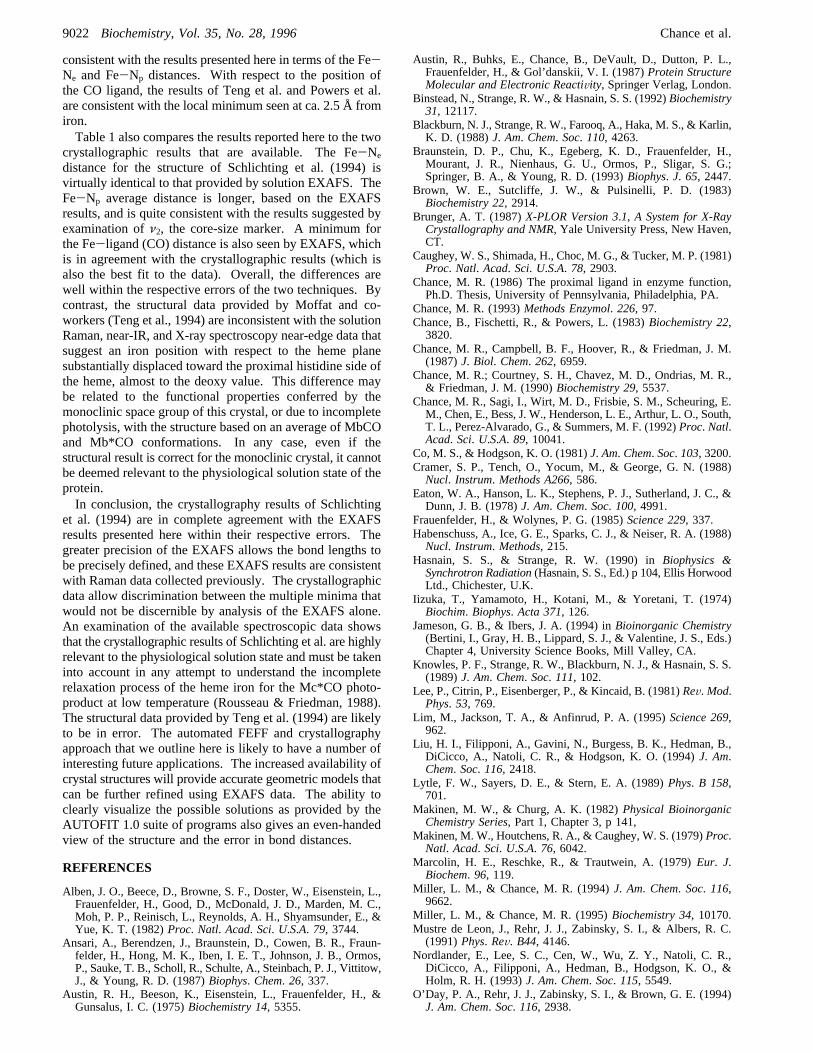
iron-histidine distance was varied from 2.10 to 2.30 Å in0.01 Å increments while the four iron-pyrrole nitrogendistances were varied as a unit from 2.00 to 2.10 Å inincrements of 0.005 Å. A sharp, well-defined minimum isobserved at an iron-pyrrole nitrogen distance of 2.05( 0.01
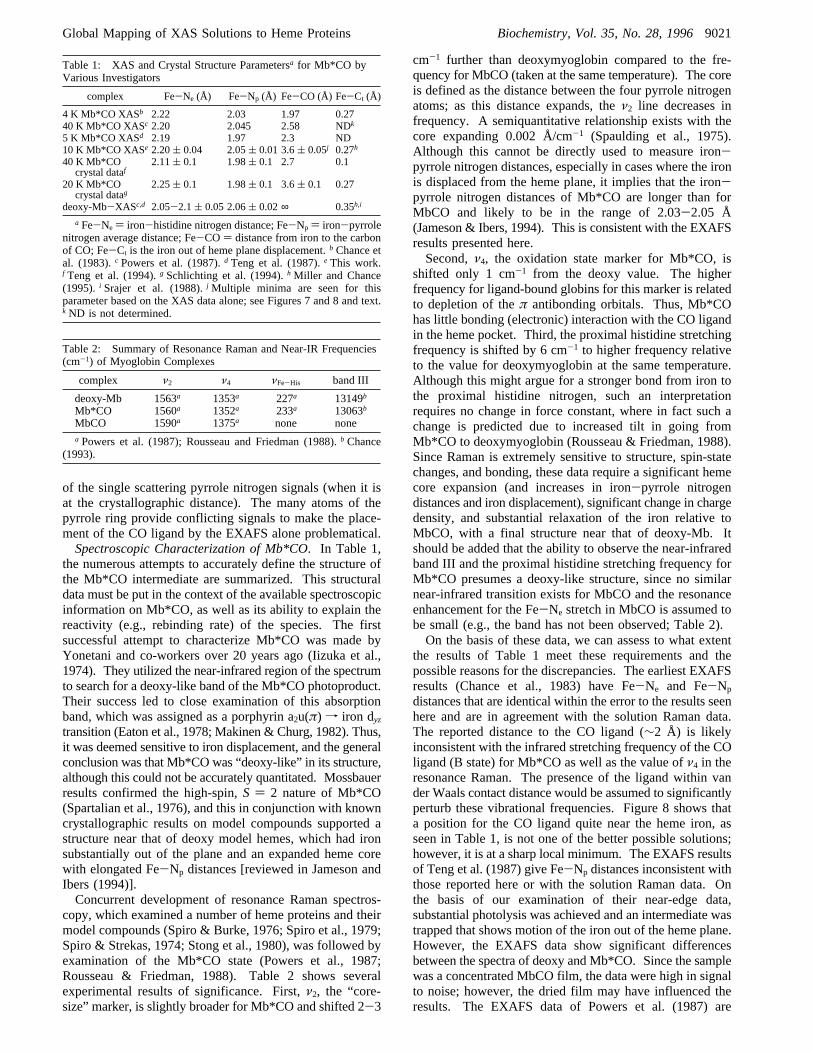
Å and a histidine distance of 2.20( 0.04 Å. These resultsare in agreement with the crystallographic results, even ifthe crystallographic errors are assumed to be as small as(0.1Å, which is unlikely. The comparison of the FEFF simula-tion of the minimum solution to thek3-weighted experimentaldata is shown in Figure 5. This is a distinct improvementover Figure 2 and represents a very good fit for a data rangeof 4-15 Å-1. It should be clearly noted that these structuralresults were obtained with virtually no fitting at all. OnlyDebye-Waller andE0 parameters were refined in a one atomtype procedure to yield indicated fit. Thus, we are using aminimumof free parameters to fit the data. We could providea smaller∑R2 and an even better match to the experimentaldata using the traditional method of fitting individual Fourier-filtered contributions (or the unfiltered EXAFS spectrum)with a series of models that explicitly include the multiplescattering and with multiple fitting parameters for each shell.The advantage of the grid-mapping technique is that we canexplicitly compare different structural solutions in an even-handed manner with far fewer fitting parameters.In Figure 6, we expand the grid (outlined in Figure 4) to
include a much wider range of simulated distances, includingdistances that are outside the range of crystallographic error.Thus, the iron-pyrrole nitrogen distance is varied from 1.95to 2.15 Å in increments of 0.01 Å and the iron-histidinedistance from 1.75 to 2.70 Å in increments of 0.05 Å. Figure6 shows two clear local minima and a third fainter minimum.Each of these minima can be seen as a diagonal featureextending from the upper left to the lower right, all centeredat iron-pyrrole nitrogen distances of 2.03-2.05 Å and atiron-histidine distances of 1.90, 2.20, and 2.50 Å.What is the source of these alternative solutions and which
of them represent the correct iron-histidine distance? Basedon ∑R2 alone, the minimum centered at an iron-histidinedistance of 1.90 Å can be ruled out since the∑R2 value is40% higher than the global minimum, where the error limitsare at∑R2 values 15% higher than the minimum. However,the minimum centered at an iron-histidine distance of 2.50Å has an∑R2 value that is only 10% higher than the globalminimum; thus it cannot be excluded on this basis. However,this value of 2.50 Å is 0.25 Å longer than the crystallographicvalue and implies aVeryweak iron-histidine bond, incon-sistent with Raman data (see below). This pattern of multipleminima for the iron-histidine distance is a consequence ofthe distance dependence of the phase of the sinusoidalEXAFS oscillations. The frequency of the oscillations is
FIGURE 3: (a, left) The original structure as provided by crystal-lography and all the atoms that are included in the simulation areshown. This view was created by deleting all atoms outside asphere defined by a radial distance 5 Å from iron. The ejectedphotoelectron in an EXAFS experiment has a mean free path thatprecludes observing atoms further removed from the centralabsorber. (b, right) This scheme shows the overall simulationprocedure.
FIGURE 4: Simulation grid for the Fe-histidine and Fe-pyrrolenitrogen distances with increments for the Fe-histidine distanceof 0.01 Å and increments for the pyrrole nitrogen distances of 0.005Å. The Fe-CO distance was held fixed at the crystallographicdistance. Simulations that are statistically valid are predominantlyyellow in color; when substantial red shading is seen,∑R2 increases15% or more above the minimum, and the error limit is reached.Thus, the error in the Fe-histidine distance is(0.04 Å while theerror in the iron-pyrrole nitrogen average distance is(0.01 Å.
FIGURE 5: k3-weighted, background-subtracted raw experimentaldata for Mb*CO (dotted line) compared to FEFF simulation (solidline) using the coordinates suggested by the minimum in Figure 4.
Global Mapping of XAS Solutions to Heme Proteins Biochemistry, Vol. 35, No. 28, 19969019
+ +
+ +

2kr, and these distance solutions represent “multiples” of afundamental oscillation that come “in phase” periodically(about every 0.3 Å). Such “multiple minima” are oftenencountered when analyzing Fourier-filtered data (Lee et al.,1981). However, such multiple minima have never beenshown for the fitting of heme protein spectra.We also analyzed the effect of moving the CO ligand on
the simulations. These results are shown in Figure 7, wherethe CO distance is varied beyond the range of the crystal-lographic error for the CO distance and where the histidineis varied in a relatively narrow range. A clear minimum isfound at a distance of 3.6 Å, identical to the crystallographicvalue. A second minimum is seen at a distance of 4.1 Åwith an∑R2 value 10% higher than that of the alternativeminimum, while an increase of at least 15% would berequired to rule the minimum out. The CO ligand observedin the heme pocket by crystallography has one atom at 3.6Å and the second atom at 4.1 Å. Thus, the minimum at thelonger distance is likely due to the backscattering signal fromthe second atom. It should be noted that both methods areinsensitive to whether the O or the C ligand is closer to theheme. However, this result indicates that assigning a uniqueposition for the CO ligand by EXAFS alone is difficult.In order to evaluate other possible solutions, including
those that have been suggested by previous investigators,we performed simulations that span a greater range of bonddistances (Figure 8). A number of different solutions areseen, although none provide fits better than the minimumcongruent with the crystallography data. It is likely that theCO backscattering signal is too small compared to the noiseof the data to have its position uniquely defined by EXAFS
alone. Examination of the individual FEFF scattering pathsshows that the total CO signal is only 6% of the amplitude
FIGURE 6: Simulation grid for the Fe-histidine and Fe-pyrrolenitrogen distances with increments for the Fe-histidine distanceof 0.05 Å and increments for the pyrrole nitrogen distances of 0.01Å. Three minima are seen; the best minimum is the one seen inFigure 4; however, the difference in∑R2 between this minimumand the one centered at a longer histidine distance is statisticallyinsignificant. The latter is ruled out on the basis of the crystal-lographic and Raman data.
FIGURE 7: Simulation grid for the Fe-histidine and Fe-COdistances with increments for the Fe-histidine distance of 0.01 Åand increments for the iron-CO distance of 0.05 Å. Two minimaare found; the one with the CO ligand further from iron is not ruledout by the statistics.
FIGURE 8: Simulation grid for the Fe-histidine and Fe-COdistances with increments for the Fe-histidine distance of 0.05 Åand increments for the iron-CO distance of 0.15 Å. Severalstatistically valid minima are observed along the grid line wherethe Fe-histidine nitrogen distance is 2.20 Å. The two best solutionsare at the crystallographic position of Schlichting et al. and 0.6 Åshorter.
9020 Biochemistry, Vol. 35, No. 28, 1996 Chance et al.
+ +
+ +
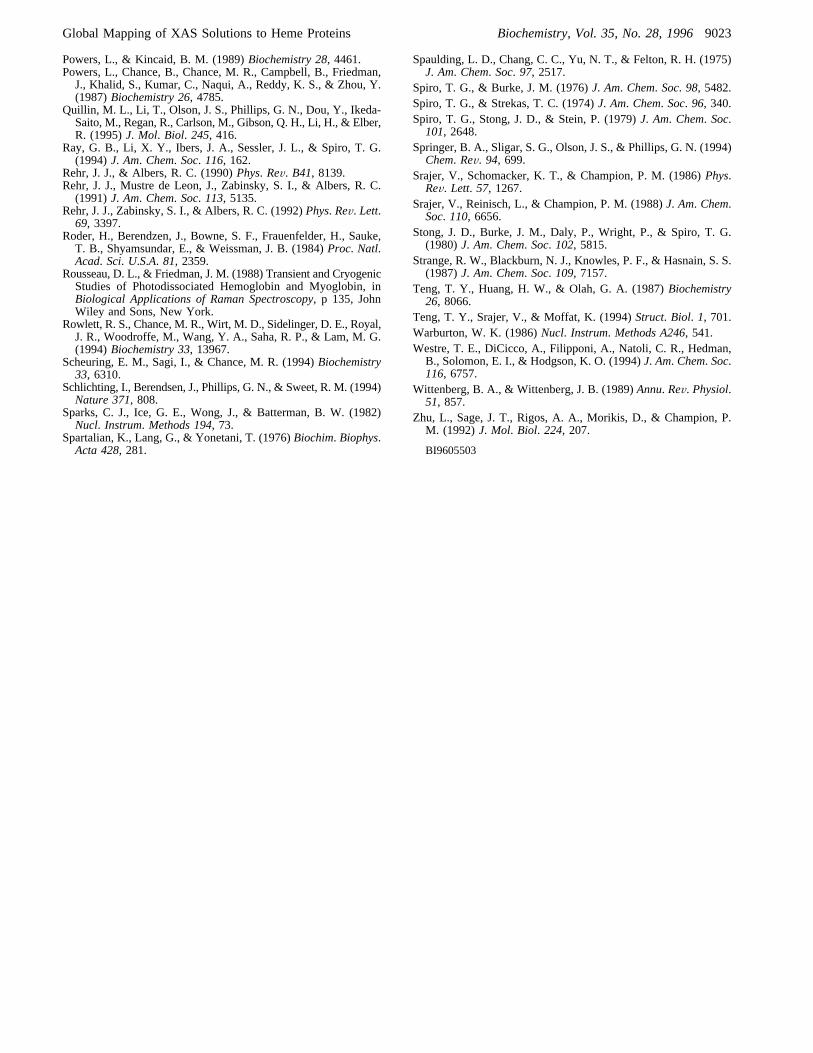
of the single scattering pyrrole nitrogen signals (when it isat the crystallographic distance). The many atoms of thepyrrole ring provide conflicting signals to make the place-ment of the CO ligand by the EXAFS alone problematical.Spectroscopic Characterization of Mb*CO. In Table 1,
the numerous attempts to accurately define the structure ofthe Mb*CO intermediate are summarized. This structuraldata must be put in the context of the available spectroscopicinformation on Mb*CO, as well as its ability to explain thereactivity (e.g., rebinding rate) of the species. The firstsuccessful attempt to characterize Mb*CO was made byYonetani and co-workers over 20 years ago (Iizuka et al.,1974). They utilized the near-infrared region of the spectrumto search for a deoxy-like band of the Mb*CO photoproduct.Their success led to close examination of this absorptionband, which was assigned as a porphyrin a2u(π) f iron dyztransition (Eaton et al., 1978; Makinen & Churg, 1982). Thus,it was deemed sensitive to iron displacement, and the generalconclusion was that Mb*CO was “deoxy-like” in its structure,although this could not be accurately quantitated. Mossbauerresults confirmed the high-spin,S ) 2 nature of Mb*CO(Spartalian et al., 1976), and this in conjunction with knowncrystallographic results on model compounds supported astructure near that of deoxy model hemes, which had ironsubstantially out of the plane and an expanded heme corewith elongated Fe-Np distances [reviewed in Jameson andIbers (1994)].Concurrent development of resonance Raman spectros-
copy, which examined a number of heme proteins and theirmodel compounds (Spiro & Burke, 1976; Spiro et al., 1979;Spiro & Strekas, 1974; Stong et al., 1980), was followed byexamination of the Mb*CO state (Powers et al., 1987;Rousseau & Friedman, 1988). Table 2 shows severalexperimental results of significance. First,ν2, the “core-size” marker, is slightly broader for Mb*CO and shifted 2-3
cm-1 further than deoxymyoglobin compared to the fre-quency for MbCO (taken at the same temperature). The coreis defined as the distance between the four pyrrole nitrogenatoms; as this distance expands, theν2 line decreases infrequency. A semiquantitative relationship exists with thecore expanding 0.002 Å/cm-1 (Spaulding et al., 1975).Although this cannot be directly used to measure iron-pyrrole nitrogen distances, especially in cases where the ironis displaced from the heme plane, it implies that the iron-pyrrole nitrogen distances of Mb*CO are longer than forMbCO and likely to be in the range of 2.03-2.05 Å(Jameson & Ibers, 1994). This is consistent with the EXAFSresults presented here.Second,ν4, the oxidation state marker for Mb*CO, is
shifted only 1 cm-1 from the deoxy value. The higherfrequency for ligand-bound globins for this marker is relatedto depletion of theπ antibonding orbitals. Thus, Mb*COhas little bonding (electronic) interaction with the CO ligandin the heme pocket. Third, the proximal histidine stretchingfrequency is shifted by 6 cm-1 to higher frequency relativeto the value for deoxymyoglobin at the same temperature.Although this might argue for a stronger bond from iron tothe proximal histidine nitrogen, such an interpretationrequires no change in force constant, where in fact such achange is predicted due to increased tilt in going fromMb*CO to deoxymyoglobin (Rousseau & Friedman, 1988).Since Raman is extremely sensitive to structure, spin-statechanges, and bonding, these data require a significant hemecore expansion (and increases in iron-pyrrole nitrogendistances and iron displacement), significant change in chargedensity, and substantial relaxation of the iron relative toMbCO, with a final structure near that of deoxy-Mb. Itshould be added that the ability to observe the near-infraredband III and the proximal histidine stretching frequency forMb*CO presumes a deoxy-like structure, since no similarnear-infrared transition exists for MbCO and the resonanceenhancement for the Fe-Ne stretch in MbCO is assumed tobe small (e.g., the band has not been observed; Table 2).On the basis of these data, we can assess to what extent
the results of Table 1 meet these requirements and thepossible reasons for the discrepancies. The earliest EXAFSresults (Chance et al., 1983) have Fe-Ne and Fe-Np
distances that are identical within the error to the results seenhere and are in agreement with the solution Raman data.The reported distance to the CO ligand (∼2 Å) is likelyinconsistent with the infrared stretching frequency of the COligand (B state) for Mb*CO as well as the value ofν4 in theresonance Raman. The presence of the ligand within vander Waals contact distance would be assumed to significantlyperturb these vibrational frequencies. Figure 8 shows thata position for the CO ligand quite near the heme iron, asseen in Table 1, is not one of the better possible solutions;however, it is at a sharp local minimum. The EXAFS resultsof Teng et al. (1987) give Fe-Np distances inconsistent withthose reported here or with the solution Raman data. Onthe basis of our examination of their near-edge data,substantial photolysis was achieved and an intermediate wastrapped that shows motion of the iron out of the heme plane.However, the EXAFS data show significant differencesbetween the spectra of deoxy and Mb*CO. Since the samplewas a concentrated MbCO film, the data were high in signalto noise; however, the dried film may have influenced theresults. The EXAFS data of Powers et al. (1987) are
Table 1: XAS and Crystal Structure Parametersa for Mb*CO byVarious Investigators
complex Fe-Ne (Å) Fe-Np (Å) Fe-CO (Å) Fe-Ct (Å)
4 K Mb*CO XASb 2.22 2.03 1.97 0.2740 K Mb*CO XASc 2.20 2.045 2.58 NDk
5 K Mb*CO XASd 2.19 1.97 2.3 ND10 K Mb*CO XASe 2.20( 0.04 2.05( 0.01 3.6( 0.05j 0.27h
40 K Mb*COcrystal dataf
2.11( 0.1 1.98( 0.1 2.7 0.1
20 K Mb*COcrystal datag
2.25( 0.1 1.98( 0.1 3.6( 0.1 0.27
deoxy-Mb-XASc,d 2.05-2.1( 0.05 2.06( 0.02∞ 0.35h,i
a Fe-Ne ) iron-histidine nitrogen distance; Fe-Np ) iron-pyrrolenitrogen average distance; Fe-CO) distance from iron to the carbonof CO; Fe-Ct is the iron out of heme plane displacement.bChance etal. (1983).c Powers et al. (1987).d Teng et al. (1987).eThis work.f Teng et al. (1994).g Schlichting et al. (1994).hMiller and Chance(1995). i Srajer et al. (1988).j Multiple minima are seen for thisparameter based on the XAS data alone; see Figures 7 and 8 and text.kND is not determined.
Table 2: Summary of Resonance Raman and Near-IR Frequencies(cm-1) of Myoglobin Complexes
complex ν2 ν4 νFe-His band III
deoxy-Mb 1563a 1353a 227a 13149b
Mb*CO 1560a 1352a 233a 13063b
MbCO 1590a 1375a none nonea Powers et al. (1987); Rousseau and Friedman (1988).b Chance
(1993).
Global Mapping of XAS Solutions to Heme Proteins Biochemistry, Vol. 35, No. 28, 19969021
+ +
+ +
consistent with the results presented here in terms of the Fe-Ne and Fe-Np distances. With respect to the position ofthe CO ligand, the results of Teng et al. and Powers et al.are consistent with the local minimum seen at ca. 2.5 Å fromiron.Table 1 also compares the results reported here to the two
crystallographic results that are available. The Fe-Ne
distance for the structure of Schlichting et al. (1994) isvirtually identical to that provided by solution EXAFS. TheFe-Np average distance is longer, based on the EXAFSresults, and is quite consistent with the results suggested byexamination ofν2, the core-size marker. A minimum forthe Fe-ligand (CO) distance is also seen by EXAFS, whichis in agreement with the crystallographic results (which isalso the best fit to the data). Overall, the differences arewell within the respective errors of the two techniques. Bycontrast, the structural data provided by Moffat and co-workers (Teng et al., 1994) are inconsistent with the solutionRaman, near-IR, and X-ray spectroscopy near-edge data thatsuggest an iron position with respect to the heme planesubstantially displaced toward the proximal histidine side ofthe heme, almost to the deoxy value. This difference maybe related to the functional properties conferred by themonoclinic space group of this crystal, or due to incompletephotolysis, with the structure based on an average of MbCOand Mb*CO conformations. In any case, even if thestructural result is correct for the monoclinic crystal, it cannotbe deemed relevant to the physiological solution state of theprotein.In conclusion, the crystallography results of Schlichting
et al. (1994) are in complete agreement with the EXAFSresults presented here within their respective errors. Thegreater precision of the EXAFS allows the bond lengths tobe precisely defined, and these EXAFS results are consistentwith Raman data collected previously. The crystallographicdata allow discrimination between the multiple minima thatwould not be discernible by analysis of the EXAFS alone.An examination of the available spectroscopic data showsthat the crystallographic results of Schlichting et al. are highlyrelevant to the physiological solution state and must be takeninto account in any attempt to understand the incompleterelaxation process of the heme iron for the Mc*CO photo-product at low temperature (Rousseau & Friedman, 1988).The structural data provided by Teng et al. (1994) are likelyto be in error. The automated FEFF and crystallographyapproach that we outline here is likely to have a number ofinteresting future applications. The increased availability ofcrystal structures will provide accurate geometric models thatcan be further refined using EXAFS data. The ability toclearly visualize the possible solutions as provided by theAUTOFIT 1.0 suite of programs also gives an even-handedview of the structure and the error in bond distances.
REFERENCES
Alben, J. O., Beece, D., Browne, S. F., Doster, W., Eisenstein, L.,Frauenfelder, H., Good, D., McDonald, J. D., Marden, M. C.,Moh, P. P., Reinisch, L., Reynolds, A. H., Shyamsunder, E., &Yue, K. T. (1982)Proc. Natl. Acad. Sci. U.S.A. 79, 3744.
Ansari, A., Berendzen, J., Braunstein, D., Cowen, B. R., Fraun-felder, H., Hong, M. K., Iben, I. E. T., Johnson, J. B., Ormos,P., Sauke, T. B., Scholl, R., Schulte, A., Steinbach, P. J., Vittitow,J., & Young, R. D. (1987)Biophys. Chem. 26, 337.
Austin, R. H., Beeson, K., Eisenstein, L., Frauenfelder, H., &Gunsalus, I. C. (1975)Biochemistry 14, 5355.
Austin, R., Buhks, E., Chance, B., DeVault, D., Dutton, P. L.,Frauenfelder, H., & Gol’danskii, V. I. (1987)Protein StructureMolecular and Electronic ReactiVity, Springer Verlag, London.
Binstead, N., Strange, R. W., & Hasnain, S. S. (1992)Biochemistry31, 12117.
Blackburn, N. J., Strange, R. W., Farooq, A., Haka, M. S., & Karlin,K. D. (1988)J. Am. Chem. Soc. 110, 4263.
Braunstein, D. P., Chu, K., Egeberg, K. D., Frauenfelder, H.,Mourant, J. R., Nienhaus, G. U., Ormos, P., Sligar, S. G.;Springer, B. A., & Young, R. D. (1993)Biophys. J. 65, 2447.
Brown, W. E., Sutcliffe, J. W., & Pulsinelli, P. D. (1983)Biochemistry 22, 2914.
Brunger, A. T. (1987)X-PLOR Version 3.1, A System for X-RayCrystallography and NMR, Yale University Press, New Haven,CT.
Caughey, W. S., Shimada, H., Choc, M. G., & Tucker, M. P. (1981)Proc. Natl. Acad. Sci. U.S.A. 78, 2903.
Chance, M. R. (1986) The proximal ligand in enzyme function,Ph.D. Thesis, University of Pennsylvania, Philadelphia, PA.
Chance, M. R. (1993)Methods Enzymol. 226, 97.Chance, B., Fischetti, R., & Powers, L. (1983)Biochemistry 22,3820.
Chance, M. R., Campbell, B. F., Hoover, R., & Friedman, J. M.(1987)J. Biol. Chem. 262, 6959.
Chance, M. R.; Courtney, S. H., Chavez, M. D., Ondrias, M. R.,& Friedman, J. M. (1990)Biochemistry 29, 5537.
Chance, M. R., Sagi, I., Wirt, M. D., Frisbie, S. M., Scheuring, E.M., Chen, E., Bess, J. W., Henderson, L. E., Arthur, L. O., South,T. L., Perez-Alvarado, G., & Summers, M. F. (1992)Proc.Natl.Acad. Sci. U.S.A. 89, 10041.
Co, M. S., & Hodgson, K. O. (1981)J. Am. Chem. Soc. 103, 3200.Cramer, S. P., Tench, O., Yocum, M., & George, G. N. (1988)Nucl. Instrum. Methods A266, 586.
Eaton, W. A., Hanson, L. K., Stephens, P. J., Sutherland, J. C., &Dunn, J. B. (1978)J. Am. Chem. Soc. 100, 4991.
Frauenfelder, H., & Wolynes, P. G. (1985)Science 229, 337.Habenschuss, A., Ice, G. E., Sparks, C. J., & Neiser, R. A. (1988)Nucl. Instrum. Methods, 215.
Hasnain, S. S., & Strange, R. W. (1990) inBiophysics &Synchrotron Radiation(Hasnain, S. S., Ed.) p 104, Ellis HorwoodLtd., Chichester, U.K.
Iizuka, T., Yamamoto, H., Kotani, M., & Yoretani, T. (1974)Biochim. Biophys. Acta 371, 126.
Jameson, G. B., & Ibers, J. A. (1994) inBioinorganic Chemistry(Bertini, I., Gray, H. B., Lippard, S. J., & Valentine, J. S., Eds.)Chapter 4, University Science Books, Mill Valley, CA.
Knowles, P. F., Strange, R. W., Blackburn, N. J., & Hasnain, S. S.(1989)J. Am. Chem. Soc. 111, 102.
Lee, P., Citrin, P., Eisenberger, P., & Kincaid, B. (1981)ReV.Mod.Phys. 53, 769.
Lim, M., Jackson, T. A., & Anfinrud, P. A. (1995)Science 269,962.
Liu, H. I., Filipponi, A., Gavini, N., Burgess, B. K., Hedman, B.,DiCicco, A., Natoli, C. R., & Hodgson, K. O. (1994)J. Am.Chem. Soc. 116, 2418.
Lytle, F. W., Sayers, D. E., & Stern, E. A. (1989)Phys. B 158,701.
Makinen, M. W., & Churg, A. K. (1982)Physical BioinorganicChemistry Series, Part 1, Chapter 3, p 141,
Makinen, M. W., Houtchens, R. A., & Caughey, W. S. (1979)Proc.Natl. Acad. Sci. U.S.A. 76, 6042.
Marcolin, H. E., Reschke, R., & Trautwein, A. (1979)Eur. J.Biochem. 96, 119.
Miller, L. M., & Chance, M. R. (1994)J. Am. Chem. Soc. 116,9662.
Miller, L. M., & Chance, M. R. (1995)Biochemistry 34, 10170.Mustre de Leon, J., Rehr, J. J., Zabinsky, S. I., & Albers, R. C.(1991)Phys. ReV. B44, 4146.
Nordlander, E., Lee, S. C., Cen, W., Wu, Z. Y., Natoli, C. R.,DiCicco, A., Filipponi, A., Hedman, B., Hodgson, K. O., &Holm, R. H. (1993)J. Am. Chem. Soc. 115, 5549.
O’Day, P. A., Rehr, J. J., Zabinsky, S. I., & Brown, G. E. (1994)J. Am. Chem. Soc. 116, 2938.
9022 Biochemistry, Vol. 35, No. 28, 1996 Chance et al.
+ +
+ +
Powers, L., & Kincaid, B. M. (1989)Biochemistry 28, 4461.Powers, L., Chance, B., Chance, M. R., Campbell, B., Friedman,J., Khalid, S., Kumar, C., Naqui, A., Reddy, K. S., & Zhou, Y.(1987)Biochemistry 26, 4785.
Quillin, M. L., Li, T., Olson, J. S., Phillips, G. N., Dou, Y., Ikeda-Saito, M., Regan, R., Carlson, M., Gibson, Q. H., Li, H., & Elber,R. (1995)J. Mol. Biol. 245, 416.
Ray, G. B., Li, X. Y., Ibers, J. A., Sessler, J. L., & Spiro, T. G.(1994)J. Am. Chem. Soc. 116, 162.
Rehr, J. J., & Albers, R. C. (1990)Phys. ReV. B41, 8139.Rehr, J. J., Mustre de Leon, J., Zabinsky, S. I., & Albers, R. C.(1991)J. Am. Chem. Soc. 113, 5135.
Rehr, J. J., Zabinsky, S. I., & Albers, R. C. (1992)Phys. ReV. Lett.69, 3397.
Roder, H., Berendzen, J., Bowne, S. F., Frauenfelder, H., Sauke,T. B., Shyamsundar, E., & Weissman, J. B. (1984)Proc. Natl.Acad. Sci. U.S.A. 81, 2359.
Rousseau, D. L., & Friedman, J. M. (1988) Transient and CryogenicStudies of Photodissociated Hemoglobin and Myoglobin, inBiological Applications of Raman Spectroscopy, p 135, JohnWiley and Sons, New York.
Rowlett, R. S., Chance, M. R., Wirt, M. D., Sidelinger, D. E., Royal,J. R., Woodroffe, M., Wang, Y. A., Saha, R. P., & Lam, M. G.(1994)Biochemistry 33, 13967.
Scheuring, E. M., Sagi, I., & Chance, M. R. (1994)Biochemistry33, 6310.
Schlichting, I., Berendsen, J., Phillips, G. N., & Sweet, R. M. (1994)Nature 371, 808.
Sparks, C. J., Ice, G. E., Wong, J., & Batterman, B. W. (1982)Nucl. Instrum. Methods 194, 73.
Spartalian, K., Lang, G., & Yonetani, T. (1976)Biochim. Biophys.Acta 428, 281.
Spaulding, L. D., Chang, C. C., Yu, N. T., & Felton, R. H. (1975)J. Am. Chem. Soc. 97, 2517.
Spiro, T. G., & Burke, J. M. (1976)J. Am. Chem. Soc. 98, 5482.Spiro, T. G., & Strekas, T. C. (1974)J. Am. Chem. Soc. 96, 340.Spiro, T. G., Stong, J. D., & Stein, P. (1979)J. Am. Chem. Soc.101, 2648.
Springer, B. A., Sligar, S. G., Olson, J. S., & Phillips, G. N. (1994)Chem. ReV. 94, 699.
Srajer, V., Schomacker, K. T., & Champion, P. M. (1986)Phys.ReV. Lett. 57, 1267.
Srajer, V., Reinisch, L., & Champion, P. M. (1988)J. Am. Chem.Soc. 110, 6656.
Stong, J. D., Burke, J. M., Daly, P., Wright, P., & Spiro, T. G.(1980)J. Am. Chem. Soc. 102, 5815.
Strange, R. W., Blackburn, N. J., Knowles, P. F., & Hasnain, S. S.(1987)J. Am. Chem. Soc. 109, 7157.
Teng, T. Y., Huang, H. W., & Olah, G. A. (1987)Biochemistry26, 8066.
Teng, T. Y., Srajer, V., & Moffat, K. (1994)Struct. Biol. 1, 701.Warburton, W. K. (1986)Nucl. Instrum. Methods A246, 541.Westre, T. E., DiCicco, A., Filipponi, A., Natoli, C. R., Hedman,B., Solomon, E. I., & Hodgson, K. O. (1994)J. Am. Chem. Soc.116, 6757.
Wittenberg, B. A., & Wittenberg, J. B. (1989)Annu. ReV. Physiol.51, 857.
Zhu, L., Sage, J. T., Rigos, A. A., Morikis, D., & Champion, P.M. (1992)J. Mol. Biol. 224, 207.
BI9605503
Global Mapping of XAS Solutions to Heme Proteins Biochemistry, Vol. 35, No. 28, 19969023
+ +
+ +