Myoglobin-NO at Low pH: Free Four-Coordinated Heme in the Protein Pocket
11
2634 Biochemistry 1995, 34, 2634-2644 Myoglobin-NO at Low pH: Free Four-Coordinated Heme in the Protein Pockett Arthur F. Duprat,*JJl Teddy G. Traylor,$," Guo-Zhang Wu,#.l Massimiliano Coletta,# Vijay S. Sharma,*,§ Kevin N. Walda,t and Douglas Magde*%$ Departments of Chemistry and Medicine, University of Calijomia at San Diego, 9500 Gilman Drive, La Jolla, Calijomia 92093-0358, and Department of Molecular, Cellular and Animal Biology, University of Camerino, Via F. Camerini, 2-62032 Camerino (MC), Italy Received July 11, 1994; Revised Manuscript Received November 28, 1994@ ABSTRACT: In either sperm whale or horse heart myoglobin, binding of NO and lowering of solution pH work together to weaken, and ultimately break, the bond between iron and the proximal histidine. This is reminiscent of the reaction observed at neutral pH in the case of guanylate cyclase, the heme enzyme that catalyzes the conversion of GTP to cGMP. Bond breaking is characterized by a spectral change from a nine-line to a three-line ESR signal and accompanied by a shift from 420 to 387 nm in the UV- vis spectrum of the Soret band maximum. Analysis of the pH-dependent spectral changes shows that they are reversible, at least within a few hours, that the transition is cooperative, involving six protons during pH lowering but only two as it is raised, and that the pK is about 4.7. Different proteins exhibit different pK values, which are generally lower than that for "chelated" protoheme. The pK differences reflect the extra bond stability afforded by the protein structure. Investigations of thermal and photochemical NO displacement by CO suggest that the local pocket around the ligand, although significantly altered (according to circular dichroism investigations), nonetheless still imposes a barrier against the outward diffusion of ligand into the solvent. Nanosecond and picosecond flash photolysis shows that in proteins at low pH there is an extremely efficient geminate recombination of the ligand with the four-coordinated species through a single-exponential process. This occurs to a significantly larger extent than for the case of NO-"chelated" protoheme (where no distal barrier for ligand is present). At neutral pH, when the proximal histidine bond is intact, the geminate recombination for NO takes longer and displays multiexponential kinetics. Altogether, these results suggest that, even though distal effects probably also play a role, proximal effects make an important contribution in modulating ligand-iron bond formation. Heme is a multifunctional prosthetic group. In various heme proteins, it participates in a wide variety of reactions of biological importance. In most of these cases the heme iron makes a coordinate bond with at least one amino acid side chain. The exception is soluble GC'-a heme protein that catalyzes the conversion of GTP to cGMP (Ignarro et al., 1986; Murad, 1986; Hibbs et al., 1988; Knowles et al., 1989; Moncada et al., 1991; Culotta & Koshland, 1992; Stamler et al., 1992; Traylor & Sharma, 1992; Breer & Sheperd, 1993; Ziche et al., 1993). In the native form of GC, protoheme is bound to the protein by a proximal histidine and shows only minimal activity. However, upon activation by reaction with nitric oxide, the proximal base to heme bond is thought by many to be broken, so that the prosthetic group remains in the protein matrix without any ' This work was supported in part by Grants NSF-CHE9114613 and NIH-PHS HL13581. K.N.W. was an NIH trainee. * Authors to whom correspondence should be addressed. * Department of Chemistry, University of Califomia at San Diego. 8 Department of Medicine, University of Califomia at San Diego. # University of Camerino. Present address: Laboratoire de Chimie Organique, ESPCI, 10 rue Vauquelin, 75005 Paris, France. Present address: Department of Chemistry, Mississippi State University, Mississippi, MS 39762. Deceased, 1993. @ Abstract published in Advance ACS Abstracts, February 1, 1995. ' Abbreviations: SVD, single value decomposition; GC, guanylate cyclase; Hm, heme; Mb, myoglobin; Hb, hemoglobin; HH, horse heart; SW, sperm whale; CTAB, cetyltrimethylammonium bromide; PTH, protoheme;PDSE, protoheme distearyl ester; MCH, methylcyclohexane. covalent or coordinate bond between the protein and the heme (Moncada et al., 1991; Culotta & Koshland, 1992; Stamler et al., 1992; Traylor & Sharma, 1992; Stone & Marletta, 1994). While numerous physicochemical studies have been made with heme proteins in which heme is firmly bound to the protein, we know little about the behavior of a heme protein in which the heme is held in the protein matrix without any real bond. In the present study, we address this issue by studying the dynamics of spectral changes and ligation in myoglobin derivatives as a function of pH. The key spectroscopic sign accompanying GC activation by NO is a dramatic change in the UV-vis spectrum of the Soret region, which moves from 432 nm, typical of a five- coordinated heme imidazole, to 399 nm, representative of a five-coordinated Hm-NO (Rose & Hoffman, 1983; Stone & Marletta, 1994). This implies a breaking or extreme weakening of the heme-imidazole bond: We have identified and characterized such a process in a model compound, chelated protoheme (Traylor et al., 1993a), 0006-2960/95/0434-2634$09.00/0 0 1995 American Chemical Society
-
Upload
independent -
Category
Documents
-
view
1 -
download
0
Transcript of Myoglobin-NO at Low pH: Free Four-Coordinated Heme in the Protein Pocket

2634 Biochemistry 1995, 34, 2634-2644
Myoglobin-NO at Low pH: Free Four-Coordinated Heme in the Protein Pockett
Arthur F. Duprat,*JJl Teddy G. Traylor,$," Guo-Zhang Wu,#.l Massimiliano Coletta,# Vijay S . Sharma,*,§ Kevin N. Walda,t and Douglas Magde*%$
Departments of Chemistry and Medicine, University of Calijomia at San Diego, 9500 Gilman Drive, La Jolla, Calijomia 92093-0358, and Department of Molecular, Cellular and Animal Biology, University of Camerino,
Via F. Camerini, 2-62032 Camerino (MC), Italy
Received July 11, 1994; Revised Manuscript Received November 28, 1994@
ABSTRACT: In either sperm whale or horse heart myoglobin, binding of NO and lowering of solution pH work together to weaken, and ultimately break, the bond between iron and the proximal histidine. This is reminiscent of the reaction observed at neutral pH in the case of guanylate cyclase, the heme enzyme that catalyzes the conversion of GTP to cGMP. Bond breaking is characterized by a spectral change from a nine-line to a three-line ESR signal and accompanied by a shift from 420 to 387 nm in the UV- vis spectrum of the Soret band maximum. Analysis of the pH-dependent spectral changes shows that they are reversible, at least within a few hours, that the transition is cooperative, involving six protons during pH lowering but only two as it is raised, and that the pK is about 4.7. Different proteins exhibit different pK values, which are generally lower than that for "chelated" protoheme. The pK differences reflect the extra bond stability afforded by the protein structure. Investigations of thermal and photochemical NO displacement by CO suggest that the local pocket around the ligand, although significantly altered (according to circular dichroism investigations), nonetheless still imposes a barrier against the outward diffusion of ligand into the solvent. Nanosecond and picosecond flash photolysis shows that in proteins at low pH there is an extremely efficient geminate recombination of the ligand with the four-coordinated species through a single-exponential process. This occurs to a significantly larger extent than for the case of NO-"chelated" protoheme (where no distal barrier for ligand is present). At neutral pH, when the proximal histidine bond is intact, the geminate recombination for NO takes longer and displays multiexponential kinetics. Altogether, these results suggest that, even though distal effects probably also play a role, proximal effects make an important contribution in modulating ligand-iron bond formation.
Heme is a multifunctional prosthetic group. In various heme proteins, it participates in a wide variety of reactions of biological importance. In most of these cases the heme iron makes a coordinate bond with at least one amino acid side chain. The exception is soluble GC'-a heme protein that catalyzes the conversion of GTP to cGMP (Ignarro et al., 1986; Murad, 1986; Hibbs et al., 1988; Knowles et al., 1989; Moncada et al., 1991; Culotta & Koshland, 1992; Stamler et al., 1992; Traylor & Sharma, 1992; Breer & Sheperd, 1993; Ziche et al., 1993). In the native form of GC, protoheme is bound to the protein by a proximal histidine and shows only minimal activity. However, upon activation by reaction with nitric oxide, the proximal base to heme bond is thought by many to be broken, so that the prosthetic group remains in the protein matrix without any
' This work was supported in part by Grants NSF-CHE9114613 and NIH-PHS HL13581. K.N.W. was an NIH trainee.
* Authors to whom correspondence should be addressed. * Department of Chemistry, University of Califomia at San Diego. 8 Department of Medicine, University of Califomia at San Diego. # University of Camerino. Present address: Laboratoire de Chimie Organique, ESPCI, 10 rue
Vauquelin, 75005 Paris, France. Present address: Department of Chemistry, Mississippi State
University, Mississippi, MS 39762. Deceased, 1993.
@ Abstract published in Advance ACS Abstracts, February 1, 1995. ' Abbreviations: SVD, single value decomposition; GC, guanylate
cyclase; Hm, heme; Mb, myoglobin; Hb, hemoglobin; HH, horse heart; SW, sperm whale; CTAB, cetyltrimethylammonium bromide; PTH, protoheme; PDSE, protoheme distearyl ester; MCH, methylcyclohexane.
covalent or coordinate bond between the protein and the heme (Moncada et al., 1991; Culotta & Koshland, 1992; Stamler et al., 1992; Traylor & Sharma, 1992; Stone & Marletta, 1994). While numerous physicochemical studies have been made with heme proteins in which heme is firmly bound to the protein, we know little about the behavior of a heme protein in which the heme is held in the protein matrix without any real bond. In the present study, we address this issue by studying the dynamics of spectral changes and ligation in myoglobin derivatives as a function of pH. The key spectroscopic sign accompanying GC activation by NO is a dramatic change in the UV-vis spectrum of the Soret region, which moves from 432 nm, typical of a five- coordinated heme imidazole, to 399 nm, representative of a five-coordinated Hm-NO (Rose & Hoffman, 1983; Stone & Marletta, 1994). This implies a breaking or extreme weakening of the heme-imidazole bond:
We have identified and characterized such a process in a model compound, chelated protoheme (Traylor et al., 1993a),
0006-2960/95/0434-2634$09.00/0 0 1995 American Chemical Society

Myoglobin-NO at Low pH
in which the chemistry and spectroscopy are subject to fewer complications:
Biochemistry, Vol. 34, No. 8, 1995 2635
crM, PHL NO
0
Lu=430 nm
n
A,,,,,=398 nm
The reduction in the affinity of protoheme for imidazole upon binding NO was (Traylor & Sharma, 1992) about lo3. Heme proteins should show similar behavior, and indeed some heme proteins do exhibit, at neutral pH, the three-line EPR spectrum typical of Hm-NO devoid of the proximal base, although others do not (Henry et al., 1991). The iron(I1) forms of myoglobins, hemoglobins, and horseradish peroxi- dase all form six-coordinated NO complexes with a Soret band near 420 nm and a nine-line EPR spectrum (Yonetani et al., 1972; Henry & Mazza, 1974; Ascenzi et al., 1981, 1985b, 1989). At low pH, however, breaking or stretching of the proximal imidazole-heme bond at low pH has been reported for T-state Hb-NO (Rein et al., 1972; Desideri et al., 1984; Coletta et al., 1990) and Aplysia limicina Mb- NO (Ascenzi et al., 1981), suggesting that pH lowering and NO binding are synergistic in weakening the imidazole bond. Since it has been shown that the five-coordinated (deoxy) forms of several heme proteins lose the proximal base at sufficiently low pH (Traylor et al., 1983; Ascenzi et al., 1985a; Anderson et al., 1989; Coletta et al., 1992), they should lose the proximal base more easily after binding NO, a fact confirmed by the appearance of the three-line EPR spectrum for Mb-NO at pH ( 5 (Ascenzi et al., 1985a). Consequently, every heme protein should display proximal base loss at some pH, whose value is expected to be higher when NO is bound, with the ApK with respect to chelated protoheme reflecting the extra proximal base affinity afforded by the protein structure. Although this hypothesis is consistent with some prior literature cited earlier, that literature was not always definitive and there have been other contradictory observations, as discussed in the following. Consequently, our first goal was to establish the spectro- scopic consequences of breaking the proximal bond.
Loss of proximal base when pH is lowered also results in an increase in the carbon monoxide association rate constant to chelated heme and myoglobin (Giacometti et al., 1977; Coletta et al., 1985). Recent interest in the fast kinetic consequences of this effect (Han et al., 1990; Iben et al., 1991) suggests the need for some method of photochemical production of four-coordinated heme inside a heme protein. Therefore, the creation of a five-coordinated Hm-NO in the protein provides the opportunity to produce by photolysis a four-coordinated heme in a protein environment (eq 3) and
- Fe- NO
hv
(b)
Eq. 3
then to study the ligand rebinding in the absence of proximal restraint. Petrich et al. (1991) and Kuczera et al. (1993) recently suggested that the multiple phases of geminate recombination observed on the picosecond time scale for Mb-NO at physiological pH are due to a time-dependent increase in the barrier to rebinding. This increase was postulated to be due to protein influence on the movement of the iron away from the heme plane. Production of four- coordinated heme in the protein pocket by photolysis should aid in our understanding of these phenomena since, according to Petrich's hypothesis, such a photolytic intermediate should show a single, very rapid phase to NO recombination.
We have therefore examined the pH effects upon the optical spectrum of Mb-NO and carried out subpicosecond photolyses to produce four-coordinated heme from the Hm- NO species.
EXPERIMENTAL PROCEDURES
Materials. Lyophilized sperm whale (type 111) and horse heart (type 111) myoglobins were purchased from Sigma and used without further purification. The buffer solutions were prepared with [(bis(2-hydroxyethyl)amjno]tris(hydroxymethyl)- methane (Bis-Tris, Eastman), sodium phosphate (dibasic, Mallinckrodt), or sodium borate (Mallinckrodt) and CTAB (Aldrich). CTAB was recrystallized twice from methanol. These buffers were carefully degassed by several freeze- pump-thaw cycles and placed under argon. The following were used as received: acetic acid, sodium hydroxide, potassium hydroxide, and methanol all from Fisher; 1,4,7,10,13,16-hexaoxacyclooctadecane (1 8-crown-6) from Fluka; hemin chloride from Calbiochem; MCH from Aldrich. Sodium dithionite was generously provided by Virginia Co. and stored in small Teflon-capped vials at 4 "C until use. PDSE was obtained from previous studies (Deardurff, 1985).
Compressed Gases. Argon gas (commercial grade, Linde Products) was passed through an oxygen scrubber (American Science Products) before use. Carbon monoxide gas (99.99%, Matheson) was used as received; nitric oxide (98.19%, Matheson), which required the use of a stainless steel regulator (14M-660, Matheson), was first passed through a KOH-filled glass column and then through a dry ice trap. Polyethylene tubing and stainless steel fittings were used for the nitric oxide purification apparatus where possible.
Reducing Agents. Two methods were used to reduce the hemin or protein samples prior to the addition of the appropriate ligands. For aqueous samples, a saturated solution of sodium dithionite was prepared by adding a degassed solution of the appropriate buffer to a sealed vial that had been thoroughly flushed with argon and that

2636 Biochemistry, Vol. 34, No. 8, 1995
contained sodium dithionite (50 mg). For MCH, the reduc- ing agent was prepared as an 18-crown-6 complex in methanol. Sodium dithionite (10 mg), dry 18-crown-6 (50 mg), and a small stir bar were sealed in a vial and flushed with argon for a few minutes. Degassed methanol was added via a syringe, and the solution was stirred vigorously (30 min) under positive argon pressure. The solution was used immediately.
Nitrosylmyoglobin Preparation. For acid-base titration, a pH calibration curve was obtained by adding small increments of acetic acid to 5 mL of 0.1 M Bis-Tris buffer. Then 10 p L of a concentrated solution of the desired myoglobin in 0.1 M Bis-Tris buffer was added via a syringe to a degassed 1 cm quartz cuvette containing the same volume of 0.1 M Bis-Tris (5 mL). After reduction of the myoglobin by the addition of 2 pL of the aqueous sodium dithionite the red solution obtained was gently stirred under a flow of nitric oxide for 5 min. Degassed glacial acetic acid was then added with a syringe to obtain the desired pH. Anaerobic conditions were maintained during the titration. The static UV-vis spectra were recorded after a short equilibration time under stirring. Mb-NO solutions were then prepared in the same volume of this buffer and pH titration was carried out. For the back titration, aliquots of a 5 M degassed NaOH solution were injected into the Mb-NO solutions, which had previously been acidified to pH 4. In all the samples, the myoglobin concentration was adjusted to give Soret absorptions close to 1 in a 1 cm quartz cuvette, approximately 6 x M. The concentrations of Mb-NO were calculated using the E values reported by Romberg (Romberg & Kassner, 1979).
For the conventional flash photolysis of HH Mb-NO, the CO complex was first prepared as above with flowing CO instead of NO. After acidification at pH 4.0, traces of NO were introduced with a syringe. Then the cuvette was purged with CO for 25 min. After standing another 25 min, the cuvette was flashed repeatedly, at about 30 s intervals, with the flash gun held against the cell. Transients were too small to detect, but cumulative changes were monitored by collecting UV-vis spectra at intervals.
For stopped-flow experiments, typically 12 mg of SW Mb was placed in a tonometer that had been flushed with argon, and 12 mL of 0.05 M phosphate buffer, also thoroughly flushed with argon, was added to dissolve the Mb. After reduction to Fe(I1) by injection of 15 pL of sodium dithionite, the solution was stirred for 5 min under a flow of NO and transferred under positive argon pressure into a degaseed syringe. The pH drop (to 4) was realized by mixing equal amounts of this Mb-NO solution with the contents of a second syringe filled with a carefully degassed solution of 200 pL of glacial acetic acid in 12 mL of water.
The procedure just described was also used to prepare Mb-NO solutions for EPR spectroscopy and for nanosecond and picosecond kinetic measurements. Acidification to pH 4 was accomplished by adding calculated (and previously verified) amounts of glacial acetic acid. The solutions were cannulated into the appropriate cuvettes. The optical cells had a path length of 2 mm; protein concentrations were adjusted to produce Soret band absorbances of 1.2 and 1.8 for the nanosecond and picosecond measurements, respec- tively. Conventional W-vis spectra were measured before and after each experiment to check for degradation. EPR and nanosecond experiments used static cells. For the picosecond measurements, 50- 100 mL of solution was
Duprat et al.
prepared and flowed through the observation cell once in order to minimize sample degradation over thousands of laser shots.
Model Compound NO Complexes. Samples were prepared in other solvents in a manner similar to the procedure used for Mb-NO titrations. Hemin samples were dissolved in methanoMO% sodium borate (0.05 M) or in dichloromethane before being diluted with the desired solvent, Le., MCH for PDSE+Cl- or CTAB (2%, v/v) and 0.05 M sodium borate buffer for PTH+Cl-. The amounts of stock solutions added were calculated to obtain a Soret band for the Hm-NO species close to either 1.2 (ns) or 1.5 (ps).
Instrumentation. pH measurements were made with a Coming Model 12 meter. Conventional flash photolysis used a Sunpak 61 1 photographic flash. Static UV-vis absorption spectra were measured on a Kontron Uvikon 810 spectro- photometer interfaced to a microcomputer. EPR spectra were recorded with a Varian E-3 spectrometer, using diphenyl- picrylhydrazyl as the field marker. Samples were cooled to 77 K by immersion in LN2. CD spectra were measured using a Jasco 5-500 spectropolarimeter and are expressed in millidegreedcentimeter. Conventional kinetic data (0.05- 20 s range) were obtained on a Hi-Tech Scientific stopped- flow instrument. The photomultiplier anode current was digitized using a Metrabyte Dash-8 A/D board in a micro- computer. The apparatus had a 1 cm optical path length. Nanosecond and picosecond kinetics were measured using instrumentation and sample handling described previously (Chafield et al., 1990; Jongeward, 1988; Walda et al., 1994). Briefly the nanosecond-microsecond apparatus used an XeCl excimer laser pumping a dye laser to produce pho- tolysis pulses of about 3 mJ at 540 nm, with 4 ns duration at half-height. For monitoring transient absorbance changes, two probe beams were available: a cw tungsten lamp and a long pulse Xe flash. Similarly, two digitizers were used for different time ranges. A special high-current photomultiplier was used. Data were transferred directly to a microcomputer. The picosecond measurements used a colliding-pulse, mode- locked ring dye laser, amplified at 10 Hz by a Nd:YAG- pumped, four-stage dye amplifier, producing 1 mJ pulses at 628 nm. Harmonic generation produced the photolysis pulses, while continuum generation produced a spectroscopic probe throughout the visible range. Time-of-flight optical delays were scanned automatically from -20 to +lo00 ps with overall measurement resolution better than 1 ps. At each delay, a spectrum was recorded using an intensified diode array. Repetitive scans of the delay line were summed for each experiment. Overall, an experiment yields absorb- ance differences measured at 600 wavelengths over a 100 nm region and up to 800 time delays. This large data array was reduced to more manageable proportions using singular value decomposition (Walda et al., 1994). Although novel in picosecond kinetics, SVD has become well established for nanosecond studies and has recently been described fully (Henry & Hofnchter, 1992).
RESULTS
Titration of Proximal Base in Mb-NO. An HH Mb solution at pH 7 was titrated with increments of acetic acid to change the pH in a predetermined manner, and a spectrum was taken after each addition until pH 4 was reached. The spectra are shown in Figure 1A. The change from the 420 nm Soret absorption to a 387 nm peak displayed reasonably

Myoglobin-NO at Low pH
1 0 , 1 A
0 80
u 0 60
5:
c
B s 040
0 20
0 0
0 80 4
300 350 400 450 500 550 600 650
Wavelength (nm)
FIGURE 1: (A) W - v i s spectra of HH Mb-NO (6 x M) in 0.1 M aqueous Bis-Tris buffer upon titration with acetic acid. pH: (a) 7.0; (b) 4.9; (c) 4.7; (d) 4.6; (e) 4.5; ( f ) 4.4; (g) 4.0. (B) Same for titration with NaOH 5 M. pH: (a) 4.0; (b) 4.4; (c) 5.0; (d) 5.6; (e) 7.0.
20
a 1
\Va\elcnglh (nml
FIGURE 2: UV-vis spectra of HH Mb-NO M) in 0.1 M aqueous Bis-Tris buffer: (a) Mb-CO complex, pH 4; (b) Mb- NO complex, pH 4; (c) same solution as (b) after 30 flashes; (d) same as (b) after 80 flashes total; (e) same as (b) after 120 flashes total.
good isosbestic points. The final solution showed a stable spectrum for at least an hour in most cases. The reversibility of this change is demonstrated in Figure lB, where an Mb solution was brought directly to pH 4 by the addition of acetic acid and then titrated back to pH 7 with aliquots of sodium hydroxide. The original six-coordinated spectrum retumed with good isosbestic points, and the final Soret absorbance is about 90% of its initial value, before the pH drop. The pH for half-conversion was 4.7.
Displacement of Both CO and Proximal Base by NO. An HH Mb-CO complex was prepared to pH 4 and 1 atm of carbon monoxide. The spectrum (Figure 2a) is typical of carboxymyoglobin. Addition of a few torr of NO to this sample resulted in a rather quick conversion to the spectrum showing a Soret band at 389 nm (Figure 2b), identical to
Biochemistry, Vol. 34, No. 8, 1995
I A
B
2637
U
FIGURE 3: CD spectra of (A) HH Mb-NO and (B) Mb-CO in 0.2 M acetate buffer at pH 4 in the visible region.
that of Figure 1A. After exhaustive purging with CO to remove excess NO, the solution was repeatedly flashed with a flash gun at full power, held against the cell. A single flash did not produce a measurable effect, either transient or irreversible, but small amounts of NO displacement were observed after a large number of flashes. A series of spectra taken at intervals, after specified numbers of flashes, is shown in Figure 2c-e. Clearly a small concentration of NO displaces both CO and imidazole at this pH. The resulting five-coordinated NO is only slightly photolabile.
Electron Spin Resonance. A 1.7 mM solution of SW Mb- NO was brought to pH 4 and then taken to liquid nitrogen temperature, and the EPR spectrum was taken. The spectrum (not shown) was identical to that previously reported (Ascenzi, 1985b) and is consistent with a five-coordinated Hm-NO.
Circular Dichroism Changes upon Breaking the Proximal Base-Heme Bond. Solutions of HH Mb-CO and Mb- NO at pH 4.0 have been examined by CD, and the data are reported in Figures 3 and 4. In the Soret region, the dichroic properties of Mb-NO are completely lost (Figure 3A), suggesting a full transition toward a five-coordinated NO- bound form, whereas in the case of Mb-CO most of the rotational properties are retained (Figure 3B), indicating that the heme structure is essentially preserved. In the case of the near-UV region (i.e., 250-300 nm), the spectral CD properties reflect the conformation of aromatic residues and therefore give some information on the overall structure of the protein moiety. In the case of Mb-CO (Figure 4B), there is substantial maintenance of the native structure, whereas for Mb-NO (Figure 4A) the spectrum indeed suggests a major conformational change, even though the tertiary structure seems preserved to a significant extent.
Kinetics of Breaking the Proximal Base-Heme Bond. A solution of SW Mb-NO at pH 9 was mixed in the stopped- flow machine with acetic acid to jump the pH to 4, and the absorbance of the 420 nm band (six-coordinated Mb-NO) was recorded as a function of time. A typical kinetic trace is shown in Figure 5. The plot is nonexponential and shows

2638 Biochemistry, Vol. 34, No. 8, 1995
A
Duprat et al.
250 0 \~velengrh (nm) 300.0
FIGURE 4: CD spectra of (A) HH Mb-NO and (B) Mb-CO in 0.2 M acetate buffer at pH 4 in the UV region.
0 40
0 35
0 30
0 2 5
9 020
s 8 0 1 5
0 10
0 050
0.0
FIGURE 5: Stopped-flow kinetics of six-coordinated SW Mb-NO disappearance after the pH jump. A 25 pM solution of Mb-NO at pH 9 in 0.05 M phosphate buffer was mixed with a 0.3 M aqueous acetic acid solution. Final pH, 4.0; I = 420 nm; temperature = 21 & 1 "C.
slowing or biphasic behavior. A fit with two exponentials yields two characteristic decay times: rl = 0.59 s and t 2 = 2.61 s.
Picosecond Kinetic Studies of Five-Coordinated Mb-NO. Solutions of HH and SW Mb-NO at pH 4 were photolyzed with 400 fs pulses. The dominant spectrum from SVD analysis is shown in Figure 6. The difference spectra correspond to the change from Hm-NO to four-coordinated heme. The first kinetic components from the SVD analysis of HH and SW Mb-NO are displayed in Figure 7, showing an accurately exponential curve with an essentially complete return. Figure 8, in which the first three kinetic components for the SVD analysis of SW Mb-NO are displayed at longer times, confirms the complete return.
Picosecond Kinetic Studies of Six-Coordinated Mb-NO. For comparison, the first kinetic components from the SVD analysis of HH and SW Mb-NO buffered at pH 7 are reported in Figure 9. It can be seen that the geminate recombination is a much slower process that is not complete after 800 ps and does not have single-exponential behavior (Walda et al., 1994).
0.15 I i
-0.1 350 380 400 420 440 460 480 500
Wavelength in nm
FIGURE 6: Major spectral components obtained from the SVD analysis of HH and SW Mb-NO in 0.05 M phosphate buffer at pH 4.
-0.1; I > 9 I I I I I
0 10 20 30 40 50 60 70 80 90 100 Time in pr
FIGURE 7: First kinetic components from the SVD analysis of HH and SW Mb-NO at pH 4 in 0.05 M phosphate buffer. The dotted line is a single-exponential fit with z = 12.5 ps and zero offset.
0.1
0
-0.1 0 10 20 30 40 50 60 70 80 90 100
Time in ps
FIGURE 8: First three kinetic components from the SVD analysis of SW Mb-NO at pH 4 in 0.05 M phosphate buffer.
Nanosecond Photolysis of Five-Coordinated Mb-NO. Photolysis of a solution of SW Mb-NO at pH 4, using 4 ns pulses of 2-3 mJ of excitation energy in 0.2 cm2, revealed no detectable absorbance changes, even after summing 200 laser shots. By comparison with Mb-02, whose photo- dissociation was reinvestigated recently (Chatfield et al., 1990), we estimate that the microsecond photodissociation yield of five-coordinated Mb-NO is well below 0.5%. This is consistent with the efficient return observed in the picosecond studies, but represents a lower limit than ccluld be obtained with the picosecond instrumentation.
Picosecond Kinetic Studies of Five-Coordinated Heme- NO Model Compounds. Solutions of PTH-NO at pH 9.2 and PDSE-NO in MCWl -methylimidazole have been photolyzed under the same conditions as given earlier. The

Myoglobin-NO at Low pH Biochemistry, Vol. 34, No. 8, 1995 2639
investigate the coordination state of the iron of various hemoprotein complexes with NO at different pH's (Rein et al., 1972; Henry & Mazza, 1974; Maxwell & Caughey, 1976; Perutz et al., 1976; Chevion et al., 1976; Hille et al., 1979; Romberg & Kassner, 1979; Nagai et al., 1980). In particular, variations in the a-, b-, and y-bands observed in the UV- vis spectra of Mb-NO and Hb-NO have been used extensively to study such pH effects, as well as the structural modifications introduced by the addition of allosteric effec- tors like IHP (Cassoly, 1974; Salhany et al., 1974; Maxwell & Caughey, 1976; Perutz et al., 1976; Hille et al., 1977, 1979). To our knowledge, Cassoly (1974) was the first to mention an important, but relatively small Soret blue shift when mixing IHP with Hb-NO at physiological pH. Subsequently, Ascenzi et al. (1981) observed a very small Soret blue shift in a solution of Aplysia nitrosylmyoglobin when the pH was lowered to 4. However, a much larger blue shift of the Soret band to 395-396 nm was reported a few years later for other histidine-bound nitrosylhemoproteins at both physiological and low pH (Yoshimura et al., 1986; Yoshimura & Susuki, 1988) or upon addition of sodium dodecyl sulfate (Yoshimura, 1988). Still more recently, only a small shift to around 418 nm was observed for the horseradish peroxidase-NO and CCP-NO Soret bands at low pH (Ascenzi et al., 1989). Because of these apparent discrepancies, we have carefully reinvestigated the pH effects on the absorption spectrum of Mb-NO and tried to characterize the species involved at low pH by other methods.
Figure 1A,B shows a series of spectra of HH Mb(I1)- NO at different pH values. This series is identical whether the titration is toward low (Figure 1A) or high (Figure 1B) pH, and the pH 4 system is quite stable at room temperature. This titration was repeated with SW Mb(I1)-NO (spectra not shown) and identical results were obtained. Since the spectrum of Mb-NO at pH 4 is very similar to that of five- coordinated PTH-NO, as seen by a comparison of the UV- vis spectra (Rose & Hoffman, 1983; Yoshimura & Ozaki, 1984; Traylor et al., 1985), and since this Soret blue shift is very similar to the one observed from deoxymyoglobin under similar conditions (Han et al., 1990; Sage et al., 1991a), it is clear that the species present at low pH is five-coordinated. Even more definitively, the pH 4 EPR spectrum of Mb- NO observed at low temperature displays the same charac- teristic triplet common to all five-coordinated Hm-NO (Kon & Kataoka, 1969; Wayland & Olson, 1974; Maxwell & Caughey, 1976; Yoshimura et al., 1979; Yoshimura, 1978, 1983; Yoshimura & Ozaki, 1984). Now it is widely agreed that a hemoprotein-NO structure characterized by an EPR spectrum with three lines must possess a loose bond-or none at all-between the proximal histidine (nitrogen atom) and the nitrosyl-heme iron atom (Henry et al., 1991). Moreover, the disappearance of the circular dichroic properties at 420 nm of the same solution of Mb-NO (Figure 4) corroborates the disruption of the histidine heme bond. Therefore, lowered pH produces five-coordinated Mb-NO (eq 3a). The same W-vis spectrum with Amax = 389 nm was obtained when 5 Torr of NO was added to Mb-CO at pH 4 under 1 atm of CO [Amu = 421 nm, typical of a six-coordinated Hm- Fe(I1) species with imidazole bound (White et al., 1979)], illustrating further the ability of NO to bring about proximal imidazole-heme cleavage (Figure 2, curve b). This five- coordinated species (A,,, = 389 nm) is not displaced by CO when all unbound NO has been removed; however, repeat- edly flashing the solution caused the Mb-CO spectrum (&
I 9 I I 0 100 200 300 400 500 600 700 800 -0.2
Time in ps
FIGURE 9: First kinetic components from the SVD analysis of HH and SW Mb-NO in 0.1 M Bis-Tris and 0.05 M phosphate buffer at pH 7.
!..:I 3 \/ 450L 1 4.05
350 400 wavelength I nm
-O.OS t 4.1 I I
360 380 400 420 440 460 480 sw wavelength I nm
FIGURE 10: Major spectral components obtained from the SVD analysis of an aqueous detergent solution at pH 9.2 of (A) PTH- NO and (B) PDSE-NO in MCH.
major spectral components obtained from their SVD analysis are reported in Figure 10 (analogous to Figure 6). The first kinetic component from the SVD analysis of PTH-NO gave an accurate exponential curve with 85% retum. PDSE- NO exhibited similar behavior, but with only 53% retum.
Nanosecond Photolysis of Five-Coordinated Heme-NO. From the data cited in the preceding paragraph, one should expect the model compounds to differ from the proteins in that one should detect dissociated partners at long times after photolysis. Such is the case. After the initial picosecond changes, there are no further changes in absorbance until bimolecular combination sets in. There are no concentration- independent absorption changes that might be attributed to geminate recombination at nanosecond times. Only bi- molecular combination has been observed. The overall combination rates are not closely related to other topics considered here and will be treated elsewhere.
DISCUSSION
Coordination State of the Mb-NO Iron at Low pH. Numerous spectral properties have been used in the past to
2640 Biochemistry, Vol. 34, No. 8, 1995
= 421 nm) to partially return (Figure 2, curves c-e). This process could be repeated:
1
f 0-
0 80
.I 8 060:
5 0 4 0 ' z"
I& 0
020-
00-
Duprat et al.
/ " " l " " I " " l " "
A + CO E q . 4
hax=421 nm lmax=389 nm
Therefore, the 389 nm peak belongs to an iron(I1) species that has no histidine bond. This is unlikely to be an iron(II1) species, since the rate of oxidation of iron(I1) depends on the rate-limiting step of Fe-NO dissociation, which is slow. This is the first time a 389 nm Soret band has been described for a nitric oxide-myoglobin complex. Such spectral identification is useful in a number of contexts, but one of the areas most dependent on UV-vis spectra is that involving fast and ultrafast kinetics.
Tertiary Structure of Mb-NO at Low pH. The denatur- ation of metmyoglobin at low pH and room temperature was observed more than 40 years ago (Theorell & Ehrenberg, 1951) and was investigated in more detail in the 1960s (Breslow & Gurd, 1962; Acampora & Hermans, 1967; Hermans & Acampora, 1967). The pH dependence of this reversible transition is quite marked, no doubt due to the presence of six buried histidine side chains in the native molecule (Breslow & Gurd, 1962; Nigen & Gurd, 1973; Puett, 1973), which become protonated as the pH drops. A simple model assuming a stable, partially unfolded state (U) at pH 4 has been built to account for this transition (Puett, 1973; Bismuto et al., 1983; Sage et al., 1991a); the ratio of the concentrations of the native state (N) of the protein to the partially unfolded state with n sites protonated is given by (Sage et al., 1991a)
N + nH+ == UH,"' ( 5 )
where KN and Ku are the proton association constants for the histidine groups in the native and partially unfolded states, respectively, and pK,ff represents the pK of the transition when the second factor of the equation is close to unity, which is generally the case (simplified Henderson-Hassel- balch form). This model has been used to fit the data of both Mb-NO titrations. The fraction of six-coordinated Mb-NO versus pH was plotted (Figure llA), assuming 100% of six coordination at pH 7 and total conversion to a five-coordinated iron species at pH 4. These data were fitted (Figure 1 lA, curves a and b) to the preceding formula, taking KV = 5.9 for both myoglobins and KN = 3.7 and 3.0 for horse heart and sperm whale, respectively (Nigen & Gurd, 1973). Good fits are obtained for n = 6 (Table l), in agreement with previous results (Bismuto et al., 1983). The back titration data have also been fit (Figure 11B) with the same formula, and the parameters are given in Table 1.
While acid unfolding involves the cooperative protonation of six histidines, refolding is cooperative for only two sites, presumably the histidines located in the vicinity of the heme. The pH for the half acidic transition of the NO derivative is quite similar to the values obtained by Puett (1973) for
A
1 0
080.
c 1 060;
? 0 4 0 a .- z"
0 20 . 00 -
FIGURE 11: (A) Fractional contributions of the native fractions of HH (0, + for two separate experiments) and SW (0) nitrosylmyo- globins in 0.1 M Bis-Tris buffer as a function of decreasing pH. The solid lines (a) and (b) are the result of the best fits obtained using eq 5 and the appropriate parameters. (B) Fractional contribu- tions of the native fractions of HH (0) and SW (+) nitrosylmyo- globins in 0.1 M Bis-Tris buffer as a function of increasing pH, starting at 4.0. The slid and dashed lines represent the best fits obtained using eq 5 for HH and SW Mb, respectively.
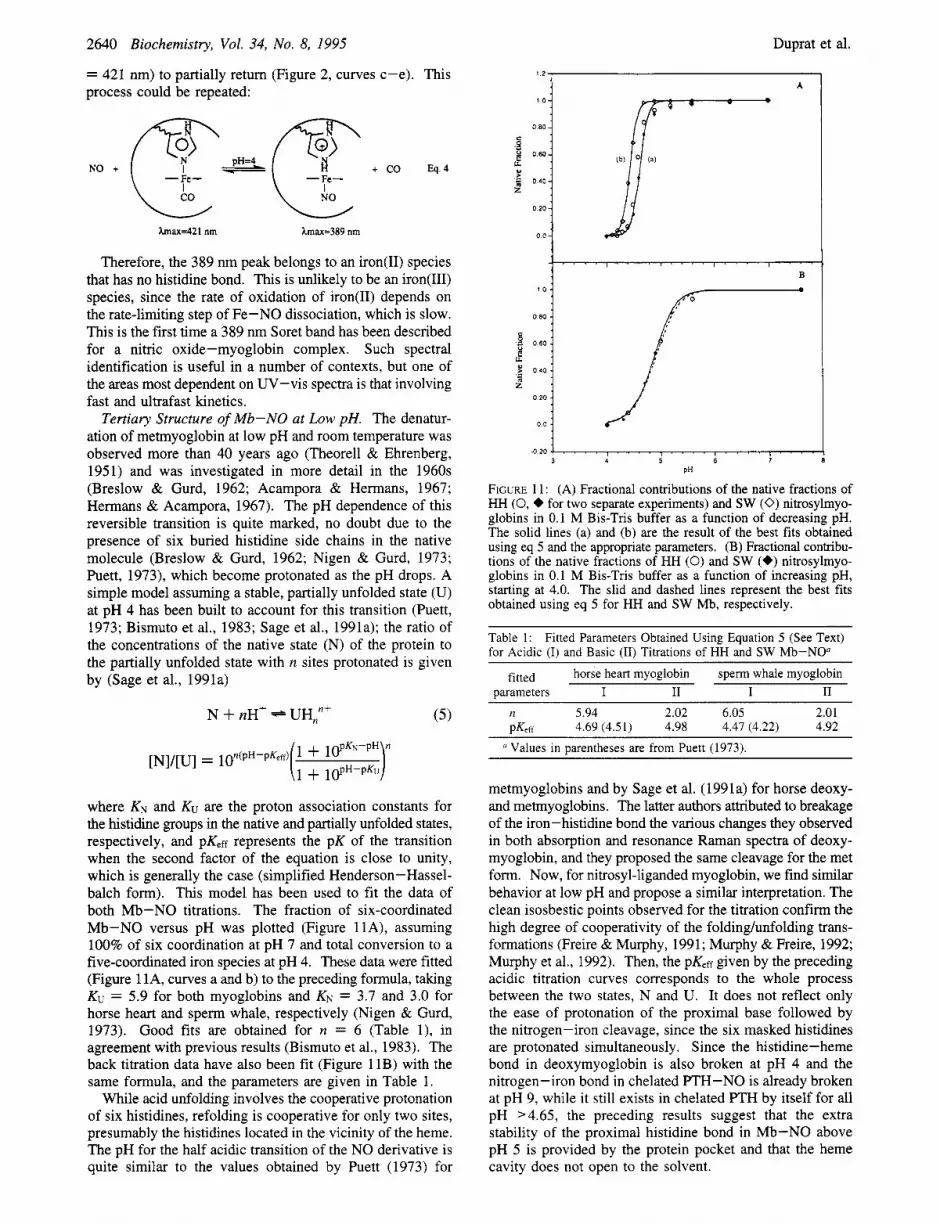
Table 1: for Acidic (I) and Basic (11) Titrations of HH and SW Mb-NO"
Fitted Parameters Obtained Using Equation 5 (See Text)
fitted horse heart myoglobin sperm whale myoglobin uarameters I I1 I I1
n 5.94 2.02 6.05 2.01 PKeff 4.69 (4.51) 4.98 4.47 (4.22) 4.92 Values in parentheses are from Puett (1973).
metmyoglobins and by Sage et al. (1991a) for horse deoxy- and metmyoglobins. The latter authors attributed to breakage of the iron-histidine bond the various changes they observed in both absorption and resonance Raman spectra of deoxy- myoglobin, and they proposed the same cleavage for the met form. Now, for nitrosyl-liganded myoglobin, we find similar behavior at low pH and propose a similar interpretation. The clean isosbestic points observed for the titration confirm the high degree of cooperativity of the foldinghnfolding trans- formations (Freire & Murphy, 1991; Murphy & Freire, 1992; Murphy et al., 1992). Then, the pK,ff given by the preceding acidic titration curves corresponds to the whole process between the two states, N and U. It does not reflect only the ease of protonation of the proximal base followed by the nitrogen-iron cleavage, since the six masked histidines are protonated simultaneously. Since the histidine-heme bond in deoxymyoglobin is also broken at pH 4 and the nitrogen-iron bond in chelated PTH-NO is already broken at pH 9, while it still exists in chelated PTH by itself for all pH >4.65, the preceding results suggest that the extra stability of the proximal histidine bond in Mb-NO above pH 5 is provided by the protein pocket and that the heme cavity does not open to the solvent.

Myoglobin-NO at Low pH
This interpretation is in agreement with the observed behavior of the NO complexes of cytochromes c and c'. Nitrosyl-cytochrome c retains the bound histidine until pH 2 (Yoshimura & Susuki, 1988), which is related to the highly nonpolar environment for the heme (Dickerson et al., 1971). There is no buried histidine except the proximal one, which could account for acid unfolding at pH 4 and a conforma- tional change able to induce the heme-base cleavage. Stronger acidification is needed (Peisach et al., 1971; Tsong, 1975; Drew & Dickerson, 1978; Goto et al., 1990) to obtain maximum unfolding [which results from maximum intra- molecular repulsion between the positively charged groups of the protein (+27; Goto et al., 1990)] and to observe the five-coordinated NO species. Addition of a detergent to NO-ferrous cytochrome c at pH 6.8 (Yoshimura, 1988) results in opening of the pocket and subsequent cleavage of the axial histidine bond similar to the one observed for chelated protoheme-NO at similar pH. Coordination of the nitrosyl group to heme iron in Alcaligenes cytochrome c' brings about the same cleavage at physiological pH (Yoshi- mura et al., 1988), indicating a very weak contribution of the polypeptide chains to the stabilization of the base-heme bond. The other interesting fact is that only two histidines (Table 1) are cooperatively involved in the refolding pathway, suggesting that even if the proximal bond is broken the immediate environment of the heme is preserved at pH 4. This assumption is confirmed by the poor photolability of the NO ligand under these conditions.
Extensive photolysis of Mb-NO at pH 4 in the presence of a great excess of CO yields only very small amounts of Mb-CO (Figure 2). Picosecond kinetic studies also suggest a very small loss of NO to the solvent. Nanosecond photolysis agrees that very little NO escapes, but sets an even lower limit than the picosecond studies. This must be due, in large measure, to the effect of the heme pocket on the rates of NO escape from it and consequent geminate recombination, because under the same conditions PTH- NO photolysis produces an easily observed yield for dis- sociation. Picosecond transients only partially recover in PTH-NO, and nanosecond-microsecond kinetic studies readily generate signals sufficient to characterize bimolecular recombination kinetics, because the NO is able to quickly diffuse away from its heme partner. The overall recombina- tion kinetics displays a bimolecular rate constant of 2 x los M-' s-', which is similar to those of other diffusion-limited reactions (Jongeward et al., 1988). This, too, is consistent with the preceding model, which implies that bond formation is very facile as long as the reactant partners are in close proximity.
All this points to pronounced geminate rebinding of NO in the protein, even at low pH. Furthermore, the low-pH CD results in the 200 nm region for Mb-NO (Figure 4) also indicate partial retention of the tertiary structure in the unfolded state, which is not surprising since it has been proved recently that the acid conformation of the U state for myoglobin retains approximately 50% of the a-helical structure of the native conformation (Bismuto et al., 1983; Irace et al., 1986; Sage et ai., 1992). Recent NMR proton exchange measurements by Hughson et al. (1990) for apomyoglobin suggested that the B-E helices are unfolded in the intermediate state. It is likely that the holoprotein- NO U state described here is structurally close to the I state in the case of the apoprotein studied by Hughson, but the presence of heme in Mb-NO may have an influence on the
Biochemistry, Vol. 34, No. 8, 1995 2641
E helix conformation, which is probably still folded, as revealed by the poor photolability of Mb-NO. These results suggest that the U state may be a stable intermediate on the Mb-NO unfolding pathway (Irace et al., 1986; Hughson et al., 1990); this species would also be more open on the distal side because of the protonation of the distal histidine as well, while keeping the main characteristics of the native protein pocket.
The stopped-flow experiments offer additional evidence for complexity in the unfolding of Mb-NO. Absorption changes at 420 nm (the Soret maximum before bond breaking and unfolding) in SW Mb-NO after a pH jump could not be fitted by a single-exponential process, but required two exponentials, with rate constants of 0.38 and 1.71 s-l. No appreciable reaction involving an absorbance change oc- curred within the dead time of the apparatus, since the maximum absorbance change recorded corresponds to the static UV-vis difference of the Mb-NO spectra before and after acidification, once corrected for dilution. The rate constants are of the same magnitude as those reported for the reaction of Hb-NO with IHP (Cassoly, 1974; Salhany et al., 1974; Hille et al., 1977), which range from 0.6 to 1.6 s-l (Hille et al., 1979), and are also consistent with the results of Shen and Hermans (1972). These rate constants are also not dissimilar from those observed by Coletta et al. (1985) for the spectral transition in deoxy-Mb at low pH, and the absorption spectra obtained after 3 ms (i,e., the dead time of the instrument) were already showing features character- istic of a tetra-coordinated deoxyheme. Therefore, the subsequent spectral transition observed in deoxy-Mb after a pH jump with k = 1.0 s-' cannot refer to the proximal base protonation [which likely occurs within the dead time of stopped flow, as indicated by the spectral features after 3 ms of mixing and by the very fast CO recombination rate constant (Coletta et al., 1985)l. The similarity among the rates of these spectral transitions suggests that they all reflect a similar process, namely, the structural change that follows the cleavage of the proximal bond and the exhaustive protonation of several other groups, leading to the unfolded state (Kihara et al., 1980; Sage et al., 1991b), as also suggested by CD stopped-flow experiments on the femc form of myoglobin (Kihara et al., 1980; Kihara et al., 1982).
Ultrafast Kinetics. Transient difference spectra measured after subpicosecond photolysis of both nitrosylmyoglobins at pH 4 showed loss (bleaching) of the prominent maximum in the Hm-NO spectrum at 388 nm, an isosbestic point at 400 nm, and the appearance of a new maximum at 424 nm (Figure 6). These features are apparent in the transient spectra themselves, and they characterize the first component of the singular value decomposition, as displayed in Figure 6. [The first SVD component is the single basis spectrum that best fit all of the transient data at all times. The second component is the spectrum that is orthogonal to the first and can be added to the first to give the best two-component fit, and so on. The time course of each component describes its contribution at each interval. In the present case, the second and higher components describe small spectral deviation at early times that are assigned to vibrational cooling and, possibly, electronic relaxation during the first few picoseconds after photolysis. Once this thermalization is complete in less than 10 ps, only the first component makes any contribution.] The transient difference spectrum derived by SVD in both myoglobins at pH 4 may be compared to the equilibrium difference spectrum in the Soret region
2642 Biochemistry, Vol. 34, No. 8, 1995 Duprat et al.
before it can escape from the protein (Petrich et al., 1991; Walda et al., 1994). At pH 4, when NO recombines with four-coordinated iron lacking any proximal ligand, the initial fast phase continues as a single exponential, without progres- sive slowing, until almost all the NO recombines. This is demonstrated in Figures 7 and 9. The single exponential accounts for essentially 100% of the decay in less than 100 ps. The rate constant is near 10” s-l, so that 100 ps is about 14 half-lives. In contrast, at neutral pH the decay is strongly nonexponential (Figure 9). The first half-life is still only 10 ps, but the recombination rate steadily decreases. The recombination is finished in a few nanoseconds, but the decay cannot be fit with two or (probably) even three exponentials, as detailed recently (Walda et al., 1994). At 100 ps, substantial amounts of NO remain unbound. The kinetic behavior in the proteins at either pH contrasts with that observed in models in a manner that is instructive. Table 2 lists lifetimes and amplitudes of the recombination phase, and asymptotic absorbance values after the geminate phase are concluded for the proteins along with PTH-NO at pH 9 and PDSE-NO in MCH. The model compound data were derived using the same SVD analysis. The models, like the protein preparations, do exhibit fast, efficient, initial geminate recombination, with a lifetime near 10 ps. However, in the case of the models, significant fractions of NO escape from any solvent cage that might be present (which persists for a few picoseconds, at most, rather than hundreds of nanosec- onds). The escape is 15% in Hm-NO and 47% in PDSE- NO, in agreement with recent reports (Traylor et al., 1993b).
All this strongly suggests that even at low pH and with the imidazole bond broken the protein “pocket” remains structured well enough to impair significant outward ligand escape into the solvent, imposing a distal barrier that is not present in model compounds. It is impossible to know what the ultimate trapping time for the NO ligand may be in the protein at low pH, but it seems to be close to a nanosecond at least, and it could be as long as it is at neutral pH, namely, hundreds of nanoseconds. On the other hand, the close similarity between the spectral components in the protein and the free heme indicates a relaxation of constraints on the heme, with the heme occupying a rather open protein pocket (Han et al., 1990). Finally, the profound change in picosecond kinetics when the imidazole bond breaks is consistent with the mechanism proposed by Petrich et al. (1991) and Kuczera et al. (1993) to account for the highly nonexponential character of the kinetics at neutral pH. Because of the absence of a strong proximal bond connecting the heme to the protein, the protein backbone no longer participates in the relaxation after photolysis. In fact, we may draw a further inference: since unliganded myoglobin displays a pK = 3.4 for the cleavage of the proximal bond (Coletta et al., 1985), at pH 4.0 (where these experiments have been carried out) about 80% of unliganded molecules after photolysis will tend to reform the proximal histidine- heme bond. The clear-cut single exponentiality of the observed geminate recombination process indicates that it occurs before the proximal bond can be formed, assigning an upper limit for its rate (amounting to
The hypothesis that the equilibrium and kinetic properties are influenced, even dominated, by tension on the iron exerted by the proximal histidine is not a new idea introduced solely to explain picosecond data. Two of the most direct arguments favoring the hypothesis depend either on studies on model compounds, which can better isolate one factor at
s-I).
j 395 I 3bo & 420 oio nko 4 s
\\‘a\ elenglh (“rn)
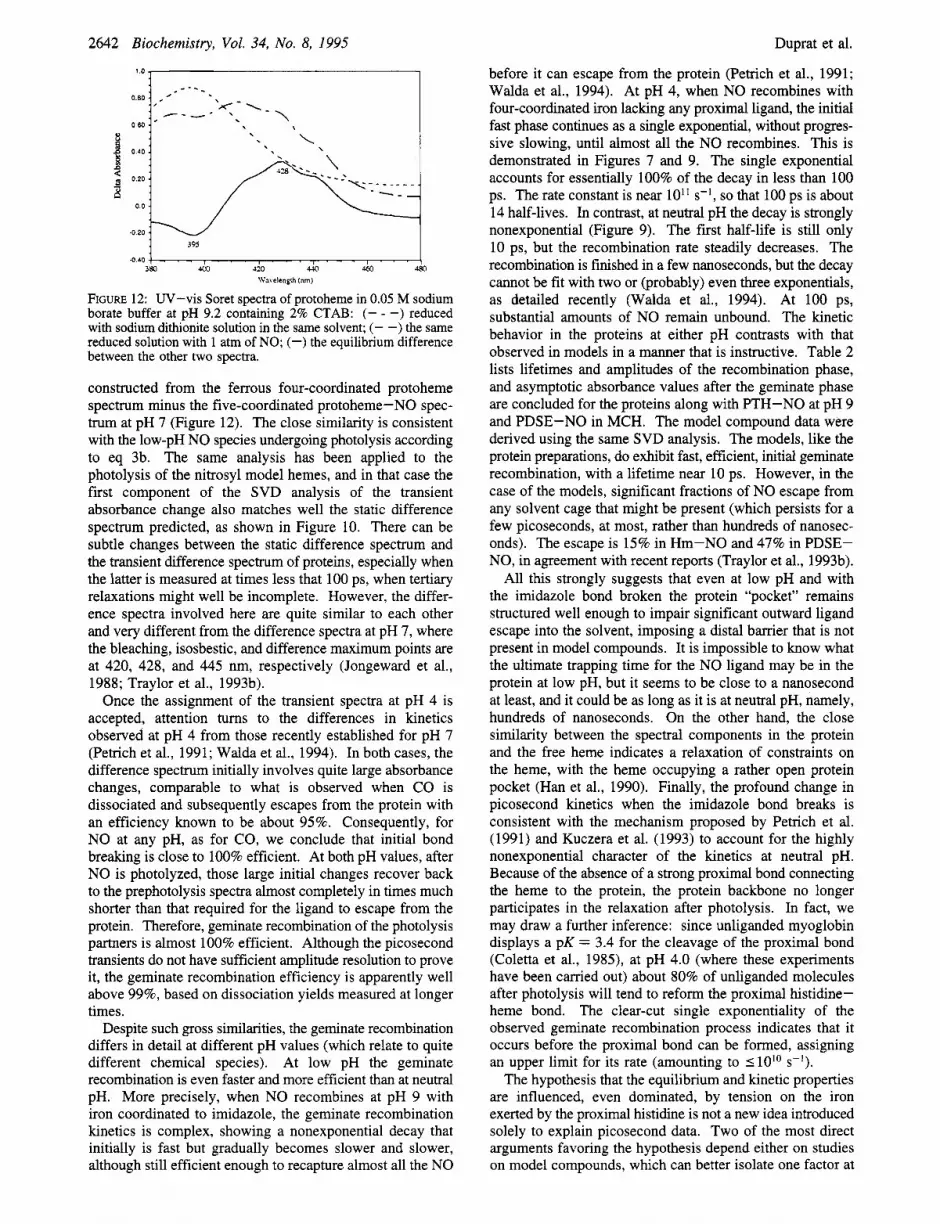
FIGURE 12: UV-vis Soret spectra of protoheme in 0.05 M sodium borate buffer at pH 9.2 containing 2% CTAB: (- - -) reduced with sodium dithionite solution in the same solvent; (- -) the same reduced solution with 1 atm of NO; (-) the equilibrium difference between the other two spectra.
constructed from the ferrous four-coordinated protoheme spectrum minus the five-coordinated protoheme-NO spec- trum at pH 7 (Figure 12). The close similarity is consistent with the low-pH NO species undergoing photolysis according to eq 3b. The same analysis has been applied to the photolysis of the nitrosyl model hemes, and in that case the first component of the SVD analysis of the transient absorbance change also matches well the static difference spectrum predicted, as shown in Figure 10. There can be subtle changes between the static difference spectrum and the transient difference spectrum of proteins, especially when the latter is measured at times less that 100 ps, when tertiary relaxations might well be incomplete. However, the differ- ence spectra involved here are quite similar to each other and very different from the difference spectra at pH 7, where the bleaching, isosbestic, and difference maximum points are at 420, 428, and 445 nm, respectively (Jongeward et al., 1988; Traylor et al., 1993b).
Once the assignment of the transient spectra at pH 4 is accepted, attention turns to the differences in kinetics observed at pH 4 from those recently established for pH 7 (Petrich et al., 1991; Walda et al., 1994). In both cases, the difference spectrum initially involves quite large absorbance changes, comparable to what is observed when CO is dissociated and subsequently escapes from the protein with an efficiency known to be about 95%. Consequently, for NO at any pH, as for CO, we conclude that initial bond breaking is close to 100% efficient. At both pH values, after NO is photolyzed, those large initial changes recover back to the prephotolysis spectra almost completely in times much shorter than that required for the ligand to escape from the protein. Therefore, geminate recombination of the photolysis partners is almost 100% efficient. Although the picosecond transients do not have sufficient amplitude resolution to prove it, the geminate recombination efficiency is apparently well above 99%, based on dissociation yields measured at longer times.
Despite such gross similarities, the geminate recombination differs in detail at different pH values (which relate to quite different chemical species). At low pH the geminate recombination is even faster and more efficient than at neutral pH. More precisely, when NO recombines at pH 9 with iron coordinated to imidazole, the geminate recombination kinetics is complex, showing a nonexponential decay that initially is fast but gradually becomes slower and slower, although still efficient enough to recapture almost all the NO

Myoglobin-NO at Low pH Biochemistry, Vol. 34, No. 8, 1995 2643
Table 2: Protoheme Distearyl Ester
Experimental Filling Parameters for Picosecond Geminate Rebinding of Nitric Oxide to HH and SW Myoglobins, Protoheme, and
minimum maximum sample (pH) length of fit (ps) bleaching (nm) bleaching (nm) amplitude lifetime (ps) baseline offset
HH Mb-NO (7) 200 420 445 0.39 9.5 (fast component) 0.14 0.48 69 (slow component)
HH Mb-NO (4) 80 388 424 1 .oo 12.5 0.00 SW Mb-NO (4) 80 388 424 1 .oo 9.5 0.00 PTH-NO(9) 40 395 423 0.87 7.5 0.07 PDSE-NO 80 395 428 0.53 10 0.23
a time (Sharma et al., 1978; Traylor et al., 1979), or on correlations of Raman vibrational frequencies of particular bonds with reactivity in Hb (Friedman, 1985) and in Mb (Ahmed et al., 1991).
Although the present results are certainly consistent with an important proximal effect, they do not exclude a signifi- cant contribution from distal side effects. Recently, Ikeda- Saito et al. (1993) obtained interesting results with proteins modified at the heme (Co replacing Fe) and at the distal histidine position and suggested distal effects as an altemative explanation of multiexponential rebinding. From the figures they presented, it appears that the influence of distal amino acid 68 is crucial, but the picosecond kinetics remained biphasic (at least) in all cases, even for V68F-NO, while our present results point to almost complete loss of any slow component when the proximal imidazole is decoupled. Much earlier we had measured faster rebinding that was monoexponential at low signal-to-noise (Magde et al., 1985; Jongeward et al., 1986a,b) in elephant Mb, in which there is a naturally occurring mutation that may reduce hindrance on the distal side. The matter of open and closed pockets was discussed at length earlier [see also Champion and Sligar (1989) and Tian et al. (1993)l. The relation between such differences and geminate rebinding has been reported in at least two molecular dynamics simulations recently, which suggest that variations in the distal side environment can indeed affect geminate rebinding (Li et al., 1993; Schaad et al., 1993). Having presented data ourselves on both sides of the argument, we believe that, so far, all investigations demonstrate at most sufficiency of explanation, not necessity or uniqueness. We suspect that proteins employ both factors to modulate reactivity.
In this work, we have confirmed that NO binding acts synergistically with lowered pH in decreasing the energy of the proximal bond. Further, we have shown that (i) the protein moiety plays a crucial role in modulating this energy change, most likely by limiting the access of protons into the proximal side of the heme pocket, and (ii) the strength of the proximal histidine-heme bond is likely to be a crucial component in the activation energy barrier for NO geminate recombination rate, since in its absence the process is monoexponential and very fast, drastically reducing the photosensitivity of this liganded form.
As a concluding remark, we note that heme proteins appear especially suitable to work as NO traps in vivo. By modulating the affinity through conformational arrangements of the proximal side of the heme pocket, they can regulate this trapping function and balance NO concentrations.
Relevance to Soluble Guanylate Cyclase. In this paper, we have described and characterized some aspects of five- coordinated NO-heme in a protein environment, which may have some bearing on guanylate cyclase, the most important five-coordinated heme in its activated state. The data show
that after the breaking of the proximal bond, the structure of the protein remains largely intact for more than an hour. During this time, little if any loss of NO-heme or dissocia- tion of NO or oxidation to ferric heme takes place. One question that remains unanswered is the following: in view of the expected slow NO dissociation ("1 x s-I) from five-coordinated nitrosylheme, what is the mechanism of down-regulation of guanylate cyclase activity, which takes only a few minutes? Studies related to this issue are currently in progress.
Registry Numbers Supplied by Author: NO, 10102-43-9; CO, 630-08-0; nitrosylprotoheme, 54854-55-6; HH Mb, 100684-32-0; SW Mb, 9047-17-0.
ADDED IN PROOF
A recent paper makes a compelling argument for the importance of distal effects for the kinetics of geminate recombination (Carlson et al., 1994).
REFERENCES
Acampora, G., & Hermans, J. (1967) J. Am. Chem. SOC. 89, 1543- 1547.
Ahmed, A. M., Campbell, B. F., Caruso, D., Chance, M. R., Chavez, M. D., Courtney, S. H., Friedman, J. M., Iben, I. E. T., Ondrias, M. R., & Yang, M. (1991) Chem. Phys. 158, 329-351.
Anderson, L. A., Mylrajan, M., Sullivan, E. P., Jr., & Straws, S. H. (1989) J . Biol. Chem. 264, 19099-19102.
Ascenzi, P., Giacometti, G. M., Antonini, E., Rotilio, G., & Brunori, M. (1981) J. Bid. Chem. 256, 5383-5386.
Ascenzi, P., Brunori, M., Coletta, M., & Traylor, T. G. (1985a) Structure And Motion: Membranes, Nucleic Acids & Proteins (Clementi, E., Corongiu, G., Sarma, M. H., & Sarma, R. H., Eds.) pp 331-337, Adenine Press, Guilderland, NY.
Ascenzi, P., Coletta, M., Desideri, A., & Brunori, M. (1985b) Biochim. Biophys. Acta 829, 299-302.
Ascenzi, P., Brunori, M., Coletta, M., & Desideri, A. (1989) Biochem. J. 258, 413-478.
Bismuto, E., Colonna, G., & Irace, G. (1983) Biochemistry 22, 4165-4170.
Breer, H., & Sheperd, G. M. (1993) Trends Neurosci. 16, 5-9. Breslow, E., & Gurd, F. R. N. (1962) J. Biol. Chem. 237, 371-
381. Carlson, M. J., Regan, R., Elber, R., Li, H., Phillips, G. N., Olson,
J. S., & Gibson, Q. H. (1994) Biochemistry 33, 10597-10606. Cassoly, R. (1974) C. R. Acad. Sci. Paris Skr. D 278, 1417-1420. Chatfield, M. D., Walda, K. N., & Magde, D. (1990) J. Am. Chem.
SOC. 112,4680-4687. Chevion, M., Salhany, J. M., Peisach, J., Castillo, C . L., &
Blumberg, W. E. (1976) Zsr. J. Chem. 15, 311-317. Coletta, M., Ascenzi, P., Traylor, T. G., & Brunori, M. (1985) J.
Biol. Chem. 260, 4151-4155. Coletta, M., A., B., Ascenzi, P., Brunori, M., & Chiancone, E.
(1990) J. Biol. Chem. 265, 4828-4830. Coletta, M., Ascenzi, P., Smulevich, G., Mantini, A. R., Del Gaudio,
R., Piscopo, M., & Geraci, G. (1992) FEBS Lett. 296, 184- 186.
Culotta, E., & Koshland, D. E. J. (1992) Science 258, 1862-1865. Deardurff, L. A. (1985) Ph.D. Thesis, University of California at
San Diego, La Jolla, CA.
2644 Biochemistry, Vol. 34, No. 8, 1995
Desideri, A., Meier, U. T., Winterhalter, K. H., & Di Iorio, E. E. (1984) FEBS Lett. 166, 378-380.
Dickerson, R. E., Takano, T., Eisenberg, D., Kallai, 0. B., Samson, L., Cooper, A., & Margoliash, E. (1971) J . Biol. Chem. 246, 1511-1535.
Drew, H. R., & Dickerson, R. E. (1978) J . Biol. Chem. 253, 8420- 8427.
Freire, E., & Murphy, K. P. (1991) J . Mol. Biol. 222, 687-698. Friedman, J. M. (1985) Science 228, 1273-1280. Giacometti, G. M., Traylor, T. G., Ascenzi, P., Brunori, M., &
Antonini, E. (1977) J . Biol. Chem. 252, 7447-7448. Goto, Y., Calciano, L. J., & Fink, A. L. (1990) Proc. Natl. Acad.
Sci. U.S.A. 87, 573-577. Han, S., Rousseau, D. L., Giacometti, G., & Brunori, M. (1990)
Proc. Natl. Acad. Sci. U S A . 87, 205-209. Henry, E. R., & Hofrichter, J. (1992) Methods Enzymol. 210, 129-
192. Henry, Y., Ducrocq, C., Drapier, J.-C., Servent, D., Pellat, C., &
Guissani, A. (1991) Eur. Biophys. J . 20, 1-15. Hermans, J., & Acampora, G. (1967) J . Am. Chem. SOC. 89,1547-
1552. Hibbs, J. J. B., Taintor, R. R., & Vavrin, Z. (1988) Biochem.
Biophys. Res. Commun. 157, 87-94. Hille, R., Palmer, G., & Olson, J. S. (1977) J . Biol. Chem. 252,
403-405. Hille, R., Olson, J. S . , & Palmer, G. (1979) J . Biol. Chem. 254,
12110-12120. Hughson, F. M., Wright, P. E., & Baldwin, R. L. (1990) Science
249, 1544-1548. Iben, I. E. T., Cowen, B. R., Sanches, R., & Friedman, J. M. (1991)
Biophys. J . 59, 908-919. Ignarro, L. J., Adams, J. B., Honvitz, P. M., &Wood, K. S . (1986)
J . Biol. Chem. 261, 4997-5002. Ikeda-Saito, M., Dou, Y., Yonetani, T., Olson, J. S., Li, T., Regan,
R., & Gibson, Q. H. (1993) J. Biol. Chem. 268, 6855-6857. Irace, G., Bismuto, E., Savy, F., & Colonna, G. (1986) Arch.
Biochem. Biophys. 244, 459-469. Jongeward, K. A., Marsters, J. C., & Magde, D. (1986a) Springer
Ser. Chem. Phys. (Ultrafast Phenomena) 46, 427-429. Jongeward, K. A,, Marsters, J. C., Mitchell, M. J., Magde, D., &
Sharma, V. S . (1986b) Biochim. Biophys. Acta 140, 962-966. Jongeward, K. A,, Magde, D., Taube, D. J., Marsters, J. C., Traylor,
T. G., & Sharma, V. S . (1988) J . Am. Chem. SOC. 110, 380- 387.
Kihara, H., Takahashi, E., Yamamura, K., & Tabushi, I. (1980) Biochem. Biophys. Res. Commun. 95, 1687- 1694.
Kihara, H., Takahashi, E., Yamamura, K., & Tabushi, I. (1982) Biochim. Biophys. Acta 702, 249-253.
Knowles, R. G., Palacios, M., Paler, R. M. J., & Moncada, S . (1989) Proc. Natl. Acad. Sci. U S A . 86, 5159-5162.
Kon, H., & Kataoka, N. (1969) Biochemistry 8, 4757-4762. Kuczera, K., Lambry, J.-C., Martin, J.-L., & Karplus, M. (1993)
Proc. Natl. Acad. Sci. U S A . 90, 5805-5807. Li, H., Elber, R., & Straub, J. E. (1993) J . Biol. Chem. 268, 17908-
17916. Magde, D., Martin, J.-L., Wilson, K. R., Dupuy, C., Zhu, J. G.,
Campbell, B. F., Mitchell, M., & Marsters, J. (1985) Proc. SPZE- Int SOC. Opt. Eng. 533, 2-7.
Martin, J.-L., & Vos, M. H. (1994) Methods Enzymol. 232, 416- 430.
Maxwell, J. C., & Caughey, W. S . (1976) Biochemistry 15, 389- 396.
Moncada, S . , Palmer, R. M. J., & Higgs, E. A. (1991) Pharm. Rev. 43, 109-142.
Morikis, D., Champion, P. M., Springer, B. A., & Sligar, S . G. (1989) Biochemistry 28, 4791 -800.
Murad, F. (1986) J . Clin. Invest. 78, 1-5. Murphy, K. P., & Freire, E. (1992) Adv. Protein Chem. 43, 313-
Murphy, K. P., Bhakumi, V., Xie, D., & Freire, E. (1992) J . Mol.
Nagai, K., Welbom, C., Dolphin, D., & Kitagawa, T. (1980)
Nigen, A. M., & Gurd, F. R. N. (1973) J . Biol. Chem. 248, 3708-
Peisach, J . , Blumberg, W. E., Ogawa, S . , Rachmilewitz, E. A., &
361.
Biol. 227, 293-306.
Biochemistry 19,4755-4761.
3715.
Oltzik, R. (1971) J . Biol. Chem. 246, 3342-3355.
Duprat et al.
Perutz, M. F., Kilmartin, J. V., Nagai, K., Szabo, A., & Simon, S .
Petrich, J. W., Lambry, J.-C., Kuczera, K., Karplus, M., Poyart,
Puett, D. (1973) J . Biol. Chem. 248, 4623-34. Rein, H., Ristau, O., & Scheler, W. (1972) FEBS Lett. 24, 24-26. Romberg, R. W., & Kassner, R. J. (1979) Biochemistry 18, 5387-
Rose, E. J., & Hoffman, B. M. (1983) J . Am. Chem. SOC. 105,
Sage, J. T., Morikis, D., & Champion, P. M. (1991a) Biochemistry
R. (1976) Biochemistry 15, 378-387.
C., & Martin, J.-L. (1991) Biochemistry 30, 3975-3987.
5392.
2866-2873.
30, 1227-1237. Sage, J. T., Pusheng, L., & Champion, P. M. (1991b) Biochemistry
30, 1237-1247. Sage, J. T., Morikis, D., Pusheng, L., & Champion, P. M. (1992)
Salhany, J. M., Ogawa, S . , & Schulman, R. G. (1974) Proc. Natl.
Schaad, O., Zhou, H.-X., Szabo, A., Eaton, W. A., & Henry, E. R.
Sharma, V. S . , Geibel, J. F., & Ranney, H. M. (1978) Proc. Natl.
Shen, L. L., & Hermans, J. J. (1972) Biochemistry 11, 1836-1849. Stamler, J. S . , Singel, D. J., & Loscalzo, J. (1992) Science 258,
1898- 1902. Stone, J. R., & Marletta, M. A. (1994) Biochemistry 33, 5636-
5640. Theorell, H., & Ehrenberg, A. (1951) Acta Chem. Scand. 5, 823-
848. Tian, W. D., Sage, J. T., & Champion, P. M. (1993) J . Mol. Biol.
233, 155-66. Traylor, T. G., & Sharma, V. S . (1992) Biochemistry 31, 2846-
2849. Traylor, T. G., Campbell, D., Sharma, V., & Geibel, J. (1979) J .
Am. Chem. SOC. 101, 5376-5383. Traylor, T. G., Deardurff, L. A., Coletta, M., Ascenzi, P., Antonini,
E., & Brunori, M. (1983) J. Biol. Chem. 258, 12147-12148. Traylor, T. G., Noboru, K., & Deardurff, L. A. (1985) J. Am. Chem.
SOC. 107, 6504-6510. Traylor, T. G., Duprat, A. F., & Sharma, V. S . (1993a) J . Am. Chem.
SOC. 115, 810-811. Traylor, T. G., Magde, D., Marsters, J. C., Jongeward, K. A., Wu,
G.-W., & Walda, K. N. (1993b) J . Am. Chem. SOC. 115,4808- 4813.
Biophys. J . 61, 1041-1044.
Acad. Sci. U S A . 71, 3359-3362.
(1993) Proc. Natl. Acad. Sci. U S A . 90, 9547-9551.
Acad. Sci. U S A . 75, 3747-3750.
Tsong, T. Y. (1975) Biochemistry 14, 1542-1547. Walda, K. N., Liu, X. Y., Sharma, V. S., & Magde, D. (1994)
Wayland, B. B., & Olson, L. W. (1974) J . Am. Chem. SOC. 96,
White, D. K., Cannon, J. B., & Traylor, T. G. (1979) J . Am. Chem.
Yonetani, T., Yamamoto, H., Erman, J. E., Leigh, J., & Reed, G.
Yoshimura, T. (1978) Bull. Chem. SOC. Jpn. 51, 1237-1238. Yoshimura, T. (1983) Arch. Biochem. Biophys. 220, 167-178. Yoshimura, T. (1988) Arch. Biochem. Biophys. 264, 450-461. Yoshimura, T., & Ozaki T. (1984) Arch. Biochem. Biophys. 229,
126- 135. Yoshimura, T., & Susuki, S . (1988) Inorg. Chim. Acta 152, 241-
249. Yoshimura, T., Ozaki, T., Shintani, Y., & Watanabe, H. (1979)
Arch. Biochem. Biophys. 193, 301-313. Yoshimura, T., Susuki, S . , Nakahara, A., Iwasaki, H., Masuko, M.,
& Matsubara, T. (1986) Biochemistry 25, 2436-2442. Ziche, M., Morbidelli, L., Masini, E., Granger, H., Geppetti, P., &
Ledda, F. (1993) Biochem. Biophys. Res. Commun. 192, 1 198- 1203.
BI9415381
Biochemistry 33, 2198-2209.
6037-6041.
SOC. 101, 2443-2454.
H. (1972) J . Biol. Chem. 247, 2447-2455.