Emergence of HGF/SF-Induced Coordinated Cellular Motility
13
Emergence of HGF/SF-Induced Coordinated Cellular Motility Assaf Zaritsky 1 , Sari Natan 2 , Eshel Ben-Jacob 3,4,5,6 , Ilan Tsarfaty 2 * 1 Blavatnik School of Computer Science, Tel Aviv University, Tel Aviv, Israel, 2 Department of Clinical Microbiology and Immunology, Sackler School of Medicine, Tel Aviv University, Tel Aviv, Israel, 3 School of Physics and Astronomy, The Raymond and Beverly Sackler Faculty of Exact Sciences, Tel-Aviv University, Tel-Aviv, Israel, 4 Center for Theoretical Biological Physics, Rice University, Houston, Texas, United States of America, 5 Research & Development Unit Assaf Harofeh Medical Center, Zerifin, Israel, 6 School of Physics and Astronomy, Tel Aviv University, Tel Aviv, Israel Abstract Collective cell migration plays a major role in embryonic morphogenesis, tissue remodeling, wound repair and cancer invasion. Despite many decades of extensive investigations, only few analytical tools have been developed to enhance the biological understanding of this important phenomenon. Here we present a novel quantitative approach to analyze long term kinetics of bright field time-lapse wound healing. Fully-automated spatiotemporal measures and visualization of cells’ motility and implicit morphology were proven to be sound, repetitive and highly informative compared to single-cell tracking analysis. We study cellular collective migration induced by tyrosine kinase-growth factor signaling (Met-Hepatocyte Growth Factor/Scatter Factor (HGF/SF)). Our quantitative approach is applied to demonstrate that collective migration of the adenocarcinoma cell lines is characterized by simple morpho-kinetics. HGF/SF induces complex morpho-kinetic coordinated collective migration: cells at the front move faster and are more spread than those further away from the wound edge. As the wound heals, distant cells gradually accelerate and enhance spread and elongation –resembling the epithelial to mesenchymal transition (EMT), and then the cells become more spread and maintain higher velocity than cells located closer to the wound. Finally, upon wound closure, front cells halt, shrink and round up (resembling mesenchymal to epithelial transition (MET) phenotype) while distant cells undergo the same process gradually. Met inhibition experiments further validate that Met signaling dramatically alters the morpho-kinetic dynamics of the healing wound. Machine-learning classification was applied to demonstrate the generalization of our findings, revealing even subtle changes in motility patterns induced by Met-inhibition. It is concluded that activation of Met-signaling induces an elaborated model in which cells lead a coordinated increased motility along with gradual differentiation-based collective cell motility dynamics. Our quantitative phenotypes may guide future investigation on the molecular and cellular mechanisms of tyrosine kinase- induced coordinate cell motility and morphogenesis in metastasis. Citation: Zaritsky A, Natan S, Ben-Jacob E, Tsarfaty I (2012) Emergence of HGF/SF-Induced Coordinated Cellular Motility. PLoS ONE 7(9): e44671. doi:10.1371/ journal.pone.0044671 Editor: Elad Katz, University of Edinburgh, United Kingdom Received June 4, 2012; Accepted August 6, 2012; Published September 6, 2012 Copyright: ß 2012 Zaritsky et al. This is an open-access article distributed under the terms of the Creative Commons Attribution License, which permits unrestricted use, distribution, and reproduction in any medium, provided the original author and source are credited. Funding: This work was supported in part by research grants from the Breast Cancer Research Foundation, the Federico Foundation Grants, the United States - Israel Binational Science Foundation and the Tauber Family Foundation. The funders had no role in study design, data collection and analysis, decision to publish, or preparation of the manuscript. Competing Interests: The authors have declared that no competing interests exist. * E-mail: [email protected] Introduction Collective cell migration is prevalent in many physiological phenomena and is the most common motility pattern in living organisms [1]. In morphogenesis, large clusters of cells travel long distances to reach their ultimate biological destination. In tissue repair, sheets of cells move coordinately to repair damaged tissue. In cancer, cells invade the extracellular matrix and traverse across normal tissue with extreme efficiency to form metastases. Extensive research has been carried out for many years in various experimental model systems to investigate, describe, analyze, model and simulate collective cell migration. There are several theories concerning the mechanisms behind collective motility [2,3]. A relatively common one regarding the physical interactions is "Follow the Leader" [4], were cells at the leading edge are assumed to produce force to pull passive followers from cells located further away from the front [5,6,7,8,9]. For example, Inaki et al. [9] recently demonstrated that directionality can be encoded within a group of cells by the constituents attaining different signaling levels. However, accumulating evidence implies that the behavior is more complex. Modern microscopy [10] revealed that distant cells extend in what is referred to as ‘cryptic’ lamellipodia against the substratum beneath their preceding cells, evidence that the cells further behind the leading edge do not simply act as naı ¨ve followers. Recent measurements of distributions of traction- and intercellular-forces within the monolayer also suggest that the "follow the leader" paradigm is too simplistic [11,12,13,14] and argue that cells further away from the front are also self-propelled in the collective motility process. Several mathematical models have been devised to describe collective migration based on single cell motility and cell-cell interactions [15,16,17]. Another theory assumes that cell proliferation expands the colony and thereby generates pressures that cause the leading cells to move [5,18,19,20], but earlier studies demonstrated that cell migration in mucosal healing is largely independent of pro- PLOS ONE | www.plosone.org 1 September 2012 | Volume 7 | Issue 9 | e44671
-
Upload
independent -
Category
Documents
-
view
0 -
download
0
Transcript of Emergence of HGF/SF-Induced Coordinated Cellular Motility

Emergence of HGF/SF-Induced Coordinated CellularMotilityAssaf Zaritsky1, Sari Natan2, Eshel Ben-Jacob3,4,5,6, Ilan Tsarfaty2*
1 Blavatnik School of Computer Science, Tel Aviv University, Tel Aviv, Israel, 2Department of Clinical Microbiology and Immunology, Sackler School of Medicine, Tel Aviv
University, Tel Aviv, Israel, 3 School of Physics and Astronomy, The Raymond and Beverly Sackler Faculty of Exact Sciences, Tel-Aviv University, Tel-Aviv, Israel, 4Center for
Theoretical Biological Physics, Rice University, Houston, Texas, United States of America, 5 Research & Development Unit Assaf Harofeh Medical Center, Zerifin, Israel,
6 School of Physics and Astronomy, Tel Aviv University, Tel Aviv, Israel
Abstract
Collective cell migration plays a major role in embryonic morphogenesis, tissue remodeling, wound repair and cancerinvasion. Despite many decades of extensive investigations, only few analytical tools have been developed to enhance thebiological understanding of this important phenomenon. Here we present a novel quantitative approach to analyze longterm kinetics of bright field time-lapse wound healing. Fully-automated spatiotemporal measures and visualization of cells’motility and implicit morphology were proven to be sound, repetitive and highly informative compared to single-celltracking analysis. We study cellular collective migration induced by tyrosine kinase-growth factor signaling (Met-HepatocyteGrowth Factor/Scatter Factor (HGF/SF)). Our quantitative approach is applied to demonstrate that collective migration ofthe adenocarcinoma cell lines is characterized by simple morpho-kinetics. HGF/SF induces complex morpho-kineticcoordinated collective migration: cells at the front move faster and are more spread than those further away from thewound edge. As the wound heals, distant cells gradually accelerate and enhance spread and elongation –resembling theepithelial to mesenchymal transition (EMT), and then the cells become more spread and maintain higher velocity than cellslocated closer to the wound. Finally, upon wound closure, front cells halt, shrink and round up (resembling mesenchymal toepithelial transition (MET) phenotype) while distant cells undergo the same process gradually. Met inhibition experimentsfurther validate that Met signaling dramatically alters the morpho-kinetic dynamics of the healing wound. Machine-learningclassification was applied to demonstrate the generalization of our findings, revealing even subtle changes in motilitypatterns induced by Met-inhibition. It is concluded that activation of Met-signaling induces an elaborated model in whichcells lead a coordinated increased motility along with gradual differentiation-based collective cell motility dynamics. Ourquantitative phenotypes may guide future investigation on the molecular and cellular mechanisms of tyrosine kinase-induced coordinate cell motility and morphogenesis in metastasis.
Citation: Zaritsky A, Natan S, Ben-Jacob E, Tsarfaty I (2012) Emergence of HGF/SF-Induced Coordinated Cellular Motility. PLoS ONE 7(9): e44671. doi:10.1371/journal.pone.0044671
Editor: Elad Katz, University of Edinburgh, United Kingdom
Received June 4, 2012; Accepted August 6, 2012; Published September 6, 2012
Copyright: � 2012 Zaritsky et al. This is an open-access article distributed under the terms of the Creative Commons Attribution License, which permitsunrestricted use, distribution, and reproduction in any medium, provided the original author and source are credited.
Funding: This work was supported in part by research grants from the Breast Cancer Research Foundation, the Federico Foundation Grants, the United States -Israel Binational Science Foundation and the Tauber Family Foundation. The funders had no role in study design, data collection and analysis, decision to publish,or preparation of the manuscript.
Competing Interests: The authors have declared that no competing interests exist.
* E-mail: [email protected]
Introduction
Collective cell migration is prevalent in many physiological
phenomena and is the most common motility pattern in living
organisms [1]. In morphogenesis, large clusters of cells travel long
distances to reach their ultimate biological destination. In tissue
repair, sheets of cells move coordinately to repair damaged tissue.
In cancer, cells invade the extracellular matrix and traverse across
normal tissue with extreme efficiency to form metastases.
Extensive research has been carried out for many years in
various experimental model systems to investigate, describe,
analyze, model and simulate collective cell migration. There are
several theories concerning the mechanisms behind collective
motility [2,3]. A relatively common one regarding the physical
interactions is "Follow the Leader" [4], were cells at the leading
edge are assumed to produce force to pull passive followers from
cells located further away from the front [5,6,7,8,9]. For example,
Inaki et al. [9] recently demonstrated that directionality can be
encoded within a group of cells by the constituents attaining
different signaling levels.
However, accumulating evidence implies that the behavior is
more complex. Modern microscopy [10] revealed that distant cells
extend in what is referred to as ‘cryptic’ lamellipodia against the
substratum beneath their preceding cells, evidence that the cells
further behind the leading edge do not simply act as naı̈ve
followers. Recent measurements of distributions of traction- and
intercellular-forces within the monolayer also suggest that the
"follow the leader" paradigm is too simplistic [11,12,13,14] and
argue that cells further away from the front are also self-propelled
in the collective motility process. Several mathematical models
have been devised to describe collective migration based on single
cell motility and cell-cell interactions [15,16,17].
Another theory assumes that cell proliferation expands the
colony and thereby generates pressures that cause the leading cells
to move [5,18,19,20], but earlier studies demonstrated that cell
migration in mucosal healing is largely independent of pro-
PLOS ONE | www.plosone.org 1 September 2012 | Volume 7 | Issue 9 | e44671

liferation [20]. Moreover, Poujade et al. [5] showed that pro-
liferation can occur almost exclusively in the void regions and
hence cannot provide complete explanation for the general
phenomenon.
In the standard in-vitro wound healing assay, collective migration
of cells toward the wound is induced by a sudden injury created by
removal of a sheet of cells from the monolayer [21]. Traditionally,
the assay is applied to measure the change in healing rate caused
by chemicals, other environmental conditions or cell types.
The epithelial to mesenchymal transition (EMT) activated by
alternations in gene expression regulates epithelial plasticity during
morphogenesis, tissue repair and cancer invasion [22]. During
EMT, epithelial cells become motile and invasive, a process that is
characterized by an elongated and more spread morphology
throughout [23]. Cancer metastasis consists of a sequential series
of events, and the EMT and mesenchymal-epithelial transition
(MET) are recognized as critical events for metastasis of
carcinomas [24]. A current area of focus is the histopathological
similarity between primary and metastatic tumors, and MET at
sites of metastases has been postulated as part of the process of
metastatic tumor formation [24].
Understanding collective cell motility and how it may lead to
metastatic formation is an important task since the vast majority of
cancer deaths result of progression from a localized lesion to
distant metastases [25]. In vitro collective migration is common in
breast cancer, as well as in many other cancer types [26]. Several
signal transduction pathways and proteins that are related to
collective processes in morphogenesis contribute to cancer pro-
gression, but their molecular action mechanisms remain mostly
unknown [1]. Many efforts are invested in targeting the tyrosine
kinase growth factor receptor Met and its ligand HGF/SF, the
master regulators of cell motility in normal and malignant
processes [27,28,29,30].
Here, we investigate the link between cells’ morpho-kinetic
dynamics and collective migration of tumor cells using mammary
adenocarcinoma cells expressing high levels of Met, image them
using a time-lapse microscopy wound healing assay, and study the
effect of HGF/SF-Met signaling on morphology and collective
motility patterns.
We devised a novel approach to analyze wound healing in vitro
using bright field, time-lapse microscopy, based on the combina-
tion of a fully automated algorithm that extracts motility
measurements from all cells in the monolayer with indirect
cellular morphology measures using image-texture descriptors,
and single cells’ morphology measurements extracted semi-
manually. Recording these as a function of location over
prolonged periods allows a coherent and concise depiction of the
essence behind three collective motility modes of cancerous cells,
and to reveal that Met-activation by HGF/SF induces elaborated
collective cell motility that is correlative to the EMT-MET
morphological transition.
Materials and Methods
Cell Lines/GrowthDA3 cells, derived from the mouse mammary adenocarcinoma
cell line D1-DMBA-3, induced in BALB/C mice by dimethyl-
benzanthracene [31] were grown in DMEM supplemented with
10% heat-inactivated FCS (Gibco 6 BRL).
Wound Healing AssayDA3 cells expressing the fluorescent protein mCherry were
grown to 90% confluence in wells of 2 cm2 diameter and treated
with or without the Met inhibitor PHA665752 [32] (2.5 mM) for
2 hours. A scratch of approximately 300 mm in width was
generated using a 200 ml tip, and the cells were incubated with
or without HGF/SF (80 ng ml21) and subjected to time lapse
confocal laser scanning microscopy (CLSM-510, Zeiss, Germany)
for approximately 26 hours, at frequency of once every 14.5
minutes. The position of each scratch was predefined, and
a macro that repetitively positions the microscope on each point
was executed. The acquired differential interference contrast
(DIC) channel of the time-lapse sequence was used for the multi-
cellular analysis; the red fluorescence channel was exploited for
single cell tracking.
Phases in the healing process. Three phases were defined
(Figure 1). Phase 1, from the scratch formation until first contact
between cells from opposing wound edges; Phase 2, from first
contact until full closure of the wound - the wound area is
completely covered by one layer of cells; Phase 3, post wound
closure. The effect of HGF/SF on cellular motility patterns,
morphology and multi-cellular texture were evaluated according
to the three healing phases. Dividing the healing process to phases
is important since the duration of each phase varies between the
treatments.
Velocity Magnitude Map – Fully Automated, Objective,Multi-Cellular Motility Visualization and Representation
Motility measurements were extracted via a fully-automated
algorithm that quantifies local motion estimation from the time-
lapse bright field (DIC) channel. The algorithm includes segmen-
tation to partition a DIC image to multi-cellular- and background-
regions, followed by local-motion estimation and quantification of
the extracted motion fields’ magnitude (which resembles cells’
local speed) at different distances from the wound edge.
Continuous quantitative description of cells’ velocity magnitude
as a function of distance from the wound throughout the healing
process is achieved by constructing a ‘‘velocity magnitude map’’:
Given two consecutive DIC frames t, t+1 from the time-lapse
sequence.
N Partition the current image (at time t) to a grid of sub-cellular
sized local patches.
N Apply motion estimation to retrieve velocity fields estimations
for each patch (Figure 2, top rows).
N Segment the image to cellular and background regions, and
use the segmented image to define strips, mask containing all
pixels at a given distance from the wound edge (Figure 2,
bottom rows).
N For a given distance d from the wound edge, calculate the
speed of the "average" cell located at d by averaging the
velocity magnitude of all pixels in the corresponding strip. This
step is repeated for every d.
Examples of two representative velocity magnitude maps, of
HGF/SF-treated and untreated cells are presented in Figure 3a;
the two vertical lines define the partition to the three healing
phases. Detailed description of each step in velocity magnitude
map’s construction is found in the Methods S1.
Multi-Cellular Texture RepresentationSimilarly to the velocity map, each image is represented by the
histogram of texture-descriptors in its cellular regions (defined by
the segmented image). The Local-Binary Patterns (LBP), known to
perform well in face-recognition [33], were applied as the texture
descriptor. It is a gray-scale invariant texture measure: for every
pixel, a code is generated based on the number and location of
Emergence of Complex Collective Motility Patterns
PLOS ONE | www.plosone.org 2 September 2012 | Volume 7 | Issue 9 | e44671

neighboring pixels with higher and lower intensities than that
pixel. There are ten possible codes, and their histogram over all
cellular pixels is used to describe the image’s texture (Figure S1),
an implicit measure for cells’ morphology that is similar to the one
for cell scattering [34]. Thus, a time-lapse experiment is again
represented by a two-dimensional map: the x-axis represents time,
whereas the y-axis is the LBP histogram.
Treatment Prediction for Wound Healing Time-LapseExperiments
To enable automatic prediction whether a full DIC time
lapse wound healing experiment was or was not treated with
HGF/SF, the 3-dimensional time-lapse (image space and time)
was "compressed" to a 2-dimensional representation, the
velocity magnitude map described above. This compact de-
scription was further represented by a one-dimensional de-
scriptor vector as follows: distances from the wound were
partitioned to 6 intervals, and the average speed of all cells in
any given interval during the 3 phases in the healing process
were used to define a vector representation of a time lapse
wound healing experiment (Figure S2a). To cancel out the effect
of the general increased motility induced by HGF/SF, a second
representation was achieved similarly, by normalizing these
vectors to be of norm 1. Similar predictions were performed
with multi-cellular texture representation (Figure S2b), using the
average texture-descriptor (described above) from first contact
between cells from opposing edges of the wound until full
closure is achieved (Phase 2).
Results
Motility AnalysisQualitative comparison of the velocity magnitude maps
visualization between untreated and treated cells revealed the
unique motility patterns induced by HGF/SF (Figure 3a). Front
layers of untreated DA3 cells move faster than those located
behind, demonstrating a homogeneous motility pattern during the
wound healing process (Phases 1 and 2). During post wound closure
(Phase 3), all cells decelerate regardless of their position. HGF/SF
treatment leads to emergence of dramatic different cell motility
patterns: at the beginning, front cells move faster than distant cells.
Throughout Phase 1, distant cells gradually join the rapid motion
by accelerating layer by layer. This gradual acceleration continues
during Phase 2, where distant cells maintain a significantly higher
motility toward the wound than cells located closer to the wound
edge (data not shown). Finally, post wound closure (Phase 3), front
cells halt, while distant cells gradually decelerate. These results
demonstrate that Met-activation via HGF/SF induces complex
motility patterns indicating cell-cell coordination and dynamic
signaling that generates micro-differentiation in the healing
wound.
To further demonstrate these phenomena, an alternative
visualization is presented in Figure 4a–b, taking into account the
direction perpendicular to (toward) the scratch. "Average" cells
(calculated as indicated in Materials & Methods) at several
locations (25–335 mm from the wound edge) were selected and
"tracked" throughout the healing process. The distance that an
"average" cell travels in each frame (retrieved from the velocity
Figure 1. Three phases in the healing process. Phase 1: From the first frame in the time-lapse sequence, until first contact between cells fromopposing edges of the wound. Phase 2: until full closure of the wound. Phase 3: post wound closure.doi:10.1371/journal.pone.0044671.g001
Emergence of Complex Collective Motility Patterns
PLOS ONE | www.plosone.org 3 September 2012 | Volume 7 | Issue 9 | e44671

Emergence of Complex Collective Motility Patterns
PLOS ONE | www.plosone.org 4 September 2012 | Volume 7 | Issue 9 | e44671

fields’ estimation) was accumulated to define its displacement as
function of time. Indeed, this measure is not exactly the actual
displacement, as it contains algorithmic "noise", cells deformations
and proliferation. Nevertheless, since the errors and noise occur in
all "directions", we assume that this measure is an approximated
representation of the true dynamics. Figure 4a–b displays this
Figure 2. Motion estimation. Given two consecutive frames from the DIC time-lapse sequence (upper row), local-motion estimation is performedat the patch level (of size ,18.5 mm618.5 mm each) to produce the velocity-estimation vector fields. In the right part of the middle row, dx, dy arethe partition to the two motion-components (dy – toward the wound, dx – parallel to the wound), the velocity fields are explicitly represented in thelarge image in the middle row. The segmented image (lower-left corner) displays the contours extracted by the MultiCellSeg algorithm over the DICimage. The wounded regions are used to define strip, a mask containing all pixels in a given distance from the wound (bottom-right). To quantify the"average" cell’s motility at a given distance from the wound, velocity magnitude is averaged over the corresponding mask.doi:10.1371/journal.pone.0044671.g002
Figure 3. Velocity Magnitude Maps. (a) A two-dimensional depiction of the average motility of all cells at a given distance from the wound edge(y-axis) at a given time (x-axis). Each bin (t,d) represents the average motility (mm hour21) of all cells at distance d from the wound at time t. Examplesof two representative velocity magnitude maps are shown: untreated and HGF/SF-treated. The two vertical lines in each map define the partition tothe three phases in the healing process. (b) The maps constructed from single-cell tracking. Examples of untreated and HGF/SF-treated cells aredisplayed. Comparison with the corresponding multi-cellular maps reveals that this approach provides a significant advantage over single-cellanalysis. (c) Single cell tracking at several distances from the wound. Only the velocity component toward the wound is considered.doi:10.1371/journal.pone.0044671.g003
Emergence of Complex Collective Motility Patterns
PLOS ONE | www.plosone.org 5 September 2012 | Volume 7 | Issue 9 | e44671

displacement measure (denoted R) as a function of time until full
closure (Phases 1 and 2). It is shown (Figure 4a) that untreated cells
express a "fan-like" dynamics, where front cells expand a physical
gap from cells behind, a gap that grows steadily during healing. As
for treated cells (Figure 4b): during Phase 1, a gap is formed
between front and distant cells, but cells from behind progressively
accelerate so that this displacement-gap shrinks or at least remains
constant during Phase 2 for cells located about 10 cell-layers behind
the leading edge. Figure 4c–d plots the average velocity
component toward the wound over time. Untreated cells exhibit
roughly constant velocity, front cells being faster than farther cells
(Figure 4c). The gradual acceleration of distant HGF/SF-treated
cells throughout Phase 1, and the higher velocity maintained by
distant cells compared to front cells is displayed in Figure 4d.
These conclusions referring to an estimation of the "average" cells’
velocity over time are supported by single-cell tracking experi-
ments as shown in Figure 3c.
To validate the local motion-estimation, which is a fundamental
component in our analysis, we compared manually-validated
fluorescence-based semi-automated single cells tracking to fully-
automated single-cell trajectory estimation extracted using these
local motion-fields (as described in Methods S1). These trajectories
are highly correlative to the manually-validated trajectories
(Figure 5a). Moreover, examinations of corresponding multi-
cellular versus single-cell based velocity maps (Figure 3a-b) clearly
demonstrate a significant qualitative advantage of the former
approach: using noisy estimation of all cells (Figure 5b) enables an
enhanced and a more coherent representation of the true nature of
the process.
Single-Cell Morphology AnalysisFigure 6a illustrates the average cell’s area as function of
distance from the wound over the different healing phases for
untreated (left) and treated (right) cells (as described in Methods
Figure 4. Motility patterns. (a–b) ‘‘Average’’ cell tracking toward the wound, and the displacement gap mystery. An ‘‘average’’ cell’s velocity ata given time and distance from the wound is defined as the average velocity component toward the wound in the strip that corresponds to therelevant location. The distance that an "average" cell travels in each frame (retrieved from the corresponding velocity fields) was accumulated todefine its displacement as function of time. The x-axis represents time; the y-axis represents the ‘‘average’’ cell’s displacement toward the wound atseveral spatial locations. For untreated cells (a) it is demonstrated that front cells accumulate an expanding displacement gap over distant cellsduring healing. For HGF/SF-treated ‘‘average’’ cell tracking (b). A gap is formed between front and distant cells; however, during Phase 2 it is shownthat cells from behind progressively accelerate so that the displacement-gap formed at Phase 1 shrinks for distant cells. (c–d) Untreated cells (c)exhibit roughly constant velocity toward the wound, whereas close cells are faster than farther cells. Distant HGF/SF-treated cells (d) exhibit gradualacceleration until they maintain higher velocity toward the wound than close cells in Phase 2.doi:10.1371/journal.pone.0044671.g004
Emergence of Complex Collective Motility Patterns
PLOS ONE | www.plosone.org 6 September 2012 | Volume 7 | Issue 9 | e44671

S1). In addition to the predefined three healing phases, a fourth
time point was added, which represents the last frame in the time-
lapse and is used to demonstrate the final stages of the healing
process. The x-axis consists of 4 different distance intervals from
the wound edge, the y-axis is the average cells’ area at a given
phase and distance-interval. Until full closure (Phases 1 and 2)
untreated cells that are close to the wound are larger than distant
cells. Front cells shrink upon wound closure, and after the wound
has healed all cells in the monolayer shrink to maintain
approximately the same size independently of their location.
Similarly to its effect on cells’ speed, HGF/SF treatment induces
dramatic changes in the dynamics of cellular morphology. At the
initial stage, close cells are larger than distant cells. During Phase 2,
front cells begin to shrink while farther cells grow. In Phase 3, only
the most distant cells continue to grow while the rest shrink. After
the wound has healed, all cells have shrunk to approximately the
same size. A bar graph that compares treated and untreated cells’
area for every distance interval over time demonstrates that the
main differences occur in Phases 2 and 3, when treated cells that
are located far from the leading edge grow dramatically in
a progressive manner (Figure S3a). Similar patterns of morphology
alteration are depicted using cell eccentricity. Untreated cells that
are close to the wound are more elliptical than distant cells
throughout the healing, while front treated cells begin as more
elliptical than distant cells, that in turn, during the later stages,
become more elliptical than these front cells (Figure S4).
Cells Density and MotilityNext, the relation between cell motility and density was
examined. Cells density was estimated based on cell size
measurements as detailed in Methods S1. Throughout the healing
Figure 5. Multi-cellular DIC based single cell trajectory estimation. (a) Visual comparison of manually tracked cells (green) and automatedtrajectories extracted from local DIC-based motion estimation (red). It is shown that the automated trajectories are highly correlated to the manually-validated trajectories. Examples of untreated (left pane) and HGF/SF-treated (right pane) are illustrated. (b) Visual illustration of the advantage inusing all cells’ information in comparison to part of the cells. Green trajectories are the manually-validated trajectories, red are trajectories extractedby our method. Left pane - untreated cells, right pane - treated cells.doi:10.1371/journal.pone.0044671.g005
Emergence of Complex Collective Motility Patterns
PLOS ONE | www.plosone.org 7 September 2012 | Volume 7 | Issue 9 | e44671
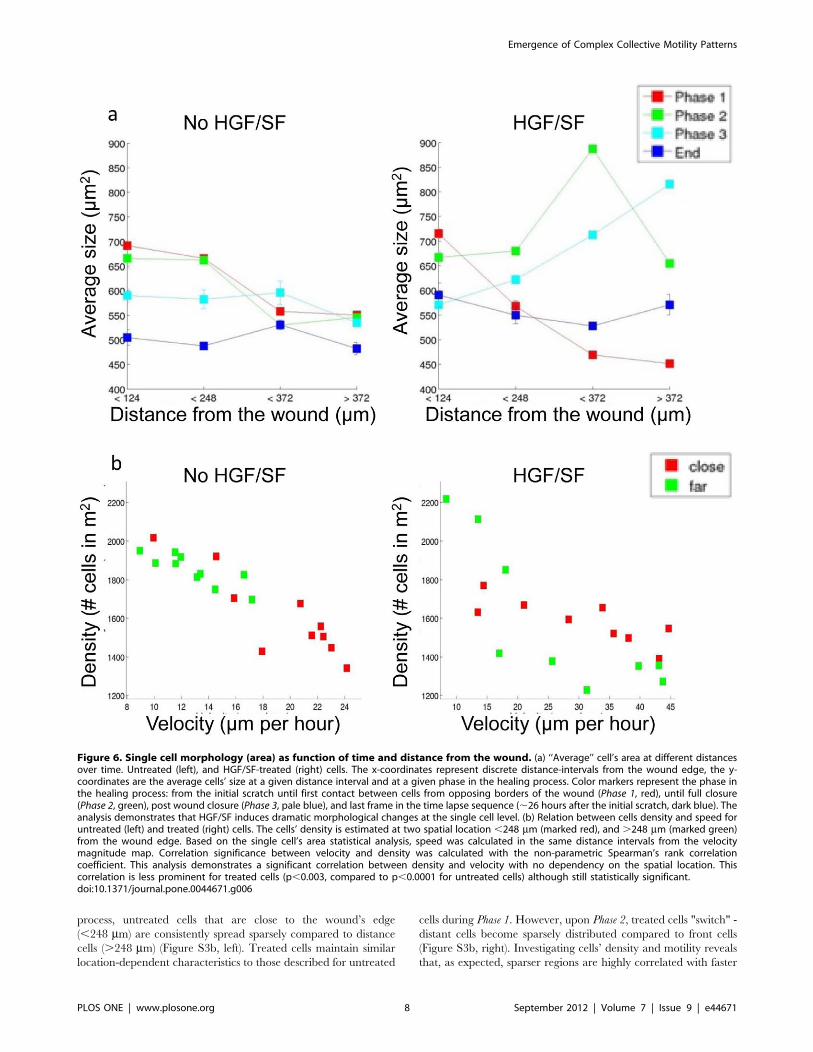
process, untreated cells that are close to the wound’s edge
(,248 mm) are consistently spread sparsely compared to distance
cells (.248 mm) (Figure S3b, left). Treated cells maintain similar
location-dependent characteristics to those described for untreated
cells during Phase 1. However, upon Phase 2, treated cells "switch" -
distant cells become sparsely distributed compared to front cells
(Figure S3b, right). Investigating cells’ density and motility reveals
that, as expected, sparser regions are highly correlated with faster
Figure 6. Single cell morphology (area) as function of time and distance from the wound. (a) ‘‘Average’’ cell’s area at different distancesover time. Untreated (left), and HGF/SF-treated (right) cells. The x-coordinates represent discrete distance-intervals from the wound edge, the y-coordinates are the average cells’ size at a given distance interval and at a given phase in the healing process. Color markers represent the phase inthe healing process: from the initial scratch until first contact between cells from opposing borders of the wound (Phase 1, red), until full closure(Phase 2, green), post wound closure (Phase 3, pale blue), and last frame in the time lapse sequence (,26 hours after the initial scratch, dark blue). Theanalysis demonstrates that HGF/SF induces dramatic morphological changes at the single cell level. (b) Relation between cells density and speed foruntreated (left) and treated (right) cells. The cells’ density is estimated at two spatial location ,248 mm (marked red), and .248 mm (marked green)from the wound edge. Based on the single cell’s area statistical analysis, speed was calculated in the same distance intervals from the velocitymagnitude map. Correlation significance between velocity and density was calculated with the non-parametric Spearman’s rank correlationcoefficient. This analysis demonstrates a significant correlation between density and velocity with no dependency on the spatial location. Thiscorrelation is less prominent for treated cells (p,0.003, compared to p,0.0001 for untreated cells) although still statistically significant.doi:10.1371/journal.pone.0044671.g006
Emergence of Complex Collective Motility Patterns
PLOS ONE | www.plosone.org 8 September 2012 | Volume 7 | Issue 9 | e44671
velocities, as was recently shown [8,12], independently of cells’
location, and is more prominent for untreated cells (Figure 6b).
Generalization: Prediction of Treatment Based on Motionand Texture Patterns
To generalize these findings, we tested whether cells in wound
healing assays can be automatically classified as HGF/SF-treated
or -untreated based solely on the DIC time-lapse images. To this
end, we defined a new measure to quantify the collective motility
patterns: each of the 11 time lapse experiments (6 untreated, 5
treated with HGF/SF) was represented by a vector containing
average speed for each healing phase as described in the Materials
and Methods section (Figure S2a). An SVM classifier was trained
and tested using "leave one out" validation (due to the small
number of experiments obtained), and a 100% accuracy rate was
achieved. Hence, an accurate prediction can be reached based on
the DIC time lapse velocity-estimation alone. It is not surprising,
since there is a clear visual separation between the motility
patterns for treated and untreated cells (Figure 7a). To examine
the motility patterns, these vectors were normalized to rule out
the general increase in velocity magnitude due to HGF/SF,
a perfect prediction was achieved when considering Phases 1 and 2
in the healing process (until full closure), implying that there is
a true-general change in the motility patterns and not only in its
magnitude. This means that given a time lapse experiment and
two time points that represent the partitioning to the three phases,
one can determine with high accuracy whether it was treated with
HGF/SF or not (p,0.0043, using the a-parametric test Wilcoxon
rank sum). Similar predictions were performed with multi-cellular
texture descriptor (as described in the Materials and Methods
section). It was shown (Figure 7b) that perfect classification is
achieved by considering cellular texture at Phase 2 (from first
contact to full healing, where most morphological changes occur),
applying an SVM classifier using "leave one out" validation
(p,0.0043, the same a-parametric test).
Effect of Met Inhibition on Velocity Magnitude PatternsTo investigate the molecular mechanism underlying collective
motility and to examine the robustness of our measures, we
examine the effect of Met-inhibition on the quantitative
measure described above. Velocity magnitude maps of cells
treated with the Met inhibitor and HGF/SF were extracted
(e.g., Figure 7c), and two SVM-classifiers was trained and tested
using "leave-one-out" validation to separate between (6 repeats
of) cells treated with the Met inhibitor + HGF/SF and (1)
untreated or (2) HGF/SF-treated cells. Since some of the
experiments treated with the Met inhibitor + HGF/SF did not
achieve full-closure (Phase 2 was not completed), only the first
two healing phases were considered (descriptor vector of length
12 per experiment). To exclude the global healing speed and to
focus on the spatio-temporal motility patterns, each experiment
descriptor was normalized to 1 (Figure 7d). Two-components
PCA analysis was unable to discriminate between the treatments
(Figure S2c). Perfect classification was achieved with each of the
two classifiers to conclude that the motility patterns of cells
treated with Met inhibitor and HGF/SF differ inherently than
untreated (p,0.0022 using Wilcoxon rank sum a-parametric
test) and HGF/SF-treated (p,0.0043 using the same test). As
Met-signaling becomes more prominent, cells located farther
than the wound take an active role in collective motility,
Figure 7d shows that when treated with Met inhibition + HGF/
SF the ratio between front cells’ and distant cells motility is
maximized, this ratio decreases for untreated cells and is
minimal when Met-signaling is induced by HGF/SF. Perfect
classification between all pairs of treatments was also demon-
strated using the texture-representation (Figure 7b). These
results indicate that the endogenously over expressed Met in
these cells [27] plays a role in collective cell motility thus
validating the involvement of the Met-signaling pathway with
induction of collective motility patterns as well as the
discriminative power of our proposed morpho-kinetic measure-
ments.
Discussion
Collective cell migration mechanisms are important for normal
and pathological biological processes. We propose a quantitative
hybrid measure that incorporates fully automated cellular
spatiotemporal motility and indirect morphological measures
together with semi-automated direct morphological measures to
describe the kinetics of collective cells migration. Applying this
analysis, we demonstrate that HGF/SF dramatically alters the
morpho-kinetic dynamics of the healing wound: from a simple
model in which the front cells lead the healing at constant speed;
to a more elaborate model in which cells lead a coordinated
increased motility along with spatiotemporal phenotypic EMT-
MET-like collective cell motility dynamics (Figure 8). Met-
inhibition experiments demonstrating inhibition of cell motility,
validated the important role of HGF/SF-induced Met activation
in breast cancer metastasis.
Traditionally, velocity fields are extracted by tracking individual
cells during a time-lapse experiment [35]. Practically, single cell
tracking in a monolayer requires considerable labor and can be
usually performed only for a small number of cells, providing
limited statistical coherency. Our method does not require single
cell tracking nor fluorescent-based imaging and is fully-automated.
The proposed collective cell migration morpho-kinetic analysis is
based on local motion estimation, an approach well suited for DIC
images, where inner cellular regions maintain high textural
information enabling accurate motion-estimation at the patch
level without further processing [8]. The main motivation behind
it is the ability to process all cells within the monolayer; the
dynamics of collective motility is complex, understanding the
individual cell in more detail does not necessarily explain the
collective kinetics of a monolayer of cells [36]. Another important
advantage is the ability to be performed in high-throughput
settings, such as suggested by Yarrow et al. [37].
Velocity magnitude maps are 2-dimensional continuous and
compact representation of the local motion estimation vector fields
during the entire time lapse wound healing experiment. Driscoll et
al. [38] recently presented a similar visualization for the
spatiotemporal evolution of a cell’s boundary curvature. This
concise and coherent visualization demonstrate the alteration of
collective motility patterns induced by HGF/SF; we hypothesize
that the treatment stimulates cells distant from the leading edge to
become self-propelled in an organized and coordinated manner.
A major qualitative and quantitative utilization of velocity
magnitude maps is the generalization of the change in collective
motility patterns as a consequence of adding HGF/SF to the
medium with or without Met inhibition. This phenomenon was
validated qualitatively, by visual inspection of the velocity
magnitude maps, and quantitatively by applying classification,
treating them as plain images and extracting appropriate image-
features. This measure allows perfect classification based solely on
the motility patterns; the relative-role that cells take in collective
migration as a function of their location. This means that given
a full time lapse wound healing experiment, and two time points
representing the three healing-phases, it is possible to predict with
Emergence of Complex Collective Motility Patterns
PLOS ONE | www.plosone.org 9 September 2012 | Volume 7 | Issue 9 | e44671

high accuracy the treatment applied to cells. This ability is
a substantial improvement over the standard measures, usually
only showing correlation between treatment and phenotype. Thus,
we address Tambe et al.’s call [12], "…our understanding of
collective cellular migration lacks predictive power and remains
largely descriptive".
It is demonstrated that marking a small number of cells within
a monolayer can be sufficient to reveal cellular morphology-
dynamics. This analysis was applied to demonstrate the high
Figure 7. Generalization: multi-cellular speed- and texture-based classification. (a) Velocity magnitude-based vector-representation ofa full time lapse sequence. Each column represents a single experiment. The vector values were calculated as the average velocity magnitude of allcells at a given distance-interval from the wound, at a given phase. The analysis demonstrates that the first six experiments (untreated) are verydifferent from the last five (HGF/SF-treated). (b) Texture-based vector-representation of a full time lapse sequence. The LBP image-texture descriptornormalized histogram is averaged over all time frames from Phase 2, when most morphological changes occur. Each column is the LBP histogramextracted from a single experiment. It was demonstrated that there exists a clear discrimination between any pair of the three conditions: untreated,HGF/SF, and Met inhibition+ HGF/SF. (c) Example of a velocity magnitude map of cells treated with Met inhibition and HGF/SF. (d) Collective motilitypatterns of full time lapse experiments. Each column represents the normalized spatio-temporal velocity magnitude of a single experiment. It wasdemonstrated that there exists a clear discrimination in collective motility patterns between any pair of the three conditions: untreated, HGF/SF, andMet inhibition + HGF/SF, as Met-signaling becomes more active, the ratio between motility of distant cells and close cells decreases which impliesthat cells located farther from the wound become more active by Met-signaling activation.doi:10.1371/journal.pone.0044671.g007
Emergence of Complex Collective Motility Patterns
PLOS ONE | www.plosone.org 10 September 2012 | Volume 7 | Issue 9 | e44671

correlation between cells’ morphology and motility: large and
elongated cells are characterized by faster motility regardless of
their spatial location or phase in the healing process. The dramatic
coordinated morphological changes in HGF/SF-treated cells’ are
another indication for being self-propelled. We hypothesize that
the lower (although still significant) morphology-motility correla-
tion of treated cells is explained by their self-propelled nature,
causing lower dependence on their surroundings.
It was demonstrated here that texture of a single image from
time lapse sequence, captured by the LBP descriptor, is sufficient
to predict the treatment. The image-texture of a monolayer of cells
can thus be used to implicitly measure cells morphological
characteristics, as in measuring cell scattering [34]. We hypoth-
esize that when considering large numbers of cells in a monolayer,
relations between neighboring pixels’ intensities represent in-
directly morphological characteristics of these cells. Indeed, the
average texture descriptor of image frames from Phase 2
discriminate between cells untreated, HGF/SF-treated and treated
with MET inhibitor and HGF/SF together, concordant with the
data indicating that the morphological changes mostly occur
during this phase. Thus, using image-texture as an indirect multi-
cellular morphology descriptor can be exploited as a treatment-
predictor. Further investigation should try to find a direct
connection between cells’ morphology and texture.
The combination of image texture and cellular velocity
magnitude descriptors may serve as fully automated quantitative
measures to represent morpho-kinetic dynamics, to enable in
principle high throughput analyses without human intervention.
It is noteworthy that the in vitro model of tumor cells moving
collectively studied herein does not take into account important
parameters that maintain a crucial role in biological processes that
include collective motility such as 3D motility and the tissue’s
microenvironment (e.g., extracellular matrix resistance
[39,40,41]). These parameters have prominent effects on collective
cell migration in embryogenesis [1], tumor invasion [1,42], and
tubulogenesis [39,40,43]. However, important benefits in using in
vitro models to study cellular and molecular mechanisms are
controlling starting-point definition and ability to perform high-
throughput screening and analysis [1].
The uneven velocity of DA3 cells in collective migration toward
the wound in vitro is not associated with formation of finger-like
structures [44] as in collective migration of MDCK cells [5]. The
displacement gap formed between front and distant cells during
untreated DA3 experiments, visualized by the fan-like dynamics
(Figure 4a), contradicts the fact that the monolayer is kept
continuous with no visible gaps throughout the healing process.
Morphology transitions alone cannot account for this phenome-
non, since cells’ growth is insignificant in the gap formed by
accumulating displacements between cells located closer and
farther from the leading edge. On the other hand, the gap formed
under HGF/SF treatment can be explained solely by morphology
transitions; it is formed when cells near the wound’s edge become
larger than distant cells. During the next phase, distant cells exceed
the size of cells located closer to the leading edge and fill the gaps.
We hypothesize that accelerated proliferation at the leading edge
is the answer for the untreated cells’ ‘‘gap mystery’’, as shown in
Figure 8. Model for HGF/SF-induced collective motility pat-terns during the healing process. HGF/SF dramatically alters themorpho-dynamics of the healing wound: from a simple model, in whichthe front cells lead the healing in constant acceleration, to a moreelaborate model in which cells in different distances from the woundlead a coordinated increased motility along with spatio-temporalphenotypic EMT-MET based collective cell motility dynamics. UntreatedDA3 front layers cells are larger, more elliptical and move faster (markedby wider arrows) than cells located behind demonstrating a homoge-neous motility pattern during the wound healing process (Phases 1 and2). During post wound closure (Phase 3), all cells decelerate, shrink andround up regardless of their position. HGF/SF treatment leads to theemergence of dramatic different cell motility patterns: at the beginning,front cells are larger, more elliptical and move faster than distant cells.Throughout Phase 1, distant cells become larger, more elliptical andgradually join the rapid motion by accelerating layer by layer. Thesemorphology changes and gradual acceleration continues during Phase2, were distant cells maintain a higher velocity toward the wound than
cells located closer to the wound edge. Finally, post wound closure(Phase 3), front cells shrink, round up and halt, while distant cellsgradually decelerate, and change morphology in a similar manner. It ishypothesized that accelerated proliferation at the leading edge is theanswer for the untreated cells gap mystery presented in the text. It ishypothesized that in treated cells proliferation occurs more intensively,but is spread approximately equally throughout the monolayer.doi:10.1371/journal.pone.0044671.g008
Emergence of Complex Collective Motility Patterns
PLOS ONE | www.plosone.org 11 September 2012 | Volume 7 | Issue 9 | e44671
Poujade et al. [5]. Since HGF/SF induces accelerated proliferation
[45], we believe that it is spread approximately equally throughout
the monolayer under treatment. This hypothesis, complementing
the motility pattern description is also illustrated in Figure 8.
EMT is a process that changes proliferating cells from an
aplanetic state to a motile state [46,47], which allows cancer cells
to leave the primary tumor and metastasize. The dramatic
changes in cell morphology and behavior here is reminiscent of the
EMT. It is thus likely that HGF/SF treatment leads to a more
pronounced and accelerated morphological EMT, followed by an
accelerated phenotypic MET post wound closure, which validates
similar results regarding Met-induced EMT [48].
Analyses of Met-inhibited experiments indicate that endoge-
nously-activated over-expressed Met plays an important role in
collective cell motility and further validates involvement of Met-
signaling pathway in this process. These results are coherent with
recent findings by Loerke et al [49], connecting cell speed to cell-
cell adhesion upon HGF/SF-induced Met-signaling.
Matsubayashi et al. have demonstrated that a "wave" of
increasing velocities propagates back from the leading edge during
monolayer wound healing of mIMCD3 mouse kidney epithelial
cells [50]. Recently, Serra-Picamal et al. demonstrated a similar
phenomenon for MDCK cells, also showing that stress forces
gradually propagate from the leading edge backwards. They
suggested that progressive cell mobilization away from the leading
edge is a general response of cell collective motility [51]. We argue
that this "wave" is induced by specific signal transduction; it is
induced by HGF/SF, and reduced by Met-inhibition in breast
cancer cells.
Collective motility should thus not be explained from
a mechanical perspective alone; increased efforts should be
invested in understanding the effects of various chemical signaling,
which constitute a significant role in collective cell motility as
demonstrated herein and in other studies (e.g., [9,35]). Revealing
the effect of Met-signaling on collective morpho-kinetic patterns is
crucial to understand the molecular and cellular mechanisms
behind metastasis. The ability to predict that a group of cells
maintain a dynamical metastatic signature can have therapeutic
implications in the long run; this may turn to be a first step in that
exciting avenue.
Supporting Information
Figure S1 Multi-cellular texture-based classification.Local Binary Patterns (LBP) applied as an image texture
descriptor. For every pixel in the image, a code is generated
based on the intensities of neighboring pixels with relation to it.
There are ten possible codes, and their histogram over all cellular
pixels is used to describe the image’s texture which is used as an
indirect descriptor of cells morphology.
(TIF)
Figure S2 Compact representations of a wound healingexperiment. (a) Velocity-magnitude based vector representation
of a wound healing experiment. Distances from the wound were
partitioned to 6 intervals. The average motility of all cells in any
given interval during each healing phase was recorded to define
a length 18 vector representation. These values are calculated by
taking the average intensities of the corresponding rectangular
regions in the velocity magnitude map. (b) Texture-based vector
representation of a wound healing experiment as an implicit
measure for cells’ morphology. LBP normalized histogram is
extracted for every image in the time-lapse sequence. All
histograms of frames in Phase 2, where most morphological-
changes occur, are averaged to define the combined texture
descriptor. (c) First two components of the principal component
analysis (PCA) performed on the normalized velocity-magnitude
based vector representation was not sufficient.
(TIF)
Figure S3 Single cell morphology (area) as function oftime and distance from the wound. (a) ‘‘Average’’ cell’s area
at different distances over time. Same data as presented in Figure 4,
shown with different visualization. It can be seen that most
morphological alterations occurs for HGF/SF-treated cells far
from the wound at the later stages of healing. (b) Estimated density
as function of time for close (,248 mm, red markers) and far
(.248 mm, green markers) cells. Throughout the healing process,
untreated cells that are close to the wound’s edges are consistently
spread sparsely compared to distance cells. During Phase 1 treated
cells maintain similar location-dependent characteristics to those
described for untreated cells. In Phase 2, treated cells "switch" -
distant cells become sparsely distributed compared to front cells.
(TIF)
Figure S4 Single cell morphology (eccentricity) asfunction of time and distance from the wound. Eccentric-
ity is the ratio of the distance between the foci of an ellipse and its
major axis length. In our setting it is referred to the ellipse that has
the same second-moments as the segmented cell. The values range
between 0 and 1. (0 and 1 are degenerate cases; an ellipse whose
eccentricity is 0 is actually a circle, while an ellipse whose
eccentricity is 1 is a line segment.). (a) Same as Figure 6 a–b only
for eccentricity instead of area: ‘‘Average’’ cell’s eccentricity at
different distances over time. Untreated (left), and HGF/SF-
treated cells (right). The x-coordinates represent discrete distance-
intervals from the wound edge, the y-coordinates are the average
cells’ eccentricity at a given distance interval and at a given phase
in the healing process. Color markers represent the phase in the
healing process. (b) Same as in Figure S3a only for eccentricity:
‘‘Average’’ cell’s eccentricity at different distances over time
(different visualization).
(TIF)
Methods S1 In this document we provide a detaileddescription of the following methods: (1) velocitymagnitude map, (2) fully-automated single cell trajecto-ry-estimation from DIC-based motion vector fields, (3)semi-automated single cell tracking, (4) velocity magni-tude map based on semi-automated single cell tracking,and (5) single-cell morphology measures.
(DOCX)
Acknowledgments
The authors would like to thank Arieh Zaritsky for proofreading the
manuscript and for his helpful remarks and Nathan Manor for valuable
discussions.
This work was performed in partial fulfillment of the requirements for
the PhD degree of Assaf Zaritsky, Blavatnik School of Computer Science,
and Sari Natan Sackler Faculty of Medicine, Tel Aviv University.
Author Contributions
Conceived and designed the experiments: SN IT AZ. Performed the
experiments: SN. Analyzed the data: AZ. Wrote the paper: AZ EBJ IT.
Emergence of Complex Collective Motility Patterns
PLOS ONE | www.plosone.org 12 September 2012 | Volume 7 | Issue 9 | e44671

References
1. Friedl P, Gilmour D (2009) Collective cell migration in morphogenesis,
regeneration and cancer. Nat Rev Mol Cell Biol 10: 445–457.2. Lecaudey V, Gilmour D (2006) Organizing moving groups during morphogen-
esis. Curr Opin Cell Biol 18: 102–107.3. Trepat X, Fredberg JJ (2011) Plithotaxis and emergent dynamics in collective
cellular migration. Trends Cell Biol.
4. Gov NS (2007) Collective cell migration patterns: follow the leader. Proc NatlAcad Sci U S A 104: 15970–15971.
5. Poujade M, Grasland-Mongrain E, Hertzog A, Jouanneau J, Chavrier P, et al.(2007) Collective migration of an epithelial monolayer in response to a model
wound. Proc Natl Acad Sci U S A 104: 15988–15993.
6. Omelchenko T, Vasiliev JM, Gelfand IM, Feder HH, Bonder EM (2003) Rho-dependent formation of epithelial "leader" cells during wound healing. Proc Natl
Acad Sci U S A 100: 10788–10793.7. Reffay M, Petitjean L, Coscoy S, Grasland-Mongrain E, Amblard F, et al. (2011)
Orientation and polarity in collectively migrating cell structures: statics anddynamics. Biophys J 100: 2566–2575.
8. Petitjean L, Reffay M, Grasland-Mongrain E, Poujade M, Ladoux B, et al.
(2010) Velocity fields in a collectively migrating epithelium. Biophys J 98: 1790–1800.
9. Inaki M, Vishnu S, Cliffe A, Rorth P (2012) Effective guidance of collectivemigration based on differences in cell states. Proc Natl Acad Sci U S A 109:
2027–2032.
10. Farooqui R, Fenteany G (2005) Multiple rows of cells behind an epithelialwound edge extend cryptic lamellipodia to collectively drive cell-sheet
movement. J Cell Sci 118: 51–63.11. Trepat X, Wasserman MR, Angelini TE, Millet E, Weitz DA, et al. (2009)
Physical forces during collective cell migration. Nature Physics 5: 426–430.12. Fredberg JJ, Tambe DT, Hardin CC, Angelini TE, Rajendran K, et al. (2011)
Collective cell guidance by cooperative intercellular forces. Nature Materials 10:
469–475.13. Gov NS (2009) Traction forces during collective cell motion. HFSP J 3: 223–
227.14. Chiou KK, Hufnagel L, Shraiman BI (2012) Mechanical stress inference for two
dimensional cell arrays. PLoS Comput Biol 8: e1002512.
15. Lee P, Wolgemuth CW (2011) Crawling Cells Can Close Wounds without PurseStrings or Signaling. Plos Computational Biology 7.
16. McGrath JL, Bindschadler M (2007) Sheet migration by wounded monolayers asan emergent property of single-cell dynamics. Journal of Cell Science 120: 876–
884.17. Pourquie O, Benazeraf B, Francois P, Baker RE, Denans N, et al. (2010) A
random cell motility gradient downstream of FGF controls elongation of an
amniote embryo. Nature 466: 248–252.18. Weaver VM, Butcher DT, Alliston T (2009) A tense situation: forcing tumour
progression. Nature Reviews Cancer 9: 108–122.19. Puliafito A, Hufnagel L, Neveu P, Streichan S, Sigal A, et al. (2012) Collective
and single cell behavior in epithelial contact inhibition. Proc Natl Acad Sci U S A
109: 739–744.20. Mccormack SA, Viar MJ, Johnson LR (1992) Migration of Iec-6 Cells - a Model
for Mucosal Healing. American Journal of Physiology 263: G426–G435.21. Liang CC, Park AY, Guan JL (2007) In vitro scratch assay: a convenient and
inexpensive method for analysis of cell migration in vitro. Nat Protoc 2: 329–333.
22. Kalluri R, Weinberg RA (2009) The basics of epithelial-mesenchymal transition.
Journal of Clinical Investigation 119: 1420–1428.23. Cano A, Peinado H, Olmeda D (2007) Snail, ZEB and bHLH factors in tumour
progression: an alliance against the epithelial phenotype? Nature ReviewsCancer 7: 415–428.
24. Yao D, Dai C, Peng S (2011) Mechanism of mesenchymal-epithelial transition
and the relationship with metastatic tumor formation. Mol Cancer Res.25. Fidler IJ (2003) The pathogenesis of cancer metastasis: the ’seed and soil’
hypothesis revisited. Nat Rev Cancer 3: 453–458.26. Friedl P, Noble PB, Walton PA, Laird DW, Chauvin PJ, et al. (1995) Migration
of Coordinated Cell Clusters in Mesenchymal and Epithelial Cancer Explants
in-Vitro. Cancer Research 55: 4557–4560.
27. Firon M, Shaharabany M, Altstock RT, Horev J, Abramovici A, et al. (2000)
Dominant negative Met reduces tumorigenicity-metastasis and increases tubuleformation in mammary cells. Oncogene 19: 2386–2397.
28. Benvenuti S, Comoglio PM (2007) The MET receptor tyrosine kinase in
invasion and metastasis. J Cell Physiol 213: 316–325.
29. Gherardi E, Birchmeier W, Birchmeier C, Vande Woude G (2012) Targeting
MET in cancer: rationale and progress. Nat Rev Cancer 12: 89–103.
30. Jung KH, Park BH, Hong SS (2012) Progress in cancer therapy targeting c-Met
signaling pathway. Arch Pharm Res 35: 595–604.
31. Fu YX, Watson G, Jimenez JJ, Wang Y, Lopez DM (1990) Expansion of
Immunoregulatory Macrophages by Granulocyte-Macrophage Colony-Stimu-lating Factor Derived from a Murine Mammary-Tumor. Cancer Research 50:
227–234.
32. Crosswell HE, Dasgupta A, Alvarado CS, Watt T, Christensen JG, et al. (2009)
PHA665752, a small-molecule inhibitor of c-Met, inhibits hepatocyte growthfactor-stimulated migration and proliferation of c-Met-positive neuroblastoma
cells. BMC Cancer 9: 411.
33. Ojala T, Pietikainen M, Maenpaa T (2002) Multiresolution gray-scale and
rotation invariant texture classification with local binary patterns. IeeeTransactions on Pattern Analysis and Machine Intelligence 24: 971–987.
34. Zaritsky A, Natan S, Horev J, Hecht I, Wolf L, et al. (2011) Cell motilitydynamics: a novel segmentation algorithm to quantify multi-cellular bright field
microscopy images. PLoS One 6: e27593.
35. Vitorino P, Meyer T (2008) Modular control of endothelial sheet migration.
Genes & Development 22: 3268–3281.
36. Deisboeck TS, Couzin ID (2009) Collective behavior in cancer cell populations.
Bioessays 31: 190–197.
37. Yarrow JC, Perlman ZE, Westwood NJ, Mitchison TJ (2004) A high-throughput
cell migration assay using scratch wound healing, a comparison of image-basedreadout methods. BMC Biotechnol 4: 21.
38. Driscoll MK, Albanese JL, Xiong ZM, Mailman M, Losert W, et al. (2012)Automated image analysis of nuclear shape: What can we learn from
a prematurely aged cell? Aging (Albany NY) 4: 119–132.
39. Liotta LA, Kohn EC (2001) The microenvironment of the tumour-host
interface. Nature 411: 375–379.
40. Friedl P, Alexander S (2011) Cancer invasion and the microenvironment:plasticity and reciprocity. Cell 147: 992–1009.
41. Pathak A, Kumar S (2012) Independent regulation of tumor cell migration bymatrix stiffness and confinement. Proc Natl Acad Sci U S A 109: 10334–10339.
42. Sahai E (2005) Mechanisms of cancer cell invasion. Curr Opin Genet Dev 15:87–96.
43. Tsarfaty I, Ben-Jacob E (2012) Secrets of tubule engineering by epithelial cells.Proc Natl Acad Sci U S A 109: 6790–6791.
44. Mark S, Shlomovitz R, Gov NS, Poujade M, Grasland-Mongrain E, et al. (2010)Physical model of the dynamic instability in an expanding cell culture. Biophys J
98: 361–370.
45. Birchmeier C, Birchmeier W, Gherardi E, Vande Woude GF (2003) Met,
metastasis, motility and more. Nat Rev Mol Cell Biol 4: 915–925.
46. Williams ED, Hugo H, Ackland ML, Blick T, Lawrence MG, et al. (2007)Epithelial-mesenchymal and mesenchymal - Epithelial transitions in carcinoma
progression. Journal of Cellular Physiology 213: 374–383.
47. Thiery JP, Acloque H, Huang RYJ, Nieto MA (2009) Epithelial-Mesenchymal
Transitions in Development and Disease. Cell 139: 871–890.
48. Thiery JP (2002) Epithelial-mesenchymal transitions in tumour progression.
Nature Reviews Cancer 2: 442–454.
49. Loerke D, le Duc Q, Blonk I, Kerstens A, Spanjaard E, et al. (2012) Quantitative
imaging of epithelial cell scattering identifies specific inhibitors of cell motilityand cell-cell dissociation. Sci Signal 5: rs5.
50. Matsubayashi Y, Razzell W, Martin P (2011) ’White wave’ analysis of epithelialscratch wound healing reveals how cells mobilise back from the leading edge in
a myosin-II-dependent fashion. J Cell Sci 124: 1017–1021.
51. Serra-Picamal X, Conte V, Vincent R, Anon E, Tambe DT, et al. (2012)
Mechanical waves during tissue expansion. Nat Phys advance onlinepublication.
Emergence of Complex Collective Motility Patterns
PLOS ONE | www.plosone.org 13 September 2012 | Volume 7 | Issue 9 | e44671