Global Ameneity Migration (with case study: Similkameen Valley, Canada)
37
See discussions, stats, and author profiles for this publication at: http://www.researchgate.net/publication/281454363 Global Amenity Migration (with case study & sustainability strategy for the Similkameen Valley, BC, Canada) RESEARCH · SEPTEMBER 2015 DOI: 10.13140/RG.2.1.3519.9208 READS 8 1 AUTHOR: Laurence Allister Gordon Moss International Amenity Migration Centre & Glorioso Mos… 11 PUBLICATIONS 23 CITATIONS SEE PROFILE Available from: Laurence Allister Gordon Moss Retrieved on: 02 October 2015
-
Upload
independent -
Category
Documents
-
view
7 -
download
0
Transcript of Global Ameneity Migration (with case study: Similkameen Valley, Canada)
Seediscussions,stats,andauthorprofilesforthispublicationat:http://www.researchgate.net/publication/281454363
GlobalAmenityMigration(withcasestudy&sustainabilitystrategyfortheSimilkameenValley,BC,Canada)
RESEARCH·SEPTEMBER2015
DOI:10.13140/RG.2.1.3519.9208
READS
8
1AUTHOR:
LaurenceAllisterGordonMoss
InternationalAmenityMigrationCentre&GloriosoMos…
11PUBLICATIONS23CITATIONS
SEEPROFILE
Availablefrom:LaurenceAllisterGordonMoss
Retrievedon:02October2015
Global Amenity Migration©
(with case study and sustainability strategy for Similkameen Valley, BC, Canada)
Romella S. Glorioso, PhD & Laurence A.G. Moss, PhD
International Amenity Migration Centre
www.amenitymigration.org
Glorioso, Moss & Associates
www.gloriosomoss.com
Prepared for Winter 2014-2015
block course & lectures
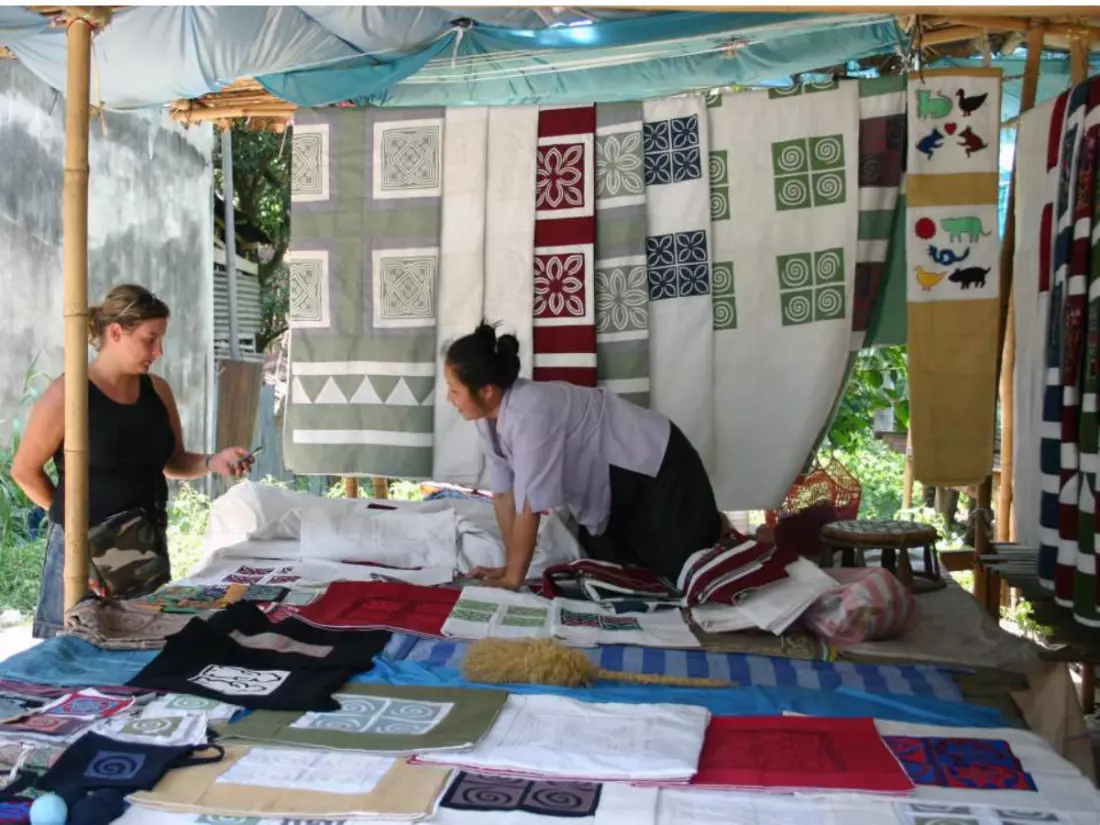
Amenity Migration
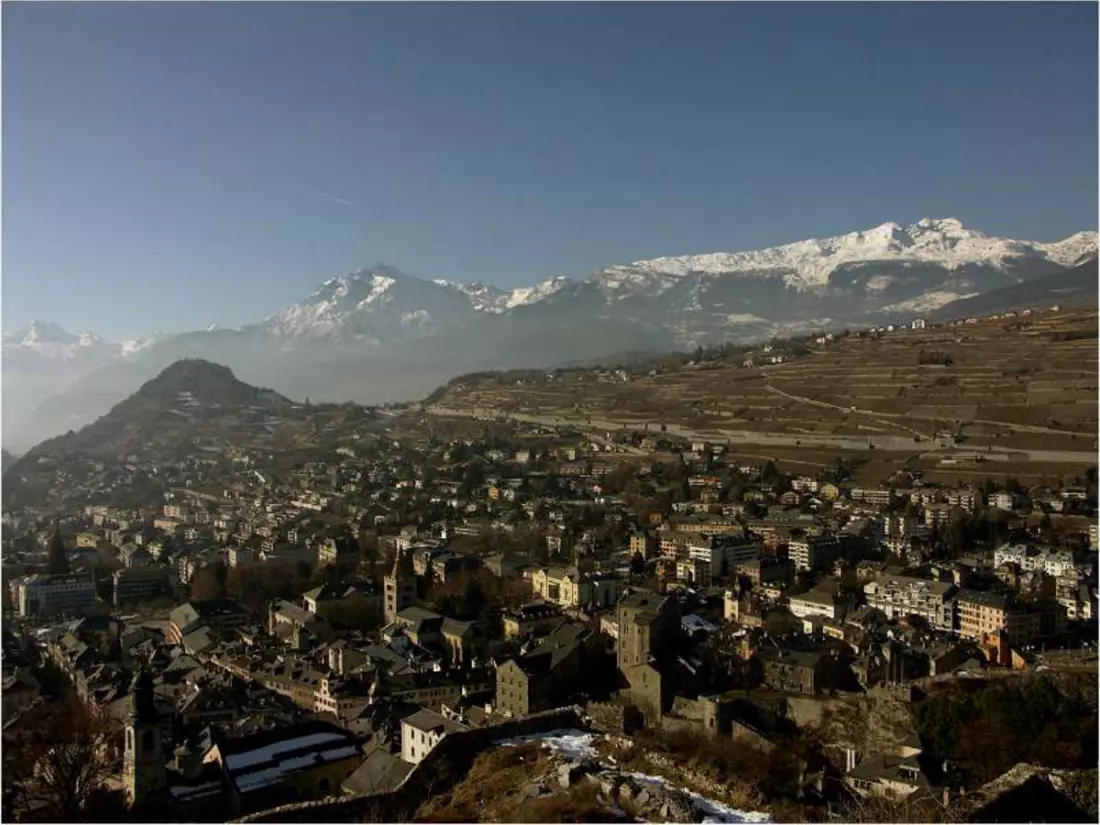
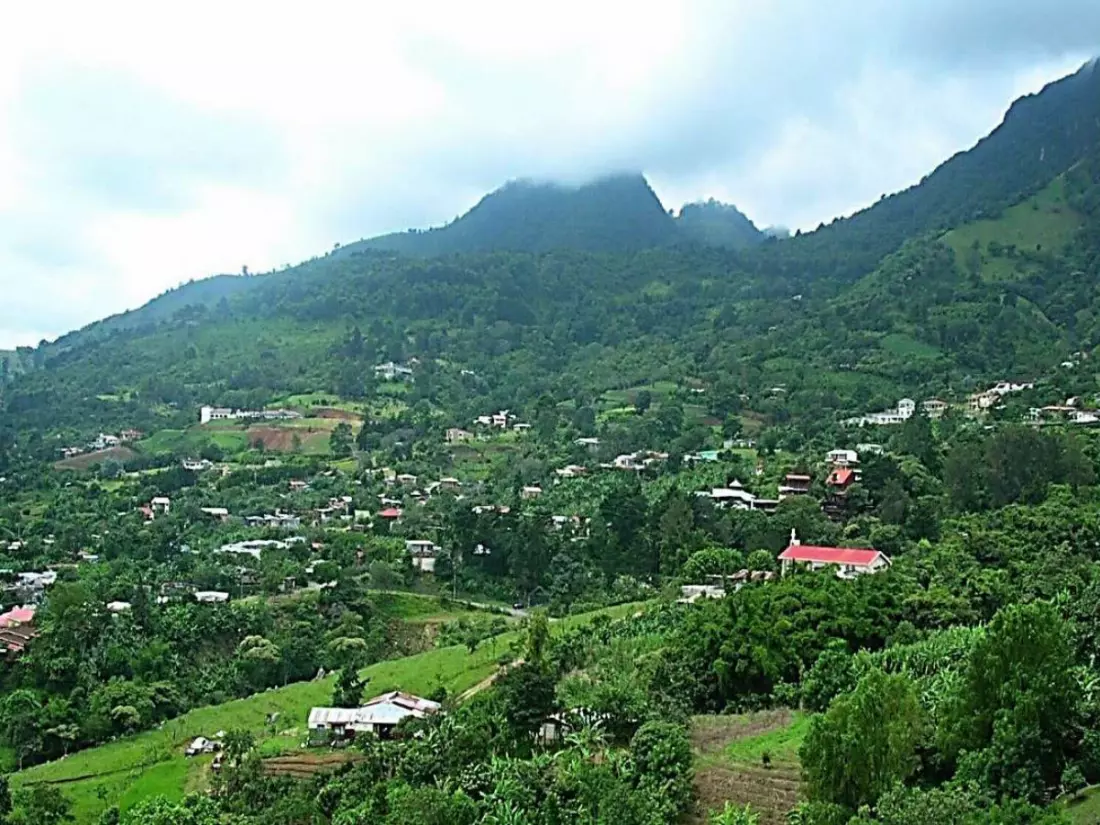
people moving to places perceived as having a higher quality of natural environment and/or more distinctive culture to improve their quality of life
• multidimensional & complex phenomenon • both opportunity & threat to sustaining ecologies & their human communities
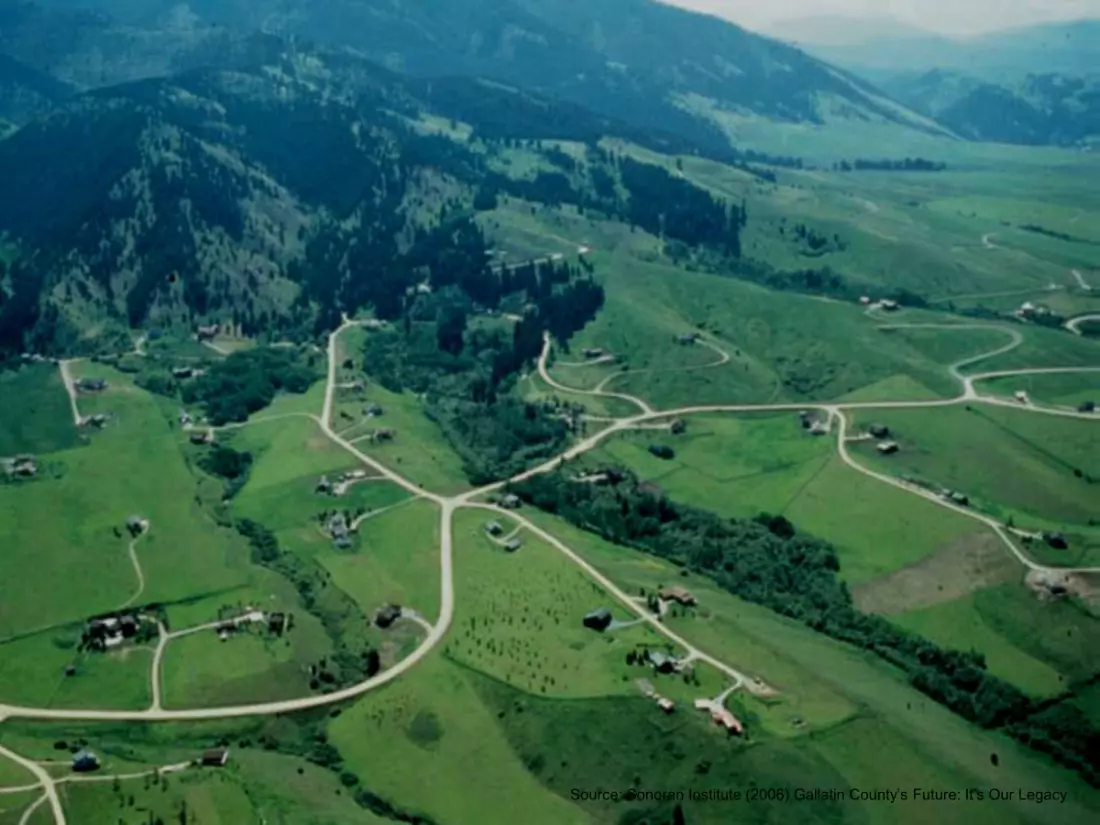
Source: Sonoran Institute (2006) Gallatin County’s Future: It’s Our Legacy
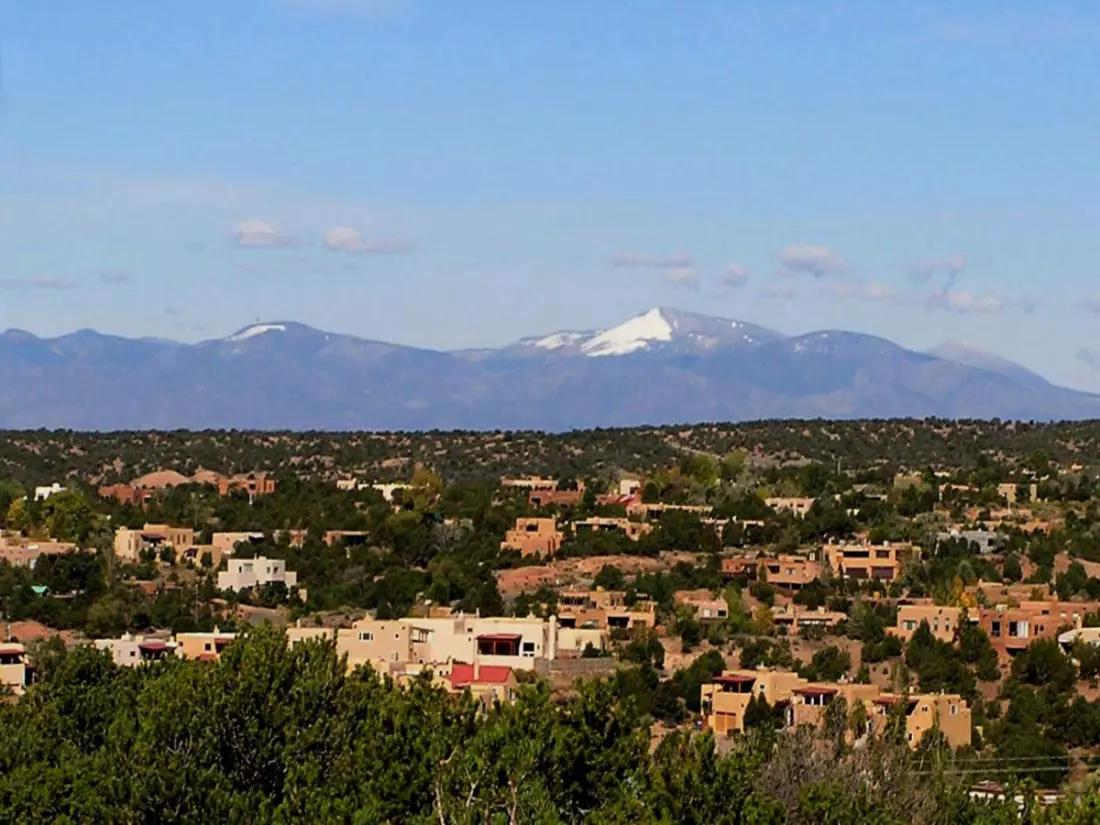
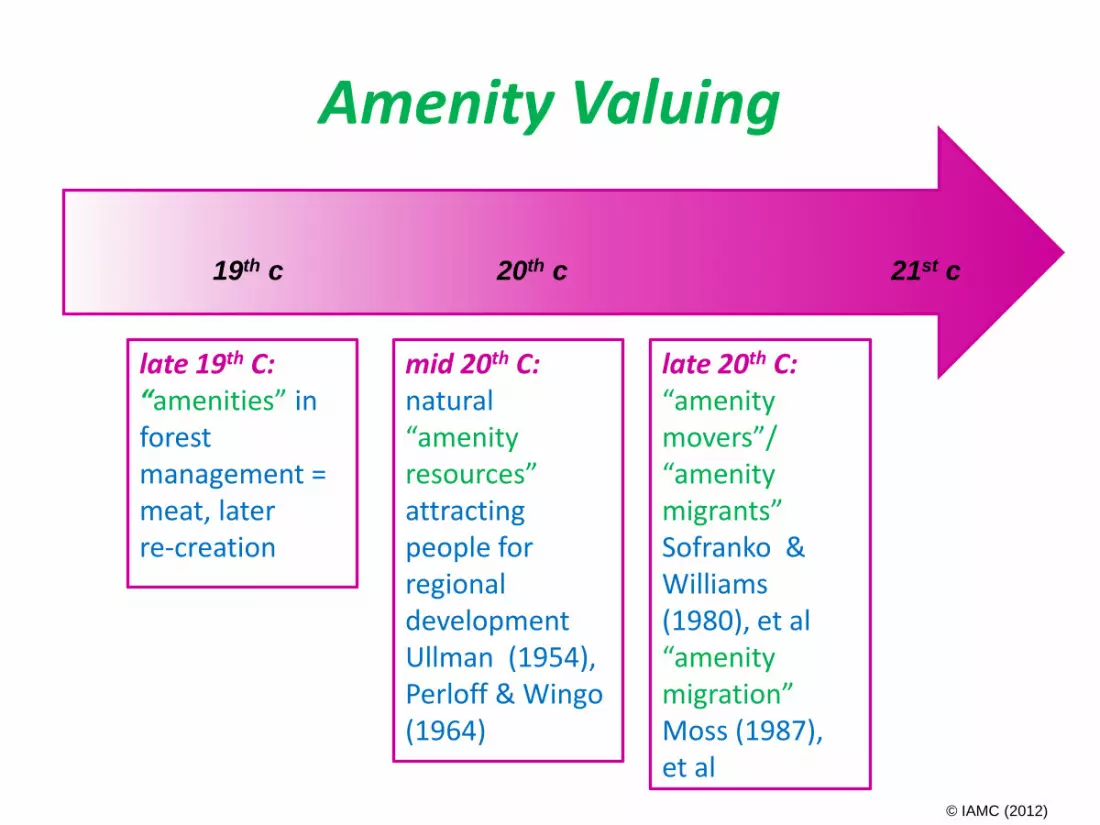
Amenity Valuing
© IAMC (2012)
19th c 20th c 21st c
late 19th C: “amenities” in forest management = meat, later re-creation
mid 20th C: natural “amenity resources” attracting people for regional development Ullman (1954), Perloff & Wingo (1964)
late 20th C: “amenity movers”/ “amenity migrants” Sofranko & Williams (1980), et al “amenity migration” Moss (1987), et al
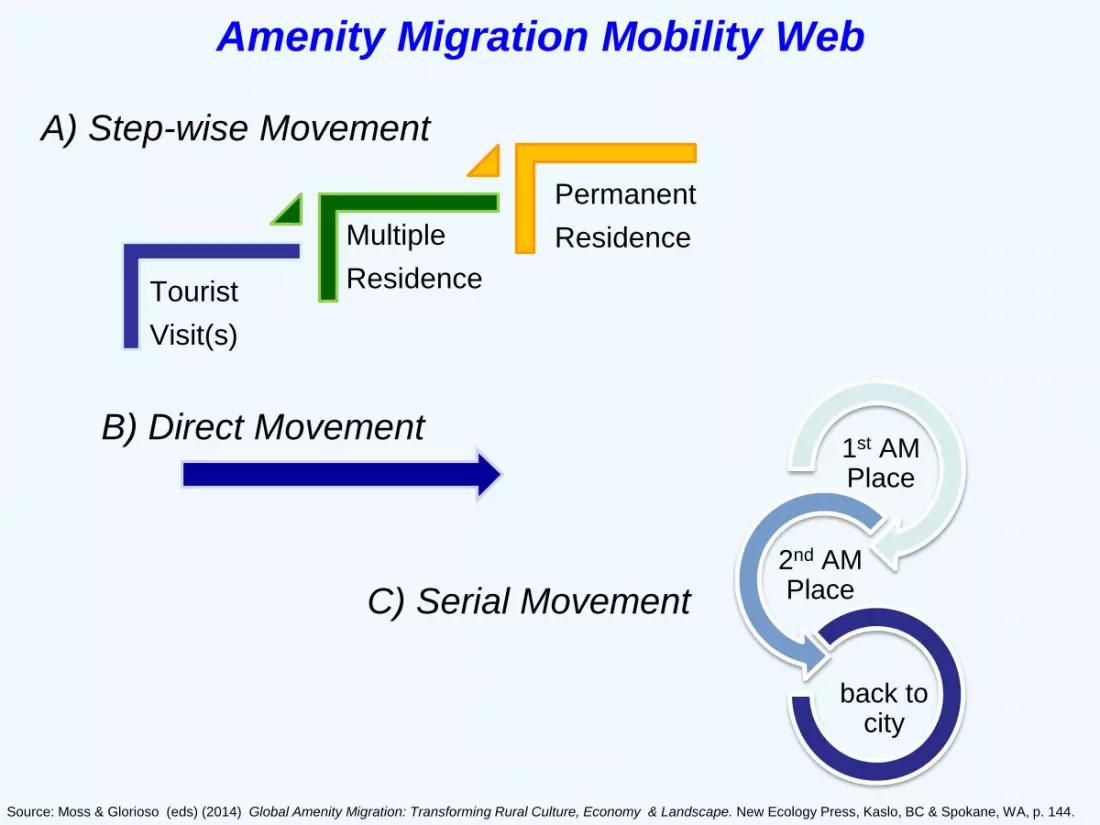
Amenity Migration Mobility Web
A) Step-wise Movement
C) Serial Movement
1st AM Place
2nd AM Place
back to city
Tourist
Visit(s)
Multiple
Residence
Permanent
Residence
B) Direct Movement
Source: Moss & Glorioso (eds) (2014) Global Amenity Migration: Transforming Rural Culture, Economy & Landscape. New Ecology Press, Kaslo, BC & Spokane, WA, p. 144.
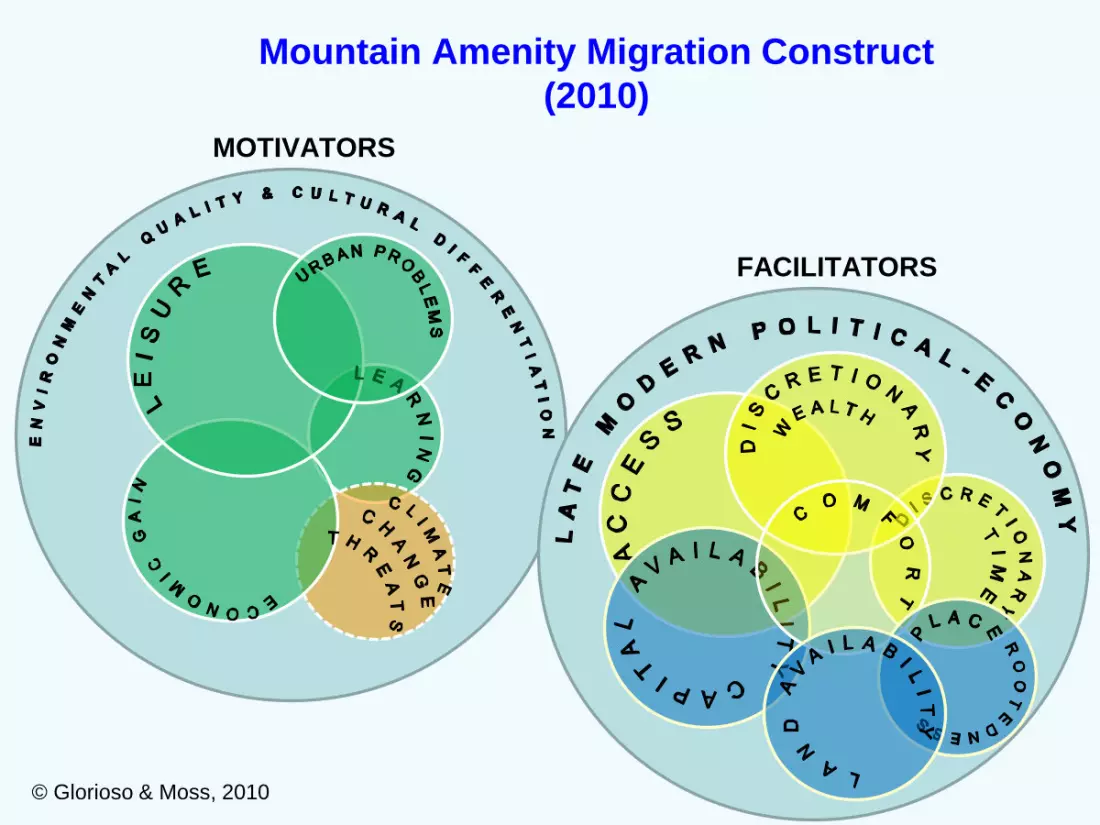
Mountain Amenity Migration Construct
(2010)
MOTIVATORS
FACILITATORS
© Glorioso & Moss, 2010
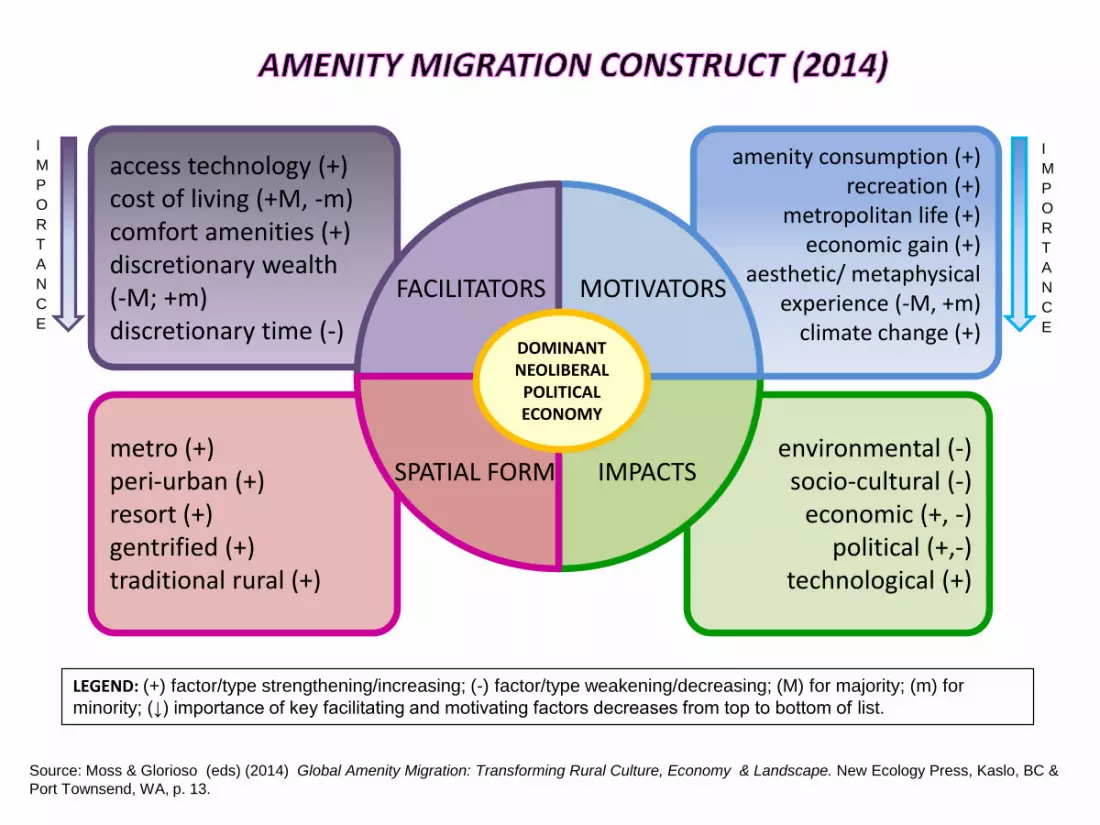
LEGEND: (+) factor/type strengthening/increasing; (-) factor/type weakening/decreasing; (M) for majority; (m) for
minority; (↓) importance of key facilitating and motivating factors decreases from top to bottom of list.
Source: Moss & Glorioso (eds) (2014) Global Amenity Migration: Transforming Rural Culture, Economy & Landscape. New Ecology Press, Kaslo, BC &
Port Townsend, WA, p. 13.
access technology (+) cost of living (+M, -m) comfort amenities (+) discretionary wealth (-M; +m) discretionary time (-)
metro (+) peri-urban (+) resort (+) gentrified (+) traditional rural (+)
amenity consumption (+) recreation (+)
metropolitan life (+) economic gain (+)
aesthetic/ metaphysical experience (-M, +m)
climate change (+)
environmental (-) socio-cultural (-)
economic (+, -) political (+,-)
technological (+)
MOTIVATORS FACILITATORS
SPATIAL FORM IMPACTS
DOMINANT NEOLIBERAL
POLITICAL ECONOMY
I
M
P
O
R
T
A
N
C
E
I
M
P
O
R
T
A
N
C
E
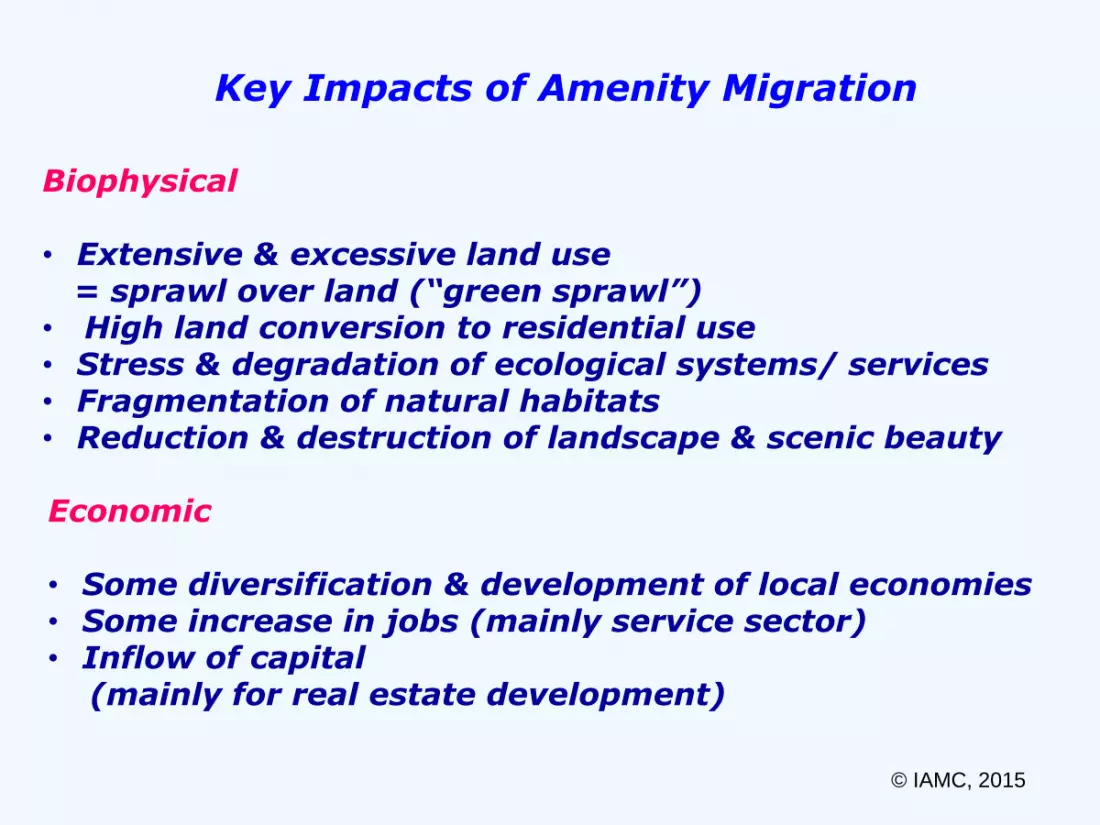
Key Impacts of Amenity Migration
Biophysical • Extensive & excessive land use = sprawl over land (“green sprawl”) • High land conversion to residential use • Stress & degradation of ecological systems/ services • Fragmentation of natural habitats • Reduction & destruction of landscape & scenic beauty
Economic • Some diversification & development of local economies • Some increase in jobs (mainly service sector) • Inflow of capital (mainly for real estate development)
© IAMC, 2015
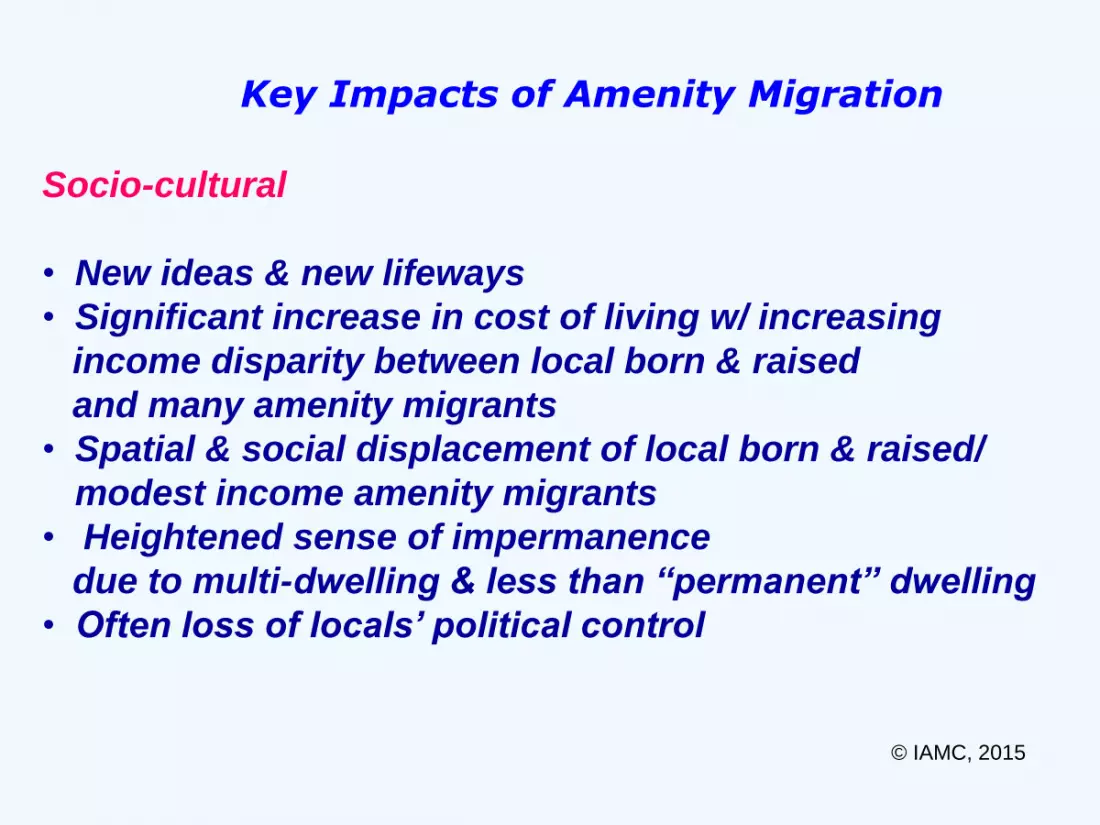
Key Impacts of Amenity Migration
Socio-cultural
• New ideas & new lifeways
• Significant increase in cost of living w/ increasing
income disparity between local born & raised
and many amenity migrants
• Spatial & social displacement of local born & raised/
modest income amenity migrants
• Heightened sense of impermanence
due to multi-dwelling & less than “permanent” dwelling
• Often loss of locals’ political control
© IAMC, 2015
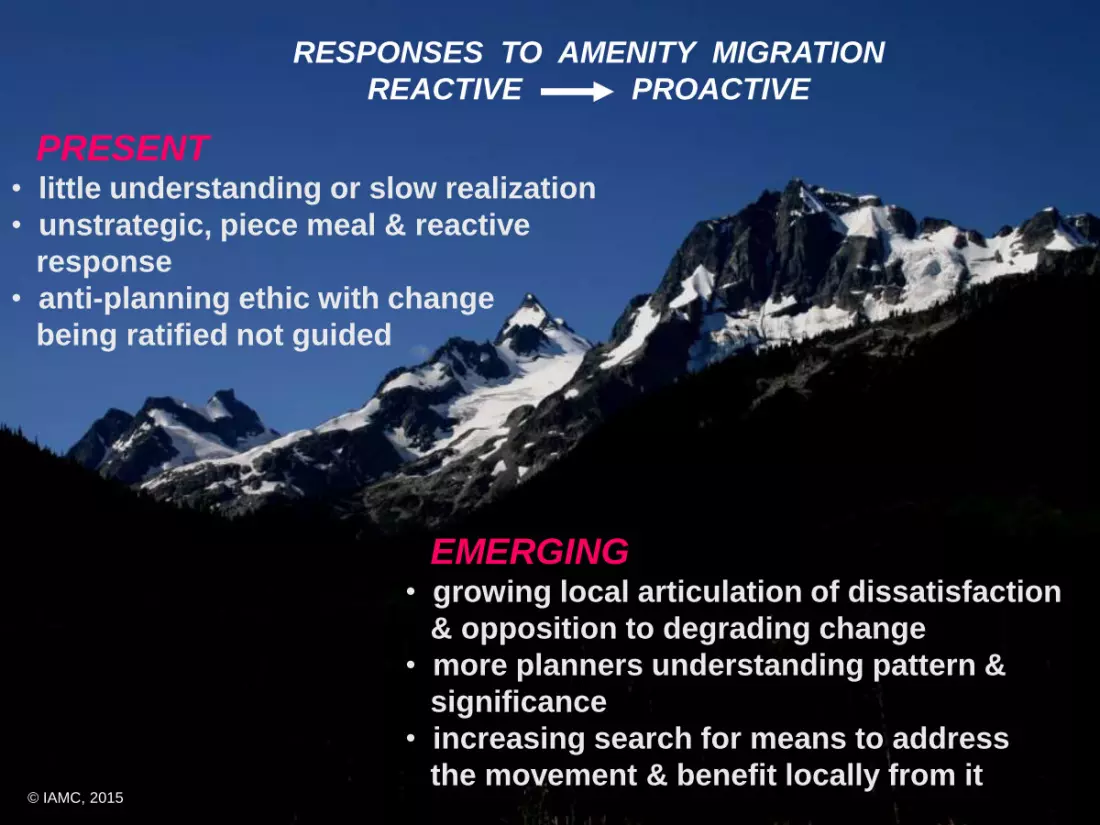
RESPONSES TO AMENITY MIGRATION
REACTIVE PROACTIVE
PRESENT • little understanding or slow realization
• unstrategic, piece meal & reactive
response
• anti-planning ethic with change
being ratified not guided
EMERGING • growing local articulation of dissatisfaction
& opposition to degrading change
• more planners understanding pattern &
significance
• increasing search for means to address
the movement & benefit locally from it © IAMC, 2015
• increase systemic knowledge about amenity migration and its effects
• greater attention to managing amenity migration for both sustainability & pleasure of the greater community
• considerably more strategic, innovative & radical thinking and management methods
Key Recommendations
© IAMC, 2015
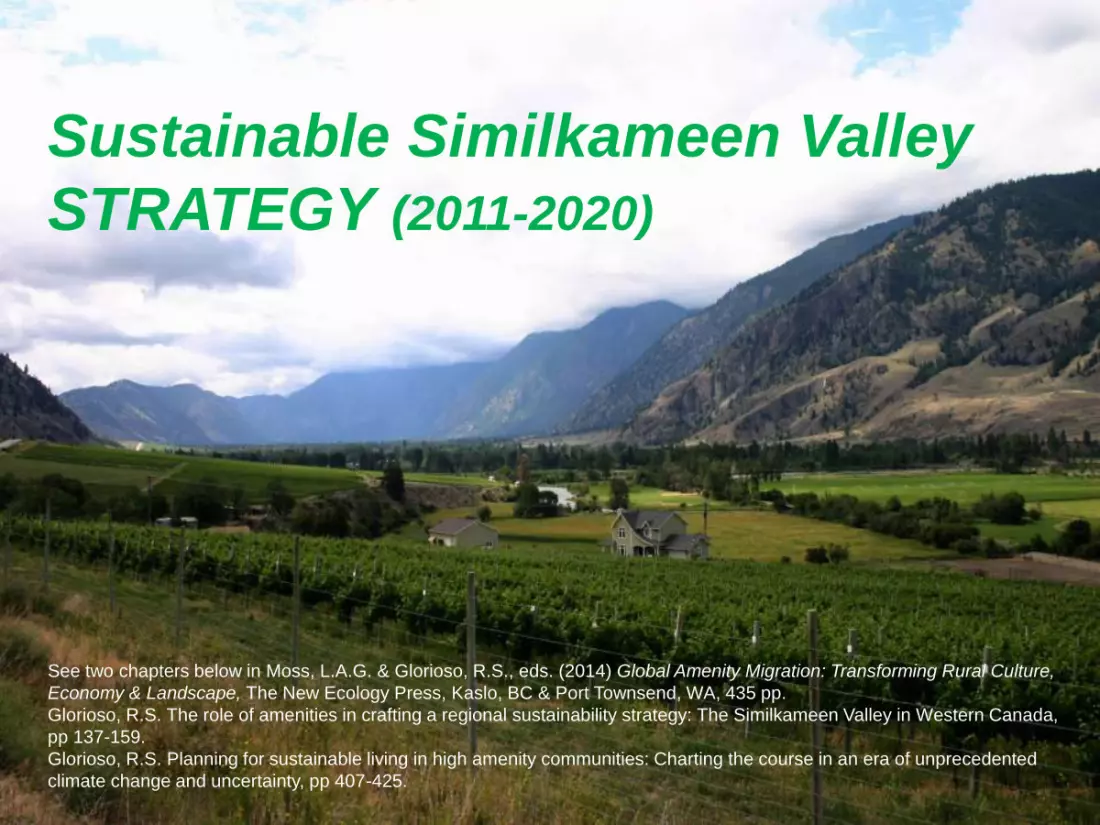
Sustainable Similkameen Valley
STRATEGY (2011-2020)
See two chapters below in Moss, L.A.G. & Glorioso, R.S., eds. (2014) Global Amenity Migration: Transforming Rural Culture,
Economy & Landscape, The New Ecology Press, Kaslo, BC & Port Townsend, WA, 435 pp.
Glorioso, R.S. The role of amenities in crafting a regional sustainability strategy: The Similkameen Valley in Western Canada,
pp 137-159.
Glorioso, R.S. Planning for sustainable living in high amenity communities: Charting the course in an era of unprecedented
climate change and uncertainty, pp 407-425.
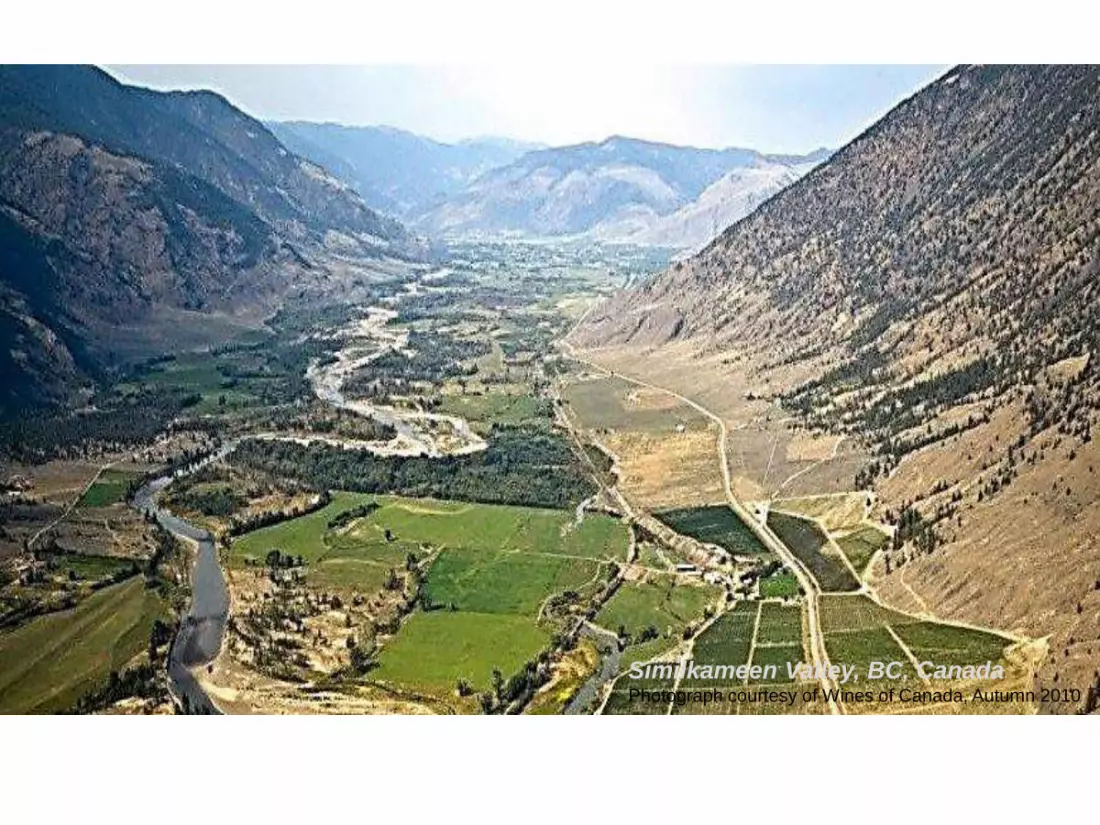
Similkameen Valley, BC, Canada Photograph courtesy of Wines of Canada, Autumn 2010
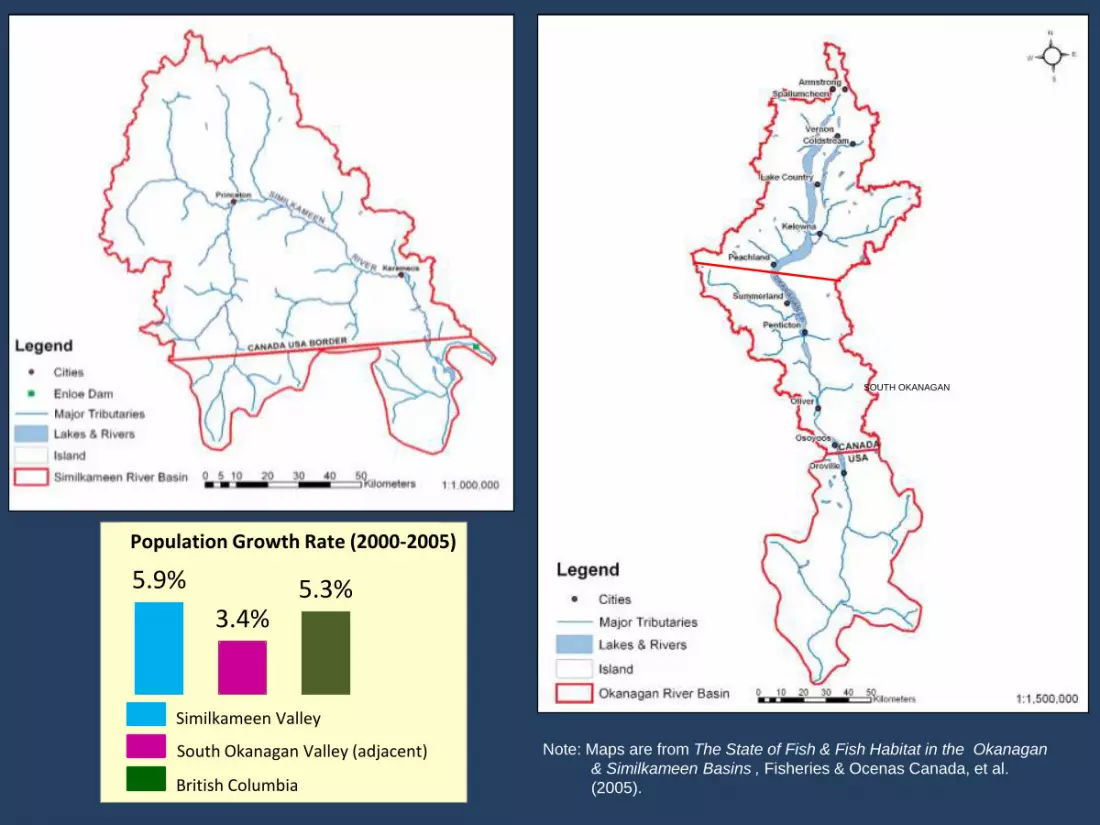
SOUTH OKANAGAN
Note: Maps are from The State of Fish & Fish Habitat in the Okanagan
& Similkameen Basins , Fisheries & Ocenas Canada, et al.
(2005).
5.9%
3.4% 5.3%
Column2 Column3
Column1
Similkameen Valley
British Columbia
South Okanagan Valley (adjacent)
Population Growth Rate (2000-2005)
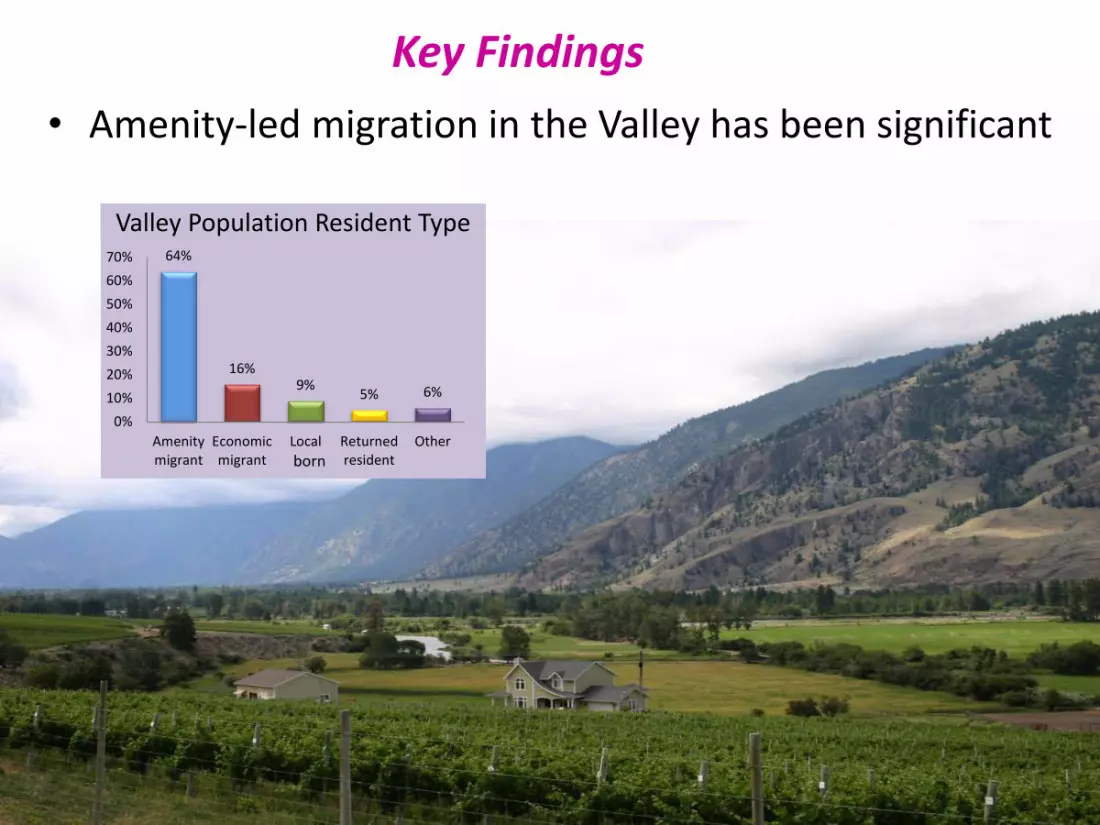
Key Findings
• Amenity-led migration in the Valley has been significant
64%
16% 9%
5% 6%
0%
10%
20%
30%
40%
50%
60%
70%
Amenitymigrant
Economicmigrant
Localperson
Returnedresident
Other
Valley Population Resident Type
born
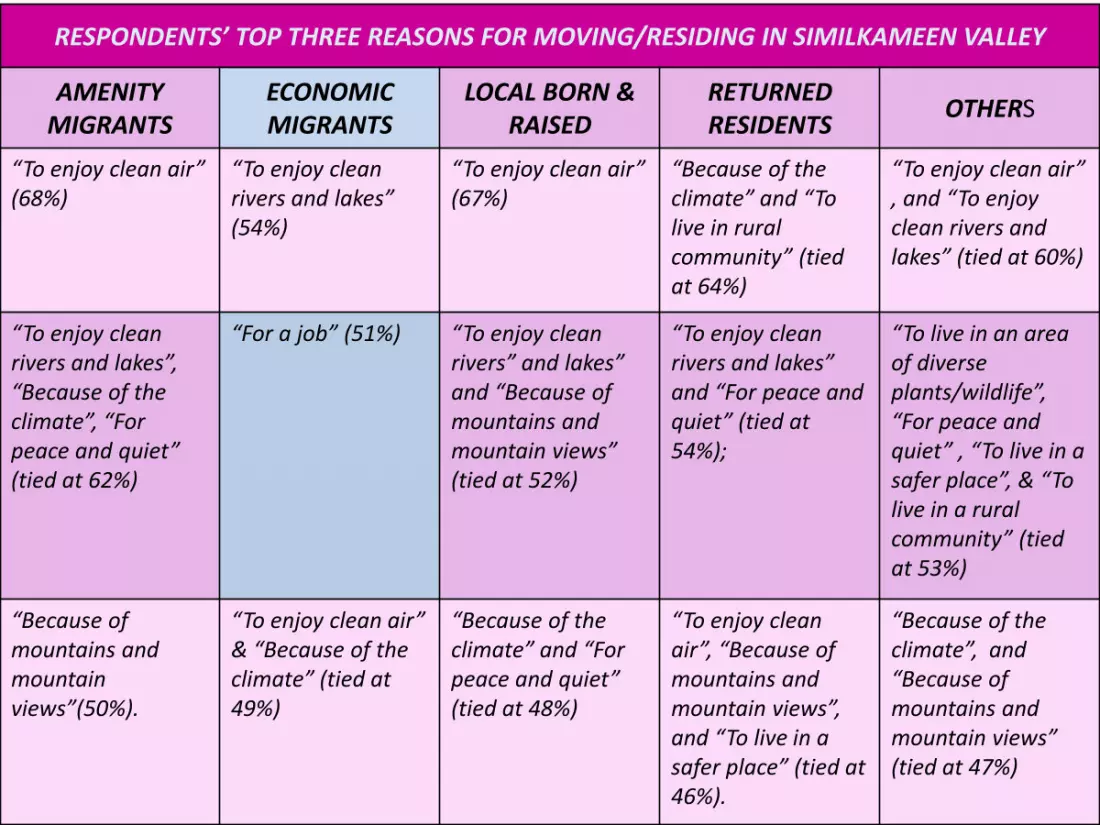
RESPONDENTS’ TOP THREE REASONS FOR MOVING/RESIDING IN SIMILKAMEEN VALLEY
AMENITY MIGRANTS
ECONOMIC MIGRANTS
LOCAL BORN & RAISED
RETURNED RESIDENTS
OTHERS
“To enjoy clean air” (68%)
“To enjoy clean rivers and lakes” (54%)
“To enjoy clean air” (67%)
“Because of the climate” and “To live in rural community” (tied at 64%)
“To enjoy clean air” , and “To enjoy clean rivers and lakes” (tied at 60%)
“To enjoy clean rivers and lakes”, “Because of the climate”, “For peace and quiet” (tied at 62%)
“For a job” (51%) “To enjoy clean rivers” and lakes” and “Because of mountains and mountain views” (tied at 52%)
“To enjoy clean rivers and lakes” and “For peace and quiet” (tied at 54%);
“To live in an area of diverse plants/wildlife”, “For peace and quiet” , “To live in a safer place”, & “To live in a rural community” (tied at 53%)
“Because of mountains and mountain views”(50%).
“To enjoy clean air” & “Because of the climate” (tied at 49%)
“Because of the climate” and “For peace and quiet” (tied at 48%)
“To enjoy clean air”, “Because of mountains and mountain views”, and “To live in a safer place” (tied at 46%).
“Because of the climate”, and “Because of mountains and mountain views” (tied at 47%)
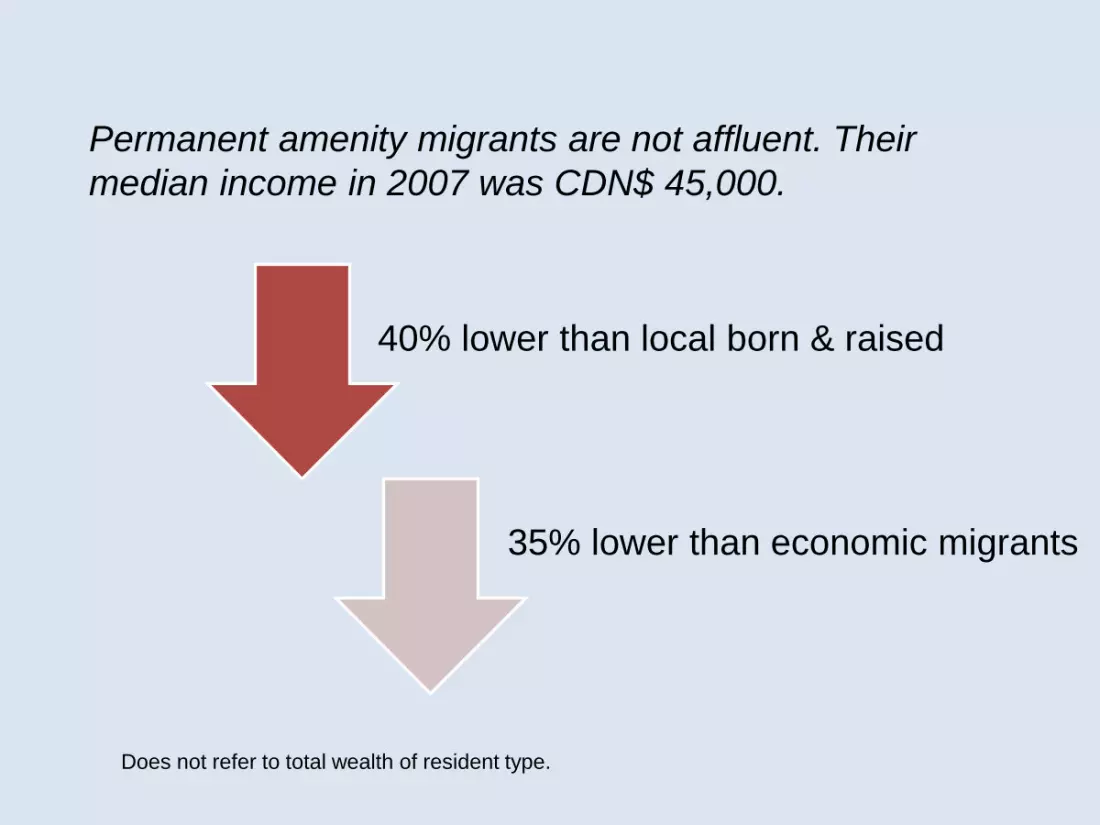
Permanent amenity migrants are not affluent. Their
median income in 2007 was CDN$ 45,000.
40% lower than local born & raised
35% lower than economic migrants
Does not refer to total wealth of resident type.
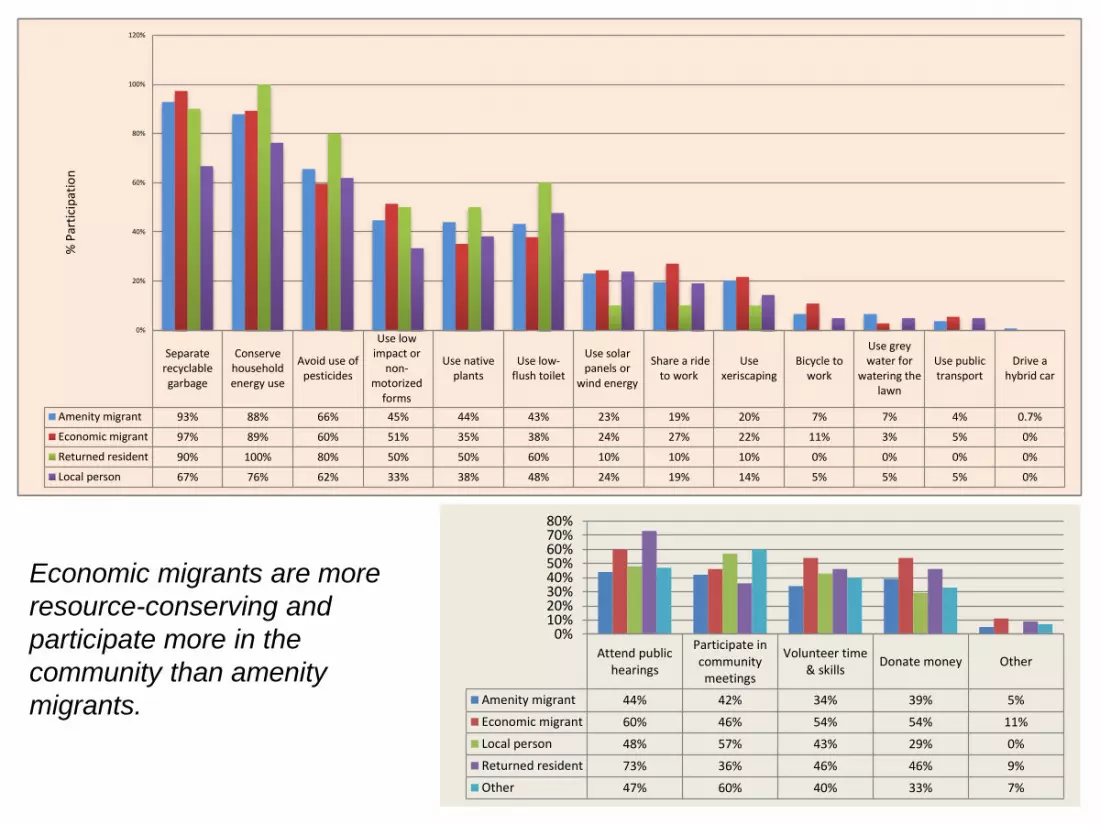
Separaterecyclablegarbage
Conservehouseholdenergy use
Avoid use ofpesticides
Use lowimpact or
non-motorized
forms
Use nativeplants
Use low-flush toilet
Use solarpanels or
wind energy
Share a rideto work
Usexeriscaping
Bicycle towork
Use greywater for
watering thelawn
Use publictransport
Drive ahybrid car
Amenity migrant 93% 88% 66% 45% 44% 43% 23% 19% 20% 7% 7% 4% 0.7%
Economic migrant 97% 89% 60% 51% 35% 38% 24% 27% 22% 11% 3% 5% 0%
Returned resident 90% 100% 80% 50% 50% 60% 10% 10% 10% 0% 0% 0% 0%
Local person 67% 76% 62% 33% 38% 48% 24% 19% 14% 5% 5% 5% 0%
0%
20%
40%
60%
80%
100%
120%
% P
arti
cip
atio
n
Attend publichearings
Participate incommunitymeetings
Volunteer time& skills
Donate money Other
Amenity migrant 44% 42% 34% 39% 5%
Economic migrant 60% 46% 54% 54% 11%
Local person 48% 57% 43% 29% 0%
Returned resident 73% 36% 46% 46% 9%
Other 47% 60% 40% 33% 7%
0%10%20%30%40%50%60%70%80%
Economic migrants are more
resource-conserving and
participate more in the
community than amenity
migrants.
0%
5%
10%
15%
20%
25%
30%
35%
40%
45%
50%
Attendpublic
hearings
Participate incommunitymeetings
Volunteertime & skills
Donatemoney
Others
permanent seasonal intermittent
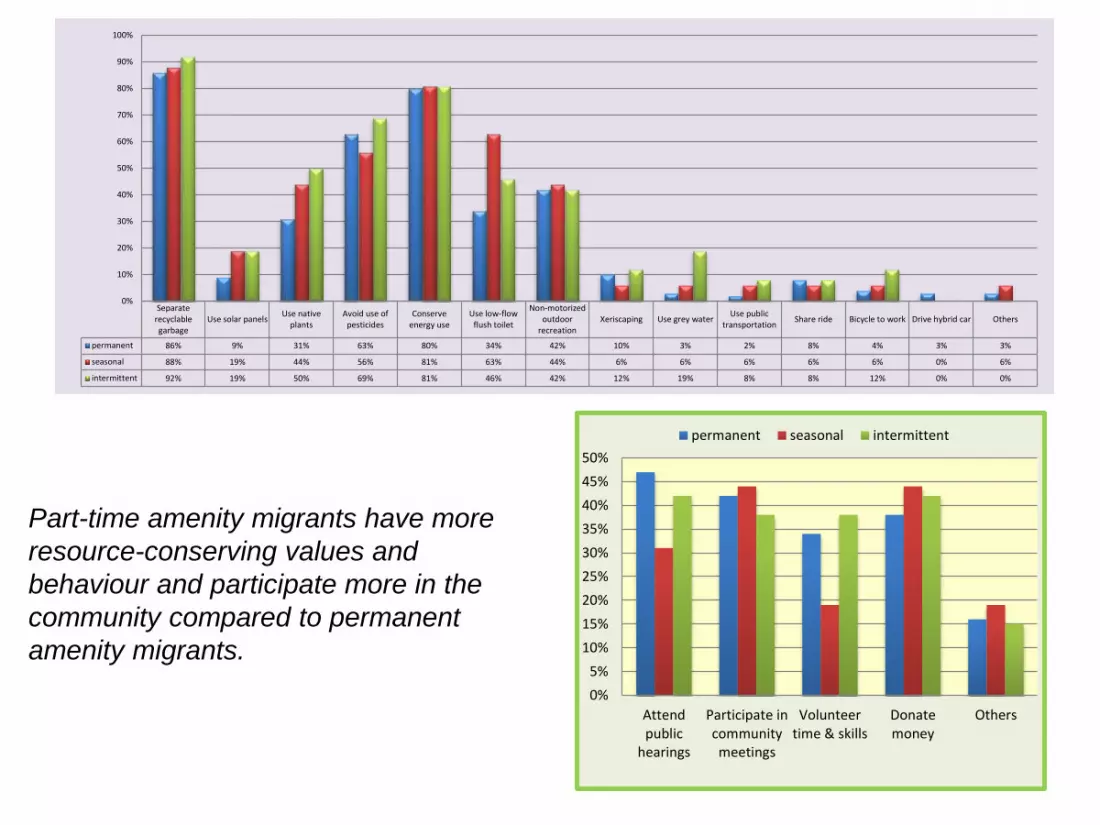
Separaterecyclablegarbage
Use solar panelsUse native
plantsAvoid use of
pesticidesConserve
energy useUse low-flow
flush toilet
Non-motorizedoutdoor
recreationXeriscaping Use grey water
Use publictransportation
Share ride Bicycle to work Drive hybrid car Others
permanent 86% 9% 31% 63% 80% 34% 42% 10% 3% 2% 8% 4% 3% 3%
seasonal 88% 19% 44% 56% 81% 63% 44% 6% 6% 6% 6% 6% 0% 6%
intermittent 92% 19% 50% 69% 81% 46% 42% 12% 19% 8% 8% 12% 0% 0%
0%
10%
20%
30%
40%
50%
60%
70%
80%
90%
100%
Part-time amenity migrants have more
resource-conserving values and
behaviour and participate more in the
community compared to permanent
amenity migrants.
“Age” is the most important factor
influencing migrants’ conservation
values and behaviour and community
participation – generally, the younger
the more conserving.
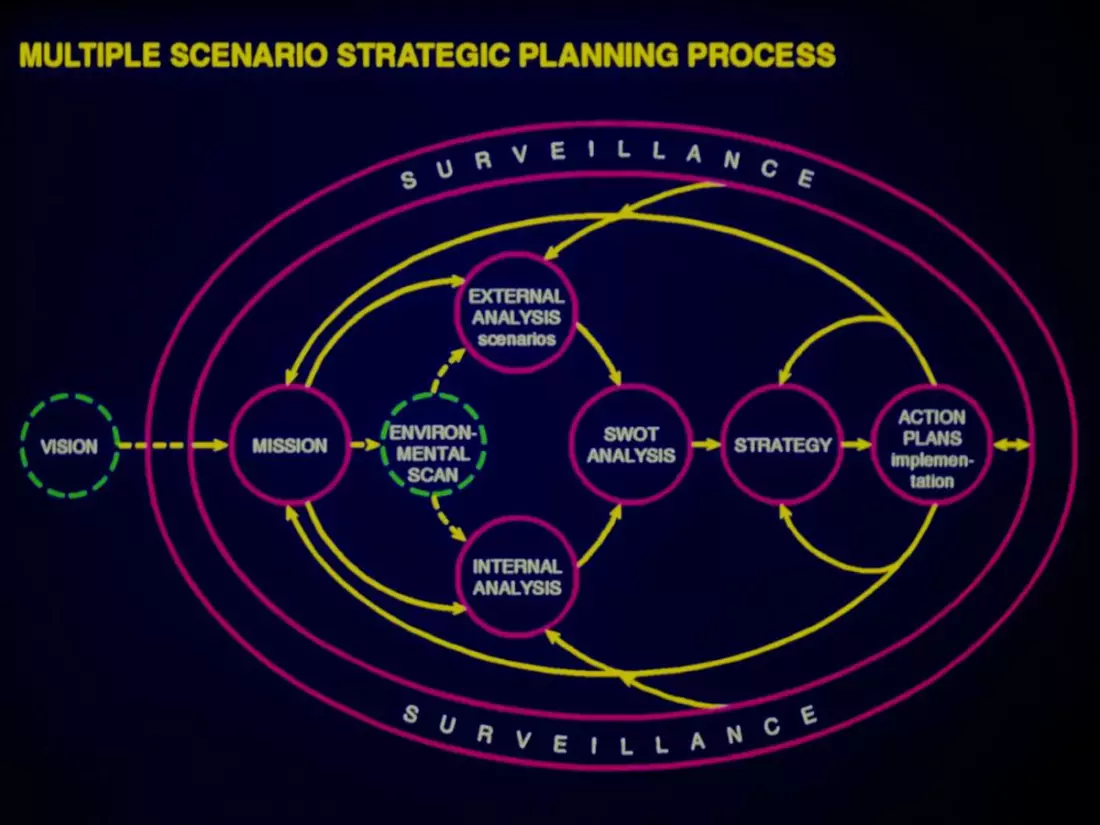
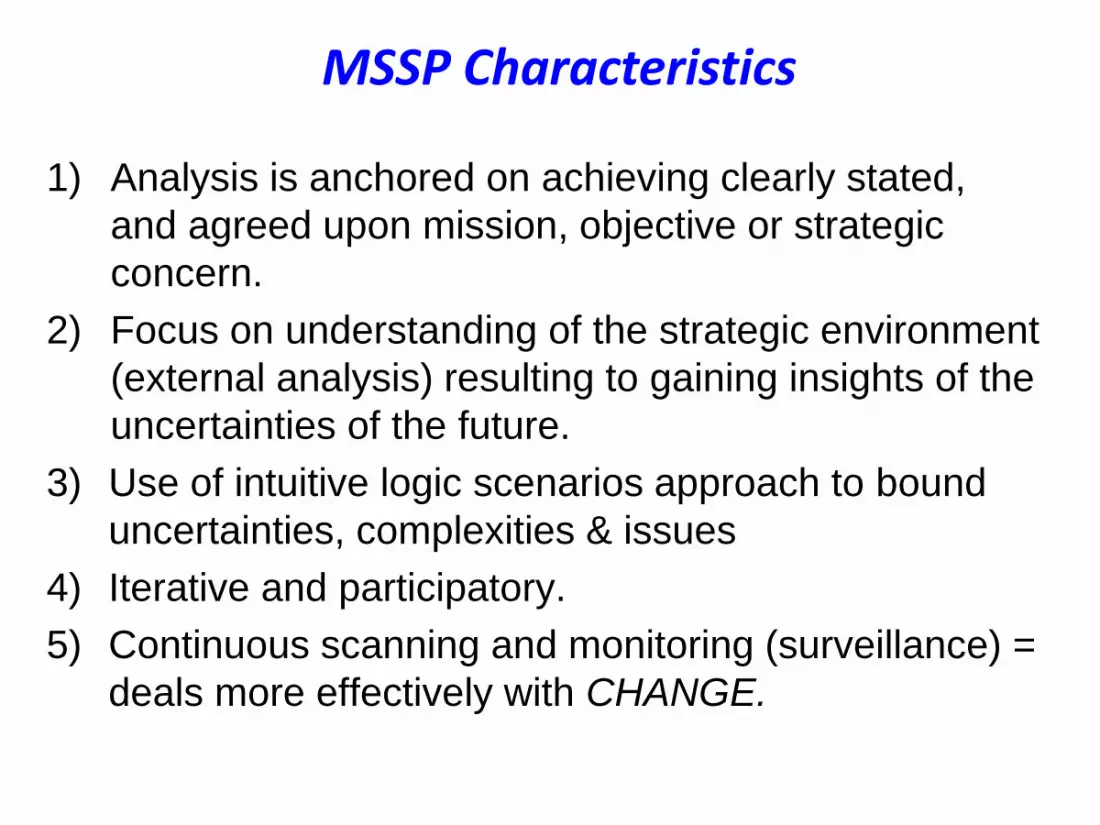
1) Analysis is anchored on achieving clearly stated,
and agreed upon mission, objective or strategic
concern.
2) Focus on understanding of the strategic environment
(external analysis) resulting to gaining insights of the
uncertainties of the future.
3) Use of intuitive logic scenarios approach to bound
uncertainties, complexities & issues
4) Iterative and participatory.
5) Continuous scanning and monitoring (surveillance) =
deals more effectively with CHANGE.
MSSP Characteristics
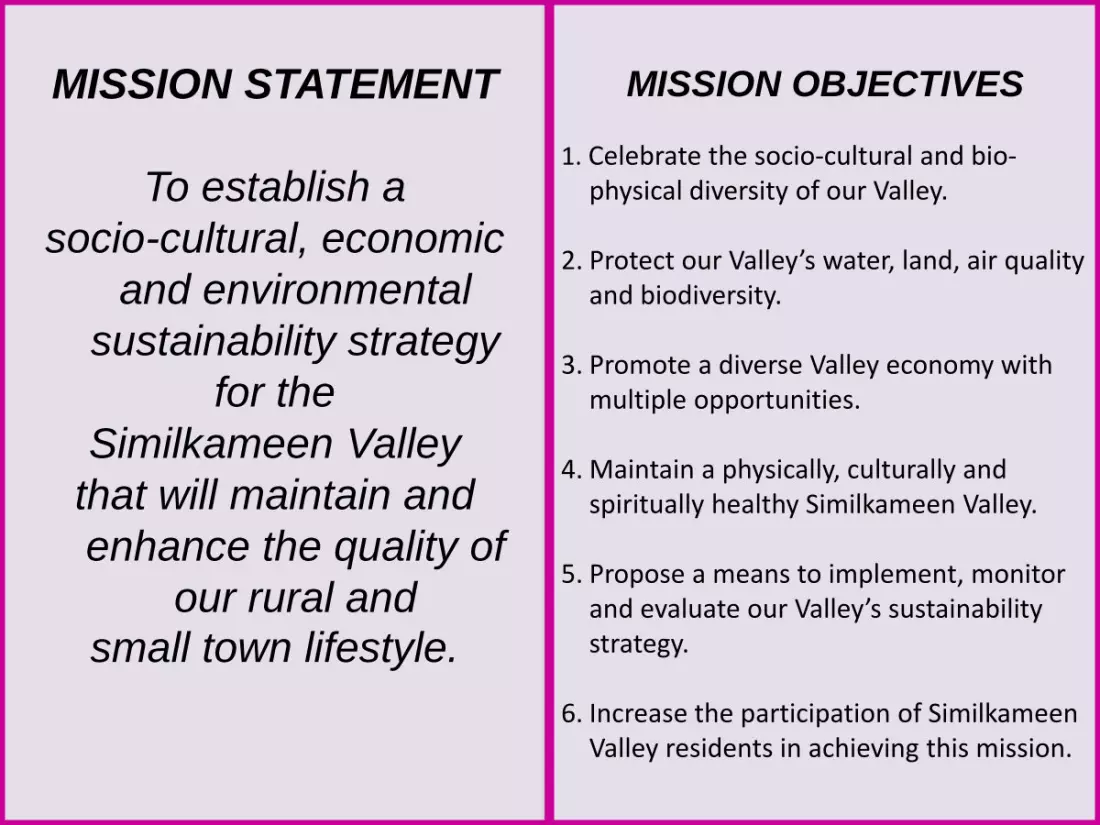
MISSION STATEMENT
To establish a
socio-cultural, economic
and environmental
sustainability strategy
for the
Similkameen Valley
that will maintain and
enhance the quality of
our rural and
small town lifestyle.
MISSION OBJECTIVES
1. Celebrate the socio-cultural and bio-physical diversity of our Valley.
2. Protect our Valley’s water, land, air quality
and biodiversity.
3. Promote a diverse Valley economy with multiple opportunities.
4. Maintain a physically, culturally and spiritually healthy Similkameen Valley.
5. Propose a means to implement, monitor and evaluate our Valley’s sustainability strategy.
6. Increase the participation of Similkameen Valley residents in achieving this mission.
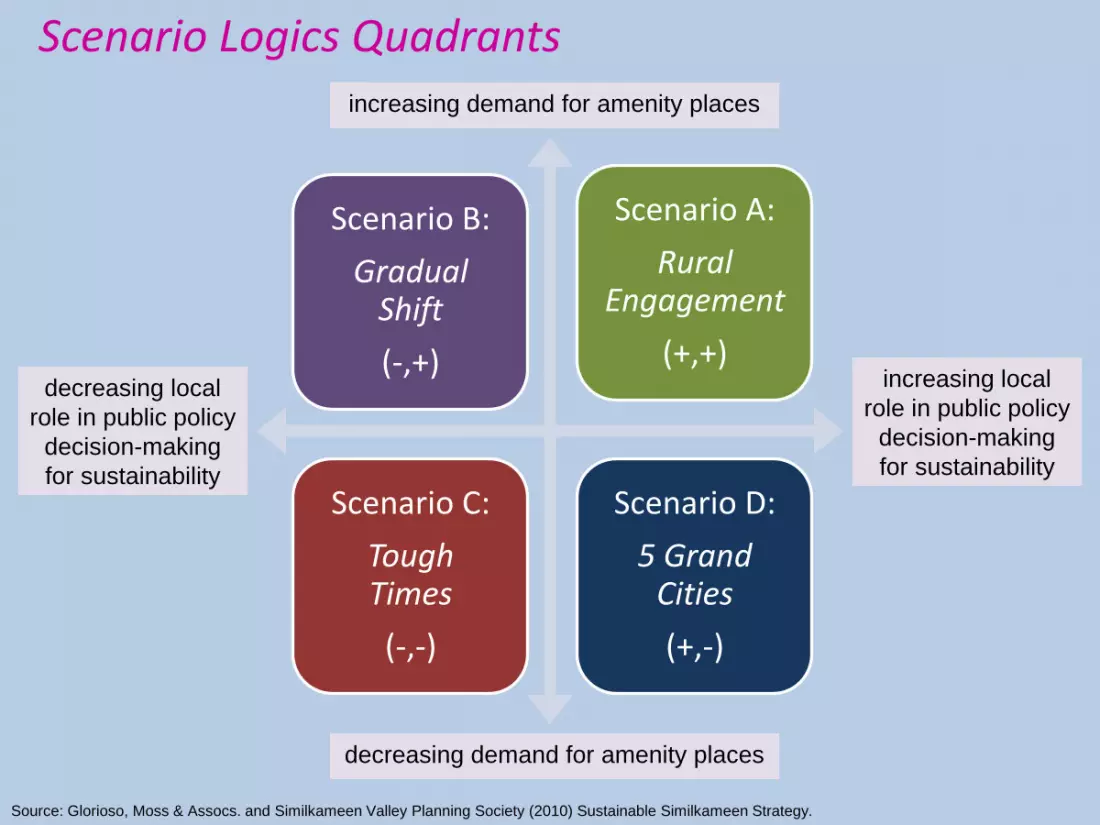
Scenario Logics Quadrants
increasing local
role in public policy
decision-making
for sustainability
decreasing demand for amenity places
increasing demand for amenity places
decreasing local
role in public policy
decision-making
for sustainability
Scenario A:
Rural Engagement
(+,+)
Scenario D:
5 Grand Cities
(+,-)
Scenario C:
Tough Times
(-,-)
Scenario B:
Gradual Shift
(-,+)
Source: Glorioso, Moss & Assocs. and Similkameen Valley Planning Society (2010) Sustainable Similkameen Strategy.
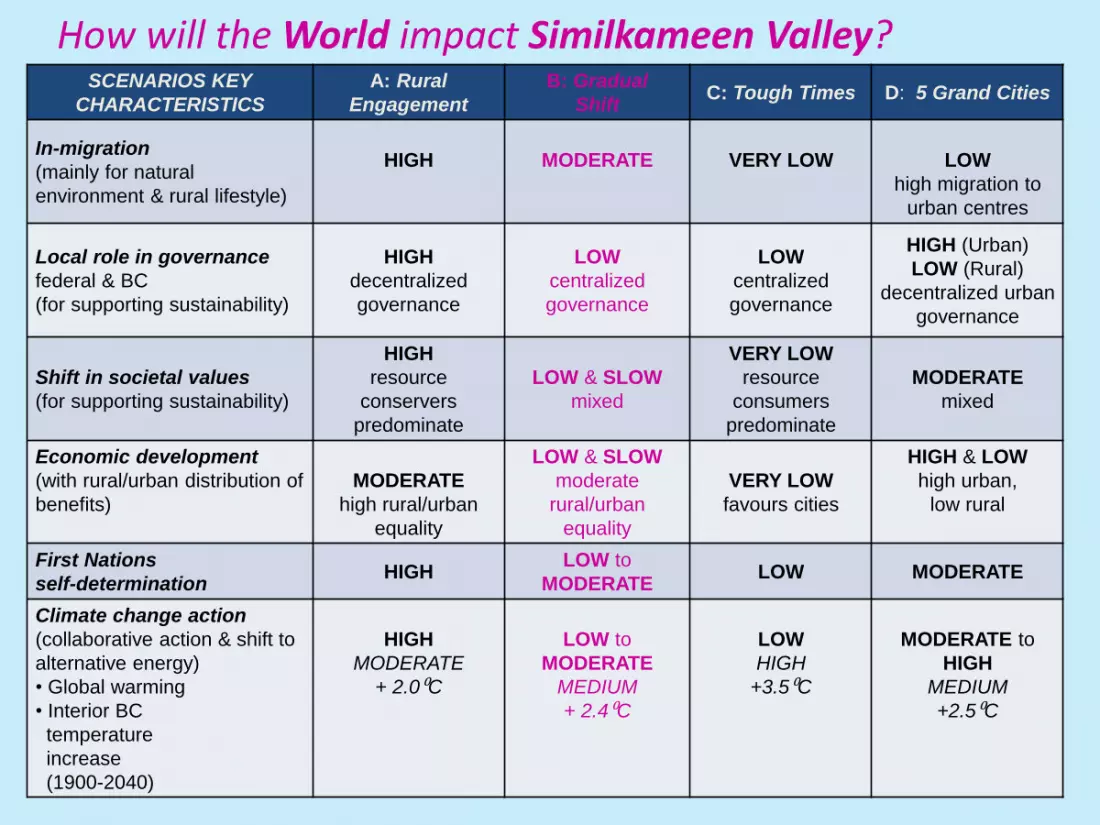
How will the World impact Similkameen Valley? SCENARIOS KEY
CHARACTERISTICS
A: Rural
Engagement
B: Gradual
Shift C: Tough Times D: 5 Grand Cities
In-migration
(mainly for natural
environment & rural lifestyle)
HIGH
MODERATE
VERY LOW
LOW
high migration to
urban centres
Local role in governance
federal & BC
(for supporting sustainability)
HIGH
decentralized
governance
LOW
centralized
governance
LOW
centralized
governance
HIGH (Urban)
LOW (Rural)
decentralized urban
governance
Shift in societal values
(for supporting sustainability)
HIGH
resource
conservers
predominate
LOW & SLOW
mixed
VERY LOW
resource
consumers
predominate
MODERATE
mixed
Economic development
(with rural/urban distribution of
benefits)
MODERATE
high rural/urban
equality
LOW & SLOW
moderate
rural/urban
equality
VERY LOW
favours cities
HIGH & LOW
high urban,
low rural
First Nations
self-determination HIGH
LOW to
MODERATE LOW MODERATE
Climate change action
(collaborative action & shift to
alternative energy)
• Global warming
• Interior BC
temperature
increase
(1900-2040)
HIGH
MODERATE
+ 2.0⁰C
LOW to
MODERATE
MEDIUM
+ 2.4⁰C
LOW
HIGH
+3.5⁰C
MODERATE to
HIGH
MEDIUM
+2.5⁰C
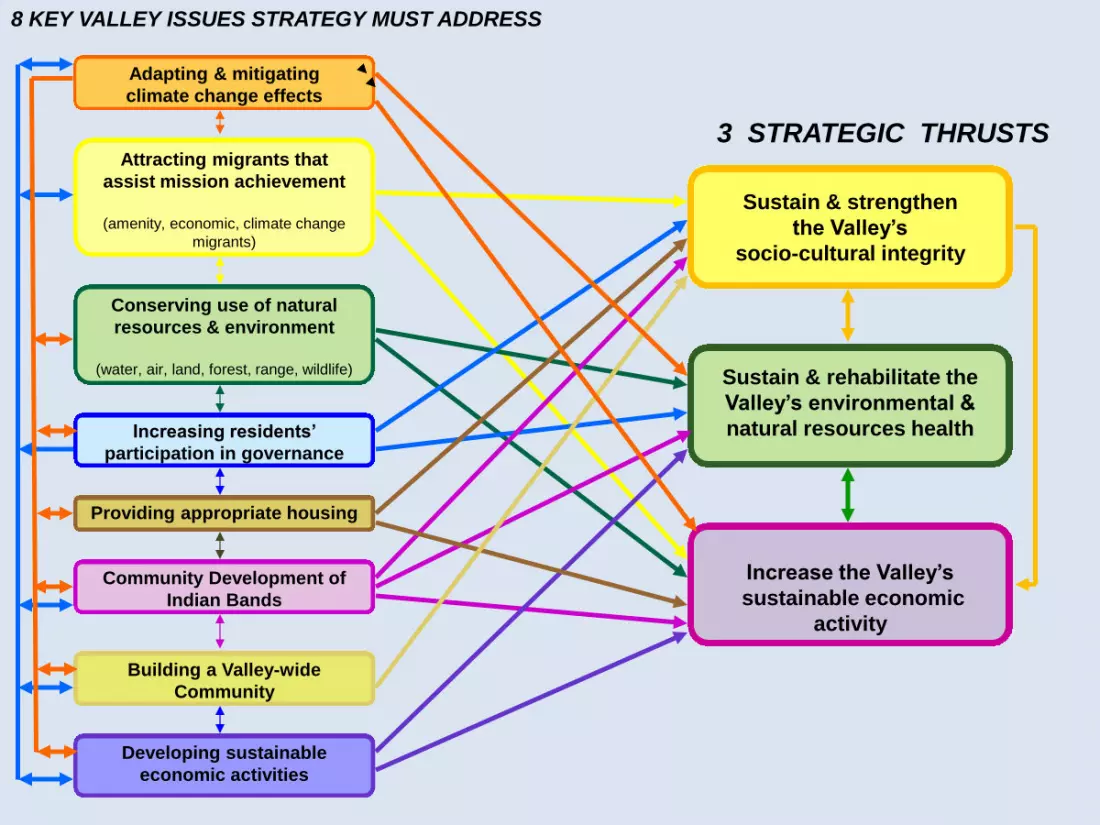
Sustain & rehabilitate the
Valley’s environmental &
natural resources health
Sustain & strengthen
the Valley’s
socio-cultural integrity
Increase the Valley’s
sustainable economic
activity
Increasing residents’
participation in governance
Adapting & mitigating
climate change effects
Attracting migrants that
assist mission achievement
(amenity, economic, climate change
migrants)
Conserving use of natural
resources & environment
(water, air, land, forest, range, wildlife)
Providing appropriate housing
Community Development of
Indian Bands
Building a Valley-wide
Community
Developing sustainable
economic activities
3 STRATEGIC THRUSTS
8 KEY VALLEY ISSUES STRATEGY MUST ADDRESS
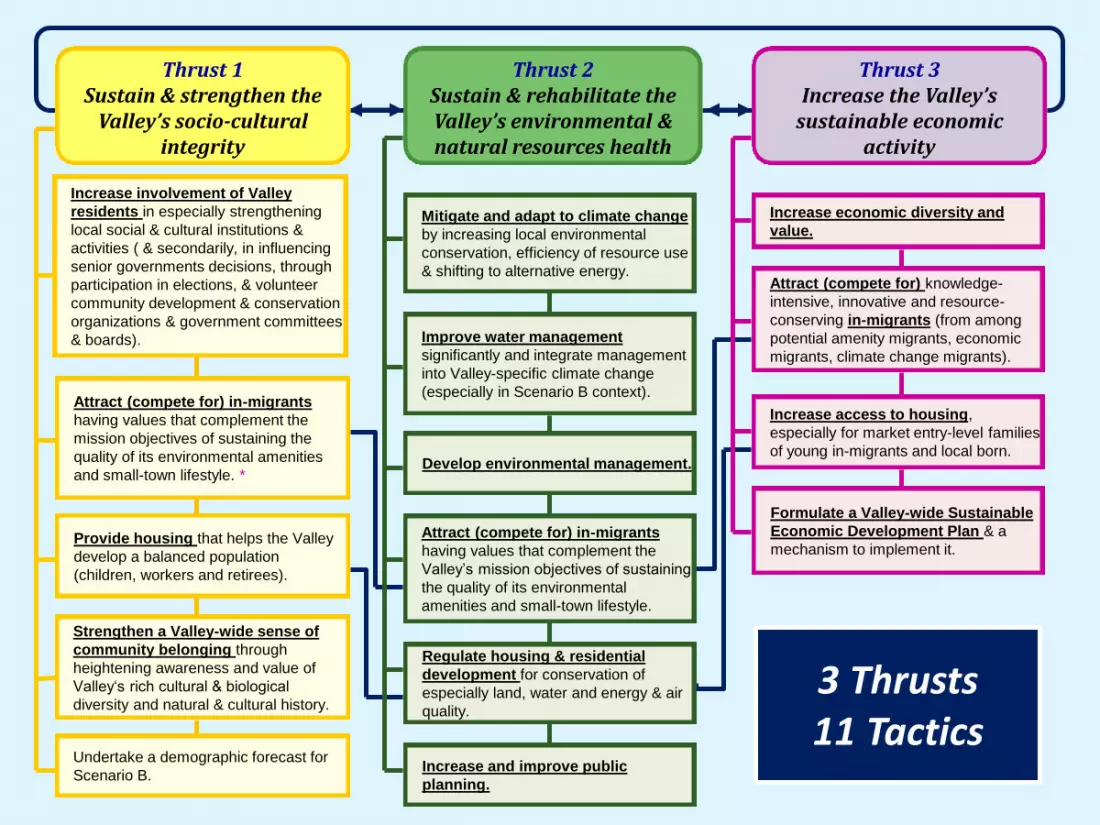
Undertake a demographic forecast for
Scenario B.
Increase involvement of Valley
residents in especially strengthening
local social & cultural institutions &
activities ( & secondarily, in influencing
senior governments decisions, through
participation in elections, & volunteer
community development & conservation
organizations & government committees
& boards).
Thrust 1 Sustain & strengthen the
Valley’s socio-cultural integrity
Attract (compete for) in-migrants
having values that complement the
mission objectives of sustaining the
quality of its environmental amenities
and small-town lifestyle. *
Provide housing that helps the Valley
develop a balanced population
(children, workers and retirees).
Strengthen a Valley-wide sense of
community belonging through
heightening awareness and value of
Valley‘s rich cultural & biological
diversity and natural & cultural history.
Thrust 2 Sustain & rehabilitate the Valley’s environmental & natural resources health
Thrust 3 Increase the Valley’s
sustainable economic activity
Mitigate and adapt to climate change
by increasing local environmental
conservation, efficiency of resource use
& shifting to alternative energy.
Improve water management
significantly and integrate management
into Valley-specific climate change
(especially in Scenario B context).
Develop environmental management.
Regulate housing & residential
development for conservation of
especially land, water and energy & air
quality.
Attract (compete for) in-migrants
having values that complement the
Valley’s mission objectives of sustaining
the quality of its environmental
amenities and small-town lifestyle.
Increase and improve public
planning.
Increase economic diversity and
value.
Increase access to housing,
especially for market entry-level families
of young in-migrants and local born.
Formulate a Valley-wide Sustainable
Economic Development Plan & a
mechanism to implement it.
Attract (compete for) knowledge-
intensive, innovative and resource-
conserving in-migrants (from among
potential amenity migrants, economic
migrants, climate change migrants).
3 Thrusts 11 Tactics
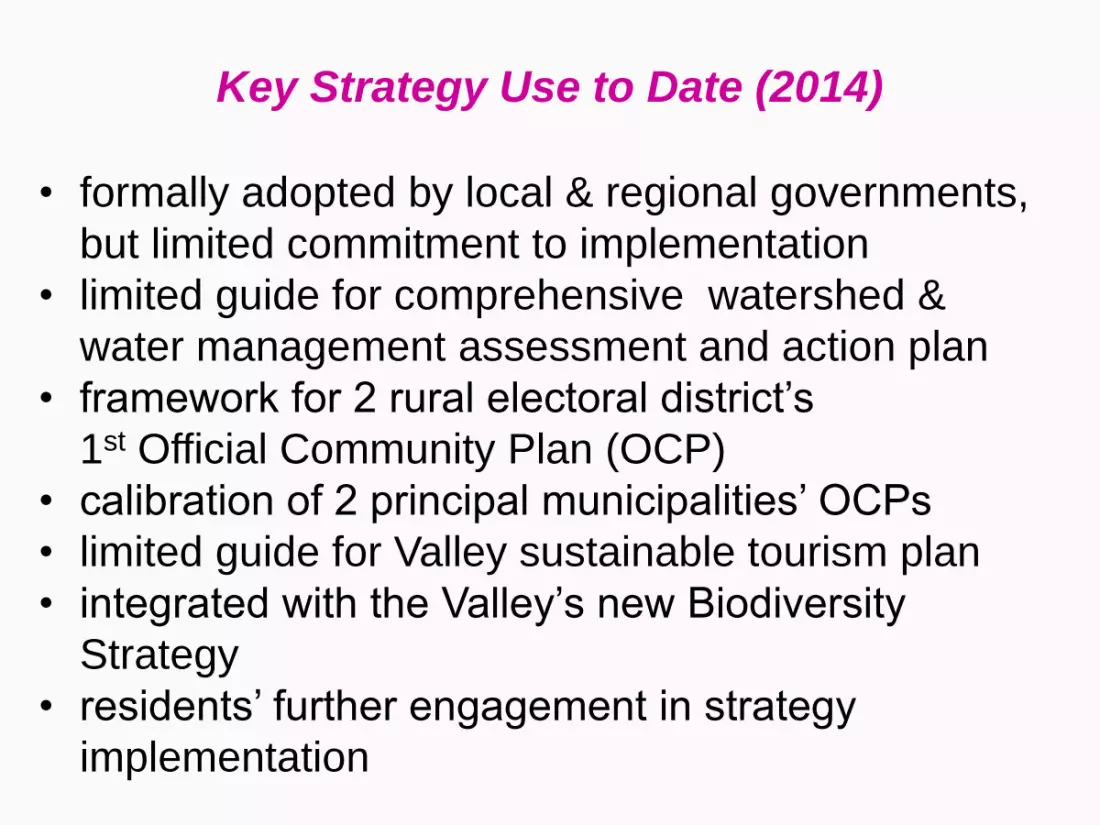
Key Strategy Use to Date (2014)
• formally adopted by local & regional governments,
but limited commitment to implementation
• limited guide for comprehensive watershed &
water management assessment and action plan
• framework for 2 rural electoral district’s
1st Official Community Plan (OCP)
• calibration of 2 principal municipalities’ OCPs
• limited guide for Valley sustainable tourism plan
• integrated with the Valley’s new Biodiversity
Strategy
• residents’ further engagement in strategy
implementation
The International Amenity Migration Centre
www.amenitymigration.org