Global Agriculture Trade and Development - World Bank ...
352
GLOBAL AGRICULTURAL Trade and Developing Countries Editors M. Ataman Aksoy • John C. Beghin THE WORLD BANK Public Disclosure Authorized Public Disclosure Authorized Public Disclosure Authorized Public Disclosure Authorized Public Disclosure Authorized Public Disclosure Authorized Public Disclosure Authorized Public Disclosure Authorized
-
Upload
khangminh22 -
Category
Documents
-
view
0 -
download
0
Transcript of Global Agriculture Trade and Development - World Bank ...

GLOBAL AGRICULTURAL
Trade andDeveloping Countries
EditorsM. Ataman Aksoy • John C. Beghin
THE WORLD BANK
Pub
lic D
iscl
osur
e A
utho
rized
Pub
lic D
iscl
osur
e A
utho
rized
Pub
lic D
iscl
osur
e A
utho
rized
Pub
lic D
iscl
osur
e A
utho
rized
Pub
lic D
iscl
osur
e A
utho
rized
Pub
lic D
iscl
osur
e A
utho
rized
Pub
lic D
iscl
osur
e A
utho
rized
Pub
lic D
iscl
osur
e A
utho
rized
WB112742
Placed Image


GLOBAL AGRICULTURAL TRADE AND DEVELOPING
COUNTRIES


GLOBALAGRICULTURAL
TRADE AND DEVELOPING
COUNTRIES
Editors
M. Ataman Aksoy and John C. Beghin
THE WORLD BANKWashington, D.C.

© 2005 The International Bank for Reconstruction and Development / The World Bank1818 H Street, NWWashington, DC 20433Telephone 202-473-1000Internet www.worldbank.orgE-mail [email protected]
All rights reserved.
1 2 3 4 07 06 05 04
The findings, interpretations, and conclusions expressed herein are those of the author(s) and do notnecessarily reflect the views of the Board of Executive Directors of the World Bank or the governmentsthey represent.
The World Bank does not guarantee the accuracy of the data included in this work. The boundaries,colors, denominations, and other information shown on any map in this work do not imply any judgment onthe part of the World Bank concerning the legal status of any territory or the endorsement or acceptance ofsuch boundaries.
Rights and PermissionsThe material in this work is copyrighted. Copying and/or transmitting portions or all of this work
without permission may be a violation of applicable law. The International Bank for Reconstruction andDevelopment/World Bank encourages dissemination of its work and will normally grant permission promptly.
For permission to photocopy or reprint any part of this work, please send a request with completeinformation to the Copyright Clearance Center, Inc., 222 Rosewood Drive, Danvers, MA 01923, USA,telephone 978-750-8400, fax 978-750-4470, www.copyright.com.
All other queries on rights and licenses, including subsidiary rights, should be addressed to the Office ofthe Publisher, World Bank, 1818 H Street NW, Washington, DC 20433, USA, fax 202-522-2422, [email protected].
Library of Congress Cataloging-in-Publication Data
Global agricultural trade and developing countries / editor M. Ataman Aksoy, John C. Beghin.p. cm. – (Trade and development)
Includes bibliographical references and index.ISBN 0-8213-5863-41. Produce trade—Developing countries. 2. Produce trade—Government
policy—Developing countries. 3. International economic relations. I. Aksoy, M.Ataman, 1945- II. Beghin, John C. (John Christopher), 1954- III. Trade anddevelopment series
HD9018.D44G565 2004382'.41'091724—dc22 2004058811

Contents
Acknowledgments xiiiContributors xvAcronyms and Abbreviations xvii
1. INTRODUCTION AND OVERVIEW 1M. Ataman Aksoy and John C. Beghin
Part I. Global Protection and Trade in Agriculture
2. THE EVOLUTION OF AGRICULTURAL TRADE FLOWS 17M. Ataman Aksoy
3. GLOBAL AGRICULTURAL TRADE POLICIES 37M. Ataman Aksoy
4. THE IMPACT OF AGRICULTURAL TRADE PREFERENCES, WITH PARTICULARATTENTION TO THE LEAST-DEVELOPED COUNTRIES 55Paul Brenton and Takako Ikezuki
5. EXPERIENCE WITH DECOUPLING AGRICULTURAL SUPPORT 75John Baffes and Harry de Gorter
6. AGRO–FOOD EXPORTS FROM DEVELOPING COUNTRIES:THE CHALLENGES POSED BY STANDARDS 91Steven M. Jaffee and Spencer Henson
7. GLOBAL AGRICULTURAL REFORM: WHAT IS AT STAKE 115Dominique van der Mensbrugghe and John C. Beghin
Part II. The Commodity Studies
8. SUGAR POLICIES: AN OPPORTUNITY FOR CHANGE 141Donald O. Mitchell
9. DAIRY: ASSESSING WORLD MARKETS AND POLICY REFORMS: IMPLICATIONS FORDEVELOPING COUNTRIES 161Tom Cox and Yong Zhu
10. RICE: GLOBAL TRADE, PROTECTIONIST POLICIES, AND THE IMPACT OF TRADELIBERALIZATION 177Eric J. Wailes
v

11. WHEAT: THE GLOBAL MARKET, POLICIES, AND PRIORITIES 195Donald O. Mitchell and Myles Mielke
12. GROUNDNUT POLICIES, GLOBAL TRADE DYNAMICS, AND THE IMPACTOF TRADE LIBERALIZATION 215Ndiame Diop, John C. Beghin, and Mirvat Sewadeh
13. FRUITS AND VEGETABLES: GLOBAL TRADE AND COMPETITION IN FRESHAND PROCESSED PRODUCT MARKETS 237Ndiame Diop and Steven M. Jaffee
14. COTTON: MARKET SETTING, TRADE POLICIES, AND ISSUES 259John Baffes
15. SEAFOOD: TRADE LIBERALIZATION AND IMPACTS ON SUSTAINABILITY 275Cathy A. Roheim
16. COFFEE: MARKET SETTING AND POLICIES 297John Baffes, Bryan Lewin, and Panos Varangis
INDEX 311
ANNEX CD-ROMBaris Sivri
List of Boxes
2.1 Role of Demand and Changes in Market Share 244.1 The EU System of Entry Prices: The Example of Tomatoes 62
10.1 Definitions of Rice Trade Flows in This Study 17813.1 The European Union’s Entry Price Scheme: Hindering Cost-Based Competition
in the EU Market 24713.2 The U.S.-Brazilian Trade Dispute over Orange Juice 24913.3 Peruvian Asparagus Exports—A Standard Success Story? 25415.1 Impacts of Trade Liberalization in Uganda’s Fishing Industry 28215.2 Foreign Fishing Access Agreements Involving Mauritania 28416.1 Coffee Supply Controls in the Twentieth Century 303
List of Figures
2.1 Ratio of Farm Household Income to Nonfarm Household Income for SelectedDeveloping Countries, Various Years 19
2.2 Ratio of Farm Household Income to All Household Income for SelectedHigh-Income Countries 19
2.3 Ratio of Farm Income to Total Income of Farm Households,Selected Countries and Years 21
3.1 Market Price Support and Average Tariffs for Selected OECD Countries 403.2 Nominal Rates of Agricultural Support in OECD Countries 1965–2002 413.3 Rates of Agricultural Support in OECD Countries and Real U.S. Agricultural Price Index 423.4 Average Most-Favored-Nation Applied Tariffs for Agricultural and Manufacturing
Products in Developing Countries, 1990–2000 43
vi Contents

3.5 Non-Ad-Valorem Tariff Lines as a Share of Total 453.6 Share of Output under Tariff Rate Quotas 504.1 The Value of Preferences Requested under GSP and AGOA Programs of the
United States, as a Share of Agricultural Export to the United States 674.2 The Value of Preferences Requested under Cotonou and GSP Programs of the
EU, as a Share of Agricultural Export to the EU 684.3 The Value of Preferences for LDCs under the GSP Program of Japan, as a Share
of Agricultural Export to Japan 697.1 Output Structure in Base Year, 1997 1227.2 Change in Rural Value Added from Baseline in 2015 1247.3 Percentage Change in Rural Value Added from Baseline in 2015 1257.4 Welfare Impacts of Productivity Changes 1307.5 Sugar Output in Europe 1327.6 Real Income and Trade Elasticities 1357.7 Exports and Trade Elasticities 1358.1 World Sugar Exports and Net Imports of Selected Countries (million of tons) 1428.2 U.S. Sugar and HFCS Consumption 1438.3 Sugar Prices, 1970–2003 1528.4 Japanese Sugar Trends, 1970–2000 1548.5 U.S. Sugar Loan Rates, U.S. Prices, and World Prices, 1980–2002 157
10.1 World Rice Trade and Share of Total Use 17911.1 Wheat Yields, U.S. and India, 1900–2000 19711.2 Per Capita Food Consumption of Wheat 19811.3 Wheat Ending-Stocks vs. Prices 19911.4 U.S. Wheat Price 19911.5 U.S. Wheat Food Aid vs. Prices 20311.6 Global Wheat Imports 20711.7 Wheat Net Imports, Average for 1990–2000 20711.8 Wheat Producer Prices in 2001 for Selected Countries 21011.9 Emerging Wheat Net Exports of Emerging Exporters in the FSU 21012.1 Global Groundnut Consumption, Exports, and Market Shares 21912.2 Unit Price of Raw Edible Groundnuts Produced in The Gambia, Senegal,
and South Africa 22112.3 Rotterdam Prices of Groundnuts, 1970–2000 22112.4 U.S. Domestic Groundnut Prices, 1993–2003 22513.1 Production of Fruit and Vegetables by Region 23813.2 Annual Growth Rates of World Imports of Selected Fruits 23913.3 Annual World Import Growth Rates of Selected Vegetables 24013.4 Annual Growth Rates of World Import of Major Processed Fruits and Vegetables 24013.5 World Unit Values for Fresh Fruits, Fresh Vegetables, and Prepared Vegetables 24113.6 Import Penetration Ratios in U.S. Fruit and Vegetable Markets, 1970–2001 24313.7 The Hierarchy of Preferences in the European Fruits and Vegetables Market 25013.8 Value of Fruit and Vegetable Preference for Major ACP Exporters, 2002 25113.9 Value of Fruit and Vegetable Preference under AGOA 25213.10 EU–Third Country Imports and the Share of Key Exporters 25314.1 Cotton’s Share in Total Fiber Consumption and Polyester to Cotton Price Ratio,
1960–2002 26015.1 Fish Catches by Leading Countries, 1991–2000 27615.2 World Aquaculture Production of Shrimp, by Volume, 2000 27715.3 World Aquaculture Production by Value, 1991–2000 278
Contents vii

15.4 Food Fish Exports by Top Countries, 2000 27915.5 World Food Fish Exports by Value of Major Commodity Group, 2000 28015.6 Tariff Structure by Level of Processing, (1998–2001) 28516.1 (a) Nominal Coffee Prices, 1990–2003 301
(b) Real Coffee Prices, 1960–2003 301(c) Nominal Price Indexes for Coffee and Other Commodities, 1990–2002 302(d) Real Price Indexes for Coffee and Other Commodities, 1960–2003 302
List of Tables
2.1 Distribution of Poor People in Developing Countries, 1999 182.2 Rural Population and Poverty for a Sample of 52 Developing Countries 182.3 Structure of Rural Household Incomes, Selected Developing Countries 202.4 Urban and Rural Income Inequality, Selected Countries and Years 212.5 Average Annual Real Export Growth Rates, 1980s and 1990s 222.6 Shares of Developing and Industrial Countries in World Exports, 1980–81
to 2000–01 232.7 Changes in Agriculture Price Indices, 1980s and 1990s 232.8 Average Annual Agricultural Output Growth Rates, 1980s and 1990s 232.9 Global Agricultural Trade Flows 252.10 Agricultural Flows (excluding Intra-EU and Intra-NAFTA Trade), 1980–81 to 2000–01 262.11 Agricultural Trade Flows of Developing Countries, by Groups, 1980–81 to 2000–01 272.12 Annual Import Growth Rates for Four Classifications of Agricultural Products,
1980s and 1990s 292.13 The Structure of Agricultural Exports, 1980–81 to 2000–01 302.14 Share of Agricultural Final Products in Exports, 1980–81 to 2000–01 312.15 Export Shares by Level of Processing, 1980/81 to 2000/01 322.16 Export Shares by Product and Region, 1980–81 to 2000–01 333.1 Percentage of Farm Gate Prices Attributable to Border Protection and
Direct Subsidies by Country and Group, 1986–2002, Evaluated at World Prices 413.2 Agricultural Protection Rates in Selected Developing Countries 433.3 Agricultural Support in OECD Countries, 2002–02 443.4 Average Ad Valorem and Specific Duty Rates 463.5 Proportion of Non-Ad-Valorem Tariff Lines by Degree of Processing 463.6 Average Agricultural Tariffs, Selected Country Groups and Years 473.7 Tariff Peaks and Variance in Selected Countries 483.8 Tariff Rate Escalation in Agriculture, Selected Country Groups and Years 483.9 Tariff Escalation in Selected Agricultural Product Groups 493.10 Tariffs in the European Union and the United States Before and After Average
Reduction from Applied Tariffs under the Harbinson Proposal 513.11 Tariffs in Selected Developing Countries Before and After Average Reductions
from Bound Rates 514.1 Average Unweighted Tariffs on Agricultural Products in the United States, 2003 594.2 Average Unweighted MFN Tariffs on Agricultural Products Covered by GSP and
AGOA in the United States, 2003 594.3 Number of Agricultural Tariff Lines Liberalized under GSP and AGOA
Programs in the United States, 2003 604.4 Average Unweighted Tariffs on Agricultural Products in the European Union, 2002 61
viii Contents

4.5 Average Unweighted MFN Tariffs on Agricultural Products Covered by GSP andCotonou Agreement, 2002 63
4.6 Number of Tariffs Lines Liberalized under EU Preferences for ACP Countries, 2002 634.7 Average Unweighted Tariffs on Agricultural Products in Japan, 2002 644.8 Average Unweighted MFN Tariffs on Agricultural Products Covered by GSP in
Japan, 2002 644.9 Tariffs Lines Liberalized under Japan’s GSP Preferences, 2002 644.10 Exports to the United States under AGOA and by other LDCs under the GSP, 2002 654.11 Exports to the European Union from ACP Beneficiaries, 2002 664.12 Exports to Japan from LDCs in 2002 665.1 Chronology of Broader Decoupling and Recoupling Episodes, 1985–2004 795.2 Composition of Agricultural Support in the United States, 1986–88 to 1999–2001 805.3 Composition of Agricultural Support in the European Union, 1986–88 to 1999–2001 825.4 Composition of Agricultural Support in Mexico, 1986–88 to 1999–2001 845.5 Composition of Agricultural Support in Turkey, 1986–88 to 1999–2001 856.1 Costs of Compliance with Export Food Safety Requirements in the Shrimp
Processing Industry in Bangladesh and Nicaragua 986.2 Estimated Value of World Agricultural and Food Trade Directly Affected by
Import Border Rejections Based on Technical Standards, 2000–01 1026.3 Number of Counter-Notifications to the Sanitary and Phytosanitary Committee
Relating to Reported Measures, 1995–2002 1047.1 Trends in Agriculture, 2000–15 1177.2 Trends in Processed Foods, 2000–15 1177.3 Real Income Gains and Losses from Global Merchandise Trade Reform: Change from
2015 Baseline 1197.4 Agricultural Output Gains and Losses from Global Merchandise Trade Reform:
Change from 2015 Baseline 1217.5 Real Income Gains from Agricultural and Food Trade Reform:
Change from 2015 Baseline 1217.6 Impact of Global Agricultural and Food Reform on Agricultural and Food Trade:
Change from 2015 Baseline 1237.7 Impact of Global Agriculture and Food Reform on Agricultural Employment
and Wages: Change from 2015 Baseline 1267.8 Impact of Global Agricultural and Food Trade Reform on Agricultural Capital:
Change from 2015 Baseline 1277.9 Impact of Global Agriculture and Food Reform on Agricultural Land:
Change from 2015 Baseline 1287.10 Net Trade Impacts Assuming Lower Agricultural Productivity in Developing Countries 1297.11 Impacts on Output Assuming Lower Agricultural Productivity for Developing Countries 1297.12 Baseline Trends in Agriculture with Higher Agricultural Productivity in
Middle-Income Countries 1317.13 Baseline Trends in Food Processing with Higher Agricultural Productivity in
Middle-Income Countries 1317.14 Impact of Lower Land Supply Elasticities in Rest of South Asia and Sub-Saharan Africa 1338.1 Average Costs of Producing Cane Sugar, Beet Sugar, and High-Fructose Corn Syrup
by Categories of Producers, and Actual Sugar Prices, 1994–1999 1448.2 Raw Sugar Produced Annually per Sugar Industry Employee, Selected Developing
Countries 1458.3 Major Sugar Producers, Net Exporters and Net Importers, 1999–2001 Average 146
Contents ix

8.4 Government Support to Sugar Producers, 1999–2001 1509.1 Dairy Import Quotas for the Developed Countries under the URAA (1000 tons) 1669.2 Tariff Reductions for Dairy Products under the URAA, by Region
(US$/ton for specific duties, percent for ad valorem tariffs) 1679.3 Full Liberalization of Trade and Domestic Support: Changes from 2005 Baseline 172
10.1 Share of Calories from Rice by Region and Income Level, 2000 17810.2 Leading Rice-Producing, -Consuming, -Exporting, and -Importing Countries 18010.3 Net Rice Trade, 1982–2002 18110.4 Schedule of Tariffs, Tariff Rate Quotas, and Quotas in Rice, 2002–03 Levels 18510.5 Simulation Results for Rice Trade Liberalization Using RICEFLOW, 2000 18711.1 Wheat Production, Trade, and Growth Rates 1989–91 to 1999–2001, by Region 19611.2 Global Wheat and Wheat Products Exports, Selected Periods 19711.3 Tariffs and Tariff Rate Quotas, by Country 20011.4 Average Tariff Rates and Imports for Wheat and Wheat Products 20211.5 Support to OECD Wheat Producers, 1999–2001 20411.6 Major Wheat Exporters’ Shares of Global Wheat Net Exports 20511.7 Producer Support Estimates, 1986–88 and 2000–02 20511.8 Percentage Change of Wheat Production, Area Harvested, Yields, and Net
Exports of Major Exporters from 1990–95 to 1996–2001 20612.1 Production, Use, and Export of Groundnuts, Average 1996–2001 21612.2 Costs of and Revenues from Groundnuts in China and the United States 21712.3 Value of Net Exports, by Groundnut Product, 1996–2000 21812.4 Share of Groundnut Products in Total Merchandise Exports 22012.5 U.S. Producer Support Prices for Groundnuts, 1993–94 to 1998–99 22212.6 U.S. Aggregate Support to Groundnuts, 1986–88 to 2000–01 22312.7 U.S. Edible Groundnut Tariff Rate Quota Allocation, 1995–2008 22312.8 U.S. Over-Quota Tariffs, 1994–2008 22412.9 U.S. Imports of Edible Groundnuts 22412.10 Groundnut Trade Policy Distortions in Argentina, China, and India 22512.11 Tariffs on Groundnut Products in The Gambia, Malawi, Nigeria, Senegal,
and South Africa 22712.12 Average Tariffs on Edible Unprocessed and Processed Groundnuts 22812.13 Welfare Effects of Policy Scenarios, 1999–2001 Average 22912.14 Impact of Different Liberalization Scenarios on Groundnut Trade and Prices 23013.1 World Fruit and Vegetable Imports, 1980–2001 23913.2 Average Annual Growth Rates in World Import Volumes, 1980–2001 24113.3 Import and Export of Fruits and Vegetables by Region or Country 24213.4 Concentration of Fresh Fruit and Vegetable Exports among Developing Countries, 2001 24413.5 Concentration of Processed Fruit and Vegetable Exports among Developing Countries 24513.6 Export Subsidy Expenditures for Horticultural Products 24513.7 Applied MFN Tariffs for Fresh Fruit and Vegetables in the Quad Countries,
1999 and 2001 24613.8 Percentage of Tariff Lines on Fresh Fruits and Vegetables in Selected OECD
Countries by Tariff Levels 24713.9 Percentage of Tariff Lines on Processed Fruits and Vegetables in Selected OECD
Countries by Tariff Levels 24813.10 Percentage of Tariff Lines at Different Levels in Selected Developing Countries, 2001 25014.1 Cotton’s Importance to Developing and Transition Economies, 1989–99 Average 26214.2 Direct Government Assistance to Cotton Producers, 1997–98 to 2002–03 26514.3 Government Assistance to U.S. Cotton Producers, 1995–96 to 2002–03 265
x Contents

14.4 Estimated Effect of Removal of Distortions (Percentage Changer over Baseline) 26915.1 Trade-Weighted Tariff Averages for Developing Countries’ Fish Product Exports
to OECD Countries, by Processing State 28515.2 Simulated Changes in the Real Value of World Exports in 1995 Prices (percent) 28915.3 Simulated Benefits from Tariff Reductions, by Country 28915.4 Effects of Relaxing Trade Barriers 29115.5 Effects of a Rise in the Price of Cultivated Fish on Aquaculture Output and
Fisheries Catch If Feed Is Held Constant 29215.6 Effects on Price and Quantities of Market Liberalization: Relaxing Border
Measures in the Importing Country 29216.1 The Changing Structure of the Coffee Market 29816.2 Coffee Production, Selected Years 29916.3 Coffee’s Importance to Developing Countries, 1997–2000 Averages 30416.4 Per Capita Coffee Consumption of Major Consumers, 1993–99 308
Contents xi

xiii
ACKNOWLEDGMENTS
This book is a joint effort by the Prospects Group inDEC and the Trade Group in PREM. Support hasbeen given by the trade group in DECRG andthrough the Knowledge for Change (KCP) trustfunds. Supporting donors for KCP include Canada,Finland, Norway, Sweden, Switzerland, the UnitedKingdom, and the European Commission.
The completion of this book would not havebeen possible without the help of numerous col-leagues inside and outside of the World Bank. Col-leagues in the Development Prospects Group andthroughout the Development Economics Vice Pres-idency and the World Bank’s operational units pro-vided critical help and feedback. Support by theformer and current Chief Economists, NicholasStern and Francois Bourguignon was instrumental.Bernard Hoekman supported this project in all itsstages, and without his support this book wouldnot have happened. We are particularly grateful forthe ideas and insights of Uri Dadush, HansTimmer, Richard Newfarmer, Will Martin, YvonneTsikata, John Redwood, Kutlu Somel, TercanBaysan, and especially to John Nash, Kevin Cleaver,Sushma Ganguly, Cornelis Van Der Meer, andtheir colleagues in the Agricultural and Rural
Development Department that reviewed the manu-script and helped to improve it.
We also benefited from presentations and feed-back at the 2003 World Bank ABCDE Conferencein Paris; to the board of Executive Directors of theWorld Bank; at the World Bank’s internationaltrade workshop, the WTO, UNCTAD, FAO, the2003 World Outlook Conference at the OECD inParis, the 2003 American Agricultural EconomicsMeetings in Montreal, the European Commission,the French Ministry of Agriculture; and at the Uni-versity of California at Berkeley. Outside the Bank,we would like to particularly thank Bruce Babcock,Pierre Bascou, Jean Christophe Bureau, TassosHaniotis, Chad Hart, David Roland-Holst, DanielSumner, Peter Timmer, and Pat Westhoff for discus-sions and comments that helped to shape our views.
Finally, we would like to thank Baris Sivri whocarried out most of the data work for the book, toMeta de Coquereaumont and Steven Kennedy forediting the manuscript and making it readable, toAwatif Abuzeid and Cathy Rollins for preparingthe manuscript in record time, and to SantiagoPombo-Bejarano and Mary Fisk for managing thepublishing process.


xv
CONTRIBUTORS
M. Ataman Aksoy has recently retired from theProspects Group of Development Economics atthe World Bank and is now a Consultant at theWorld Bank in Washington, D.C.
John Baffes is Senior Economist in the ProspectsGroup of Development Economics at the WorldBank in Washington, D.C.
John C. Beghin is Professor, and Martin ColeEndowed Chair for the Department of Econom-ics and Center for Agricultural and Rural Devel-opment at Iowa State University in Ames.
Paul Brenton is Senior Economist in the TradeDepartment of the World Bank in Washington,D.C.
Tom Cox is Professor in the Agricultural andApplied Economics Department at the Univer-sity of Wisconsin in Madison.
Ndiame Diop is Economist in the Trade Depart-ment of the World Bank in Washington, D.C.
Harry de Gorter is Associate Professor of Agricul-tural Economics at Cornell University in Ithaca,New York.
Spencer Henson is Professor of Economics in theDepartment of Agriculture, Economics, andBusiness at the University of Guelph in Canada.
Takako Ikezuki is Junior Professional AssociateEconomist in the Trade Department of theWorld Bank in Washington, D.C.
Steven M. Jaffee is Senior Economist in the TradeDepartment of the World Bank in Washington,D.C.
Bryan Lewin is Consultant in the Agriculture andRural Development Department of the WorldBank in Washington, D.C.
Myles Mielke is Senior Commodity Specialist inBasic Foodstuffs Service at Commodities andTrade Division of the Food and AgricultureOrganization of the United Nations in Rome,Italy.
Donald O. Mitchell is Lead Economist in theProspects Group of Development Economics atthe World Bank in Washington, D.C.
Cathy A. Roheim is Professor of Economics in theDepartment of Environmental and NaturalResource Economics at the University of RhodeIsland.
Mirvat Sewadeh is Consultant in the TradeDepartment of the World Bank in Washington,D.C.
Baris Sivri is Consultant in the DevelopmentEconomics Group of the World Bank inWashington, D.C.
Dominique van der Mensbrugghe is Lead Econo-mist in the Prospects Group of DevelopmentEconomics at the World Bank in Washington,D.C.
Panos Varangis is Lead Economist in the Agricul-ture and Rural Development Department of theWorld Bank in Washington, D.C.
Eric J. Wailes is the L. C. Carter Professor in theDepartment of Agricultural Economics andAgribusiness at University of Arkansas inFayetteville.
Yong Zhu is a Research Associate in the Agricul-tural and Applied Economics Department atUniversity of Wisconsin in Madison.


Acronyms andAbbreviations
ABARE Australian Bureau of Agriculturaland Research Economics
ACP Africa, Caribbean, and Pacific ACPC Association of Coffee-Producing
Countries AFIPEK Kenya Fish Processors and
Exporters Association AGOA African Growth and
Opportunity Act AGRM Arkansas Global Rice Model AMAD Agricultural Market Access
DatabaseAPEC Asia Pacific Economic
Cooperation APTA Andean Trade Preference Act BAAC Bank for Agriculture and
Agricultural Cooperatives BULOG Nacional Logistics Agency
(Indonesia) CAP Common Agricultural
Policy (EU) CBERA Caribbean Basin Economic
Recovery ActCIMMYT Internacional Maite and Wheat
Improvement Center CMO Common Market Organization Conasupo Compania Nacional de
Subsistencias Populares (Mexico) CTE Committee on Trade and the
Environment (WTO) EBA Everything But Arms (EU)EEZ exclusive economic zonesEPA economic partnership agreementsEU European UnionEVSL early, voluntary sector-
liberalization FAIR Federal Agricultural Improvement
and Reform Act (U.S.) FAPRI Food and Agricultural Policy
Research Institute FAO Food and Agriculture
Organization of the UnitedNations
FSU Former Soviet Union FTA free trade agreement GAP good agriculture practiceGATT General Agreement on Tariffs
and Trade GBC Guatemalan growers association GDP gross domestic product GSP generalized system of preferencesGTAP Global Trade Analysis Project HACCP hazard analysis and critical
control point HFCS high-fructose corn syrup HS harmonized system IADB Inter-American Development
BankICAC International Cotton Advisory
Committee ICO International Coffee Organization LDC least-developed countriesMAFF Ministry of Agriculture, Forestry,
and Fisheries (Japan) MFN most-favored nationMPS market price supportNAFTA North American Free Trade
AgreementODA official development assistance OECD Organisation for Economic
Co-operation and DevelopmentOPEC Organization of Petroleum
Exporting Countries PIPAA Integrated Program for
Agricultural and EnvironmentalProtection
PROCAMPO Programa de Apoyos Directos alCampo
PROMPEX Peruvian Commission for ExportPromotion
PS&D Production supply anddistribution
PSE producer subsidy equivalents SACU Southern Africa Customs UnionSAM social accounting matrix SMP skim milk powder
xvii

xviii Acronyms and Abbreviations
TCK tilletia controversa kuhn fungusTRQ tariff rate quotaUKP UzKhlopkoprom/
UzPakhtasanoitishUNCTAD United Nations Conference on
Trade and Development UNEP United Nations Environment
ProgrammeURAA Uruguay Round Agreement on
Agriculture USAID United States Agency for
International Development
USFDA United States Food and DrugAdministration
USGAO United States General AccountingOffice
USDA United States Department ofAgriculture
USITC United States International TradeCommission
UW-WDM University of Wisconsin-MadisonWorld Dairy Model
VAT value-added tax WTO World Trade Organization

those leaving the farm, growth and modernizationof agriculture create jobs in agricultural processingand marketing, as well as the expansion of othernonfarm jobs.
Although most successful developing countrieshave not relied on agriculture for export expansionand growth, growth in agriculture has a dispropor-tionate effect on poverty because more than half ofthe populations in developing countries reside inrural areas and poverty is much higher in ruralareas than in urban areas. Some 57 percent of thedeveloping world’s rural population lives in lower-middle-income countries, and 15 percent lives inthe least-developed countries. Even though histo-rical trends show that agriculture’s importancediminishes over time and the share of populationin rural areas declines, there will still be more poorpeople in rural areas than in cities for at least ageneration.
Why This Book?
This book explores the outstanding issues in globalagricultural trade policy and evolving worldproduction and trade patterns. Its coverage of agri-cultural trade issues ranges from the details ofcross-cutting policy issues to the highly distortedagricultural trade regimes of industrial countries
In recent years, agricultural protection and itsimpact on developing countries have attractedgrowing attention. While manufacturing protec-tion has declined worldwide following substantialreforms of trade policies, especially in developingcountries, most industrial and many developingcountries still protect agriculture at high levels.Agricultural protection continues to be among themost contentious issues in global trade negotia-tions, with high protection in industrial countriesbeing the main cause of the breakdown of theCancún Ministerial Meetings in 2003.
Why Highlight Agriculture?
What happens in the global agricultural market isimportant for developing countries beyond theprice changes triggered by global reforms. For coun-tries with a small urban population, increasing agri-cultural exports can accelerate growth more thanexpanding domestic market demand can. Althoughfood production for home consumption and sale indomestic markets accounts for most agriculturalproduction in the developing world, agriculturalexports and domestic food production are closelyrelated. Export growth contributes significantly tothe growth of agriculture overall by generating cashincome for modernizing farming practices. For
1
1
INTRODUCTIONAND OVERVIEW
M. Ataman Aksoy and John C. Beghin

and detailed studies of agricultural commoditiesof economic importance to many developing coun-tries. The book brings together the backgroundissues and findings to guide researchers and policy-makers in their global negotiations and domesticpolicies on agriculture. The book also explores thekey questions for global agricultural policies, boththe impacts of current trade regimes and the impli-cations of reform. It complements the recent agri-cultural trade handbook that focuses primarily onthe agricultural issues within the context of theWorld Trade Organization (WTO) negotiations(Ingco and Nash 2004).
The first part of the book replies to the broad,cross-cutting questions raised by researchers andpolicymakers about agricultural trade regimes andtrade performance. What has happened to thestructure of agricultural trade over the last twodecades? What is the level of protection acrosscommodities and countries? Do tariff preferencesmake a big difference in the levels of protection fac-ing developing-country agricultural products? Hasthe move toward decoupling agricultural supportfrom production reduced the effects of agriculturalsupport? Do stricter food safety standards consti-tute a new barrier to market access by developingcountries? How big are the potential gains fromglobal liberalization, and how sensitive are esti-mates to various assumptions? While these topicshave been analyzed before, much of the work hererelies on new information. The answers to thesequestions give a clearer picture of global agricul-tural policies and reforms.
However, broad answers to these questions typi-cally do not convince the critics and, more impor-tant, provide little implementable guidance onspecific policy issues. Micro details and partialequilibrium analyses at country and commoditylevels are necessary to ensure that these broadresults are credible and specific enough to be a basisfor policies. The second part of the book comple-ments the broad answers with detailed studies ofcommodities that are of considerable economicimportance to many developing countries and thatare representative of the export bundle of develop-ing countries. The commodities selected are sugar,dairy, rice, wheat, groundnuts, fruits and vegeta-bles, cotton, seafood, and coffee. Most of the prod-ucts selected have highly distorted policy regimesin industrial and some developing countries. The
general issues of competition, entry, and exit, whichare major issues for products with distorted poli-cies, are equally important for the less-protectedtraditional export products such as coffee, tea, andcocoa. Exporters of such products still face long-term price declines, price volatility, and otherproblems usually associated with products with dis-torted policy regimes. Seafood also faces fewer tradedistortions but is included as representative of theproblems facing new, expanding sectors in the pres-ence of domestic subsidies in industrial countries.
The commodity studies analyze the currenttrade regimes in key producing and consumingcountries, document the magnitude of distortionsin these markets, and assess the distributionalimpacts (across countries and across groups of con-sumers, taxpayers, and producers within countries)of trade and domestic policy reforms in developingand industrial countries. These assessments arebased on rigorous quantitative analyses of variousreform scenarios and disaggregated partial equilib-rium models. The impacts of current agriculturaltrade policies and of policy reforms vary substan-tially across commodities, and different reformsresult in very different gainers and losers.
Some Key Findings
Despite the diversity of the cross-cutting analysesand commodity studies, it is possible to draw somegeneral conclusions. First, these commodity mar-kets exhibit a complex political economy, bothdomestically and internationally. The arcane natureof many policy interventions in these commoditymarkets and the many heterogeneous interests exac-erbate this complexity. Identifying superior policyoptions is not difficult, but the feasibility of reformdepends on the power of vested interests and theability of governments to identify tradeoffs and pos-sible linkages that will allow them to pursue multi-ple goals (food security, income transfers, expansionof domestic value added) more efficiently.
Second, a narrow sectoral or product approachis unlikely to be fruitful in WTO negotiations. Thecommodity studies illustrate why. They also illus-trate that potential tradeoffs exist even within agri-culture, as interests differ across commodities.
Third, and perhaps most important, the studiesreveal the importance of microanalysis for identify-ing both the key policy instruments that distort
2 Global Agricultural Trade and Developing Countries
competition and the likely winners and losers fromglobal reforms (producers, consumers, taxpayerswithin and across countries). Knowing who is likelyto gain or lose from reform is critical for sequenc-ing reforms and putting in place complementarypolicies, including assistance to reduce the cost ofadjustment in noncompetitive sectors.
Fourth, the studies identify trade distortions(border protection) and domestic subsidies asmajor factors affecting world markets and thusdeveloping-country consumers and producers. Acommon theme is that border protection is moredistorting in most markets, with the notable excep-tions of cotton and seafood (corroborating the find-ings of Hoekman, Ng, and Olarreaga 2002). Bothdomestic subsidies and border protection con-tribute to making commodity markets artificiallythin, with small trade volumes and a small numberof agents, in turn leading to high variability in pricesand trade flows. Large trade distortions impedetrade flows, depress world prices, and discouragemarket entry or delay exit by noncompetitive pro-ducers. Border barriers are high in most of the com-modity markets studied (the exceptions are cotton,coffee, and seafood), including industrial countriesand many developing countries. For example, theglobal trade-weighted average tariff for all typesof rice is 43 percent and reaches 217 percent forJaponica rice. Many Asian countries remain bas-tions of protectionism in their agricultural and foodmarkets.
Subsidies have similar effects, depressing worldprices and inhibiting entry by inducing procyclicalsurplus production by noncompetitive (often large)producers. In dairy and sugar markets, the effects ofexport subsidies have been smaller than those oftariffs and tariff rate quota schemes, partly becauseof the export subsidy disciplines introduced in theUruguay Round Agreement on Agriculture. Manydomestic subsidies in Organisation for EconomicCo-operation and Development (OECD) coun-tries, such as cotton subsidies in the United States,are countercyclical.
Domestic support and protection policies havesubstantial negative effects on producers in devel-oping countries, because of the sheer size of thesubsidies relative to the size of the market. Cottonsubsidies in the United States and European Union(EU), for example, reached $4.4 billion in a $20 bil-lion market. Such large subsidies shield noncom-
petitive producers from exit decisions, makingdecoupling of these policies a moot point. If U.S.cotton subsidies were abolished, revenues for cot-ton farmers in West and Central Africa wouldincrease by some $250 million. Total official devel-opment assistance (ODA) to the region in 1999 was$1.9 billion, 15–25 percent of which typically goesto agricultural assistance, not all of it directly reach-ing producers. One can see the incompatibilitybetween ODA and farm policy in donor countriesthat subsidize their rich farmers.
Fifth, a development strategy based on agricul-tural commodity exports is likely to be impoverish-ing in the current agricultural policy environmentin which policymakers in many countries havemercantilist and protectionist reflexes that, whenaggregated, compromise world trade in agriculturaland food products. The emergence of competitiveproducers in developing countries does not lead toa rationalization of production among noncom-petitive producers as it would in a liberalizedmarket. Instead, noncompetitive producers remainin business, buffered by extensive protection andsupport.
Potential Winners and Losersfrom Trade Liberalization
Agricultural trade liberalization would create win-ners and losers. The studies conclude that reformwould reduce rural poverty in developing eco-nomies, both because in the aggregate they have astrong comparative advantage in agriculture andbecause the agricultural sector is important forincome generation in these countries.
Resource reallocation within agriculture wouldbe substantial. For example, production of ground-nut products in India would likely contract as wouldvegetable oil production in China, but dairy produc-tion and exports would expand in India, and riceproduction and exports would expand in China.Liberalization of value-added activities is crucial forexpanding employment and income opportunitiesbeyond the farm gate. Such findings illustrate theimportance of a multicommodity approach toreform, as gains and losses will differ by market.They also illustrate the importance of social safetynets and other complementary policies.
Consumers in highly protected markets willbenefit greatly from trade liberalization as domestic
Introduction and Overview 3

(tariff-inclusive) prices fall and product choiceexpands. Consumers in poor, net-food-importingcountries could face higher prices if these marketswere not protected before liberalization, because ofhigher import unit costs. In practice, however, suchconcerns have often been exaggerated. For example,dairy consumption in the Middle East and NorthAfrica would be little affected by trade liberaliza-tion because, while world prices would rise, highimport tariffs would be removed, so that the netimpact on dairy consumer prices would be negligi-ble. Consumer prices would rise for rice, however,since the removal of low tariffs would not offset theincrease in border prices.
Other winners and losers would also emerge.Multilateral trade liberalization erodes the benefitsfrom preferential bilateral trade agreements andpits low-cost producers in some developing coun-tries (such as sugar producers in Brazil andThailand) against less efficient producers in theleast-developed countries who are currently helpedby preferential access. The actual gains from suchpreferences, however, have been smaller thanexpected because of efficiency differences.
How these reforms occur will have importantconsequences for developing countries. The bestapproach is coordinated global liberalization ofpolicies. This approach would yield the largest priceincreases to offset some of the lost rents. For exam-ple, world sugar price increases alone would offsetabout half the lost quota rents, or about $0.45 bil-lion, for countries with preferential access. Theanalysis shows that losses in rents would be muchless than is commonly expected, because high pro-duction costs eat up much of the potential benefitfrom preferential access to the high-price markets.Moreover, the cost to the European Union and theUnited States of each $1 in preferential access isestimated at more than $5, a very inefficient way toprovide development assistance. Global liberaliza-tion of primary commodity markets should beaccompanied by further effective opening of value-added markets, along with some targeted assistanceto overcome supply constraints. Supply constraintsare particularly acute in Africa and some LatinAmerican countries but are not insurmountable, assuccess stories in horticultural and seafood marketsin Kenya show.
Although the commodity case studies provideevidence that higher market prices would prevail in
traditional agricultural commodity markets (sugar,cotton, dairy, groundnuts, rice, and to a lesserextent, wheat) if trade and domestic distortionswere removed, prospects of continuing high pricesare limited because of the nature of these markets(a large number of low-cost competitors andinelastic demand). The bulk-commodity route toexport expansion requires low-cost conditions andachievement of economies of scale. These marketsface a long-term decline in prices as economies ofscale and competitive pressures yield lower costsand margins. Domestic farm subsidies in industrialcountries have exacerbated this low-price tendencyby fostering production beyond what free marketswould demand, with dramatic immiserizing conse-quences in some cases, such as cotton.
Better opportunities exist in new markets suchas horticulture and seafood and in more differenti-ated products (niche coffee markets, confectionarypeanuts). The high-quality differentiated-productalternative requires quality upgrades and the neces-sary infrastructure and institutions to certify prod-ucts. These new markets imply increased costs tomeet quality standards and higher rewards. Pro-ducers have to be able to demonstrate quality, aninstitutional challenge in many countries. This sec-ond strategy can be successful only when supplyconstraints are alleviated. Trade barriers also existin these new markets, especially with higher safetystandards. However, while the findings show thatfood safety standards are becoming more stringent,the view that standards are simply new barriers totrade has been somewhat oversold.
What the Book Covers
Part 1 contains six chapters on cross-cutting issues,and Part 2 includes nine commodity studies. Whilethe chapters in Part 1 are sequenced to provide adetailed picture of cross-cutting issues in globalagricultural trade, they can be read individually asself-contained pieces. The accompanying CD-ROMcontains detailed supplementary tables and annexes.
Changes in Agricultural Trade Flows
Chapter 2, “The Evolution of Agricultural TradeFlows,” by Ataman Aksoy, gives a bird’s-eye view ofthe changes in global agricultural trade flows sincethe early 1980s and contrasts these with the pro-gressive global integration of manufacturing. World
4 Global Agricultural Trade and Developing Countries

trade in agriculture, broadly defined throughoutthe book to include seafood, processed foods, andsome agro-processing such as wine and tobaccoproducts, was $467 billion in 2001–01, up from$243 billion in 1980–81. During the 1980s realmanufacturing and agriculture exports expanded atsimilar rates of 5.7 and 4.9 percent a year. However,during the 1990s real agricultural export growthdecelerated to 3.7 percent a year, falling well behindthe 6.7 percent annual growth in manufacturing.
Developing countries increased their share inmanufacturing exports during the 1990s but sawlittle expansion in agricultural exports, barely main-taining their share of around 36 percent after losingmarket shares during the 1980s. All of their gains inagriculture during the 1990s came from expansionof their exports to other developing countries. Morethan 48 percent of world agricultural trade is stillaccounted for by trade between industrial coun-tries—about the same share as in 1980–81.
This stability of trade shares comes as a surprise,since it was during the 1990s that Uruguay Roundcommitments in agriculture began to be imple-mented and rapid trade reforms were introduced indeveloping countries. More than a third of worldagricultural exports are traded within EU membernations and among the three signatories of theNorth American Free Trade Agreement (NAFTA).
Low-income countries’ agricultural tradesurpluses against both middle-income and indus-trial countries has increased. Low-income develop-ing countries now export more to middle-incomecountries than they do to the European Union, theirlargest export market in the early 1980s. The agri-cultural trade surpluses of middle-income countrieshave diminished. Among industrial countries, Japanhas the largest agricultural trade deficit (almost$50 billion in 2000–01); the European Union, oncethe largest net buyer of agricultural commodities,has seen its deficits decline; and NAFTA’s trade sur-plus has shrunk considerably. Developing-countryregions, after losing market shares during the 1980s,regained most of them by the end of 1990s. Theonly exception is Sub-Saharan Africa, which lostmarket shares during the 1980s and did not regainthem during the 1990s.
The structure of world trade has changed, espe-cially for developing countries. Nontraditionalproducts, especially seafood and fruits and vegeta-bles, now constitute almost half their exports. Also,
exports of temperate-climate products (grains,meats, dairy products, edible oils and seeds, andanimal feed) have surpassed exports of traditionaltropical products (coffee, tea, cocoa, textile fibers,sugar, and nuts and spices). More important,exports of fruits and vegetables are now greaterthan total exports of traditional products. Seafoodexports are larger still, with a growing portion ofexports coming from aquaculture.
State of Agricultural Protection
Chapter 3, “Global Agricultural Trade Policies,” byAtaman Aksoy, summarizes the state of agriculturalprotection, using data on domestic support policiesfrom the OECD and tariff data from the WTO for alarge set of developing and industrial countries.The analysis of experience with the new rules onmarket access, export subsidies, and domestic sup-port indicates that the effects of implementation ofthe Uruguay Round Agreement on Agriculturehave been modest. Within OECD countries, pro-ducer support in agriculture was about $230 billionin 2000–02, or almost 46 percent of productionvalue (evaluated at world prices), down fromapproximately 63 percent in 1986–88, but still veryhigh. Of producer support, 63 percent camethrough higher prices associated with border pro-tection (so-called Market Price Support or MPS)and 37 percent from direct subsidies.
While protection remained high in industrialcountries, many developing countries have signifi-cantly liberalized their agricultural sectors since theearly 1980s. Average agricultural tariffs, the mainsource of protection in developing countries,declined from 30 percent to 18 percent during the1990s. In addition, these countries eliminatedimport restrictions, devalued exchange rates, aban-doned multiple exchange rate systems that penal-ized agriculture, and eliminated almost all exporttaxes. As overall taxation of agriculture declinedin developing countries, reactive protection inresponse to industrial-country support to agricul-tural producers increased, especially in food prod-ucts. All these measures increased incentives foragricultural production in many developing coun-tries. However, without compensating reductionsin protection in industrial and some middle-income countries, the result was overproduction(beyond competitive and undistorted market
Introduction and Overview 5

levels) and price declines for many commodities,reducing opportunities for competitive developingcountries to expand exports and rural incomes.
The structure of agricultural tariffs is compli-cated and nontransparent. More than 40 percent ofthe agricultural tariff lines in the European Unionand the United States contain specific duties, whichmake it difficult to calculate average tariffs, obscuretrue levels of protection, and penalize developingcountries that supply cheaper products. Specificduties, which are rare in manufacturing, are alsoused to hide high rates of protection in agriculture.The ad valorem equivalents of specific duties, whenthey can be measured, are much higher than theaverage ad valorem duties. Also, a much higher pro-portion of tariff lines in final products than in rawand intermediate products have specific rates. Low-income countries have more transparent tariffregimes and tend to use ad valorem tariffs.
Average agricultural tariffs in industrial coun-tries, when they can be measured, are some two tofour times higher than manufacturing tariffs.Developing-country exports confront tariff peaksas high as 500 percent in some industrial countries.High variance and high peaks make it difficult tomeasure the real impact of protection on key prod-ucts, whose high tariff rates are buried in loweraverage tariffs. This is why the OECD measure ofprotection, market price support, which compareslocal and international prices, shows much higherrates of protection than do average tariffs. Tariffsalso increase by the degree of product processing,creating an escalating tariff structure that impedesaccess to processed food markets. In addition,almost 30 percent of domestic production in OECDcountries is protected by tariff rate quotas.
Trade Preferences
Industrial countries have established tariff prefer-ence schemes to create market access opportunitiesfor developing countries, especially for low-incomecountries. In chapter 4, “The Impact of AgriculturalTrade Preferences on Low-Income Countries,” PaulBrenton and Takako Ikezuki examine the impactsof these preferences. For most developing coun-tries, preferences have provided limited gains atbest. Many agricultural products exported fromdeveloping countries, especially traditional tropicalproducts, are subject to zero duties in industrial
countries, so tariff preferences are irrelevant.Although duties on other primary agriculturalproducts and processed products are often veryhigh, few of these products receive preferences.Nevertheless, for a small number of productssubstantial preferences are available for certaincountries, usually within strict quantitative limits.Countries that produce sugar and tobacco, forexample, have received large transfers as a result ofthese preferences.
Comparison of different preference schemes isdifficult because the schemes differ substantially.They differ in the group of eligible countries, theproducts covered, the size of the preferencesgranted, and administrative requirements, espe-cially rules of origin. These differences are a majorweakness of the current system of preferences. Dif-ferences between preference schemes constrain theability of developing-country suppliers to developglobal market strategies.
In general, preferences are unilateral concessionsby industrial countries. The agreements requirerenewal, and specific products can be withdrawn atshort notice. This uncertainty has impeded newinvestment. The most highly protected products,which would have the highest potential margins ofpreference, are often excluded or preferences aresmall. Rules of origin for processed products oftenconstrain the ability of countries to expand intothese products.
The value of preferences is largest in the EU mar-ket, driven mainly by the very high EU prices forsugar. For some countries, such as Mauritius, prefer-ences seem to explain at least part of the relativelystrong economic performance and economic diver-sification. For the majority of low-income coun-tries, however, EU, Japanese, and U.S. preferenceshave had little impact and have done little to stimu-late the export of a broader range of products.
Decoupling Agricultural Support
One key challenge is to lower the effect of domesticsubsidies on world production and prices. Althoughofficial export subsidies may be small and shrink-ing, implicit export subsidies created by domesticsupport are increasing, lending unfair advantage toproducers in industrial countries. More generally,there is a move toward supporting agriculturethrough direct subsidies rather than through border
6 Global Agricultural Trade and Developing Countries

barriers. Some domestic support to agriculture hasmoved away from being directly linked to produc-tion to being partially decoupled, with paymentsmade based on historical production levels andother mechanisms. Decoupling should reduce theoutput effects of support and thus increase worldprices for the exports of developing countries. Themove to decoupled agricultural support policies istherefore a step in the right direction.
How much has the world actually moved todecoupled payments? What has been the net effecton resource use, efficiency, and trade distortions? Inchapter 5, “Experience with Decoupling Agricul-tural Support,” John Baffes and Harry de Gorterevaluate the impact of decoupling measures inindustrial and developing countries. From 1986–88to 2000–02, domestic subsidies paid to farmers inOECD countries increased 60 percent. Output andinput subsidies (“large” impact programs) increasedmoderately compared with the substantial increasesin payments linked to land area or number of ani-mals, decoupled historical entitlements, or inputuse and overall farm income (“smaller” impact pro-grams). Payments based on area planted and num-ber of animals have increased most, followed by his-torical entitlements.
The United States took the first step towarddecoupling in the 1985 Farm Bill, which shifted thebase of support from current yields to historicalyields. In the 1996 Farm Bill the United Statesreplaced deficiency payments with decoupled sup-port. The European Union partially replaced inter-vention prices with decoupled payments followingthe Common Agricultural Policy reform of 1992.Mexico replaced price supports with decoupledpayments in 1994 with the introduction of theNational Program for Direct Assistance to RuralAreas (Programa de Apoyos Directos al Campo[PROCAMPO]). More recently, Turkey replacedsome price supports and input subsidies withdecoupled payments. In addition to broad decou-pling attempts, there have been numerous one-timebuyouts, including New Zealand’s exit grant in1984, the buyout of Canada’s grain transportationsubsidy in 1995, and the buyout of the U.S. peanutmarketing quota under the 2002 Farm Bill.
Experience designing and implementing theseprograms has been mixed. Although decoupling hasled to a reallocation of resources in agriculture, itseffects have been modest. In many cases, overpro-
duction has continued. One-time buyouts have hadgreater success in eliminating very inefficientarrangements, but their range is limited. More atten-tion should be given to constraints on input use,government credibility, other support programs,and time limits. Unless these aspects are addressed,decoupled support is likely to have the same kinds ofundesirable effects as other subsidy programs. Pay-ments should be time limited, provided only to helpproducers adjust. The European Union and Turkeyhave no time limit. The United States had (at leastimplicitly) a time limit in the 1996 Farm Bill butviolated it three years later. Mexico has a time limitand has complied with it so far.
The coexistence of coupled and decoupled pro-grams means that incentives to overproduceremain. In the four decoupling cases examined, alleither left some coupled support programs in placeor added new ones. Eligibility rules need to be fixedand clearly defined. Updating the bases for pay-ment of subsidies and adding crops results in a gov-ernment credibility problem and reduces the effectof the decoupling programs.
Food Product and Safety Standards
With the decline in traditional barriers to trade,attention has focused on the potential role of stan-dards as technical barriers to trade. Zero-dutyaccess means little if countries cannot meet prod-uct standards. Chapter 6, “Agro-Food Exports fromDeveloping Countries: The Challenges of Stan-dards,” by Steven M. Jaffee and Spencer Henson,provides an overview of the impact of food safetyand agricultural health standards on developingcountry agro-food exports. Standards have becomean increasingly important influence on the interna-tional competitiveness of developing countries,especially in the context of high-value agriculturaland food products. Some well-established sectorsthat are highly export dependent have been hurt bynew and stricter standards. In several cases, devel-oping countries have faced restrictions because oftheir inability to meet food safety or agriculturalhealth requirements. At the same time, other devel-oping countries have gained access to high-valuemarkets in industrial countries despite thesestricter standards.
The evidence in this chapter suggests a less pes-simistic picture for developing countries than that
Introduction and Overview 7

commonly presented, which sees standards as bar-riers to developing-country trade. Rising standardsaccentuate underlying supply chain strengths andweaknesses and thus have different effects on thecompetitive position of different countries. In thisperspective, food safety measures must be viewedwithin the context of more general capacityconstraints.
Much of the impetus for stricter food safety andagricultural health standards is coming from con-sumer and commercial interests, magnified byadvances in technology and new security concerns.Thus prospects are slim for slowing this movementor allowing poorer countries to meet lower stan-dards. Developing countries need to find ways todevelop and improve food safety and agricul-tural health management systems to meet thesestandards.
A crucial need is for management capacity, notonly to comply with the different requirements indifferent markets but also to demonstrate thatcompliance has been achieved. While many coun-tries have struggled to meet ever-stricter standards,even some very poor countries have managed toimplement the necessary capacity, especially wherethe private sector is well organized and the publicsector supports the efforts of exporters. Many poorcountries have successfully entered the demandingseafood and fresh fruit and vegetable markets. Mostviolations reported at border controls involve fail-ures to meet simple hygiene standards.
There is no single model for all countries striv-ing to meet the challenges posed by standards.Institutional frameworks are required, however, toovercome the problems associated with being pooror small. These can include outgrower1 programsfor smallholder farmers, systems of training andoversight for small and medium-size enterprisesestablished through associations and other groups,and twinning and regional networking for smallcountries. Such efforts undoubtedly need to beimproved and refined, but they offer useful guid-ance on effective ways to proceed.
The chapter clearly demonstrates the need fordeveloping countries to be proactive when facingnew food safety and agricultural health standards.By thinking strategically, countries can programcapacity enhancement into wider and longer-termefforts to enhance domestic food safety and agri-cultural health management systems and export
competitiveness. Failing this, countries face theneed for potentially large-scale investments overlong periods of time to remedy violations of stan-dards as they arise. In all of this, the public and pri-vate sectors need to work together to identify themost efficient and effective ways to develop capac-ity. Food safety and agricultural health controlsmust be seen as a collaborative effort in a systemthat is only as strong as its weakest link.
Welfare Gains from Global Agricultural Reform
Given the magnitude of the distortions in agricul-tural sectors in all countries, an obvious questionconcerns the net impact of status quo policies andof global reform. Models of global trade anddomestic policy reforms often yield very largewelfare gains for both industrial and developingcountries. Critics argue that many of the assump-tions of these studies are exaggerated and thattheir results should be treated with caution. Inchapter 7, “Global Agricultural Reform: What Is atStake?” Dominique van der Mensbrugghe and JohnC. Beghin look beyond the estimates of aggregatewelfare gains to structural changes that wouldemerge from multilateral trade liberalization inagricultural and food markets, including cross-regional patterns of output and trade. They addresssome of the common criticisms of these aggregatemodels and explore the implications for welfare,trade, output, and value added of changing keymodeling assumptions. The real gains oftenamount to 1 percent or less of base income,whereas the structural changes (resource realloca-tion) can be greater than 50 percent. The chapterdecomposes the impacts of partial reforms bothregionally and across instruments to determine theshare of the global gains that comes from reform inindustrial countries and the share from reform indeveloping countries. It also examines the extent towhich border protection and various forms ofdomestic support drive global gains.
The second part of the chapter addresses some ofthe issues raised by critics of trade reform—notably,that the estimated gains for developing countries aretoo optimistic and that the transitional costs forindustrial-country farmers are high and too oftenignored. The analysis looks at three assumptions thatcould influence the level of gains: the consequencesof lowering agricultural productivity growth in
8 Global Agricultural Trade and Developing Countries

developing countries, the impact of constrainingoutput supply response in low-income countries,and the assumptions on the magnitude of tradeelasticities. The chapter also examines the impact oflowering the rate of exit of industrial-country farm-ers, including adjustments to transition.
The results are broadly robust to the range ofsensitivity analyses undertaken, but trade elastici-ties are the most important. Assuming low produc-tivity gains in agriculture in developing countriesleads to a reversal in the estimated impact of globalliberalization for industrial countries, with anincrease in the net food trade surplus. If productiv-ity grows slowly in developing countries, theybecome much larger importers of food and agricul-tural products, and trade reform accentuates thistendency. Low-income developing countries expe-rience an increase in net food trade surplus that ismuch smaller than under the higher productivityassumption. Thus different assumptions aboutproductivity could lead to different conclusionsabout the direction of food self-sufficiency in theaftermath of reform. Supply constraints do notqualitatively affect the estimated impact of tradereform on agricultural output, although estimatedchanges tend to be smaller. Higher trade elasticitiesdampen the adverse terms-of-trade shocks fromreforms, leading to larger income gains and highervariations at the country level.
Commodity Studies
Nine chapters analyze the impact on global marketsof policies for selected commodity groups. Thecommodity groups were selected to provide abroad range of policy environments, to deal withdifferent groups of countries, and to show thediversity of gainers and losers.
Sugar Chapter 8,“Sugar: Opportunity for Change,”by Donald O. Mitchell, looks at the sugar market,one of the most distorted markets in the world. TheEuropean Union, United States, and Japan togetherprotect sugar at some $6.4 billion a year, about thevalue of total developing-country exports. On aver-age, domestic producers in these countries receivemore than triple the world price for their output.Among middle-income countries, Mexico, Poland,Turkey, and almost all beet-producing, northerndeveloping countries also provide significant
support to their producers. Thus 80 percent ofworld production and 60 percent of world tradetake place at prices much higher than world prices.
There are pressures on the European Union andthe United States to reform their sugar marketsbecause of internal market changes and interna-tional commitments already made under NAFTA,the EU Everything but Arms Program, and theUruguay Round Agreement on Agriculture. Theirprotectionism is unravelling, another case ofborder opening forcing domestic policy discipline.Needed reforms could be carried out in conjunc-tion with scheduled reviews of the EU CommonAgricultural Policy in 2006 and expiration of theU.S. Farm Bill in 2007, which could provide a targetperiod for getting reforms agreed on and in place.Japan remains a bastion of protectionism, with tar-iffs, price surcharges, and trade management bystate agencies.
Preferential and regional agreements often barlow-cost producers from entering the internal mar-kets covered by the agreements. Quota allocationsare concentrated in a few, often high-cost countries,which are generally not the poorest. For example,Mauritius has 38 percent of EU quotas. Thailand, avery low-cost producer, is limited to a 15,000 tonquota in the United States, whereas the Philippineshas a quota 10 times larger that often goes unfilled.
Multilateral negotiations provide an opportu-nity to rationalize the proliferation of preferentialagreements, by phasing in multilateral liberaliza-tion and allowing markets to allocate access on acompetitive basis. Reforms would result in a con-traction of output in both industrial countries andbeet-producing developing countries. World priceswould rise by about 40 percent. The big gainerswould be producers in Thailand, Latin America,and southern Africa among developing countriesand Australia among industrial countries. Con-sumers would gain in almost every country, sinceeven competitive producers cover their exportlosses with higher-price domestic sales. The lossesto quota holders, many of them very high-cost pro-ducers, would be much smaller because of theworld price increases.
Dairy In chapter 9, “Dairy: World Markets andthe Implications of Policy Reform for DevelopingCountries,” Tom Cox and Yong Zhu analyze thedairy market, which is the most distorted of all the
Introduction and Overview 9

markets examined in this volume. The sector isdistorted by a complex system of domestic and inter-national trade barriers, including surplus disposal inthe Quad countries (Canada, Japan, the EuropeanUnion, and the United States) and the Republic ofKorea. OECD support totaled $41 billion in 2002,and tariff rates are above 30 percent worldwide. TheQuad countries and Australia and New Zealanddominate the export market. Although Australia andNew Zealand are competitive exporters, with fewdistortions, dairy interest groups in the Quad coun-tries are strongly entrenched. Prospects for policyreforms appear dim, especially in the EuropeanUnion and Japan. Domestic price discriminationschemes in the European Union, the United States,and Canada rely on the ability to close borders, sug-gesting that the emphasis in the Doha Round negoti-ations should be on commitments to lower borderprotection.
Despite high distortion levels, the global dairymarket is dynamic, with much growth potential.Dairy consumption in Asia has been expanding dra-matically with income growth, urbanization, andthe westernization of diets. Innovations in food pro-cessing also contribute to the sector’s dynamism,with new value-added opportunities such as drywhey and lactose, for which trade barriers are low.Innovations have also expanded trade opportunitiesfor traditional milk products such as milk powderand butter-oil, which are transformed into finalproducts after importation to circumvent protec-tion on finished products. Concentration and verti-cal integration in industrial countries are alsoimportant sources of economies in procurement,processing, and logistics and lead to high levels offoreign direct investment. Global reforms couldraise prices by 20–40 percent and lead to productiondeclines in the Quad countries and increases inAustralia, New Zealand, Latin America, and India.
Rice In chapter 10, “Rice: Global Trade, Protec-tionist Policies, and the Impact of Trade Liber-alization,” Eric J. Wailes analyzes rice, the mostimportant food grain in the world. On average, con-sumers in low-income food-deficit countries get28 percent of their calories from rice. Productionand consumption are concentrated in Asia (China,India, and Indonesia). The rice market is a maturemarket, with static demand in industrial countriesand growing demand in developing economies
driven by demographics rather than by incomegrowth. Prospects for growth in trade therefore relyon policy reforms.
Tariff and related border protection are veryhigh, averaging about 40 percent globally and risingto 200 percent in some markets. Support in OECDcountries is almost $25 billion. Support in Japan,expressed in ad valorem form, is a staggering700 percent of world prices. Tariff escalation issystematically practiced (from paddy to milled rice)in many countries. In the European Union thetariff on milled rice (80 percent) is prohibitive,except for small preferential import quotas grantedto a few countries. Tariff escalation is also prevalentin Central and South America. Mexico has a 10 per-cent tariff on paddy rice and a 20 percent tariffon brown and milled rice. This pattern of protec-tion depresses world prices for milled high-qualitylong grain rice relative to prices for brown andrough rice, creating economic hardship for millersof high-quality long grain rice in exporting coun-tries such as Thailand, the United States, andVietnam.
Net rice consumers would be negatively affectedby trade liberalization if the new consumer pricerises with reform. Prices would rise wherever cur-rent ad valorem tariffs are lower than the potentialworld price increase following liberalization, suchas in the Middle East.
Wheat In chapter 11, “Wheat: The Global Mar-ket, Policies, and Priorities,” Donald O. Mitchelland Myles Mielke analyze the world wheat market,which has become less distorted since 1990. Anumber of countries have undertaken reforms uni-laterally or as a consequence of commitmentsunder the Uruguay Round. The European Unionand the United States have ended their export sub-sidies, but other surplus-disposal programs, such asnonemergency food aid and export credits, are stillin place. Most importing countries have reducedtheir tariffs on wheat or allowed duty-free importsfrom regional trading partners and thus benefitfrom low world market prices. A few importers,such as Japan, continue with high levels of protec-tion that raise internal prices to more than fivetimes world market levels.
While wheat trade has become less distorted,tariff escalation is high. Tariffs on flour are wellabove those on wheat, and tariffs on bakery and
10 Global Agricultural Trade and Developing Countries

pasta products are even higher. Consequently, tradein wheat products is confined largely to free-tradeareas such as the European Union and NAFTA.
A major concern for wheat-importing countriesis the lack of assured access to wheat markets inperiods of high prices. In the 1970s the United Statesimposed an export embargo on wheat, to protectdomestic consumers from high world prices. In1995 the European Union imposed an export tax onwheat for a similar reason. Such actions increaseinternational price volatility and reinforce the desirefor self-sufficiency in importing countries. Import-ing countries need to pressure exporting countriesfor assured market access as part of the Doha Roundof multilateral trade negotiations.
OECD countries still provide substantial sup-port to wheat producers, but the production effectshave been partially offset by land set-aside pro-grams and by the way support is provided. Globalliberalization is expected to raise world wheatprices by a relatively small amount (5–10 percent)because of large surplus capacity in majorexporters. This capacity could return to productionfollowing policy reforms, preventing prices fromrising significantly. Big gainers would be Argentina,Kazakhstan, and Ukraine, with some output reduc-tion by the United States and the European Union.Further reforms of the global wheat market shouldfocus on ensuring access to wheat exports duringprice spikes, reducing producer support in OECDcountries, reducing protection in the few remaininghighly protected markets, and reducing tariff esca-lation on wheat products.
Groundnuts In chapter 12,“Groundnuts: Policies,Global Trade Dynamics, and the Impact of TradeLiberalization,” Ndiame Diop, John C. Beghin, andMirvat Sewadeh analyze groundnuts, an importantproduct for many low-income producers and con-sumers. There are two main groundnut markets,one for edible groundnuts (confectionary, processedbutter and paste) and one for crushed groundnuts(oil and cakes) used in livestock feed. The peanut oilmarket is declining because of the availability oflower-priced vegetable oils, but the confectionarynuts market is expanding. African producers haveconsiderable potential in this sector, but supplyvolatility, inefficient processing, and uneven qualityare challenges to their becoming dependableexporters of confectionary products.
The policy dimension of international ground-nut markets is a challenge largely for developingcountries. India and, to a lesser extent, China arelarge, protected groundnut markets, and low-costproducers in Argentina and Sub-Saharan Africa arepotential gainers from global reforms. The UnitedStates, which once strongly supported the peanutsector, eliminated major distortions with a one-time buyout in 2002, but a now-redundant tariff of160 percent remains. Liberalization would makeIndia and China net importers of some peanutproducts. With trade liberalization, the bulk ofworld welfare gains would occur with groundnutsrather than with derivative products, although lib-eralization of the value-added markets (groundnutoil and meal) would lead to larger welfare gainsand higher rural incomes for African countries($72 million in aggregate welfare and $124 millionin farm profits). Consumers in OECD countrieswould pay higher prices for these products, butthere would be little effect on poverty. Consumersin India and southern China, who pay for heavyand inefficient government intervention in the sec-tor, would be better off.
The major challenge in successful negotiationsto open groundnut product markets is to overcomeentrenched interests in India and China. Except forthe United States, industrial countries have limitedinterests at stake in these markets and should notbe an impediment to reform. Moreover, U.S. pro-ducers would benefit from the higher world pricesthat would prevail under free trade, helping to off-set reductions in U.S. tariffs.
Fruits and vegetables In chapter 13, “Fruits andVegetables: Global Trade and Competition in Freshand Processed Products,” Ndiame Diop and StevenM. Jaffe look at another dynamic product group,which now constitutes almost 21 percent of devel-oping-country exports. World imports of fruits andvegetables grew 2–3 percent a year during the 1990s,a slowdown over the 1980s. Low population andincome growth in the European Union, where prod-uct markets were already mature and saturated, hadmuch to do with the slowdown. Adverse price move-ments for fresh and processed products from themid-1990s onward also contributed to the decelera-tion. Trade growth remained robust among NAFTAcountries, for exports to high-income Asian coun-tries and for trade between developing countries.
Introduction and Overview 11

Although many developing-country suppliershave entered this market, relatively few countrieshave achieved significant success on a sustainedbasis. This is a highly competitive and rapidlychanging industry, with multiple influences oncompetitiveness.
Unlike the case in many other agricultural sec-tors, production and export subsidies are not per-vasive in horticulture. Border controls are the maininstrument of protection. The United States, theEuropean Union, and Japan use a range of complextools, including highly dispersed ad valorem tariffs,specific duties, seasonal tariffs, tariff escalation, andpreferential access with tariff rate quotas. Manyindustrial countries have set up complex systems ofpreferential access to provide a few privileged tradepartners with favorable entry without underminingprotection of domestic producers. The productcoverage of preferential access schemes is wide, butentry is often limited by quotas for “sensitive prod-ucts.” Tariff escalation is widespread, although itsextent varies significantly across countries.
Further tariff liberalization would be needed toreduce tariff peaks, especially in the European Unionand the Republic of Korea. Changes in domesticsupport will not affect the sector significantlybecause most countries have low levels of direct gov-ernment intervention. Reductions in tariffs andother import restrictions are thus critical for deter-mining the impact of trade agreements and policieson world horticultural trade. Still, as experience sug-gests, the main beneficiaries of such reforms will be alimited number of middle-income countries thathave developed strong production, post-harvestprocessing, logistical marketing, and sanitary andphytosanitary management systems and that con-tinue to attract new investment. With few excep-tions, low-income countries still face substantialsupply-side challenges in taking advantage of exist-ing and future international market opportunities.
Cotton In chapter 14, “Cotton: Market Settingand Policies,” John Baffes explores cotton, a marketwith minimal border restrictions but considerabledomestic support. Cotton production is an impor-tant source of rural income and exports in Africaand Central Asia. In 1998–99, cotton accountedfor more than 30 percent of merchandise exportsin Benin, Burkina Faso, Chad, Mali, Togo, andUzbekistan, and 15 percent in Tajikistan. Cottonfaces intense competition from synthetic fibers,
especially following the technological improve-ments of the early 1970s that brought prices downto those for cotton. Since 1975 polyester and cottonhave traded at roughly the same price levels. Cot-ton’s share of total fiber consumption has droppedfrom 68 percent in 1960 to 40 percent in 2001–02.Cotton demand has grown at the same rate as pop-ulation growth during the last 40 years.
The major challenge for cotton is to cut backsupport policies, particularly in the United States,which subsidized cotton at a cost of $3.7 billion in2001–02, and the European Union (Greece andSpain), which provided subsidies of almost $1 bil-lion. These are extremely high subsidies in a marketin which production was valued at $20 billion in2001–02. At this level of support, U.S. and EU cot-ton producers receive prices that are 87 percent and160 percent, respectively, above world prices. Chinahas also supported its cotton sector. Many cotton-producing developing countries have reacted to lowworld prices by introducing offsetting support.Support in Brazil, Egypt, India, Mexico, and Turkeytotaled $0.6 billion in 2001–02.
Cotton support policies reduce world prices bysome 10–15 percent, cutting the incomes of poorfarmers in West Africa and Central and South Asia.Cotton has important implications for povertyreduction in these countries as it is one of the mostimportant sources of cash in these economies. Ifsupport were removed completely, Africa wouldincrease production by 6 percent and Uzbekistanby 4 percent, while the United States would reduceproduction by 7 percent and the European Unionby 10 percent.
Seafood In chapter 15, “Seafood: Trade Liberal-ization and Impacts on Sustainability,” Cathy A.Roheim looks beyond global trade policies toexamine the complementary issues of managementand sustainability. Seafood is one of the mosttraded food commodities in the world. Developingcountries account for more than 50 percent of theglobal fish product trade by value. This trade nowconstitutes 20 percent of their agricultural and foodprocessing exports, more than tropical beverages(coffee, cocoa, and tea), nuts and spices, cotton, andsugar and confectionary combined. Aquaculturehas expanded to 30 percent of world seafoodproduction. The most valuable component of theseafood trade is shrimp, with total world trade ofmore than $10 billion in 2000.
12 Global Agricultural Trade and Developing Countries
Capture fisheries still supply the majority of fishproduction, but 60 percent of the world’s fisheriesare either overused or fully used. Even with theestablishment of the 200-mile exclusive economiczones in 1977, which brought a third of the world’soceans under the jurisdiction of coastal states, mostfisheries management plans have not achieved theirstated goal of maintaining sustainable fisheries.
Most seafood product trade flows from develop-ing countries to industrial countries. In severaldeveloping countries, fish products are a primarysource of export earnings. Trade barriers may havesignificant potential for harm for these countries.Among trade barriers, tariffs are low comparedwith the effects of sanitary and phytosanitarymeasures and, increasingly, countervailing andantidumping measures. Many industrial countriesheavily subsidize their fishing sector, includingbuying access to the waters of developing nations.These subsidies and other fishing arrangementsmean that industrial countries capture a significantportion of fishing value added. Many developingcountries do not have management policies or lackthe resources to enforce them, with the result thatcapture fisheries are being depleted. Increasedaquaculture production in developing countries,particularly of shrimp, has had adverse environ-mental impacts along coastal areas.
The effects of trade liberalization will differ bycountry, depending on domestic policies for fish-eries and aquaculture. If trade liberalization in fishproducts leads to higher prices for exporters, fishcatches may decline as already overstressed resourcesare pushed past sustainable levels. This in turn willlead to a decline in food security and, ultimately, tounsustainable international seafood markets.
Coffee In chapter 16, “Coffee: Market Setting andPolicies,” John Baffes, Bryan Lewin, and PanosVarangis look at a traditional tropical product, onethat does not have major trade distortions. Tariffsare low, and there is only slight tariff escalation onprocessed coffee. Yet despite this, coffee prices havebeen highly volatile. This volatility reflects mainlyweather-related conditions (and to a lesser extentcurrency fluctuations) in Brazil.
Coffee consumption has been stagnant (com-mon among primary commodities), in partbecause of competition from the soft drink indus-
try. Except in Brazil, Colombia, Ethiopia, and Mex-ico, little coffee is consumed in developing coun-tries. Efforts to expand coffee consumption indeveloping countries are likely to come at theexpense of tea, a commodity produced by the samecountries that produce coffee.
Although a few large producers produce most ofthe coffee, several small countries depend heavilyon coffee. In Burundi, Ethiopia, and Rwanda, coffeeaccounts for more than half of total merchandizeexports. The coffee market had supply controls inplace longer than any other important commodity.In addition to stabilizing (and perhaps raising)prices in the short term, these agreements broughtnew entrants into the coffee market. With theexception of Colombia, Ethiopia, and, to a lesserdegree, Côte d’Ivoire, Kenya, and Tanzania, themarketing regimes in coffee-producing countriesare liberal. Some 6–8 percent of coffee output istraded outside of traditional marketing channels, asorganic, fair-trade, gourmet specialty, and eco-friendly products. These new markets providehigher prices to producers.
During the 1990s, Brazil expanded its coffeeproduction to areas less subject to frost, reducingweather-induced supply disruptions. Vietnamemerged as the dominant supplier of robustacoffee, currently producing as much coffee asColombia. New technologies on the demand sidehave enabled roasters to be more flexible in switch-ing quickly among coffee types, implying thatpremiums for certain types of coffee cannot beretained for long. Thus the so-called coffee crisis ismore a case of new entry, faster technologicalchange, and so far, little exit.
Note
1. Outgrower refers to farmers producing for a larger proces-sor under some contractual arrangement and technical advice oroversight.
References
Hoekman, Bernard, Francis Ng, and Marcelo Olarreaga. 2002.“Reducing Agricultural Tariffs versus Domestic Support:What’s More Important for Developing Countries?” WorldBank Policy Research Working Paper 2918. Washington,D.C.
Ingco, Merlinda, and John D. Nash, eds. 2004. Agriculture andthe WTO: Creating a Trading System for Development.Washington, D.C.: World Bank.
Introduction and Overview 13

Part I
GlobalProtection
and Tr ade inAgriculture

the least-developed countries (table 2.1). Althoughmost of the world’s poor countries are in Sub-Saharan Africa, the region accounts for only about12 percent of the developing world’s rural popula-tion. Asia accounts for 65 percent.
Although the share of the population in ruralareas is declining, more poor people will live inrural areas than in cities in developing countries forat least a generation. With urbanization, the ruralshare of poor households will decline, but based oncurrent trends that share will not fall below 50 per-cent before 2035 (Ravallion 2001).
Poverty
By the international $1-a-day poverty line, most ofthe world’s poor live in China, India, and“other low-income” countries (see table 2.1). Least-developedcountries constitute 15 percent of the world’s popu-lation but almost 24 percent of the world’s poor.National poverty data, which disaggregate informa-tion by rural and urban households but are notavailable for all countries, yield similar results. They
Despite tremendous change in the past 20 years inglobal specialization and trade in manufacturing,remarkably little structural change has occurred inglobal agricultural trade flows. This chapter exam-ines the growth and structure of agricultural tradesince the 1980s, looking at the performance ofindustrial and developing countries and of specificcommodity groups. To place arguments about agri-cultural policies in perspective, it also presentsbasic statistics on rural income and poverty.
Agriculture and Rural Income
The share of agriculture in global trade has beenshrinking, as has its share in global gross domesticproduct. Most successful developing countries havenot relied on agriculture for their exports. Yet formost developing countries, growth in agriculturehas a disproportionate effect on poverty becausemore than half of the people in developing coun-tries reside in rural areas.1 Some 57 percent of thedeveloping world’s rural population lives in lower-middle-income countries, and 15 percent lives in
17
2
The EVOLUTION OF AGRICULTURAL
TRADE FLOWS
M. Ataman Aksoy
Research support for this chapter was supplied by Baris Sivri, Tarek Souweid, Konstantin Senyut, and ZeynepErsel. The author would like to thank John Beghin, Donald Mitchell, John Baffes, Steve Jaffee, Ndiame Diop,Sushma Ganguly, Harry De Gorter, and anonymous reviewers for their comments. Some of the preliminaryfindings of this chapter have been incorporated into Beghin and Aksoy (2003) and World Bank (2003).

show that four countries—Bangladesh, China,India, and Indonesia—account for 75 percent of theworld’s rural poor. It is in Asia, therefore, that ruralincome growth will have the greatest impact onpoverty.
In the 52 countries for which separate rural andurban income data are available, 63 percent of thepopulation lives in rural areas, slightly more thanthe 56 percent for developing countries as a whole(table 2.2). Some 73 percent of poor people livein rural areas and the incidence of poverty is higherin rural areas in all groups of developing coun-tries, whatever their income level. In the least-developed countries, 82 percent of the poor live inrural areas.
On average, farmers are poorer than nonfarmersin developing countries but are better off than non-farmers in industrial countries. In almost all devel-
oping countries, rural households have lower aver-age incomes than nonrural households (figure 2.1).The ratio of rural incomes to nonrural incomesranges from 40 to 75 percent, a relationship thatremains consistent across groups of developingcountries. The same relationship holds for themiddle-income OECD (Organisation for Eco-nomic Co-operation and Development) countries,such as Greece, the Republic of Korea, and Turkey.2
Farm household incomes are around 75–80 percentof nonfarm incomes.
The opposite is true in many high-incomeOECD countries. Average farm household incomesare higher than average household incomes(figure 2.2). Average farm household incomes arealmost 275 percent of average household incomesin the Netherlands, 175 percent in Denmark,160 percent in France, and 110 percent in the
18 Global Agricultural Trade and Developing Countries
TABLE 2.1 Distribution of Poor People in Developing Countries, 1999
Poverty Headcount
Percentage of (under $1/day)Population 2001 Developing Number of(millions) World’s Rural Rate Poor People
Country Category National Rural Urban Population (percent) (millions)
Least-developed countries 596 443 153 74 15 49 292Other low-income countries 839 501 338 60 17 26 218
excluding IndiaMiddle-income countries 1,435 478 957 33 16 8 114
excluding ChinaChina 1,272 805 467 63 27 18 226India 1,032 745 288 72 25 35 358Total 5,175 2,972 2,203 57 100 23 1,209
Source: World Bank data.
TABLE 2.2 Rural Population and Poverty for a Sample of 52 Developing Countries(percent)
Sample Countries All Developing Countries
Share of Rural Share of Poor Share of RuralIncome Group Dwellers in Rural Areas Dwellers
Upper-middle-income countries 19 37 22Lower-middle-income countries 64 72 61Low-income countries 65 74 60Least-developed countries 76 82 68All developing countries 63 73 56
Note: Sample consists of 52 countries for which separate rural and urban income data are available.Source: World Bank data.
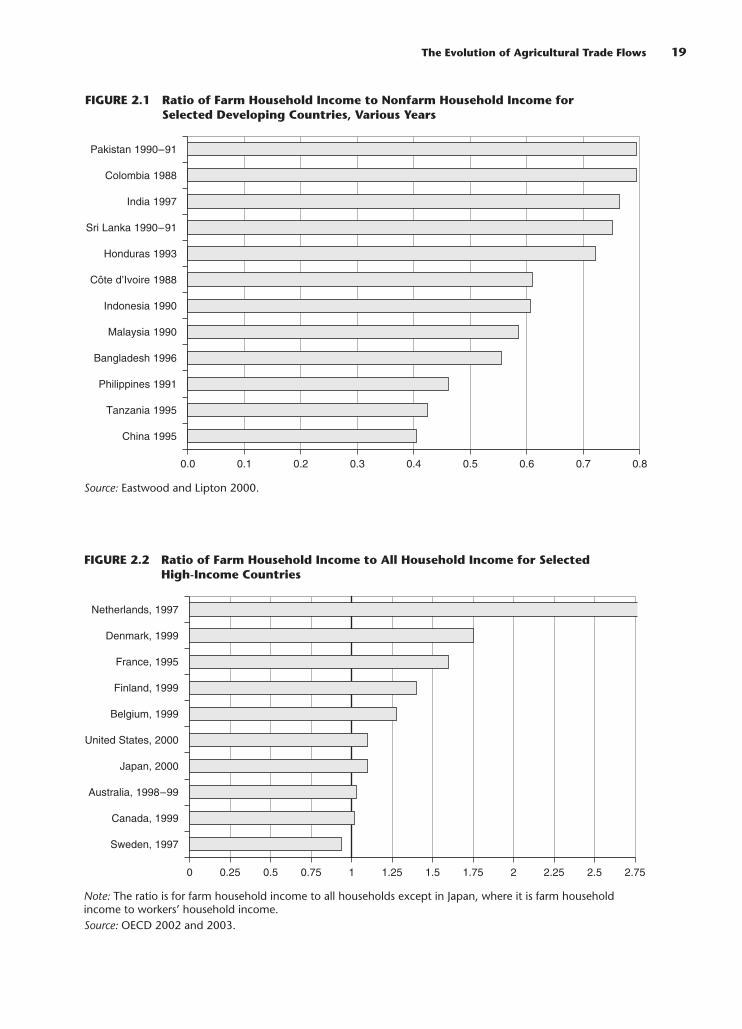
The Evolution of Agricultural Trade Flows 19
FIGURE 2.1 Ratio of Farm Household Income to Nonfarm Household Income forSelected Developing Countries, Various Years
0.0 0.1 0.2 0.3 0.4 0.5 0.6 0.7 0.8
China 1995
Tanzania 1995
Philippines 1991
Bangladesh 1996
Malaysia 1990
Indonesia 1990
Côte d’Ivoire 1988
Honduras 1993
Sri Lanka 1990–91
India 1997
Colombia 1988
Pakistan 1990–91
FIGURE 2.2 Ratio of Farm Household Income to All Household Income for SelectedHigh-Income Countries
0 0.25 0.5 0.75 1 1.25 1.5 1.75 2 2.25 2.5 2.75
Sweden, 1997
Canada, 1999
Australia, 1998–99
Japan, 2000
United States, 2000
Belgium, 1999
Finland, 1999
France, 1995
Denmark, 1999
Netherlands, 1997
Note: The ratio is for farm household income to all households except in Japan, where it is farm householdincome to workers’ household income. Source: OECD 2002 and 2003.
Source: Eastwood and Lipton 2000.

United States and Japan. In most other high-income countries, average farm incomes are eitherequal to or very slightly lower than the averagehousehold income (OECD 2002).
Structure of Income Sources
In addition to these differences in relative rural andnonrural income levels between developing andindustrial countries, the two groups of countrieshave different structures of income sources. Mostrural households in poor countries are dependenton agriculture. Rural households in Ethiopia,Malawi, and Vietnam, for example, derive aboutthree-quarters of their income from agriculturalactivities, mainly subsistence farming (table 2.3).Wages are the second-largest income source, withsome of the wage income originating in agricul-ture. For example, in Malawi, where 8 percent oftotal income is from wages, 3 percentage points ofthat income is from agriculture. In Mexico, where40 percent of total income is from wages and only26 percent is directly from agriculture, 24 percent-age points of wage income is from agriculture,bringing agriculture’s contribution to almost50 percent.
As countries develop, the share of nonfarmincome in rural households increases, so that agri-cultural price and output variations have a smallerdirect impact on rural households (figure 2.3).3 Inmost industrial countries, the share of farm incomein total household income declines even further, asother sources of income gain a larger share (salariesand wages from other activities; investment income;
and social transfers from health, pension, unem-ployment, and child-allowance schemes). Whileratios of farm to nonfarm income are higher forsome European countries, definitional differencesmake reliable comparisons across countries verydifficult (OECD 2002).
Income Distribution
It is often argued that income distribution in ruralareas of developing countries is highly unequal andthat the gains from global reforms could accrue pri-marily to the well-to-do rather than to the ruralpoor. Gini coefficients for a group of developingand industrial countries indicate that despite claimsto the contrary, income distribution in most devel-oping countries is more equitable in rural house-holds than in nonrural households (table 2.4). Thisis true for both low- and middle-income countries.The opposite is true in industrial countries.
In industrial countries the largest farmoperations, generally the most profitable andwealthiest, receive most of the benefits of supportsystems. Subsidy programs are not intended to keepsmall, struggling family farms in business but toprovide large rents to large-scale farmers. Currentproduction-based policies, by increasing land prices,also encourage the creation of larger farms and theelimination of small family farms. The unintendedspillover effects of these policies on other countriesand on global markets are large and negative.
Agricultural protection in rich countries wouldappear to worsen global income distribution. Farm-ers in industrial countries earn more on average
20 Global Agricultural Trade and Developing Countries
TABLE 2.3 Structure of Rural Household Incomes, Selected Developing Countries(percent)
Ethiopia Malawi Vietnam Pakistan MexicoType of Income 2000 1997 1993 1989 2000
Total agricultural income 77 76 63 45 26Agricultural cash income 18 16 — — 22Subsistence farming 59 60 — — 4Transfers 16 7 1 9 23Wages 3 8 21 31 40Other 4 9 15 15 11Total 100 100 100 100 100
— Not available.Source: World Bank household data.

than the national income average, and most farmaid goes to the largest and wealthiest farmers. At theother end of the global income spectrum, morepoor people in developing countries tend to live inrural areas. Agricultural support in industrial coun-tries tends to depress world prices and demand forthe agricultural products of developing countriesand to lower rural incomes. Global trade reforms, tothe extent that they transfer resources from well-to-do farmers in industrial countries to poorer farmers
in developing countries, will thus improve globalincome distribution while reducing global poverty.
Broad Trends in Agricultural Trade
The last two decades have been a period of veryrapid export growth from developing countries,aided by the growth of the world economy and thelowering of trade barriers, as well as by increasingsupply capabilities in developing countries. The
The Evolution of Agricultural Trade Flows 21
FIGURE 2.3 Ratio of Farm Income to Total Income of Farm Households, SelectedCountries and Years
United
Sta
tes,
1999
–200
1
Canad
a,
1997
–199
9Ja
pan,
1998
–200
0Finl
and,
1996
�19
98–1
999
Denm
ark,
1997
–199
9Ire
land,
1994
�19
99
United
King
dom
,
1996
–199
8Nor
way,
1997
–199
9
Austra
lia,
1997
–199
9
0
0.1
0.2
0.3
0.4
0.5
0.6
0.7
Note: Data are averages of three most recent years available.Source: OECD 2002.
TABLE 2.4 Urban and Rural Income Inequality, Selected Countries and Years
Low-Income Rural Urban Middle-Income Rural Urban High-Income Rural UrbanCountries Gini Gini Countries Gini Gini Countries Gini Gini
Bangladesh 1996 0.26 0.36 Mexico 1996 0.34 0.40 Australia 1994/95 0.36 0.31Pakistan 1991 0.41 0.39 Turkey 1994 0.46 0.58 Canada 1994 0.30 0.29Sri Lanka 1990/91 0.28 0.35 Colombia 1988 0.47 0.49 Denmark 1992 0.32 0.23Indonesia 1990 0.26 0.35 Costa Rica 1984 0.41 0.48 Finland 1995 0.26 0.22Lesotho 1993 0.55 0.58 Peru 1994 0.37 0.35 France 1994 0.29 0.29Madagascar 1980 0.44 0.49 India 1997 0.30 0.36 Ireland 1987 0.37 0.32Tanzania 1993 0.35 0.42 China 1995 0.34 0.28 Italy 1995 0.43 0.34Uganda 1992 0.35 0.44 Rep. of Korea 1987 0.12 0.42 Netherlands 1994 0.31 0.26Malawi 1997–98 0.33 0.52 Thailand 1986 0.45 0.46 Norway 1995 0.20 0.24Nigeria 1996 0.42 0.50 Malaysia 1987 0.42 0.43 Spain 1990 0.28 0.31Burkina Faso 1995 0.40 0.45 Philippines 1991 0.39 0.47 United States 1994 0.37 0.37
Source: OECD 1999 for the high-income countries; National Statistics Office for Malawi; World Bank data forNigeria; Ozmucur and Silber 2000 for Turkey; and Eastwood and Lipton 2000 for the remaining countries.

resulting increased import and export shares intotal output have been a key source of growth inmany developing countries. This growth has beenfastest in manufacturing, where global levels ofprotection have been reduced significantly. Growthhas been slower in agriculture, where significantprotection still remains.4
While the 1990s were a period of rapid tradereform in developing countries and of implemen-tation of Uruguay Round commitments, theUruguay Round seems not to have yielded anymeaningful reduction in protection in industrialcountries (see chapter 3). Protection in OECDcountries increased during the 1960s and 1970s,reaching its peak in the late 1980s. There is littleevidence that protection decreased significantly inthe 1990s. In many cases, protection might evenhave increased in the 1990s through “dirty tariffica-tion” (Nogues 2002; Ingco 1997).
Growth in Agricultural Trade
World agricultural trade in 2000–01 was $467 bil-lion, up from $243 billion in 1980–81.5 Real manu-facturing and agriculture trade expanded at similarrates during the 1980s (5.7 and 4.9 percent a year),but real manufacturing export growth acceleratedto 6.7 percent a year during the 1990s, while agri-cultural export growth decelerated to 3.4 percent(table 2.5).
The picture is similar for developing countries.Their manufacturing export growth acceleratedand agricultural export growth stagnated duringthe 1990s. Manufacturing export growth rates
increased both to other developing countries andto industrial countries, while agricultural exportgrowth rates increased to other developing coun-tries but decreased to industrial countries.
These differential growth rates are reflected inthe shares of exports in world trade in developingcountries (table 2.6). Their share in manufacturingexports rose dramatically, from 19 percent in1980–81 to 33 percent in 2000–01, with higherexports to both developing countries and industrialcountries. In agricultural trade, developing coun-tries lost market shares during the 1980s and barelyrecovered during the 1990s to their 1980–81 level ofaround 36 percent. All of this gain in the 1990scame from expansion of exports to other develop-ing countries. Despite these changes in the shares,nearly half of world agricultural trade takes placeamong industrial countries.
The deceleration in growth of world agriculturaltrade reflects the decline in real import growthrates of industrial countries, from 4.8 percent a yearin the 1980s to 2.3 percent in the 1990s.6 Over thatsame period, real import growth rates for develop-ing countries accelerated from 4 percent to 6.1 per-cent a year.
Two explanations have been proposed for thedecline in import growth in industrial countries: alower elasticity of demand for agricultural productsin industrial countries and the decline in commod-ity prices in the 1990s. Gross domestic product(GDP) growth slowed from 3.0 percent a year inthe 1980s to 2.3 percent a year during the 1990s inindustrial countries, while rising from 3.1 percentto 3.7 percent in developing countries. Unless there
22 Global Agricultural Trade and Developing Countries
TABLE 2.5 Average Annual Real Export Growth Rates, 1980s and 1990s(percent)
Developing Countries
Developing to Developing toWorld Total Developing Countries Industrial Countries
1980–81/ 1990–91/ 1980–81/ 1990–91/ 1980–81/ 1990–91/ 1980–81/ 1990–91/Sector 1990–91 2000–01 1990–91 2000–01 1990–91 2000–01 1990–91 2000–01
Agriculture 4.9 3.4 5.3 5.3 4.2 7.2 5.9 4.4Manufacturing 5.7 6.7 7.4 10.9 7.1 12.1 7.5 10.3
Note: Manufacturing imports are adjusted by the manufactures’ unit value. World agricultural trade isadjusted by commodity price index with world trade weights, and developing country exports areadjusted by the same index with developing country trade weights. Source: COMTRADE.
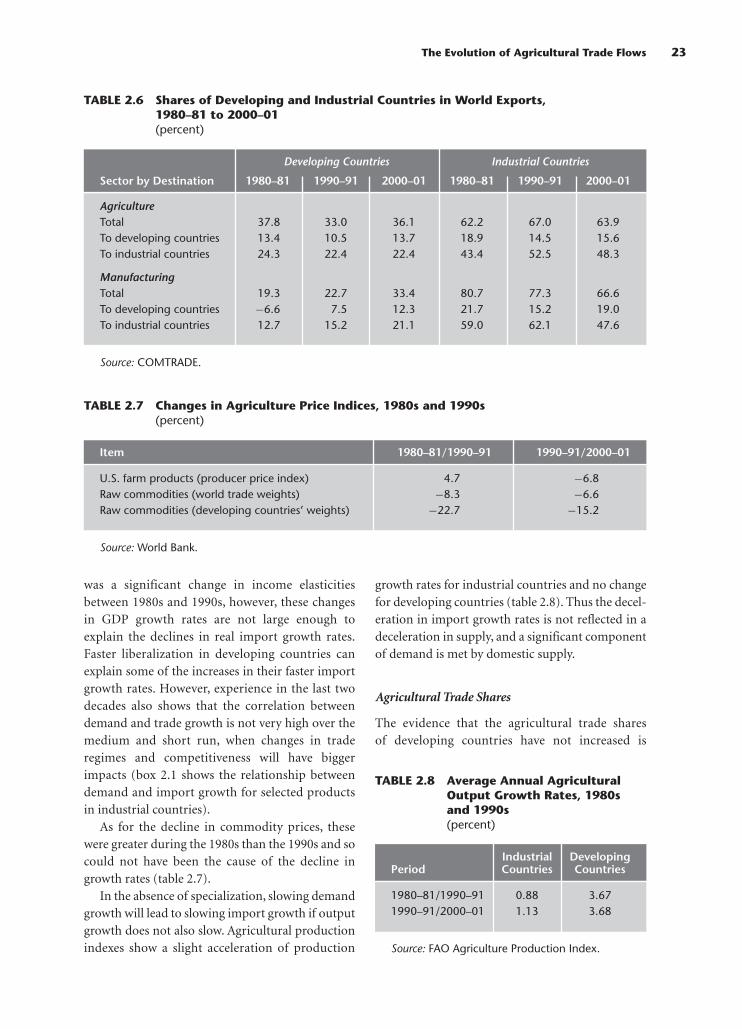
was a significant change in income elasticitiesbetween 1980s and 1990s, however, these changesin GDP growth rates are not large enough toexplain the declines in real import growth rates.Faster liberalization in developing countries canexplain some of the increases in their faster importgrowth rates. However, experience in the last twodecades also shows that the correlation betweendemand and trade growth is not very high over themedium and short run, when changes in traderegimes and competitiveness will have biggerimpacts (box 2.1 shows the relationship betweendemand and import growth for selected productsin industrial countries).
As for the decline in commodity prices, thesewere greater during the 1980s than the 1990s and socould not have been the cause of the decline ingrowth rates (table 2.7).
In the absence of specialization, slowing demandgrowth will lead to slowing import growth if outputgrowth does not also slow. Agricultural productionindexes show a slight acceleration of production
growth rates for industrial countries and no changefor developing countries (table 2.8). Thus the decel-eration in import growth rates is not reflected in adeceleration in supply, and a significant componentof demand is met by domestic supply.
Agricultural Trade Shares
The evidence that the agricultural trade sharesof developing countries have not increased is
The Evolution of Agricultural Trade Flows 23
TABLE 2.6 Shares of Developing and Industrial Countries in World Exports,1980–81 to 2000–01(percent)
Developing Countries Industrial Countries
Sector by Destination 1980–81 1990–91 2000–01 1980–81 1990–91 2000–01
AgricultureTotal 37.8 33.0 36.1 62.2 67.0 63.9To developing countries 13.4 10.5 13.7 18.9 14.5 15.6To industrial countries 24.3 22.4 22.4 43.4 52.5 48.3
ManufacturingTotal 19.3 22.7 33.4 80.7 77.3 66.6To developing countries −6.6 7.5 12.3 21.7 15.2 19.0To industrial countries 12.7 15.2 21.1 59.0 62.1 47.6
Source: COMTRADE.
TABLE 2.7 Changes in Agriculture Price Indices, 1980s and 1990s(percent)
Item 1980–81/1990–91 1990–91/2000–01
U.S. farm products (producer price index) 4.7 −6.8Raw commodities (world trade weights) −8.3 −6.6Raw commodities (developing countries’ weights) −22.7 −15.2
Source: World Bank.
TABLE 2.8 Average Annual AgriculturalOutput Growth Rates, 1980sand 1990s(percent)
Industrial DevelopingPeriod Countries Countries
1980–81/1990–91 0.88 3.671990–91/2000–01 1.13 3.68
Source: FAO Agriculture Production Index.

A trade flow matrix for the years 1980–81,1990–91, and 2000–01 shows the details of nominalagricultural trade flows among different groups ofcountries (table 2.9). The European Union is thelargest trader, with exports of $181 billion andimports of $197 billion. Developing countries as ablock are the second largest trader, with exports of$162 billion and imports of $128 billion.
Trade among industrial countries dominatesglobal agricultural trade, most of it within the tradeblocs such as the European Union and NAFTA
24 Global Agricultural Trade and Developing Countries
BOX 2.1 Role of Demand and Changes in Market Share
Low income elasticities for agricultural products,especially in industrial countries, are identified asthe primary reason for the slowdown in globalagricultural trade growth. These low incomeelasticities are contrasted with higher incomeelasticities for manufactured products. Whiletrade and demand growth are highly correlatedin the long run, it is not clear whether they are inthe medium run. Variables such as level andchanges in protection and the degree of com-parative advantage play an important role.
If world trade expands primarily because ofincreases in demand, then slower agriculturaltrade can be explained by lower income elastici-ties and lower income growth in industrial coun-tries. But if the primary cause of trade expansionover the medium run is restructuring of produc-tion and changes in both imports and exports,without commensurate changes in total demand,
then changes in trade regimes can explain a sig-nificant part of trade growth. Since the mid-1970s merchandise trade has expanded muchfaster than demand, showing the importance ofproduction restructuring. Unfortunately, the sys-temic information that is necessary to decom-pose the determinants of export growth existsonly for manufacturing. The information for agri-culture is very limited.
When manufacturing (including food process-ing) import growth to industrial countries(Canada, Germany, Japan, and the United States)is decomposed between demand and marketshare changes, demand growth accounted for32 percent of import growth and changes inmarket share for 68 percent. For imports fromdeveloping countries, growth contributed only21 percent while changes in market share con-tributed 79 percent (Aksoy, Ersel, Sivri 2003).
consistent with other partial findings. Within a nar-rower definition of agriculture, and focusingmostly on key commodities, OECD (2001) datashow that import shares of these agricultural com-modities in key industrial countries have notincreased since 1986. For many agricultural com-modities, imports as a share of world consumptionstagnated. For some commodities, such as sugarand wheat, there has been significant import sub-stitution since the 1960s and 1970s, when theOECD countries greatly increased their protection.
Demand and Import Growth in Selected Industrial Countries, 1991–99(percent)
Import Import Growth 1991 Market Shares
Industrial Country Growth from from Developing DevelopingSectors Demand Growtha the World Countries World Countries
Food processing 15.82 26.65 14.46 6.41 2.42Garments 14.35 57.29 73.08 43.19 33.80Glass products 13.06 63.54 71.99 14.24 4.30
a. Includes Canada, Germany, Japan, and the United States. Source: Aksoy, Ersel, Sivri 2003.
The examples of food processing, garments,and glass products illustrate the lack of a strongrelationship between import and demandgrowth. The three subsectors have similardemand growth rates but very different importgrowth rates. The import growth rates are differ-
ent not only for imports from developing coun-tries but for imports from the rest of the world aswell. Depending on policy regimes and changesin policy regimes, trade growth rates can be verydifferent from growth rates in demand.

The Evolution of Agricultural Trade Flows 25
(North American Free Trade Agreement). Thisintrabloc trade accounts for more than a third ofglobal agricultural trade. In 2000–01 industrialcountry agricultural exports to other industrialcountries totaled $226 billion. Of that, $131 billionwas intra-EU trade (almost 58 percent) and $35billion was intra-NAFTA trade. Agricultural tradeamong industrial countries excluding intra-EU andintra-NAFTA was only $60 billion.
Agricultural trade within trade blocs as a shareof total trade is not only high, but it has increasedduring the last 20 years. Intra-EU agriculturalimports increased from 51 percent of total agricul-tural imports in 1980–81 to 66 percent in 2000–01;intra-NAFTA imports rose from 29 percent to 44percent. This increase shows how removing tariffbarriers can stimulate trade.
Trade among developing countries is alsoincreasing, with more than 50 percent of their agri-cultural imports coming from other developingcountries. Only 39 percent of their agriculturalexports are to other developing countries, however,showing the continuing importance of industrial-country markets for their exports. Other develop-ing countries accounted for 39 percent of exportsfrom low-income countries and 51 percent ofimports in 2000–01, increases from 26 percent and41 percent, respectively, in 1980–81. Shares formiddle-income countries were similar, with otherdeveloping countries accounting for 39 percent oftheir exports and 50 percent of their imports in2000–01. Developing countries have become majorplayers in the world agricultural trade, especially ifintra-EU and intra-NAFTA trade is excluded.
TABLE 2.9 Global Agricultural Trade Flows(US$ billion)
Exporters Low- Middle- OtherIncome Income Developing Industrial Total
Importers Countries Countriesa Countries EU-15 Japan NAFTA Countries Imports
Low- 1980–81 0.86 2.16 3.03 2.19 0.20 1.42 0.63 7.47income 1990–91 0.81 2.52 3.33 1.17 0.06 1.22 0.73 6.52countries 2000–01 1.50 4.48 5.98 2.01 0.06 1.99 1.78 11.82
Middle- 1980–81 3.05 25.73 28.78 14.55 1.02 20.03 6.51 70.88income 1990–91 4.05 29.72 33.77 17.41 1.32 19.30 7.18 78.99countriesa 2000–01 9.20 48.44 57.64 22.85 1.74 23.42 10.71 116.36
Developing 1980–81 3.91 27.89 31.80 16.74 1.21 21.45 7.14 78.34countries 1990–91 4.85 32.25 37.10 18.59 1.39 20.52 7.92 85.51
2000–01 10.70 52.92 63.63 24.86 1.80 25.41 12.49 128.18
EU-15 1980–81 7.20 22.89 30.09 53.82 0.24 15.44 5.55 105.151990–91 7.66 33.76 41.42 116.81 0.28 9.99 9.42 177.922000–01 9.65 37.81 47.46 131.33 0.15 9.57 9.38 197.89
Japan 1980–81 1.13 6.64 7.77 1.22 — 9.20 2.56 20.741990–91 1.85 14.61 16.47 3.78 — 14.65 4.32 39.232000–01 2.52 19.21 21.73 4.83 — 17.61 5.11 49.28
NAFTA 1980–81 2.62 11.67 14.30 4.42 0.37 8.86 2.78 30.731990–91 2.06 15.02 17.08 7.96 0.42 15.52 3.54 44.532000–01 3.72 21.95 25.67 12.60 0.54 34.80 4.77 78.38
Other 1980–81 0.47 1.68 2.14 3.79 0.06 1.53 0.62 8.15industrial 1990–91 0.40 2.31 2.71 7.01 0.07 1.66 1.09 12.54countries 2000–01 0.54 3.24 3.79 7.22 0.08 2.15 1.70 14.94
Total 1980–81 15.33 70.77 86.10 79.99 1.89 56.48 18.64 243.10exports 1990–91 16.81 97.95 114.77 154.16 2.15 62.35 26.29 359.72
2000–01 27.14 135.13 162.27 180.84 2.57 89.55 33.45 468.67
— Not available.Note: All data are import-based and all the exports and imports are evaluated at c.i.f. (cost, insurance, andfreight) prices.a. Includes China and India.Source: COMTRADE.

26 Global Agricultural Trade and Developing Countries
Since 1980–81 the biggest change in net agricul-tural trade flows has been the relative decline in EUimports from the rest of the world and the increasein its export share (table 2.10). In 1980–81 theEuropean Union was the largest importer in theworld, accounting for 32 percent of world imports.By 2000–01 its import share had dropped to 23 per-cent and its export share had increased to 16 per-cent (from 13 percent). Its trade deficit declined aswell, from $25 billion in 1980–81 to $19 billion in2000–01. The opposite has happened in NAFTA,whose trade surplus has decreased. Japan has beenthe world’s largest net importer of agriculturalproducts since 1990–91, and Australia and NewZealand combined have surpassed NAFTA as netexporters.
The combined trade surplus of developingcountries increased to $34 billion in 2000–01, from$8 billion in 1980–81. They have a trade surpluswith all groups of countries except Australia andNew Zealand.
Distribution of the Trade Expansion
A contentious issue in the literature has been thetrade performance of low-income countries. Manyanalysts have argued that the low-income countrieshave not benefited from the expansion in globaltrade. This is only partially true in agriculture. Low-income countries’ share of world exports fell from6.3 percent in 1980–81 to 4.3 percent in 1990–01and barely recovered to 5.8 percent in 2000–01.
TABLE 2.10 Agricultural Trade Flows (excluding Intra-EU and Intra-NAFTA Trade), 1980–81to 2000–01(US$ billion)
Country Group and Period Exports Imports Net Imports
Low-income developing countries1980–81 15.33 7.47 −7.861990–91 16.81 6.52 −10.302000–01 27.14 11.82 −15.32
Middle-income developing countriesa
1980–81 70.77 70.88 0.111990–91 97.95 78.99 −18.962000–01 135.13 116.36 −18.77
EU-151980–81 26.17 51.32 25.161990–91 37.34 61.10 23.762000–01 49.51 66.56 17.06
NAFTA1980–81 47.62 21.86 −25.751990–91 46.83 29.01 −17.822000–01 54.75 43.57 −11.17
Japan1980–81 1.89 20.74 20.741990–91 2.15 39.23 39.232000–01 2.57 49.28 49.28
Other industrial countries1980–81 18.64 8.15 −10.491990–91 26.29 12.54 −13.762000–01 33.45 14.94 −18.51
a. India and China are included under the middle-income developing countries.Source: COMTRADE and computations by the author.

The Evolution of Agricultural Trade Flows 27
However, if intra-EU and intra-NAFTA trade areexcluded, their share increases from 8.5 percent in1980–81 to 8.9 percent in 2000–01. As measured byexport and import performance, the 1980s were aperiod of decline for low-income countries, whilethe 1990s were a period of major expansion.
Their overall trade surpluses, however, haverisen throughout the period, from $7.8 billion in1980–81 to $15 billion in 2000–01. Low-incomedeveloping countries have a trade surplus withindustrial countries and with middle-incomedeveloping countries, and both of these surpluseshave increased since 1980. Their exports haveincreased as well, primarily to other developing
countries. In 2000–01 low-income countriesexported more to other developing countries thanto the European Union, while in 1980–81 theyexported only half as much. Some analysts haveargued that it is primarily small low-income coun-tries that have performed poorly, but the results donot change if the low-income countries are dividedinto small and large countries. Trade expandedfor both groups during the 1990s, and both haveincreased their trade surpluses in agriculture(table 2.11). Smaller low-income countries did per-form much worse than large low-income countriesduring the 1980s, however, when their exports andimports declined.
TABLE 2.11 Agricultural Trade Flows of Developing Countries, by Groups, 1980–81 to 2000–01(US$ billion)
Group and Period Exports Imports Net Imports
Low-income, small1980–81 10.63 3.26 −7.371990–91 10.06 2.39 −7.672000–01 14.95 4.45 −10.5
Low-income, largea
1980–81 4.7 4.21 −0.491990–91 6.75 4.13 −2.622000–01 12.19 7.38 −4.81
Middle-income, large exportersb
1980–81 20.26 17.73 −2.531990–91 25.94 18.47 −7.472000–01 38.4 18.11 −20.29
Middle-income, Asian importersc
1980–81 5.28 12.62 7.341990–91 9.54 22.77 13.232000–01 7.22 28.49 21.27
China and India1980–81 7.14 5.87 −1.271990–91 15.13 6.56 −8.572000–01 23.67 14.12 −9.55
Other middle-income1980–81 38.09 34.65 −3.441990–91 47.34 31.19 −16.152000–01 65.85 55.64 −10.21
a. Bangladesh, Ethiopia, Indonesia, Nigeria, and Pakistan.b. Argentina, Brazil, and Thailand.c. Republic of Korea, Hong Kong (China), Singapore, Taiwan (China).Source: COMTRADE and World Bank calculations.

28 Global Agricultural Trade and Developing Countries
Middle-income countries, however, performedworse during the 1990s, becoming smaller netexporters, with a shrinking trade surplus with therest of the world. There are large differences in agri-cultural trade performance among the middle-income countries. Argentina, Brazil, and Thailandare becoming major exporters (see table 2.11).These countries, which do not have highly distortedagricultural trade regimes, are frequently cited aspotential gainers from global liberalization. Theupper-middle-income manufacturing exporters inEast Asia, another group of developing countries,are becoming major importers of agricultural com-modities, along with Japan. Of these, the Republicof Korea and Taiwan (China) have distorted traderegimes, while Hong Kong (China) and Singaporehave liberal trade regimes. With liberalization,China and India, with one-third of the world’s pop-ulation, could emerge as major global exportersand importers. While they have trade surpluses, thesurpluses did not increase significantly during the1990s. The remaining middle-income countriesexperienced rapid trade growth during the 1990s,but their trade surpluses shrank considerably dur-ing this period. The significant trade liberalizationamong developing countries since the 1980s, espe-cially among middle-income countries, couldexplain some of the expanding imports of thesecountries.
Disaggregated Export and Import Performance
To get an accurate sense of changes in trade, it isimportant to measure the contributions of differ-ent product groups to those changes.7 Many ana-lysts argue that the markets for traditional exportsto industrial countries are static because of bothlow income elasticities and product substitution.For example, coffee and tea have been partiallydisplaced by soft drinks, cotton by synthetic fibers,and sugar by high-fructose corn syrup (see com-modity chapters).
To examine the detailed flows, agricultural prod-ucts were separated into four groups. One groupconsists mainly of developing-country tropicalproducts, such as coffee, cocoa, tea, nuts, spices, tex-tile fibers (mostly cotton), and sugar and confec-tionary products. A second is made up of highlyprotected temperate zone products of industrialcountries, such as meats, milk and milk products,
grains, animal feed, and edible oil and oilseeds. Athird category consists of dynamic nontraditionalproducts, such as seafood, fruits, vegetables, and cutflowers, for which global protection rates are lower.A fourth group consists of other products, includingprocessed agricultural products such as tobacco andcigarettes, beverages, and other processed foods.
Import growth rates in industrial countries havedeclined across all these agricultural productgroups (table 2.12). The decline does not originatewith price declines, which were greater during the1980s than the 1990s, or with slower import growthof tropical products, whose share was only 16 per-cent in 1990–91. Industrial countries’ growth inimports from both developing and other industrialcountries declined during the 1990s, while develop-ing countries’ import growth rates accelerated in allfour product groups. Again, the differences inimport growth rates of developing countriesbetween the 1980s and the 1990s are striking, sug-gesting a significant role for the trade liberalizationof the late 1980s and 1990s (see chapter 3).
Changes in Trade Structure
The structure of world trade in agriculture haschanged since the 1980s along with overall tradegrowth rates. Expanding groups include fruits andvegetables, which now have the largest share ofworld exports at 19 percent; fish and seafood, at12 percent; and alcoholic and nonalcoholic bever-ages, at almost 9 percent (table 2.13). While theseproduct groups tend to have high income elastici-ties, they also have low rates of protection in indus-trial and large developing countries.
Product groups that show significant declinesare grains, from 17 percent to 10 percent; coffee,cocoa, and tea, from 8.5 percent to 5.4 percent;sugar and confectionary products, from 6.4 percentto 3.1 percent; and textile fibers, from 5.9 percent to2.8 percent. These declines result from a combina-tion of price declines, low demand elasticities, and,in the case of sugar and grains, expanded produc-tion in industrial countries.
For developing countries the biggest decline inexport shares has come in their traditional tropicalproducts, such as coffee and cocoa, while the biggestgains have come in nontraditional exports, such asseafood and fruits and vegetables. For protectedproducts, such as grains, the increase in export

The Evolution of Agricultural Trade Flows 29
shares during the 1990s are due exclusively toexpanding trade among developing countries; theseproducts lost shares in industrial-country marketsand gained them in developing-country markets.Market share gains for beverages come primarilyfrom expanding exports of wine and beer to bothdeveloping- and industrial-country markets.
Whatever the causes for these changes, analysisof agricultural trade for developing countries nowneeds to focus on the new commodities, such asseafood, fruits, vegetables, and cut flowers, and on
other processed products, which together consti-tute almost 50 percent of the exports of developingcountries. Temperate zone products constituteanother 28 percent, while the traditional productsthat have received most of the attention in the liter-ature now constitute only 19 percent of the exportsof developing countries. Attention also has to beplaced on further expanding trade within develop-ing countries in temperate zone products such asmilk, grains, and meats, whose trade within devel-oping countries has already increased significantly.
TABLE 2.12 Annual Import Growth Rates for Four Classifications of Agricultural Products,1980s and 1990s(percent)
Developing Countries Industrial Countries
1980–81/ 1990–91/ 1980–81/ 1990–91/Product Classification 1990–91 2000–01 1990–91 2000–01
Tropical productsCoffee, cocoa, and tea, 1.9 5.1 −0.6 1.6
raw and processedNuts and spices 1.4 4.7 5.0 3.8Textile fibers 3.8 0.8 0.2 −5.9Sugar and confectionary −5.7 3.7 0.4 0.2
Subtotal �0.3 2.9 0.2 0.1
Temperate productsMeats, fresh and processed 2.2 2.9 6.1 1.2Milk and milk products 1.9 3.0 6.3 1.8Grains, raw and processed −1.3 1.6 0.4 1.8Animal feed 5.3 5.9 3.8 1.2Edible oil and oil seeds 2.0 6.8 1.3 1.0
Subtotal 0.7 3.5 3.6 1.4
Seafood, fruits, and vegetablesSeafood, fresh and processed 8.8 7.7 10.4 3.3Fruits and vegetables,
fresh and processed 2.8 6.4 8.3 1.9
Subtotal 4.4 6.8 9.0 2.4
Other processed productsTobacco and cigarettes 8.5 4.1 6.6 3.3Beverages, alcoholic 4.9 6.6 8.8 4.6
and nonalcoholicOther processed food 5.6 11.9 13.6 4.9Other −2.0 2.6 0.2 0.6
Subtotal 3.9 6.0 7.4 4.0
Total 1.4 4.3 5.1 2.0
Source: COMTRADE.

30 Global Agricultural Trade and Developing Countries
These developments show that many developingcountries can compete in the product categorieshistorically dominated by industrial countries andthat trade reforms in industrial sectors could leadto a large expansion of exports from these develop-ing countries.
Industrial-country export structures have alsochanged, with a decline in exports of protectedproducts and expansion in exports of beverages andfruits and vegetables (including intra-EU trade).Greater domestic production of sugar, grains, andother protected products has made many industrialcountries more self-sufficient and reduced theirexports to each other.
Degree of Processing
Despite significant tariff escalation in processedproducts, trade has moved toward processed (final)agricultural products and away from raw materialand intermediate products.8 In 1980–81 final prod-ucts made up slightly more than a quarter of worldexports, and raw and intermediate products madeup two-thirds. By 2000–01 the share of final prod-ucts had increased to 38 percent of total exports(table 2.14). The share of final products in exportsincreased for both developing and industrial coun-tries, but in 2000–01 final products still constitutedonly 10 percent of the exports from low-income
TABLE 2.13 The Structure of Agricultural Exports, 1980–81 to 2000–01(percent of total world trade)
Developing-Country Industrial-CountryExports Exports World Exports
1980 1990 2000 1980 1990 2000 1980 1990 2000Product Classification –81 –91 –01 –81 –91 –01 –81 –91 –01
Tropical productsCoffee, cocoa, and tea, 18.3 11.0 8.5 2.5 2.9 3.6 8.5 5.6 5.4
raw and processedNuts and spices 2.4 2.7 2.8 0.7 0.7 0.8 1.3 1.3 1.5Textile fibers 8.0 6.2 3.3 4.5 3.9 2.6 5.9 4.7 2.8Sugar and confectionary 10.5 4.6 4.3 3.9 2.8 2.3 6.4 3.4 3.1
Subtotal 39.2 24.4 18.9 11.6 10.3 9.3 22.0 14.9 12.7
Temperate productsMeats, fresh and processed 7.2 8.3 6.0 14.8 15.7 15.4 11.9 13.2 12.0Milk and milk products 0.3 0.7 1.1 7.9 7.9 7.6 5.0 5.5 5.2Grains, raw and processed 9.3 4.9 7.0 21.6 13.8 11.6 16.9 10.9 9.9Animal feed 7.5 7.9 8.5 7.7 5.1 5.3 7.7 6.0 6.4Edible oil and oil seeds 4.6 5.7 5.5 4.8 4.4 4.4 4.7 4.8 4.8
Subtotal 28.8 27.5 28.1 56.9 46.8 44.2 46.3 40.4 38.3
Seafood, fruits, and vegetablesSeafood, fresh and processed 6.9 15.9 19.4 5.5 8.2 8.0 6.0 10.8 12.2Fruits, vegetables, and cut 14.7 22.2 21.5 13.1 17.2 17.3 13.7 18.9 18.9
flowers
Subtotal 21.6 38.2 41.0 18.7 25.5 25.4 19.8 29.7 31.0
Other processed productsTobacco and cigarettes 2.6 3.1 3.3 3.0 4.2 4.8 2.8 3.8 4.2Beverages, alcoholic and 1.1 1.8 3.6 6.9 9.5 11.5 4.7 6.9 8.6
nonalcoholicOther products and 6.7 5.0 5.2 3.0 3.8 5.0 4.4 4.2 5.1
processed food
Subtotal 10.4 9.9 12.1 12.8 17.5 21.2 11.9 15.0 17.9
Total 100.0 100.0 100.0 100.0 100.0 100.0 100.0 100.0 100.0
Source: COMTRADE.

The Evolution of Agricultural Trade Flows 31
countries, compared with 46 percent from indus-trial countries.
Tariff escalation has slowed the growth of tradein final products. Shares of final products are muchhigher within trading blocs, where there are no tar-iffs, than as shares of exports to the rest of theworld. For example, in 2000–01 final products con-stituted 49 percent of intra-EU exports but 39 per-cent of EU exports to the rest of the world. ForNAFTA final products constituted 38 percent ofintra-NAFTA exports but 32 percent of NAFTAexports to the rest of the world. For developingcountries, however, the share of final products in2000–01 exports was the same (around 25 percent)for exports to developing countries and to indus-trial countries (table 2.15).
More detailed disaggregation of export flows bydegree of processing does not yield much moreinformation than the aggregate flows. The exportshare of final products increased for tropical andtemperate product groups. For seafood and fruitsand vegetables, the shares of final product stayedthe same because of the higher value of fresh pro-duce. In tropical products trade among industrialcountries is now primarily trade in final products.
Export Shares by Product and Region
Developing countries lost agricultural marketshares during the 1980s, mainly because theincrease in their shares of seafood and fruit andvegetable exports was not great enough to compen-sate for the decline in tropical product exports(table 2.16). During the 1990s developing countriesincreased their export shares for most productgroups, while the loss of market share in tropicalproducts slowed.
The geographical structure of developing-country exports has changed little since the 1980s.
Sub-Saharan Africa is the only region that has notmade up the market share losses of the 1980s.Despite preferential access, Africa’s export share inindustrial-country markets has halved. The otherregions made a comeback in the 1990s.
Conclusion
The incidence of poverty is much higher in ruralareas than in urban areas in developing countries,the average incomes are much lower, and even withrapid urbanization, the rural share of the poor willnot fall below 50 percent before 2035. In industrialcountries average farm household incomes arehigher than average household incomes. The sharesof nonfarm income in total farm householdincomes are much higher in industrial countriesthan in developing countries, partially shieldingfarmers from price and supply shocks. Finally, thedistribution of income is more equitable in ruralareas in developing countries than in urban areas,while the opposite is true for industrial countries.
Remarkably little structural change has occurredin global agricultural trade since the early 1980s,unlike the significant changes in global specializa-tion and trade in manufacturing. Unlike the casewith manufacturing, developing countries have notbeen able to increase their export shares in agricul-ture. They have maintained their global tradeshares by expanding exports to other developingcountries. Again unlike the case with manufactur-ing and services, trade-to-output ratios in agricul-ture have not increased. Import growth rates accel-erated in developing countries and decelerated inindustrial countries during the 1990s. These resultsare consistent with significant trade liberalizationin manufacturing in both developing and industrialcountries and reforms in agricultural trade regimesonly in developing countries. Developing countries
TABLE 2.14 Share of Agricultural Final Products in Exports, 1980–81 to 2000–01(percent)
Developing Developing Low- Developing Middle- IndustrialYears World Countries Income Countries Income Countriesa Countries
1980–81 27.3 15.5 6.6 17.4 33.81990–91 33.2 19.1 7 21.2 39.82000–01 38.3 24.8 10.4 27.8 45.6
a. Includes China and India.Source: COMTRADE.

32 Global Agricultural Trade and Developing Countries
TAB
LE 2
.15
Exp
ort
Sh
ares
by
Leve
l o
f P
roce
ssin
g, 1980
–81 t
o 2
000–0
1(p
erce
nt o
f wor
ld t
rade
)
Indu
stri
al t
oIn
dust
rial
to
Dev
elop
ing
toD
evel
opin
g to
Dev
elop
ing
Cou
ntri
esIn
dust
rial
Cou
ntri
esD
evel
opin
g co
untr
ies
Indu
stri
al C
ount
ries
Tota
l Exp
orts
Pro
duc
t19
80–8
119
90–9
120
00–0
119
80–8
119
90–9
120
00–0
119
80–8
119
90–9
120
00–0
119
80–8
119
90–9
120
00–0
119
80–8
119
90–9
120
00–0
1
Trop
ical
pro
duct
sRa
w1.
451.
311.
333.
022.
741.
613.
772.
142.
168.
864.
833.
3917
.10
11.0
38.
49Fi
nal
0.96
0.56
0.50
1.40
1.91
2.09
0.65
0.38
0.48
1.09
0.17
0.26
4.10
3.02
3.33
Tota
l2.
411.
871.
834.
424.
643.
694.
422.
522.
649.
955.
013.
6621
.20
14.0
511
.82
Tem
pera
te p
rodu
cts
Raw
10.1
06.
735.
6815
.31
14.6
412
.53
4.79
3.62
4.45
4.67
3.72
3.19
34.8
828
.71
25.8
5Fi
nal
2.61
2.07
2.74
7.40
7.90
7.22
0.56
0.69
1.30
0.86
1.05
1.23
11.4
411
.71
12.4
9To
tal
12.7
18.
808.
4222
.72
22.5
419
.75
5.36
4.31
5.75
5.53
4.78
4.42
46.3
240
.42
38.3
4
Seaf
ood,
frui
ts, a
nd v
eget
able
sRa
w1.
111.
181.
877.
6211
.81
10.2
31.
561.
892.
565.
218.
199.
1515
.50
23.0
723
.81
Fina
l0.
650.
390.
632.
614.
053.
820.
440.
470.
761.
392.
562.
915.
087.
478.
12To
tal
1.75
1.58
2.50
10.2
215
.86
14.0
52.
002.
363.
326.
6010
.75
12.0
520
.58
30.5
431
.93
Oth
er p
roce
ssed
pro
duct
sRa
w0.
600.
390.
491.
391.
320.
961.
330.
840.
991.
891.
411.
055.
223.
963.
49Fi
nal
1.37
1.85
2.42
4.63
8.16
9.67
0.33
0.51
1.04
0.36
0.51
1.29
6.69
11.0
314
.42
Tota
l1.
972.
242.
916.
029.
4910
.63
1.66
1.35
2.03
2.25
1.92
2.35
11.9
114
.99
17.9
1
Tota
l foo
d an
d ag
ricu
ltur
eRa
w13
.26
9.61
9.36
27.3
530
.51
25.3
311
.45
8.49
10.1
620
.63
18.1
616
.78
72.6
966
.77
61.6
3Fi
nal
5.59
4.87
6.29
16.0
322
.01
22.8
01.
982.
053.
583.
704.
295.
6927
.31
33.2
338
.37
Tota
l18
.85
14.4
815
.65
43.3
852
.52
48.1
213
.43
10.5
413
.75
24.3
322
.45
22.4
710
0.00
100.
0010
0.00
Not
e:“R
aw”
incl
udes
bot
h ra
w a
nd in
term
edia
te g
oods
, bec
ause
the
ir m
ovem
ents
are
hig
hly
corr
elat
ed.
Sour
ce:C
OM
TRA
DE.

The Evolution of Agricultural Trade Flows 33
TABLE 2.16 Export Shares by Product and Region, 1980–81 to 2000–01(percent of world trade)
Exports to Exports toDeveloping Countries Industrial Countries Total Exports
1980 1990 2000 1980 1990 2000 1980 1990 2000Item –81 –91 –01 –81 –91 –01 –81 –91 –01
Tropical productsIndustrial countries 2.4 1.9 1.8 4.4 4.6 3.7 6.8 6.5 5.5Developing countries 4.4 2.5 2.6 10.0 5.0 3.7 14.4 7.5 6.3
Americas 1.8 0.7 0.8 4.9 2.2 1.5 6.7 2.9 2.4East Asia And Pacific 1.1 0.7 0.6 1.5 0.9 0.8 2.5 1.6 1.3Europe and Central Asia 0.4 0.1 0.3 0.3 0.2 0.2 0.7 0.4 0.5Middle East and North Africa 0.1 0.1 0.2 0.1 0.1 0.1 0.3 0.1 0.2South Asia 0.5 0.5 0.3 0.4 0.2 0.2 0.9 0.8 0.5Sub-Saharan Africa 0.5 0.3 0.5 2.8 1.4 0.9 3.2 1.7 1.4
Subtotal 6.8 4.4 4.5 14.4 9.6 7.4 21.2 14.0 11.8
Temperate productsIndustrial countries 12.7 8.8 8.4 22.7 22.5 19.8 35.4 31.3 28.2Developing countries 5.4 4.3 5.8 5.5 4.8 4.4 10.9 9.1 10.2
Americas 2.2 1.3 2.7 2.1 2.3 2.2 4.3 3.7 4.9East Asia And Pacific 1.7 1.9 1.7 2.0 1.4 1.2 3.7 3.2 3.0Europe and Central Asia 0.7 0.5 0.5 0.7 0.7 0.6 1.3 1.2 1.2Middle East and North Africa 0.1 0.2 0.2 0.1 0.1 0.1 0.2 0.3 0.3South Asia 0.4 0.3 0.4 0.1 0.1 0.1 0.5 0.4 0.6Sub-Saharan Africa 0.3 0.1 0.1 0.5 0.2 0.1 0.8 0.3 0.3
Subtotal 18.1 13.1 14.2 28.2 27.3 24.2 46.3 40.4 38.3
Seafood, fruits, and vegetablesIndustrial countries 1.8 1.6 2.5 10.2 15.9 14.0 12.0 17.4 16.5Developing countries 2.0 2.4 3.3 6.6 10.7 12.1 8.6 13.1 15.4
Americas 0.4 0.4 0.8 2.2 3.8 4.3 2.6 4.1 5.1East Asia And Pacific 0.8 1.3 1.4 2.3 3.8 4.3 3.0 5.1 5.7Europe and Central Asia 0.2 0.2 0.4 0.7 1.2 1.3 0.9 1.4 1.7Middle East and North Africa 0.3 0.2 0.3 0.4 0.6 0.5 0.7 0.9 0.8South Asia 0.2 0.2 0.2 0.4 0.5 0.6 0.6 0.6 0.8Sub-Saharan Africa 0.1 0.1 0.2 0.7 0.8 1.0 0.8 0.9 1.2
Subtotal 3.8 3.9 5.8 16.8 26.6 26.1 20.6 30.5 31.9
Other processed productsIndustrial countries 2.0 2.2 2.9 6.0 9.5 10.6 8.0 11.7 13.5Developing countries 1.7 1.4 2.0 2.3 1.9 2.3 3.9 3.3 4.4
Americas 0.1 0.1 0.5 0.4 0.5 0.9 0.5 0.6 1.4East Asia And Pacific 1.2 0.9 1.0 1.3 0.8 0.8 2.5 1.7 1.8Europe and Central Asia 0.2 0.1 0.2 0.2 0.3 0.2 0.4 0.4 0.4Middle East and North Africa 0.1 0.1 0.2 0.0 0.0 0.0 0.1 0.1 0.2South Asia 0.1 0.1 0.1 0.1 0.1 0.1 0.2 0.2 0.1Sub-Saharan Africa 0.0 0.1 0.1 0.2 0.2 0.2 0.3 0.3 0.4
Subtotal 3.6 3.6 4.9 8.3 11.4 13.0 11.9 15.0 17.9
TotalIndustrial countries 18.9 14.5 15.7 43.4 52.5 48.1 62.2 67.0 63.8Developing countries 13.4 10.5 13.7 24.3 22.4 22.5 37.8 33.0 36.2
Americas 4.6 2.6 4.8 9.5 8.8 9.0 14.1 11.4 13.8East Asia And Pacific 4.7 4.8 4.8 7.1 6.9 7.1 11.8 11.7 11.9Europe and Central Asia 1.4 0.9 1.4 2.0 2.4 2.4 3.4 3.3 3.7Middle East and North Africa 0.7 0.6 0.9 0.6 0.8 0.7 1.3 1.4 1.5South Asia 1.2 1.1 1.0 0.9 0.9 1.0 2.1 2.0 2.0Sub-Saharan Africa 0.9 0.7 0.9 4.2 2.6 2.3 5.1 3.3 3.3
Total 32.3 25.0 29.4 67.7 75.0 70.6 100.0 100.0 100.0
Source: COMTRADE.

34 Global Agricultural Trade and Developing Countries
lost export market shares during the 1980s, mainlybecause of the collapse in the value of tropicalproducts, and made up the loss during the 1990s byincreasing their shares of other commodities.
Trade among industrial countries still domi-nates world agricultural trade flows, with much ofthe trade taking place within trading blocs, such asthe European Union and NAFTA. Trade amongdeveloping countries has expanded, especially dur-ing the 1990s, when most developing countriesgrew faster than they had in the past and liberalizedtheir trade regimes. The middle-income developingcountries have now become the biggest single mar-ket for the exports of low-income developing coun-tries. Despite the belief of many to the contrary,low-income countries have increased their tradesurplus in agricultural commodities over the lasttwo decades, especially during the 1990s.
Some change has taken place in the product mixof global agricultural trade. The shares of nontradi-tional products, such as seafood, fruits, and vegeta-bles, have increased, and the shares of traditionaltropical products have decreased. Seafood, fruits,and vegetables, and processed foods now constituteabout 50 percent of the agricultural exports ofdeveloping countries. Temperate zone products,such as grains, dairy, and meats, constitute another28 percent. Traditional exports, such as tea, coffee,cocoa, sugar, cotton, nuts, and spices, now consti-tute a very small share of exports. This suggests theneed for more attention to global and country poli-cies for nontraditional product groups.
There is also a move toward greater trade in finalproducts. However, most of this trade takes placewithin trade blocs, such as the European Union andNAFTA, primarily because of steeply escalating tar-iffs. Despite significant reforms, the EuropeanUnion has become more self-sufficient in agricul-ture, and its net trade deficit has shrunk. During the1990s, Japan became the biggest net importer ofagricultural commodities, followed by the AsianTigers: the Republic of Korea, Taiwan (China), HongKong (China), and Singapore. Sub-Saharan Africa isthe only developing-country region that has notregained the market share lost during the 1980s.
Although linking this lack of change to trade poli-cies is not straightforward, the next chapter showsthat agricultural trade policies tend to be much morerestrictive than manufacturing policies. This veryhigh protection in agriculture has slowed the move-
ment of production to more competitive producersand created much more static global trade flows.
Notes
1. Global poverty rates estimated on a consistent interna-tional poverty line of $1 a day are not disaggregated by rural andurban populations. Such disaggregated data are available onlyfor national poverty rates, which vary across countries, and thecountry coverage of these surveys is limited. Data here are from52 country household surveys conducted between 1990 and2001.
2. The information and data are not identical, however.There is a difference between rural households and farm house-holds. One is a locational definition, while the other is definedby the sources of income.
3. Of course, in most regions where agriculture is the pri-mary activity, income from nonfarm sources is also related toagriculture. In regions where there are other nonfarm-relatedactivities, or other transfers, the relationship between off-farmincome and farm income will not be so close.
4. Annex 2 in the attached CD-ROM has detailed productcoverage by degree of processing, description of the commoditygroups, the concordance between nomenclatures, the countrycoverage, country income and geographic classifications, anddetailed trade flows by more detailed commodity groups.
5. This study uses a broad definition of the agricultural sec-tor that includes fisheries as well as raw agricultural commodi-ties and processed food products. This classification includes allstages of processing and results in economically consistent dataseries. See the CD-ROM for the details of the coverage and defi-nition of subgroups. Data for the European Union-15 have beenused for all periods. Mexico is included in NAFTA and not indeveloping countries. For comparability over time, trade withinthe Commonwealth of Independent States is excluded fromdeveloping-country trade data for 1990–2001, as is trade withinthe former Yugoslavia and within the Southern African CustomsUnion. Data on imports are used in most cases, but export dataare used for the following countries and years: United ArabEmirates 2000–01, Bulgaria 1980–81 and 1990–91, GermanDemocratic Republic 1980–81, Iran 1980–81 and 1990–91,Kuwait 2000–01, Lebanon 1980–81 and 1990–91, Libya2000–01, Romania 1980–81, Sudan 1990–91, Soviet Union1980–81, South Africa 1990–91, China 1980–81, and intra-EUflows for 2000–01.
6. The deceleration of the world trade growth rates was notcaused by price declines in the 1990s. In nominal terms, importgrowth declined from 5.1 percent a year in the 1980s to 2.1 per-cent in the 1990s in industrial countries, while rising from1.4 percent to 4.3 percent in developing countries.
7. The price series are not consistent with the trade cate-gories so the disaggregated flows discussed in this section arebased on nominal trade data.
8. To have consistent data going back to 1980, this analysisuses Standard International Trade Classification (SITC 1), whichis not as precise as the Harmonized System in separating theproducts by degree of processing. Thus the results are not as pre-cise as they are under the Harmonized System classification.
References
Aksoy, M. Ataman, Z. Ersel, and B. Sivri. 2003. “Demand Growthversus Market Share Gains: Decomposing Export Growth inthe 1990s.” World Bank, Washington, D.C.

The Evolution of Agricultural Trade Flows 35
tries.” Directorate for Food, Agriculture, and Fisheries,Committee for Agriculture, Paris.
———. 2001. The Uruguay Round Agreement on Agriculture: AnEvaluation of Its Implementation in OECD Countries. Paris.
———. 2002. “Farm Household Income Issues in OECD Coun-tries: A Synthesis Report.” Directorate for Food, Agriculture,and Fisheries, Committee for Agriculture, Paris.
———. 2003. Farm Household Income: Issues and PolicyResponses. Paris.
Ravallion, Martin. 2001. “On the Urbanization of Poverty.”World Bank, Country Economics Department, Washington,D.C.
Silber, J., and S. Ozmucur. 2000. “Decomposition of IncomeInequality: Evidence from Turkey.” Topics in Middle Easternand North African Economics, Electronic Journal 2. Eco-nomic Association and Loyola University, Chicago.
World Bank. 2003. Global Economic Prospects 2004: Realizing theDevelopment Promise of the Doha Agenda. Washington, D.C.
Beghin, John C., and M. Ataman Aksoy. 2003. “AgriculturalTrade and the Doha Round: Preliminary Lessons From theCommodity Studies.” Paper presented at the Annual WorldBank Conference on Development Economics Europe Con-ference, May 15–16, Paris.
Eastwood, R., and M. Lipton. 2000. “Rural-Urban Dimensionsof Inequality Change.” University of Sussex, Brighton,United Kingdom.
Ingco, M. 1997.“Has Agricultural Trade Liberalization ImprovedWelfare in the Least-Developed Countries? Yes.” PolicyResearch Working Paper 1748. World Bank, Washington,D.C.
Nogues, Julio J. 2002. “Comment to ‘Trade, Growth, andPoverty—A Selective Survey’ by Andrew Berg and AnneKrueger, and ‘Doha and the World Poverty Target’ by L. AlanWinters.” Commentary presented at the Annual World BankConference on Development Economics, May 10–11,Brussels.
OECD (Organisation for Economic Co-operation and Develop-ment). 1999. “Low Incomes in Agriculture in OECD Coun-


supplying the world market with tropical com-modities that industrial countries could not easilyproduce. Some countries exported limited amountsof products, such as sugar and beef, in whichthey competed with industrial countries underpreferential-access programs. Many governmentslevied export taxes on agricultural products togenerate revenues while protecting manufacturingthrough high tariffs and other import restrictions.These countries also used price controls, exchangerate policies, and other restrictions to keep agricul-tural prices low for urban consumption. Thus, manypolicy analysts focused more on the taxation of agri-culture and its negative effects on supply in develop-ing countries than on protection in industrial coun-tries.2 In industrial countries the higher returnscreated by protection led to capital-intensive andsupposedly efficient agricultural sectors, creatingthe impression that their higher yields reflectedcomparative advantage rather than public support.
This pattern of incentives began to change withthe reforms in developing countries. Over the lasttwo decades many developing countries havemoved from taxing agriculture to protecting it.
Agricultural protection continues to be the mostcontentious issue in global trade negotiations.1
The high protection in industrial countries was themain cause of the breakdown of the Cancún Minis-terial Meetings in 2003. Although protection formanufacturing products in both industrial anddeveloping countries has declined significantly andoverall trade reforms have been adopted in devel-oping countries, agricultural protection in indus-trial countries has changed very little.
Until the 1990s industrial countries generally pro-tected agriculture while developing countries gener-ally taxed it (Krueger, Schiff, and Valdes 1992; WorldBank 1986). Industrial countries supported theiragricultural sectors through subsidies to producers,high tariffs, and other nontariff measures such asimport restrictions and quotas.While this protectionwas acknowledged in the economic literature and inglobal discussions, its implication for developingcountries received much less attention.
Until the late 1980s and 1990s many developingcountries generated a large portion of their agricul-tural gross domestic product (GDP) in lower-efficiency production for the domestic market,
37
3
GLOBAL AGRICULTURALTRADE POLICIES
M. Ataman Aksoy
Research support for this chapter was supplied by Baris Sivri and Konstantin Senyut. The author would like tothank John Beghin, Donald Mitchell, John Baffes, Harry de Gorter, and the reviewers for their comments. Someof the findings of this chapter have been incorporated into Beghin and Aksoy (2003) and World Bank (2003).
38 Global Agricultural Trade and Developing Countries
Most of this change has come not through increas-ing protection on agricultural products butthrough eliminating import restrictions and lower-ing tariffs on manufactured products, devaluingexchange rates, abandoning multiple exchange ratesystems that penalized agriculture, and eliminatingexport taxes (World Bank 2001; Jansen, Robinson,and Tarp 2002; Quiroz and Opazo 2000).
Meanwhile, reforms in most industrial countrieshave been modest—despite the inclusion of agri-culture under the World Trade Organization(WTO) Uruguay Round of international tradenegotiations. Increasing the incentives for agricul-tural production in many developing countrieswithout lowering the incentives in industrial coun-tries led to overproduction and price declines formany commodities, reducing opportunities formany developing countries to expand exports andrural incomes (see chapter 2).
This chapter evaluates both the broad trendsin agricultural protection and the structure ofprotection in key industrial and developingcountries. Specific issues, such as the impact ofpreferences, decoupled support, and other formsof protection, are covered in the following chapters,as are the structure and levels of protection forselected individual commodities.
Uruguay Round Agreement onAgriculture
Since the 1980s major reforms have been made inprotection regimes around the world, both throughunilateral reform of tariffs and quantitative importrestrictions and through undertakings within theUruguay Round of multilateral trade negotiations.Most developing countries have eliminated exporttaxes; average tariffs have declined rapidly; andother import restrictions, such as foreign exchangeallocations for import, have effectively disappeared(World Bank 2001).
Industrial countries have also started to reducedistortions in their agricultural trade policies.Agricultural trade policies were brought into theglobal trade negotiations for the first time in the1994 Uruguay Round Agreement on Agriculture(URAA). Before then, import barriers in agricul-ture were coupled with the widespread use ofproduction-related subsidies, such as price supports,which in some countries increased production abovethe competitive market equilibrium level.
With the intention of aligning agricultural traderules with the rules applying to trade in other goods,negotiators agreed that all barriers to imports, otherthan those in place for health and safety reasons,should be subject to tariffs only. Before agreeing ontariff reductions, countries had to convert all bordermeasures to their tariff equivalents—a processcalled tariffication—by calculating the differencebetween domestic and world market prices (theprice-gap method). Once tariff equivalents wereestablished, reductions were applied to bound tar-iffs. Developed countries were to reduce tariffs by anaverage of 36 percent and a minimum of 15 percentover 6 years. Developing countries had lower targetsof a 20 percent reduction and a minimum of 10 per-cent over 10 years.3 For cases of very high tariffs orimport quotas that had allowed in some imports,minimum and current market access opportunitieswere also negotiated. Usually, a minimal tariff rate(called a tariff rate quota, or TRQ) was set for a lim-ited volume of imports.
With the removal of nontariff measures, somecountries were concerned about not being able toprevent sudden surges in imports. To allay theseconcerns, negotiators agreed that a special agricul-tural safeguard could be applied to certain products.
The URAA offered limited opportunities forundertaking minimum import commitmentsfor certain products rather than adopting tariffs forthem. This option was taken by Japan, the Republicof Korea, and the Philippines for rice and by Israelfor certain sheep and dairy products. Japan andKorea have now tariffed their rice imports.
Similar efforts were made to reduce the distort-ing effect of subsidies. Subsidies were classified bydegree of distortion: a Red Box for prohibited sub-sidies, an Amber Box for subsidies that had to bereduced, and a Green Box for nondistorting subsi-dies. The negotiators decided to treat export subsi-dies separately, so the Red Box disappeared, andthe Amber Box became the core of the negotia-tions. A new Blue Box was created to cover directpayments to producers under production-limitingprograms that were considered to be less trade dis-torting than pure market price supports (Ingcoand Nash 2004).
Amber Box
To measure domestic support and establish a basisfor reductions, a total aggregate measure of support

was created based on support to agriculture duringthe base period, 1986–88. The measure coveredmarket price support and production-relatedsubsidies to farmers. Each country agreed to reduceits supports on the basis of this measure. Industrialcountries committed to reduce support by 20 per-cent by 2000, and developing countries committedto a 13.3 percent reduction by 2004. Countries withno Amber Box supports agreed not to use supportsover a de minimis level of 5 percent (10 percent fordeveloping countries) of the total value of agricul-tural production.
Green Box
To qualify as a Green Box measure, requiring noreduction, a subsidy must have no or almost notrade-distorting effect and must be providedthrough publicly funded government programs.Despite these general requirements, the Green Boxcovers a wide range of programs.
Blue Box
A special exemption from reduction commitmentscovers payments made under production-limitingprograms, provided that the payments are basedon fixed areas, crop yields, livestock numbers, or, ifthe payments are variable, on 85 percent of thebase level of production. These payments replacedtraditional market support payments in the Euro-pean Union (EU) and elsewhere that had led tooverproduction or had become too expensive tomaintain.
Evolution of Agricultural Protectionin Industrial and DevelopingCountries
Review of the experience with the new rules onmarket access, export subsidies, and domestic sup-port shows only modest effects. One reason is thatsupport levels were at historically high levels duringthe base period selected (1986–88). In some coun-tries, such as the United States, reforms undertakenbefore the negotiations were adequate to achievecompliance with the new rules on reducing domes-tic support (OECD 2001).
OECD Countries
Two different sets of data are available to estimatethe degree of protection in agriculture. The most
comprehensive coverage is for OECD (Organisationfor Economic Co-operation and Development)countries: all the industrial countries and a fewmiddle-income developing countries. The focus ison selected agricultural commodities that constitute60–70 percent of domestic agricultural output.Food processing and seafood are generally notcovered.
Agricultural protection in OECD countries ismeasured using three instruments. One is marketprice support, the difference between domestic andinternational prices caused by border barriers suchas tariffs and quantitative restrictions. It measuresthe total impact of border barriers on the prices ofdomestic production and is equivalent to borderprotection weighted by domestic production. Bor-der barriers are the major tool of protection andaccount for about 70 percent of total protection inOECD countries. A second instrument is directsupport, the direct production-related subsidiesgiven to farmers. A third is the general supportgiven to agriculture through research, training,marketing support, and infrastructure. This instru-ment is not usually included in overall productionsupport estimates. In addition, many countries havesubsidies for consumers. These subsidies generallydo not affect production and so are not included inproducer support estimates.
The second measure of support is the borderprotection measured by average tariffs, a measureavailable for all countries. Both the market supportprice and the average tariff rate are used to com-pare protection across time and across countries.Both measures have limitations. Average tariffsmeasure protection on all agricultural commodi-ties, including products that are not produceddomestically, while the market price support meas-ures show only the protection rate for locally pro-duced commodities. In countries such as theUnited States that produce a large number of agri-cultural commodities and have a diversified agri-cultural sector or in which the degree of protectionon locally produced and imported commodities issimilar, these two measures tend to be very close(figure 3.1). In countries such as Japan where localproduction is highly specialized or locally pro-duced commodities have different rates of protec-tion from imported commodities, the two meas-ures will differ much more. Average tariffs also failto give a clear picture of real protection for domesticproducers when the variances in tariff rates are large
Global Agricultural Trade Policies 39

and the peaks on key domestically produced com-modities are very high.
Average tariffs underestimate the real degree ofprotection given to local producers in industrialcountries and overestimate protection in theOECD developing countries (see figure 3.1). Thusthe low average tariffs in industrial countries,which are compared with higher average tariffsin developing countries, are highly misleading.Industrial countries protect commodities produceddomestically much more than commodities thatare not produced locally. Developing countries, incontrast, seem to protect commodities that are notproduced locally more than commodities that are.
Most of the analysis of protection in OECDcountries covers the post-1986 period because sys-temic data have been collected since then. Otherestimates, though not exactly comparable overtime, indicate that the 1986–88 baseline was aperiod of peak protection levels in the OECD (fig-ure 3.2) and that the significant increase in protec-tion took place during the 1960s and 1970s.
Since 1986–88, when data become more consis-tent, overall protection (total support) for agricul-tural producers in the OECD, including borderprotection and direct subsidies, fell from 63 percent
of gross agricultural output at world prices to45 percent in 2000–02 (table 3.1). The contributionof border barriers to total protection came downfrom 77 percent to about 63 percent. If the 1960sand 1970s are used as the base, however, protectionhas risen in most OECD countries.
The overall protection rate, which declined rap-idly after 1986 to a low of 42 percent in 1995–97,began to rise after 1997 as world agricultural pricesdeclined (figure 3.3). This recent increase is drivenboth by higher domestic prices compared withinternational prices and by increases in direct sup-port. This overall cyclical movement is observed inmost major countries and groups (EuropeanUnion, Japan, and the United States). The counter-cyclical movement of border protection indicatesthat the concept of full ad valorem tariffication isnot complete and that the instruments for increas-ing protection as global prices decline are still oper-ative. Direct subsidies also increased as world pricesdeclined because most direct subsidies are tied tothe differences between a floor and a world priceand increase when world prices decline.
The European Union and the United Statesmarginally reduced their overall support during1986–2002. In the European Union the prices
40 Global Agricultural Trade and Developing Countries
FIGURE 3.1 Market Price Support and Average Tariffs for Selected OECD Countries (percent)
0
20
40
60
80
100
140
120
Japa
n
Icelan
d
Norway EU
Canad
aUS
Slovak
Repub
licM
exico
Hunga
ry
Poland
Turke
y
Percent
Market price support Average tariffs
Note: Market price support figures are calculated using the 2000 and 2001 average except for the SlovakRepublic, which uses just the 2000 average.Source: Organisation for Economic Co-operation and Development and World Trade Organization IntegratedDatabase.
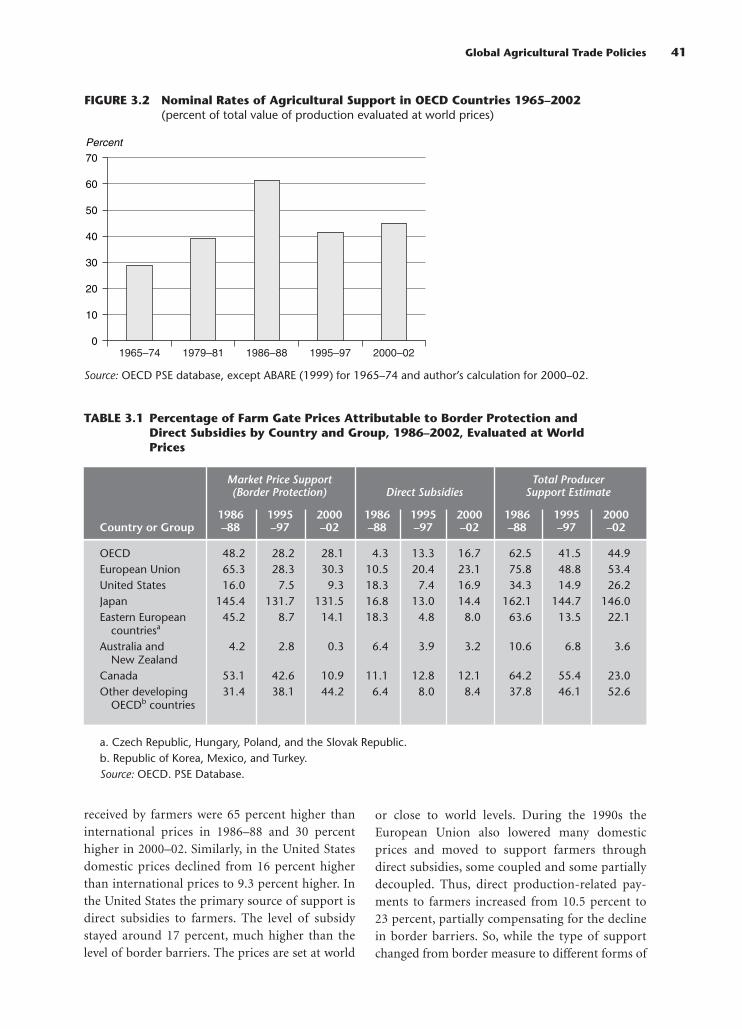
received by farmers were 65 percent higher thaninternational prices in 1986–88 and 30 percenthigher in 2000–02. Similarly, in the United Statesdomestic prices declined from 16 percent higherthan international prices to 9.3 percent higher. Inthe United States the primary source of support isdirect subsidies to farmers. The level of subsidystayed around 17 percent, much higher than thelevel of border barriers. The prices are set at world
or close to world levels. During the 1990s theEuropean Union also lowered many domesticprices and moved to support farmers throughdirect subsidies, some coupled and some partiallydecoupled. Thus, direct production-related pay-ments to farmers increased from 10.5 percent to23 percent, partially compensating for the declinein border barriers. So, while the type of supportchanged from border measure to different forms of
Global Agricultural Trade Policies 41
FIGURE 3.2 Nominal Rates of Agricultural Support in OECD Countries 1965–2002(percent of total value of production evaluated at world prices)
0
10
20
30
40
50
70
60
Percent
1965–74 1979–81 1986–88 1995–97 2000–02
Source: OECD PSE database, except ABARE (1999) for 1965–74 and author’s calculation for 2000–02.
TABLE 3.1 Percentage of Farm Gate Prices Attributable to Border Protection andDirect Subsidies by Country and Group, 1986–2002, Evaluated at WorldPrices
Market Price Support Total Producer(Border Protection) Direct Subsidies Support Estimate
1986 1995 2000 1986 1995 2000 1986 1995 2000Country or Group –88 –97 –02 –88 –97 –02 –88 –97 –02
OECD 48.2 28.2 28.1 4.3 13.3 16.7 62.5 41.5 44.9European Union 65.3 28.3 30.3 10.5 20.4 23.1 75.8 48.8 53.4United States 16.0 7.5 9.3 18.3 7.4 16.9 34.3 14.9 26.2Japan 145.4 131.7 131.5 16.8 13.0 14.4 162.1 144.7 146.0Eastern European 45.2 8.7 14.1 18.3 4.8 8.0 63.6 13.5 22.1
countriesa
Australia and 4.2 2.8 0.3 6.4 3.9 3.2 10.6 6.8 3.6New Zealand
Canada 53.1 42.6 10.9 11.1 12.8 12.1 64.2 55.4 23.0Other developing 31.4 38.1 44.2 6.4 8.0 8.4 37.8 46.1 52.6
OECDb countries
a. Czech Republic, Hungary, Poland, and the Slovak Republic.b. Republic of Korea, Mexico, and Turkey.Source: OECD. PSE Database.

direct support, there was very little reduction inoverall protection (see chapter 5).
Among the middle-income countries of theOECD, the Eastern European countries had thelargest reductions in protection, from about 64 per-cent in 1986–88 to 18 percent in 2000–02. TheRepublic of Korea always had very high protection,and it has stayed high, with small variations.Mexico and Turkey, which started with low protec-tion, increased it over this period, mainly throughhigher border protection.
These numbers support the hypothesis that theUruguay Round did not have a significant impacton the levels of agricultural support in OECDcountries, especially the large industrial countries(Ingco 1997; Messerlin 2002; Nogues 2003; OECD2001). Thus, despite the implicit promise by indus-trial countries that agriculture would follow thepath of manufacturing, with protection rates con-tinuously declining—one of the reasons developingcountries embraced trade liberalization—this hasnot happened.
Other Developing Countries
In contrast to the modest changes in agriculturalprotection in OECD countries, changes in protec-
tion in most developing countries have been signif-icant. From the 1960s to the 1980s, despite hightariffs on agricultural products, most developingcountries had negative total protection rates onagriculture, a result of both direct protection,including tariffs and taxes on agricultural products,and indirect protection caused by protection ofindustry and exchange rate overvaluation (Schiffand Valdes 1992; World Bank 1986). In a sample of15 developing countries studied by Schiff andValdes (1992), all but the 3 OECD middle-incomecountries had negative direct protection rates andnegative total protection rates on agriculture. Ofthe 3 OECD middle-income countries, the totalprotection rate was marginally positive for theRepublic of Korea and Portugal (table 3.2).
The average agricultural tariff in developingcountries declined from 30 percent in 1990 to18 percent in 2000, a significant drop (figure 3.4).4
These reductions were complemented by elimina-tion of import licensing, most export taxes, andmany quantitative restrictions (World Bank 2001).Overvaluation of exchange rates, the main sourceof the bias against agriculture, decreased or waseliminated during the 1990s in most developingcountries. On average, tariffs are now much higherin agriculture than in manufacturing, a reversal of
42 Global Agricultural Trade and Developing Countries
FIGURE 3.3 Rates of Agricultural Support in OECD Countries and Real U.S.Agricultural Price Index
0.0
10.0
20.0
30.0
40.0
50.0
60.0
70.0
80.0
0.00
20.00
40.00
60.00
80.00
100.00
120.00
140.00
Estimated protection Prices
Agricultural Support Real Prices
1986
1987
1988
1989
1990
1991
1992
1993
1994
1995
1996
1997
1998
1999
2000
2001
2002
Source: OECD for 1986–2001; author’s calculation for 2002. Agricultural price data is from the U.S.Department of Agriculture and is deflated by the manufacturing unit value index.

the tendency during the 1980s of greater protectionfor the industrial sector.
A study of 15 developing countries by Jansen,Robinson, and Tarp (2002) also concludes that thebias against agriculture had been largely elimi-nated. They find that by the end of the 1990s theeconomywide system of indirect taxes, includingtariffs and export taxes, significantly discriminatedagainst agriculture in only one country, was largelyneutral in five, provided a moderate subsidy toagriculture in four, and strongly favored agriculturein five. Quiroz and Opazo (2000), updating Schiffand Valdes (1992) for Latin America, also concludethat direct protection and protection due to highertariffs in manufacturing have fallen but thatexchange rates appreciated, reversing some of thelower protection for exportable commodities.
Current Structure of AgriculturalProtection
The overall support given to agricultural producersin OECD countries through higher domestic pricesand direct production-related subsidies was $228billion during 2000–02 (table 3.3). About 63 per-cent, or $143 billion, of this came from border bar-riers and market price support, and 37 percentfrom direct subsidies to farmers. The bulk of thesupport went to temperate-climate products suchas milk, meats, grains, and sugar.
Aggregate support levels in OECD countries varysignificantly. Iceland, Norway, and Switzerland havevery high levels of support, through both high borderprotection and high direct payments. At the otherextreme, Australia and New Zealand have very low
Global Agricultural Trade Policies 43
FIGURE 3.4 Average Most-Favored-Nation Applied Tariffs for Agricultural andManufacturing Products in Developing Countries, 1990–2000(percent)
0
5
10
15
20
25
35
30
Average tariff (percent)
1990 1995 2000
Agricultural products Manufacturing products
29.6
22.9
18.4
25.8
16.1
11.4
Note: Tariff rates are simple averages of countries’ unweighted tariffs.Source: TRAINS.
TABLE 3.2 Agricultural Protection Rates in Selected Developing Countries
Tax Due toGroup Direct Protection Industrial Protection Total Protection
Developing countriesa −13.0 −27.8 −35.7OECD middle-income countriesb 17.8 −28.4 −3.6
a. Argentina, Brazil, Chile, Colombia, Côte d’Ivoire, Dominican Republic, Egypt, Ghana, Malaysia, Morocco,Pakistan, Philippines, Sri Lanka, Thailand, and Zambia.b. Republic of Korea, Portugal, and Turkey.Source: Schiff and Valdes 1992, table 2-1.

support levels. Japan and the Republic of Korea havehigh support levels mainly through higher tariffs andquantitative restrictions. In between are the EuropeanUnion toward the higher end and Canada toward thelower end.
This section evaluates tariff regimes for agricul-tural products for 6 industrial and 24 developingcountries within the context of the objectives of theUruguay Round. The selection of countries wasconstrained by the lack of recent detailed tariffschedules for most countries.5
The countries are placed in four groups foranalysis: the Quad countries (Canada, the EuropeanUnion, Japan, and the United States); eight largemiddle-income countries with significant agricul-tural sectors (Brazil, China, India, the Republic ofKorea, Mexico, South Africa, Russian Federation,and Turkey); eight other middle-income countries,to ensure regional balance (Bulgaria, Costa Rica,Hungary, Jordan, Malaysia, Morocco, Philippines,and Romania); and eight low-income countries
(Bangladesh, Guatemala, Indonesia, Kenya, Malawi,Togo, Uganda, and Zimbabwe). The analysis focuseson tariffs because they are the only comparablemeasure of protection and support across countriesand because lower, more transparent tariff struc-tures were a key objective of the Uruguay Round.
Tariff Transparency
The objective of achieving greater transparency ofprotection levels through tariffication has not beenfully realized, especially in the key industrial coun-tries and some middle-income countries. Manytariffs are still specific, compound, or mixed, makingit almost impossible to estimate real protection lev-els, since these will change with the price of imports.Protection rates rise as the world prices of productsdecline, increasing protection levels for lower-pricedproducts originating from developing countries.6
Transparency in agriculture is significantlygreater in developing countries than in industrial
44 Global Agricultural Trade and Developing Countries
TABLE 3.3 Agricultural Support in OECD Countries, 2002–02(billions of U.S. dollars)
EasternUnited European Emerging European
Support States Union Japan Supportersa Countriesb Total OECD
Who receives supportProducers 46.97 92.19 47.50 30.49 4.41 227.54General services 24.29 8.02 12.25 5.98 0.57 53.08Consumers 22.24 3.64 0.42 0.97 0.06 34.26Total 93.50 103.85 60.17 37.44 5.05 314.88
Products that receive supportMilk 11.25 16.11 4.63 2.53 1.03 40.14Beef and pork 1.99 25.05 3.50 2.63 0.73 36.65Rice 0.92 0.25 16.47 7.21 na 25.00Wheat 3.99 8.97 0.89 0.36 0.31 15.31Corn 6.80 2.41 na 1.32 −0.10 10.64Other 22.02 39.40 22.00 16.46 2.45 99.81
Source of producer support Border measuresc 16.63 52.24 42.80 25.60 2.81 142.66Domestic measuresd 30.34 39.95 4.70 4.89 1.60 84.89
na – not applicable.a. Republic of Korea, Mexico, and Turkey.b. Czech Republic, Hungary, Poland, and Slovak Republic.c. Tariffs and tariff equivalents of other border measures.d. Direct payments to producers.Source: OECD 2003 and authors’ calculations.

countries (figure 3.5). Of the 24 developing coun-tries in the sample, only 4 have non-ad-valoremrates in more than 5 percent of tariff lines—Bulgaria(13.5 percent), South Africa (25 percent), RussianFederation (31 percent), and Turkey (6 percent)—allof them middle-income countries. Of the remaining20 countries, 4 have them in less than 5 percent oftariff lines, 5 in less than 1 percent; 11 have none.Within the Quad, Japan has specific, compound, ormixed rates in 15 percent of its tariff lines, Canadain 24 percent, the United States in 40 percent, theEuropean Union in 44 percent, and Norway, with thehighest share of any industrial country, in 54 per-cent. The European Union also has duties that varyaccording to the content of the products in 4 percentof its tariff lines, and the United States in 1 percent ofits tariff lines. Thus, transparency of tariff rates isconsistently weaker for industrial countries and afew middle-income countries than for most devel-oping countries.
The pattern of specific duties varies across coun-tries. In the United States almost all categories ofproducts have non-ad-valorem rates between 30and 60 percent of tariff lines. In the EuropeanUnion some product groups, such as milk, grains,sugar, and beverages have non-ad-valorem dutiesin more than 90 percent of tariff lines. In the devel-
oping countries that have specific duties, they areclustered within a few product groups. For exam-ple, in Malaysia they are on tobacco and alcoholproducts, in Mexico on chocolate and confec-tionary products, sugar, nuts, and spices.
Specific duties are found almost exclusivelyin agriculture. For example, in the United States,which has the highest percentage of non-ad-valorem duties in manufacturing, only 8 percent oftariff lines in manufacturing are non-ad-valorem,compared with 43 percent in agriculture. TheEuropean Union has almost no non-ad-valoremduties in manufacturing, but 44 percent of its tarifflines in agriculture have non-ad-valorem rates. Thusthe use of specific duties is not a general administra-tive arrangement but is limited to agriculture.
More detailed analysis of the incidence of spe-cific duties suggests that they are being used prima-rily as an instrument of disguised protection. First,the average ad valorem equivalents of specificduties, where available, are much higher than theaverage ad valorem rates, as shown for four coun-tries that reported the ad valorem equivalents ofnon-ad-valorem rates (table 3.4). This suggests thatreported average duties are seriously underesti-mated for countries with a large proportion ofnon-ad-valorem duties.
Global Agricultural Trade Policies 45
FIGURE 3.5 Non-Ad-Valorem Tariff Lines as a Share of Total(percent)
0
5
10
15
20
25
35
3031.3
3.1
9.3
5.7
2.60.1 0.2 0.5
Percentage of tariff lines
Quadcountries
Large middle-income
countries
Agriculture Manufacturing
Other middle-income
countries
Low-incomecountries
Note: Covers tariff lines with specific, compound, or mixed duties.Source: World Trade Organization Integrated Database (most-favored-nation applied duties).

Second, the share of tariff lines with non-ad-valorem duties increases with the degree of pro-cessing and is highest in final products, which aregenerally classified under food-processing indus-tries. For example, in the European Union, theshare of non-ad-valorem tariff lines is 22 percentfor raw materials but 43 percent and 58 percent forintermediate and final products (table 3.5). In theRussian Federation the share of non-ad-valoremduties in tariff lines is 12 percent for raw materialsbut 53 percent for final products.
Levels of Tariff Protection
The conversion of nontariff barriers to tariffs underthe Uruguay Round Agreement on Agriculture wasan important step forward, but in most industrialand developing countries average agricultural tar-iffs are much higher than average tariffs for non-agricultural products and continue to restrict trade(table 3.6).
The tariff data presented here, especially forindustrial and some middle-income countries,seriously underestimates actual border protectionfor domestic producers. Specific duties are notreflected in the averages, and they are generallyhigher than ad valorem rates (see table 3.4). Thereported ad valorem equivalents of specific dutiesfor the European Union and the United States aremuch higher than the ad valorem rates. Assumingthe same pattern for Canada and Japan, which havenon-ad-valorem rates for 25 percent and 15 percentof their tariff lines, respectively, Quad averagetariffs are being significantly underestimated. Thedegree of bias is indicated by the third column intable 3.6 showing the proportion of tariff lines towhich the average tariffs apply.
Except for Canada, which has a large proportionof non-ad-valorem tariffs without equivalents, aver-age tariffs are much higher in agriculture thanin manufacturing. The difference is especiallypronounced in the European Union, where the
46 Global Agricultural Trade and Developing Countries
TABLE 3.4 Average Ad Valorem and Specific Duty Rates(percent)
Country or Average ad Valorem Average ad Valorem Tariff Share of Non-ad-Group Tariff Equivalent of Specific Duties Valorem Lines
Australia 1.2 5.0 0.9United States 10.6 35.2 43.6European Union 21.6 58.0 40.4Jordan 8.1 11.7 0.8
Note: Average applied, out-of-quota, ad valorem, and ad valorem equivalents of non-ad-valorem tariffs forwhich equivalents are reported.Source: World Trade Organization Integrated Database (most-favored-nation applied duties).
TABLE 3.5 Proportion of Non-Ad-Valorem Tariff Lines by Degree of Processing (percent)
Country or Group Raw Intermediate Final
Norway 41.39 58.84 68.53European Union 22.05 45.27 57.54United States 37.91 43.05 41.34Canada 17.14 23.01 30.20Russian Federation 11.79 9.74 53.06Turkey 0 5.22 12.70
Note: Tariff Lines containing specific, compound, or mixed duties, as a percentage of all lines.Source: World Trade Organization Integrated Database (most-favored-nation applied duties).
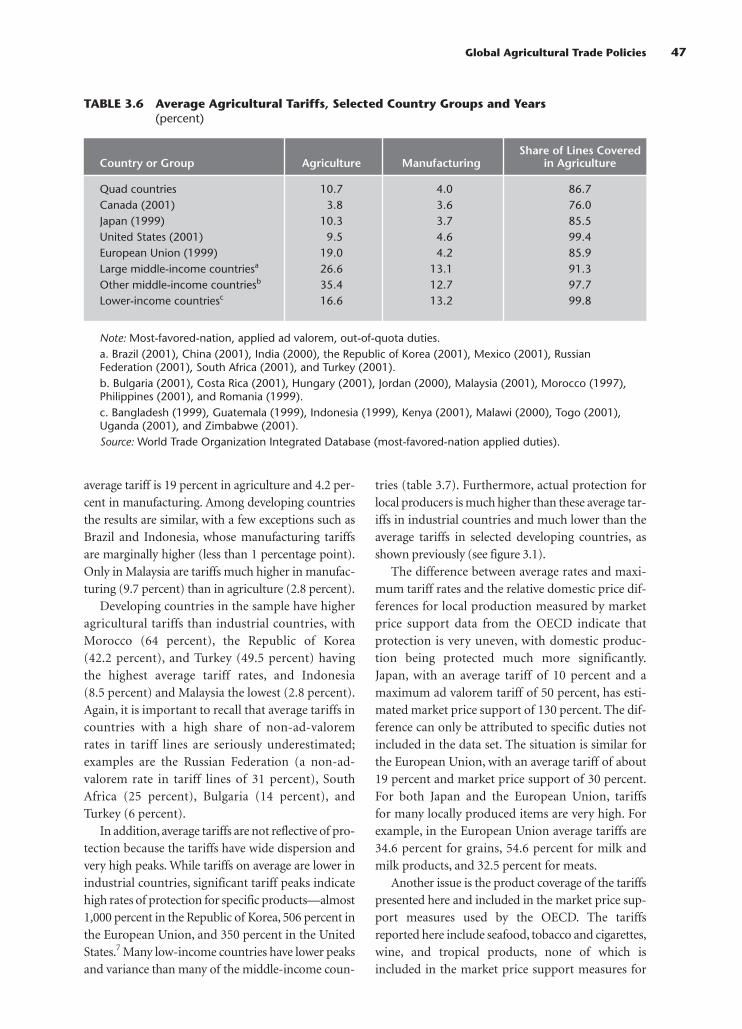
average tariff is 19 percent in agriculture and 4.2 per-cent in manufacturing. Among developing countriesthe results are similar, with a few exceptions such asBrazil and Indonesia, whose manufacturing tariffsare marginally higher (less than 1 percentage point).Only in Malaysia are tariffs much higher in manufac-turing (9.7 percent) than in agriculture (2.8 percent).
Developing countries in the sample have higheragricultural tariffs than industrial countries, withMorocco (64 percent), the Republic of Korea(42.2 percent), and Turkey (49.5 percent) havingthe highest average tariff rates, and Indonesia(8.5 percent) and Malaysia the lowest (2.8 percent).Again, it is important to recall that average tariffs incountries with a high share of non-ad-valoremrates in tariff lines are seriously underestimated;examples are the Russian Federation (a non-ad-valorem rate in tariff lines of 31 percent), SouthAfrica (25 percent), Bulgaria (14 percent), andTurkey (6 percent).
In addition, average tariffs are not reflective of pro-tection because the tariffs have wide dispersion andvery high peaks. While tariffs on average are lower inindustrial countries, significant tariff peaks indicatehigh rates of protection for specific products—almost1,000 percent in the Republic of Korea, 506 percent inthe European Union, and 350 percent in the UnitedStates.7 Many low-income countries have lower peaksand variance than many of the middle-income coun-
tries (table 3.7). Furthermore, actual protection forlocal producers is much higher than these average tar-iffs in industrial countries and much lower than theaverage tariffs in selected developing countries, asshown previously (see figure 3.1).
The difference between average rates and maxi-mum tariff rates and the relative domestic price dif-ferences for local production measured by marketprice support data from the OECD indicate thatprotection is very uneven, with domestic produc-tion being protected much more significantly.Japan, with an average tariff of 10 percent and amaximum ad valorem tariff of 50 percent, has esti-mated market price support of 130 percent. The dif-ference can only be attributed to specific duties notincluded in the data set. The situation is similar forthe European Union, with an average tariff of about19 percent and market price support of 30 percent.For both Japan and the European Union, tariffsfor many locally produced items are very high. Forexample, in the European Union average tariffs are34.6 percent for grains, 54.6 percent for milk andmilk products, and 32.5 percent for meats.
Another issue is the product coverage of the tariffspresented here and included in the market price sup-port measures used by the OECD. The tariffsreported here include seafood, tobacco and cigarettes,wine, and tropical products, none of which isincluded in the market price support measures for
Global Agricultural Trade Policies 47
TABLE 3.6 Average Agricultural Tariffs, Selected Country Groups and Years(percent)
Share of Lines CoveredCountry or Group Agriculture Manufacturing in Agriculture
Quad countries 10.7 4.0 86.7Canada (2001) 3.8 3.6 76.0Japan (1999) 10.3 3.7 85.5United States (2001) 9.5 4.6 99.4European Union (1999) 19.0 4.2 85.9Large middle-income countriesa 26.6 13.1 91.3Other middle-income countriesb 35.4 12.7 97.7Lower-income countriesc 16.6 13.2 99.8
Note: Most-favored-nation, applied ad valorem, out-of-quota duties.a. Brazil (2001), China (2001), India (2000), the Republic of Korea (2001), Mexico (2001), RussianFederation (2001), South Africa (2001), and Turkey (2001).b. Bulgaria (2001), Costa Rica (2001), Hungary (2001), Jordan (2000), Malaysia (2001), Morocco (1997),Philippines (2001), and Romania (1999).c. Bangladesh (1999), Guatemala (1999), Indonesia (1999), Kenya (2001), Malawi (2000), Togo (2001),Uganda (2001), and Zimbabwe (2001).Source: World Trade Organization Integrated Database (most-favored-nation applied duties).
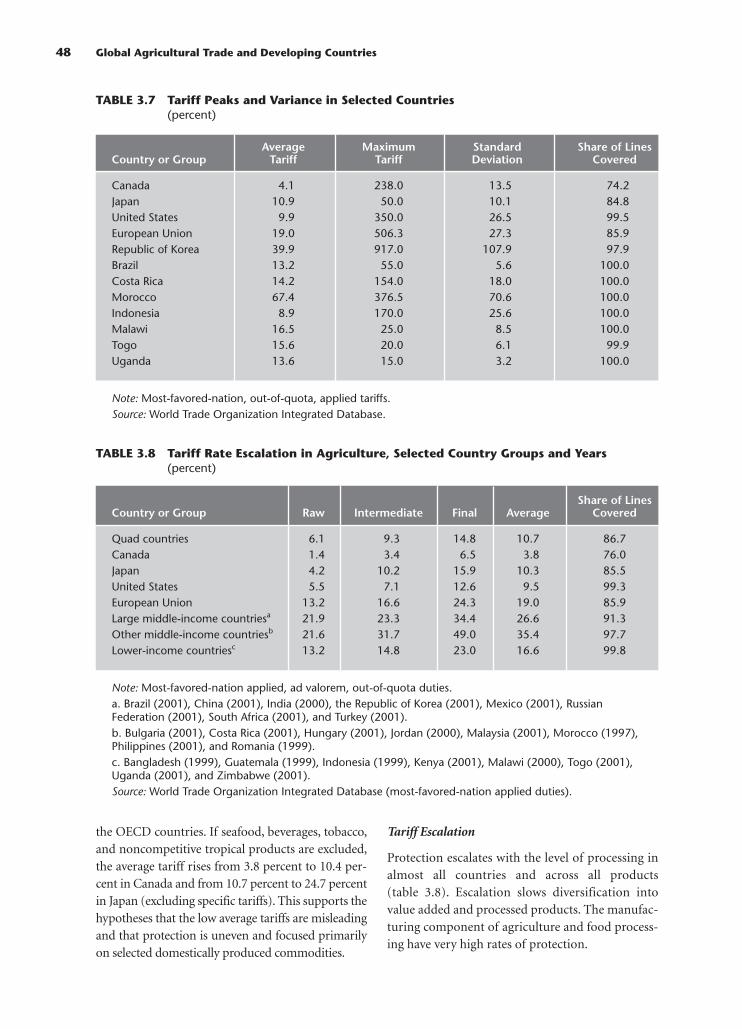
the OECD countries. If seafood, beverages, tobacco,and noncompetitive tropical products are excluded,the average tariff rises from 3.8 percent to 10.4 per-cent in Canada and from 10.7 percent to 24.7 percentin Japan (excluding specific tariffs). This supports thehypotheses that the low average tariffs are misleadingand that protection is uneven and focused primarilyon selected domestically produced commodities.
Tariff Escalation
Protection escalates with the level of processing inalmost all countries and across all products(table 3.8). Escalation slows diversification intovalue added and processed products. The manufac-turing component of agriculture and food process-ing have very high rates of protection.
48 Global Agricultural Trade and Developing Countries
TABLE 3.7 Tariff Peaks and Variance in Selected Countries(percent)
Average Maximum Standard Share of LinesCountry or Group Tariff Tariff Deviation Covered
Canada 4.1 238.0 13.5 74.2Japan 10.9 50.0 10.1 84.8United States 9.9 350.0 26.5 99.5European Union 19.0 506.3 27.3 85.9Republic of Korea 39.9 917.0 107.9 97.9Brazil 13.2 55.0 5.6 100.0Costa Rica 14.2 154.0 18.0 100.0Morocco 67.4 376.5 70.6 100.0Indonesia 8.9 170.0 25.6 100.0Malawi 16.5 25.0 8.5 100.0Togo 15.6 20.0 6.1 99.9Uganda 13.6 15.0 3.2 100.0
Note: Most-favored-nation, out-of-quota, applied tariffs.Source: World Trade Organization Integrated Database.
TABLE 3.8 Tariff Rate Escalation in Agriculture, Selected Country Groups and Years(percent)
Share of LinesCountry or Group Raw Intermediate Final Average Covered
Quad countries 6.1 9.3 14.8 10.7 86.7Canada 1.4 3.4 6.5 3.8 76.0Japan 4.2 10.2 15.9 10.3 85.5United States 5.5 7.1 12.6 9.5 99.3European Union 13.2 16.6 24.3 19.0 85.9Large middle-income countriesa 21.9 23.3 34.4 26.6 91.3Other middle-income countriesb 21.6 31.7 49.0 35.4 97.7Lower-income countriesc 13.2 14.8 23.0 16.6 99.8
Note: Most-favored-nation applied, ad valorem, out-of-quota duties.a. Brazil (2001), China (2001), India (2000), the Republic of Korea (2001), Mexico (2001), RussianFederation (2001), South Africa (2001), and Turkey (2001).b. Bulgaria (2001), Costa Rica (2001), Hungary (2001), Jordan (2000), Malaysia (2001), Morocco (1997),Philippines (2001), and Romania (1999).c. Bangladesh (1999), Guatemala (1999), Indonesia (1999), Kenya (2001), Malawi (2000), Togo (2001),Uganda (2001), and Zimbabwe (2001).Source: World Trade Organization Integrated Database (most-favored-nation applied duties).

Tariff escalation occurs in all types of products,not just those produced in industrial countries. Dataon products with low tariffs on raw commodities,both traditional products (coffee and cocoa) andnew products (fruits and vegetables, seafood), showthat tariff escalation is common to both (table 3.9).Tariffs are extremely low on the raw stages of tra-ditional products, whereas the final stages andprocessed products have extremely high tariffs. Sim-ilar tariff escalation is apparent in fruits and vegeta-bles, which are supposed to be less protected and inwhich developing country exports have expanded.
In addition, these averages mask very high peakson individual products. In the United States maxi-mum tariffs are 136 percent on final fruit productsand 186 percent on cocoa products. In the EuropeanUnion the maximum rates are 98 percent and 146percent on processed fruits and vegetables and 63 per-cent on cocoa products. And again, many of the finalproduct tariffs are non-ad-valorem, meaning that theaverages underestimate the full extent of high tariffs.
Tariff Rate Quotas
Tariff rate quotas, designed to ensure some degree ofmarket access despite protection, have resulted inmore complex tariff regimes. While the number oftariff lines under tariff rate quotas is small, theselines cover some of the main commodities producedin OECD countries. According to OECD data,almost 28 percent of domestic agricultural produc-tion is protected by tariff rate quotas. Rates rangefrom a high of 68 percent in Hungary to 38 percentin the European Union and 26 percent in the UnitedStates to 13 percent in Japan (figure 3.6). Australiaand New Zealand have no tariff rate quotas.
Export Subsidies
Although lower tariffs and the move toward directproduction subsidies are beginning to reduce theneed for export subsidies in agriculture (they havebeen illegal on nonagricultural products since
Global Agricultural Trade Policies 49
TABLE 3.9 Tariff Escalation in Selected Agricultural Product Groups (percent)
Product European Union United States Japan
Traditional tropical productsCoffee
Raw 7.3 0.1 6.0Final 12.1 10.1 18.8
CocoaRaw 0.5 0.0 0.0Intermediate 9.7 0.2 7.0Final 30.6 15.3 21.7
New expanding productsFruits
Raw 9.2 4.6 8.7Intermediate 13.3 5.5 13.2Final 22.5 10.2 16.7
VegetablesRaw 9.9 4.4 5.0Intermediate 18.5 4.4 10.6Final 18.0 6.5 11.6
SeafoodRaw 11.5 0.6 4.9Intermediate 5.1 3.2 4.3Final 16.2 3.5 9.1
Note: Most-favored-nation applied, ad valorem, out-of-quota duties. Source: World Trade Organization Integrated Database.

1955), export subsidies continue to distort worldmarkets. The European Union accounts for almost90 percent of all OECD export subsidies. TheUruguay Round Agreement on Agriculture placedlimits on export subsidies for individual commodi-ties but allowed some flexibility. With usage levelslow early in the implementation period, when worldprices were high, several countries carried forwardunused export subsidy credits for later use. Circum-vention, through the subsidy elements of exportcredits, export restrictions, and revenue-poolingarrangements in major products, is a concern.
Even if tariffs were eliminated altogether alongwith the official export subsidies, current agricul-tural production subsidies would keep the domesticand export price of many commodities lower thantheir costs of production in industrial countries. Bylowering production costs, production subsidiesfavor industrial-country producers over developing-country producers, who do not receive direct subsi-dies. Consider cotton subsidies in the EuropeanUnion and the United States. Tariffs are zero, anddomestic prices are the same as world or exportprices (Baffes 2004; Watkins 2003). Yet in the UnitedStates in 2001, production subsidies effectivelyincreased the prices farmers received (or reduced
their costs of production) by 51 percent, leading toincreased production that depressed the worldprice. U.S. export prices were 58 percent of the aver-age costs of production for wheat, 67 percent forcorn, and 77 percent for rice (Watkins 2003). Themove toward replacing border barriers with directsubsidies in industrial countries will increase theimportance of these implicit export subsidies.8
Implications of Reform
One trade reform proposal that would have cutagricultural tariffs substantially was put up byStuart Harbinson, chairman of the agriculturalnegotiations in the Doha Round of the WTO tradenegotiations (DRIFE 2003). The proposal wasrejected by industrial-country trade ministers astoo radical, however, and brought the CancúnMinisterial Meetings to a close. The implications ofthis proposal in terms of actual tariff outcomes ispresented below as an illustration.
Harbinson proposed that industrial countriescut average agricultural tariffs 60 percent on boundtariffs above 90 percent, 50 percent on bound tariffsbetween 15 and 90 percent, and 40 percent onbound tariffs below 15 percent.9 For developing
50 Global Agricultural Trade and Developing Countries
FIGURE 3.6 Share of Output under Tariff Rate Quotas(percent)
0
10
20
30
40
50
60
OECD ave
rage
Europ
ean
Comm
unity
United
Sta
tes
Japa
n
Easte
rn E
urop
e
Austra
lia, N
ew Z
ealan
d
Other
indu
strial
coun
tries
Other
dev
elopin
g co
untri
es
Percent
Source: OECD, Agricultural Market Access Database (AMAD).

countries and for products that are not consideredstrategic, average tariffs would be cut 40 percent forbound tariffs above 120 percent, 35 percent for tar-iffs between 60 percent and 120 percent, 30 percentfor tariffs between 20 percent and 60 percent, and25 percent for tariffs below 20 percent. These cutswould be implemented over 5 years for industrialcountries in equal installments and over 10 yearsfor developing countries (WTO 2003).
While the proposed cuts look significant—somegroups have called them radical—their impactwould not be as great as might appear. For develop-ing countries the key issue is reductions from thebound, not the applied, rates. Most developingcountries have bound their tariffs at relatively highrates, but applied rates are much lower. If cuts aremade to the bound rates, countries would get creditfor the unilateral reforms, but the reductions wouldnot lead to significant actual reductions in tariffs.
For the United States and the European Union,average effective tariffs would be halved by the end
of the reform process under an optimistic scenarioin which all tariffs are cut by the average rate fromthe applied rates (table 3.10).10 EU tariffs wouldcome down from 20 percent to about 10 percent,while U.S. tariffs would drop from 9 percent tobelow 5 percent. Even so, the average agriculturaltariffs in both areas would remain significantlyhigher than the average manufacturing tariffs of4.2 percent in the European Union and 4.6 percentin the United States. Tariff peaks would remainabove 200 percent in the European Union andabove 140 percent in the United States.
For developing countries the optimistic scenariolowers all the bound rates by the amount of theaverage cut. Cuts from bound rates do not signifi-cantly lower protection in most developing coun-tries. At the end of 10 years the Harbinson reformwould leave bound tariffs significantly above thecurrently applied rates in Costa Rica and India andonly marginally below the current applied rates inJordan and the Republic of Korea (table 3.11).
Global Agricultural Trade Policies 51
TABLE 3.11 Tariffs in Selected Developing Countries Before and After AverageReductions from Bound Rates (percent)
Costa Rica India Jordan Korea, Rep. of
Category Average Peak Average Peak Average Peak Average Peak
Before Harbinson 49.0 245.0 115.3 300.0 21.5 180.0 50.8 917.0After Harbinson 33.8 147.0 72.3 180.0 14.9 108.0 33.2 550.2Current applied rates 13.1 154.0 36.7 115.0 18.5 120.0 42.7 917.0
Note: The analysis excludes cigarettes and alcoholic drinks. Source: World Trade Organization Integrated Database.
TABLE 3.10 Tariffs in the European Union and the United States Before and AfterAverage Reduction from Applied Tariffs under the Harbinson Proposal(percent)
United States European Union
Before Harbinson After Harbinson Before Harbinson After Harbinson
Product Average Peak Average Peak Average Peak Average Peak
Raw 5.5 350.0 2.7 140.0 13.2 131.8 6.9 52.7Intermediate 7.1 159.3 3.8 63.8 16.6 284.8 8.3 113.9Final 11.7 180.8 6.2 72.3 26.8 506.3 13.1 202.5Overall 8.8 350.0 4.6 140.0 19.7 506.3 9.9 202.5
Note: The analysis excludes cigarettes and alcoholic drinks. Source: World Trade Organization Integrated Database.

Because these results would hold for most develop-ing countries, existing levels of protection in thedeveloping world would not be significantlyreduced under the Harbinson proposals or underany other proposals that start with bound rates.
Thus even significant cuts in tariffs by industrialand developing countries will leave agriculturalsectors with highly distorted tariff structures. Inaddition to average cuts, however designed, therehas to be an agreement on tariff peaks, whichshould be capped at reasonably low rates.
Conclusion
Within OECD countries, budgetary subsidies andsubsidies from consumers (through high tariffs andquantitative restrictions on domestic production ofselected commodities) to agricultural producerstotaled about $228 billion in 2000–02, or 45 percentof farm revenues. That was down from 62 percentin 1986–88 but is still very high. Some 63 per-cent of this support was through the higher pricesassociated with border protection and 37 percentthrough direct subsidies. In developing countriesalmost all support is generated through borderbarriers.
Average agricultural tariffs in industrial coun-tries, when they can be measured, are two to fourtimes higher than average manufacturing tariffs.Even at that, these averages seriously underestimatethe actual level of protection to local producers.Almost 30 percent of domestic production inOECD countries is protected by tariff rate quotas.More than 40 percent of the tariff lines in theEuropean Union and the United States include spe-cific duties, which make it difficult to calculateaverage tariffs, obscure actual levels of protection,and penalize developing countries that supplycheaper products. Tariff peaks as high as 500 per-cent confront imports from developing countries.Tariffs also rise by degree of processing, creating ahighly escalating tariff structure that limits accessto processed food markets.
Developing countries, too, have maintainedhigh border protection and have higher averageagricultural tariffs than industrial countries. Whatis worse, many of the protectionist developingcountries are middle-income economies, where thedemand for agricultural products is growing rap-idly. These countries are beginning to resemble
industrial countries in their structure of protection.More generally, as taxation of agriculture dimin-ishes in developing countries, reactive protection inresponse to industrial-country agricultural supportis increasing. Many developing countries haveincreased protection of domestic food productsagainst cheaper, subsidized exports from industrialcountries.
Although official export subsidies may be smalland shrinking, implicit export subsidies resultingfrom domestic support are increasing, lendingunfair advantage to industrial-country producers.In the United States and the European Union,domestic and export prices of cotton are thesame—but those prices are less than half the aver-age cost of production. Similar differences exist formany other products, a gap that will increase asindustrial countries move from protection throughborder barriers and high support prices to supportthrough coupled or partially decoupled subsidies.
Two other dynamics complicate protection.First, many agricultural policies are anticyclical,with protection increasing when agricultural pricesare low. Thus protection levels fell as commodityprices increased in the early 1990s and then roseagain as prices declined in the late 1990s. Second,rapid and sustained technical progress in agricul-ture has lowered the costs of production and thuslowered prices. Countries that have been able toenjoy the benefits of technological change havemanaged to maintain their production and com-pete with subsidized production.
Significant reforms are needed to make a dent inrural poverty in most developing countries (seechapter 2). Given the magnitude of the distortionsin the agricultural sectors in all countries, the pro-posals for reform have been quite modest. Yet eventhe modest proposals have not been accepted by thekey industrial countries.
A few simple issues stand out. Given the com-plexity of the protection regimes, all non-ad-valorem tariffs should be converted into advalorem tariffs. Variances in tariff rates are so highthat the only way to reduce protection significantlyis through binding ad valorem, nonseasonal tariffcaps that are gradually reduced to zero or to verylow levels. Otherwise, high tariffs on selected prod-ucts will continue under all modalities of reform.Finally, direct support programs have to be fullydecoupled from production in industrial and
52 Global Agricultural Trade and Developing Countries

middle-income countries (see chapter 5), and otherinstruments have to be used to support the ruralsector in these countries.
Notes
1. Annex 3 in the attached CD-ROM contains detailed tarifftables for 31 countries.
2. For example, most of the policy work on agricultural poli-cies in the World Bank in the 1970s and 1980s focused on supplyenhancement and the elimination of taxation of agriculture.
3. These were simple averages and were not weighted for thevolume of trade. Thus some countries made large reductions intariffs that were already low (from 2 percent to 1 percent, forexample, for a 50 percent reduction), while making only the min-imum reduction in sensitive product groups with high tariffs.
4. It has not been possible to generate consistent agriculturalmanufacturing and agricultural tariffs for earlier years.
5. The annex in the attached CD-ROM presents the detailedstructure of tariffs for the individual countries and the year forwhich the tariff information applies for each country. The yearsare also presented in table 3.6.
6. For example, EU duties on wine are 13 euros a hectoliter,or about $0.15 a bottle. For a $1 (c.i.f.) bottle of wine fromdeveloping countries such as Bulgaria and Moldova, that gives ahigh tariff rate of 15 percent. For a $10 dollar bottle of winefrom California, the tariff rate would be just 1.5 percent, a verylow one.
7. Peaks for the European Union and the United States are allspecific tariffs, whereas the variance and peaks for Canada andJapan probably do not reflect the real peaks because specificduties are excluded.
8. Elimination of the Peace Clause, which effectively prohib-ited legal action against implicit export subsidies, could changethe legality of having domestic costs much higher than exportprices. Decoupling payments to producers from production lev-els is another alternative that would allow income support tofarmers but eliminate its link with production decisions (seechapter 5).
9. These are average cuts, so actual cuts in each line could belower.
10. The European Union and United States were selectedbecause there are tariff equivalents for the specific duties. Thedata for the European Union are for 1999, the last year for whichthe tariff equivalents were available. The difference betweenbound and effective rates is very small in most industrial coun-tries and for ease of presentation, the reductions were takenfrom the effective rates.
References
ABARE (Australian Bureau of Agricultural and ResourceEconomics). 1999. “Reforming World Agricultural TradePolicies.” Research Report 99.12. Canberra.
Baffes, John. 2004. “Cotton: Market Setting and Policies.” Chap-ter 16 in this volume. World Bank, Washington D.C.
Beghin, John C., and M. Ataman Aksoy. 2003. “AgriculturalTrade and the Doha Round: Preliminary Lessons From theCommodity Studies.” Paper presented at the Annual WorldBank Conference on Development Economics Europe Con-ference, May 15–16, Paris.
DRIFE (Danish Research Institute of Food Economics). 2003.“Note on the Harbinson Draft on Modalities in the WTOAgriculture Negotiations.” Agricultural Policy ResearchDivision, Frederiksberg, Denmark.
Ingco, Merlindo. 1997. “Has Agricultural Trade LiberalizationImproved Welfare in the Least-Developed Countries?Yes.” Policy Research Working Paper 1748. World Bank,Washington, D.C.
Ingco, Merlindo, and John D. Nash. 2004. Agriculture andthe WTO: Creating a Trading System for Development.Washington, D.C.: World Bank.
Jansen, H. Tarp, Sherman Robinson, and Finn Tarp. 2002.“General Equilibrium Measures of Agricultural Policy Biasin Fifteen Developing Countries.” Discussion Paper 105.International Food Policy Research Institute, Trade andMacroeconomics Division, Washington, D.C.
Krueger, Anne, M. Schiff, and A. Valdes. 1992. The PoliticalEconomy of Agricultural Pricing Policy. A World Bank Com-parative Study. Baltimore: Johns Hopkins University Press.
Messerlin, Patrick A. 2002. “Agriculture in the Doha Round.”Paper presented at the World Bank Roundtable on PolicyResearch in Preparation for the 5th WTO Ministerial Meet-ing, May 20–21, Cairo.
Nogues, Julio J. 2003. “Agricultural Exports in a ProtectionistWorld: Assessing Trade Strategies for MERCOSUR.” Inter-American Development Bank, Trade and Integration Divi-sion, Washington, D.C.
OECD (Organisation for Economic Co-operation and Develop-ment). 2001. The Uruguay Round Agreement on Agriculture:An Evaluation of Its Implementation in OECD Countries.Paris.
———. 2003. Agricultural Policies in OECD Countries: Monitoringand Evaluation. Paris.
Quiroz, J., and L. Opazo. 2000. “The Krueger-Schiff-Valdés Study10 Years Later: A Latin American Perspective.” EconomicDevelopment and Cultural Change 49(1): 181–96.
Schiff, M., and A. Valdes. 1992. The Political Economy of Agricul-tural Pricing Policy: A Synthesis of the Economics in DevelopingCountries. Baltimore: Johns Hopkins University Press.
Watkins, Kevin. 2003. “Northern Agricultural Policies andWorld Poverty: Will the Doha ‘Development Round’ Make aDifference?” Oxfam. Paper presented at the Annual WorldBank Conference on Development Economics Europe Con-ference, May 15–16, Paris.
World Bank. 1986. World Development Report 1986. Washington,D.C.
———. 2001. Global Economic Prospects and the DevelopingCountries 2001. Washington, D.C.
———. 2003. Global Economic Prospects 2004: Realizing thePromise of the Doha Agenda. Washington, D.C.
WTO (World Trade Organization). 2003. “Negotiations onAgriculture First Draft of Modalities for the FurtherCommitments.” WTO Document TN/AG/W/1/Rev.1. Geneva.
Global Agricultural Trade Policies 53


of origin for many processed products, haveseverely limited the role of trade preferences inencouraging agricultural diversification in develop-ing countries. Many countries remain dependenton the export of staple products, for which worldprices have fluctuated wildly.
While the United States, the European Union(EU), and Japan all offer preference schemes, com-paring them is difficult since each scheme differs inimportant respects: the group of eligible countries,the products covered, and the magnitude of thepreference granted. Administrative requirements,especially rules of origin, also vary across schemesand across products. These differences are a majorweakness of the current system of preferences.
This chapter reviews these schemes, concentrat-ing on the preferences offered to least-developedcountries, and discusses some of the key problemswith preferences:
• They are unilateral concessions from industrialcountries that must be renewed, and specificproducts can be withdrawn at short notice,creating too much uncertainty to stimulate newinvestment.
Improving the ability of the least-developed coun-tries (LDCs) to participate fully in world marketscan accelerate development and poverty reduction.Their dependence on agriculture, together with thehigh duties levied on many agricultural imports byindustrial countries, suggests that preferences onagricultural products could help boost exports andgrowth in developing countries.
In practice, however, preferences have had littleimpact for most developing countries. First, manyagricultural products produced in developingcountries are subject to zero duties in industrialcountries, and therefore no trade preference can begiven. Usually these are tropical products thatare not produced in industrial countries. Second,the primary agricultural products and processedproducts with very high duties are typicallyexcluded from preferences or the preference marginis very small. For a small number of products, how-ever, preference margins are substantial, althoughusually within strict quantitative limits and only forcertain countries. Countries that have been grantedpreferential access for sugar and tobacco, for exam-ple, have received large transfers because of prefer-ences. These factors, together with restrictive rules
55
4 THE IMPACT OF AGRICULTURAL
TRADE PREFERENCES, WITHPARTICULAR ATTENTION TO
THE LEAST-DEVELOPEDCOUNTRIES
Paul Brenton andTakako Ikezuki
The authors are grateful for the comments of M. Ataman Aksoy and Harry de Gorter.

56 Global Agricultural Trade and Developing Countries
• The most highly protected products, with thehighest potential margins of preference, areoften excluded or receive only small preferencemargins.
• Rules of origin for processed products constrainthe ability of countries to expand into theseproducts.
• Differences and inconsistencies between prefer-ence schemes prevent developing-country sup-pliers from developing global market strategies.
If trade preferences are to assist developingcountries,
• The schemes should be made permanent andcomprehensive, with no product exclusions.
• They should be harmonized, preferably at theWorld Trade Organization (WTO), with com-mon and simple rules of origin.
• The domestic investment environment in bene-ficiary countries must be improved so thatproducers and investors can exploit the oppor-tunities that arise from trade preferences todevelop competitive businesses that will surviveonce those preferences are eroded.
• Developing countries need to diversify into abroader range of exports and not becomedependent on the preferential access granted fora narrow range of products.
• Beneficiaries should ensure preferences are inte-grated as one element of a strategy for broad-based export expansion.
• Preferences for a small group of developingcountries should not act as a brake on the multi-lateral liberalization of agricultural productsunder the WTO. Many developing countriesreceive little or nothing from preferences butwould gain from a reduction of subsidies in richcountries (which, for example, would benefitcotton producers in Western Africa) and frommultilateral tariff reductions in all countries.Such liberalization can be achieved only throughnegotiations at the WTO.
Trade Preferences in Principle andin Practice
Trade preferences allow products from developingcountries to enter industrial-country markets withlower import duties than are applied to other
countries’ products under the importing country’smost-favored-nation (MFN) tariffs. The principalscheme governing such preferences is the General-ized System of Preferences (GSP), which originatedin the work of the United Nations Conference onTrade and Development (UNCTAD) in the 1960sto introduce a harmonized preference schemeacross donor countries (UNCTAD 2001). Becausepreferences for particular countries are at oddswith the fundamental nondiscrimination principleof the General Agreement on Tariffs and Trade(GATT) and the WTO, the Decision on Differentialand More Favorable Treatment, Reciprocity, andFuller Participation of Developing Countries(called the Enabling Clause) was adopted under theGATT in 1979 to allow industrial countries to offermore favorable treatment to developing countrieson a nonreciprocal basis.
Potential Benefits of Trade Preferences
Tariffs introduce a wedge between the world priceof a product and the price in the domestic market.Tariff preferences give suppliers in beneficiarydeveloping countries access to part or all of thisprice premium that normally accrues to theimporting-country government as tariff revenue.The acquisition of these rents raises returns in thedeveloping country and, depending on the natureof competition in domestic product and factormarkets, stimulates expansion of the activityconcerned, with implications for wages andemployment.
The arguments underlying trade preferences arethat the small scale of industry and the low level ofdevelopment in developing countries lead to highcosts, which reduce the ability to compete in globalmarkets, and to lack of diversification, whichincreases risks. Developing countries, especiallyleast-developed countries, face much higher trade-related costs than other countries in getting theirproducts into international markets. Some of thesecosts may reflect institutional problems within thecountries themselves, such as inefficient practicesand corruption, and these problems require adomestic policy response. But some costs alsoreflect weak transportation infrastructure in manycountries and firms’ lack of access to standardtrade-facilitating measures such as insurance andtrade finance.

Trade preferences can provide the premium overthe normal rate of return that is required toencourage investment in these economies. Theincrease in trade attributable to preferences leads tomore output and, if there are scale economies, tolower costs, which stimulate further trade.1 It isimportant, however, that the sectors that receivepreferences and investment are those in which thecountry has a comparative advantage in the longterm and that investment not be based on a falsecomparative advantage based on the margin ofpreference.
Why Do Trade Preferences Fall Shortof Their Potential?
Assessments of the impact of trade preferences sug-gest that they have not transformed the export andgrowth performance of most developing-countrybeneficiaries, although performance may have beenworse without them and a few countries may havebenefited substantially. Trade preferences have notenabled beneficiaries as a group to increase theirmarket shares in the main preference-grantingmarkets.2 Why?
UNCTAD’s objectives of harmonizing prefer-ence regimes across countries and making prefer-ences general and nondiscriminatory among devel-oping countries were never achieved. Industrialcountries have often excluded the most heavily pro-tected products, many of which offer the greatestscope for gains by developing countries. The seg-mented markets for preferential-access goods makethe program a weak mechanism for integratingdeveloping countries into the world economy.
Industrial countries that grant preferences uni-laterally determine which countries and whichproducts are included in their schemes and whatrules govern the provision of preferences—andgraduation from the program. Preference schemestypically are not permanent programs but requirelegislative renewal. And preference-granting coun-tries have the discretion to remove countries andproducts from the program, creating uncertaintyand discouraging investment in developing coun-tries to exploit available opportunities. Recently,however, the European Union introduced the Every-thing but Arms program for the least-developedcountries, introducing an element of permanencyinto preference schemes for the first time.
Most highly protected products are excludedfrom preference schemes. When preferences aregranted on some products for which domesticprices in industrial countries are much higher thanworld prices, such as sugar in the European Union,traded quantities are limited to avoid underminingthe distortionary policies that generate the largedivergence between domestic and world prices.Nevertheless, in these instances preferential accesscan lead to substantial gains for preferred suppliers.
How much of the available rents are actuallyobtained by suppliers in developing countriesdepends on the nature of competition in the indus-try and the rules and regulations governing thegranting of preferential access, among other fac-tors. If there is little effective competition amongbuyers, then exporters may be unable to acquiremuch of the price premium. Ozden and Olarreaga(2003) find that only a third of the available rentsfor African exports of clothing to the United Statesunder the African Growth and Opportunity Act(AGOA) actually accrue to exporters. Furthermore,satisfying the rules governing preferences raisescosts and reduces the extent to which the prefer-ences raise actual returns. The cost of satisfying therules of origin in preferences schemes is a majorreason for low rates of utilization (UNCTAD 2001;Brenton and Imagawa 2004).3
Undesirable Effects of Preference Schemes
Tariff preferences can lead to several adverse effects.Negotiations under the Doha Round have shownthat preferences can be used to bolster external sup-port for highly protectionist policies in industrialcountries and to weaken proposals that would sub-stantially reduce such levels of protection. Prefer-ences can also create a degree of dependence thatconstrains flexibility and diversification and resultsin high-cost production of preferred products(Topp 2001). And the beneficiaries of trade prefer-ences are not always the poorest constituents indeveloping countries. When rents do accrue to thedeveloping country, they tend to accrue to the own-ers of the most intensively used factors. Withagricultural preferences, the main beneficiaries arethe owners of land. Preferences could have a strongimpact on poverty if the landowners are poor or,when they are not poor, if policies for redistribu-tion are in place. So even when preferences create
The Impact of Agricultural Trade Preferences, with Particular Attention to the Least-Developed Countries 57

substantial transfers for producers in developingcountries, they may not necessarily stimulate thelong-term growth of exports or reduce poverty, andthey can lead to a less-diversified export base.
The Nature and Impact ofPreferences Offered by the UnitedStates, the European Union,and Japan
The impact of a particular scheme of trade prefer-ences on individual countries is determined byseveral factors:
• The scope of preferences in terms of the range ofproducts covered.
• The importance of products eligible for prefer-ences in the export and production structure ofthe beneficiary country.
• The margins of preference, determined by theheight of the MFN tariff and the size of thepreference.
• Actual utilization of preferences. To a largeextent this reflects the costs of satisfying therules, mainly the rules of origin, governing pref-erences. If the costs of compliance exceed themargin of preference, the preference will notbe used.
• The extent to which preferences facilitate diver-sification into a broader range of products. Thisis determined by the coverage of the scheme, themargins of preference on products not currentlyexported, and the rules of origin relating tothese products.
Whether such preference opportunities areactually exploited depends on the domestic invest-ment environment in the beneficiary country andthe extent to which legal characteristics of the pref-erence scheme constrain investment decisions. Theeconomic impact of the preferences offered by theUnited States, the European Union, and Japan varyenormously across beneficiary countries. For somecountries exports are dominated by products thatdo not receive preferences, and there has been littlesuccess in diversification. This is especially the casefor countries dependent on products that are cur-rently subject to zero import duties in developedcountries, such as coffee and cocoa. For other coun-tries, however, all exports are eligible for prefer-
ences to a particular market and the potentialimpact of preferences is much greater. The actualutilization of preferences, from very low rates to fullutilization, also varies substantially across coun-tries. Also of importance is that utilization ratestend to be lower for processed products.
The Scope of Preferences
Whether trade preference schemes assist the inte-gration of developing countries into world marketsdepends on the breadth of the preferences offeredin terms of the number and importance of eligibleproducts.
Products subject to tariff quotas complicate theassessment of the impact of trade preferences. Dur-ing the Uruguay Round of world trade negotia-tions, industrial countries agreed to reduce tariffson a range of sensitive agricultural products butonly for limited quantities of imports, often creat-ing two or more tariff lines for each product: theduty on in-quota quantities and the duty (oftenvery high) on additional out-of-quota imports.Preferences are offered on the in-quota quantitiesonly, and once the quota is reached, preferences areno longer available. Quotas can be global (availableto all eligible countries) or bilateral (limits are spec-ified for a particular country). With bilateral limits,quantities may not be sufficient to induce invest-ments in raising capacity, whereas for preferencesbased on global tariff quotas, uncertainty overwhen the quota will be filled dampens interest ininvestment or even in exporting.
Thus the lack of preferences for out-of-quotaquantities is important in assessing the impact ofpreference schemes. The analysis here includes out-of-quota rates in calculating the average duty onproducts not covered by preferences even if the quo-tas are not exceeded, because of the discouragingimpact of the tariff quotas. This approach differsfrom that of preference-giving countries, which typ-ically assume that if exports from a preference-receiving country or group of countries do notexceed the preferential quota, the product is fullycovered by the scheme and the out-of-quota ratesare not relevant. Of course, the obvious response isthat if the out-of-quota rates are not relevant, thereis no reason not to offer full duty- and quota-freeaccess.
58 Global Agricultural Trade and Developing Countries

U.S. Preferences under the GSP and AGOA
The United States has offered preferences under theGeneralized System of Preferences (GSP) since themid-1970s, with a significant increase in coveragefor low-income countries in 1997. The current GSPprogram expires at the end of 2006. In 2003, 143developing countries were eligible for preferencesunder the GSP. There are no partial preferences, sothe preferential rate on all included products iszero. However, the preferences can be withdrawn atany time. In addition, the GSP contains safeguardsin the form of benefit ceilings for each product andcountry, known as competitive need limitations(these do not apply to LDCs). A country loses itsGSP eligibility for a product if it supplies more than50 percent of U.S. imports of that product or if itsexports exceed a certain dollar value.4
The African Growth and Opportunity Act of2000 offers improved market access to 48 Sub-Saharan African countries subject to certain criteriaregarding basic human rights and the rule of law.The competitive needs limitations of the GSP donot apply to AGOA preferences. The currentscheme expires in 2015. So far, 38 countries havebeen granted eligibility for AGOA preferences.
The average duty on agricultural goods fromcountries that do not receive preferences in theUnited States is 7.3 percent (table 4.1). The prefer-ences available under the GSP for non-LDCsreduce the average tariff to 6.2 percent. The impactof the GSP on LDCs is more substantial, reducingthe average tariff to just under 4 percent. AGOA has
little impact on the LDCs, reducing the averagetariff by just 0.2 percentage points, but it offersnon-LDCs enhanced preferences similar to thoseavailable to LDCs under the GSP. All these averagetariffs include the out-of-quota duties for tariffquota products.
Comparing MFN duties on the products cov-ered by preferences and average duties on productsexcluded from preferences shows that the averagemargin of preference on products under the GSP is3.6 percent for non-LDCs and 5 percent for LDCs(table 4.2). AGOA enhances the preferences avail-able for non-LDCs by including products subject toan average duty of 7 percent. However, the averagetariff on products excluded from preferences ismore than 30 percent. The GSP and AGOA do notaffect the maximum duty that can be applied toimports from LDCs (more than 160 percent forgroundnuts, an important product for a number ofAfrican countries).
The duties shown in tables 4.1 and 4.2 areunweighted averages. They do not capture actualduties being levied on developing-country exportsbut rather the duties that would apply if developingcountries exported a completely diversified bundleof agricultural products. In practice, the dutiesactually levied on many countries are close to zerosince these countries export a bundle of exports
The Impact of Agricultural Trade Preferences, with Particular Attention to the Least-Developed Countries 59
TABLE 4.1 Average Unweighted Tariffs onAgricultural Products in theUnited States, 2003 (percent)
Category Non-LDC LDC
MFN rates 7.3 7.3GSP beneficiaries 6.2 3.9AGOA beneficiaries 3.8 3.7
Note: Because of the potential effect on decisionsto export and invest, average tariffs include out-of-quota tariffs on tariff quota products even ifquotas are not filled.Source: Calculated using data from U.S. Interna-tional Trade Commission dataweb.
TABLE 4.2 Average Unweighted MFNTariffs on Agricultural ProductsCovered by GSP and AGOA inthe United States, 2003 (percent)
Category Non-LDC LDC
Total GSP 3.6 5.4GSP 3.6 3.6GSP LDC — 7.0
Total AGOA 7.0 9.4Excluded lines 32.5 32.8
— Not availableNote: Data for calculated duties and customsvalue for the GSP group were used to derive advalorem equivalents for specific duties. Whenthere are zero duties from the GSP group ofcountries, data for total imports were used tocalculate the ad valorem equivalent.Source: Calculated using data from U.S. Interna-tional Trade Commission dataweb.

concentrated on zero or low-duty products. Devel-oping countries in Africa currently export almostno products that are subject to tariff quotas—themain exceptions are sugar and tobacco. But thismay simply reflect the fact that very high duties canbe levied once the quota is reached.5 Liberalizationof many of these products under AGOA or GSP isunlikely to have a substantial impact on trade in theshort term, but it could encourage investment infuture capacity in certain countries.
Data on the number of tariff lines liberalizedunder U.S. preference programs show that a quar-ter of tariff lines already have zero MFN duties(table 4.3). For the LDCs, AGOA liberalizes only anadditional 26 agricultural tariff lines, or less than2 percent of the total number of agricultural linesand just under 12 percent of the remaining dutiablelines (those lines for which the MFN duty is notzero). The main products liberalized under AGOAhave already been liberalized for LDCs under theGSP. For non-LDCs, AGOA adds 541 products tothe 519 products already eligible for duty-free pref-erences for developing countries under the GSP.Hence, the potential impact is much greater fornon-LDCs.6
Under AGOA more than 200 agricultural tarifflines have MFN duties but no preferences. Theseamount to 17 percent of the number of dutiableagricultural tariff lines in the U.S. schedule,although they protect much more than 17 percentof U.S. agricultural production. More than 150 ofthese lines relate to the over-quota rates for prod-ucts subject to tariff rate quotas. These productsinclude certain meat and dairy products, many
sugar products, chocolate, prepared foodstuffs, andtobacco products.
EU Preferences under the GSP and CotonouAgreement
The current GSP scheme of the European Union,which runs to the end of December 2004, has twocategories of products: nonsensitive, for whichduties are suspended; and sensitive, which face aflat rate reduction of 3.5 percentage points from theMFN rate. A number of products, including meats,dairy products, certain vegetables, cereals, someprepared foodstuffs, and wine are entirely excludedfrom the scheme. Among eligible products, propor-tionate reductions are high for most industrialproducts, for which the average MFN tariff is 4 per-cent, but relatively low for many agricultural prod-ucts, for which the average MFN tariff is almost20 percent. The EU tariff structure for agriculturalproducts is extremely complicated, with more than45 percent of product lines subject to non-ad-valorem duties. This complexity is reflected in sim-ilar complexity in preferences granted.
Specific duties, those based on physical ratherthan monetary values, are reduced by 30 percent,except when they are combined with ad valoremduties (as in a range of processed agricultural prod-ucts of interest to developing countries), when theyare not reduced. Typically, the specific duties pro-vide the greatest part of the protection on theseproducts. For a number of products, primarilyfruits and vegetables, the European Union applies asystem of minimum reference prices that vary by
60 Global Agricultural Trade and Developing Countries
TABLE 4.3 Number of Agricultural Tariff Lines Liberalized under GSP and AGOAPrograms in the United States, 2003
Category Non-LDCs LDCs
Total tariff lines 1,723 1,723Total GSP 519 1,038
GSP LDC 519 (38) 547 (158)AGOA 541 (120) 26Duty-free lines 440 440Dutiable lines (MFN) 223 219
Note: The numbers in parentheses are the number of product lines relating to in-quota duty rates forproducts subject to tariff quotas.Source: Calculated using data from U.S. International Trade Commission dataweb.

The Impact of Agricultural Trade Preferences, with Particular Attention to the Least-Developed Countries 61
season, despite the dubious compatibility of theapproach with WTO rules. This can lead to a verycomplex structure of preferences (box 4.1). Mini-mum duties specified in the European Union’sCommon Customs Code do not apply to productscovered under the GSP.
Within the GSP, the European Union discrimi-nated in favor of the least-developed countries. Allimports of industrial products and a range of agri-cultural products from these countries enteredduty free, but a significant number of agriculturalproducts still faced some market access barriers.These were removed under the Arms initiativeintroduced in 2001, which grants duty-free access,without any quantitative restrictions, to imports ofall products from the least-developed countries,except arms and munitions. Liberalization wasimmediate except for three products (freshbananas, rice, and sugar), for which tariffs gradu-ally will be reduced to zero (in 2006 for bananasand in 2009 for rice and sugar). The effect of theArms initiative will be limited in the short run sincethe LDCs were not exporting the products thatwere immediately liberalized (Brenton 2003).
Because preferences for the least-developedcountries are granted for an unlimited period andare not subject to periodic review, the Everythingbut Arms program should provide greater certaintyof market access and therefore stimulate a greaterproduction response by existing products and aconducive environment for exports of a widerrange of products. This is a crucial aspect of theprogram. The challenge for developing countries isto create a climate that allows investment to takeplace in activities in which a comparative advantagecan be sustained in the long run.
However, these changes may be partly under-mined by the inclusion of a new reason for sus-pending preferences: “massive increases in importsof products relative to the usual levels of productionand export capacity” (our emphasis). This couldconstrain large-scale investment to transform theproduction capacity in a particular country anddiscourage diversification into new products.7
The European Union offers enhanced prefer-ences beyond those of the GSP to Sub-SaharanAfrican, Caribbean, and Pacific countries (the ACPcountries) under the Cotonou Agreement. Thereare individual protocols for bananas, beef, veal, andsugar. These products accounted for three-quarters
of the value of ACP preferences in the late 1990s,including industrial products, which are all eligiblefor duty-free access (McQueen 1999).
The average duty in the European Union is veryhigh, at more than 17 percent. Countries eligiblefor GSP benefits on agricultural products face aslightly lower average duty of 15.3 percent, andACP countries face a much lower average duty ofabout 7 percent (table 4.4). The average duty thatwould be levied on products covered by the GSP ifthose preferences were removed is about 14 percent(table 4.5). Full preferences tend to be granted onagricultural products with lower MFN rates,whereas those with higher MFN rates tend toreceive only partial preferences. Products notgranted preference under the GSP scheme tend tobe very-high-duty products, with an average tariffof more than 25 percent.
The average duty on products covered by theCotonou Agreement is more than 21 percent, andthe preferences available are much deeper thanthose under the GSP. And while very-high-dutyproducts tend to receive only partial preferences,many high-duty products excluded from the GSPreceive preferences under Cotonou. The averageduty on excluded products is just under 10 percent.Nevertheless, preferences do not reduce the
TABLE 4.4 Average Unweighted Tariffson Agricultural Products inthe European Union, 2002 (percent)
Category Average Tariff
MFN rates 17.3GSP beneficiaries 15.3ACP beneficiaries 6.9
Note: For seasonal rates, the duty applied on July1 is used, the high season for most fruits andvegetables. For products for which it is notpossible to calculate an ad valorem equivalentof the complex duties that are applied (forexample, for chocolate the duty depends on themilk and sugar content), an ad valorem duty of30 percent was assigned for the MFN rate and20 percent for the ACP rate. These are conserva-tive assumptions since many of these complexduties are likely to be prohibitive. In 2002 therewere 161 lines for which the ad valoremequivalent could not be computed.Source: Calculated from EU Commission data andWorld Trade Organization Integrated Data Bank.
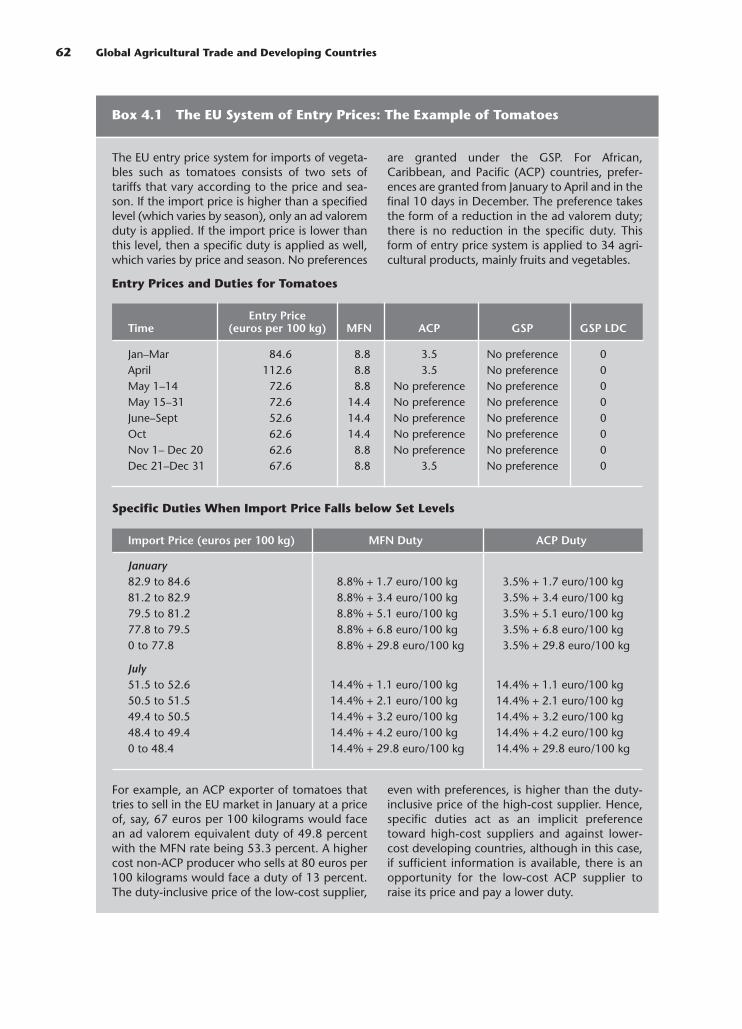
62 Global Agricultural Trade and Developing Countries
Box 4.1 The EU System of Entry Prices: The Example of Tomatoes
The EU entry price system for imports of vegeta-bles such as tomatoes consists of two sets oftariffs that vary according to the price and sea-son. If the import price is higher than a specifiedlevel (which varies by season), only an ad valoremduty is applied. If the import price is lower thanthis level, then a specific duty is applied as well,which varies by price and season. No preferences
are granted under the GSP. For African,Caribbean, and Pacific (ACP) countries, prefer-ences are granted from January to April and in thefinal 10 days in December. The preference takesthe form of a reduction in the ad valorem duty;there is no reduction in the specific duty. Thisform of entry price system is applied to 34 agri-cultural products, mainly fruits and vegetables.
Entry Prices and Duties for Tomatoes
Entry PriceTime (euros per 100 kg) MFN ACP GSP GSP LDC
Jan–Mar 84.6 8.8 3.5 No preference 0April 112.6 8.8 3.5 No preference 0May 1–14 72.6 8.8 No preference No preference 0May 15–31 72.6 14.4 No preference No preference 0June–Sept 52.6 14.4 No preference No preference 0Oct 62.6 14.4 No preference No preference 0Nov 1– Dec 20 62.6 8.8 No preference No preference 0Dec 21–Dec 31 67.6 8.8 3.5 No preference 0
Specific Duties When Import Price Falls below Set Levels
Import Price (euros per 100 kg) MFN Duty ACP Duty
January82.9 to 84.6 8.8% + 1.7 euro/100 kg 3.5% + 1.7 euro/100 kg81.2 to 82.9 8.8% + 3.4 euro/100 kg 3.5% + 3.4 euro/100 kg79.5 to 81.2 8.8% + 5.1 euro/100 kg 3.5% + 5.1 euro/100 kg77.8 to 79.5 8.8% + 6.8 euro/100 kg 3.5% + 6.8 euro/100 kg0 to 77.8 8.8% + 29.8 euro/100 kg 3.5% + 29.8 euro/100 kg
July51.5 to 52.6 14.4% + 1.1 euro/100 kg 14.4% + 1.1 euro/100 kg50.5 to 51.5 14.4% + 2.1 euro/100 kg 14.4% + 2.1 euro/100 kg49.4 to 50.5 14.4% + 3.2 euro/100 kg 14.4% + 3.2 euro/100 kg48.4 to 49.4 14.4% + 4.2 euro/100 kg 14.4% + 4.2 euro/100 kg0 to 48.4 14.4% + 29.8 euro/100 kg 14.4% + 29.8 euro/100 kg
For example, an ACP exporter of tomatoes thattries to sell in the EU market in January at a priceof, say, 67 euros per 100 kilograms would facean ad valorem equivalent duty of 49.8 percentwith the MFN rate being 53.3 percent. A highercost non-ACP producer who sells at 80 euros per100 kilograms would face a duty of 13 percent.The duty-inclusive price of the low-cost supplier,
even with preferences, is higher than the duty-inclusive price of the high-cost supplier. Hence,specific duties act as an implicit preferencetoward high-cost suppliers and against lower-cost developing countries, although in this case,if sufficient information is available, there is anopportunity for the low-cost ACP supplier toraise its price and pay a lower duty.
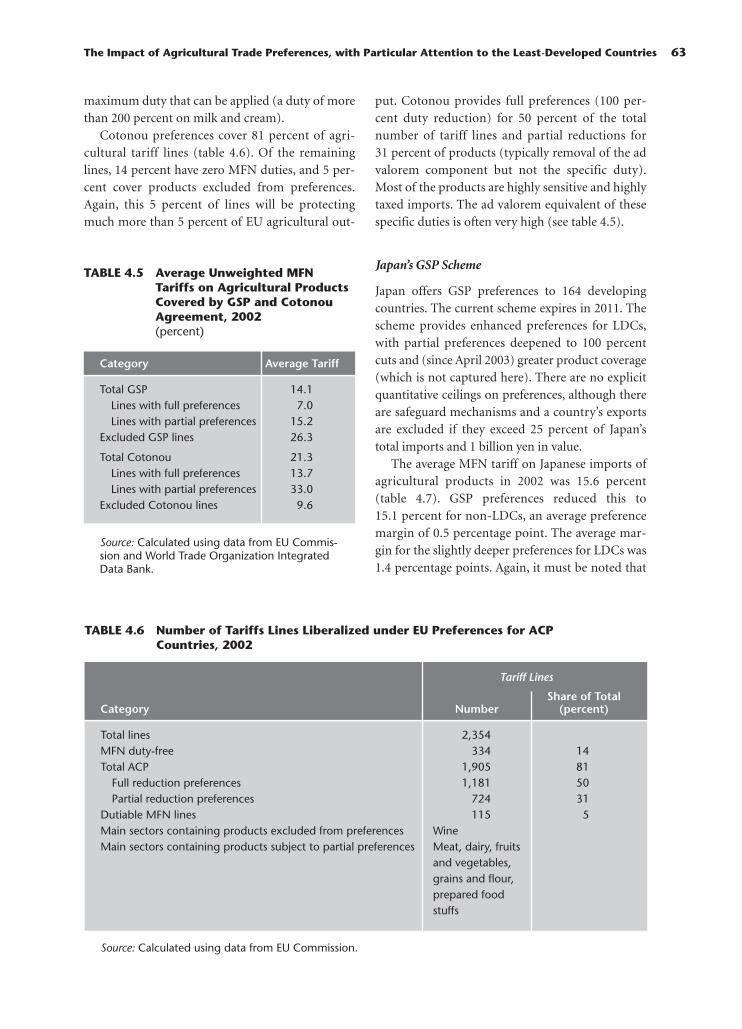
maximum duty that can be applied (a duty of morethan 200 percent on milk and cream).
Cotonou preferences cover 81 percent of agri-cultural tariff lines (table 4.6). Of the remaininglines, 14 percent have zero MFN duties, and 5 per-cent cover products excluded from preferences.Again, this 5 percent of lines will be protectingmuch more than 5 percent of EU agricultural out-
put. Cotonou provides full preferences (100 per-cent duty reduction) for 50 percent of the totalnumber of tariff lines and partial reductions for31 percent of products (typically removal of the advalorem component but not the specific duty).Most of the products are highly sensitive and highlytaxed imports. The ad valorem equivalent of thesespecific duties is often very high (see table 4.5).
Japan’s GSP Scheme
Japan offers GSP preferences to 164 developingcountries. The current scheme expires in 2011. Thescheme provides enhanced preferences for LDCs,with partial preferences deepened to 100 percentcuts and (since April 2003) greater product coverage(which is not captured here). There are no explicitquantitative ceilings on preferences, although thereare safeguard mechanisms and a country’s exportsare excluded if they exceed 25 percent of Japan’stotal imports and 1 billion yen in value.
The average MFN tariff on Japanese imports ofagricultural products in 2002 was 15.6 percent(table 4.7). GSP preferences reduced this to15.1 percent for non-LDCs, an average preferencemargin of 0.5 percentage point. The average mar-gin for the slightly deeper preferences for LDCs was1.4 percentage points. Again, it must be noted that
The Impact of Agricultural Trade Preferences, with Particular Attention to the Least-Developed Countries 63
TABLE 4.5 Average Unweighted MFNTariffs on Agricultural ProductsCovered by GSP and CotonouAgreement, 2002 (percent)
Category Average Tariff
Total GSP 14.1Lines with full preferences 7.0Lines with partial preferences 15.2
Excluded GSP lines 26.3
Total Cotonou 21.3Lines with full preferences 13.7Lines with partial preferences 33.0
Excluded Cotonou lines 9.6
Source: Calculated using data from EU Commis-sion and World Trade Organization IntegratedData Bank.
TABLE 4.6 Number of Tariffs Lines Liberalized under EU Preferences for ACPCountries, 2002
Tariff Lines
Share of TotalCategory Number (percent)
Total lines 2,354MFN duty-free 334 14Total ACP 1,905 81
Full reduction preferences 1,181 50Partial reduction preferences 724 31
Dutiable MFN lines 115 5Main sectors containing products excluded from preferences WineMain sectors containing products subject to partial preferences Meat, dairy, fruits
and vegetables,grains and flour,prepared foodstuffs
Source: Calculated using data from EU Commission.

these are not average duties paid since few importsare in the high-duty categories.
The average duty on products covered by theGSP was 10.4 percent for non-LDCs and 9.8 per-cent for the LDCs (table 4.8). The duty on productsexcluded from preferences is high relative to dutieson products covered by preferences, even whenconservatively estimated, at about 21 percent (seenote to table 4.7).
Some 20 percent of agricultural tariff lines inJapan are subject to zero duties, while preferences
under the GSP cover 11 percent of agriculturalproducts for non-LDCs and 15 percent for LDCs(table 4.9). The 2003 reform of the GSP added anadditional 198 products (or 10 percent of total tar-iff lines) to preferences for LDCs. For non-LDCsmost products under preferences receive only apartial reduction in duties, and 71 percent of agri-cultural products are excluded from preferences,while preferences were not available for 67 percentof tariff lines for LDCs in 2002 (falling to 57 percent in 2003).
64 Global Agricultural Trade and Developing Countries
TABLE 4.7 Average Unweighted Tariffs onAgricultural Products in Japan,2002 (percent)
Category Non-LDCs LDCs
Average MFN 15.6 15.6Average applied 15.1 14.2
preferential duty
Note: Specific duties were converted to advalorem equivalents based on the total valueand quantity of imports from developingcountries. When that information was notavailable, the value and quantity of importsfrom all sources was used. For tariff lines forwhich there were no imports, an ad valoremequivalent of 30 percent was assumed—probably an underestimate since these dutiesare likely to be prohibitive.Source: Calculated using data from United NationsConference on Trade and Development TRAINS.
TABLE 4.8 Average Unweighted MFNTariffs on Agricultural ProductsCovered by GSP in Japan, 2002 (percent)
Category Non-LDCs LDCs
Total GSP 10.4 9.8Full preference 7.3 9.8Partial preference 12.0
Excluded lines (MFN) 20.8 21.5
Source: Calculated using data from UnitedNations Conference on Trade and Development(TRAINS).
TABLE 4.9 Tariffs Lines Liberalized under Japan’s GSP Preferences, 2002
Non-LDCs LDCs
Number of Share of Total Number of Share of TotalCategory Tariff Lines (percent) Tariff Lines (percent)
Total lines 2,014 2,014MFN duty-free 393 20 393 20Total GSP 221 11 298 15
Full preferences 80 4 298 15Partial preferences 141 7 0
Dutiable lines (MFN) 1,400 70 1,323 66
Main sectors containing products Meat, fish, dairy, cereals, prepared meat and fish, sugar, cocoa,excluded from preferences prepared food products
Source: Calculated using data from the United Nations Conference on Trade and Development (TRAINS).

Proportion of Trade Coveredby Preferences
U.S. Preferences
Examination of the proportion of developing-country exports covered by U.S. preference pro-grams shows that (table 4.10)
• Exports of processed agricultural products aremuch smaller than exports of primary agricul-tural products.
• For a large proportion of primary productexports (more than 70 percent for the threegroups of countries), there are no preferencessince the MFN duty is zero. A much largerproportion of processed exports is eligible forpreferences.
• Preference use is high for primary products(more than 80 percent) and higher than the rateof preference use for processed products.
• Products not eligible for preferences constitute asmall proportion of current exports.
EU Preferences
Several findings stand out in an examinationof the proportion of exports covered by EU
preferences (table 4.11) and show the following:
• The value of agricultural exports to the Euro-pean Union is much larger than that of exportsto the United States, for both processed and pri-mary products. Again, the value of exports issmaller for processed products than for primaryproducts.
• A much larger proportion of exports are eligiblefor preferences than in the United States becausefewer export products have MFN duties of zero.Two-thirds or more of exports are eligible forpreferences.
• Products not eligible for preferences constitute avery small proportion of current exports.
Japanese Preferences
An examination of the proportion of developingcountry exports covered by GSP exports to Japanshows the following: (table 4.12)
• As a market for the exports of agricultural prod-ucts of African LDCs, Japan is smaller than theEuropean Union and about the same size as theUnited States.
• Exports from other LDCs, including those inAsia, are considerably smaller than those from
The Impact of Agricultural Trade Preferences, with Particular Attention to the Least-Developed Countries 65
TABLE 4.10 Exports to the United States under AGOA and by other LDCs under theGSP, 2002(US$ millions)
GSP and AGOA Preferences
Category GSP+AGOA Non-LDCs GSP+AGOA LDCs GSP LDCs
Basic agricultural commoditiesTotal exports to United States 600 247 122Exports duty free 431 (72) 190 (77) 114 (93)Exports for which preferences requested 149 (25) 47 (19) 7 (6)Exports eligible, but preferences not requested 15 (1) 11 (4) 1 (1)Exports not eligible for preferences 6 (1) 0 (0) 0 (0)
Processed agricultural productsTotal exports to United States 133 51 2.3Exports duty free 55 (41) 9 (18) 0.9 (41)Exports for which preferences requested 61 (46) 31 (61) 0.6 (29)Exports eligible, but preferences not requested 11 (8) 10 (20) 0.7 (30)Exports not eligible for preferences 5 (4) 0 0
Note: Numbers in parentheses are shares of exports for each category of agricultural exports.Source: Calculated using data from U.S. International Trade Commission dataweb.

African LDCs. This may reflect the structure ofprotection and preferences in Japan.
• For African LDCs, more than 50 percent ofexports of basic agricultural products enter theJapanese market at zero duty MFN rates. Of the
remaining exports to Japan, 23 percent are eligi-ble for preferences, and 26 percent are excludedfrom preferences. For other LDCs, only 5 per-cent of exports of basic agricultural productsenter duty free under zero percent MFN rates,
66 Global Agricultural Trade and Developing Countries
TABLE 4.11 Exports to the European Union from ACP Beneficiaries, 2002 (US$ millions)
Africa
Category Africa LDC Africa Non-LDC Caribbean Pacific
Basic agricultural commoditiesTotal exports to the European Union 1,904 5,159 1,018 310Exports duty free 533 (28) 2,065 (40) 55 (5) 68 (22)Exports for which preferences requested ACP+GSP 1,188 (62) 2,623 (51) 874 (86) 223 (72)Exports eligible, but preferences not requested 183 (10) 471 (9) 89 (9) 19 (6)Exports not eligible for preferences 0.2 (0) 0.5 (0) 0.18 (0) 0 (0)
Processed agricultural productsTotal exports to the European Union 303 1,414 455 15Exports duty free 30 (10) 16 (1) 8 (2) 1 (10)Exports for which preferences requested ACP+GSP 235 (78) 1,186 (84) 416 (92) 8 (57)Exports eligible, but preferences not requested 37 (12) 212 (15) 30 (7) 5 (34)Exports not eligible for preferences 0.1 (0) 0 (0) 0.1 (0) 0 (0)
Note: Numbers in parentheses are shares of exports for each category of agricultural exports.Source: Calculated using data from EU Commission.
TABLE 4.12 Exports to Japan from LDCs in 2002(US$ millions)
Category All LDCs African LDCs Other LDCs
Basic agricultural commoditiesTotal exports to Japan 381 241 140Exports duty free 131 (34) 124 (51) 8 (5)Exports for which preferences requested 62 (16) 52 (22) 10 (7)Exports eligible, but preferences not requested 3.7 (1) 3 (1) 0 (0)Exports not eligible for preferences 184 (48) 62 (26) 122 (87)
Processed agricultural productsTotal exports to Japan 40.8 39.4 1.4Exports duty free 36.7 (90) 36.2 (92) 0.5 (35)Exports for which preferences requested 3.5 (9) 2.8 (7) 0.6 (44)Exports eligible, but preferences not requested 0.3 (0.8) 0.3 (0.7) 0.1 (3.8)Exports not eligible for preferences 0.3 (0.7) 0.1 (0.2) 0.2 (16.5)
Note: Numbers in parentheses are shares of exports for each category of agricultural exports.Source: Calculated using data from Ministry of Finance, Japan.

just 7 percent are eligible for preferences and87 percent are excluded from preferences.
• Exports of processed products to Japan are avery small share for African LDCs and are non-existent for non-African developing countries.
Within the overall figures for each preference-granting market, there are large variations acrosscountries. For example, while the value of exportseligible for preferences exceeds 20 percent of totalexports to the European Union for non-LDCAfrican countries, it is less than 20 percent for 11LDC African countries and higher than 80 percentfor 11 other LDC African countries. There are alsoimportant differences across schemes for the samecountry. For example, 90 percent of Guinea-Bissau’s exports to the European Union are eligiblefor preferences, yet none of its current exports tothe United States receive preferences because theexports are subject to an MFN rate of zero. ForMozambique, by contrast, 97 percent of exports tothe European Union and 86 percent of exports tothe United States are eligible for preferences.
There are also substantial variations acrosscountries in their use of available preferences. Forexample, in 2002, only 10 percent of Ethiopia’sexports to the European Union that were eligible
for preferences made use of those preferences,while 85 percent of eligible exports to the UnitedStates did. Botswana used 99 percent of availablepreferences in the European Union but only 22 per-cent of those in the United States.
The Value of Preferences
An estimate of the value of trade preferences to theexporting countries was also calculated, using theamount of exports actually receiving preferencesand the margin of preference to derive the tariffrevenue that would have been paid without prefer-ences. This overstates the actual transfers to devel-oping countries because some of the rent will beacquired by importers in the preference-grantingcountry, especially if there is a single buyer, andbecause of the administrative costs incurred byexporters, such as compliance with rules of origin.8
Average transfers to LDCs under AGOA and theGSP amount to less than 1 percent of their agricul-tural exports to the United States in 2002 (figure 4.1).For most countries, preferences have a negligibleimpact under the current structure of exports. Pref-erences of this magnitude will not encourage addi-tional investment in these countries and will do littleto mitigate the high transaction costs these countries
The Impact of Agricultural Trade Preferences, with Particular Attention to the Least-Developed Countries 67
FIGURE 4.1 The Value of Preferences Requested under GSP and AGOA Programs ofthe United States, as a Share of Agricultural Export to the United States (percent)
0
1
2
3
4
5
6
7
8
Percent
The
Gam
bia
Nig
erC
entr
al A
fric
an R
ep.
Cha
dB
enin
Mau
ritan
iaR
wan
daS
ão T
omé
and
Prin
cipe
Leso
tho
Uga
nda
Mad
agas
car
Gui
nea
Eth
iopi
aS
ierr
a Le
one
Tan
zani
aZ
ambi
aC
ape
Ver
deD
em. C
ongo
Gro
up A
vera
geM
ali
Djib
outi
Moz
ambi
que
Mal
awi
Nam
ibia
Gui
nea-
Bis
sau
Sey
chel
les
Erit
rea
Gab
onC
amer
oon
Côt
e d'
Ivoi
reN
iger
iaK
enya
Sen
egal
Bot
swan
aM
aurit
ius
Gha
naG
roup
Ave
rage
Rep
. Con
goS
waz
iland
Sou
th A
fric
a
Nep
alS
omal
iaY
emen
Bur
kina
Fas
oB
urun
diC
omor
osE
q. G
uine
aK
iriba
tiA
fgha
nist
anM
yanm
arLa
osLi
beria
Mal
dive
sS
olom
on Is
land
sS
udan
Ang
ola
Cam
bodi
aB
angl
ades
hT
ogo
Bhu
tan
Van
uatu
Sam
oaG
roup
Ave
rage
Hai
ti
Processed products
AGOA US Non-LDC Group UN LDCs GroupAGOA LDC Group
Source: Calculated using data from USITC dataweb.

face in accessing world markets. Malawi may be anexception. It receives a transfer equivalent to justover 7 percent of the value of exports to the UnitedStates, thanks largely to exports of processed prod-ucts (mainly tobacco). Haiti is the only other LDC toreceive significant preferences. It is granted morefavorable treatment than the GSP under theCaribbean Basin Initiative, mainly for exports oftropical fruits such as mangoes. Preferences for non-LDCs in the United States are also small, with theaverage transfer being less than 1 percent of the valueof exports to the United States.
Under the Cotonou and GSP preferenceschemes, the highest transfers go to non-LDCs,mainly as rents on sugar exports (figure 4.2). Mau-ritius, for example, is a major beneficiary receivingtransfers in 2002 equivalent to more than 52 per-cent of the value of its agricultural exports to theEuropean Union in that year. The value of prefer-ences for sugar accounted for more than 30 percentof the value of exports for Fiji, the Republic ofCongo, Swaziland, and a number of Caribbeancountries. Among LDCs, preferences on sugarresulted in substantial transfers to Burkina Faso,Malawi, and Mozambique.
While transfers to a small number of LDCsunder the Cotonou Agreement are substantial, theaverage transfer across all LDC beneficiaries
amounts to 6 percent of the value of their exportsto the European Union. A large number of coun-tries receive little or no benefit from EU preferenceson agricultural products. For 10 of the LDCs,including Chad, Niger, and Rwanda, the value ofEU preferences amounts to less than 2 percent ofthe value of exports.
As with the U.S. and EU programs, Japanesepreferences for a few countries under the GSP pro-gram in 2002 are substantial, primarily for fishproducts (figure 4.3). For the majority of LDCs,however, transfers due to preferences are zero. Only6 of the 46 LDCs receive a transfer greater than 1percent of the value of agricultural exports to Japanin 2002.
Preferences and ExportDiversification
A key problem for the least-developed countrieshas been their export reliance on a small number ofagricultural commodities. This export concentra-tion leaves them vulnerable to external shocks andthe downward trend in commodity prices. Prefer-ences could provide incentives for investment insectors in which countries have a comparativeadvantage but that are not being exploited becauseof difficulties in accessing export markets.
68 Global Agricultural Trade and Developing Countries
FIGURE 4.2 The Value of Preferences Requested under Cotonou and GSP Programsof the EU, as a Share of Agricultural Export to the EU (percent)
0
10
20
30
40
50
60
70
Percent
Tuv
alu
Cha
dS
olom
on Is
land
sB
urun
diR
wan
daS
ierr
a Le
one
Cen
tral
Afr
ican
Rep
ublic
Eq.
Gui
nea
São
Tom
é an
d P
rinci
peS
omal
iaH
aiti
Dem
. Con
goN
iger
Mal
iS
amoa
Djib
outi
Van
uatu
Tog
oC
omor
osU
gand
aE
ritre
aLi
beria
Eth
iopi
aB
enin
The
Gam
bia
LDC
Ave
rage
Gui
nea
Sud
anZ
ambi
aM
adag
asca
rT
anza
nia
Gui
nea-
Bis
sau
Sen
egal
Cap
e V
erde
Mau
ritan
iaA
ngol
aLe
soth
oM
alaw
iM
ozam
biqu
eB
urki
na F
aso
Kiri
bati
Pal
auN
iue
Mar
shal
l Isl
ands
Nau
ruT
onga
Nig
eria
Bah
amas
Gre
nada
Pap
ua N
ew G
uine
aG
hana
Ken
yaC
ook
Isla
nds
Côt
e d'
Ivoi
reA
ntig
ua a
nd B
arbu
daZ
imba
bwe
Nam
ibia
Gab
onS
urin
amB
otsw
ana
Mic
rone
sia
Cam
eroo
nD
omin
ican
Rep
.S
eych
elle
sN
on-L
DC
Con
goD
omin
ica
St L
ucia
St V
ince
ntT
rinid
ad a
nd T
obag
oJa
mai
caS
waz
iland
Bel
ize
Bar
bado
sG
uyan
aM
aurit
ius
Fiji
St K
itts
and
Nev
is
LDC Group Non-LDC Group
Value of preferences from sugar exports
Source: Calculated using data from EU Commission.

Preferences have done little to increase the diversi-fication of agricultural exports. Only 4 of the 38countries eligible for preferences under AGOA havesignificantly diversified their exports of agriculturalproducts over the last 20 years (Ghana, Nigeria,South Africa, and Tanzania). For the other 34 coun-tries, five or fewer products accounted for more than90 percent of their agricultural exports in both 1982and 2002.9 The same pattern holds for Africanexports to the European Union. In 1982, for 37 of the44 African ACP countries, five or fewer productsaccounted for more than 90 percent of exports to theEuropean Union.By 2002 only two of these countrieshad diversified their exports to the European Unionto reduce the importance of the main five exportproducts. None of the LDCs had diversified exportsto Japan. In 2002 the five top products accounted for90 percent or more of every country’s exports.
Much of this failure to stimulate export diversifi-cation likely results from several features of the pro-grams. The uncertain duration of the preferencesgranted, the exclusion of many products with thelargest preference margins, and the inadequacy ofpreference margins for making investments in newactivities attractive, given the high transaction costsof operating in the least-developed countries. Also
possibly contributing are the administrative rulesgoverning the granting of preferences, describedbelow. However, the main factor constraining diver-sification is likely to be the poor domestic invest-ment climate in most of the beneficiary countries.
Constraints on Preferences andDiversification: Rules of Origin
Rules of origin are essential to ensure that prefer-ences are granted only to exporters from eligiblecountries. The nature of the rules of origin, how-ever, are a key element determining the extent towhich countries are able to take advantage of thepreferences available to them. For a product pro-duced in a single stage or wholly obtained in onecountry, origin is relatively easy to establish. Pri-mary agricultural products typically fall into thiscategory. Proof that the product was produced orobtained in the preferential trade partner is nor-mally sufficient. The process of proving conform-ity, however, may incur costs that reduce the valueof the preferences.
For processed manufactured products, rules oforigin stipulate how much or what kind of domes-tic processing must take place. The U.S. GSP scheme
The Impact of Agricultural Trade Preferences, with Particular Attention to the Least-Developed Countries 69
FIGURE 4.3 The Value of Preferences for LDCs under the GSP Program of Japan, asa Share of Agricultural Export to Japan(percent)
0
1
2
3
4
5
6
7
8
Percent
Cam
bodia
Laos
Afg
hanis
tan
Haiti
Guin
ea
Lib
eria
Mali
Burk
ina F
aso
Nig
er
Chad
Republic
of C
ongo
Buru
ndi
Uganda
Moza
mbiq
ue
Madagasc
ar
Zam
bia
Sam
oa
Vanuatu
Kirib
ati
Guin
ea B
issa
uB
enin
Cape V
erd
eR
wanda
Centr
al A
fric
an R
epublic
Equato
rial G
uin
ea
São
Tom
é an
d P
rinci
peS
om
alia
Leso
tho
Eritr
ea
Tuva
luB
angla
desh
Yem
en
Togo
Sudan
Eth
iopia
Tanza
nia
Mya
nm
ar
Mald
ives
Mala
wi
Nepal
Bhuta
nS
olo
mon Isl
ands
Senegal
Angola
Maurita
nia
The G
am
bia
Source: Calculated using data from Ministry of Finance, Japan.

has a value-added requirement of 35 percent for allproducts. The U.S. scheme also allows for cumula-tion between selected countries, so that value addedin those countries can be counted toward the over-all value-added requirement for the productexported to the United States. AGOA permits suchcumulation among all Sub-Saharan preferencetrade partners. In practice, many processed foodproducts are excluded from the GSP and AGOA.
EU rules of origin are product specific andsometimes complex. Some products require achange of tariff heading, some have a value-addedrequirement, and some are subject to a specificmanufacturing process requirement. In some casesthese methods are combined. For certain industrialproducts, a choice among alternative methods ispermitted—for example, either a change of tariffheading or satisfaction of a value-added require-ment. This more flexible approach is not availablefor agricultural products.
For many products, the EU rules require achange of chapter, which is even more restrictivethan a change of heading. Some of the EU rulesexclude some changes in tariff classification by pro-scribing the use of certain imported inputs. Forexample, the rule of origin for bakery productssuch as bread, pastry, cakes, and biscuits requires achange of tariff heading except for any heading inchapter 11 (products of the milling industry),meaning that bakery products cannot use importedflour, a restrictive requirement for countries with-out a competitive milling industry. Products thatinclude sugar have to demonstrate that the value ofany imported sugar does not exceed a certain pro-portion of the price of the product.
While the European Union has sought to har-monize the processing requirements for eachproduct across preference programs, a number ofgeneral rules vary substantially across differentschemes, particularly those on the nature andextent of cumulation and the tolerance rule. Thereare important differences in the rules of originamong the Everything but Arms program, the GSP,and the Cotonou Agreement. For example, theCotonou Agreement permits full cumulation. TheGSP has more limited partial cumulation that cantake place only within four regional groupings(Association of South-East Asian Nations, CentralAmerican Common Market, the Andean Commu-nity, and South Asian Association for Regional
Cooperation), but it excludes the ACP countries.Hence LDC members of the ACP that are eligible toexport to the EU under Everything but Arms mayoften prefer to continue exporting under the Coto-nou Agreement because of the more liberal rules oforigin (Brenton 2003).
The rules of origin for the Japanese GSP requirea change of tariff heading to demonstrate that asubstantial transformation has taken place,although there is a list of products for which spe-cific criteria are defined. Thus, for example, flour orsimilar products cannot be produced fromimported grains. Cumulation is allowed among alimited group of Southeast Asian countries(Indonesia, Malaysia, Philippines, Thailand, andVietnam).
An important feature of these preferential tradeschemes is the requirement of direct consignmentor direct transport. This stipulates that goods forwhich preferences are requested be shipped directlyto the destination market. If they are in transitthrough another country, documentary evidencemay be required to show that the goods remainedunder the supervision of the customs authorities ofthe country of transit, did not enter the domesticmarket there, and did not undergo operationsother than unloading and reloading. In practice, itcan be very difficult to obtain the necessary docu-mentation from foreign customs.
In general, preferences are more effective whenthe rules of origin are simple and easy to apply. Fur-ther, the value of OECD (Organisation for Eco-nomic Cooperation and Development) preferenceswould be enhanced by greater uniformity in theway given products are treated in the differentschemes. Thus a product that qualifies for prefer-ences in one market should be granted preferentialaccess to all other OECD countries. The WTOwould be an appropriate forum for discussing andagreeing on a common set of rules of origin.
Preference Erosion by MultilateralTariff Reductions
As multilateral tariff reductions are negotiated atthe WTO, the margins of preference available todeveloping countries decline. Whether developingcountries lose overall from multilateral liberaliza-tion depends on the extent of negotiated tariffreductions on products that currently receive
70 Global Agricultural Trade and Developing Countries
preferential access and on the importance of prod-ucts excluded from preferences or not using currentpreferences. The analysis here makes clear that theimpact of reducing tariffs will vary substantiallyacross countries but that most countries will notlose because they currently gain very little frompreferences.10 For the countries that receive sub-stantial transfers from preferences, the commodityimpact of tariff liberalization is crucial. For exam-ple, significant reductions in EU tariffs and internalprices for sugar would have a significant impact ona number of countries, especially if existing quotaswere maintained.
The impact of reducing tariffs on productsexcluded from preferences will tend to be positivefor the least-developed countries. These productshave very high tariffs, and a reduction in protectionwould stimulate exports from countries with acomparative advantage in these products. Whetherthe least-developed countries would gain morefrom the inclusion of these very-high-duty prod-ucts under preferences and the continuation ofhigh levels of protection is difficult to assess, butthe uncertain duration of many nonreciprocalschemes and the difficulties of satisfying rules oforigin are likely to limit the value of preferences onthese products.
Wainio and Gibson (2003) estimate that, as agroup, countries receiving nonreciprocal tradepreferences on agricultural products in the UnitedStates would gain from multilateral trade liberaliza-tion because losses from preference erosion wouldbe exceeded by gains on products on which thesecountries pay the MFN tariff. Within this group, acountry will tend to lose on balance from multilat-eral liberalization only if more than 80 percent ofits exports to the United States receive preferences,while it would tend to gain if less than 50 percent ofits exports benefit from preferences. For countriesin between, whether there was a net gain or a lossfrom reducing MFN tariffs would depend on theparticular tariff-cutting formula and the structureof exports.
Conclusion
In principle, trade preferences can assist develop-ment if they provide temporary margins of prefer-ence to enable industries to adjust and competemore effectively in global markets. Multilateral
trade liberalization contributes to this outcome byensuring that preferences have a short “half-life”11
and that inefficient, high-cost industries withentrenched lobbies do not constrain flexibility andadjustment. Multilateral liberalization is alsoimportant for limiting the long-term trade divert-ing impact of preferences on other countries (typi-cally these will be other developing countries).
In practice, only a small number of countriesreceive large transfers as a result of preferences inOECD markets. The values of preferences arelargest in the EU market, driven by a narrow rangeof products and the very high EU price for sugar. Ina few countries, such as Mauritius, preferencesappear to have contributed to a relatively strongeconomic performance and economic diversifica-tion (Subramanian 2001). In other countries, eventhough preferences have led to large transfers,domestic industries have experienced rising costsand declining output and have accumulated largedebts.12 Nevertheless, the majority of beneficiariesof U.S., EU, and Japanese preferences have experi-enced little or no impact. Preferences have donenothing to stimulate the export of a broader rangeof products.
The key issues for improving trade preferenceschemes are as follows:
• How to enhance the value of preferences undercurrent export structures, which would be facili-tated by–Extending coverage to all agricultural products.–Liberalizing the rules of origin and simplifying
the process of certifying compliance.–Removing sources of uncertainty concerning
product and country coverage and theduration of preference schemes.
• How to strengthen the impact of existing prefer-ences on developing countries, which would befacilitated by –Improving the domestic investment
environment.–Addressing the internal barriers that raise
the costs of trade for developing countries—inadequate and high-price transport services,reflecting lack of infrastructure and lack ofeffective competition in many countries, ineffi-cient and corrupt customs practices, and lackof trade-supporting financial and telecommu-nications services.13
The Impact of Agricultural Trade Preferences, with Particular Attention to the Least-Developed Countries 71

• How to ensure that preferences do not interferewith multilateral liberalization, which would befacilitated by–Developing mechanisms for helping countries
that incur significant losses from preferenceerosion adjust.
–Not using fear of preference erosion to main-tain high levels of protection in industrialcountries.
The challenge is to find preference schemes thatcomplement the domestic reforms that developingcountries must undertake to improve the returns toexports without stifling diversification and multi-lateral trade liberalization. Trade preferences arenot a panacea for success but rather should be seenas just one part of a strategy to boost export-ledgrowth and development. Realizing the full poten-tial of trade also requires improving customs clear-ance procedures, reducing the costs of transporta-tion and other trade-related services, endingcorruption, and removing other disincentives toinvestment. Addressing these issues will permitbroad-based export growth and will ensure that aspreferences decline with multilateral liberalization,the economic structure needed for continuedexport expansion is in place. The Integrated Frame-work for Trade-Related Technical Assistance, whenincorporated into poverty reduction strategies,provides a vehicle for addressing these issues, defin-ing appropriate policy responses, and mobilizingrelevant resources.
Notes
1. By providing a stimulus to increased trade, preferencescan lead to lower transportation costs, which in turn lead to afurther trade impact. Hummels and Skiba (2002) discuss howeconomies of scale in transportation can lead to a virtuous circleinvolving increased trade and lower transportation costs.
2. For example, the share of Sub-Saharan African countriesin U.S. imports of agricultural products fell from 4.3 percent in1982 to 2.5 percent in 2002. Similarly, the share of the African,Caribbean, and Pacific countries in total EU agriculturalimports fell from 11.7 percent in 1982 to 7.8 percent in 2002.And the share of low-income countries in Japanese imports fellfrom 1.2 percent to 0.5 percent over the same period. More sys-tematic empirical studies of the impact of trade preferencesare rare and seldom separate out the impact on agriculturalproducts.
3. The rate of utilization of preferences is the proportion ofexports from developing countries to the European Union, theUnited States, and Japan that are recorded at the border asrequesting preferences. Therefore, the underutilization of pref-erences (the fact that some exports do not request and therefore
are not granted the preferential access for which they are in prin-ciple eligible) cannot reflect the inability to meet other require-ments to access the relevant market, such as health and safety orsanitary requirements or deficiencies in their infrastructure, as issometimes suggested. Lack of infrastructure might explain amuted response from trade to preferences but cannot explainwhy, at the border, some products that are eligible for prefer-ences do not request those preferences.
4. For a comprehensive description of U.S. preferences foragricultural products, see Wainio and Gibson (2003)
5. Many of the tariff quota products are also subject to safe-guard measures. Once quantities exceed the quota, exports tothe United States are subject to both the high MFN duty and anadditional, often high, safeguard duty.
6. A number of lines shown as AGOA products are likely tobe economically meaningless. These are lines that refer to Gen-eral Note 15 of the U.S. tariff schedule, which excludes from thein-quota quantity for a product subject to a tariff rate quota andto safeguard amounts that are imported by the U.S. government,by individuals in quantities of less than five kilograms, and sam-ples for exhibition or for display at trade fairs. If such productsare imported from AGOA countries, they are eligible for zeroduty access. In the 2002 tariff schedule, 85 agricultural lines des-ignated as AGOA products referred to General Note 15, or 14percent of AGOA-designated agricultural tariff lines. In 2002imports from AGOA countries were recorded in only one ofthese categories, and the amount was negligible. For a moreaccurate representation of the impact of AGOA, these lines areexcluded from the analysis.
7. This clause was initially discussed in the context of com-bating fraud. However, this is not made clear in the legislation,and it appears that the clause could be invoked in more generalcircumstances.
8. The value of preferences will also be overstated for prod-ucts for which there are no nonpreferential imports and forwhich the duty exceeds the prohibitive level—the gap betweenthe internal price in the importing country and the world price.
9. The analysis was undertaken at the 5-digit level of theStandard International Trade Classification (SITC). There arearound 250 agricultural products in this classification. The 34countries include 3 that did not export any agricultural productsto the United States in 2002.
10. Stevens (2003) notes that the flip side of the preferencecoin is agricultural protectionism in OECD countries, which hasled to cheaper imports for African countries of a number ofagricultural products, such as cereals. There are two impacts:preferences increase export receipts to pay for imports, andOECD protectionism reduces the prices of those imports. Evencountries that gain little from preferences may lose from multi-lateral trade reform.
11. Taken from Schott (2004), who presented the notion interms of free trade agreements.
12. Mitchell (2004) shows that the sugar industry in theCaribbean is dominated by high-cost producers, few of whichcan profitably export to the European Union, even at four timesworld prices. Sugar production has been declining, and efforts todiversify away from sugar have generally been unsuccessful. Aserious problem in a number of countries is the high level ofaccumulated debt of the state-owned sugar industries, whichcan amount to a substantial proportion of gross domesticproduct.
13. These issues are highlighted in diagnostic trade studiesundertaken in the context of the Integrated Framework forTrade-Related Technical Assistance for the least-developedcountries (see www.integratedframework.org).
72 Global Agricultural Trade and Developing Countries
References
Brenton, P. 2003. “Integrating the Least Developed Economiesinto the World Trading System: The Current Impact of EUPreferences under Everything but Arms.” Journal of WorldTrade 37: 623–46.
Brenton, P., and H. Imagawa. 2004. “Rules of Origin, Trade andCustoms.” In J. Sokol and L. de Wulf, eds., The Customs Mod-ernisation Handbook. Washington, D.C.: World Bank.
Hummels, D., and Alexandre Skiba. 2002. “A Virtuous Circle?Regional Tariff Liberalization and Scale Economies in Trans-port.” Purdue University, West Lafayette, Ind., www.mgmt.purdue.edu/faculty/hummelsd.
McQueen, M. 1999. “After Lome IV: ACP-EU Trade Preferencesin the 21st Century.” Intereconomics 34: 223–32.
Mitchell, D. 2004. “Sugar in the Caribbean: Policies and Diversi-fication Strategies to Cope with Declining Preferences.”World Bank, Washington, D.C.
Ozden, C., and M. Olarreaga. 2003. “AGOA and Apparel: WhoCaptures the Tariff Rent in the Presence of Preferential Mar-ket Access?” World Bank, Washington, D.C.
Schott, J. 2004. “Free Trade Agreements: Boon or Bane of theWorld Trading System?” In J. Schott, ed., Free Trade Agree-ments: US Strategies and Priorities. Washington, D.C.: Insti-tute for International Economics.
Stevens, C. 2003. “Agricultural Reform and Erosion of Prefer-ences.” Institute of Development Studies, Brighton, U.K.
Subramanian, A. 2001. “Mauritius: A Case Study.” Finance andDevelopment 38(4): 22–25.
Topp, V. 2001. “Trade Preferences: Are They Helpful in Advanc-ing Economic Development in Poor Countries?” AustralianBureau of Agricultural and Resource Economics, Canberra.
UNCTAD. 2001. “Improving Market Access for LDCs.”UNCTAD/DITC/TNCD/4, http://www.unctad.org/en/docs//poditctncd4.en.pdf.
Wainio, J., and P. Gibson. 2003. “The Significance of Nonrecip-rocal Trade Preferences for Developing Countries.” Paperpresented at the International Conference “Agricultural Pol-icy Reform and the WTO: Where Are We Heading?” June23–26, Capri, Italy.
The Impact of Agricultural Trade Preferences, with Particular Attention to the Least-Developed Countries 73

deem necessary. Perhaps the only effective way toachieve socially acceptable and politically feasiblereform is to decouple payments from current pro-duction levels, input use, and prices. Thus, the rele-vant question is how support can be given withoutcreating negative effects for the rest of the world—how to increase farmers’ incomes without distort-ing production and consumption.
This chapter analyzes the experience with decou-pling, making a clear distinction between decou-pling that replaces domestic support anddecoupling that replaces border support. It reviewsa number of one-time buyouts, the best form ofdecoupling, and looks at the externalities of decou-pling, especially for middle- and low-income coun-tries, in reducing poverty, instituting land titlereform, and providing credit.
What Is Decoupling?
Decoupling has different meanings to economists,policymakers, and trade negotiators. Some see it as atransition mechanism to a fully competitive sector.
For most of the past half century industrial coun-tries have had high levels of agricultural protection,provided by import tariffs, quantitative restric-tions, and domestic subsidies. Among the manyclaimed objectives of these policies, boosting theincome of small family farms is by far the most fre-quently cited (Winters 1989–90). Because most ofthis support is based on current output, input use,and prices, it also induces overproduction. Giventhe weight of industrial countries in the globaltrading system, the aggregate effect of such supportis to depress world commodity prices, reducing theexport shares of countries that do not protect theiragricultural sectors. Such support is costly andoften goes to unintended recipients, thus exacer-bating rather than eliminating the presumedincome inequalities that justified support in thefirst place.
Considering the harmful effects of such supporton world markets and the mismatch between statedobjectives and ultimate outcomes, its outrightelimination is sometimes advocated. But societieshave the right to transfer income to groups as they
75
5
The authors would like to thank Ataman Aksoy, John Beghin, Uri Dadush, Gaston Gohou, BernardHoekman, John Nash, and Marcelo Olarreaga for helpful comments on earlier drafts. Comments receivedfrom the participants at the 2003 Annual World Bank Conference on Development Economics–Europe andseveral World Bank seminars are greatly appreciated.
EXPERIENCE WITHDECOUPLING
AGRICULTUR AL SUPPORT
John Baffes and Harry de Gorter

76 Global Agricultural Trade and Developing Countries
Others see it as another support program, withfewer production- and trade-distorting effects.Some use decoupling only to refer to programs fortransferring income to producers; others use theterm much more broadly, to include, for example,programs to improve the environment. Sometimesdecoupling is assessed according to the policy’slong-run impact on output through such factors asuncertainty, investment, and expectations.
Decoupling was discussed in the literature asearly as 1945, when the American Farm EconomicAssociation announced 18 awards for papers on “aprice policy for agriculture, consistent with eco-nomic progress, that will promote adequate andmore stable income from farming.” Nicholls andJohnson (1946)—recipients of the first- and second-place awards—summarized the main findings of theaward-wining papers. Several recommendationsclosely resembled decoupled support. For example(p. 281),
Cochrane presents a special formula for pro-gressively smaller income payments for aidingproducers in adjusting their operations from asupport level to a free market situation. Thesedeclining payments would be based on produc-tion during 1939–41, so that the producer wouldnot be “tied to commodity in surplus to receive apayment benefit.” Thus, he could shift to someother product during the payment period with-out losing the specified payments.
Perhaps the first analyst to explicitly advocatedecoupled support in U.S. agriculture was Swerling(1959). Two characteristics of Swerling’s proposalare especially interesting. First, he advocated asafety net mechanism for agriculture, similar tosafety nets in other sectors of the economy (such asunemployment insurance). Second, he proposedlinking the benefits of the decoupled support toincome declared in tax returns during the recentpast (not to historical production or area). Specifi-cally (pp. 179–80), he wrote:
Removal of this price stimulus is long over-due. . . . An income-insurance plan for farm-operators [should be in place] that include[s]the following elements: (1) . . . benefits willbe related to income experience of the particularindividual during the recent past; (2) the
purpose would not be to support income at arti-ficially high levels but to prevent a severe tempo-rary decline in individual income; (3) the rightto benefits would attach to the person, not tofarm land or the farm enterprise, and wouldaccordingly not be transferable; (4) the benefitto be enjoyed by any individual would notexceed a modest maximum; (5) benefits wouldnot be conditioned upon the production of par-ticular commodities or even upon continuedemployment in agriculture. . . .
Another early decoupling proposal was put for-ward by Nash in Europe (1961, p. 188):
Instead of obstructing the withdrawal of farmersfrom an industry which cannot adequatelyreward them, . . . an unconditional payment[could be made] to all those at present engagedin farming, or to those of them deemed to be inneed of compensation, calculated by the refer-ence to the difference between the incomes nowearned under the protective system and thosecapable of being earned under a system of freemarket prices. An annuity calculated in this wayand payable for life to all engaged in farming,but not transferable to their successors, would,in theory at least, make it possible to bring theprotective system to an end while fully makinggood the loss of income to its present beneficiar-ies. There is no doubt that compensation of thiskind is feasible.
The proceedings of the workshop “Decoupling:The Concept and Its Future in Canada” containsnumerous definitions of decoupling (Finkle andCameron 1990). Consider the following two rathercontrasting views. Van Donkersgoed (1988, p. 40),of the Christian Farmers Foundation of Ontario,defined decoupling as “a program in which eligibil-ity is not linked to production, the productionpotential of resources or the production effort of afarm entrepreneur; rather eligibility is linked tostewardship farming practices, marketing, themaintenance of rural communities, diversifiedownership of the assets of production, moderate-sized family enterprises and other rural, non-production valuables that add to the quality ofCanadian life.” Spriggs and Sigurdson (1988, p. 93),in contrast, simply stated: “In fact, a program to

eliminate subsidies would be the ultimate in decou-pling. It is the only truly decoupled program thatthere is.”
Cahill (1997, p. 351) defines as fully decoupledfrom production a policy that “does not influenceproduction decisions of farmers receiving pay-ments, and that permits free market determinationof prices (facing all farmers, whether or not receiv-ing income support).” A policy is effectively fullydecoupled if “the provision of the compensatorypayment package results in production that, for anycrop, does not exceed that level that would existwithout compensation.” The Organisation for Eco-nomic Co-operation and Development (OECD2000a) defines decoupling in a similar way.
Hennessy (1998) includes as decoupling pay-ments triggered by ex post market or productionconditions, as long as the payment level is not con-ditioned on an individual’s specific level of produc-tion. Disaster relief measures, for example, wouldbe considered decoupled because they are notaffected by the individual’s level of production.
Goodwin and Mishra (2002) argue that a fullydecoupled payment must be fixed and guaranteedand thus is not influenced by ex post realizations ofmarket conditions (such as low prices or areayields). This is the narrowest definition becauseneither payments nor the rules of eligibility and thebase criteria can be changed. If a time limit is addedto this definition, then decoupling simply implies anumber of annual payments to producers. Wherefinancial markets function efficiently, these bondscan be converted into a single payment. In such asetting, decoupling would consist of an administra-tive decision to remove distortions followed by asingle payment—a radical policy initiative. In fact,a number of analysts have advocated a fundamentalreform of the European Union’s Common Agricul-tural Policy (CAP), with the last step consisting ofpayment of a bond (see, for example, Beard andSwinbank 2001, Swinbank and Tangermann 2001,and Tangermann 1991).
The Politics of Decoupling
Politicians are reluctant to subsume all agriculturalpolicies into a universal social welfare program,including job retraining and the like, even thoughthese types of programs to help small farmerswould be ideal and truly compatible with World
Trade Organization (WTO) policy in being mini-mally trade distorting (as Swerling originally sug-gested in 1959). It is very difficult to end farm sub-sidy programs, however; there is always a bias tomaintain current policies because politicians losemore support if they take away subsidies than theygain if they introduce new ones. Furthermore,governments like to concentrate the benefits ofsubsidies and diffuse the costs to as many people aspossible in order to maximize political support.And small groups are better able to organize andcontrol free riders. All this appears to make itinevitable that governments will favor commodity-or sector-based policies over all other forms ofagricultural support. So, fully decoupled paymentsand one-time buyouts, even more than universalprograms, have the political disadvantage of notbeing able to continue to favor incumbent farmers.They also look like corporate welfare, whereastrade barriers and price supports reduce visibletaxpayer costs and hide the fact that large farms getmost of the transfers. Politicians also lack thecommitment mechanism to keep such policies inplace—politicians are tempted to reintroduce sup-port later in its original form or with new distort-ing programs.
Under many current systems, a complex web ofpolicies, including payments not to produce, subsi-dies, and production controls, help to obfuscate thepolicies’ true nature in terms of who benefits and towhat extent. Another class of subsidy programs, thewhole farm insurance program used in Canada andthe revenue stabilization programs used in the past,has the economic advantage of not singling outspecific sectors. And because all farms are eligible,taxpayer constraints dilute the per farm benefitsthereby reducing the political support for such pro-grams. Thus Canada has eliminated perfectly func-tioning revenue insurance programs, and othercountries are not rushing to adopt wholesale farmincome insurance programs.
Politicians and farm lobbies capitalize on the factthat most voters know of at least one farmer, often afamily member, who experienced severe adjust-ments in the past 50 years. Thus it is much easier tomaintain the status quo of subsidies in agriculture.Politicians also play on insecurities related to foodself-sufficiency in case of war, food safety issuesarising because of new technologies and geneticallymodified organisms, and the multifunctional
Experience with Decoupling Agricultural Support 77

benefits of farms in providing landscape amenitiesand rural livelihoods.
The Economics of Decoupling
Decoupling can be viewed as two distinct transitionmechanisms: one replacing domestic support andone replacing border measures. The key variabledriving this distinction is the source of financingfor the original support measures: consumers, tax-payers, or a combination.
Replacing domestic support measures such asproduction subsidies with decoupled support isstraightforward in the small country case and canbe shown to be Pareto improving. Instead of pro-viding output-based subsidies, the governmentmakes lump-sum payments to producers based onsome historical criteria without any constraint orrequirement on the current use of their resources.Under the lump-sum scheme, producers canreceive higher payments because welfare losses (theso-called Harberger triangles) disappear. Taxpayerscan also be better off if part of the efficiency gains istranslated into lower taxes. Because both producersand taxpayers can be made better off, decoupling inthe production subsidy case is clearly a Pareto-improving move.
Decoupling in the case of an import tariff, how-ever, is more complicated as it involves eliminatingtariffs, raising additional taxes, and distributing thetax revenues to producers. Producers are no worseoff (they receive the same amount of support), con-sumers are better off (they pay lower prices), buttaxpayers are worse off because they lose the tariffrevenue and must finance the decoupled support.Assuming that welfare losses arising from bordermeasures are higher than welfare losses arisingfrom domestic subsidies, decoupling of bordermeasures is welfare improving. It is not a Paretoimprovement, however. Furthermore, while theremoval of the import tariff implies welfare gains,introduction of the tax to finance decoupled sup-port implies welfare losses. Alston and Hurd (1990,p. 155) contend the following:
Currently it is fashionable to argue for “decou-pling” farm programs in the sense that incometransfers should be achieved with minimalconsequences for commodity markets. Alongwith the benefits from transparency, the benefits
from decoupling may be illusory. The issue hereis whether the costs of distortions in commoditymarkets are necessarily greater than the costs ofdistortions introduced elsewhere in the econ-omy to finance “decoupled” transfers.
Moschini and Sckokai (1994) claim that the wel-fare losses of raising new taxes to finance decou-pling are unlikely to be larger than the welfare gainsfrom decoupling. Beghin, Bureau, and Park (2003)estimate that in the Republic of Korea it coststaxpayers $1.61 for every $1 transferred to produc-ers. Using a general equilibrium model, Parry(1999) finds that the efficiency cost of taxpayer-financed lump-sum transfers to agriculture equals27 percent of the amount of the income transfer.
Since most of the support is at the border,decoupling is likely to be a complicated exercisewith mixed outcomes. Although the costs oftaxpayer-financed programs are shown to be signif-icant, welfare gains depend on how decoupled pro-grams are financed. But the general result from thepublic finance literature is that trade taxes havemuch higher inefficiencies relative to other formsof taxation or sources of revenue for farmers.
Experience with BroadDecoupling Attempts
Early attempts at decoupling failed. The 1949Brannan Plan in the United States, which proposedcash payments to farmers whose overall income fellbelow a certain level, was defeated in the U.S.Congress. Similarly in Europe, the Mansholt Planof 1968, which advocated support in order tofinance mandatory retirement for older farmers,also failed.
The first attempt at decoupling came in theUnited States with the 1985 Farm Bill, whichshifted the base of support from current yields tohistorical yields (see timeline in table 5.1). TheEuropean Union (EU) partially replaced interven-tion prices with direct payments following theCommon Agricultural Policy reform of 1992.Mexico replaced price supports with direct pay-ments in 1994 with the introduction of theNational Program for Direct Assistance to RuralAreas (Programa de Apoyos Directos al Campo, orProcampo). The United States replaced deficiencypayments with decoupled support in the 1996
78 Global Agricultural Trade and Developing Countries

Farm Bill. More recently, Turkey replaced someprice support and input subsidies with direct pay-ments. In addition to broad decoupling programs,there have been numerous one-time buyouts,including New Zealand’s exit grant in 1984, thebuyout of Canada’s grain transportation subsidy in1995, and the buyout of the U.S. peanut marketingquota under the 2002 Farm Bill.
Decoupling Efforts in the United States
The budgetary outlays for most U.S. commodityprograms are authorized by Congress (and subse-quently approved by the president) every few years
through farm bills. There have been 20 such billssince the first one in 1929. The central feature of theNew Deal farm programs of the 1930s was pricesupports achieved through taxpayer-funded pro-duction subsidies and supply controls (acreage set-asides, accumulation, maintenance, and disposal ofpublic stocks). Payments were based on the differ-ence between the target price set by the governmentand the higher of the market price or the price atwhich the government would value crops used ascollateral for loans made by a public corporation.The total payment was equal to the yield per acremultiplied by a farm’s eligible payment acreage (theamount of land devoted to cultivation of the crop
Experience with Decoupling Agricultural Support 79
TABLE 5.1 Chronology of Broader Decoupling and Recoupling Episodes,1985–2004
Year Country Policy change
1985 United States 1985 Farm Bill introduces “frozen” government payment yieldsper acre.
1992 European Union Mac Sharry reforms of the Common Agricultural Policy reduce pricesupports and introduce direct payments linked to historical areaplanted (with “frozen” government payments for the output perhectare) or number of animals (but farmers still need to produce toreceive payments).
1994 Mexico Procampo introduces payments based both on historical acres andyields up to 2008 with a phase-out of import barriers under the NorthAmerican Free Trade Agreement, input subsidies, and activities of thestate trading monopoly.
1996 United States 1996 Farm Bill eliminates target prices, replacing them with decoupledhistorical entitlements, the so-called production flexibility contractpayments, to end in 2002.
1996 Mexico Base acres can be switched to other crops or enterprises, and ruraldevelopment policy is launched to foster productivity.
1998 United States Emergency market loss assistance payments effectively reverse the1996 Farm Bill.
2000 European Union Agenda 2000 extends, deepens, and widens the Mac Sharry reforms.2001 Turkey Direct income support program reduces some administered prices and
input subsidies. Only minor changes in border policies.2002 United States 2002 Farm Bill extends production flexibility contracts, formalizes
emergency payments as countercyclical payments, adds new cropsto production flexibility contracts program, allows base acres andpayment yields to be updated, increases price supports for coupledsubsidies, and introduces three new crops to the coupled subsidyprogram.
2002 Mexico Target prices and input subsidies are reintroduced. Procampo remainslargely unchanged.
2002 European Union Mid-term review, resulting in June 2003 agreement to switch mostdirect payments to decoupled payments, with entitlements sold withor without land; level of payments and some support prices to declinein 2005–07.
2004 European Union Decoupled payments are introduced for the so-called Mediterraneanproducts (cotton, olive oil, and tobacco).
Source: Authors’ compilations.

in question). This portfolio of policy instrumentswas the primary means of price support for themajor field crops for decades until the 1980s.
The Food Security Act of 1985 set a new trendfor major field crops by reducing the role of acreageset-asides and public stockholding and movingtoward decoupling, with a “freeze” on paymentyields (farmers were paid on the basis of fixed out-put per acre regardless of what was actually pro-duced). Payment yield was established for eachfarm by the Department of Agriculture, based onaverage yields in 1981–85.
Acreage set-asides and public stockholding werelargely abandoned by the mid-1990s and elimi-nated soon thereafter with the introduction of theFederal Agricultural Improvement and Reform(FAIR) Act in 1996. FAIR also banished the targetprice used in calculating deficiency payments butmaintained the lower fixed price, called the loanrate, which had triggered public stock purchases inthe past. In place of the links between support,prices, and production, production flexibility con-tract payments were introduced. Participating pro-ducers received payments in proportion to whatthey had received during 1990–95 or would havereceived had they been enrolled. These historicalbenefits were in turn determined by a farmer’s his-torical production levels. Each participating pro-ducer received a fixed schedule of payments, whichwas to decline gradually through 2002. Althoughnot specifically stated, it was implicitly assumedthat the payments would end by 2002.
The effect of the 1996 Farm Bill on the structureof budgetary outlays is shown in table 5.2. It breaksthe producer support estimate down into marketprice support (a measure of border protection) andbudgetary support (a measure of domestic sup-port). Budgetary support is further decomposedinto support based on output and input use (con-sidered as having a large impact on production andtrade, or fully coupled support) and support basedon area, historical entitlements, input constraints,and overall farm income (considered as having asmaller impact on production and trade, or par-tially decoupled support; for further details anddefinitions, see OECD 2000b).
Historical entitlements, which did not existbefore 1996, represented more than a third of totalbudgetary support in 1996–98. They are exemptfrom disciplines in the WTO (they are in the GreenBox; see chapter 3). Area payments declined from$5.4 billion in 1993–95 to $1.2 billion in 1996–98and are also exempt from reduction commitmentsin the WTO (they are in the Blue Box). Duringthese two periods, output payments under disci-pline in the WTO (in the Amber Box) alsoincreased, from $0.2 billion to $1.6 billion, a reflec-tion primarily of declining commodity prices andconsequently increased loan rate payments.
Although payments were made on a crop-by-crop basis, planting was not required or restrictedto any particular crop. Payments were tied to85 percent of the fixed-base area (average of acresplanted or prevented from being planted for
80 Global Agricultural Trade and Developing Countries
TABLE 5.2 Composition of Agricultural Support in the United States, 1986–88 to1999–2001(US$ millions)
Category 1986–88 1989–92 1993–95 1996–98 1999–2001
Value of production 113,537 168,615 184,239 199,990 192,417Total support estimate 68,540 72,779 79,060 81,715 95,455Producer support estimate 41,839 34,326 31,091 36,384 51,256
Market price support 19,533 17,825 16,969 17,864 18,662Budgetary support 22,306 16,501 14,123 18,519 32,594Output 2,919 510 241 1,644 9,285Input use 6,516 6,574 6,003 6,088 6,877Area 11,313 6,897 5,396 1,247 2,722Historical entitlements 0 0 0 6,647 10,085Input constraints 637 1,776 1,963 1,940 1,844Overall farm income 912 743 520 954 1,780
Source: OECD database.

covered crops of wheat, feed grains, rice, and cot-ton) and fixed-payment yields. Because the pay-ments were independent of current production,farmers had far greater flexibility to make plantingdecisions (or to not plant at all). Farmers were freeto allocate their land to any crops on the “contractacres” except fruits and vegetables, but they had tomaintain their land in “agricultural use.” Thus pro-ducers were to depend more heavily on the marketand also bear greater risk from increased pricevariability.
The FAIR Act was meant to be a transitiontoward a new policy environment with a dimin-ished government role in commodity markets.Commodity prices declined sharply in the late1990s, however, triggering three major policyevents that reversed much of what had beenaccomplished by the FAIR Act. First, emergencypayments were introduced, approximately equal to50 percent of decoupled payments in 1998 and 100percent of decoupled payments in 1999, 2000, and2001. These were designated as non-product-specific support and so escaped reduction underthe de minimis proviso of the WTO. Second, whenmarket prices fell below the loan rate, the govern-ment extended the marketing loan program byissuing loan deficiency payments, which had thesame economic effects as the previous deficiencypayment scheme. Third, the 2002 Farm Bill wasintroduced, increasing several loan rates, introduc-ing three more crops into the loan rate scheme, andallowing base acres and payment yields to beupdated and soybean acreage to be added to thebase. The bill formalized the emergency paymentsinto a new countercyclical scheme in which pay-ments vary with price but not with quantity.
The emergency measures introduced in 1998(and later the 2002 Farm Bill) changed the structureof the budgetary outlays considerably. Between1996–98 and 1999–2001, historical entitlementsincreased by more than 50 percent (from $6.6 bil-lion to $10.1 billion, area payments increasedtwofold, and payments based on output increasedmore than fivefold (see table 5.2), implying thatsupport is less decoupled now than it was after 1996.
Decoupling Efforts in the European Union
The principal vehicle of support in the EuropeanUnion has been the Common Agricultural Policy.
Following the Spaak Report of 1956, which sug-gested that agriculture requires special treatment,the Stresa Conference of 1958 outlined CAP’s threeguiding principles: free flow of agricultural com-modities within the common market, preferenceto member states, and common financing. CAP,formally put in place in 1962, had multiple objec-tives: increase agricultural production, ensure a fairstandard of living for the agricultural community,stabilize markets, guarantee a regular supply ofagricultural commodities, and ensure reasonableprices for consumers. The objectives were to beachieved through domestic price supports, exportsubsidies, and common trade barriers. The first andlast objectives were fully met within a few years, butconcerns were soon raised about excess productionand the unsustainable level of CAP budgetaryrequirements if policies did not change.
Reform of the CAP was attempted in 1972, fol-lowing the recommendations of the 1968 MansholtPlan. The plan proposed, among other reforms,lump-sum transfers to 5 million farmers to retirethem from farming and reduce active farmland by5 percent. The Mansholt Plan, the first attempt todecouple, was never implemented.
The first major reinstrumentation of the CAPtook place in 1992. The reform, known as the MacSharry reform after the EU’s Commissioner forAgriculture, together with the Blair House Accordof the United States, paved the way for the signingof the Uruguay Round Agreement on Agriculturein 1994. For cereal, oilseed, and protein cropsand for beef and veal, price supports provided byimport levies or export refunds were reduced, andfarmers were compensated with direct payments.For crops, payments were based on 85 percent ofhistorical plantings (with a paid minimum areaset-aside requirement, a further paid voluntaryset-aside of up to 30 percent of historical area,and a base acre limit for payments set at thenational or regional level). The area-payment ratesvaried by crop type, and the set-aside paymentswere initially higher but are now equal. The onlyrequirement is the land had to be set aside orplanted in crops or temporary grass. Small-scalefarmers producing less than 92 tons of cerealsannually are exempt from set-asides and receive“all cereals” payments irrespective of crop planted(representing 25 percent of area but 70 percent offarmers).
Experience with Decoupling Agricultural Support 81

Between 1986–88 and 1993–95, budgetary sup-port in the EU increased threefold, from $13.4 bil-lion to $40.3 billion, while border support declinedfrom $80 billion to $76 billion (table 5.3). Most ofthe increase in budgetary support was attributableto area payments and, to a more limited extent, tohistorical entitlements and input constraints (des-ignated Blue Box payments and so exempt fromreductions in the WTO).
Following the 1992 reforms, the level of supportremained unchanged, but its structure changedconsiderably. For example, while estimated pro-ducer support averaged $117 billion for 1989–92and 1993–95, border protection support declinedfrom $93 billion in 1989–92 to $76 billion in1993–95. Support based on output declined from$7 billion to $3 billion, and area paymentsincreased from $7 billion to $24 billion. Thusthe 1992 CAP reform was a good step towarddecoupling.
Under Agenda 2000, price support to cropsdeclined, direct payments increased and wererealigned across all crops, and reference yields werechanged in some countries. A push toward moreinvestment in rural development was also made. Alarge transformation has occurred away from bor-der protection and input subsidies to direct pay-ments. Total support has been declining, especiallyin grains and oilseeds. More than the increase inbudgetary allocations, which remains moderatecompared with other expenditures, the growing
importance of rural development seems to followfrom the official reference to it as the “second pillarof the CAP.”
The European Union now has greater flexibilityto overhaul any policy element in light of changesin market developments, costs, enlargement, WTO(and other) trade negotiations, food crises, andother pressure for reform. The budget for Agenda2000 did not include any provision for extendingdirect payments to farmers in Eastern Europe,making reform a requirement. Meanwhile, theEuropean Union has launched free trade negotia-tions with Mercosur, and it established theEverything but Arms initiative with low-incomedeveloping countries. Because Mercosur includessome major agricultural exporting nations and theEverything but Arms program will increaseimports, especially for sugar, rice, and bananas, fur-ther reform of the CAP is necessary.
Recent food crises underline the need forreform, sometimes for more regulation and con-trols over production practices, including animalwelfare. Against this background, the EuropeanCommission’s midterm review of Agenda 2000proposed a set of reforms that include furtherdecoupling, continuing set-asides, and more cross-compliance rules with statutory environmental,food safety, and animal health and welfarestandards.
Current EU compensatory payments still influ-ence farmers’ decisions on how much land to plant.
82 Global Agricultural Trade and Developing Countries
TABLE 5.3 Composition of Agricultural Support in the European Union, 1986–88to 1999–2001(US$ millions)
Category 1986–88 1989–92 1993–95 1996–98 1999–2001
Value of production 214,849 275,770 286,658 291,427 237,990Total support estimate 109,654 138,927 133,050 129,328 112,628Producer support estimate 93,719 117,097 116,519 111,966 99,343
Market price support 80,257 93,282 76,084 64,989 60,863Budgetary support 13,446 23,327 40,279 47,468 38,693
Output 5,009 6,769 2,999 3,945 3,644Input use 5,025 7,135 8,133 8,446 6,540Area 2,701 6,987 24,326 29,419 24,733Historical entitlements 0 559 1,466 1,007 597Input constraints 711 1,877 3,356 4,650 3,178Overall farm income 0 0 0 2 0
Source: OECD database.

This results not only because farmers are obligatedto produce cereals on the base acres to receive thepayments, but also because area payments in theEuropean Union are made on an aggregate, fixed-area basis that is set at the national or regional level.Individual farmers do not have a base area—justeligible acres for which they receive payments andhave area set-asides. If the regional base area isexceeded, the per-unit subsidy is prorated down-ward proportionately for all farmers in the region.
Because the prorating occurs on the total areaplanted ex post, farmers have an incentive to over-plant in order to maximize their share of fixedbudget outlays or to defend against share erosiondue to overplanting by other producers. Thismeans that the area payments are fully coupled toplantings because individual farmers are not penal-ized for their own decisions to overplant. Area pay-ments with a national base area are therefore not alimit on total acres planted.
For EU cattle, the headage payments under“production-limiting” arrangements are anythingbut production limiting because farmers areallowed to keep more cattle than are eligible forpayments, so there is no absolute production con-trol, and the number of eligible animals is not lim-ited to the number on farms prior to the introduc-tion of payments in 1992. Where numbers ofanimals are below the maximum that could beclaimed per farm, farmers have an incentive toexpand their stock up to the limits on which pay-ments are made. Thus incentives in the programhave been to encourage initial expansion of animalnumbers and then to lock production in at aroundthe levels that are consistent with the maximumnumber of animals eligible for payments. Thosenumbers reflect the very high levels of support forseveral decades as well as the incentives inherent inthe headage payments.
The CAP reform agreement of June 2003requires decoupling at least 75 percent of paymentsin the arable sector and at least 50 percent in thebeef and sheep sectors. Dairy premiums will beadded into the single farm payment after 2007. Thedecoupled single farm payment will be based onaverage payments claimed over the three-year refer-ence period, 2000–02, and will be paid per eligiblehectare of land. Entitlements can be sold with orwithout land. Member states are offered some flex-ibility in the year they begin and in fully or partially
decoupling within the limits for each sector. Theymay also give up to 10 percent of the payments forenvironmentally friendly farming and restrict enti-tlement trading within a region. All payments areto be reduced 3 percent in 2005, 4 percent in 2006,and 5 percent in 2007. Support prices will alsodecline. Payments will be conditional on compli-ance with various measures, including environ-mental and acreage set-asides.
Decoupling Efforts in Mexico
About a quarter of Mexico’s population depends onagriculture, which contributes 5 percent to grossdomestic product (GDP), down from 9 percent inthe early 1980s. According to the OECD, totaltransfers to agriculture averaged $7 billion annuallyduring 1999–2001, $5.7 billion of which went toproducer support. This support corresponds to$1,000 per full-time farmer equivalent and $53 perhectare, both considerably lower than the OECDaverages of $11,000 per farmer and $192 perhectare. About 29 percent of producer supportwent to maize, 21 percent to milk, and 13 percent tosugar.
Traditionally, Mexico’s state agricultural enter-prise, Conasupo (Compania Nacional de Subsis-tencias Populares), has been heavily involved in themarketing, transportation, storage, and processingof most agricultural commodities. Maize, beans,and wheat, by far the most important agriculturalcommodities, have been heavily subsidized througha system of guaranteed prices. The government alsoset prices, which were usually announced beforeplanting decisions were made and were uniformacross the country and across seasons. Conasupobought unlimited quantities at the guaranteedprices. Hence, producers knew in advance the pricethey would receive and shifted production to cropswith the highest degree of relative protection ratherthan with the highest profitability according toworld prices. The poorest peasants did not benefitfrom guaranteed prices since they formally mar-keted little or none of their production.
In 1994 Mexico introduced Procampo, a decou-pled support program to provide income supportto grain and oilseed producers—about 90 percentof all Mexican farmers. Procampo replaced the oldscheme of guaranteed prices. By supporting farm-ers’ incomes rather than production of specific
Experience with Decoupling Agricultural Support 83
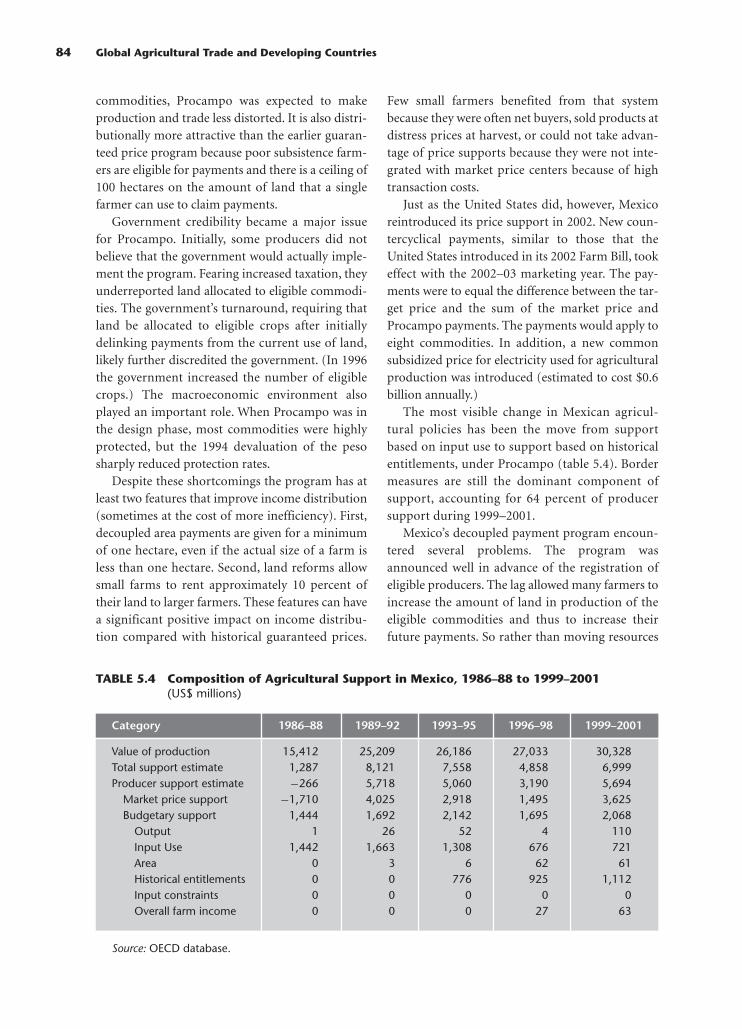
commodities, Procampo was expected to makeproduction and trade less distorted. It is also distri-butionally more attractive than the earlier guaran-teed price program because poor subsistence farm-ers are eligible for payments and there is a ceiling of100 hectares on the amount of land that a singlefarmer can use to claim payments.
Government credibility became a major issuefor Procampo. Initially, some producers did notbelieve that the government would actually imple-ment the program. Fearing increased taxation, theyunderreported land allocated to eligible commodi-ties. The government’s turnaround, requiring thatland be allocated to eligible crops after initiallydelinking payments from the current use of land,likely further discredited the government. (In 1996the government increased the number of eligiblecrops.) The macroeconomic environment alsoplayed an important role. When Procampo was inthe design phase, most commodities were highlyprotected, but the 1994 devaluation of the pesosharply reduced protection rates.
Despite these shortcomings the program has atleast two features that improve income distribution(sometimes at the cost of more inefficiency). First,decoupled area payments are given for a minimumof one hectare, even if the actual size of a farm isless than one hectare. Second, land reforms allowsmall farms to rent approximately 10 percent oftheir land to larger farmers. These features can havea significant positive impact on income distribu-tion compared with historical guaranteed prices.
Few small farmers benefited from that systembecause they were often net buyers, sold products atdistress prices at harvest, or could not take advan-tage of price supports because they were not inte-grated with market price centers because of hightransaction costs.
Just as the United States did, however, Mexicoreintroduced its price support in 2002. New coun-tercyclical payments, similar to those that theUnited States introduced in its 2002 Farm Bill, tookeffect with the 2002–03 marketing year. The pay-ments were to equal the difference between the tar-get price and the sum of the market price andProcampo payments. The payments would apply toeight commodities. In addition, a new commonsubsidized price for electricity used for agriculturalproduction was introduced (estimated to cost $0.6billion annually.)
The most visible change in Mexican agricul-tural policies has been the move from supportbased on input use to support based on historicalentitlements, under Procampo (table 5.4). Bordermeasures are still the dominant component ofsupport, accounting for 64 percent of producersupport during 1999–2001.
Mexico’s decoupled payment program encoun-tered several problems. The program wasannounced well in advance of the registration ofeligible producers. The lag allowed many farmers toincrease the amount of land in production of theeligible commodities and thus to increase theirfuture payments. So rather than moving resources
84 Global Agricultural Trade and Developing Countries
TABLE 5.4 Composition of Agricultural Support in Mexico, 1986–88 to 1999–2001(US$ millions)
Category 1986–88 1989–92 1993–95 1996–98 1999–2001
Value of production 15,412 25,209 26,186 27,033 30,328Total support estimate 1,287 8,121 7,558 4,858 6,999Producer support estimate −266 5,718 5,060 3,190 5,694
Market price support −1,710 4,025 2,918 1,495 3,625Budgetary support 1,444 1,692 2,142 1,695 2,068
Output 1 26 52 4 110Input Use 1,442 1,663 1,308 676 721Area 0 3 6 62 61Historical entitlements 0 0 776 925 1,112Input constraints 0 0 0 0 0Overall farm income 0 0 0 27 63
Source: OECD database.

to more efficient uses, the scheme, initially at least,moved more resources into production that wasalready inefficient. Moreover, because land rightsamong landowners, tenants, and sharecropperswere unclear, it was difficult to determine who wasentitled to payment.
Decoupling Efforts in Turkey
The agricultural sector in Turkey employs 43 per-cent of the labor force and contributes 16 percentto GDP, down from 26 percent in 1980. Total agri-cultural support in Turkey reached an annual aver-age of $9.7 billion during 1999–2001, $6.5 billion ofit in direct producer support, according to theOECD (table 5.5). Of that amount, $5.1 billion wastransferred through border measures, the domi-nant component of agricultural support in Turkey.At 5.1 percent of GDP, Turkey’s agricultural sup-port rate is the highest of all OECD countries andalmost four times the OECD average of 1.3 percent.This support corresponds to $162 per hectare,compared with the $192 per hectare average forOECD. Sugar accounts for 13 percent of estimatedproducer support, milk for 11 percent, and wheatfor 10 percent. The main policy instruments foragricultural support have been border measures,administered prices, input subsidies, and budgetarypayments. With a per capita GDP of a little over$3,000, this support imposes considerable budget-ary strains on the economy.
Responding to the high cost of support and itsdistortionary effects, Turkey embarked on a majoragricultural policy reform program in 2001 withWorld Bank assistance (World Bank 2001). Amain component of the reform was to replaceadministered prices and input subsidies withannual direct income support payments. In addi-tion, farmers were granted a one-time payment tocover the cost of transition from overproducedand highly subsidized commodities to othercommodities.
Income support payments were set at $100 perhectare, but even this low level of transfer impliedan eventual annual expenditure of $1.9 billion. Theupper limit, initially set at 20 hectares, was raised to50 hectares in 2002. As in Mexico, to allow smallsubsistence farmers (who otherwise received nosupport) to benefit from the program, a minimumpayment was set for farmers cultivating below acertain threshold.
A number of hard choices had to be made fol-lowing the decision to implement direct incomesupport payments. A key decision related to records(as was the case in Mexico). A pilot program was setup in several districts in four provinces to test twomethods of developing a registry for producers.One method, applied in two provinces, used theexisting land registry records. A second method,applied in the other two provinces, was based oncertifications by the chief of the village, the council,and the local farmers associations. Payments were
Experience with Decoupling Agricultural Support 85
TABLE 5.5 Composition of Agricultural Support in Turkey, 1986–88 to 1999–2001(US$ millions)
Category 1986–88 1989–92 1993–95 1996–98 1999–2001
Value of production 18,343 26,859 29,158 34,068 29,458Total support estimate 3,092 7,212 6,027 10,705 9,649Producer support estimate 2,779 6,127 4,675 7,791 6,522
Market price support 1,884 4,784 2,712 5,710 5,093Budgetary support 895 1,344 1,962 2,081 1,429
Output 11 30 242 104 337Input Use 885 1,314 1,720 1,978 957Area 0 0 0 0 0Historical entitlements 0 0 0 0 136Input constraints 0 0 0 0 0Overall farm income 0 0 0 0 0
Source: OECD database.

made on a per hectare basis in two installments forup to two hectares.
While the pilot benefited 9,681 farmers includ-ing many small farmers, at a cost of $2.3 million,numerous problems were encountered duringimplementation. Land registries contained uncleardescriptions, shared titles did not specify theamount of land that each person owned, and manylandowners who had inherited their land did notpossess deeds. Registration procedures were alsounclear, and various “producer certificates” wereissued without uniform standards. Many share-croppers were declared ineligible for participationbecause they lacked official documents. There werealso cases of false claims, for nonfarm land or landnot in agricultural use.
Other problems were related to the design andimplementation of the pilot. Farmers receivedinadequate information about the program, andconsequently many failed to apply for benefits(especially in remote villages). The agenciesinvolved in the pilot also received inadequate train-ing and information. And farmers were not givenenough time to apply for the program.
Experience with One-Time Buyouts
In addition to broad decoupling attempts, coun-tries have conducted numerous one-time buyoutsin the last two decades. These buyouts have beenmuch more successful than the broader decouplingefforts.
The 2002 U.S. Peanut Quota Buyout
The U.S. peanut program goes back to 1934, whenpeanut producers agreed to reduce their acreage inreturn for payments. The program failed to reduceoutput and was revised in 1941 by introducingindividual acreage allotments and penalties forfarmers who exceeded the allotments. The allot-ments were not enforced, however. The Agricul-tural Act of 1949 established support prices forpeanuts, and until 1978 all peanuts from approvedallotments were guaranteed the support price. Theprogram again ran into financial difficulties prima-rily because of the introduction of high-yieldingvarieties. Beginning in 1978 peanut quotas were setannually and producers received support for quotapeanuts only. During 1979–82 farmers had to have
both quantity and acreage allotments to be eligiblefor payments. The acreage allotment was aban-doned in 1982. Quantity quotas were tradable, withsome exceptions. Imports were banned.
The program again ran into trouble as the costsof the program grew enormously. Peanut manufac-turers pressed for reforms because they wantedaccess to lower-priced peanuts, while the introduc-tion of the North American Free Trade Agreement(NAFTA) allowed peanut products to enter dutyfree from Mexico and Canada.
Some modifications were made in 1996, but thebiggest change came with the 2002 Farm Bill, withthe government deciding to buy out the marketingquotas created in 1978. Eligible quota holders are tobe compensated for the lost value of the marketingquota during fiscal years 2002–06. Quota holderscan elect to receive payment in five equal install-ments of $0.11 a pound per year times the actualquota allotment for the 2001 marketing year or toreceive the undiscounted sum of all the payments inthe first year, equal to $0.55 a pound. Given that anaverage effective quota for 1998–2000 is 5.6 milliontons, the buyout is expected to cost $181 million ayear, or $1.4 billion for the five-year period. Duringthe same period, the annual value of U.S. peanutproduction was $3.1 billion (8.79 million tonstimes $355 per ton). In addition to the quota buy-out, peanut producers will be compensated byreceiving support from the other provisions of the2002 Farm Bill (decoupled and countercyclical pay-ments). Several factors led to this change in theexisting peanut program: pressure from importsunder NAFTA, opposition by other industrygroups, and enormous increases in the fiscal costsof the program (see chapter 12 in this volume).
Canada’s Buyout of the Railway Subsidy (“CrowRate”) for Grain Shippers
Canada’s Crow Rate program (named forCrowsnest Pass in the Rocky Mountains) goes backto 1897, when Canadian Pacific Railway was given asubsidy of $3.4 million to build a line betweenAlberta and British Columbia. In exchange for thesubsidy, Canadian Pacific agreed to charge grainfarmers 20 percent less than the (then) prevailingrates. The 1925 Railway Act made the subsidizedrates statutory. Over the years the Crow subsidieswere extended to numerous commodities. Because
86 Global Agricultural Trade and Developing Countries

of the higher prices received by western grain farm-ers created by the transportation subsidies, value-added industries (especially livestock production),moved to central and eastern Canada where grainprices were lower (Klein and Kerr 1995).
In 1995 the Canadian government decided toterminate the program, which was becomingfiscally unsustainable. To ease the transition, a one-time payment of C$1.6 billion was made to eligiblefarmers. An additional C$300 million was investedin a more efficient grain handling and transporta-tion system. The one-time payment was spreadover two fiscal years and made to owners of prairiefarmland with eligible crops grown in 1994 andsummer fallow land in 1993, adjusted for a produc-tivity factor, distance factor, and provincial alloca-tion factor. Eligible crops were those that wereeligible for subsidies under the Western GrainsTransportation program. There were no restric-tions on how the payments were used, and theywere treated as a capital gain rather than as currentincome, a concession valued by the OECD at anestimated $0.6 billion.
The outcome has been positive overall. Thelower grain prices lifted a constraint on value-added industries, encouraging entrepreneurshipand innovation; led to diversification into specialtycrops; lowered land prices; and exposed the indus-try to trade challenges. The change also broughtCanada into compliance with international tradeagreements.
The 1984 New Zealand Exit Grant
Before 1984 New Zealand’s farmers were receivinggenerous support—in some years as high as 40 per-cent of the value of production. In 1984 the govern-ment abolished the subsidies. With the economyalmost on the brink of bankruptcy and facing dete-riorating external markets, inflation, and histori-cally high interest rates, the government eliminatedalmost 30 different production subsidies. Althoughthe end of agricultural subsidies took place in con-junction with overall deregulation of the economyand reduced input costs, currency appreciation andlow commodity prices during 1985–87 made thetransition stressful.
To ease the transition, the government providedone-time exit grants to farmers leaving the land,equivalent to about 66 percent of their previous
annual income. Farmers with extremely lowincomes were temporarily entitled to social welfareincome support. Farmers were also offered limitedfinancial advice. There was no substantive effort tosoften the effects of the change. Despite early pre-dictions that large numbers of farmers would leavethe land, only 1 percent of farms failed, with signif-icant adjustments occurring in the form of off-farm employment and changes in input use andoutput mix.
Land prices, which had been kept artificiallyhigh by the subsidies, plummeted with theirremoval. Marginal land reverted to bush, andsubsidy-driven land management problems ended.Now farmland values have more than recovered asfarm profitability has been restored. Farmersreduced costs and focused on producing higher-value products, where profitable. Many farmersrestructured their debts and continued farming,adjusting farm practices to reduce input costs. Withinvestment decisions now subject to commercialand good farming disciplines, agricultural inputsuppliers were forced to become more competitive,also improving the competitiveness of the agricul-tural sector.
Since 1986–87 the value of economic activity inNew Zealand’s farm sector has grown by more than40 percent in constant dollar terms, and agricul-ture’s contribution to the economy has risen from14.2 percent of GDP in 1986–87 to 16 percent in1999–2000. With the removal of farm subsidies,GDP growth went from 1 percent in 1986 to thecurrent annual average of 5.9 percent. New Zealandhas around 80,000 farm holdings. Sheep and beeffarms account for 20 percent of the number offarms, and dairy farms for 18 percent. Horticulture,forestry, cropping, and rural tourism also con-tribute to the rural sector, which employs 11.4 per-cent of the work force. About 80 percent of NewZealand’s farm outputs are exported, accountingfor more than half of New Zealand’s merchandiseexports.
Assessing Decoupling
The movement toward decoupled agricultural poli-cies is undeniably a step in the right direction,reducing trade distortions and increasing worldprices for developing countries’ exports. But howmuch movement has actually occurred? And what
Experience with Decoupling Agricultural Support 87

have been the net effects on resource use, efficiency,and trade distortions?
The rate of agricultural protection in OECDcountries has declined, while the share of domes-tic support has increased. Total direct supportto agricultural producers as measured by esti-mated producer support averaged $235 billion in2000–02, 63 percent of it from border measures.Most support is concentrated in a few sectors(milk, meats, and sugar).
Although the absolute level of producer supporthas remained fairly constant, taxpayer-financedsubsidies paid directly to farmers have increasedsignificantly. From 1986–88 to 2000–02, domesticsubsidies to farmers rose 60 percent, with large-impact programs (output and input subsidies)increasing moderately compared with the substan-tial increases in so-called smaller-impact programs(subsidies for land area and number of animals,decoupled historical entitlements, and paymentsbased on input use restrictions and overall farmincome). Payments based on area planted andnumber of animals have increased the most, fol-lowed by historical entitlements. Several countries,however, have made little progress in reforming thecomposition of support away from border supportto domestic support (among them Japan andSwitzerland), while others have not needed sub-stantial reforms (many members of the CAIRNSGroup).
As for reductions in trade distortions, experi-ence in the decoupled programs described abovehas been mixed. The few countries studied herehave moved away from border support to domesticsupport and to less distorting domestic support.Although there is evidence of a reallocation ofresources across agriculture as a result, the declinein total output and increase in world prices havebeen modest.
In addition to the uneven distribution of “cou-pled” subsidies (less in major field crops, more insugar and livestock), other factors help to explainthe lack of significant reductions in output. Eligi-bility rules have changed, and expectations aboutfuture policies and dynamic considerations affectcurrent production decisions because producersdevelop expectations about future assistance basedon past government actions. Experience shows thatimperfect decoupled programs still distort trade,especially when decoupled payments are substan-
tial. Large payments can have risk reduction effectsthat lead to increased output. Direct payments alsohelp cover fixed costs, allowing farmers to cross-subsidize production at market prices. Directpayments can affect farmers’ investment and exitdecisions if they are facing constraints in capitaland labor markets. Direct payments allow banks tomake loans that they otherwise would not andallow farmers with specialized skills to stay inagriculture.
The primary motivation for decoupling is tocompensate farmers for the move to free marketsby providing transitional adjustment assistance.This also makes the programs politically morepalatable and transparent. Ideally, compensationprograms would be universal (open to all sectors inthe economy, not just agriculture) or at least non-sector-specific within agriculture. A simple andminimally distorting scheme would be a one-timeunconditional payment to everyone engaged infarming or deemed in need of compensation that isnontransferable, along the lines of the one-timebuyouts discussed earlier.
However, because a one-time buyout is anunlikely outcome (unless it is well-targeted in onesector), specific attention should be given to timelimits, harmonization with other support pro-grams, government credibility, and constraints oninput use (Baffes and de Gorter 2003 provide adetailed discussion of these conditions along withWTO’s potential role on decoupling). Unless theseaspects are properly addressed, decoupled pro-grams are likely to have the same detrimentaleffects as other subsidy programs.
Most important, programs should be strictlylimited in duration. The European Union andTurkey have no limit: the United States had (at leastimplicitly) one in the 1996 Farm Bill but violated itthree years later. Mexico’s reform had a time limit,which so far has not been extended. A time limithelps to ensure that payments are made for adjust-ment purposes only.
If there are other (coupled) support programs,the decoupled program may not eliminate theincentives to overproduce. All four decouplingcases examined here either left other coupled sup-port programs in place or added new ones.
To maintain government credibility and reduceuncertainty, eligibility rules need to be clearlydefined and not allowed to change. The time period
88 Global Agricultural Trade and Developing Countries

on which payments are based, the level of payments,and the sectors covered should all remain fixed.Updating bases and adding crops create a govern-ment credibility problem, making the decouplingpolicy inconsistent over time. If governments havethe discretion to change eligibility criteria and pay-ments as market conditions change, these commit-ments will not be viewed as binding. Farmers,meanwhile, will change their production decisionsto reflect this, thus undermining decoupling.
Support to specific sectors within agricultureshould be in the form of taxpayer-funded pay-ments. There should be no requirement of produc-tion. Land, labor, and any other input should nothave to be in “agricultural use.”
Experience shows the difficulty of designingeffective decoupling schemes. But strict criteria arerequired to minimize direct trade distortionsbecause sector-specific decoupled support can stillaffect output indirectly, through wealth effects andlessened constraints in credit and labor markets.One way to improve the performance of decou-pling schemes might be to have the WTO specifythe conditions; this approach would avoid counter-vailing duties by other countries.
References
Alston, J. M., and B. H. Hurd. 1990. “Some Neglected SocialCosts of Government Spending in Farm Programs.”American Journal of Agricultural Economics 72.
Baffes, John, and Harry de Gorter. 2003. “Decoupling Supportto Agriculture: An Economic Analysis and of RecentExperience.” Paper presented at the Annual World BankConference on Development Economics–Europe, May15–16, Paris.
Baffes, John, and Jacob Meerman. 1998. “From Prices toIncomes: Agricultural Subsidization without Protection?”World Bank Research Observer 13(2): 191–211.
Beard, Nick, and Alan Swinbank. 2001. “Decoupled Payments toFacilitate CAP Reforms.” Food Policy 26: 121–46.
Beghin, John C., Jean-Christophe Bureau, and Sung Joon Park.2003. “Food Security and Agricultural Protection in SouthKorea.” American Journal of Agricultural Economics 85:618–32.
Cahill, Sean, A. 1997. “Calculating the Rate of Decoupling forCrops under CAP/Oilseeds Reforms.” Journal of AgriculturalEconomics 48: 349–78.
Finkle, Peter, and Duncan Cameron. 1990. Decoupling: TheConcept and Its Future in Canada. Ottawa: AgricultureCanada.
Goodwin, Barry K., and Ashok K. Mishra. 2002. “Are‘Decoupled’ Farm Program Payments Really Decoupled?An Empirical Evaluation.” Ohio State University, Columbus,http://departments.agri.huji.ac.il/economics/kenes-goodwin2.pdf.
Hennessy, David A. 1998. “The Production Effects of Agricul-tural Income Support Policies under Uncertainty.” AmericanJournal of Agricultural Economics 80(1): 46–57.
Klein, K. K., and W. A. Kerr. 1995. “The Crow Rate Issue: ARetrospective on the Contributions of the Agricultural Eco-nomics Profession in Canada.” Canadian Journal of Agricul-tural Economics 44(1): 1–18.
Moschini, G., and P. Sckokai (1994), “Efficiency of DecoupledFarm Programs under Distortionary Taxation,” AmericanJournal of Agricultural Economics 76.
Nash, Eric Francis. 1961. “Agriculture.” In Arthur Selton, ed.,Agenda for a Free Society: Essays on Hayek’s “The Constitutionof Liberty.” London: The Institute of Economic Affairs.
Nicholls, William H., and D. Gale Johnson. 1946. “The FarmPrice Policy Awards, 1945: A Topical Digest of the WinningEssays.” Journal of Farm Economics 27(1): 267–83.
OECD (Organisation of Economic Co-operation andDevelopment). 2000a. “Decoupling: A ConceptualOverview.” COM/AGR/APM/TD/WP 14. Paris.
———. 2000b. “Methodology for the Measurement of Supportand Use in Policy Evaluation.” Paris.
Parry, Ian W. H. 1999.“Agricultural Policies in the Presence of Dis-torting Taxes.” American Journal of Agricultural Economics 81.
Spriggs, John, and Dale Sigurdson. 1988. “The Economics ofDecoupling and Targeting Canada’s Grain and LivestockStabilization Programs.” In Peter Finkle and DuncanCameron, eds., Decoupling: The Concept and Its Future inCanada. Ottawa: Agriculture Canada.
Swerling, Boris G. 1959. “Income Protection for Farmers: APossible Approach.” Journal of Political Economy 64(2):173–86.
Swinbank, Alan, and Stefan Tangermann. 2001. “The Future ofDirect Payments under the CAP: A Proposal.” EuroChoices1(1): 28–35.
Tangermann, Stefan. 1991. “A Bond Scheme for SupportingFarm Incomes.” In J. Marsh, B. Green, B. Kearney, L. Mahé, S.Tangermann, and S. Tarditi, eds., The Changing Role of theCommon Agricultural Policy: The Future of Farming inEurope. London: Belhaven.
Van Donkersgoed, Elbert. 1988. “Decoupling: A Family Farmand Stewardship Approach.” In Peter Finkle and DuncanCameron, eds., Decoupling: The Concept and Its Future inCanada. Ottawa: Agriculture Canada.
Winters, L. Alan. 1989–90. “The So-Called ‘Non-Economic’Objectives of Agricultural Support.” OECD Economic Studies13: 238–66.
World Bank. 2001. “Turkey—Agricultural Reform Implementa-tion Project.” Project Appraisal Document. Europe andCentral Asia Region, Turkey Country Unit, Washington, D.C.
Experience with Decoupling Agricultural Support 89


Standards: Barrier or Catalyst?
The expansion of global trade in perishable agricul-tural products and high-value foods has high-lighted the great divergence in national standardsfor food safety and animal and plant health and inthe capacities of public authorities and commercialsupply chains to manage the risks associated withtrade in these products. For many higher-valuefoods, including fruits and vegetables, fish, beef,poultry, and herbs and spices, the challenges ofinternational competitiveness have moved wellbeyond price and basic quality to food safety andagricultural health concerns.1 There is increasingattention to the risks associated with microbialpathogens; residues from pesticides, veterinarymedicines, and other agricultural inputs; and envi-ronmental or naturally occurring toxins. And thereis greater scrutiny of the production and processingtechniques employed along supply chains (Buzby2003).
There are several reasons why food safety andagricultural health standards, referred to as sanitaryand phytosanitary measures within the WorldTrade Organization (WTO), differ across countries
Food safety and agricultural health standards canimpede trade, especially for developing countries,through explicit bans on imports of particularproducts or through the high cost of compliancewith stringent standards, which can diminish com-petitiveness. In certain circumstances, however, thenew landscape of proliferating and increasinglystringent food safety and agricultural healthstandards can be a basis for the competitive reposi-tioning and enhanced export performance ofdeveloping countries. Key to this is the ability ofdeveloping countries to upgrade capacity and makenecessary adjustments in the structure and opera-tion of their supply chains. In an attempt to rebal-ance much of the dialogue in this area, this chapterexplores the nature of the new standards landscapeand the related capacity requirements, before look-ing at the impacts on trade. In addition to the tradi-tional approach using quantitative measures ofchanges in trade that are related to the evolution ofstandards, the chapter presents a number of illus-trative case studies that relate losses or gains intrade to food safety and agricultural health require-ments within the context of wider supply chainchallenges.
91
6AGRO-FOOD EXPORTS
FROM DEVELOPINGCOUNTRIES: THE
CHALLENGES POSEDBY STANDARDS
Steven M. Jaffee andSpencer Henson

92 Global Agricultural Trade and Developing Countries
(Unnevehr 2003; Henson 2004). Differences intastes, diets, income levels, and perceptions influ-ence people’s tolerance of these risks. Differences inclimate and available technology (from refrigera-tion to irradiation) affect the incidence of foodsafety and agricultural health hazards. Standardsreflect the feasibility of implementation, itselfinfluenced by legal and industry structures as wellas technical, scientific, administrative, and finan-cial resources. Some food safety risks tend to begreater in developing countries because of weak-nesses in physical infrastructure and the higherincidence of certain infectious diseases. Tropicaland subtropical climates may be more conducive tothe spread of certain pests and diseases that poserisks to health.
Thus the intrinsic risks associated with the pro-duction, transformation, and sale of high-valueand perishable food products, combined with dif-ferent standards and institutional capabilities, canpose major challenges for international trade. Andfood safety and agricultural health standardsare changing rapidly, along with increased publicawareness of food safety in high-income countriesfollowing a series of highly publicized food scaresor scandals (bovine spongiform encephalopathy, orBSE, in beef in the United Kingdom, E. coli in ham-burgers in the United States, dioxins in animal feedin Belgium). In response, there have been signifi-cant institutional changes in food safety oversightand reform of laws and regulations. For long-heldconcerns such as pesticide residues, there has beena tightening of standards in many countries. Andnew standards are being applied to address previ-ously unknown or unregulated hazards, such asBSE, genetically modified organisms, and environ-mental contaminants.
As official standards and public oversight havechanged, the private sector has moved rapidly toaddress food safety risks and the concerns and pref-erences of consumers, resulting in a proliferation ofprivate codes of practice and other forms of supplychain governance. Private systems of food safetygovernance are also being applied more widely inmiddle-income and some low-income countries, inpart through investments by multinational super-market and restaurant chains and competitiveresponses by local firms (Reardon and Berdegue2002). In addition, new food safety standards inindustrial countries are shaping the expectations of
developing-country consumers, especially thosewith higher incomes and in urban areas.
The proliferation and enhanced stringency offood safety and agricultural health standards are agrowing concern among many developing coun-tries and those promoting their increased integra-tion into the world trading system. Reflecting widerchanges in the trade regime for various agriculturaland food products, there is a presumption thatfood safety and agricultural health measures will beused as protectionist tools, providing “scientific”justification for prohibiting certain imports orapplying higher standards to imports than todomestic supplies. Even if standards are not inten-tionally used to discriminate, their growing com-plexity and lack of harmonization could stillimpede the trading efforts of developing countries.
There is also a concern that many developingcountries lack the administrative, technical, andscientific capacities to comply with emergingrequirements. The investment and recurrent costsof compliance could undermine the competitiveposition of developing countries or otherwise com-press the profitability of high-value food exports.The combined effects of institutional weaknessesand rising compliance costs could contribute to thefurther marginalization of weaker economic play-ers, including poor countries, small businesses, andsmallholder farmers.
A less pessimistic view emphasizes the opportu-nities provided by evolving standards, which somedeveloping countries can use to their competitiveadvantage. Many of the emerging public andprivate standards can serve as a bridge betweenincreasingly demanding consumers and distantsuppliers. The standards can provide a commonlanguage within the supply chain and promoteconsumer confidence in food product safety.
From this standards-as-catalyst perspective,food safety and agricultural health standards mayprovide a powerful incentive for modernizingdeveloping-country export supply chains and giv-ing greater clarity to the management functions ofgovernment. Further, there may be spillovers intodomestic food safety and agricultural health, to thebenefit of the local population and domestic pro-ducers. Part of the costs of compliance could beconsidered necessary investments, while an array offoreseeable and unforeseeable benefits might arisefrom the adoption of different technologies and

management systems. Rather than degrading thecomparative advantage of developing countries,enhancement of capacity to meet stricter standardscould create new forms of competitive advantage,providing the basis for more sustainable and prof-itable trade over the long term.
This rather crude dichotomy between standardsas barriers and standards as catalysts suggests acomplex reality in which close attention is neededto the specifics of particular markets, products, andcountries to understand how the changing foodsafety and agricultural health standards environ-ment is providing challenges and opportunities fordeveloping countries. This chapter draws on theliterature and work in progress to examine theunderlying evidence on the changing standardsenvironment and its implications for developing-country exporters of high-value agricultural andfood products. Drawing on both systematic andanecdotal evidence, the chapter presents a variedpicture, partially supporting both perspectives.
The Sanitary and PhytosanitaryAgreement: An End to Disguiseand Discrimination?
During the Uruguay Round of multilateral tradenegotiations, agricultural exporters voiced con-cerns that sanitary and phytosanitary measureswere being used to restrict foreign competition andthat such protectionist measures would likelyincrease as the use of more traditional trade barri-ers declined. The Agreement on the Application ofSanitary and Phytosanitary Measures provided a setof multilateral rules recognizing the need of coun-tries to adopt such measures and creating a frame-work to reduce their trade distorting effects.
The agreement, built on the Standards Code ofthe 1947 General Agreement on Tariffs and Trade,permitted measures “necessary to protect human,animal, or plant life and health,” yet required thatregulators base measures on a scientific risk assess-ment, recognize that different measures can achieveequivalent safety outcomes, and allow importsfrom particular regions in an exporting countrywhen presented with evidence of the absence or lowincidence of pests or diseases. The agreementencouraged the adoption of international stan-dards, making explicit reference to those of theCodex Alimentarius Commission for food safety,
the International Office of Epizootics for animalhealth, and the International Plant Protection Con-vention for plant health. The agreement protectsthe rights of countries to choose their own “appro-priate level of protection,” yet guides members to“take into account the objective of minimizing neg-ative trade effects.”
Important underlying objectives are minimiza-tion of protectionist and unjustified discriminatoryuse of standards and promotion of greater trans-parency and harmonization. In both regards, expe-rience has been mixed. The difficulties encounteredare probably due less to specific shortcomings ofthe Sanitary and Phytosanitary Agreement itselfthan to the intrinsic complexities of managing foodsafety and agricultural health protection and therapidly evolving markets for agricultural and foodproducts. Further, it is evident that WTO membersvary widely in their understanding of the agree-ment and their ability to take advantage of therights and responsibilities it defines.
The agreement has not brought an end to thedifferential application of standards—nor should it.Differentiation is a necessary part of any risk-basedfood safety and agricultural health control system.The hazards to be monitored and the control meas-ures to be implemented need to be prioritized at thecountry, industry, and enterprise levels. Politicalfactors as well as scientific evidence influence prior-ities, focusing, for example, on issues of greatestconcern to consumers and other interest groups(Henson 2001). As resources are limited and imple-mentation may be costly, an effective risk manage-ment system will go beyond prioritizing potentialhazards to differentiate explicitly among alternativesources of supply based on conditions of produc-tion, experience, and assessments of risk manage-ment capabilities in the supply chain.
Separating Legitimate and Illegitimate StandardsDifferentiation
When regulators and others have wide discretionand differentiation is required for cost-effectivemanagement of food safety and agricultural health,there remains ample scope for mischief. Yet separat-ing legitimate differentiation from illegitimate dis-crimination is problematic. Even more difficult isclearly attributing standards to protectionist inten-tions, considering that in most circumstances at least
Agro-Food Exports from Developing Countries: The Challenges Posed by Standards 93

partially legitimate food safety or agricultural healthissues are involved. For example, in two widely refer-enced cases of assumed protectionist motivation—restrictions on exports of Mexican avocados andArgentine citrus fruits to the United States—therewas scientific justification for measures to preventthe spread of plant disease, though less-trade-restricting measures were available (Roberts andOrden 1997). In other cases, trade partners havedifferent perspectives on the state of scientificknowledge and the need to make allowance foruncertainty.A prominent case is the dispute betweenthe European Union (EU) and United States over theuse of hormones in beef cattle (Pauwelyn 1999;Bureau, Marette, and Schiavina 1998).
Thus, questions remain about whether there issystematic discrimination against imports in theapplication of food safety and agricultural healthcontrols. One question is whether foreign suppliersmust comply with higher standards than domesticsuppliers. No systematic research has been done onthis subject, although a great deal of anecdotal evi-dence is presented by those who purport to havebeen adversely affected by such discrimination.And WTO members raised 241 complaints in theSanitary and Phytosanitary Committee from 1995to 2002 (Roberts 2004).
General impressions suggest that many coun-tries, both industrial and developing, have a lowertolerance for certain animal and plant health risksfrom imports than from domestic sources. Therehave been cases when countries have restrictedimports from countries experiencing a plant pestor animal disease that is also prevalent domesti-cally. Similar observations can be made for somefood safety controls. For example, the United Stateshas long argued that, like itself, a broad array ofcountries has a near-zero tolerance for salmonellain imported poultry products yet this pathogen iswidely present in domestic supply chains. Coun-tries can also apply discriminatory measures todifferent importing countries. For example, thePhilippines complained that Australia prohibitedimports of Philippine sauces containing benzoicacid while permitting imports from New Zealandof similar products containing that additive.
Private and Public Oversight and Monitoring
High-value food exporters in developing countriesfrequently claim that they face more rigorous
controls than do domestic suppliers in certainindustrial countries. But this intensive oversightand monitoring often come from private entities,especially supermarkets and their buying agents,rather than from official systems. And the methodsof control that exporters face are more visible intheir effects, in that compliance for exporters isassessed at the border, with entry possibly deniedon this basis, whereas domestic suppliers are regu-lated through inspection of processing facilities,with a focus on system-based controls and marketsurveillance.
Yet, there is anecdotal evidence that regulatoryoversight is substantially more stringent on domesticsupplies in certain products and markets. For exam-ple, there is no official requirement in the UnitedStates for border testing of cereals or nuts for thepresence of aflatoxin. Private-sector testing for afla-toxin levels in cereals is commonplace in the domes-tic market, however, with frequent price discountsbeing applied by buyers. Over a typical three-yearperiod the U.S. Food and Drug Administration’s(FDA) Center for Food Safety and Applied Nutritioninspects all domestic firms that produce low-acidcanned foods, yet only 3 percent of foreign facilitiesthat export such products to the United States mar-ket undergo such inspection.2 The FDA inspects only1–2 percent of the more than 6 million consignmentsof food (and cosmetic products) imported each year.For relatively high-risk products (for example, fishand meat products), a higher proportion of domesticthan imported supplies is inspected. In both theUnited States and the European Union compliancemonitoring for pesticide residues pays consider-ably more attention (absolute and proportional) todomestic suppliers than to imports.3
There is also little research comparing the inten-sity with which private buyers and distributorsenforce their own standards among domestic sup-pliers and foreign suppliers, especially in develop-ing countries. With less opportunity to observedirectly the food safety and agricultural healthcontrol systems employed by developing-countrysuppliers, private buyers would likely emphasizeend-product testing or third-party certification ofquality management systems. This is certainly aclear trend among buyers in the United Kingdomand the Netherlands, for example, yet it is doubtfulthat such requirements are being imposed ondeveloping-country suppliers at the same rate as ontheir industrial-country competitors.4
94 Global Agricultural Trade and Developing Countries
Increased Complexity of the StandardsEnvironment
The overall picture for food safety and agriculturalhealth requirements in trade is becoming increas-ingly complex and fast moving as standards arepromulgated in multiple spheres at both public andprivate and national and international levels. Thecomplexity of this issue stems from the variabilityof the standards themselves and from differences inhow and with what intensity standards are moni-tored and enforced, which is also changing overtime.
The transparency of official regulatory measuresin the application of food safety and agriculturalhealth requirements has clearly improved since theSanitary and Phytosanitary Agreement entered intoforce. Some 85 percent of WTO members haveestablished an “enquiry point” for obtaining infor-mation on proposed food safety and agriculturalhealth requirements. Between 1995 and 2002 WTOmembers submitted some 3,220 notifications indi-cating the nature and objectives of proposed meas-ures, the products they applied to, whether theywere based on an international standard, and whenthe measure was to come into force. These notifica-tions provide advance warning of new or modifiedmeasures and an opportunity for trading partnersto raise questions about the proposed measures,both bilaterally and through the Sanitary and Phy-tosanitary Committee. An increasing proportion ofWTO members, including developing countries,has been taking advantage of this opportunity toraise concerns (Roberts 2004).
While the transparency of many food safety andagricultural health measures has increased, consid-erable variation remains in standards across coun-tries. And there is widespread uncertainty abouthow certain countries are implementing their stan-dards. Roberts, Josling, and Orden (1999) note thepaucity of international standards for many agro-food products and indicate that the vast majorityof food safety and agricultural health measuresnotified to the WTO during 1995–99 had no inter-national standard.5 With specific reference to horti-cultural products, Roberts and Krissoff (2003)found that over the same period two-thirds ofnotifications involved measures for which there wasno recognized international standard and thatmany involved maximum pesticide residue levels.Jaffee (2003) notes that despite EU efforts to har-monize maximum pesticide residue levels in
imported fresh fruit and vegetables, wide variationsremain in operative standards due to countries’ dif-ferent approaches to surveillance and enforcement.
Variations in standards are also common inother sectors. Henson and Mitullah (2004) note thevaried standards that developing countries mustmeet to gain and maintain access to the U.S., EU,and Japanese markets for fish products. While somerequirements overlap, differences remain in bothregulatory and technical requirements. Likewise,Mathews, Bernstein, and Buzby (2003) highlightthe range of product and process standards coun-tries require to minimize the risk of salmonellacontamination in poultry products. Dohlman(2003) and Otsuki, Wilson, and Sewadeh (2001)discuss the significant differences in the maximumpermitted level for aflatoxin in cereals and nuts andin the sampling methods used. This lack of harmo-nization of standards and conformity assessmentprocedures raises production and transaction costsfor developing-country suppliers, necessitatingduplicative testing and reducing their ability toachieve economies of scale in production and infood safety and agricultural health managementfunctions.
Also contributing to the increased complexity ofthe standards environment is the expansion of risk-based process standards relating to production,postharvest, and other procedures, and the prolifer-ation of private standards. Roberts (2004) notesthat the major international standards organiza-tions have devoted more of their attention andresources over the past decade to the developmentof common approaches to risk identification,assessment, and management than to internationalstandards themselves. This reflects both the ineffi-ciency and the inefficacy of end-product testing,particularly in view of the levels of risk deemedacceptable today and the emergence of new ornewly prominent food-borne pathogens.
With respect to private standards, there havebeen attempts to harmonize standards formerlyapplied by individual private companies, yet aplethora of private standards are still simply com-municated through individual supply chains andcan vary widely in their specific requirements.Examples of private protocols that have been codi-fied and are available to the public include foodsafety and food hygiene protocols, such as theBritish Retail Consortium Technical Food Standardand the EUREPGAP Fruit and Vegetable Standard,
Agro-Food Exports from Developing Countries: The Challenges Posed by Standards 95

which combines food safety, environmental, andsocial dimensions. Other standards focus on socialor environmental issues, such as Social Account-ability 8000, the Ethical Trading Initiative, and theMarine Stewardship Initiative.
Variations in food safety and agricultural healthrequirements together with the progressive shifttoward process-based measures have enhanced theimportance of “equivalence” of national standardsand systems. Currently, there is no systematicrecording of equivalence agreements. Most appearto be between industrial countries. Certain develop-ing countries, including successful agriculturalexporters, have highlighted the difficulties in gain-ing recognition for the equivalency of their foodsafety and other controls to those of their majortrading partners (WTO 2001). A successful andwide-ranging example of equivalence, however, isthe recognition by the European Union that manydeveloping and industrial countries have establishedsystems of hygienic control for fish and fisheryproducts that offer a level of protection at least com-parable to its own legislation (see discussion below).
A parallel trend, reflecting the proliferation ofprivate standards, is the heightened importance ofcertification of compliance with defined standards,which is typically undertaken by a third-partyagency that the buyer recognizes as “competent.”A crucial issue for developing countries is theestablishment of certification capacity and parallelinstitutions for accrediting certification bodies.Exporters in countries that lack an accreditationcertification system may be forced to use the ser-vices of an accredited body in another country, atconsiderable cost (El-Tawil 2002).
What Capacity Is Needed?
Countries frequently require guarantees thatimports come from areas that are free of certainpests or diseases; that minimum standards ofhygiene have been applied in manufacture, packag-ing, and distribution; and that products are free ofexcessive residues of pesticides, medicines, andother contaminants. The exporting country musthave the capacity to comply with these require-ments and to demonstrate compliance. Among therequired capacities are:
• Detecting the presence or demonstrating theabsence of biological, chemical, and physical
hazards and having an information system toinform decision-making processes.
• Employing emergency procedures in the eventof emerging hazards or outbreaks.
• Certifying that traded products meet establishedfood safety risks.
• Undertaking scientific analysis of hazards inagricultural inputs and food products.
• Establishing and maintaining the identity ofagricultural products through the supply chain.
• Establishing and maintaining systems forhygienic practices in agro-food product han-dling and transformation.
• Registering the production, distribution, anduse of agricultural inputs that may pose risks tohuman, animal, or plant health.
Administrative and technical capacities for foodsafety and agricultural health management areembodied in institutional structures and proce-dures, physical infrastructure, and human capital.It is frequently assumed that managing food safetyand agricultural health is predominantly a public-sector responsibility. While some crucial regulatory,research, and management functions are normallycarried out by governments, and importing coun-tries may require that certain functions be per-formed by a designated public-sector “competentauthority,” the private sector also has importantroles:
• Because it is typically well informed about tech-nical options and hazard management systems,it should contribute to standard setting.
• Compliance with food safety and agriculturalhealth standards requires specific actions byindividual producers and processors.
• Capacity building in the private sector can com-plement (or substitute for) public-sector capac-ity, as through investment in accredited labora-tory testing facilities.
Development of food safety and agriculturalhealth management systems is closely related to theavailability of wider technical, administrative, andscientific capacities that reflect broader patternsof economic development as much as specificdemands for food safety and agricultural healthcontrols. Unnevehr and Hirschhorn (2001) high-light the capacity needs for food safety manage-ment at different stages of economic development.
96 Global Agricultural Trade and Developing Countries

Export-oriented agriculture gives rise to a new setof challenges because foreign food safety and agri-cultural health requirements may differ sharplyfrom domestic requirements, especially in the caseof low-income countries (Dong and Jensen 2004).
Some regulatory, technical, and administrativecapacities represent a greater constraint ondeveloping-country exports of agricultural andfood products than do others.6 In general, weak-nesses in the management of plant and animalhealth issues are more likely to be an absolute bar-rier to trade than is lack of food safety controls. Formany food safety hazards there is an array of effec-tive technologies or approaches, some of which donot require sophisticated equipment or expertise.Even where management of food safety hazards iswell within the capacities of producers and proces-sors, systems of conformity assessment require test-ing and certification of food safety managementsystems and end products. Many developing coun-tries lack the capability to undertake the rigorousepidemiological surveillance and risk assessmentsdemanded by trading partners. They lack theaccredited laboratories and internationally recog-nized systems for certification (El-Tawil 2002).Thus, regardless of private-sector capacity to meetthe food safety and quality requirements of foreigncustomers, the country as a whole will be unable togain market access.
While many developing countries have wide-spread weaknesses in food safety and agriculturalhealth management capacity, there is evidence thateven low-income countries can establish the regu-latory, technical, and administrative arrangementsto meet demanding standards in high-incomeexport markets. The European Commission hasrecognized a relatively large—and growing—number of low- and lower-middle-income coun-tries as having standards of hygiene in the capture,processing, transportation, and storage of fish andfishery products that are at least equivalent to thoseof the European Union. Their shipments benefitfrom reduced physical inspection at the border.
How Significant Are ComplianceCosts?
Developing countries can incur significant “costsof compliance” whenever changes are made ininternational standards or those of their trading
partners. These costs can come in various forms,including fixed investments in adjusting produc-tion and processing facilities and practices,recurrent personnel and management costs toimplement food and other control systems and thepublic- and private-sector costs of conformityassessment.
Typically there are a variety of technological andadministrative ways in which to achieve compli-ance with a certain standard. For this and otherreasons the level and relative significance of com-pliance costs can vary enormously from industry toindustry and between countries.7 Important vari-ables include the structure and conditions of thesupply chain, the extent of administrative and sci-entific capacities, the degree of cooperation withinindustries and between the public and private sec-tors, and the strength of technical service indus-tries. Where the export industry is mature andreasonably well developed, changes in food safetyand agricultural health standards may requireonly incremental adjustments by producers andexporters and modest changes in public-sectoroversight arrangements. Where the supply chain ismakeshift, however, or uses multipurpose facilitiesand when new requirements (or levels of enforce-ment) necessitate major upgrades, some firms mayneed to redirect their products to less-demandingmarkets, while others will need to undertake signif-icant fixed investments.
Consider the differences in adjustment costsassociated with investments in the upgrading ofhygiene controls in the shrimp industries inBangladesh and Nicaragua (table 6.1). InBangladesh major investments had to be made inthe mid-1990s to upgrade fish-processing facilities,product-testing laboratories, and other areas inresponse to repeated quality and safety detentionsof products entering the United States and a ban in1997 on shrimp imports into the European Union.These investments equaled 2.3 percent of the valueof the country’s shrimp exports in 1996–98. Annualmaintenance costs for hazard analysis and criticalcontrol point (HACCP) and regulatory systemsequaled 1.1 percent of exports. The Nicaraguanshrimp industry needed to make adjustments dur-ing 1997–2002 to hygiene controls to ensure com-pliance with modified U.S. fish safety regulations,including requirements to implement a HACCPprogram. But many Nicaraguan factories were
Agro-Food Exports from Developing Countries: The Challenges Posed by Standards 97

relatively new and modern, so only modest incre-mental investments were needed, equivalent to0.6 percent of the value of exports.
Many technological and organizational changesinvolve shifts in levels and structures of operatingcosts. The costs associated with these changes areoften controversial. The changes are sometimesperceived to be unjustified, because they lack scien-tific basis or replace simpler, less costly proceduresthat might provide similar outcomes. Anothercomplaint is that suppliers obtain little or no bene-fit beyond continued market access, while theopportunity cost of the required investments canbe considerable. This complaint is more difficult tosustain, often reflecting a lack of appreciation of thefrequently intangible or indirect benefits that canresult from enhancement of food safety controls,for example. Improved control systems can reducewaste, improve product-cost accounting, andenhance staff morale. Thus, changes in product andprocess technologies can generate substantialincreases in efficiency, reducing production costsand promoting competitiveness.
The expenditures related to standards compli-ance can have other beneficial, multiplier effects.Some of the needed investments may require labor,especially skilled and supervisory workers, creatingadditional job opportunities. Other expendituresmay go toward building materials, contractors, andtechnical services, much of which could be sourcedlocally. Only where upgrading relies primarily onimported equipment or expertise would there befew multiplier effects.
The enhancement of food safety capacity canalso have more dynamic and wide-ranging impactson private-sector suppliers. For example, imple-menting an HACCP system and gaining third-party certification can send positive signals toexisting and potential customers, enabling firms toreposition themselves in the marketplace or accessnew markets. Indian fish-processing plants thathave invested in sophisticated systems of hygienecontrol are seeking to access higher-value marketsfor processed and semi-processed products. Some-times, when problems are experienced in comply-ing with requirements in a particular market,producers and exporters will shift to markets withlower or different food safety requirements. Kenyanfish exporters, which have been highly dependenton European markets, have attempted to diversifytheir exports to Australia, Japan, and the UnitedStates.
But even where the administrative, technical,and financial burdens of compliance are manage-able at the country or industry level, the burdensmay be too great at the firm level. There is a generalconcern that the challenge of rising standards ismarginalizing smaller players, especially producers,traders, and processors, as well as smaller industriesas a whole. There is, however, little empirical evi-dence to support this argument. In part, this isbecause of the difficulties of disentangling the spe-cific role of standards compliance in the consolida-tion processes of agro-food systems.
In many cases, compliance requirements exacer-bate other factors that threaten the status quo in
98 Global Agricultural Trade and Developing Countries
TABLE 6.1 Costs of Compliance with Export Food Safety Requirements in theShrimp Processing Industry in Bangladesh and Nicaragua(millions of US$)
Bangladesh NicaraguaCost 1996–98 1997–2002
Industry facility upgrading 17.55 0.33Government 0.38 0.14Training programs 0.07 0.09Total 18.01 0.56Annual maintenance of HACCP program 2.43 0.29Shrimp exports during focal periods 775.00 92.60Average annual shrimp exports 225.00 23.20Ratio of upgrade costs to focal year export (%) 2.3 0.61Ratio of maintenance costs to annual exports (%) 1.1 1.26
Source: Based on Cato and Lima dos Santos 2000, and Cato, Otwell, and Coze 2003.

established supply chains. For example, both theIndian and Kenyan fish-processing sectors werefacing longer-term challenges when forced to com-ply with enhanced hygiene standards for exports.Indian exporters were facing intense price competi-tion from other suppliers such as Thailand andVietnam. The Kenyan fish-processing sector suf-fered from chronic excess capacity because of rawmaterial shortages. In both cases the costs of com-pliance with stricter food hygiene standards haveinduced consolidation of the industry that likelywould have occurred anyway, albeit over a longerperiod. In Nicaragua the decline in the productionshare of small-scale shrimp producers had more todo with Hurricane Mitch and its aftermath thanwith the tightening of standards (Cato, Otwell, andCoze 2003).
A particular concern is that smaller players canbe disadvantaged where there are economies ofscale or scope in the implementation of particulartechnologies or administrative systems. Studies ofcompliance with labor and environmental stan-dards in the United States suggest that costs areproportionately higher for smaller firms (Crainand Johnson 2001). In some cases the necessaryinvestments have elements of lumpiness, for exam-ple, in laboratory equipment and cold-storagefacilities, which are economically viable only forlarge-scale operations or require collective action.Likewise, smaller firms may find it more difficult tohire certain types of skilled personnel. More gener-ally, smaller firms can be overwhelmed by the sheernumber of changes needed to comply with newfood safety requirements, even when the cashinvestments required are not substantial.
Sometimes certifying that the standards havebeen met is more difficult for small producers thancomplying with food safety and agriculturalhealth requirements. For example, Kenyan veg-etable exporters face considerable oversight costs indemonstrating compliance to their major Europeanbuyers.8 In turn, this generates pressure for rational-izing supply chains. Changes in the product compo-sition of trade may also affect structural patterns.9
Further, in a competitive environment, exportersfind it difficult to control the volume and continuityof smallholder supplies due to side-selling by farm-ers. Where export supply commitments are firmand specific, exporters need more effective control,and this can induce backward integration intoproduction.
A frequent presumption when discussing themarginalization of suppliers is that standards com-pliance is a do-or-die situation. In reality, however,there is rarely just a single market for a particularproduct. Suppliers need to seek out markets (andmarket segments) where they have advantagesrather than disadvantages. For example, there maybe opportunities in domestic or regional marketsfor the same or similar products, with lower pricesoffset by the absence of compliance challenges andcosts. Directing attention to these markets may beone way to avoid marginalization. Thus, the devel-opment of high-value agricultural and foodproducts sectors in the future is likely to bebimodal, with some firms upgrading and adaptingand others targeting other markets and raising theircapacity at a slower pace.
What Impact Are StandardsHaving on Exports of High-ValueAgro-Food Products?
The application of food safety and agriculturalhealth standards by governments and the privatesector can significantly affect international trade.While most standards are designed in pursuit of thelegitimate goals of maintaining human, plant, andanimal health, they can also serve as technical bar-riers to trade. Roberts, Josling, and Orden (1999)classify technical trade barriers associated withagricultural and food products into three cate-gories: full or partial import bans; technical specifi-cations, including product and process standards;and information remedies, including packagingand labeling requirements and controls on volun-tary (health and other) claims. Full or partial bansare the most trade restricting. Total bans are typi-cally used when great risks are associated with cer-tain plant and animal health problems and wherecost-effective measures are not available. Partialbans may permit trade only in certain seasons orfrom certain countries or regions. Technical specifi-cations and informational remedies will normallyapply to both imports and domestic supplies. Theireffects on trade will derive from the relative abilitiesof different suppliers to comply with these meas-ures, the incidence of compliance costs, and howeach affects the relative competitiveness of differentsuppliers.
While there is general agreement that foodsafety and agricultural health measures strongly
Agro-Food Exports from Developing Countries: The Challenges Posed by Standards 99
affect international agro-food trade, there is noconsensus on the importance of individual meas-ures, their impact compared with other trade-distorting measures, or their aggregate net effect.Testing the empirical impact of such standards ontrade is enormously difficult. First, it requiresassumptions about how the broad array of meas-ures is actually enforced and how enforcementdeters or encourages potential export suppliers,depending on whether suppliers need to makemajor or modest adjustments. This variable cannotbe aggregated and differs across countries andindustries. Second, food safety and agriculturalhealth standards may have secondary effects, forexample, leading to shifts in sourcing, the produc-tion of complementary and competitive goods, andthe spread of regulations and restrictions to othercountries. Third, a specific measure may not be adominant or even important determinant ofobserved trade flows. There is a risk of ascribingagro-food standards to shifts in trade that aredriven by other economic or technical factors.Fourth, there are problems in defining the counter-factual. Without the measure, would trade havebeen unimpeded, or would distributors and con-sumers have sought the product from other suppli-ers instead? In the absence of a (trade-restricting)measure, might overall demand have declined for aproduct for which certain problems were identi-fied? Finally, many food safety and agriculturalhealth measures will affect domestic suppliers aswell, with varied outcomes in terms of shifts in therelative competitiveness and market share of thedifferent players.
These and other empirical problems have ledresearchers to devote more attention to specificcases and to attempt to highlight the role played by(changing) food safety and agricultural healthrequirements on bilateral or broader multicountrypatterns of trade. Some of the cases are discussedbelow. Only one study, however, has attempted toprovide an aggregate measure of the level of agri-cultural and food trade constrained or blocked bytechnical barriers. In 1996 the U.S. Department ofAgriculture, drawing on the expert opinions of staffand other regulatory personnel, found that “ques-tionable” technical barriers (measures judged tohave no scientific basis) were inhibiting U.S.exports of agricultural and food products to some62 countries. More than 300 market restrictions
were identified as constraining exports valued at$5 billion, equal to around 7 percent of U.S. agri-cultural, food, and forestry trade in 1996. Two-thirds of the identified measures, including nearlyall full or partial import bans, addressed risks foranimal or plant health (Roberts, Josling, and Orden1999).
This type of broad estimate of trade effects hasnot been made for any other country. Otherapproaches have provided insights into the subject,however. Most commonly, researchers have lookedto the only two available multicountry sources ofdata on the subject, official listings of agriculturaland food product detentions and rejections byindustrial countries and the growing number ofcomplaints recorded by the Sanitary and Phytosan-itary Committee. Though incomplete, both areuseful proxies for the trade-inhibiting effects offood safety and agricultural health standards.
Border Detentions and Rejections of Agriculturaland Food Products
Information is available for a limited number ofcountries (through periodic reports and web-baseddatabases) on the incidence of detention or rejec-tion of imported agricultural and food products forreasons associated with quality, safety, labeling, orother technical issues. The most widely availableand cited data are for the European Union and theUnited States.10 The data provide a reasonable pic-ture of the incidence of product rejections overtime by country of origin but do not specify thevolume or value of rejected consignments.
Several patterns emerge from product rejectiondata for the European Union and United States:
• Rising incidence. In the European Union thenumber of notifications or alerts increased morethan sixfold between 1998 (230 cases) and 2002(1,520). This increased incidence of rejectionsreflects a combination of factors, including thetightening or harmonizing of standards, appli-cation of standards for formerly unregulatedhazards, and substantially increased capacityfor inspection and enforcement. In the UnitedStates there was a sixfold increase in the numberof product inspections by the FDA, in partbecause of heightened concerns about bioter-rorism.11
100 Global Agricultural Trade and Developing Countries

• Product concentration. Most detentions andrejections occurred in a few product categories:fish and crustaceans (35 percent of rejections in2002), meat products, and fruits and vegetables.For the European Union there was also a highincidence of rejections for nuts, while for theUnited States there were many rejections of low-acid canned foods. Comparatively few rejectionswere issued on quality or safety grounds for bev-erage crops, cereal products, feedstuffs, or spices.
• Country of origin concentration. A few countriesaccounted for the bulk of rejections. Amongdeveloping countries most of the rejectionswere from countries that have been dominantsuppliers of “sensitive” products for many years(for example, Brazil, Mexico, Thailand, andTurkey) or newly emerging large exporters ofsuch products (for example, China, India, andVietnam). In 2002 five countries (Brazil, China,Thailand, Turkey, and Vietnam) accounted fornearly 60 percent of EU rejections of agricul-tural and food products from outside Europe.Some of these countries, however, are simulta-neously increasing their EU market share forsuch products, suggesting that border rejectionsare more of an irritant than a major problemfor larger exporters.
• Minimal interception of products from low-income countries. Exports from low-incomecountries account for a very small proportion ofproduct rejections. For example, in 2002 theEuropean Union rejected only 26 consignmentsfrom low-income Sub-Saharan African coun-tries, with most countries experiencing only oneor two rejections. Most of these countries areexporting less sensitive products in terms offood safety or agricultural health risks, or theyhave been recognized as being fully harmonizedwith EU requirements for more sensitive prod-ucts such as fish and thus are subject to lowerlevels of border inspection.
• Leading reasons for product rejections. For theEuropean Union the largest (and growing) pro-portion of rejections concerns chemical andother contaminants in food, especially veteri-nary drug residues, pesticide residues, andmycotoxins. Chemical contaminants accountedfor nearly two-thirds of rejections in 2002, upfrom 55 percent in 2000. Microbial pathogenswere implicated in 30 percent of rejections,
down from 41 percent. This pattern reflectsthe growing harmonization of EU standardsfor an array of chemical contaminants and theincreased political and technical attention tothese issues within the European Union. For theUnited States a large proportion of border rejec-tions in the late 1990s was due to the presence offilth or foreign bodies (32 percent), microbialpathogens (17 percent), or problems associatedwith the packaging or labeling of canned foodproducts for which botulism is a risk (13 per-cent). A smaller proportion of rejections wasdue to chemical contaminants (12 percent).
Neither the European Union nor the UnitedStates systematically reports on the volume or valueof trade that is affected by border inspections andrejections. To obtain a rough notion of the value oftrade interrupted by technical measures, data werecollected (from official sources and consultationswith private traders) on the proportion of trade inparticular products that was likely to have beendetained or rejected in 2000–01. These estimateswere then applied to overall trade in these prod-ucts to estimate the value of interrupted trade(table 6.2). For simplicity, the proportion of tradefor particular products that is subject to rejectionsis assumed to be the same for products flowingbetween low-, middle-, and high-income countries.This is unlikely to be so in practice, but data are notavailable to provide more refined estimates.
The value of world agro-food trade affected byofficial product rejections at the import level is esti-mated at $3.8 billion in 2000–01.12 This is almostcertainly an overestimate since similar levels ofrejection are assumed for products entering devel-oping countries as for those entering industrialcountries, even though levels of standards andenforcement capacities are typically lower in devel-oping countries. Reflecting the dominant share ofhigh-income countries in certain product groupsfor which detention or rejection levels are high (forexample, meat and dairy products, other processedfoods, and processed fruit and vegetables), thesecountries are estimated to account for 53 percentof rejected exports, while they account for some63 percent of world agricultural and food productexports. The estimated value of developing-country agro-food border rejections is $1.8 billion,74 percent of it accounted for by middle-income
Agro-Food Exports from Developing Countries: The Challenges Posed by Standards 101

countries. For low-income countries the estimated$275 million in agricultural and food product traderejected at the importing-country border repre-sents less than 1 percent of their agricultural andfood exports. The product composition of therejected exports is broadly consistent with the datapresented earlier on EU and U.S. rejections. Formiddle-income countries, the dominant productsare fruits and vegetables and fish, followed by live-stock products. For low-income countries, fish isthe dominant category, accounting for more thanhalf the estimated rejections.
Until recently, border rejections for food safetyor related technical reasons have had only a modestimpact on overall trade in agricultural and foodproducts, including that of developing countries.An estimated 1 percent of this trade was directlyaffected in 2000–01. Further, only a small propor-tion of rejected consignments is actually destroyedat the point of import. Some (perhaps significant)proportion of the product is reshipped, recondi-tioned, or otherwise managed for sale whether inthe domestic market of the exporter or in someother international market. Indeed, for most foodcategories the proportion of agro-food trade thatencounters official rejection is probably substan-
tially lower than the proportion of sales that aresubjected to price discounts by private buyersbecause of quality defects, lack of timeliness, andpoor presentation. The products with the highestestimated proportion of rejections are also thosewith the highest rates of growth in internationalagricultural trade.
Thus while undoubtedly an irritant to exporters,border rejections are not a major impediment totrade. Still, they are costly, both in the value of lostproduct and in adverse reputation effects on thesupplier and the country of origin. Some import-ing countries will list for automatic detention par-ticular suppliers or the entire country followingrepeated violations of food safety and otherstandards. Subsequent shipments are detained,inspected, and tested at the expense of the exporteror importer until a record of compliance has been(re)established. This can take a long time, and thecosts can be considerable (Lamb, Velez, and Barclay2004). Further, during this period exporters maylose customers who are unwilling to incur the costsand delays associated with enhanced border for-malities.
In addition, there are some indications for cer-tain high-income countries that increased attention
102 Global Agricultural Trade and Developing Countries
TABLE 6.2 Estimated Value of World Agricultural and Food Trade Directly Affectedby Import Border Rejections Based on Technical Standards, 2000–01(millions of US$)
Estimated High- Middle- Low-Proportion Income Income Income Total Trade
Product Group of Trade (%)a Countries Countriesb Countries China Affected
Meat and dairy products 1.25 811 142 8 21 982Fish and fishery products 1.00–2.00 232 417 145 90 884Fruit and vegetables 0.75–1.50 367 439 44 61 911Grains 0.50 160 40 6 8 214Animal feed 0.50 65 39 4 2 110Tropical beverages 0.25 25 18 16 0 59Nuts and spices 0.75–1.50 16 33 30 1 80Other processed food 1.00–2.00 122 53 3 6 184All other categoriesc 0.25 199 112 19 6 307Total 1,997 1,332 275 195 3,799Proportion of trade affected 0.70 1.10 0.93 1.25 0.84
a. Where there are two numbers the first relates to exports of high-income countries and the second to thoseof middle- and low-income countries.b. Excluding China.c. Includes oilseeds, textile fibers, drinks, tobacco/cigarettes, and sugar/confectionery.Source: Authors’ computation based on official data and consultations with private traders.
is being given to border inspections of productsdeemed “sensitive” in relation to new regulatoryconcerns about food safety and agricultural healthrisks. If the patterns described above are indicative,an increasing level of border interceptions of prod-ucts would be expected in coming years. This willeither increase the transaction costs for certaindeveloping-country suppliers or induce them tomake adjustments in production, postharvest, andproduct monitoring and testing arrangements.
Border rejections attributable to food safetyconcerns represent only a small part of the con-straint on international trade in agricultural andfood products associated with food safety and agri-cultural health measures. For example, althoughmeat and dairy products may be subject to thehighest level of rejections in global trade, theseare not significant for low-income countries andare probably of secondary importance for mostmiddle-income countries. In terms of the impacton aggregate trade, far more inhibiting are thebroad array of measures related to animal and planthealth that render large numbers of countries ineli-gible to supply many livestock products and foodcrops to other countries (Sumner 2003).
While this pattern undoubtedly reflects tradi-tional trade protections and subsidies in industrialcountries that distort world trade, animal diseasecontrols exclude many developing countries fromworld markets for these products altogether.13
In part this reflects the prevalence of endemicinfectious diseases of animals in many low- andmiddle-income countries. Indeed, the high costs ofestablishing and maintaining disease-free areas canbe beyond the means of many of the poorest coun-tries. Many developing countries lack the surveil-lance and risk assessment capacity to demonstratethat they have areas that are disease-free and to getthese areas recognized as such by the InternationalOffice of Epizooties.14 And even where developingcountries have established disease-free areas, theyface the risk that trade will be disrupted shouldoutbreaks of disease occur. A recent example is therestrictions applied to exports of poultry fromThailand and Vietnam because of an outbreak ofavian flu. The overall impact of animal diseaseissues, therefore, is to enhance the risks associatedwith trade in livestock products and put a greatonus on public authorities to invest in disease con-trols and to ensure their continued efficacy.
Because of an inability to meet a broad array offood safety and agricultural health requirementspertaining to livestock disease and hygiene con-trols, most low-income countries are restricted totrade in live animals rather than livestock products.This avoids the need for attention to hygienicslaughter in an abattoir, meat inspection, andrefrigerated transport.15 Even if animal disease andhygiene capacity could be enhanced, however, low-income countries would need to compete withwell-established livestock product exporters such asArgentina and Australia, which are more reliableproducers with fewer animal health problems andmore standardized production. However, the bene-fits from access to high-value markets could beconsiderable for developing countries that invest inanimal disease controls, as a case study of foot andmouth disease controls in Zimbabwe shows (Perryand others 2003).
Disputes and Complaints through the WTO
Complaints and counter-notifications madethrough the Sanitary and Phytosanitary Committeewithin the WTO also provide an indication ofthe nature and breadth of the standards challengefor developing countries (table 6.3). While thecounter-notification database and the informationprovided in most counter-notifications do not per-mit quantifying the levels of developing-countrytrade that has or might be affected by the contestedmeasures, it does provide some insights. A sum-mary of complaints by regulatory goal and countrygroup suggests that (at least some) developingcountries have actively used this formal review andcomplaint process to register their concerns about asignificant number of notified measures by bothindustrial and developing countries. A moredetailed look at the individual complaints, indicatesthat:
• Complaints by developing countries are domi-nated by a handful of countries—Argentina,Brazil, Chile, and Thailand. Each of these coun-tries has issued or supported more than a dozencomplaints, with Argentina being involved inmore than a quarter of all developing-countrycomplaints. Only a handful of other countries,including Ecuador, India, the Philippines, SouthAfrica, and Uruguay, have been involved in
Agro-Food Exports from Developing Countries: The Challenges Posed by Standards 103

multiple cases. This pattern of participationreflects the prominence of certain countries intrade in a few product categories, especially beefand horticultural products, rather than the over-all structure of developing country agriculturaland food trade.
• These data alone provide little informationabout the extent to which food safety and agri-cultural health measures are inhibiting exportsof low-income countries. Low-income countriesare weakly represented in counter-notifications,issuing or supporting complaints in only fivecases. This could reflect the structure of theirexports (concentrated in commodities for whichfood safety and agricultural health measures areof lesser importance) or their limited capacity toparticipate in the formal review process. Thislack of formal complaints does not mean thatthey have been able to resolve their concernsbilaterally.
• Among the seemingly large number ofdeveloping-country complaints are a limitednumber of repeated concerns, with slight varia-tions. Most complaints about animal healthissues relate to what are claimed to be overlyrestrictive (and nonscientifically based) measures
dealing with foot and mouth disease and beefproducts or bovine spongiform encephalopathyand animal by-products for pet food, animalfeed, and cosmetics. Similarly, most complaintsabout plant health issues relate to claims ofoverly restrictive measures for plant diseases orpests or for horticultural products. Complaintsrelated to food safety are a mixture of specificconcerns, with no large clustering around partic-ular themes. Surprisingly, given the huge impor-tance for developing-country trade, there arefew complaints about measures governing fishproducts.
• The reasons for developing-country complaintsare varied, yet most involve concerns about thelack of scientific evidence in relation to foodsafety, the absence of risk assessments in relationto plant health, and inconsistencies betweencountry and international standards in animalhealth.
• Among industrial countries, the EuropeanUnion has been the subject of the largest num-ber of complaints by developing countries.There were more than three times as many com-plaints against the European Union as againstthe United States. Several factors might account
104 Global Agricultural Trade and Developing Countries
TABLE 6.3 Number of Counter-Notifications to the Sanitary and PhytosanitaryCommittee Relating to Reported Measures, 1995–2002
Regulatory Goal of Contested Measure
Plant Animal HumanComplaints Health Health Health Othera Total
By industrial countries against:Industrial countries 16 7 44 3 70Developing countries 17 11 41 4 73Multiple countries — 2 — — 2
Subtotal 33 20 85 7 145
By developing countries against:Industrial countries 12 12 34 2 60Developing countries 8 17 7 2 34Multiple countries — 2 — — 2
Subtotal 20 31 41 4 96
Total 53 51 126 11 241
— Not availablea. Includes complaints about horizontal regulations (such as those regulating products of modernbiotechnology) that reference human, animal, and plant health as objectives.Source: Roberts 2004.

for this. Harmonization of food safety and agri-cultural health measures within the EuropeanUnion has often resulted in the adoption of themost stringent standards previously applied byindividual member states. The European Unionhas more frequently and most visibly embracedthe precautionary principle when adopting cer-tain standards, sometimes giving rise to contro-versies over the scientific basis for the measures.And because of the complex administrativestructure of the European Union, some coun-tries find it difficult to resolve concerns throughbilateral discussions and therefore more readilyturn to the Sanitary and Phytosanitary Commit-tee for concerns related to the European Unionthan for other countries.
Thus, the growing number of recorded com-plaints or counter-notifications by developingcountries provides only a crude indicator of theextent to which food safety and agricultural healthmeasures impede their trade in high-value agricul-tural and food products. These complaints proba-bly represent only the tip of the iceberg as mostconcerns and disputes are raised bilaterally, and themajority of negotiations are handled by technicalorganizations rather than country trade representa-tives. Some of the complaints have occurred in thecontext of expanding trade ties, which can increasethe seriousness of previously minor effects.
There is little basis for associating the growingnumber of complaints with deliberate protection-ism. Many of the concerns seem to be related moreto inadequate (scientific) information rather thanto discrimination. Further, the apparatus of formalcomplaints relates only to mandatory standards setby public agencies. A growing array of standardsare being set privately, either through consensuswithin particular industries or by the gatekeepers ofthe dominant supply chains. While many suchstandards are ostensibly voluntary, they are becom-ing the de facto standards to gain or maintainaccess to particular buyers or market segments.
Some Illustrative Case Studies
Because the data on agricultural and food productrejections and disputes related to food safety andagricultural health measures provide an incompletepicture of the effects on developing countries,
analysts are using case studies to examine theeffects of specific standards on the trade of particu-lar countries and products. Earlier work empha-sized the potential disruptive impact of food safetyand agricultural health measures on exports fromdeveloping countries (Otsuki, Wilson, andSewadeh 2001; Wilson and Otsuki 2003). Morerecent work by the U.S. Department of Agriculture(Buzby 2003) and the International Food PolicyResearch Institute (Unnevehr 2003) point to morevaried experiences. Other case study analyses havebeen undertaken by the United Nations Conferenceon Trade and Development (UNCTAD), the UnitedNations Environment Programme (UNEP), andthe World Bank.16
This section draws on selected examples to illus-trate the complex ways in which sanitary andphytosanitary measures can affect developing-country exports. Three of the most prominentconcerns raised in the literature are emphasized inthe selection of case studies: fish trade bans andtheir wider supply chain effects, limits on myco-toxins as trade barriers, and the strengthening ofhorticultural product and process standards.
Fish Bans and Their Wide Supply-Chain Effects
Since 1990 developing-country exports of fish andfishery products have increased at an averageannual rate of 6 percent (Delgado and others 2003).A major challenge faced by developing countries inseeking to maintain and expand their share ofglobal markets is the progressively stricter foodsafety requirements, particularly in major indus-trial countries. Previous studies suggested thatsome exporters experienced considerable problemsin complying with these requirements.
The European Union lays down harmonizedrequirements governing hygiene throughout thesupply chain for fish and fishery products. Process-ing plants are inspected and approved individuallyby a specified “competent authority” in the coun-try of origin, whether an EU member state or athird country, to ensure compliance. Imports fromthird countries are required to have controls thatare at least equivalent to those of the EuropeanUnion.17 Exports from countries for which localrequirements have been recognized as equivalentare subject to reduced physical inspection at theborder. Countries that have not yet met these
Agro-Food Exports from Developing Countries: The Challenges Posed by Standards 105

requirements but that have provided assurancesthat their controls are at least equivalent to those ofthe European Union are permitted to export butare subject to higher rates of border inspection.The current deadline for all countries to be fullyharmonized with the EU’s hygiene standards isDecember 31, 2005.
Kenya is an example of longer-term efforts tocomply with the European Union’s food safetyrequirements, overlaid with the need to overcomerestrictions on trade relating to immediate foodsafety concerns. Kenya’s major fish export is Nileperch from Lake Victoria. Until the mid-1980s thiswas a relatively minor species in the Lake Victoriafishery, but with a shift in focus from local to exportmarkets, Nile perch came to account for more than90 percent of Kenya’s exports of fish and fisheryproducts by the mid-1990s, with a value of around$44 million in 1996. Most exports were destined forthe European Union. Through the 1980s there wassignificant investment in industrialized fish-processing facilities, and 15 facilities were in opera-tion by the mid-1990s. At the landing beaches,however, there was little or no change in fishingmethods or marketing facilities.
Initially, Nile perch exports were extremely prof-itable. Processing capacity soon exceeded the sup-ply of fish, however, a situation that sets the com-petitive environment in which all levels of the chainoperate. Although food safety requirements in theirmajor export markets were evolving, most proces-sors made little attempt to upgrade their facilitiesand systems of procurement, processing, and mar-keting. Likewise, the legislative framework of foodsafety controls remained largely unchanged, despitethe fact that the structure and focus of the supplychain had shifted to exports. The picture was of asupply chain that had not been upgraded in linewith the growth in exports and was unable toimplement effective controls within the context ofrapidly evolving standards overseas. Thus, both thepublic authorities and exporters were in the posi-tion of continuous problem solving.
In recent years exporters of Nile perch havefaced a catalogue of restrictions on trade with theEuropean Union. In 1996 salmonella was detectedin a number of consignments of Nile perch fromKenya (and Tanzania and Uganda) at the Spanishborder, and Spain immediately prohibited imports.In April 1997 the European Commission intro-duced a requirement for salmonella testing of all
consignments of Nile perch from the region.Following an outbreak of cholera across EastAfrica, testing was extended to all fish and to coverVibrio cholerae and Vibrio parahaemoliticus. Theserequirements were lifted in June 1998. In March1999 a suspected case of fish poisoning with pesti-cide was identified in Uganda. The EuropeanUnion subsequently imposed a ban on exports ofNile perch in April 1999 that was not lifted forKenya until December 2000. In each case, theimpact was immediate. Exports declined, althoughover time declines were partially offset by increasedsales to other markets. Fish-processing plants, mostalready operating at less then 50 percent capacity,reduced their production, and some closed. In turn,the landed price of Nile perch fell.
Both the Kenyan government and the privatesector tried to upgrade food safety controls.Responsibility for regulatory controls was splitbetween the Ministry of Health and the FisheriesDepartment of the Ministry of Agriculture andRural Development, creating significant coordina-tion problems. To improve compliance, the Fish-eries Department was made the sole “competentauthority,” and legislation was quickly revised inline with the European Union’s requirements.
Fish-processing plants upgraded their facilitiesand implemented an HACCP system, at an esti-mated average cost per plant of about $40,000 anda total cost of $557,000. These costs were prohibi-tive for several processing facilities, which closed,helping to reduce excess capacity. Simultaneously,fish-processing companies began to cooperate topresent a united voice to the government and Euro-pean Commission. The Kenya Fish Processors andExporters Association (AFIPEK), formed in 2000,has developed a code of good manufacturing prac-tice for the sector.
A remaining weakness in the Nile perch supplychain is standards of hygiene at landing beaches.Most attempts by the government to implementeffective management of the fishery resource andmarketing arrangements have failed. Only recentlyhave efforts been made to provide toilets, pavedand fenced landing areas, potable water, and cov-ered markets. This is the biggest compliance issuefacing the sector in the short to medium term foraccess to EU markets.
The efforts of the Kenyan government and pri-vate sector eventually paid off, and in December2003 the European Commission recognized the
106 Global Agricultural Trade and Developing Countries

controls in place as equivalent to those in theEuropean Union. The European Union’s hygienerequirements for fish and fishery products have hadprofound effects on the Nile perch sector in Kenya.Whereas the export supply chain had developedwith a sole focus on EU markets, today mostexporters have diversified their export base andhave major markets in Australia, Japan, and theUnited States. Compliance with EU requirementshelped Kenyan exporters to access and maintainthese markets.
This case illustrates the significant impact thatstricter food safety requirements can have on a sup-ply chain that is almost entirely export oriented anddependent on a single market. It also demonstrateshow such requirements can exacerbate pressuresfor restructuring and reform, while prevailing sup-ply and capacity issues constrain how various levelsof the chain are able to respond. The case also illus-trates the interdependencies between levels of thesupply chain and between the public and privatesectors in meeting food safety requirements inexport markets. And it demonstrates the impor-tance of responding quickly to emerging foodsafety and agricultural health standards. The peri-ods of restrictions faced by Kenyan exporters ofNile perch very much reflect the fact that little hadbeen done in response to the implementation ofstricter food safety requirements in the country’smost important export market. Rather, most of theconcerted effort to comply with these requirementswas stimulated by the sudden loss of market access,in very much a crisis management mode ofoperation.
Limits on Mycotoxins as Trade Barriers
Mycotoxins are toxic by-products of mold infesta-tions, affecting as much as a quarter of global foodand feed crop output (Dohlman 2003; Reddy andothers 2002). They commonly occur in the produc-tion of corn, wheat, and peanuts, causing consider-able crop losses (Bhat and Vasanthi 1999). Theirincidence is affected by weather and insect infesta-tion, although proper production and postharvest(especially storage) practices can strongly mitigateoccurrence.18 Consuming foods with very high lev-els of mycotoxins can be fatal, and long-term con-sumption of foods with lower levels has been linkedto liver cancer. Since the discovery of mycotoxins inthe 1960s, regulatory limits have been established
in 77 countries to protect consumers (Egmond1999). There are wide differences in national stan-dards, however, linked to different susceptibilitiesand different perceptions of acceptable health risks.For example, acceptable tolerances for aflatoxin infood range from zero to 50 parts per billion.
There are indications that mycotoxin problemshave disrupted developing-country trade. Thailandwas once a leading world exporter of corn. Becauseof persistent aflatoxin problems, however, Thaicorn regularly sold at a discount, costing the coun-try an estimated $50 million a year in reducedexport revenue.19 Similarly, India was historically asignificant supplier of peanut meal to the EuropeanUnion, but this trade declined sharply in the early1980s because of problems meeting stricter stan-dards for aflatoxin. Otsuki, Wilson, and Sewadeh(2001), in a widely cited study, examine the processof harmonization of the European Union’s stan-dards for aflatoxin and the potential impact onexports of selected products, including cereals anddried fruit and nuts, from African countries.20 In1997 the European Union proposed a set of harmo-nized standards for aflatoxin for member states,which had developed their own standards, anda uniform sampling procedure for testing. Inresponse to the European Union’s notification tothe WTO, developing countries raised a series ofobjections to the proposed standards and samplingmethods. The proposed standards were to be farmore stringent than the proposed Codex standard,without proper scientific justification.21
Otsuki, Wilson, and Sewadeh (2001) argue thatthese standards are unnecessarily stringent giventhe estimated risk reduction that would beachieved. Their work is widely cited for its econo-metric estimation of the potential loss of Africantrade that could be attributed to the change in theEuropean Union’s standard. Using a gravity model,which incorporates a number of variables assumedto affect bilateral trade flows, they compare existinglevels of African exports to the European Unionwith likely levels following implementation of thenew standards and likely levels had the EuropeanUnion adopted the Codex standard (15 parts perbillion) across all product categories. They estimatethat annual African exports to the European Unionof cereals and nuts and dried fruit would declinefrom $770 million to $372 million following adop-tion of the EU standard but would rise to slightlymore than $1 billion under the Codex standard.
Agro-Food Exports from Developing Countries: The Challenges Posed by Standards 107

Hence, the decision by the European Union toadopt the more stringent standards was estimatedto have cost Africa some $667 million.
The conclusions of this work were headlinegrabbing but widely misinterpreted. Many subse-quent commentators have mistakenly referred tothe estimates as if they were actual losses ratherthan the results of an econometric simulation. Sev-eral shortcomings of this method need to be takeninto account when interpreting the results.22 Themajor focus here relates to the value of exportsbefore and after the adoption of the standardand the lessons that stakeholders take from theexample.
The trade data used to establish the baseline putAfrican exports to the European Union (in 1998) at$472 million for dried fruit and nuts and $298 mil-lion for cereals, with the bulk of this trade occurringwith France. These figures seem implausible, espe-cially for cereals, given Africa’s lack of competitive-ness in this sector relative to Europe. Statistics fromthe United Nations COMTRADE database showmuch lower European imports from Africa in 1998of $104 million for dried fruit, $45 million forgroundnuts, $27 million for other edible nuts, andless than $14 million for cereals and cereal prod-ucts.23 This suggests that the baseline against whichthe impact of the standards should have beenassessed was $190 million (c.i.f.—cost, insurance,and freight—value) rather than $770 million.
What about the evidence on impact? Most of theregion’s dried fruit trade is accounted for by twoNorth African countries—Tunisia and Algeria—whose exceptionally dry climate contributes to avery low incidence of aflatoxin. The only otherAfrican country with any history and recentstrength in exports of dried fruit is South Africa.The new EU standards came into full force in April2002. Both in the year proceeding and the year fol-lowing that date there were no cases of dried fruitconsignments from Africa being detained on entryto the European Union. In fact, while total EUimports of dried fruit declined somewhat in 2002,imports from Africa increased, boosting Africa’sshare from 9.8 percent in 2001 to 10.3 percent in2002. Competing countries with more humid con-ditions (especially Turkey) incurred higher levels ofproduct rejections during 2003. For dried fruit, themore stringent EU standards and enforcement atthe border worked to the competitive advantage ofAfrica’s leading suppliers.
What about groundnuts? Africa’s groundnutexports are dominated by South Africa, althoughEgypt, The Gambia, Sudan, and Senegal have main-tained small exports of confectionery nuts. Varioussupply-side constraints have inhibited the competi-tiveness of many African countries in the interna-tional market for groundnuts (see chapter 12).24 In2002 South Africa had 12 consignments of ground-nuts rejected by EU member states because of afla-toxin. Only 3 of the 12 would have met the lessstringent Codex standard or the standards appliedpreviously by the individual member states. Therejected consignments were returned to SouthAfrica, presumably for sale elsewhere, rather thandestroyed. Probably a few hundred thousand dol-lars of business was affected, although the probablesale of these nuts in other markets would have sub-stantially mitigated these losses. No evidence wasfound that Africa’s limited exports to the EuropeanUnion of either cereals or tree nuts have beenadversely affected since the adoption of the newstandards. Thus the near-term loss of African tradebecause of the more stringent EU standards haslikely been in the hundreds of thousands of dollarsrather than in the hundreds of millions.
While the case for significant African trade lossesis weak, compliance with the EU aflatoxin standardsremains a challenge for some developing countries.Between 2000 and 2002 the number of border rejec-tions of nuts, nut products, and other snacksincreased threefold (from 92 to 251). In 2002 some235 consignments of nuts and dried fruit wererejected on grounds of excessive levels of aflatoxin.Most of the rejected shipments were from Turkey(77 cases involving hazelnuts and dried fruit), Brazil(51 cases, mainly Brazil nuts), and Iran (50 cases,mainly pistachios). Other countries with more thana few rejections were China (18), South Africa (12),the United States (7), and Argentina (5).
Although the data are incomplete, the EU notifi-cations and alerts database reports the actual testresults for levels of aflatoxin for many months. Inmost cases of rejection, the measured levels of afla-toxin are substantially higher (sometimes manytimes higher) than the Codex standard and also sig-nificantly above the domestic standards of theexporting countries. For example, of the 15 nut anddried fruit consignments rejected in January 2002,only 3 were above the EU standard but below theCodex standard. In October 2002, one countrysource of nuts had 38 individual consignments
108 Global Agricultural Trade and Developing Countries
rejected, 15 involving aflatoxin levels of 100 partsper billion or more.25 This suggests that suppliers,especially those producing in humid conditions,are having considerable difficulty controlling afla-toxin contamination.
It is still unclear, however, how much EUstandards on aflatoxin have affected developing-country trade. For example, Iran has been experi-encing problems with aflatoxin for several years. Itsexports of edible nuts declined from $452 millionin 1996 to less than $210 million in 2002. Furtheranalysis is needed to determine how much of thisdecline can be attributed to problems with afla-toxin contamination and of that, how much to reg-ulatory measures rather than to a more general lossof buyer confidence. Exports from Turkey, however,seem to have been little affected by the increasedstringency of EU standards and enforcement. In2002 the volume of products rejected by theEuropean Union constituted less than 1 percent ofTurkish exports of nuts and dried fruit to that mar-ket. Any rejected product is reexported to countrieswith less strict standards (or enforcement) or solddomestically, reducing losses.
Proliferation of Horticultural Product Standards
The regulatory and private governance systems forinternational fresh produce markets are becomingincreasingly complex. This changing regulatoryenvironment appears to be raising the bar for newentrants and throwing new challenges in the path ofexisting developing-country suppliers. Concern ismounting about the ability of small and low-incomecountries to meet rising public and private stan-dards and thus their ability to remain competitivein international fresh produce markets (Dolan andHumphrey 2000; Chan and King 2000; Buurma andothers 2001). High-profile food scares and highlypublicized instances of pesticide residue violationshave created an impression of extreme vulnerabilityof developing-country suppliers. Yet experiences aremixed, and most countries and industries that haverun into standards-related barriers have also beenstruggling with other supply-chain problems thathave inhibited their profitability and competitive-ness. Consider the contrasting experiences of twolow-income countries, Guatemala and Kenya.
Guatemalan raspberries: a cautionary tale? Inthe late 1980s several firms began exporting
raspberries from Guatemala to the United Statesduring months when U.S. domestic supplies werelimited (Calvin 2003; Calvin, Flores, and Foster2003). By 1996 these exports had reached $3 mil-lion, with some 85 growers participating. In thatyear, however, the U.S. Centers for Disease Controland Prevention and Health Canada receivedreports of some 1,465 cases of food-borne illnessassociated with the parasite Cyclospora. Raspberriesfrom Guatemala were identified as the most likelysource of the contamination.
The FDA sent a team to Guatemala to investi-gate, amid considerable scientific uncertainty andgreat difficulty identifying the likely source of thecontamination. The association of Guatemalangrowers (GBC) remained unconvinced that itsraspberries were the source of the problem. Itattempted to put in place a limited program toscreen out potentially high-risk farms, but the pro-gram had no effective enforcement mechanism.After another large outbreak of Cyclospora-relatedillnesses in the spring of 1997, the GBC voluntarilyagreed to stop exports of raspberries to the UnitedStates. Despite the fact that the Guatemalan gov-ernment created a food safety commission withenforcement powers in late 1997, the FDA wasunconvinced and essentially imposed an importban on Guatemalan raspberries.
During the next two years many organizationsin the United States and Canada worked with theGuatemalans to solve the problem. A Model Plan ofExcellence was put in place in 1999, involving theapplication of food safety practices by growers,mandatory inspection by government, and a sys-tem of product traceability back to individualgrowers. The United States lifted the ban onimports of Guatemalan raspberries. In 2000, how-ever, there were two further Cyclospora outbreaks,which were traced back to a single Guatemalanfarm. The grower was removed from the program,and there have been no further outbreaks.
While the Model Plan of Excellence was techni-cally successful, it came too late to save the industry.Facing consumer concerns, several supermarkets inthe United States sought alternative sources ofraspberries. Recognizing the enormous challenge ofrehabilitating the reputation of Guatemalan rasp-berries in the eyes of both consumers and distribu-tors, several leading firms (both Guatemalan andinternational firms) shifted their operations toMexico. By 2001 only four growers of raspberries
Agro-Food Exports from Developing Countries: The Challenges Posed by Standards 109

for export remained in Guatemala, with exports ofless than $200,000. Meanwhile, Mexico’s exports ofraspberries grew from $2.9 million in 1998 to $8.9million in 2002 and now account for the largestshare of an expanding U.S. import market.
Although the Guatemalan raspberry industrynever recovered, other parts of the fresh produceindustry built on the institutional capacity buildingthat had taken place. For example, the inspectionagency, the Integrated Program for Agriculturaland Environmental Protection (PIPAA), has beenworking closely with local blackberry growers, aleading local supermarket chain, and others toenhance food safety management systems. PIPAAis also collaborating with the Animal and PlantHealth Inspection Service and the FDA in theUnited States on a program for Guatemalanexports of mangoes and papayas.
Calvin, Flores, and Foster (2003) draw severallessons from Guatemala’s experience. Delays inaddressing food safety and agricultural healthproblems may hurt an industry’s exports and repu-tation. An effective traceability system allows focus-ing on particular growers or exporters rather thanneeding to enhance standards in an entire industry.Finally, strong grower organizations can improvean industry’s ability to respond to food safetychallenges. There is also a wider lesson fromGuatemala’s experience. Small countries and nicheproducts are probably far more vulnerable to lossof markets and collapse of reputation in the face offood safety problems than are larger countries andmore mainstream or generic products. Both inter-national buyers and consumers would likely bemore tolerant and patient with core, long-standingsuppliers that have established a “brand” in whichthey have confidence.
Kenyan fresh produce exports: some success.Kenya’s fresh produce trade dates to the mid-1950s,when small quantities of temperate-climate vegeta-bles and tropical fruits were supplied in the Euro-pean winter off-season to up-market stores inLondon.26 This off-season trade was later joined byyear-round supplies of high-quality green beansand a broad array of vegetables that are part of thetraditional diets of UK immigrant populationsfrom South Asia. Most of the products were air-freighted in two-kilogram boxes for sale throughwholesale markets or to distributors and caterers.
For years the industry functioned with simplesupply chains, involving little investment in infra-structure, product development, or managementsystems. Around a dozen medium-size firms pluslarge numbers of small, part-time operators han-dled the exports, frequently trading with relativesor similar small-scale companies in Europe. Freshproduce was purchased from large numbers ofgrowers. Produce was generally collected in card-board boxes from farms or along roadsides andbrought to a central warehouse, sifted through andregraded if necessary, cooled a little, and trucked tothe airport for evening shipment. Ministry of Agri-culture officials at the airport conducted limitedinspections. This was the model from the 1960s tothe mid-1980s. The industry remained competitivein some markets and for some products, but not forothers. The Kenyan fresh produce export tradegrew slightly in the 1970s but stagnated in the1980s.
Since the early 1990s the industry has beenreshaped and transformed in response to—and inanticipation of—commercial, regulatory, and pri-vate governance changes within its core externalmarkets. Commercial pressures came from satu-rated markets for certain products and increasedcompetition from suppliers that had improvedtheir supply capabilities and had less expensive seaor air-freight costs than did Kenya. Commercialchanges within Europe also required a shift in theKenyan approach. In many countries large super-market chains were in ascendancy while wholesalemarkets were declining. Consolidation was alsooccurring among importers, packers, and distribu-tors. The growing segments of the fresh producemarket were being managed by fewer players. Onthe regulatory front a steady wave of activity wasgeared toward strengthening and harmonizing EUand member state regulations and monitoring sys-tems for food safety, quality conformity, and planthealth. Also emerging were progressively refinedprivate-sector standards or codes of practice gov-erning food safety, plant health, and other issues.
Several leading Kenyan exporters caught anearly glimpse of this new fresh produce environ-ment and began to reorient their operations. Withthe encouragement of several UK supermarkets,they began to experiment with new crops, new con-sumer packaging, and new combinations of vegeta-bles. An increasing proportion of products was
110 Global Agricultural Trade and Developing Countries

directed to selected supermarket chains, whichbegan to send “audit” teams to Kenya to checkhygiene and other conditions on farms and pack-houses. Improvements and investments were rec-ommended and in some cases required. Withrenewed confidence in the future of the industry,several exporters invested heavily in new orupgraded pack-houses and related food safetymanagement systems for packing ready-to-eat andsemi-prepared products. Mixed salads, stir-frymixes, vegetable kebabs, and other value-addedproducts now account for more than 40 percent ofwhat has been a burgeoning trade over the pastdecade. Between 1991 and 2003 Kenya’s freshvegetable exports increased from $23 million to$140 million.27
Rising public- and private-sector standards haveposed challenges to the Kenyan fresh produceindustry, yet they have also thrown a lifeline to theindustry. Because of Kenya’s location and relativelyhigh air-freight costs, its fresh produce sectorcannot compete with many other players on a unit-cost basis. Margins have been squeezed in the mar-ket for mainstream, commodity-type vegetables.With rising labor costs in Europe, however, theKenyan industry has positioned itself as a slicer,dicer, and salad-maker, all labor-intensive func-tions. Thus far, this market segment has grownfastest in the United Kingdom, although there isincreased buyer interest and consumer demand onthe European continent as well. This suggests thatwell-organized industries in low-income countriescan use stricter standards as a catalyst for change—and profit in the process.
Conclusions
There are now a number of documented cases inwhich developing countries have faced restrictionsbecause of their inability to meet food safety oragricultural health requirements. In some of these,well-established export-dependent sectors havebeen compromised by the implementation of new,stricter standards, with negative repercussions forthe livelihoods of those involved. At the same time,other countries have managed to gain access tohigh-value markets in industrial countries despitethe exacting standards. Clearly, the situation is notas black and white as some commentators suggest.What cannot be disputed, however, is that stan-
dards have become an increasingly importantinfluence on the international competitiveness ofdeveloping countries, especially for high-valueagricultural and food products.
The evidence presented in this chapter, whileadmittedly incomplete, suggests that the picture fordeveloping countries as a whole is much lesspessimistic than that widely presented by thestandards-as-barriers perspective. Indeed, risingstandards accentuate underlying supply-chainstrengths and weaknesses and thus affect the com-petitive positions of countries and distinct marketparticipants, making it important to view theeffects of food safety and agricultural health meas-ures in the context of wider capacity constraints.The key question for developing countries is how toexploit their strengths and overcome their weak-nesses to emerge as gainers rather than losers.
Still, by raising the bar for new entrants andplacing a premium on effective safety managementand logistical coordination, higher official and pri-vate standards can weaken the competitive positionof small and poorer countries and the ability ofsmall enterprises and farmers to remain active andprofitable in export supply chains. But food safetyand agricultural health standards are here to stay,and there is no slowing down their rate of changeor applying for special and differential treatment.Much of the impetus for standards comes fromconsumer and commercial interests, magnifiedby advances in technology and added securityconcerns.
The answer for developing countries is todevelop and improve food safety and agriculturalhealth management systems. This requires simulta-neous attention to legal systems, human capital, andphysical infrastructure, among other things. Man-agement capacity is required not only to complywith different requirements in different markets,but also to demonstrate compliance with standards.Although many countries have struggled to meetever stricter standards, even some very poor coun-tries have managed to implement the necessarycapacity. This has most commonly occurred wherethe private sector is well organized and the publicsector is well focused and supports the efforts ofexporters. To meet the challenges posed by stan-dards in international markets for high-value agri-cultural and food products, developing countriesneed institutional frameworks to help them
Agro-Food Exports from Developing Countries: The Challenges Posed by Standards 111

overcome the problems associated with being pooror small. These can include outgrower programs forsmallholder farmers, systems of training and over-sight for smaller enterprises organized throughassociations and other groups, and twinning andregional networking for small countries.
An overarching message is the need for develop-ing countries (and their exporters) to be proactiveon food safety and agricultural health issues. It isimportant not to be pushed into action by a majorcrisis. By thinking strategically, countries, produc-ers, and exporters can program capacity enhance-ment into wider and longer term efforts to enhancedomestic food safety and agricultural health man-agement systems and export competitiveness. Thealternative is that large investments will be requiredover a long period just to “put out fires.” In all ofthis, there is a need for the public and private sec-tors to work together to identify the most efficientand effective ways to develop capacity, viewing foodsafety and agricultural health controls as a collabo-rative effort.
Notes
1. For the more traditional food exports of developing coun-tries, such as beverage crops, fiber crops, tobacco, and sugar,international trade is still largely governed by price and qualityand by traditional forms of trade protection and preferences (seechapters 3 and 4).
2. According to a source at the Food and Drug Administra-tion, while 99 percent of domestic facilities are found to be incompliance, some 30 percent of inspected foreign facilities havesignificant system defects.
3. See www.cfsan.fda.gov and europa.eu.int/comm/food/fs/inspections/fnaoi/reports/annual_eu/index_en.html.
4. For example, as of August 2003, two countries—theNetherlands and the United Kingdom—accounted for morethan two-thirds of the area certified as being EUREPGAP-compliant. EUREPGAP is a set of good agricultural practices(GAP) based on accepted standards and promoted by the Euro-pean retailer produce group (EUREP). Only a small proportionof the area in developing countries on which fresh produce isgrown for the European market was so certified, the bulk of it inSouth Africa. Recognizing these constraints, extended deadlineshave been given to many developing-country exporters and pro-ducers to adopt and gain certification against the EUREPGAPprotocol.
5. Only 20 percent of the notifications by low-income coun-tries and 22 percent of those of high-income countries involvedapplications of international standards.
6. An array of capacity assessment instruments are used togauge strengths and weaknesses of food safety and agriculturalhealth management capacity. Some instruments focus on spe-cific dimensions of capacity, while others provide a broaderoverview.
7. In practice, it is rather difficult to measure “costs of com-pliance.” Food safety is very often achieved in combination with
other business functions and is thus a joint product with thosefunctions. Thus, there are questions over what investments andwhich management systems are put in place strictly to ensurecompliance with particular standards and which service a multi-plicity of functions. In practice, it is often difficult to make thisseparation. For example, cold-store facilities may be needed toprevent the multiplication of bacteria in fresh produce, yet suchfacilities are also critical for achieving a quality characteristic orextended shelf-life.
8. One leading Kenyan firm estimated that the costs of itssmall farmer oversight arrangements represented about 12 per-cent of its costs of raw materials. These transaction costs repre-sent 6 percent of the f.o.b. (free on board) value of French beans,which is equivalent to the exporter’s profit on the product andabout 60 percent of the grower’s profit.
9. Some new products may not require as much farmlabor as previously traded products or may require more capitalinvestment. In either scenario the comparative advantage ofsmallholders may be reduced.
10. Data for the United States can be found at www.fda.gov/ora/oasis/ora_oasis_ref.html, and for the European Union atwww.europa.eu.int/comm/food/fs/sfp/ras_index_en.html. Thedata exclude certain agricultural and food products for whichthe FDA has no jurisdiction, most notably meat and poultry.Until 2002 these data referred to border detentions regardless ofwhether the product was eventually permitted to enter. Sincethen they have recorded border rejections. The European Unionhas made disaggregated data on import alerts available onlysince 2002, although annual reports with broad summary statis-tics were published previously.
11. Between 2002 and 2003 the number of ports at which theFDA has assigned inspection staff increased from 40 to 90. Dur-ing this period, a $96 million increase in the FDA’s budget forfood security work enabled it to hire 655 new field personnel. Inthe Bush administration’s proposed 2005 budget, the FDAwould receive a 9 percent increase in funding to expand its “fooddefense” program. The fiscal 2005 budget calls for 97,000 importinspections, seven times the number undertaken in 2001. Simi-larly large increases were proposed for the Department ofAgriculture’s work on food safety.
12. To put this number into perspective, the estimated totalcosts to the United Kingdom alone from BSE-related marketlosses and for the various cull and disposal schemes was morethan $5 billion (Mathews, Bernstein, and Buzby 2003). This doesnot take any account of the adverse impact on the country’stourism industry.
13. For example, the United States currently permits importsof beef from only 33 countries and imports of chicken from only4 countries.
14. Currently, the International Office of Epizooties recog-nizes only 57 countries as being totally free of foot and mouthdisease without vaccination, of which 26 are developing coun-tries—only 3 of them low-income countries. For further infor-mation, see www.oie.int.
15. Indeed, more widespread cases of both new and well-established animal diseases have led to heightened concernsabout the role of international trade in the spread of such dis-eases. In the case of BSE, widespread restrictions have beenapplied to trade in live animals, meat, animal feed, and an arrayof by-products used in the cosmetics, pharmaceutical, and otherindustries.
16. For the case studies produced by UNCTAD, seer0.unctad.org/trade_env/test1/openF1.htm. For the case studiesproduced by UNEP, see www.unep.ch/etu/publications/Ctry_studies.htm.
112 Global Agricultural Trade and Developing Countries

17. The European Commission has presented its controls onhygiene for imports of fish and fishery products as a practicalexample of the application of equivalence (WTO 2001). Thus,rather than laying down specific requirements, the EuropeanCommission focuses on the conditions under which productswill be equivalent to those produced in the European Union.
18. Although the growth of mycotoxin-producing molds isan endemic problem in humid areas, management of this prob-lem need not involve very sophisticated or costly measures. SeeBoutrif (1997), Park, Njapau, and Boutrif (1999), andDimanche and Kane (2002) for examples of practical and low-cost measures.
19. There, most of the problem occurred during postharvestas the harvested maize was typically stored in moist if not wetconditions for one to two months before sale and processing(Tangthirasunan, T. n.d.).
20. This is probably the most widely cited study on the poten-tial or actual impact of rising food safety standards on exports ofagricultural and food products from developing countries.
21. In response to objections, the European Union revisedsome of its proposed measures. In its 1998 Directive, it estab-lished a limit for total aflatoxin in groundnuts subject to furtherprocessing at 15 parts per billion, and a limit for aflatoxin B1 at 8parts per billion, which was consistent with the proposed Codexstandard. For other nuts and dried fruit subject to further pro-cessing, more stringent limits were set at 10 parts per billion fortotal aflatoxin and 5 parts per billion for aflatoxin B1. There wasno equivalent Codex standard. The strictest standard was set forcereals, dried fruits and nuts intended directly for human con-sumption with maximum levels of 4 parts per billion for totalaflatoxin and 2 parts per billion for aflatoxin B1. Again, therewas no equivalent Codex standard.
22. See, for example the discussions about gravity modelsand other approaches to estimating the trade impacts of stan-dards in Beghin and Bureau (2001), OECD (2003), and Wilson(2003).
23. In that year, African exports of cereals totaled $105 mil-lion, with Egypt accounting for $70 million. The vast majority ofthis trade was conducted with countries of the Near East andMiddle East.
24. In the 1960s and 1970s Africa was a major world supplierof groundnuts, with large exporters in Malawi, Nigeria, Senegal,and other countries. For reasons unrelated to aflatoxin, theseexports lost their international competitiveness, and most pro-duction went to serve domestic markets or for use in oil crush-ing. Over the years, research activity and the commercial trade inAfrica moved away from confectionery-type varieties preferredin world markets, and recent attempts to revive confectionerynut exports have encountered major problems attributable toinadequate seed, basic quality control and price incentives forfarmers.
25. Moonen (2004) reports on testing results from theDutch import control authority. It is common that groundnutshipments from developing countries have levels of aflatoxincontamination of between 50 and 800 parts per billion. Alsocited by Moonen are toxicological surveys in Senegal forgroundnuts sold in the domestic market. Some 90 percent ofsampled groundnuts were contaminated with aflatoxin with theaverage level being 230 parts per billion.
26. The discussion in this section draws on Jaffee (2003).27. Systems for crop procurement have also been trans-
formed, with many leading companies investing in their ownfarms or inducing changes in the practices of outgrowers. Therehas been an array of joint public-private initiatives to traingrowers in all aspects of good agricultural practice. But not all of
the industry has transformed itself. Some 25 smaller exporterslack the financial resources to invest in modern pack-houses andcontinue to supply loose produce to commission agents andothers in European wholesale markets and the Middle East.
References
Beghin, J., and J. C. Bureau. 2001. “Quantitative Policy Analysisof Sanitary, Phytosanitary and Technical Barriers to Trade.”Economie Internationale 87(3): 107–30.
Bhat, Ramesh, and S. Vasanthi. 1999. “Mycotoxin Contamina-tion of Foods and Feeds.” Paper presented at the Third JointFAO/WHO/UNEP International Conference on Mycotox-ins, March 3–6, Tunis.
Boutrif, E. 1997. “Aflatoxin Prevention Programmes.” Food andAgriculture Organization, Rome.
Bureau, J. C., S. Marette, and A. Schiavina. 1998. “Non-TariffTrade Barriers and Consumers’ Information: The Case of theEU–US Trade Dispute over Beef.” European Review of Agri-cultural Economics 25(4): 437–62.
Buurma, J. S., M. J. B. Mengelers, A. J. Smelt, and E. Muller. 2001.“Developing Countries and Products Affected by SettingNew Maximum Residue Limits of Pesticides in the EU.”Agricultural Economics Research Institute, The Hague.
Buzby, J., ed. 2003. International Trade and Food Safety: EconomicTheory and Case Studies. Agricultural Economic Report 828.U.S. Department of Agriculture. Washington, D.C.
Calvin, L. 2003. “Produce, Food Safety, and International Trade:Response to U.S. Foodborne Illness Outbreaks Associatedwith Imported Produce.” In J. Buzby, ed., International Tradeand Food Safety: Economic Theory and Case Studies. Agricul-tural Economic Report 828. U.S. Department of Agriculture.Washington, D.C.
Calvin, L., L. Flores, and W. Foster. 2003. “Case Study:Guatemalan Raspberries and Cyclospora.” In L. Unnevehr,ed., Food Safety in Food Security and Food Trade. Washing-ton, D.C.: International Food Policy Research Institute.
Cato, J., and C. Lima dos Santos. 2000. “Costs to Upgrade theBangladesh Frozen Shrimp Processing Sector to AdequateTechnical and Safety Standards and to Maintain a HACCPProgram.” In L. Unnevehr, ed., HACCP: New Studies of Costsand Benefits. St. Paul: Eagen Press.
Cato, J., S. Otwell, and A. Coze. 2003. “Nicaragua’s Shrimp Sub-sector: Developing a Production Capacity and Export Mar-ket during Rapidly Changing Worldwide Safety and QualityRegulations.” Case study prepared as part of a World Bankprogram on The Challenges and Opportunities Associatedwith International Agro-Food Standards. Washington, D.C.
Chan, M., and B. King. 2000. “Review of the Implications ofChanges in EU Pesticides Legislation on the Production andExport of Fruits and Vegetables from Developing CountrySuppliers.” Natural Resources and Ethical Trade Programme,London.
Crain, W., and J. Johnson. 2001. “Compliance Costs of FederalWorkplace Regulations: Survey Results from U.S. Manufac-turers.” George Mason University, Regulatory Studies Pro-gram, Arlington, Va.
Delgado, C. L., N. Wada, M. W. Rosegrant, S. Meijer, and M.Ahmed. 2003. Fish to 2020: Supply and Demand in ChangingGlobal Markets. Washington, D.C.: International Food PolicyResearch Institute.
Dimanche, P., and A. Kane. 2002. “Senegal’s ConfectioneryPeanut Supply Chain: The Challenge of ControllingAflatoxin Levels.” In Food Safety Management in Developing
Agro-Food Exports from Developing Countries: The Challenges Posed by Standards 113

Countries. Proceedings of the International Workshop,CIRAD-FAO, December 11–13, Montpellier, France.
Dohlman, E. 2003. “Mycotoxin Hazards and Regulations:Impacts on Food and Animal Feed Crop Trade.” In J. Buzby,ed., International Trade and Food Safety: Economic Theoryand Case Studies. Agricultural Economic Report 828. U.S.Department of Agriculture. Washington, D.C.
Dolan, C., and J. Humphrey. 2000. “Governance and Trade inFresh Vegetables: The Impact of UK Supermarkets on theAfrican Horticulture Industry.” Journal of Development Stud-ies 37(2): 147–76.
Dong, F., and H. Jensen. 2004. “The Challenge of Conforming toSanitary and Phytosanitary Measures for China’s Agricul-tural Exports,” MATRIC Working Paper 04-MWP 8, IowaState University, Ames, Iowa.
Egmond, Hans. 1999. “Worldwide Regulations for Mycotoxins.”Paper presented at the Third Joint FAO/WHO/UNEP Inter-national Conference on Mycotoxins, March 3–6, Tunis.
El-Tawil, A. 2002. “An In-Depth Study of the Problems by theStandardizers and Other Stakeholders from DevelopingCountries.” Paper presented at the ISO/WTO regional work-shops: Part 1. International Organization for Standardiza-tion, Geneva.
Henson, S. J. 2001. “Appropriate Level of Protection: A EuropeanPerspective.” In K. Anderson, C. McRae, and D. Wilson, eds.,The Economics of Quarantine and the SPS Agreement. Uni-versity of Adelaide, Centre for International Trade Studies,Australia.
———. 2004. “National Laws, Regulations, and InstitutionalCapabilities for Standards Development.” Paper prepared fora World Bank training seminar on Standards and Trade, Jan-uary 27–28, Washington, D.C.
Henson, S. J., and W. Mitullah. 2004. “Kenyan Exports of NilePerch: Impact of Food Safety Standards on an Export-Oriented Supply Chain.” Case study for a World Bank pro-gram on the Challenges and Opportunities Associated withInternational Agro-Food Standards. Policy Research Work-ing Paper 3349. World Bank, Washington, D.C.
Jaffee, S. 2003. From Challenge to Opportunity: TransformingKenya’s Fresh Vegetable Trade in the Context of Emerging FoodSafety and Other Standards in Europe. Agriculture and RuralDevelopment Discussion Paper 1. World Bank, Washington,D.C.
Lamb, J., J. Velez, and R. Barclay. 2004. “The Challenge of Com-pliance with SPS and Other Standards Associated with theExport of Shrimp and Selected Fresh Produce Items to theUnited States Market.” Paper submitted to the World Bank.Washington, D.C.
Mathews, K, J. Bernstein, and J. Buzby. 2003. “InternationalTrade of Meat/Poultry Products and Food Safety Issues.” InJ. Buzby, ed., International Trade and Food Safety: EconomicTheory and Case Studies. Agricultural Economic Report 828.U.S. Department of Agriculture, Washington, D.C.
Moonen, I. 2004. “The Aflatoxin Case: Process and Impact Eval-uation of the EU Regulation on Aflatoxin.” Paper submittedto the Netherlands Ministry of Foreign Affairs, PolicyCoherence Unit, The Hague.
OECD (Organisation for Economic Co-operation and Develop-ment). 2003. “Trade Effects of the SPS Agreement.” JointWorking Party on Agriculture and Trade, Paris.
Otsuki, T., J. Wilson, and M. Sewadeh. 2001. “Saving Two in aBillion: Quantifying the Trade Effect of European FoodSafety Standards on African Exports.” Food Policy 26(5):495–514.
Park, D., H. Njapau, and E. Boutrif. 1999. “Minimizing RisksPosed by Mycotoxins Utilizing the HACCP Concept.” Paperpresented at the Third Joint FAO/WHO/NEP InternationalConference on Mycotoxins, March 3–6, Tunis.
Pauwelyn, J. 1999. “The WTO Agreement on Sanitary and Phy-tosanitary (SPS) Measures as Applied in the First Three SPSDisputes.” Journal of International Economic Law 2(94):641–49.
Perry, B. D., T. F. Randolph, S. Ashley, R. Chimedza, T. Forman,J. Morrison, C. Poulton, L. Sibanda, C. Stevens, N. Tebele,and I. Yngstrom. 2003. “The Impact and Poverty ReductionImplications of Foot and Mouth Disease Control inSouthern Africa.” International Livestock Research Institute,Nairobi.
Reardon, T., and J. A. Berdegue. 2002. “The Rapid Rise ofSupermarkets in Latin America: Challenges and Opportuni-ties for Development.” Development Policy Review 20(4):371–88.
Reddy, D., K. Thirumala-Devi, S. Reddy, F. Waliyar, M. Mayo, K.Devi, R. Ortiz, and J. Lenne. 2002. “Estimation of AflatoxinLevels in Selected Foods and Feeds in India.” In Food SafetyManagement in Developing Countries, Proceedings of theInternational Workshop, CIRAD-FAO, December 11–13,Montpellier, France.
Roberts, D. 2004. “The Multilateral Governance Framework forSanitary and Phytosanitary Regulations: Challenges andProspects.” Paper prepared for a World Bank training semi-nar on Standards and Trade, January 27–28, Washington,D.C.
Roberts, D., and B. Krissoff. 2003. “The WTO Agreement on theApplication of Sanitary and Phytosanitary Barriers.” U.S.Department of Agriculture, Economic Research Service,Washington, D.C.
Roberts, D., and D. Orden. 1997. “Determinants of TechnicalBarriers to Trade: The Case of U.S. Phytosanitary Restric-tions on Mexican Avocados, 1972–1995.” In D. Orden and D.Roberts, eds., Understanding Technical Barriers to Trade.Minneapolis-St. Paul: University of Minnesota, Interna-tional Agricultural Trade Research Consortium.
Roberts, D., T. Josling, and D. Orden. 1999. “A Framework forAnalyzing Technical Trade Barriers in Agricultural Markets.”U.S. Department of Agriculture, Economic Research Service.Washington, D.C.
Sumner, D. A., ed. 2003. Exotic Pests and Diseases: Biology andEconomics for Biosecurity. Ames, Iowa: Iowa State Press.
Tangthirasunan, T. n.d. “Mycotoxin Economic Aspects.” Foodand Agriculture Organization. Rome.
Unnevehr, L. 2003. “Food Safety in Food Security and FoodTrade: Overview.” In L. Unnevehr, ed., Food Safety in FoodSecurity and Food Trade. Washington, D.C.: InternationalFood Policy Research Institute.
Unnevehr, L., and N. Hirschhorn. 2001. “Designing EffectiveFood Safety Interventions in Developing Countries.” WorldBank, Washington, D.C.
Wilson, J., and T. Otsuki. 2003. “Balancing Risk Reduction andBenefits from Trade in Setting Standards.” In L. Unnevehr,ed., Food Safety in Food Security and Food Trade. Washing-ton, D.C.: International Food Policy Research Institute.
Wilson, N. 2003. “A Review of Empirical Studies of the Tradeand Economic Effects of Food Safety Regulations.” In A.Velthuis, ed., New Approaches to Food Safety Economics.Boston: Kluwer Academic Publishers.
WTO (World Trade Organization). 2001 “Equivalence: Note bythe Secretariat.” G/SPS/W/111. Geneva.
114 Global Agricultural Trade and Developing Countries

decomposes the aggregate results by looking at theimpacts of partial reforms—both regionally andacross instruments—to identify what share of theglobal gains derives from reform in industrial coun-tries and what from reform in developing countriesand what share is driven by border protection andwhat by domestic support. The second set of simu-lations addresses issues raised by critics of tradereform—notably that the predicted gains for devel-oping countries are too optimistic and that the tran-sition costs for industrial-country farmers are highand too often ignored. Concerns have also beenraised about the ability of developing countries torespond to reforms and to achieve consistently highproductivity gains. To answer the questions aboutthe impacts on developing countries, three assump-tions are explored: the consequences of assumingdifferential and lower agricultural productivity insome developing countries, the impacts of con-straining output supply response in selectedlow-income countries, and estimates of trade elas-ticities. The chapter also assesses the impacts of
This chapter uses a global, dynamic applied generalequilibrium model (LINKAGE) to assess how themultifarious trade and support policies in agricul-ture affect income, trade, and output patterns at theglobal level.1 Such models have become a standardtool for assessing policy reforms because they cap-ture linkages across sectors and regions (throughtrade) and because, by their nature, they haveadding-up constraints so that supply and demandare in equilibrium in all markets. The analysis pro-vides order-of-magnitude estimates of the poten-tial consequences of policy changes, rather thana single point or “best” estimate. It also looks atthe induced structural changes, including cross-regional patterns of output and trade, which tendto be much larger than the more familiar gainsto real income. Whereas income gains typicallyamount to 1 percent of base income or less, struc-tural changes—for example, in sectoral output ortrade—can be greater than 50 percent.
Two sets of simulations are used to create adeeper picture of what drives the key results. One set
115
7
GLOBAL AGRICULTURalReform: WHAT IS
AT STAKE?
Dominique van der Mensbrugghe and John C. Beghin
With great appreciation from the authors, the underlying work in this chapter has benefited over severalyears from useful comments and suggestions from the following colleagues: Ataman Aksoy, JonathanBrooks, Bill Cline, Uri Dadush, Bernard Hoekman, Jeff Lewis, Will Martin, John Nash, Richard Newfarmer,David Roland-Holst, Josef Schmidhuber, and Hans Timmer as well as participants at seminars at the OECDand the University of California at Berkeley.

116 Global Agricultural Trade and Developing Countries
slower exit by industrial-country farmers and howthis would affect transition adjustments.
Some of the main findings:
• Reform of agricultural and food trade policyprovides 70 percent of the global gains frommerchandise trade reform—$265 billion of atotal of $385 billion.
• The global gains are shared roughly equallybetween industrial and developing countries,but developing countries gain significantly moreas a share of initial income. Significant incomegains occur in developing-country agriculture,where poverty tends to be concentrated.
• Developing countries gain more from reformingtheir own support policies than from improvedmarket access in industrial countries. Likewise,industrial countries also gain relatively morefrom their own reform.
• Notwithstanding the overall benefits fromgreater openness, structural changes are impor-tant and transition adjustments need to beaddressed.
• Productivity and supply assumptions affectimpact assessment, but their influence is small,and they do not alter the main aggregatefindings. Trade elasticities, however, are key indetermining the overall level of the incomegains. Higher elasticities dampen terms-of-tradeeffects and increase trade and real income gainsmore than proportionally, while the opposite istrue for lower elasticities. These effects can bevery large for individual countries.
The Modeling Framework
The LINKAGE model is based on a standard neo-classical general equilibrium model with firmsmaximizing profit in competitive markets and con-sumers maximizing well-being under a budget con-straint. The model has added features related to itsdynamic nature. It is global, with the world decom-posed into 23 regions, and multisectoral, witheconomic activity aggregated into 22 sectors (seeannex A in the report on the CD-ROM). Seven ofthe 23 regions are classified as high-income (orindustrial) including Canada, Western Europe(European Union-15 plus the European Free TradeAssociation countries), Japan, and the UnitedStates—the so-called Quad countries. The develop-
ing countries include some of the large countriesthat are important in agricultural markets as pro-ducers or as consumers (Argentina, Brazil, China,India, and Indonesia). The remaining developingcountries are grouped into regional aggregations.2
The sectoral decomposition is concentrated in theagricultural and food sectors (15 of the 22 sectors).
The LINKAGE model is dynamic, with scenariosspanning 1997 to 2015. The dynamics includeexogenously given labor and land growth rates,savings-driven investment and capital accumula-tion, and exogenous productivity growth. Struc-tural changes over time are driven by differentialgrowth rates and supply and demand parameters.Trade is modeled using the Armington assumption.Goods are differentiated by region of origin using atwo-nested structure (domestic absorption firstallocated across domestic and aggregate importgoods, then aggregate imports allocated acrossdifferent regions of origin).
Overview of Baseline Simulation
Assessing the impacts of policy reforms requirestwo steps in the dynamic framework of theLINKAGE model, a baseline (or reference) simula-tion and a reform simulation. The baseline involvesrunning the model forward from its 1997 base yearto 2015, with exogenous assumptions about laborand population growth rates, productivity, anddemand behavior parameters including savings,which determines the rate of capital accumulation(adjusted exogenously for depreciation).
The baseline simulation can also incorporatechanges in base year policies—to take into accountknown changes in policies (between 1997 and thepresent) or anticipated changes. The baselinedescribed below assumes no changes in base yearpolicies, however; they are held at their 1997 levels.Thus the reform simulations reflect changes fromtheir 1997 levels, not changes that would be antici-pated from 2004 levels.3 It is unclear in whichdirection some past and anticipated changes wouldaffect the global trade reform results. Some changesclearly reflect further opening—for example,China’s accession to the World Trade Organization(WTO) and some bilateral free trade agreements.Others would go in the opposite direction—forexample, the changes to the U.S. farm supportprograms.

Agriculture and Food Trends in the BaselineScenario
Trends in agriculture and food supply and demandacross the globe as determined in the baseline sce-nario are driven in part by the macroeconomicenvironment (as described in annex B on theCD-ROM). But they are also driven by microeco-nomic assumptions about the mobility of factors,production technologies, income and price elastici-ties, and trade elasticities, among others.
For agriculture and food between 2000 and2015, both demand and production grow at1.0–1.2 percent a year in industrial countries and at
a much higher 2.9–3.4 percent in developing coun-tries (tables 7.1 and 7.2 summarize the results;tables on the CD-ROM provide details for individ-ual countries). On a per capita basis there is moredemand growth in developing countries, largelybecause of higher income elasticities for food. Thusthe baseline assumes that demand growth will belower than output growth in industrial countriesand higher than output growth in developingcountries.
With higher output growth than demand,industrial countries will see an increase in theirexportable surplus. On aggregate their net
Global Agricultural Reform: What Is at Stake? 117
TABLE 7.2 Trends in Processed Foods, 2000–15
Average Annual Growth Net Trade(percent) (billions of 1997 US$)
Country Grouping Output Demand Imports Exports 2000 2015
High-income countries 1.2 1.0 1.3 2.4 7.7 53.5Low-income countries 3.3 3.4 3.9 2.2 3.6 1.8Middle-income countries 2.9 3.1 4.5 2.0 −11.3 −55.3Low-income countries, 3.1 3.3 3.8 2.2 1.8 −0.2
excluding IndiaMiddle-income countries, 2.9 3.1 4.5 2.0 −9.5 −53.4
including IndiaDeveloping countries 2.9 3.2 4.5 2.1 −7.7 −53.5World total 1.8 1.8 2.4 2.3 0.0 0.0
Note: Net trade is measured at f.o.b. prices (imports exclude international trade and transport margins).Source: World Bank simulations with LINKAGE model, based on release 5.4 of the GTAP data.
TABLE 7.1 Trends in Agriculture, 2000–15
Average Annual Growth Net Trade(percent) (billions of 1997 US$)
Country Grouping Output Demand Imports Exports 2000 2015
High-income countries 1.2 1.1 1.9 3.0 −24.3 −3.1Low-income countries 3.6 3.5 4.4 5.5 9.9 21.6Middle-income countries 3.2 3.3 8.3 5.4 14.4 −18.5Low-income countries, 3.7 3.4 3.6 6.6 7.2 22.4
excluding IndiaMiddle-income countries, 3.2 3.4 8.3 5.1 17.1 −19.3
including IndiaDeveloping countries 3.3 3.4 7.8 5.4 24.3 3.1World total 2.6 2.6 4.4 4.2 0.0 0.0
Note: Net trade is measured at f.o.b. prices (imports exclude international trade and transport margins).Source: World Bank simulations with LINKAGE model, based on release 5.4 of the GTAP data.

agricultural and food trade will improve dramati-cally from a deficit of $17 billion in 2000 to a sur-plus of $50 billion in 2015 (at 1997 prices). Theopposite occurs in developing countries, where a netpositive balance in agriculture and food turns into alarge deficit of $50 billion, due mostly to a balloon-ing deficit in processed food. Agriculture and foodbalances are positive for low-income countries in2000 and 2015.
Developing a baseline of the future world econ-omy requires nuanced analysis. The country andregional growth rates used here are in line withconsensus views, given stronger demographictrends and income elasticities for agriculture andfood in developing economies. World and regionaltotals may be skewed by several factors. The weightsare biased toward industrial countries because ofthe use of base year (1997) value shares. Volumeshares would yield different figures. Demandgrowth in developing countries may be overstatedbecause income elasticities are held constant attheir base year levels. It is plausible to argue thatincome elasticities would converge toward those ofhigh-income countries as developing countriesgrow. The growth numbers are also broadly consis-tent with Food and Agriculture Organization(FAO) historical trends. The discrepancy betweenagricultural growth and food processing originatesin the growth in intermediate demand for agricul-tural products as food processing grows. A moremeat-intensive future world would also exhibit aslight acceleration in agricultural growth relative tofood because of the feed input in the livestocksector. So, while the baseline scenario is plausible,aggregate growth rates should be used with cautionfor all these reasons.
The biggest mover among developing countriesis China, where the food deficit of $8 billion in 1997would swell to somewhere around $120 billion by2015. Demand is expected to outpace output byabout 1 percentage point a year.4 In agriculture thisprovides new opportunities for Sub-Saharan Africaand Latin America, with both seeing a large rise inagricultural surplus (on an aggregate basis). Sub-Saharan Africa will nonetheless see a slight deterio-ration in its processed-food balance. The aggregatenet trade balances may mask more detailed sectoralshifts. For example, Sub-Saharan Africa will con-tinue to be a net importer of grains through thebaseline scenario time horizon, and therefore a rise
in world prices induced by trade reform could leadto a negative terms-of-trade shock since the agri-cultural commodities they tend to export—forexample, coffee and cocoa—already have relativelyfree access.
With relatively low demand growth in industrialcountries and relatively high output growth, theexportable agricultural surplus will increase sub-stantially, particularly from North America andOceania. Europe and Japan are the exceptions, withoutput growth expected to be anemic.
The Impacts of AgriculturalReform
The impacts of agricultural trade reform are exam-ined first in the context of global merchandise tradereform, and then the results are decomposed bytype of reform and region, to assess the relativeimportance for developing countries of reforms inindustrial countries and in developing countries.
Results of Global Merchandise Trade Reform
Global reform involves removing protection in all(nonservice) sectors, in all regions, and for allinstruments of protection (leaving other taxesunchanged, although lump-sum taxes (or trans-fers) on households adjust to maintain a fixed gov-ernment fiscal balance). The model contains sixinstruments of protection:
• Import tariffs, eliminated only if they arepositive
• Export subsidies, eliminated only if they arenegative5
• Capital subsidies, with direct payments con-verted into subsidies on capital
• Land subsidies, with some payments also con-verted to subsidies on land
• Input subsidies• Output subsidies
The overall measure of reform, referred to asreal income, measures the extent to which house-holds are better off in the post-reform scenariothan in the baseline scenario in the year 2015.6 Theworld gain (measured in 1997 U.S. dollars) is$385 billion, an increase from baseline income ofsome 0.9 percent (table 7.3). The gains are relatively
118 Global Agricultural Trade and Developing Countries

evenly divided between industrial countries($188 billion) and developing countries ($197 bil-lion), but developing countries are considerablybetter off as a share of reference income, with a gainof 1.7 percent compared with 0.6 percent for indus-trial countries.
Caveats. A few caveats about the basic globalreform scenario. First, there are known deficienciesin the base year policies, which are taken from release5.4 of the Global Trade Analysis Project (GTAP)database. Most preferential arrangements—including the Generalized System of Preferencesand some regional trading agreements—are notincorporated.7 Alternative scenarios could be under-taken to test their overall importance especiallyregarding the utilization rates of the preferences.Second, the reference scenario assumes no changesin the base year policies between the base and termi-nal years. Thus changes in trading regimes since1997, such as China’s accession to the WTO, or antic-
ipated changes, such as the elimination of the Multi-fiber Arrangement, are not taken into account.8
Third, changes to some key assumptions orspecifications could generate higher benefits. Forexample, raising the trade elasticities—as somehave argued—dampens the negative terms-of-trade effects. Increasing returns to scale can gener-ate greater efficiency improvements, dependingon the structure of product markets and scaleeconomies to be achieved. Reform of services couldhave economywide impacts to the extent thatcheaper and more efficient services can lower pro-duction costs as well as improve real incomes.Changes in investment flows—not modeled here—have proven to be as important (sometimes more)as lowering trade barriers in many regional agree-ments. In a global model, the net change would bezero. Therefore, any reallocation of capital wouldlead some countries to be better off, all else remain-ing the same, and others worse off (abstractingfrom the benefits of future repatriated profits).
Global Agricultural Reform: What Is at Stake? 119
TABLE 7.3 Real Income Gains and Losses from Global Merchandise Trade Reform:Change from 2015 Baseline
Export Capital Land Input OutputAll Tariffs Subsidies Subsidies Subsidies Subsidies Subsidies
Country Grouping Instruments Only Only Only Only Only Only
Change in value(billions of 1997 US$)
High-income countries 188.3 160.4 1.4 1.1 −4.8 −0.3 9.0Low-income countries 31.9 34.6 −1.1 −0.1 −0.7 −0.3 0.2Middle-income countries 164.7 187.7 −7.0 −1.2 −7.3 −3.8 −6.4Low-income countries, 19.9 21.5 −0.9 −0.1 −0.6 −0.2 0.9
excluding IndiaMiddle-income countries, 176.7 200.8 −7.3 −1.2 −7.4 −3.9 −7.0
including IndiaDeveloping countries 196.5 222.3 −8.2 −1.3 −8.1 −4.1 −6.2World total 384.8 382.7 −6.8 −0.2 −12.8 −4.4 2.8
Percentage changeHigh-income countries 0.6 0.5 0.0 0.0 0.0 0.0 0.0Low-income countries 1.6 1.7 −0.1 0.0 0.0 0.0 0.0Middle-income countries 1.8 2.0 −0.1 0.0 −0.1 0.0 −0.1Low-income countries 1.9 2.1 −0.1 0.0 −0.1 0.0 0.1
excluding IndiaMiddle-income countries 1.7 1.9 −0.1 0.0 −0.1 0.0 −0.1
including IndiaDeveloping countries 1.7 1.9 −0.1 0.0 −0.1 0.0 −0.1World total 0.9 0.9 0.0 0.0 0.0 0.0 0.0
Source: World Bank simulations with LINKAGE model, based on release 5.4 of the GTAP data.

Gross flows could have a greater impact than netcapital flows to the extent that they raise productiv-ity if they are associated with technology-ladencapital goods. Finally, dynamic effects can also leadto a boost in the overall gains from reform.
The global scenario captures some of the inher-ent dynamic gains, notably changes from savingsand investment behavior. These can sometimeshave a substantial impact, to the extent thatimported capital goods are taxed. Assuming thatsavings rates are unchanged, a sharp fall in the priceof capital goods can lead to a significant rise ininvestment (more bang per dollar invested). Thescenario does not incorporate changes to produc-tivity, however. The channels and magnitudes oftrade-related changes to productivity are as yetpoorly validated by solid empirical evidence, andattempts to incorporate these effects are by andlarge simply illustrative of potential magnitudes.Recent World Bank reports suggest that theseeffects could be large, but the reports are really anappeal for more empirical research.9
Decomposition by instrument. The key findingon instruments of protection is the predominantrole of tariffs. Removal of tariffs accounts for virtu-ally all of the gains. The other instruments havemuch smaller impacts on real income—slightlypositive on average for industrial countries andnegative in aggregate for developing countries. Forexample, elimination of export subsidies negativelyaffects Africa—both North and Sub-Saharan—andthe Middle East, although it provides a positivebenefit for Europe. Elimination of domestic protec-tion also tends to be negative for developingcountries, and at times for industrial countries aswell. The rest of Sub-Saharan Africa is a notableexception, with an income gain of 0.6 percent. Thiscould reflect the removal of significant output sub-sidies on cotton in some of the major producingcountries (China and the United States).
The ambiguity of the welfare impact is in partdriven by the nature of partial reforms. Removal ofone form of protection may exacerbate the negativeeffects of other forms of protection. For example,removal of output subsidies may worsen the impactof tariffs if removal of the subsidies leads to areduction in output and an increase in imports.There are no robust theoretical arguments to deter-mine which is more harmful. There are also other
general equilibrium effects inherent in multisec-toral global models.
While the aggregate measure of gain often gar-ners the most attention—at least from policy mak-ers and the media—more relevant for most playersare the detailed structural results. By and large, it isthe structural results that influence the politicaleconomy of reforms, particularly since the losersfrom reforms tend to be concentrated and a well-identified pressure group, whereas the gainers aretypically diffuse and harder to identify. For exam-ple, a 10 percent decline in the price of wheat couldhave a major impact on a farmer’s income, butan almost imperceptible effect on the averageconsumer.
With reform, aggregate agricultural output ofindustrial countries declines—by more than11 percent when all forms of protection are elimi-nated (table 7.4). Removal of tariff protection gen-erates the greatest change to production in indus-trial countries, but unlike the case with the welfareimpacts, the other forms of protection have meas-urable, if smaller, impacts on output. Removal ofoutput subsidies results in the next greatest changein agricultural output, driven largely by the nearly5 percent output decline in the United States—although land and export subsidies have nearly thesame aggregate impact. The detailed results for theQuad countries confirm several points of commonwisdom regarding the patterns of protection. First,the United States makes more use of output subsi-dies than do Europe and Japan. Europe makesgreater use of export subsidies and direct payments(capital and land subsidies). Japanese protection ismostly in the form of import barriers.
Results of Agricultural Reform
Full merchandise trade reform provides a bench-mark from which to judge the maximal effects fromreform. This section focuses on the agricultural andfood sectors.
Real income gains. If all regions remove all pro-tection in agriculture and food, the global gains in2015 amount to $265 billion—nearly 70 percent ofthe gains from full merchandise trade reform(table 7.5). This is remarkable considering thesmall size of agriculture and food in global output(figure 7.1).10 Agriculture represents less than
120 Global Agricultural Trade and Developing Countries

Global Agricultural Reform: What Is at Stake? 121
TABLE 7.4 Agricultural Output Gains and Losses from Global Merchandise Trade Reform:Change from 2015 Baseline
Export Capital Land Input OutputAll Tariffs Subsidies Subsidies Subsidies Subsidies Subsidies
Country Grouping Instruments Only Only Only Only Only Only
Change in value(billions of 1997 US$)
High-income countries −109.7 −56.2 −9.5 −1.6 −10.4 −7.4 −12.0Low-income countries 14.8 11.5 1.1 0.0 0.7 0.4 2.0Middle-income countries 41.8 18.1 8.2 −0.2 8.5 0.5 9.3Low-income countries, 13.7 10.5 0.9 0.0 0.5 0.3 2.8
excluding IndiaMiddle-income countries, 42.9 19.2 8.4 −0.2 8.7 0.6 8.6
including IndiaDeveloping countries 56.6 29.7 9.3 −0.1 9.2 0.9 11.3World total −53.1 −26.6 −0.2 −1.7 −1.2 −6.5 −0.7
Percentage changeHigh-income countries −11.1 −5.7 −1.0 −0.2 −1.1 −0.7 −1.2Low-income countries 2.4 1.8 0.2 0.0 0.1 0.1 0.3Middle-income countries 2.4 1.0 0.5 0.0 0.5 0.0 0.5Low-income countries, 4.1 3.1 0.3 0.0 0.2 0.1 0.8
excluding IndiaMiddle-income countries, 2.1 0.9 0.4 0.0 0.4 0.0 0.4
including IndiaDeveloping countries 2.4 1.2 0.4 0.0 0.4 0.0 0.5World total −1.6 −0.8 0.0 −0.1 0.0 −0.2 0.0
Source: World Bank simulations with LINKAGE model, based on release 5.4 of the GTAP data.
TABLE 7.5 Real Income Gains from Agricultural and Food Trade Reform: Changefrom 2015 Baseline(billions of 1997 US$)
Agricultural andGlobal Food Trade Agricultural
Merchandise Reform Trade ReformTrade Reform High-Income Only
Country Grouping Global Global Countries High-Income
High-income countries 188.3 136.6 92.0 29.3Low-income countries 31.9 10.3 3.0 1.1Middle-income countries 164.7 118.2 6.9 −4.9Low-income countries, 19.9 8.4 3.6 1.6
excluding IndiaMiddle-income countries, 176.7 120.1 6.4 −5.3
including IndiaDeveloping countries 196.5 128.6 10.0 −3.8World total 384.8 265.2 102.0 25.5
Source: World Bank simulations with LINKAGE model, based on release 5.4 of the GTAP data.

2 percent of output for industrial countries and10.5 percent for developing countries, whileprocessed foods represent 4.5 percent for industrialcountries and 7.5 percent for developing countries.Agriculture is still a relatively high 19 percent ofoutput in the low-income developing countries.Clearly, protection tends to be higher in agricultureand food than in other sectors, particularly inindustrial countries, but in middle-income coun-tries as well. Protection is more uniform in low-income countries.
For low-income countries the gains from globalfree trade in agriculture and food amount toaround one-third of the gains from global freetrade in all merchandise. This is a consequence oftheir dependence on imports of the most protectedfood items—such as grains—while they are netexporters of commodities with little or no protec-tion. The middle-income countries gain 71 percentfrom global free trade in agriculture and food,nearly as much as industrial countries, which gain72 percent as compared with full merchandisetrade reform.
If reforms are limited to high-incomecountries—a super-version of special and differen-tial treatment—with perhaps an agreement bymiddle-income countries to bind at existing levelsof protection, global gains drop to $102 billion,indicating that a significant portion of the globalgains is generated by removal of agricultural barri-ers in developing countries (see table 7.5).11 Thedrop in gains is particularly striking for middle-
income countries, where the gains from their ownagricultural and food reform would be quite sub-stantial. On a percentage basis, this is less so forlow-income countries. The industrial countriesreap gains of $92 billion, implying that agriculturalreform in developing countries could generategains of about $45 billion for the industrialcountries.
The final decomposition scenario is to assess theimpacts of reform in agriculture alone in industrialcountries—leaving protection unchanged forprocessed foods. This lowers the gains substantiallyfor industrial countries—from $92 billion to $29billion (see table 7.5). Protection is high in bothsectors, and the processed foods sector is more thantwice as large as the agricultural sector. Further-more, in a partial reform scenario, the efficiencygains in agriculture could be offset to some extentby further losses in processed foods. Output willexpand in the processed food sector as resourcesare moved around—and the lower costs of inputswill also provide incentives to increase output.Middle-income countries could lose from anagriculture-only reform in industrial countries.They would benefit little from improved marketaccess in agriculture, and in a partial reform sce-nario, expansion of their protected domestic agri-culture and food production leads to efficiencylosses that are not compensated elsewhere.
To conclude—global agricultural trade reformgenerates a huge share of the gains to be made frommerchandise trade reform. Market access into
122 Global Agricultural Trade and Developing Countries
FIGURE 7.1 Output Structure in Base Year, 1997
0
2010
30
50
70
90
40
60
80
100
Percent
Industrial Low-income Middle-income
Other goods and servicesProcessed foodsAgriculture
Manufacturing
Source: GTAP release 5.4.

industrial countries provides significant gains, buta greater share of the gains for developing countriescomes from agricultural trade reform amongdeveloping countries. Finally, reform in agriculturealone provides few benefits. It needs to be linked toreform in the processed food sectors.
Structural implications. Accelerating integrationis one of the key goals of trade reform. Beyond theefficiency gains that come from allocating resourcesto their best uses, integration is expected to bringproductivity increases—scale economies, greatercompetitiveness, ability to import technology-laden intermediate goods and capital, greater mar-ket awareness, and access to networks.
The potential changes in trade from globalreform of agriculture and food are large. Worldtrade in these two sectors could jump by more thanhalf a trillion dollars in 2015 (compared with thebaseline), an increase of 74 percent (table 7.6).
Exports in agriculture and food from developingcountries would jump $300 billion, an increase ofmore than 115 percent, with industrial-countryexports increasing $220 billion, or 50 percent. Onthe flip side, imports from both industrial anddeveloping countries would rise substantially. Thenet trade position of industrial countries woulddeteriorate marginally—from $50 billion in thebaseline in 2015 to $48 billion after global reformof agriculture and food. The marginal improve-ment for developing countries decomposes into aboost of nearly $12 billion for low-income coun-tries and deterioration for middle-income coun-tries of nearly $10 billion.
If the reform is limited to industrial countries,the picture is modified significantly. First, thechange in imports for industrial countries is almostidentical under the two scenarios—$223 billionwith full reform and $205 billion with industrial-country reform only (see table 7.6). Developing
Global Agricultural Reform: What Is at Stake? 123
TABLE 7.6 Impact of Global Agricultural and Food Reform on Agricultural andFood Trade: Change from 2015 Baseline
Exports Imports Net Trade
Country Grouping Global Industrial Global Industrial Global Industrial 2015 Baseline
Change in value(billions of 1997 US$)
High-income countries 221.2 63.4 223.3 205.3 −2.1 −141.9 50.4Low-income countries 41.0 20.9 29.2 −0.3 11.8 21.2 23.4Middle-income countries 260.1 120.5 269.8 −0.2 −9.7 120.7 −73.8Low-income countries, 33.8 17.5 21.9 0.1 11.8 17.5 22.2
excluding IndiaMiddle-income countries, 267.3 123.9 277.1 −0.5 −9.8 124.4 −72.7
including IndiaDeveloping countries 301.1 141.4 299.0 −0.4 2.1 141.9 −50.4World total 522.3 204.9 522.3 204.9 0.0 0.0 0
Percentage changeHigh-income countries 50 14 57 52Low-income countries 74 38 92 −1Middle-income countries 125 58 96 0Low-income countries, 70 36 84 0
excluding IndiaMiddle-income countries, 125 58 96 0
including IndiaDeveloping countries 115 54 95 0World total 74 29 74 29
Note: The columns labeled Global refer to the impacts from global agriculture and food reform.The columns labeled Industrial refer to industrial-country only reform of agriculture and food.Source: World Bank simulations with Linkage model, based on release 5.4 of the GTAP data.

countries see a significant rise in exports, but toindustrial countries only, with little or no change intheir own imports. Thus industrial countries wouldwitness a much sharper deterioration in their netfood bill, with net imports registering a change of$142 billion instead of $2 billion, as under theglobal reform scenario. The United States andEurope bear the brunt of the adjustment, withCanada, Australia, and New Zealand seeing littledifference between the global and partial reformscenarios. In other words, these three countriesreap much of the trade benefits from greater mar-ket access within industrial countries. Opening upof markets in developing countries significantlydampens the adjustment process for the UnitedStates and Europe, and the United States wouldreinforce its net exporting status significantlyunder a global reform scenario.
Most developing countries see a greater im-provement in their net food trade with industrial-country-only reform than with global reform—but not all countries. Argentina, Brazil, and the restof East Asia improve their net food trade morewith global reform than with partial reform. They
would gain additional market access from develop-ing countries and reinforce their comparativeadvantage over more highly protected countries inEast Asia. The biggest beneficiary in net termswould be China. While its (small) exports wouldnot change much, removal of its own protectioninduces a huge shift in imports. The lack of reformunder the partial reform scenario means thatinstead of its net food position deteriorating by$74 billion in the global reform, it sees a smallimprovement of $6 billion. On aggregate for devel-oping countries the partial reform would gener-ate an improvement in net trade of food of$142 billion.
The structural impacts described above are asso-ciated with global changes in the distribution offarm income. With global agriculture and foodreform, farm incomes barely change at the globallevel (a loss of perhaps $10 billion,12 or 0.6 percentof baseline 2015 farm income). Changes are muchmore significant at the regional level (figures 7.2and 7.3). The largest absolute gains in farm incomeare in the Americas, Australia and New Zealand,and developing East Asia excluding China. Latin
124 Global Agricultural Trade and Developing Countries
FIGURE 7.2 Change in Rural Value Added from Baseline in 2015(billions of 1997 $US)
�100 �80 �60 �40 �20 200 40
ChinaWestern Europe
JapanKorea, Rep. of, and Taiwan (China)
Rest of South AsiaIndia
Rest of Europe and Central AsiaRest of the world
VietnamSouthern African Customs Union
EU accession countriesIndonesia
TurkeyMexico
CanadaRest of Sub-Saharan Africa
Rest of East AsiaAustralia and New Zealand
BrazilArgentina
Rest of Latin AmericaUnited States
Source: World Bank simulations with Linkage model, based on release 5.4 of the GTAP data.
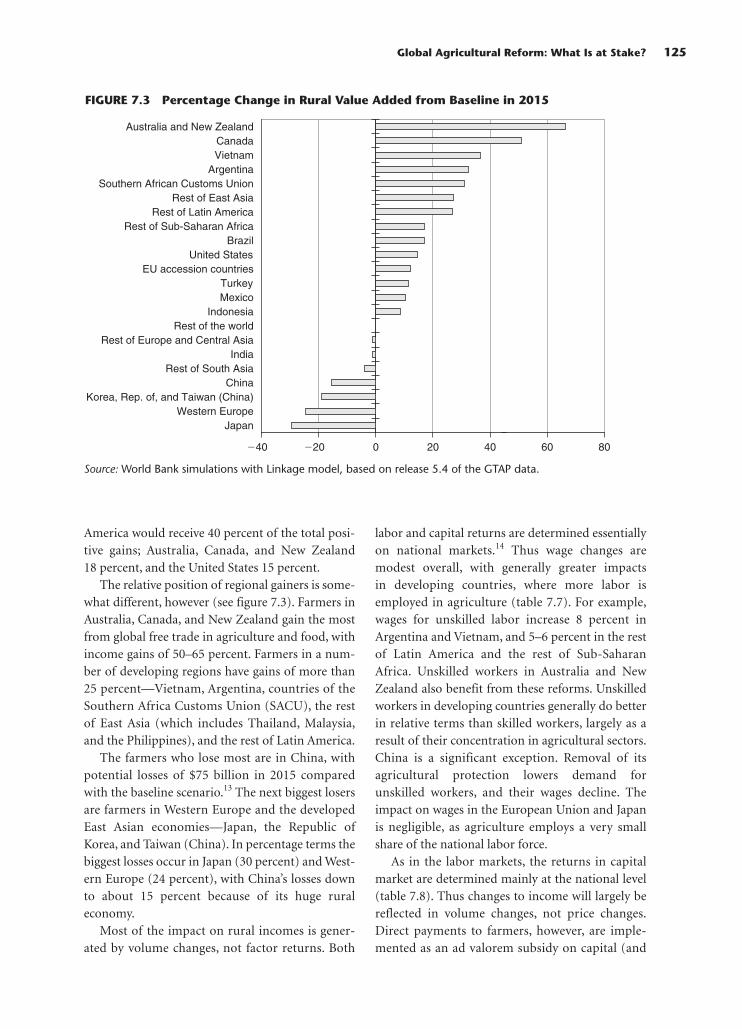
America would receive 40 percent of the total posi-tive gains; Australia, Canada, and New Zealand18 percent, and the United States 15 percent.
The relative position of regional gainers is some-what different, however (see figure 7.3). Farmers inAustralia, Canada, and New Zealand gain the mostfrom global free trade in agriculture and food, withincome gains of 50–65 percent. Farmers in a num-ber of developing regions have gains of more than25 percent—Vietnam, Argentina, countries of theSouthern Africa Customs Union (SACU), the restof East Asia (which includes Thailand, Malaysia,and the Philippines), and the rest of Latin America.
The farmers who lose most are in China, withpotential losses of $75 billion in 2015 comparedwith the baseline scenario.13 The next biggest losersare farmers in Western Europe and the developedEast Asian economies—Japan, the Republic ofKorea, and Taiwan (China). In percentage terms thebiggest losses occur in Japan (30 percent) and West-ern Europe (24 percent), with China’s losses downto about 15 percent because of its huge ruraleconomy.
Most of the impact on rural incomes is gener-ated by volume changes, not factor returns. Both
labor and capital returns are determined essentiallyon national markets.14 Thus wage changes aremodest overall, with generally greater impactsin developing countries, where more labor isemployed in agriculture (table 7.7). For example,wages for unskilled labor increase 8 percent inArgentina and Vietnam, and 5–6 percent in the restof Latin America and the rest of Sub-SaharanAfrica. Unskilled workers in Australia and NewZealand also benefit from these reforms. Unskilledworkers in developing countries generally do betterin relative terms than skilled workers, largely as aresult of their concentration in agricultural sectors.China is a significant exception. Removal of itsagricultural protection lowers demand forunskilled workers, and their wages decline. Theimpact on wages in the European Union and Japanis negligible, as agriculture employs a very smallshare of the national labor force.
As in the labor markets, the returns in capitalmarket are determined mainly at the national level(table 7.8). Thus changes to income will largely bereflected in volume changes, not price changes.Direct payments to farmers, however, are imple-mented as an ad valorem subsidy on capital (and
Global Agricultural Reform: What Is at Stake? 125
FIGURE 7.3 Percentage Change in Rural Value Added from Baseline in 2015
�40 �20 0 20 40 60 80
JapanWestern Europe
Korea, Rep. of, and Taiwan (China)China
Rest of South AsiaIndia
Rest of Europe and Central AsiaRest of the world
IndonesiaMexicoTurkey
EU accession countriesUnited States
BrazilRest of Sub-Saharan Africa
Rest of Latin AmericaRest of East Asia
Southern African Customs UnionArgentina
VietnamCanada
Australia and New Zealand
Source: World Bank simulations with Linkage model, based on release 5.4 of the GTAP data.
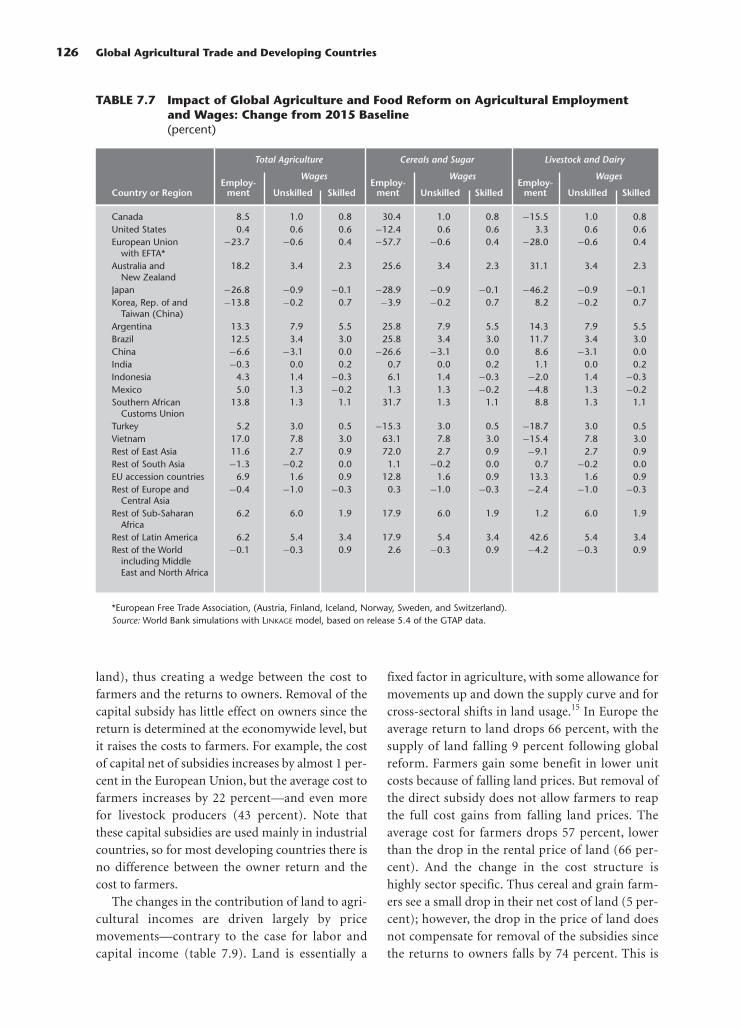
land), thus creating a wedge between the cost tofarmers and the returns to owners. Removal of thecapital subsidy has little effect on owners since thereturn is determined at the economywide level, butit raises the costs to farmers. For example, the costof capital net of subsidies increases by almost 1 per-cent in the European Union, but the average cost tofarmers increases by 22 percent—and even morefor livestock producers (43 percent). Note thatthese capital subsidies are used mainly in industrialcountries, so for most developing countries there isno difference between the owner return and thecost to farmers.
The changes in the contribution of land to agri-cultural incomes are driven largely by pricemovements—contrary to the case for labor andcapital income (table 7.9). Land is essentially a
fixed factor in agriculture, with some allowance formovements up and down the supply curve and forcross-sectoral shifts in land usage.15 In Europe theaverage return to land drops 66 percent, with thesupply of land falling 9 percent following globalreform. Farmers gain some benefit in lower unitcosts because of falling land prices. But removal ofthe direct subsidy does not allow farmers to reapthe full cost gains from falling land prices. Theaverage cost for farmers drops 57 percent, lowerthan the drop in the rental price of land (66 per-cent). And the change in the cost structure ishighly sector specific. Thus cereal and grain farm-ers see a small drop in their net cost of land (5 per-cent); however, the drop in the price of land doesnot compensate for removal of the subsidies sincethe returns to owners falls by 74 percent. This is
126 Global Agricultural Trade and Developing Countries
TABLE 7.7 Impact of Global Agriculture and Food Reform on Agricultural Employmentand Wages: Change from 2015 Baseline(percent)
Total Agriculture Cereals and Sugar Livestock and Dairy
Wages Wages WagesEmploy- Employ- Employ-
Country or Region ment Unskilled Skilled ment Unskilled Skilled ment Unskilled Skilled
Canada 8.5 1.0 0.8 30.4 1.0 0.8 −15.5 1.0 0.8United States 0.4 0.6 0.6 −12.4 0.6 0.6 3.3 0.6 0.6European Union −23.7 −0.6 0.4 −57.7 −0.6 0.4 −28.0 −0.6 0.4
with EFTA*Australia and 18.2 3.4 2.3 25.6 3.4 2.3 31.1 3.4 2.3
New ZealandJapan −26.8 −0.9 −0.1 −28.9 −0.9 −0.1 −46.2 −0.9 −0.1Korea, Rep. of and −13.8 −0.2 0.7 −3.9 −0.2 0.7 8.2 −0.2 0.7
Taiwan (China)Argentina 13.3 7.9 5.5 25.8 7.9 5.5 14.3 7.9 5.5Brazil 12.5 3.4 3.0 25.8 3.4 3.0 11.7 3.4 3.0China −6.6 −3.1 0.0 −26.6 −3.1 0.0 8.6 −3.1 0.0India −0.3 0.0 0.2 0.7 0.0 0.2 1.1 0.0 0.2Indonesia 4.3 1.4 −0.3 6.1 1.4 −0.3 −2.0 1.4 −0.3Mexico 5.0 1.3 −0.2 1.3 1.3 −0.2 −4.8 1.3 −0.2Southern African 13.8 1.3 1.1 31.7 1.3 1.1 8.8 1.3 1.1
Customs UnionTurkey 5.2 3.0 0.5 −15.3 3.0 0.5 −18.7 3.0 0.5Vietnam 17.0 7.8 3.0 63.1 7.8 3.0 −15.4 7.8 3.0Rest of East Asia 11.6 2.7 0.9 72.0 2.7 0.9 −9.1 2.7 0.9Rest of South Asia −1.3 −0.2 0.0 1.1 −0.2 0.0 0.7 −0.2 0.0EU accession countries 6.9 1.6 0.9 12.8 1.6 0.9 13.3 1.6 0.9Rest of Europe and −0.4 −1.0 −0.3 0.3 −1.0 −0.3 −2.4 −1.0 −0.3
Central AsiaRest of Sub-Saharan 6.2 6.0 1.9 17.9 6.0 1.9 1.2 6.0 1.9
AfricaRest of Latin America 6.2 5.4 3.4 17.9 5.4 3.4 42.6 5.4 3.4Rest of the World −0.1 −0.3 0.9 2.6 −0.3 0.9 −4.2 −0.3 0.9
including Middle East and North Africa
*European Free Trade Association, (Austria, Finland, Iceland, Norway, Sweden, and Switzerland).Source: World Bank simulations with LINKAGE model, based on release 5.4 of the GTAP data.

not the case in the livestock sector, where subsidypayments are linked to capital (the herds) and notto land. The impacts in the United States aremuted, with the overall return to landownerschanging slightly—a decline of 5 percent—butcosts to farmers increasing substantially—22 per-cent on average and more than 42 percent forcereal and sugar producers.
In most developing countries land pricesincrease substantially, except in China and in a fewother regions. This may reduce to some extentthe positive distributional impacts from relativelyhigher wages for unskilled labor since land owner-ship may not necessarily be congruent with theunskilled labor working the land. There are someinteresting sectoral shifts. For example, Chinawould see more land devoted to livestock and dairyand less to cereals, which would be imported fromlower-cost sources.
Sensitivity Analysis
This section uses sensitivity analysis to explore howresults change when some of the basic assumptionsof the model change. It focuses on four areas:
• The agricultural productivity assumptions ofthe standard baseline scenario. Agriculturalproductivity is cut by 1 percentage point indeveloping countries and the results from globalagriculture and food reform are compared withthe results using the default productivityassumptions. In a separate analysis, productivityis increased for middle-income developingcountries.
• The impacts of the mobility of agricultural capi-tal. Agricultural capital is more closely tied tothe sector, making it more difficult to shed andleading to a different transition when reform isundertaken.
Global Agricultural Reform: What Is at Stake? 127
TABLE 7.8 Impact of Global Agricultural and Food Trade Reform on AgriculturalCapital: Change from 2015 Baseline(percent)
Total Agriculture Grains and Sugar Livestock and Dairy
Owners’ Farmers’ Owners’ Farmers’ Owners’ Farmers’Country or Region Volume Return Cost Volume Return Cost Volume Return Cost
Canada −4.9 −0.5 4.1 7.2 −0.5 3.1 −17.0 −0.5 7.1United States 0.8 0.7 2.6 −19.2 0.7 2.6 4.5 0.7 6.5European Union with EFTA −32.9 0.7 21.8 −67.1 0.7 21.7 −29.2 0.8 43.1Australia and New Zealand 40.2 0.6 1.2 3.0 0.7 1.3 123.5 0.6 1.7Japan −22.9 1.7 4.9 −25.0 1.7 7.6 −47.0 1.7 12.2Korea, Rep. of and −4.3 0.7 12.0 8.9 0.8 15.4 17.5 0.8 103.8
Taiwan (China)Hong Kong (China) 9.8 0.7 0.7 75.4 0.7 0.7 −4.3 0.7 0.7
and SingaporeArgentina 6.0 4.2 4.2 9.0 4.2 4.2 17.9 4.2 4.2Brazil 10.1 3.1 3.1 21.9 3.1 3.1 9.8 3.1 3.1China −2.7 3.2 3.2 −17.5 3.2 3.2 5.8 3.2 3.2India 0.0 0.1 0.1 0.8 0.1 0.1 1.2 0.1 0.1Indonesia 0.7 −0.2 −0.2 1.0 −0.2 −0.2 −0.9 −0.2 −0.2Mexico 4.3 −0.1 3.7 2.3 −0.1 4.4 −7.5 −0.1 9.1Southern African 19.5 −0.6 −0.6 39.4 −0.6 −0.6 25.4 −0.6 −0.6
Customs UnionTurkey 0.2 −0.4 −0.2 −15.8 −0.4 0.5 −15.1 −0.4 −0.4Vietnam 2.4 1.8 1.8 28.7 1.8 1.8 −13.3 1.8 1.8Rest of East Asia 20.9 0.2 0.2 36.5 0.2 0.2 −8.6 0.2 0.2Rest of South Asia 0.1 1.3 1.3 2.3 1.3 1.3 0.7 1.2 1.2EU accession countries −0.2 0.5 21.6 7.7 0.5 18.9 −6.3 0.5 67.6Rest of Europe and −2.5 1.6 7.7 −1.9 1.6 8.3 −5.8 1.6 9.3
Central AsiaRest of Sub-Saharan Africa 0.5 −1.1 −1.1 5.6 −1.1 −1.1 4.0 −1.1 −1.1Rest of Latin America 6.2 1.8 1.8 15.9 1.8 1.8 41.1 1.8 1.8Rest of the World 0.3 −0.2 −0.2 2.9 −0.2 −0.2 −3.7 −0.2 −0.2
including Middle East and North Africa
Source: World Bank simulations with LINKAGE model, based on release 5.4 of the GTAP data.

• Sensitivity of the results to supply rigidities indeveloping countries.
• Sensitivity of the results to the key tradeelasticities.
Agricultural Productivity
Agricultural productivity is assumed to grow2.5 percent a year globally in the standard baselinescenario based on existing evidence (Martin andMitra 1996, 1999). This may be too optimistic fordeveloping countries, particularly for low-incomecountries. This assumption may have an impact onlong-term self-sufficiency rates, particularly of sen-sitive commodities. The more trade reform raisesthe world price of food, the more net foodimporters will be adversely affected by negativeterms-of-trade shocks. To test the sensitivity of thetrade results to agricultural productivity, a different
baseline was constructed with agricultural produc-tivity improving at a slower 1.5 percent for devel-oping countries, but remaining at 2.5 percent forindustrial countries.
Trade impact. Under the standard baseline, high-income countries go from a position of net foodimporters in 1997 to net food exporters in 2015(table 7.10). Low-income countries improve theirposition significantly, going from a positive foodbalance of $12.5 billion in 1997 to $23 billion in2015. The position of middle-income countriesdeteriorates, however. Under the low-productivitybaseline, the net food trade position of industrialcountries increases substantially—jumping to $151billion in 2015 compared with only $50 billion inthe standard baseline. Low-income countries stillmaintain a positive balance, but the balance ismuch closer to zero than it was in the previous
128 Global Agricultural Trade and Developing Countries
TABLE 7.9 Impact of Global Agriculture and Food Reform on Agricultural Land:Change from 2015 Baseline(percent)
Total Agriculture Cereals and Sugar Livestock and Dairy
Price Price Price
Country or Region Land Owner Farmer Land Owner Farmer Land Owner Farmer
Canada −6.4 69.5 133.8 6.6 76.9 192.8 −25.2 56.8 83.5United States 2.4 −5.1 22.1 −19.0 −12.5 42.1 12.3 −0.2 9.1European Union with EFTA −9.4 −66.3 −57.0 −58.9 −74.1 −4.7 −3.5 −65.0 −59.7Australia and New Zealand 6.2 197.8 219.1 1.9 197.0 224.0 34.8 219.6 252.4Japan −21.0 −44.9 −41.5 −24.0 −45.5 −34.6 −34.1 −48.9 −48.9Korea, Rep. of and −11.4 −27.6 −27.1 −0.2 −25.3 −24.6 4.1 −23.0 −20.9
Taiwan (China)Argentina 4.5 56.2 56.2 11.4 59.5 59.5 12.0 60.0 60.0Brazil 9.9 18.0 18.0 23.8 22.9 22.9 8.6 17.6 17.6China −0.9 −25.7 −25.7 −21.1 −31.1 −31.1 7.6 −23.6 −23.6India 0.0 −1.8 −1.8 0.8 −1.5 −1.5 1.4 −1.3 −1.3Indonesia 0.7 10.9 10.9 2.1 11.4 11.4 −1.8 10.0 10.0Mexico 2.7 0.6 13.1 −8.9 −3.6 52.1 −1.6 −0.6 0.8Southern African 8.0 86.4 86.4 26.4 95.2 95.2 4.5 84.9 84.9
Customs UnionTurkey 0.8 47.3 47.3 −14.9 39.0 39.0 −20.2 36.1 36.1Vietnam −0.3 44.6 44.6 33.2 60.3 60.3 −16.0 38.1 38.1Rest of East Asia −1.5 34.1 34.1 43.7 53.8 53.8 −9.6 32.7 32.7Rest of South Asia −0.1 −6.0 −6.0 3.2 −5.0 −5.0 1.3 −5.4 −5.4EU accession countries 2.6 2.0 6.1 4.6 2.8 10.8 7.5 3.5 8.8Rest of Europe and −1.5 −2.4 −2.4 −1.1 −2.3 −2.3 −1.2 −2.2 −2.2
Central AsiaRest of Sub-Saharan Africa −0.3 62.8 62.8 9.0 67.9 67.9 −2.4 61.7 61.7Rest of Latin America 1.0 55.4 55.4 5.0 58.6 58.6 40.3 74.9 74.9Rest of the World 0.0 0.1 0.1 2.7 0.8 0.8 −4.3 −1.2 −1.2
including Middle East and North Africa
Source: World Bank simulations with LINKAGE model, based on release 5.4 of the GTAP data.
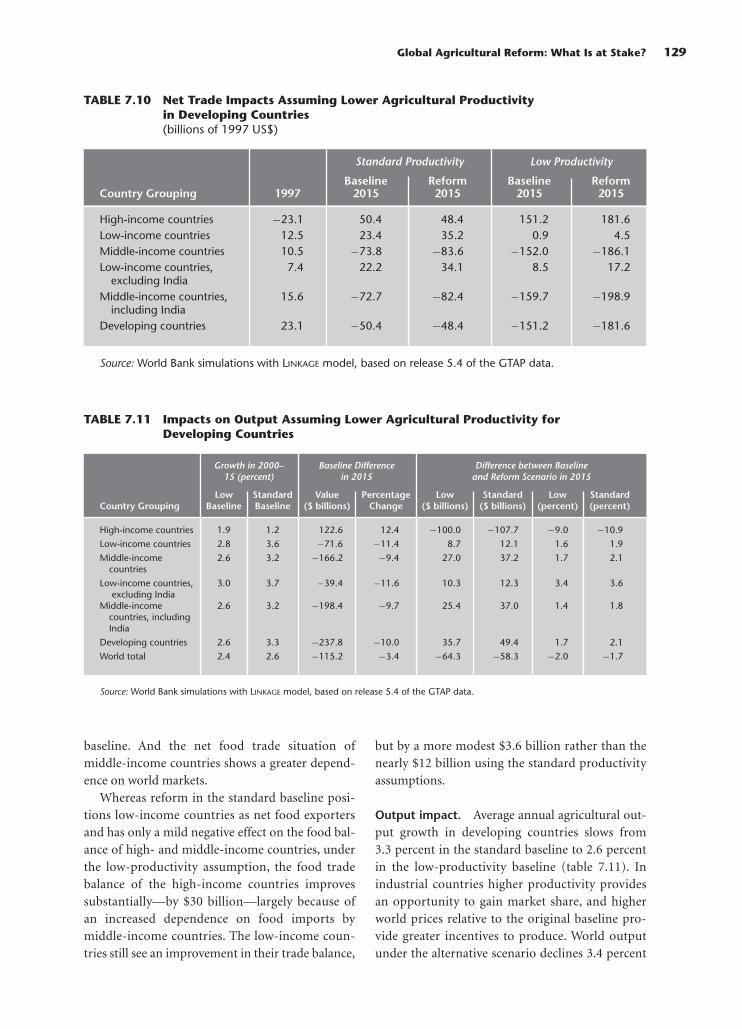
baseline. And the net food trade situation ofmiddle-income countries shows a greater depend-ence on world markets.
Whereas reform in the standard baseline posi-tions low-income countries as net food exportersand has only a mild negative effect on the food bal-ance of high- and middle-income countries, underthe low-productivity assumption, the food tradebalance of the high-income countries improvessubstantially—by $30 billion—largely because ofan increased dependence on food imports bymiddle-income countries. The low-income coun-tries still see an improvement in their trade balance,
but by a more modest $3.6 billion rather than thenearly $12 billion using the standard productivityassumptions.
Output impact. Average annual agricultural out-put growth in developing countries slows from3.3 percent in the standard baseline to 2.6 percentin the low-productivity baseline (table 7.11). Inindustrial countries higher productivity providesan opportunity to gain market share, and higherworld prices relative to the original baseline pro-vide greater incentives to produce. World outputunder the alternative scenario declines 3.4 percent
Global Agricultural Reform: What Is at Stake? 129
TABLE 7.10 Net Trade Impacts Assuming Lower Agricultural Productivity in Developing Countries(billions of 1997 US$)
Standard Productivity Low Productivity
Baseline Reform Baseline ReformCountry Grouping 1997 2015 2015 2015 2015
High-income countries −23.1 50.4 48.4 151.2 181.6Low-income countries 12.5 23.4 35.2 0.9 4.5Middle-income countries 10.5 −73.8 −83.6 −152.0 −186.1Low-income countries, 7.4 22.2 34.1 8.5 17.2
excluding IndiaMiddle-income countries, 15.6 −72.7 −82.4 −159.7 −198.9
including IndiaDeveloping countries 23.1 −50.4 −48.4 −151.2 −181.6
Source: World Bank simulations with LINKAGE model, based on release 5.4 of the GTAP data.
TABLE 7.11 Impacts on Output Assuming Lower Agricultural Productivity forDeveloping Countries
Growth in 2000– Baseline Difference Difference between Baseline15 (percent) in 2015 and Reform Scenario in 2015
Low Standard Value Percentage Low Standard Low StandardCountry Grouping Baseline Baseline ($ billions) Change ($ billions) ($ billions) (percent) (percent)
High-income countries 1.9 1.2 122.6 12.4 −100.0 −107.7 −9.0 −10.9
Low-income countries 2.8 3.6 −71.6 −11.4 8.7 12.1 1.6 1.9
Middle-income 2.6 3.2 −166.2 −9.4 27.0 37.2 1.7 2.1countries
Low-income countries, 3.0 3.7 −39.4 −11.6 10.3 12.3 3.4 3.6excluding India
Middle-income 2.6 3.2 −198.4 −9.7 25.4 37.0 1.4 1.8countries, including India
Developing countries 2.6 3.3 −237.8 −10.0 35.7 49.4 1.7 2.1
World total 2.4 2.6 −115.2 −3.4 −64.3 −58.3 −2.0 −1.7
Source: World Bank simulations with LINKAGE model, based on release 5.4 of the GTAP data.

(higher prices lead to reduced demand), with areallocation between industrial and developingcountries. Industrial countries benefit from a12 percent increase in output in 2015 comparedwith the standard baseline, whereas developingcountry output is reduced by some 10 percent.
With respect to output impacts following thetrade reform scenario, the qualitative results of thedifferent baseline assumptions of agricultural pro-ductivity are identical—trade reform of agricultureand food lead to a shift in agricultural productionfrom industrial to developing countries. In thestandard baseline, developing-country agriculturaloutput increases more than 2 percent, whereas inthe low-productivity baseline the increase is only1.7 percent. The decline in industrial countriesdrops to 9 percent, from 11 percent in the standardbaseline. The changes in output patterns acrossregions are identical, although the magnitudesdiffer.
Aggregate welfare. The change in the agricul-tural productivity assumption translates into mod-est changes in aggregate welfare (figure 7.4). Indus-trial countries see an improvement of $18 billion in2015, a jump in gains of some 0.05 percentagepoint. Developing countries see a reduction in theirwelfare gains, with low-income countries seeing a
drop of $1.4 billion (0.08 percentage point) andmiddle-income countries a drop of $17.8 billion(0.19 percentage point).
A high-productivity assumption. Many middle-income countries such as Argentina, Brazil, andThailand have experienced rapid growth in agricul-ture, suggesting the potential for higher productiv-ity growth than assumed in the standard baseline.To explore this, agricultural productivity growthwas raised from 2.5 percent to 4.0 percent formiddle-income countries (China, India, Indonesia,rest of East Asia, Vietnam, Argentina, Brazil, Mexico,rest of Latin America, the EU accession countries,rest of Europe and Central Asia, and Turkey).
Changes are as expected. Agricultural supplyand exports expand for natural exporters such asArgentina and Brazil. China, the largest middle-income importer, reduces its deficit by about$18 billion (table 7.12). The middle-income groupincluding India experiences a net surplus of $30 bil-lion in 2015, whereas under the standard baseline ithas a deficit of $19 billion. High-income countriesexperience a deterioration of their net agriculturaltrade of about $50 billion, compared with $3 billionin the standard baseline, and Europe’s deficitincreases to nearly $60 billion. Results for the foodsector are qualitatively similar, but smaller in size,
130 Global Agricultural Trade and Developing Countries
FIGURE 7.4 Welfare Impacts of Productivity Changes
0
20
60
40
80
120
100
160
140
180
$ billion
High-income
Low-income
Middle-income
0.0
0.2
0.6
0.4
0.8
1.2
1.0
1.4
Percent
High-income
Low-income
Middle-income
Low productivity Default productivity
Source: World Bank simulations with Linkage model, based on release 5.4 of the GTAP data.

with an increase in competitiveness of food pro-cessing in middle-income countries and a decreasein net trade by high-income countries relative tothe standard baseline (table 7.13). These largechanges show how sensitive baseline trajectoriesare to changes in assumptions about the future.They do not, however, affect the impact of thereform scenario measured in deviations fromthe baseline.
In conclusion, the baseline assumptions regard-ing productivity are important, although changes inthe assumption would not yield substantially differ-ent results from agriculture and food trade reformfor developing countries in terms of net benefitsand agricultural output.16 However, lower produc-tivity will reduce the level of food self-sufficiency
among developing countries—particularly middle-income countries—and could lead to a differentassessment of the direction of food self-sufficiencyin the aftermath of reform.
Mobility of Agricultural Capital and the Transitionin Industrial Countries
The focus so far has been mainly on the long-termimpact of the removal of protection, with littleattention to the transitional impacts. A key mecha-nism of the model is the vintage structure of capi-tal. Sectors in decline have excess capital that willnot readily be used in other sectors. This is certainlythe case with agricultural capital, although somecould be used for nonagricultural purposes, and
Global Agricultural Reform: What Is at Stake? 131
TABLE 7.12 Baseline Trends in Agriculture with Higher Agricultural Productivity inMiddle-Income Countries
Average Annual Growth, 2000–15 (percent) Net Trade (billions of 1997 US$)
Country Grouping Output Demand Imports Exports 2000 2015
High-income countries 0.6 1.0 2.7 0.9 −24.3 −50.2Low-income countries 3.9 3.8 4.0 6.2 9.9 25.2Middle-income countries 3.7 3.6 7.5 7.2 14.4 24.9Low-income countries, 3.8 3.5 4.0 6.2 7.2 19.1
excluding IndiaMiddle-income countries, 3.7 3.7 7.4 7.1 17.1 31.1
including IndiaDeveloping countries 3.7 3.7 7.0 7.0 24.3 50.2
Note: Net trade is measured at f.o.b. prices (imports exclude international trade and transport margins).Source: World Bank simulations with LINKAGE model, based on release 5.4 of the GTAP data.
TABLE 7.13 Baseline Trends in Food Processing with Higher AgriculturalProductivity in Middle-Income Countries
Average Annual Growth, 2000–15 (percent) Net Trade (billions of 1997 US$)
Country Grouping Output Demand Imports Exports 2000 2015
High-income countries 1.1 1.0 1.4 2.0 7.7 36.2Low-income countries 3.5 3.5 3.6 3.2 3.6 4.4Middle-income countries 3.1 3.3 4.1 2.6 −11.3 −40.6Low-income countries, 3.2 3.3 3.7 2.2 1.8 −0.1
excluding IndiaMiddle-income countries, 3.1 3.3 4.1 2.8 −9.5 −36.2
including IndiaDeveloping countries 3.2 3.3 4.1 2.7 −7.7 −36.2
Note: Net trade is measured at f.o.b. prices (imports exclude international trade and transport margins).Source: World Bank simulations with LINKAGE model, based on release 5.4 of the GTAP data.

other equipment could be used in nonprotectedagricultural sectors.
Excess capital is released to other sectors follow-ing an upward-sloping supply curve. The value forthe supply elasticity in the standard model is 4. Totest the importance of this elasticity, the reform sce-nario is simulated again, but with a supply elasticityof 0.5. This makes excess supply much less mobileand, all else equal, will tend to increase supply rela-tive to the same simulation with a higher supplyelasticity.
Consider the case for the sugar sector in Europe.The starting point is 2004, since the trade reformstarts in 2005. Under the baseline, sugar output inEurope increases modestly between 2004 and 2015(figure 7.5). With the start of reform, output dropsrapidly, and by 2015 output has fallen from about$42 billion to about $11 billion. The supply elastic-ity has an impact on the rate of decline of sugaroutput, but the final level is more or less identical.Thus with a low supply elasticity, the transition isdrawn out over a longer period. The rate of declinebetween 2004 and 2010 is 18.4 percent using thestandard elasticity and 16.5 percent with the lowerelasticity.
There are only a handful of sectors in industrialcountries where the supply elasticity has anynoticeable impact: wheat and sugar in the UnitedStates; rice, wheat, other grains, oil seeds, and sugarin the European Union; and wheat and oil seeds inJapan. The aggregate impacts on agriculturalproduction are negligible, at less than 1 percent
over all industrial countries in any given year, andat most 0.3 percent for developing countries, but inthe opposite direction. There are no discernibleimpacts on welfare.
In conclusion, lowering the supply elasticity willdraw out the supply response during the transitionphase but will have no discernible long-termimpact on the results.
Supply Response in the Low-Income Countries
This section evaluates the impact of lowering theland supply response in three regions—rest ofSouth Asia, the Southern Africa Customs Unionregion, and the rest of Sub-Saharan Africa—toexamine whether low-income countries, with theirpotentially low supply response, will benefit fromgreater market access. This involves three param-eters. First, the base year land supply elasticity wasreduced from 1 to 0.25. Second, the land supplyasymptote was reduced from 20 percent of the ini-tial land supply to 10 percent.17 These two param-eters determine aggregate land supply. A thirdparameter moderates the degree of land mobilityacross sectors. The allocation of land across sectorsis governed by a constant elasticity of transforma-tion function.18 The standard transformation elas-ticity is 3, a relatively elastic value. In the sensitivitysimulation, the transformation elasticity for thethree regions is set to 0.5.
The lower land supply elasticities affect the base-line scenario. For the three regions where changes
132 Global Agricultural Trade and Developing Countries
FIGURE 7.5 Sugar Output in Europe(US$ billions)
0
10
5
15
20
25
35
45
30
40
2004 200720062005 2008 2009 2010 2011 2012 2013 2014 2015
$ billion
Baseline
Standard supplyelasticity
Low supplyelasticity
Source: World Bank simulations with Linkage model, based on release 5.4 of the GTAP data.
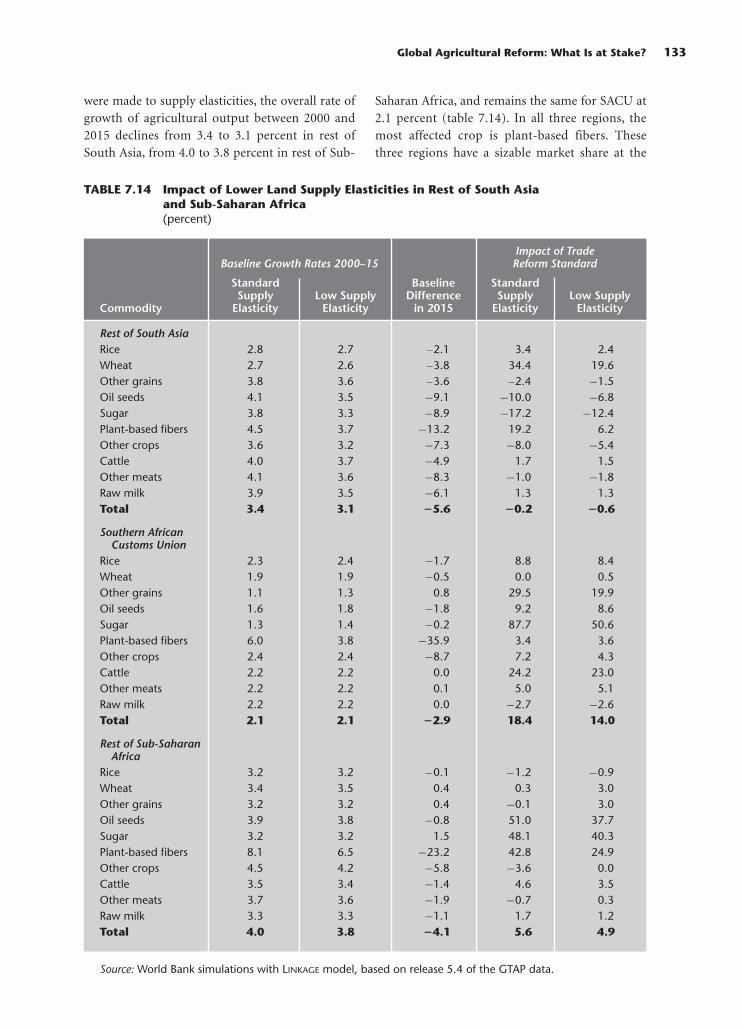
were made to supply elasticities, the overall rate ofgrowth of agricultural output between 2000 and2015 declines from 3.4 to 3.1 percent in rest ofSouth Asia, from 4.0 to 3.8 percent in rest of Sub-
Saharan Africa, and remains the same for SACU at2.1 percent (table 7.14). In all three regions, themost affected crop is plant-based fibers. Thesethree regions have a sizable market share at the
Global Agricultural Reform: What Is at Stake? 133
TABLE 7.14 Impact of Lower Land Supply Elasticities in Rest of South Asiaand Sub-Saharan Africa(percent)
Impact of Trade Baseline Growth Rates 2000–15 Reform Standard
Standard Baseline StandardSupply Low Supply Difference Supply Low Supply
Commodity Elasticity Elasticity in 2015 Elasticity Elasticity
Rest of South AsiaRice 2.8 2.7 −2.1 3.4 2.4Wheat 2.7 2.6 −3.8 34.4 19.6Other grains 3.8 3.6 −3.6 −2.4 −1.5Oil seeds 4.1 3.5 −9.1 −10.0 −6.8Sugar 3.8 3.3 −8.9 −17.2 −12.4Plant-based fibers 4.5 3.7 −13.2 19.2 6.2Other crops 3.6 3.2 −7.3 −8.0 −5.4Cattle 4.0 3.7 −4.9 1.7 1.5Other meats 4.1 3.6 −8.3 −1.0 −1.8Raw milk 3.9 3.5 −6.1 1.3 1.3Total 3.4 3.1 �5.6 �0.2 �0.6
Southern African Customs Union
Rice 2.3 2.4 −1.7 8.8 8.4Wheat 1.9 1.9 −0.5 0.0 0.5Other grains 1.1 1.3 0.8 29.5 19.9Oil seeds 1.6 1.8 −1.8 9.2 8.6Sugar 1.3 1.4 −0.2 87.7 50.6Plant-based fibers 6.0 3.8 −35.9 3.4 3.6Other crops 2.4 2.4 −8.7 7.2 4.3Cattle 2.2 2.2 0.0 24.2 23.0Other meats 2.2 2.2 0.1 5.0 5.1Raw milk 2.2 2.2 0.0 −2.7 −2.6Total 2.1 2.1 �2.9 18.4 14.0
Rest of Sub-Saharan Africa
Rice 3.2 3.2 −0.1 −1.2 −0.9Wheat 3.4 3.5 0.4 0.3 3.0Other grains 3.2 3.2 0.4 −0.1 3.0Oil seeds 3.9 3.8 −0.8 51.0 37.7Sugar 3.2 3.2 1.5 48.1 40.3Plant-based fibers 8.1 6.5 −23.2 42.8 24.9Other crops 4.5 4.2 −5.8 −3.6 0.0Cattle 3.5 3.4 −1.4 4.6 3.5Other meats 3.7 3.6 −1.9 −0.7 0.3Raw milk 3.3 3.3 −1.1 1.7 1.2Total 4.0 3.8 �4.1 5.6 4.9
Source: World Bank simulations with LINKAGE model, based on release 5.4 of the GTAP data.

global level in 1997 of 11.4 percent for plant-basedfibers and 15 percent for rice. The demand for rice,however, is much less elastic than for plant-basedfibers. The lower supply elasticity would make landrelatively more costly, all else equal, and given thehigher demand elasticities, the higher land priceswill be reflected in lower demand from these threeregions.
The impact of trade reform on agricultural out-put using both the standard and the lower landelasticities is broadly the same qualitatively,although lower in magnitude in general. Considersugar again. Output increases 88 percent in SACUand 48 percent in the rest of Sub-Saharan Africausing the standard supply elasticity. Sugar outputexpansion drops to 51 percent in SACU and 40 per-cent in the rest of Sub-Saharan Africa when lowerland supply elasticity is assumed.
The welfare impacts are modest, but measura-ble, and the results reflect only some of the possiblesupply constraints in low-income countries. Forthe three regions under question, aggregate welfarewould decline $1.1 billion compared with the stan-dard assumption and would drop from 1.2 percentto 1.1 percent of baseline income.
Trade Elasticities
The most critical parameter in trade reform scenar-ios is trade elasticities. There is ongoing debateabout their size. Most econometric evidence sug-gests that the Armington elasticities (measuring thedegree of substitutability between domestic andimported goods) are low, in the range of 1 to 2.19
The studies are riddled with data problems—particularly the evaluation of unit values—andmany trade economists downplay the empiricalevidence, for two main reasons. First, low Arming-ton elasticities lead to implausible terms-of-tradeeffects. And second, low elasticities would suggesthigh optimal tariffs. Trade studies fall into threegroups—those with relatively low elasticities (1–3),those with middling elasticities (3–6), and thosewith very high elasticities (20–40). Examples of thefirst are the MONASH model (Dixon and Rimmer2002) and the standard GTAP model (Hertel 1996).Recent World Bank work has been using the mid-dling elasticities. High elasticities are mainly associ-ated with the work of Harrison, Rutherford, andTarr (for example, see Harrison, Rutherford, andTarr 2003).
The impacts of the agriculture and food tradereform were reassessed using two alternative elastic-ities. A low scenario uses trade elasticities 50 percentlower than the standard, and a high scenario usestrade elasticities 50 percent higher than the stan-dard (the standard values used in this study areshown in table A3 on the CD-ROM). Each set ofassumptions requires two simulation runs. A newbaseline is constructed each time—with all assump-tions identical except for the trade elasticities—andthe reform scenario is simulated. Thus the compar-isons are between each individual baseline and eachassociated reform scenario.
Within this range of trade elasticities the modelexhibits some modest nonlinearity, particularly onthe upside (figure 7.6). For all three regions the50 percent higher elasticities lead to a greater than50 percent rise in real income gains—particularlyfor developing regions, where the rise is almost75 percent. On the downside, both high- and low-income regions see an equiproportionate fall in thereal income gains relative to the elasticities, with afall to 40 percent of the standard gains in the case ofthe middle-income countries. The higher elastici-ties dampen the adverse terms-of-trade shocksfrom reforms, leading to the higher income gains.The global gains vary from a low of $126 billion toa high of $438 billion, with the gains at $265 billionusing the standard elasticities.
For some countries and regions the range ofresults is much broader than at the aggregate level.For example, Mexico would lose some $1.2 billionwith the low elasticities and gain $3 billion with thehigh elasticities compared with a gain of 0.9 withthe standard elasticities. Several other regions showsimilar variation. The standard deviation of theindex across all developing countries is 130 in thecase of the high elasticities, whereas the weightedaverage is 170.
The impacts on trade are similar to the impacts onincome but exhibit more nonlinearity (figure 7.7).At the global level, exports increase 80 percentusing the high elasticities and decline 60 percentusing the low elasticities (with export increasesranging from a low of $216 billion to nearly $1 tril-lion). There is also less variability across regions ofthe model than with the income results. In isolationthe trade elasticities appear to have the greatestimpact in determining the overall outcomes oftrade reform, although other model changes—bothin specification and in elasticities—combined may
134 Global Agricultural Trade and Developing Countries

be at least as important in determining overall out-comes. This is an area of active research to betterdetermine the bounds on the possible ranges forthese elasticities. Better data would help, but thereare still issues relating to model specification andaggregation that need to be thought through.
Conclusions
This quantitative assessment of the impact of agri-cultural and food market distortions on incomes,welfare, trade, and output shows that the changes incross-regional patterns of output and trade tend to
be much larger than the more familiar gains to realincome. A decomposition of the aggregate resultsacross policy instruments and regions shows thatreforms in agriculture and food account for a largeshare of the global gains of reforms of total mer-chandise trade. This result is driven by the relativelylow protection levels in manufacturing sectors.Another major finding is that developing countrieshave more to gain from reforming their own sup-port policies than from reforms in high-incomecountries. Symmetrically, high-income countrieswould experience larger welfare gains from theirown reforms than from developing countries’
Global Agricultural Reform: What Is at Stake? 135
FIGURE 7.6 Real Income and Trade Elasticities
Index relative to default elasticities in 2015
Low Default High
200
175
0
25
50
75
100
150
125
High-income Low-income Middle-income
Source: World Bank simulations with Linkage model, based on release 5.4 of the GTAP data.
FIGURE 7.7 Exports and Trade Elasticities
0
25
50
75
100
150
200
175
125
High-income Low-income Middle-income
Index relative to default elasticities in 2015
Low Default High
Source: World Bank simulations with Linkage model, based on release 5.4 of the GTAP data.

reforms. These dimensions of the debate are oftenoverlooked but are crucial. Global reform leads toadditive results with aggregate gains close to thegains from reforms in each group. A third key find-ing is that agricultural reform alone in high-income countries would create moderate gains,about 10 times smaller than those of a combinedreform of food and agricultural markets. Develop-ing countries would be negatively affected as agroup, because their own distortions would beexacerbated by the agricultural reforms in high-income countries.
The results are broadly robust to changingassumptions on future agricultural productivity indeveloping countries, supply constraints, and levelof the trade elasticities, but the levels of the tradeelasticities remain of foremost importance. Thetrade effects of reforms are also sensitive toassumptions about agricultural productivity gainsin developing countries. Assuming low productiv-ity gains leads to a reversal in the estimated impactof global liberalization for industrial countries,increasing their net food trade surplus as middle-income countries become much larger importersof food and agricultural products. Low-incomecountries experience an increase in net food tradesurplus that is much smaller than under the higherproductivity assumption. Hence, variations in pro-ductivity could lead to a different assessment of thedirection of food self-sufficiency after reform.Supply constraints do not qualitatively affect theestimated impact of trade reform on agriculturaloutput, although estimated changes tend to besmaller. Higher trade elasticities dampen theadverse terms-of-trade shocks from reforms, lead-ing to higher income gains. The global gains varyfrom a low of $126 billion with low elasticities to ahigh of $438 billion with high elasticities, with thegains at $265 billion using the standard elasticities.There is also higher variation at the individualcountry level.
The changes in agricultural value added and fac-tor prices are considerable in several cases. The esti-mated loss of rural value-added is large in Japanand the European Union, the Republic of Korea,Taiwan (China), and China. Thus, considerableadjustment and displacement of resources wouldtake place to reflect these changes. Cairns Groupcountries and the United States experience sizable
gains in rural value-added as do SACU and the restof Sub-Saharan Africa. Wages for unskilled labor indeveloping countries are moderately influenced bymajor policy reforms such as in China, where theydecrease, but more significantly in Argentina,where they increase.
Notes
1. The model is based at the World Bank and uses the GTAPrelease 5.4 dataset (see van der Mensbrugghe 2003 for details).The details of the modeling and the results are given in theattached CD-ROM.
2. East Asia is divided into four economies—China,Indonesia, Vietnam, and the rest. South Asia has two compo-nents—India and the rest. Latin America has four economies—Argentina, Brazil, Mexico, and the rest. Europe and Central Asiais split into three components—the European Union accessioncountries, Turkey, and the rest. Sub-Saharan Africa has twocomponents—the Southern African Customs Union countriesand the rest, and the Rest of the World region has all other coun-tries including those in the Middle East and North Africa.
3. Agricultural policies derived from the Agricultural MarketAccess Database (AMAD) reflect 1998–99 levels of support,except for cotton, for which International Cotton AdvisoryCommittee data were used (see chapter 14 in this volume).
4. Income elasticities are held more or less constant over thetime horizon. With China’s rapid growth, one might anticipate aconvergence of income elasticities toward levels in higher-income countries and thus a dampening of food growth overtime relative to incomes.
5. Textile and apparel quotas that generate quota rents forexporters are converted to export taxes (for the country of ori-gin). In the current simulations, these have not been eliminated.
6. Technically, it is a measure of the Hicksian equivalentvariation. When comparing aggregate welfare measures acrossstudies, it is important to convert them to similar scales. Thus$350 billion in 2015 is more or less equivalent to $250 billion in2004 and $200 billion in 1997—assuming an average annualglobal growth rate of 3 percent in gross domestic product (all in1997 US$, the base year of release 5 of the GTAP data set).Assuming a world inflation rate of 2.5 percent over the entireperiod, the measured $250 billion in 2004 in 1997 dollarsbecomes $300 billion in 2004 dollars.
7. The Mercosur preferential agreement is not incorporatedin the standard GTAP dataset but is included in the dataset usedfor these simulations. Efforts were made to minimize distortionsto the original social accounting matrix (SAM) while adjustingthe original dataset.
8. There is also an issue regarding whether bound or appliedtariffs are liberalized. Most developing countries have boundtheir tariffs at rates much higher than applied rates. Negotiationsconcern the bound tariffs; the reforms described here are relativeto the applied tariffs. For a full reform scenario, it is not much ofan issue, but for analyzing potential outcomes of a negotiation, itcould be.
9. See Global Economic Prospects 2002 and 2004 (World Bank2001, 2003). The 2002 report notes dynamic gains of $830billion compared with static gains of $350 billion, with a rangeof up to $1,340 billion depending on some key parameters(table 6.2, page 100).
136 Global Agricultural Trade and Developing Countries

10. Figure 7.1 shows output shares in the base year. Onewould assume that the agricultural and food shares are decliningover time as income elasticities for food tend to be lower thanfor other goods and services.
11. While the model is highly nonlinear, the results to a closeapproximation are relatively additive.
12. Nominal values are measured with respect to the model’snuméraire—the average export price of manufactured exportsfrom industrial countries.
13. This should be considered an upper bound on China’spotential loss since the baseline scenario does not include theimpacts of China’s accession to the WTO. Thus the reform sce-nario is capturing the combined gains from global reform andChina’s WTO accession, which include the gains to be had fromreforming from 1998–99 base agricultural policies.
14. Sector-specific capital returns may be possible during thetransition phase, as sectors in decline shed unwanted capital.The most mobile equipment will be shed first, and the return tothe remaining capital may be priced lower than the national rateof return to capital.
15. In the default version of the model, cross-sectoral trans-formation elasticities are set to 3. Thus a 10 percent rise in thereturn in one sector (relative to the others) will lead to a 30 per-cent shift of land into that sector. Because of the finite transfor-mation elasticity, land prices are sector specific.
16. Given the aggregate nature of the model, the impacts onvulnerable countries or sectors are harder to assess. In particular,Sub-Saharan Africa is a heterogeneous subcontinent that is notreflected in the level of aggregation of this study.
17. The land supply function is governed by a logistic curve.It is calibrated in the base year to an exogenously given elasticityand the value of the asymptote relative to the base supply level.Thus if the asymptote is set to 1.2, land supply can increase by atmost 20 percent above its base level.
18. The elasticity measures the ease of shifting land from oneactivity to another when the relative price of these two activitieschanges.
19. More recent econometric work is resulting in higher esti-mates for the trade elasticities, and these are now being reflectedin the forthcoming release of the GTAP dataset.
References
Dixon, P. B., and M. T. Rimmer. 2002. Dynamic, General Equilib-rium Modelling for Forecasting and Policy: A Practical Guideand Documentation of MONASH. Boston: North-Holland.
Harrison, G. W., T. F. Rutherford, and D. Tarr. 2003. “TradeLiberalization, Poverty and Efficient Equity.” Journal ofDevelopment Economics 71(1): 97–128.
Hertel, T. W. 1996. Global Trade Analysis: Modeling and Applica-tions. Cambridge, U.K.: Cambridge University Press.
Martin, W., and D. Mitra. 1996. “Productivity Growth inAgriculture and Manufacturing.” World Bank, InternationalEconomics Department, Washington, D.C.
———. 1999. “Productivity Growth and Convergence inAgriculture and Manufacturing.” Country EconomicsDepartment Working Paper 2171. World Bank, Washington,D.C.
van der Mensbrugghe, D. 2003. “LINKAGE Technical ReferenceDocument.” Working Paper. World Bank, EconomicProspect Group, Washington, D.C.
World Bank. 2001. Global Economic Prospects and the DevelopingCountries 2002: Making Trade Work for the Poor. Washington,D.C.: World Bank.
———. 2003. Global Economic Prospects 2004: Realizing theDevelopment Promise of the Doha Agenda. Washington, D.C.:World Bank.
Global Agricultural Reform: What Is at Stake? 137


Part II
The CommodityStudies

fallen from 2.5 million tons to 1.5 million tons overthe past two decades. Thus, the three largestmarkets for sugar imports in the 1970s have beenclosing to competition after becoming largely self-sufficient, at least compared with the early 1970s,when their combined net imports accounted forhalf of the world’s exports (figure 8.1).
Background
Sugar occurs naturally in most foods, but it is eco-nomically extracted from only a few crops such assugar beets, sugar cane, and corn. Sugar beets are anannual root crop grown in temperate climates,while sugar cane is a tall perennial grass grown intropical and semitropical climates. About 55 coun-tries grow sugar beets, and 105 grow sugar cane.The process of producing sugar (sucrose) fromsugar beets or sugar cane requires that the juice beextracted and processed in a factory near where thebeet or cane is grown. The by-products of sugarcane are bagasse and molasses. Bagasse is theresidue of cane, after the juice is extracted. It hassome industrial uses and is often used to fuel the
Sugar protection dates back to at least the 1800s. Ithas been greatest in countries of the northern hemi-sphere that produce sugar beets. That is becausesugar from beets is nearly twice as expensive to pro-duce as sugar from cane, and most beet producerscannot survive without high protection. Over theyears, high protection has led to lower consump-tion, reduced imports, and surplus production,which is disposed of in the world market atsubsidized prices. Many other countries have beenpressured by their producers for protection fromheavily subsidized exports and depressed worldmarket prices. The cycle of protection, subsidies,and more protection has run for decades.
The European Union (EU), Japan, and theUnited States are among the areas with the highestlevel of protection and therefore the most distortedimport patterns. Since the early 1970s, U.S. sugarimports have declined from more than 5 milliontons per year to slightly more than 1 million tonsper year. The European Union was a net importerof about 2.5 million tons of sugar in the early1970s, compared with net exports of about 5 mil-lion tons in recent years. Japan’s sugar imports have
141
8
SUGAR POLICIES: AN OPPORTUNITY
FOR CHANGE
Donald O. Mitchell
The author wishes to express thanks for useful comments to Ataman Aksoy, John Beghin, Margaret Blamberg,Uri Dadush, Harry de Gorter, Stephen Haley, Steven Jaffee, Will Martin, John Nash, and Albert Viton.

142 Global Agricultural Trade and Developing Countries
boilers in the sugar factory (also called a sugar mill).Molasses is an edible by-product as well as an ani-mal feed. The by-products of sugar beets are beettops, the leafy portion of the beet used for animalfeed, and molasses, which is also used primarily asan animal feed. Once harvested, sugar cane ishighly perishable and must be processed quickly.Sugar beets are less perishable than sugar cane butstill must be processed soon after harvest. The highcost of transporting sugar beets or cane makes itimpractical to locate the factory far from the pro-ducing areas.
Sugar growers and processors are economicallyinterdependent and normally share in the value oftotal sugar and molasses sales according to a con-tractual agreement. Both can influence the value oftotal output since the volume and sugar content ofsugar beets or cane is affected by input use and pro-duction practices, and the recovery of sugar frombeets or cane is dependent on the technology andoperation of the sugar factory. Various ownershiparrangements exist in the industry—ranging fromownership by a single company of the factory andproducing lands to independent growers who con-tract production with a factory. Some growers aremembers of cooperatives, which own and operate asugar factory. State ownership of factories and landsis still common in developing countries, but sub-stantial privatization has taken place in recent years.
Common sugar is sucrose. It is extracted innearly pure, chemically identical form from sugar
cane and sugar beets. Dextrose is a sugar derivedsynthetically from starch (most commonly cornstarch). Fructose is a very sweet sugar derived fromdextrose. High-fructose corn syrup (HFCS) is pro-duced by the enzymatic conversion to fructose of aportion of the dextrose in corn syrup. It is chemi-cally similar to sugar used in soft drinks, which is amixture of equal parts of dextrose and fructose.The fact that identical or nearly identical sugars canbe produced from different crops provides produc-ers and consumers with a wide range of substitu-tion possibilities. It also means, however, that sugarpolicies are often complex, as the different indus-tries vie for support. For example, sugar producersin the European Union have been able to get legis-lated quotas on HFCS production. Japan also limitsHFCS production to prevent it from further erod-ing sugar’s market share. In the United States,HFCS producers benefit from high sugar prices andsupport current sugar policies.
High protection has led to the emergence ofHFCS as a substitute for sugar in the United Statesand Japan. Because it is a nearly perfect substitutefor sugar in uses such as soft drinks, HFCS andother corn syrups now account for 40 percent ofcaloric-sweetener use in Japan and more than halfof U.S. caloric sweetener consumption (figure 8.2).The technique for commercial production of high-fructose corn syrup was discovered in the late 1960sand made profitable by high sugar prices in theprotected Japanese and U.S. markets. But now,
FIGURE 8.1 World Sugar Exports and Net Imports of Selected Countries(million of tons)
�10
10
0
20
30
40
50
1965 1970 1975 1980 1985 1990 1995 2000
World exports
Net imports of European Union, Japan, andUnited States
Million metric tons
Source: FAOSTAT.

economies of scale, improvements in productiontechniques, and large installed production capacity(financed under high prices), have made cornsyrups competitive with sugar from cane and lesscostly than sugar from beets.
Another product that can be produced fromsugar beets, sugar cane, and corn (and some othercrops) is ethanol—a clear colorless, flammable,oxygenated hydrocarbon that can be used for anumber of purposes, including as a vehicle fuel, ause that accounts for about two-thirds of worldethanol consumption. It is normally more costlythan petroleum-based fuels, however, and is usedonly when special incentives, such as environmen-tal regulations or government subsidies encourageits production and use. Ethanol can be producedfrom crude oil, ethylene, and coal, or from agricul-tural products. Roughly 60 percent of globalethanol production comes from sugar cane andsugar beets. In Brazil, half of sugar cane productionis used for ethanol production; government ethanolpolicies mandate the share of ethanol to be blendedwith gasoline.
The United States is a major producer and con-sumer of ethanol from corn. Ethanol has environ-mental advantages when used as a fuel, because itburns cleaner than gasoline and does not producegreenhouse gases. In 1990 amendments to the U.S.Clean Air Act required certain U.S. regions to useoxygenated, reformulated gasoline during certainhigh-smog months and stipulated that a certainpercentage of oxygenates must be derived from
renewable sources such as corn. The legislationprovided tax incentives for ethanol, amounting to$0.54 cents a gallon when blended with gasoline ata 10 percent rate. Some Midwestern states provideadditional tax incentives.
The cost of ethanol production from corn isabout $1.10 per gallon, but because ethanol containsless energy than gasoline, the comparable energy-equivalent cost is $1.65 per gallon (Oregon Office ofEnergy 2002). Thus, with the $0.54 tax incentive,ethanol is competitive with regular gasoline. Inresponse to the incentive, U.S. ethanol productionhas been growing by about 6 percent per year (Berg2001). Both HFCS and ethanol can be produced inthe same facility by adding an ethanol unit to anHFCS facility, so the tax incentive on ethanol partlyfinances the facilities that produce HFCS. A seasonalcomplementarity between ethanol and HFCS pro-duction is also possible because ethanol is used forfuels primarily during the winter months, whereasthe demand for HFCS in soft drinks increases dur-ing summer months. The U.S. ethanol policy con-tributes to production capacity, which also can beused for HFCS production, thereby reducing HFCSproduction costs and making HFCS more competi-tive with sugar.
Estimates of Production Costs
Although the costs of producing sugar vary amongcountries for a variety of reasons, it is cheaperto produce it from cane than from beets in all
Sugar Policies: An Opportunity for Change 143
FIGURE 8.2 U.S. Sugar and HFCS Consumption
Sugar
HFCS
0
4
2
6
8
10
12
1970 1975 1980 1985 1990 1995 2000
Million metric tons
Source: USDA.

countries. LMC International, a London-based con-sulting firm, periodically estimates production costsfor cane sugar, beet sugar, and HFCS. The firm’smost recent estimates cover 41 beet-producingcountries, 63 cane-producing countries, and19 HFCS-producing countries (table 8.1). LMCbases its estimates on an engineering cost approachthat accounts for the physical inputs of labor,machinery, fuel, chemicals, and fertilizers used infield and factory. The estimates are of actual averagecosts and include the impact of policies that protectproducers in certain countries. Such cost estimatesdo not represent the supply curve normally esti-mated by economists, since they are not estimates ofmarginal costs. Nevertheless, they are useful forcomparing the average costs of production of dif-ferent products. Actual raw cane sugar prices areprovided for comparison. The prices are f.o.b. (free
on board), while costs are exfactory; thus the pricesshould be higher.
The average cost of producing raw cane sugar bymajor exporters was 10.39 U.S. cents per pound in1994–99, while the average cost of refined canesugar was 14.25 cents per pound. Thus the raw-to-white spread averaged 3.86 cents per pound.Refined sugar from beets cost an average of25.31 cents per pound—78 percent more thanrefined cane sugar. Among low-cost producers, thedifference between refined cane and beet sugar waseven wider. The average production cost for low-cost producers of refined cane sugar was 11.44 centsper pound, compared with 22.29 cents per poundfor refined beet sugar—a difference of 95 percent.Based on this comparison, sugar from beets was notcompetitive with sugar from cane by either majorexporters or low-cost producers. However, the wide
144 Global Agricultural Trade and Developing Countries
TABLE 8.1 Average Costs of Producing Cane Sugar, Beet Sugar, and High-FructoseCorn Syrup by Categories of Producers, and Actual Sugar Prices,1994–1999 (nominal U.S. cents per pounda)
Category 1994–95 1995–96 1996–97 1997–98 1998–99
Raw cane sugar Low cost producersb 7.43 8.10 8.18 7.78 7.58Major exportersc 10.37 10.60 10.72 10.52 9.73
Cane sugar, white equiv.Low cost producersb 11.02 11.75 11.84 11.41 11.19Major exportersc 14.23 14.48 14.61 14.38 13.53
Beet sugar, refinedLow cost producersd 21.31 23.16 23.09 21.21 22.67Major exporterse 25.47 26.87 25.90 23.56 24.75
High-fructose corn syrupf
Major producersg 13.45 16.78 13.57 12.86 11.76Actual market prices
Raw cane sugarh 13.53 12.23 11.21 10.71 7.05
a. Exfactory basis. b. Average of 5 producing regions (Australia, Brazil–Center/South, Guatemala, Zambia, and Zimbabwe). c. Average of 7 countries (Australia, Brazil, Colombia, Cuba, Guatemala, South Africa, and Thailand). d. Average of 7 countries (Belgium, Canada, Chile, France, Turkey, United Kingdom, and United States). e. Average of 4 countries (Belgium, France, Germany, and Turkey). f. HFCS-55, dry weight. g. Average of 19 countries (Argentina, Belgium, Canada, Egypt, Finland, France, Germany, Hungary, Italy,Japan, Mexico, Netherlands, the Slovak Republic, the Republic of Korea, Spain, Taiwan (China), Turkey,United Kingdom, and United States). h. Raw cane sugar price is U.S. cents per pound, July-June average of monthly prices, f.o.b. Caribbeanports. Source: LMC International (1999). Actual market prices are from World Bank databases.

margin between refined sugar from beets and caneis partly a reflection of protection to sugar beet pro-ducers in the European Union and United States,which encourages production in marginal areasand contributes to higher average costs.
Production costs for HFCS-55 (55 percent fruc-tose) averaged 13.68 cents per pound and werelower than white sugar from cane produced bymajor exporters in four of the five years. Theyexceeded the cost of cane sugar only when cornprices rose sharply in 1995–96. Thus, HFCS-55 cancompete with refined cane sugar in the current pol-icy environment, and perhaps even in a fully liber-alized market environment, since many studieshave suggested that raw sugar prices would risemore than corn prices under liberalization.
Employment
Data on employment in developing countries’sugar industries are not readily available but can beestimated from reports, surveys, and industry state-ments. Such estimates (table 8.2) show consider-able cross-country consistency among high- andlow-cost producers. For example, Brazil, Guyana,and South Africa are known to be among thelowest-cost producers; raw-sugar production per
industry employee for those countries is estimatedto range from 16.3 tons to 19.9 tons. In contrast,countries known to be high-cost producers such asFiji, Kenya, and Mauritius have production of 7.0 to8.3 tons of raw sugar per industry employee. Thus,one can reasonably conclude that an additionalmillion tons of sugar production from a low-costsugar-producing country would generate about55,500 direct employment jobs. If the exports camefrom a high-cost producer, the same million tons ofproduction would generate about 128,000 directemployment jobs. Additional indirect employmentjobs would also be generated in transportation andrelated industries, but no attempt was made to esti-mate these jobs.
The World Sugar Market
Brazil, the European Union, and India are thelargest sugar producers, each accounting forroughly 14 percent of world production during1999–2001 (table 8.3). They are followed by Chinaand the United States, which each produce about6 percent of the world’s sugar. Sugar trade is domi-nated by Brazil and Russia, with Brazil accountingfor about one-quarter of world net exports andRussia accounting for about 14 percent of world
Sugar Policies: An Opportunity for Change 145
TABLE 8.2 Raw Sugar Produced Annually per Sugar Industry Employee, SelectedDeveloping Countries
Tons of Raw Tons of RawDirect Employment Sugar Produced, Sugar Produced
Country (Growers and Factory) Average 1999–2001 Per Employee
Low-cost producersBrazil 1,100,000 19,485,000 17.7Guyana 18,000 293,072 16.3South Africa 130,000 2,589,667 19.9
High-cost producersFiji 40,500 336,333 8.3Kenya 69,000 485,333 7.0Mauritius 65,000 529,299 8.1
Other producersMalawi 17,000 200,667 11.8Mexico 300,000 5,069,233 16.9
Note: Production is the three-year average of raw sugar production during 1999–2001 from FAOSTAT. Source: Employment figures are derived from various sources and include total direct employment insugar factories and plantations. Employment data for Brazil, Mexico, and South Africa are from OECD(2002a); Fiji, Guyana, and Mauritius data are from F. O. Licht (2002); Kenya data are from the KenyaSugar Board; Malawi data are from the Malawi Ministry of Commerce and Industry.

net imports during 1999–2001. The EuropeanUnion is the second largest net exporter, followedby Australia, Cuba, and Thailand, which eachexport about 8–10 percent of the world total. Netimports are widely dispersed after Russia, with thenext largest net importer accounting for less than5 percent of world imports. India is the largestsugar consumer, with about 15 percent of worldconsumption, followed by the European Unionwith 10 percent, and Brazil with 7 percent.
World HFCS production averaged 11.7 milliontons (dry weight basis) during 1999–2001. Produc-tion in the United States alone averaged 9.2 milliontons—79 percent of the world total. Japan was thesecond-largest producer, with an average of .78 mil-lion tons, followed by Argentina, Canada, EuropeanUnion, Mexico, and Republic of Korea with be-tween .3 and .4 tons each. HFCS is consideredequivalent to sugar on a dry weight basis when usedto produce products such as soft drinks.
World sugar prices have historically been char-acterized by periodic sharp increases followed bylong periods of low or declining prices. This patternhas been caused, in large part, by policies in bothdeveloped and developing countries that isolatedconsumers and producers from international pricesand diminished their price responsiveness. Sincethe early 1980s, however, some developing coun-
tries have reformed their policies. As the share ofthose countries in global consumption and importshas increased with population and income growth,the reformed policies have led to greater priceresponsiveness by sugar producers and consumers,likely reducing the severity of future price spikes.The collapse of the former Soviet Union also led tothe abandonment of dedicated sugar imports fromCuba and increased trade at world market prices.Many developed countries still maintain highlyprotected sugar sectors and thus contribute to thelikelihood of price spikes, but they now account foronly one-third of consumption and one-half ofimports—compared with slightly more than half ofconsumption and 60 percent of imports when thelast sugar price spike occurred in 1980.
Despite some liberalization of sugar policies,roughly 80 percent of world sugar production and60 percent of world sugar trade is at subsidized orprotected prices. Only three major producers(Australia, Brazil, and Cuba) have sugar sectors thatproduce and operate at world market price levels.1
These three producers account for a combined20 percent of world production and 40 percent ofworld trade. The remaining 80 percent of worldproduction and 60 percent of world trade relies onproduction subsidies, export subsidies, or preferen-tial access to protected markets. The European
146 Global Agricultural Trade and Developing Countries
TABLE 8.3 Major Sugar Producers, Net Exporters, and Net Importers,1999–2001 Average
Producers Net Exporters Net Importers
Millions Millions MillionsCountry/Region of Tons Country/Region of Tons Country/Region of Tons
India 19.4 Brazil 9.3 Russia 5.2European Union 18.6 European Union 4.2 Indonesia 1.7Brazil 18.5 Australia 3.8 Japan 1.6United States 7.9 Thailand 3.6 United States 1.4China 7.8 Cuba 3.2 Korea, Rep. of 1.2Thailand 5.4 South Africa 1.3 Canada 1.2Mexico 5.1 Guatemala 1.1 Iran 1.0Australia 4.9 Colombia 1.0 Malaysia 1.0Cuba 3.8 Turkey 0.6 Algeria 0.9Pakistan 3.0 Mauritius 0.5 Nigeria 0.7All other 38.9 All other 10.3 All other 20.7World 133.3 World 38.9 World 36.6
Note: Data are in raw sugar equivalents.Source: USDA Production Supply and Distribution (PS&D) 2002.

Union, Japan, and the United States account for20 percent of world production; their averageproducer prices are more than double the worldmarket. China and India account for another20 percent of world production and protect pro-ducers with prices that are higher than world mar-ket prices. The remaining 40 percent of productionis in countries that either produce for preferentialmarkets (as is the case with Fiji, Mauritius, thePhilippines, and many African and Caribbeancountries) and thus receive prices higher than thoseof the world market, or they protect their domesticproducers with policies that restrict imports toprovide above-market prices.
The value of world sugar exports has remainedrelatively constant in nominal dollars ($11.8 billionduring 1980–85; $11.6 billion during 1995–2000),and sugar has remained an important source ofexport earnings for some developing countries.However, the share of developing countries in totalsugar exports declined from 71 percent during1980–85 to 54 percent in 1995–2000, as developed-country exports increased and the share of higher-valued refined-sugar exports by developed countriesincreased. Twelve countries received 10 percent ormore of their total export earnings from sugarduring 1995–2000, and an additional five received5–10 percent. In contrast, during 1980–85, tencountries received 20 percent or more of totalexports from sugar, and nine additional countriesreceived from 5–20 percent.
Sugar Policies in SelectedDeveloping Countries
Although this chapter focuses on prospects for pol-icy reform in the European Union, Japan, and theUnited States, it is useful to examine policies inother major sugar-producing and -trading coun-tries to see how they would be affected by suchreforms.
Brazil—the world’s largest sugar exporterand generally considered to be its lowest-costproducer—would be a major beneficiary ofincreased world sugar trade and higher pricesbecause it has the capacity to increase sugar pro-duction and exports substantially. The devaluationof the Brazilian real by 65 percent relative to thedollar since 1998 has contributed to the country’scompetitiveness. Despite its dominance, however,
exports are viewed as the third alternative forBrazilian sugar cane after production of fuelethanol and sugar for the large domestic market.Only half of Brazil’s sugar cane is used to producesugar; the other half goes into ethanol for automo-tive fuel. Sugar cane can easily be divided betweensugar and ethanol production depending on mar-ket conditions and government policies. If all ofBrazil’s sugar cane were used to produce sugar, pro-duction could roughly double (an increase ofroughly 18.5 million tons per year). Most of theincrease could be exported, subject to port andmilling capacity.
The Brazilian government has pursued a biofuelpolicy since the 1970s, when concerns about theadequacy of petroleum supplies were high. Thesepolicies included tax incentives and direct subsidiesfor ethanol production and use, sugar price con-trols, and restrictions on sugar exports. Lowerpetroleum prices during the 1980s led to reducedethanol subsidies and the removal of export andprice controls on sugar beginning in 1990. Othercontrols on sugar were eased during the 1990s, andsugar exports increased from 1.5 million tons in1990–91 to 11.3 million tons in 2000–01. Somesubsidies remain on ethanol production and use,and the future of such subsidies can strongly influ-ence the use of sugar cane for ethanol versus sugarproduction. Government mandates on the shareof ethanol to be included in gasoline (currently20–24 percent) can strongly influence demand forethanol as automotive fuel and the supplies ofsugar cane directed to sugar production. The futureof the biofuel program depends on internationalpetroleum prices as well as Brazilian policy.Recently marketed flex-fuel automobile enginesthat run equally well on gasoline or pure hydrousalcohol are expected to boost ethanol demand anddirect some sugar cane production away from sugarproduction and exports.
Sugar cane production has increased rapidly inthe center-south region of Brazil, where the climateis favorable, land is available, and sugar cane yieldsgood returns relative to other crops. Further expan-sion of sugar cane production in the center-southregion is possible and expected by most industryexperts, but milling capacity will need to be ex-panded to allow significantly more sugar produc-tion. Sugar is also produced in the northeastregion, where high-cost growers receive a small
Sugar Policies: An Opportunity for Change 147

subsidy. The central government allocates Brazil’stotal annual quota of premium-priced U.S. importsto this region.
China was an occasional large sugar importerand exporter in the 1990s, but average net importswere about 400,000 tons during 1990–2000. Mostof these imports came from Cuba under a long-term trade agreement. The government has fol-lowed a policy aimed at self-sufficiency by provid-ing strong price incentives to producers, controllingimports, and accumulating and releasing govern-ment stocks to maintain high internal marketprices. About 90 percent of China’s sugar produc-tion comes from sugar cane and the remainderfrom sugar beets. A “guidance price” is provided tosugar refiners for sugar cane and beet, but marketforces largely determine prices (Sheales and others1999). The policy and strong demand growth keptsugar prices high during most of the 1990s, butprices fell sharply after the record 1998–99 crop,remaining low through 2000. Prices increased in2001, with white wholesale sugar prices averagingabout $0.22 per pound during the first half of 2001(F. O. Licht 2002), more than double the worldmarket price and similar to U.S. domestic prices. Arecord 2002–03 harvest caused prices to fall again.
Artificial sweeteners, mainly saccharin, are animportant competitor to sugar in China and substi-tute for as much as 2.4 million tons. When Chinaentered the World Trade Organization (WTO) in2001, it agreed to a tariff rate quota of 1.6 milliontons of sugar at a tariff rate of 20 percent, with anover-quota tariff of 76 percent. The quota is sched-uled to increase to 1.945 million tons, and the over-quota rate to fall to 65 percent, by 2004. If Chinawere to import the full amount specified by the tar-iff rate quota, imports would increase substantiallyover the levels of recent years. China’s WTO tariffquota does not commit the country to import all ofthe quota tonnage, however, and China can chooseamong a number of different methods of adminis-tering the quota to influence its fill rate (Jolly 2001).For example, actual imports during 2001–02 were1.15 million tons, according to the InternationalSugar Organization (2002), despite the tariff ratequota of 1.6 million tons. The Chinese sugar indus-try would undergo substantial adjustment if it wereopened to international competition. A large num-ber of small, high-cost sugar mills would becomeunprofitable, and production would likely decline.
India’s sugar industry, heavily regulated underthe Essential Commodities Act of 1955, is verypoliticized because of the large number of sugarcane growers (reportedly as many as 5 million) andthe importance of sugar in Indian diets. The indus-try is largely self-sufficient, with occasional importsto offset domestic shortfalls. An import duty (cur-rently 60 percent) is varied to maintain domesticprices above those of the world market. Largestocks of sugar currently burden the industry andcan only be exported with substantial subsidies orat substantial losses. India provides an internalfreight reimbursement and ocean freight subsidy tohelp export surplus production. State controls limitinternal sugar movements, and licensing and stock-holding requirements for mills and shops con-tribute to industry inefficiencies. Sugar mills aresmall and inefficient, and high internal transportcosts would limit export potential even if worldprices were to rise above internal prices. Sugarmillers and importers are required to sell a portionof their supplies to the Public Distribution Systemat below-market prices for resale to low-incomeconsumers. Sugar-cane production is more prof-itable than most other crops, with prices that areabout 50 percent higher than world market pricesdue to minimums established by the central gov-ernment and higher prices advised by the states.
India has a small ethanol program, and there aregovernment proposals to require ethanol to beblended with gasoline to reduce pollution. The gov-ernment has announced plans to liberalize the sec-tor, but past efforts at liberalization have beenunsuccessful. Decades of regulation have also cre-ated complicated political interdependencies thatwill be difficult to disentangle. It is unlikely thatIndia would emerge as a significant exporter even ifpolicies in the European Union, Japan, and theUnited States were changed to allow greater imports.
Mexico privatized its sugar mills and partiallyderegulated its sugar industry in reforms that con-cluded in 1992 (Escandon 2002). It has maintainedstrong government regulation of the sector, how-ever, by setting sugar-cane prices for its 150,000growers. Mexico liberalized pricing and productionof sugar in 1995 but simultaneously increased pro-tection by increasing tariffs from 65 percent to136 percent on raw sugar and from 73 percent to127 percent on refined sugar. This led to a 60 per-cent increase in domestic sugar prices, a 50 percent
148 Global Agricultural Trade and Developing Countries

increase in production, and a doubling of exportsfrom 1992 to 2002.
The North American Free Trade Agreement(NAFTA) came into force on January 1, 1994. A15-year adjustment period ending in 2008 was to befollowed by free trade in sugar between Mexico andthe United States. The implementation of NAFTAhas been contentious because of a last-minute side-letter agreement on sugar added to ensure approvalby the U.S. Congress. Although the side-letter agree-ment was never ratified by Mexico’s Congress and isnot recognized as valid by Mexico, the U.S. govern-ment administers NAFTA in accordance with itsterms. Under NAFTA, the amount of Mexico’s duty-free access to the U.S. sugar market depends onwhether Mexico is a surplus sugar producer (sugarproduction minus sugar consumption). The side-letter agreement changed the definition of surplusproducer to include HFCS consumption as well assugar consumption. Using this definition, Mexicocould export up to 25,000 tons per year of surplussugar duty-free during the first 6 years of NAFTA.Beginning in year 7 (the 2000–01 marketing year),and until the end of the 15-year adjustment period,Mexico could export up to 250,000 tons of surplussugar duty-free.
High prices for sugar in Mexico led to largeimports and increased production of HFCS, whichquickly displaced sugar in the soft-drinks industryand left Mexico with large sugar stocks that couldnot be exported duty-free to the United Statesbecause of the 25,000 ton limit. After the UnitedStates rejected a request to allow increased duty-free exports, Mexico charged that the United Stateswas dumping HFCS in Mexico and initiatedantidumping duties. Negotiations are continuing toresolve the trade and duties on HFCS.
Caught between the high prices that the govern-ment had established for sugar cane and the weakdomestic and world market prices for sugar, manyof Mexico’s 60 sugar mills became insolvent. Thegovernment expropriated 27 mills with large andunpayable debts in September 2001. Public invest-ments are being made to prepare these mills forresale to private investors.
Among the measures in Mexico’s national sugarpolicy for 2002–2006, which is designed to make thesector profitable, is the formation of an exportcooperative of all private and government-ownedsugar mills. Mexico’s sugar exports in the 2001–02
marketing year are estimated to total 650,000 tons,of which 148,000 tons were exported to the UnitedStates duty-free. Beginning in 2009, Mexico willhave unlimited duty-free access to the U.S. sugarmarket and will likely increase exports substantially.
The Russian Federation is by far the world’slargest sugar importer, with average annual importsof 5.2 million tons during 1999–2001, three timesthe amount of the next largest importer. Followingthe breakup of the Soviet Union, the Russian sugarsector faced an uncertain future, an unstable andconfused policy structure, and a technically weakindustry. Sugar production, all from beets, declinedby about 45 percent from 1992 to 2000, while con-sumption declined by 17 percent and sugar importsincreased by 35 percent. Low beet yields, poorfactory recovery rates, outdated technology, andshortages of fuel and replacement parts hamperedthe adjustment of the Russian sugar industry toprivatization. With trade policy changing fre-quently, high perceived risks discouraged foreigndirect investment and slowed the modernization ofthe industry.
The government uses high tariffs to protect thedomestic industry. To protect domestic sugar refin-ers, tariffs on white sugar are higher than on rawsugar. Seasonal tariffs are added during periods ofpeak domestic production to protect local produc-ers and support prices. The import duty on rawcane sugar for 2003 has been set at $95 per ton($.043 per pound). Russia is expected to remain alarge importer as long as the investment climateremains uncertain and foreign companies arereluctant to invest. Even with foreign investment,Russia will likely remain a high-cost producerbecause its industry is based on beets.
Thailand is the world’s fourth-largest sugarexporter, with net exports of 3.6 million tons dur-ing 1999–2001 (annual average). Thailand’s sugarpolicy is patterned after that of the EuropeanUnion, with high internal sugar prices maintainedby quotas and import tariffs. The government usesproduction quotas, tax incentives, and subsidizedcredit to encourage exports. The tariff rate quotaagreed under the WTO Agreement on Agriculturewas 65 percent for in-quota imports in 1999 and99 percent for outside-quota imports (Sheales andothers 1999). Despite high protection, Thailand’scosts of production are among the lowest in theworld, roughly comparable to those of Australia
Sugar Policies: An Opportunity for Change 149

(Borrell and Pearce 1999). High protection and lowcosts have led to rapid growth of production and amore than tripling of exports over the past twodecades.
This selective review of policies in major sugar-producing and -trading countries illustrates thesignificance of policy distortions in the world sugarmarket. India, the largest sugar producer, has aheavily regulated domestic sugar market and highimport tariffs to protect local producers. China’simport restrictions keep domestic sugar pricesnearly as high as those in the United States. Russia,the largest net importer, has high tariffs to protectsugar-beet producers and additional tariffs onwhite sugar to protect local refiners. Brazil, thelargest sugar exporter, has a sugar policy that ispartly driven by its biofuel policies; until recently itrestricted sugar exports. Thailand, the fourth-largest net exporter and a low-cost producer, hasused high domestic prices, tax incentives, and sub-sidized credit to increase exports. Mexico’s highdomestic prices have stimulated production inanticipation of unlimited duty-free access to theU.S. sugar market beginning in 2009.
Sugar Policies in Selected OECDCountries
More than half of the value of sugar production inOECD (Organisation for Economic Co-operationand Development) countries during 1999–2001came from government support or transfers fromconsumers. Such high support typically limits con-sumption through high prices and encourages pro-duction even when a country does not have a com-parative advantage in sugar production. Support toOECD sugar producers during 1999–2001 totaled$6.35 billion, more than half the value of worldsugar trade (about $11.6 billion) and nearly equalto developing-country exports of about $6.5 bil-lion. The European Union provided the largestannual support, with $2.71 billion, while theUnited States provided $1.30 billion, and Japanprovided $0.44 billion. Several developing coun-tries also provided high levels of support to sugarproducers, including Mexico, Poland, and Turkey(table 8.4). Much of that support is providedthrough border protection.
The benefits of more liberalized trade in sugarand reduced domestic support, especially in OECD
150 Global Agricultural Trade and Developing Countries
TABLE 8.4 Government Support to Sugar Producers, 1999–2001
Producer Support Producer Nominal Support from BorderCountry/Region (million US$) Assistance Coefficient Protection (percent)
OECD 6,351 2.11 n.a.Australia 51 1.11 0.0Czech Republic 16 1.25 47.6European Union 2,713 2.11 91.7Hungary 12 1.20 41.5Japan 437 2.17 88.7Mexico 713 2.10 83.9Poland 176 2.28 92.9Slovak Republic 16 1.94 54.7Switzerland 86 4.36 73.0Turkey 749 3.02 95.8United States 1,302 2.37 84.3
n.a. Not applicable.Note: Producer support was converted from local currency to U.S. dollars using period average annualexchange rates from the IMF’s International Financial Statistics, May 2002. Producer nominal assistancecoefficient is an indicator of the nominal rate of assistance to producers measuring the ratio between thevalue of gross farm receipts including support and gross farm receipts valued at world market priceswithout support. No calculations were made for Canada, Iceland, New Zealand, Norway, or the Republicof Korea.Source: OECD 2002b.
countries, are substantial, according to several stud-ies (Borrell and Pearce 1999; Devadoss and Kropf1996; Elbehri and others 2000; El-Obeid andBeghin 2004; USGAO 1993 and 2000; Sheales andothers 1999; USITC 2002; van der Mensbrugghe,Beghin, Mitchell 2003; Wohlgenant 1999). Studyresults differ because of different assumptions,methodologies, and scenarios, but the general con-clusion is that reduced support to OECD sugarproducers would result in lower production inthose countries, lower domestic prices, increasedconsumption, and increased net imports. Worldsugar prices would increase and exports fromdeveloping countries, and some developed-countryexporters, would rise. According to Sheales andothers (1999), full liberalization of the world sugarmarket would result in a 41 percent increase inworld sugar prices. Sugar imports would increaseby 44 percent in the United States. Exports woulddecline by 34 percent in the European Union. Low-cost sugar-producing countries would increaseexports, with Australia’s exports rising 16 percent,Brazil’s 23 percent, and Thailand’s 22 percent.Removal of government support from domesticproducers in the European Union, Japan, and theUnited States would save consumers $4.8 billionper year. A study by the U.S. General AccountingOffice (USGAO 2000) concluded that the U.S. sugarprogram resulted in a net loss to the U.S. economyof $1 billion in 1998. Elbehri and others (2000)used the global trade analysis project (GTAP)multisectoral, multiregional general-equilibriummodel to examine the impacts of partially liberaliz-ing sugar tariff-rate-quota regimes, concluding thatcutting the European Union’s over-quota tariff byone-third would yield a global welfare gain of $568million. Coordinated global reforms would resultin the greatest benefits. Wohlgenant (1999) esti-mated that global sugar-trade liberalization wouldresult in a 43 percent increase in world price.
Borrell and Pearce (1999) used a 24-regionmodel of the global sweetener market to examineconsumption, production, trade, price, and welfareeffects for seven classes of sweeteners. A baselineprojection that continued current protection wascompared with a fully liberalized market with notrade protection or domestic support in any coun-try or region. Under the fully liberalized scenario,sugar prices were projected to fall from the baselineby 65 percent in Japan; 40 percent in Western
Europe; 25 percent in Eastern Europe, Indonesia,Mexico, and the United States; and 10 percent inChina, the Philippines, and Ukraine. Lower priceswould lead to higher consumption, lower produc-tion, and increased imports of sugar in those coun-tries that had trade protection. World prices wouldincrease by 38 percent, and lower-cost producerswould increase production and exports—howeverconsumption decreased from the higher prices. Incountries with the highest protection (Europe,Indonesia, Japan, the United States), net importswould increase by 15 million tons per year. Japan’sproduction would drop by 44 percent, that of theUnited States by 32 percent, and Western Europe’sby 21 percent. Among low-cost producers andexporters, Australia and Thailand would increaseproduction by 25 percent, and Brazil, Cuba, andother Latin American countries (excluding Brazil,Mexico, and Cuba) would increase production byabout 15 percent.
Global welfare gains from full liberalization areestimated by Borrell and Pearce (1999) to total$4.7 billion per year based on historical supplyresponses; gain could go as high as $6.3 billion peryear if higher supply responses occur. Brazilianproducers would gain the most from liberalization,at around $2.6 billion per year, but this would beoffset by a loss of $1 billion to Brazilian consumerswho would pay higher prices after liberalization—leaving a net gain of $1.6 billion for Brazil. Japanwould enjoy a net gain of about $0.4 billion fromlower consumer prices that would more than offsetlower producer prices on the 40 percent of sugarthat is domestically produced. The United Stateswould have a small net gain of about $0.5 billionfrom full liberalization, with consumer gainsslightly larger than producer losses. WesternEurope would gain about $1.5 billion as consumergains of about $4.8 billion exceeded producer lossesof about $3.3 billion.
The exporting countries that now enjoy prefer-ential access to European and U.S. sugar marketsgain about $0.8 billion per year from prices that aremore than twice world market prices on sales to theEuropean Union, and 80 percent more than theworld market price for sales to the United States.The value of the preferential access is less than itappears, however, because many of these producershave high production costs and would not produceas much at world market prices. Further, world
Sugar Policies: An Opportunity for Change 151

market prices would rise by an estimated 38 per-cent after full liberalization, partially offsetting theloss of high prices in preferential markets for pro-ducers. Borrell and Pearce (1999) estimate the netloss to these exporting countries from full liberal-ization at $0.45 billion. The cost to taxpayers in theEuropean Union and United States of providingeach $1 of preferential access is estimated to bemore than $5. In a recent study of the Fijian econ-omy (Levantis, Jotzo, and Tulpule 2003), alternativeforms of aid were found to deliver much greatereconomic benefits and growth prospects.
Caribbean sugar producers are among thelargest group of countries having preferentialaccess to the European and U.S. sugar markets. Arecent study (Mitchell 2004) found that most of theCaribbean producers cannot export profitably evento the European Union, which pays prices that aremore than triple those of the world market. Manyof these countries have abandoned their U.S. quo-tas because they do not produce enough to satisfyboth their EU and U.S. quotas, and EU quotas havehigher prices.
While the benefits to reform are not widely dis-puted, the opposition to reform within certaincountries has been strong. The remainder of thissection examines the sugar policies of the EuropeanUnion, Japan, and the United States with an eye tothe prospects for reform.
The European Union’s Sugar Policy
The European Union’s sugar policy uses produc-tion quotas, import controls, and export refunds
(subsidies) to support producer prices at levels wellabove international prices. The program is financedprimarily by the European Union’s consumers, whopay high prices for sugar. The sugar policy began in1965 as part of the Common Agricultural Policy(CAP). Under the CAP, intervention sugar priceshave been constant in nominal terms since1984–85; however, they vary with exchange rateswhen expressed in U.S. dollars (figure 8.3). Theyhave been more than double world market pricesduring most of the past 20 years. Import duties areused to prevent lower-priced imports from theworld market, and export refunds are paid toexporters to cover the gap between the EU priceand the generally lower world market prices whencommodities are sold from intervention stocks.
Production quotas limit the amount of sugareligible for price support. Quotas are divided intocategories A and B, with different levels of pricesupport. Sugar production in excess of quota isclassed as C sugar and is not supported, but it canbe carried over for use as quota sugar in the nextyear or exported at world market prices. The totalof A and B quota sugar was 14.592 million tons in2000–01, of which 11.983 million tons was for Aquota and 2.611 million tons was for B quota(USDA 2003). The quotas have been declining tomeet WTO commitments. The surplus of A and Bquota sugar above domestic consumption is about1.5 million tons; it is exported with subsidy. Excessquota (C sugar) averaged 1.59 million tons (whiteequivalent) between 1995–96 and 2000–01. Thus,the EU sugar program results in about 3.1 milliontons of sugar exports per year (about 10 percent of
152 Global Agricultural Trade and Developing Countries
FIGURE 8.3 Sugar Prices, 1970–2003
EU intervention
World
0
15
5
10
20
25
30
35
1970 1975 1980 1985 1990 1995 2000
U.S. cents per pound
world exports), and half of this is subsidized.2 Crit-ics of EU policy charge that A and B quota sugar issubsidizing the production and export of C sugar.Australia, Brazil, and Thailand have filed a com-plaint with the WTO to that effect.
Production levies are applied to all quota sugarproduction to cover the costs of export refunds.The levy on A quota sugar is 2 percent, whereas thelevy on B quota varies from 30 percent to 37 per-cent depending on world market prices. An addi-tional levy can be collected in the next marketingyear to recover any shortfall in export refunds.Quotas are also set for some alternative sweetenerssuch as HFCS (known as isoglucose within theEuropean Union) and inulin (produced fromchicory and Jerusalem artichoke). The quota forproduction of HFCS is 303,000 tons; that for inulinis 323,000 tons.
The Uruguay Round commitments had little ini-tial impact on the European Union’s sugar regime.The variable import levy was replaced by a fixedduty plus a safeguard clause allowing for a variableadditional duty with minimal impact on protectionto sugar beet producers. The European Unionagreed to reduce both the amount spent on exportrefunds and the volume of sugar exported with sub-sidy. Export refunds are also payable on sugarexported in the form of processed goods such assugar confectionery, chocolate, biscuits, cakes, icecream, soft drinks, and so on. The European Unionamended legislation to allow changes in sugar-production quotas on an annual basis (rather thanthe previous five-year basis) to ensure that the limitson exports were met. The WTO commitment was toreduce only the subsidized exports net of preferen-tial imports. This is a small proportion of totalexports, and amounted to just 34 million tons fromthe 1986–90 base of 1.612 million tons per year.
Preferential access to the European Union’s sugarmarket and its high prices are granted to the46 countries from Africa, the Caribbean, and thePacific (ACP) that signed the first Lomé Conventionin 1975. The Lomé sugar protocol provided forimports of specified quantities of raw or white canesugar originating in the ACP states at guaranteedprices. Unlike most articles of the Lomé Convention,the sugar protocol does not expire and cannot bechanged unilaterally. The original quantities speci-fied were 1,294,700 tons of white-sugar equivalent,with an additional amount allotted to India. Thetotal import commitment was for 1,304,700 tons;
this amount has remained constant, with realloca-tion of quotas among existing members when acountry did not fulfill its quota. The sugar importedunder the Lomé Convention is known as“preferencesugar.” An additional import allocation of between200,000 and 350,000 tons of sugar was made to ACPcountries (primarily) in 1995. This allocation of“special preference sugar” is not permanent, and thequantity can vary based on import needs. The pricespecified for special preference sugar was 85 percentof the guaranteed price for the permanent prefer-ence sugar. In addition, the European Union tookover the WTO import commitments of the newmembers joining the European Union in 1995.These included a tariff quota of 85,500 tons, mainlyfrom Brazil, with an in-quota tariff rate of 98 ECU(European currency unit) per ton. The EuropeanUnion has also granted several countries in theBalkans temporary access to its sugar market.Imports under this program totaled about 100,000tons in 2001–02. In total, the EU permanent importcommitment is 1.39 million tons (white sugarequivalent) plus additional quantities of up to450,000 tons of temporary imports.
The European Union’s Everything But Armsinitiative (EBA), approved in 2001, allows duty-free access to the EU sugar market by the 48 least-developed countries (39 are ACP countries). Itcould become the largest of the European Union’scommitments. Initially EBA imports will be limitedby quotas, and the sugar imported will be countedagainst the quota of special preference sugar. TheEBA quota will increase annually until full duty-free access for white and raw sugar is allowed in2009. Safeguard clauses in the EBA initiative couldbe used to limit imports, but these would be diffi-cult for the European Union to invoke becausedoing so would be seen in the least-developedcountries as a policy reversal.
Imported sugar will eventually displace domes-tic EU production and could severely strain the EUsugar regime. The European Commission esti-mated the possible impact of the EBA on the EUsugar regime in 2000, concluding that sugarimports could increase by an additional 2.4 milliontons and cost the EU budget about 1.05 billioneuros. These imports would have to be offset byreduced domestic production quotas or used forethanol (European Commission 2003).
A longer-term threat to the EU sugar programis the Commission’s plan to offer, all 77 ACP
Sugar Policies: An Opportunity for Change 153

countries the same conditions as the EBA countriesunder the Economic Partnership Agreements(EPAs). Negotiations, begun in September 2002, areexpected to take five years. Under the EPAs, all ACPcountries would have duty-free access to the EUmarket for all goods except arms. These countriescurrently produce 6.2 million tons of sugar. Theycould provide all of it to the European Union onshort notice while covering their own demand fromthe world market. Taken together, EBA and ACPsupplies could total 8.6 million tons. This is 60 per-cent of current EU production and would forcemajor changes to the EU sugar program.
Enlargement of the European Union may alsocreate new problems for its sugar regime. The10 countries that joined in mid-2004 were Cyprus,the Czech Republic, Estonia, Hungary, Latvia,Lithuania, Malta, Poland, the Slovak Republic, andSlovenia. Bulgaria and Romania will likely join inthe next several years; the last of the current roundof accession countries, Turkey, may join severalyears later. Poland is the largest sugar producer ofthe 10 countries that joined in 2004, with nearly60 percent of the group’s total production. The first10 accession countries produce about one-fifth asmuch sugar as the European Union, have higher percapita consumption, lower yields, and lower recov-ery rates than the European Union. They agreed toan A and B quota of 2.958 million tons, with2.829 million tons of A quota and 0.129 milliontons of B quota (European Commission 2003).Acceding producers will likely also produce C sugar,
as is done by current EU producers, and export it atworld market prices. A 1998 EU Commission studyof the 10 accession countries concluded that thegroup would add at least 200,000 tons to theEuropean Union’s export surplus.
The current EU sugar regime runs until June2006, and the European Commission openeddiscussions on reform on September 23, 2003.However, unlike the other commodities sched-uled for reform discussions—cotton, olive oil,and tobacco—specific reform proposals were notoffered for sugar. Instead, three scenarios forreform were offered, ranging from an extension ofthe current sugar regime beyond 2006 to completeliberalization of the current regime. Complicatingthe reform discussions is an investigation launchedby the WTO in August 2003 in response to thecomplaint by Australia, Brazil, and Thailand thatthe EU sugar regime illegally subsidizes the indus-try and depresses world prices. A negative findingagainst the EU by the WTO dispute-settlementbody could force changes to the EU sugar regime.
Japan’s Sugar Policy
Japan is the third-largest net sugar importer, afterRussia and Indonesia, with average annual netimports of about 1.6 million tons of raw sugar dur-ing 1999–2001 (figure 8.4). Imports supply abouttwo-thirds of domestic consumption; the remain-ing one-third is supplied by highly subsidized beetand cane production. Domestically produced
154 Global Agricultural Trade and Developing Countries
FIGURE 8.4 Japanese Sugar Trends, 1970–2000
Consumption
Imports
Production
0.0
1.5
0.5
1.0
2.0
2.5
3.0
3.5
4.0
1970 1975 1980 1985 1990 1995 2000
Million metric tons (raw equivalent)
Source: FAOSTAT.

HFCS accounts for about 40 percent of total caloricsweeteners. The government intervenes in the sugarmarket by establishing guaranteed minimum pricesfor sugar beets and cane, controls on raw sugarimports, prohibitive duties on refined sugarimports, high tariffs on imported products con-taining sugar, and quotas, tariffs, and other controlson sugar substitutes. The system results in retailsugar prices that are among the highest in the world($.89 per pound in Tokyo in 2000) and producerprices for sugar beets and sugar cane that areroughly 10 times world market levels. Sugar con-sumption is gradually declining due to competitionfrom HFCS, high sugar prices, slow economicgrowth, and dietary changes away from sweeteners.Consumption may actually be higher than re-ported, however, because sugar contained in im-ported products is not reported and is estimated toaccount for as much as an additional 10 percent ofsugar consumption.
Japan’s Ministry of Agriculture, Forestry, andFisheries (MAFF) sets guaranteed minimum pricesfor sugar cane and sugar beets according to theSugar Price Stabilization Law of 1965 and theRevised Sugar Price Adjustment Law of 2000(Fukuda, Dyck, and Stout 2002). The minimumproducer prices are set based on a formula com-paring current agricultural input prices and consu-mer goods relative to prices that prevailed in 1950and 1951. The minimum producer price for sugarbeets during 1990–95 averaged $149 per ton, whilethe minimum producer price for sugar cane was$174 per ton. By comparison, U.S. sugar beet andcane producers received an average of $29 and $40per ton, respectively, during the same period. ThusJapanese beet and cane producers received at least10 times the world market prices.3 For the 2001marketing year, the minimum price was 17,040 yenper ton ($131 per ton) for sugar beets and20,370 yen per ton for sugar cane ($157 per ton).Australian sugar cane producers, which receive nogovernment price supports, received $16 per ton inthe 2001 marketing year (Sheales 2002). The MAFFalso sets the raw sugar price for domestic refiners,known as the “domestic sugar rationalization targetprice,” at a level intended to allow restructuredsugar refining firms to pay the guaranteed mini-mum price to sugar cane and beet producers andstill recover costs. A subsidy is provided to sugarrefiners to cover the difference between the domes-
tic market price and the “target price.” In marketingyear 2001, the target price for raw sugar was151,800 yen per ton ($1,168 per ton or $0.53 perpound), while the resale price on imported rawcane sugar was about $0.22 per pound (Fukuda,Dyck, and Stout 2002). The difference was made upby a subsidy financed by a surcharge on importedsugar, other surcharges, and funds from Japan’snational budget. The current subsidy to refiners is90 billion yen ($692 million) (Fukuda, Dyck, andStout 2002). The government regulates the produc-tion and price of HFCS to limit competition withsugar and obtain funds to partially pay for the highsupport to sugar beet and cane producers.
Full liberalization of Japan’s sugar and sweetenermarket would likely reduce domestic sugar produc-tion drastically—perhaps completely eliminat-ing domestic production. Consumption wouldincrease as consumers faced lower sugar prices.Imports would increase to meet consumerdemand. HFCS consumption would likely increasewithout current controls but would not necessarilyincrease under full liberalization of the sugar andsweetener markets because of competition fromimported sugar. The Australian Bureau of Agricul-ture and Resource Economics (see Sheales and oth-ers 1999) estimated that sugar imports would riseby 500,000 tons if Japan eliminated its tariffs, sur-charges, and levies on sugar imports. The studyassumed that domestic production would declineby just 22 percent because of other means of gov-ernment support—this is probably an underesti-mate. The Economic Research Service of the U.S.Department of Agriculture (USDA) estimated thatproduction would decline by 40 percent if Japanwere to eliminate all border protection and trade-distorting domestic support. Consumer and pro-ducer prices in Japan would fall by 70 percentunder the scenario, and imports would rise by asmuch as 735,000 tons (Fukuda, Dyck, and Stout2002). Borrell and Pearce (1999) estimated thatsugar prices would decline by 65 percent, produc-tion would decline by 44 percent, and net importswould increase by about 1.5 million tons.
The United States’ Sugar Policy
U.S. sugar policy provides for a loan program forsugar beets and cane.4 The nonrecourse loan pro-gram is reauthorized through fiscal 2007 at 18 cents
Sugar Policies: An Opportunity for Change 155
per pound for raw cane sugar and 22.9 cents perpound for refined beet sugar. A Refined Sugar Reex-port Program allows sugar cane refiners to pur-chase raw sugar at world prices, without duty, andexport a like amount within 90 days. A similar pro-gram exists for manufacturers of sugar-containingproducts. A no-cost provision of the policy requiresthe secretary of agriculture to make every effort tooperate the sugar program in a way that avoids for-feiture under the loan program. To avoid forfei-tures, it is necessary to keep the domestic sugarprice above the world market price. This is done byrestricting sugar imports, first by quotas introducedin May 1982, and then by tariff rate quotas begin-ning in 1990 following a successful GATT (GeneralAgreement on Tariffs and Trade) challenge.
Minimum import levels were approved in 1990to allay concerns of quota-holding countries andcane processors. It provided for marketing allot-ments on domestically produced sugar if estimatedimports were less than 1.25 million tons, raw value.The secretary of agriculture has the authority toimpose marketing allotments in order to balancemarkets, avoid forfeitures, and comply with theU.S. sugar-import commitments under WTO andNAFTA. The allotments can be used only whensugar imports, excluding imports under the reex-port program, are less than 1.532 million tons.5 TheUSDA announced flexible marketing allotments forsugar for the 2002–03 marketing year (Haley andSuarez 2002).
In the Uruguay Round Agreement on Agricul-ture (URAA), the United States agreed to maintainminimum imports of 1.139 million metric tons ofraw-value sugar imports (1.256 short tons). Of this,22,000 metric tons were reserved for refined sugar.The tariff rate quota on raw cane sugar was allo-cated to 40 quota-holding countries based on theirexport shares during 1975–81, when trade was rela-tively unrestricted. The duty of 0.625 cents perpound, raw value, continues on quota imports.Most countries continue to avoid the duty becauseof programs under the Generalized System of Pref-erences and the Caribbean Basin Initiative. Theduty on raw sugar above the tariff rate quota was17.62 cents per pound beginning in January 1995and declined by 0.45 cents per pound each yearuntil it reached 15.36 cents per pound in 2000. Theover-quota rate for refined sugar was 18.62 centsper pound in 1995 and declined by 0.48 per year
through 2000 to 16.21 cents per pound. The over-quota tariff will remain prohibitive at a world priceof about 5 cents per pound (assuming a U.S. rawsugar market price of 22 cents per pound and atransportation cost of 1.5 cents per pound).
Under NAFTA most trade barriers betweenCanada, Mexico, and the United States were to beeliminated by 2009. As described previously, thetreaty’s sugar provisions were altered by a side-letter agreement prior to the start of NAFTA. Butthe side-letter agreement did not change otherNAFTA provisions—such as the phased reductionin the United States over-quota tariff of 16 centsper pound by a total of 15 percent during the firstsix years, and then in a straight line to zero in calen-dar year 2008. The over-quota tariff on raw sugar,7.6 cents per pound in 2003, drops about 1.5 centsper pound each year. If the world raw sugar pricesare in the range of 7 cents per pound, and U.S. rawsugar prices are about 18 cents per pound, Mexicanproducers would benefit from exporting to theUnited States instead of to the world market(USDA 2002). Currently, Mexico does not have alarge surplus of sugar to export, but increased pro-duction or reduced consumption could changethat. In future years, the over-quota tariff will con-tinue to decrease and could lead to large imports. Aprovision of the U.S. sugar legislation removes pro-duction quotas if imports exceed 1.5 milliontons—a free-for-all if imports increase beyondcertain limits. Under this alternative, the U.S. gov-ernment could end up holding large stocksdefaulted under the sugar loan program, and thesugar system would become more difficult to man-age because of the no-net-cost provision. Mexicohas increased sugar production from about 3.5 mil-lion tons during 1989–91 to 5.2 million during2000–02, while consumption has increased from4.0 to 4.5 million tons. Following the end of theNAFTA phase-in period, Mexico can ship unlim-ited quantities of sugar to the United States duty-free without the condition of being a net surplusproducer. This will likely force changes to the U.S.sugar program. For example, Mexico could increaseimports of HFCS for use in the soft drink industry,freeing sugar for export to the United States.
The effectiveness of the U.S. sugar program atkeeping domestic prices above world prices since1980 can be seen in figure 8.5. During this period,world prices have fallen sharply, but U.S. producers
156 Global Agricultural Trade and Developing Countries

were protected. The sugar program, however, facesnew challenges in the near future that could bringinto conflict the no-cost provision of the sugar pro-gram, the minimum import commitment underthe WTO, and the duty-free access provision toMexican imports in 2009. The rapid growth ofsweetener production compared with consumptioncould also destabilize the program. The growth rateof sweetener production during 1985–2000 was3.2 percent, compared with consumption growth of2.1 percent over the same period. If these growthrates are extended into the future, marketing allot-ments would be needed to prevent stock building.The problem is further exacerbated by the agree-ment under the URAA to import 1.139 million tonsof sugar per year.
The U.S. sugar program, like that of theEuropean Union, almost certainly will have tochange. But although it benefits just 9,000 sugarbeet producers and 1,000 sugar cane producers(Orden 2003), opposition to policy reform isstrong, especially from sugar-cane producers, whoaverage nearly 3,000 acres per producer (comparedwith 200 acres per beet producer). Florida accountsfor one-quarter of U.S. sugar production, and twolarge corporations account for nearly 80 percent ofthe cane acreage in Florida. Such concentration ofproduction suggests that reforming the U.S. sugarprogram will likely require compensation to exist-ing producers.
A model to consider is the recent reform of theU.S. edible peanut program (Orden 2003). Under
that program domestic prices were supported atabout double world prices, with quotas to limitproduction and tariff rate quotas to limit imports(see Diop, Beghin, and Sewadeh in this volume).And, like sugar, the edible peanut program facedthe threat of increased imports due under WTOagreements and NAFTA. In the 2002 U.S. Farm Bill,the loan rate for edible peanuts was cut by half,compared with the mid-1990s, production quotaswere eliminated, and direct cash payments weremade to producers. The payments consisted ofdeficiency payments if prices fell below the newlower loan rates, decoupled direct payments, andcountercyclical payments. In addition, quota hold-ers were compensated with direct payments fortheir loss of quota rights. A similar program forsugar would be complicated by the loss of benefitsby HFCS producers, who benefit from high sugarprices. Reform of the sugar program may alsorequire compensating the industries that nowdepend on distorted sugar policies.
Conclusions
Sugar cane is an almost ideal commodity for somedeveloping countries to grow for domestic con-sumption and export. It can be produced efficientlyin tropical climates under a wide range of technolo-gies, from low-input labor-intensive to high-inputfully mechanized. Sugar is locally consumed in allproducing countries and provides a substantialpart of total calories in many countries. Processing
Sugar Policies: An Opportunity for Change 157
FIGURE 8.5 U.S. Sugar Loan Rates, U.S. Prices, and World Prices, 1980–2002
U.S. raw sugar price
U.S. loan rate
World market price
0
10
20
30
1980 1985 1990 1995 2000
U.S. cents per pound, raw cane sugar
Source: USDA.

can be varied to meet the needs of low-incomedomestic or high-income foreign consumers. Rawcane sugar stores well after initial processing. Thereare few problems in meeting sanitary and healthstandards because sugar cane juice is boiled duringinitial processing and raw cane sugar is boiled againwhen refined to produce white sugar. The biggestproblems for producers are limited export oppor-tunities and low world prices—caused partly bypolicies in OECD countries.
Support for current OECD sugar policiesamong beneficiaries is obviously strong, but prob-lems are emerging that make change inevitable. Thebenefits of sugar policy reform are substantial, andthe gains are greatest under multilateral reform.According to recent studies of the global sugar andsweetener markets, the global welfare gains ofremoving all trade distortions and domestic sup-port are estimated to total as much as $4.7 billionper year. In countries with the highest protection(Europe, Indonesia, Japan, and the United States),net imports would increase by 15 million tons peryear. World sugar prices would increase about40 percent, while sugar prices in countries thatheavily protect their markets would decline. Thegreatest price decline would occur in Japan, wheresugar prices would fall 65 percent, followed by a40 percent decline in Western Europe and a 25 per-cent decline in the United States. Brazilian produc-ers would gain the most from liberalization, around$2.6 billion per year, offset by a loss of $1 billion toBrazilian consumers who would pay higher pricesunder liberalization. Employment in developingcountries would increase by approximately 1 mil-lion workers if the 15 million ton increase in netimports that accompanied the removal of all tradedistortions and domestic support were supplied bydeveloping countries.
The exporting countries that currently havepreferential access to European and U.S. sugar mar-kets gain about $0.8 billion per year through pricesthat are more than double world market price. Thevalue of the preference is less than it appears, how-ever, because many of these protected producershave high production costs and would not produceat world market prices. Further, world marketprices would rise by about 40 percent after full mul-tilateral liberalization, partially offsetting the loss toproducers of high prices in preferential markets.The net loss to these exporting countries from full
liberalization is estimated to total $0.45 billionper year.
The nature of reforms can have very differentconsequences for developing countries. If existingEU and U.S. polices are adjusted to accommodatehigher imports from countries in the EBA andNAFTA systems, low-cost producers such as Brazilwill lose. Full multilateral liberalization of theworld sugar market would allow efficient producersto expand production and exports, thereby benefit-ing consumers in protected markets. Coordinatedmultilateral liberalization also offers the advantageof somewhat higher world prices to soften theadjustment for producers in protected marketssuch as the European Union, Japan, and the UnitedStates.
Notes
1. Brazil’s policies on ethanol indirectly affect sugar, but thegovernment provides no direct subsidies to sugar producers.Other small sugar producers that produce at world marketprices include Canada and Malaysia.
2. An additional 1.8 million tons of sugar is imported underthe sugar protocol between the EU and the member countries ofACP (Africa, the Caribbean, and the Pacific) and reexportedwith subsidy after processing.
3. There appears to be an anomaly between the OECD’s esti-mate of producer support in table 8.4 and the prices received bysugar beet and sugar cane producers in Japan. If sugar beet andcane producers in Japan receive five times the prices in theUnited States, then it appears the Producer Support Estimate(PSE) in percentage form should be higher rather than lower asreported in table 8.4.
4. Nonrecourse commodity loans are used by the govern-ment to support prices of many crops. Under the program,farmers who comply with the provisions of each commodityprogram are allowed to pledge their commodity as collateral andobtain a loan from the USDA’s Commodity Credit Corporationat the specified loan rate per unit for the commodity. The bor-rower may elect to repay the loan with interest within a specifiedperiod and regain control of the commodity, or default on theloan as payment of the loan and interest. The farmer will nor-mally default on the loan if the market price is below the levelnecessary to repay the loan and interest. Thus, the loan ratebecomes the effective floor price.
5. This seems the opposite of what is required, but the logicis apparently that if imports exceed this amount then the sugarprogram has lost its ability to control imports and U.S. produc-ers should be given unrestricted freedom to produce.
References
Berg, C. 2001. World Ethanol Production 2001. Ratzeburg,Germany: F.O. Licht.
Borrell, B., and D. Pearce. 1999. “Sugar: The Taste Test ofTrade Liberalization.” Center for International Economics,Canberra and Sydney, Australia. September.
158 Global Agricultural Trade and Developing Countries

Devadoss, S., and J. Kropf. 1996. “Impact of Trade Liberalizationunder the Uruguay Round on the World Sugar Market.”Agricultural Economics 15: 83–96.
Diop, N., J.C. Beghin, and M. Sewadeh. 2004.“Groundnuts: Poli-cies, Global Trade Dynamics, and the Impact of Trade Liber-alization.” In M.A. Aksoy and J.C. Beghin, eds., Global Agri-cultural Trade and the Developing Countries. World Bank,Chapter 12.
European Commission. 2003. “Reforming the European Union’ssugar policy. Summary of impact assessment work.” Com-mission Staff Working Paper. Brussels.
Elbehri, A., T. Hertel, M. Ingco, and K. Pearson. 2000. “PartialLiberalization of the World Sugar Market: A General Equi-librium Analysis of Tariff-Rate Quota Regimes.” U.S.Department of Agriculture, Economic Research Service,Washington, D.C. August 25.
El-Obeid, A., and J.C. Beghin. 2004.“Multilateral Trade and Agri-cultural Policy Reforms in Sugar Markets,” CARD WorkingPaper 04-WP 356, Iowa State University, Ames, Iowa.
Escandon, J. 2002. “Mexico: Sugar and Ethanol Don’t Mix Well.”F. O. Licht’s International Sugar and Sweetener Report.Ratzeburg, Germany, June 27.
F. O. Licht. 2002. “India to Liberalize Its Sugar Market,” F. O.Licht’s International Sugar and Sweetener Report, March 4.
Fry, J. 1985. “Aspects of a Complex Commodity.” World BankWorking Paper. Commodities Division, Washington, D.C.
Fukuda, H., J. Dyck, and J. Stout. 2002. “Sweetener Policiesin Japan.” Electronic Outlook Report SSS-234-01. U.S.Department of Agriculture, Economic Research Service,Washington, D.C. September.
Haley, S., and N.R. Suarez. 2002. Sugar and Sweeteners Outlook.U.S. Department of Agriculture, Economic Research Service,Washington, D.C. September 26.
International Sugar Organization. 2002. “Quarterly MarketOutlook,” September, London.
Jolly, L. 2001.“Will China Ever Fill its WTO Sugar Tariff Quota?”International Sugar Association, London. Processed.
Levantis, T., F. Jotzo, and V. Tulpule. 2003. “Ending of EU SugarTrade Preferences: Potential Consequences for Fiji.” CurrentIssues 3 (2). Australian Bureau of Agricultural and ResourceEconomics, Canberra.
LMC International. 1999. “Pricing Policy Reform—A Sum-mary.” Sweetener Analysis.
Mitchell, D. 2004. “Sugar in the Caribbean: Adjusting to ErodingPreferences.” Policy Research Working Paper (forthcoming).World Bank, Washington, D.C.
Orden, D. 2003. “Sugar Policies and Implications: Integrationinto an FTAA.” Paper presented at the conference on
Agricultural Competitiveness and World Trade Liberaliza-tion: Implications of the WTO and FTAA, Fargo, NorthDakota, May 29.
Oregon Office of Energy. 2002. “Biomass Energy: Cost of Pro-duction.” Salem, Oregon.
Organisation for Economic Co-operation and Development(OECD). 2002a. Directorate for Food, Agriculture andFisheries “Working Party on Agricultural Policies andMarkets, Background Information on Selected Policy Issuesin the Sugar Sector.” Paris, June.
———. 2002b. Agricultural Policies in OECD Countries. Moni-toring and Evaluation. Paris, June.
Sheales, T.C. 2002. “Australia’s Sugar Industry: Operating in aFree-Market Environment,” in A. Schmitz, T.H. Spreen, W. A.Messina and C.B. Moss, eds. Sugar and Related SweetenerMarkets: International Perspectives. CABI Publishing,Wallingford, Oxfordshire.
Sheales, T.C., S. Gordon, A. Hafi, and C. Toyne. 1999. “SugarInternational Policies Affecting Market Expansion,” ABAREResearch Report 99.14. Australian Bureau of Agriculturaland Resource Economics, Canberra. November.
USDA. 2002. “Production, Supply, and Distribution” ForeignAgricultural Service (FAS). Washington D.C.
———. 2002. “Briefing Room Data for Sugar.” EconomicResearch Service. Washington, D.C.
———. 2003. “European Union Sugar Annual”, Global Agricul-ture Information Network Report, Foreign Agricultural Ser-vice (FAS). Washington D.C.
U.S. General Accounting Office (USGAO). 1993. “Sugar Pro-gram: Changing Domestic and International ConditionsRequire Program Changes.” Report GAO/RCED-93-84,April, Washington, D.C.
———. 2000. “Sugar Program: Supporting Sugar Prices HasIncreased Users’ Cost While Benefiting Producers.” ReportGAO/RCED-00-126, June, Washington, D.C.
U.S. International Trade Commission (USITC). 2002. “TheEconomic Effects of Significant U.S. Import Restraints,Third Update 2002.” Publication 3519. Washington, D.C.June.
van der Mensbrugghe, D., J.C. Beghin, and D. Mitchell. 2003.“Modeling Tariff Rate Quotas in a Global Context: The Caseof Sugar Markets in OECD Countries.” CARD WorkingPaper 03-WP 343. Iowa State University, Ames, Iowa.
Wohlgenant, M.K. 1999. “Effects of Trade Liberalization on theWorld Sugar Market.” United Nations Food and AgricultureOrganization, Rome.
Sugar Policies: An Opportunity for Change 159

tion in industrialized countries are also importantsources of economies in procurement, processingand logistics, and foreign direct investment.
Policy reforms leading to free markets wouldpitch consumers against producers in most coun-tries because of the large transfers implied by cur-rent policies and their removal. In importing coun-tries with high barriers (Asia), consumers’ gains arelarger than producers’ losses because the dairy sec-tor is small. In competitively producing countries,consumers currently benefit from depressed worlddairy prices and low trade barriers and have muchto lose in undistorted markets, whereas producershave much to gain. The largest net welfare gainswould accrue in the Quad, however, because largeconsumer gains and reduced budgetary costs forsupport policies would be much larger than pro-ducers’ losses. In most other countries, net effi-ciency gains would remain small because the gainsto one group would be offset by losses to the other.Our simulations also show the production gainsfrom trade liberalization are captured by dynamicreformers attracting foreign direct investment andovercoming supply constraints and technologytransfers.1
World dairy markets exhibit an extreme case of dis-tortions traceable to a complex system of domesticand international trade barriers—including sur-plus disposal in the Quad countries (Canada,European Union, Japan, and the United States) andthe Republic of Korea. Oceania (Australia and NewZealand)—which, with the Quad, dominates theexport market—is a competitive exporter with fewdistortions. However, dairy interest groups in theQuad are entrenched, and prospects for policyreforms appear dim. Domestic price discrimina-tion schemes in the Quad (minus Japan) rely heav-ily on the ability to close borders, suggesting thatthe emphasis in the Doha negotiations should beon commitments to lower border protection toforce domestic reforms.
Despite the quagmire of distortions, dairy is adynamic sector with much growth potential, espe-cially in Asia, where dairy consumption has beenpropelled upward by income growth, urbanization,and westernization of diets. Dairy is also experienc-ing innovations in food processing, with value-added opportunities in traditional products andnew dairy-based protein ingredients facing fewtrade barriers. Concentration and vertical integra-
161
9
DAIRY: ASSESSING worldMARKETS AND POLICY
REFORMs: IMPLICATIONSFOR DEVELOPING
COUNTRIES
Tom Cox and Yong Zhu

162 Global Agricultural Trade and Developing Countries
Background on the World Dairy Sector
Milk Production and Dairy ProductManufacturing
Milk and dairy products are expensive to produce.Production of animal feed uses three to nine timesmore land than production of food plants thatproduce the same amount of protein (Bender1992). When food sufficiency is a problem in acountry, dairy is probably not an appropriate wayto produce food, because the nutritional conver-sion rate from grains to animals is low. In mostdeveloped countries, milk is produced by feedinganimals concentrates made from grains—these canbe used directly as human foods. Livestock feedrequires on average 7 kilocalories input for eachkilocalorie generated. The range extends from 16for beef production to 3 for broiler chickens, withmilk somewhere in between (Bender 1992).
Animal food production does not always com-pete with other food production, however. Someanimals, including sheep and cows, can be fed oninedible agricultural and industrial by-products(with limited alternative uses) to produce highlynutritional foods, or they can be grazed on mar-ginal land. Marginal land suitable for grazing isoften on small parcels in remote areas with lowpopulation density. Shipping perishable dairyproducts to urban consumers is expensive, as manydeveloping countries face production and distribu-tion challenges that constrain milk production,such as poor infrastructure and limited refrigera-tion facilities.
In Argentina, Australia, Ireland, and NewZealand, milk production occurs generally on largepastures within reach of relatively efficient trans-portation systems and with the support of betterhuman capital and technology. These factors pro-vide considerable advantage to these countries inproducing milk and dairy products in free-tradeenvironments. However, pasture-based milk farm-ing is seasonal and vulnerable to weather and natu-ral disasters.
Although raw animal milk is nutritious, only 5to 10 percent of milk is consumed in raw form inmost developed countries. Most raw milk isprocessed into derivative products in these coun-tries (FAO various years). These processing sectorscan be significant sources of income and employ-
ment to local economies. Derivative dairy products,or manufactured products, can be either in liquidform (standardized milk, pasteurized milk, cream,partly or totally skimmed milk, buttermilk), orproducts no longer liquid (cheese, butter, cream,condensed and evaporated milk, milk powder,casein).
Development of the dairy industry requires goodinfrastructure. A good transportation system, avail-ability of low-cost refrigeration technology, andgood packing technologies are all prerequisites foran advanced dairy manufacturing sector. Mostdeveloping countries have poor conditions for dairymanufacturing. In those that lack an adequate milksupply and infrastructure to process and distributemilk, people reconstitute milk powder and butter oilback to fluid form to meet daily consumptionneeds. In many countries, commercial milk combi-nation, which reestablishes the product’s specifiedfat-to-nonfat solids ratio and solids-to-water ratio,is widely used.
Overall, approximately one-third of world milkis consumed in fluid form. About one-fourth isused in cheese making. The joint production ofbutter, milk powder, and casein uses roughly one-fifth of all milk. The remainder is processed intosoft or frozen products, condensed and evaporatedmilk, or other dairy products.
Derivative products satisfy specific consumptionneeds. Simple technologies for separating andrecombining nutritional components of milk havelowered the cost of processing and made it possibleto adjust fat content to different dietary needs.Cheese and butter do not require advanced technol-ogy. The production of milk protein concentratesand whey and lactose milk fractionations, however,is relatively new technology. Milk protein concen-trates and whey and lactose products are importantin the world dairy markets, where most buyers aredeveloping countries, countries with low self-sufficiency in dairy production, and developedeconomies with relatively low trade barriers onthese products.
Skim milk powder, whole milk powder, butteroil, and even butter are important inputs in aspecial dairy processing practice called milk recon-stitution, a technology that converts milk powder,milk fat products, and other dairy products back tofluid milk for consumption or for making otherdairy products. With the rapid development of

dairy processing technology, milk reconstitutionbecomes commercially practical and desirable, evenin more advanced dairy-producing countries wherefresh milk is readily available.
Fluid milk is a major product of milk reconstitu-tion in developing countries. In developed countriesand countries with dairy foods in the traditionaldiet, “hard” dairy products, such as cheese, are pro-duced through milk reconstitution. The recentgrowth of trade in milk powder and butter oil ispartially attributable to the improvement in milkreconstitution technology in many dairy-importingcountries. Milk reconstitution overcomes hightransportation and storage costs. Trade distortionsand investment decisions in the dairy manufactur-ing sector also make reconstitution desirable. Manydeveloping countries reconstitute fluid milk basedon cheap milk powder available in world markets.For example, Mexico makes cheese by reconstitut-ing imported skim milk powder and adding veg-etable oil (filled milk).
Besides technical difficulties and additionalcosts involved in milk reconstitution, other prob-lems limit the practice of this technology. Thereconstituted dairy products are often consideredto be inferior substitutes for fresh-milk-basedproducts. In addition, milk reconstitution fromdried dairy ingredients often induces a loss ofnutrients due to the heat required to condense anddry milk.
World Milk Production Trends
In the last decade, world milk production wasbetween 445 million and 470 million metric tons.The Quad and Oceania’s share of this productionwas around 42 percent, while the share from East-ern Europe and the Former Soviet Union (FSU)fell steadily from 27 percent to 16.8 percent. Thereis some reason to expect that the decline in theshare of Eastern Europe and the FSU in worldmilk production may be reversed as several keymilk-producing countries (Poland, Hungary, andBaltic countries join the European Union (EU) in2004.
South Asia (India and other South Asian Coun-tries) and Sub-Saharan Africa increased their shareof world milk production slightly from just under20 percent in 1990 to more than 20 percent by2000. Similarly, other developing countries and
regions (China, Korea, other Southeast Asia,Middle East and North Africa, and Central andSouth America) increased their combined sharefrom just over 10 percent in 1990 to almost 20 per-cent in 2000. These trends indicate significantchanges in the production of milk in the develop-ing regions. For example, growth in South Asia andthe Middle East and North Africa was 3.8 percentannually, in sharp contrast to the negative growthof –3.5 percent recorded in Eastern Europe andthe FSU.
About 25 percent of world milk was produced inWestern Europe before the 1994 Uruguay RoundAgreement on Agriculture (URAA) (FAO variousyears). After 1994 Western Europe’s share of worldmilk production began to dip slowly, falling to23 percent in 2000. Nevertheless, Western Europeremains a key factor in world dairy markets. Theshare of world milk production of the United Statesand Canada remained relatively constant at around14 percent before (1989–1994) and after (1995–2000) the URAA. The share of Oceania in worldmilk production increased slightly, reaching 4 per-cent in 2000. Japan’s share of world milk produc-tion remained relatively constant at around 1.5 per-cent over the same periods.
In China, Korea, and the rest of Southeast Asia,a steady increase in share occurred both beforeand after the URAA, reaching 2.8 percent in 2000.Much of the growth occurred in China and Korea.India, as well, showed a steady growth in share ofworld milk production before and after the URAAperiods. That share stood at 13.8 percent in 2000.India appears to be expanding its activity in worldexport markets, particularly for butter fat products(butter, ghee/anhydrous milk fat). The share ofother countries in South Asia reached 5.1 percentin 2000.
Central and South America showed stronggrowth in share of world milk production bothbefore and after the URAA. Its share is now 10.5 per-cent. Expansion in this region is dominated byArgentina and, to a lesser extent, Uruguay, Brazil,and Mexico. Sub-Saharan Africa, including SouthAfrica, has held relatively steady at around 3 per-cent of world milk production, suggesting that milkproduction and dairy processing are not expandingas rapidly in southern Africa as in other developingeconomies. Disparity in regional income growthlikely plays a key role in this trend.
Dairy: Assessing World Markets and Policy Reforms: Implications for Developing Countries 163

Trends in the World Dairy Trade
Dairy products exhibit two-way trade because theyare differentiated products.2 Over the 1989–2000period, world dairy exports increased more or lesssteadily from 25.6 million to 39.1 million metrictons, with no difference between the pre- and post-URAA periods. World dairy exports are dominatedby the developed economies (Quad and Oceania),but their share of the markets shrank from 87 per-cent in 1989 to 78 percent in 2000. Developedcountries’ share of world dairy exports grew anaverage 2.9 percent annually in 1989–2000. Exportsrepresented 9.7 percent of the developed countries’total milk production in 1989; that share hadgrown to 12.4 percent by 2000. World dairyimports increased more or less steadily, from26 million to 36 million metric tons (FAO, variousyears). World dairy imports in the pre-URAAperiod (1989–94) averaged 27 million metric tons,increasing to 33 million metric tons in 1995–2000period.
Comparison of dairy exports as a share of totalmilk production before and after the URAA pro-vides some informal evidence that the dairy tradeliberalization during the Uruguay Round increasedthe importance of exports in the world’s dairyeconomies. Developed countries’ (Quad and Ocea-nia) import market shares—16 percent (4 millionmetric tons) in 1989 and 20 percent (7 million met-ric tons) in 2000—grew an average 4.8 percentannually, but average annual growth was muchfaster after the URAA (7.3 percent). Japan is a largeimporter of high value-added dairy products, suchas cheese and casein. Its demand for dairy productsis driven by high incomes, more Westernized diets,and the inability of domestic supply to satisfy thedemand growth despite protectionist policies.
Despite their decreased share of world milkproduction, Eastern Europe and the FSU increasedtheir share in world dairy exports from 7.6 per-cent to 11.6 percent during the period under study.Those exports represented 1.3 percent of total milkproduction in the region in 1989 and increasedmore than three-fold, to 4.8 percent, by 2000.Eastern Europe and the FSU are relatively smallimporters, with imports fluctuating in the 3 million–4 million metric ton range. Import growth slowed inthe years after the URAA (–5.9 percent). Lowgrowth rates in gross domestic product (GDP),
rather than URAA-induced trade liberalization, arelikely responsible for most of these changes.
Other developing economies (China, Korea,other Southeast Asia, Middle East and NorthAfrica, and Central and South America almostdoubled their share of world dairy exports from5.3 percent in 1989 to 9.6 percent by 2000; muchof the increase came from the Southern Cone(Argentina, Chile, and Uruguay), where exportsrepresented 1.9 percent of total milk production in1989 and 3.6 percent by 2000.
In South Asia (India and other South Asiancountries) and Sub-Saharan Africa (includingSouth Africa), which are primarily importers,exports represented less than 1 percent of totalmilk production in 1989–2000. The share of worlddairy imports for these two regions was 9–10 per-cent (3 million metric tons) over the same period.The dominant countries in these regions (Indiaand South Africa) are either self-sufficient or netexporters. Overall, the participation of SouthAsian countries in world dairy trade has been lim-ited, because most countries in the region strive forself-sufficiency in food; both imports and exportsof dairy products are restricted by the government.Imports consist of intermediate products such asbutter oil, milk powder, and condensed milk,mostly obtained from food aid programs fromWestern countries.
The Middle East and North Africa are signifi-cant importers of dairy products, accounting for21 percent of total world imports of dairy products.Lacking natural resources to expand their milk pro-duction, the countries of this region will continueto rely on imports to meet their increasing con-sumption needs.
Import substitution policies and economichardship in Central and South America have pre-vented these countries from fully exploiting theirsignificant comparative advantage in agriculture,though some South American countries increas-ingly participate in world and regional dairy trade.Under more stable macroeconomic environmentsand regional trade agreements, Latin Americancountries, have increased trade volume consider-ably. Latin America imports about 18 percent ofworld dairy trade while exporting 2 percent. Mexicois the world’s largest importer of milk powder,accounting for some 10 percent of total world trade.Brazil is a significant importer of dairy products,
164 Global Agricultural Trade and Developing Countries
most of which are imported from its Mercosur part-ners, Argentina and Uruguay. The European Unionis also a big player in the Brazilian market, butBrazil’s dependence on imports will likely changewith the rapid adoption of new technology indomestic milk production and dairy processing.
Other African countries are net importers(mostly through food aid programs), accountingfor about 6 percent of total world trade. Reducedgovernment intervention in agriculture, propelledby the URAA and other factors, will result inreducing food aid to traditional recipients, includ-ing the Sub-Saharan countries. A significant pro-portion of food aid has been redirected to transi-tional economies. The affordability of commercialimports of dairy products (without current exportsubsidies) is questionable for many Africancountries.
Trade and Domestic PolicyRegimes in Key Producing andConsuming Countries
Developed Economies: Quad and Oceania
Most developed countries intervene in theirdomestic dairy sectors with a wide variety of policyinstruments. Intervention prices (price supportprograms) establish minimum domestic prices thatare generally well above world market levels. This istrue for butter and skim milk powder (SMP) inCanada and the European Union; for butter,cheese, and SMP in the United States, althoughSMP is priced near world-market levels.
Canada and the European Union use a system ofmilk production and marketing quotas to limit theproduction of milk and reduce the cost of protect-ing the domestic milk- and dairy-processing sec-tors. These policies have generated substantive“quota rents” to the holders of the quotas.
Canada and the United States use classified pric-ing schemes to enhance market returns for dairyfarmers based on how their milk is used. Generallythese are price-discrimination schemes that admin-ister higher prices to less elastic, higher-value-added, and more perishable product markets (bev-erage milks, soft and frozen products). To theextent that these premium markets are nontrad-able, such schemes can help insulate domestic mar-kets from world market forces. In addition, becausethey increase milk prices above the competitive
equilibrium price, more milk is generated, less pre-mium milk is consumed (due to the higher admin-istered prices), and the prices for manufacturedmilk are depressed relative to a competitive, non-distorted equilibrium. In a sense, these classifiedpricing schemes generate consumption cross-subsidies to manufactured products (and theconsumers and processors who purchase theseproducts) at the expense of the consumers ofpremium products. To the extent that these cross-subsidized manufactured products are exported,there is an open question as to whether the implicit,consumption cross-subsidies are in fact exportsubsidies.
In the case of Canada, several of the dairy classifi-cations targeted to compete on export markets (theworld or the U.S. market) have been deemed exportsubsidies generated by government intervention—hence countable against URAA export-subsidycommitments.
Canada, the European Union, and the UnitedStates also use a variety of other subsidies in pro-duction, marketing, and export financing. Amongthese are the European Union’s consumption subsi-dies on butter (60 percent of EU butter is subsi-dized for use by the bakery sector) and skim milkpowder (45 percent is subsidized for animal feed).
Market access under the URAA is controlled pri-marily by tariff rate quotas, a system of in-quotatariffs up to a negotiated limit, and a series of out-of-quota tariffs that are generally quite prohibitive.In addition, a variety of sanitary, phytosanitary, andtechnical trade restrictions (such as country-levelstandards of identity) act as nontariff barriers andimpede global trade in dairy products.
Developed countries agreed in the URAA toincrease their import quotas to 5 percent of con-sumption by 2000. Similarly, in- and out-of-quotatariffs were to be reduced 16 percent over six years,by 2000. Table 9.1 summarizes the URAA increasesin dairy import quotas for the developed countries.Table 9.2 summarizes the URAA dairy producttariff reductions.
Under the URAA, the European Union andUnited States were obliged to make the greatestincreases in access to their domestic markets, par-ticularly for cheese, butter, butter oil, and skim milkpowder. Australia, Canada, and Japan endured lessmarket access change under the URAA since manyof their dairy product imports were already in
Dairy: Assessing World Markets and Policy Reforms: Implications for Developing Countries 165

excess of the requirement of 5 percent of domesticconsumption (by 2000). The level of most out-of-quota tariffs is prohibitive, with the result that tariffrate quotas act as pure import quotas for manyproducts in developed countries.
The heavy intervention in domestic dairy mar-kets by the developed countries often generates sur-plus production relative to domestic consumptionrequirements. Because the domestic policies usu-ally keep domestic prices above world marketlevels, many developed countries—particularlyCanada, the European Union, and the UnitedStates—are forced to export these surpluses withconsiderable subsidy. Those export subsidiesdepress world market prices, making cost-effectivedairy production more difficult in many develop-ing countries. While frustrating potential milk pro-ducers, consumers in these developing countriesgain substantively from the transfer of wealth,which comes in the form of cheaper dairy imports.3
Since Australia substantially deregulated itsdomestic market in 2000–01, domestic market
protection has been radically reduced. Currently,Australian dairy exports are without explicit exportsubsidies.
Eastern Europe and Baltics
Among World Trade Organization (WTO) membersin Eastern Europe, only the Czech Republic andEstonia use Green Box policies to support theirdomestic dairy industry. These policies are limited.Under its Domestic Food Aid Plan, the CzechRepublic donates milk to schools. The program’smonetary value reached $0.74 million in 2000.At thesame time, the Czech government paid $4.7 millionin support to dairy cow herds through structuraladjustment assistance provided through an invest-ment aids plan. The monetary value of Estonia’sschool milk program value was small ($0.6 millionin 2001) (Megli, Peng, and Soufi 2002).
The dairy industry is important in EasternEurope. Many countries in the region use AmberBox policies to support its development. Some even
166 Global Agricultural Trade and Developing Countries
TABLE 9.1 Dairy Import Quotas for the Developed Countries under the URAA(1000 tons)
Butter, Skim Milk Whole MilkCountry/Region Policy Regime Cheese Butter Oil Powder Powder
Western Europe BASE 37.0 79.5 41.2 0.7GATT 2000 123.1 91.3 69.2 1.1GATT 2005 194.7 101.0 92.6 1.5
Eastern Europe BASE 6.9 12.6 10.5 3.0GATT 2000 8.8 20.9 19.0 5.0GATT 2005 10.4 27.8 26.1 6.7
Japan BASE na 3.5 99.8 0.0GATT 2000 na 3.5 99.8 0.0GATT 2005 na 3.5 99.8 0.0
Australia BASE 11.5 na na naGATT 2000 11.5 na na naGATT 2005 11.5 na na na
Canada BASE 20.4 2.0 0.9 0.0GATT 2000 20.4 3.3 0.9 0.0GATT 2005 20.4 4.4 0.9 0.0
United States BASE 116.4 7.5 1.3 0.5GATT 2000 136.4 13.1 5.3 3.4GATT 2005 153.1 17.7 8.6 5.9
na — Not availableData source: International Dairy Arrangement, Fifteenth Annual Report. November 1994.BASE and GATT 2000 follow the URAA of the GATT (General Agreement on Tariffs and Trade), assume linearchanges.GATT 2005 projects the Uruguay Round Agreement linearly to 2005.
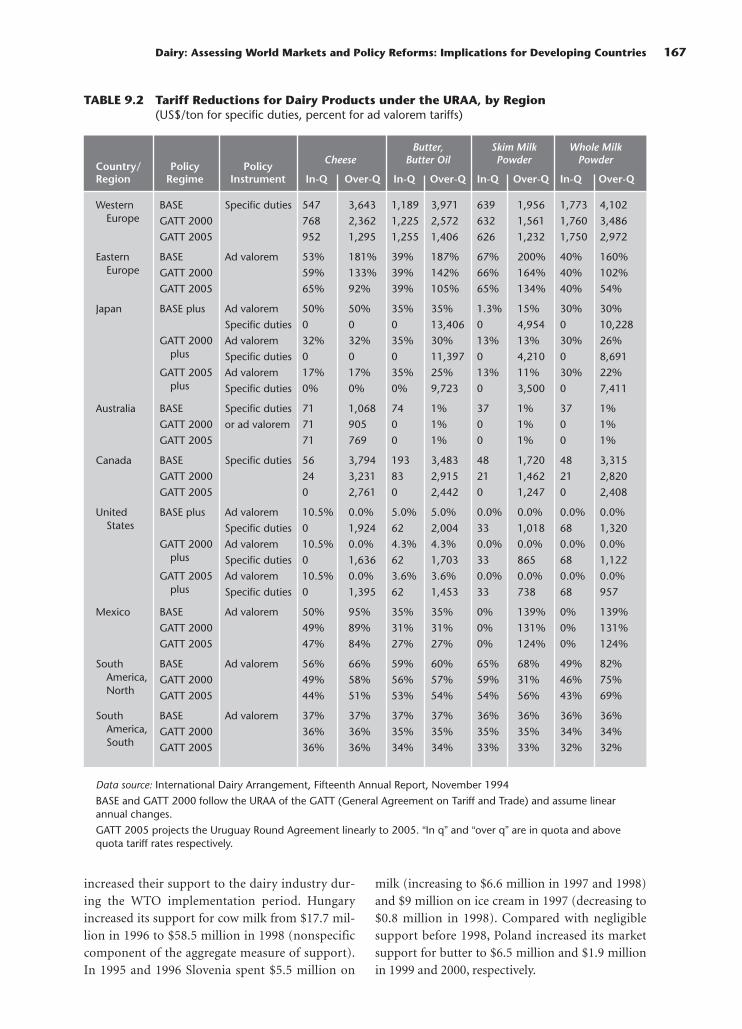
increased their support to the dairy industry dur-ing the WTO implementation period. Hungaryincreased its support for cow milk from $17.7 mil-lion in 1996 to $58.5 million in 1998 (nonspecificcomponent of the aggregate measure of support).In 1995 and 1996 Slovenia spent $5.5 million on
milk (increasing to $6.6 million in 1997 and 1998)and $9 million on ice cream in 1997 (decreasing to$0.8 million in 1998). Compared with negligiblesupport before 1998, Poland increased its marketsupport for butter to $6.5 million and $1.9 millionin 1999 and 2000, respectively.
Dairy: Assessing World Markets and Policy Reforms: Implications for Developing Countries 167
TABLE 9.2 Tariff Reductions for Dairy Products under the URAA, by Region(US$/ton for specific duties, percent for ad valorem tariffs)
Butter, Skim Milk Whole Milk
Country/ Policy PolicyCheese Butter Oil Powder Powder
Region Regime Instrument In-Q Over-Q In-Q Over-Q In-Q Over-Q In-Q Over-Q
Western BASE Specific duties 547 3,643 1,189 3,971 639 1,956 1,773 4,102Europe GATT 2000 768 2,362 1,225 2,572 632 1,561 1,760 3,486
GATT 2005 952 1,295 1,255 1,406 626 1,232 1,750 2,972
Eastern BASE Ad valorem 53% 181% 39% 187% 67% 200% 40% 160%Europe GATT 2000 59% 133% 39% 142% 66% 164% 40% 102%
GATT 2005 65% 92% 39% 105% 65% 134% 40% 54%
Japan BASE plus Ad valorem 50% 50% 35% 35% 1.3% 15% 30% 30%
Specific duties 0 0 0 13,406 0 4,954 0 10,228
GATT 2000 Ad valorem 32% 32% 35% 30% 13% 13% 30% 26%plus Specific duties 0 0 0 11,397 0 4,210 0 8,691
GATT 2005 Ad valorem 17% 17% 35% 25% 13% 11% 30% 22%plus Specific duties 0% 0% 0% 9,723 0 3,500 0 7,411
Australia BASE Specific duties 71 1,068 74 1% 37 1% 37 1%
GATT 2000 or ad valorem 71 905 0 1% 0 1% 0 1%
GATT 2005 71 769 0 1% 0 1% 0 1%
Canada BASE Specific duties 56 3,794 193 3,483 48 1,720 48 3,315
GATT 2000 24 3,231 83 2,915 21 1,462 21 2,820
GATT 2005 0 2,761 0 2,442 0 1,247 0 2,408
United BASE plus Ad valorem 10.5% 0.0% 5.0% 5.0% 0.0% 0.0% 0.0% 0.0%States Specific duties 0 1,924 62 2,004 33 1,018 68 1,320
GATT 2000 Ad valorem 10.5% 0.0% 4.3% 4.3% 0.0% 0.0% 0.0% 0.0%plus Specific duties 0 1,636 62 1,703 33 865 68 1,122
GATT 2005 Ad valorem 10.5% 0.0% 3.6% 3.6% 0.0% 0.0% 0.0% 0.0%plus Specific duties 0 1,395 62 1,453 33 738 68 957
Mexico BASE Ad valorem 50% 95% 35% 35% 0% 139% 0% 139%
GATT 2000 49% 89% 31% 31% 0% 131% 0% 131%
GATT 2005 47% 84% 27% 27% 0% 124% 0% 124%
South BASE Ad valorem 56% 66% 59% 60% 65% 68% 49% 82%America, GATT 2000 49% 58% 56% 57% 59% 31% 46% 75%North GATT 2005 44% 51% 53% 54% 54% 56% 43% 69%
South BASE Ad valorem 37% 37% 37% 37% 36% 36% 36% 36%America, GATT 2000 36% 36% 35% 35% 35% 35% 34% 34%South GATT 2005 36% 36% 34% 34% 33% 33% 32% 32%
Data source: International Dairy Arrangement, Fifteenth Annual Report, November 1994
BASE and GATT 2000 follow the URAA of the GATT (General Agreement on Tariff and Trade) and assume linearannual changes.
GATT 2005 projects the Uruguay Round Agreement linearly to 2005. “In q” and “over q” are in quota and abovequota tariff rates respectively.

Some countries apply tariff rate quotas (TRQ)on dairy imports to protect their domestic markets.The Czech Republic applies TRQs to milk, cream,yogurt, butter, and ice cream. While the fill rate forice cream and yogurt is relatively high, it is low forbutter and even less for milk and cream (less than1 percent). Similarly, the fill rates for butter inSlovenia and the Slovak Republic are quite low asthey are for milk and cream in Hungary andPoland. The resulting reduction in market accesscontributes to distortions in world dairy markets,but the levels are small, reflecting the modest levelsof both trade and support.
The countries of Eastern Europe use differentmethods to administer TRQs. The Czech Republicuses a first-come-first-served method to allocatethem. Hungary uses licenses on demand. For milkand cream Poland applies licenses on demand; forother dairy products it uses the applied-tariffmethod. Slovenia and the Slovak Republic apply alicense-on-demand method to allocate TRQs. Nomatter which method is used, additional importcosts are incurred, and imports are restricted.
Milk powder, butter, cheese, casein, yogurt,creams, and some other dairy products receiveexport subsidy from the Czech Republic, Poland,and the Slovak Republic. The actual level of exportsubsidies is much lower than the commitment lev-els, however, and these levels have been decreasingover time.
Latin America
A major question regarding the future of dairy pol-icy and trade agreements in South America iswhether the Mercosur countries will join with theNAFTA countries in creating a Free Trade Area ofthe Americas, or FTAA. Initiated in 1994 with nego-tiations to be finished by 2005, the FTAA project isconsidered a single undertaking: nothing is agreeduntil all is agreed. If implemented, major changescan be expected for trade policies in South America,especially for the Mercosur countries (Megli 2002).
Current trade policies in South America revolvemainly around the Mercosur policies for the fourmain economies of Argentina, Brazil, Paraguay, andUruguay. Negotiations are under way to bring Chileand Bolivia into full member status, and futurenegotiations are expected to take place for Colombia,Peru, and Venezuela.
The implementation of a set of common exter-nal tariffs and a substantive (if not total) elimina-tion of internal tariffs and nontariff barriers inMercosur countries began in 1995. Certain prod-ucts or regions are exempted from these regulationsuntil 2006. Mercosur has 11 different tariff levelsbounded by 20 percent; exceptions can be greaterthan 20 percent but no more than 35 percent. As aresult of this common market, trade among themember countries increased from $4.7 billion in1991 to $18 billion in 1998.
Other trade agreements exist between countriesin South America. The Andean Group consists ofBolivia, Chile, Colombia, Ecuador, and Peru, whilethe Group of Three is made up of Colombia,Mexico, and Venezuela. Bilateral agreements arealso common (Bolivia-Mexico; Brazil-Argentina).Chile’s tariff rates are around 8 percent for mostdairy products. Peru has rates of 20 percent onmost dairy products, with a surcharge of 5 percent.Both countries are members of the Asia PacificEconomic Cooperation (APEC). Argentina’s agri-cultural sector enjoys export rebates that rangefrom 1.4 to 10 percent. Brazil has a system of exportcredits and cash advances for exported products.
East Asia and South Asia
Income, price, tastes, age, and geography are mainfactors affecting dairy consumption in Asia.4 China,India, Indonesia, Japan, the Republic of Korea,Malaysia, Philippines, Thailand, and Singapore—all WTO members—are the main dairy producersand consumers in the region. Because dairy prod-ucts are not necessary products in Asia, income isthe major factor affecting their consumption. Whenincome goes up, dairy consumption will increase, ascan be seen from the experience of China, Japan,and the Republic of Korea. Although the threecountries show similar patterns of food consump-tion behavior, Japan’s per capita GDP is muchhigher than those of Korea and China, and its percapita consumption of dairy products is 66 and23 kilograms more, respectively.
In developed countries and cities of developingcountries, dairy products represent a small portionof total expenditure. Thus, consumers’ reaction toprice change is not highly sensitive. In rural areas ofdeveloping countries, however, where dairy prod-ucts are a luxury, consumption is highly sensitive toprice changes.
168 Global Agricultural Trade and Developing Countries

Most of the dairy products consumed in Asia arefluid milk, yogurt, and milk powder. In 1999, forexample, Asia’s consumption of fluid milk andmilk powder accounted for 97 percent of dairyconsumption.
People in dairy-producing areas tend to con-sume more dairy products than in other regions,due to easy and convenient access. This may explainwhy per capita dairy consumption in South Asia ishigher than in East Asia, even though its per capitaGDP is much lower.
From countries’ notifications to the WTO Agri-culture Committee, we find that only Japan usesGreen Box policies to support domestic dairy mar-ket in school-lunch programs. Another potentialuser of this policy may be China, which has begun aprogram to provide subsidized milk for school chil-dren in some cities and expects to expand it to therest of the country.
With the exception of Japan and Korea, mostcountries in East Asia show a negative or de mini-mus aggregate level of support for agriculture(Amber Box policy). Japan uses price support pro-grams for certain dairy products (mainly butterand skimmed milk powder), and also makes defi-ciency payments for calves and milk manufactur-ing. In 2000 Japan’s milk-producer support esti-mate (PSE) reached $4.7 billion; the nominalprotection coefficient for milk in 1999 was 364 per-cent (OECD 2001). Korea’s milk producers receivemore than three times the world price for milk. ThePSE for Korean milk reached $0.8 billion in 2000;the nominal protection coefficient in 1999 was225 percent. No Asian country uses blue-box poli-cies to support their dairy sectors.
East Asia protects its dairy markets, and entry ofmany imports is governed by tariff rate quotas andhigh tariffs. The scale and scope of tariffs differwidely, however. China, India, Japan, and Koreaimpose relatively higher tariffs on dairy productsthan do Indonesia, the Philippines, Malaysia, andSingapore. Ten dairy exports to Japan, five to SouthKorea, two to Malaysia, and just one to Indonesiaare subject to tariff rate quotas. Japan’s and Korea’stariff rate quotas are allocated on a global basis. Forwhey and skim milk powder, Japan’s tariff rate quo-tas are allocated to producers and producer organi-zations or sellers of mixed feed. For skim milk pow-der, whole milk powder, and other milk and cream,Korea’s tariff rate quotas are allocated according to
the highest-price bidders at quota auctions held bythe livestock products marketing organization. InJapan, the tariff rate quota fill rates for skimmedmilk powder, whey, and butter are around 50 per-cent. South Korea and Malaysia have higher fillrates, but real imports are still lower than tariff ratequotas. Indonesia has out-of-quota imports, andthe tariff rate quota fill rate is 100 percent.
World dairy trade liberalization would increasethe region’s imports.
The Middle East and North Africa
Dairy tariff levels in the Middle East and NorthAfrica vary greatly among countries and products.They appear to be relatively high for nonconcen-trated milk, cream, and yogurt, for example, andlower for milk powder and butter.5 In addition totariffs, countries implement regulations aimed atprotecting dairy consumers from fraud. Such regu-lations impose technical requirements related toproduct composition and associated customs pro-cedures such as sanitary certifications. There arevarious bilateral trade arrangements between theEuropean Union and the countries of the region.
Import tariffs directly affect the supply of dairyproducts in the Middle East and North Africa. Forinstance, relatively high tariffs on milk powder tendto increase raw milk supply, while low tariffs on rawmilk handicap local production. Also, low importtariffs on raw materials and equipment stimulatethe production of processed dairy products and thederived demand for raw milk. Subsidies are not themain incentive tool used to encourage raw milksupply in the Middle East and North Africa. Wheresubsidies exist, they support production or trans-portation, but their level is not always effective.
The Impact of World Dairy Policy Reforms
Considerable scope remains for further removal oftrade and domestic support policy distortions inthe Doha Round. Even after full implementation ofthe URAA provisions by developed countries,almost 60 percent of world dairy trade will still beexported with subsidies (U.S. Dairy Export Council1999). Market access provisions allow for tariff ratequotas with prohibitively high rates of out-of-quota duty (Griffin 1999). Also, special safeguards,
Dairy: Assessing World Markets and Policy Reforms: Implications for Developing Countries 169
low minimum-access requirements, and small tariffreduction requirements for individual commodi-ties undermine the market access provisions of theURAA (Coleman 1998). Thus, even after fullimplementation, world dairy markets will continueto be characterized by highly subsidized exports,limited market access, and heavy governmentintervention.
As part of the URAA, countries agreed to beginnew agricultural negotiations by the beginning of2000, and dairy groups in several countries havedetailed their policy objectives and positions for theDoha Round. U.S. dairy industry representativesoutlined their negotiating priorities early on (U.S.Dairy Export Council 1999). Those prioritiesinclude gradual elimination of export subsidies,reduction and harmonization of high tariffs, andtightening disciplines on domestic supports. Byeliminating export subsidies and reducing importbarriers, it is assumed that world prices will risesufficiently for the United States to be competitivein world markets (Kirkpatrick 1998). Countries ofthe Cairns Group (with the exception of Canada),which represents small- and medium-sized agricul-tural exporters, are pushing for measures that goeven further toward freer markets and liberalizedtrade (Cairns Group Farm Ministers 1998). Whilethe negotiating goals of the European Union arenot yet articulated, their priorities will likelyinvolve minimizing increases in import access andreductions in export subsidies, as well as maintain-ing the Blue Box and the Peace Clause (OxfordAnalytica 1998).
The implications of alternative proposals ondeveloped versus developing countries are not wellresearched. This chapter addresses these questionsby simulating various dairy policy liberalizationscenarios using the University of Wisconsin-Madison World Dairy Model (UW-WDM).6 Theresults of the simulations provide insights into thetradeoffs between the heavily protected developedeconomies and the developing economies, provid-ing quantitative measures of the impact of thosetradeoffs on economic welfare and world trade.
World Dairy Deregulation Scenarios
A first scenario, discussed here in detail, contem-plates full dairy sector liberalization: all trade anddomestic support policies are removed between2001 and 2005. Full world dairy sector liberaliza-
tion combines two other scenarios: free dairy trade,and no domestic support. The free-dairy-trade sce-nario considers the elimination of all trade distor-tions for 2001 through 2005. All export subsidiesand import tariff rate quotas (quotas, in- and out-of-quota tariffs) are eliminated. Domestic supportpolicies are maintained as in the base scenario. Thisshould increase world trade, increase world marketprices, and put considerable strain on severaldomestic support policies (intervention price pro-grams, in particular) in the protected dairy sectors.The no-domestic-support scenario eliminates alldomestic supports from 2001 to 2005. These meas-ures include intervention prices for the EuropeanUnion (SMP), Canada (butter and SMP), theUnited States (butter, SMP, cheese), and othercountries; the elimination of classified pricing inthe United States and Canada (modeled as a pricepremium for residual—fluid, soft, and frozen—products over manufactured products); and elimi-nation of production and marketing quotas in theEuropean Union and Canada.
Because the United States incurred large costs inthe base year (2000) through its intervention/pricesupport program (about $500 million in SMP pur-chases), domestic deregulation would have strongimpacts on U.S. milk prices. Similarly, given thelarge levels of rents from milk-production quotasin the European Union and Canada (35 percentand 40 percent of the domestic milk prices, respec-tively), elimination of these policies would sharplyincrease these countries’ competitiveness (no quotaconstraints and sharply reduced production costs).Hence milk production would increase sharplyeven as milk prices and revenues drop.
Domestic deregulation would lower prices in theprotected dairy economies and thus lower worlddairy prices, but it would not necessarily widenaccess to competitive exports—unless out-of-quotatariffs became less prohibitive at the lower marketprices. Moreover, the increased milk production forthe European Union and Canada would need tofind a market, potentially beyond domestic con-sumption, and so would likely displace base-levelimports by these dairy sectors and reduce othercountries’ potential for export-market growth.
We focus our presentation of the simulationresults on the main scenario (full liberalization)and refer readers to the annex tables for the sepa-rate second and third scenarios.
170 Global Agricultural Trade and Developing Countries

Full world dairy sector liberalization. Devel-oped economies with dairy sectors characterized bystrong protection from domestic and trade policieswould experience large changes from full liberaliza-tion, with large transfers from producers to con-sumers. In the absence of rents from milk produc-tion quotas, EU milk prices would fall 23 percent by2005, generating a moderately competitive EU milksector and expanded production (approximately8 percent at prices roughly 20 percent less than baselevels by 2005). The expansion implies a potentiallyradical restructuring of the EU milk sector towardmore efficient farms. Dairy exports would increase16 percent, while imports would fall 50 percent by2005, suggesting that lower domestic prices (inter-vention price floors having been eliminated) andlarger domestic milk availability at sharply lowerprices (due to quota elimination) would cutimports. Currently competitive exporters, there-fore, would suffer. The current producer surpluswould take a massive hit of $8.1 billion by 2005,and the social and political costs of the implied rad-ical restructuring of the milk production sectorwould be nontrivial. Consumers would be the biggainers from deregulation (due to falling prices),with large welfare gains of $8.1 billion. Total gov-ernment costs would fall slightly (lost tariff rev-enues offset by reduced costs of domestic supportand export subsidies). Consumer and treasurygains would offset producer losses, yielding netwelfare gains of $1.1 billion.
The scenario would work similarly in Japan. By2005 Japanese milk production would fall by23 percent, milk prices by 54 percent, and the pro-ducer surplus by 61 percent (or $3.2 billion). Theconcurrent removal of domestic regulations wouldhave little effect because trade barriers sustain mostof the domestic programs. Imports would increaseby 134 percent, bringing consumers a surplus of$4 billion. Net government revenues would fall by$21 million (lost tariff revenues net of smallerdomestic policy savings). Consumer gains wouldoffset producer and treasury losses to generate netwelfare gains of $1.1 billion.
While the dairy sectors in Canada and theUnited States use both trade policies and domesticsupport programs, they derive more protectionfrom the former (subsidized exports and limitedmarket access due to import quotas and higher out-of-quota tariffs). Under the full liberalization sce-
nario, Canada’s milk prices would drop by 44 per-cent and production by 4 percent, significantlymore than under the no-domestic-support sce-nario. Dairy exports would fall by 6 percent, whileimports would increase 215 percent (versus 80 per-cent export expansion and 5 percent contraction ofimports, under the no-domestic-support scenario).Producer surpluses would be cut in half (to$1.4 billion) by 2005, but consumer welfare gainswould be even greater at $1.6 billion (up 14 per-cent). Total government revenues would fall slightly(lost tariff revenues being not quite offset by gainsfrom elimination of export subsidies, the interven-tion price program, and production and marketingsubsidies). Consumer welfare gains would offsetproducer and treasury losses, yielding a net welfaregain of 2.7 percent ($385 million).
In the United States, milk production (–7 per-cent), prices (–12 percent), and producer surplus(–17 percent, –$2.7 billion) would fall sharply by2005 under full liberalization, about three timesmore than under the no-domestic-support sce-nario. These relative impacts indicate that U.S pro-ducers enjoy substantive protection from currenttrade-policy distortions. U.S. exports would fall61 percent (down 331,000 metric tons), whileimports would more than double (130 percent,510,000 metric tons) by 2005. U.S. consumerswould gain $3.4 billion (4 percent); governmentcosts would be reduced by $147 million (lost tariffrevenues net of gains from eliminating interventionprice and export subsidy costs). These gains wouldexceed producer losses by $2.7 billion to generatenet welfare gains of $729 million (0.7 percent) by2005.
As expected, Oceania’s dairy producers andprocessors would gain under full liberalization,despite giving up large quota rents (especially NewZealand) associated with current preferential(quota) access to the protected developed-economymarkets. As low-cost exporters, Australia and NewZealand would be able to fully exploit their com-parative advantage in undistorted world dairy mar-kets, increasing milk production by 6 percent, pro-ducer prices by 22 percent, and the producersurplus by 42 percent, or $1.1 billion, by 2005.Their exports would rise by 21 percent, or 429,000metric tons, by 2005. The production and tradegains would be less than under the free-trade-alonescenario, because that scenario would not increase
Dairy: Assessing World Markets and Policy Reforms: Implications for Developing Countries 171

TAB
LE 9
.3Fu
ll L
iber
aliz
atio
n o
f Tr
ade
and
Do
mes
tic
Sup
po
rt: C
han
ges
fro
m 2
005 B
asel
ine
Milk
Pro
duc
tio
nM
ilk P
rice
Tota
l Go
v(p
erce
nta
ge
(per
cen
tag
ePr
oduc
er S
urpl
usC
onsu
mer
Sur
plus
Rev
/Co
sts
Tota
l Wel
fare
Co
untr
y/R
egio
nch
ang
e)ch
ang
e)$U
S M
% C
han
ge
$US
M%
Ch
ang
e($
US
M)
$US
M%
Ch
ang
e
Dev
elop
ing
Econ
omie
s,Po
tent
ially
Com
peti
tive
Expo
rter
s
Indi
a1.
41.
297
26.
0(9
93)
−1.3
(2)
(95)
−0.1
Oth
er E
aste
rn E
urop
e4.
34.
455
11.4
(66)
−2.9
(36)
(13)
−0.5
Sout
h A
mer
ica,
Sou
th6.
58.
660
1.7
(516
)−2
.8(2
)(1
8)−0
.1C
hina
, Mon
golia
0.4
14.3
498
17.4
(57)
−0.4
(74)
(33)
−0.2
Pola
nd
3.3
10.4
247
13.1
(236
)−1
.9(0
)9
0.1
Sout
h A
fric
an R
epub
lic3.
824
.266
937
.0(6
92)
−7.0
1(2
2)−0
.2To
tal:
2.6
—2,
501
9.3
(2,5
60)
−1.9
(114
)(1
73)
−0.1
Dev
elop
ing
Econ
omie
s, N
et Im
port
ers
Form
er S
ovie
t U
nion
4.0
−1.0
2,56
223
.1(2
,574
)−4
.0(4
43)
(16)
0.0
Sout
h A
mer
ica,
Nor
th−5
.7−1
.0(1
,445
)−1
8.0
1,70
73.
3(1
33)
129
0.2
Oth
er S
outh
Asi
a−0
.1−0
.1(1
2)−0
.217
10.
5(2
48)
(284
)−0
.7M
iddl
e Ea
st−0
.1−3
0.4
(32)
−0.5
160
0.6
(163
)1
0.0
Rest
of W
orld
−0.3
−8.3
(334
)−1
2.4
300
2.2
(138
)(8
1)−0
.5M
exic
o−2
.9−8
.9(4
1)−1
.5(4
8)−0
.4(1
07)
(197
)−1
.3N
orth
Afr
ica
−0.5
10.6
(125
)−1
1.9
237
5.0
(47)
(51)
−0.9
Cen
tral
Am
eric
a,−3
.3−1
3.0
(302
)−4
3.3
(219
)−5
.3(3
4)(3
87)
−7.8
Car
ibbe
anKo
rea,
Rep
. of,
−6.7
18.6
8015
.041
614
.4(4
)80
2.
2D
em. P
eop
le’s
Rep
.of
Kor
eaSo
uthe
ast
Asi
a3.
5−0
.3(6
4)−1
.237
21.
5(3
63)
(55)
−0.2
Tota
l:0.
0—
298
0.7
521
0.2
(1,6
80)
(861
)−0
.3D
evel
op
ed1.
1−2
0.7
(14,
472)
−25.
317
,464
6.8
1,18
4 4,
176
1.3
Dev
elo
pin
g1.
12.
72,
797
4.1
(2,0
39)
−0.5
(1,7
95)
(1,0
37)
−0.2
Wo
rld
1.1
−7.8
(11,
675)
−9.3
15,4
252.
5(6
11)
3,13
9 0.
4
— N
ot a
vaila
ble
Sour
ce:U
nive
rsity
of W
isco
nsin
-Mad
ison
Wor
ld D
airy
Mod
el (
UW
-WD
M).
172
production in Canada and the European Union.Consumer losses would pale in comparison to thesubstantive producer gains, generating net totalwelfare gains of 8.8 percent, or $1 billion, by 2005.
Developing-country exporters would enjoy thesame benefits from full dairy sector liberalizationas Oceania, but at slightly lower levels of gain andwith larger transfers from consumers to producers(table 9.3). Wider access to developed-economymarkets and elimination of export subsidies wouldgenerate aggregate increases in milk production(2.6 percent), prices (1–24 percent), and producersurpluses ($2.5 billion, or 9.3 percent), suggestingsubstantial import-substitution and export opportu-nities available in some of these countries. However,the aggregate consumer surplus in the developingcountries would fall by $2.6 billion (1.9 percent)because of the loss of subsidized imports and higherdomestic prices (except in Eastern European coun-tries). Together with the loss of tariff revenues($114 million), aggregate consumer and taxpayerlosses would slightly dominate producer gains,generating modest welfare losses ($173 million, or0.1 percent) by 2005. The political economy of dairyreform is complex even in developing countries,because consumer and producer interests are dia-metrically opposed. The poverty implications arealso stark, pitching poor consumers (who benefitfrom the current regime) against the rural dairysector, which would gain under free markets.
Consumers in net-importing regions wouldgain or lose depending on the tradeoffs betweenincreased world import prices (a negative impact)and increased dairy trade (a positive impact). Theloss of previously subsidized imports can be offsetby gains from broadly expanding trade dependingon the size, composition, and direction of importprice increases. Many governments currently taxtheir consumers—removing those taxes could off-set price increases. Although there may be someopportunity to expand domestic production tosubstitute for previously subsidized imports, thecost-competitiveness of scale-efficient exportersmakes this less viable for many of these countriesthat would experience negative impacts on milkproduction, prices, and producer surpluses underfull liberalization. These producer surplus lossescould be offset by consumer gains, notably in SouthAmerica (dominated by Brazil), where dismantlingMercosur common external import tariffs would
generate lower prices and large consumer gains($1.7 billion, or 3.3 percent). Several regions wouldshow substantive increases in production, price,and producer surplus, notably the FSU (with a pro-ducer surplus gain of $2.6 billion). Treasuries in allcountries would suffer from lost tariff revenues.Aggregate treasury losses would amount to $1.7 bil-lion exceeding modest aggregate producer gains of$298 million and consumer gains of $521 million.Net welfare losses would be $861 million by 2005.
Under full liberalization aggregate world milkproduction would rise by 1.1 percent by 2005.Average milk prices would decrease by 7.8 percentoverall, falling 20.7 percent in the developed coun-tries, while rising 2.7 percent in the developingcountries, reflecting the modest loss to consumers inthe latter countries on average. World dairy tradewould expand by more than 2 million metric tons by2005 as the impacts of domestic deregulation(chiefly quota removal) reinforced the impacts fromthe elimination of trade barriers. World producersurpluses would fall sharply in the developed coun-tries (–$14.5 billion, –25 percent) while increasing inthe developing countries ($2.8 million, 4.1 percent).Developed-country losses would be due primarily tothe loss of quota value in the European Union andCanada, and to the removal of substantive domesticsupports (in Japan and the United States).
Savings from elimination of domestic andexport subsidies would exceed lost tariff revenuesin the developed countries, generating a net treas-ury savings of $1.2 billion by 2005. In developingcountries, where domestic supports are generallymuch smaller, their elimination would not offsetthe loss of tariff revenues, generating net increasesin treasury costs of $1.8 billion, which could be anissue in some developing countries with few alter-native fiscal sources. Aggregate world treasury rev-enues would fall nearly $611 million by 2005. Con-sumer welfare would increase by $17.5 billion inthe developed countries, while falling $2 billion inthe developing regions. In the developed countries,gains by consumers and taxpayers would exceedproducer losses, generating $4.2 billion in net wel-fare gains by 2005. Just the opposite would occur inthe developing regions, where producer gainswould fail to offset consumer and treasury losses onaverage, yielding net welfare losses of $1 billion.
Because the markets of the developed countriesare so much larger than those of the developing
Dairy: Assessing World Markets and Policy Reforms: Implications for Developing Countries 173

world, aggregate consumer gains would be larger(at $15.4 billion) than aggregate producer losses of$11.7 billion and treasury losses of $611 million,yielding net welfare gains for the world of $3.1 bil-lion by 2005. These aggregate patterns hide thevariability in individual country impacts and thelarge transfers at work between consumers andproducers within many countries.
Other scenarios. The free-trade scenario modelsthe elimination in 2001 of export subsidies and alltariff rate quota barriers, while keeping substantivedomestic supports in place. In the absence ofchanges in domestic support programs, free tradewould decrease welfare overall, pointing to the fis-cally unsustainable nature of domestic programsunder conditions of free trade. Free trade wouldhave the effect of stimulating domestic supports,possibly leading to violations of WTO ceilings onaggregate measure of support.
Under the scenario of free trade alone, trade-protected producers in developed economieswould suffer substantive losses as their domesticconsumers enjoyed world prices. In the protecteddeveloped countries, milk prices, exports, and pro-ducer surpluses would fall, while imports wouldclimb. Elimination of export subsidies would notoffset the loss of tariff revenues in Canada or theEuropean Union, yielding net treasury and welfarelosses in these countries. Exporting developingcountries and Oceania’s dairy producers andprocessors would realize strong gains due to freeaccess to higher-priced, protected markets. Con-sumers in these countries would lose, but not asmuch as producers gain, resulting in net welfaregains. Consumers in net-importing dairy regionswould gain or lose depending on the tradeoffsbetween increased import prices (a negativeimpact) and increased trade (a positive impact)from elimination of tariffs on imports into theseregions.
In the last scenario, that in which domestic sup-ports are eliminated but trade barriers remain,dairy producers in developed countries with strongdomestic support and production controls wouldsuffer as production quotas and associated rentswere eliminated. Lower prices would lead ineffi-cient producers to exit the market and nearly elim-inate imports to these markets. In the EuropeanUnion, producers would take a massive hit, offset
by strong consumer welfare gains. Total govern-ment costs would fall, yielding substantive net wel-fare gains of $4 billion, much larger than under fullliberalization results ($1.1 billion). Similar forceswould apply in Canada. Dairy sectors that weremore protected by trade barriers than domesticsubsidies (such as Japan) would not experiencesuch losses. The United States would bear the fullbrunt of domestic policy deregulation, as U.S. milkprices, production, and producer surpluses allwould fall sharply. Reduced government costs andmassive consumer gains would offset producerlosses, however, leading to a net welfare gain. InOceania, New Zealand would gain and Australiawould lose under the no-domestic-support sce-nario. Milk production, prices, and producer sur-plus would rise across most of the developingworld, but consumers in unprotected marketswould face higher prices. Impacts on net importersin the developing world would be quite similar tothose for potential developing-country exporters,with the notable exception of the FSU, where con-sumer gains would barely exceed producer losses togenerate a breakeven net welfare impact.
Conclusions
The world dairy sector is complex and character-ized by multifaceted domestic and trade policy dis-tortions. The results of our simulation model(detailed by commodity, policy, and region) pro-vide a quantitative measure of the economic andwelfare impacts of those distortions across regions,producers, consumers, and governments. While theusual limitations of sectoral simulation studiesshould be kept in mind, the simulations confirmwhat most standard economic policy analysessuggest—that the numerous and sizeable distor-tions induced by most developed economies toprotect their domestic dairy sectors have large andgenerally negative spillover effects on competitiveexporters and developing countries. Liberalizationwould lessen those spillovers, creating opportuni-ties for growth in the domestic and potentiallyexport-oriented portions of the dairy sectors indeveloping countries, but several caveats must benoted.
Liberalization would also cut into the largebenefits that now accrue to consumers who enjoyaccess to subsidized dairy products on world
174 Global Agricultural Trade and Developing Countries

markets thanks to the current protection regimesof the developed countries. Millions of these con-sumers live in poorer countries with low borderprotection and limited capacity to develop a dairysector. The interests of these developing countriesdiverge starkly from those of others having anactual or potential dairy industry.
World Dairy Sector Growth: A ComponentPerspective
World product markets are increasingly driven bymilk components (milk fat and fat fractionations;casein, whey, and other protein fractionations; andlactose). Current world growth trends are domi-nated by “industrial” demand for dairy-basedingredients—intermediate products, not consumerproducts. This growth in demand is driven byadvances in food processing, both on the input side(fractionations of milk components) and the pro-duction side (processes that optimize cost andfunctionality using the evolving dairy-based ingre-dients), and by consumer demand for the finalprocessed products. Shaping a competitive dairysector in a world context will require producers tohave component-based marketing plans, to organ-ize incentive structures rewarding such plans, andto meet quality standards regimes. Making use ofnew dairy-based ingredients demands a moderatelysophisticated food-processing sector and technol-ogy. Size and scale economies are important inmany of these processes, suggesting differentialadvantages to larger firms and to firms with foreigndirect investment backed by knowledge, expertise,and ready capital.
Prospects for World Dairy Policy Liberalization
Trends in dairy product development and marketsoccur in the context of current and evolvingWTO agricultural trade negotiations. Short-termprospects for further dairy trade liberalization indeveloped markets may be somewhat limited, how-ever. The heavily protected dairy sectors of Canada,the European Union, Japan, and the United Statesare not likely to open their markets before reducingsubsidy levels. While the United States and Canadawould likely support liberalization in grains,oilseeds, and livestock products, dairy remainsan especially sensitive industry. Meanwhile, the
European Union is absorbed in its expansion to theEast and the new 2003 CAP reforms, which leavedairy relatively unchanged.
U.S. dairy policy as articulated in the 2002 FarmBill increases domestic subsidies through the MilkIncome Loss Contract program. Meanwhile, low-cost dairy exporters (Australia, Argentina, andEastern Europe) will likely continue pushing hardfor additional market access through lower tariffs,lower export subsidies, and increased importquotas.
The fundamental question is, “Who has the bar-gaining power in dairy issues?” The WTO meetingin Cancún in 2003 changed this calculus by creatingstrong opportunities for expansion of regionaltrade agreements (as opposed to a difficult globalagreement) that will limit access by nonmembers.
Expansion of the European Union will provideprotected access to new members, benefiting thedairy sectors in several Eastern European countries.However, managing the EU’s structural milk sur-plus will remain challenging in the face of existingWTO commitments, the integration of EasternEurope, and the relatively strong entrenchment ofprotectionist farm lobbies. The interests and influ-ence of EU dairy processors and consumers, bothof whom would benefit in a liberalized market,compete directly with the established interests ofthe milk producers.
Prospects for Developing Economies
The potential for domestic market growth is drivenby population and GDP. Population growth stimu-lates consumption of traditional dairy products;whereas increased incomes favor growth in newvalue-added products. Slow GDP growth will stallconsumption of both types of products.
What firms will supply the demand of growingpopulations of more affluent consumers in thedeveloping world? Will they be local or multina-tional firms? Will they use local milk supplies,imported dairy ingredients, or some combinationof the two? Industry structure and infrastructureare crucial to answering these questions. Scale effi-cient (low-cost) and innovative processing firmsare likely to have competitive advantages in meet-ing these potential growth markets. Local versusmultinational ownership will be influenced byaccess to and the cost of capital and by the firms’
Dairy: Assessing World Markets and Policy Reforms: Implications for Developing Countries 175

marketing and procurement strategies. Foreigndirect investment is often used to overcome marketaccess limitations allowed by the current WTOagreement and regulations by countries that permitonly domestically owned firms to import dairyproducts.
Export potential into the developed economieswill be closely linked to further dairy trade liberal-ization characterized by increased market accessand lower domestic subsidies. In this context, opti-mal world supply and demand will remain a crucialdeterminant of export prices and hence will definethe competitive context of world trade. If recenttrends continue, export markets should remain rel-atively competitive, with lower production costsand prices, but also with some structural weaknessin demand due to macroeconomic factors. Discern-ing the differential potential for market growth invalue-added products (which are sensitive to con-sumer income) versus bulk commodities (whichare more responsive to price) will require carefulconsideration.
Overall, countries that are actual or potentialdairy producers and exporters stand to gain froman unfettered market, but as liberalization occurs,special consideration should be given to poor con-sumers who are likely to suffer from higher con-sumer prices. Poor consumers in such countrieswill be hurt, at least in the short run, by a move toglobal free trade in dairy products unless specialmeasures are taken.
Notes
1. The CD-ROM included with this volume containsan annex for this chapter presenting detailed market dataand policy information by country, a description of the modelused here, and additional tables of results of policy-reformsimulations.
2. In this section all dairy products are expressed as totalsolids, milk equivalent, to facilitate comparisons.
3. The European Union and, to a lesser extent, Canada, andthe United States have had substantive export subsidyallowances under the URAA and used them—a major impedi-ment to the expansion of dairy production in many developingcountries.
4. This discussion draws on Peng (2002).5. See Soufi (2002) for further details.
6. The model is described on the CD-ROM that accompa-nies this volume. See also Zhu, Cox, and Chavaz (1999) and Coxand others (1999).
References
Bender, Arnold E. 1992. Meat and Meat Products in HumanNutrition in Developing Countries. Rome: Food and Agricul-ture Organization.
Cairns Group Farm Ministers. 1998. “Communiqué followingtalks on the upcoming WTO talks on agriculture.” Sydney,Australia, April 2–3.
Coleman, J. R. 1998. “World Dairy Trade Overview: Trade Policyand the WTO.” Paper presented at the Workshop for DairyEconomists and Policy Analysts, Cornell Program on DairyMarkets and Policy, Baltimore, October 26–27.
Cox, T. L., J. R. Coleman, J. P. Chavas, and Y. Zhu. 1999. “An Eco-nomic Analysis of the Effects on the World Dairy Sector ofExtending Uruguay Round Agreement to 2005.” CanadianJournal of Agricultural Economics 47: 169–183.
FAO (Food and Agriculture Organization of the UnitedNations). Various years. FAO Yearbook: Production. Rome.
———. “FAOSTAT PC: User Manual.” Rome.Griffin, M. 1999. “The Effects of Agricultural Trade Liberaliza-
tion on Global Dairy Markets.” Paper presented at the 4thInterleite Symposium on Intensive Dairy Production,Caxambu, Brazil, July 22–24.
Kirkpatrick, E. 1998.“Editorial comments.” Cheese Reporter, July 10.Megli, K., T. Peng, and W. Soufi. 2002. “Eastern Europe and
Former Soviet Union Dairy: A Look at Policy, CountryGroupings, and Income Elasticity.” Agriculture and AppliedEconomics Working Paper, University of Wisconsin–Madison.
Megli, K. 2002. “South America in the UW World Dairy Model:Policy, Grouping, and Elasticity.” Agriculture and AppliedEconomics Working Paper, University of Wisconsin–-Madison.
Organisation for Economic Co-operation and Development(OECD). 2001. Agricultural Policies in OECD Countries.Monitoring and Evaluation 2001. June.
Oxford Analytica. 1998. “European Union: Farm Trade.” DailyBrief, June 2.
Peng, T. 2002. “A Study of Income Effects on Dairy Consump-tion and Milk Supply Elasticity in Asia.” Agricultureand Applied Economics Working Paper, University ofWisconsin–Madison.
Soufi, W. 2002. “North Africa and Middle East Dairy Supply andConsumption: Economic Policy, Disaggregation of the Areaand Econometric Modeling.” Agriculture and Applied Eco-nomics Working Paper, University of Wisconsin–Madison.
U.S. Dairy Export Council, International Dairy Food Association,National Milk Producers Federation, American Dairy Prod-ucts Institute. 1999. “White Paper: Preparing for the SeattleRound: U.S. Dairy Industry Negotiating Priorities.” July 21.
Zhu, Y., T. L Cox, and J. P. Chavas. 1999. “An Economic Analysisof the Effects of the Uruguay Round Agreement and FullTrade Liberalization on the World Dairy Sector.” CanadianJournal of Agricultural Economics 47: 187–200.
176 Global Agricultural Trade and Developing Countries

markets. Clearly, however, domestic price stabiliza-tion policies have been pursued by restricting im-ports, in turn contributing substantially to interna-tional market thinness. Therefore, it is difficult toignore the effect of domestic stabilization policiesachieved through import and export restrictionsas a significant cause of international rice priceinstability.
In addition to the thinness of rice trade, anotherimportant structural characteristic is the geo-graphic concentration of production and con-sumption in Asia. More than 90 percent of produc-tion and consumption occur in Asia—nearlytwo-thirds of it in just three countries (China,India, and Indonesia). With as much as 40 percentof Asian rice cultivated under rain-fed systems,the monsoon weather effects are magnified onrice trade.
Finally, there is substantial market segmentationby rice type and quality. A key structural dimensionis the degree of end-use differentiation. Substitu-tion among rice types and qualities is limited bydifferences in taste preferences. Low substitutability
Rice is one of the most important food grains in theworld, accounting for more than 20 percent ofglobal calories consumed and 29 percent in low-income countries (table 10.1). Thus, policies thataffect rice prices, production, and trade have a largeimpact on the poor.
Despite the importance of rice as a basic staple,global trade accounts for only 6.5 percent of con-sumption. That means that most countries are self-sufficient in rice and face increased price volatilityin times of production shortfalls. By contrast,wheat trade accounts for 18 percent of consump-tion, corn for 12 percent, and soybeans for 35 per-cent (USDA PS&D 2003). The thinness of trade forrice stems primarily from the use of protectionistmechanisms to achieve national policy objectivesof domestic food security and support for producerprices and incomes in major rice-producing and -consuming countries (box 10.1).
Jayne (1993) argues that the link betweendomestic stabilization policies and instability inworld rice prices has been exaggerated, empha-sizing instead the role of thin and fragmented
177
10
RICE: GLOBAL TRADE,PROTECTIONIST
POLICIES, AND THEIMPACT OF TRADE
LIBER ALIZATION
Eric J. Wailes
The author acknowledges the assistance of Frank Fuller and Alvaro Durand-Morat for model computationsand expresses appreciation to John Beghin, Don Mitchell, and Kenneth Young for useful comments. Theannex for chapter 10, on the CD-ROM, contains more extensive tables and figures on market data, policies,and simulation results.

178 Global Agricultural Trade and Developing Countries
for rice exists on both demand (mill and end-use)and supply sides. On the demand side, the closestsubstitute is wheat, particularly important in SouthAsia (India and Pakistan). In many Asian nationsrice has become an inferior good, so that asincomes rise it is replaced by meats, fruits, andvegetables.
On the supply side, different rice varietiesrequire different climatic conditions and produc-tion and milling technologies. This limits the abilityof producers to respond to price incentives byswitching the type of rice produced. Productionbenefits greatly from access to plentiful supplies ofsurface or ground water and soils with poordrainage that can maintain a flood condition.While these characteristics limit the potential rice
production area, they also limit the production ofother crops that cannot withstand flood condi-tions. Development of rice varieties that will bemuch less dependent on water will have the poten-tial to greatly expand production areas suitable forcultivation, changing costs of production and geo-graphic areas of comparative advantage and disad-vantage. As the first major food crop to have itsgenomic structure fully described, rice genomicsand biotechnology are progressing rapidly (Khushand Brar 2002).
Thus, the combination of high levels of domesticprotection, geographic concentration, erraticweather, inelastic price responses in production andend-use markets, and relatively thinly traded volumesresults in volatile prices and trade (Wailes 2002).
TABLE 10.1 Share of Calories from Rice by Region and Income Level, 2000
Total Calories Rice Calories Share of CaloriesRegion Per Capita Per Capita from Rice (%)
World 2,805 576 20.5Developed countries 3,260 118 3.6Developing countries 2,679 703 26.2Low-income countries 2,405 702 29.2Low-income food-deficit countries 2,625 732 27.9Africa 2,434 178 7.3Asia 2,713 856 31.6Sub-Saharan Africa 2,226 174 7.8South America 2,838 315 11.1North and Central America 3,411 117 3.4Europe 3,250 45 1.4
Source: FAOSTAT.
BOX 10.1 Definitions of Rice Trade Flows in This Study
The international rice trade is differentiated bytype, quality, degree of processing, and degreeof milling. Long-grain varieties are typicallylonger than 6.2 millimeters , while medium- andshort-grain varieties are 6.2 millimeters or less.Many factors enter into the designation of qual-ity for long-grain rice, including share of brokenkernels, seeds, chalkiness, and color. In this studyhigh quality refers to grain that contains 10 per-cent or less of broken kernels and low quality torice that contains more than 10 percent broken
kernels. Paddy rice refers to rice as it is harvestedin the field before the husk and bran layer areremoved. Brown rice, also referred to as cargo orhusked rice, has had the husk removed butretains the bran layer. Milled rice, also referred toas white rice, has had both the husk and branlayers removed. The fragrant rice varieties, bas-mati and jasmine, are generally considered long-grain types but are marketed and priced inglobal markets differently from unscented long-grain varieties.

Rice Trade and Policies in theMajor Producing and ConsumingNations
Because rice has been so highly protected in bothindustrial and developing nations, trade liberaliza-tion under the Uruguay Round Agreement onAgriculture is having a profound impact on theinternational rice market (Wailes 2002). Trade hasessentially doubled in volume and as a share of con-sumption since the 1970s and 1980s (figure 10.1).The changes in protection have been modest,however, and rice remains one of the most protectedfood commodities in world trade.
As a result of the more limited and longer mar-ket access reforms required for developing coun-tries under the Uruguay Round, rice policies indeveloping countries have not changed signifi-cantly since the early 1990s. This lack of rice policyreforms has intensified price volatility, placing aheavy burden on poor consumers and on govern-ments to provide food distribution programs forthe poor. The coefficient of variation of domesticprices in real terms over the past 20 years was 0.43in India and 0.26 in Indonesia; it was 0.37 in Chinaover the past 16 years. However, some price stabilitywas achieved in these Asian countries in the 1990sbecause real world prices had fallen dramaticallyduring this period as well as variability.
The major rice-producing countries are also themajor rice-consuming countries and leading riceexporters and importers (tables 10.2 and 10.3 andannex table 1 on the CD-ROM).
China
China, the largest rice-producing and -consumingcountry, accounts for nearly a third of the globalrice economy. Rice has been an important compo-nent of China’s food grain security objectives andhas been managed through procurement supportprices to ensure stable supplies. Government ricestocks increased in the late 1990s to about 100 mil-lion metric tons, 73 percent of domestic use. In1999 the government eliminated purchases of low-quality early season rice and lowered the procure-ment prices for its rice purchases. The area plantedwith rice has declined (USDA PS&D 2003), and ricestocks were reduced by more than 30 percent by theend of 2002, to 67.6 million metric tons. In somecoastal provinces the government has since elimi-nated its procurement policy entirely, leaving pro-ducers to sell their rice in the open market (Wadeand Junyang 2003). The government policy nowemphasizes quality over quantity, and rice produc-ers are quickly adopting improved quality varieties.
The rice tariff rate quota negotiated by Chinawas initially 2.66 million metric tons in 2002,
Rice: Global Trade, Protectionist Policies, and the Impact of Trade Liberalization 179
FIGURE 10.1 World Rice Trade and Share of Total Use
0.0
5.0
10.0
15.0
20.0
25.0
30.0
0.0
1.0
2.0
3.0
4.0
5.0
6.0
7.0
8.0
Million metric tons Percent
Trade Percent of use
1973
–74
1975
–76
1977
–78
1979
–80
1981
–82
1983
–84
1985
–86
1987
–88
1989
–90
1991
–92
1993
–94
1995
–96
1997
–98
1999
–00
2001
–02
Source: USDA PS&D 2003.

equally divided between long-grain and medium-and short-grain or other rice (WTO 2001). Only10 percent of the long-grain tariff rate quota and50 percent of the medium-short grain quota aredesignated for private firms. The tariff rate quotarose to 3.78 million metric tons in 2003 and willincrease to 5.32 million metric tons by 2004 (Sunand Branson 2002; Zhang, Matthews, and Branson2002). Nearly all rice imports are fragrant jasminerice, primarily from Thailand. Domestic produc-tion of fragrant rice is increasing, however, anddisplacing imports. Unless there is a significantadverse weather event, China is not expected to fillits rice tariff rate quota. In-quota tariffs are 1 per-cent for grains (including milled rice) and no morethan 10 percent for partially processed grain prod-ucts. Over-quota tariffs will be 76 percent initially,reduced to 65 percent in 2004 (WTO 2001).
China is a significant exporter of low-qualitylong-grain rice, with principal markets in Côted’Ivoire, Cuba, and Indonesia. Medium-grain riceis exported competitively into Russia, Japan, theRepublic of Korea, and the Democratic Republic ofKorea (Hansen and others 2002). While the statetrading agency handles most rice exports, exportsubsidies are not considered necessary for China’srice export shipments (except for out-of-conditionstock liquidation).
India
As the second-largest rice producer, consumer, andexporter, India plays an important role in the globalrice economy. India is a major supplier of low-quality long-grain rice and fragrant basmati rice.Like China, India views rice as a strategic commod-ity for food security based on grains (rice andwheat). Consequently, the government intervenesin the market through grain procurement, pricesupports, and export subsidies. In recent years thegovernment has procured some 25 percent of theannual harvested crop to replenish governmentstocks. Since April 2001 the government hasactively subsidized rice exports at 50 percentof procurement prices, underselling Pakistan,Thailand, and Vietnam in low-quality long-grainmarkets by $15–$20 a metric ton. Major marketsfor India’s low-quality parboiled and regularlong-grain rice include Bangladesh, Côte d’Ivoire,Indonesia, Nigeria, Philippines, and South Africa.Major markets for basmati rice include theEuropean Union (EU), Iran, Kuwait, Saudi Arabia,and United Arab Emirates.
India bound its rice tariffs under the UruguayRound at zero percent. Until May 1997 all rice wasimported through the Food Corporation of India.Under an agreement to privatize the rice trade, thegovernment negotiated higher import tariffs that
180 Global Agricultural Trade and Developing Countries
TABLE 10.2 Leading Rice-Producing, -Consuming, -Exporting, and -ImportingCountries
Rank Producing Consuming Exporting Importing
1 China China Thailand Indonesia2 India India India Nigeria3 Indonesia Indonesia Vietnam Bangladesh4 Bangladesh Bangladesh United States Iran5 Vietnam Vietnam China Philippines6 Thailand Japan Pakistan Brazil7 Japan Thailand Uruguay Iraq8 Myanmar Myanmar Argentina Saudi Arabia9 Philippines Philippines Egypt European Union
10 Brazil Brazil Myanmar Senegal11 United States Korea, Rep. of Australia China12 Korea, Rep. of United States Japan South Africa13 Pakistan Nigeria European Union Côte d’Ivoire14 Egypt Egypt Guyana Malaysia15 Cambodia Iran Ecuador Cuba
Source: USDA PS&D 2003.
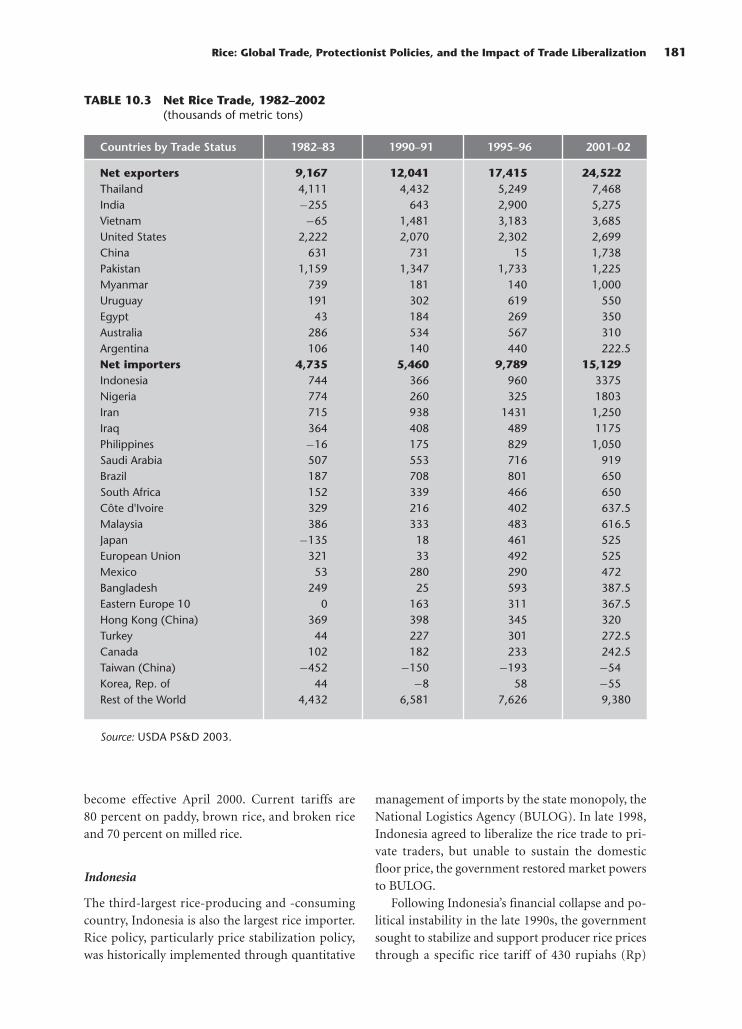
become effective April 2000. Current tariffs are80 percent on paddy, brown rice, and broken riceand 70 percent on milled rice.
Indonesia
The third-largest rice-producing and -consumingcountry, Indonesia is also the largest rice importer.Rice policy, particularly price stabilization policy,was historically implemented through quantitative
management of imports by the state monopoly, theNational Logistics Agency (BULOG). In late 1998,Indonesia agreed to liberalize the rice trade to pri-vate traders, but unable to sustain the domesticfloor price, the government restored market powersto BULOG.
Following Indonesia’s financial collapse and po-litical instability in the late 1990s, the governmentsought to stabilize and support producer rice pricesthrough a specific rice tariff of 430 rupiahs (Rp)
Rice: Global Trade, Protectionist Policies, and the Impact of Trade Liberalization 181
TABLE 10.3 Net Rice Trade, 1982–2002(thousands of metric tons)
Countries by Trade Status 1982–83 1990–91 1995–96 2001–02
Net exporters 9,167 12,041 17,415 24,522Thailand 4,111 4,432 5,249 7,468India −255 643 2,900 5,275Vietnam −65 1,481 3,183 3,685United States 2,222 2,070 2,302 2,699China 631 731 15 1,738Pakistan 1,159 1,347 1,733 1,225Myanmar 739 181 140 1,000Uruguay 191 302 619 550Egypt 43 184 269 350Australia 286 534 567 310Argentina 106 140 440 222.5Net importers 4,735 5,460 9,789 15,129Indonesia 744 366 960 3375Nigeria 774 260 325 1803Iran 715 938 1431 1,250Iraq 364 408 489 1175Philippines −16 175 829 1,050Saudi Arabia 507 553 716 919Brazil 187 708 801 650South Africa 152 339 466 650Côte d'Ivoire 329 216 402 637.5Malaysia 386 333 483 616.5Japan −135 18 461 525European Union 321 33 492 525Mexico 53 280 290 472Bangladesh 249 25 593 387.5Eastern Europe 10 0 163 311 367.5Hong Kong (China) 369 398 345 320Turkey 44 227 301 272.5Canada 102 182 233 242.5Taiwan (China) −452 −150 −193 −54Korea, Rep. of 44 −8 58 −55Rest of the World 4,432 6,581 7,626 9,380
Source: USDA PS&D 2003.

per kilogram (equivalent to a 30 percent ad val-orem tariff). Nontariff barriers and trader responseto risks and regulation (including a 2002 require-ment for an import license and redlining) haveraised the effective rate of protection to 100 percent(Timmer 2002). Average border prices of milledrice were $200 per metric ton in 2002, whilemonthly retail prices in Jakarta averaged $377 permetric ton (Katial-Zemany and Alam 2003). It isbelieved that a significant share of imports in 2002was smuggled into the country, thanks to a porousborder and this large difference between world anddomestic prices.
The tariff policy is currently under review, andproducers are pressuring for an increase to Rp 510per kilogram, equivalent to a 36 percent tariff butwell below the WTO (World Trade Organization)bound rate of 160 percent until 2004 (Katial-Zemany and Alam 2003). Floor prices for paddyand milled rice were increased by 13 percent in2003. In early 2003 BULOG’s status was changedfrom a state agency to a state trading enterprise. Itcontinues to distribute subsidized rice to low-income consumers. Current import and domesticprice support policies clearly have negative conse-quences for Indonesia’s consumers, especially poorconsumers, and negative consequences on realwages and therefore economic growth.
Bangladesh
Bangladesh is the fourth-largest rice-producingand -consuming nation and an important buthighly variable rice import market. Since much ofthe rice production in Bangladesh is dependent onmonsoon weather, production can fluctuate greatly.In 1998 Bangladesh was the world’s second largestimporter at 2.5 million metric tons, but since 1998it has imported an average of only 500,000 metrictons annually.
In 2000 Bangladesh imposed an import tariff of5 percent on rice. The rate was raised to 25 percentin 2001, and a 10 percent regulatory duty wasadded mid-year, along with an advance income taxof 3 percent and a development surcharge of 2.5 per-cent. These import protections along with a cropshortfall in 2001 and a policy shift to distributingmoney instead of food grains in the national fooddistribution program resulted in a higher domesticprice and a rise in smuggled imports from India. As
a result, the government withdrew the 10 percentregulatory duty in 2002 and more recently reducedletter-of-credit margins from 100 percent to 25 per-cent. Import restrictions that remained in 2003include a tariff of 22.5 percent, an advance incometax of 3 percent, and a development surcharge of3.5 percent. Bangladesh imposes no quantitativerestrictions.
Vietnam
Vietnam produces the fifth-largest rice crop and isalso the fifth-largest rice-consuming country. Fol-lowing the adoption of the Doi Moi reform pro-gram in late 1986, Vietnam’s rice economy recov-ered, and by the mid-1990s Vietnam had becomethe world’s second-largest rice exporter. Vietnamexports both high- and low-quality long-grain rice.Important export destinations include Cuba,Indonesia, Iraq, Malaysia, and several Africancountries. Rice exports and prices are under thecontrol of the Ministry of Trade and Vietnam’sFood Association (Vinafood) (Young, Wailes,Cramer, and Tri Khiem 2002).
Vietnam has no significant production supportpolicies or export subsidy programs. Vietnam andthe other major Asian rice exporters (China, India,Pakistan, and Thailand) have discussed the forma-tion of a rice export cartel in response to the lowworld prices for rice since 1999. India rejected theidea, but the others are developing the concept.
Thailand
Thailand has been the world’s leading rice exporterfor the past several decades. Private export compa-nies supply world markets with a wide range oflong-grain rice, including the fragrant jasmine rice.The primary government rice policy is the paddymortgage scheme, a loan program operated underthe Bank for Agriculture and Agricultural Coopera-tives (BAAC). Participating farmers can obtainloans from BAAC using their crop as collateral. Theloan price is set at 95 percent of a government-determined target price. In 2002 loan rice priceswere $8 to $10 per metric ton higher than marketprices (a 10 percent price support). Nearly a thirdof the Thai crop was pledged to the loan price sup-port program. Government stocks increased asfarmers defaulted on their loans. The government
182 Global Agricultural Trade and Developing Countries

procured rice is milled and then exported throughgovernment-to-government arrangements.
Japan
Japan’s rice economy is supported by the highprices paid by consumers. Japan controls riceimports through a tariff rate quota with a prohibi-tive over-quota tariff. As the traditional staple food,rice dominates the government’s agricultural policy(Fukuda, Dyck, and Stout 2003).
In 1996 the government ended regulation of ricemarketing, freeing up wholesale and retail marketsfrom government supervision and licensingrequirements. With market liberalization, farm-gate prices have declined. In 1998 the governmentadopted the Rice Farming Income StabilizationProgram. When prices fall below a seven-year,moving-average standard rice price, producers arepaid 80 percent of the difference between the cur-rent year price and the standard price. Payments aremade from the Rice Farming Income StabilizationFund, with 25 percent of contributions from riceproducers and 75 percent from the government.Participation is voluntary, but participants mustalso enroll in the Production Adjustment Promo-tion Program, which diverts land from rice to othercrops (wheat, barley, soybeans, forages, vegetables,and fruits). Since stabilization fund payments aretied to a diversion program, Japan claims Blue Boxtreatment (see chapter 3). Income stabilization pay-ments to rice producers in 1999, the most recentlyreported year, were $815 million. Payments underthe diversion program were $1.03 billion.
Before the Uruguay Round Agreement on Agri-culture, Japan had banned rice imports for 30 years,except following the devastating production short-fall in 1993. Japan now imports 682,000 metric tonsannually under a tariff rate quota, 7.2 percent ofdomestic consumption in the base period 1986–88.In-quota purchases are controlled exclusively bythe Food Agency, for which a markup of up to ¥292($2.41 in 2001) per kilogram is allowed.
Imports are purchased through either ordinarymarket access or the simultaneous-buy-sell system.Under ordinary market access, which accounted for85 percent of imports in 2001, the Food Agencyimports rice and resells it into Japan’s domestic mar-ket or donates it to food assistance programs. Underthe simultaneous-buy-sell system, purchases are
made through an auction at which importers sellrice to the Food Agency and simultaneously buy itback. The Food Agency selects bids that maximizethe markup. They have averaged ¥100–¥200 per kilo-gram ($1,000 to $2,000 per metric ton). Over-quotatariffs are ¥341 per kilogram, ($2,842 per metric tonin 2003). The average successful bid price in Decem-ber 2002 was $318 per metric ton. Summary meas-ures of protection from the Organisation for Eco-nomic Co-operation and Development (OECD2003) indicate that the average producer supportestimate in Japan for 2000–02 was 86 percent and thenominal protection coefficient was 6.89.
Republic of Korea
The Republic of Korea also protected its rice sectorwith an import ban until 1995, when it agreed to aminimum market access import commitment inthe Uruguay Round. In 2004, the final year of com-mitment, Korea will import 205,000 metric tons,4 percent of domestic consumption in the 1986–88base period. Consumption has been declining and,coupled with rising minimum market accessimports, this has resulted in excessive stocks.
In April 2002 the government released “A Com-prehensive Plan on the Rice Industry” to cope withthe structural problem of oversupply and to pre-pare for future restructuring. The government hadrelied on a procurement program to support farmprices. In 2002 it procured 789,000 metric tons of atotal production of 4.9 million metric tons at 2,097won per kilogram ($1,667 per metric ton). Underthe proposed comprehensive plan the governmentintends to decouple payments, moving from pricesupports to income support. In 2002 the govern-ment made a direct payment of 500,000 won($398) per hectare in agricultural promotion areasand 400,000 won ($319) per hectare in nonpromo-tion areas. The program is similar to Japan’sincome stabilization program in that it will belinked to a production adjustment system to shiftrice areas to other crops (soybeans, forages, and fal-low) and therefore will claim Blue Box WTO status.In 2003 the government announced plans to keeprice land fallow by paying producers 3 million won($2,531) per hectare on 27,500 hectares—2.6 per-cent of total rice area. OECD (2003) estimates anaverage producer subsidy equivalent to 82 percentand a nominal protection coefficient of 5.35 per-cent for Korean rice producers in 2000–02.
Rice: Global Trade, Protectionist Policies, and the Impact of Trade Liberalization 183

Imports are guided by the Uruguay Round min-imum market access agreement and are assessed a5 percent tariff under this tariff rate quota agree-ment. Imports, strictly controlled by the Ministryof Agriculture, have generally been of low-qualityrice and are made available to end-users throughcontrolled channels.
European Union
The European Union maintained an interventionprice on paddy rice of €298.35 per metric ton.Since 1996 the European Union has accumulatedintervention stocks as a result of increased produc-tion and imports. Direct payments were introducedin 1997, with payments up to a maximum guaran-teed area of 433,123 hectares. The current directpayment rate is €325.70 per hectare. Based on aver-age yields, the direct payment is equivalent to€52.65 per metric ton. Total support to rice pro-ducers, taking into account the intervention priceand direct payment, is €351 per metric ton (Com-mission of the European Communities 2002).
Under the Uruguay Round agreement, the Euro-pean Union agreed to convert variable levies tofixed tariffs and to reduce them by 26 percent by2000. Current tariff levels are €211 per metric tonfor paddy, €264 per metric ton for brown rice, and€416 per metric ton for milled rice. Import pricesof brown rice were approximately €250 per metricton in 2003, so the €264 tariff provides a protectionrate of 105 percent. Tariff escalation makes the tar-iff rate on milled rice prohibitive.
A variety of tariff concessions and preferencesfor EU rice imports exist. Brown basmati importsfrom India and Pakistan are given a €250 per metricton reduction, resulting in a tariff of €14 per metricton. With the accession to the European Union ofAustria, Finland, and Sweden in 1995, a tariff ratequota was negotiated with zero tariff per metric tonon imports of 63,000 metric tons of milled rice,€88 per metric ton on imports of 20,000 metrictons of brown rice, and €28 per metric ton onimports of 80,000 metric tons of broken rice. Egypthas an import concession for 39,000 metric tons ata 25 percent tariff reduction, and Bangladesh has a4,000 metric ton concession for brown rice at a50 percent tariff reduction. Preferences are giventhrough a 110,000 metric ton quota to the African,Caribbean, and Pacific countries at a 35 percenttariff reduction and overseas countries and
territories at zero percent duty. Beginning in 2007,tariffs on imports from the 48 least-developedcountries will be progressively reduced to zero by2009 under the Everything but Arms agreementnegotiated in 2001.
The export regime for rice is based on UruguayRound agreement commitments, which limitrefunds to 133,400 metric tons of milled rice equiv-alent and a subsidy expenditure of no more than€36.8 million ($39.4 million). Export refunds areset by type of rice and destination. In 2003 exportsubsidies ranged from €111 to €165 ($119 to $177)per metric ton. The OECD (2003) estimates theproducer subsidy equivalent at 31 percent andnominal protection coefficient at 1.24 for 2000–02.
United States
The United States is the world’s fourth-largest riceexporter, exporting nearly 45 percent of its produc-tion. Under the 2002 Farm Bill, the U.S. govern-ment provides price supports through a marketloan rate of $143 per metric ton of paddy rice. Amarket loan deficiency payment is made if theworld reference price falls below the market loanrate. The 2002 crop received an average payment of$73 per metric ton.
Producers also receive income support throughtwo payment programs, a fixed decoupled directpayment of $51.80 per metric ton and a decoupledcountercyclical payment when the direct paymentplus the market price or market loan rate (whicheveris higher) are below a target price of $231.48 permetric ton.1 When the market price is below themarket loan rate, the maximum countercyclical pay-ment is $36.68 per metric ton. Both direct paymentand countercyclical payment are made on 85 percentof a fixed historical production level.
Rice imports are subject to tariffs of $14 per met-ric ton for milled rice, 11.2 percent ad valorem forparboiled, $21 per metric ton for brown, $8.30 permetric ton for basmati brown, and $18 per metricton for paddy rice. In 2002, 10 percent of exports(380,000 metric tons) were funded by governmentprograms, all food aid shipments. Export subsidiesunder the Export Enhancement Program have notbeen used for U.S. rice exports since 1996. TheOECD (2003) estimates a producer subsidy equiva-lent of 50 percent and a nominal protection coeffi-cient of 1.77 for 2000–02.
184 Global Agricultural Trade and Developing Countries

Magnitude of Policy Distortions inKey Rice Markets
The major distortions in world rice markets arecaused by import tariffs and tariff rate quotas inkey importing countries and price supports in keyexporting countries. The global trade-weightedaverage tariff on all rice was 43.3 percent in 2000:217 percent for medium- and short-grain rice and21 percent for long-grain rice. Medium-grain ricemarkets are far more distorted than long-grain ricemarkets because of tariff rate quotas and quotasin the major medium-grain rice importing coun-tries of Japan, the Republic of Korea, and Taiwan(China). OECD countries are a major source of dis-tortions, with average annual producer supportreaching $25 billion in 2000–02.
Trade protection is also provided for domesticmilling industries. This protection is expressed intariff escalation and is especially prevalent in Cen-
tral and South America and the European Union.EU tariffs are 46 percent for brown rice but 80 per-cent for milled rice (table 10.4). In Mexico, paddyrice imports pay a 10 percent tariff while brownand milled rice pay a 20 percent tariff.
The effect of tariff escalation is seen in tradeflows. Most of the trade in milled high-qualitylong-grain rice goes to countries with low tariffs,while most of the trade in brown and paddy ricegoes to countries with high tariff escalation. Trade-weighted average tariffs for high-quality long-grainrice are estimated at 4.3 percent for milled rice,31.4 percent for brown rice, and 16.9 percent forpaddy rice. Simple non-trade-weighted averagesare 13.7 percent for milled rice, 18.7 percent forbrown rice, and 25.4 percent for paddy.
The greatest degree of protection in world ricetrade is in medium- and short-grain rice. Protec-tion by Japan, the Republic of Korea, and Taiwan
Rice: Global Trade, Protectionist Policies, and the Impact of Trade Liberalization 185
TABLE 10.4 Schedule of Tariffs, Tariff Rate Quotas, and Quotas in Rice, 2002–03 Levels(percent)
Long-GrainTariff Rate
Country or Milled Medium–Short Quota (1,000Region Nonfragrant Fragrant Brown Paddy Milled Brown MetricTons)
Bangladesh 22.5 22.5 22.5 22.5 22.5 22.5Brazil 15.0 15.0 13.0 13.0 15.0 13.0Canada 0.0 0.0 0.0 0.0 0.0 0.0China 1.0 1.0 1.0 1.0 1.0 1.0 5,320Costa Rica 35.0 35.0 35.0 20.0 35.0 35.0Côte d’Ivoire 32.0 32.0 12.0 7.0 32.0 12.0European Union 80.0 71.0 46.0 146.0 75.0 64.3India 70.0 70.0 80.0 80.0 70.0 80.0Indonesia 21.0 16.1 25.0 35.0 14.3 15.6Japan (yen/kg) 341 341 341 341 341 341 682Korea, Rep. of 5.0 5.0 5.0 5.0 5.0 5.0 204*Malaysia 0.0 0.0 0.0 0.0 0.0 0.0Mexico 20.0 20.0 20.0 10.0 20.0 20.0Nigeria 50.0 50.0 50.0 50.0 50.0 50.0Philippines 50.0 50.0 50.0 50.0 50.0 50.0Russia 5.0 5.0 5.0 5.0 5.0 5.0Senegal 12.7 12.7 12.7 12.7 12.7 12.7Taiwan (China) 0.0 210.0 0.0 0.0 210.0 229.4Turkey 35.0 27.0 35.0 27.0 35.0 35.0United States 14 14 21 18 14 21
($/metric ton)
* The Republic of Korea uses a quota rather than a Tariff Rate Quota (TRQ).Sources: AMAD (Agricultural Market Access Database), USDA, FAS GAIN reports.

(China) lowers world export prices by some 100 per-cent. Currently, very few rice exporting countriesproduce medium- and short-grain rice. The clearbeneficiaries of trade liberalization in medium- andshort-grain rice will be countries, especially China,with a competitive advantage in production costsand logistics relative to such other export competi-tors as Australia, Egypt, and the United States.
Trade liberalization would be expected to stimu-late production of medium- and short-grain rice inother countries, but current varieties are suitableonly for temperate climates. Thus South Americanexporters such as Argentina and Uruguay coulddevelop adapted varieties more quickly. Many otherdeveloping countries have tropical or subtropicalclimates and would require a decade or more todevelop varieties that would be competitive in lib-eralized medium- and short-grain rice markets.Production capacity in Australia and the UnitedStates and to some degree in China is increasinglyconstrained by lack of water.
Long-grain rice markets are far less protected.Tariffs in major low-quality rice-importing nationssuch as Indonesia and Bangladesh are estimated toreduce world prices by as much as 30 percent com-pared with full liberalization. The major impact ison consumers in these low-income developingcountries and on producers of low-quality long-grain rice in exporting countries such as India,Pakistan, Thailand, and Vietnam. While tariffsare lower than on medium- and short-grain rice,tariff escalation is substantial, particularly in theEuropean Union and several Central and SouthAmerican countries. This pattern of protectiondepresses world prices for milled high-quality long-grain rice relative to brown and paddy rice, creatingeconomic hardship for the milling industry inhigh-quality long-grain exporting countries such asThailand, Vietnam, and the United States. Protec-tion in high-quality long-grain milled rice marketsis estimated to reduce prices by 10–20 percent.
Trade Flow and Price Impact ofRice Trade Liberalization
Estimates of the impact of the elimination ofimport tariffs and export subsidies using a spatialequilibrium model, RICEFLOW (Durand-Moratand Wailes 2003), show a significant expansion of
rice trade and large price adjustments. An earlierversion of the model was used to assess tradeliberalization prior to the Uruguay Round (Cramer,Wailes, and Shui 1993; Cramer and others 1991).For the current study RICEFLOW was morecompletely disaggregated by rice type and degree ofmilling, and the baseline trade flows and elasticityestimates were updated through 2000. The resultsreflect the effects of trade liberalization applied toyear 2000 trade flows and prices. Detailed analysisby quantities traded and prices are presented intable 10.5.
Complete liberalization in 2000 would haveresulted in a significant expansion in global ricetrade of nearly 3.5 million metric tons, a 15 percentincrease in trade. Trade-weighted average exportprices would be 32.8 percent higher and trade-weighted import prices would be 13.5 percent lower.
Trade in medium- and short-grain rice, whereinitial protection was highest, would increase by73 percent. Producer export prices would rise 91 per-cent and import prices would decline 27 percent.2
In the most protected medium- and short-grainbrown rice markets, trade would increase 141 per-cent, export prices would increase 200 percent, andimport prices would decrease 41 percent. Tradewould expand 59 percent in milled medium- andshort-grain rice markets, with export prices 71 per-cent higher and import prices 25 percent lower.
Because trade in high-quality, long-grain mar-kets is subject to much less protection, trade liberal-ization results in only slight increases in volumetraded—4 percent more for paddy rice, 7 percentfor brown rice, and 3 percent for milled rice. Exportprices increase only 2 percent but import prices fall18 percent (10 percent for paddy, 31 percent forbrown rice, and 4 percent for milled rice), improv-ing consumer welfare in rice-importing countries.Most of the expansion in trade occurs in the low-quality markets, such as Bangladesh, Indonesia, andthe Philippines. Traded volumes increase 13 per-cent and import prices fall 14 percent, improvingconsumer welfare in many low-income developingcountries. Removing protection in these marketsalso improves producer welfare in developing coun-tries as export prices rise 7 percent. In the fragrantrice market liberalization results in a 41.5 percentlower import price but only slight increases in thevolume traded and the export price.
186 Global Agricultural Trade and Developing Countries

Rice: Global Trade, Protectionist Policies, and the Impact of Trade Liberalization 187
TABLE 10.5 Simulation Results for Rice Trade Liberalization Using RICEFLOW, 2000
Rice Type Baseline Free Trade Change (%)
Long grainHigh-quality
PaddyQuantity (metric tons) 1,035,320 1,081,254 4.4Export price ($/metric ton) 149.21 154.67 3.7Import price ($/metric ton) 185.51 166.89 −10.0
BrownQuantity (metric tons) 856,798 916,721 7.0Export price ($/metric ton) 223.75 219.25 −2.0Import price ($/metric ton) 363.32 250.64 −31.0
MilledQuantity (metric tons) 7,495,594 7,704,482 2.8Export price ($/metric ton) 225.97 225.58 −0.2Import price ($/metric ton) 262.06 252.16 −3.8
Low-qualityMilled
Quantity (metric tons) 8,084,093 9,149,728 13.2Export price ($/metric ton) 177.05 188.70 6.6Import price ($/metric ton) 248.19 213.09 −14.1
FragrantMilled
Quantity (metric tons) 2,449,711 2,467,502 0.7Export price ($/metric ton) 265.24 267.07 0.7Import price ($/metric ton) 511.20 299.07 −41.5
All long grainQuantity (metric tons) 19,921,516 21,319,687 7.0Export price ($/metric ton) 206.87 210.68 1.8Import price ($/metric ton) 287.45 236.43 −17.7
Medium and short grainBrown
Quantity (metric tons) 483,063 1,162,478 140.6Export price ($/metric ton) 271.80 814.47 199.7Import price ($/metric ton) 1438.54 842.75 −41.4
MilledQuantity (metric tons) 2,487,760 3,946,170 58.6Export price ($/metric ton) 367.71 628.92 71.0Import price ($/metric ton) 855.89 645.69 −24.6
All medium and short grainQuantity (metric tons) 2,970,823 5,108,648 72.0Export Price ($/metric ton) 352.11 671.14 90.6Import Price ($/metric ton) 950.63 690.53 −27.4
All riceQuantity (metric tons) 22,892,339 26,428,335 15.4Export Price ($/metric ton) 225.71 299.69 32.8Import Price ($/metric ton) 373.51 322.97 −13.5
Source: Durand-Morat and Wailes 2003.

Welfare Impact of Rice TradeLiberalization
Global rice trade liberalization results in a total eco-nomic surplus gain of $7.4 billion annually.3
Importing countries have a net gain of $5.4 billionand exporting countries a net gain of $2 billion.Gains vary considerably by country, rice type, anddegree of milling.
Impact on Price Importers and Exporters
In most rice-importing countries, consumers gain($32.8 billion for all importers), but producers lose($27.2 billion). In some countries with large butnot prohibitive tariffs, significant tax revenuesevaporate under free trade ($2.9 billion in aggre-gate), while significant public savings occur withthe removal of domestic support ($2.7 billion inaggregate).
In rice-exporting countries producers gain fromhigher prices and expanded output ($70.3 billion),while consumers lose ($68.8 billion). Amongexporters, China accounts for the bulk of the pro-ducer gains and consumer losses. Behind the netgains are much larger transfers between producersand consumers. When these transfers are normal-ized by population to account for the large numberof producers and consumers in China and someother countries, the transfers are much smaller andless daunting than they appear. Many householdsare involved in both production and consumption.The net buyers detached from production activitiesare the largest losers.
Impact by Type of Rice
This logic of large transfers between consumersand producers holds on examination of the impactof reforms by rice type. Reform of trade inmedium-grain milled rice accounts for more than60 percent of the total global welfare improvement,at $4.3 billion, with importers benefiting by $3.4 bil-lion and exporters by $905 million. A breakdown bymilling stage reveals that importers of medium-grain brown rice benefit by $1 billion and exportersby $449 million. Liberalization of long-grain ricetrade generates improvements of $1.14 billion, withimporters gaining $1.06 billion and exporters just$80 million. High-quality rice trade yields welfaregains of $218 million—$195 million to importers
and $23 million to exporters. Most of these gainsare for high-quality milled rice ($69 million) andbrown rice ($124 million). Liberalization of paddyrice trade improves the welfare of exporters by$2.4 million and of importers by $22.4 million.Liberalization of low-quality rice trade improvesthe welfare of importing countries by $315 millionand exporters by $52 million.
Again these small net figures hide the largetransfers at work between sellers and buyers of rice.Nearly all of the net gains are captured by develop-ing countries. Reform of fragrant rice trade isestimated to improve the welfare of importers by$547 million, a result due primarily to Japan.Exporting countries (India, Pakistan, and Thailand)gain marginally in the net, although their producersdo gain substantially.
Impact by Country
Results by country or region depend on the type ofrice and degree of protection. The results discussedhere are for some key countries that are highly pro-tectionist or large traders of rice.
Asian importers. Among Asian importers, Japan,the most protectionist country in rice trade, wouldgain the most from liberalization. Medium-grainwhite rice prices would decline from $3,098 permetric ton to $656 per metric ton, while the volumeof trade would increase from 392,000 metric tonsto 2.18 million metric tons. This results in a welfaregain of $3.6 billion per year, with producers losing$19.2 billion and consumers gaining $24.2 billion.Savings from removing farm programs more thanoffset the loss in tariff revenue.
The patterns for the Republic of Korea andTaiwan (China) are similar. Border reform wouldtriple Korean imports of medium-grain rice to306,000 metric tons. Prices would decline from$1,952 per metric ton to $840 per metric ton. Koreaalso imports fragrant rice. With liberalization, thefragrant rice price would fall from $2,003 per metricton to $288 per metric ton. Consumers would expe-rience a net gain of $6.2 billion, while producerswould lose $5.9 billion. Taiwan (China) shows tradeand welfare patterns similar to those of Korea, butthe welfare gains are of magnitude smaller.
The Philippines is a major low-quality, long-grain rice importer. Elimination of import tariffs
188 Global Agricultural Trade and Developing Countries

would result in an increase of imports from787,000 metric tons to 1.02 million metric tons,induced by price declines to $215 per metric tons.Consumers would gain $701 million annually, andproducers lose from lower prices by $629 million.
The largest rice importer, Indonesia, would ben-efit from tariff reform of its low-quality long-grainrice imports. The volume of imports would in-crease from 1.3 million metric tons to 1.7 millionmetric tons. Prices would decline from $228 permetric ton to $196 per metric ton. Producers wouldlose $1.02 billion annually while consumers wouldgain $1.07 billion.
Asian exporters. China is the world’s largest pro-ducer of medium-grain rice and would therefore bethe largest export beneficiary of medium-grain ricetrade liberalization. Exports would more than dou-ble, from 614,000 metric tons to 1.47 million metrictons. Export prices would increase from $270 permetric ton to $647 per metric ton. Brown medium-grain rice trade would increase from 113,000 metrictons to 403,000 metric tons, with prices rising from$233 per metric ton to $834 per metric ton. Chinais also a significant exporter of low-quality long-grain rice. With trade liberalization, exports wouldincrease from 1.9 million metric tons to 2.3 millionmetric tons, and prices would increase from $178per metric ton to $190 per ton. Producers wouldgain $64.2 billion in aggregate, and consumerswould lose $63.6 billion, a large aggregate loss butless so when normalized by population.
Vietnam is the major low-quality long-grain riceexporter. Therefore tariff reform by importers ofthis type of rice would mostly benefit Vietnam.Exports would be expected to increase from 2.7 mil-lion metric tons to 3.1 million metric tons, andprices would rise moderately to $185 per metricton. Vietnam has steadily increased its volume ofhigh-quality milled long-grain rice. Trade reformwould increase this volume moderately as well as itsprice. In aggregate, Vietnamese consumers wouldlose from higher prices by $210 million annually,but producers would gain $229 million.
Thailand is the world’s dominant rice-exportingnation. All Thai exports are long grain, which is theleast protected rice type in world trade. As a result,the benefits of rice trade liberalization are small forThailand. Milled high-quality long-grain riceexports would increase from 3.3 million metric
tons to 3.4 million metric tons, milled low-qualitylong-grain exports from 1.6 million metric tons to1.8 million metric tons, and fragrant rice exportsfrom 1.21 million metric tons to 1.23 million met-ric tons. Price increases would be modest and leadto small gains to producers of $123 million annu-ally, while consumers would lose $101 million.
In India producers of long-grain rice would gainsubstantially ($973 million) but the gains would bealmost offset by losses to consumers ($967 mil-lion). These figures are the results of moderateprice changes applied to large volumes and repre-sent moderate impacts per producer or consumer.
Other exporters. Among other exporters, theUnited States would be the next most importantbeneficiary of rice trade liberalization after China.Milled medium-grain rice exports would increasefrom 226,000 metric tons to 383,000 metric tons,with prices rising from $270 per metric ton to$617 per metric ton. Brown medium-grain exportswould increase from 292,000 metric tons to594,000 metric tons, and prices would rise from$296 per metric ton to $803 per metric ton. TheUnited States is also a major exporter of high-quality long-grain rice. Summing across all riceimports and exports, the net gain to the UnitedStates would be $326 million annually, a result ofhigher total gains to producers of $2.2 billion andlosses to consumers of $1.9 billion annually.
Australia is the third largest medium-grain riceproducer and exporter and would also benefitgreatly from rice trade liberalization. Exports ofmilled medium-grain rice would increase from475,000 metric tons to 756,000 metric tons, withprices rising from $271 per metric ton to $615 permetric ton. The net welfare gain for milled medium-grain rice is $211 million. Brown medium-grain riceexport prices would increase from $235 per metricton to $805 per metric ton. Producers would gain$1.03 billion from higher prices, while consumerslose $745 million.
The fourth major medium-grain exporter isEgypt. Trade reform would result in an increase inexports of milled medium-grain rice from 326,000metric tons to 448,000 metric tons and an increasein prices from $298 per metric ton to $629 per met-ric ton. Producers would gain $1.39 billion andconsumers lose $1.26 billion, with a moderateaggregate net gain of $128 million.
Rice: Global Trade, Protectionist Policies, and the Impact of Trade Liberalization 189

Other importers. Among importers outsideAsia, the European Union would have an overallnet welfare gain from rice trade liberalization of$145 million annually. As an importer of high-quality long-grain brown rice, the European Unionwould increase imports from 451,000 metric tonsto 588,000 metric tons, and prices would fall from$496 per metric ton to $260 per metric ton. Theaggregate welfare gain for high-quality long-grainbrown rice imports would be $138 million annu-ally. This gain is offset by the higher prices that theEuropean Union would pay for medium-grainimports, up from $372 per metric ton to $624 permetric ton. The volume of medium-grain importswould decline from 645,000 metric tons to 595,000metric tons. The aggregate welfare change would bea gain to consumers of $254 million annually and aloss to producers of $109 million.
Africa. Nigeria became a major rice importerwhen it relaxed quantitative restrictions to rely pri-marily on tariffs. Nigeria imports milled high- andlow-quality parboiled rice. High-quality importswould increase from 36,000 metric tons to 144,000metric tons, and low-quality imports would in-crease from 682,000 metric tons to 877,000 met-ric tons. Prices would fall substantially for both.Rice producers would lose $186 million annuallywhile consumers would gain $271 million. Severalsmaller African developing nations would gainsimilarly, with large gains to consumers partiallyoffset by losses to producers.
North and Central America. Central Americanpaddy rice importers would capture most of thegains associated with liberalization of paddy rice.On the export side the analysis does not changecurrent rules in most countries, which ban paddyexport. Only Argentina and the United States cur-rently export paddy. The net gain to these twocountries would be $2.4 million. Paddy riceimporters—Costa Rica, El Salvador, Guatemala,Honduras, Mexico, and Nicaragua—would have anet gain of $22.4 million from lower import pricesand increased imports. The expanded trade wouldbenefit the domestic milling industries in theimporting countries and rice consumers at theexpense of rice producers.
Other countries. Several developing countriesand regions would lose from rice trade liberalization.
These are countries that have been importing ricewithout trade barriers. In a sense they have benefitedfrom protection by other importers since this pro-tection has depressed export prices. Removing tradebarriers would boost export prices for all rice typesby degree of milling. This has negative consequencesfor countries that have had little or no import pro-tection in rice. Most seriously affected would beTurkey, a major importer of medium-grain rice,which faces much higher export supply prices afterglobal trade reform. The estimated net welfare lossfor Turkey is $137 million.All importers of medium-grain rice, except Japan, the Republic of Korea, andTaiwan (China) lose as a result of significantly higherimport prices after global reform. The same situa-tion holds for long-grain rice importers that havelittle or no import protection. This includes MiddleEastern countries such as Iran, Iraq, and SaudiArabia. Brazil, Canada, Hong Kong (China),Malaysia, Singapore, and South Africa would also notbe expected to benefit from rice trade liberalization.
Dynamic Analysis of Rice Tradeand Domestic Policy Reforms
The RICEFLOW model used for the trade and wel-fare analysis presented above is a static spatial equi-librium framework of excess supply and demandequations. It does not allow for analysis of domesticfarm policies. For that, the Arkansas Global RiceModel (AGRM) was used. The AGRM is a partialequilibrium nonspatial dynamic econometricmodel of the global rice economy (Fuller, Wailes,and Djunaidi 2003; Wailes, Cramer, Chavez, andHansen 2000). The AGRM structure is based onequations for supply (expressed for estimated areaharvested and yields) and demand (domestic con-sumption, exports, imports, and ending stocks).Rice prices are endogenized, with world referenceequilibrium prices for long-grain and medium-grain rice. The AGRM is used to generate baselineestimates for domestic and international rice forthe FAPRI outlook (FAPRI 2004).
For this analysis, policy interventions in ricesupply that are trade distorting (Amber Box inWTO parlance) were removed. The model was alsosimulated for the removal of import tariffs andexport subsidies, to provide perspective. FinallyAGRM was used to examine the net effect of com-plete policy reform including domestic support,import protection, and export subsidies.
190 Global Agricultural Trade and Developing Countries

The AGRM baseline global trade (sum of allexports) projections are 27.9 million metric tons in2005 increasing to 33.6 million metric tons by2012.4 Long-grain rice prices in the baseline beginat $232 per metric ton in 2005 and increase to $277per metric ton by 2012. Medium-grain prices risefrom $332 per metric ton in 2005 to $406 per met-ric ton by 2012.
The removal of tariffs dominates all policyreform scenarios. Global rice trade increases by3.5 million metric tons in 2005 and continues toexpand to 5.3 million metric tons above the base-line. The removal of export subsidies reducesglobal rice trade in the short term by 720,000 met-ric tons, but the long-term effect is negligible.Taken together, the tariff effects swamp the exportsubsidy effects, and global trade is higher by2.7 million metric tons in 2005 and by 5.2 millionmetric tons in 2012. Elimination of domesticsupports in the United States, the European Union,and Japan reduces trade very slightly in the shortterm and not at all over the longer term. The com-bined effect of the removal of tariff barriers, exportsubsidies, and domestic supports increases tradeby 2.4 million metric tons in 2005 and by 4.9 mil-lion metric tons in 2012. The 15 percent expansionof global rice trade given by the more aggregatedbut dynamic AGRM model is remarkably similarto the static results generated by the RICEFLOWmodel.
The impact on global export prices follows theimpact on trade, with the dominant impact onprices resulting from removal of import tariffs. Thelong-grain export price is higher by $23 per metricton in the short term and by $43 per metric ton inthe longer term relative to the baseline level. In themore highly protected medium-grain rice market,tariff removal boosts prices by $291 per metric tonin 2005 and by $340 per metric ton in 2012. Theimpact of removal of export subsidies is importantonly in the short term, with long-grain rice exportprices 6 percent higher and medium-grain prices5 percent higher. The effect of removal of domesticsupport is negligible throughout the projectionperiod. The aggregate effects of policy reforms,including tariffs, export subsidies, and domesticsupports, is significant for both long-grain rice andmedium-grain rice prices. Long-grain rice exportprices are 18–22 percent higher. This result differsfrom the RICEFLOW model result. Medium-grainrice prices are higher than baseline projections by
70–80 percent, a result similar to the findings usingthe RICEFLOW model.
Policy Implications and Conclusions
Despite the importance of rice as a basic food sta-ple, especially in developing countries, rice tradeaccounts for only 6.5 percent of consumption. Suchlimited trade is due partly to preferences for spe-cific types and grades of rice, but also to protection-ist policies based on food security objectives orprice and income support for producers. The trade-weighted average import tariff on rice was 43 per-cent in 2000, and tariff escalation is common, toprotect rice milling industries.
Several market and production characteris-tics make rice prices more volatile than the pricesof most other commodities. Much of Asian riceproduction is subject to monsoon climates, re-sulting in uncertain yields. Global rice trade ishighly segmented by rice type (long and medium),degree of processing (milled, brown, and paddy),and quality (generally pertaining to the percent ofbroken kernels). As a staple food, the demand forrice is not very responsive to price and incomechanges.
The combination of a high degree of protection,geographic concentration, market segmentation,inelastic supply response to price, and inelasticdemand response to price and income results involatile prices and volumes traded. Distortions inrice trade occur throughout the world. State trad-ing enterprises are pervasive in rice trade, mostnotably in China, Indonesia, India, Japan, Republicof Korea, Vietnam, and Australia. State tradingtends to result in a lack of transparency in pricingand trade competitiveness. Thailand is a clearexception, as rice trade is managed by a very com-petitive group of export companies.
Domestic policy distortions exist in a number ofmajor rice trading nations, including Japan, theEuropean Union, and the United States. In theUnited States and the European Union, domesticsupport results in implicit or direct export subsi-dies. In Japan the government’s commitment tosupport rice prices is based on an aggressive riceland diversion program and a tightly managed tar-iff rate quota.
Policy reforms to eliminate protection in theglobal rice economy are estimated to boosteconomic welfare by more than $7.4 billion per
Rice: Global Trade, Protectionist Policies, and the Impact of Trade Liberalization 191

year. But the real story is the large transfers betweenconsumers and producers that lead to these netgains. Most of the gains can be achieved by elimi-nating tariffs on imports. In importing countriesconsumers gain $32.8 billion, while producers lose$27.2 billion. Governments lose $2.9 billion in tar-iff revenue but gain $2.7 billion by eliminatingdomestic supports. The net welfare gain to rice-importing countries is estimated at $5.4 billion. Inexporting countries producers gain $70.2 billion,while consumers lose $68.8 billion. Imports by theexporting countries result in a loss of tariff revenueof $5.3 million while elimination of domestic sup-ports saves $598 million. The net welfare gain inexporting countries is $2 billion.
With global policy reform, rice trade is estimatedto increase by 10–15 percent. Prices received byexporters would be 25–35 percent higher. Pricespaid by importers would be 10–40 percent lower,depending on the type of rice. Rice trade, despite theexpansion, would remain relatively thin. Completepolicy reform would result in an increase in ricetrade from the current level of 6.5 percent of con-sumption to 8.4 percent by 2012. Thus, one of themajor sources of world rice price instability is likelyto remain after liberalization. Global rice stockshave declined by 30 percent between 2000 and 2003.Thus, the ability of stocks to buffer supply shocks hasbeen markedly reduced. Global rice trade liberaliza-tion would make low-income, net-rice-importingcountries more reliant on world rice trade, likelyreducing political and food security.
Medium-grain rice is the most protected ricetype. Consequently, policy reform would have itsbiggest impact on countries that export and importmedium-grain rice. Japan is estimated to capturenearly 70 percent of the global economic welfaregains. Other industrial countries, such as Australia,the European Union, and the United States, thatexport medium-grain rice would also be significantbeneficiaries of trade policy reform.
Countries that had little or no protection beforereform are likely to be harmed by global policyreforms. This result is due to the large countryimpacts that increased imports in countries likeJapan would have, increasing the demand formedium-grain rice and thereby boosting worldprices. Countries like Turkey and Russia that haveimported medium-grain rice with moderate or no
protection would experience higher prices as aresult. The benefits of removing moderate levels oftariff protection, as in the case of Turkey, areswamped by the price effect of free and expandedtrade in medium-grain rice.
Domestic policy reforms in the United Statesand the European Union are estimated to reducerice exports by less than 5 percent in the initialyears and to have little or no impact on trade in thelonger term. Prices are estimated to be 5–10 percenthigher initially, but the effect diminishes to zeroover the longer term.
The multilateral and regional trade policyreforms adopted since the early 1990s have con-tributed to an expansion in rice trade and more sta-ble prices. The achievements of the Uruguay RoundAgreement on Agriculture include the opening ofthe previously closed Japanese and Korean markets.But the limits on domestic support and export sub-sidies have yet to have a significant impact. Regionalagreements such as NAFTA (North American FreeTrade Agreement) and Mercosur have increased ricetrade in the Western Hemisphere. The prospects forthe success of the Doha Round of the WTO hinge toa great extent on continuing the expansion of mar-ket access, reductions of tariffs, and limits on exportsubsidies required to achieve the benefits estimatedhere from global trade liberalization.
Notes
1. The direct payment is paid on a historical base produc-tion, decoupled from both current production and current mar-ket conditions. The countercyclical payment is also paid on ahistorical base production, and although payment is decoupledfrom current production, it is triggered by current market priceconditions. The government claims both payments as Green Boxin the WTO.
2. The large increase in the export prices for short- andmedium-grain rice does not consider the likely supply responsesby less-competitive producers that could enter the market andsurvive at that high price. Hence, this is an upper-bound esti-mate of the likely price increase.
3. Consumer and surplus gains and losses are estimatedusing the results of the baseline and free trade results of theRICEFLOW model. The welfare estimates for producers andconsumers are detailed in annex table 3 on the CD-ROM. Theresults are reported for the major importing and exportingcountries or regions by rice type and degree of milling. Annextable 4 on the CD-ROM includes the producer and consumerwelfare estimates with the impact on government revenues lostdue to tariff elimination and government expenditures elimi-nated because of the elimination of domestic support programs.
4. Results are presented in annex table 5 and annex figures 1–3on the CD-ROM.
192 Global Agricultural Trade and Developing Countries

References
Agricultural Market Access Database. (AMAD). Online:http://www.amad.net/index.htm.
Childs, N. W., and L. Hoffman. 1999. “Upcoming WorldTrade Organization Negotiations: Issues for the U.S. RiceSector.” Rice Situation and Outlook. RCS-1999. U.S.Department of Agriculture, Economic Research Service,Washington, D.C.
Commission of the European Communities. 2002. “Rice: Mar-kets, CMO and Medium Term Forecasts.” Commission StaffWorking Paper SEC(2002) 788. Brussels.
Cramer, G. L., E. J. Wailes, and S. Shui. 1993. “The Impacts ofLiberalizing Trade in the World Rice Market.” American Jour-nal of Agricultural Economics 75 (February): 219–26.
Cramer, G. L., E. J. Wailes, J. Goroski, and S. Phillips. 1991. “TheImpact of Liberalizing Trade on the World Rice Market:A Spatial Model Including Rice Quality.” Arkansas Experi-ment Station Special Report 153. University of Arkansas,Fayetteville.
Durand-Morat, A., and E. J. Wailes. 2003. “RICEFLOW(R): ASpatial Equilibrium Model of World Rice Trade.” Staff PaperSP 02 2003. University of Arkansas, Department of Agricul-tural Economics and Agribusiness, Division of Agriculture,Fayetteville.
Food and Agricultural Policy Research Institute (FAPRI). 2004.FAPRI 2004 World Agricultural Outlook, Iowa State Univer-sity and University of Missouri, Ames, Iowa, Staff Report 1-04, ISSN 1534-4533.
Fukuda, H., J. Dyck, and J. Stout. 2003. “Rice Sector Policies inJapan.” RCS-0202-01. U.S. Department of Agriculture, Eco-nomic Research Service, Washington, D.C.
Fuller, F., E. J. Wailes, and H. Djunaidi. 2003. “Revised ArkansasGlobal Rice Model.” Staff Paper SP 01 2003. University ofArkansas, Department of Agricultural Economics andAgribusiness, Division of Agriculture, Fayetteville.
Hansen, J., F. Fuller, F. Gale, F. Crook, E. Wailes, and M. Moore.2002. “China’s Japonica Rice Market: Growth and Competi-tiveness.” Rice Situation and Outlook Yearbook. RCS-2002.U.S. Department of Agriculture, Economic Research Service,Market and Trade Economics Division, Washington, D.C.
Jayne, T. S. 1993. “Sources and Effects of Instability in the WorldRice Market.” MSU International Development Paper 13.Michigan State University, Department of Agricultural Eco-nomics, East Lansing, Michigan.
Katial-Zemany, A., and N. S. Alam. 2003. “Indonesia Grainand Feed Annual, 2003.” Foreign Agricultural Service GAINReport ID3008. U.S. Department of Agriculture, Washington,D.C.
Khush, G. S., and D. S. Brar. 2002. “Biotechnology for RiceBreeding: Progress and Potential Impact.” Presented at the20th Session of the International Rice Commission,July 23–25, Bangkok, Thailand. www.fao.org/DOCREP/MEETING/004AC347E/AC347E00.HTM.
Nielsen, C. P. 2002. “Vietnam in the International Rice Market.”Rapport 132. Fødevareøkonomisk Institut. Copenhagen.
OECD (Organisation for Economic Co-operation and Develop-ment). 2003. Agricultural Policies in OECD Countries:Monitoring and Evaluation. Paris.
Sun, X., and A. Branson. 2002. “Food and Agricultural ImportRegulations and Standards, Interim Rules and Regulationsof Tariff Rate Quota 2002.” Foreign Agricultural ServiceGAIN Report CH2007. U.S. Department of Agriculture,Washington, D.C.
Timmer, C. P. 2002. “Food Security and Rice Price Policy inIndonesia: The Economics and Politics of the Food PriceDilemma.” Indonesian Food Policy Program Working Paper14. BAPPENAS/Department Pertanian/USAID/DAI FoodPolicy Advisory Team. Jakarta.
USDA PS&D (U.S. Department of Agriculture, Production,Supply and Distribution). 2003. PS&D Online. www.fas.usda.gov/psd.
USDA, FAS. “Rice. Annual”. Various years and countries. GlobalAgricultural Information Network (GAIN) Reports, ForeignAgricultural Service (FAS), Washington, D.C.
Wade, J., and J. Junyang. 2003. “China Grain and Feed Annual2003.” Foreign Agricultural Service GAIN Report 3010. U.S.Department of Agriculture, Washington, D.C.
———. 2002. “Trade Liberalization in Rice.” In P. Lynn Kennedy,ed., Agricultural Trade Policies in the New Millennium.New York: Haworth Press.
Wailes, E. J., G. Cramer, E. Chavez, and J. Hansen. 2000.“ArkansasGlobal Rice Model: International Baseline Projections for2000–2010.” Arkansas Agricultural Experiment StationSpecial Report 200. University of Arkansas, Fayetteville.
WTO (World Trade Organization). 2001. “Report of the Work-ing Party on the Accession of China.” WT/MIN(01)/3. Pre-sented at the Fourth Session of the Ministerial Conference,November 9–14, Doha, Qatar.
Young, K. B., E. J. Wailes, G. L. Cramer, and N. Tri Khiem. 2002.“Vietnam’s Rice Economy: Developments and Prospects.”Arkansas Agricultural Experiment Station Research Report968. University of Arkansas, Fayetteville.
Zhang, J., R. Matthews, and A. Branson. 2002. “Food and Agri-cultural Import Regulations and Standards, ImplementationMeasures for 2002 TRQ Allocation.” Foreign AgriculturalService GAIN Report CH2008. U.S. Department of Agricul-ture, Washington, D.C.
Rice: Global Trade, Protectionist Policies, and the Impact of Trade Liberalization 193

local production. Competing exporters such asArgentina, Kazakhstan, the Russian Federation, andUkraine are also harmed because they receive lowerprices for their wheat. The surplus disposal pro-grams are reduced during periods of low stocks andrelative wheat shortages, thus contributing toglobal price volatility. In addition, many exportingcountries have resorted to export restrictions toprotect domestic consumers when prices are high, apractice that further adds to global price volatility.Such policies make it very difficult for importingcountries to rely on the world wheat market to ful-fill a significant portion of their needs because ofthe uncertainty of world supply. Consequently,many countries follow policies aimed at self-sufficiency and thus are deprived of the benefits oftrade. Policy reforms that reduced global volatilityin wheat prices, cut production subsidies, andimproved access to exports during periods of highprices would reduce food security concerns.
This chapter discusses major trends and devel-opments in the world wheat market and theirimpact on trade and food security. We begin bylooking at the characteristics of wheat and trends inwheat production, use, trade, stocks, and prices. Wethen examine the policy environment, focusingespecially on trade policy and domestic support.
Wheat is one of the most important food crops, pro-viding nearly one-fifth of the world’s calorie sup-plies. About 19 percent of the world’s production istraded internationally, primarily as exports from thecountries of the Organisation for Economic Co-operation and Development (OECD)—includingAustralia, Canada, the European Union (EU), andthe United States—to developing countries to supplybasic food needs and the growing demand for prod-ucts made from wheat flour, such as bread, pasta, andnoodles.1 Wheat is also the food crop most com-monly stored as a buffer against production short-falls, with an average of 30 percent of the world’swheat production carried over from one crop year tothe next. The global wheat situation and wheat poli-cies of major actors are thus central to the food secu-rity and dietary preferences of many countries.
Major OECD wheat exporters, such as the Euro-pean Union and the United States, support domes-tic production. The support policies often lead tosurpluses, which are then exported with subsidiesor donated as food aid that is not emergencyrelated. Developing countries sometimes benefitfrom such surplus disposal programs because theypay lower import prices or receive food aid. How-ever, countries are also harmed by such programsbecause they depress world prices and discourage
195
11
WHEAT: THE GLOBALMARKET, POLICIES, AND
PRIORITIES
Donald O. Mitchell and Myles Mielke

196 Global Agricultural Trade and Developing Countries
Wheat Characteristics and Trends
Wheat is produced in 120 countries and accountsfor about 19 percent of the world’s calorie supplies.It is used primarily as flour for making bread, pas-try, pasta, or noodles. It is also used to feed livestock,with feed use accounting for about 17 percent ofglobal wheat consumption. In addition, the by-products from milling wheat into flour are used asfeed. Wheat stores for several years without deterio-ration under proper conditions, making it wellsuited for use as a buffer against food shortages.
The many varieties of wheat have different pro-tein levels and varying milling and baking charac-teristics. The protein levels range from about 8 to18 percent. High-protein wheat is better suited tobread and pasta making, while lower protein wheatis better suited for pastry and noodles. There is sub-stitution between wheat varieties and blending ofdifferent varieties to produce flour with specificcharacteristics. The demand for high-quality wheatand wheat with specific characteristics is increas-ing, as buyers become more sophisticated. Proteinpremiums have steadily increased since the early1980s, as responsibility for import decisions hasshifted to the private sector, which is better ableto evaluate quality and more willing to paypremiums (Wilson and Dahl 1999). There has alsobeen greater specificity in purchasing contracts.For example, the Australian Wheat Board offered34 different segregations of wheat in the mid-
1990s, compared to just 2 in 1980 (Carter andWilson 1999).
Production and Yields
Wheat is produced under a variety of climatic con-ditions using technologies ranging from fullymechanized production and harvesting on largetracts to manual planting and harvesting on smallplots. About 61 percent of wheat is produced innon-OECD countries (table 11.1); this share hasbeen increasing over time as production has grownmore rapidly in developing countries than inOECD countries. The European Union, China, andIndia are the largest producers, with 18, 16, and13 percent of global production, respectively.
Wheat yields have increased significantly sincethe middle of the 20th century. From 1961 (whendata on many countries first became available) to2000, world wheat yields increased by an average of2.4 percent each year. The increase in yields indeveloping countries came from using more inputs(such as fertilizer) and high-yielding semi-dwarfseed varieties developed at the International Maizeand Wheat Improvement Center (CIMMYT) inMexico and released to developing countries in themid-1960s in what is now known as the Green Rev-olution. These varieties, adapted to local condi-tions, were quickly adopted (Dalrymple 1974). Asshown in figure 11.1, average yields in India arenow very similar to those in the United States, at
TABLE 11.1 Wheat Production, Trade, and Growth Rates 1989–91 to 1999–2001,by Region
Millions of Tons Growth Rates (percent)
Region Production Imports Exports Production Imports Exports
World 583 107 108 0.5 0.4 0.4OECD 227 19 80 0.6 6.2 −1.1Non-OECD 356 88 28 0.4 −0.5 5.4
Africa 17 26 0 1.3 3.3 9.7Americas 111 25 58 −0.4 6.8 −0.3Asia 199 27 4 1.7 −2.1 15.1Europe 130 8 17 −1.0 −4.3 −2.2FSU 75 6 9 −1.5 −12.2 4.8Middle East 29 12 4 0.5 3.2 −6.3Oceania 24 1 17 6.6 5.4 5.4
Note: Production, imports, and exports are the average for 1999–2001 crop years, which begin withharvest and vary by country. Growth rates are for the average of 1999–2001 compared with 1989–91.Source: USDA PSD online database and USDA 2003.

about 2.8 tons per hectare, thanks largely to theGreen Revolution. The annual increase in yieldsfrom 1950 to 2000 was 1.89 percent in the UnitedStates and 2.95 percent in India.2
While improvements in wheat yields have con-tinued along historical trends, the growth of globalwheat production has slowed to just 0.5 percent peryear over the last decade (see table 11.1), largelybecause of slower consumption growth and thecorresponding adjustment in production. Areaplanted with wheat declined by 5.5 percent from1989–91 to 1999–2001, mostly as a result of land-diversion policies of major exporters such as theUnited States. Certain regions, such as Oceania,increased production and exports during thisperiod because of favorable exchange rates and lowproduction costs, while others, such as the former
Soviet Union (FSU), reduced production becauseof reduced input use and lower domestic demand.
Trade
Trade of wheat is primarily from OECD to non-OECD countries, with about three-quarters ofglobal wheat exports coming from OECD countriesand 82 percent of imports absorbed by non-OECDcountries (see table 11.1). Trade of wheat grew only0.4 percent per year during the 1990s, while tradein processed products made from wheat (bakeryproducts, flour, pasta, and other products) ex-panded more rapidly (table 11.2). This increase inwheat product trade has occurred despite tariffescalation with higher levels of processing. Most ofthe trade in processed products has been between
Wheat: The Global Market, Policies, and Priorities 197
FIGURE 11.1 Wheat Yields, U.S. and India, 1900–2000
0.0
0.5
1.0
1.5
2.0
2.5
3.0
1900 1910 1920 1930 1940 1950 1960 1970 1980 1990 2000
Tons per hectare
United States India
Source: USDA.
TABLE 11.2 Global Wheat and Wheat Products Exports, Selected Periods(millions of US$)
Average Value Annual Percentage Increase
Product 1970* 1980* 1990* 2000* 1970–80 1980–90 1990–2000
Wheat 3,146 15,502 15,572 14,399 17.3 0.0 −0.8Bakery 227 1,362 3,913 8,108 19.6 11.1 7.6Flour 408 1,889 1,748 1,763 16.6 −0.8 0.1Pasta 39 285 841 1,508 21.9 11.4 6.0Other 113 894 1,237 972 23.0 3.3 −2.4Total wheat products 787 4,430 7,738 12,352 18.9 5.7 4.8
*Data is three-year average centered on year shown. Note: Values are in nominal U.S. dollars. Bakery products include bread and pastry. Other productsinclude gluten feed and meal, bran, germ, and whole meal bulgur.Source: FAOSTAT.

developed countries. During 1999–2001 about85 percent of global exports and 77 percent ofglobal imports of processed wheat products wereby developed countries. Developing countries pri-marily import wheat rather than products, withabout 80 percent of total expenditures on wheatgoing for grain imports during 1999–2001. At thesame time, developing countries have increasedtheir wheat product exports from one-third of theaverage value of total wheat and product exportsduring 1979–81 to one-half the average value in1999–2001.
Use
Wheat use has grown faster than population—at2.5 percent per year since 1961, compared withpopulation growth of 1.7 percent. More recently,however, use has slowed, and per capita food con-sumption has remained nearly constant for morethan a decade in both developed and developingcountries (figure 11.2). Feed use has shown stronggrowth among both developed and developingcountries, but this growth has been offset by thedramatic drop in feed use in the countries of theFSU following the breakup of the Soviet Union.Global use of wheat for feed rose hardly at all dur-ing 1981–2001, compared with average annualgrowth of 7 percent during 1961–81. Among devel-oping countries, feed use grew by 2.4 percent peryear in 1981–2001, compared to 6 percent per yearduring the previous two decades. Developing coun-
tries tended to substitute wheat for other grainswhen prices were advantageous; this was particu-larly true for those Asian countries that are sensitiveto prices of grain imports for feed rations. Thedemand for other uses of wheat, such as industrialuses and as a food additive (gluten, starches, and soon), also has been steady during the past fourdecades, growing at an average of 1.6 percentper year.3
Stocks
Wheat carryover, or ending-stocks, provide a bufferagainst wheat shortages during years of low produc-tion or rapid increases in demand. When stocks arehigh, prices tend to be low, and vice-versa. The levelof global ending-stocks as a percentage of con-sumption and real wheat prices are shown in fig-ure 11.3. The inverse relationship is readily apparent.
The share of global wheat stocks held by the fivemajor exporters (Argentina, Australia, Canada, theEuropean Union, and the United States), whichtogether account for three-quarters of net exports,declined from 80 percent in 1960 to about 20 percentin 2002. This dramatic shift occurred for two mainreasons. First, the share of global production of thefive major exporters declined from a high of 46 per-cent in 1963 to 33 percent in 2002 as production indeveloping countries increased more rapidly thanamong major exporters. Second, policy changes inthe major exporters reduced government-heldstocks. The consequence has been a shrinking supply
198 Global Agricultural Trade and Developing Countries
FIGURE 11.2 Per Capita Food Consumption of Wheat
01960 1965 1970 1975 1980 1985 1990 1995 2000
30
60
90
120
150
Kilograms per year
Developed Developing
Source: FAO.
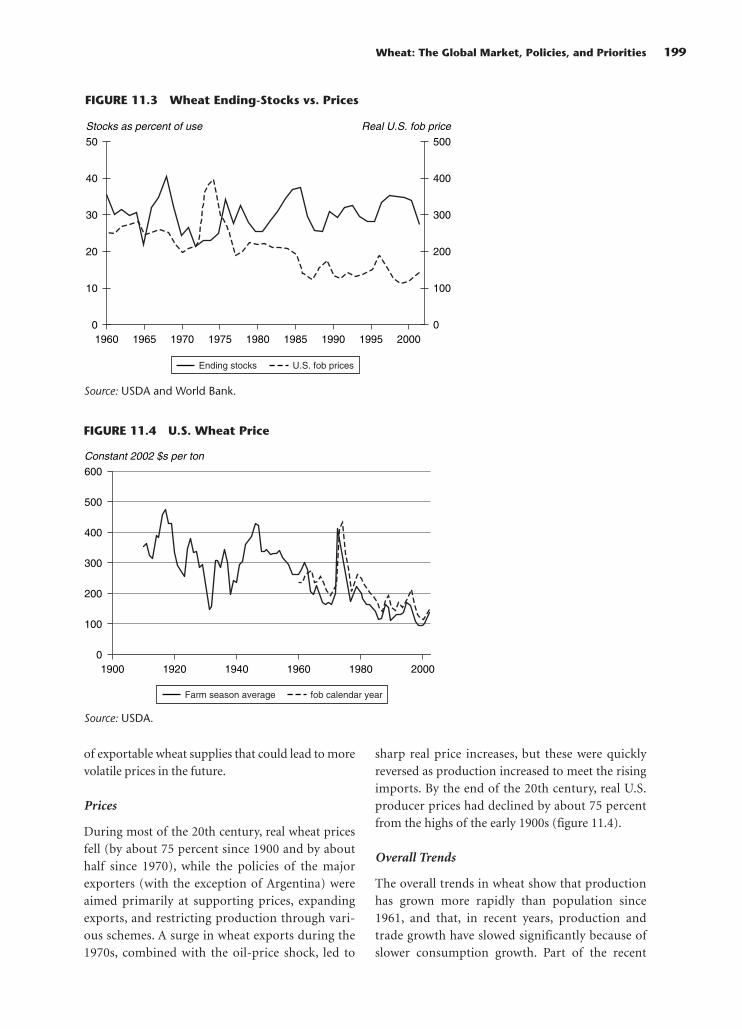
of exportable wheat supplies that could lead to morevolatile prices in the future.
Prices
During most of the 20th century, real wheat pricesfell (by about 75 percent since 1900 and by abouthalf since 1970), while the policies of the majorexporters (with the exception of Argentina) wereaimed primarily at supporting prices, expandingexports, and restricting production through vari-ous schemes. A surge in wheat exports during the1970s, combined with the oil-price shock, led to
sharp real price increases, but these were quicklyreversed as production increased to meet the risingimports. By the end of the 20th century, real U.S.producer prices had declined by about 75 percentfrom the highs of the early 1900s (figure 11.4).
Overall Trends
The overall trends in wheat show that productionhas grown more rapidly than population since1961, and that, in recent years, production andtrade growth have slowed significantly because ofslower consumption growth. Part of the recent
Wheat: The Global Market, Policies, and Priorities 199
FIGURE 11.3 Wheat Ending-Stocks vs. Prices
0
10
20
30
40
50 500
400
300
200
100
0
Stocks as percent of use Real U.S. fob price
1960 1965 1970 1975 1980 1985 1990 1995 2000
Ending stocks U.S. fob prices
Source: USDA and World Bank.
Source: USDA.
FIGURE 11.4 U.S. Wheat Price
01900 1920 1940 1960 1980 2000
100
300
200
400
500
600
Constant 2002 $s per ton
Farm season average fob calendar year

slowdown in consumption has been due to the col-lapse of the FSU, but, in addition, per capita con-sumption of wheat as food has stopped increasingin both developed and developing countries. Tradein wheat products has grown more rapidly thangrain trade, especially among developed countries.The steady decline in real wheat prices and thedecline in stocks held by the major exporting coun-tries as a share of world stocks could lead to greaterprice volatility.
Policy Environment
Under the Uruguay Round Agreement on Agricul-ture (URAA), member countries of the WorldTrade Organization (WTO) had to convert quanti-tative restrictions on imports into bound tariffs,reduce those tariffs over an implementation period,open their markets to imports under minimumaccess provisions, limit and reduce the most trade-distorting forms of domestic support, and cap andreduce subsidized wheat exports. Despite these sig-nificant achievements, the amount of trade liberal-ization achieved in wheat was modest because ofthe way the reforms were implemented. Manycountries applied the Uruguay Round provisions sothat they could protect producers in key sectors
from foreign competition. Applied tariffs wereoften set high, and bound tariffs even higher, leav-ing open the possibility of future increases in ap-plied tariffs. Wheat export subsidies were reducedby the European Union and the United States—thecountries with the largest export subsidies—butthat was attributable more to budget constraintsthan to the URAA. Implementation of minimumaccess and tariff reductions have stalled as coun-tries have introduced new measures to offset agreedcommitments or to prevent them from takingeffect.
Market Access
Most countries met the minimum market accessrequirements of the URAA by establishing tariffrate quotas (TRQs), which provided for reducedtariff rates on a specified volume of imports(table 11.3). Imports above these quotas facedhigher tariffs. However, regional trading agree-ments often have provided even lower tariffs orduty-free access to regional trading partners. Forexample, Mexico established a TRQ for wheat of605,000 tons at an in-quota tariff of 67 percent.Meanwhile, Canada and the United States receive apreferential tariff of 4.5 percent under the North
200 Global Agricultural Trade and Developing Countries
TABLE 11.3 Tariffs and Tariff Rate Quotas, by Country(percent and millions of metric tons)
Year of Bound Tariffs Applied Tariffs Regional TradeCountry Report Final TRQ In-Quota Above-Quota Average Preferential Agreements
Brazil 2001 750 0.0 55.0 12.5 0.0 MercosurCanada 2001 227 0.7 62.8 1.3 0.0 NAFTAChina 2001 7,884 1.0 74.0 — — —Colombia 2001 692 124.0 130.0 12.5 — AndeanEcuador 1999 480 19.0 23.6 9.2 — —European 2001 350 0.0 58.9 12.8 0.0 Central
Union EuropeIsrael 2000 450 92.0 137.8 — 0.0 EU, U.S.Japan 2001 5,740 249.2 414.3 — — —Mexico 2001 605 50.0 67.0 67.0 4.5 NAFTAMorocco 2001 1,555 144.0 198.4 30.1 2.5 EUPoland 2000 280 25.0 64.0 20.0 0.0 EUSouth Africa 2001 108 20.0 93.0 — — —Tunisia 2000 900 17.0 86.7 20.0 — EUVenezuela 2000 1,317 24.0 117.0 11.0 — —
— Not available.Source: WTO, FAO, USDA, and ABARE 2002.

American Free Trade Agreement (NAFTA). Conse-quently, virtually all of Mexico’s wheat importscome from Canada and the United States. Brazil’swheat imports are mostly supplied by Argentina,which has a comparative advantage in geographicproximity and in preferential treatment under theMercosur regional trade agreement (Diaz-Bonilla1999).
Turkey did not establish a TRQ for wheat, butinstead relied on tariff-only protection with abound tariff of 188 percent and an applied tariff of55 percent. Because imports from the EuropeanUnion receive a zero tariff under a regional tradeagreement, however, most of Turkey’s importscome from the European Union. The Russian Fed-eration, which is not a member of the WTO, pro-vides preferential access to several FSU countries.The European Union has protected its producersthrough variable import levies for many years aspart of the Common Agricultural Policy, but itmore recently resorted to TRQs on low- tomedium-grade wheat to slow wheat imports fromUkraine and the Russian Federation.
Tariff escalation is a common practice thatencourages trade in wheat grain rather than inwheat products (table 11.4). Tariffs generally esca-late with the degree of processing of wheat prod-ucts. Brazil, the largest wheat importer during the1990s, imposed an average tariff on wheat importsof 6.3 percent, but the tariff on wheat flour was13.5 percent, and those for pasta and bakery prod-ucts were 18.5 and 20.5 percent, respectively.Because of the high tariffs on value-added prod-ucts, most imports were in the form of grain orflour. Bangladesh, Costa Rica, Egypt, Guatemala,Jordan, the Philippines, and Uganda showed simi-lar patterns, with most tariffs escalating withgreater processing and larger imports of the prod-ucts with the lower tariffs. Kenya, the Republic ofKorea, Japan, and Mexico had different patternsthat may reflect stronger protection to producers orspecific processors. For example, Kenya had a35 percent tariff on wheat imports, but a 25 percenttariff on flour, pasta, and bakery products. Koreahad prohibitive tariffs on wheat flour imports, butmuch lower tariffs on wheat grain, pasta, andbakery products. Consequently, there have beenalmost no flour imports, while wheat, pasta, andbakery products have had large imports. The verylow tariffs on wheat probably reflect the fact that
Korea produced less than 1 percent of its consump-tion but used high tariffs to protect flour millers.Japan has specific duties on wheat, flour, and pasta;Mexico had specific duties on bakery products. Therelatively large imports of bakery products despitehigh tariffs suggest high demand or lack of compet-itiveness of local bakers.
Indonesia and Malaysia, which had low tariffsfor wheat and all wheat products, provide an inter-esting case of imports without much distortion.There is still some tariff escalation, but the maxi-mum tariff was a relatively low 6.3 percent on pastaimports in Malaysia and 5.0 percent on bakeryproducts in Indonesia. Imports reflect these lowtariffs, with wheat products accounting for almosthalf of the value of imports in Malaysia and forone-third in Indonesia. This suggests that withouttariff escalation, wheat product trade would haveincreased significantly, benefiting consumers. Tradein processed wheat products is concentrated withinfree trade areas such as within the European Unionand NAFTA. The shares of global trade occurringwithin these two regions alone during 2000–01were 23, 36, 50, and 66 percent, respectively, forwheat, flour, pasta, and bakery products.
Some countries have used nontariff barriers(NTBs) to protect their domestic wheat markets.For example, the United States resorted to phy-tosanitary standards during the 1980s to blockwheat imports from Mexico. At that time, durumwheat producers in the southwestern United Statesused the existence of Karnal bunt as a reason toblock wheat imports from Mexico (Beattie andBiggerstaff 1999).4 In an ironic twist, wheat importsfrom four southwestern states of the United Statesare currently banned by Mexico because of con-cerns about Karnal bunt (USDA 2004). U.S. wheatwas also barred from three major wheat marketsduring the second half of the 1990s because ofphytosanitary concerns. Brazil, China, and Indiabanned the import of U.S. wheat, in particularfrom the Pacific Northwest, based on the possiblepresence of tilletia controversa kuhn (TCK) fungusand mycotoxins. While all three cases were resolvedby the end of the decade, U.S. wheat exports tothese markets have not recovered due to changingmarket conditions.
Several kinds of NTBs have also been adminis-tered by governments to control wheat imports—in many cases these have been lessened or
Wheat: The Global Market, Policies, and Priorities 201
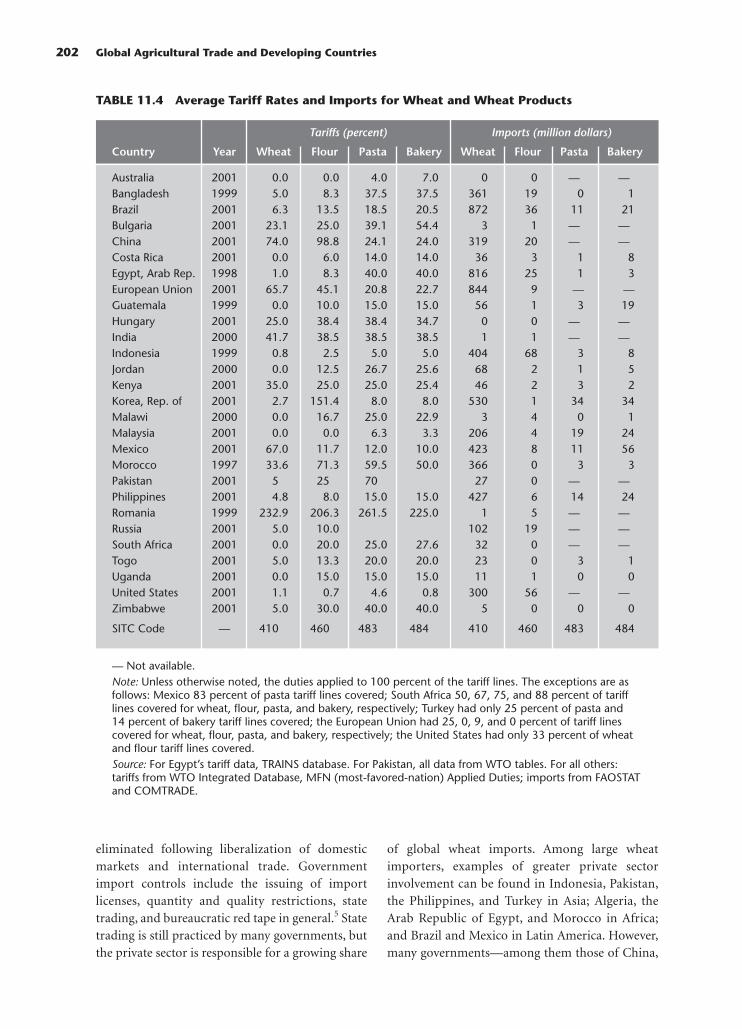
eliminated following liberalization of domesticmarkets and international trade. Governmentimport controls include the issuing of importlicenses, quantity and quality restrictions, statetrading, and bureaucratic red tape in general.5 Statetrading is still practiced by many governments, butthe private sector is responsible for a growing share
of global wheat imports. Among large wheatimporters, examples of greater private sectorinvolvement can be found in Indonesia, Pakistan,the Philippines, and Turkey in Asia; Algeria, theArab Republic of Egypt, and Morocco in Africa;and Brazil and Mexico in Latin America. However,many governments—among them those of China,
202 Global Agricultural Trade and Developing Countries
TABLE 11.4 Average Tariff Rates and Imports for Wheat and Wheat Products
Tariffs (percent) Imports (million dollars)
Country Year Wheat Flour Pasta Bakery Wheat Flour Pasta Bakery
Australia 2001 0.0 0.0 4.0 7.0 0 0 — —Bangladesh 1999 5.0 8.3 37.5 37.5 361 19 0 1Brazil 2001 6.3 13.5 18.5 20.5 872 36 11 21Bulgaria 2001 23.1 25.0 39.1 54.4 3 1 — —China 2001 74.0 98.8 24.1 24.0 319 20 — —Costa Rica 2001 0.0 6.0 14.0 14.0 36 3 1 8Egypt, Arab Rep. 1998 1.0 8.3 40.0 40.0 816 25 1 3European Union 2001 65.7 45.1 20.8 22.7 844 9 — —Guatemala 1999 0.0 10.0 15.0 15.0 56 1 3 19Hungary 2001 25.0 38.4 38.4 34.7 0 0 — —India 2000 41.7 38.5 38.5 38.5 1 1 — —Indonesia 1999 0.8 2.5 5.0 5.0 404 68 3 8Jordan 2000 0.0 12.5 26.7 25.6 68 2 1 5Kenya 2001 35.0 25.0 25.0 25.4 46 2 3 2Korea, Rep. of 2001 2.7 151.4 8.0 8.0 530 1 34 34Malawi 2000 0.0 16.7 25.0 22.9 3 4 0 1Malaysia 2001 0.0 0.0 6.3 3.3 206 4 19 24Mexico 2001 67.0 11.7 12.0 10.0 423 8 11 56Morocco 1997 33.6 71.3 59.5 50.0 366 0 3 3Pakistan 2001 5 25 70 27 0 — —Philippines 2001 4.8 8.0 15.0 15.0 427 6 14 24Romania 1999 232.9 206.3 261.5 225.0 1 5 — —Russia 2001 5.0 10.0 102 19 — —South Africa 2001 0.0 20.0 25.0 27.6 32 0 — —Togo 2001 5.0 13.3 20.0 20.0 23 0 3 1Uganda 2001 0.0 15.0 15.0 15.0 11 1 0 0United States 2001 1.1 0.7 4.6 0.8 300 56 — —Zimbabwe 2001 5.0 30.0 40.0 40.0 5 0 0 0
SITC Code — 410 460 483 484 410 460 483 484
— Not available.Note: Unless otherwise noted, the duties applied to 100 percent of the tariff lines. The exceptions are asfollows: Mexico 83 percent of pasta tariff lines covered; South Africa 50, 67, 75, and 88 percent of tarifflines covered for wheat, flour, pasta, and bakery, respectively; Turkey had only 25 percent of pasta and14 percent of bakery tariff lines covered; the European Union had 25, 0, 9, and 0 percent of tariff linescovered for wheat, flour, pasta, and bakery, respectively; the United States had only 33 percent of wheatand flour tariff lines covered. Source: For Egypt’s tariff data, TRAINS database. For Pakistan, all data from WTO tables. For all others:tariffs from WTO Integrated Database, MFN (most-favored-nation) Applied Duties; imports from FAOSTATand COMTRADE.

the Islamic Republic of Iran, India, and Japan—stillcontrol wheat imports through various schemes.
Export promotion
The two largest providers of wheat export subsi-dies, the European Union and the United States,had largely eliminated export subsidies by 2001 asglobal prices rose and the European Union reducedintervention prices under its 1992 and Agenda 2000policy reforms. The European Union agreed toreduce subsidized exports to 14.4 million tons by2000 and thereafter under the URAA and has notreported export subsidies since the 2001–02 sea-son.6 The United States agreed to reduce subsidizedwheat exports to 14.5 million tons by 2000 andthereafter under the URAA, although the U.S. pri-mary export subsidy facility, the Export Enhance-ment Program, has not been used for wheat since1995. Under URAA, however, both countries couldrevive their export subsidy programs and togethercould subsidize nearly one-quarter of global wheatexports. Export credits were still used by Australia,Canada, the European Union, and the United Statesas recently as 1998, the most recent period forwhich complete data were available (OECD 2000).
Food aid has been provided by many countriesto respond to emergencies or persistent food short-ages. It has often been charged, however, that foodaid is partly used as a way to dispose of surplus pro-duction. This charge is supported by the fact that
85 percent of global wheat food aid during1990–2000 was provided by four of the world’smajor wheat exporters. The United States provided54 percent of world wheat food aid, the EuropeanUnion 20 percent, Canada 8 percent, and Australia3 percent (FAOSTAT). In total, wheat food aidaccounted for about 6 percent of wheat trade dur-ing 1990–2000. Over a longer period, the UnitedStates provided an average of 3.3 million tons ofwheat food aid from 1970 to 2000, averaging10 percent of U.S. wheat exports. The level of foodaid varied with price (figure 11.5), which suggeststhat it was partly surplus disposal.7
Food Security and Global Wheat Trade
Since wheat is the food grain most often used as abuffer against food shortages, any disruption oftrade flows or sharp increases in prices causes foodsecurity concerns for importing countries. Whenreal wheat export prices doubled from 1970 to 1974,for example, policymakers in wheat-importingcountries were quick to raise concerns. These werefurther heightened when the United States imposedgrain export embargoes in 1974 and 1975 to protectits own consumers from high prices.8 Such actionslikely contributed to the strong desire for food self-sufficiency in many food-importing countries. TheUnited States again embargoed grain sales to theSoviet Union in 1980 as a foreign policy actionmotivated by the USSR’s invasion of Afghanistan.
Wheat: The Global Market, Policies, and Priorities 203
FIGURE 11.5 U.S. Wheat Food Aid vs. Prices
0
2
4
6
8 250
200
150
100
50
0
Food aid million tons Price US$ per ton
1970 1975 1980 1985 1990 1995 2000
Total aid U.S. fob price
Source: USDA and World Bank.

The embargo lasted nearly 16 months and includeda wide range of products. The European Union pro-voked anxiety over food security again in 1995, afterit had become a wheat exporter, when it imposed anexport tax of $35 per ton on wheat during 1995–96to protect its consumers from high prices.9 TheRussian Federation recently took similar action byimposing an export tax on wheat of 25 euros perton during the period from January 15 to May 1,2004. Several other wheat exporters also imposedrestrictions on wheat exports, including Hungary,India, and Ukraine. As with the previous actions,the policies were intended to protect domestic sup-plies and control prices. All came at times whenworld prices were rising and the availability of sup-plies was uncertain. Such actions send the signalthat access to wheat exports cannot be relied uponduring periods of shortages and high prices.
Domestic support
Because domestic support commitments under theURAA apply to the whole of agriculture rather thanto individual commodities, countries have beenable to protect their most politically sensitive sec-tors by keeping support high. According to OECDestimates, domestic support to OECD wheat pro-ducers averaged $17.3 billion per year during1999–2001 (table 11.5), compared with $18.7 bil-lion per year during the 1986–88 base period of theURAA. Domestic support in 1999–2001 accountedfor 41 percent of the value of wheat production atfarm-gate prices. The European Union and theUnited States provided the largest absolute supportto wheat, amounting to $9.6 billion and $4.9 billionper year, respectively. However, support represent-ing a higher percentage of the value of wheat
204 Global Agricultural Trade and Developing Countries
TABLE 11.5 Support to OECD Wheat Producers, 1999–2001
Producer SupportOECD Country/Region (millions of dollars) PSE Percentage Producer NPC Producer NAC
OECD 17,331 41 1.16 1.70Australia 119 5 1.01 1.05Canada 358 15 1.01 1.17Czech Republic −10 −3 0.87 0.97European Union 9,565 48 1.15 1.95Hungary 53 13 1.06 1.15Japan 822 86 6.38 7.20Mexico 237 39 1.44 1.64Norway 67 71 2.63 3.58Poland 251 21 1.22 1.27Slovak Republic 5 5 0.86 1.06Switzerland 191 63 2.33 2.82Turkey 551 26 1.30 1.41United States 4,928 46 1.12 1.86
Note: Producer support was converted from local currency to U.S. dollars using period average annualexchange rates from International Monetary Fund’s International Financial Statistics, 2002 Yearbook.PSE percentage is producer support estimate, an indicator of the annual monetary value of gross transfersfrom consumers and taxpayers to support agricultural producers, measured at farm-gate level as apercentage of the value of production arising from policy measures, regardless of their nature, objectives,or impact on farm production or income. Producer NPC is producer nominal protection coefficient, anindicator of the nominal rate of protection for producers measuring the ratio between the average pricereceived by producers (at farm gate), including payments per ton of current output, and the border price(measured at farm-gate level). Producer NAC is producer nominal assistance coefficient, an indicator ofthe nominal rate of assistance to producers measuring the ratio between the value of gross farm receiptsincluding support and gross farm receipts valued at world market prices without support. No calculationswere made for Canada, Iceland, New Zealand, Norway, or the Republic of Korea.Source: OECD 2002

production was provided by Japan (86 percent),Norway (71 percent), and Switzerland (63 percent).
Major Wheat Exporters
Five countries accounted for about three-quarters ofnet global wheat exports in 1970–1999 (table 11.6).The United States was the largest net exporter overthis period, but its share declined from nearly41 percent during the 1970s to 27 percent during the1990s. Canada was the second-largest net exporterwith an 18–19 percent share. Australia maintainedits 12 percent share throughout the period, andArgentina expanded its share from about 4 to 6 per-cent of global exports. The European Union ex-ported 10 percent of global net exports during the1990s after being a net importer of about 10 percentof global trade during the 1970s. The emergence ofthe European Union as a major exporter was attrib-utable to highly subsidized production and exportsunder the Common Agricultural Policy (CAP) andwas largely at the expense of U.S. exports.
Wheat support policies of the major exportershave changed since the early 1980s, with Australiaand Canada significantly reducing support to theirwheat producers, while the European Union and theUnited States have decreased support more moder-ately according to OECD estimates (table 11.7).Argentina, which is not an OECD country and doesnot have producer support estimates comparable tothe other major exporters, has historically taxedrather than supported its wheat producers.
Canada made the largest reductions in wheatsupport among major exporters between 1986–88
and 2000–02, with total producer support declin-ing from 45 percent of the value of production to16 percent. The country largely abandoned directprice support to individual commodities in favor ofincome support in the early 1990s (Gardiner 1999).This led to reduced wheat production and reducednet exports by 13 percent between 1990–95 and1996–2001 (table 11.8).
The European Union sharply reduced wheatintervention prices in the CAP reform of 1992 andimplemented a mandatory land set-aside policy(Rayner and others 1999). Further reforms weretaken in 2000 and 2003. However, total support didnot decline significantly (see table 11.7), and pro-duction continued to increase (see table 11.8).Consumption increased because of the lower inter-vention prices, allowing net exports to fall by41 percent between 1990–95 and 1996–2001.
The United States undertook major reforms inthe 1980s, with the reduction in wheat loan ratesand the introduction of the Conservation Reserve
Wheat: The Global Market, Policies, and Priorities 205
TABLE 11.7 Producer Support Estimates,1986–88 and 2000–02(percent)
Exporter 1986–88 2000–02
Australia 9 5Canada 45 16European Union 52 46United States 49 40
Source: OECD 2003.
TABLE 11.6 Major Wheat Exporters’ Shares of Global Wheat Net Exports(percent)
Exporter 1970–79 1980–89 1990–99
United States 40.9 36.1 27.1Canada 19.5 18.4 17.9Australia 12.1 12.8 12.0European Union 0.0 7.8 9.9Argentina 3.9 5.6 6.2Total 76.4 80.7 73.1
Note: The average export shares were calculated on net exports because the European Union was both alarge importer and exporter and net exports capture the net trade situation better than gross exports.When net exports were negative, a zero was assigned. The European Union was defined as the current15 members even though not all of these countries were members during the entire period.Source: FAOSTAT.

Program, which removed about 10 million acres ofwheat land from production (15 percent of wheatarea) (Hoffman, Schwartz, and Chomo 1995). Netexports declined by nearly 17 percent from1990–95 to 1996–2001, as area declined 9.3 percent.The 2002 U.S. Farm Bill somewhat reversed previ-ous reforms but did continue the large wheat-landdiversion program begun in the 1980s.
The changes in Argentina led to large investmentsin the Argentine grain marketing system, moreintensive input use, and a 50 percent increase in netexports from 1990–95 to 1996–2001 (Schneph,Dohlman, and Collins 2001). The financial crisis of2002 contributed to the profitability of exportableagriculture, as the peso was devalued by 70 percentafter being fixed to the U.S. dollar for 10 years.Export taxes of 20 percent were reinstated to offsetwindfall profits from the currency devaluation.
The combined impacts of reduced productionsupport, lower export subsidies, and land set-asidesare reflected in lower production and reduced netexports by Canada, the European Union, and theUnited States (see table 11.8). These declines weremostly offset, however, by larger exports fromArgentina and Australia. On balance, the five majorexporters reduced net wheat exports from 80 mil-lion tons during 1990–95 to 75 million tons during1996–2001, a decline of 6.3 percent. The largestdecline in producer support came in Canada, wherelower support led to lower area planted, produc-tion, and net exports.
Major Wheat Importers
Global wheat imports have grown by just 1.2 percentper year since 1980, compared with nearly 6 percentper year between 1970 and 1980 (figure 11.6).The rapid increase in imports during the 1970s was
caused by major economic and policy changes inseveral regions and countries. These includeincreased wheat imports by OPEC (Organization ofPetroleum Exporting Countries), large net importsby the FSU and Eastern Europe because of poor pro-duction, and policy changes in China that led tolarge net imports. Most of these changes have eitherbeen reversed or had more moderate influences onwheat imports since 1980.
Imports by the FSU accounted for one-quarterof global imports at their peak in 1984 and thensteadily declined to only 3 percent by 1995. Importsby Eastern European countries, while much smallerthan those of the FSU, declined by 75 percentduring the same period (FSU+Eastern Europeancountries in figure 11.6). China’s imports peaked at16 million tons in 1989 (16 percent of global trade)and declined to 2 million tons in 2000 due to rap-idly increasing domestic production following pol-icy changes (see figure 11.6).
OPEC’s import increases slowed during the1980s as oil prices fell. Imports have only recentlybegun to increase with the recovery in oil pricesthat began in 1999. Thus the countries that fueledthe large increase in wheat trade during the 1970slargely accounted for its stagnation after 1980. Off-setting these declines have been steady increases inimports by other developing countries (shown asDeveloping minus China in figure 11.6), but theincreases were not large enough to raise globaltrade significantly. Imports by the developed coun-tries have remained largely constant since 1980,with lower imports by Western Europe offsettingincreases from high-income Asia.
Brazil, China, Egypt, Japan, and the RussianFederation were the largest importers during1990–2000, each with 5–7 percent of global imports(figure 11.7). They were followed by Algeria,
206 Global Agricultural Trade and Developing Countries
TABLE 11.8 Percentage Change of Wheat Production, Area Harvested, Yields, and NetExports of Major Exporters from 1990–95 to 1996–2001
Exporter Production Area Harvested Yields Net Exports
Argentina 47.2 28.0 14.7 53.8Australia 66.2 37.5 21.7 61.9Canada −10.0 −13.4 4.0 −13.3European Union 12.4 3.0 9.1 −40.8United States −2.0 −9.3 8.6 −16.7Major exporters 10.2 1.4 8.6 −6.3
Source: Authors’ calculations.

Indonesia, Iran, and Korea, each with 2–5 percent ofglobal imports. The 10 largest net importers during1990–2000 accounted for 46 percent of globalimports. Many of these large importers undertookpolicy reforms during the late 1980s or 1990s thatremoved government monopolies on imports.
Egypt was the largest importer during1990–2000, with average imports of slightly morethan six million tons per year. Wheat is considereda strategic commodity in Egypt, providing morethan one-third of the daily caloric intake ofEgyptian consumers and 45 percent of protein
consumption. It is also the major staple crop pro-duced in the country, occupying about one-third ofthe total winter crop area. The government’s policyobjectives in the agricultural sector have been toprovide an adequate supply of food to all incomegroups, to promote greater self-sufficiency in cropproduction, and to increase farm income.
In the mid-1980s the widening food gap, stagna-tion of the agricultural sector, and the rising costsof the food subsidy system encouraged the govern-ment to reform agriculture and the wheat sectorunder the Agricultural Reform Program, initiated
Wheat: The Global Market, Policies, and Priorities 207
FIGURE 11.6 Global Wheat Imports
0
20
40
60
80
100
120
1970 1975 1980 1985 1990 1995
Million tons
2000
World Developing�China
FSU�Eastern European Countries
China
OPEC
FIGURE 11.7 Wheat Net Imports, Average for 1990–2000
0
1
2
3
4
5
7
6
Egypt
Brazil
Japa
n
China
Russia
Algeria Ira
n
Korea
, Rep
. of
Indo
nesia
Mor
occo
Million tons
Source: USDA.
Source: FAO.
in 1987. In the first phase of the reform, prices,quotas, and marketing controls were partiallyliberalized. Import subsidies were reduced, andmarkets were opened to private investment. Thesecond phase of the reform coincided with thelaunching of the Economic Reform and StructuralAdjustment Program in 1991, which sought to shiftEgypt from a state-controlled economy into a moremarket-oriented economy in which the privatesector could play a major role (Kherallah andothers 2000).
In 1992 the Egyptian government also began toliberalize the wheat-milling sector, which up to thattime had maintained a monopoly over the impor-tation of all types of wheat grain and flour. In addi-tion, around 80 percent of all industrial wheat millsin the country belonged to the public sector—therest were licensed to mill for the government underspecific arrangements. The partial liberalization ofwheat trading started in the flour market in 1992,when the government freed the prices of flour andbread and allowed the private sector to importwheat for the production of flour. Resale of wheatin excess of the milling needs for flour was notpermitted. The government also allowed privatetraders to import flour directly. All the remainingrestrictions on flour production and trading wereremoved in 1993, allowing both the public and pri-vate sectors to freely import, produce, distribute,and sell flour at free-market prices. The quotas ofgovernment-milled flour going to food-processingfactories, shops, and bakeries were also eliminated,thus allowing these outlets to purchase their flourfreely in the market.
Brazil was the second-largest importer during1990–2000, with imports averaging 6 million tonsper year. Before 1991 the Brazilian governmentheavily subsidized wheat flour, but consumer subsi-dies were removed in late 1991 along with otherprice controls, and the mill-quota system was elim-inated (Brandão and Salazar 2003). Brazil nowobtains nearly all of its wheat from Argentina witha zero import duty because of its membership inthe regional trade group, Mercosur. In 2002, toreduce wheat imports, the government introduceda program to expand domestic wheat production to50 percent of total consumption by 2004. Thegovernment operates a minimum-support-pricesystem for wheat and other commodities. Otherpolicies and programs to support domestic wheat
production include subsidized loan programs forfarmers and processors to borrow against theirproducts at below-market-interest rates whileholding their products as collateral in accreditedwarehouses. Small producers are eligible for financ-ing of production costs at subsidized interest ratesunder a program to strengthen family farms.Longer-term support for production and process-ing of agricultural products is available from theBrazilian Bank for Economic and Social Devel-opment and the Special Agency for IndustrialFinancing.
Japan was the third-largest wheat importer dur-ing 1990–2000, but unlike other importers it hasnot reduced import controls or significantlyreduced producer support. Japan’s agricultural pol-icy is strongly influenced by concerns for foodsecurity and self-sufficiency. In addition, postwarland reforms created a very small-scale farm struc-ture that is inefficient by global standards; thusincome support for farmers is also a high priority.Wheat producers receive about $1,200 per ton forwheat—about 10 times the U.S. f.o.b. (free onboard) price and 6 times the c.i.f. (cost, insurance,and freight) import price. Domestic wheat produc-tion is about 10 percent of domestic consumption,and the Japanese Food Agency imports about6 million tons of wheat per year. Import policy hasfocused on food security and diversification of sup-plies in an effort to ensure guaranteed suppliesrather than low import prices. Domestic producersare paid an administered purchase price for wheat,which is then resold at higher prices to the domes-tic milling industry. Imported wheat is resold tomillers at prices that are about double the importprice. A margin between the resale of domestic andimported wheat is necessary to adjust for qualitydifferences between Japanese and imported wheat.
A new wheat policy was introduced in 1998 bythe Japanese Food Agency, with implementationoccurring during the 2000 to 2002 crop years. TheJapanese Food Agency retained control over thepricing and marketing of domestic wheat, as well asthe importing and pricing of foreign wheat. Thenew policy allows the private sector to importwheat, whereas the Japanese Food Agency had beenthe exclusive importer under the previous system.The new policy also introduced a new compensa-tion system for domestic wheat producers. Otherprograms to improve quality allow continuous
208 Global Agricultural Trade and Developing Countries

importation of wheat for food use by the JapaneseFood Agency and a simultaneous-buy-and-sell sys-tem for imported feed wheat.
China was the fourth-largest importer duringthe 1990–2000 period, but it has undertaken majorreforms in the past few years, lowering supportprices to near world market levels and reducingimports by 90 percent (Crook 1996 and 1997;USDA 1998 and 2001a). The government’s long-standing policy has been to approximate self-sufficiency in food staples, including wheat. Thisbegan in the 1950s with producer quotas, but thesystem changed significantly with the introductionof the Household Responsibility System in 1978.Under this system, local leaders began contractingproduction quotas with small work units and fam-ily farms instead of large collectives. China initiatedthe Governors’ Grain-Bag Responsibility System in1995, whereby provincial authorities were given thetask of stimulating production, stabilizing prices,making provisions for adequate grain stocks,reducing imports, and ensuring supplies for urbanareas and the military. These reforms led to anincrease in wheat production of about 22 percentbetween 1990–92 and 1997–99 and to huge stocksby the end of the 1990s. Since the mid-1990s, thestate grain procurement program has not beenaltered to any significant degree, although therehave been revisions in some procurement proce-dures and efforts to improve wheat quality. In 2000the government introduced new wheat standards toupgrade the average quality of the crop. Protectedprices were removed from spring wheat in thenorth and winter wheat south of the Yangtze River.In 2001 market reforms eliminated protected pricesin many provinces but not in the major producingregions.
One of the most significant consequences ofChina’s domestic policies has been the shift in itscereal trade balances. The accumulation of largegrain stocks caused average annual wheat importsto fall from 10 million tons in the early 1990s tobelow 1 million tons since 2000. China became anet exporter of wheat in 2002.
Other factors contributed to the decline inwheat imports, including local market conditionsand government actions. China assessed a 13 per-cent value-added tax on imported wheat (while notcollecting the tax on most domestic wheat produc-tion), and a 1 percent import duty, thus making
imported wheat uncompetitive in some years. Dur-ing the phase-in period after China’s entry into theWTO in 2001, the volume of imports was regulatedby a tariff rate quota system. The initial TRQfor wheat was 7.3 million tons in 2001; it rose to9.64 million tons in 2004. China also agreed toexpand the role of private traders after WTO acces-sion, but state trading enterprises would still con-trol 90 percent of the wheat TRQ. NotwithstandingChina’s WTO commitments, however, the fill rateof the wheat TRQ has been minimal—8 percent in2002 and 5 percent in 2003, according to periodicreports from the Global Agricultural InformationNetwork of the U.S. Department of Agriculture.
While many of the major importing countrieshave reformed policies, high protection is still evi-dent in many countries, as shown by disparitiesbetween producer prices and U.S. fob prices (fig-ure 11.8). Japan, has the highest producer prices,but several other countries also have high prices.Consumers in these countries have the most to gainfrom more liberal trade policies.
Emerging Wheat Exporters
China, India, Pakistan, and several countries of theFSU have emerged as wheat exporters. This is ashift from the past when these countries were eitherlarge regular importers or occasional importers.
Former Soviet Union
Several countries of the FSU have the potential tobecome large exporters—among them Kazakhstan,the Russian Federation, and Ukraine, which collec-tively moved from being net importers of 15 mil-lion tons of wheat in 1992 to net exporters of23 million tons in 2002 (figure 11.9).
The emerging exporters of the FSU have manycommon problems, including weak marketing sys-tems; inefficient storage, transport, and grain han-dling systems; lack of credit; and the challenge ofmaking the transition from collective farms to pri-vate production systems. Policy reforms have beenslow and only partially effective in stimulatingprivate-sector initiative. Despite these problems, allof these countries have large land areas well suitedto wheat production and low production costs.They also have an advantage in transporting wheatto importers in the Middle East compared with
Wheat: The Global Market, Policies, and Priorities 209
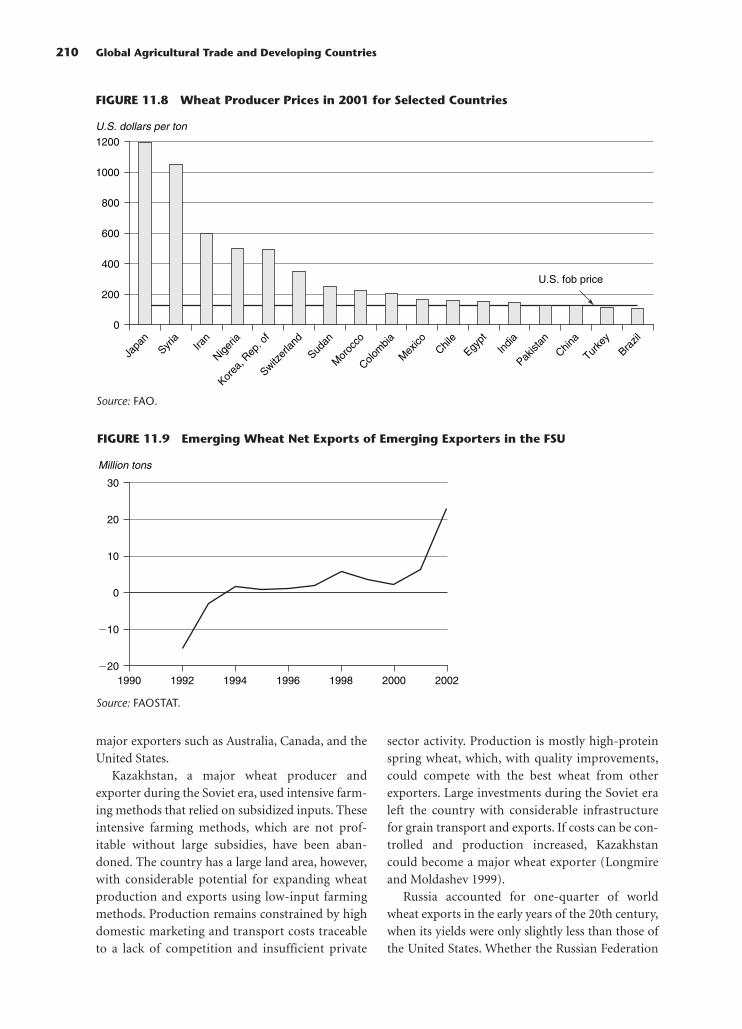
major exporters such as Australia, Canada, and theUnited States.
Kazakhstan, a major wheat producer andexporter during the Soviet era, used intensive farm-ing methods that relied on subsidized inputs. Theseintensive farming methods, which are not prof-itable without large subsidies, have been aban-doned. The country has a large land area, however,with considerable potential for expanding wheatproduction and exports using low-input farmingmethods. Production remains constrained by highdomestic marketing and transport costs traceableto a lack of competition and insufficient private
sector activity. Production is mostly high-proteinspring wheat, which, with quality improvements,could compete with the best wheat from otherexporters. Large investments during the Soviet eraleft the country with considerable infrastructurefor grain transport and exports. If costs can be con-trolled and production increased, Kazakhstancould become a major wheat exporter (Longmireand Moldashev 1999).
Russia accounted for one-quarter of worldwheat exports in the early years of the 20th century,when its yields were only slightly less than those ofthe United States. Whether the Russian Federation
210 Global Agricultural Trade and Developing Countries
FIGURE 11.9 Emerging Wheat Net Exports of Emerging Exporters in the FSU
�20
�10
0
10
20
30
Million tons
1990 1992 1994 1996 1998 2000 2002
Source: FAOSTAT.
Source: FAO.
FIGURE 11.8 Wheat Producer Prices in 2001 for Selected Countries
0
200
400
600
U.S. fob price
800
1200
1000
Japa
nSyr
iaIra
n
Nigeria
Korea
, Rep
. of
Switzer
land
Sudan
Mor
occo
Colom
bia
Mex
ico
U.S. dollars per ton
Chile
Egypt
India
Pakist
an
China
Turke
yBra
zil

can return to its former role as a major exporterdepends largely on policy developments. Input sub-sidies and price supports were largely dismantled inJanuary 1992, when the transition toward a marketeconomy began. Decreases in real incomes andchanges in food prices led to substantial changes infood consumption and declines in feed use. Gov-ernment procurement of wheat declined fromnearly all before the reform to just 21 percent by1995—in part because of lack of funds by the stateprocurement agency. Private grain-trading compa-nies have largely replaced the state. Simultaneously,subsidies have been reversed and the agriculturalsector (including wheat) are taxed. Grains are stillproduced on large farms and under the same man-agement as before the reforms, but many of thefarms have been converted into private stock com-panies. Regional authorities use wholesale andretail price controls, subsidies, and barriers to inter-regional trade to regulate prices and food stocks.The emerging private sector must deal with thehigh transaction costs of these interregional traderestrictions. Producers have considerable potentialto increase yields if economic incentives improve.Efficient transportation and marketing systemscould make the Russian Federation a net exporter(Goodwin and Grennes 1999).
Ukraine emerged from a decade of adjustmentfollowing the end of the Soviet era to become a sig-nificant wheat exporter. In 2002–03 the countryexported about 6.6 million tons of wheat before aproduction slump in 2003–04 forced a return toimports. However, low production costs and shiftsin resource use since the Soviet era suggest thatwheat exports will likely increase in the future.During the Soviet era, Ukraine concentrated onlivestock and poultry production, but soon afterindependence in 1991 poultry and livestock num-bers declined by more than half. Wheat productionfell as well (in part because of lower demand foranimal feed) until 2000, rebounding in the twoyears before the severe drought of 2003. Productioncosts are estimated by the U.S. Department of Agri-culture (USDA) to be $50 per ton (Thursland andPrikhodko 2002), offsetting inefficiencies in han-dling, storage, and transport.
Policy reforms began with price liberalization in1992, but many agricultural subsidies were contin-ued, resulting in budget deficits and inflation.Economywide price and trade reforms were fully
implemented, but specific agricultural and institu-tional reforms were only partially implemented.Land reform has been slow to develop in the yearssince transfer and ownership legislation was passedin 1994 and 1995. The result has been a slow recov-ery of production (Debatisse and Chabot 2000).
Asia
Several Asian countries have become net wheatexporters in recent years because of large crops andstocks. It remains to be seen, however, whether theycan sustain exports or will revert back to being netimporters. Domestic policies in Asia remain aimedat self-sufficiency and self-reliance rather than onpromoting surpluses for export.
India has followed a policy of self-sufficiencysince independence, increasing crop output byexpanding irrigation, improving crop yields throughhigh-yielding varieties, and increasing land-useintensity with multiple cropping. Better yields werepossible because of the Green Revolution, whichprovided the high-yielding varieties that wereadopted with support from production and pricepolicies. To increase yields, the public sector pro-vided agricultural inputs, such as fertilizers, power,and water for irrigation at subsidized prices. Thegovernment also established a system of minimumsupport prices to procure wheat from farmers. Sub-sequently, India made substantial gains in food grainproduction, and over the past 30 years wheat pro-duction has grown by about 3.5 percent per year.
In the early 1980s, India cautiously began to lib-eralize trade, but only since 1991 has the process ofliberalization picked up speed. In July 1991 Indiaintroduced radical policy reforms in various eco-nomic sectors, but trade restrictions on agriculturalproducts were left largely untouched. Subsequentchanges in trade policy gradually lifted restrictionson agricultural products. Bumper wheat cropsstarting in 1999 led to large accumulations of pub-lic stocks, which eventually prompted wheatexports, making India a net wheat exporter in 2000.In order to be competitive in the Asian markets, thegovernment subsidized exports, displacing sales inthe region by the United States and other tradi-tional suppliers. Exports reached a record 6 milliontons in 2002–03. Wheat exports were halted inAugust 2003 as stocks diminished following a poorcrop in 2003.
Wheat: The Global Market, Policies, and Priorities 211

China has been exporting wheat since 1992.Exports reached 1 million tons in 2002–03, makingChina a significant net wheat exporter for the firsttime. Despite stagnant domestic demand, however,domestic surpluses have been falling in recent yearsin line with policy-driven production declines.Rozelle and Huang (1999) argue that China willremain a net importer at the levels of the early tomid-1990s.
Pakistan has been a net wheat exporter since2000–01, reaching 1 million tons in 2002–03, butreverted to being a net importer during the2003–04 season.
The Impact of Liberalization
Various studies have estimated the impact of liber-alizing trade and reducing domestic support on theworld wheat market. Results vary and do not alwaysconsider the full range of reforms. The Food andAgricultural Policy Research Institute (FAPRI2002) at Iowa State University and the University ofMissouri recently evaluated the impacts of liberal-ization of agricultural markets using a multimarketglobal agricultural model. The results for wheat arereported here. The study considered two scenarios.The first, full liberalization, explored the probableeffects of removing all agricultural distortions—domestic farm programs and border measures—including all TRQ schemes, tariffs, and directexport subsidies such as the European Union’sCAP. The second investigated the effects of remov-ing only border measures. The two scenarios allowthe impact of domestic programs to be evaluatedseparately from border measures. The question ofhow to examine domestic programs without bor-der measures was addressed by assuming that gov-ernment payments would be used to provide pro-ducers with the difference between currentdomestic price floors and the lower prices thatwould result without border measures. The simula-tions did not include the 2002 U.S. Farm Bill butinstead used an extension of the previous farm billin the baseline simulation. Nor did they include thereforms to the European Union’s CAP in mid-2003.The URAA was assumed to extend after 2004, whenthe final provisions are to be implemented. Theresults are presented as average percentage changesrelative to the baseline simulation for the periodfrom 2002 to 2011.
The FAPRI results show that wheat prices (U.S.fob Gulf) would rise from the baseline by an aver-age of 4.8 percent under the full liberalizationscenario and by 7.6 percent in the trade-only sce-nario. The price increase is lower under full liberal-ization because set-asides would be removed in theEuropean Union and the United States, resulting ina substantial increase in production and exportsthat would dampen the price effect. Global wheattrade would increase by 7.9 percent under full lib-eralization and by 5.0 percent under the trade-onlyscenario, with the largest export increase going tothe European Union once set-asides were removed.China would reduce imports under both scenariosbecause it would face slightly higher prices onwheat allowed under the low in-quota tariff in itswheat tariff rate quota. India would reduce exportsand become a net importer, because export subsi-dies would no longer be allowed.
A USDA study (2001b) found a larger wheatprice increase from elimination of all policy distor-tions. It concluded that wheat prices would rise by18.1 percent from elimination of all policy distor-tions. Removal of global tariffs would raise prices3.4 percent; elimination of OECD domestic subsi-dies would raise them 12.0 percent; and globalelimination of export subsidies would raise them2.0 percent. A recent FAO study (Poonyth andSharma 2003) concluded that wheat prices wouldrise by 11.9 percent under the U.S.-proposed WTOreform, which is similar to the USDA’s full-liberalization scenario.
The three studies provide a range of estimates—from 4.8 to 18.1 percent—of the increase in worldprices that would result from eliminating all pro-ducer support and trade distortions.
Conclusions
The global wheat market has become less distortedsince the early 1990s, as several countries haveundertaken reforms unilaterally or as a conse-quence of commitments under the URAA. Govern-ments in OECD countries still provide substantialsupport to producers, however. The effects of thatsupport have been partially offset by land set-asideprograms and by the way in which support is pro-vided; however, support policies still distort tradeand depress world prices. The European Union andthe United States have not used export subsidies in
212 Global Agricultural Trade and Developing Countries

recent years but still use other surplus disposal pro-grams, such as nonemergency food aid and exportcredits. These programs make it more difficult foremerging exporters to compete with establishedexporters.
Most importing countries have reduced wheattariffs or allowed duty-free imports from regionaltrading partners, thus benefiting from lower prices.A few countries, such as Japan, continue to applyextreme protection, with internal prices more thanfive times global market levels. Tariff escalation is amajor problem for countries trying to diversifyproduction and exports, with tariffs on flour wellabove those on wheat grain, and tariffs on bakeryand pasta products even higher. Consequently,trade in wheat products is largely confined to freetrade areas such as within the European Union orNAFTA.
A major concern for wheat-importing countriesis the lack of assured access to wheat export mar-kets during periods of supply shortages and highprices. Policies such as the U.S. grain exportembargo of the 1970s, designed to protect domesticconsumers, contribute to higher global wheatprices and increase the uncertainty of wheat-importing countries. The threat of such policyactions continues, with the European Unionimposing export taxes on wheat in 1995 and theRussian Federation imposing export taxes in2004—also to protect domestic consumers. Suchactions reinforce the calls for food security throughself-sufficiency in importing countries and deprivethose countries of the benefits from trade.
Future reforms of the global wheat marketshould focus on reducing producer support inOECD countries, reducing protection in theremaining highly protected markets, reducing tariffescalation on wheat products, and ensuring accessto exportable supplies during price spikes. Elimina-tion of production subsidies and trade distortionscould raise world wheat prices by 5–18 percentaccording to recent studies, but the large surpluscapacity among major wheat exporters could boostproduction under policy reforms and preventprices from rising further.
Notes
1. More detailed trade flow tables are given in the attachedCD-ROM.
2. Note that the yields in India and the United States are notstrictly comparable because a larger share of wheat area in Indiais irrigated than in the United States.
3. About 9 percent of global grain-based starch productioncomes from wheat (80 percent comes from maize). “Starch—Versatile and in Demand,” World Grain, January 2004.
4. Karnal bunt is a wheat fungus that occurs during cool,rainy growing conditions. It is named after the city in India nearwhere it was first reported in the 1930s. It is not harmful tohumans or animals, but it causes an unpleasant odor in wheatflour.
5. Exchange rate controls are another means to regulateimports, but these are not normally commodity-specific.
6. Based on the use of wheat subsidies as reported to theWTO. Source: USDA, ERS WTO Agricultural Trade Policy Com-mitments Database.
7. Regressing wheat food aid (FA) on wheat prices (WP)shows a statistically significant relationship between the quan-tity of food aid and prices; as prices fall the quantity of food aidincreases. The OLS regression estimated was FA = 6.487 −.023*WP. The R2 = .42 and the coefficient on prices was statisti-cally significant at the 1 percent level of significance with t =−4.6.
8. The United States suspended grain exports in 1974 andagain in 1975 because of low stocks, poor crop productionprospects, and concern about the inflationary impacts of highgrain prices. However, the action was directed only at the USSRin 1974 and at the USSR and Poland in 1975 since these coun-tries were major buyers and perceived to be disrupting the mar-kets (USDA 1986).
9. “EU Hits Grain Exporters, Steep New Tax Aims to ProtectSupplies,” International Herald Tribune, December 8, 1995. Mostrecently, however, the European Union declined to imposewheat export taxes following the 2003 production shortfall, butdid temporarily suspend grain export licenses in August 2003.Reuters, July 31 and September 2, 2003.
References
ABARE. 2002. “Global Grains Policy and WTO AgriculturalNegotiations.” Current Issues 02.2 (January).
Beattie, B. R., and D. R. Biggerstaff. 1999. “Karnal Bunt: A Wimpof a Disease But an Irresistible Political Opportunity.”Choices (2nd Quarter).
Brandão, A., and P. Salazar. 2003. “Brazil.” In FAO, WTO Agree-ment on Agriculture, The Implementation Experience. Devel-oping Country Case Studies, Rome.
Carter, C. A., and W.W. Wilson. 1999. “Emerging Differences inState Grain Trading: Australia and Canada.” In J. M. Antleand V. H. Smith, eds., The Economics of World WheatMarkets. New York: CABI.
Crook, F. 1996. “China’s Agricultural Policy Developments.”China Situation and Outlook Series WRS-96-2, U.S. Depart-ment of Agriculture, Economic Research Service, Washing-ton, D.C. June.
———. 1997. “Current Agricultural Policies Highlight Con-cerns About Food Security.” China Situation and OutlookSeries WRS-97-3, U.S. Department of Agriculture, Eco-nomic Research Service, Washington, D.C. June.
Dalrymple, D. G. 1974. “Development and Spread of High-Yielding Varieties of Wheat and Rice in the Less DevelopedNations.” Economic Research Service, U.S. Department ofAgriculture, in Cooperation with the U.S. Agency for Inter-national Development, Washington, D.C.
Wheat: The Global Market, Policies, and Priorities 213

Debatisse, Michel, and Philippe Chabot. 2000. “A Review of theGrain Marketing Sector in Kazakhstan and Ukraine.” Envi-ronmentally and Socially Sustainable Development WorkingPaper 25, World Bank, Washington, D.C. June.
Diaz-Bonilla E. 1999. “South American Wheat Markets andMERCOSUR” in J. M. Antle and V. H. Smith, eds., TheEconomics of World Wheat Markets. New York: CABI.
FAOSTAT. Nutritional data: Food aid shipments. On line:http://faostat.fao.org/faostat/.
FAPRI (Food and Agricultural Policy Research Institute). 2002.“The Doha Round of the World Trade Organization:Appraising Further Liberalization of Agricultural Markets.”Iowa State University CARD Working Paper 02-WP 317.November. Ames, Iowa.
Gardiner, Bruce L. 1999. “Canadian/U.S. Farm Policies and theCreation of a Single North American Grain Market.” In J. M.Antle and V. H. Smith, eds., The Economics of World WheatMarkets. New York: CABI.
Goodwin, Barry K., and Thomas J. Grennes. 1999. “RussianAgriculture and World Grain Trade: Lessons from the Pastand Implications for the Future.” In J. M. Antle and V. H.Smith, eds., The Economics of World Wheat Markets. NewYork: CABI.
Hoffman, Linwood A., Sara Schwartz, and Grace V. Chomo.1995. “Wheat Background for 1995 Farm Legislation.” AER-712. U.S. Department of Agriculture, Economic ResearchService, Washington, D.C. April.
Kherallah, Mylene, Hans Lofgren, Peter Gruhn, and Meyra M.Reeder. 2000. “Wheat Policy Reform in Egypt, Adjustment ofLocal Markets and Options for Future Reforms.” IFPRIResearch Report 115. International Food Policy ResearchInstitute, Washington D.C.
Longmire, Jim, and Altynbeck Moldashev. 1999. “ChangingCompetitiveness of the Wheat Sector of Kazakhstan andSources of Future Productivity Growth.” Economics Work-ing Paper 99-06. International Maize and Wheat Improve-ment Center (CIMMYT), Mexico.
OECD (Organisation for Economic Co-operation and Develop-ment). 2000. “An Analysis of Officially Supported ExportCredits in Agriculture.” Joint Working Party of the Commit-tee for Agriculture and the Trade Committee, Directorate forFood, Agriculture and Fisheries, Paris. December 20.
———. 2002. Agricultural Policies in OECD Countries, Monitor-ing and Evaluation. Paris. June.
———. 2003. Agricultural Policies in OECD Countries, Monitor-ing and Evaluation. Paris.
Poonyth, Daneswar, and Ramesh Sharma. 2003. “The Impact ofthe WTO Negotiating Modalities in the Areas of DomesticSupport, Market Access, and Export Competition on Devel-oping Countries: Results from ATPSM.” Paper prepared forthe International Conference Agricultural Policy Reformand the WTO, Capri, Italy, June 23–26.
Rayner, Anthony, Robert Hine, Timothy Lloyd, Vincent H.Smith, and Robert Ackrill. 1999. “The European UnionCommon Agricultural Policy under the GATT.” In J. M.Antle and V. H. Smith, eds., The Economics of World WheatMarkets. New York: CABI.
Rozelle, Scott D., and Jikun Huang. 1999. “Wheat in China: Sup-ply Demand and Trade in the 21st Century.” In J. M. Antleand V. H. Smith, eds., The Economics of World Wheat Mar-kets. New York: CABI.
Schneph, Randall, Erik Dohlman, and Chris Collins. 2001.“Agri-culture in Brazil and Argentina: Developments andProspects for Major Field Crops.” Agriculture and TradeReport WRS-01-3. U.S. Department of Agriculture, Eco-nomic Research Service, Washington, D.C. November.
Thursland, Marget E., and Dmitri Prikhodko. 2002. “UkraineGrain and Feed: How Is Ukraine Grain Competitive?” U.S.Department of Agriculture, Global Agricultural InformationNetwork, Washington, D.C. August 2.
USDA (U.S. Department of Agriculture). 1986. “Embargoes,Surplus Disposal, and U.S. Agriculture.” AER 564. EconomicResearch Service, Washington, D.C. December.
———. 1998. “China: International Agriculture and TradeReport.” WRS-98-3. Economic Research Service, Washing-ton, D.C. August.
———. 2001a. “China: Agricultural in Transition.” WRS-01-2.Economic Research Department, Washington, D.C.November.
———. 2001b. “The Road Ahead: Agricultural Policy Reform inthe WTO—Summary Report.” AER 797. Economic ResearchDepartment, Washington, D.C. January.
——. 2003. Wheat Situation and Outlook Yearbook. WHS-2003.Economic Research Service, Washington, D.C. March.
———. 2004. “Mexico Grain and Feed Annual Report.”MX4033. Global Agricultural Information Network ForeignAgriculture Service, Washington, D.C. March.
Wilson, William W., and Bruce L. Dahl. 1999. “Grain Qualityand North American Hard Wheat Exports.” In J. M. Antleand V. H. Smith, eds., The Economics of World WheatMarkets. New York: CABI.
214 Global Agricultural Trade and Developing Countries
Sub-Saharan Africa heavy producer taxation hasended, and unilateral liberalization efforts are con-tinuing, although significant protection of process-ing remains.
The current situation raises many questionsabout the future of the sector and the prospects forvarious players. How will multilateral groundnuttrade liberalization affect the competitive positionsof different players? Which countries are likely togain and which are likely to lose? How will smallSub-Saharan African producers be affected?
Groundnut Production
Groundnuts are a valuable source of protein, fat,energy, and minerals, and they generate cashincome to many poor farmers in the developingworld, especially in Sub-Saharan Africa and Asia. InSenegal, for instance, 70 percent of the rural laborforce is employed in groundnut production, whichaccounts for 60 percent of households’ agriculturalincome. Groundnut production and processingrepresent about 2 percent of gross domestic prod-uct and 9 percent of exports in Senegal.
Since the mid-1990s all major groundnut-export-ing countries have been gradually liberalizing theirgroundnut sectors, in part to fulfill their commit-ments under World Trade Organization (WTO)agreements.1 The results have been mixed, andtrade in groundnut products remains heavily dis-torted. Both China and India have removed someimport restrictions and allowed wider private-sector participation in importing groundnuts.However, tariffs on groundnut products remainvery high in India and high in China. The largemarket size of both countries exacerbates these dis-tortions and their effects on the world market.
In the United States the 2002 Farm Bill elimi-nated many unsustainable features of previousgroundnut policies (such as the high support priceand production quotas), but it introduced new dis-tortions, such as countercyclical payments and thefloor price mechanism. These policies subsidizeU.S. groundnut exports when world prices are low,with the potential to depress world market prices.
Argentina still selectively subsidizes someprocessed groundnut products and exports andapplies moderate export taxes on groundnuts. In
215
12
GROUNDNUT POLICIES,GLOBAL TRADE
DYNAMICS, AND THEIMPACT OF TRADE
LIBERALIZATION
Ndiame Diop, John C. Beghin, and Mirvat Sewadeh
This chapter is an abbreviated version of Diop, Beghin, and Sewadeh (2004), which is reproduced on theCD-ROM.

216 Global Agricultural Trade and Developing Countries
China is the world’s largest groundnut producer,with 40 percent of world production in 2001. Indiaaccounts for 23 percent of worldwide production, agroup of Sub-Saharan African countries produces8.4 percent, and the United States produces 5.6 per-cent (table 12.1). Malawi, Nigeria, South Africa, andthe United States produce shelled groundnuts,which are used as seed, consumed raw, or consumedafter having been transformed into prepared(roasted, salted, flavored) groundnuts or groundnutbutter or paste. In contrast, Argentina, China, India,and Senegal devote more than 60 percent of theirproduction to crushing groundnuts for oil andmeal.2
Groundnut production conditions vary consid-erably across countries, reflecting differences intechnological development, access to moderninputs and irrigation, and farm management prac-tices. Yields are highest in the United States andChina and lowest in Sub-Saharan Africa (exceptSouth Africa) and India. The low yields in Africaand India are the result of limited use of moderninputs, including high-yielding seed varieties, andheavy dependence on rainfall.
Driven by tremendous growth in China, globalshelled production grew 34 percent between1981–85 and 1996–2000. Growth has been unevenacross countries (figure A12.1 on the CD-Rom).China doubled its production between 1992 and2000 by increasing its use of high-yielding varietiesand agricultural inputs, including fertilizers, pesti-cides, mechanization, and irrigation (Colby andothers 1992). In India production exhibited signifi-cant fluctuations, increasing between 1987 and 1998before returning to the production levels of the1970s (about 6 million tons). Production in Sub-Saharan Africa picked up in the early 1990s, after along period of decline. Production has been stablesince the early 1970s in the United States, which pro-duces about 2 million tons a year, and in Argentina,which produces 300,000 tons.
The economic costs of groundnut productionvary significantly across countries. In 1993 theaverage cost per acre was $694 in the United States,more than three times the average cost in China of$164 per acre (table 12.2). The higher economiccosts per acre for U.S. groundnuts were attributedchiefly to production quota rent, land value, and
TABLE 12.1 Production, Use, and Export of Groundnuts, Average 1996–2001
Area Domestic Edible Crushed for NetHarvested Yield Production Use Groundnuts Oil and Cake Exports
Country (1,000 ha) (mt/ha) (1,000 mt) (1,000 mt) (1,000 mt) (1,000 mt) (1,000 mt)
World 21,452 1.4 29,997 29,896 12,416 14,590 169
Main producers and exportersChina 4,234 2.9 12,204 11,777 4,753 6,140 427
India 7,902 0.9 7,176 7,082 534 5,581 94
United States 569 3.0 1,701 1,428 978 280 220
Argentina 280 1.5 403 191 21 155 213
Main producers in AfricaNigeria 1,187 1.1 1,340 1,340 636 427 0
Senegal 690 1.1 722 730 317 304 −6
South Africa 98 1.7 161 123 72 32 33
Malawi 117 0.9 103 101 78 18 2
Gambia, The 89 1.0 95 80 26 54 15
Main importersEuropean Union 1 1.0 1 454 433 17 −449
Canada 0 0.0 0 115 115 0 −115
Japan 12 2.3 28 129 121 2 −103
Korea, Rep. of 7 2.2 15 30 30 0 −15
Note: The difference between production plus net exports and domestic utilization reflects stock variationand feed and seed use. Ending stocks are negligible for all countries except the United States, which hadending stocks of 28 percent of total production during 1996–2001.Source: U.S. Department of Agriculture.

the costs of using and maintaining farm equip-ment, fuel, electricity, repair, and capital replace-ment. Quota rent and land value are not costs forfarmers in China, since there is no productionquota and land is considered public property,belonging to local communities organized ingroups of 30–40 households (Chen and others1997).3 Net returns for China and the United Statesare not significantly different if quota rent (irrele-vant since the 2002 Farm Bill) is excluded from U.S.production costs. The U.S. cost disadvantage is,however, compensated for by higher producerprices brought about by the groundnut programand the higher quality of U.S. groundnuts. Theelimination of quota production (and thus quotarent) in the 2002 Farm Bill reduces U.S. productioncosts. This development, as well as the high qualityof U.S. groundnuts, which earn a high price pre-mium in international markets, may well maintainU.S. competitiveness with China.4
Global Trade in Groundnuts
Domestic consumption of groundnuts is high, andonly 5 percent of world production is sold in inter-national markets. Of the three major groundnutproducts traded internationally (edible ground-nuts, groundnut oil, and groundnut meal), edible
groundnuts are the most traded, with a volume of1.2 million tons in 2001; trade in groundnut oil was250,000 tons (table 12.3). The global export of edi-ble groundnuts has increased 2.2 percent a yearsince the early 1980s, while exports of groundnutoil declined 1 percent and meal exports fell 2.5 per-cent, despite growing global consumption of bothproducts.
China is the world’s largest exporter of ediblegroundnuts, accounting for 32 percent of worldexports. The United States is the second-largestexporter, with 19 percent of the world market, fol-lowed by Argentina, at 10.5 percent. Sub-SaharanAfrica (The Gambia, Malawi, Nigeria, Senegal,South Africa, and Sudan) has lost market sharein international edible groundnut markets andaccounts for only 5 percent of world trade. Senegalis the world’s largest supplier of groundnut oil, butthis market has declined as other vegetable oils areincreasingly used as substitutes.
The European Union (EU) is the single largestgroundnut market, accounting for 43 percent ofworld imports. The total value of net groundnutimports in the European Union was just below$500 million a year in 1996–2000. Canada, with9 percent of world imports, is the second-largestmarket, followed by Japan, which imports 8.2 per-cent of world groundnuts.
Groundnut Policies, Global Trade Dynamics, and the Impact of Trade Liberalization 217
TABLE 12.2 Costs of and Revenues from Groundnuts in China and the United States(US$ per acre)
1992 1993
Item United States China United States China
Variable costsSeed 70.32 43.83 71.18 45.96Fertilizer 43.27 25.03 42.40 26.13Chemicals 89.70 3.40 92.57 3.68Labor 89.14 71.51 86.17 75.86Other expenses 212.84 41.43 188.54 12.82Subtotal 505.27 185.20 480.86 164.45Fixed costsLand value 92.58 — 97.77 —Quota rent 113.38 — 115.40 —Total costs 711.23 185.20 694.03 164.45
Yield (pounds per acre) 2576 2520 1940 2135Revenue (producer price times yield) 753.66 323.69 570.58 280.83
— Not available.Note: More recent data are not available.Source: Chen and others 1997.

Consistent with growth in world consumption,exports of raw edible groundnuts and preparedgroundnuts have expanded rapidly since the mid-1980s (figures 12.1a–12.1d). Exports of ediblegroundnuts increased 8 percent in the 1990s, after adramatic increase of more than 20 percent duringthe 1980s. The pattern of growth in preparedgroundnut exports broadly mirrors that of ediblegroundnuts, signaling the highly integrated natureof these markets (figure 12.1c).
China has been the major beneficiary of thisexpansion (figure 12.1b). From barely 1 percent in1976, its global market share in exports of ediblegroundnuts rose to 32 percent in 2001. During thesame period, the U.S. market share dropped from32 percent to 19 percent. The emergence of Chinaas a leading exporter in the prepared groundnutmarket is even more impressive (figure 12.1d).
While the international edible groundnut mar-ket has become more concentrated (with 61 per-cent of exports controlled by China, the UnitedStates, and Argentina in 2001), the market for pre-pared groundnuts has become more fragmented.Concentration in the edible groundnut marketpartially reflects the significant decrease in Sub-Saharan Africa’s share of prepared groundnuts,from 17 percent in 1976 to 5 percent in 2001.Africa’s market countries (including The Gambia,Malawi, and Nigeria) enter the edible groundnutexport market intermittently, depending on theircrop quality and world market demand.
Figures 12.1e and 12.1f show the trends inexports and market shares of groundnut oil. Manycountries, including Brazil and China, have exitedthe groundnut oil market since 1976 to focus onedible groundnuts and other vegetable oils. Othercountries, such as the United States, have chosento enter the market only when the quality ofgroundnuts harvested is too low for the nuts to besold in the edible groundnut market. Senegal andArgentina remain the world’s leading exportersof groundnut oil. The market has become sig-nificantly fragmented, however. Argentina, Brazil,Senegal, and the United States jointly supplied just52 percent of total exports in 2001, down from85 percent in 1976.
The decline in African countries’ shares in globalgroundnut markets has significantly reduced thecontribution of groundnut products to the exportearnings of many Sub-Saharan African countries.The importance of groundnut products as a sourceof export earnings has declined dramatically inMalawi, Senegal, and South Africa since the early1980s (table 12.4). The importance of ground-nut products increased significantly only in TheGambia, where they accounted for 84 percent oftotal merchandise exports in 2000–02.
The volume of raw edible groundnuts exporteddecreased significantly in Malawi, Nigeria, andSouth Africa and stagnated in The Gambia andSenegal (table 12.4). As a result of decliningand almost stagnant volumes, export earnings for
218 Global Agricultural Trade and Developing Countries
TABLE 12.3 Value of Net Exports, by Groundnut Product, 1996–2000(US$ millions)
Country Edible Groundnut Groundnut Oil Prepared Groundnut Total
EU-15 −378.47 −115.12 −4.54 −498.13Japan −44.00 −1.85 −71.46 −117.31Canada −76.67 −1.19 −3.31 −81.18Korea, Rep. of −4.55 0.01 −14.31 −18.86Malawi 0.77 0.00 0.00 0.77Nigeria −3.29 4.64 0.00 1.35Gambia, The 4.49 1.09 0.05 5.63South Africa 16.01 4.68 0.27 20.95Senegal 3.34 48.99 0.60 52.92India 86.85 −0.13 7.27 93.99United States 126.43 −12.77 28.26 141.92Argentina 160.98 51.52 25.82 238.32China 193.79 2.82 111.06 307.68
Note: Prepared groundnuts are roasted, salted, or flavored groundnuts. Peanut butter is not included.Source: FAOSTAT.

Groundnut Policies, Global Trade Dynamics, and the Impact of Trade Liberalization 219
FIGURE 12.1 Global Groundnut Consumption, Exports, and Market Shares
Source: FAOSTAT.
(a) Global Exports and Consumption of Raw EdibleGroundnuts, 1976–2002(1,000 metric tons)
(b) Market Shares of Global Raw EdibleGroundnut Exports, 1976–2002(percent)
(c) Global Exports of Prepared Groundnuts,1976–2002(tons)
(d) Market Shares of Global PreparedGroundnut Exports, 1976–2002(percent)
(e) Global Exports of Groundnut Oil(1,000 metric tons)
(f) Market Shares of Global GroundnutOil Exports(percent)
0
350,000
300,000
250,000
200,000
150,000
100,000
50,000
Metric tons
150
550
500
450
400
350
300
250
200
Post-NAFTAand -URAA
Metric tons
1976
1978
1980
1982
1984
1986
1988
1990
1992
1994
1996
1998
2000
2002
1976
1978
1980
1982
1984
1986
1988
1990
1992
1994
1996
1998
2000
2002
100
90
80
70
60
50
40
30
20
10
0
Percent
1976
1978
1980
1982
1984
1986
1988
1990
1992
1994
1996
1998
2000
1976
1978
1980
1982
1984
1986
1988
1990
1992
1994
1996
1998
2000
2002
20
10
0
30
40
80
70
60
50
90Percent
1976
1978
1980
1982
1984
1986
1988
1990
1992
1994
1996
1998
2000
2002
800
16,000
20,000
24,000
28,000
32,000
36,000
1,800
1,600
1,400Consumption
Export
1,200
1,000
1976
1978
1980
1982
1984
1986
1988
1990
1992
1994
1996
1998
2000
2002
World consumption World export
0
20
10
30
40
80
70
60
50
90Percent
Senegal Argentina United States Brazil
Argentina China United States Sub-Saharan AfricaWorld edible export World groundnut consumption
United States China Netherlands

shelled groundnuts dwindled. The extent of thedecline suggests that unit values also decreased inThe Gambia, Malawi, and Senegal.
International Prices of Groundnuts
Prices declined sharply in The Gambia and, to alesser degree, in Senegal, while prices in SouthAfrica remained higher (figure 12.2). The discounton groundnuts of Gambian and Senegalese originreflects both their lower quality and stricter EUquality and technical standards. The EuropeanUnion has become more demanding, from both apublic health and a technical standpoint (size,uniformity).5 Nigeria and Senegal increased thevolume and value of their exports of groundnut oil,while South Africa exited the groundnut oil market.
International prices of edible groundnuts andgroundnut oil in the Rotterdam market (the refer-ence for groundnut trade) have exhibited twodistinct patterns since 1970 (figure 12.3). During1970–81 the prices of both products were increas-ing. Tests show no cointegration between ediblegroundnut and groundnut oil during this period(tables A12.1–A12.3 on the CD-ROM). Prices werehigh, and the world market was dominated bythe United States, which supplied 45 percent ofexports, and Sub-Saharan Africa, which supplied18 percent. China exported no edible groundnutsor groundnut oil.
In sharp contrast with the 1970s, groundnutprices over the past 20 years have been stable,constantly reverting to their mean values followingshocks (tables A12.4 and A12.5 on the CD-ROM).Two subperiods can be distinguished. Before 1994prices of groundnuts displayed a higher level ofvolatility. The coefficient of variation of pricesstood at 20 percent between 1980 and 1994, almostthree times the 7 percent level witnessed between1995 and 2001.
What are the main causes of this price variabil-ity? Is the change in price variability permanent?Revoredo and Fletcher (2002b) analyze bothproduction instability (originating in exportingcountries) and consumption instability (originat-ing in importing countries). They find that thesteady expansion of Chinese exports, which arenegatively correlated with exports from Argentinaand United States, was a stabilizing force in the sec-ond half of the 1990s. This stabilization occurreddespite the fact that Argentina, India, and SouthAfrica now transmit a higher proportion of theirsupply shocks to the world market.
Substitution between Chinese and U.S. ground-nuts appears to have increased in recent years,although detailed data on substitution in worldmarkets are not available.
In the groundnut oil market, the influence ofSenegal on world prices remains significant. Senegalexported about 100,000 metric tons of groundnut
220 Global Agricultural Trade and Developing Countries
TABLE 12.4 Share of Groundnut Products in Total Merchandise Exports
Item Period The Gambia Malawi Nigeria Senegal South Africa
Shelled groundnut exportsVolume (metric tons) 1980–82 27,333 14,867 1,026 2,725 41,333
2000–02 27,939 662 412 2,915 34,830Value (US$ thousands) 1980–82 11,743 12,333 400 2,145 29,730
2000–02 5,763 436 204 1,371 22,875Groundnut oil exports
Volume (metric tons) 1980–82 7,651 0 0 82,693 22,6672000–02 8,633 0 1,287 98,879 1,519
Value (US$ thousands) 1980–82 6,400 0 0 60,285 14,0712000–02 6,333 0 797 63,007 1,053
Share of groundnuts in 1980–82 59.62 4.65 0.003 16.17 0.21total exports (percent) 2000–02 84.64 0.10 0.006 8.16 0.08
Note: The share of groundnuts in total goods exports includes exports of groundnut meal.Source: Production and groundnut exports data, FAOSTAT; total goods exports, World Bank.

oil in 2000–01, representing one-third of worldexports and more than 60 percent of demand fromthe European Union, Senegal’s main export market.While 2000–01 was an exceptional production year,econometric tests strongly indicate that variationsin Senegal’s exports were transmitted into the vari-ability in international prices and that the reversewas not true.
Groundnut oil markets are broadly integratedwith markets for other vegetable oils (soy oil, rape-seed oil, palm oil, and sunflower oil). Integration
seems to be much stronger for other oilseeds thanfor groundnuts, however.
Domestic Groundnut Policies ofMajor Countries in World Markets
Domestic producer support and taxation and tradepolicies determine excess supply and trade flows.It is important to examine these policies—inArgentina, China, India, Sub-Saharan Africa, andthe United States—in some detail to anticipate the
Groundnut Policies, Global Trade Dynamics, and the Impact of Trade Liberalization 221
FIGURE 12.2 Unit Price of Raw Edible Groundnuts Produced in The Gambia, Senegal, andSouth Africa(US$ per ton)
0
200
400
600
800
1,000
1,200
1980 1982 1984 1986 1988 1990 1992 1994 1996 1998 2000 2002
US$ per ton
The Gambia Senegal South Africa
Source: FAOSTAT.
FIGURE 12.3 Rotterdam Prices of Groundnuts, 1970–2000(cif, US$ per metric ton)
200
1,400
1,200
1,000
800
600
400
1970 1972 1974 1976 1978
Prices are nonstationaryand not integrated
Period of stationary prices(tendency to revert to their mean values)
Edible groundnut (U.S.shelled runner 40/50)
Groundnut oil (any origin)
1980 1982 1984 1986 1988 1990 1992 1994 1996 1998 2000
US$ per metric ton
Source: Oil World, various issues.

potential implications of policy changes on the dis-tribution of gains and losses across countries.
Groundnut Policies in the United States
Groundnut products are a minor sector nationally,but they are a key component of agriculture andrural development in the southern part of theUnited States. Based on the U.S. Department ofAgriculture (USDA) Census of Agriculture, manycounties in the South derive 50–70 percent of theiragricultural income from groundnuts. Shelling isperformed locally, as are many groundnut productmanufacturing activities (Fletcher 2001). Ground-nut policies have played a major role in maintain-ing rural income in these counties.
The foundation of U.S. groundnut policy is theU.S. peanut program, which traces its roots to the1930s. Until the enactment of the 2002 Farm Bill,the pillars of the system were production regulationthrough quotas, high producer support prices, andimport control. The groundnut support programexisted as a two-tier price support program. Thesupport price for edible groundnuts was $610 pershort ton paid for production under quota. Othergroundnuts (“additionals”), which could be eitherexported at world prices or sold to the domesticcrushed groundnut industry, were eligible for alower support price ($132 in 2001). The quotafarm-gate price tended to be higher than the pre-vailing export prices (table 12.5).
The average annual aggregate measure of sup-port for U.S. groundnuts was estimated at $330 mil-lion during 2000–01, $31 million more than in1996–2001. The average cost of aggregate supportin 1996–01 stood at $206 per metric ton of ground-nuts produced in the United States (table 12.6).
The 2002 Farm Bill eliminated groundnut pro-duction quotas (with a quota buyout), convertedthe price support program to a system of direct andcountercyclical payments, and set a price floor witha production subsidy (nonrecourse loans, withmarketing loan provisions). The key features of thenew program include the following:
• All current groundnut producers have equalaccess to a marketing loan program under whichproducers can pledge their crops as collateral toobtain a marketing loan rate equal to $355 pershort ton. Producers may repay the loan at a ratethat is the lesser of the USDA–set repaymentrate plus interest or the marketing loan rate plusinterest, or they can forfeit the loan.
• For producers with a history of groundnut pro-duction, a new direct and fixed payment of $36per short ton is available. Historic producers arethose who were engaged in groundnut produc-tion between 1998 and 2001. Eligible productionequals the product of average yields in the baseperiod and 85 percent of base-period acres.These so-called decoupled payments are maderegardless of current prices or the actual cropplanted, as long as the farm remains in approvedagricultural uses.
• Producers with a history of groundnut produc-tion are also eligible for a new countercyclicalpayment when market prices are below an estab-lished target price of $495 per short ton minusthe $36 per ton direct payment. The paymentrate is the difference between the target price($495 per short ton) minus the direct fixed pay-ment ($36 per ton) and the higher of the 12-month national average market price for themarketing year for groundnuts or the marketing
222 Global Agricultural Trade and Developing Countries
TABLE 12.5 U.S. Producer Support Prices for Groundnuts, 1993–94 to 1998–99(US$ per pound)
Item 1993–94 1994–95 1995–96 1996–97 1997–98 1998–99
Quota price 0.388 0.339 0.339 0.305 0.305 0.305“Additional” price 0.660 0.660 0.660 0.660 0.660 0.660Average farm price 0.304 0.289 0.293 0.281 0.283 0.280CCCa export price 0.200 0.200 0.200 0.200 0.200 0.200Export unit value 0.330 0.286 0.292 0.322 0.327 0.328Rotterdam cif price 0.371 0.292 0.336 0.316 0.360 0.290
a. Commodity Credit Corporation.Source: Skinner 1999.

Groundnut Policies, Global Trade Dynamics, and the Impact of Trade Liberalization 223
TABLE 12.6 U.S. Aggregate Support to Groundnuts, 1986–88 to 2000–01
Aggregate Measure of Support Aggregate Measure of Support per Period (millions of US$) Metric Ton of U.S. Production (US$)
1986–88 347.2 203.31995–96 414.6 264.11996–97 299.0 180.01997–98 305.8 190.51999–2000 300.0 172.72000–01 330.0 222.8
Source: Skinner 1999; Hart and Babcock 2002 for 2000–01 aggregate measure of support; USDA databasefor production data.
TABLE 12.7 U.S. Edible Groundnut Tariff Rate Quota Allocation, 1995–2008(metric tons)
Argentina Mexico Other TotalUruguay Round NAFTA Tariff Uruguay Round NAFTA + Uruguay
Year Tariff Rate Quota Rate Quota Tariff Rate Quota Round
1995 26,341 3,478 4,052 33,8711996 29,853 3,582 5,043 38,4781997 33,364 3,690 6,034 43,0881998 36,877 3,801 7,024 47,7021999 40,388 3,915 8,015 52,3182000 43,901 4,032 9,005 56,9382001 43,901 4,153 9,005 57,0592002 43,901 4,278 9,005 57,1842003–07 43,901 4,278 9,005 —2008 43,901 unrestricted 9,005 —
— Not available.Source: USDA.
assistance loan rate ($355 per short ton). Thetotal countercyclical payment to each eligibleproducer is calculated as the product of the pay-ment acres (85 percent of base acres), the base-year average yield, and the payment rate.
• Owners of groundnut quotas under the previ-ous legislation receive compensation paymentsfor the loss of quota asset value. Payments maybe made in five annual installments of $220 pershort ton during fiscal years 2002–06, or thequota owner may opt to take the outstandingpayment due in a lump sum. These paymentsare based on quota owners’ 2001 quota, as longas they owned a farm eligible for the groundnutquota (Wescott, Young, and Price 2002).
Beginning in 1994, under the Uruguay Roundand NAFTA (North American Free Trade Agree-ment), the United States gradually increased thequantities of groundnut imports through a tariffrate quota system. For edible groundnuts the totaltariff rate quota in 2001 was 57,059 metric tons, or4 percent of domestic consumption, allocated firstto historical importers and then on a first-come,first-served basis (table 12.7). In-quota tariffs foredible and prepared groundnuts range between$.066 and $.0935 per kilogram. Out-of-quotatariffs are very high (131.8–163.0 percent under theUruguay Round; table 12.8).6
The phase-out of groundnut trade barriersunder NAFTA and the Uruguay Round is limited in
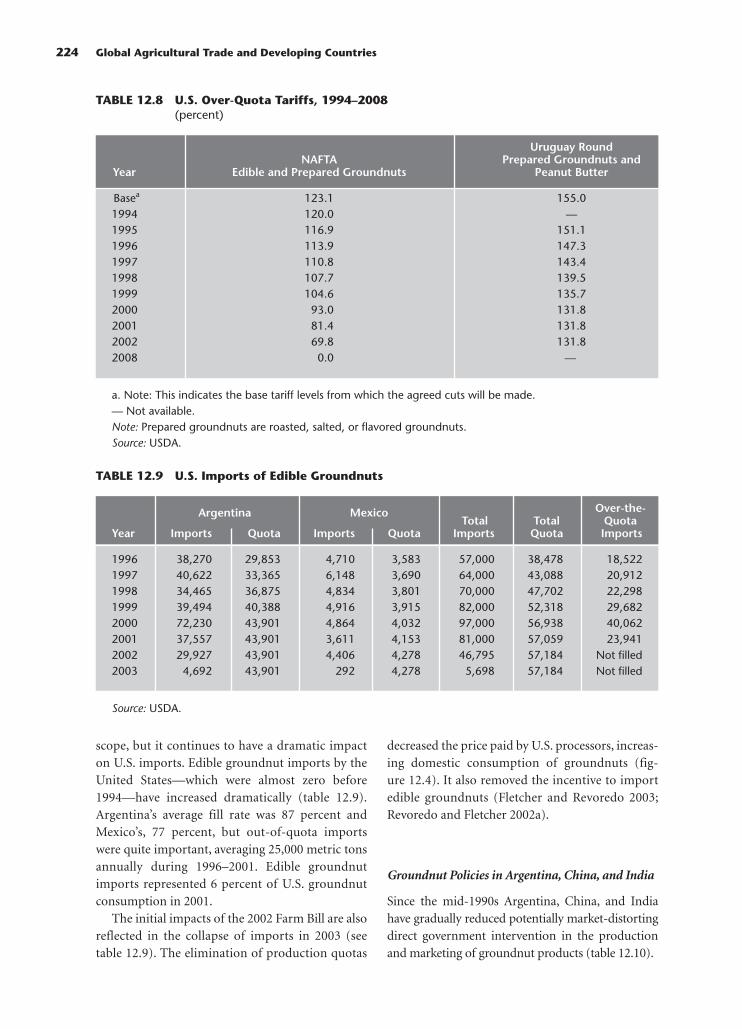
scope, but it continues to have a dramatic impacton U.S. imports. Edible groundnut imports by theUnited States—which were almost zero before1994—have increased dramatically (table 12.9).Argentina’s average fill rate was 87 percent andMexico’s, 77 percent, but out-of-quota importswere quite important, averaging 25,000 metric tonsannually during 1996–2001. Edible groundnutimports represented 6 percent of U.S. groundnutconsumption in 2001.
The initial impacts of the 2002 Farm Bill are alsoreflected in the collapse of imports in 2003 (seetable 12.9). The elimination of production quotas
decreased the price paid by U.S. processors, increas-ing domestic consumption of groundnuts (fig-ure 12.4). It also removed the incentive to importedible groundnuts (Fletcher and Revoredo 2003;Revoredo and Fletcher 2002a).
Groundnut Policies in Argentina, China, and India
Since the mid-1990s Argentina, China, and Indiahave gradually reduced potentially market-distortingdirect government intervention in the productionand marketing of groundnut products (table 12.10).
224 Global Agricultural Trade and Developing Countries
TABLE 12.8 U.S. Over-Quota Tariffs, 1994–2008(percent)
Uruguay RoundNAFTA Prepared Groundnuts and
Year Edible and Prepared Groundnuts Peanut Butter
Basea 123.1 155.01994 120.0 —1995 116.9 151.11996 113.9 147.31997 110.8 143.41998 107.7 139.51999 104.6 135.72000 93.0 131.82001 81.4 131.82002 69.8 131.82008 0.0 —
a. Note: This indicates the base tariff levels from which the agreed cuts will be made.— Not available.Note: Prepared groundnuts are roasted, salted, or flavored groundnuts.Source: USDA.
TABLE 12.9 U.S. Imports of Edible Groundnuts
Over-the-Argentina MexicoTotal Total Quota
Year Imports Quota Imports Quota Imports Quota Imports
1996 38,270 29,853 4,710 3,583 57,000 38,478 18,5221997 40,622 33,365 6,148 3,690 64,000 43,088 20,9121998 34,465 36,875 4,834 3,801 70,000 47,702 22,2981999 39,494 40,388 4,916 3,915 82,000 52,318 29,6822000 72,230 43,901 4,864 4,032 97,000 56,938 40,0622001 37,557 43,901 3,611 4,153 81,000 57,059 23,9412002 29,927 43,901 4,406 4,278 46,795 57,184 Not filled2003 4,692 43,901 292 4,278 5,698 57,184 Not filled
Source: USDA.

Argentina. Argentina’s groundnut trade policycontrasts sharply with that of India and China, asalmost all the distortions are associated withexports, which are subject to a 3.5 percent tax onraw groundnuts. With the peso devaluation of2001, export tax retention on groundnut exports
increased to 20 percent. This export tax may coun-tervail the positive signal sent to groundnutexporters through the peso devaluation. Argentinamaintains import tariffs on groundnut products,which exhibit some escalation (5 percent on ediblegroundnuts, 8 percent on groundnut meal, and
Groundnut Policies, Global Trade Dynamics, and the Impact of Trade Liberalization 225
FIGURE 12.4 U.S. Domestic Groundnut Prices, 1993–2003(US$ per metric ton)
400
300
600
500
800
700
1,000
900
1,100
1993 1994 1995 1996 1997 1998 1999 2003200220012000
Rotterdam price
US domestic price
New farm bill
Source: USDA.
TABLE 12.10 Groundnut Trade Policy Distortions in Argentina, China, and India(percent)
Country Product Description 1999/2002
ArgentinaEdible groundnuts Import tariff 5Groundnut oil Import tariff 13Groundnut meal Import tariff 8Edible groundnuts Export tax 3.5Groundnut meal Export rebate 3.2Groundnut oil (refined) Export rebate 2.3
ChinaRaw edible groundnuts Import tariff 15Processed edible groundnuts Import tariff 30Groundnut oil Import tariff 10Groundnut meal Import tariff 5VAT on edible groundnuts and groundnut oil VAT 17
IndiaEdible groundnuts Import tariff 45Groundnut oil Import tariff 35Groundnut meal Import tariff 45
Note: India raised its tariff on oil to 65 percent in 2002 and 85 percent in 2003. Raw ediblegroundnuts are raw, not roasted or cooked, in shell or shelled groundnuts. Processed groundnutsare bleached, preserved, or otherwise prepared groundnuts, including roasted, salted, andgroundnut butter.Source: WTO; WITS; USDA GAIN Report.

13 percent on groundnut oil). These tariffs areoften redundant, since the country is a net exporterof groundnut products.
China. Like India, China liberalized groundnuttrade to some degree in recent years. Before 1999six public agencies were the only importers ofgroundnut products; today, private firms are free toimport groundnuts. However, while the govern-ment has committed to cap and reduce trade-distorting domestic subsidies as part of its WTOaccession commitments, guaranteed prices andgovernment procurement schemes remain inplace.7 Furthermore, border protection remainshigh for processed groundnuts (30 percent). Thetariff on raw groundnuts was only 15 percent in2001, and many regions of China are naturalexporters of groundnuts, making the tariff redun-dant. In-quota tariffs on groundnut oil (10 percent)and groundnut meal (5 percent) were much lower.
USDA attaché reports have repeatedly raised theissue of the uneven application of the Chinesevalue-added tax (VAT) on imported and domesticproducts. The VAT is significant, ranging from 13to 17 percent, depending on the product, and thereis ample room for tax evasion (USDA FASa, USDAFASb). The lack of uniformity in application pre-vents a more accurate measure of the impact. Thequantitative policy analysis presented in the nextsection examines several cases with and withoutthe VAT.
China’s state trading imposes quantitativerestrictions through quotas and licenses on ground-nut oil imports, and it imposes tariff barriers onseeds, meal, and oil. These barriers create a wedgebetween domestic and world market prices.Domestic prices of most oils, including groundnutoil, are significantly higher than international mar-ket prices. Tariffs and rents on import licensesexplain the price differentials.8
India. India removed most restrictions ondomestic trade, storage, and export of groundnutsby 1998 and permitted trading in groundnutfutures. However, import tariff levels remain veryhigh for all three groundnut products. Moreover, inresponse to declines in prices, India has intensifiedits use of trade policy measures to protect its pro-ducers and processors. India is now the largestsource of distortions in these product markets.
Tariffs on edible groundnuts and groundnutmeal stood at 45 percent, while the tariff on ground-nut oil was 35 percent in 2001 (see table 12.10).Since 2002 India has reversed its trade liberalizationcourse on vegetable oil, increasing applied tariffson groundnut oil to 65–75 percent in 2002–03and 85 percent in 2003–04 (Gulati, Pursell, andMullen, 2003; Pursell, 2003). The bound tariff is100 percent.
Regulatory burdens increase domestic costs andprices. Producers are obligated to sell and purchasegroundnuts only in the agricultural producewholesale market.9 The “small-scale reservation”policy in groundnut processing sets limits on fixedassets in plant and machinery, preventing thedomestic processing industry from realizingeconomies of scale.
Groundnut Policies of Key African Exporters
After decades of extensive intervention in thegroundnut sector, to varying degrees African coun-tries underwent market reforms in the 1980s understructural adjustment plans. One of the mainobjectives of market reforms was to eliminatedirect and indirect taxation of farmers that hadundermined production incentives in the 1970sand early 1980s and led to underutilized processingcapacities in many groundnut producing countries(Badiane and Kinteh 1994).
Reforms have been piecemeal and partial. Gov-ernments have generally withdrawn from inputmarkets, making it difficult for producers to obtaincertified seeds and fertilizer in countries such asThe Gambia and Senegal, where there are marketfailures (in the credit market and elsewhere) andhigh transactions costs (Akobundu 1998). Govern-ments have been reluctant to liberalize groundnutprocessing, for which privatization efforts startedonly recently (in The Gambia and Senegal). In TheGambia and Senegal producer prices are still set bythe government.
African governments have traditionally usedpricing policies as convenient levers to tax or subsi-dize farmers based on their industrial policies andpolitical circumstances.10 Taxation of groundnutfarmers was high in the 1970s but has been reversedsince the early 1990s in most countries, while realworld prices have trended downward (Badiane andKinteh 1994). In The Gambia and Senegal the main
226 Global Agricultural Trade and Developing Countries

rationale for state intervention in the groundnutsector has been to safeguard the viability of state-owned processing mills. Consequently, the share ofthe export price to groundnut farmers has consis-tently been less than 60 percent in these countries.This policy has been counterproductive for thestate-owned enterprises, since farmers havebypassed large public processing companies, creat-ing excess capacity and financial difficulties.
Trade policies vary widely among traditionalgroundnut exporters in Africa. Malawi and Senegalapply high tariffs on processed groundnuts toencourage domestic processing or oil production(table 12.11). In contrast, The Gambia and Nigeriahave liberal trade policies, with no tariffs or exporttaxes. South Africa’s tariff structure exhibits a slightescalation, with processed groundnuts subject to atariff of 6 percent while unprocessed groundnutsenter duty free. In The Gambia and Senegal unoffi-cial cross-border trade is significant, with farmersfrequently crossing the border depending mainly onproducer prices and domestic supply levels in thetwo countries. Groundnut oil imports face a 20 per-cent tariff in Malawi, Senegal, and South Africa.
African countries are facing difficulties meetingEU standards on aflatoxin and stricter product andquality standards. In The Gambia and Senegalgroundnut varieties were originally selected for oilproduction, which can accommodate lower-qualityseeds, and raw groundnuts. A seed variety inMalawi proved successful in producing betteryields, but it lacked commercially viable character-istics. Groundnuts exported from most Africancountries are sold at a discount relative to the high-quality groundnuts sold in the European Union.
African producers may be able to shift out ofgroundnut oil and upgrade the quality of theiredible groundnuts. Unlike demand for groundnutoil and meal, demand for confectionery groundnut(the higher-quality edible groundnut) has been ris-ing and is expected to continue to increase in themedium term. Confectionery groundnuts receive aprice premium of as much as 100 percent overgrades used for oil and meal. In Senegal 1 ton offirst-grade confectionery groundnuts sells for$800–$900, equivalent to the price of groundnutoil. It takes three tons of unshelled groundnuts toproduce 1 ton of oil. However, fob (free on board)prices of Gambian groundnuts are about $300 forcrushing, $450 for birdfeed, and $600 for edible
groundnuts. Were The Gambia able to upgrade50 percent of its 10,000 tons of exports from crush-ing to edible groundnuts, it would increase itsrevenues by $1.5 million.
Groundnut Trade Policies of High-IncomeImporters
Despite a general pattern of tariff escalation, tradebarriers are not a major obstacle to high-incomegroundnut importers: the European Union andCanada have a zero tariff for unprocessed ground-nuts and low tariffs for processed groundnut for
Groundnut Policies, Global Trade Dynamics, and the Impact of Trade Liberalization 227
TABLE 12.11 Tariffs on GroundnutProducts in The Gambia,Malawi, Nigeria, Senegal,and South Africa(percent)
Country Product Tariff 1999–2002
Gambia, TheEdible groundnuts 0Groundnut meal 0Groundnut oil (refined) 0
MalawiRaw edible groundnuts 5Processed edible 25
groundnutsGroundnut meal 0Groundnut oil (refined) 20
NigeriaEdible groundnuts 0Groundnut meal 0Groundnut oil (refined) 0
SenegalRaw edible groundnuts 5Processed edible 20
groundnutsGroundnut meal 0Groundnut oil (refined) 20
South AfricaRaw edible groundnuts 0Processed edible 6
groundnutsGroundnut meal 0Groundnut oil (refined) 20
Note: Raw edible groundnuts are raw, not roastedor cooked, in-shell or shelled groundnuts.Processed groundnuts are bleached, preserved, orotherwise prepared groundnuts, including roastedand salted groundnuts and groundnut butter.Source: World Trade Organization database.

generalized system of preferences (GSP) and low-income developing countries (table 12.12). Assess-ment of market access in these countries must,however, take into account the strict qualitystandards.
In contrast to the European Union and Canada,Japan and the Republic of Korea have high tariffregimes for groundnuts. Japan applies a high tariffon processed groundnuts and offers a very limitedpreference margin of 4 percent for groundnutexports from low-income developing countries.Korea has very high tariffs on both raw and pro-cessed groundnuts, with tariffs on raw groundnuts ofmore than 200 percent. This high tariff may reflectthe government’s desire to stimulate production,which has plummeted since the mid 1980s. In con-trast to edible groundnuts, groundnut oils and mealenter all of these high-income countries duty free.
Impact of Groundnut ProductPolicy Reforms on World Prices,Trade Flows, and Welfare
Several key findings emerge from the quantitativeanalysis of distortions in groundnut markets. (For afull description of the model, see Beghin and others2003.) The main results obtained under the mostplausible assumptions underlying the model arepresented first, followed by sensitivity analysis test-ing the effects of U.S. policy and uncertainty aboutprotection by China (VAT and protection ofprocessed groundnuts).
Policy Reform Scenarios
Several scenarios are analyzed:
• Full multilateral trade liberalization for ground-nuts, meal, and oil, with and without elimina-
tion of the U.S. peanut program (FMTL&USand FMTL)
• Multilateral trade liberalization of groundnuts,with and without elimination of the U.S. peanutprogram (GMTL&US and GMTL)
• Full trade liberalization in the two largest andmost distorted groundnut markets, China andIndia (CIFTL)
Summary results of these five scenarios are pre-sented in tables 12.13 and 12.14. Detailed results foreach scenario are presented in the longer report onthe CD-ROM.
Analysis Results
In countries with high groundnut protection, thecombined effect of the world price increase andelimination of their own protection is beneficial tofinal users of groundnuts, other things being equal.For countries with moderate or no protectionbefore reform, tariff elimination and changes in theterms of trade result in an increase in domesticgroundnut prices, handicapping groundnut users(consumers and crushers). A similar logic holds forgroundnut oil and meal, for which the combinedeffect of world price increases and the eliminationof tariffs has to be assessed. These substantialterms-of-trade effects have a significant impact ontrade and welfare. Allocative efficiency gains indomestic markets can be offset by large priceincreases originating in postreform world markets.
In countries with high protection of groundnutoil or meal (such as India), tariff elimination, net ofthe world price hike, induces lower domestic pricesand reduces margins on crushed groundnuts. As aresult, the domestic excess supply of groundnuts
228 Global Agricultural Trade and Developing Countries
TABLE 12.12 Average Tariffs on Edible Unprocessed and Processed Groundnuts(percent)
Most-Favored-Nation Generalized System of Low-Income Developing-Tariffs Preferences Tariffs Countries Tariffs
Importer Unprocessed Processed Unprocessed Processed Unprocessed Processed
Canada 0 4 0 4 0 3.2European Union 0 13 0 9 0 0Japan 3.7 19 3.7 19 3.7 15Korea, Rep. of 243 65 243 65 243 65
Source: WTO.

crushed into oil and meal decreases, increasingimports. In contrast, countries with moderate or noprotection in their oil and meal markets face a netprice increase for oil and meal after full trade liber-alization. Their final consumption of these value-added products decreases, and crushing increases,as the crush margin improves. Their excess supplyof these products increase, and they increaseexports.
The two full trade liberalization scenarios withand without the elimination of the U.S. farm policy(FMTL&US and FMTL) induce strong priceincreases for all three products: 10 percent forgroundnuts, 18 percent for groundnut meal, and27 percent for groundnut oil (see table 12.13). Thewelfare impact of the FMTL&US and FMTLreforms is influenced by the change in the ground-nut oil price, which affects the crush margin. Crushmargins narrow in the European Union and India,decreasing supply, but they may increase in China,The Gambia, Nigeria, Senegal, South Africa, andthe United States.
Trade patterns change dramatically. Chinaexpands its exports of the three products. The largeincrease in the price of groundnut oil improves thecrush margin, stimulating crushing in China.Higher prices for groundnut oil in world marketstranslate into larger exports. In India the lower
crush margin reduces groundnut oil productionand meal production; lower consumer prices for allgroundnut products stimulate groundnut oil pro-duction and increase demand and eventuallyimports. African producers expand their exports ofvalue-added products. Malawi and Senegaldecrease their exports of groundnuts because ofincreased domestic use, while India experiences atrade reversal, becoming a large importer ofgroundnut oil and meal. Aggregate trade ingroundnuts increases 16 percent, and trade invalue-added products more than doubles.
The aggregate net welfare effects of FMTL&USand FMTL amount to about $791 million at 1995prices in each scenario (see table 12.14). China andIndia experience the largest welfare gains—not sur-prisingly, since they have the two largest and mostdistorted groundnut product markets. China’s wel-fare gains are about $666 million, India’s are about$213 million. The “moderate” magnitude of globalwelfare gains first comes from offsets—some coun-tries gain in aggregate whereas some others, chieflythe European Union-15, lose. For many countriesother than China and India, individual net gainsand losses are moderate, mostly because of thesmall size of the groundnut markets and theirprice-inelastic nature, which produces largetransfers but small deadweight losses. Indeed,
Groundnut Policies, Global Trade Dynamics, and the Impact of Trade Liberalization 229
TABLE 12.13 Welfare Effects of Policy Scenarios, 1999–2001 Average(millions of 1995 US$)
Country FMTL&US FMTL GMTL&US GMTL CIFTL
Argentina 16.07 15.94 9.97 9.84 12.66EU-15 −51.83 −51.27 −34.40 −33.82 −58.87China 666.25 668.76 650.65 653.33 716.25India 213.27 214.11 196.57 197.79 228.59Rest of the world −126.69 −127.06 −4.21 −4.86 −71.06Canada −5.94 −5.87 −4.88 −4.81 −4.59Mexico −7.43 −7.34 −6.11 −6.01 −5.73Senegal 41.03 40.96 21.93 21.86 21.39Nigeria 15.93 15.77 7.22 7.07 13.45South Africa 2.30 2.28 2.19 2.17 0.53Malawi 7.45 7.45 7.60 7.61 −1.06The Gambia 0.43 0.42 0.24 0.24 0.36USA 20.18 16.70 21.71 18.40 12.39Africa-5 total1 67.14 66.89 39.18 38.95 34.67Total 791.01 790.87 868.48 868.79 864.32
1. Denotes the aggregate of Senegal, Nigeria, South Africa, Malawi, and the Gambia.Source: USDA.

230 Global Agricultural Trade and Developing Countries
TABLE 12.14 Impact of Different Liberalization Scenarios on Groundnut Trade and Prices(percent)
FMTL&US FMTL GMTL&US GMTL CIFTL
(percent except welfare)
for 3 years for 3 years for 3 years
Peanuts Trade(1,000 metric tons)
Net ExportersArgentina 7 6 22 22 −6China 36 34 42 41 13Gambia, The 11 11 31 30 3India −62 −64 −556 −557 −94Malawi −80 −82 −93 −95 84Nigeria 3667 3564 7470 7358 1776Senegal −287 −298 −8 −20 −708South Africa 22 22 20 20 14United States 8 15 48 55 2Total net exports 16 16 −17 −16 −4
Net ImportersCanada −5 −5 −4 −4 −4European Union −3 −3 −3 −3 −2Mexico −8 −8 −7 −7 −6Rest of the world 63 65 −47 −45 −7Residual 0 0 0 0 0Total net imports 16 16 −17 −16 −4Peanuts Price US Run. 10 10 8 8 840/50 cif Rotterdam
$ per mt
Peanut Meal Trade (1,000 metric tons)
Net ExportersArgentina 13 13 −6 −6 18China 741 739 −144 −146 759Gambia, The 22 21 −2 −2 22India −1702 −1703 344 342 −1690Malawi 9 8 1 1 46Nigeria 2867 2862 −193 −196 2867Senegal 5 5 −1 −1 14South Africa 95 95 −7 −7 139United States 484 487 −380 −376 563Rest of World 499 499 −70 −69 385Total Net Exports −9 −9 0 0.4 −9
Net ImportersEuropean Union −12 −12 1 1 −13Residual 0 0 0 0 0Total net imports −9 −9 0 0 −9Meal Price 48/50 cif 18 18 0 0 18Rotterdam $ per mt
Peanut Oil Trade (1,000 metric tons)
Net exportersArgentina 11 11 −6 −6 16

Groundnut Policies, Global Trade Dynamics, and the Impact of Trade Liberalization 231
substantial offsetting transfers occur between con-sumers, crushers, and producers.
Price effects induced by the reforms have a simi-lar impact large welfare transfer (rectangles) andsmall net welfare effects (triangles), even in coun-tries with undistorted markets. In Nigeria, forexample, following full multilateral trade liberaliza-tion without elimination of the U.S. peanut pro-
gram, groundnut producers gain $34 million inquasi-rents, consumers experience welfare losses of$65 million (because of higher oil and processedgroundnut prices), crushers gain $51 million, andmeal users (feed users) lose about $3 million. Inaggregate the country is better off by $16 million.
Under multilateral trade liberalization for allthree products, elimination of the U.S. program
TABLE 12.14 (Continued)
FMTL&US FMTL GMTL&US GMTL CIFTL
(percent except welfare)
for 3 years for 3 years for 3 years
China 3469 3459 −705 −713 3354Gambia, The 589 587 −5 −6 567India −24288 −24304 4591 4558 −24481Malawi 43 43 0 0 185Nigeria 123 123 −6 −6 120Senegal 5 5 −1 −1 19South Africa 49 49 −4 −4 224United States 288 290 −194 −192 326Rest of world 861 864 −103 −99 665Total net exports −6 −6 0 0 −8
Net importersEuropean Union −9 −9 0 0 −12Residual 0 0 0 0 0Total net imports −6 −6 0 0 −8Peanut Oil Price cif 27 27 0 0 26
Rotterdam $ per mtwelfare(million dollars) 791 791 868 869 864Argentina 16.07 15.94 9.97 9.84 12.66EU-15 −51.83 −51.27 −34.40 −33.82 −58.87China 666.25 668.76 650.65 653.33 716.25India 213.27 214.11 196.57 197.79 228.59Rest of world −126.69 −127.06 −4.21 −4.86 −71.06Canada −5.94 −5.87 −4.88 −4.81 −4.59Mexico −7.43 −7.34 −6.11 −6.01 −5.73Senegal 41.03 40.96 21.93 21.86 21.39Nigeria 15.93 15.77 7.22 7.07 13.45South Africa 2.30 2.28 2.19 2.17 0.53Malawi 7.45 7.45 7.60 7.61 −1.06Gambia, The 0.43 0.42 0.24 0.24 0.36United States 20.18 16.70 21.71 18.40 12.39Africa-5 totala 67.14 66.89 39.18 38.95 34.67Total 791.01 790.87 868.48 868.79 864.32
Note: Table totals are average changes for three years totaled in each column. Results are percentagechanges from the baseline. Baseline and simulations were run for three years (1999–2001) and averaged.a. Totals are three-year averages.Source: computed by the authorsa. Denotes the aggregate of Senegal, Nigeria, South Africa, Malawi, and The Gambia.

affects trade flows, terms of trade, and welfare. Thestrong price effects of trade liberalization invalidatethe price floor established by the U.S. loan rate. Theonly remaining production-distorting element isthe fixed payment (fully coupled to production inthe model), which is small. Results under both sce-narios (full trade liberalization with and withoutelimination of the U.S. peanut program) are quali-tatively identical, except for the United States,which experiences additional welfare gains of $3.5million (gains to U.S. taxpayers net of losses by U.S.producers) by eliminating its domestic distortions.
The world price impacts of the FMTL scenarioare identical to those of FMTL&US (a 10 percentincrease for groundnuts, an 18 percent increase formeal, and a 27 percent increase for groundnut oil).Trade flows are barely affected by the elimination ofthe U.S. domestic program under free trade. U.S.groundnut exports are about 15,000 metric tonslower in the FMTL&US scenario than in the FMTLscenario. Given that the parameterization of U.S.farm policy assumes full coupling to production forpayments received by producers, the assessmentprovides an upper bound on the effect of the cur-rent U.S. peanut program.11
Many agricultural negotiations during the DohaRound of the WTO revolve around narrow issues ofsubstantial importance to developing countries.Hence it is useful to assess what a narrow agricul-tural liberalization encompassing the value-addedproducts of groundnut oil and meal would achieverelative to full trade liberalization.
The GMTL&US and GMTL scenarios considerthese reforms and their impacts. Much is achievedby groundnut trade liberalization alone, but with alarge second-best component, since distortions arepresent in the value-added markets. In thesegroundnut liberalization scenarios, the prices ofmeal and oil are little affected, and crush marginsare driven primarily by changes in groundnutprices. Margins improve in India but deteriorate incountries with limited groundnut distortions.
Consumer welfare implications are also differ-ent in these trade scenarios. In highly protectedgroundnut oil markets, prices are higher under thegroundnut trade (GMTL) scenarios than they areunder all-product trade liberalization (FMTL sce-narios). In countries with no oil distortions, pricesremain roughly at their baseline level, and con-sumers do better under the groundnut tradeliberalization than under the full liberalization
scenarios. The rest of the world fares much betterunder the groundnut trade liberalization scenariosthan under the full liberalization scenarios. In con-trast, African economies do much better under thefull liberalization scenarios than with groundnuttrade liberalization reforms. The potential welfaregains for Africa-5 (The Gambia, Malawi, Nigeria,Senegal, and South Africa) nearly double by mov-ing from groundnut trade liberalization to fullliberalization scenarios.
If China and India liberalized alone (the CIFTLscenario), the qualitative results of the full liberal-ization scenarios hold. What is striking in this lastscenario is the importance of India’s—and to alesser extent China’s—distortions and market sizeon welfare, trade, and price effects. As suggested bytable 12.13, FMTL really hinges on the eliminationof distortions in India and China. With liberaliza-tion in India and China, world prices would rise8 percent for groundnuts, 18 percent for meal, and26 percent for oil. The major welfare differencesoccur in the rest of the world, where consumers areworse off than they would be under the multilat-eral groundnut trade liberalization scenario, sincegroundnut oil prices are higher. Africa-5 improvesits lot in aggregate but by less than it would underthe full liberalization scenario, since groundnutprices are lower and distortions within Africa-5remain in place.
Two key assumptions in the model—the prevail-ing groundnut market price in the U.S. market andthe level of protection of the groundnut market inChina—were investigated. The model was cali-brated on 2002–03 U.S. prices ($389 per metricton) to see if the new U.S. policy under the 2002Farm Bill would have had a stronger impact on theworld market under lower prevailing prices (farmprices in the United States were 25 percent lower in2002–03 than in 2001–02). The loan rate, counter-cyclical payments, and fixed payments were elimi-nated (countercyclical payments and fixed pay-ments are assumed to be fully coupled to providean upper bound on the effect of the U.S. program),while all distortions in all other countries wereretained. The price floor provided by the loan rateis effective under the lower 2002–03 farm price.
U.S. output decreases 7 percent under the newprices, and U.S. exports decrease 52 percent, induc-ing a 0.9 percent increase in the world price ofgroundnuts and negligible price impacts in theother markets. The aggregate net welfare effect is
232 Global Agricultural Trade and Developing Countries
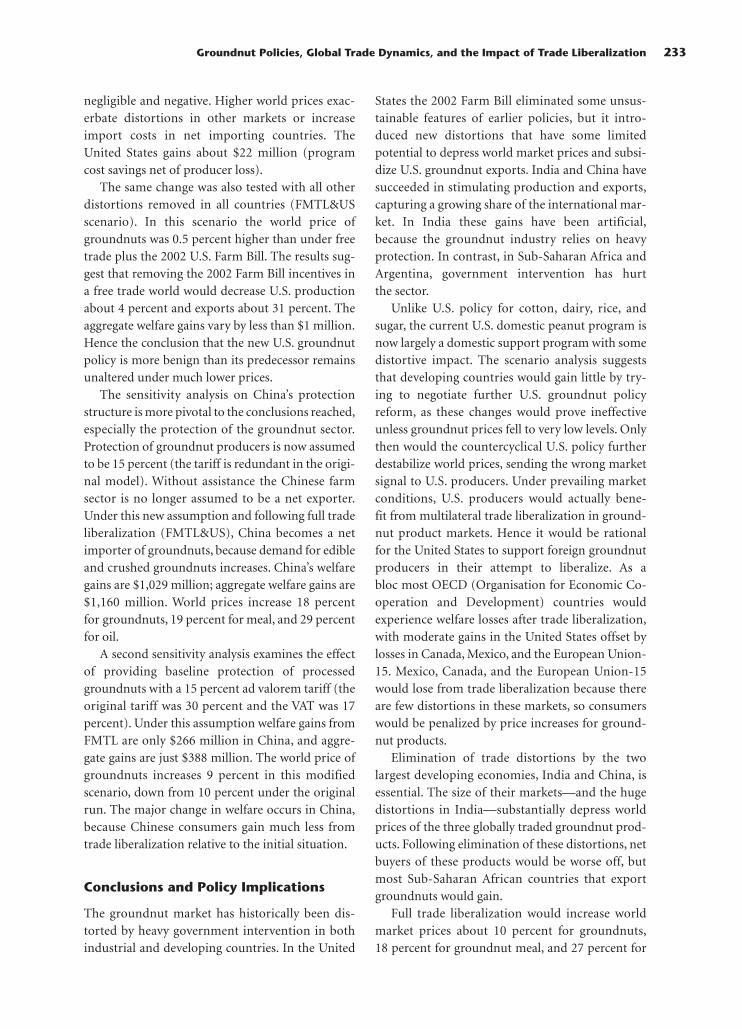
negligible and negative. Higher world prices exac-erbate distortions in other markets or increaseimport costs in net importing countries. TheUnited States gains about $22 million (programcost savings net of producer loss).
The same change was also tested with all otherdistortions removed in all countries (FMTL&USscenario). In this scenario the world price ofgroundnuts was 0.5 percent higher than under freetrade plus the 2002 U.S. Farm Bill. The results sug-gest that removing the 2002 Farm Bill incentives ina free trade world would decrease U.S. productionabout 4 percent and exports about 31 percent. Theaggregate welfare gains vary by less than $1 million.Hence the conclusion that the new U.S. groundnutpolicy is more benign than its predecessor remainsunaltered under much lower prices.
The sensitivity analysis on China’s protectionstructure is more pivotal to the conclusions reached,especially the protection of the groundnut sector.Protection of groundnut producers is now assumedto be 15 percent (the tariff is redundant in the origi-nal model). Without assistance the Chinese farmsector is no longer assumed to be a net exporter.Under this new assumption and following full tradeliberalization (FMTL&US), China becomes a netimporter of groundnuts, because demand for edibleand crushed groundnuts increases. China’s welfaregains are $1,029 million; aggregate welfare gains are$1,160 million. World prices increase 18 percentfor groundnuts, 19 percent for meal, and 29 percentfor oil.
A second sensitivity analysis examines the effectof providing baseline protection of processedgroundnuts with a 15 percent ad valorem tariff (theoriginal tariff was 30 percent and the VAT was 17percent). Under this assumption welfare gains fromFMTL are only $266 million in China, and aggre-gate gains are just $388 million. The world price ofgroundnuts increases 9 percent in this modifiedscenario, down from 10 percent under the originalrun. The major change in welfare occurs in China,because Chinese consumers gain much less fromtrade liberalization relative to the initial situation.
Conclusions and Policy Implications
The groundnut market has historically been dis-torted by heavy government intervention in bothindustrial and developing countries. In the United
States the 2002 Farm Bill eliminated some unsus-tainable features of earlier policies, but it intro-duced new distortions that have some limitedpotential to depress world market prices and subsi-dize U.S. groundnut exports. India and China havesucceeded in stimulating production and exports,capturing a growing share of the international mar-ket. In India these gains have been artificial,because the groundnut industry relies on heavyprotection. In contrast, in Sub-Saharan Africa andArgentina, government intervention has hurtthe sector.
Unlike U.S. policy for cotton, dairy, rice, andsugar, the current U.S. domestic peanut program isnow largely a domestic support program with somedistortive impact. The scenario analysis suggeststhat developing countries would gain little by try-ing to negotiate further U.S. groundnut policyreform, as these changes would prove ineffectiveunless groundnut prices fell to very low levels. Onlythen would the countercyclical U.S. policy furtherdestabilize world prices, sending the wrong marketsignal to U.S. producers. Under prevailing marketconditions, U.S. producers would actually bene-fit from multilateral trade liberalization in ground-nut product markets. Hence it would be rationalfor the United States to support foreign groundnutproducers in their attempt to liberalize. As abloc most OECD (Organisation for Economic Co-operation and Development) countries wouldexperience welfare losses after trade liberalization,with moderate gains in the United States offset bylosses in Canada, Mexico, and the European Union-15. Mexico, Canada, and the European Union-15would lose from trade liberalization because thereare few distortions in these markets, so consumerswould be penalized by price increases for ground-nut products.
Elimination of trade distortions by the twolargest developing economies, India and China, isessential. The size of their markets—and the hugedistortions in India—substantially depress worldprices of the three globally traded groundnut prod-ucts. Following elimination of these distortions, netbuyers of these products would be worse off, butmost Sub-Saharan African countries that exportgroundnuts would gain.
Full trade liberalization would increase worldmarket prices about 10 percent for groundnuts,18 percent for groundnut meal, and 27 percent for
Groundnut Policies, Global Trade Dynamics, and the Impact of Trade Liberalization 233

groundnut oil. Trade in groundnuts would increase16 percent, and trade in oil and meal would morethan double.
Although the net world welfare effects of liberal-izing markets in the United States, China, and Indiaare moderate, they remain significant for smallagrarian economies in Sub-Saharan Africa. Liberal-ization would thus produce welfare gains in thecountries in which they are most needed.
The simulations show that liberalization of thevalue-added markets is essential to achieve largerwelfare gains in African countries. Although thebulk of the world welfare gains occur with ground-nut trade liberalization, elimination of distortionsin value-added markets doubles net welfare gainsin Africa by yielding larger profits to producersand exporters of groundnuts and groundnut oil.African countries modeled in the trade liberaliza-tion analysis would experience aggregate welfaregains of $67 million, with Senegal and Nigeriareaping most of these gains. Groundnut andgroundnut oil consumers in Africa tend to beurban, whereas groundnut production generatesincome in rural areas as a cash crop. Africangroundnut producers modeled in the analysis gain$50 million–$150 million of farm income, depend-ing on the assumptions underlying the model.These figures are significant for small Africaneconomies and represent an important opportu-nity to expand rural development in these areas. Inthe scenarios tested, the rest of the world would fareworse under full trade liberalization, because con-sumers are required to pay higher groundnut prod-uct prices. Groundnuts are not without substitutes,however, and the price increase may induceincreases in demand for other oils.
Recent changes present both challenges andopportunities for major countries in the market.The United States is likely to continue to dominatethe high end of the international confectionerymarket under its new peanut program. Argentinaand China have established strong groundnut sec-tors that can compete favorably under free marketconditions. Chinese exports played a stabilizingrole in world markets in the 1990s.
All developing countries except Argentina facethe challenge of meeting the quality requirementsof the expanding confectionery markets. This isparticularly so for African countries, which aremissing out on the opportunities and rewards
created by the expansion of the edible groundnutexports market because of inadequate quality.
Notes
1. Groundnuts are also known as peanuts, earthnuts,goobers, pinders, and Manila nuts. The groundnut plant is ahairy, tap-rooted, annual legume that measures 1–1.5 feet inheight.
2. Groundnut oil is an excellent cooking oil, with a highsmoke point and neutral flavor and odor. Groundnut meal isused as animal feed.
3. Any grower in the group is eligible to farm a certain num-ber of acres of land. Farmers who use the land are obligated,however, to pay agricultural tax in kind and sell a certainamount of their products to the state government at regulatedprices.
4. Export markets reflect relatively high-quality premiumsand discounts. Prices of U.S. groundnuts set a ceiling for inter-national prices, because the quality is high. Edible U.S. ground-nuts commanded a 40 percent premium on world markets overshelled Chinese groundnuts in 2000 (FAO 2002).
5. In 1998 the EU harmonized country regulations on themaximum permissible level of aflatoxin, setting levels at the low-est possible level (0.002 milligrams for B1 type aflatoxin for edi-ble groundnuts). Aflatoxin is a cancer-causing chemical pro-duced by species of aspergillus molds that can contaminategroundnuts. The spores of these molds, present anywhere in theair and the soil, require specific temperature, moisture, andnutrient substrates to germinate. Aflatoxin contamination ofgroundnuts can occur during cultivation in the field, as well asduring harvesting, postharvesting, storage, or processing. Whileaflatoxin disappears with crushing, it remains in edible ground-nuts and groundnut meal. Technical processes exist to reduceaflatoxin contamination (with ammoniac, for example, whichSenegal uses on groundnut meal), but the best method is toimprove farm practices through use of best-quality and resistantseeds, proper management of farms, and appropriate storage toavoid exposure to high temperature and humidity. See chapter 6in this volume for a discussion of food safety and agriculturalhealth standards.
6. The levels of quota and tariff for the period after 2003 arecurrently under negotiation.
7. According to the FAO (Food and Agriculture Organiza-tion), these policies provide little incentive to expand produc-tion due to unattractive administrative price levels and greaterinvolvement of the private sector in marketing operations. Dataon the magnitude of domestic support are not available.
8. The international price of groundnut oil in Hong Kong(China) was $728 a ton in 1998, and the wholesale price inChina was 67.8 percent higher (Fang and Beghin 2002).
9. This regulation imposes a significant burden on farmersand processors. Even if they are located very close to oneanother, they have to travel to the wholesale market and pay an“agent commission” and other marketing fees before the trans-action is processed.
10. Taxation of producers was direct (that is, marketingboards or similar agencies captured the rent, equal to the differ-ence between the net world price and the producer price) orindirect (through appreciation of the real exchange rate). Thistaxation was generally mitigated by input subsidies and borderprotection.
11. Eliminating U.S. distortions under existing trade distor-tions produces a 0.13 percent increase in the world price of
234 Global Agricultural Trade and Developing Countries

groundnuts and virtually no increase in world cake and oilprices. U.S. groundnut exports decrease by 10 percent, or about20,000 metric tons a year. Thus in contrast to the effect of U.S.subsidies on rice, cotton, and sugar, the impact of the currentU.S. farm program on the world price of and trade in ground-nuts is negligible.
References
Akobundu E. 1998. Farm-Household Analysis of Policies AffectingGroundnut Production in Senegal. MS Thesis, Virginia Poly-technic and State University.
Badiane, O., and Kinteh, S. 1994. “Trade Pessimism and Region-alism in African Countries: The Case of GroundnutExporters.” IFPRI Research Report 97. International FoodPolicy Research Institute, Washington, D.C.
Beghin, J., N. Diop, H. Matthey, and M. Sewadeh. 2003. “TheImpact of Groundnut Trade Liberalization: Implication forthe Doha Round.” Presented at the 2003 American Agricul-tural Economics Association Annual Meeting, July 27–30,Montreal.
Chen, Changping, Stanley M. Fletcher, Ping Zhang, and Dale H.Carley. 1997. “Competitiveness in Peanuts: United Statesversus China.” Research Bulletin 430. University of Georgia,Georgia Agricultural Experiment Station.
Colby, W. H., F. W. Crook, and S. Webb. 1992. Agricultural Statis-tics of the People’s Republic of China, 1949–1990. SB-844,United States Department of Agriculture, EconomicResearch Service, December.
Diop, N., J. Beghin, and M. Sewadeh. 2004. “Groundnut Policies,Global Trade Dynamics and the Impact of Trade Liberaliza-tion,” World Bank Policy Research Working Paper 322.Washington, D.C.
Gulati, A., G. Pursell, and K. Mullen. 2003. “Indian Agriculturesince the Reforms: Performance, Policy Environment, andIncentives.” World Bank, Washington, D.C.
Fang C., and J. Beghin. 2002. “Urban Demand for Edible Oilsand Fats in China: Evidence from Household Survey Data.”Journal of Comparative Economics 30(4): 732–53.
FAO (Food and Agriculture Organization of the UnitedNations) 2002. FAO Yearbook. Trade. Rome.
Fletcher, S. M. 2001. “Peanuts: Responding to Opportunities andChallenges from an Intertwined Trade and Domestic Poli-cies.” University of Georgia, National Center for PeanutCompetitiveness, Griffin, Ga.
Fletcher, S. M., and C. L. Revoredo. 2003.“Does the United StatesNeed the Groundnut Tariff Rate Quota Under the 2002 U.S.Farm Act?” Paper presented at the International Conferenceon Agricultural Policy and the WTO: Where Are We Head-ing, June 23–26, Capri, Italy.
Hart, C. and B. Babcock. 2002. “U.S. Farm Policy and the WTO:How Do They Match Up?” The Estey Centre Journal of Inter-national Law and Trade Policy 3:119–39.
Pursell, G. 2003. Private e-mail correspondence on India’sgroundnut protection, September.
Revoredo, C. L., and S. Fletcher. 2002a. “The U.S. 2002 Farm Actand the Effects on U.S. Groundnut Exports.” University ofGeorgia, Griffin, Ga.
———. 2002b. “World Peanut Market: An Overview of the Last30 Years.” University of Georgia, Griffin, Ga.
Skinner, R. 1999. “Issues Facing the United States: Peanut Indus-try during the Seattle Round of the World Trade Organiza-tion.” U.S. Department of Agriculture, Economic ResearchService, Washington, D.C.
USDA FAS (U.S. Department of Agriculture, Foreign Agricul-ture Service). GAIN Reports, various years a. “China, Peo-ple’s Republic of. Oilseeds and Products. Oilseeds Update.”Washington, D.C.
———. Various years b. “China, People’s Republic of. Oilseedsand Products. Annual.” Washington, D.C.
Wescott, P. C., C. E. Young, and J. M. Price. 2002. “The 2002Farm Act Provisions and Implications for Commodity Mar-kets.” Agriculture Information Bulletin Number 778. U.S.Department of Agriculture, Economic Research Service,Washington, D.C.
Groundnut Policies, Global Trade Dynamics, and the Impact of Trade Liberalization 235

exports of sugar, and seven times exports of textilefibers.
This chapter highlights major global, regional,and product-specific trends in the trade in fruit andvegetable products, and examines the major policyand other factors that have affected this trade overthe past two decades.1 Particular attention is givento the performance and position of developingcountries in this trade and the policies, institutions,and infrastructure they need to succeed.
Fruit and Vegetable Productionand Trade Growth
For the purpose of this study, we group fruits andvegetables in four main categories: fresh fruits,fresh vegetables, processed fruits, and processedvegetables. These categories comprise all SITC(Standard International Trade Classification) Revi-sion 1, Chapter 5 items except nuts, roots, andtubers. They correspond to most products inChapter 7 (edible vegetables and certain rootsand tubers), Chapter 8 (edible fruits and nuts;peel of citrus fruits or melons) and Chapter 20(preparations of vegetables, fruit, nuts, or otherparts of plants) of the Harmonized System (HS)nomenclature.
Trade in fruit and vegetable products has beenamong the most dynamic areas of internationalagricultural trade, stimulated by rising incomes andgrowing consumer interest in product variety, fresh-ness, convenience, and year-round availability.Advances in production, postharvest handling, pro-cessing, and logistical technologies—along withincreased levels of international investment—haveplayed a facilitating role. For developing countries,trade in these products has been attractive in theface of highly volatile or declining long-term trendsin the prices for many traditional export products.Although many developing-country suppliers haveentered the field, relatively few have achieved signif-icant, sustained success, reflecting the fact that theindustry is highly competitive and rapidly changing.
Still, the aggregate picture is favorable. Fresh andprocessed fruit and vegetable products accounted for16.7 percent of total agricultural exports from devel-oping countries in 1980–81. By 2000–01, this sharehad increased to 21.8 percent. Only for one otherproduct category—fish and fisheries products—aredeveloping countries more significant exporters (seechapter 1). Fruit and vegetable exports from devel-oping countries are now more than double exportsfor tropical beverages, three times exports of grains,three times exports of livestock products, five times
237
13
FRUITS AND VEGETABLES:GLOBAL TR ADE AND
COMPETITION IN FRESHAND PROCESSED
PRODUCT MARKETS
Ndiame Diop and Steven M. Jaffee

238 Global Agricultural Trade and Developing Countries
Trends in World Production and Trade
World production of fruit and vegetables grew by30 percent between 1980 and 1990 and by 56 per-cent between 1990 and 2003, reaching 1,274 mil-lion tons by 2003. Much of this growth occurred inChina, where production grew by 134 percent inthe 1980s and by 200 percent in the 1990s. China iscurrently the world’s largest producer of fruits andvegetables, with a share of 34 percent, followed byLatin America and the Caribbean (11 percent),India (10 percent), and Africa and the EuropeanUnion (EU) (both at 9 percent) (figure 13.1).
The structure of world trade in fruits and veg-etables does not fully mirror that of production.Many of the largest producers are not significanttraders due to a combination of domestic demandand geographical and logistical factors. For exam-ple, in China and India, where strong domesticdemand is fueled by growing income and a largeand rapidly growing urban population, only a smallpercentage of fruit and vegetable production isexported. In contrast, Latin American countries(such as Mexico, Chile, and Costa Rica) are amongthe world’s leading exporters of fruits and vegeta-bles, mainly because of their proximity to the largeU.S. market.
World trade in fruits and vegetables, fresh andprocessed, has increased by 30 percent since 1990,reaching $71.6 billion in 2001 (table 13.1). This
followed even more robust growth in the 1980s,when trade in fruits and vegetables doubled. Worldtrade in all categories of fruits and vegetableshas grown strongly, with only slight changes inits broad composition. In 2001 fresh produceaccounted for 63 percent of the total, whereasprocessed products accounted for 37 percent. Thecomplexity of these definitions must be kept inmind, however. Both in Europe and the UnitedStates, one of the fastest-growing product segmentsis semi-prepared and packed fresh produce, includ-ing preassembled salads, vegetable dips, and slicedor mixed fruit products.
Taking all fruit and vegetable products com-bined, the value of world imports grew at 2–3 per-cent a year during the 1990s, a sharp decelerationfrom the 7–8 percent annual growth during theprevious decade (figures 13.2–13.5). As elaboratedbelow, the slower growth in world imports duringthe 1990s reflects two primary factors: a decline inworld prices for many important fruit and veg-etable products in the latter half of the 1990s, andstagnation in EU import demand due to marketsaturation.
Within the fresh fruit category, the decelerationhas been sharpest for apples, grapes, and citrus (fig-ure 13.2). Comparatively more dynamic trade hasremained for various tropical fruits (especiallypapaya, mango, and pineapple), with averageannual growth in the 1990s remaining at 8 percent.
FIGURE 13.1 Production of Fruit and Vegetables by Region (million of tons)
Africa EU-15 LAC China India U.S. Rest of World0
50
100
150
200
250
300
Millions of tons
350
400
450
500
1980 1990 2003
Source: United Nations Food and Agriculture Organization.

Still, these latter products represent a relativelysmall proportion of world fresh fruit trade (7 per-cent in 2001), which is still heavily concentrated inparticular lines, including bananas (25 percent ofthe total), citrus fruit (20 percent), grapes (11 per-cent), and apples (10 percent). A large number ofother fresh fruits, not separated in the statistics, col-lectively represent 28 percent of world fresh fruitimports. Prominent items in this category includemelons, various types of berries, and other temper-ate fruits.
World import values for fresh vegetables grew at6.9 percent a year during the 1980s, yet deceleratedto 2.4 percent a year in the 1990s (figure 13.3). Thedeceleration affected most individual commodities.World vegetable trade is fragmented among a largenumber of individual items. The largest single item
is tomatoes, which account for 17 percent of thetotal. The category of beans, peas, and lentilsaccounts for another 14 percent. Other relativelymajor commodities in the fresh vegetable tradeinclude onions, potatoes, asparagus, mushrooms,and various types of sweet and pungent peppers.
The evolution of trade in processed fruit andvegetable products mirrors that for fresh produce.The annual growth rate in trade value was 8.3 per-cent a year during the 1980s, yet only 3 percentduring the 1990s (figure 13.4). All categories ofprocessed products saw a deceleration in tradeexpansion, although fruit and vegetable juices andpreserved fruits and jams fell most sharply.Processed vegetables (such as canned mushrooms,dried mushrooms, and tomato paste) account for55 percent of world trade in all these products, fruit
Fruits and Vegetables: Global Trade and Competition in Fresh and Processed Product Markets 239
Source: COMTRADE.
TABLE 13.1 World Fruit and Vegetable Imports, 1980–2001 (US$ millions)
Percent Share Percent Share Percent ShareCategory 1980–81 in Total 1990–91 in Total 2000–01 in Total
Fresh fruits 10,971 40 20,981 38 27,978 39Processed fruits 4,441 16 9,916 18 13,176 18Fresh vegetables 6,805 25 13,315 24 16,914 24Processed vegetables 5,424 20 10,883 20 13,577 19Total 27,641 100 55,094 100 71,644 100
Source: COMTRADE.
FIGURE 13.2 Annual Growth Rates of World Imports of Selected Fruits (Value)
0
2
4
6
8
12
10
Percent
Freshfruits total
Citrus Bananas Apples Grapes Otherfruit
Tropicalfruit
1980–81 to 1990–91 1990–91 to 2000–01

and vegetable juices for some 20 percent, and sev-eral smaller categories for the balance.
Price played a role in the observed trends. Theunit values of fresh fruit and of fresh and preparedvegetables dropped sharply in the second half ofthe 1990s after an extended period of increase dat-ing from the early 1980s (figure 13.5). These trendssuggest that price factors played a very significantrole in the declining rate of growth in the value of
fruit and vegetable imports during the 1990s.Indeed, for each of the most important traded freshfruits and vegetables, the rate of import volumegrowth was modestly higher in the 1990s than inthe 1980s (table 13.2).
Part of the decline in world prices is a statisticalmatter. The data above are recorded in U.S. dollars.During the latter half of the 1990s, the U.S. dollarappreciated vis-à-vis the yen and most European
240 Global Agricultural Trade and Developing Countries
FIGURE 13.4 Annual Growth Rates of World Import of Major Processed Fruitsand Vegetables
0
2
1
3
4
5
7
8
9
10
6
Percent
Totalprocessedfruits and
vegetables
Dried fruits Preservedfruits, jams,
and flour
Fruit juices,vegetable
juices
Processedvegetables
1980–81 to 1990–91 1990–91 to 2000–01
FIGURE 13.3 Annual World Import Growth Rates of Selected Vegetables
0
2
1
3
4
5
7
6
Percent
Freshvegetables total
Othervegetables
Beans,peas, lentilsa
Tomatoes
1980–81 to 1990–91 1990–91 to 2000–01
a. The corresponding value for 1990–91 to 2000–01 has the value of 0%.Source: COMTRADE.
Source: COMTRADE.

currencies, deflating Japanese and Europeanimport values upon conversion into U.S. dollars.For some commodities, however, the unit importvalues into Japan, Europe, and elsewhere actuallydid decline in local currency terms—in some casessubstantially. For example, from 1996 to 2001, theaverage unit value of Japanese fresh vegetableimports fell by 25 percent, while that of processedvegetable imports fell by 8 percent.2 A major factorin this decline was the rapidly expanding supply oflow-cost production in China. During the 1990sChina accounted for virtually all of the incrementalexpansion in Japan’s vegetable trade, taking marketshare from other suppliers. Declining unit importvalues for various products in Europe can be attrib-uted to at least three factors: the slow economicgrowth in the region (especially in Germany, the
leading importer); competitive and structuralchanges in fruit and vegetable distribution systems,which put downward pressures on trader andmanufacturer margins; and greater availability ofproduct and intensified international competition.
Sources and Destinations ofExported Fruits and Vegetables
The European Union, NAFTA (North AmericanFree Trade Agreement), and a few middle-incomecountries dominate trade in fruits and vegetables(table 13.3). Eight categories of countries are dis-tinguished. China, India, Japan, and the EuropeanUnion are singled out. The United States, Canada,and Mexico are grouped together in the NAFTAcategory. The developing-country group minusChina and India is split between low-income coun-tries and middle-income ones.
Global Trade Patterns
The European Union is the world’s largest marketand supplier of fresh and processed fruits and veg-etables. In 2001 its 15 member countries accountedfor $37 billion in imports, or 51 percent of worldimports, while exports stood at $28 billion, or39.5 percent of world exports.3 EU trade in fruitsand vegetables is, however, largely intraregional.Intra-EU imports represent 64 percent of EUimports, while 83 percent of EU export trade occursamong its 15 member states. Still, with its affluent
Fruits and Vegetables: Global Trade and Competition in Fresh and Processed Product Markets 241
TABLE 13.2 Average Annual Growth Ratesin World Import Volumes,1980–2001
Commodity 1980–1991 1990–2001
Bananas 3.45 3.96Oranges 1.11 1.68Apples 1.42 2.33Grapes 4.31 4.34Tomatoes 3.11 4.45Onions 3.50 4.17Green beans 4.59 5.98
Source: FAOSTAT.
FIGURE 13.5 World Unit Values for Fresh Fruits, Fresh Vegetables, and Prepared Vegetables (US$ per metric ton)
0
1,400
1,000
1,200
800
600
400
200
1980 1982 1984 1986 1988 1990 1992 1994 1996 1998 2000 2002
US$
Prepared vegetables Fresh fruit Fresh vegetables
Source: FAOSTAT.

and aging population, its high factor costs, and itscold winters, this region represents one of the largestfruit and vegetable markets for non-EU countries($13.2 billion), especially for low- and middle-income countries, which exported $1.08 and $9 bil-lion, respectively, to the European Union in 2001.Major middle-income suppliers to the EuropeanUnion market include banana-exporting coun-tries (mainly Colombia, Costa Rica, Côte d’Ivoire,Ecuador, and Panama4) and counterseasonal-supplying countries such as Argentina, Chile, andSouth Africa. Led by South Africa, the latter threecountries dominate exports of apples, grapes, andpears to the European Union.
Intraregional trade is also significant in NAFTA,the world’s second-largest fruit and vegetable
market. Trade between Mexico, Canada, and theUnited States accounted for 49 percent of NAFTA’simports and 53 percent of its exports in 2001.Intra-NAFTA trade is most important for freshvegetables. For this commodity group, 90 percentof exports and 86 percent of imports occur withinthe trade group (Huang 2004). Still, middle-income countries (excluding Mexico) have a strongfoothold in this market. By securing 71 percent ofthe $7.25 billion extra-NAFTA import market in2001, middle-income countries are major players.
Interestingly, thanks to growing incomes in the1990s, middle-income countries have seen theirown market become a major destination of fruit andvegetable exports from other countries, with importdemand totaling $11 billion in 2001. South-South
242 Global Agricultural Trade and Developing Countries
TABLE 13.3 Import and Export of Fruits and Vegetables by Region or Country(US$ billions)
ExportersLow- Middle- European Other Total
Importers Year Income Income Union Japan NAFTA Industrial China India Imports
Low-income 1980–81 0.05 0.14 0.09 0.00 0.03 0.01 0.02 0.02 0.371990–91 0.02 0.12 0.05 0.00 0.02 0.05 0.04 0.04 0.342000–01 0.08 0.19 0.10 0.00 0.13 0.09 0.14 0.05 0.78
Middle- 1980–81 0.10 2.24 0.88 0.18 0.84 0.21 0.39 0.09 4.94income 1990–91 0.14 2.77 0.91 0.10 1.12 0.33 0.79 0.12 6.27
2000–01 0.44 4.69 2.22 0.05 1.88 0.58 1.04 0.17 11.08
European 1980–81 0.42 4.36 8.63 0.02 0.75 1.08 0.24 0.02 15.52 Union 1990–91 0.75 8.86 20.59 0.01 1.07 1.71 0.50 0.02 33.51
2000–01 1.08 9.19 23.45 0.01 1.19 1.09 0.55 0.11 36.67
Japan 1980–81 0.02 0.68 0.05 0.00 0.49 0.07 0.13 0.00 1.431990–91 0.01 1.49 0.17 0.00 1.21 0.25 0.56 0.00 3.692000–01 0.04 1.49 0.25 0.00 1.69 0.36 1.93 0.00 5.76
NAFTA 1980–81 0.04 1.64 0.29 0.05 1.97 0.09 0.05 0.00 4.121990–91 0.07 3.94 0.75 0.06 3.59 0.23 0.13 0.01 8.802000–01 0.12 5.20 1.15 0.05 7.10 0.27 0.36 0.10 14.35
Other 1980–81 0.01 0.31 0.61 0.00 0.13 0.11 0.02 0.00 1.20industrial 1990–91 0.03 0.55 1.16 0.00 0.17 0.21 0.04 0.01 2.17
2000–01 0.03 0.56 1.10 0.00 0.23 0.21 0.08 0.01 2.22
China 1980–81 0.00 0.01 0.00 0.00 0.00 0.00 0.00 0.00 0.011990–91 0.02 0.03 0.00 0.00 0.00 0.00 0.00 0.00 0.062000–01 0.06 0.32 0.01 0.00 0.12 0.03 0.00 0.01 0.56
India 1980–81 0.02 0.04 0.00 0.00 0.00 0.00 0.00 0.00 0.061990–91 0.08 0.10 0.00 0.00 0.02 0.04 0.00 0.00 0.242000–01 0.10 0.03 0.00 0.00 0.08 0.02 0.00 0.00 0.23
Total 1980–81 0.65 9.41 10.55 0.25 4.21 1.58 0.85 0.13 27.64exports 1990–91 1.12 17.86 23.62 0.18 7.22 2.83 2.06 0.20 55.09
2000–01 1.95 21.66 28.29 0.12 12.41 2.65 4.10 0.45 71.64
Source: COMTRADE.

trade—trade between developing countries, exclud-ing China and India—totaled $5.4 billion in 2001,accounting for 45 percent of developing countries’imports. Japan has also emerged as a significantmarket for fruits and vegetables over the 1990s, withimport demand culminating at $5.8 billion in 2001.China has emerged as a major supplier of horticul-ture to Japan with its market share doubling from16 percent in the 1980s to 33 percent in the 1990s.
While import penetration increased in theUnited States and other regions, EU importdemand grew little in the 1990s. As table 13.3 shows,a salient feature of world import dynamics is thesharp increase in imports of developing countries(6 percent a year) and NAFTA (5 percent a year),and the stagnation of EU imports (1 percent a year)over the 1990s. Focusing on the United States, theimport penetration ratio has increased steadily overtime for fresh produce (figure 13.6). In contrast,extra-EU import demand grew by just 0.2 percent ayear between 1990 and 2001, indicating that thebulk of the small increase in the European Union’shorticultural trade, shown in table 13.3, occurredinternally. This is a major change from the 1980s,when EU imports almost doubled. Closer examina-tion of the data shows that the European Union’simport deceleration is largely driven by Germany,which represents 25 percent of the EU’s fruit andvegetable market. Germany’s imports dropped by
1.4 percent annually over the 1990s, reflecting itsslow pace of economic growth during this decade.5
Income and population composition anddynamics are the major drivers of import demand.Demand for fruits and vegetables—derived from acombination of broad demand dynamics, domesticsupply trends, and trade policies—is relativelyincome elastic. Higher incomes typically induceincreased expenditures on a broader array of freshand processed fruit and vegetable products. Inaddition to income, other important factorsinclude the size, age, ethnic composition of thepopulation, cultural and religious factors, lifestylefactors (including work patterns and urbanization),and consumer education about health matters.
Although not all of these factors can be exam-ined statistically, we attempt here to quantify theimportance of most of the factors that explainthe observed cross-country differences in growthin imports of fresh fruits, fresh vegetables, andprocessed fruits over the 1990s. The analysis, basedon a sample of 49 major importers, uses the stan-dard imperfect substitutes model (Goldstein andKhan 1985), which assumes that imports are notperfect substitutes for domestic goods for the coun-tries under consideration.6
It is well known that economic growth stronglystimulates imports of fruits and vegetables, whereasinflation reduces them (Goldstein and Khan 1985).7
Fruits and Vegetables: Global Trade and Competition in Fresh and Processed Product Markets 243
FIGURE 13.6 Import Penetration Ratios in U.S. Fruit andVegetable Markets, 1970–2001 (percent)
01970 1975 1980 1985 1990 1995 1996 1997 1998 1999 2000 2001
50
45
40
35
30
25
20
15
10
5
Percent
Fresh fruit Fruit juice Fresh vegetables
Source: USDA.
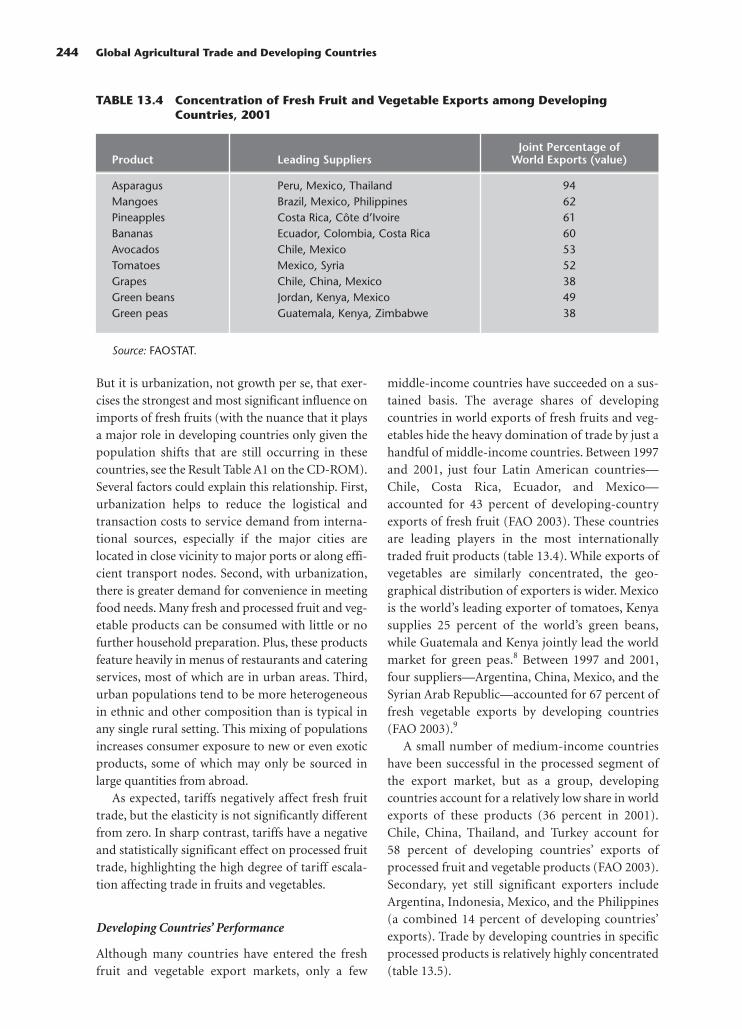
But it is urbanization, not growth per se, that exer-cises the strongest and most significant influence onimports of fresh fruits (with the nuance that it playsa major role in developing countries only given thepopulation shifts that are still occurring in thesecountries, see the Result Table A1 on the CD-ROM).Several factors could explain this relationship. First,urbanization helps to reduce the logistical andtransaction costs to service demand from interna-tional sources, especially if the major cities arelocated in close vicinity to major ports or along effi-cient transport nodes. Second, with urbanization,there is greater demand for convenience in meetingfood needs. Many fresh and processed fruit and veg-etable products can be consumed with little or nofurther household preparation. Plus, these productsfeature heavily in menus of restaurants and cateringservices, most of which are in urban areas. Third,urban populations tend to be more heterogeneousin ethnic and other composition than is typical inany single rural setting. This mixing of populationsincreases consumer exposure to new or even exoticproducts, some of which may only be sourced inlarge quantities from abroad.
As expected, tariffs negatively affect fresh fruittrade, but the elasticity is not significantly differentfrom zero. In sharp contrast, tariffs have a negativeand statistically significant effect on processed fruittrade, highlighting the high degree of tariff escala-tion affecting trade in fruits and vegetables.
Developing Countries’ Performance
Although many countries have entered the freshfruit and vegetable export markets, only a few
middle-income countries have succeeded on a sus-tained basis. The average shares of developingcountries in world exports of fresh fruits and veg-etables hide the heavy domination of trade by just ahandful of middle-income countries. Between 1997and 2001, just four Latin American countries—Chile, Costa Rica, Ecuador, and Mexico—accounted for 43 percent of developing-countryexports of fresh fruit (FAO 2003). These countriesare leading players in the most internationallytraded fruit products (table 13.4). While exports ofvegetables are similarly concentrated, the geo-graphical distribution of exporters is wider. Mexicois the world’s leading exporter of tomatoes, Kenyasupplies 25 percent of the world’s green beans,while Guatemala and Kenya jointly lead the worldmarket for green peas.8 Between 1997 and 2001,four suppliers—Argentina, China, Mexico, and theSyrian Arab Republic—accounted for 67 percent offresh vegetable exports by developing countries(FAO 2003).9
A small number of medium-income countrieshave been successful in the processed segment ofthe export market, but as a group, developingcountries account for a relatively low share in worldexports of these products (36 percent in 2001).Chile, China, Thailand, and Turkey account for58 percent of developing countries’ exports ofprocessed fruit and vegetable products (FAO 2003).Secondary, yet still significant exporters includeArgentina, Indonesia, Mexico, and the Philippines(a combined 14 percent of developing countries’exports). Trade by developing countries in specificprocessed products is relatively highly concentrated(table 13.5).
244 Global Agricultural Trade and Developing Countries
TABLE 13.4 Concentration of Fresh Fruit and Vegetable Exports among DevelopingCountries, 2001
Joint Percentage ofProduct Leading Suppliers World Exports (value)
Asparagus Peru, Mexico, Thailand 94Mangoes Brazil, Mexico, Philippines 62Pineapples Costa Rica, Côte d’Ivoire 61Bananas Ecuador, Colombia, Costa Rica 60Avocados Chile, Mexico 53Tomatoes Mexico, Syria 52Grapes Chile, China, Mexico 38Green beans Jordan, Kenya, Mexico 49Green peas Guatemala, Kenya, Zimbabwe 38
Source: FAOSTAT.

Policy Factors Shaping InternationalTrade Patterns
Domestic Support and Export Subsidies
Government interventions for fruits and vegetablesare significantly lower than in other agriculturalsectors. Consistently, domestic subsidies to produc-ers are relatively low in OECD (Organisation forEconomic Co-operation and Development) coun-tries. Of the major industrialized regions, only theEuropean Union reports an aggregate measure ofsupport related specifically to several fruits andvegetables, while Japan and Canada indicate mod-erate levels of aggregate support for a few com-modities.10 The European Union’s budgetary out-lays for fruits and vegetables totaled $1.55 billion in1999. Those expenditures covered compensationfor surplus withdrawals; production aid to produc-ers of bananas, peas, lentils, beans, pineapples,grapes, and stone fruits; and aid to producers ofcertain products intended for processing (toma-toes, peaches, pears) and to processors who pay
producers at least the minimum price fixed eachyear (for dried figs and certain prunes, for exam-ple). Japan reported price support for starches($179 million for potatoes and sweet potatoes in1998) and direct payments to the vegetable andfruit sectors, but the aggregate measure of supportwas below the de minimis level. Similarly, inCanada, only its support for dry beans was abovethe de minimis levels (WTO 2000a).
Unlike in many other agricultural sectors, theuse of export subsidies is not pervasive in horticul-ture. The export subsidy expenditures notified tothe WTO in 2000 (WTO 2000b) (table 13.6) arewell below those reported for other agriculturalcategories. In only one country, Switzerland, wereexpenditures large relative to horticultural exports,with export subsidies accounting for 21 percent ofthat country’s exports. The European Union’sexport subsidies represented less than 1 percent ofthe value of its total exports. Although it did notsupply information to the WTO, the United Statesindirectly subsidized horticultural exports, albeit
Fruits and Vegetables: Global Trade and Competition in Fresh and Processed Product Markets 245
TABLE 13.5 Concentration of Processed Fruit and Vegetable Exports among DevelopingCountries
Joint Percentage ofProduct Leading Suppliers World Exports (value)
Orange juice concentrated Brazil 91Canned pineapples Indonesia, Philippines, Thailand 74Canned mushrooms China 52Dried mushrooms China 52Dried fruits Chile, China, Thailand 35Tomato paste Chile, China, Turkey 35Apple juice, concentrated Argentina, Chile, Turkey 31
Source: FAO 2003.
TABLE 13.6 Export Subsidy Expenditures for Horticultural Products
Export Total Horticultural Export Expenditures as aExpenditure Exports Percent of Total Horticultural
Country (US$ millions) (US$ millions) Export Value
European Union 40 5,301 0.8Switzerland 14 69 20.6Colombia 13 521 2.4Turkey 11 2,348 0.0
Source: WTO 2000b and subsequent WTO notification updates. Export data from FAOSTAT.

to a very limited degree, through export creditguarantees.
Tariffs and Other Import Restrictions
Regulating market access is the main instrumentused to protect the fruit and vegetable sector. TheEuropean Union, Japan, and the United States use,to varying degrees, similar protection tools: low buthighly dispersed ad valorem tariffs, specific duties,seasonal tariffs, tariff escalation, and preferentialaccess along with tariff-rate quotas. Tariffs for aspecific range of products depend on numerousfactors, including the date of entry (seasonality fac-tor), the degree of processing (escalation phenome-non), and the relationships with exporting coun-tries (preferential agreements and regional andbilateral free trade agreements—FTAs).
Average applied most-favored-nation (MFN)tariffs are very low in all countries of the Quad—Canada, the European Union, Japan, and theUnited States. These tariffs range between 0.9 per-cent for fresh fruits in Canada to 9.2 percent in theEuropean Union for the same product category(table 13.7). The average tariffs, however, do notaccurately reflect the level of actual protectioncaused by the wide dispersion in tariffs and theprevalence of high peaks. Closer examination of thetariff structure highlights the importance of tariffpeaks, especially in the European Union and the
opacity of protection. Tariff peaks in the EuropeanUnion, for example, can reach as high as 128 percentfor fresh fruits and 132 percent for fresh vegetables.
Viewed in closer detail, the protection structureof several OECD countries is opaque. Canada,Japan, and the United States have the lowest tariffs,with, for instance, 85 percent of U.S. tariffs under10 percent. In sharp contrast, the Republic of Koreaand the European Union apply high tariffs on manyproducts. For instance, in the Republic of Korea,59 percent of fresh fruit and vegetable tariff lines liebetween 20 and 50 percent and 37 percent of thelines are over 100 percent. Protection of fruitsremains relatively nontransparent, as well, especiallyin Canada and the European Union (table 13.8).The percentage of fresh fruit tariff lines that are spe-cific, compound, or mixed stands at 31 percent inCanada and 25 percent in the European Union.
Fresh vegetable exports face, in general, higherlevels of protection, reflecting the fact that tariffs ontemperate horticultural commodities are higherthan they are for tropical commodities, dominatedby fruits. The EU tariffs are particularly high formany commodities, as 60 percent of vegetable tarifflines are in the 20–50 percent range and 23 percentof the latter are greater than 50 percent. Thisreflects the large number of items that are subjectto ad valorem tariffs (including seasonal) aug-mented by specific tariffs under the EuropeanUnion’s minimum entry price scheme (box 13.1).
246 Global Agricultural Trade and Developing Countries
TABLE 13.7 Applied MFN Tariffs for Fresh Fruit and Vegetables in the QuadCountries, 1999 and 2001(percent)
Average ad Percentage of Number ofValorem All Rates Lines Standard Total
Country Rate Average Covered Maximum Deviation Lines
European Fruits 7.3 9.2 75.0 127.6 15.4 89Union Vegetables 5.5 6.8 98.0 131.8 10.7 200(1999)
United States Fruits 6.1 4.6 100.0 29.8 7.0 70 (2001) Vegetables 4.1 3.1 98.0 24.3 5.0 189
Japan (2001) Fruits 8.7 8.7 100.0 32.0 6.8 56Vegetables 3.9 3.9 94.0 40.0 5.6 185
Canada Fruits 0.9 0.9 72.0 8.5 2.5 67(2001) Vegetables 1.1 1.1 74.0 16.0 2.7 216
Source: WTO Integrated Data Base at the original tariff line level (6- to 11-digit tariff line depending onthe country).

Fruits and Vegetables: Global Trade and Competition in Fresh and Processed Product Markets 247
TABLE 13.8 Percentage of Tariff Lines on Fresh Fruits and Vegetables in Selected OECDCountries by Tariff Levels
Tariff Levels Canada United States European Union Japan Korea, Rep. of(percent) (2001) (2001) (1999) (2001) (2001)
Fresh fruitsDuty free 60 19 2 7 01–10 9 66 49 64 011–20 0 9 22 20 021–50 0 6 0 9 59Over 50 0 0 1 0 37Specific, compound, 31 1 25 0 5
mixed
Fresh vegetablesDuty free 47 16 0 10 31–10 7 59 11 69 4211–20 1 14 1 11 4721–50 0 1 60 7 1Over 50 0 0 23 0 1Specific, compound, 45 9 5 2 5
mixed
Note: Average applied out-of-quota ad valorem and ad valorem equivalent of non-ad-valorem tariffs forthose equivalent data reported.Source: WTO IDB database.
Current basic rules governing trade in fruits andvegetables were defined as part of the EuropeanUnion’s 1996 Common Market Organization(CMO) reform. One of the most prominent fea-tures of this reform is the “minimum entry price”system. This complex tariffication system appliesto imports of a large number of fruits and veg-etables, including fresh or chilled tomatoes,courgettes, cucumbers, apples, grapes, pears,peaches, plums, apricots, cherries, and citrusfruits. Under the system, the European Union cal-culates an entry price for each of the commodi-ties covered by the program. The tariffs levied foreach item depend on its import price comparedwith the calculated price.11 Fruits and vegetablesimported at prices equal to or greater than theestablished entry price are charged an ad valoremduty only. Commodities valued below the entryprice are charged a specific tariff in addition tothe ad valorem duty. In the latter case, two situa-tions are distinguished: if the import price is morethan 8 percent below the entry price, a large
specific tariff (called the maximum tariff equiva-lent) is levied against the shipment, most likelyprohibiting its importation. If the entry pricestands between 92 and 100 percent of the entryprice, an additional specific duty is levied.
Through this system, applied tariffs are actu-ally linked to the delivered price and the season.For instance, fresh tomatoes imported betweenJune 1 and October 30 and priced 8 percentbelow the reference price of €52.6 per100 kilo-grams face tariffs amounting to 57 percent ofthe import price (Sallyards 2001). The entryprices are generally highest during the EU pro-duction season and lowest during the off-season, and the difference can be very large. Theentry price for courgettes, for instance, increasesfrom a base level of €450 a metric ton to €730 ametric ton in April and May. This system stronglyrestricts an exporter’s ability to increase marketshares in the European Union based on lowerprices and efficiency, especially during theEuropean production season.
BOX 13.1 The European Union’s Entry Price Scheme: HinderingCost-Based Competition in the EU Market

The tariff structures of the European Union,Japan, the Republic of Korea, and the United Statesalso feature a high degree of escalation. All EUprocessed fruit tariffs are above 20 percent, and themajority of processed fruit products entering theEuropean Union face a tariff of greater than 50 per-cent (table 13.9). There is also tariff escalation in theEuropean Union for processed vegetables, with88 percent of these products facing a tariff in therange of 21–50 percent. The European Union’s esca-lating tariffs for tomato and apple-based productsinhibit a potentially large level of trade by nonmem-ber countries. Tariffs facing most processed fruitand vegetable products entering Canada, Japan,Korea, and the United States are below 20 percent.These low tariffs do not exclude the use of highlevels of protection for particular products, as illus-trated by U.S. protection of its own orange juiceindustry (box 13.2).
In most middle-income countries, the tariffstructure is more transparent than in the Quad, butaverage tariff levels are higher (table 13.10), posinga challenge to would-be external suppliers. Averageapplied MFN tariffs in Brazil, India, and Morocco,for example, are far higher than in the high-income
countries analyzed above. Ninety-four percent ofMFN tariff lines for fresh fruits in India arebetween 21 and 50 percent, while all “MFN” fruitsentering Morocco face a tariff of more than 50 per-cent. (In contrast, Indonesia and South Africa havetariff structures similar to those of Japan and theUnited States, with most tariff lines falling betweenzero and 10 percent.) The potential hindrance ofthese high tariffs to developing-country exportsshould not be underestimated. As seen above,South-South trade in fruits and vegetables is grow-ing rapidly and now represents about one-fifth ofdeveloping countries’ exports.
Preferential Market Access and Magnitudeof Preference
The protection structure just described does notapply equally to all exporting countries. Manyhigh-income countries maintain a complex systemof preferential access (that is, better-than-MFNaccess) designed to provide privileged partnerswith favorable entry without undermining theprotection of domestic producers. The productcoverage of preferential access schemes is wide, but
248 Global Agricultural Trade and Developing Countries
TABLE 13.9 Percentage of Tariff Lines on Processed Fruits and Vegetables in SelectedOECD Countries by Tariff Levels
Tariff Levels Canada United States European Union Japan Korea, Rep. of(percent) (2001) (2001) (1999) (2001) (2001)
Processed fruitsDuty free 35 1 0 7 11–10 43 14 0 62 211–20 20 43 0 24 4421–50 0 34 47 4 40Over 50 0 0 53 4 2Specific, compound, 2 7 0 0 10
mixed lines
Processed vegetablesDuty free 22 3 0 8 31–10 31 39 6 65 611–20 40 50 0 24 7621–50 0 6 88 3 5Over 50 0 0 3 0 3Specific, compound, 7 2 3 0 8
mixed lines
Note: Average applied out-of-quota ad valorem and ad valorem equivalents of non-ad-valorem tariffs forthose equivalent data reported.Source: WTO IDB database.

entry is often limited by quotas for “sensitive prod-ucts” such as those put in special protocols (such asbananas).
The major EU preferential access schemes rele-vant to trade in fruits and vegetables include theEverything but Arms (EBA) initiative that benefitsthe 48 UN-defined least-developed countries(LDCs); the EU-ACP Lomé Conventions, underwhich the European Union grants unilateral prefer-ential access to 75 African, Caribbean, and Pacific(ACP) countries, bilateral agreements such as theEuro-Med Agreements between the EuropeanUnion and many Mediterranean countries, and theEU-South Africa free trade area; and the general-ized system of preferences (GSP).
A large number of countries also enjoy preferen-tial access to the United States through formalregional, bilateral, and preferential trade agree-ments. These include NAFTA, the African GrowthOpportunity Act (AGOA), the Caribbean BasinEconomic Recovery Act (CBERA), the Andean
Trade Preference Act (ATPA), and free trade agree-ments with Israel and Chile. Since NAFTA wassigned, tropical fruits shipped from Mexico (man-goes, guavas, avocados, and papayas) have beensubject to steadily reduced tariffs. Since January2003 they have entered the U.S. market free of duty.
While these different agreements are not alwaysdirectly comparable, it is clear that they providevaried degrees of preference to the suppliersinvolved. Figure 13.7, adapted from Stevens andKennan (2000), highlights the hierarchy of prefer-ences within the European Union’s fruit and veg-etable import regime as of 2003. The major changessince 2000 include the promulgation of the EBAinitiative and the multiplication of bilateral agree-ments, which erode the preferences of those on topof the pyramid. The ranking of preferencesdepends on the difference between preferential ver-sus MFN tariffs (that is, the margin of preference),the breadth of product coverage, the extent ofquota limitations, and the degree of certainty of
Fruits and Vegetables: Global Trade and Competition in Fresh and Processed Product Markets 249
The world market for orange juice is basically aduopolistic market structure, with only two play-ers, the United States (mainly Florida) and Brazil,supplying roughly 85 percent of the world mar-ket. Over 95 percent of Brazil’s production isexported, whereas more than 95 percent of U.S.orange juice is consumed domestically. Of theU.S. imports of concentrated orange juice, some90 percent comes from Brazil. Imported orangejuice is mixed with U.S. juice to improve its colorand make up for seasonal supply shortfall. Thistrade pattern reflects Brazil’s production costadvantages, which in turn mirror lower laborcosts in Brazil, reinforced in recent years by thedevaluation of the real. The United States levies atariff of 7.85 cents per liter on Brazilian orangejuice. In addition, an antidumping order remainsin effect, with dumping duties ranging from2 percent to 27 percent on imports of theBrazilian product.
Furthermore, Brazilian exporters pay a “Floridaequalizing excise tax” on frozen orange juice con-centrate, from which domestic producers inArizona, California, and Texas whose juice is alsoblended with Florida orange juice are exempt.The proceeds of the tax are allocated by statuteto the exclusive promotion of Florida-growncitrus products. According to one estimate, the
combined tax and duty accounts for nearly50 percent of the cost of a ton of Brazilian con-centrate. This discrimination between importedand domestic products has prompted Brazil toinitiate a dispute settlement process at the WTO.In March 2002 the government of Brazilrequested bilateral consultations under WTO aus-pices with the United States regarding the“equalizing excise tax.” Brazil argued that theincidence of the tax on imported processed citrusproducts and not on domestic products consti-tutes a de facto violation of most-favored-nationand national treatment provisions of GATT (Gen-eral Agreement on Tariffs and Trade) (Articles II:1(a), III.1 and III:2, GATT 1994).
Interestingly, the private sector has alreadytaken pragmatic actions to deal with theseproblems, through joint investments and jointproduction. In an increasingly common tariff-jumping tactic, the Brazilian producers in theearly 1990s began to invest directly in the Floridaindustry. It is estimated that foreign—mainlyBrazilian—companies own as much as 40 per-cent of the Florida processing industry. The U.S.presence in Brazil’s citrus industry started in the1960s, when winter freezes prompted U.S.growers to seek out Brazil for planting.
Source: Thunder Lake Management 2002.
BOX 13.2 The U.S.-Brazilian Trade Dispute over Orange Juice
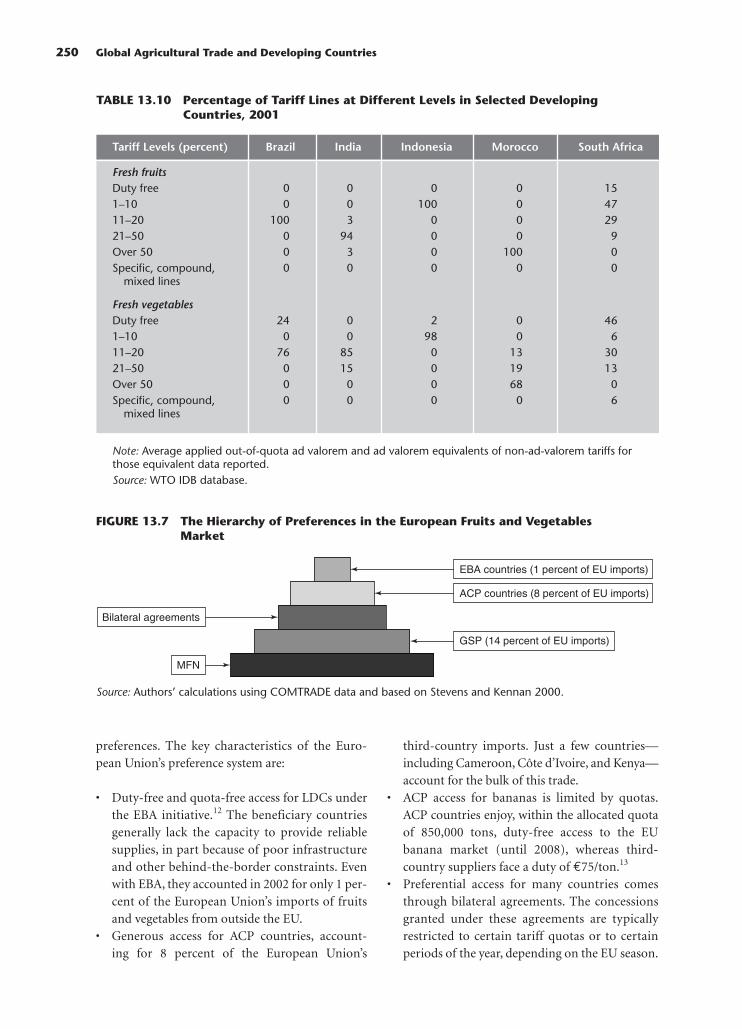
preferences. The key characteristics of the Euro-pean Union’s preference system are:
• Duty-free and quota-free access for LDCs underthe EBA initiative.12 The beneficiary countriesgenerally lack the capacity to provide reliablesupplies, in part because of poor infrastructureand other behind-the-border constraints. Evenwith EBA, they accounted in 2002 for only 1 per-cent of the European Union’s imports of fruitsand vegetables from outside the EU.
• Generous access for ACP countries, account-ing for 8 percent of the European Union’s
third-country imports. Just a few countries—including Cameroon, Côte d’Ivoire, and Kenya—account for the bulk of this trade.
• ACP access for bananas is limited by quotas.ACP countries enjoy, within the allocated quotaof 850,000 tons, duty-free access to the EUbanana market (until 2008), whereas third-country suppliers face a duty of €75/ton.13
• Preferential access for many countries comesthrough bilateral agreements. The concessionsgranted under these agreements are typicallyrestricted to certain tariff quotas or to certainperiods of the year, depending on the EU season.
250 Global Agricultural Trade and Developing Countries
TABLE 13.10 Percentage of Tariff Lines at Different Levels in Selected DevelopingCountries, 2001
Tariff Levels (percent) Brazil India Indonesia Morocco South Africa
Fresh fruitsDuty free 0 0 0 0 151–10 0 0 100 0 4711–20 100 3 0 0 2921–50 0 94 0 0 9Over 50 0 3 0 100 0Specific, compound, 0 0 0 0 0
mixed lines
Fresh vegetablesDuty free 24 0 2 0 461–10 0 0 98 0 611–20 76 85 0 13 3021–50 0 15 0 19 13Over 50 0 0 0 68 0Specific, compound, 0 0 0 0 6
mixed lines
Note: Average applied out-of-quota ad valorem and ad valorem equivalents of non-ad-valorem tariffs forthose equivalent data reported.Source: WTO IDB database.
FIGURE 13.7 The Hierarchy of Preferences in the European Fruits and VegetablesMarket
MFN
GSP (14 percent of EU imports)
Bilateral agreements
ACP countries (8 percent of EU imports)
EBA countries (1 percent of EU imports)
Source: Authors’ calculations using COMTRADE data and based on Stevens and Kennan 2000.

Tensions between opening markets for privi-leged partners and protecting domestic producershave led to a widespread use of tariff rate quotas(TRQs) in fruit and vegetable trade. In 2000 devel-oped countries applied 355 TRQ schemes toimported fruits and vegetables, compared with 56for tropical beverages and processed agriculturalproducts (Jabati 2003). Quotas are typically set atlow levels with low in-quota tariffs and prohibitiveover-the-quota tariffs. A good example is that ofwinter seedless grapes, a product exported by someSouthern Hemisphere suppliers, including SouthAfrica and Namibia. Namibia may export only900 tons per year to the European Union fromNovember to end of January (Jabati 2003). Anyover-the-quota export is subject to an import tariffof 16.4 percent. The tariff and period restrictionsclearly constitute a constraint for Namibia if itwants to increase its exports.
Analysis of the value of ACP and AGOA prefer-ences show heterogeneous situations among ACPcountries, while South Africa stands out as the onlycountry taking significant advantage of the AGOApreference. It has been argued that preferentialtreatment has contributed to the successful pene-tration of some developing countries into the EU
market (Stevens and Kennan 2000). We examinehere the effectiveness of ACP and AGOA prefer-ences for fruits and vegetables exported to theEuropean Union and United States, respectively.These indicators are preferred over changes inMFN tariffs, which do not capture the variety ofspecific trade regimes in the European Union andthe United States that are relevant for many devel-oping countries.
The value of an ACP preference can be definedas the product of the value of exports for whichpreferences have been requested and the preferen-tial margin (figure 13.8). The value of the ACP pref-erence in fruits and vegetables represented 12 per-cent of ACP country exports, with a great deal ofvariation around the average.14 The ACP “rent”stood at less than 5 percent for Ethiopia, Madagas-car, and Namibia, but between 28 and 42 percentfor major banana producers such as Cameroon, theCaribbean islands, and Côte d’Ivoire.
In terms of scope, about 82 percent of ACP fruitand vegetable exports to the European Union areeligible for preference. Use of this preference isquite high, with an average 75 percent of eligibleexports requesting preference. Use rates vary widelyacross ACP countries, however.
Fruits and Vegetables: Global Trade and Competition in Fresh and Processed Product Markets 251
Source: World Bank staff calculations based on the EU Commission Database.
FIGURE 13.8 Value of Fruit and Vegetable Preference for Major ACP Exporters, 2002
0.0 5.0 10.0 15.0 20.0
Value of ACP preference requested (percent of exports)
25.0 30.0 35.0 40.0 45.0
Senegal
Côte d'Ivoire
Ghana
Cameroon
Ethiopia
Kenya
Madagascar
Zambia
Zimbabwe
Namibia
Swaziland
Belize
Dominican Rep.
Dominica
Jamaica
St. Lucia
St. Vincent

In sharp contrast with the ACP scheme, the useof the AGOA preference to export fruits and vegeta-bles to the United States is not yet a widespreadpractice in Africa, since only 14 of 38 AGOA coun-tries exported fruits and vegetables to the UnitedStates in 2002. Among those having done so, how-ever, the use of the AGOA preference was high,averaging 73 percent (see annex table A3). The verysmall number of countries that have exported fruitsand vegetables under AGOA is associated with theconstrained logistics on African–U.S. trade inperishable products, the very limited degree of U.S.private investment in Africa in this field, andstringent U.S. phytosanitary requirements.
Not surprisingly, countries that have moreadvanced logistical systems and stronger inter-national marketing ties (for example, SouthAfrica) are better placed to benefit from AGOA.In fact, South Africa is the only AGOA countryfor which the preference “rent” represents a signifi-cant share of export values (74 percent) (fig-ure 13.9). Few other African countries have a com-parative advantage in servicing the U.S. market and,given comparative freight costs and availability, findthe European market a more attractive outlet. Weanalyze these issues further in the next section.
As more and more countries are enjoying better-than-MFN access to the EU market, preferences areeroding and competition is stiffer—as illustrated bythe experience of large middle-income exporters(figure 13.10). Morocco, South Africa, and Turkeyare large exporters of fruits and vegetables that enterthe European Union under bilateral agreementswith limitations on some products.15 Morocco,among the first countries to sign preferential agree-ments with the European Union in the late 1960s,has lost ground in the EU market to Turkey sinceTurkey’s free-trade agreement with the EuropeanUnion was signed in 1998. South Africa recentlyunseated Turkey in the EU market and is now thelargest third-country supplier of fruits and vegeta-bles to the European Union (with a 31 percentshare). Turkey holds a slightly lower share (29 per-cent), while Morocco lags far behind (22 percent,down from 37 percent in 1980). In several products(citrus fruit, tomato products, dried fruit, and fruitjuice), these suppliers have competed directly.
Determinants of Success in Fruitand Vegetable Export Markets
Many developing countries have sought to takeadvantage of emerging international markets for
252 Global Agricultural Trade and Developing Countries
FIGURE 13.9 Value of Fruit and Vegetable Preference under AGOA
0.0 10.0 20.0 30.0
Value of AGOA preference requested (percent of exports)
40.0 50.0 60.0 70.0 80.0
Côte d'Ivoire
Ethiopia
Ghana
Kenya
Madagascar
Malawi
Mozambique
Nigeria
Sierra Leone
South Africa
Swaziland
Tanzania
Uganda
Zambia
Source: World Bank staff calculations based on USITC Database.

fresh and processed fruit and vegetable products.Yet, as noted above, relatively few have achieveddominance in a range of such products. In Sub-Saharan Africa several dozen countries haveparticipated in this trade, yet just three—Côted’Ivoire, Kenya, South Africa—accounted fornearly 90 percent of the region’s trade in recentdecades. Only a few other countries in the regionhave been able to sustain growth in their horticul-tural trade over time; none has emerged as a majorplayer in the international market.
Success Factors
To succeed in exporting fruits and vegetables, acountry must have important assets that provide aninitial comparative advantage. Among those assetsare favorable agroclimatic conditions and ampleand accessible land and water resources; a physicallocation on the sea or close to a major market;ample and relatively inexpensive labor; and a classof entrepreneurs with commercial experience.Many countries may possess some or even most ofthese assets. But translating them into a competi-tive horticultural industry that maintains or im-proves its competitiveness over time requires adistinctive set of investments and institutionalstructures, a range of facilitative government poli-cies, and, usually, a bit of luck (Jaffee 2003; Gabre-Madhin and Minot 2003; FAO 2003; Huang 2004).
Jaffee (1993) examines the ingredients commonto the initial growth and subsequent maturation of
some of the developing world’s leading fresh andprocessed fruit and vegetable success stories—among them Brazil, Chile, Kenya, Mexico, andTaiwan (China). In each case, the initial take-offoccurred during a period of stable macroeconomicconditions and the presence of a favorable invest-ment climate. Important initial catalysts for exportgrowth included sudden shortfalls in major over-seas markets, new foreign direct investment orstrategic partnerships, and improvements in inter-national logistics capacity. International technicaland marketing partnerships provided a vehicle forthe transfer of technology, for new market penetra-tion, and for creating an identity for the productsfrom the exporting country.
Many countries have experienced short-termspurts in horticultural exports; few have been ableto consolidate their early gains. Those that havedone so invested in research and adopted interna-tional technologies, expanded and upgraded logis-tical facilities, strengthened vertical supply chains,developed industry organizations for collectiveaction, and built credible systems for quality assur-ance and food safety management. Industry expan-sion induced the development of associated indus-tries, such as packaging, equipment supply, andtechnical consulting, which in turn contributed tothe underlying competitiveness of the industries.Further investments were made in the industries’underlying assets, for example, through irriga-tion development and worker and management
Fruits and Vegetables: Global Trade and Competition in Fresh and Processed Product Markets 253
FIGURE 13.10 EU–Third Country Imports and the Share of Key Exporters
0
15
10
5
20
25
30
35
40
1980 1982 1984 1986 1988 1990 19941992 1996 1998 2000 2002
Percent
Morocco South Africa Turkey
Source: COMTRADE.

training. Synergies have generally developedbetween export horticulture and complementaryindustries such as domestic catering and tourism.
With certain historical exceptions, in most of thelong-standing industries the private sector domi-nates the commercial dimensions of the business,while governments play a substantial and multidi-mensional facilitative role. In the early stages ofindustry development, the public sector has beencritical in improving transportation and port/airport infrastructure, investing in research and farmadvisory services, facilitating access by investors andfarmers to suitable land, helping to transfer tech-nologies and skills, and advancing the broad arrayof policies that make for a conducive investmentclimate (box 13.3). Over time, other important func-tions for government have emerged, notably sanitaryand phytosanitary control, promotion of competi-
tion within the industry and in critical support serv-ices, negotiation of favorable international marketaccess, and resolution of trade disputes.
Explaining Intercountry Differences in ExportPerformances
Focusing on the factors identified in the literature asinfluencing export performance, this sectionattempts to quantify their importance in determin-ing the value of fruit and vegetable exports across asample of 45 developing countries. The theoreticalanchor of the empirical investigation is Reddingand Venables’ geographic and trade model (Reddingand Venables 2002).16
The variables assumed to have a significantimpact on the value of fresh and processed fruit andvegetable exports are grouped into supply-capacity
254 Global Agricultural Trade and Developing Countries
Once the leaders of Peru’s asparagus industry andgovernment specialists realized that it was in thebest interest of the country, they worked togetherto bring national standards in line with interna-tional norms. The industry—and Peru—havegreatly benefited as a result. Over the pastdecade, Peru has quickly risen to become one ofthe world’s largest exporters of asparagus. In2002 earnings reached $187 million, represent-ing nearly 25 percent of Peru’s total agriculturalexports. Peru is able to produce quality asparagusyear-round, yet because of high transportationcosts, its exporters are unable to match priceswith inexpensive asparagus from some othercountries. Nonetheless, they have continued toincrease exports and gain market share by grow-ing asparagus of consistently higher quality thatcan be internationally certified. By meeting inter-national standards, Peruvian exporters haveincreased production and worker efficiency,gained access to industrialized country markets,built customer loyalty, and drastically reduced theindustry’s risk of trade disruptions caused by poorquality, food safety hazards, and plant disease.
In 1997 Spanish health authorities assertedthat two cases of botulism had been caused byconsumption of canned Peruvian asparagus.Despite assurances from the Peruvian govern-ment and companies, press coverage of thebotulism scare left an unfavorable impressionamong consumers in European markets, causingsales to slump in Peru’s leading market. The
incident helped motivate the industry and gov-ernment to take action, by reinforcing the factthat one careless exporter could disrupt markets.
Beginning in 1998, officials of the PeruvianCommission for Export Promotion (PROMPEX)convinced the asparagus industry to implementthe Codex code of practice on food hygiene, notbecause it was the easiest but because it was themost appropriate. PROMPEX specialists workedclosely with industry leaders and productionmanagers to ensure proper implementation ofgood hygiene standards. The industry soon sawimproved production methods, greater workerefficiency, and better product quality.
Thus, when the national fresh asparagusnorms were published in early 2001, becausethe industry was already familiar with the con-cept of national standards, producers quicklycomplied with little argument. The first nationalnorms—for fresh asparagus—established a qual-ity and performance baseline for the industrythat allowed many to generate the skills andexperience needed to voluntarily certify undermore stringent international standards, includ-ing HACCP (hazard analysis and critical controlpoint), traceability systems, and Good Agricul-tural Practice (GAP) certification. Many largeexporters have reached the level where theycan now be certified under the even stricterEUREPGAP protocol.
Source: Tim O’Brien, Interamerican Institutefor Cooperation in Agriculture.
BOX 13.3 Peruvian Asparagus Exports—A Standard Success Story?
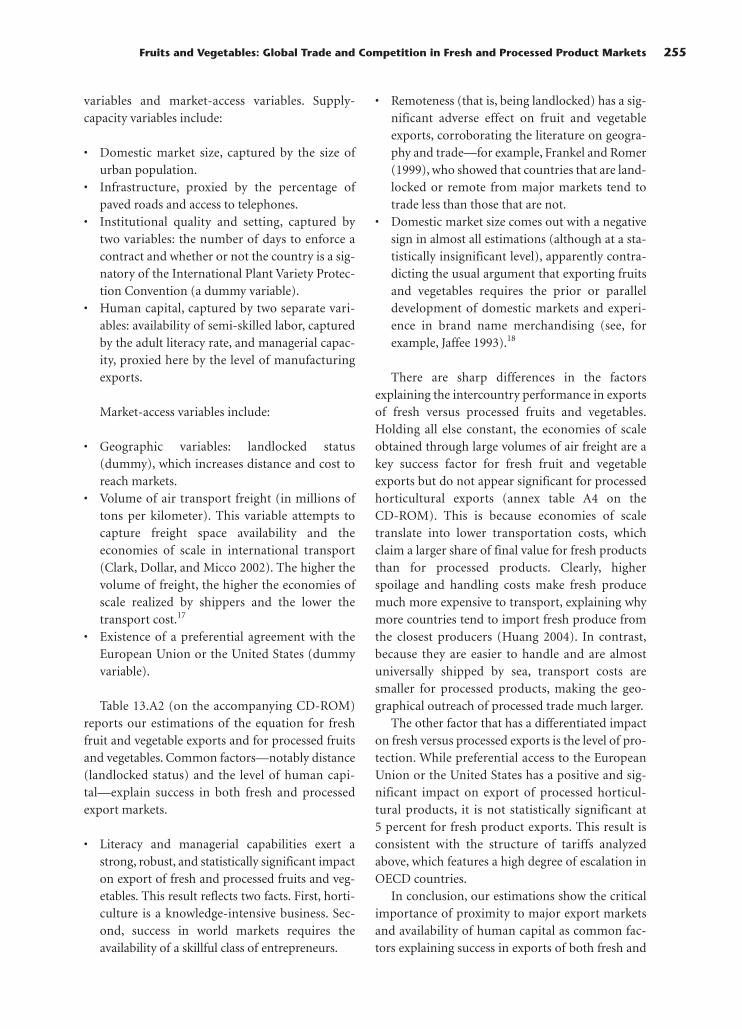
variables and market-access variables. Supply-capacity variables include:
• Domestic market size, captured by the size ofurban population.
• Infrastructure, proxied by the percentage ofpaved roads and access to telephones.
• Institutional quality and setting, captured bytwo variables: the number of days to enforce acontract and whether or not the country is a sig-natory of the International Plant Variety Protec-tion Convention (a dummy variable).
• Human capital, captured by two separate vari-ables: availability of semi-skilled labor, capturedby the adult literacy rate, and managerial capac-ity, proxied here by the level of manufacturingexports.
Market-access variables include:
• Geographic variables: landlocked status(dummy), which increases distance and cost toreach markets.
• Volume of air transport freight (in millions oftons per kilometer). This variable attempts tocapture freight space availability and theeconomies of scale in international transport(Clark, Dollar, and Micco 2002). The higher thevolume of freight, the higher the economies ofscale realized by shippers and the lower thetransport cost.17
• Existence of a preferential agreement with theEuropean Union or the United States (dummyvariable).
Table 13.A2 (on the accompanying CD-ROM)reports our estimations of the equation for freshfruit and vegetable exports and for processed fruitsand vegetables. Common factors—notably distance(landlocked status) and the level of human capi-tal—explain success in both fresh and processedexport markets.
• Literacy and managerial capabilities exert astrong, robust, and statistically significant impacton export of fresh and processed fruits and veg-etables. This result reflects two facts. First, horti-culture is a knowledge-intensive business. Sec-ond, success in world markets requires theavailability of a skillful class of entrepreneurs.
• Remoteness (that is, being landlocked) has a sig-nificant adverse effect on fruit and vegetableexports, corroborating the literature on geogra-phy and trade—for example, Frankel and Romer(1999), who showed that countries that are land-locked or remote from major markets tend totrade less than those that are not.
• Domestic market size comes out with a negativesign in almost all estimations (although at a sta-tistically insignificant level), apparently contra-dicting the usual argument that exporting fruitsand vegetables requires the prior or paralleldevelopment of domestic markets and experi-ence in brand name merchandising (see, forexample, Jaffee 1993).18
There are sharp differences in the factorsexplaining the intercountry performance in exportsof fresh versus processed fruits and vegetables.Holding all else constant, the economies of scaleobtained through large volumes of air freight are akey success factor for fresh fruit and vegetableexports but do not appear significant for processedhorticultural exports (annex table A4 on theCD-ROM). This is because economies of scaletranslate into lower transportation costs, whichclaim a larger share of final value for fresh productsthan for processed products. Clearly, higherspoilage and handling costs make fresh producemuch more expensive to transport, explaining whymore countries tend to import fresh produce fromthe closest producers (Huang 2004). In contrast,because they are easier to handle and are almostuniversally shipped by sea, transport costs aresmaller for processed products, making the geo-graphical outreach of processed trade much larger.
The other factor that has a differentiated impacton fresh versus processed exports is the level of pro-tection. While preferential access to the EuropeanUnion or the United States has a positive and sig-nificant impact on export of processed horticul-tural products, it is not statistically significant at5 percent for fresh product exports. This result isconsistent with the structure of tariffs analyzedabove, which features a high degree of escalation inOECD countries.
In conclusion, our estimations show the criticalimportance of proximity to major export marketsand availability of human capital as common fac-tors explaining success in exports of both fresh and
Fruits and Vegetables: Global Trade and Competition in Fresh and Processed Product Markets 255

processed horticultural products. They also indi-cate that countries wishing to boost exports of freshproducts should invest in high-quality logistics,whereas those seeking success in processed marketsneed to develop or tie in with leading productbrands and circumvent tariff escalation throughpreferential agreements with major tradingpartners or within the framework of multilateralnegotiations.
Conclusion
This chapter has highlighted the major global,regional, and product-specific trends in fruit andvegetable products trade and examined majorstructural and policy factors that have affected thistrade over the past two decades. Growth in worldimports was 2–3 percent a year in the 1990s, repre-senting a deceleration in the rate of growth fromthe 1980s. This slower growth in world trade in the1990s was strongly affected by the European Union,which experienced relatively low growth in popula-tion and income during the decade and had manymature and saturated product markets. Adverseprice movements for fresh and processed productsfrom the mid-1990s onward also contributed sub-stantially to the overall deceleration in the growthof trade values. Robust growth in trade has contin-ued among NAFTA countries, for sales to high-income Asian countries, and between developingcountries.
For developing countries, fresh and processedfruits and vegetables is now one of the most impor-tant categories for agro-food trade, accounting forabout 22 percent of their exports in 2000–01. Thisis far larger than their current level of trade in manytraditional commodities. Still, although manydeveloping-country suppliers have entered thisfield, relatively few countries have achieved sus-tained success at a high level—testimony that theindustry is highly competitive and rapidly chang-ing, and that it requires sustained investments ininfrastructure, human capital, technology, andgood governance.
Unlike the situation in many other agriculturalsectors, production and export subsidies are notcommon in horticulture. Instead, domestic fruitand vegetable producers are protected through reg-ulation of market access. The European Union,Japan, and the United States use, to varying
degrees, complex protection tools—among themhighly dispersed ad valorem tariffs, specific duties,seasonal tariffs, tariff escalation, and preferentialaccess along with tariff-rate quotas. A complex sys-tem of preferential access in many rich countriesprovides privileged partners with favorable entrywithout undermining protection of domestic pro-ducers. The product coverage of preferential accessschemes is wide but quotas for “sensitive products”often limit entry. Tariff escalation for processedfruit and vegetable products is widespread,although its extent varies significantly betweenregions.
Because horticultural sectors throughout theworld have traditionally seen a low level of directgovernment interventions, changes in domesticsupport cannot affect the sector broadly or signifi-cantly. Reductions in tariffs and other importrestrictions, however, are critical in determining theimpact of trade agreements and policies on worldhorticultural trade. Further tariff liberalizationefforts would need to reduce tariff peaks, especiallyin the European Union and the Republic of Korea.Past trends suggest that the main beneficiaries fromsuch reforms will be a limited number of middle-income countries that have developed strong pro-duction, postharvest processing, logistical market-ing, and sanitary and phytosanitary managementsystems over the years and that continue to attractnew investment. With only a few exceptions, low-income countries still face enormous supply-sidechallenges in taking advantage of existing andfuture international market opportunities.
Notes
1. More detailed tables on trade flows and tariffs are pre-sented on the attached CD-ROM.
2. “Statistics on Foreign Trade of Vegetables.” Vegetable Sup-ply Stabilization Fund. Tokyo. October 2002.
3. This reflects the heavy influence of Spain, which is theglobal leader in fresh fruit exports (mainly oranges and clemen-tines). Italy is also a significant exporter of grapes, apples, andpeaches.
4. Bananas accounted for more than 80 percent of the freshfruit imported by the European Union from these countries(Huang 2004).
5. Between 1993 and 2003, gross domestic product growth inGermany averaged 1.4 percent, the lowest among EU memberstates.
6. See box A1 in annex to this chapter in the CD-ROM.7. Lacking a better alternative, food prices are considered
here as a proxy for the prices of fruits and vegetables. The maincaveat associated with this is that the range of goods covered in
256 Global Agricultural Trade and Developing Countries

the food-price index is wider than what a proper (and exoge-nous) fruits and vegetables import price index would cover.
8. Mexico remains the world’s top exporter of many smallervegetable products—among them asparagus, eggplant, andonions.
9. The bulk of Syria’s trade is with other Middle Easterncountries; Argentina’s is targeted primarily to other LatinAmerican countries.
10. The aggregate measure of support was defined in theUruguay Round Agreement on Agriculture as an aggregate sub-sidy measure, designed to quantify and compare countries’annual levels of domestic support. It aggregates the effects of alltrade-distorting policies (direct subsidies plus implicit subsidiesfrom border measures) into a single measure of support.
11. An importer can choose one of the three following meth-ods to calculate entry price: the standard import value (SIV),calculated daily by product and by origin and published in EU’sOfficial Journal; the f.o.b. price of the product in the country oforigin; the effective resale value of the shipment concerned.
12. Bananas are the only exception in the fruit and vegetablecategory. For this product, duty-free access is phased in between2002 and 2006 by a 20 percent yearly tariff reduction. This isunlikely to have a significant impact in the short run, however,as all LDCs producing bananas of export quality belong to theACP group, which enjoys duty-free access.
13. This preferential access has allowed countries likeCameroon, Côte d’Ivoire, and Dominican Republic to competewith lower-cost Latin American suppliers (Costa Rica, Ecuador).
14. For more details regarding the definitions and estima-tions of these indicators, see chapter 4 of this volume.
15. A recent study has identified three categories of productsthat receive different treatments under the European Union andMediterranean countries trade agreements: first, the productsfor which the preferential margin (tariff difference with MFN) isgranted without quantitative restriction but with seasonalrestrictions (such as tomatoes); second, the products for whichthe tariff reduction applies solely if the entry price is higher thana reference price in EU; and a third group for which the impactof tariff reductions are severely limited by quota restrictions(such as bananas and olives). Chahed and Drogué (2002).
16. The empirical model and its derivation from the Reddingand Venables’ theoretical model is described in box A2 of theannex to this chapter in the attached CD-ROM.
17. Lack of data prevented us from using the volume of mar-itime freight.
18. As noted earlier, a large and rapidly growing urban pop-ulation (as in China and India) can absorb very large quantitiesof fruit and vegetables and lead entrepreneurs to focus on serv-icing the domestic market.
References
Chahed, Y., and S. Drogué. 2002. “Echanges agricoles et AccordsEuromed, l’érosion des préférences en question.” Depart-ment of Public Economics, INRA-INAPG, Paris-Grignon.
Clark, X., D. Dollar, and A. Micco. 2002. “Port Efficiency, Mar-itime Transport Costs and Bilateral Trade,” NBER workingpaper 10353. National Bureau of Economic Research, Inc,Cambridge, MA.
FAO (United Nations Food and Agriculture Organization).2003. “The Market for Nontraditional Agricultural Exports.”Commodity and Trade Division. Rome.
FAOSTAT 2003. FAO Statistical Databases. Accessible athttp://apps.fao.org/default.jsp.
Frankel, J., and D. Romer. 1999. “Does Trade Cause Growth?”American Economic Review 89(3), June, 379–399.
Gabre-Madhin, E., and N. Minot. 2003. “Successes and Chal-lenges for Promoting African Horticulture Exports.” WorldBank, Washington, D.C. August.
Goldstein, M., and M. S. Khan. 1985. “Income and Price Effectsin Foreign Trade.” In R. W. Jones and P. B. Kenen, eds., Hand-book of International Economics, vol. 2. New York: ElsevierScience Publications.
Huang, S. W., ed. 2004. “Global Trade Patterns in Fruits and Veg-etables.” Agriculture and Trade Report WRS-04-06. U.S.Department of Agriculture, Washington, D.C.
Jabati, M.C. 2003. “Market Access for Developing Countries ofAfrica: The Reality.” AGSF Occasional Paper No. 1. UnitedNations Food and Agriculture Organization. Rome.
Jaffee, S. 1993. “Exporting High-Value Food Commodity: Suc-cess Stories From Developing Countries.” World Bank Dis-cussion Paper 198. Washington, D.C.
———. 2003. “From Challenge to Opportunity: TransformingKenya’s Fresh Vegetable Trade in the Context of EmergingFood Safety and Other Standards in Europe.” Agricultureand Rural Development Discussion Paper 1. World Bank,Washington, D.C.
Redding, Stephen, and A. Venables. 2002. “The Economics ofIsolation and Distance.” Nordic Journal of Political Economy28, Conference Volume, no. 2, pp. 93–108.
Sallyards, M. 2001. “European Union Agricultural Situation: EUFruits and Vegetables Regime.” GAIN Report E21058. U.S.Department of Agriculture, Washington, D.C.
Stevens, C., and Jane Kennan. 2000. “Will Africa’s Participationin Horticulture Chains Survive Liberalization?” WorkingPaper 106. University of Sussex, Institute for DevelopmentStudies, Brighton, U.K.
Thunder Lake Management, Inc. 2002. “Florida-Brazil CitrusCase.” Trade Policy Monitor. April. Online: http://www.thunderlake.com/brazil_oj.html.
Vegetable Supply Stabilization Fund. 2002. “Statistics on ForeignTrade of Vegetables.” Tokyo.
WTO (World Trade Organization). 2000a. “Domestic Support:Background Paper by the Secretariat.” G/AG/NG/8. May 26.
———. 2000b. “Export Subsidies: Background Paper by theSecretariat.” G/AF/NG/S/1. April.
Fruits and Vegetables: Global Trade and Competition in Fresh and Processed Product Markets 257


rable to cotton’s since the early 1970s. Between1960 and 1972, the polyester price indicatordeclined from $12 to $2.50 per kilogram, mainly areflection of the technological improvements (andconsequent cost reductions) that took place in thechemical fiber industry. After reaching parity withcotton prices in 1972, the ratio of polyester to cot-ton prices has increased at an average rate of 1 per-cent per year, implying that while cotton andpolyester are priced at similar levels, polyester hasmade small pricing gains (see figure 14.1).
The Global Cotton Balance
Cotton is produced in many countries, but theNorthern Hemisphere accounts for 90 percent ofglobal output. More than two-thirds of the world’scotton is produced by developing countries.Between 1960 and 2001, global cotton outputdoubled—from 10.2 million to 20 million tons.Most of this growth came from China and India,which tripled and doubled their production,respectively, during this 40 year period. Othercountries that significantly increased their shareof cotton production were Turkey, Greece, andPakistan. Some new entrants also contributed.Australia, which produced only 2,000 tons of cotton
Cotton—by far the most common natural fiber ofthe 19th and 20th centuries—has been used as araw material for clothing for at least 5,000 years. Itsuse expanded significantly after 1793, when theinvention of the cotton gin introduced mechanicalseparation of lint from seed. The industrial revolu-tion, which reduced the cost of producing textiles,accelerated cotton’s progress.1
Cotton’s most important competitors are naturaland synthetic man-made fibers such as rayon andpolyester.2 Although large-scale commercial pro-duction of man-made fibers did not begin until afterWorld War II, experimentation was taking place asearly as the late 1800s. In 1925, rayon, a natural man-made fiber produced from cellulose, accounted for1.6 percent of the world’s total fiber consumption.Twenty years later, this share had increased to11.8 percent. The share of all man-made fibers intotal fiber consumption reached 22 percent in 1960and now stands at about 57 percent.
As production of man-made fibers expanded,cotton’s share fell (figure 14.1). Between 1960 and2002, man-made fiber consumption grew at anannual rate of 4.7 percent, compared to just1.8 percent for cotton.
Synthetic (noncellulose) man-made fibers suchas polyester and nylon have traded at prices compa-
259
14
COTTON: MARKETSETTING, TR ADE
POLICIES, AND ISSUES
John Baffes

260 Global Agricultural Trade and Developing Countries
in 1960, averaged 650,000 tons a year during thelate 1990s. Francophone Africa, which producedless than 100,000 tons in the 1960s, now producesalmost 1 million tons. The two dominant producersduring the 1960s, the United States and the CentralAsian republics of the Soviet Union, have main-tained their output levels at about 3.5 million and1.5 million tons, respectively, thereby halving theirshares. Several Central American countries thatused to produce almost 250,000 tons of cottonannually now produce almost none. The share ofEast African cotton producers, too, has declinedconsiderably during this period.
The two largest cotton producers, China and theUnited States, each account for approximately20 percent of world output, followed by India(12 percent), Pakistan (8 percent), and Uzbekistan(5 percent). Other significant cotton producers arethe countries of Francophone Africa, Turkey,Brazil, Australia, and Greece, which account for acombined 18 percent of global output.
The consumption pattern of cotton is primarilydetermined by the size of the textile industries ofthe dominant cotton consumers. China, the leadingtextile producer, absorbed more than a quarter ofglobal cotton output during the late 1990s. Othermajor textile producers (and hence major cottonconsumers) are India, the United States, andTurkey, which, together with China, account for
three-quarters of global cotton consumption.Several East Asian countries have emerged recentlyas important cotton consumers. For example,Indonesia, Thailand, the Republic of Korea, andTaiwan (China) consumed only 130,000 tons in1960 (1.2 percent of global consumption), but1.5 million tons in 2002 (7.2 percent of globalconsumption).
Growth in the demand for cotton has been slow.Between 1960 and 2000, cotton demand grew at thesame rate as population (1.8 percent a year), imply-ing that per capita cotton consumption hasremained stagnant.
Stocks, which historically have fluctuatedbetween 20 and 50 percent of global output, haveaffected the cotton market considerably, especiallyin the area of price variability. The stockholdingpolicies of the United States and China, the twomajor holders of cotton stocks, have affected thelevel and volatility of prices. Two major cottondestocking episodes are associated with periods ofconsiderable price variability: the 1985 shift in U.S.policy from stockholding to price support and the1999 reforms in China.
One-third of cotton production is traded inter-nationally. The four dominant exporters—UnitedStates, Uzbekistan, Francophone Africa, andAustralia—account for more than two-thirds of theworld’s exports. Four major producers, China,
FIGURE 14.1 Cotton’s Share in Total Fiber Consumption and Polyester to CottonPrice Ratio, 1960–2002
30
1960
1963
1966
1969
1972
1975
1978
1981
1984
1987
1990
1996
1993
1999
2002
40
50
60
70
80
0.5
1.5
1.0
2.0
2.5
3.0
3.5
4.0
4.5
Cotton’s share (percent) Price ratio
Cotton’s share Price ratio
Source: International Rayon and Synthetic Fibers Committee.

India, Pakistan, and Turkey do not export cottonand occasionally import to supply their textileindustries. Imports of cotton are more uniformlydistributed than exports.
During the 2000–01 season, the eight largestimporters (Indonesia, India, Mexico, Thailand,Turkey, Russia, Italy, Korea) accounted for morethan one-half of world cotton imports. Apartfrom Russia (which before 1990 was considered amajor producer but not an importer because Cen-tral Asian cotton production was consideredinternal trade), most of the remaining cottonimporters are new in the sense that they have beenimporting cotton to supply newly developedtextile industries. For example, four East Asiantextile producers (Indonesia, Thailand, Taiwan,and Korea) accounted for less than 3 percent ofworld cotton imports in 1960, compared to22 percent in 2002.
The International Cotton Advisory Committee(ICAC) collects data comparing costs of productionamong cotton producers. Its most recent 2001 sur-vey, based on a questionnaire of 28 cotton-producing countries, suggests that West Africa(especially Benin, Mali, and Burkina Faso), Uganda,and Tanzania are among the lowest-cost cotton pro-ducers. High-cost producers are the United States,Israel, and Syria. The two European cotton produc-ers, Greece and Spain, are probably the world’shighest-cost cotton producers, although they didnot participate in the survey. Calculating and com-paring the costs of producing cotton in variouscountries is, admittedly, a difficult task, involvingassumptions about the cost of land and capital aswell as various hidden subsidies and distortions.The ICAC (2001) warns that its data must be usedcarefully:“Differences in production practices, vari-ations in the input supply among countries, anddirect and indirect technical and financial supportto farmers in the form of free seed, technical advice,etc., make comparisons difficult among countries.”
Population growth for the current decade isprojected at 1.2 percent a year. In the absence ofpolicy reforms by major players, ICAC (2003a and2003b) projects that annual consumption growthduring the decade will be about 1.8 percent, imply-ing that by 2010 world cotton consumption will be23.6 million tons. That may be optimistic, however,considering that for the last 15 years cotton con-sumption grew at an annual rate of just 0.7 percent.
Price Trends and Variability
Real cotton prices over the last two centuries havefollowed a declining pattern showing temporaryspikes and troughs. The reasons for the long-termdecline are similar to those behind the pricedeclines in most primary commodities—reductionin the costs of production due to technologicalimprovements, slow demand growth, and strongcompetition from substitutes (in this case, chemicalfibers). The declining pattern of cotton prices hasnot been smooth, and it appears that a structuralbreak took place in the mid-1980s. Between 1960and 1984 real cotton prices averaged $2.62 per kilo-gram. Following a sharp decline in 1984 (from$2.45 per kilogram in 1984 to $1.83 in 1985 and$1.27 in 1986), they have been fluctuating around$1.49 per kilogram. Between 1985 and 2002, pricesdeclined 0.9 percent a year (as opposed to just0.2 percent a year during 1960–84).
Reductions in the costs of production stem pri-marily from yield increases—from 300 kilogramsper hectare in the early 1960s to 600 kilograms perhectare in the late 1990s. The phenomenal yieldgrowth is attributable to the introduction of im-proved cotton varieties, expansion of irrigation, useof chemicals and fertilizers, and mechanical har-vesting. To these improvements one should adddevelopments in genetically modified seed technol-ogy and precision farming during the late-1990s,which are expected to further reduce the costs ofproduction. Innovations in transportation and in-formation technology have lowered costs of trans-porting cotton and reduced the need to hold largeinventories. Substantial technological improve-ments in the textile sectors have made it possible toobtain high-quality fabric from lower-quality cot-ton, a trend that holds for many products whosemain input is a primary commodity.
The prime movers behind the 1984–85 declinein cotton prices were the structural shift in the sup-port policy of the United States and the shift inChina’s trade policy (MacDonald 1997). During the1950s the U.S. Commodity Credit Corporationbought and sold most American cotton. For exam-ple, between 1962 and 1966, it accounted for almosttwo-thirds of cotton stocks. Although its role wasreduced after 1970, the United States still accountedfor 35 percent of world cotton stocks (exclusive ofChinese stocks). Following enactment of the 1985
Cotton: Market Setting, Trade Policies, and Issues 261

Farm Bill, support prices for cotton (that is, “loanrates,” the equivalent of a floor price) were substan-tially reduced, and most of the U.S. stocks werereleased to the market, depressing the world prices.1985 also marked the beginnings of large exportsby China, which for the previous 20 years had beena net importer. In fact between 1980 and 1985,China went from the world’s largest importer to theworld’s largest exporter.
Visual inspection of the 1984–85 price declinesuggests a structural break in the series, somethingalso supported by statistical tests. However, it maybe argued that if the policy shift in the UnitedStates, which caused massive destocking, had beenthe main reason behind the price decline, a newstock equilibrium level would have brought a priceincrease, making the 1984–85 decline temporary. Inreality, the U.S. policy shift accelerated a pricedecline that would have taken place even without it.Real cotton prices did rise somewhat after the shiftbut never reached pre-1984 levels.
While falling, cotton prices have been volatile.Admittedly, measuring volatility is a difficult (andoften tricky) task precisely because prices haveshown a long-term, nonlinear decline, making itdifficult to isolate a meaningful average aroundwhich variability can be defined. Defining volatility
as variability from one year to another shows thatduring 1985–2002 volatility was 2.5 times higherthan in 1960–72 but only half of the level in1973–84. Note that 1973 reflects the commodityprice boom, while 1985 coincides with the U.S.change in cotton policy and the subsequent dis-posal of large cotton stocks. In summary, cottonprices were very stable before 1974, highly volatileuntil 1985, and then less volatile, but not as stable asbefore 1974.
Cotton and the DevelopingCountries
Although cotton trade is insignificant on a globalscale—accounting for just 0.12 percent of totalmerchandise trade—it is an important cash cropfor several developing countries at both the farmand national levels. Cotton accounted for between30 and 44 percent for total merchandise exportsin five West African countries (Burkina Faso,Benin, Chad, Mali, Togo) during 1998–99(table 14.1). The corresponding figures forUzbekistan, Tajikistan, and Turkmenistan are 32,15, and 12 percent. Cotton’s contribution to thegross domestic product (GDP) of these countrieshas been substantial, ranging between 3.6 percent
262 Global Agricultural Trade and Developing Countries
TABLE 14.1 Cotton’s Importance to Developing and Transition Economies,1989–99 Average
Cotton Exports
Percent of MerchandiseMillions of Merchandise Percent of Exports (millions Per Capita
Countrya Dollars Exports GDP of dollars) GDPb
Burkina Faso 127 43.9 5.1 289 249Benin 164 39.1 7.1 419 398Uzbekistan 1,038 32.2 6.5 3,227 467Chad 76 32.2 4.7 236 224Mali 180 29.5 6.7 611 285Togo 67 21.3 4.7 315 341Tajikistan 97 15.1 8.2 643 352Turkmenistan 110 12.3 3.6 891 1,126Tanzania 44 7.6 0.5 576 185Syrian Arab Rep. 214 6.7 1.4 3,177 858Sudan 41 6.0 0.4 688 290
a. Countries ranked by decreasing order of cotton exports in merchandise exports; b. Constant 1995 U.S.dollars.Source: FAOSTAT, and World Bank, World Development Indicators, various years.

(Turkmenistan) and 8.2 percent (Tajikistan). Withthe exception of Turkmenistan and Syria, the percapita annual GDP in these countries is well below$500. In most (especially in Africa), cotton is typi-cally a smallholder crop and the main cash crop. Itis grown in rain-fed land with minimal use of pur-chased inputs such as chemicals and fertilizers.
According to FAO (Food and Agriculture Orga-nization) estimates, as many as 100 million ruralhouseholds may have been involved in cotton pro-duction during 2001. In China, India, and Pakistanabout 45, 10, and 7 million rural households, respec-tively, were engaged in cotton production. The totalnumber of rural households depending on cottonin major African producing countries, includingNigeria, Benin, Togo, Mali, and Zimbabwe, was6 million.
The high dependence on cotton in these coun-tries has important ramifications for poverty, espe-cially when prices change suddenly. In a study ofBenin, Minot and Daniels (2002) estimated that a40 percent reduction in farm-gate cotton prices—equivalent to the price decline that occurredbetween December 2000 and May 2002—implied a7 percent reduction in rural per capita income inthe short run and a 5–6 percent reduction in thelong run. They also estimated that the incidence ofpoverty among cotton growers will rise in the shortrun from 37 percent to 59 percent, while the aver-age incidence of rural poverty (among cottongrowers and other farmers) will increase from40 percent to 48 percent.
In terms of policy interventions, the cotton sec-tor in developing countries has been traditionallytaxed either explicitly through export taxes orimplicitly through price-fixing arrangements orexchange-rate misalignments. The pattern, how-ever, changed somewhat during the 1990s, as anumber of cotton producers undertook policyreforms. However, several African and all CentralAsian cotton producers still tax their cotton sectors.
Nonconventional CottonProduction
Recent trends in growing cotton focus on costreductions through less intensive use of inputs,especially chemicals. These include the use ofgenetically modified seed technology and organicmethods of production. Genetically modified
cotton (sometimes referred to as Bt cotton) has notfaced the degree of opposition faced by geneticallymodified food crops, allowing more rapid adop-tion. Organic cotton has been embraced enthusias-tically by environmental activists but not by con-sumers. Hence, while there is plenty of room forexpanding genetically modified cotton, the scopefor expanding organic cotton appears to be limited.
Genetically modified cotton, a result of techno-logical developments of the 1990s, has the potentialof reducing the cost of production and henceincreasing profitability of the early adopters ofthis technology. Like other genetically modifiedproducts, it provides insurance against pests, insects,and weeds. Growers pay a premium for the resistantseed, as they would when buying insurance.
Genetically modified cotton was first grown inthe United States in 1996. Among the cotton-producing countries that have introduced it sincethen are China, India, and Mexico in the NorthernHemisphere and Argentina, Australia, and SouthAfrica in the Southern. Other countries are in theprocess of approval or at the trial stage, includingBrazil, Indonesia, Israel, Pakistan, and Turkey.Major producers that had not used or approvedgenetically modified cotton as of 2003 were theEuropean Union, Central Asia, and FrancophoneAfrica (except Burkina Faso, which is conductingtrials).
It is estimated that about 22 percent of theworld’s cotton plantings are now in geneticallymodified varieties, up from 2 percent in 1996–97.The largest user of such cotton is the United States,which during the 2003–04 season is estimated tohave sown 70 percent of its cotton area with geneti-cally modified varieties. In Australia about 44 per-cent of cotton area was sown to such varietiesin 2002–03, up from 40 percent two years earlier. InChina, which adopted the new technology at anexperimental stage in 1996, more than 20 millionhectares were planted with genetically modifiedvarieties in 2002, corresponding to more than20 percent of cotton acreage. In addition to theimported genetically modified varieties, China hasdeveloped 11 of its own varieties. According to Prayand others (2001), the major share of the benefitsfrom growing Bt cotton in China went to farmers(most of whom are smallholders). In contrast, mostof the benefits associated with genetically modifiedproducts in the other cotton-producing countries
Cotton: Market Setting, Trade Policies, and Issues 263

go to biotech and seed companies. They also foundthat the increased use of genetically modified cot-ton in China was associated with considerable pos-itive health effects—notably fewer hospitalizationsfrom pesticide poisoning. Farmers who did not useBt cotton had to spray 12 times on average, whereasfarmers who used Bt cotton had to spray only3–4 times. If the conversion to genetically modifiedcotton varieties continues at rates experienced dur-ing the last few years, as much as half of the world’scotton (from 40 percent of total cotton acreage)will be of genetically modified origin within fiveyears.
The second trend, organic cotton, may be asmall market niche to be exploited by developingcountries. Many developing countries can be classi-fied as “organic” cotton producers without alteringtheir current production practices because of theirlow reliance on chemicals and fertilizers. Thepotential for organic cotton appears to be limited,however. Organic cotton initiatives have takenplace in many countries, including in Africa, butthe scale is still insignificant compared to globalproduction of conventional cotton. Myers andStolton (1999) reported that in 1997, about 8,150tons of certified organic cotton fiber was producedworldwide—2,600 tons was produced in the UnitedStates, 1,175 in India, 1,800 in Turkey, 1,570 inAfrica, and 845 in Latin America.
Significant expansion of organic cotton facesdifficulties on both the supply and demand sides.On the supply side, the certification process (espe-cially in African cotton-producing countries wherethe majority of growers are smallholders) is costlyto implement and monitor. On the consumptionside, demand for organic cotton is not as strong asit is for other commodities such as coffee and tea.There are three reasons for this. First, there is a “dis-tance” in the eyes of the consumer between theprimary product (cotton) and the final product(cloth). Second, consumers of clothing (as opposedto consumers of, say, beverages) must pay attentionto a host of factors before they make their purchas-ing decision. The decision involves brand, color,style, size, type of cotton (typically identified by itscountry of origin), content (for example, 80 per-cent cotton, 20 percent polyester), and care instruc-tions. Adding to that already congested list infor-mation on whether the cotton is of organic origin israther difficult. Note that this decision-making
process compares unfavorably with much simplerlabeling for, say, coffee or tea where something like“Organically grown from Costa Rica” or “Organicof Kenyan origin” is likely to suffice. Third, organicproducts are typically associated with health-related benefits that do not apply to nonfood prod-ucts such as cotton.
Distortions in the Cotton Market
Cotton has been subject to various marketing andtrade interventions. Townsend and Guitchounts(1994) estimated that in the early 1990s, more thantwo-thirds of cotton was produced in countriesthat had some type of government intervention,including taxation and subsidization policies. TheICAC (2002 and 2003), which has been monitoringthe level of assistance to cotton production bymajor producers since 1997–98, found that eightcountries provided direct support to cottonproduction—Brazil, China, Arab Republic ofEgypt, Greece, Mexico, Spain, Turkey, and theUnited States (table 14.2). For 2001–02, direct gov-ernment assistance to U.S. cotton producersreached $3.9 billion; China’s support totaled$1.2 billion; and the European Union’s was almost$1 billion. Producers in Brazil, Egypt, Mexico, andTurkey received a combined total of $150 million insupport. India also supported its cotton sector in2001–02 with an estimated $0.5 billion.
In addition to domestic support, some borderrestrictions apply, mainly in the form of importtariffs. Most countries that impose import quotasare cotton exporters, some with large textiles sec-tors. Import tariffs rates for 2003 were: Argentina(7.5 percent); Brazil (7.5 to 10 percent); China(3 percent within quota, 90 percent outsidequota3); Egypt (5 percent); India (10 percent);United States (4.4 cents per kilogram within quotaand 31.4 cents per kilogram outside quota4);Uzbekistan (10 percent); and Zimbabwe (15 per-cent duty plus 5 percent import tax).
The remainder of this section analyzes the struc-ture and degree of interventions in the UnitedStates, European Union, and China. It also looks atUzbekistan, a country that taxes its cotton sector.
United States
The main channels of support in the United Statesare decoupled payments (formerly known as
264 Global Agricultural Trade and Developing Countries

production flexibility contracts), loan deficiencypayments (through the loan-rate mechanism),insurance, subsidies to domestic mills (the so-called Step-2 mechanism, also referred to asexport subsidy), and emergency payments (intro-duced in 1998 to compensate for the loss ofincome caused by low commodity prices butmade “permanent” under the 2002 Farm Bill)(table 14.3). Direct payments, predeterminedannual payments based on historically enrolledareas of cotton, were introduced with the 1996Farm Bill to compensate farmers for “losses”stemming from elimination of earlier loan defi-ciency payments. Market price payments aredesigned to compensate cotton growers for thedifference between the world price and the loanrate (the target price) when the latter exceeds the
former. Export subsidies, or Step-2 market pay-ments, are made to eligible cotton exporters anddomestic end users of cotton when domestic U.S.prices exceed c.i.f. (cost, insurance, and freight)prices in northern Europe by a certain level andthe world price is within a certain level of the baseloan rate. The objective of the Step-2 payment isto bridge the gap between higher U.S. domesticprices and world prices so that U.S. exporters andtextile mills maintain their competitiveness.
In 2002 the U.S. Congress passed a farm bill thatis expected to be in place for the next six years. The2002 Farm Bill retained the earlier support throughvarious loans, flexibility contracts, and insurance,as well as the Step-2 payment, while legitimizingemergency assistance under the term “countercycli-cal payments.” If cotton prices remain at their
Cotton: Market Setting, Trade Policies, and Issues 265
TABLE 14.2 Direct Government Assistance to Cotton Producers, 1997–98 to 2002–03(US$ millions)
Country 1997–98 1998–99 1999–2000 2000–2001 2001–02 2002–03
United States 1,163 1,946 3,432 2,148 3,964 2,620China 2,013 2,648 1,534 1,900 1,196 750Greece 659 660 596 537 735 718Spain 211 204 199 179 245 239Turkey — 220 199 106 59 57Brazil 29 52 44 44 10 —Mexico 13 15 28 23 18 7Egypt, Arab Rep. 290 — 20 14 23 33
— Not available. Data for 2001–02 are preliminary.Source: ICAC 2002 and 2003, U.S. Department of Agriculture, and European Union.
TABLE 14.3 Government Assistance to U.S. Cotton Producers, 1995–96 to 2002–03(US$ millions)
Policy Instrument 1995–96 1996–97 1997–98 1998–99 1999–2000 2000–01 2001–02 2002–03
Coupled payments 3 0 28 535 1,613 563 2,507 248PFC/DP 0 599 597 637 614 575 474 914Emergency/CCP 0 0 0 316 613 613 524 1,264Insurance 180 157 148 151 170 162 236 194Step-2 34 3 390 308 422 236 196 —Total 217 759 1,163 1,946 3,432 2,148 3,964 2,620
— Not available.Note: PFC denotes production flexibility contracts, DP denotes direct payments, CCP denotes countercyclicalpayments.Source: U.S. Department of Agriculture (assistance); International Cotton Advisory Committee (production);and author’s calculations.

2001–02 levels, then U.S. support to its cotton sec-tor is expected to be in the order of $3.5 billion to$4.0 billion for the next six years, implying the U.S.cotton producers will be receiving close to twice theworld market price.
European Union
In the 1960s there were three cotton producers inEurope. Greece and Spain produced an average of85,000 tons each; Bulgaria produced 25,000 tons.Throughout the 1970s Bulgaria’s output declined,while that of Greece and Spain stayed at the levelsseen during the 1960s. Cotton production by thethree countries taken together declined by 0.4 per-cent a year between 1960 and 1982. With the Euro-pean Union’s expansion and the subsequent acces-sion of Greece and Spain, cotton production grewby an annual average of 7.3 percent during the1990s, averaging 325,000 and 78,000 tons in Greeceand Spain, respectively.
Under the EU Common Agricultural Policy(CAP), support is given to cotton growers based onthe difference between the market price and aguide (support) price. Advance payments are madeto ginners based on estimates of seed cotton pro-duction. They pass the subsidy on to growers bypaying higher prices. The policy also influences thequantity of cotton produced by setting a maxi-mum guaranteed quantity of seed cotton for whichassistance is provided—782,000 tons of seed cot-ton for Greece, and 249,000 for Spain, approxi-mately equivalent to 255,000 and 82,000 tons ofcotton lint.
The European Union reformed its cotton pro-gram in 1999 (European Commission 2000). Whilethe guide price level and the maximum guaranteedquantity of seed cotton for which assistance is pro-vided have been maintained, “penalties” (that is,reductions in subsidy) for excess production overthe maximum guaranteed quantity increased.Under the reformed policy, for each 1 percent ofexcess production, the level of subsidy is lowered by0.6 percent of the guide price as opposed to 0.5 per-cent prior to 1999. As production increases, thepenalty becomes stiffer, effectively, putting anupper limit on the budgetary outlays to the cottonsector. It is important to note that this quantitativerestriction (the so-called maximum quantity guar-anteed) applies at the aggregate (that is, country)
level, implying that when this restriction is con-verted to individual basis, it creates not onlyadministrative complexities but also leads to misal-location of resources (see chapter 5 on decouplingfor more on this issue). Karagiannis and Pantzios(2002) found that the current system failed as a sur-plus containment mechanism and also resulted infarm income losses.
Between 1995–96 and 1999–2000 the budgetaryexpenditure on cotton aid ranged between €740million and €903 million, implying that, on aver-age, EU cotton producers received more than twicethe world price of cotton. Note that even in periodsof high prices, EU cotton producers would receivesupport since the amount allocated to the cottonsector had to be disbursed. In addition to outputsubsidies, EU cotton producers receive subsidies oninputs such as credit for machinery purchase,insurance, and publicly financed irrigation. OnSeptember 23, 2003, the EU Commission proposedto reform its cotton, sugar, and tobacco sectors(European Commission 2003). Under the cottonreform proposal, EU support to the cotton sectorwill consist of the following parts: a single farmpayment scheme; a production aid scheme, grantedas an area payment; and development measures.
China
China is currently the largest producer, consumer,and stockholder of cotton. China’s cotton sectorbecame fully government-controlled in 1953 afterthe introduction of the first Five-Year Plan (Zhongand Fang 2003). The central planning policiesadopted then were similar to those of the SovietUnion and remained in place for the next 35 years.The central government set production targets andprocurement quotas. This monopoly was easilyexercised because all ginning facilities were ownedby the cooperatives. A step to boost cotton produc-tion was taken in 1978 by increasing the price ofcotton as well as supplying more fertilizer. A secondboost came in 1980 with the partial abolition of thecommunal production system under the House-hold Responsibility System, which gave land userights to individual farmers.
Evidence suggests that the government of Chinaprotects its cotton sector through support prices,import tariffs, export subsidies, and public stock-holding. The government sets a reference price for
266 Global Agricultural Trade and Developing Countries

cotton, typically above world prices. China alsomaintains tariffs on imports that bridge the gapbetween domestic and world prices. Followingits WTO (World Trade Organization) accessionarrangements the tariffs will be reduced to 15 per-cent, but at the same time a tariff-related quotasystem will be implemented to manage imports.
The International Cotton Advisory Committeefound that support to the cotton sector in the sixseasons beginning in 1997–98 ranged from $0.8 bil-lion to $2.6 billion. Huang, Rozelle, and Chang(2004) estimated that during 2001 the nominalrate of protection for cotton averaged 17 percent.Fang and Beghin (2003), however, estimated thatbetween 1997 and 2000, the nominal protectioncoefficient for cotton has averaged 0.80, implyingthat China taxes its cotton sector by 20 percent. Thedifferent views on the nature and degree of inter-vention, however, should not be surprising giventhe complexities of China’s agricultural policies aswell as the unreliability of the data.
In September 1999 the government of Chinaannounced reform measures which included thecreation of a cotton exchange to facilitate domesticspot trading; the reduction of prices paid to pro-ducers; and a reduction in stocks. In some sensethe reforms have worked: China’s stocks declinedfrom 4.1 million tons in 1998–99 to 2.3 milliontons in 2000–01. In September 2001 furtherreforms were announced and are currently underway (Zhong and Fang 2003). First, the internal cot-ton market would be open to cross-regional trade.Second, various enterprises would be allowed tobuy cotton directly from producers with approvalgranted by the provincial government. Third,ginning operations would be separated frommarketing cooperatives, in effect making themcommercial enterprises.
Uzbekistan
Uzbekistan, the world’s fifth largest cotton pro-ducer and second largest cotton exporter, producesmore than 1 million tons of cotton annually, mostof which is exported. During 1998–99 cottonexports accounted for one-third of total merchan-dise exports, while the sector contributed an aver-age of 6.4 percent to the country’s GDP. Before1991 all aspects of Uzbekistan’s cotton sector wereunder state control (of the Soviet Union). Most
cotton was either consumed by mills in Russia(then considered domestic trade) or shipped toEastern European countries under barter arrange-ments. Following the collapse of the Soviet Union,Uzbekistan began exporting its cotton to Westerncountries in exchange for foreign currency (until1996 some cotton still went to Russia in bartertrade terms).
Although 12 years have passed since the changein the trade regime, most aspects of production,marketing, and trade of the sector closely resemblepre-1991 arrangements. Numerous entities areinvolved in all postproduction activities of cotton.The three most important ones are the statecompany handling ginning; the state tradingorganizations handling exports; and the Ministryof Foreign and Economic Relations, handlingfinancial transactions.
All pre- and post-ginning operations of cottonare handled by UzKhlopkoprom/UzPakhtasanoitish(UKP), a state company that used to be a ministry.UKP is responsible for collecting, storing, ginning,and classifying cotton, making payments to growers,and providing inputs. UKP owns considerableassets, including all ginning and storage facilities aswell as handling machinery and equipment.
The second important entities are the three statetrading organizations (STOs) in charge of handlingall aspects of cotton exports. The main responsibil-ities of these organizations include contracting cot-ton merchants for the sale of cotton, organizing theavailability and shipment of cotton, receiving pay-ments and converting them into local currency, andpaying UKP. Although these organizations have anumber of other responsibilities (such as purchas-ing machinery and equipment on behalf of the gov-ernment), exporting cotton is their core activity.Because each organization has been allocated aquota of cotton to be exported, there is no competi-tion involved in the export process.
The third important entity is the Ministry ofForeign Economic Relations, which reports directlyto the government. Its main function is to managecotton export operations, including setting prices,selecting buyers, and monitoring dollar receipts.Several other entities are involved in the sectorincluding the state company responsible fordomestic and international transportation of cot-ton, the organization responsible for quality moni-toring, and the customs agency.
Cotton: Market Setting, Trade Policies, and Issues 267
It appears that cotton growers are heavily taxedboth directly through the lower price received byUKP (which, in turn, receives a fixed price from theSTOs, as dictated by the Ministry) and indirectlythrough the exchange rate regime. A recent study(Uzbekistan 2003) found that at an ex-ginneryprice of $1.03 a kilogram, the STOs receive theequivalent of $0.63 a kilogram (these calculationswere based on a Cotlook A Index (price) of $1.24 akilogram). With respect to the difference between$1.03 and $0.63 a kilogram, the study concluded:“It is not clear exactly where this profitability figureis allocated. It is alleged that, after a marketing fee isdeducted, the balance is paid to the Ministry ofFinance as an export duty.” The declared price to bepaid to farmers by UKP is 126,000 Sum per ton ofseed cotton, which, at an exchange rate of 960 Sumper U.S. dollar and a 32 percent ginning out-turnratio, implies a price of $0.41 a kilogram, aboutone-third of the A Index.
Perhaps, it is not unreasonable to conclude thateven though cotton exports from Uzbekistanmoved from a barter to a commercially orientedstructure, the sector is still tightly controlled by thegovernment. Moreover, growers are taxed heavily,receiving only about one-third of the export priceof cotton.
Impact of Distortions andProspects for Reform
The ICAC (2003a) concluded that in the absence ofdirect subsidies, average cotton prices during the2000–01 and 2001–02 seasons would have been 17and 31 cents a pound higher, respectively. If theUnited States alone removed its subsidies duringthese two seasons, world cotton prices would havebeen 6 and 11 cents higher, respectively. These fig-ures imply cotton prices 30 and 71 percent higherthan the actual averages of 57.2 and 41.8 cents apound. The study, which is based on a short-runpartial equilibrium analysis, does acknowledge thatwhile removal of subsidies would result in lowerproduction in the countries that receive them (andhence higher prices in the short term), such impactwould be partially offset by shifting production tononsubsidizing countries in the medium to longerterms; similarly higher prices are likely to reducethe growth of cotton consumption, making thelong-run impact less striking.
Quirke (2002) estimated that removal of pro-duction and export subsidies by the United Statesand the European Union are likely to induce a20 percent reduction in U.S. cotton production anda 50 percent reduction in U.S. cotton exports, withmuch higher figures for the European Union. Healso estimated that if support was not in place,world cotton prices would be 10.7 percent highercompared to their 2001–02 levels.
Based on a partial equilibrium model, Tokarick(2003) found that multilateral trade liberalizationin all agricultural markets (including cotton) isexpected to induce a 2.8 percent increase in theworld prices of cotton, with 0.8 percent comingfrom the removal of market price support and theremaining 2 percent coming from the removal ofproduction subsidies (removal of market price sup-port most likely applies to the United States Step-2payment). Tokarick also calculated that globalreforms would lead to $95 million in total changein welfare a year.
FAPRI (2002) found that under global liberal-ization (that is, removal of trade barriers anddomestic support of all commodity sectors), theworld cotton price would increase over the baselinescenario by an average of 12.7 percent over the10-year period (table 14.4). The largest gains intrade would go to Africa, which would increase itsexports by an average of 12.6 percent. Exports fromUzbekistan and Australia would increase by 6.0 and2.7 percent, respectively, while exports from theUnited States would decline by 3.5 percent. Themost dramatic impact is on the production sidewhere the European Union’s cotton output woulddecline by more than 70 percent. The latter out-come should not be a complete surprise, consider-ing that the European Union’s cotton outputduring the late 1990s was, on average, three times asmuch as it was before CAP took effect on the cottonsector.
Prospects for policy reforms by major producerssubsidizing the sector are mixed. Support for cot-ton in the European Union is unlikely to increasefor two reasons. First the countries expected to jointhe EU are not cotton producers and hence therewill be no budgetary pressure. Second, the currentsupport scheme is subject to an upper spending capthat appears to be a binding constraint; bothGreece and Spain, being among the world’shighest-cost cotton producers, are unlikely to
268 Global Agricultural Trade and Developing Countries

increase production given the reduced support theywould receive if they exceed the current outputlevels. At the same time, support is not expected tobe eliminated because it supposedly goes to low-income areas and hence it is regarded as a povertyreduction program.
The nature of support is shifting away fromdirect price support toward partially decoupled pay-ments. Beginning in 2006, the EU cotton sector willgo through another reform. Under the LuxembourgCouncil’s decisions of April 22, 2004 (which wasbased on the September 2003 proposal), an esti-mated €700 million will fund two support meas-ures, with 65 percent of the total coming in the formof a single farm payment decoupled from currentproduction decisions and the remaining 35 percentin the form of an area payment. Eligibility for thedecoupled payment will be limited to growers whoproduced cotton during the three-year period from1999 to 2001. The area payment will be given for amaximum area of 380,000 hectares in Greece,85,000 hectares in Spain, and 360 hectares in Portu-gal and will be proportionately reduced if claimsexceed the maximum area allocated to each country.To receive decoupled payments, cotton growersmust keep the land in good agricultural use. Toreceive area payments they must plant (not neces-sarily produce) cotton. Karagiannis (2004) esti-mated that the reformed regime is likely to reduceEU cotton production between 10 and 25 percent(depending on the assumed elasticity of supply).
The United States took a step in the right direc-tion with the replacement of the deficiency pay-ment system by decoupled payments in 1996, butall progress was eliminated with the 2002 Farm Bill,which effectively legitimized emergency paymentsintroduced in 1998–99 following the sharp declinein prices; renamed them as countercyclical pay-ments; increased target prices; and made it moreconvenient for larger farmers to increase the sup-port they receive. Historically, U.S. farm bills eithergive what they promise or give more than theypromise (as the recent experience showed). Hence,if history is any guide, it is reasonable to expect thatU.S. cotton farmers will be receiving generous sup-port for the next six years, unless the supportexceeds WTO commitments, in which case the U.S.secretary of agriculture has the discretion to inter-vene and reduce it.
A number of factors may induce some earlyreforms, however. First, the substantial increase ofthe support to the U.S. cotton sector along with30-year record low prices and the fact that 10 per-cent of U.S. cotton growers receive 90 percent of thesupport (hence falsifying the claim that supportpreserves the small farm), is likely to put pressurefor altering the nature of policy sooner. Second,Brazil’s request for consultations at the WTO re-garding U.S. cotton subsidies may create some pres-sure to lower subsidies (WTO 2002). Third, fourWest African cotton-producing countries (Benin,Burkina Faso, Chad, and Mali) pressed for removal
Cotton: Market Setting, Trade Policies, and Issues 269
TABLE 14.4 Estimated Effect of Removal of Distortions(percentage changes over baseline)
Variable 2003–04 2005–06 2007–08 2009–10 2011–12 Averagea
World price 15.6 13.7 13.0 12.2 11.7 12.7Exports
Africa 12.1 15.1 14.0 13.1 12.3 12.6Australia 3.9 3.0 2.7 2.3 2.1 2.7United States −8.4 −6.6 −4.0 −1.5 0.9 −3.5Uzbekistan 5.4 6.9 6.7 6.4 6.2 6.0World 3.9 5.6 6.2 6.7 7.3 5.8
ProductionAfrica 4.5 7.5 7.1 6.7 6.3 6.0European Union −77.4 −77.7 −78.3 −78.8 −79.0 −70.5United States −18.3 −7.9 −5.9 −4.1 −2.3 −6.7Uzbekistan 3.1 4.7 4.6 4.4 4.2 4.0
a. Average is taken over the 10-year period 2001–02 to 2010–11.Source: FAPRI 2002.

of support to cotton sector through the WTO. In anunusual move, the president of Burkina Fasoaddressed the WTO on June 10, 2003, asking forfinancial compensation for cotton-producing low-income countries to offset the injury caused bysupport. This compensation, according to therequest, should be in place for as long as subsidiesare in place.
China appears to be the most promising case ofreform. The reforms undertaken in 1999 and morerecently in 2001 indicate that its cotton sector willbe soon exposed to internal and external competi-tion. China is also in the process of establishing acotton futures exchange, indicating that marketforces within the sector are likely to play a more sig-nificant role in the future (Shuhua 2003).
On the international side, while the phase-out ofthe Agreements on Textiles and Clothing (ATC) issupposed to end the distortions imposed on thelocation of the textile industries, it is uncertainwhether the expected benefits will be fully realized.
• First, ATC is back-loaded, with most of thereforms expected to take place in the last year,thus increasing the risk of noncompliance.
• Second, a number of (mainly European Union)countries have repeatedly sought to imposeantidumping duties on textile imports from Asiain recent years.
• Third, a number of provisions under the ATCallow for the imposition of temporary duties inthe case that current domestic textiles suffer“significant damage” following the phaseout.
Reform Initiatives in Africa
During the 1990s, a number of African cotton-producing countries undertook substantial reforms.The reform process and its outcome have been stud-ied extensively. See, for example, Kähkönen andLeathers (1997) for Zambia and Tanzania; Sabune(1996) and Lundbæk (2002) for Uganda; Larsen(2002) for Zimbabwe; Baffes (2001) for Uganda,Zimbabwe, and Tanzania; Baffes (2000), Badianeand others (2002), and Goreux and Macrae (2003)for Francophone Africa; Baffes (2004) and Gibbon(1999) for Tanzania. Poulton and others (2004)looked at the cotton sectors of six African countries,while Shepherd and Farolfi (1999) reviewed exportcommodity sectors for a number of sub-SaharanAfrican countries.
Reforms in East African cotton-producingcountries were in response to the inefficienciesfaced by the parastatals that used to handle most(and in some occasions all) aspects of marketingand trade. For the most part, policy reforms meantelimination of the monopoly powers of the paras-tatals. Although the outcome of these reformsappears to have been mixed, if one considers thatthe countries that undertook reforms also faced themost difficulties, one may argue that reforms havebeen successful. For example, during the eight-yearperiod staring in 1995–96, cotton output in Ugandahas averaged 17,000 tons, an almost three-foldincrease compared with the eight seasons before1995–96. The corresponding world price averagebefore 1995–96 was $1.56 a kilogram; after it was$1.40 a kilogram. The farmers’ share in world pricesrose from less than 50 percent to 70 percent afterthe reforms, while a number of new traders andexporters entered the sector. This success camedespite the failure of most credit mechanisms thatwere launched after the reforms.
In Zimbabwe reforms appear to have been suc-cessful. First, cotton production is up substantially.During the eight seasons since 1995–96, cottonoutput has averaged 115,000 tons, 50 percenthigher than the eight-year period average before1995–96. Some 30 percent of the 1997–98 cottonharvest was marketed entirely by private entities.Private companies now transport most of thecotton. Competition has pushed the price farmersreceive to close to 80 percent of internationalprices, and producers are being paid faster.Zimbabwe has also retained the premium for qual-ity it used to receive in the world market.
The outcome of cotton reforms in Tanzania hasbeen mixed. On the positive side, the share of pro-ducer prices increased to 51 percent (from 41 per-cent before the reforms). Furthermore, cottongrowers receive payments quickly, a major achieve-ment compared with the delays encountered beforethe reforms. Contrary to what many reports show,quality of cotton appears not to have suffered con-siderably. At the same time, cotton productionsince 1995–96 has averaged less than before reforms(55,000 after, compared with 61,000 tons before).On the policy side, the Cotton Board along with thetwo line ministries (Agriculture and Food Security,and Cooperatives) still play a major role in the sec-tor that goes far beyond the regulatory role they aresupposed to play. Collection and dissemination of
270 Global Agricultural Trade and Developing Countries
data (as well as accuracy of statistics) are poor evenby the government’s own admission.
Reforms are also under way in West Africa. TheWorld Bank has argued that the discipline andresponsibility that a free-entry competitive systemimposes on market participants would make for amore resilient, flexible, self-reliant, and innovativenational cotton sector. Improved competitionthrough market reforms offers important oppor-tunities for regional trade and cooperation, thelatter in areas such as research, phytosanitary regu-lations, and seed development and certification.Most important, improved sector performancewould contribute to alleviating poverty by raisingcotton prices to levels enjoyed by farmers else-where in the world.
Significant developments have taken place dur-ing the last few years, which indicate the futuredirection of institutional changes in the region’scotton sector. Three countries, Benin, Côte d’Ivoire,and Togo, have now opened their sector to privateginners. Benin and Côte d’Ivoire have eliminatedthe monopoly power of their national companiesand transferred key responsibilities to the privatesector.
Summary and Conclusions
Cotton is very important to a number of low-income African and Central Asian countries, insome cases contributing as much as 40 percent tomerchandise exports and between 5 and 10 percentto GDP. Considering that in most countries cottonis a smallholder crop, the implications of pricechanges (either induced by market forces or policyinterventions) as well as changes in market shareare enormous. For example, a 40 percent reductionin price (the equivalent of the price decline thattook place from December 2000 to May 2002)implies a 7 percent reduction in rural income inBenin—a typical cotton-producing country inWest Africa. Cotton also faces intense competitionfrom chemical fibers, especially following techno-logical improvements in the early 1970s thatbrought their prices down to cotton price levels.Since 1975, polyester and cotton have been tradedat roughly the same price levels. Currently, theshare of cotton in total fiber consumption is 40 per-cent (down from 68 percent in 1960).
Although cotton faces minimal border restric-tions, there is considerable domestic support.
Major subsidizers are the United States, $3.96 bil-lion in 2001–02 and the European Union—Greeceand Spain—$0.98 billion (compare this to $20 bil-lion, the value of world’s cotton production, evalu-ated at 2001 prices and quantities). This level ofsupport implies that prices received by U.S. and EUcotton producers are 87 and 160 percent aboveworld prices. China reportedly has been supportingits cotton sector during the last few seasons by anestimated $1.5 billion annually. Many cotton-producing countries have reacted to low prices byintroducing offsetting support. Support in Turkey,Brazil, Mexico, Egypt, and India, totaled $0.6 billionduring 2001–02. Further, Brazil initiated a WTOconsultation process claiming losses to its cottonexports due to subsidies by the United States. WTOdetermined in its interim ruling that indeed theU.S. cotton program has violated the Agreement onAgriculture. Not only is this decision an importantvictory for Brazil, but it may also trigger similarcases, especially in view of the expiration of thePeace Clause in the Uruguay Round Agreement onAgriculture. More recently, four West Africancotton-producing countries (Benin, Burkina Faso,Chad, and Mali) pressed for removal of support tothe cotton sector through the WTO (the so-called“cotton initiative”). This compensation, accordingto the request, should be in place for as long as sub-sidies are in place.
Given the highly distorted nature of the cottonmarket and the fact that millions of rural poorhouseholds in developing countries depend on thiscommodity, what are the alternatives? As discussedearlier, a number of developing countries, espe-cially in Sub-Saharan Africa have undertaken pol-icy reforms during the 1990s. Setting aside thelively debate on the motives of the reforms, in manyrespects the reforms have been successful. Forexample, in the few cases reviewed here, cottongrowers received a higher share of f.o.b. prices, theyalso received payments more promptly, and therewas considerable supply response. In an environ-ment of declining commodity prices, these are nottrivial achievements. In a number of cases, how-ever, the reform process has either not been com-pleted (Tanzania), has been reversed (Zimbabwe),has been slow (West Africa), or has not even started(Uzbekistan). In these cases further reforms are theonly feasible alternative.
A second issue that should receive attention isthe enabling policy environment regarding the use
Cotton: Market Setting, Trade Policies, and Issues 271

of genetically modified cotton. In China for exam-ple, where genetically modified cotton is usedextensively by smallholders, the costs of producingcotton declined by 20–25 percent. This cost reduc-tion meant doubling the net income for cottongrowers. One should also note that geneticallymodified cotton has not been subject to negativeconsumer reaction as has been the case with genet-ically modified food products.
A third issue (and one closely related to geneti-cally modified cotton) is organic cotton. Producersof organic products typically command significantpremiums. However, organic cotton productionhas not been as profitable as other organic crops(such as coffee and tea). The main reason is weakdemand, which appears to be a reflection of the“distance” between the farm product—cotton—and the final product—cloth. It is because of thisdistance that genetically modified cotton has notfaced resistance by the consumers, which furtherreinforces the conclusion that genetically modifiedcotton is something that developing countriesshould consider seriously.
The price prospects (and consequently theexport shares of low-cost producers, includingmany African countries) can be improved consid-erably if support by developed countries is reducedsubstantially or eliminated altogether. Given thelow probability of eliminating support, however,a second-best alternative would be for support tobe given in a nondistortionary manner. A type ofsupport with minimal distortionary effects—theso-called decoupled support mechanisms—hasregained popularity recently. Income transfersunder decoupled mechanisms are based on pastproduction and prices and thus have no effect oncurrent production decisions. What makes decou-pled support in the cotton sector an interesting(and potentially applicable) alternative is thatalmost all support comes in the form of domesticmeasures. Therefore, changing the nature of sup-port does not require changing the sources of fund-ing, as it would in the case of border measures.
Notes
1. A more detailed version of this chapter is presented inAnnex 14 of the attached CD-ROM.
2. Fibers include a wide variety of products that can bedivided into two broad categories: natural and man-made. Nat-ural fibers can be further divided into fibers of plant origin(such as cotton and linen) and fibers of animal origin (such as
wool and silk). Likewise, man-made fibers can be furtherdivided into inorganic and organic fibers. Inorganic fibers arematerials such as ceramic, glass, and carbon (typically not usedin garments.) Organic man-made fibers, on the other hand, aremostly used in garment production either as substitutes or ascomplements to natural fibers. Organic fibers are further subdi-vided into natural and synthetic polymers. Natural polymers(often called cellulosic) are made from wood. The most com-mon natural polymer is viscose, also known as rayon. The syn-thetic polymers are made from crude oil. The most commonsynthetic polymers are polyester, acrylic, and polyamide (alsoknown as nylon). Per capita chemical fiber consumption in 1960and 2000 was 1.75 and 4.52 kilograms, respectively. China is theworld’s dominant producer of chemical fibers, accounting for6.7 million tons each year.
3. China’s 2003 tariff rate quota of 856,250 tons wasexhausted.
4. The U.S. tariff rate quota for 2002 was 73,207 tons, whilecotton imports totaled 6,295 tons.
References
Badiane, O., D. Ghura, L. Goreux, and P. Masson. 2002. “CottonSector Strategies in West and Central Africa.” Policy ResearchPaper 2867. World Bank, Washington, D.C.
Baffes, John. 2000. “Cotton Reforms in West and Central Africa,and the World Bank.” Cotton Outlook, Special Issue: Cotton inthe Franc Zone. Liverpool: Cotlook Limited.
———. 2001. “Policy Reforms in the Cotton Market.” In T.Akiyama, J. Baffes, D. Larson, and P. Varangis, eds., Commod-ity Market Reforms: Lessons from Two Decades. Regional andSectoral Studies. Washington, D.C.: World Bank.
———. 2004. “Tanzania’s Cotton Sector: Constraints and Chal-lenges in a Global Environment.” Development Policy Review22 (January): 75–96.
European Commission. 2000. “Commission Analysis Paper: TheCotton Sector in the European Union.” Brussels.
———. 2003. “Agricultural Reform Continued: CommissionProposes Sustainable Agricultural Model for Europe’sTobacco, Olive Oil and Cotton Sectors.” Brussels.
Fang, C., and J. C. Beghin. 2003. “Protection and ComparativeAdvantage of Chinese Agriculture: Implications for Regionaland National Specialization.” In D. Sumner and S. Rozelle,eds., Agricultural Trade and Policy in China: Issues, Analysisand Implications. Aldershot, U.K.: Ashgate Press.
FAPRI (Food and Agricultural Policy Research Institute). 2002.“The Doha Round of the World Trade Organization: Liber-alization of Agricultural Markets and its Impact on Develop-ing Economies.” Paper presented at the IATRC WinterMeetings, San Diego, CA.
Gibbon, P. 1999. “Free Competition without Sustainable Devel-opment? Tanzanian Cotton Sector Liberalization, 1994–95to 1997–98.” Journal of Development Studies 36:128–50.
Goreux, L., and J. Macrae. 2003. “Reforming the Cotton Sectorin Sub-Saharan Africa.” Africa Region Working Paper Series47. World Bank, Washington, D.C. http://www.worldbank.org/afr/wps.
Huang, J., S. Rozelle, and M. Chang. 2004. “The Nature of Dis-tortions to Agricultural Incentives in China and Implica-tions of WTO Accession.” In D. Bhattasali, S. Li, and W.Martin, eds. China and the WTO: Accession, Policy Reform,and Poverty Reduction Strategies. Washington, D.C.:WorldBank, 2004, pp. 81–97.
ICAC (International Cotton Advisory Committee). 2001. Surveyof the Costs of Production of Raw Cotton. Washington D.C.
272 Global Agricultural Trade and Developing Countries

———. 2002. Production and Trade Policies Affecting theCotton Industry. Washington, D.C.
———. 2003a. Production and Trade Policies Affecting theCotton Industry. Washington, D.C.
———. 2003b. World Textile Demand. Washington, D.C.———. Various Issues. Cotton: Review of the World Situation.
Washington, D.C.Kähkönen, S., and H. Leathers. 1997. “Is There Life after Liberal-
ization?: Transaction Costs Analysis of Maize and CottonMarketing in Zambia and Tanzania.” Prepared for the U.S.Agency of International Development. Center for Interna-tional Reform and the Informal Sector, University ofMaryland, College Park.
Karagiannis, G. 2004. “The EU Cotton Policy Regime and theImplications of the Proposed Changes for Producer Wel-fare.” Report prepared for the Food and Agriculture Organi-zation. University of Macedonia, Greece.
Karagiannis, G., and C. Pantzios. 2002. “To Comply or Not toComply with Policy Regulation—the Case of Greek CottonFarmers: A Note.” Journal of Agricultural Economics, 53:345–51.
Larsen, M. N. 2002. “Is Oligopoly a Condition of Successful Pri-vatization? The Case of Cotton in Zimbabwe.” Journal ofAgrarian Change 2:185–205.
Lundbæk, J. 2002. Privatization of Cotton Sub-Sector in Uganda:Market Mechanisms and Institutional Mechanisms to Over-come These. Masters thesis, The Royal Veterinary and Agri-cultural University, Department of Economics and NaturalResources, Copenhagen, Denmark.
MacDonald, S.A. 1997. “Forecasting World Cotton Prices.” InDebra E. Gerald, ed., Federal Forecasters Conference—1997,Papers and Proceedings. National Center for EducationStatistics. http://nces.ed.gov/pubs98/98134.pdf (accessedDecember 9, 2002).
Minot, N., and L. Daniels. 2002. “Impact of Global CottonMarkets on Rural Poverty in Benin.” International Food Pol-icy Research Institute, Washington, D.C.
Myers, D., and S. Stolton. 1999. Organic Cotton: From Field toFinal Product, London: ITDG Publishing .
Poulton, C., and others. 2004. “Competition and Coordinationin Liberalized African Cotton Market Systems.” World Devel-opment 32 (3): 519–36.
Pray, C., D. Ma, J. Huang, and F. Qiao. 2001. “Impact of Bt
Cotton in China.” World Development 29: 813–25.Quirke, D. 2002. Trade Distortions and Cotton Markets: Implica-
tions for Global Cotton Producers. Canberra: Cotton Researchand Development Corporation, Centre for InternationalEconomics.
Sabune, J. 1996. “Experiences of Uganda with Privatization of itsCotton Industry.” Paper presented at the 55th Plenary Meet-ing of the International Cotton Advisory Committee,Tashkent, Uzbekistan.
Shepherd, A. W., and S. Farolfi. 1999. Export Crop Liberalization inAfrica: A Review. Rome: Food and Agriculture Organization.
Shuhua, G. 2003. “Introduction to China’s Cotton Futures Trad-ing.” Cotton Outlook, Special Feature—China: The Future.Liverpool: Cotlook Limited.
Tokarick, S. 2003. “Measuring the Impact of Distortions in Agri-cultural Trade in Partial and General Equilibrium.” IMFWorking Paper, WP/03/110. International Monetary Fund,Washington, D.C.
Townsend, T., and A. Guitchounts. 1994. “A Survey of CottonIncome and Price Support Programs.” Proceedings of theBeltwide Cotton Conferences. National Cotton Council ofAmerica, Washington, D.C.
Uzbekistan. 2003. “Uzbekistan: Cotton Policy Note.” Govern-mental publication. Processed.
WTO (World Trade Organization). 2002. United States—Subsidies on Upland Cotton: Request for Consultations byBrazil. WT/DS267/1. Geneva, October 3.
Zhong, F., and C. Fang. 2003. “China’s Cotton Policy.” Center forAgricultural and Rural Development, Iowa State University,Ames, IA. Processed.
Cotton: Market Setting, Trade Policies, and Issues 273


grams per year in China and to 25.8 kilograms peryear in Southeast Asia, whereas it will remain con-stant or decline in developed countries (Delgadoand others 2003).
The goal of this chapter is to present the struc-ture and important features of the global seafoodmarket, including illustrations of the complexitiesof the market, followed by a discussion of theimpacts of trade liberalization, with a particularfocus on developing countries. Developing coun-tries play a very important role in internationalseafood trade (FAO 2002b). Many rely on seafoodfor export earnings—among them the Maldives,Mozambique, Peru, Senegal, and Sierra Leone.Fisheries production, both caught and farmed, hasdoubled in the last 30 years, and most of thatincrease has come from developing countries. Overhalf of global fish exports by value come from LatinAmerica and the Caribbean and the developingnations of Asia and Africa, and the majority of thatproduction goes to developed nations.
With rapid growth in production and trade havecome the overexploitation of fish stocks and a rapid
In many ways, fish as a commodity is treated differ-ently from agricultural products. For one thing, it isnot part of the agricultural negotiations of theWorld Trade Organization (WTO). That it contin-ues to be treated as an industrial product in negoti-ations may be a mixed blessing—leading to lowertrade protection but less discipline on domesticsubsidies. Yet fish is the most important source ofprotein for many around the globe. Seafood consti-tutes the biggest category of food and agricultureexports from developing countries, at an annualaverage of $33 billion (2000–01), or 18 percent ofexports—more than combined exports of coffee,cocoa, tea, spices and nuts, cotton, and sugar. Glob-ally, per capita consumption of fish is estimated at14.3 kilograms per year (Delgado and others 2003).Per capita consumption in 1997 was led by Japan,with 62.6 kilograms per year, and China, at 26.5kilograms per year (up from 8.1 in 1985). TheEuropean Union (EU) consumes 23.6 kilogramsper year per capita, and Southeast Asia 23 kilo-grams, up from 19.8 in 1985. By 2020 per capitaconsumption of fish is expected to rise to 35.9 kilo-
275
15
SEAFOOD: TRADELIBERALIZATION AND
IMPACTs ON SUSTAINABILITY
Cathy A. Roheim
The author would like to thank Mirvat Sewadeh for her contributions to the trade policies and trade flowsand Baris Sivri for his help with the data analysis. The CD-ROM accompanying this volume contains alonger version of this chapter with additional figures, tables, and boxes and an expanded narrative on fishand aquaculture production, value, trade, and policy matters.
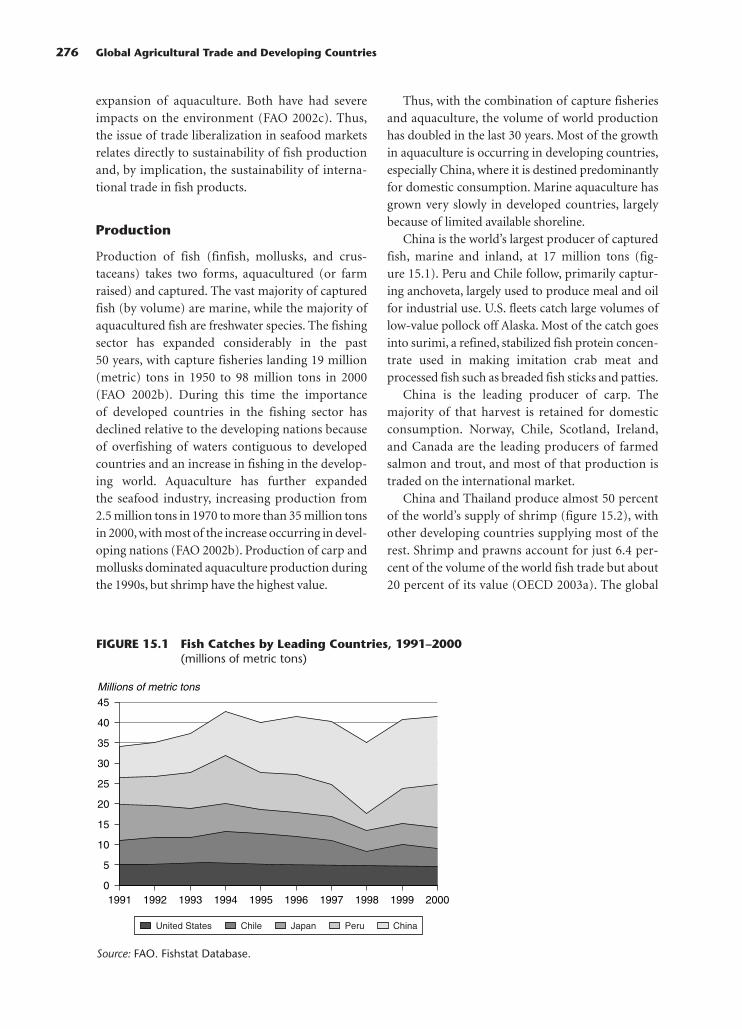
276 Global Agricultural Trade and Developing Countries
expansion of aquaculture. Both have had severeimpacts on the environment (FAO 2002c). Thus,the issue of trade liberalization in seafood marketsrelates directly to sustainability of fish productionand, by implication, the sustainability of interna-tional trade in fish products.
Production
Production of fish (finfish, mollusks, and crus-taceans) takes two forms, aquacultured (or farmraised) and captured. The vast majority of capturedfish (by volume) are marine, while the majority ofaquacultured fish are freshwater species. The fishingsector has expanded considerably in the past50 years, with capture fisheries landing 19 million(metric) tons in 1950 to 98 million tons in 2000(FAO 2002b). During this time the importanceof developed countries in the fishing sector hasdeclined relative to the developing nations becauseof overfishing of waters contiguous to developedcountries and an increase in fishing in the develop-ing world. Aquaculture has further expandedthe seafood industry, increasing production from2.5 million tons in 1970 to more than 35 million tonsin 2000, with most of the increase occurring in devel-oping nations (FAO 2002b). Production of carp andmollusks dominated aquaculture production duringthe 1990s, but shrimp have the highest value.
Thus, with the combination of capture fisheriesand aquaculture, the volume of world productionhas doubled in the last 30 years. Most of the growthin aquaculture is occurring in developing countries,especially China, where it is destined predominantlyfor domestic consumption. Marine aquaculture hasgrown very slowly in developed countries, largelybecause of limited available shoreline.
China is the world’s largest producer of capturedfish, marine and inland, at 17 million tons (fig-ure 15.1). Peru and Chile follow, primarily captur-ing anchoveta, largely used to produce meal and oilfor industrial use. U.S. fleets catch large volumes oflow-value pollock off Alaska. Most of the catch goesinto surimi, a refined, stabilized fish protein concen-trate used in making imitation crab meat andprocessed fish such as breaded fish sticks and patties.
China is the leading producer of carp. Themajority of that harvest is retained for domesticconsumption. Norway, Chile, Scotland, Ireland,and Canada are the leading producers of farmedsalmon and trout, and most of that production istraded on the international market.
China and Thailand produce almost 50 percentof the world’s supply of shrimp (figure 15.2), withother developing countries supplying most of therest. Shrimp and prawns account for just 6.4 per-cent of the volume of the world fish trade but about20 percent of its value (OECD 2003a). The global
FIGURE 15.1 Fish Catches by Leading Countries, 1991–2000 (millions of metric tons)
Source: FAO. Fishstat Database.
0
10
1991 1992 1993 1995 1997 19991994 1996 1998 2000
5
15
20
25
30
35
45
40
Millions of metric tons
United States Chile Japan Peru China

shrimp trade is valued at more than $10 billionannually.
It is estimated that more than 60 percent ofAsia’s mangroves have already been converted toaquaculture farms, primarily for the production ofshrimp (ESCAP and ADB 2000), degrading habi-tats and land. Because shrimp is such an impor-tant export earner for Southeast Asia and SouthAmerica and has such a marked negative effect ontheir environments, it is worthwhile to discuss itsproduction in some detail.
Sustainable Shrimp Aquaculture in Bangladeshand Thailand
Subsistence fishermen have caught shrimp inBangladesh for hundreds of years. But since themid-1980s the cultivation of shrimp for export hasgrown significantly. In 1972–73 exports of capturedshrimp were valued at $2.9 million. By 1985 ex-ports had growth to $90 million, primarily fromaquaculture. In 2000 the figure was $330 million(FAO 1999, 2002b).
Some of the credit for this rise goes to a struc-tural adjustment program in which Bangladeshreceived a World Bank loan of $1.76 billion overthe period 1979–96 (UNEP 1999b). Under the pro-gram, policies that had limited trade were replacedwith new policies that encouraged exports. Thechanges created an environment in which privateinvestments in shrimp culture, shrimp processing,and shrimp exports flourished.
Shrimp now accounts for almost 91 percent offish exports from Bangladesh (FAO 2002b). It is
generally agreed, however, that this rapid expansionhas had considerable environmental costs. The areaunder shrimp culture tripled in 10 years, from themid-1980s to the mid-1990s, covering 130,000 hec-tares by 1999 (UNEP 1999a). In the process, man-groves have been removed and replaced by coastalponds. The ponds have increased the salinity of adja-cent land, jeopardizing its future productivity.
The costs of restoration would likely be veryhigh. Disappearing mangroves have deprived themarine ecosystem of valuable habitat and nurseryareas for fish reproduction. In addition, sustainableshrimp farming is threatened by its reliance on thecollection of wild shrimp fry, which are then“grown out” to appropriate sizes for export, a prac-tice that threatens the sustainability of wild shrimpstocks as well. Disease sometimes breaks out inshrimp ponds and may spread to the wild shrimppopulation. Finally, the feed for cultured shrimp isbased on fish meal, which is produced from fullyused, if not overused, stocks of anchovies, herring,menhaden, and sardines.
Recognizing the negative externalities caused byshrimp culture in Bangladesh, the U.N. Environ-ment Programme (UNEP) recommended that ef-fective environmental policies with proper enforce-ment should be implemented to ensure that tradeliberalization did not lead to externalities that re-duced overall welfare (UNEP 1999a).
Thailand is the world’s largest producer ofshrimp, with approximately 23,413 farms coveringan area of 72,663 hectares (in 1996) (FAO 2000). By2000, Thailand was exporting 249,638 metric tonsof shrimp, valued at some $2.7 billion, to the worldmarket. Shrimp production in India, Indonesia,and Vietnam combined equal what Thailand pro-duces in export value. The same environmentalissues highlighted for Bangladesh apply toThailand—satisfying the huge export market forcultivated shrimp has led to significant environ-mental damage.
The Shrimp Industry in Madagascar
Madagascar’s shrimp industry is the country’s lead-ing foreign exchange earner. Exports grew from $20million in 1980 to $102 million in 1999 and nowaccount for 7 percent of gross domestic product(GDP). Approximately one-half of the shrimp pro-duced are from capture fisheries, the other half
Seafood: Trade Liberalization and Impacts on Sustainability 277
FIGURE 15.2 World Aquaculture Productionof Shrimp, by Volume, 2000
Source: FAO. Fishstat Database.
Thailand 28%
Other 9%Brazil 2%
Mexico 3%
Philippines 4%
China 20%Indonesia 13%
Vietnam 6%
Bangladesh5%
India 5%
Ecuador 5%

from aquaculture. The industry provides directemployment for approximately 53,000 people andindirectly for another 30,000 people (World Bank2003).
In the shrimp capture industry, there are threetypes of fisheries: traditional, artisanal, and indus-trial. The bulk of employment occurs in traditionalfisheries, in which fishers have no motorized equip-ment. Entry into the fishery is open; no license isrequired. Most of the catch of traditional fishermenis consumed domestically. Production was about3,400 tons in 2000 (World Bank 2003).
The cost of the license required to ply the arti-sanal fisheries depends on the power of the fishingboat’s motor. Most artisanal boats belong to a com-pany rather than being individually owned. Indus-trial trawlers that fish in Madagascar’s waters aremostly foreign owned and have processing facilitieson board. In 2000, approximately 8,200 tons ofshrimp were captured by artisanal and industrialfisheries, which directly employed some 10,500people. Virtually all of the shrimp captured in thesetwo fisheries are exported, with France and Japanbeing the primary markets (World Bank 2003).
Industrial Products
Developing countries are important exporters andimporters of fish meal. Fishmeal and oil are derivedfrom small, wild-caught pelagic fish such as capelinfrom the North Atlantic, anchovies from the South
Pacific, and other species such as menhaden andherring found around the globe. In processing thefish are cooked, pressed, dried, and milled. Thedry remainder is fishmeal; oil is extracted frompressing.
Fishmeal and fish oil, used in animal feeds (forboth terrestrial livestock and aquacultured fish) butnot for human consumption, are industrial prod-ucts. Demand for fish meal from the farmed fishindustry has increased dramatically in the last20 years. Growing poultry and pig industries inChina and Southeast Asia also create strong de-mand for fish meal.
The primary producer of fish meal has longbeen Latin America, with a total of 2.8 million tonsproduced in 1997 and an annual growth rate of1.7 percent between 1985–97 (Delgado and others2003). Much of that production, from Chile andPeru, is susceptible to the vagaries of El Niño. Themost heavily exploited fish is the Peruviananchoveta (figure 15.3). World production in 1997was 6.1 million tons, with the balance after LatinAmerica made up primarily by China, SoutheastAsia, Japan, and the European Union.
If world markets and production do not changesubstantially over the next 17 years, fish meal pricesare projected to rise by 18 percent (Delgado andothers 2003). Conversely, if aquaculture expands by50 percent, then the price of fish meal will increaseby 42 percent. Greater efficiency in the use of fishmeal in animal feed could push prices down. In the
278 Global Agricultural Trade and Developing Countries
FIGURE 15.3 World Aquaculture Production by Value, 1991–2000
Source: FAO. Fishstat Database.
0
10
1991 1995 2000
5
15
20
25
30
35
40
US$ billions
Carps Salmon�Trout Shrimp Tilapia Mollusk
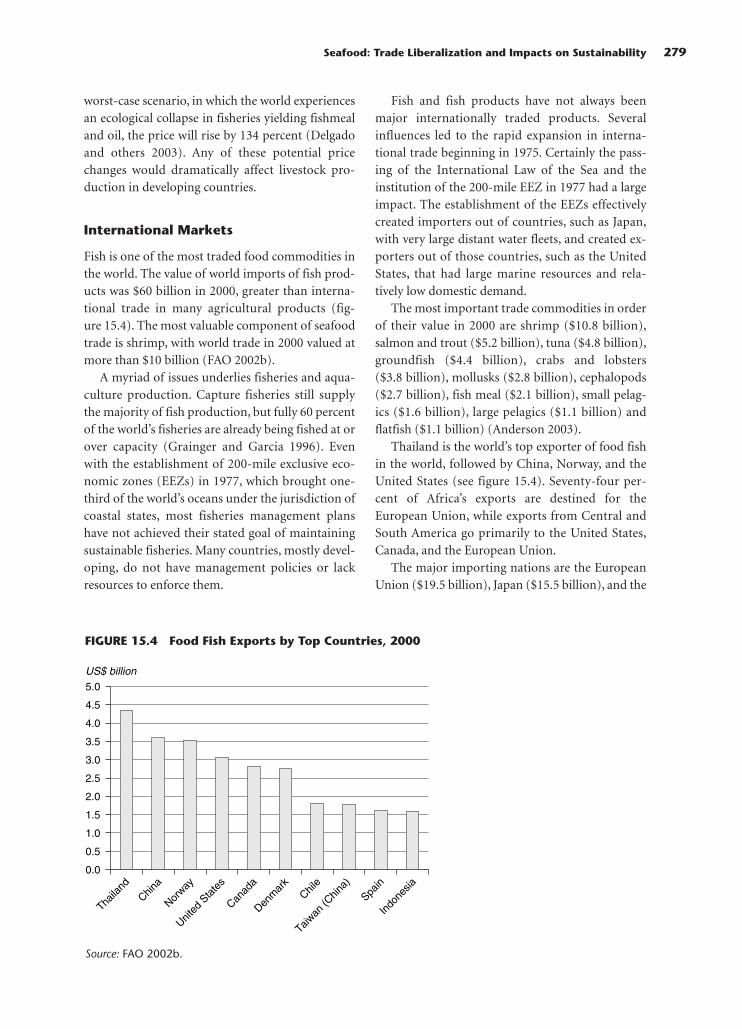
worst-case scenario, in which the world experiencesan ecological collapse in fisheries yielding fishmealand oil, the price will rise by 134 percent (Delgadoand others 2003). Any of these potential pricechanges would dramatically affect livestock pro-duction in developing countries.
International Markets
Fish is one of the most traded food commodities inthe world. The value of world imports of fish prod-ucts was $60 billion in 2000, greater than interna-tional trade in many agricultural products (fig-ure 15.4). The most valuable component of seafoodtrade is shrimp, with world trade in 2000 valued atmore than $10 billion (FAO 2002b).
A myriad of issues underlies fisheries and aqua-culture production. Capture fisheries still supplythe majority of fish production, but fully 60 percentof the world’s fisheries are already being fished at orover capacity (Grainger and Garcia 1996). Evenwith the establishment of 200-mile exclusive eco-nomic zones (EEZs) in 1977, which brought one-third of the world’s oceans under the jurisdiction ofcoastal states, most fisheries management planshave not achieved their stated goal of maintainingsustainable fisheries. Many countries, mostly devel-oping, do not have management policies or lackresources to enforce them.
Fish and fish products have not always beenmajor internationally traded products. Severalinfluences led to the rapid expansion in interna-tional trade beginning in 1975. Certainly the pass-ing of the International Law of the Sea and theinstitution of the 200-mile EEZ in 1977 had a largeimpact. The establishment of the EEZs effectivelycreated importers out of countries, such as Japan,with very large distant water fleets, and created ex-porters out of those countries, such as the UnitedStates, that had large marine resources and rela-tively low domestic demand.
The most important trade commodities in orderof their value in 2000 are shrimp ($10.8 billion),salmon and trout ($5.2 billion), tuna ($4.8 billion),groundfish ($4.4 billion), crabs and lobsters($3.8 billion), mollusks ($2.8 billion), cephalopods($2.7 billion), fish meal ($2.1 billion), small pelag-ics ($1.6 billion), large pelagics ($1.1 billion) andflatfish ($1.1 billion) (Anderson 2003).
Thailand is the world’s top exporter of food fishin the world, followed by China, Norway, and theUnited States (see figure 15.4). Seventy-four per-cent of Africa’s exports are destined for theEuropean Union, while exports from Central andSouth America go primarily to the United States,Canada, and the European Union.
The major importing nations are the EuropeanUnion ($19.5 billion), Japan ($15.5 billion), and the
Seafood: Trade Liberalization and Impacts on Sustainability 279
FIGURE 15.4 Food Fish Exports by Top Countries, 2000
Source: FAO 2002b.
0.0
1.5
1.0
0.5
2.0
2.5
3.0
3.5
4.0
5.0
4.5
Thaila
nd
China
Norway
United
Sta
tes
Canad
a
Denm
ark
Chile
Taiwan
(Chin
a)
Spain
Indo
nesia
US$ billion

United States ($10.4 billion). Within the EuropeanUnion, imports go to Spain ($3.35 billion), France($3.0 billion), Italy ($2.5 billion), Germany ($2.3billion), the United Kingdom ($2.2 billion), andDenmark ($1.8 billion) (FAO 2002b).
Crustaceans account for 19 percent of theweight of exports but 33 percent of the value. Fin-fish, by contrast, contribute 63 percent of volumebut only 45 percent of value (figure 15.5). The mostwidely traded processed seafood products are itemssuch as canned tuna, canned crab and lobstermeats, canned herring and sardines, roe (such ascaviar), shelled and deveined shrimp, and dried orsalted finfish.
Significant reexporting occurs in the worldseafood markets. Thailand, for example, imports asignificant amount of the world’s tuna catches,processes it into cans, and then exports it. Similarly,China is a major reprocessing market for U.S. andNorwegian seafood.
For low-income, food-deficit countries, exportsare far larger in value than imports. When fish mealand oil are excluded from export values, the picturechanges only slightly, since their value is not highand many of these countries do not participate infish meal or fish oil production. Among the devel-oping countries that rely on exports of seafood asa primary source for export earnings are theMaldives, Mozambique, Peru, Senegal, and SierraLeone (FAO 2002b). Thus, reductions in the stocksof fish in developing countries because of poormanagement have the potential to jeopardize thefood supply while reducing household incomes andexport earnings.
Institutional Influences on InternationalTrade in Fishery Products
Even though most caught, farmed, and traded fishare clearly food products, no fish is included in theWTO Uruguay Round Agreement on Agriculture(URAA). The concern among some nations is thatfishing as an industry involves not only marketaccess, but also resource access on a scale unprece-dented in other areas of agriculture. Therefore,negotiations regarding trade liberalization for fishhave proceeded far differently from those on agri-cultural commodities.
Tariffs on fish products, in contrast to those onagricultural products, have been reduced withevery successive trade round. And internationalagreements on sanitary and phytosanitary meas-ures, technical barriers to trade, antidumping, rulesof origin, import licensing, and safeguards haveall been applied to trade in fish. Subsidies in thefishing industry fall under the GATT (GeneralAgreement on Tariffs and Trade) Agreement onSubsidies, whereas in agriculture they fall under theURAA.
This section of the chapter discussed the domes-tic and international policies and institutions mostrelevant to global trade in fish and fish products.The domestic policy interventions are fisheriesmanagement policies, fishing subsidies, and tradebarriers, including tariffs, technical barriers totrade, sanitary and phytosanitary measures, andantidumping and countervailing measures.
Fisheries Management Policies
To fully understand the impact of trade liberaliza-tion on fishery products, one first must understandthe factors influencing supply. The impacts of tradeliberalization will differ depending on several fac-tors, including production method (capture oraquaculture) and domestic fisheries managementpolicies.
Fish in capture fisheries belong to a commonpool. Before 1977 jurisdiction of most nations overfishing grounds extended only 12 nautical milesfrom shore. Expansion to 200-mile EEZs was dis-cussed and agreed to in 1977 by nations at theThird Law of the Sea Convention (UNCLOS-III,1973–1982) (Hannesson 1996). EEZs cover 40 per-cent of the world’s oceans and 90 percent of its liv-ing marine resources (Deere 2000).
280 Global Agricultural Trade and Developing Countries
FIGURE 15.5 World Food Fish Exports byValue of Major CommodityGroup, 2000
Source: FAO 2002b.
Fish, fresh, chilled orfrozen 45%
Fish, dried, salted orsmoked 5%
Crustaceans and mollusks33%
Fish, canned 10%
Crustaceans andmollusks, canned 7%

UNCLOS assigns the exclusive right to coastalstates to manage and exploit marine living resourcesand to regulate fisheries resources through a com-prehensive management system. There is consider-able debate over the effectiveness with which coastalnations have managed their EEZs with respect tothe sustainability of production. Creating an EEZdoes not remove the common-pool property of theresource; it simply redistributes the use of theresource to new (domestic) market entrants. Manynations, especially developed nations, encouragedexpansion of the domestic fleet to increase thenational capacity to catch fish that foreign nationswould have caught in the past. Catches quickly grewas the number and size of fishing boats increased. Inensuing years, however, supplies in many fisheriesdecreased drastically as fish stocks were reducedbeyond the sustainable limit and the remaining fishbecame harder to find.
An often-quoted statistic is that fully 60 percentof the world’s major fisheries resources are alreadybeing exploited at or above capacity (Grainger andGarcia 1996). Fish stocks in OECD (Organisationfor Economic Co-operation and Development)countries, in particular, have been subject to largefishing pressure over the years and are mostly over-fished (OECD 2003b). The problem derives notfrom a lack of regulations per se, but rather from alack of effective regulations.
In a fishery where there is no restriction onentry into fishing, the management system (or lackof it) is referred to as open access. It is well knownfrom economic theory and experience that openaccess will lead to overexploitation of the fish stock,as individual fishermen have little incentive torestrain their fishing efforts to promote a sustain-able fishery, because the fish forgone by one fisher-man will simply be captured by someone else(box 15.1). Most fisheries in the United States andEuropean Union operate under some form of lim-ited access or limited harvest.
Management policies can be categorized asbeing either an input or output control. Input con-trols, the oldest type of fishery management tool,are designed to limit either the number of peoplefishing or the efficiency of fishing (NationalResearch Council 1999). Input controls generallylead to inefficient outcomes. They raise the cost offishing but generally do not reduce effort orcapacity.
Output controls are designed to limit directlythe volume of the catch from a given fishery. Thecritical necessity for this form of management isthe ability to monitor the catch. In some fisheries,managers may have personnel at the dockside tocount the number (or weight) of fish caught as theyare landed. In other cases, on-board observers maymonitor the catch. In either case, once the totalallowable catch (TAC) is reached, the fishery is gen-erally closed for the season.
Management by TAC has at least three short-comings. First, it induces fishers to compete to catchas much as possible before the TAC is reached. Sec-ond, as fishers become more intensively capitalized,the TAC is reached in a shorter time, leading to abacklog of fish for processors that pushes downfishermen’s prices and reduces product quality.Third, idle vessels may move to fish in another fish-ery, leading to overcapitalization in yet additionalfisheries (Conrad 1999).
The management systems of fisheries havecaused vexing trade and environment issues, andseveral cases have landed before dispute panels dis-cussions with the WTO and format GATT. The dis-putes below (drawn from Robb 2001) were directlyrelated to fisheries management policies.
• Canada v. U.S.—Prohibition of Imports of Tunaand Tuna Products from Canada, 1982.
• Canada v U.S.—Measures Affecting Exports ofUnprocessed Herring and Salmon, 1988.
• Mexico v. U.S.—Restrictions on Imports of Tuna(Tuna/Dolphin I), 1991.
• European Economic Community and Netherlandsv. U.S.—Restrictions on Imports of Tuna (Tuna/Dolphin II), 1994.
• India, Malaysia, Pakistan, and Thailand v. U.S.—Import Prohibitions of Certain Shrimp andShrimp Products—1998.
Because of poor management and other factors,the status of fish stocks worldwide is alarming. Theimplications of trade liberalization for capture fish-eries are many, but the most obvious implication isthat the current level of catches from capture fish-eries is unsustainable. Should trade liberalizationprovide incentives to fishermen to catch even morefish, it would simply speed up the overfishing anddepletion process, leading to unsustainable interna-tional markets as well. This is not to say that further
Seafood: Trade Liberalization and Impacts on Sustainability 281

liberalization should not occur, but rather thatoverfishing and other externalities must be consid-ered in free-trade discussions.
Fishing Subsidies
The most sensitive issue related to capture fisheriesbefore the WTO Committee on Trade and the Envi-ronment (CTE) is fishing subsidies. Subsidies existin the fishing sector globally and have come to berecognized as having a significant impact on thequantities of fish traded, largely because they lead tounsustainable fishing practices. At the WTO High-Level Symposium on Trade and Environment inMarch 1999, five WTO member nations (Australia,Iceland, New Zealand, the Philippines, and theUnited States) submitted a joint statement on theneed to eliminate “environmentally damaging and
trade-distorting subsidies” in the fisheries sector(WTO 1999, 2000, 2001). In 2001, at the FourthMinisterial Conference in Doha, Qatar, the WTOexplicitly included fisheries subsidies in the negoti-ating agenda to improve current discipline onsubsidies—this as a result of discussions in theCTE. The Doha Declaration states that the need to“clarify and improve WTO disciplines on fisheriessubsidies, taking into the account the impor-tance of this sector to developing countries” (WTO2003a: 28).
In an excellent review of fisheries subsidies,Schrank (2003: 49) cites three implications.
Three implications are noted: (1) countries thatdo not subsidize and that restrain total catch tomaintain the resource lose the extra catch tocountries that subsidize and do not restrain total
282 Global Agricultural Trade and Developing Countries
BOX 15.1 Impacts of Trade Liberalization in Uganda’s Fishing Industry
Economywide liberalization and reforms inUganda’s trade regimes have made the fisheriesindustry one of the country’s most important interms of employment and export earnings. Thefisheries sector is Uganda’s second-largestnational export producer, with export valuesgrowing from $1.4 million in 1990 to $78 mil-lion by 2001 (UNEP 2002a). More than 1 millionworkers are directly engaged in harvesting,transporting, processing, distributing, and mar-keting fish (UNEP 1999b).
With success have come problems common tofishing industries elsewhere. Uganda’s fish comefrom the country’s many lakes and rivers. Currentlegislation allows open access to lake fishing.There are relatively few restrictions on who mayfish, and few technical measures to control fishingmortality. Poor data make it difficult to determinethe amount of fish that can be taken withoutdepleting the stocks beyond a sustainable level,particularly in Lake Victoria, which borders notonly Uganda but also Kenya and Tanzania. Thus ithas been difficult to establish harvest limits. TheU.N. Environment Programme recommends thatUganda should determine the level of fish stocksit currently has, establish a total allowable catchthat is in line with sustainable harvests in each ofthe major water bodies, and implement an indi-vidual transferable quota system.
Overfishing is not the only problem inUganda. According to UNEP, unsustainable fish-
ing practices are on the rise, as the catch ofnative fish has declined. For example, exoticspecies are being introduced to lakes and rivers.In another example, poisons are being used, ille-gally, to stun the fish, bringing them to the sur-face, making them easy to scoop up in nets. Thepoisoning has led the European Union to imposea ban on fish exports from Uganda due to foodsafety concerns.
Other issues related to food safety include alack of refrigeration facilities to preserve fish afterharvest. Transportation to processing facilities ismade difficult and slow by poor road conditions,further degrading the quality and safety of thefish prior to processing.
Other environmental concerns include efflu-ent pollution from fish-processing industries.Raw, untreated waste is dumped directly intothe very rivers and lakes from which the fish arebeing pulled, contaminating the environmentsfor tomorrow’s catch.
Social problems also threaten the fishingindustry, as most of the products are destinedfor export markets, where they fetch higherprices. Much of the local population can affordonly fish rejected by processors for the exportmarket. Food security concerns have beenraised, as well, as Nile perch feed heavily onfreshwater shrimp that are also caught and usedas animal feed.
Source: UNEP 1999b.
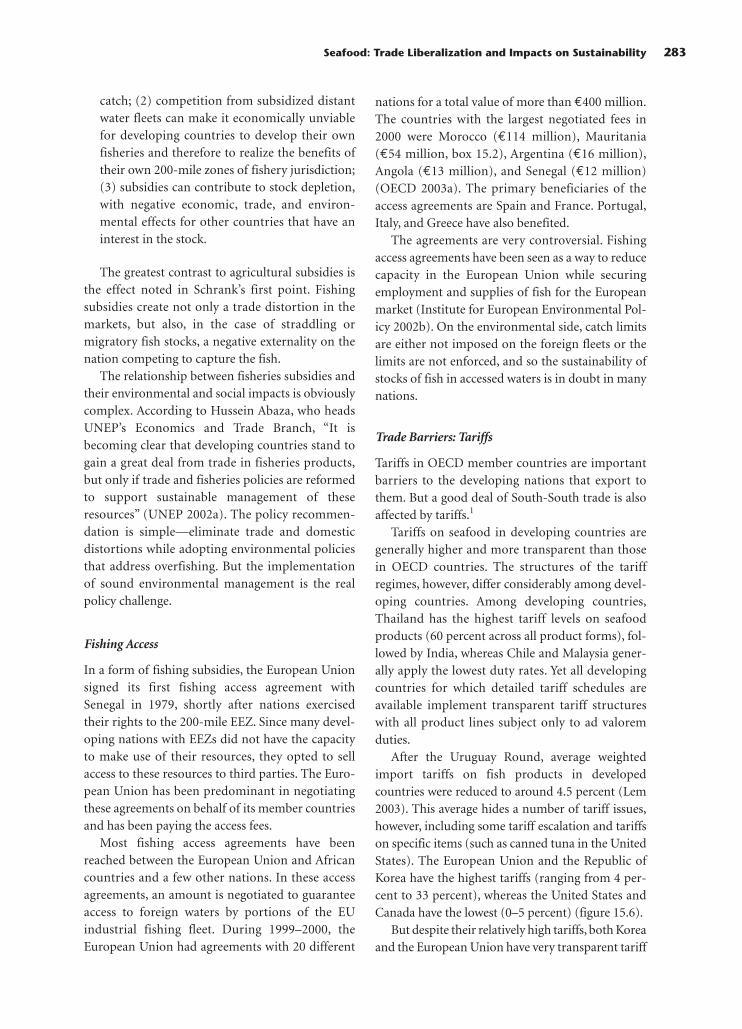
catch; (2) competition from subsidized distantwater fleets can make it economically unviablefor developing countries to develop their ownfisheries and therefore to realize the benefits oftheir own 200-mile zones of fishery jurisdiction;(3) subsidies can contribute to stock depletion,with negative economic, trade, and environ-mental effects for other countries that have aninterest in the stock.
The greatest contrast to agricultural subsidies isthe effect noted in Schrank’s first point. Fishingsubsidies create not only a trade distortion in themarkets, but also, in the case of straddling ormigratory fish stocks, a negative externality on thenation competing to capture the fish.
The relationship between fisheries subsidies andtheir environmental and social impacts is obviouslycomplex. According to Hussein Abaza, who headsUNEP’s Economics and Trade Branch, “It isbecoming clear that developing countries stand togain a great deal from trade in fisheries products,but only if trade and fisheries policies are reformedto support sustainable management of theseresources” (UNEP 2002a). The policy recommen-dation is simple—eliminate trade and domesticdistortions while adopting environmental policiesthat address overfishing. But the implementationof sound environmental management is the realpolicy challenge.
Fishing Access
In a form of fishing subsidies, the European Unionsigned its first fishing access agreement withSenegal in 1979, shortly after nations exercisedtheir rights to the 200-mile EEZ. Since many devel-oping nations with EEZs did not have the capacityto make use of their resources, they opted to sellaccess to these resources to third parties. The Euro-pean Union has been predominant in negotiatingthese agreements on behalf of its member countriesand has been paying the access fees.
Most fishing access agreements have beenreached between the European Union and Africancountries and a few other nations. In these accessagreements, an amount is negotiated to guaranteeaccess to foreign waters by portions of the EUindustrial fishing fleet. During 1999–2000, theEuropean Union had agreements with 20 different
nations for a total value of more than €400 million.The countries with the largest negotiated fees in2000 were Morocco (€114 million), Mauritania(€54 million, box 15.2), Argentina (€16 million),Angola (€13 million), and Senegal (€12 million)(OECD 2003a). The primary beneficiaries of theaccess agreements are Spain and France. Portugal,Italy, and Greece have also benefited.
The agreements are very controversial. Fishingaccess agreements have been seen as a way to reducecapacity in the European Union while securingemployment and supplies of fish for the Europeanmarket (Institute for European Environmental Pol-icy 2002b). On the environmental side, catch limitsare either not imposed on the foreign fleets or thelimits are not enforced, and so the sustainability ofstocks of fish in accessed waters is in doubt in manynations.
Trade Barriers: Tariffs
Tariffs in OECD member countries are importantbarriers to the developing nations that export tothem. But a good deal of South-South trade is alsoaffected by tariffs.1
Tariffs on seafood in developing countries aregenerally higher and more transparent than thosein OECD countries. The structures of the tariffregimes, however, differ considerably among devel-oping countries. Among developing countries,Thailand has the highest tariff levels on seafoodproducts (60 percent across all product forms), fol-lowed by India, whereas Chile and Malaysia gener-ally apply the lowest duty rates. Yet all developingcountries for which detailed tariff schedules areavailable implement transparent tariff structureswith all product lines subject only to ad valoremduties.
After the Uruguay Round, average weightedimport tariffs on fish products in developedcountries were reduced to around 4.5 percent (Lem2003). This average hides a number of tariff issues,however, including some tariff escalation and tariffson specific items (such as canned tuna in the UnitedStates). The European Union and the Republic ofKorea have the highest tariffs (ranging from 4 per-cent to 33 percent), whereas the United States andCanada have the lowest (0–5 percent) (figure 15.6).
But despite their relatively high tariffs, both Koreaand the European Union have very transparent tariff
Seafood: Trade Liberalization and Impacts on Sustainability 283

structures.All tariffs applied on seafood products aread valorem duties. In comparison, Japan and theUnited States implement more complex tariff struc-tures. In Japan about 20 percent of the tariff lines onintermediate seafood products are either per-unit-specific or compound duties. Similarly, 38 percent ofU.S. tariff lines on intermediate seafood products areper-unit-specific or compound. The U.S. tariffs donot seem to be aimed at concealing protection, sincetheir average ad valorem equivalent is only a littlemore than 2 percent. At the same time, the productsthat receive tariff protection in the United States,such as canned tuna, are protected only throughhigh ad valorem tariffs.
Most industrial countries offer preferentialaccess to developing countries’ seafood exports.
The European Union offers free access to allseafood products from the least-developed coun-tries and partial tariff exemption to most ofseafood exports from Africa-Caribbean-Pacific(ACP) countries and other developing countries.The United States grants free access for all develop-ing countries for all seafood products. Japan alsogrants free access to some seafood imports from theleast-developed countries and maintains only oneseafood tariff line for other developing countries(table 15.1).
Table 15.1 shows that the trade-weighted tariffaverages across the OECD countries exhibit sometrade escalation for imports from developing coun-tries and all other countries, but not for the least-developed countries. However, in the context of
284 Global Agricultural Trade and Developing Countries
BOX 15.2 Foreign Fishing Access Agreements Involving Mauritania
The fishing sector in Mauritania accounts formore than 40 percent of exports and about6 percent of gross domestic product. The onlymajor export items are squid and octopus, withan export value of $68 million in 2000 (FAO2002b). Only $639,000 were fish productsexported in processed form and that was fordried, salted, or smoked products. Total fishproduct exports were $74 million.
The primary source of earnings from the fish-ery sector in Mauritania is not from exports butfrom access fees. The European Union pays forits fleet to fish in Mauritanian waters. In a senseone might say that Mauritania exports its fish re-sources, while they are still in their habitat, di-rectly to the European Union fishing fleet. Eightypercent of fish in Mauritania, or 450,000 tons,were landed by industrial vessels in 2001 (WWF2003). A new agreement on fishing access byThe European Union was enacted in 2001 andis effective until August 2006. The EuropeanUnion is paying €430 million, creating accessto Mauritanian water for 248 vessels, target-ing hake, squid, crawfish, and tuna. The EUvessels are predominately from Spain andFrance, but also from Italy, Portugal, Greece, theNetherlands, Germany and, to a minor extent,Ireland.
In addition to the access fees, vessel ownersare required to pay €29 per ton of catch takenby freezer tuna seiners, and €19 per ton forcatches from pelagic fish trawlers. A license fee isalso payable, based on tonnage per year in somecases and a flat annual fee for tuna vessels.
In response to critics, the European Union hasbegun to increase the value of the access pay-ments (for Mauritania up 61 percent over theprevious agreement) and to work toward agree-ments that promote sustainable development ofthe fisheries in the target nations. To that end,the agreements, by design, allow the Mauritan-ian authorities to inspect and control fishingactivities—requiring a daily log of catches by theforeign vessels and setting up a system ofobservers on board vessels. These opportunitiesfor Mauritania are not fully taken advantage of.Restricted fishing zones have increased in size.There remain no catch limits.
Determining economic benefits for eitherparty to the agreement is uncertain, as there islittle information on catch statistics. However,based on the previous agreement between theEuropean Union and Mauritania, for each europaid to Mauritania in 1996, the value of thecatch was two times greater. In 1997, the valueof the catch was three times greater than thecost of access. Little of the access moneyappears to be utilized to build within Mauritaniaa domestic infrastructure to nationalize itsresources rather than selling foreign access. Inaddition, reports from nongovernmental organi-zations, such as the World Wildlife Fund, indicatethat the agreements have negative effectson local communities and on sustainabledevelopment.
Source: Institute for European EnvironmentalPolicy (2002a and b);www.integratedframework.org.

tariffs on agricultural goods, tariffs in seafoodproducts are lower and the level of tariff escalationis very moderate.
Trade Barriers: Technical Barriers
In recent years, there has been a large increase inpolicies that could potentially come under theheading of technical barriers to trade. Among themare labeling programs and the resultant tracingcapability they require. The programs are typicallyfound in developed countries but can have poten-tially large impacts on developing countries.
Among the labeling programs are ecolabeling,country-of-origin labeling, and other labelingrelated to the production process, such as “organic.”
A great deal of regulatory activity concerningcountry-of-origin labels is occurring in the UnitedStates and European Union. Ecolabeling andorganic labeling are voluntary programs, but theWTO is interested in whether such labels constitutea nontariff trade barrier. Currently, these labels arenot considered to be trade barriers as long as theyare nondiscriminatory (WTO 2003b).
Trade Barriers: Sanitary and PhytosanitaryMeasures
Import regulations based on hazard-analysis,critical-control-point (HACCP) principles, adoptedby many of the major importing nations, areregarded as nontariff barriers by many developing
Seafood: Trade Liberalization and Impacts on Sustainability 285
FIGURE 15.6 Tariff Structure by Level of Processing, (1998–2001)
Source: WTO IDB database.
0
5
10
20
15
Canada United States Japan EU Korea, Rep. of
Average of all Tariffs
Raw Inter Final
TABLE 15.1 Trade-Weighted Tariff Averages for Developing Countries’ Fish ProductExports to OECD Countries, by Processing State(percent)
Level of Processing Least-Developed Developing All Other
All 2.5 2.9 3.2Unprocessed 2.5 2.5 2.5Fillets 2.8 2.5 2.0Semi-processed 0.5 1.9 1.4Processed 1.7 4.3 8.0Total value (US$ millions) 437 10,689 21,992
Source: OECD 2003a.

countries, as the investment required to bring pro-cessing plants up to code can be substantial (Filhol2000). During 1997–98, the European Union im-posed bans on the import of seafood from India,Bangladesh, Kenya, Madagascar, Mozambique,Tanzania, and Uganda, citing food safety concernsboth in processing and in possible contaminationprior to catch in both capture fisheries and aquacul-ture (Filhol 2000).
For example, most of the fish caught in Kenyaare from Lake Victoria; the majority of that catch isNile perch (FAO 2002b).2 Nile perch are also themain export from Kenya, earning about $50 mil-lion annually. Of the 18 fish processing and export-ing firms now in Kenya, 10 specialize in Nile perchand 8 in marine products such as shrimp, othercrustaceans, and tuna. In 1997 the European Unionbecame concerned about the safety of fish fromKenya when Spain and Italy both banned fishimports because of the presence of salmonella.Some other members of the European Union con-tinued to import from Kenya, but exports declinedby 34 percent between 1996 and 1997. In 1998 theEuropean Union banned imports of fish fromKenya because of a cholera outbreak, causing a66 percent drop in fish exports to the EuropeanUnion. In 1999 the European Union banned fishfrom Lake Victoria yet again, this time because ofthe presence of pesticides, causing another 68 per-cent decline in fish exports. In 1997 Kenyan exportswere $52 million, in 1998 $39 million, and in 1999$32 million. In 2000 they were back up to $39 mil-lion (FAO 2002a).
In response to the requirement for a HACCPprogram to export to many nations, Kenya hasinstituted stringent quality control procedures. TheFisheries Department controls quality though pro-visions of the Kenya Fisheries Act and the FishQuality Assurance Regulation of 2000. However,fish quality comes at a cost. There are strict regula-tions on production, handling, processing, packag-ing, and transportation of fishery products. Inaddition, strict regulations govern construction ofbuildings, equipment, purification tanks, and stor-age facilities. Costs were incurred to train workersin hygiene related to fish handling. There is also theadditional cost of electricity to maintain strict tem-perature controls. Finally, the cost to fishermen issignificant. They must invest in newer boats thathave chillers to maintain the quality of caught fish.
Kenya has adapted to the new realities byrestricting the number of facilities handling fish tobe exported. Only five fishing villages (out of nearly300) are authorized to handle fish landings. Thiscauses fishermen from elsewhere to incur highertransportation costs to land their catch.
The costs of exporting to nations with strictquality controls are not trivial, but Kenya has had toincur those costs to remain in the internationalmarket. As long as Nile perch continues to be indemand in the world market, it is likely that Kenyanproducers can more than cover their costs. Shouldthe prices rise too far, however, other white-fleshedfish will become competitive substitutes. The inter-national seafood market in white-fleshed fish isvery competitive, particularly now that farmedtilapia and catfish are available in large quantities.
Trade Barriers: Antidumping and CountervailingMeasures
As tariff barriers have been relaxed and the aquacul-ture industry has boomed globally, more and morefishing industries in the United States have foundthemselves competing with lower-priced imports.Thus, the United States in particular has been quiteactive in pursuing antidumping and countervailingduty suits against foreign competitors. The UnitedStates brought antidumping and countervailingcharges against imports of Norwegian farmedsalmon in 1990, Chilean farmed salmon in 1997,crawfish from China in 1997, and farmed catfishfrom Vietnam in 2003. A petition was filed with theU.S. International Trade Commission (USITC) inDecember 2003 against six exporters of farmedshrimp. Details on several of these cases follow.
Crawfish from China. The imported product wasdefined as freshwater crawfish tail meat in all itsforms, grades, and sizes. China supplied 62 percentof all imports by the United States in 1997 and92 percent in 2001. U.S. production of crawfish in1996 was 12.5 million pounds; in 1997, 23 millionpounds (U.S. Department of Commerce 1997).Meanwhile imports of crawfish from China were2.6 million pounds in 1996 and 5.8 million poundsin 1998.3 The average value per pound of importsfrom China was $1.85 in 1997, compared with$5.82 per pound for the domestically producedproduct. As a result, antidumping duties of
286 Global Agricultural Trade and Developing Countries

223.01 percent were imposed (USITC 2003b).However, Chinese crawfish continue to dominateimports to the U.S. market, with sales of 8 millionpounds in 2001 and 7.5 million pounds in 2002,worth a total of $38.7 million in 2001 and $22.2million in 2002. The ruling was reviewed in 2003,and it was determined that the antidumping dutiesshould remain in place.
Catfish from Vietnam. In 2002, independentprocessors and the Catfish Farmers of America, atrade association of U.S. catfish farmers and proces-sors, brought a petition to the USITC regardingdumping of frozen catfish fillets into the U.S. mar-ket by Vietnam. Catfish farming is the largest aqua-culture industry in the United States. Production in2000 was 150.6 million pounds (USITC 2003a).The primary producing states are Mississippi,Arkansas, Louisiana, and Alabama. Prior to 1999imports were largely absent from the U.S. market.In 1999, Vietnam exported fewer than 2 millionpounds of what the Vietnamese call catfish into theU.S. market. By 2001 that number had increased to15.9 million pounds. Although the Vietnameseproduct was successfully labeled and marketed ascatfish, the Latin names of the imported specieswere Pangasius bocurti, Pangasius pangasius, andPangasius micronemus. American catfish are fromthe Ictaluridae family.
A problem in world markets for fish is that oncefish is processed, it is very difficult to determine itsspecies. Some fish marketed as red snapper are not,in fact, red snapper, a high-value fish. Due to manycases of intentional and unintentional fraud inseafood markets, in which consumers were falselyled to believe that they were buying a certain prod-uct or confused by the same product being mar-keted under different names, the U.S. Food andDrug Administration has become more rigorous inits regulations of appropriate names for fish.
Vietnam is now required to label its fish not ascatfish, but instead as basa and tra.1 However,Vietnamese basa and tra are still considered similarenough to American catfish to be subject toantidumping measures. Producers have had to payantidumping duties of between 36.84 percent and63.88 percent.
Shrimp from some developing countries. As ofDecember 2003, the Southern Shrimp Alliance
(SSA), a group of shrimp harvesters and processorsin the United States, filed antidumping petitionswith the USITC, alleging that Brazil, China,Ecuador, India, Thailand, and Vietnam were dump-ing shrimp (primarily farmed) with an approximateannual value of $2.4 billion into the U.S. market.The SSA is petitioning for tariffs on imports ofshrimp from these countries ranging from 30 per-cent to 267 percent. It argued that “a variety offinancial incentives provided by national govern-ments and international institutions over a numberof years have overstimulated the infrastructure andproduction of farm-raised shrimp in these coun-tries” (emphasis added) (McGovern 2003). Thus itseems that the investment by organizations such asthe World Bank and others in helping build anexport industry in some of these countries is per-ceived to have created unfair subsidies for theseshrimp-exporting nations.
Impacts of Trade and DomesticPolicy Reforms
The previous section makes clear that the primarytrade barriers for capture and aquaculture fisheriesare tariffs, countervailing and antidumping meas-ures, and the discriminatory potential of ecolabel-ing, country-of-origin labeling, and sanitary andphytosanitary measures for seafood safety.
To analyze the impacts of trade liberalization ontrade in seafood, particularly on seafood fromdeveloping countries, one must distinguish betweenthe impacts of trade liberalization on seafood de-rived from capture fisheries and on seafood fromaquaculture. This is because of their distinct attrib-utes. Capture fisheries are generally ill-managed. Assuch, changes in trade policies may create changesin welfare that differ between the short and long runbecause of the sustainability of fish stocks. Withrespect to the effects of trade liberalization, aquacul-ture is more similar to agriculture. However, to theextent that aquaculture is dependent on feed de-rived from capture fisheries or seed stock from wildfisheries, trade liberalization may have a differenteffect on aquaculture than on agriculture.
Whereas the research literature on markets forfish is extensive (Wessells and Anderson 1992;Kinnucan and Wessells 1997), there has been littleempirical analysis of the impacts of trade liberaliza-tion through tariff reductions related to fish and
Seafood: Trade Liberalization and Impacts on Sustainability 287

fish products. This is partly because of the complexnature of the global seafood market, partly becauseof a lack of data, and partly because of a govern-mental and academic focus diverted away fromseafood markets toward the economics of manage-ment of capture fisheries. In addition, althoughnongovernmental organizations and internationaldevelopment agencies have produced many studieson trade liberalization and its impacts on the agri-cultural sector in developing countries, there isa spectacular lack of quantitative information onthe impacts of trade liberalization for developingcountries with respect to fish.
The study by Cox, Stubbs, and Davies (2000) isthe notable exception. This section begins by dis-cussing its findings on trade liberalization in AsiaPacific Economic Cooperation (APEC) countries.
Trade Liberalization in APEC Countries
Cox, Stubbs, and Davies (2000) investigate theshort-run effects of trade liberalization on seafoodproducts in the APEC countries. These countriesmaintain a tariff and other trade barriers againstfish and fish products. With the conclusion of theUruguay Round, WTO member nations agreed tolower tariff rates. However, the APEC agenda wasmore ambitious. Under the 1994 Bogor Declara-tion, APEC made a commitment to fully liberalizeall markets by 2020, with 2010 as the deadline fordeveloped countries. This was followed by “early,voluntary sectoral-liberalization” (EVSL) proposalsin which nine sectors, including fisheries, wouldaccelerate tariff removals beyond the Bogor Decla-ration. Rather than having 2010 and 2020 as dead-lines for developed and developing countries,respectively, the timeline was moved to December31, 2005.
Cox, Stubbs, and Davies (2000) developed asimulation model to evaluate the impact of seafoodtariff removals under the Bogor Declaration, EVSL,and another scenario wherein only the developedcountries in APEC would remove their tariffs whilethose of developing countries remained the same.The model included all the APEC countries and therest of the world as sources and destinations.Seafood products were generally grouped togetherexcept for a focus on species particularly importantto Australia such as tuna, lobsters, and shellfish.
As expected the results show that there would besignificant increases in export volumes (and prices)under the Bogor Declaration and the ESVL relativeto the baseline. If only the developed countriesremoved their tariffs, the simulation shows thatthere would be little difference from the baselinebecause developed-country tariffs are generallysmall. The greatest change would occur under theEVSL scenario, at least initially. By 2020 the effectsof the Bogor and EVSL agreements would be thesame (tables 15.2 and 15.3).
Significant benefits from import tariff reduc-tions accrue to the “Other APEC” countries ofBrunei, Indonesia, Malaysia, Mexico, New Zealand,Papua New Guinea, the Philippines, the RussianFederation, Singapore, and Vietnam.
Removing Subsidies in Capture Fisheries
The previous section discussed the types of subsi-dies found in the fishing sector and the concern ofthe WTO CTE about fishing subsidies as a potentialdistorter of trade and contributor to unsustainabil-ity of fish stocks around the globe. To analyze thetrade impacts of these subsidies, a logical place tobegin may be to calculate producer subsidy equiva-lents (PSEs). According to the OECD,“the PSE is anindicator of the value of the transfers from domes-tic consumers and taxpayers to the producersresulting from a given set of agricultural policies ata point in time” (FAO 2003).
The PSE also may be useful in assessing theadvantages of producer subsidies in the fisheriessector. The complicating factor is management. Inagriculture, it is assumed that subsidies are com-pared to a subsidy-free world characterized by eco-nomically efficient allocation of goods at variousprices. However, if the fishery is managed under anopen-access system, for example, then the subsidy-free world is not economically efficient, becausethat system does not lead to efficient allocation. Tobe truly efficient, the subsidies would not exist andthere would be perfect management of fish stocksso that all negative externalities were incorporatedinto the price of each fish. PSEs for fisheries prod-ucts have not been calculated because fish arehighly heterogeneous and reference prices tomeasure market-price support are hard to pindown.
288 Global Agricultural Trade and Developing Countries

Seafood: Trade Liberalization and Impacts on Sustainability 289
TABLE 15.2 Simulated Changes in the Real Value of World Exports in 1995 Prices(percent)
Annual Growth Developed APEC
in Base EVSL Bogor Countries
Type of Export (1995–2020) 2010 2020 2010 2020 2010 2020
UnprocessedTuna 1.3 5.0 4.8 1.5 4.8 1.6 1.5Other fish 8.2 32.4 28.0 0.4 28.0 −1.9 −1.9Rock lobster 1.4 1.5 1.5 0.7 1.5 0.7 0.7Prawns 2.6 11.3 15.5 0.4 15.5 0.4 0.4Other crustaceans 7.1 38.5 51.2 1.3 51.2 1.3 0.7Abalone 3.4 20.2 21.9 2.6 21.9 2.6 2.0Scallops 6.2 15.5 23.5 0.5 23.5 0.6 0.1Other mollusks 3.9 22.5 23.7 1.3 23.7 1.3 1.4
ProcessedTuna 2.4 0.4 0.8 0.3 0.8 0.3 0.3Other fish 4.4 11.7 17.0 2.6 17.0 2.6 1.5Rock lobster 0.4 0.0 0.0 0.1 0.0 0.1 0.0Prawns 1.2 0.6 0.7 0.3 0.7 0.3 0.3Other crustaceans 1.6 0.4 0.4 0.4 0.4 0.4 0.4Mollusks 3.0 8.4 9.4 4.0 9.4 4.0 3.9Total 5.1 20.4 24.1 1.0 24.1 0.2 −0.4
Source: Cox, Stubbs, and Davies 2000.
TABLE 15.3 Simulated Benefits from Tariff Reductions, by Country(percent)
Growth Developed EVSL and Developedin Base EVSL Bogor APEC Countries Bogor APEC Countries
Country (1995–2020) 2010 2010 2010 2010 2010
Australia 2.7 0.0 0.1 0.1 0.7 0.1Canada 2.4 1.9 0.1 0.0 5.9 0.1Chile/Peru 0.2 0.0 0.0 0.0 0.4 0.0China 9.1 0.0 0.0 0.0 −0.3 0.0Hong Kong (China) 4.8 −0.3 0.0 0.0 −1.4 0.1Japan 1.9 −0.3 −0.2 −0.2 0.0 −0.3Korea, Rep. of 3.7 1.1 0.1 0.0 2.5 0.0United States 1.7 0.6 0.0 0.0 2.9 −0.1Other APEC 4.6 1.0 0.0 −0.1 0.9 −0.2Total APEC 5.4 0.2 0.0 0.0 0.2 −0.1Non-APEC 1.8 0.2 0.0 0.0 0.7 0.0World 4.0 0.2 0.0 0.0 0.4 0.0
Note: These benefits represent changes in the sum of consumer surplus, producer surplus, and importtariff revenue.Source: Cox, Stubbs, and Davies 2000.

The impact of removing subsidies may be ana-lyzed according to the type of subsidy. For subsidiesthat lower the costs of production (such as govern-ment-paid fishing access fees, low-cost vessel con-struction loans, and tax exemptions), removal willincrease costs of production. A large portion ofthe world’s subsidized fishing fleet is from theEuropean Union, Japan, Russia, China, and othernations that subsidize (Milazzo 1998). A reductionin these subsidies would almost certainly benefitfish stocks—as well as decreasing trade.
Milazzo (1998) provides an excellent summaryof the benefits to developing nations of removingsubsidies.
• Subsidies that pay for access arrangementssupport continued operations primarily byEuropean and East Asian distant-water fleetsoff Africa and in the Western Pacific. Thesesubsidized operations reduce the fishing oppor-tunities available to local fishermen. In mostcases, the payments probably do not compensateadequately for the full economic value of theresources.
• There is scattered evidence that subsidizedaccess arrangements are beginning to compro-mise local food needs.
• The combination of developed countries’ subsi-dies to their distant-water fleets and to theirdomestic (coastal) fleets minimizes to someextent trade opportunities that should be avail-able to developing countries.
• Fishing subsidies are highly nontransparent inthe sense that more than three-quarters of thesubsidies are not budgeted, and a good share ofbudgeted subsidies are controlled by govern-mental agencies other than those responsible forfisheries.
• Environmentally harmful subsidies outweighthe effect of subsidies that are environmentallybenign or positive. Milazzo’s estimates show thatpossibly no more than 5 percent of all subsidiessupport conservation.
Influence of Management Regime on Effects ofTrade Liberalization in Capture Fisheries
An alternative means of looking at impacts of tradeliberalization is to assess their implications un-der different management programs. Rögnvaldur
Hannesson (OECD 2003a) has investigated theeffects of liberalizing trade in fish, fishing services,and investments in fishing vessels. Three styles offisheries management are defined: open access,catch control, and efficient management. As we sawearlier, under open access fishermen are free torespond to prices by increasing or decreasing theircatch. Increased prices will invite entry into thefishery by more participants, so that in the long runthe fishery will be overfished. Under catch controland efficient management, total supplies are fixedand will not change with changes in prices. This isbecause a TAC will have been set to guide the fish-ing effort and guarantee a sustainable fishery. Thedifference between catch control and efficient man-agement is that the TAC catch control imposes noconstraint on each fisherman, who retains theincentive to catch as much as he can, as fast as hecan, before the TAC is reached and the fisheryclosed. Catch control alone is economically in-efficient because it allows too many fishermen inthe fishery, and the capitalization and effort aretoo high.
If trade barriers are removed—that is, if fish-importing countries lift their barriers—pricesdecline in the importing country and rise in theexporting country to a global equilibrium (account-ing for transportation costs). What are the impactsof such a development, assuming adequate manage-ment measures? Table 15.4 shows the expectedoutcome.
The “double dividend” refers to the gain in theimporting country from getting fish at a lowerprice and redirecting resources from the domesticfishing industry to higher-value uses. Althoughthere is no reason to assume that both the import-ing and exporting countries share the same type ofmanagement regime, if both have an effectiveregime then the results will be very similar to theclassic outcome of agricultural trade liberalization.
With open access and catch control, underwhich a change in prices induces increased effort inthe exporting country, it is conceivable that a coun-try could end up worse off with trade liberaliza-tion (Brander and Taylor 1997a, 1997b, 1998;Hannesson 2000). This is because the total quantitycaught in the open-access fishery will increase atfirst but then decline as the fishery becomes over-fished. With a decline in prices resulting from theelimination of import barriers, however, the effort
290 Global Agricultural Trade and Developing Countries

in the importing country would be likely to decline,giving fish stocks a chance to recover. This is notnecessarily the predicted outcome. Indeed, in manycases, as the price of fish has decreased, fishermenhave actually increased their effort to maintain totalrevenue, at least in the short run.
The results above were premised on two sepa-rate stocks of fish—one in the importing countryand one in the exporting country. The discussioncan be made much more complicated by assumingthat several countries share the resource.
Consider the European Union and Uganda astrading partners. Much of Uganda’s fisheries prod-ucts come from Lake Victoria and are exported tothe European Union. Uganda has an open-accessmanagement regime on Lake Victoria and sharesthe lake with Kenya and Tanzania. If trade were tobe liberalized, the amount traded would increase.Fishing pressure on Lake Victoria and its stock ofNile perch would increase, putting further pressureon the fish stock from both Uganda and Kenya. Theprice of the fish would rise as fewer and fewer fishwere found. Food security would decline as thelocal community found it increasingly difficult toafford Nile perch. Unless some type of enforcementmanagement regime were set up to limit total catchfrom the lake, this source of export earnings mightbe short-lived. Holding all else constant, trade lib-eralization would deplete stocks in Lake Victoriamore quickly than if trade were not liberalized.
Impact of Trade Liberalization in Aquaculture
The implications of trade liberalization in aquacul-ture would likely be very similar to those in agricul-ture, because aquaculture shares many of theresource constraints and externalities of agriculture(tables 15.5 and 15.6). Certainly, if tariffs in theEuropean Union, the Republic of Korea, and Japanwere reduced, the quantity of aquacultured prod-ucts sold to those countries would grow.
The concern among many is that increased tradein cultivated shrimp has had a large and negativeeffect on the environment and that the effect riseswith production and exports. The same is true forsalmon farming. Chile, Norway, Scotland, Canada,and Ireland are the largest producers of farmedsalmon, with Chile and Norway being by farthe largest. Environmental groups are concernednot only about pollution but also about effects onthe genetic diversity of wild fish from escapedfarmed fish that may not be indigenous to the area(Porter 2003).
Both salmon and shrimp production rely on fishmeal for feed. Any increase in aquaculture produc-tion of either species will have an impact ondemand for fish meal. I have already discussed thevarious issues associated with fish meal production,including the growing concern that the stocks offish from which fish meal is produced (herring,anchovies, capelin, menhaden) are themselves
Seafood: Trade Liberalization and Impacts on Sustainability 291
TABLE 15.4 Effects of Relaxing Trade Barriers
Fish-Exporting Country Fish-Importing Country
Catch Efficient Catch EfficientRegime Open Access Control Management Open Access Control Management
Short-term Increased Increased No change in Lower effort, Lower effort, No change ineffects effort, larger effort, no effort unless smaller no change in effort unless
catches, more change in higher allowed catches, catch, lower smaller allowedtrade gains catch, higher catch, gains more trade, profits, gains catch, gains fromfrom trade profit gains from trade, gains from from trade trade, lower
from trade higher market trade market value ofvalue of quotas quotas andand licenses licenses
Long-term Fish stocks Increased Same as above Fish stocks Reduction of Same as aboveeffects decline, catch investment in recover, fishing fleets,
may decline, fishing boats, catch may no change inpossibly loss no change in increase, catch, doublefrom trade catch, small double dividend from
gains from dividend tradetrade from trade
Source: OECD 2003a: 170.
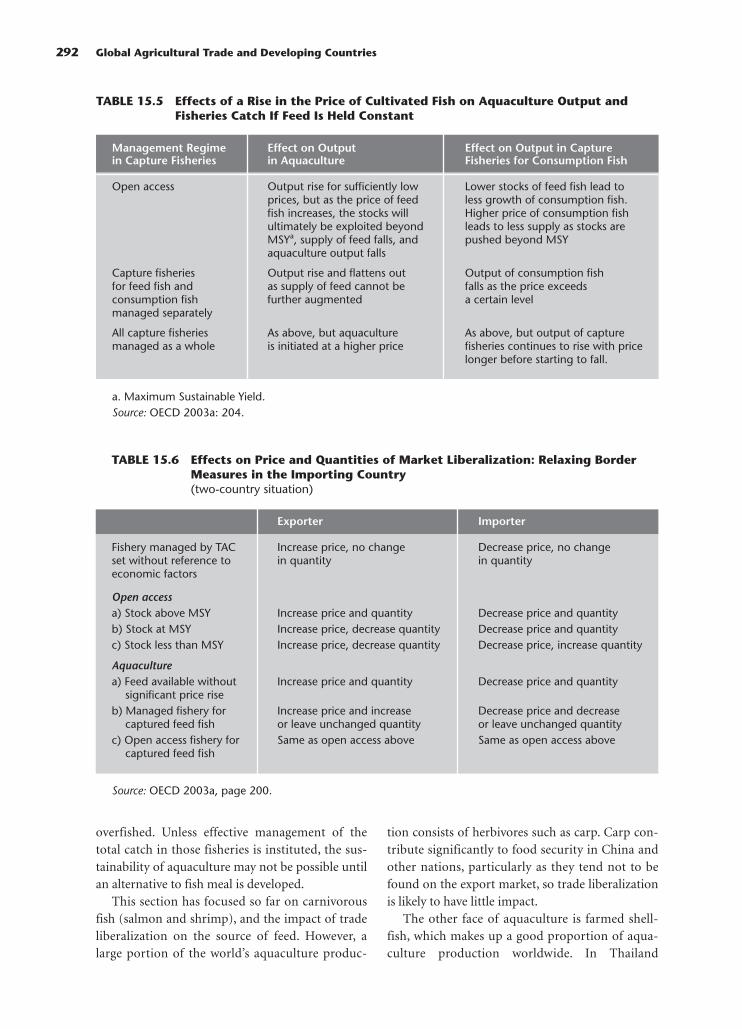
292 Global Agricultural Trade and Developing Countries
TABLE 15.5 Effects of a Rise in the Price of Cultivated Fish on Aquaculture Output andFisheries Catch If Feed Is Held Constant
Management Regime Effect on Output Effect on Output in Capturein Capture Fisheries in Aquaculture Fisheries for Consumption Fish
Open access Output rise for sufficiently low Lower stocks of feed fish lead to prices, but as the price of feed less growth of consumption fish.fish increases, the stocks will Higher price of consumption fishultimately be exploited beyond leads to less supply as stocks areMSYa, supply of feed falls, and pushed beyond MSYaquaculture output falls
Capture fisheries Output rise and flattens out Output of consumption fishfor feed fish and as supply of feed cannot be falls as the price exceedsconsumption fish further augmented a certain levelmanaged separately
All capture fisheries As above, but aquaculture As above, but output of capturemanaged as a whole is initiated at a higher price fisheries continues to rise with price
longer before starting to fall.
a. Maximum Sustainable Yield.Source: OECD 2003a: 204.
TABLE 15.6 Effects on Price and Quantities of Market Liberalization: Relaxing BorderMeasures in the Importing Country(two-country situation)
Exporter Importer
Fishery managed by TAC Increase price, no change Decrease price, no changeset without reference to in quantity in quantityeconomic factors
Open accessa) Stock above MSY Increase price and quantity Decrease price and quantityb) Stock at MSY Increase price, decrease quantity Decrease price and quantityc) Stock less than MSY Increase price, decrease quantity Decrease price, increase quantity
Aquaculturea) Feed available without Increase price and quantity Decrease price and quantity
significant price riseb) Managed fishery for Increase price and increase Decrease price and decrease
captured feed fish or leave unchanged quantity or leave unchanged quantityc) Open access fishery for Same as open access above Same as open access above
captured feed fish
Source: OECD 2003a, page 200.
overfished. Unless effective management of thetotal catch in those fisheries is instituted, the sus-tainability of aquaculture may not be possible untilan alternative to fish meal is developed.
This section has focused so far on carnivorousfish (salmon and shrimp), and the impact of tradeliberalization on the source of feed. However, alarge portion of the world’s aquaculture produc-
tion consists of herbivores such as carp. Carp con-tribute significantly to food security in China andother nations, particularly as they tend not to befound on the export market, so trade liberalizationis likely to have little impact.
The other face of aquaculture is farmed shell-fish, which makes up a good proportion of aqua-culture production worldwide. In Thailand

production of green mussels, blood cockle, oysters,and other shellfish doubled from 73,976 milliontons in 1988 to 138,202 million tons in 2000 valuedat approximately $47 million (Chalermwat, Szuster,and Flaherty 2003). Because the primary concernwith these products is the placement of the farms inunpolluted areas, the WTO Agreement on Sanitaryand Phytosanitary Measures is likely to have thelargest effect on this sector. Table 15.6 summarizesthe discussion in this section.
Conclusions
Global seafood markets are truly international.Production, consumption, imports, and exportscover the globe, just as several species of fishmigrate around the globe. Because the global mar-ket for fish and fish products has specific dynamicsand issues separate from global agriculture, under-standing the impacts of trade liberalization onseafood and fishery products requires an under-standing of the differentiated markets for the vari-ous products.
Key aspects of trade liberalization on globalseafood, fish meal, and fish oil markets haveemerged from the discussion. Impacts of trade lib-eralization on the welfare of countries dependscritically on the fisheries management systems ofthe producing countries, since negative externali-ties in global seafood markets are much larger andmore detrimental than those specific to agriculture.Open access, the management regime in manydeveloping countries, invariably leads to overfish-ing. Any event that raises prices for fish fromexporting developing countries creates incentivesto fish even more, exacerbating overfishing andleading quickly to collapses in stocks. Even tradeliberalization in the aquaculture industries is notimmune from the effects of fisheries managementregimes to the extent that the feed for that produc-tion is derived from a poorly managed capturefishery.
Increased trade in aquacultured products, inde-pendent of issues with feed, can lead to increasedenvironmental degradation from conversion ofland from benign agricultural use to less benignaquacultural use. Little has so far been done to inter-nalize the negative externalities caused by excessfishing, unintended trapping of other marine life, orwater pollution from aquaculture operations.
As stocks in developed countries have declined,their fleets have gone elsewhere to capture fish. Thegovernments of the European Union, for example,have paid several developing countries for access totheir fishing territory. While the developing nationsgain access fees, enforcement of fish-managementpolicies to limit the catches of the foreign fleets areminimal, resulting in an overfishing of these fishstocks. Thus, developing countries derive a short-term gain by allowing foreign fleets to fish in theirwaters; that value disappears in the long run.
Removing foreign access from developing coun-tries’ waters may not be the complete answer, eventhough foreign access is usually subsidized by theforeign fleets’ governments. Developing countrieshave fisheries resources within their exclusive eco-nomic zones. Removing foreign fleets from thosewaters is good for the fish stocks, but if the countryitself has no means to capture the value of theresource, it gains little else. Two options presentthemselves under such circumstances: first, tonegotiate better access agreements to ensure thatthe true value of the resource is being paid to thedeveloping country, and, second, to invest in thedeveloping country’s fishing capacity so that it cantake advantage of its rightful resource. It should gowithout saying that in either case an effective man-agement system must be put in place to preventoverfishing.
Tariffs in global seafood markets have comedown significantly and may no longer be a primetrade barrier, except perhaps in South-South trade.In the United States, as the markets for certainseafood species has become more competitive,industries in the United States have increasinglyturned to antidumping and countervailing dutymeasures to protect themselves from competitionfrom developing countries.
The WTO has the opportunity to use its purviewover subsidies through the Agreements on Subsi-dies and Countervailing Measures to encouragemembers to drop fishing subsidies and thus to curethe trade distortions caused by the subsidies whileencouraging sustainability of fish stocks globally. Inaddition, from the developing countries’ perspec-tive, an important focus in WTO negotiations mustbe the Agreement on Technical Barriers to Tradeand the Agreement on Sanitary and PhytosanitaryMeasures. The processes by which developed coun-tries impose technical barriers to trade must be
Seafood: Trade Liberalization and Impacts on Sustainability 293

transparent and demonstrably nonarbitrary. Devel-oping countries need resources to assist them tomeet current sanitary and phytosanitary measuresby building infrastructure that permits them tomeet the requirements and training workers tomaintain the proper measures.
Finally, international trade in fish and fish prod-ucts also has an impact on food security. Often thedomestic market in exporting developing countriesretains only the inferior fish, while the better, morevaluable fish are sold abroad. A collapse in the stockof the fish consumed domestically may lead to sig-nificant food security problems. Similarly, if fishmeal prices were to rise for any reason, the increasewould have an impact on the ability of somenations to feed terrestrial livestock.
Everyone has an interest in ensuring that fish-eries and aquaculture are managed in a sustainableway. As externalities are internalized into the pro-duction process and their value incorporated intothe prices of fish products, then it is likely that tradeliberalization will bring about a net benefit to trad-ing partners. The distribution of benefits acrosscountries, producers, and consumers can best bejudged after effective management measures are inplace. That distribution is not easily judged today.
Notes
1. The primary source for the material in this section is Abila2003.
2. www.st.nmfs.gov/webpls.3. The Farm Security and Rural Investment Act of 2002
(Farm Bill) states that for the purposes of the Federal Food,Drug, and Cosmetic Act, “the term ‘catfish’ may only be consid-ered to be a common or usual name (or part thereof) for fishclassified within the family Ictaluridae” (USITC 2003a).
References
Abila, Richard. 2003. “Food Safety in Food Security and FoodTrade, Case Study of Kenyan Exports.” International FoodPolicy Research Institute, Washington, D.C. September.
Anderson, J. L. 2003. The International Seafood Trade. Oxford:Woodhead.
Brander, J. A., and M. S. Taylor. 1997a. “International Trade andOpen-Access Renewable Resources: The Small Open Econ-omy Case.” Canadian Journal of Economics 30: 526–52.
———. 1997b. “International Trade between Consumer andConservationist Countries.” Resource and Energy Economics19: 267–98.
———. 1998. “Open Access Renewable Resources Trade andTrade Policy in a Two-country Model.” Journal of Interna-tional Economics 44: 181–210.
Chalermwat, K., B. W. Szuster, and M. Flaherty. 2003. “ShellfishAquaculture in Thailand.” Aquaculture Economics and Man-agement 7: 249–61.
Conrad, J. M. 1999. Resource Economics. Cambridge: CambridgeUniversity Press.
Cox, Anthony, Matthew Stubbs, and Luke Davies. 2000. SouthernBluefin Tuna and CITES: An Economic Perspective. Reportprepared for the Fisheries Resource Research Fund andEnvironment Australia, ABARE Research Report 99.2,Canberra.
Deere, C. 2000. “Net Gains: Linking Fisheries Management,International Trade and Sustainable Development.” Interna-tional Union for Conservation of Nature and NaturalResources (IUCN), Washington, D.C.
Delgado, C. L., N. Wada, M. W. Rosengrant, S. Meijer, andM. Ahmed. 2003. Fish to 2020: Supply and Demand inChanging Global Markets. Washington, D.C.: InternationalFood Policy Research Institute.
ESCAP and ADB. 2000. State of the Environment in Asia andPacific 2000. Economic and Social Commission for Asia andthe Pacific and Asian Development Bank. New York: UnitedNations. www.usepscap.org/enrd/environ/soe.htm.
FAO (U.N. Food and Agriculture Organization). 1999. “CountryProfile: The People’s Republic of Bangladesh.” Rome.August.
———. 2000. “Country Profile: The Kingdom of Thailand.”Rome. May.
———. 2002a. FAO Yearbook—Fisheries Statistics, AquacultureProduction. volume 90/2. Rome.
———. 2002b. FAO Yearbook—Fisheries Statistics, Commodities.vol. 91. Rome.
———. 2002c. The State of World Fisheries and Aquaculture.Rome.
———. 2003. “Report of the Expert Consultation on Identify-ing, Assessing and Reporting on Subsidies in the FishingIndustry.” FAO Fisheries Report 698. Rome.
Filhol, Agnes. 2000.“Effect of World Trade Organization’s Regula-tion on World Fish Trade.” GLOBEFISH 65 (February). Rome.
Grainger, R. J. R., and S. M. Garcia. 1996. “Chronicles of MarineFishery Landings (1950–94): Trend Analysis and FisheriesPotential.” FAO Fisheries Technical Paper 359. Rome.
Hannesson, Rögnvaldur. 1996. Fisheries Mismanagement: TheCase of the North Atlantic Cod. Oxford: Fishing News Books.
———. 2000. “Renewable Resources and the Gains from Trade.”Canadian Journal of Economics 33: 122–32.
Institute for European Environmental Policy. 2002a. “Subsidiesto the European Union Fisheries Sector.” London. October.
———. 2002b. “Fisheries Agreements with Third Countries—Is the EU Moving Towards Sustainable Development?”London. November.
Kinnucan, H., and C. R. Wessells. 1997. “Marketing ResearchParadigms for Aquaculture.” Aquaculture Economics andManagement 1: 73–86.
Lem, Audun. 2003. The WTO Doha Round and Fisheries: What’sat Stake. FAO Fact Sheet for WTO Ministerial Conference inCancún, Mexico. July.
McGovern, Dan. 2003. “SSA Files 6 Shrimp AntidumpingPetitions; Alleges Dumping Margins of Over 200 Percent.”The Wave News Network, December 31.
Milazzo, Matteo. 1998. “Subsidies in World Fisheries: A Reexam-ination.” World Bank Technical Paper. Washington, D.C.
National Research Council. 1999. Sustaining Marine Fisheries.Washington, D.C.: National Academy Press.
OECD (Organisation for Economic Co-operation and Develop-ment). 2003a. Liberalising Fisheries Markets: Scope andEffects. Paris.
———. 2003b. Review of Fisheries in OECD Countries: CountryStatistics 1999–2001. Paris.
294 Global Agricultural Trade and Developing Countries
Porter, G. 2003. “Protecting Wild Atlantic Salmon from Importsof Salmon Aquaculture: A Country-by-Country ProgressReport.” www.worldwildlife.org. May.
Robb, Cairo. 2001. International Environmental Law Reports,vol. 2, Trade and the Environment. Cambridge: CambridgeUniversity Press.
Schrank, W. 2003. “Introducing Fisheries Subsidies.” FAOFisheries Technical Paper 437. Rome.
UNEP (United Nations Environment Programme). 1999a. Envi-ronmental Impacts of Trade Liberalization and Policies forthe Sustainable Management of Natural Resources: A CaseStudy of Bangladesh’s Shrimp Farming Industry. UNEP:New York.
———. 1999b. “Environmental Impacts of Trade Liberaliza-tion and Policies for the Sustainable Management of Nat-ural Resources: A Case Study of Uganda’s Fisheries Sector.”New York.
———. 2002a. “Africa Environment Outlook: Past, Present andFuture Perspectives.” www.unep.org/aeo.
———. 2002b. “Well Managed Fisheries Vital for Environmen-tally Friendly Development in Poor Parts of the Globe.” Pressrelease. New York. March.
U.S. Department of Commerce. 1997. “Fisheries of theUnited States, 1997.” National Marine Fisheries Service,Washington, D.C.
USITC (United States International Trade Commission). 2003a.“Certain Frozen Fish Fillets from Vietnam.” Investigation
No. 731-TA-1012 (Final). Publication 3617. August.Washington, D.C.
———. 2003b. “Crawfish Tail Meat from China.” Investigation731-TA-752 (Review). Publication 3614. July. Washington,D.C.
Wessells, C. R., and J. Anderson. 1992.“Innovations and Progressin Seafood Demand and Market Analysis.” Marine ResourceEconomics 7: 209–28.
World Bank. 2003. “Madagascar Diagnostic Trade IntegrationStudy.” Prepared for the Integrated Framework for Trade-Related Technical Assistance to Least Developed Countries,Washington, D.C.
WTO (World Trade Organization). 1999. “Benefits of Eliminat-ing Trade Distorting and Environmentally DamagingSubsidies in the Fisheries Sector.” WT/CTE/W/121. Geneva.
———. 2000. “Environmental Benefits of Removing TradeRestrictions and Distortions: The Fisheries Sector.”WT/CTE/W/167. Geneva.
———. 2001. “Environmental Benefits of Removing TradeRestrictions and Distortions: The Fisheries Sector—Addendum.” WT/CTE/W/167/Add.1. Geneva.
———. 2003a. “Possible Approaches to Improved Disciplineson Fisheries Subsidies.” TN/RL/W/77. Geneva.
———. 2003b. “Understanding the WTO.” Third Edition. Sep-tember. www.wto.org. WWF (World Wildlife Fund). 2003.“WWF Fact Sheet: West African Marine Ecoregion.” Dakar,Senegal.
Seafood: Trade Liberalization and Impacts on Sustainability 295


There are two types of coffee. Arabica, grown athigh altitudes in Latin America (including Brazil)and northeastern Africa, accounts for two-thirds oftotal world output. It has a strong aroma and lowlevel of caffeine. Robusta, with a much strongertaste than arabica, is grown in humid areas at lowaltitudes in Asia, western and southern Africa, andBrazil. During the last decade, production ofrobusta, which is particularly suitable for instantcoffee, has increased (table 16.1).1
During the last decade, the coffee market hasgone through a number of structural changes. Onthe supply side, Brazil’s production capacityexpanded enormously, with new plantations in thenorth that are less affected by frosts and, becauseof irrigation, not affected by droughts. Vietnamentered the coffee market in a major way in the1980s—it currently supplies more than 12 millionbags, making it the world’s second-largest coffeeexporter. On the demand side, consumption of spe-cialty coffees has expanded, currently accountingfor an estimated 6–8 percent of total consumption.Demand for low-quality coffee beans has alsoincreased, primarily reflecting new technologiesthat enable roasters to remove the harsh taste ofrobustas for normal coffee while continuing to
All coffee is produced in the tropics, primarily bysmallholders. Most is consumed in high-incomecountries. Latin America accounts for 60 percent ofglobal output, followed by Asia (24 percent), andAfrica (16 percent). More than half of global coffeeoutput is accounted for by the three dominant pro-ducers: Brazil (33 percent), Colombia (10 percent),and Vietnam (10 percent). Some other African andLatin American countries, however, are heavilydependent on their exports of coffee, despite theirlow share in global output. For example, coffeeaccounts for more than half of total merchandiseexports in Burundi, Rwanda, and Ethiopia andmore than 20 percent in Guatemala, Honduras, andNicaragua. More than 80 percent of coffee produc-tion is traded internationally. Historically, coffee isthe second most traded primary commodity aftercrude oil, generating more than $15 billion inexport revenue (evaluated at 1997–98 average pricesand volumes). Overall, consumption volumes havestagnated in the mature markets, in which theUnited States accounts for about 18 percent, fol-lowed by Brazil (10 percent), Germany (9 percent),Japan (6 percent), and France and Italy (5 percenteach). However, consumption has been increasingin some new (especially transition) markets.
297
16
COFFEE: MARKETSETTING AND POLICIES
John Baffes, Bryan Lewin, and Panos Varangis
The authors thank Ataman Aksoy and Harry de Gorter for helpful comments and suggestions on earlier drafts.

298 Global Agricultural Trade and Developing Countries
meet the increasing demand for instant and fla-vored coffees, which primarily use robusta coffees.
For most of the 20th century the coffee markethas been subject to various supply-control schemes.The most important were the price-stabilizationschemes implemented by Brazil at the beginning ofthe century, the Inter-American Coffee Agreementsimplemented during and after the Second WorldWar, the agreements administered by the Interna-tional Coffee Organization (ICO) from 1962 to1989, and more recent attempts by the Associationof Coffee Producing Countries (ACPC). Althoughthe stated objective of these arrangements was tostabilize prices, prices often ended up being higherthan they would have been in the absence ofthe arrangements. The most influential of theseschemes were the International Coffee Agreements
(ICAs) under the auspices of the ICO, the last ofwhich collapsed in 1989. Government interventionin domestic markets was also prevalent in manycountries through parastatals that controlled mar-keting and trade in the coffee industry. Followingthe collapse of the last ICA, most parastatals wereeither dismantled or their roles diminished. Cur-rently, the global coffee market is, to a large extent, adistortion-free market. On the trade side, importrestrictions are nonexistent, except some tariff esca-lation in coffee products (such as instant coffee).
Global Balance and Price Trends
Brazil, by far the largest coffee producer andexporter and the second-largest consumer,accounts for one-third of global output and
TABLE 16.1 The Changing Structure of the Coffee Market (thousands of 60-kg bags)
Arabica
Year Colombian Milds Other Milds Naturals Subtotal Robusta Total
1992 16,959 25,122 23,317 65,398 27,291 92,6891993 13,256 23,398 28,555 65,209 26,989 92,1981994 15,059 24,582 29,300 68,941 27,901 96,8421995 15,503 27,525 18,545 61,573 27,193 88,7661996 12,489 27,040 27,126 66,655 37,033 103,6881997 13,498 27,965 23,436 64,899 32,753 97,6521998 12,509 27,380 35,024 74,913 33,506 108,4191999 11,821 31,698 30,178 73,697 39,706 113,4032000 12,026 28,480 30,717 71,223 45,638 116,8612001 13,229 26,123 28,540 67,892 42,834 110,7262002 13,179 25,585 43,667 82,431 41,720 124,1512003 13,352 26,318 26,217 65,887 39,945 105,232
Market share (percent)1992 18 27 25 71 29 1001993 14 25 31 71 29 1001994 16 25 30 71 29 1001995 17 31 21 69 31 1001996 12 26 26 64 36 1001997 14 29 24 66 34 1001998 12 25 32 69 31 1001999 10 28 27 65 35 1002000 10 24 26 61 39 1002001 12 24 26 61 39 1002002 11 21 25 66 34 1002003 13 25 25 63 37 100
Source: U.S. Department of Agriculture.

produces both arabica and robusta coffee. It is fol-lowed by Colombia (arabica) and Vietnam(robusta), each accounting for about 10 percent ofglobal output. Other significant producers areIndonesia and Mexico (6 percent each) and India(4 percent) (table 16.2).
The technology of coffee production haschanged significantly in the past 30 years, but notall countries have shared equally in the changes.Average yields in Asia are double those in Sub-Saharan Africa, and yields in Latin America are60 percent higher than in Africa. Annual yieldgrowth during the 1990s was 2.6 percent in Asia,1.7 percent in Latin America, and 1.1 percent inSub-Saharan Africa, according to data from theU.N. Food and Agriculture Organization (FAO).
On the demand side, the United States con-sumes about 18 percent of global output, followedby Brazil (10 percent), Germany (9 percent), Japan(6 percent), France and Italy (5 percent each). On aper capita basis, Scandinavian countries consumeabout 10 kilograms a year, followed by Germany(8 kilograms), and France, Italy, and Spain with
approximately 5.5 kilograms each. U.S. per capitaconsumption fluctuates between 4 and 5.5 kilo-grams; in the United Kingdom and Japan it isbetween 2.5 and 3 kilograms. Only five coffee pro-ducers consume a substantial portion of theiroutput: Brazil and Ethiopia (30 percent each),Indonesia (23 percent), Mexico (19 percent), andColombia (11 percent), which together account forabout 20 percent of global output; the remaining80 percent is internationally traded.
Vietnam’s emergence as a major robusta pro-ducer altered the landscape of the global coffeemarket in a permanent way. In 1980 Vietnam pro-duced 77,000 bags—less than 0.1 percent of worldproduction. In 2000, it exceeded 15 million bags—more than 13 percent of world production.Vietnam entered the coffee market in response to aseries of policy reforms in the early 1990s thatchanged the balance of incentives toward exportcrops. These reforms facilitated land ownershipand liberalized input and output markets. Follow-ing the reforms, for example, fertilizer pricesdeclined by almost 50 percent. Other reforms
Coffee: Market Setting and Policies 299
TABLE 16.2 Coffee Production, Selected Years(thousands of 60-kg bags)
Country 1960 1970 1980 1990 2000 2002 2004
Brazil 29,800 11,000 21,500 31,000 34,100 51,600 42,400Vietnam 53 39 77 1,200 15,333 11,167 12,000Colombia 7,260 8,000 13,500 14,500 10,500 11,712 11,600Indonesia 1,327 2,327 5,365 7,480 6,495 6,140 5,750India 1,225 1,914 1,977 2,970 5,020 4,588 4,835Mexico 2,100 3,200 3,862 4,550 4,800 4,350 4,500Ethiopia 1,687 2,589 3,264 3,500 3,683 3,693 4,000Guatemala 1,500 1,965 2,702 3,282 4,564 3,802 3,671Uganda 1,925 2,667 2,133 2,700 3,205 2,910 3,200Peru 598 1,114 1,170 1,170 2,824 2,760 2,980Honduras 291 545 1,265 1,685 2,821 2,661 2,753Costa Rica 951 1,295 2,140 2,565 2,502 2,207 2,050Nicaragua 437 641 971 460 1,610 997 1,500Côte d’Ivoire 0 4,414 3,973 4,734 5,700 3,568 1,444El Salvador 1,452 2,054 2,940 2,603 1,624 1,351 1,285Papua New Guinea 61 426 889 969 1,051 1,118 1,210Cameroon 855 1,180 1,860 1,450 1,113 801 1,100Kenya 566 999 1,568 1,455 864 926 1,085Thailand 1 19 201 785 1,692 757 950Ecuador 594 1,255 1,517 1,830 1,005 790 750Total 64,999 58,838 85,738 99,911 116,861 124,151 117,650
Source: U.S. Department of Agriculture.

(known as Doi Moi) encouraged internal migra-tion to the Central Highlands because of easy accessto new land (eventually to be used for coffee pro-duction). These reforms, combined with the 1994coffee price spike, made Vietnam an importantplayer in the coffee market. It is worth noting thatVietnam’s coffee expansion took place withoutassistance from either national or multilateralfunding. However, some help came from the SovietUnion and Eastern European countries in the formof technical assistance during the early 1980s.Because neither Vietnam nor these countries wereICO members, and hence not bound by any quotaobligations, they could expand coffee productionand trade without any restriction. The expansionwas also aided by the desire of the Soviet Union andEastern European countries to have access to coffeewithout paying hard currency.
Brazil has been able to maintain unprecedentedoutput levels, averaging more than 35 million bagsduring the last four seasons. Extensive mechaniza-tion of coffee harvesting, along with the develop-ment of high-yielding varieties, has reduced costsof production, while shifting production to thenorth, away from the frost-prone areas of thesouth, has reduced the likelihood of weather-related supply disruptions. Extensive use of irriga-tion in areas such as Bahia and the Cerrado hasstabilized and sustained yields. Another signifi-cant development in Brazil is emergence of semi-washed arabicas; a process that makes better coffee.About 3 million bags of semi-washed arabicascompete directly with higher-quality coffee fromCentral America.
Given that both Vietnam and Brazil are low-costproducers, they are unlikely to reduce coffee pro-duction. Consequently production cutbacks torestore the balance of supply and demand are nowcoming from the higher-cost African and CentralAmerican producers. In Central America, for exam-ple, production of the lower-altitude, lower-qualitycoffees that can be easily replaced in commercialblends by Brazilian arabicas have fallen sharply.2
While Latin America and Asia have increasedtheir shares in global coffee output, Africa’s sharehas declined from 33 percent in 1970 to 18 percentin 2000. Africa’s coffee output has never surpassedits peak in 1972. After remaining almost constant at20 million bags for two decades following thatpeak, it has been in slow decline since then.
Numerous studies have identified several factorsthat are likely to further influence coffee process-ing and consumption patterns (see, for example,IADB/USAID/World Bank 2002, and Lewin,Giovannucci, and Varangis 2004). First, roasters areable to work with a lower level of stocks. Second,new technology enables them to remove the harshtaste of robustas, achieving the same level of qualitywith lower-quality beans. Third, roasters have beenmore flexible in their ability to make short-termswitches between coffee types, implying that thepremiums commanded by certain types of coffeecannot be retained for long. Finally, a small seg-ment of the market has emerged that focuses onproduct differentiation, such as organic, gourmet,and shade coffee. The implication of all this is thatthe demand outlook is likely to be different for dif-ferent coffee producers. Specifically, if any expan-sion in coffee demand takes place, it is likely to be atthe two ends of the spectrum: lower-quality beans(reflecting improved technology and increaseddemand for soluble coffee) and specialty coffees(reflecting expansion to niche markets).3 Efforts toincrease coffee consumption may also come at theexpense of tea consumption, a commodity pro-duced mainly by low-income (and often coffee-producing) countries.
Coffee prices are highly volatile. (figures 16.1athrough d). During the 1990s arabica prices rangedfrom $1.17 a kilogram in August 1992 to $5.89 akilogram in May 1997. Robusta prices ranged from$0.82 a kilogram in June 1992 to $4.03 a kilogramin September 1994. The price volatility stems inpart from weather conditions in Brazil, where frostaffects crops every five to six years and severedroughts also occur periodically. While short-selling and buying by hedge funds are sometimescited as a reason for the high volatility of coffeeprices, this activity probably contributes only toshort-term volatility.4
Coffee prices have declined considerably since1998 (figure 16.1). In January 2002 robusta droppedto $0.50 a kilogram (the lowest nominal level sincethe $0.49 a kilogram price of May 1965 and 86 per-cent below its high four years earlier), while inOctober 2001 arabica averaged $1.24 a kilogram, anine-year low and 76 percent below its high fouryears earlier. The combination of increased avail-ability from Vietnam and Brazil, as well as domesticpolicies in many producing countries that retard
300 Global Agricultural Trade and Developing Countries

exit from the market of uncompetitive producers,led to these historically low prices, which, in theabsence of any international supply control mecha-nism, gave rise to the so-called coffee crisis andprobably prolonged its length.
Exports from small coffee producers are aminuscule proportion of global trade in coffee butcan loom large in the exporters’ economies. Forexample, three African countries (Burundi,Rwanda, and Ethiopia) derive more than half oftheir total merchandise exports from coffee. The
poverty implications of coffee in these countriesare enormous—in seven coffee-dependent Africancountries, per capita gross domestic product(GDP) ranged between $112 and $336 (table 16.3).
Areas with relatively high labor costs and largefarms that are heavily dependent on seasonal labor,especially in Central America, can feel the effectsof changing prices in a significant way (Lewin,Giovannucci, and Varangis 2004). For example, therural labor employed in the coffee sectors of fiveCentral American countries represented, on
Coffee: Market Setting and Policies 301
FIGURE 16.1(a) Nominal Coffee Prices, 1990–2003 (US$ per kilogram)
6.0
5.0
4.0
3.0
2.0
1.0
0.0
Jan-
90
Jul-9
0
Jan-
91
Jul-9
1
Jan-
92
Jul-9
2
Jan-
93
Jul-9
3
Jan-
94
Jul-9
4
Jan-
95
Jul-9
5
Jan-
96
Jul-9
6
Jan-
97
Jul-9
7
Jan-
98
Jul-9
8
Jan-
99
Jul-9
9
Jan-
00
Jul-0
0
Jan-
01
Jul-0
1
Jan-
02
Jul-0
2
Jan-
03
Jul-0
3
Robusta Arabica
(b) Real Coffee Prices, 1960–2003 (US$ per kilogram)
10.0
8.0
6.0
4.0
2.0
0.0
1960
1962
1964
1966
1968
1970
1972
1974
1976
1978
1980
1982
1984
1986
1988
1990
1992
1994
1996
1998
2000
2002
ArabicaRobusta
Source: World Bank.
Source: World Bank.

average, 28 percent of the labor force in those coun-tries (Nicaragua, 42 percent; Guatemala, 31 per-cent; Costa Rica, 28 percent; Honduras, 26 percent;El Salvador, 17 percent).
The Policy Environment
The coffee market has been subject to considerableintervention at the international and national lev-els. Those interventions are the subject of the nexttwo subsections.
The International Environment
Regulation of coffee supplies at the internationallevel has a long history (box 16.1). Calls for supplycontrols were made as early as 1902 following pricedeclines due to Brazil’s oversupply (Hutchinson1909). At least three successful stabilization schemestook place in Brazil between 1905 and 1921.However, the coffee market became depressedfollowing the crash of 1929. Attempts by Brazil toconvince other coffee producers to coordinate
302 Global Agricultural Trade and Developing Countries
(c) Nominal Price Indexes for Coffee and Other Commodities, 1990–2002 (August 2002 = 1.0)
5.0
4.0
3.0
2.0
1.0
0.0
Jan-
90
Jul-9
0
Jan-
91
Jul-9
1
Jan-
92
Jul-9
2
Jan-
93
Jul-9
3
Jan-
94
Jul-9
4
Jan-
95
Jul-9
5
Jan-
96
Jul-9
6
Jan-
97
Jul-9
7
Jan-
98
Jul-9
8
Jan-
99
Jul-9
9
Jan-
00
Jul-0
0
Jan-
01
Jul-0
1
Jan-
02
Jul-0
2
Jan-
03
Jul-0
3
AgricultureCoffee composite
(d) Real Price Indexes for Coffee and Other Commodities, 1960–2003 (2001 = 1.0)
8.0
6.0
4.0
2.0
0.0
1960
1962
1964
1966
1968
1970
1972
1974
1976
1978
1980
1982
1984
1986
1988
1990
1992
1994
1996
1998
2000
2002
Coffee composite Agriculture
Source: World Bank.
Source: World Bank.
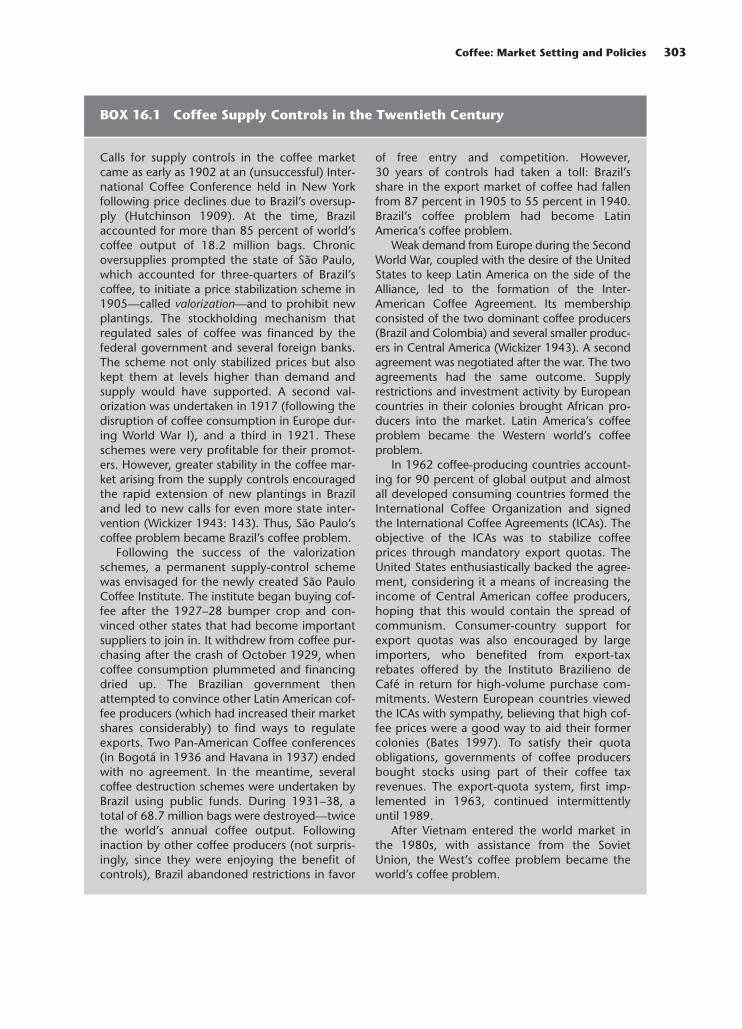
Coffee: Market Setting and Policies 303
BOX 16.1 Coffee Supply Controls in the Twentieth Century
Calls for supply controls in the coffee marketcame as early as 1902 at an (unsuccessful) Inter-national Coffee Conference held in New Yorkfollowing price declines due to Brazil’s oversup-ply (Hutchinson 1909). At the time, Brazilaccounted for more than 85 percent of world’scoffee output of 18.2 million bags. Chronicoversupplies prompted the state of São Paulo,which accounted for three-quarters of Brazil’scoffee, to initiate a price stabilization scheme in1905—called valorization—and to prohibit newplantings. The stockholding mechanism thatregulated sales of coffee was financed by thefederal government and several foreign banks.The scheme not only stabilized prices but alsokept them at levels higher than demand andsupply would have supported. A second val-orization was undertaken in 1917 (following thedisruption of coffee consumption in Europe dur-ing World War I), and a third in 1921. Theseschemes were very profitable for their promot-ers. However, greater stability in the coffee mar-ket arising from the supply controls encouragedthe rapid extension of new plantings in Braziland led to new calls for even more state inter-vention (Wickizer 1943: 143). Thus, São Paulo’scoffee problem became Brazil’s coffee problem.
Following the success of the valorizationschemes, a permanent supply-control schemewas envisaged for the newly created São PauloCoffee Institute. The institute began buying cof-fee after the 1927–28 bumper crop and con-vinced other states that had become importantsuppliers to join in. It withdrew from coffee pur-chasing after the crash of October 1929, whencoffee consumption plummeted and financingdried up. The Brazilian government thenattempted to convince other Latin American cof-fee producers (which had increased their marketshares considerably) to find ways to regulateexports. Two Pan-American Coffee conferences(in Bogotá in 1936 and Havana in 1937) endedwith no agreement. In the meantime, severalcoffee destruction schemes were undertaken byBrazil using public funds. During 1931–38, atotal of 68.7 million bags were destroyed—twicethe world’s annual coffee output. Followinginaction by other coffee producers (not surpris-ingly, since they were enjoying the benefit ofcontrols), Brazil abandoned restrictions in favor
of free entry and competition. However,30 years of controls had taken a toll: Brazil’sshare in the export market of coffee had fallenfrom 87 percent in 1905 to 55 percent in 1940.Brazil’s coffee problem had become LatinAmerica’s coffee problem.
Weak demand from Europe during the SecondWorld War, coupled with the desire of the UnitedStates to keep Latin America on the side of theAlliance, led to the formation of the Inter-American Coffee Agreement. Its membershipconsisted of the two dominant coffee producers(Brazil and Colombia) and several smaller produc-ers in Central America (Wickizer 1943). A secondagreement was negotiated after the war. The twoagreements had the same outcome. Supplyrestrictions and investment activity by Europeancountries in their colonies brought African pro-ducers into the market. Latin America’s coffeeproblem became the Western world’s coffeeproblem.
In 1962 coffee-producing countries account-ing for 90 percent of global output and almostall developed consuming countries formed theInternational Coffee Organization and signedthe International Coffee Agreements (ICAs). Theobjective of the ICAs was to stabilize coffeeprices through mandatory export quotas. TheUnited States enthusiastically backed the agree-ment, considering it a means of increasing theincome of Central American coffee producers,hoping that this would contain the spread ofcommunism. Consumer-country support forexport quotas was also encouraged by largeimporters, who benefited from export-taxrebates offered by the Instituto Brazilieno deCafé in return for high-volume purchase com-mitments. Western European countries viewedthe ICAs with sympathy, believing that high cof-fee prices were a good way to aid their formercolonies (Bates 1997). To satisfy their quotaobligations, governments of coffee producersbought stocks using part of their coffee taxrevenues. The export-quota system, first imp-lemented in 1963, continued intermittentlyuntil 1989.
After Vietnam entered the world market inthe 1980s, with assistance from the SovietUnion, the West’s coffee problem became theworld’s coffee problem.

supply-containing mechanisms failed. Brazil thenintroduced a number of coffee destruction schemes.Between 1931 and 1938, a total of 68.7 million bagswere destroyed—twice the world’s annual globalcoffee output. Following years of weak demandfrom Europe during the Second World War, Brazilnegotiated two agreements with other produc-ing countries in Latin America. Those agreementswere largely unsuccessful. The countries that agreedto restrict their exports in return for Brazil’scoffee stock destruction did not respect theircommitments.
In the early 1960s most coffee-producing coun-tries (accounting for 90 percent of global output)and almost all developed coffee-consuming coun-tries formed the ICO, which attempted to stabilizecoffee prices through mandatory export quotasunder the International Coffee Agreements. Theexport quota system, first implemented in 1963,was temporarily suspended in 1972 as coffee pricessoared. Quotas were restored in 1980 and sus-pended again in 1986 due to soaring prices. Theywere reintroduced in 1987 and suspended indefi-nitely in 1989. These agreements kept coffee priceshigher than they otherwise would have been(Gilbert 1995).
Following the collapse of the last InternationalCoffee Agreement, several coffee producers—including Brazil and Colombia but not Vietnamand Mexico—formed the Association of CoffeeProducing Countries in September 1993. In thefollowing year, export restrictions did contribute to
the price increase already under way, but the agree-ments were overtaken by the price rises thatfollowed the Brazilian frosts in 1994. During 2000and 2001 the ACPC worked to persuade coffee-producing countries to retain part of their exportsso as to staunch the decline in coffee prices that hadstarted in 1998 and accelerated in 2000. Followingsome initial enthusiasm, ACPC’s efforts failed, andthe association was dissolved in February 2002, onemonth after robusta prices reached their historiclow. The ACPC failed for several reasons, but aprincipal one was that in a liberalized market, theinstitutional structure necessary to ensure compli-ance in the member countries—a single-desk mar-keting agency—had been dismantled. There wasalso the problem of free-riding by nonmembers.The ICO attempted once again in 2002 to reducecoffee availability in a new agreement under whichcoffee producers are to remove low-quality beansfrom the market. Regulation 407 of the ICO statesminimum specifications for export qualities, but itwill depend entirely on voluntary compliance forits success.
A final consequence of the ICAs was that theygave rise to rent-seeking behavior by governmentsand marketing boards. The extent of this problemwas revealed in the late 1980s, shortly before thecollapse of the last ICA, when the InstitutoBrazilieno de Café decided to auction 10 percent ofits export quotas. The very high prices exporterspaid for the quotas revealed to the entire domesticcoffee industry the extent of the rents being
304 Global Agricultural Trade and Developing Countries
TABLE 16.3 Coffee’s Importance to Developing Countries, 1997–2000 Averages
Percent of Merchandise Exports Per Capita GDPCountry Merchandise Exports (millions of current US$) (constant 1995 US$)
Burundi 72.2 64 143Rwanda 58.1 65 227Ethiopia 51.5 520 112Uganda 40.1 509 336Sierra Leone 29.7 11 161Nicaragua 25.4 613 435Honduras 21.7 1,398 715Guatemala 20.2 2,505 1,535El Salvador 18.2 2,580 1,737Tanzania 13.4 637 185Madagascar 11.1 616 241
Source: International Coffee Organization.
extracted. A common consequence in many coun-tries of the end of the ICA was an end to opportu-nities for rent seeking—this led to significant shiftsin domestic support policies in several producingcountries.
Domestic Policies
Since the collapse of the ICAs, domestic policies ofcoffee producers have focused on the reform andliberalization of marketing systems, and morerecently on helping producers survive periods oflow prices, sometimes through state intervention.
Akiyama (2001) reported that only 15 of theworld’s 51 coffee-producing countries had privatemarketing systems in 1985. Twenty-five countriessold coffee through state-owned enterprises, includ-ing marketing boards and stabilization funds, andanother 11 countries had mixed state and private-sector marketing bodies. Most aspects of coffeemarketing and trade, especially in Sub-SaharanAfrica, were handled by government-controlledagencies, which typically resulted in heavy taxationof the sector. Although the reasons behind the taxpolicies varied, the main ones were low price elastic-ity of short-run supply, implying minimal impact oftaxation on supply; less social and political resist-ance to taxation for cash crops than for food crops;the relative simplicity of tax collection, facilitated bythe single marketing channel; and support for thegovernment budget and balance of paymentsthrough foreign exchange earnings.
Many coffee-producing countries undertookreforms during the 1990s by removing or redefin-ing the role of the parastatals. A combination offalling prices and rent-seeking activities by someof the marketing boards led several countries toreform their coffee sectors altogether. The outcomeof these reforms has been mixed and mirrors theoutcome of similar efforts in other export crop sec-tors (Akiyama and others 2003; Shepherd andFarolfi 1999). Bohman, Jarvis, and Barichello(1996) showed that in many cases, prices paid togrowers were lower under the ICAs compared withwhat they would have been under a free market.Krueger (1990) showed that this was the case forother commodities as well. Krivonos (2003), whoevaluated the impact of reforms undertaken in14 coffee-producing countries during the late 1980sand early 1990s, concluded that in most cases
domestic prices adjusted faster after the reformsthan they did before the reforms. In addition tohigher prices, considerable private investment inthe marketing, processing, and transportation sec-tors took place. Increased supply response also tookplace in most occasions.
At the same time, the gap created by the with-drawal of the state has not been filled in all cases—the quality of public-sector services has deterio-rated. It has been often argued that the quality ofcoffee declined after the reforms, but this cannot besubstantiated from the data. Quality may havedeclined after the collapse of the ICAs, since duringthe coffee agreements, quality improvements werethe only means of increasing revenue.5
Uganda undertook sweeping reforms in 1990(Akiyama 2001). An overvalued exchange rate, theinefficiencies of the country’s Coffee Board, politi-cal instability, and the price decline of 1989 madereform the only viable alternative. Under thereforms, producer prices rose from 40–50 percentof export prices to 70–80 percent. The supplyresponse has been considerable, and many entre-preneurs have entered the market. Regulation, qual-ity control, and promotion issues were assigned tothe newly established Uganda Coffee DevelopmentAuthority. In addition to increased output, Ugandaregained its reputation as a reliable robusta pro-ducer, commanding a premium for its exports.
Reforms in neighboring Tanzania have been lesssuccessful. Before 1990 the Tanzania MarketingBoard and the cooperative unions handled all mar-keting (including input provision, transportation,and processing) and trade aspects of the sector. Thecooperatives were also responsible for managingthe large estates nationalized in the early 1970s.Some reforms were introduced in 1990, but theyaffected only inputs, price announcements, andretention of export earnings. More comprehensivereforms begun in 1994 allowed private traders topurchase coffee directly from growers and process itin their own factories for the first time in more than30 years. The outcome of these reforms has beenmixed. Growers receive a higher share of f.o.b. (freeon board) prices, they are paid promptly, and entre-preneurial activity has increased enormously. Butthe Tanzanian coffee sector is still plagued by over-regulation (including mandatory auction), hightaxation, and ad hoc decisions by the TanzanianCoffee Board (Baffes forthcoming).
Coffee: Market Setting and Policies 305

Domestic policies in producing countriesremain sensitive to international developments aswell as to local pressures, and consequently distor-tionary domestic policies appear in many coun-tries. Although coffee prices have been in long-termdecline, the volatility discussed above can make itdifficult to determine whether price changes aretemporary or a genuine shift in market fundamen-tals. Under such circumstances it is equally difficultto determine the correct policy response. An addi-tional complication is that the shift to lower-costproducers has been paralleled by the fact that thosecountries with greater market power have lowerdependency on coffee export volumes. This makesdefensive policymaking difficult for countries withgreater dependency.
The approaches taken to recent domestic policy-making are varied. Among the larger producingcountries, Brazil has long had a policy of preferen-tial credit access but more recently has been auc-tioning put options to farmers at well below fairvalue; these options are exercisable as sales of coffeeto the government. In Central America govern-ments have bailed out the banks that had lent heav-ily to the coffee sector, but because most loans hadbeen made to larger, more creditworthy farmers,the bailout failed to have much impact on the poor-est, except by maintaining employment in largerestates.
Niche Markets and ChangingPatterns of Consumption
The last decade has witnessed the emergence ofnontraditional channels of production, marketing,and consumption of “new coffees”—gourmet (orspecialty6), organic, fair trade, eco-friendly (shade-grown or bird-friendly), and other certified coffees.Lewin, Giovannucci, and Varangis (2004: 99) makethe following distinction between differentiatedand mainstream coffees:
“Differentiated coffees are those that can beclearly distinguished because of distinct origin,defined processes, or exceptional characteristicssuch as superior taste or zero defects. In con-trast, mainstream coffees are nearly always pre-ground blends that are often unidentified interms of origin. These are usually, though notalways, distributed through mainstream chan-
nels such as supermarkets, foodservice, andother institutions and they compete strongly onthe basis of price. Differentiated coffees are oftendistinguished by a closer and sometimes directrelationship with a roaster or buyer rather thanbeing traded in bulk or via the commoditymarkets.
Differentiated coffees can help the cof-fee industry compete with other beverages byleveraging unique characteristics that in-clude: (1) geographic indications of origin(appellations); (2) gourmet and specialty;(3) organic; (4) fair trade; (5) eco-friendlyor shade-grown; (6) private or corporatestandards.”
The expansion of differentiated coffees has two,often overlapping, dimensions. The first is social.Rising consumption of fair-traded, eco-friendly,shade-grown, or bird-friendly coffees is driven bysocial concerns. Consumers wish to ensure thatcoffee growers receive higher prices (fair trade)or to improve the effects of coffee growing onthe environment (shade-grown or bird-friendlycoffee). The second dimension relates to taste orpreference. Here, increasing consumption derivesfrom geographic indications of origin as well asgourmet and specialty coffees (such as Kona coffeeor Kilimanjaro coffee). Consumers are willing topay a premium for these coffees because of theirsuperior characteristics. Quite often these twodimensions overlap in the sense that consumersmay demand specialty coffee that also satisfies cer-tain social criteria.
Certification of nontraditional coffees is compli-cated and often contentious. Currently, no govern-ment agency or international organization has theofficial mandate to certify nontraditional coffees.With the exception of organic coffee, all certifica-tion comes from nongovernmental organizations—hence some of the value of the certified coffee restswith the reputation of the certifying organizat-ion. Organic coffee carrying a legally protectedtrademark is regulated in the European Union,Japan, and the United States.
The rise of self-certification by large supermar-ket chains, often with standards below those set bythe independent certification agencies, raises theissue of credibility and thus of the further expan-sion of niche markets. Parallel to the question of
306 Global Agricultural Trade and Developing Countries

self-certification is the emergence of institutionalbuyers that require producers to meet certain sus-tainability criteria but do not offer a price premiumfor doing so.
Firm estimates of the market share of differenti-ated coffee do not exist, but the figure is probablybetween 6 and 8 percent of global coffee consump-tion. Organic consumption in major consumingcountries reached 700,000 bags in 2002–03 (or about0.6 percent of global coffee consumption). In termsof market share the highest rates of consump-tion were in Denmark (2.8 percent), Switzerland(2.3 percent), Austria (2.0 percent), and Germany(1.2 percent), followed by the United States andCanada (1.1 percent each). Japan’s share was 0.5 per-cent. In the fair-trade coffee market about 240,000bags were traded in 2001, 43 percent of which wereconsumed by Germany and the Netherlands.
To summarize, several characteristics of these“new” markets must be highlighted. First, the phe-nomenal growth of these markets reflects, in part,a low base—implying that as a share of globaloutput, niche markets are small. Second, supplyand demand conditions will soon saturate thesemarkets—there is increasing evidence of fallingpremiums for these coffees in some markets. Third,the benefits usually accrue to producers with someorganizational structure, who are usually not thepoorest.
Synthesis
The coffee market may have been subject to supplycontrols longer than any other important com-modity. Apart from stabilizing (and perhaps rais-ing) prices in the short term, these agreementsbrought new entrants into the coffee market. Withfew exceptions, the trade and marketing regimesof coffee-producing countries are largely free ofdomestic support or taxation measures. At theinternational level, there are no tariffs or quantita-tive restrictions, with the exception of some tariffescalation on coffee products (such as soluble cof-fee). This escalation is very small compared toother commodities, however.
During the 1990s Brazil expanded its coffee out-put to less frost-prone areas, thus reducing theprobability of weather-induced supply disruptions.Vietnam emerged as the dominant supplier ofrobusta coffee; it now produces as much coffee as
Colombia. At the same time, numerous niche mar-kets have emerged. Currently 6 to 8 percent of cof-fee output is traded outside traditional marketingchannels. On the other hand, new technologieshave enabled roasters to be more flexible in theirability to make short-term switches among coffeetypes, implying that premiums for certain types ofcoffee cannot be retained for long.
Given the inability of the various supply-controlmeasures to arrest the decline in coffee prices, andin the absence of any new international initiative ordistorting domestic policies by dominant produc-ers, the outlook for the coffee market rests entirelyon supply and demand. Neither the supply nor thedemand outlook favors a reversal of the events thatshaped the coffee market during the last decade.
Per capita coffee consumption in high-incomecountries, where more than three-quarters of coffeeis consumed, has remained virtually unchanged overthe past decade, implying a near-zero income elas-ticity for coffee. According to recent InternationalCoffee Organization calculations, per capita coffeeconsumption in Western Europe declined from5.8 kilograms a year in 1993 to 5.5 kilograms in 1999and in the United States from 4.5 kilograms a year to4.2 kilograms (table 16.4). That is the same as the1910–20 average.Annual per capita coffee consump-tion in the United States peaked at about 8 kilogramsafter World War II and declined to 6.5 kilogramsduring the 1960s, before returning to its 1910–20average (Pan-American Coffee Bureau 1970).
Like tea, coffee faces strong competition fromthe soft drink industry. In 1970 annual per capitaconsumption of soft drinks in the United States was86 liters; in 1999 it exceeded 200 liters, accordingto the U.S. Department of Agriculture. With theexception of a few coffee producers, low-incomecountries that have high income growth potentialand high income elasticities for food do not con-sume much coffee. Efforts to penetrate new mar-kets (China and Russia, for example) have onlyrecently begun. Even if such efforts succeed, twopoints must be made. First, success is likely to comeat the expense of tea consumption, which is oftenproduced by the same countries that produce coffee(the tea industry has also engaged in efforts toincrease consumption). Second, any increase incoffee consumption by developing countries islikely to come in the form of soluble coffee, which,as mentioned earlier, requires lower quality beans.
Coffee: Market Setting and Policies 307

With the aggressive production prospects ofmajor Asian producers, especially Vietnam; withBrazil’s expansion, considerable efficiency gains,and reduced likelihood of frosts; and with weakdemand prospects due to low income elasticity andstrong competition from soft drinks, the outlookfor the coffee market is poor. While prices areexpected to recover from their current lows whenthe downward adjustment of supply takes place,prices are unlikely to reach the highs experiencedduring the boom years of the late 1970s or themid-1990s.
Notes
1. Arabica typically commands a highly volatile premiumover robusta. However, a bivariate time series error-correctionmodel that examined the comovement of arabica and robustaprices using monthly data from January 1983 to September 2001found extremely low comovement. In the 1990s, for example,the price differential fluctuated between 13 percent in October1995 and 156 percent in August 1997.
2. The concentration of coffee production has increased(from 0.11 in 1970 to 0.14 in 2000), mainly reflecting theincreased shares of Brazil and Vietnam. The concentrationindex, also known as the Herfindahl index, is defined as thesquared sum of production shares of all countries. A value ofunity indicates that a single country accounts for the entire pro-duction. Values close to zero indicate that a large number ofcountries have equal shares.
3. There has been some concern that the increasing concen-tration of the coffee industry has allowed for rent-seeking by thecoffee industry. Evidence cited includes the very high profitsmade by the coffee industry in times of low prices and the “stick-iness” of retail prices, which do not fall as fast as world green cof-fee prices. It is claimed that this reduces final demand because ofhigher-than-necessary retail prices, thus holding down worlddemand for any given level of supply. Although recent work by
RIAS (2002) found no evidence of collusion or a cartel, it is alsothe case that the coffee industry wishes to sell the volume thatmaximizes profits, which appears not to be the highest possiblevolume.
4. Highly liquid coffee futures contracts, where the hedgefund activity takes place, are traded at the New York Board ofTrade for arabica and at the London International FinancialFutures and Options Exchange for robusta. Less liquid coffeecontracts are traded at the São Paulo Commodity Exchange,Singapore Commodity Exchange, Bangalore CommodityExchange, and Tokyo Grains Exchange.
5. Quality deterioration has been presented as a negativeconsequence of policy reforms. However, the two studies thathave looked at the issue in some detail, albeit for different com-modities found little or no evidence of lower quality of cocoa inCameroon (Gilbert and Tollens 2003) and cotton in Tanzania(Baffes 2004) after the reforms.
6. UNCTAD (2002: 65) describes specialty coffees: “It is fairto say that ‘specialty coffee’ has become a generic label covering arange of different coffees, which either command a premiumprice over other coffees or are perceived by consumers as beingdifferent from widely available mainstream brands of coffee.The term has become so broad that there is no universallyaccepted definition of what constitutes ‘specialty coffee’, and itfrequently means different things to different people. Given thislack of precision in definition it is extremely difficult to describethe market in a global way.”
References
Akiyama, T. 2001. “Coffee Market Liberalization since 1990.” InTakamasa Akiyama, John Baffes, Donald Larson, and PanosVarangis, eds., Commodity Market Reforms: Lessons from TwoDecades. Regional and Sectoral Studies. Washington, D.C.:World Bank.
Akiyama, T., J. Baffes, D. Larson, and P. Varangis. 2003. “Com-modity Market Reform in Africa: Some Recent Experience.”Economic Systems 27: 83–115.
Baffes, J. (forthcoming) “Tanzania’s Coffee Sector: Constraintsand Challenges.” Journal of International Development.
308 Global Agricultural Trade and Developing Countries
TABLE 16.4 Per Capita Coffee Consumption of Major Consumers, 1993–99(kilograms per year)
Country 1993 1994 1995 1996 1997 1998 1999
European UnionGermany 7.93 7.53 7.37 7.16 7.22 7.01 7.46France 5.73 5.30 5.48 5.69 5.68 5.39 5.52Italy 5.18 5.00 4.86 4.95 5.08 5.16 5.16Spain 4.19 4.28 4.21 4.49 4.63 4.68 5.15United Kingdom 2.61 2.71 2.25 2.43 2.46 2.62 2.30EU average 5.76 5.57 5.33 5.57 5.56 5.51 5.52
Japan 2.83 2.92 2.98 2.83 2.90 2.91 3.01United States 4.50 4.01 3.98 4.10 4.00 4.14 4.24Average 4.88 4.64 4.51 4.64 4.59 4.62 4.69
Source: International Coffee Organization.

Baffes, J. 2004. “Tanzania’s Cotton Sector: Reforms, Constraintsand Challenges.” Development Policy Review 22: 75–96.
Bates, R. H. 1997. Open-Economy Politics: The Political Economyof the World Coffee Trade. Princeton, N.J.: Princeton Univer-sity Press.
Bohman M., Lovell Jarvis, and R. Barichello. 1996.“Rent Seekingand International Commodity Agreements: The Case ofCoffee.” Economic Development and Cultural Change 44(2):379–404.
Gilbert, C. L. 1995. “International Commodity Control: Retro-spect and Prospect.” Policy Research Working Paper 1545.World Bank, International Economics Department, Com-modity and Policy Analysis Unit, Washington, D.C.
Gilbert C. L., and E. F. Tollens. 2003. “Does Market LiberalisationJeopardise Export Quality? Cameroonian Cocoa, 1988–2000,”Journal of African Economies 12: 303–342.
Hutchinson, L. 1909. “Coffee ‘Valorization’ in Brazil.” QuarterlyJournal of Economics 23(3): 528–35.
IADB/USAID/WB (Inter-American Development Bank, U.S.Agency for International Development, World Bank). 2002.“Managing the Competitive Transition of the Coffee Sector inCentral America.” Paper presented at the Regional Workshop“The Coffee Crisis and its Impact in Central America: Situa-tion and Lines of Action,” Antigua, Guatemala, April 3–5.
Kreuger A. O. 1990. The Political Economy of Controls. PublicPolicy and Development: Essays in honor of Ian Little. Oxford:Oxford University Press.
Krivonos, Ekaterina. 2003. “The Impact of Coffee MarketReforms on Producers’ Prices and Price Transmission.” Devel-opment Prospects Group, World Bank, Washington, D.C.
Lewin, B., D. Giovannucci, and P. Varangis. 2004. “CoffeeMarkets: New Paradigms in Global Supply and Demand.”Agriculture and Rural Development Internal Report, WorldBank, Washington, D.C.
Pan-American Coffee Bureau. 1970. Annual Coffee Statistics. No.34. New York.
RIAS (Rabo International Advisory Services). 2002. “Raising theIncome of Coffee Growers.” Paper prepared for the Ministryof Foreign Affairs, The Netherlands.
Shepherd, A. W., and S. Farolfi. 1999. Export Crop Liberalizationin Africa: A Review. Rome: United Nations Food and Agri-culture Organization.
UNCTAD (U.N. Conference on Trade and Development). 2002.Product and Market Development—Coffee: An Exporter’sGuide. International Trade Center, Geneva.
Wickizer, V. D. 1943. The World Coffee Economy with SpecialReference to Control Schemes. Palo Alto, Calif.: StanfordUniversity Press.
Coffee: Market Setting and Policies 309


ACP (African, Caribbean, and Pacific). See CotonouAgreement and trade preferences; LoméConvention
ACPC. See Association of Coffee Producing Countriesacreage set-asides, 80ad valorem and specific duty rates, 45, 46t3.4aflatoxin problems, 94, 107, 227
See also food safety standardsAfrica
See also African Growth and Opportunity Act(AGOA); Southern Africa Customs Union(SACU); specific countries and regions
agricultural exports, 31, 108coffee production, 297cotton
exports, 260, 262production, 260, 261reform, effect of, 268, 269–271
dried fruit exports, 107–108reform, effect on, 120rice and trade liberalization, 190seafood exports, 279trade preferences, 65–67
African Growth and Opportunity Act (AGOA)clothing exports, 57U.S. preferences under, 59, 59t4.2, 60t4.3
cumulation permitted, 70fruits and vegetables, 249, 251–252
Agenda 2000 (EU), 82Agreement on the Application of Sanitary and
Phytosanitary Measures. See Sanitary andPhytosanitary Agreement
Agreements on Textiles and Clothing (ATC), 270Agricultural Act of 1949 (U.S.), 86agricultural productivity and reform, 128–131
aggregate welfare, 130, 130f 7.4high-productivity assumption, 130–131,
131t7.12–7.13output impact, 129–130, 129t7.11trade impact, 128–129, 129t7.10
agricultural protection, 5–6, 37–53See also specific commoditiesaquaculture, 291coffee, 298cotton tariffs, 264current structure of, 43–50, 44t3.3decoupling. See decoupling
in developing countries, 42–43escalation of tariffs, 48–49, 48t3.8, 49t3.9evolution of, 39–42export subsidies. See export subsidiesfruits and vegetables tariffs and import restrictions,
246–248, 246t13.7, 247t13.8, 256developing countries, 248, 250t13.10
groundnuts, 223–228, 232, 233African exporters, 226trade liberalization scenarios, 228–234, 229t12.13,
230t12.14in OECD countries, 39–42
See also OECD countriesreform implications for, 50–52, 51t3.10–3.11, 52–53,
118–120See also reform; trade liberalization
seafood, 280, 283–287, 287–288tariff levels, 42, 46–48, 47t3.6, 48t3.7tariff rate quotas, 49, 50f3.6
fruits and vegetables, 251sugar, 148, 149, 156
tariff transparency, 44–46, 45f3.5ad valorem and specific duty rates, 45, 46t3.4non-ad valorem lines as share of total,
44–45, 45f3.5non-ad valorem lines by degree of processing,
46, 46t3.5Uruguay Round Agreement and, 38–39wheat tariff rates and quotas, 200–203, 200t11.3,
202t11.4agricultural trade
evolution of. See changes in agricultural trade flowsimportance of, 1policies. See agricultural protection; specific
commoditiesreform. See reform; trade liberalization
agricultural trade shares, 23–26, 23t2.6, 25t2.9excluding intra-EU and intra-NAFTA trade, 25, 26t2.10
alcoholic beveragesgrowth in trade of, 28tariff lines, 45
Algeriadried fruit exports, 108wheat imports, 206
Andean Group and dairy product trade, 168Andean Trade Preference Act, 249Angola fishing access, 283
Index
311
Page numbers followed by b, f, or t indicate box, figure, or table.

animal diseases, 103, 104antidumping duties
HFCS, 149orange juice, 249b13.2seafood, 286–287
APEC countries and seafood trade liberalization, 288aquaculture
See also seafoodcarp, 292environmental effects, 277, 291, 293expansion of, 276, 278–279fish meal, effect on, 291–292, 294production, 276, 277f15.2, 278, 278f15.3salmon farming, 291–292shellfish, 292–293shrimp, 276, 277, 277f15.2
See also shrimpThailand and Bangladesh, 276trade liberalization, impact of, 291–293,
292t15.5–15.6Arabica coffee, 297Argentina
cotton tariffs, 264fishing access, 283food safety complaints, 103fruits and vegetables exports, 244groundnuts
exports, 108global trade in, 218policies, 215, 225–226, 233, 234prices, 220
HFCS production, 146as major exporter, 28milk production, 162, 163reform, impact of, 28, 124
high-productivity assumption, 130rice exporters, effect of liberalization on, 190trade liberalization, impact of, 125wage changes for unskilled labor, 125wheat, 201
domestic support, 205as major exporter, 205, 206
Arkansas Global Rice Model (AGRM) to study domesticrice policies, 190–191
artificial sweeteners, 148Asia
See also specific countries and regionscoffee production and yields, 297, 299, 300poverty, 18protectionism of, 3rice
production and consumption, 177trade liberalization, effect of, 188–189
seafoodconsumption, 275fishmeal production, 278
shrimp production, 276wheat exports, 211–212
Asia Pacific Economic Cooperation (APEC)milk and dairy products, 168
asparagus exports, 254b13.3Association of Coffee Producing Countries (ACPC),
298, 304Australia
agricultural protection levels, 43–44cotton
exports, 260genetically modified, 263production, 259, 260reform, effect of, 268
exporting of agricultural products, 26milk and dairy products
production and manufacturing, 161, 162reform, effect of, 171, 174trade and domestic policy, 165–166trade trends, 164
rice exporters, effect of liberalization on, 189sugar
exports, 146reform, effect of, 151
trade liberalization, impact of, 124, 125wage changes for unskilled labor, 125wheat
export credits for, 203as major exporter, 205production and yields, 197
Austrian organic coffee, 307avian flu, 103
BAAC (Bank for Agriculture and AgriculturalCooperatives), 182
bagasse, 141–142Bangladesh
food safety, costs of compliance in shrimp industry,97, 98t6.1
rice, 182seafood bans for food safety reasons, 286shrimp
food safety, costs of compliance in, 97sustainable aquaculture in, 277
Bank for Agriculture and Agricultural Cooperatives(BAAC), 182
Benin and cotton reform initiatives, 270beverages
growth in trade of, 28, 30soft drink competition with coffee, 307tariff lines, 45
bilateral trade agreementsfruits and vegetables, 249, 250groundnut trade liberalization, 228–233milk and dairy products, 168trade liberalization and, 4
312 Index

Bogor Declaration, 288Brannan Plan of 1949 (U.S.), 78Brazil
coffeeassociation of producers, 304consumption, 297, 298, 299, 307domestic policies, 305output, 297price and price stabilization, 298, 300,
303b16.1production, 297, 298–299, 300, 307, 308rent-seeking behavior by governments and
marketing boards, 304–305supply controls, 302–304types grown, 297
cottongovernment assistance, 264production, 260reform, effect of, 269tariffs, 264WTO process initiated by, 269, 271
food safety complaints, 103fruits and vegetables tariffs, 248groundnut exports, 108, 218as major exporter, 28milk and dairy products
production trends, 163trade trends, 164–165
orange juice trade dispute, 249b13.2reform, impact of, 28, 124
high-productivity assumption, 130rice trade liberalization, effect of, 190sugar
employment, 145ethanol production, 143, 147policies, 147–148, 150production and trade, 145reform, effect of, 151, 158
wheat, 201imports, 206, 208
British Retail Consortium Technical Food Standard, 95
Bt cotton, 263–264, 272bulk-commodity approach to export expansion, 4Burundi coffee exports, 297, 301
Cahill, Sean A., 77Cairns Group and dairy products, 170Canada
See also Quad countriesagricultural protection levels, 44
tariff lines, 45Crow Rate program for grain shippers, 79, 86–87fruits and vegetables
domestic support, 245tariffs, 246
groundnutsmarket for, 217policies, 227–228
HFCS production, 146milk and dairy products
production trends, 163reform, effect of, 170, 171, 173, 174trade and domestic policy, 165–166
organic coffee, 307rice trade liberalization, effect of, 190salmon farming, 291–292seafood
exports, 279tariffs, 283
trade liberalization, impact of, 124, 125, 233wheat
export credits for, 203as major exporter, 205
Cancún Ministerial Meetings (2003), 37, 50, 175capital market, change due to reform, 125–126, 127t7.8Caribbean Basin Economic Recovery Act, 249Caribbean Basin Initiative, 68, 156Caribbean countries and sugar reform, 152carp production, 276, 292catfish, 287Catfish Farmers of America, 287cattle headage payments (EU), 83Central America. See Latin Americacephalopods, 279changes in agricultural trade flows, 4–5, 17–35
disaggregated export and import performance, 28,29t2.12
export shares by product and region, 31, 33t2.16growth in trade, 22–23, 22t2.5
distribution of, 26–28, 27t2.11output growth rates, 23, 23t2.8poverty and, 17–20price decline, 23, 23t2.7processing, degree of, 30–31, 31t2.14, 32t2.15ratio of farm household income
to all household income for high-income countries,18, 19f2.2
to nonfarm household income for developingcountries, 18, 19f2.1
ratio of farm income to total income of farmhouseholds for high-income countries, 20, 21f2.3
role of demand and changes in market share,23, 24b2.1
rural income and, 17–21, 18t2.1–2.2income distribution, 20–21, 21t2.4structure of income sources, 20, 20t2.3
trade shares, 23–26, 23t2.6, 25t2.9excluding intra-EU and intra-NAFTA trade,
25, 26t2.10trade structure changes, 28–30, 30t2.13trends, 21–31
Index 313

Chilefood safety complaints, 103free trade agreement with U.S., 249fruits and vegetables exports, 244milk and dairy products, 168salmon farming, 291–292seafood
antidumping and countervailing measures,286–287
fishmeal production, 278production, 276tariffs, 283
Chinacarp production, 276coffee, 307cotton
exports, 262genetically modified, 263–264government assistance, 264, 266–267production and consumption, 259, 260, 263reform, effect of, 270tariffs, 264trade in, 260–261
food deficit trends, 118fruits and vegetables
exports, 238, 244unit values, 241
groundnutsexports, 108, 217global trade in, 218policies, 226, 228, 234prices, 220production, 216–217trade liberalization scenarios, 229, 232, 233–234
milk and dairy products, 168–169production trends, 163
reform, impact of, 3, 118, 124, 125, 127high-productivity assumption, 130
rice, 179–180exporters, effect of liberalization on, 189
seafoodantidumping and countervailing measures,
286–287consumption, 275crawfish, 286–287exports, 279fishmeal production and use, 278production, 276reprocessing market for U.S. and Norway, 280subsidies, 290
sugar, 145, 147policies, 148, 150reform, effect of, 151
trade surplus of, 28wage changes for unskilled labor, 125wheat
exports, 212imports, 206, 209production and yields, 196
Clean Air Act amendments of 1990 (U.S.), 143Codex Alimentarius Commission, 93coffee, 13, 297–309
certification of nontraditional, 306–307changing structure of coffee market, 297, 298t16.1consumption of, 297–298, 299, 300, 306–308, 308t16.4decline in trade, 28developing countries, importance to, 297, 301,
304t16.3differentiated, 306–307as distortion-free market, 298domestic policy, 305–306global balance and price trends, 298–302,
301–302f16.1international policy, 302–305low-quality beans, demand for, 297–298, 307market outlook, 307–308new markets for, 307niche marketing and changing patterns of
consumption, 297–298, 306–307price-stabilization schemes, 298, 303b16.1production, 297–298, 299, 299t16.2, 300rent-seeking behavior by governments and marketing
boards, 304–305soft drink competition, 307, 308supply controls, 298, 302, 303b16.1, 304tariffs, 298types of, 297
Colombian coffeeassociation of producers, 304consumption, 299output, 297, 299production, 307
commoditiesSee also specific commoditieschange of product mix in global trade, 28–30, 30t2.13,
34, 69Conservation Reserve Program (U.S.), 205–206corn and aflatoxin problems, 107corn starch, 142Costa Rican coffee prices, 302Côte D’Ivoire and cotton reform initiatives, 270Cotonou Agreement and trade preferences, 61, 63,
63t4.5–4.6, 68rules of origin and, 70
cotton, 12, 259–273See also specific countries and regionsborder protection and, 3developing countries
economic importance of, 262–263, 262t14.1, 271production, 259
genetically modified, 263–264, 272government assistance, 264, 265t14.2
314 Index
historical background, 259importing, 261market distortions, 264–268
reform of, 268–270market share vs. polyester, 259, 260f14.1, 271nonconventional production, 263–264organic, 263–264, 272phase-out of Agreements on Textiles and Clothing
(ATC), 270pricing, 261–262, 271, 272production and consumption, 259–261stockholding, 260subsidies, effect of, 3, 50, 271tariffs, 264trade liberalization, effect of, 268–270, 269t14.4, 271
country of originlabeling of seafood, 285rules of origin and trade preferences, 57, 69–70
crab and lobster, 279, 280crawfish, 287Crow Rate program for grain shippers (Canada),
79, 86–87crustaceans, 280Cuban sugar
exports, 146reform, effect of, 151
Cyclospora, 109Czech Republic and dairy products, 166, 168
dairy products, 9–10, 161–176See also specific countriesbackground, 162–163developing economies, prospects for, 175–176milk components as factor in sector growth, 175milk production and dairy product manufacturing,
162–163subsidies, effect of, 3tariff lines, 45trade liberalization and, 3, 4, 161–162, 169–174
full liberalization scenario, 170–174, 172t9.3other scenarios, 174prospects for, 175
trends in trade, 164–165decoupling, 6–7, 75–89
assessment of, 87–89definition of, 75–77economics of, 78EU cotton payments, 269experience with broad attempts, 78–86
EU, 81–83, 82t5.3Mexico, 83–85, 84t5.4Turkey, 85–86, 85t5.5U.S., 79–81, 80t5.2
experience with one-time buyouts, 86–87Canadian Crow Rate program for grain shippers,
79, 86–87
New Zealand exit grant to farmers, 79, 87U.S. peanut quota, 79, 86, 157
politics of, 77–78recommendations for, 88–89U.S. cotton payments, 264–265, 269
“Decoupling: The Concept and Its Future in Canada,” 76Denmark
farm household incomes, 18organic coffee, 307seafood imports, 280
developing countriesSee also specific countries and regionsagricultural protection policies of, 37–38, 42–43,
43t3.2, 52most-favored-nation tariffs for, 42, 43f3.4
agricultural trade flow of, 25, 26–28, 27t2.11agricultural trade shares of, 23–26, 23t2.6, 31cotton
economic importance of, 262–263, 262t14.1, 271production, 259
food safety issues, 97–99, 101, 103, 111–112disputes and complaints through WTO, 103–105
fruits and vegetables exports, 237, 244, 244t13.4,245t13.5, 256
growth in trade, 22, 28, 29, 34export shares by product and region, 31, 33t2.16
milk and dairy productsmarket growth prospects for, 175–176production trends, 164
reform, effect of, 30, 123–124agricultural productivity, 128–130supply response, 132–134, 133t7.14
rice trade and policies, 179trade liberalization, effect of, 190
rural household incomes, 20, 20t2.3sugar production, 157–158tariff rates, 42, 47trade preferences and least-developed countries,
55–73See also trade preferences
wheatfood aid programs, 195importing of, 198
development strategy based on agricultural exports, 3dextrose, 142disaggregated export and import performance,
28, 29t2.12diversification and trade preferences, 68–69Doha Declaration
fishing subsidies, 282Doha Round, 57, 232Doi Moi, 300Domestic Food Aid Plan (Czech Republic), 166domestic subsidies, effect of, 3
See also specific commoditiesdecoupling. See decoupling
Index 315

East AsiaSee also specific countriescotton
consumption, 260importing, 261
growth in importing, 28milk and dairy products, 168–169
trade and domestic policy, 168–169reform, impact of, 124, 125
Eastern EuropeSee also specific countriesagricultural protection reductions, 42milk and dairy products
production trends, 163trade and domestic policy, 166–168trade trends, 164
wheat imports, 206EBA. See Everything But Arms initiativeeco-friendly coffee, 306–307eco-labeling of seafood, 285Economic Partnership Agreements (EPAs) and sugar
policies, 154Economic Research Service of USDA on Japanese sugar
policies, 155EEZ. See exclusive economic zonesEgypt
cottongovernment assistance, 264tariffs, 264
groundnut exports, 108rice exporters, effect of liberalization on, 189wheat imports, 206, 207–208
El Salvadorcoffee prices, 302
environmental effectsaquaculture, 277, 293shrimp aquaculture, 277, 291Uganda’s fishing industry, 282b15.1
EPAs (Economic Partnership Agreements) and sugarpolicies, 154
Essential Commodities Act of 1955 (India), 148ethanol, 143, 147, 148Ethiopia
coffeeconsumption, 299exports, 297, 301
income sources, 20trade preferences, 67
EURECAP Fruit and Vegetable Standard, 95–96European Union (EU)
See also Quad countriesAgenda 2000, 82agricultural protection levels, 40–41, 44
average tariffs, 47tariff lines, 45, 46
agricultural trade shares of, 24–25, 26
aquaculture tariffs, 291cattle headage payments, 83Common Agricultural Policy (CAP), 81–83
cotton, 266decoupled payments and, 77, 78sugar, 152wheat, 201, 205
cottondecoupled payments, 269government assistance, 264, 266reform, effect of, 268
decoupling agricultural support, 77, 81–83, 82t5.3, 88Economic Partnership Agreements (EPAs), 154Everything But Arms. See Everything But Arms
initiative (EBA)export trade subsidies, 50farm subsidies, 41, 126final products, shares of, 31, 34fish bans, 105–106food safety standards, 94
aflatoxins, 107complaints from developing countries, 104EURECAP Fruit and Vegetable Standard, 95–96fish bans, 105–106harmonization of measures, 105product rejection data, 100–103, 102t6.2recognition of developing country standards, 96
fruits and vegetablesdomestic support, 245entry price scheme, 247b13.1as largest market and supplier, 241–242, 243preference system, 60, 249–250, 250f13.7, 252,
253f13.10production growth, 238tariffs, 246, 248unit values, 241
groundnutsmarket for, 217policies of, 227–228prices, 221rejection for food safety reasons, 101technical standards for, 220, 227trade liberalization scenarios, 229
Mac Sharry reform, 81milk and dairy products
reform, effect of, 170, 171, 173, 174, 175tariff rates, 47trade and domestic policy, 165–166
organic coffee, 306rice, 184
domestic trade and policy reforms, 191importers, effect of liberalization on, 190policy distortions, 185
seafoodbans, 282b15.1, 286consumption, 275
316 Index

country-of-origin labels, 285fishing access, 283, 284, 293fishing sector in Mauritania, 283, 284b15.2fishmeal production, 278imports, 279–280management styles, 290subsidies, 290tariffs, 283–284
self-sufficiency of, 34sugar
enlargement issues, 154HFCS production, 146as major global producer and exporter, 145, 146protection, 141, 142reform, effect of, 151, 152–154, 158
tariff transparency, 45trade liberalization, impact of, 124, 125, 233trade preferences under GSP and Cotonou
Agreement, 58, 60–63, 61t4.4, 63t4.5–4.6entry price of tomatoes, 62b4.1proportion of trade covered by, 65, 66t4.11rules of origin and, 70value of, 68, 68f4.2, 71
wage changes for unskilled labor, 125wheat
domestic support of, 195, 204export subsidies, 200, 203as major exporter, 205processed wheat products trade, 201production and yields, 196
Everything But Arms initiative (EBA), 57, 61, 82,153–154, 249, 250
rules of origin and, 70exchange rates, 42exclusive economic zones (EEZ), 279, 280–281, 283export diversification and trade preferences, 68–69Export Enhancement Program (U.S.), 203export shares by product and region, 31, 33t2.16export subsidies, 49–50
See also specific commoditiesexport taxes, 37
Argentina’s groundnut policy, 225
FAIR Act. See Federal Agricultural Improvement andReform (FAIR) Act of 1996
fair trade coffee, 306–307FAO. See Food and Agriculture OrganizationFarm Bill of 1985 (U.S.), 78Farm Bill of 1996 (U.S.)
cotton, 265decoupling and, 78–79, 80, 88
Farm Bill of 2002 (U.S.)cotton, 265dairy products, 175decoupling, effect of, 81groundnuts, 215, 217, 222–223, 224, 233
peanut buyout, 79, 86rice, 184wheat, 206
FDA. See Food and Drug Administration (FDA, U.S.)Federal Agricultural Improvement and Reform (FAIR)
Act of 1996 (U.S.), 80–81feed, use of wheat for, 198Fiji
sugarindustries employment, 145reform, effect of, 152
trade preferences, 68fish. See seafoodFlorida and sugar production, 157food aid programs, effect on wheat, 195, 203, 203f11.5Food and Agricultural Policy Research Institute on
liberalization’s effect on wheat, 212Food and Agriculture Organization (FAO)
on cotton production, 263historical trends of growth, 118
Food and Drug Administration (FDA, U.S.)Center for Food Safety and Applied Nutrition, 94Guatemalan fruits, standards for, 109, 110increased inspections by, 100
Food Corporation of India and rice importation, 180food safety standards, 7–8, 91–114
See also specific commoditiesasparagus exports, 254b13.3capacity to comply with minimum standards, 96–97costs of compliance, 97–99effect of, 91–93exports of high-value agro-food products and,
99–105border detentions and rejections of agricultural
and food products, 100–103, 102t6.2WTO disputes and complaints, 103–105, 104t6.3
fruits and vegetables, 109–111Guatemalan raspberries, 109–110horticultural product standards, proliferation of,
109–111Kenyan fresh produce, 110–111mycotoxins and aflatoxins, 107–109as political issues, 77Sanitary and Phytosanitary Agreement, 93–96, 293seafood, 95, 102, 105–107, 282b15.1, 285–286,
293, 294viewed as barriers, 4wheat, 201
Food Security Act of 1985, 80food security and wheat, 203–204, 213foot and mouth disease controls, 103, 104Former Soviet Union (FSU)
See also Russiacotton
economic importance of, 262–263production, 260
Index 317

Former Soviet Union (continued)milk and dairy products
production trends, 163trade trends, 164
wheatexports, 209–211, 210f11.9feed use, 198imports, 206production and yields, 197tariff protection, 201
FranceSee also European Union (EU)coffee consumption, 297, 299farm household incomes, 18seafood
fishing access, 283imports, 280
Free Trade Area of the Americas (FTAA), 168fructose, 142
See also high-fructose corn syrup (HFCS)fruits and vegetables, 11–12, 237–257
See also specific countries and regionsdeveloping countries as exporters, 237, 244, 244t13.4,
245t13.5, 256domestic support and export subsidies, 245–246,
245t13.6dried fruit exports from Africa, 107–108EU entry price scheme, 247b13.1EURECAP Fruit and Vegetable Standard, 95–96exports, 241–244, 242t13.3
determinants of success, 252–256food safety standards, 109–111global trade patterns, 241–244Guatemala programs, 109–111imports, 238, 239t13.1, 240f13.3–13.4, 241t13.2,
242t13.3, 256preferential market access, 248–352
EU hierarchy of preferences, 249–250, 250f13.7pricing, 240–241, 241f13.5processed, 239–240, 240f 13.4
preferential access, 255tariffs, 248, 248t13.9
production and trade growth, 28, 30, 237–241,238f13.2, 239f 13.3–13.4
tariff rate quotas, 251tariffs and import restrictions, 246–248, 246t13.7,
247t13.8, 256developing countries, 248, 250t13.10
tomatoes and EU system of entry prices, 62b4.1trends in production and trade, 238–241,
238f13.1urbanization, effect of, 244
FSU. See Former Soviet UnionFTAA (Free Trade Area of the Americas), 168
Gambian groundnutsglobal trade in, 108, 217, 218–220
policies, 226–227prices, 220trade liberalization scenarios, 229, 232
GAP (Good Agricultural Practice), 254b13.3GATT (General Agreement on Tariffs and Trade)
disputes. See World Trade Organization (WTO)Enabling Clause and trade preferences, 56fishing subsidies, 280Standards Code, 93sugar tariff rate quotas for U.S., 156
Generalized System of Preferences (GSP), 56EU preferences under, 60–63, 63t4.5–4.6fruits and vegetables, 249harmonizing preference regimes as goal of, 57Japanese preferences under, 63–64, 64t4.8–4.9rules of origin and, 70sugar duties and, 156U.S. preferences under, 59–60, 59t4.2, 60t4.3
genetically modified cotton, 263, 272Germany
See also European Union (EU)coffee
consumption, 297, 299fair trade, 307organic, 307
seafood imports, 280global merchandise trade reform, 118–120,
119t7.3caveats about, 119–120tariffs’ role, 120, 121t7.4
Global Trade Analysis Project (GTAP)data problems, 119sugar policies and, 151trade elasticities, 134
Good Agricultural Practice (GAP), 254b13.3Goodwin, Barry K. and Ashok K. Mishra, 77Greece
See also European Union (EU)cotton production, 259, 260, 261fishing access, 283
Green Revolution, 196–197, 211groundnuts, 11, 215–235
See also specific countries and regionsAfrican exports, 108, 215, 226–227, 227t12.11confectionery, 227, 234domestic policies of major countries in world
markets, 221–228African exporters, 226–227, 227t12.11Argentina, China, and India, 224–226,
225t12.10, 233high-income importers, policies of, 227–228,
228t12.12U.S. policies, 222–224, 222t12.5, 223t12.6,
224t12.8–12.9, 233global trade in, 217–220
consumption, exports, and market shares,218, 219f12.1
318 Index

share of groundnut products in total merchandiseexports, 218, 220t12.4
value of net exports by product, 217, 218t12.3high-income importers, policies of, 227–228international prices of, 220–221, 231–233
Rotterdam prices, 220, 221f12.3unit price of edible raw groundnuts in Gambia,
Senegal, and South Africa, 220, 221f12.2oil markets, 221patterns of trade, 229policy reforms, impact of, 228–233, 229t12.13,
230t12.14production, 215–217, 216t12.1, 217t12.2trade liberalization scenarios, 3, 215, 228–234,
229t12.13, 230t12.14U.S., 222–224welfare gains, 229, 231
Group of Three and dairy product trade, 168growth in trade, 22–23, 22t2.5
See also specific commoditiesdistribution of, 26–28, 27t2.11
GSP. See Generalized System of PreferencesGTAP. See Global Trade Analysis ProjectGuatemala
coffeeexports, 297prices, 302
fruits and vegetables exports, 244raspberries and food safety standards, 109–110rice importers, effect of liberalization on, 190
Haiti and trade preferences, 68Harbison, Stuart, 50–52hazard-analysis, critical-control-point (HACCP)
principles, 97, 98, 285–286seafood imports, 285–286
Hennessy, David A., 77herring, 280high-fructose corn syrup (HFCS), 142–143, 146, 149
EU quotas, 153Japan, 146, 155U.S., 142–143, 143f 8.2, 146, 156
high-income countries. See industrial countries; OECDcountries
Honduras coffeeexports, 297prices, 302
Hong Kongliberal trade regime of, 28rice trade liberalization, effect of, 190
horticultural tradeEU, 243export subsidies, 245, 245t13.6opportunities for reform and, 4, 256pesticide residues, 95, 109product standards, proliferation of, 109–111
Household Responsibility System (China), 266
ICAC. See International Cotton Advisory CommitteeICAs. See International Coffee AgreementsIceland agricultural protection levels, 43ICO. See International Coffee OrganizationIndia
cottonproduction and consumption, 259, 260, 263tariffs, 264trade in, 261
food safety complaints, 103fruits and vegetables
exports, 238tariffs, 248
groundnuts, 3policies, 226, 228, 233production, 216trade liberalization scenarios, 229, 232, 233–234
milk and dairy products, 168–169production trends, 163
rice, 180–181exporters, effect of liberalization on, 189
seafoodfood safety issues, 99, 286tariffs, 283
sugarethanol production, 148as largest global consumer, 146as major global producer, 145, 147policies, 148, 150
trade liberalization and, 3trade surplus of, 28wheat
exports, 211production and yields, 196–197, 197f11.1
Indonesiacoffee output and consumption, 299fruits and vegetables exports, 244milk and dairy products, 168–169rice, 181–182, 189sugar, 151, 158tariff rates, 47wheat imports, 201, 207
industrial countriesSee also OECD countries; specific countries and regionsagricultural protection policies, 37
average tariffs, 47Harbinson reform proposal, 50–52
agricultural support, effect of, 21demand and changes in market share, 24b2.1farm income, distribution of, 20, 31import decline, 22, 28reform, effect on, 121–122, 123–124
agricultural productivity, 128–130Integrated Framework for Trade-Related Technical
Assistance, 72Integrated Program for Agricultural and Environmental
Protection (Guatemala), 110
Index 319
Inter-American Coffee Agreements, 298International Coffee Agreements (ICAs), 298, 303b16.1,
304–305International Coffee Conference (N.Y. 1902), 303International Coffee Organization (ICO), 298,
303b16.1, 304International Cotton Advisory Committee (ICAC), 261,
264, 267, 268International Food Policy Research Institute, 105International Law of the Sea, 279International Maize and Wheat Improvement
Center, 196International Office of Epizooties, 93, 103International Plant Protection Convention, 93International Sugar Organization on China’s sugar tariff
rate quota, 148inulin, 153Iran
groundnut exports, 108wheat imports, 207
Irelandmilk production and dairy product manufacturing, 162salmon farming, 291–292
isoglucose. See high-fructose corn syrup (HFCS)Israel
cotton production, 261free trade agreement, 249minimum import commitments for sheep and dairy
products, 38Italy
coffee consumption, 297, 299seafood
bans for food safety reasons, 286fishing access, 283imports, 280
JapanSee also Quad countriesagricultural protection levels, 44
average tariffs, 39tariff lines, 45
aquaculture tariffs, 291coffee
consumption, 297, 299organic, 306, 307
farm household incomes, 19fruits and vegetables
domestic support, 245imports, 243tariffs, 248unit values, 241
groundnutsglobal trade in, 217policies of, 228
importing, 26, 28, 213milk and dairy products, 168–169
reform, effect of, 171
rice, 183policy distortions, 38, 185
seafoodconsumption, 275fishmeal production, 278imports, 279subsidies, 290tariffs, 284trade preferences, 68
sugar, 154–155, 154f 8.4HFCS production and consumption, 146, 155protection, 141, 142reform, effect of, 151, 158
trade liberalization, impact of, 125trade preferences under GSP, 58, 63–64,
64t4.7–4.9proportion of trade covered by, 65–67, 66t4.12rules of origin and, 70value of, 68, 69f4.3
wage changes for unskilled labor, 125wheat
imports, 201, 206, 208–209support to domestic producers, 205
KazakhstanSee also Former Soviet Union (FSU)wheat exports, 209–210
Kenyafruits and vegetables exports, 244
food safety standards, 110–111seafood exports and food safety standards, 98, 99,
106–107, 286sugar industries employment, 145wheat imports, 201
Korea, Republic ofagricultural protection levels, 42, 44
average tariffs, 47aquaculture tariffs, 291fruits and vegetables tariffs, 246, 248groundnut policies of, 228HFCS production, 146as major importer, 28milk and dairy products, 168–169
production trends, 163rice, 183
importers, effect of liberalization on, 188policy distortions, 38, 185
seafood tariffs, 283–284tariff rates, 47taxation to finance decoupling, 78trade liberalization, impact of, 125wheat imports, 201, 207
labeling of seafood, 285names, regulation of, 287
land contribution to agricultural income and impact ofreform, 126, 128t7.9
320 Index
Latin AmericaSee also specific countriesagricultural protection, evolution of, 43agricultural surplus trends, 118coffee
domestic policies, 305output, 297, 300prices, 301–302production, 300regulation of exports, 303b16.1type grown in, 297yields, 299
cotton production, 260fishmeal production, 278fruits and vegetables exports, 238, 244milk and dairy products
production trends, 163reform, effect of, 173trade and domestic policy, 168trade trends, 164
reform, impact of, 124–125rice
policy distortions, 185trade liberalization, effect of, 190
seafood exports, 279shrimp production, 278sugar, effect of trade reform, 151wage changes for unskilled labor, 125
least-developed countries and trade preferences,55–73
See also trade preferencesliberalization. See reform; trade liberalizationlicensing
elimination in developing countries, 42wheat importers, 202
LINKAGE model and simulations, 115–118agriculture and food trends, 117–118, 117t7.1–7.2baseline simulation, 116
LMC International on sugar production costs, 144,144t8.1
Lomé Conventionfruits and vegetables, 249, 250, 251, 251f13.8sugar protocol, 153
low-income countries. See developing countries
Mac Sharry reform (EU), 81Madagascar seafood
bans for food safety reasons, 286shrimp industry, 277–278
Malawigroundnuts, 227
exports, 217global trade in, 218, 220production, 216trade liberalization scenarios, 229, 232
income sources, 20sugar and trade preferences, 68
Malaysiamilk and dairy products, 168–169rice trade liberalization, effect of, 190seafood tariffs, 283tariff rates, 47wheat imports, 201
Maldives seafood exports, 275, 280Mansholt Plan of 1968 (Europe), 78, 81market share
cotton vs. polyester, 259, 260f14.1, 271groundnuts, 218, 219f12.1role of demand and changes in, 23, 24b2.1Sub-Saharan Africa, 31
Mauritania fishing access, 283, 284b15.2Mauritius
sugar industries employment, 145trade preferences, 68, 71
Mercosur countriesEU free trade negotiations with, 82milk and dairy product trade, 168
reform, effect of, 173rice trade, 192wheat trade, 201, 208
MexicoSee also NAFTA countriesagricultural protection levels, 42coffee output and consumption, 299Conasupo programs, 83cotton and government assistance, 264decoupling agricultural support, 83–85, 84t5.4, 88fruits and vegetables exports, 109–110, 244milk and dairy products
production and manufacturing, 163trade trends, 164
National Program for Direct Assistance to RuralAreas, 78
Procampo program, 83–84rice importers, effect of liberalization on, 190rural household incomes, 20sugar
HFCS production, 146policies, 148–149, 150, 156reform, effect of, 151
trade liberalization, impact of, 134, 233wheat imports, 201
microanalysis, importance of, 2–3Middle East
See also specific countriesmilk and dairy products
trade and domestic policy, 169trade trends, 164
reform, effect on, 120rice importers, effect of liberalization on, 190
milk. See dairy productsMilk Income Loss Contract program (U.S.), 175molasses, 142mollusks, 276, 279
Index 321

MONASH model and trade elasticities, 134Morocco
fruits and vegetablespreferential agreement with EU, 252tariffs, 248
tariff rates, 47most-favored-nation tariffs
developing countries, 42, 43f3.4fruits and vegetables, 246, 248
Mozambiqueseafood
bans for food safety reasons, 286exports, 275, 280
sugar and trade preferences, 68trade preferences, 67
mycotoxins and food safety standards, 101, 107–109, 201
NAFTA countriesagricultural trade shares of, 24–25, 26final products, shares of, 31, 34fruits and vegetables intraregional trade, 242, 249groundnut tariffs, 223–224peanuts, 86rice trade, 192sugar trade, 156
side-letter agreement between U.S. and Mexico,149, 156
wheatprocessed wheat products trade, 201tariffs, 200–201
Namibia, fruits and vegetables tariff rate quotas, 251Nash, Eric F., 76National Program for Direct Assistance to Rural Areas
(Mexico), 78Netherlands
fair trade coffee, 307farm household incomes, 18
New Deal farm programs, 79New Zealand
agricultural protection levels, 43–44exit grant to farmers, 79, 87exporting of agricultural products, 26milk and dairy products
production and manufacturing, 161, 162reform, effect of, 171, 174trade and domestic policy, 165–166trade trends, 164
trade liberalization, impact of, 124, 125wage changes for unskilled labor, 125wheat production and yields, 197
Nicaraguacoffee
exports, 297prices, 302
food safety, costs of compliance in shrimp industry,97, 98t6.1, 99
rice importers, effect of liberalization on, 190
Nigerian groundnutsglobal trade in, 217, 218policies, 227prices, 220production, 216trade liberalization scenarios, 229, 231, 232, 234
Nile perch and food safety standards, 106–107, 286non-ad valorem lines
by degree of processing, 46, 46t3.5as share of total, 44–45, 45f3.5
nontariff barriersSee also specific types (e.g., licensing)removal of, effect of, 38wheat and, 201–202
North AfricaSee also specific countriesmilk and dairy products
trade and domestic policy, 169trade trends, 164
North American Free Trade Agreement. See NAFTAcountries
Norwayagricultural protection levels, 43
tariff lines, 45salmon farming, 291–292seafood
antidumping and countervailing measures,286–287
exports, 279wheat support to domestic producers, 205
Oceania. See Australia; New ZealandOECD countries
See also Quad countries; specific countriesagricultural protection
evolution of, 39–42, 40f3.1, 41f3.2, 42f3.3, 52market price support, 39percentage attributable to border protection and
direct subsidies, 40–41, 41t3.1product coverage of tariffs, 47–48seafood, 283, 284–285structure of, 43–44, 44t3.3
agricultural trade shares of, 24domestic subsidies in, 3export trade subsidies, 50farm household incomes, 18fruits and vegetables
domestic subsidies, 245tariffs, 246, 247t13.8, 248, 248t13.9
sugar policies, 150–157, 158tariff rates, 39–40, 40f3.1, 47–48
quotas, 49trade liberalization and, 233wheat
domestic support, 204–205, 204t11.5, 205t11.7exports, 195
OPEC countries and wheat imports, 206
322 Index

orange juice trade dispute, 248, 249b13.2organic coffee, 306–307organic cotton, 263–264, 272output growth rates, 23, 23t2.8
Pakistancotton
production and consumption, 259, 260, 263trade in, 261
wheat exports, 212peanuts
mycotoxins. See mycotoxins and food safety standardsU.S. quota buyout, 79, 86, 157
pelagics, 276, 279Peru
asparagus exports, 254b13.3milk and dairy products, 168seafood
exports, 275, 280fishmeal production, 278production, 276
Peruvian Commission for Export Promotion,254b13.3
pesticide residues. See food safety standards;horticultural trade
Philippinesfood safety complaints, 103fruits and vegetables exports, 244milk and dairy products, 168–169rice
importers, effect of liberalization on, 188–189minimum import commitments, 38
sugar reform, effect of, 151phytosanitary measures. See Sanitary and Phytosanitary
AgreementPolish milk and dairy products, 167, 168politics and decoupling, 77–78polyester, 259, 260f14.1, 271Portugal
agricultural protection levels, 42fishing access, 283
povertyagriculture and, 1, 3changes in agricultural trade flows and, 17–20trade preferences and, 57
preferences. See trade preferencespricing
See also specific commoditiesdecline, 23, 23t2.7
Procampo program (Mexico), 83–84processed food
fruits and vegetables, 239–240, 240f13.4preferential access, 255tariffs, 49, 248, 248t13.9
rejection for food safety reasons, 101trends in baseline simulation to assess impact of
reform, 117–118, 117t7.2
processing, degree of, 30–31, 31t2.14, 32t2.15, 34non-ad valorem lines by, 46, 46t3.5tariff escalation and, 49wheat products, 201
producer subsidy equivalent (PSEs) and seafood, 288protection. See agricultural protection
Quad countriesagricultural protection levels, 44, 45
reform, effect on, 120underestimation of tariffs, 46
fruits and vegetables tariffs, 246, 246t13.7milk and dairy products
production trends, 163trade and domestic policy, 161, 164, 165–166
quotas. See agricultural protection
Railway Act of 1925 (Canada), 86raspberries and food safety standards, 109–110real income gains from reform, 120–123, 121t7.5,
122f 7.1red snapper, regulation of names, 287Refined Sugar Reexport Program (U.S.), 156reform, 8–9, 115–137
agricultural productivity and, 128–131aggregate welfare, 130, 130f 7.4high-productivity assumption, 130–131,
131t7.12–7.13output impact, 129–130, 129t7.11trade impact, 128–129, 129t7.10
of agricultural protection, implications for, 50–52,51t3.10–3.11, 52–53, 118–120
global merchandise trade reform, 118–120,119t7.3
caveats about, 119–120tariffs’ role, 120, 121t7.4
impacts of, 118–127LINKAGE model and simulations, 115–118
See also LINKAGE modelmilk and dairy products, 169–174multicommodity approach to, 3–4problems in pursuing, 2–3real income gains, 120–123, 121t7.5, 122f 7.1structural implications, 123–127, 123t7.6
capital market change, 125–126, 127t7.8change in rural value, 124–125, 124f 7.2, 125f 7.3land contribution to agricultural income, 126,
128t7.9wage changes for unskilled labor, 125, 126t7.7
sugar, 150–152transitional impact, 132, 132f 7.5
supply response in low-income countries, 132–134,133t7.14
trade elasticities, 134–135, 135f 7.6–7.7of trade preferences, to benefit developing countries,
56transitional impact, 131–132
Index 323

Revised Sugar Price Adjustment Law of 2000 (Japan), 155rice, 10, 177–193
See also specific countries and regionsconcentration of production and consumption in
Asia, 177definitions of rice trade flows, 178b10.1development of new types of, 178domestic rice trade and policy reforms, 190–191policy distortions, 38, 185–186, 185t10.4, 191pricing volatility, factors contributing to, 177–178, 191self-sufficiency of countries in, 177, 191as share of calories by region and income level, 177,
178t10.1trade and policies in major producing and consuming
nations, 179–184, 179f10.1, 180t10.2net rice trade, 179, 181t10.3
trade liberalization and, 3, 4, 188–192Africa, impact on, 190Asian exporters, impact on, 189Asian importers, impact on, 188–189developing countries, impact on, 190flow and price impact, 186, 187t10.5, 188Latin America, impact on, 190North America, impact on, 190other exporters, impact on, 189other importers, impact on, 190price impact, 188type of rice, impact by, 188, 192welfare impact, 188–190
RICEFLOW as model to study rice trade liberalization,186, 187t10.5, 190, 191
robusta coffee, 297roe, 280rules of origin and trade preferences, 57, 69–70rural income
changes in agricultural trade flows and, 17–21,18t2.1–2.2
income distribution, 20–21, 21t2.4structure of income sources, 20, 20t2.3
trade liberalization, impact of, 125rural value, change in from reform, 124–125, 124f 7.2,
125f 7.3Russia
See also Former Soviet Union (FSU)average tariffs, 47coffee, 307cotton importing, 261global milk production trends, 163seafood subsidies, 290sugar imports, 145–146, 149wheat
exports, 209–211imports, 206
Rwandan coffee exports, 297, 301
saccharin, 148SACU. See Southern Africa Customs Unionsalmonella. See food safety standards
salmon farming, 291–292Sanitary and Phytosanitary Agreement, 93–96, 293
increased complexity of the standards environment,95–96
private and public oversight and monitoring, 94separating legitimate from illegitimate differentiation,
93–94sardines, 280Scandinavian countries
See also specific countriescoffee consumption, 299
Scottish salmon farming, 291–292seafood, 12–13, 275–295
aquaculture. See aquaculturebans for food safety reasons, 105–107, 286border protection and, 3captured, 276catch control, 290–291common-pool property, 280–281consumption, 275eco-labeling, 285efficient management, 290environmental concerns, 282b15.1fish catches in leading countries, 276, 276f15.1fisheries management policies, 280–282fishing access, 283fishing subsidies, 280, 282–283, 288, 290, 293fish meal, 278–279, 291–292, 294food fish
exports by top countries, 279, 279f15.4exports by value of major commodity group, 280,
280f15.5foreign fishing access agreements, 283, 284,
284b15.2, 293global aquaculture production by value, 278, 278f15.3growth in trade of, 28hazard-analysis, critical-control-point (HACCP)
principles, 285–286institutional influences on international trade in
fishery products, 280–287international markets, 279–280labeling, 285limited access, 281names, regulation of, 287open access, 281, 290–291overexploitation and, 279, 281overexploitation of fish stocks, 275–276prices, 278–279production, 275, 276–280
industrial products, 275, 278–279shrimp. See shrimpsustainability, 276, 294tariffs, 280, 283–285, 285f15.6, 285t15.1, 287–288, 293total allowable catch (TAC), 281, 290trade barriers
antidumping and countervailing measures, 286–287sanitary and phytosanitary measures. See food
safety standards
324 Index

technical barriers, 285, 293–294trade liberalization, impact of, 4, 280, 287–293, 293
in APEC countries, 288, 289t15.2–15.3aquaculture, 291–293, 292t15.5, 292t15.6fisheries management policies, 280, 281–282management regime in capture fisheries, influence
of, 290–291, 291t15.4removing subsidies in capture fisheries, 288, 290Uganda’s fishing industry, 282b15.1
200-mile exclusive economic zones (EEZ), 279,280–281, 283
self-certification of coffee, 306–307self-sufficiency, 30
EU, 34rice, 177, 191wheat, 195
Senegalgroundnuts
global trade in, 108, 217, 218–220policies, 226–227prices, 220–221production, 215trade liberalization scenarios, 229, 232, 234
seafoodexports, 275, 280fishing access, 283
set-asides, 80, 82–83shrimp
antidumping and countervailing measures,286, 287
Bangladeshfood safety in, 97sustainable aquaculture in, 277
environmental effects, 291exports, 280food safety, 97as important trade commodity, 279Madagascar, 277–278Nicaragua, food safety in, 97production, 276–2778Thailand
production, 276sustainable aquaculture in, 277
trade liberalization, impact of, 277value of trade in, 276–277world aquaculture production, by volume,
277f15.2Sierra Leone seafood exports, 275, 280Singapore
liberal trade regime of, 28milk and dairy products, 168–169rice trade liberalization, effect of, 190
Slovak Republic milk and dairy products, 168Slovenia milk and dairy products, 167, 168soft drink consumption, 307, 308South Africa
average tariffs, 47food safety complaints, 103
fruits and vegetablesdried fruit exports, 108preferential agreement with EU, 252tariff rate quotas, 251
groundnutsglobal trade in, 108, 218policies, 227production, 216trade liberalization scenarios, 229, 232
rice trade liberalization, effect of, 190sugar industries employment, 145
South America. See Latin AmericaSouth Asia
See also specific countriesmilk and dairy products, 168–169
production trends, 163trade and domestic policy, 168–169trade trends, 164
supply response and reform, 133, 133t7.14Southeast Asia
fishmeal production and use, 278seafood consumption, 275shrimp production, 278
Southern Africa Customs Union (SACU)trade liberalization, impact of, 125
supply response, 133, 134Southern Shrimp Alliance (SSA), 287Spaak Report of 1956 (EU), 81Spain
See also European Union (EU)seafood
bans for food safety reasons, 286fishing access, 283imports, 280
Spriggs, John, and Dale Sigurdson, 76–77state trading of wheat, 202Sub-Saharan Africa
See also African Growth and Opportunity Act(AGOA); specific countries
agricultural surplus trends, 118coffee
domestic policies, 305yields, 299
food safety issues, 101groundnuts
global trade in, 217policies, 233prices, 220production, 215trade liberalization, 233
market share of, 31milk and dairy products
production trends, 163trade trends, 164
reform, effect on, 120supply response, 133, 133t7.14, 134
wage changes for unskilled labor, 125sucrose, 142
Index 325
sugar, 9, 141–159See also specific countries and regionsbackground, 141–147bagasse as production by-product, 141–142Brazil policies, 150China policies, 150decline in trade, 28employment in sugar industries, 145, 145t8.2ethanol as by-product of. See ethanolEU policies, 152–154
See also European Union (EU)exports and net imports, 141, 142f8.1global market, 145–147, 146t8.3government support to producers, 150, 150t8.4HFCS. See high-fructose corn syrupIndia policies, 150Japanese policies, 154–155, 154f 8.4
See also JapanLomé Convention preference sugar, 153Mexico policies, 150molasses as production by-product, 142NAFTA side-letter agreement, 149OECD countries’ policies, 150–157prices, 146–147, 152, 155production costs, 143–145, 144t8.1protection, 146–147, 158
history of, 141reform, effect of, 132, 150–152
transitional impact, 132, 132f 7.5Russia policies, 150tariff lines, 45Thailand policies, 149–150U.S. policies, 155–157, 157f 8.5
See also United StatesSugar Price Stabilization Law of 1965
(Japan), 155surplus. See specific countriessustainability
aquaculture, 294fish products, international trade in, 276
Swerling, Boris, 76Switzerland
agricultural protection levels, 43horticultural export subsidies, 245organic coffee, 307wheat support to domestic producers, 205
synthetic fibers, 259Syria
cotton production, 261fruits and vegetables exports, 244
Taiwanas major importer, 28rice
importers, effect of liberalization on, 188policy distortions, 185
trade liberalization, impact of, 125
Tanzaniacoffee, domestic policies, 305cotton, reform initiatives, 270seafood bans for food safety reasons, 286
tariffication, 38tariffs. See agricultural protection; decouplingtaxation
of African groundnut farmers, 226export taxes. See export taxesreplacing tariffs, economic effect of, 78VAT in China, 226
tea consumption, 307Thailand
corn and aflatoxin problems, 107food safety complaints, 103fruits and vegetables exports, 244as major exporter, 28milk and dairy products, 168–169poultry safety issues, 103reform, impact of, 28
high-productivity assumption, 130rice, 182–183
exporters, effect of liberalization on, 189seafood
exports, 279production, 276tariffs, 283
shellfish, 292–293shrimp
production, 276sustainable aquaculture in, 277
sugarexports, 146policies, 149–150reform, effect of, 151
tuna exports, 280Third Law of the Sea Convention (UNCLOS-III,
1973–1982), 280–281Togo and cotton reform initiatives, 270tomatoes and EU system of entry prices, 62b4.1trade elasticities and impact of reform, 134–135,
135f 7.6–7.7trade liberalization, 3–4
See also reformcotton, effect of, 268–270, 269t14.4, 271developing countries and, 28environmental effects of, 277groundnuts, 215, 228–233, 229t12.13, 230t12.14milk and dairy products, 3, 4, 161–162, 169–174
full liberalization scenario, 170–174, 172t9.3other scenarios, 174prospects for, 175
rice, 3, 4, 188–192seafood, 280, 282b15.1, 287–293shrimp, 277sugar, 150–152wheat, 212
326 Index

trade preferences, 6, 55–73benefits of, 56–57direct transport requirement, 70erosion by multilateral tariff reductions, 70–71EU preferences under GSP and Cotonou Agreement,
60–63, 61t4.4, 63t4.5–4.6entry price of tomatoes, 62b4.1proportion of trade covered by, 65, 66t4.11
export diversification and, 68–69factors determining impact of, 58failure to reach potential of, 57Generalized System of Preferences. See Generalized
System of Preferences (GSP)Japan’s preferences under GSP, 63–64, 64t4.7–4.9
proportion of trade covered by, 65–67, 66t4.12out-of-quota quantities and, 58in principle and practice, 56–58problems with, 55–56, 71–72reform needed to benefit developing countries, 56rules of origin and, 57, 69–70scope of, 58undesirable effects of, 57–58U.S. preferences under GSP and AGOA, 59–60,
59t4.1–4.2proportion of trade covered by, 65, 65t4.10
value of, 67–68EU, 68, 68f4.2Japan, 68, 69f4.3U.S., 67–68, 67f4.1
trade shares, 23–26, 23t2.6, 25t2.9excluding intra-EU and intra-NAFTA trade, 25, 26t2.10
trade structure changes, 28–30, 30t2.13transitional impact of reform, 131–132
sugar, 132, 132f 7.5tuna, 279, 280, 284Tunisia and dried fruit exports, 108Turkey
agricultural protection levels, 42cotton
government assistance, 264production and consumption, 259, 260trade in, 261
decoupling and reform efforts, 79, 85–86, 85t5.5, 88fruits and vegetables
exports, 244preferential agreement with EU, 252
groundnut exports, 108, 109rice importers, effect of liberalization on, 190tariff rates, 47wheat, 201
Ugandacoffee, domestic policies and, 305seafood
bans for food safety reasons, 286management styles, 290trade liberalization, 282b15.1
UkraineSee also Former Soviet Union (FSU)wheat exports, 211
UNCLOS (Third Law of the Sea Convention), 280–281United Kingdom
British Retail Consortium Technical Food Standard, 95
coffee consumption, 299fruits and vegetables standards, 110–111seafood imports, 280
United Nations Conference on Trade and Development(UNCTAD)
food safety studies, 105Generalized System of Preferences. See Generalized
System of Preferences (GSP)United Nations Environment Programme
(UNEP), 105United States
See also Quad countriescoffee
consumption, 297, 299, 307ICAs and, 303b16.1organic, 306, 307soft drink competition, 307
cottondecoupled payments, 264–265, 269exports, 260export subsidies, 50, 265, 268genetically modified, 263government assistance, 264, 265t14.3market distortions, 264–266production and consumption, 260reform, effect of, 269tariffs, 264
decoupling agricultural support, 79–81,80t5.2, 88
farm household incomes, 19farm subsidies, 41food safety standards, 94, 100–103, 102t6.2fruits and vegetables
imports, 243, 243f13.6production growth, 238tariffs, 246, 248
groundnutsconfectionery, 234exports, 108, 217policies, 215, 222–224, 228, 233prices, 220production, 216–217trade liberalization scenarios, 229, 231–234
horticultural export subsidies, 245–246milk and dairy products
production trends, 163reform, effect of, 170, 171trade and domestic policy, 165–166
orange juice protection, 248, 248b13.2peanut quota buyout, 79, 86, 157
Index 327

United States (continued)rice, 184
domestic trade and policy reforms, 191exporters, effect of liberalization on, 189, 190
seafoodantidumping and countervailing measures,
286–287, 293country-of-origin labels, 285exports, 279imports, 279–280tariffs, 283–284
sugar policies, 145ethanol production and consumption, 143high-fructose corn syrup (HFCS), 142–143,
143f8.2, 146prices and loan rates, 156–157protection, 141, 142reform, effect of, 151, 152, 155–157, 158
tariffsaverage tariffs, 39, 47transparency, 45
trade liberalization, impact of, 124, 127, 233trade preferences under GSP and AGOA, 58, 59–60,
59t4.1–4.2proportion of trade covered by, 65, 65t4.10value of, 67–68, 67f4.1
wheatdomestic support of, 195embargoes, 203–204, 213export subsidies, 200, 203food aid and surplus production, 203, 203f11.5as major exporter, 205pricing, 199, 199f11.4production and yields, 196–197, 197f11.1support to domestic producers, 204
University of Wisconsin-Madison World Dairy Model, 170
unskilled labor and wage changes, 125, 126t7.7urbanization, effect on fruits and vegetables
trade, 244Uruguay Round Agreement on Agriculture (URAA),
38–39, 200Amber Box, 38–39, 166, 190Blue Box, 39, 82, 170, 183Green Box, 39, 80, 166, 169groundnut tariffs, 223–224milk and dairy products, 163, 164, 165, 166t9.1,
169–170OECD countries’ level of support and, 42, 44Peace Clause expiration, 271protection reduction efforts of, 22, 46, 58rice, 180, 183, 184, 192seafood, 280
tariffs, 283sugar, 153, 156wheat, 200, 203
U.S. Commodity Credit Corporation, 261U.S. Department of Agriculture
Economic Research Service of USDA on Japanesesugar policies, 155
food safety issues and exports, 100, 105wheat price study, 212
U.S. Food and Drug Administration. See Food and Drug Administration (FDA, U.S.)
U.S. General Accounting Office study on sugar policies, 151
U.S. International Trace Commission and antidumpingmeasures, 286–287
UzbekistanSee also Former Soviet Union (FSU)cotton
export, 260government assistance, 267–268production, 260reform, effect of, 268tariffs, 264
valorization, 303b16.1value-added tax (VAT) in China, 226Van Donkersgoed, Elbert, 76vegetables. See fruits and vegetablesVietnam
coffeeoutput, 297, 299prices, 300production, 299–300, 307, 308world issues and, 303b16.1
income sources, 20poultry safety issues, 103rice, 182
exporters, effect of liberalization on, 189seafood
antidumping and countervailing measures, 287catfish, 287
trade liberalization, impact of, 125wage changes for unskilled labor, 125
wage changes for unskilled labor, 125, 126t7.7wheat, 10–11, 195–214
See also specific countries and regionscharacteristics and trends, 196–200domestic support, 204–205
OECD countries, 204–205, 204t11.5, 205t11.7export
emerging exporters, 209–212, 210f11.8–11.9major exporters, 205–206, 205t11.6, 206t11.8promotion, 203
feed use of, 198food consumption levels, 198, 198f11.2, 200food security and, 203–204, 213importers, 206–209, 207f11.6–11.7, 213market access, 200–203
328 Index

policy environment, 200–205pricing, 199f11.3–11.4production and yields, 196–197, 196f11.1, 196t11.1,
199–200self-sufficiency policies, effect of, 195stocks of, 198–199, 199f11.3surplus disposal programs, 195, 203, 203f11.5tariff rates and quotas, 200–203, 200t11.3,
202t11.4trade liberalization, effect of, 212trade policies, 197–198, 197t11.2, 212–213
World Bank food safety studies, 105World Trade Organization (WTO)
agreementsgroundnuts, 215sanitary and phytosanitary measures. See Sanitary
and Phytosanitary Agreementon Subsidies and Countervailing Measures, 293on Technical Barriers to Trade, 293
China entry and sugar tariff rate quota, 148
Committee on Trade and the Environment (CTE)fishing subsidies, 282, 288
cotton subsidies, disputes and complaints, 269, 271Doha Round, prospects for, 192EU sugar regime, disputes and complaints, 154fisheries management, disputes and complaints, 281food safety standards, disputes and complaints,
103–105, 104t6.3High Level Symposium on Trade and Environment,
282orange juice, disputes and complaints, 249b13.2sectoral or product approach, shortcomings of
negotiations, 2Thailand and sugar tariff rate quota, 149
Zimbabwecotton
reform initiatives, 270tariffs, 264
foot and mouth disease controls, 103
Index 329


T R A D E A N D D E V E L O P M E N T S E R I E S
™xHSKIMBy358634zv":&:>:<:$0-8213-5863-4
Global Agricultural Trade and Developing Countries explores theoutstanding issues in global agricultural trade policy andevolving world production and trade patterns. This book
presents research findings based on a series of commodity studies ofsignificant economic importance to developing countries. Setting thestage with background chapters and investigations of cross-cutting issues,the authors describe trade and domestic policy regimes affectingagricultural and food markets and analyze product standards andcompliance costs and their effects on agricultural and food trade. Theythen examine the impact and effectiveness of preferences and review theevidence on attempts to decouple agricultural support from agriculturaloutput. Finally, they assess the potential gains from global liberalization inagricultural and food markets, and their sensitivity to various assumptions.
Within this broad context of global agricultural policies and reforms, theauthors then present detailed studies of commodity markets that featuredistorted policy regimes among industrial and developing countries or thatare important contributors to exports of developing countries. Thecommodities analyzed are sugar, dairy, rice, wheat, groundnuts, fruits andvegetables, cotton, seafood, and coffee. These commodity studies analyzecurrent policy regimes in key producing and consuming countries,document the magnitude of these distortions, and estimate thedistributional impacts—winners and losers—of trade and domestic policyreforms as well as their impact on trade flows and production location.
Global Agricultural Trade and Developing Countries will aid policymakers andresearchers in approaching global negotiations and in evaluating domesticpolicies on agriculture. This book complements the findings of Agricultureand the WTO: Creating a Trading System for Development.
THE WORLD BANK