Trade Policy and Food Security - World Bank Documents
325
Trade Policy and Food Security Improving Access to Food in Developing Countries in the Wake of High World Prices Ian Gillson and Amir Fouad, Editors DIRECTIONS IN DEVELOPMENT Trade Public Disclosure Authorized Public Disclosure Authorized Public Disclosure Authorized Public Disclosure Authorized Public Disclosure Authorized Public Disclosure Authorized Public Disclosure Authorized Public Disclosure Authorized
-
Upload
khangminh22 -
Category
Documents
-
view
2 -
download
0
Transcript of Trade Policy and Food Security - World Bank Documents

Trade Policy and Food Security
Trade Policy and Food SecurityImproving Access to Food in Developing Countries
in the Wake of High World Prices
Ian Gillson and Amir Fouad, Editors
D I R E C T I O N S I N D E V E L O P M E N TTrade
Gillson and Fouad
Pub
lic D
iscl
osur
e A
utho
rized
Pub
lic D
iscl
osur
e A
utho
rized
Pub
lic D
iscl
osur
e A
utho
rized
Pub
lic D
iscl
osur
e A
utho
rized
Pub
lic D
iscl
osur
e A
utho
rized
Pub
lic D
iscl
osur
e A
utho
rized
Pub
lic D
iscl
osur
e A
utho
rized
Pub
lic D
iscl
osur
e A
utho
rized
WB456286
Typewritten Text
92647


Trade Policy and Food Security


Trade Policy and Food SecurityImproving Access to Food in Developing Countries in the Wake of High World Prices
Ian Gillson and Amir Fouad, Editors
D i r e c t i o n s i n D e v e l o p m e n tTrade

Trade Policy and Food Security • http://dx.doi.org/10.1596/978-1-4648-0305-5
© 2015 International Bank for Reconstruction and Development / The World Bank1818 H Street NW, Washington DC 20433Telephone: 202-473-1000; Internet: www.worldbank.org
Some rights reserved
1 2 3 4 17 16 15 14
This work is a product of the staff of The World Bank with external contributions. The findings, interpreta-tions, and conclusions expressed in this work do not necessarily reflect the views of The World Bank, its Board of Executive Directors, or the governments they represent. The World Bank does not guarantee the accuracy of the data included in this work. The boundaries, colors, denominations, and other information shown on any map in this work do not imply any judgment on the part of The World Bank concerning the legal status of any territory or the endorsement or acceptance of such boundaries.
Nothing herein shall constitute or be considered to be a limitation upon or waiver of the privileges and immunities of The World Bank, all of which are specifically reserved.
Rights and Permissions
This work is available under the Creative Commons Attribution 3.0 IGO license (CC BY 3.0 IGO) http://creativecommons.org/licenses/by/3.0/igo. Under the Creative Commons Attribution license, you are free to copy, distribute, transmit, and adapt this work, including for commercial purposes, under the following conditions:
Attribution—Please cite the work as follows: Gillson, Ian, and Amir Fouad, eds. 2015. Trade Policy and Food Security: Improving Access to Food in Developing Countries in the Wake of High World Prices. Directions in Development. Washington, DC: World Bank. doi:10.1596/978-1-4648-0305-5. License: Creative Commons Attribution CC BY 3.0 IGO
Translations—If you create a translation of this work, please add the following disclaimer along with the attribution: This translation was not created by The World Bank and should not be considered an official World Bank translation. The World Bank shall not be liable for any content or error in this translation.
Adaptations—If you create an adaptation of this work, please add the following disclaimer along with the attribution: This is an adaptation of an original work by The World Bank. Responsibility for the views and opinions expressed in the adaptation rests solely with the author or authors of the adaptation and are not endorsed by The World Bank.
Third-party content—The World Bank does not necessarily own each component of the content contained within the work. The World Bank therefore does not warrant that the use of any third-party-owned individual component or part contained in the work will not infringe on the rights of those third parties. The risk of claims resulting from such infringement rests solely with you. If you wish to re-use a component of the work, it is your responsibility to determine whether permission is needed for that re-use and to obtain permission from the copyright owner. Examples of components can include, but are not limited to, tables, figures, or images.
All queries on rights and licenses should be addressed to the Publishing and Knowledge Division, The World Bank, 1818 H Street NW, Washington, DC 20433, USA; fax: 202-522-2625; e-mail: pubrights@worldbank .org.
ISBN (paper): 978-1-4648-0305-5ISBN (electronic): 978-1-4648-0306-2DOI: 10.1596/978-1-4648-0305-5
Cover illustration: © Fabio Freitas E. Silva / Dreamstime.com. Used with the permission of Fabio Freitas E. Silva / Dreamstime.com. Further permission required for reuse. Cover design: Naylor Design.
Library of Congress Cataloging-in-Publication Data has been requested.

Trade Policy and Food Security • http://dx.doi.org/10.1596/978-1-4648-0305-5 v
Contents
Acknowledgments xvAbout the Authors xviiAbbreviations xix
Overview Introduction 1Drivers of World Food Prices 4High Food Prices versus Food Price Volatility 5The Role of Trade Policy in Boosting Food Security 6International Experience with Trade and Food Security 8References 10
Chapter 1 Long-Term Drivers of Food Prices 13John Baffes and Allen Dennis
Introduction 13Explaining Long-Term Price Trends 15Discussion 18Assessing Post-2004 Price Movements 24Conclusions and Further Research 32References 33
Chapter 2 The Role of Biofuel Policies on Grain and Oilseed Prices 37Harry de Gorter, Dusan Drabik, and Erika M. Kliauga
Introduction 37Measuring the Support and Trade Distortion Caused
by Biofuel Policies 42The Impact of Biofuel Policy Compared to Other
“Perfect Storm” Factors 50The Role of Sugarcane-Ethanol in Brazil on Grain
and Oilseed Prices 53Concluding Remarks 55Notes 58References 60

vi Contents
Trade Policy and Food Security • http://dx.doi.org/10.1596/978-1-4648-0305-5
Chapter 3 Price Transmission from World to Local Grain Markets in Developing Countries 65
Sergiy Zorya, Stephan von Cramon-Taubadel, Friederike Greb, Nelissa Jamora, Carolin Mengel, and Nadine Würriehausen
Why It Matters 65How It Works 66Stylized Facts Pertaining to Recent Cereal Price
Transmission 68What Can Be Done to Enhance Food Price Transmission? 77Annex 3A: Literature Review 79Annex 3B: Prevalence of Different International Prices
in the Literature 81Notes 83References 83
Chapter 4 Trade Policy Responses to High and Volatile Food Prices 87 Ian Gillson and Christina Busch
Introduction 87Trade in Food 88Higher World Food Prices and Their Trade Effects 92Trade Policy Responses 94Opening Food Trade in the Pursuit of Food Security 106Trade and Transport Facilitation to Promote Access
to Food 110Policy Measures to Support Food Security 111Notes 114References 114
Chapter 5 The Welfare Effects of Changes in Food Prices 119 Maros Ivanic and Will Martin
Introduction 119Effects of Food Price Changes on National Income 120Effects of Food Price Changes on Poverty 121Policy Implications 127Conclusions 130Annex 5A: Agricultural Imports and GDP 131References 132
Chapter 6 Food Security and the World Trade Organization 135 Clem Boonekamp
Introduction 135Trade and Food Security 136The WTO and Other Forums 137Conclusion 149

Contents vii
Trade Policy and Food Security • http://dx.doi.org/10.1596/978-1-4648-0305-5
Notes 150References 151
Chapter 7 Regional Trade of Food Staples and Crop Inputs in Africa 153 John C. Keyser
Introduction 153Current Trade of Food Staples 154Regional Trade of Seed and Fertilizer 162The Benefits of Minimizing Trade Barriers 167Opportunities to Improve Trade Conditions 175Conclusion 184Notes 185References 186
Chapter 8 The Grain Chain 189 Michelle Battat and Julian Lampietti
The Importance of Food Trade for Arab Countries 189Trade Policy Implications for Food Security 192Procurement Strategies to Manage Wheat Trade Risks 193Effect of Wheat-Trade Logistics on Food Security
in Arab Countries 195Role of Strategic Reserves as a Food Security Policy 201Conclusion 206Notes 206References 211
Chapter 9 How Can Latin America and the Caribbean Contribute to Global Food Security? 215
Nabil Chaherli and John Nash
Introduction 215Recent Performance of Latin America and the Caribbean
in Agricultural Markets: Overall Good News 216The Enabling Environment for Agricultural Trade:
Potential Constraints and What Can Be Done to Overcome Them 221
The Future: How Can LAC Help Feed the World? 232Notes 235References 236
Chapter 10 Trade Policy and Food Security in Latin America 239 Ekaterina Krivonos and Rogerio Da Paixao
Introduction 239Food Prices and Food Security in Latin America and
the Caribbean 240

viii Contents
Trade Policy and Food Security • http://dx.doi.org/10.1596/978-1-4648-0305-5
Evolution of Food and Agricultural Trade 244Policy Responses to High Food Prices 249Country Case Studies: Policy Responses to the
Increase in Food Prices 250Effects of the Trade Policy Measures on Consumer
Prices for Main Food Staples 255Conclusion 265Notes 270References 270
Chapter 11 Using Trade to Enhance Food Security in Southeast Asia 273 Hamid R. Alavi and Aira Htenas
Introduction 273State of Rice Production and Trade in the ASEAN Region 274Objectives and Features of Food Security Policies in
the Rice Market in Southeast Asian Countries 274The Effects of Food Security Policies on Production,
Consumption, and Trade 279Enhancing Regional Trade Coordination to Improve
Food Security 286Conclusion 288Annex 11A: State Trading Enterprises (Parastatals) in
Selected ASEAN Countries 289Notes 295References 296
Boxes3.1 Interplay between Transport Costs and Policy Measures in Price
Transmission in Ethiopia 674.1 The Russian Federation’s Export Ban on Grains 1014.2 Zambian Government Imports of Maize during the Southern
Africa Food Crisis 1034.3 The Middle East and North Africa Region Faces High
Trade Costs in Food 1034.4 Quantifying the Effects of NTMs on Trade in African
Food Staples 1044.5 Open Border Policies for Trade in Food 1067.1 Difference between a Technical Regulation and a Standard 1777.2 Costs of Regional Trade on the Ghana-to-Nigeria Corridor 1807.3 Harmonized EAC Dairy Standards as a Potential Trade Barrier 1837.4 Poor Use of Trucks 1848.1 Regional Cooperation: Jordan Could Import Wheat through
Nearby Mediterranean Ports 199

Contents ix
Trade Policy and Food Security • http://dx.doi.org/10.1596/978-1-4648-0305-5
FiguresO.1 Food Demand from Asia 2O.2 Increasing Supply of Animal Protein for Domestic Consumption 21.1 Food Price Index, 1960–2012 141.2 Elasticities (Absolute Values) 251.3 Food and Crude Oil Price Indexes 271.4 Stock-to-Use Ratios, 1997–2004 and 2005–12 272.1 Corn Prices and Ethanol Production Capacity 382.2 Oil and Cereal Prices 392.3 Sugarcane Production in Brazil over the Past Decade 532.4 Evolution of the Number of New Ethanol Production
Facilities in Center-South Brazil 542.5 Evolution of U.S. and Brazilian Ethanol Prices since
September 2010 55B3.1.1 Domestic Wheat Prices and Export/Import Parity Band in
Addis Ababa, January 1998–October 2011 673.1 Estimates of Long-Term Elasticity of Price Transmission by
Different Commodities, 1970–2010 743B.1 The Prevalence of Different International Maize Prices in
the Literature Sample 813B.2 The Prevalence of Different International Rice Prices in
the Literature Sample 823B.3 The Prevalence of Different International Wheat Prices in
the Literature Sample 824.1 Most Cereal Production Is Consumed Domestically and
Not Traded 884.2 Food Trade Matters Most for Low-Income Countries 894.3 Trade in Key Cereals Is Dominated by Just a Few Countries 914.4 Recent Food Price Spikes 934.5 Net Food-Importing Regions Lose from Higher Food
Prices and Vice Versa 944.6 The Most Frequent Users of Trade Restrictive Measures
on Food Products Are G-20 Countries 964.7 Support by Developed OECD Countries to Agricultural
Producers, 1996–2010 984.8 Support by Selected Non-OECD Countries to Agricultural
Producers 100B4.4.1 Price-Raising Effect of NTMs, Africa Average
(All Affected Products) 1055.1 Net Agricultural Import Shares as a Percentage of GDP,
30 Highest 1215.2 World Prices and the Average Protection Rate for Rice 1287.1 Directions of Informal Food Trade in Eastern Africa 1587.2 Border Costs for Maize at Kasumbalesa 172

x Contents
Trade Policy and Food Security • http://dx.doi.org/10.1596/978-1-4648-0305-5
8.1 Arab Countries Should Pursue a Three-Pillar Approach to Food Security 190
8.2 The Analysis Covers the Supply Chain from the Unloading Port to Bulk Storage at the Flour Mill 196
8.3 On Average, Moving One Metric Ton of Wheat from the Destination Port to the Flour Mill Costs US$40/Metric Ton and Takes 78 Days 197
8.4 Vessel Turnaround Times Can Be Reduced by Improving either Waiting or Unloading Times 198
8.5 In 2009, Most Vessels Waited Less Than Two Days in the Harbor, yet There Was Significant Variability 198
8.6 Wheat Stocks Are Negatively Correlated with Wheat Prices 2028.7 Many Arab Countries Are Planning to Increase Storage
Capacity to Accommodate Increasing Strategic Reserves 2038.8 Simulations Suggest That Higher Global Stock
Levels May Provide a Buffer to Supply Shocks and Thus Mitigate Price Risks 204
8.9 Increasing Reserves in Arab Countries not Only Reduces Local Price Volatility but Also Reduces Volatility in Global Markets 205
9.1 Shares and Contribution to Growth of LAC’s Agricultural Exporters, by Origin, 1995 and 2009 217
9.2 Shares and Contribution to Growth by Export Destination, 1995 and 2009 218
9.3 Top 10 Latin American and Caribbean Agricultural Exports to Developed and Developing Economies, 2009 219
9.4 Argentine Grain Production, 1979–2010 2199.5 Market Access Overall Trade Restrictiveness Indexes for
Agricultural Exports, by Region 2229.6 Relative Rates of Assistance, by Region, 1965–2009 2239.7 Real Effective Exchange Rates, 1980–2010 2239.8 Increase in Exports from an Improvement in Soft
Infrastructure to the Levels of OECD Countries 2279.9 Logistics Cost as a Percentage of Food Product Value, 2004 2289.10 Trade Facilitation: Comparing LAC with Other Regions 2299.11 Cost to Export and Import: Global Comparison, 2011 2319.12 Price Decomposition for Pineapple Supply Chain from
Costa Rica to St. Lucia 23210.1 Annual Food Inflation in Latin America and the
Caribbean, 2005–11 24110.2 Annual Food Inflation in Latin America and the Caribbean
and Growth in the FAO Food Price Index, 2005–11 24210.3 Undernourishment Indicators for Latin America and the
Caribbean 243

Contents xi
Trade Policy and Food Security • http://dx.doi.org/10.1596/978-1-4648-0305-5
10.4 The Change in Undernourishment Rates between 1990–92 and 2010–12, by Country 244
10.5 Evolution of Food and Agricultural Trade in Latin America and the Caribbean, 2006–11, by Value 245
10.6 Evolution of the Trade Balance in Basic Foods and Total Food and Agricultural Products in Latin America and the Caribbean, 2006–11, by Value 246
10.7 FAO Food Price Index and Agrifood Trade Balance in Selected Countries 247
10.8 Share of Latin America and the Caribbean in Global Production and Trade of Cereals, 1990–2012 247
10.9 Share of Latin America and the Caribbean in Global Production and Trade of Selected Products, 2011 248
10.10 Monthly Average Export Tax Rates in Argentina, January 2001–January 2011 251
10.11 Wheat Producer Prices and Consumer Prices of Wheat-Based Products (Bread and Crackers) and Packaged Wheat Flour in Argentina, 2005–January 2011 256
10.12 Maize Producer Prices and Consumer Prices of Maize Flour in Argentina, 2005–October 2010 257
10.13 Planted Area of Wheat, Maize, and Soy in Argentina, 2000–11 25810.14 Producer and Consumer Prices of Bovine Meat Cuts in
Argentina, 2005–October 2010 25910.15 World Prices and Domestic Producer Prices for Maize,
Rice, and Wheat in Brazil, 2002–09 26010.16 Producer Prices in the Dominican Republic and the
United States, January 2007–November 2009 26110.17 Consumer Price Index for Selected Commodities in Ecuador,
2007–11 26310.18 Index of Maize, Maize Flour, and Tortilla Prices in Mexico,
January 2007–January 2011 26410.19 Index of Retail Prices of Main Food Staples in Nicaragua,
February 2007–January 2011 26510.20 Production of Staple Foods in Nicaragua, 2004/05–2010/11 266
mapB8.1.1 Proposed Transport Network, Jordan 200
t ables1.1 Stationarity Properties 171.2 Parameter Estimates from Ordinary Least Squares
Regressions, 1960–2012 18

xii Contents
Trade Policy and Food Security • http://dx.doi.org/10.1596/978-1-4648-0305-5
1.3 Key Characteristics of Commodity Markets 201.4 Parameter Estimates from Ordinary Least Squares
Regressions, 1960–2004 251.5 Contribution of Each Driver to Food Price Changes,
1997–2004 to 2005–12 261.6 Actual Prices Compared to Model-Generated Prices 291.7 Assessing the Fit of the Models 301.8 Parameter Estimates from Panel Regressions 313.1 The Direction of Monthly Price Movements on Domestic and
International Markets, Agreement and Disagreement, by Region and Cereal 69
3.2 The Prevalence of Cointegration in the Literature Sample 713.3 The Prevalence of Cointegration in the GIEWS Estimates 723.4 Average Estimates of the Long-Run Rice Transmission
Coefficients Taken from the GIEWS and Literature Samples, by Product and Region 73
3.5 Average Estimates of the Speed of Adjustment Based on the GIEWS and Literature Samples, by Product and Region 75
3.6 Median Price Transmission Parameters Estimated with GIEWS Data, before and after July 2007 75
3.7 Estimated Meta-Regression Coefficients 763.8 The Effect of Distance and Border on Combined Rates of
Adjustment for Market Pairs in Kenya, Tanzania, and Uganda: Regression Results 77
3A.1 Studies Included in the Literature Review 795.1 Short-Run Poverty Effects of Food Price Increases,
US$1.25 per Day 1245.2 Short-Run Global Poverty Effects of Food Price Increases 1255.3 Global Poverty Effects of General Food Price Increases,
US$1.25 per Day 1275A.1 Agricultural Imports as a Share of GDP 1317.1 ECOWAS Imports of Basic Foods, by Region, 2005–09 1557.2 Intraregional Imports as a Percentage of Total COMESA
Imports of Basic Foods, 2004–08 1597.3 Pesticide Registration Fees in Tanzania and Kenya 1637.4 Costs of Formal Sector Border Crossing at Kasumbalesa,
November 2011 1697.5 Cost of Informal Border Crossing at Kasumbalesa for Selected
Commodities, November 2011 1717.6 Buildup of Fertilizer Prices in Ghana under Alternative Trade
Scenarios 1727.7 Financial Indicators for Ghana Hybrid Maize 1737.8 Value-Chain Indicators for Ghana Hybrid Maize 1747.9 ECOWAS Regional Trade Requirements 176

Contents xiii
Trade Policy and Food Security • http://dx.doi.org/10.1596/978-1-4648-0305-5
8.1 Arab Countries Have Existing FTAs with Some but Not All Major Wheat Exporters 192
9.1 Logistics Performance Index, International, Regional, and Income Group Comparisons 230
9.2 Regional Shares in World Net Exports in Business-as-Usual and Alternative Scenarios for 2050 233
10.1 The Ratio between Volumes of Net Exports and Food Consumption for Wheat, Rice, and Maize, 2011–12 249
10.2 Implementation of Trade-Related Policies in Selected Latin American and Caribbean Countries as a Result of the 2006–08 Food Price Spike 250
10.3 Argentine Export Taxes, 2002–07 25110.4 Summary of Trade Policy Response and Market Interventions,
by Country and Product 26711.1 Share in Total Product Lines with MFN Tariff Rates
Exceeding 15 Percent 277


Trade Policy and Food Security • http://dx.doi.org/10.1596/978-1-4648-0305-5 xv
The editors would like to thank the authors of the individual chapters and the many individuals who contributed to the project. In particular, the editors would like to acknowledge contributions by Hamid R. Alavi, John Baffes, Michelle Battat, Clem Boonekamp, Christina Busch, Nabil Chaherli, Rogerio Da Paixao, Allen Dennis, Dusan Drabik, Harry de Gorter, Friederike Greb, Aira Htenas, Maros Ivanic, Nelissa Jamora, John C. Keyser, Erika M. Kliauga, Ekaterina Krivonos, Julian Lampietti, Will Martin, Carolin Mengel, John Nash, Stephan von Cramon-Taubadel, Nadine Würriehausen, and Sergiy Zorya. The editors are also most grateful to Kym Anderson (University of Adelaide), John Beghin (Iowa State University), and Ian Sheldon (Ohio State University) for peer reviewing an early draft of the book. Their valuable comments and suggestions were incorpo-rated into the final draft.
Many people contributed to the development of this book. Ataman Aksoy, Tassos Haniotis, Aira Htenas, and Hans Timmer provided comments and suggestions to earlier drafts of chapter 1, which also benefited greatly from seminar participants at the U.S. Department of Agriculture, the University of Georgia, Oxfam America, and the European Commission. Further inputs, com-ments, and suggestions for the book were provided by Mohini Datt (chapter 4); Derek Headey (chapter 5); John Finn and Cedric Pene (chapter 6); Paul Brenton (chapter 7); Donald Larson (chapter 8); and David Hallam, Jamie Morrison, Julio Nogués, and Alberto Valdés (chapter 10). Chapter 7 was the result of numer-ous consultations with agribusiness firms, small market traders, customs agents, commodity brokers, standards authorities, plant and animal health inspectors, food safety inspectors, transport companies, superintendent companies, clearing agents, seed and fertilizer companies, donor representatives, representatives of regional economic communities, project practitioners, and others with a detailed knowledge of food staple and crop input trade in Africa. Special thanks go to Francis K. Frempong Aidoo for his assistance with data collection in Ghana.
Several chapters are based on existing reports. Chapter 3 is based on the report, “Price Transmission from World to Local Grain Markets in Developing Countries: Why It Matters, How It Works, and How It Should Be Enhanced” (2012), written by Stephan von Cramon-Taubadel, Sergiy Zorya, Friederike Greb, Nelissa Jamora, Carolin Mengel, and Nadine Würriehausen for the World Bank’s Rural Policies Thematic Group. The paper was a result of collaboration among the
Acknowledgments

xvi Acknowledgments
Trade Policy and Food Security • http://dx.doi.org/10.1596/978-1-4648-0305-5
Agriculture Global Practice, the Poverty Global Practice, and the Development Research Group of the World Bank. Chapter 8 would not have been completed without the dedication and insights of Sean Michaels, Dana Erekat, and Arnold de Hartog, who were co-authors of the report, “The Grain Chain: Food Security and Managing Wheat Imports in Arab Countries” (World Bank, Washington, DC, 2012). Chapter 9 is based on the report, “Agricultural Exports from Latin America and the Caribbean: Harnessing Trade to Feed the World and Promote Development” (World Bank, Washington, DC, 2013), developed under the overall guidance of Augusto de la Torre, Ethel Sennhauser, and Laurent Msellati. Chapter 11 is based on the contributions of Ramon Clarete (University of the Philippines), Ron Kopicki (World Bank), and Andrew W. Shepherd (Food and Agriculture Organization [FAO] of the United Nations), all of whom helped prepare the book, Trusting Trade and the Private Sector for Food Security in Southeast Asia (Washington, DC: World Bank, 2012). The latter was developed as a result of cooperation among the World Bank, the Asian Development Bank, and FAO, under the aegis of the Association of Southeast Asian Nations (ASEAN) Secretariat.
The authors and editors gratefully acknowledge the financial support provided by the World Bank’s second Multi-Donor Trust Fund for Trade and Development (chapters 1 and 11); the National Research Initiative of the National Institute of Food and Agriculture, U.S. Department of Agriculture, as well as the Cornell University Agricultural Experiment Station federal formula funds (Project No. NYC-121–7433) received from Cooperative State Research, Education, and Extension Service, U.S. Department of Agriculture (chapter 2); and the Spanish Trust Fund for Latin America (chapter 9). In addition, this book would not have been possible without the continuous support and guidance of the staff of the World Bank Group’s Trade and Competitiveness Global Practice, in particular Mona Haddad (Practice Manager) and the excellent administrative assistance of Cynthia Abidin-Saurman, Shienny S. Lie, Marinella Yadao, and Maria Yenko.
The editors would like to specially thank Mary-Ann Moalli and the team at Publications Professionals LLC for their superb work editing earlier drafts of this book and the World Bank’s Publishing and Knowledge Division for the efficient management of the publication process, in particular, Aziz Gökdemir and Paola Scalabrin, who provided excellent editorial, design, production, and printing services for this book.

Trade Policy and Food Security • http://dx.doi.org/10.1596/978-1-4648-0305-5 xvii
Editors
Ian Gillson, Senior Trade Economist, Trade and Competitiveness Global Practice, World Bank Group
Amir Fouad, Research Analyst, Trade and Competitiveness Global Practice, World Bank Group
Contributors
Hamid R. Alavi, Senior Private Sector Development Specialist, East Asia and Pacific Region, Trade and Competitiveness Global Practice, World Bank Group
John Baffes, Senior Agricultural Economist, Development Prospects Group, World Bank Group
Michelle Battat, Director, Development Finance International, Inc.
Clem Boonekamp, Chief Executive Officer, World Trade Advisors
Christina Busch, Research Analyst, Trade and Competitiveness Global Practice, World Bank Group
Nabil Chaherli, Program Leader for West Africa, Africa Region, Agriculture Global Practice, World Bank Group
Rogerio Da Paixao, Information Analyst, Focalization Division, Ministry of Social Development, Chile
Allen Dennis, Senior Economist, Development Prospects Group, World Bank Group
Dusan Drabik, Assistant Professor, Agricultural Economics and Rural Policy Group, Wageningen University, The Netherlands
Harry de Gorter, Professor, Dyson School of Applied Economics and Management, Cornell University
Friederike Greb, Department of Agricultural Economics and Rural Development, University of Göttingen, Germany
About the Authors

xviii About the Authors
Trade Policy and Food Security • http://dx.doi.org/10.1596/978-1-4648-0305-5
Aira Htenas, Operations Officer, Agriculture Global Practice, World Bank Group
Maros Ivanic, Research Economist, Development Research Group, World Bank Group
Nelissa Jamora, Department of Agricultural Economics and Rural Development, University of Göttingen, Germany
John C. Keyser, Senior Agricultural Trade Economist, Africa Region, Trade and Competitiveness Global Practice, World Bank Group
Erika M. Kliauga, Research Associate, Dyson School of Applied Economics and Management, Cornell University
Ekaterina Krivonos, Economist, Trade and Markets Division, Food and Agriculture Organization (FAO) of the United Nations
Julian Lampietti, Program Leader for Argentina, Paraguay, and Uruguay, Agriculture Global Practice, World Bank Group
Will Martin, Research Manager, Development Research Group, World Bank Group
Carolin Mengel, Department of Agricultural Economics and Rural Development, University of Göttingen, Germany
John Nash, Lead Economist, Africa Region, Agriculture Global Practice, World Bank Group
Stephan von Cramon-Taubadel, Agricultural Policy Professor, Department of Agricultural Economics and Rural Development, University of Göttingen, Germany
Nadine Würriehausen, Department of Agricultural Economics and Rural Development, University of Göttingen, Germany
Sergiy Zorya, Senior Agricultural Economist, East Asia and Pacific Region, Agriculture Global Practice, World Bank Group

Trade Policy and Food Security • http://dx.doi.org/10.1596/978-1-4648-0305-5 xix
ADF Augmented Dickey-FullerAFTA ASEAN Free Trade AgreementAMIS Agricultural Market Information SystemAMS aggregate measurement of supportAoA Agreement on Agriculture ASCM Agreement on Subsidies and Countervailing MeasuresASEAN Association of Southeast Asian NationsASEAN+3 ASEAN + China, Japan, and the Republic of KoreaATIGA ASEAN Trade in Goods AgreementATP Agribusiness and Trade PromotionB bahtBAAC Bank for Agriculture and Agricultural Cooperatives BERNAS Padiberas Nasional Berhad (Malaysia)BULOG Badan Urusan Logistik, or Board of Logistics (Indonesia)CEPS Customs, Excise and Preventive Service (Ghana)CEPT Common Effective Preferential TariffCET Common External TariffCFR cost and freightCIF cost, insurance, and freightCOMESA Common Market for Eastern and Southern AfricaEAC East African CommunityECOWAS Economic Community of West African StatesEMBRAPA Brazilian Agricultural Research CorporationENABAS Empresa Nicaragüanese de Alimentos Básicos, or Nicaraguan Basic
Food CompanyEU European UnionEU-27 Austria, Belgium, Bulgaria, Cyprus, Czech Republic, Denmark,
Estonia, Finland, France, Germany, Greece, Hungary, Ireland, Italy, Latvia, Lithuania, Luxembourg, Malta, the Netherlands, Poland, Portugal, Romania, the Slovak Republic, Slovenia, Spain, Sweden, and the United Kingdom
Abbreviations

xx Abbreviations
Trade Policy and Food Security • http://dx.doi.org/10.1596/978-1-4648-0305-5
FAO Food and Agriculture Organization (of the United Nations)
FOB free on board
FSNWG Food Security and Nutrition Working Group
FTA free trade agreement
FY fiscal year
G-20 Group of 20
GATT General Agreement on Tariffs and Trade
GDP gross domestic product
GHG greenhouse gas
GIEWS Global Information and Early Warning System
GMO genetically modified organism
GSA Ghana Standards Authority
IMF International Monetary Fund
LAC Latin America and the Caribbean
LAC5 Argentina, Brazil, Colombia, Mexico, República Bolivariana de Venezuela
LAC10 Argentina, Brazil, Colombia, Mexico, República Bolivariana de Venezuela, Chile, Costa Rica, the Dominican Republic, Ecuador, Peru
LDC least developed country
LPI Logistics Performance Index
LPJN Lembaga Padi dan Beras Negara, or Padi and Rice Board
MA-OTRI Market Access Overall Trade Restrictiveness Index
MAPE Mean Absolute Percent Error
MEP minimum export price
Mercosur Mercado Común del Sur, or Southern Cone Common Market
MFN most-favored nation
MPS market price support
mt metric ton
MTBE methyl tertiary butyl ether
MUV manufacture unit value
NFA National Food Authority (the Philippines)
NPK nitrogen, phosphorous, and potassium
NRA nominal rate of assistance
NTB nontariff barrier
NTM nontariff measure
OECD Organisation for Economic Co-operation and Development
PAA Programa de Aquisição de Alimentos, or Food Acquisition Program
PNAE Programa Nacional de Alimentação Escolar, or National School Feeding Program

Abbreviations xxi
Trade Policy and Food Security • http://dx.doi.org/10.1596/978-1-4648-0305-5
PP Phillips-Perron
PPP purchasing power parity
PPRSD Plant Protection and Regulatory Services Directorate (Ghana)
PSE producer subsidy equivalent
PSE Producer Support Estimate
PTA preferential trade agreement
PWO Public Warehouse Organization (Thailand)
Rp rupiah
RTA regional trade agreement
SADC Southern African Development Community
SAGARPA Secretaría de Agricultura, Ganadería, Desarrollo Rural, Pesca, y Alimentación, or Secretary of Agriculture, Livestock, Rural Development, Fisheries, and Food
SPS sanitary and phytosanitary
SSM Special Safeguard Mechanism
STE state trading enterprise
STR Simplified Trade Regime (Malawi, Zambia, Zimbabwe)
S/U stock-to-use (ratio)
TAEC Tanzania Atomic Energy Commission
TFDA Tanzania Food and Drugs Authority
TPRI Tropical Pesticides Research Institute
TRI Trade Restrictiveness Index
UEMOA West African Economic and Monetary Union
UN United Nations
VFA Vietnam Food Association
WFP World Food Programme
WISC wheat-import supply chain
WTO World Trade Organization


1 Trade Policy and Food Security • http://dx.doi.org/10.1596/978-1-4648-0305-5
Overview
introduction
Because global population is expected to surpass 9 billion by 2050, food security remains among the most pressing development issues of our time. The physical and economic access of not only nations, but also individuals and households to sufficient and nutritional foods is linked with poverty. Inadequate access to technology, land, water, and other agricultural inputs, as well as climate and other environmental factors, routinely imperils the ability of poor people to produce or secure sufficient food. Furthermore, the obligation of governments to nurture an enabling environment for food security based on economic openness, func-tioning markets, and sound policy making has been a development challenge too often unmet.
Much of the increase in world food demand in the coming decades as a result of population growth will continue to originate in developing countries where, according to the United Nations, nearly one billion people (or about 16 percent of the world’s population) still go hungry every day. Demand for food in China alone will account for 46 percent of the increase in global food consumption by 2050 (figure O.1). At the same time, many developing countries are experienc-ing rapid urbanization and rising incomes that have been accompanied by an evolving diet away from traditional crops toward more animal-based foods (figure O.2). These trends are altering the food production landscape and calling into question how the world can best adjust to this new reality.
However, food security today is less a question of whether the Earth is capable of producing enough food for such a large and growing population; indeed, food shortage at the global level has yet to pose a legitimate threat. Rather, the role that political factors, ownership, institutions, and inequality play in the distribution of food remains pivotal. The notion that food may be avail-able even in instances of food shortage or high prices, but the urban poor simply have no access to it was laid bare over three decades ago in Amartya Sen’s (1981) seminal work, Poverty and Famines: An Essay on Entitlement and Deprivation. In many ways, food security in the twenty-first century continues to amount to the premise that having enough to eat is more an issue of ensuring

2 Overview
Trade Policy and Food Security • http://dx.doi.org/10.1596/978-1-4648-0305-5
local access to the global food supply at affordable prices than of questioning whether the supply exists at all. In today’s world, the mechanisms that threaten global food security often persist in the form of barriers prohibiting the efficient movement of food from areas of food surplus to those of food deficit, often across borders.
Figure o.2 increasing supply of Animal protein for Domestic c onsumption
Source: Westhoek and others 2011.
Kg p
rote
in/y
ear
b. Per Capita
30
20
0UnitedStates
EU27 China India World
10
1970 2007 2030
120
100
a. World
Billi
on k
g/ye
ar 80
60
01970 2007 2030
40
20
Other countries
India
United States
China
EU27
Figure o.1 Food Demand from Asia
Source: Linehan and others 2013.
5000 1,000 1,500 2,000 2,500 3,000 3,500
Rest of Asia
India
China
Rest of World
Asia
U.S. dollars, billion (2007)
20502007
Breakdown of Asian
production

Overview 3
Trade Policy and Food Security • http://dx.doi.org/10.1596/978-1-4648-0305-5
At the heart of this conundrum are world food prices, which, following three decades of decline, have spiked in recent years. Even in real terms, the magnitude, frequency, and variability of these price increases seem ominously permanent, unlike the price spikes in previous decades that seemed more teth-ered to isolated international events such as the oil crises of the 1970s. During the latter quarter of the twentieth century, inelastic demand for foodstuffs, coupled with a lack of differentiation among agricultural commodity produc-ers, led to highly competitive markets and falling prices. The trend was propa-gated by technological improvements, reduced market protection, and currency devaluation in many agriculture-producing countries (Gillson, Wiggins, and Pandian 2004). Recent price surges, conversely, have been attributed to a myriad of factors, such as weather shocks, biofuel promotion policies, U.S. dollar depreciation, rising production costs, and nontariff trade measures (FAO 2011). The higher prices have reignited the food security debate as concern about ensuring food availability for the poor mounts. Net buyers of food in developing countries, especially those living in urban areas, have been the hardest hit by high food prices. As the most rapidly growing segment of the world’s population, the urban poor are among those likely to benefit most from increased food security.
Higher world food prices translate into uneven distributional effects. Just as net sellers of food gain at the expense of net buyers when prices rise, terms of trade improve for net food-exporting countries and worsen for net food-importing countries, although the extent of this result depends on both country size and the type of trade policy implemented (see chapter 4). This reality increasingly affects developing countries that have emerged as major players in world food markets. Two decades ago, the largest exporters of food did not include a single developing country, but today China and Brazil are among the largest at a time of declining growth rates in agricultural productivity. These large developing countries will likely have to pick up the slack in terms of publicly supporting agricultural research and development, given declining rates of public expenditures in developed countries (Alston and Pardey 2014). At the same time, food production patterns are continuing to change in response to supply-side pressures such as climate change, thereby making improvements to food security all the more challenging.
In the context of these emerging trends, this book’s purpose is twofold. First, it aims to provide guidance on understanding the drivers of high world food prices, the factors that determine the transmission of world food prices to domes-tic markets, and the key barriers to trade in food for developing countries. These are particularly salient topics for dissection given the increased frequency and persistence of recent food price spikes, as well as developing countries’ varied experiences in weathering them. Second, the book draws on examples of best (and worst) practice from around the world to assess the role of trade policy, trade facilitation, and logistics in enhancing both national and global food security. From a philosophical standpoint, the book is grounded by two impor-tant presuppositions: the first Millennium Development Goal to end hunger is

4 Overview
Trade Policy and Food Security • http://dx.doi.org/10.1596/978-1-4648-0305-5
achievable, and trade policy formulation can be an active (rather than passive or reactionary) tool in meeting this goal.
Drivers of World Food prices
The undeniable role of high world food prices in exacerbating global hunger and food insecurity begs the question: what are the drivers of recent changes in these prices? World prices are determined by several factors, and the supply and demand forces of a given food commodity that ultimately dictate its price are also influenced by a myriad of broader macroeconomic realities. Energy prices, for example, can influence commodity prices through their potentially adverse effect on fertilizer prices and transport costs. Food-importing countries felt this effect acutely during the recent food price spikes, which incidentally coincided with large increases in maritime freight costs. In chapter 1, the authors probe the relative importance and effect of several potential drivers of the world price of maize, wheat, rice, soybeans, and palm oil, such as crude oil and other energy prices, interest and exchange rates, income growth, and infla-tion. The key role of energy prices in food price fluctuation is corroborated, but the authors’ analysis also bears out just how little some of the other drivers actually appear to matter, particularly compared to stock-to-use ratios, which were found to have the largest effect on food price fluctuations among the potential drivers analyzed.
In addition to supply, demand, and macroeconomic factors, however, world food price changes are also affected by domestic initiatives such as biofuel sup-port policies. For example, U.S. corn-ethanol policies designed to fulfill energy, farm, and environmental policy goals precipitated the grain and oilseed price rise in late 2006, part of a trend of biofuel policies in developed countries lead-ing to increases in crop prices. This link between crop and biofuel prices has resulted in a new reality: oil prices now provide a floor for crop prices by way of biofuel consumption subsidies. Chapter 2 presents a framework to measure the subsidy effect of such biofuel policies, finding, for example, that actual shifts in the supply and demand of crops explain only about 15 percent of the corn price increase in the past four years. This outcome depends not only on the source of the shock, or on which biofuel policy determines the world bio-fuel market price, but also on the interactions among the various policy instru-ments within a country and across countries. In assessing the effects of Brazil’s sugarcane-ethanol policy, for example, the chapter shows clearly that despite a comparative advantage in biofuel production, Brazil and other developing countries were at a disadvantage as net importers because of the sudden increase in commodity prices.
Of course, domestic prices—not world prices—are what matter most for poor consumers and farmers alike. The transmission of world prices to domestic prices is essential in the pursuit of sustainable agricultural production based on com-parative advantage. However, price transmission is often slow and partial in developing countries, where markets are often not well linked to international

Overview 5
Trade Policy and Food Security • http://dx.doi.org/10.1596/978-1-4648-0305-5
food markets. In cases where prices are linked, changes in international grain prices are transmitted by roughly three-fourths to domestic prices, which is less than for nonagricultural products. Ultimately, identifying universal concrete fac-tors that affect the speed and extent of price transmission is extremely difficult, but qualitative evidence suggests that even in the absence of in-depth country-by-country analysis, opening up trade, integrating markets, and allowing domestic prices to rise and fall in concert with international prices can all help strengthen price transmission for the majority of countries, provided the methods are com-plemented with effective social safety nets (chapter 3).
High Food prices versus Food price volatility
Although food prices clearly have exhibited spikes in recent years, whether a similar problem exists with food price volatility is not clear (Gilbert and Morgan 2010). This is an important distinction, given that high food prices hurt poor consumers by reducing their purchasing power (and benefit producers), whereas high food price volatility hurts producers. As a result, the benefits of stabilizing food prices are relatively small from a consumer point of view and may actually be regressive given how much producers—particularly large food surplus producers—stand to benefit. According to standard theory, the minor consumer benefits of price stabilization are sensitive to both the degree of consumer risk aversion and the share of food expenditure in their budgets (Gouel 2014).
The concept of volatility suggests that periods of both high and low prices exist, yet food price volatility is often blamed for food riots and other acts of political unrest. In fact, empirical evidence refutes the notion that price volatility matters for developing country consumers. Rather, high food prices are relevant. For example, political unrest in the late 2000s clearly coincided with food price spikes, particularly in the Middle East and North Africa region (Lagi, Bertrand, and Bar-Yam 2011), providing support for the argument that the two are corre-lated. Bellemare (2011) goes further in isolating food price increases as a causal factor in increased political unrest over the period 1990–2011, while also finding food price volatility to be associated with decreased political unrest.
Not surprisingly, therefore, riots over high food prices are a signal of signifi-cant economic hardship for poor households. In addition, there can be signifi-cant long-term effects on educational outcomes, cognitive skills, and adult economic achievement when young children face reduced dietary diversity (D’Souza and Joliffe 2012; Hoddinott and others 2008). Clearly such social costs cannot be compensated for during subsequent periods of low food prices. Politicians in developing countries—particularly where large poor populations exist—must thus be seen to be reacting to food price spikes, as former Prime Minister Manmohan Singh did during his successful 2009 reelection campaign by emphasizing how he had limited the effect of the 2008 food crisis on India (Gouel 2014).
Because of the fact that poor households spend a large share of their incomes on food compared to households with higher incomes, their purchasing power

6 Overview
Trade Policy and Food Security • http://dx.doi.org/10.1596/978-1-4648-0305-5
falls more when food prices rise. However, high food prices are not necessarily unambiguously bad for the poor: the question is whether rural households are net consumers or net producers of food, and also whether higher food prices eventually stimulate increased agricultural production, thereby resulting in higher wages being paid to unskilled agricultural labor. Chapter 5 explores these issues in detail, finding that even allowing for increased production in the long run, higher food prices typically raise poverty in the short run, which is what matters politically.
Still, given the extent to which poor households are affected by high food prices, policy makers should seemingly intervene in markets only when food prices are high. But government responses to food price volatility—whether out of concern for consumer welfare in the case of high prices and producer welfare in the case of low prices—are carried out in an equally substantial manner by agricultural-importing and agricultural-exporting countries, respectively, which ultimately weakens the domestic price-stabilizing effect of the interventions (Anderson and Nelgen 2012).
t he r ole of t rade policy in Boosting Food s ecurity
There is no global food shortage. The problem is local—or sometimes regional—and centers on moving food, often across borders, from areas of food surplus to areas of food deficit. Given the relative stability of global food output versus domestic food output, increased openness to trade in food would be an excellent buffer to counter domestic fluctuations in food supply, and increased trade inte-gration in turn holds considerable potential to stabilize food prices. In addition, market-driven instruments such as futures and options markets and weather-indexed insurance programs are complementary arrangements to open trade policies that—if implemented successfully—have the potential to mitigate food price risks given the limited amount of infrastructure they require, the low costs they impose on public resources, and the financial security they provide to vulnerable producers.
Trade policy does have a significant role to play in mitigating the adverse effects of high food prices and overcoming food insecurity, because world output of any given food commodity tends to be much more stable than output in any individual country. Therefore, countries must not only import more food during times of local scarcity and export more food during periods of local abundance, but also ensure that policies appropriately incentivize farmers and consumers to respond to market signals. However, many countries often take the opposite approach, altering restrictions on food trade in efforts to insulate domestic mar-kets from world price fluctuations. Even the World Trade Organization’s (WTO) landmark Bali Package, agreed in December 2013, permits developing countries to provide domestic food price supports through at least 2017.
Giordani, Rocha, and Ruta (2012) put forward a compelling argument that when consumers are risk averse, food-exporting countries will use border restric-tions if the world food market is subject to a large positive price shock.

Overview 7
Trade Policy and Food Security • http://dx.doi.org/10.1596/978-1-4648-0305-5
Importantly, if a country unilaterally restricts exports in response to a world food price increase, the initial price shock will be exacerbated, giving rise to a multi-plier effect whereby exporters implement additional export restrictions. Using a sample of 125 countries and 29 food products for the period 2008–10, the authors find that changes in countries’ export restrictions occurred in response to restrictions imposed by other exporters and that these policy choices had a significant positive effect on world food prices.
These restrictions and other direct market interventions of this nature mimic the immediate post–World War II period, when the focus of public policy was aimed at ensuring price stability for agricultural commodities through input subsidies, import and export taxes, public buffer stocks, and other policy instru-ments (Galtier 2009). However, these interventions fell out of favor after 1980. The economic argument was twofold: first, prices should be allowed to play their role as a signal for production, trade, and storage decisions, and second, stabilizing prices could actually increase income instability for producers. The latter was argued to be a result of the negative correlation between production and price levels that provides a form of insurance to producers, that is, price and produc-tion risks partially offset each other (Newbery and Stiglitz 1981). Policy advice has since stressed that producer incomes should instead be stabilized through market-based risk-management instruments (for example, futures and options contracts and weather-indexed insurance) in combination with public provision of safety nets intended to maintain the purchasing power of vulnerable house-holds. Furthermore, support for long-run productivity growth in agriculture through investment has been advocated, as has reliance on trade and private storage as a means to address market shortages.
However, even these new “best practices” have themselves come under scru-tiny, particularly in the aftermath of the 2008 food price spike (Abbott 2012; Galtier 2009; Timmer 2012). Risk management tools are often unavailable in developing countries; safety nets have proven too complex to use; and poor food-importing countries have been hurt the most during food price spikes, even as they have attempted to rely on world markets (Gouel 2014). It is therefore not surprising that direct intervention to insulate domestic markets and stabilize food prices remains widespread among developing countries.
If a country is a natural exporter, however, it should not hinder its comparative advantage with export bans, nor should a country that tends to import food allow its domestic market to delink from the world market. On the contrary, food security requires encouraging more trade, including through adopting a more open, rules-based multilateral trade regime; working to develop new disciplines on export restrictions; promoting more effective regional integration among developing countries; and increasing Aid for Trade in support of logistics and other trade-related reforms, as discussed in chapter 4.
At the multilateral level, food security is central to the WTO’s Agreement on Agriculture, which seeks a more level playing field in two key elements of food security—accessibility and availability. On the one hand, the agreement is careful to ensure that governments retain policy choices to support their agricultural

8 Overview
Trade Policy and Food Security • http://dx.doi.org/10.1596/978-1-4648-0305-5
sectors. On the other hand, it limits the scope for countries to implement desta-bilizing policies abroad, thus contributing to a reduction in food price volatility and improved food security. The agreement has been an important step in improving the international trading environment for agriculture, but more needs to be done, particularly by reducing the scope for trade-distorting support but also by increasing market access and by strengthening disciplines in areas such as export competition.
international experience with t rade and Food s ecurity
The second half of this book tackles the above issues from the perspective of international experience. In Sub-Saharan Africa, current trade requirements for food staples and crop inputs have undermined the continent’s agricultural com-petitiveness and prevented small traders from participating in the formal econ-omy. Despite having some of the lowest agricultural yields per hectare in the world, many places in Sub-Saharan Africa with good growing conditions already produce food surpluses that are not traded internationally because of various constraints. The types of trade barriers that need to be overcome for the conti-nent to achieve its potential in food trade, reduce poverty, and improve food security are many.
Trade facilitation can significantly improve the ability of the public and pri-vate sectors to deliver the core services needed for agricultural growth. Without it, complicated procedures and formal sector requirements continue to prevent thousands of small traders from competing with large shippers, as well as under-mine the ability of African farmers to compete with global commodities, as illus-trated by the case study in chapter 7 of border costs in the town of Kasumbalesa in the Democratic Republic of Congo. In addition, long-term commitment and strong political will are needed to root out the obvious vested interests in the status quo and the rents generated therein.
Defining a set of actions to achieve trade goals in coordination with regional partners—including intended outcomes and indicators to monitor progress—would be a useful first step, because this represents a tangible strategy around which the international community could organize support. Similarly, efforts to increase awareness of the current high costs of trade requirements and the benefits of free trade are important for Africa to realize its potential to feed itself. In other words, concrete actions to build a constituency for free trade are critical.
In the Middle East and North Africa, the majority of countries face a number of food security risks because of their high dependence on food imports. Population growth, rising incomes, and climate change will only increase their dependency, making Arab countries even more exposed to international market volatility in the future than they are today. But the region can import wheat in a more reliable and cost-effective manner to mitigate wheat-import risks. As in Sub-Saharan Africa, improved trade facilitation is of the utmost importance. However, improving grain procurement strategies, increasing the efficiency

Overview 9
Trade Policy and Food Security • http://dx.doi.org/10.1596/978-1-4648-0305-5
of import supply chain logistics, and designing strategic reserves policies would also contribute to a comprehensive strategy to improve food security in these countries.
Conversely, Latin American and Caribbean countries are well equipped to meet the food security challenge. Despite the countries being quite heteroge-neous in their production potential, the region has always maintained a strong comparative advantage in agricultural production relative to the rest of the world, as indicated by its position as a net food exporter. The region’s high poten-tial for scaling up its agricultural output is due mainly to its natural endowments, especially land and water. Modeling of future scenarios suggests that the region’s already increasing share of world agricultural exports will continue to grow in the major food categories (cereals, oilseeds, meats, fruits, and vegetables), but to ful-fill its potential, the challenge posed by climate change will need to be met and improvements made to its trade infrastructure and logistics.
Latin American and Caribbean countries have wielded a number of trade policies in their responses to recent high food prices, with mixed results. Some intervened directly in their domestic markets or attempted to influence prices through export restrictions or subsidies to producers, while others relied on income transfers to compensate the poor for price increases. In many cases, sec-ondary policies had to be adopted to offset adverse effects on domestic prices for certain groups. As alluded to earlier, the long-term implications of some of these policy measures, most notably export restrictions, will ultimately have a negative overall effect on the food sector, given the reduced incentive to invest in agricul-ture created by them.
Finally, in Southeast Asia, the alarm over food shortages that drove the tripling of rice prices in 2007–08 and provoked unilateral bans on rice exports, panic buying, and hoarding within the countries of the Association of Southeast Asian Nations (ASEAN) now seems exaggerated, if not irrational. The hysteria had little or no basis in the actual state of regional rice supply and demand. As noted earlier, world (or in this case, regional) output tends to be more stable than indi-vidual country output. Behind the worries, however, lay a set of long-standing and seemingly informed calculations by individual ASEAN governments that relied—and still rely—on the public sector to promote food security. The book’s final chapter presents a cautionary view on how trade-related food security policies may be misdirected and too often wasteful of government and natural resources.
Ultimately, these international experiences illustrate the positive role that trade openness has to play in ensuring global food security. Given current fore-casts of global population growth, the challenge of ensuring that food deficit areas are supplied efficiently by food surplus areas at prices affordable to low-income consumers in developing countries will continue to be an important economic and development issue in the years to come. Trade policy measures that try to insulate domestic food markets from fluctuating international prices are not only unhelpful, but also possibly counterproductive, as illustrated by the collective action problem witnessed during the recent food price spikes.

10 Overview
Trade Policy and Food Security • http://dx.doi.org/10.1596/978-1-4648-0305-5
r eferences
Abbott, Philip C. 2012. “Stabilisation Policies in Developing Countries after the 2007/08 Food Crisis.” In Agricultural Policy for Poverty Reduction, edited by Jonathan Brooks, 109–68. Paris: Organisation for Economic Co-operation and Development.
Alston, Julian M., and Philip G. Pardey. 2014. “Agriculture in the Global Economy.” Journal of Economic Perspectives 28 (1): 121–46.
Anderson, Kym, and Signe Nelgen. 2012. “Trade Barrier Volatility and Agricultural Price Stabilization.” World Development 40 (1): 36–48.
Bellemare, Marc F. 2011. “Rising Food Prices, Food Price Volatility, and Political Unrest.” MPRA Paper 31888, Munich University Library, Germany.
D’Souza, Anna, and Dean Jolliffe. 2012. “Rising Food Prices and Coping Strategies: Household-Level Evidence from Afghanistan.” Journal of Development Studies 48 (2): 282–99.
FAO (Food and Agriculture Organization, United Nations). 2011. “Recent Trends in World Food Commodity Prices: Costs and Benefits.” The State of Food Insecurity in the World, 11–20.
Galtier, Franck. 2009. “How to Manage Food Price Instability in Developing Countries?” Working Paper Moisa 5, Marchés Organisations Institutions Stratégies d’Acteurs, CIRAD, Paris.
Gilbert, Christopher L., and C. Wyn Morgan. 2010. “Food Price Volatility.” Philosophical Transactions of the Royal Society 365 (1554): 3023–34.
Gillson, Ian, Steve Wiggins, and Nilah Pandian. 2004. “Rethinking Tropical Agricultural Commodities.” U.K. Department for International Development and Overseas Development Institute, London.
Giordani, Paolo, Nadia Rocha, and Michele Ruta. 2012. “Food Prices and the Multiplier Effect of Export Policy.” Staff Working Paper ERSD-2012-08, World Trade Organization, Geneva.
Gouel, Christophe. 2014. “Food Price Volatility and Domestic Stabilization Policies in Developing Countries.” In The Economics of Food Price Volatility, edited by Jean-Paul Chavas, David Hummels, and Brian Wright. Chicago: University of Chicago Press.
Hoddinott, John, John A. Maluccio, Jere R. Behrman, Rafael Flores, and Reynaldo Martorell. 2008. “Effect of a Nutrition Intervention during Early Childhood on Economic Productivity in Guatemalan Adults.” The Lancet 371 (9610): 411–16.
Lagi, Marco, Karla Z. Bertrand, and Yaneer Bar-Yam. 2011. “The Food Crises and Political Instability in North Africa and the Middle East.” New England Complex Systems Institute, Cambridge, MA. http://arxiv.org/pdf/1108.2455.pdf.
Linehan, Verity, Sally Thorpe, Caroline Gunning-Trant, Edwina Heyhoe, Kate Harle, Mary Hormis, and Keely Harris-Adams. 2013. “Global Food Production and Prices to 2050: Scenario Analysis under Policy Assumptions.” Australian Bureau of Agricultural and Resource Economics and Sciences (ABARES) Conference Paper 13.6, Canberra, March.
Newbery, David M. G., and Joseph E. Stiglitz. 1981. The Theory of Commodity Price Stabilization: A Study in the Economics of Risk. Oxford, U.K.: Clarendon Press.
Sen, Amartya. 1981. Poverty and Famines: An Essay on Entitlement and Deprivation. Oxford, U.K.: Oxford University Press.

Overview 11
Trade Policy and Food Security • http://dx.doi.org/10.1596/978-1-4648-0305-5
Timmer, C. Peter. 2012. “Behavioral Dimensions of Food Security.” Proceedings of the National Academy of Sciences of the United States of America 109 (31): 12315–20.
Westhoek, Henk, Trudy Rood, Maurits van den Berg, Jan Janse, Durk Nijdam, Melchert Reudink, and Elke Stehfest. 2011. “The Protein Puzzle: The Consumption and Production of Meat, Dairy and Fish in the European Union.” PBL Netherlands Environmental Assessment Agency, The Hague. http://www.pbl.nl/sites/default/files /cms/publicaties/Protein_Puzzle_web_1.pdf.


13 Trade Policy and Food Security • http://dx.doi.org/10.1596/978-1-4648-0305-5
Long-Term Drivers of Food PricesJohn Baffes and Allen Dennis
introduction
It is becoming increasingly apparent that the post-2004 commodity price increases, which initially appeared to be a spike similar to the ones experienced during the early 1950s (Korean War) and the 1970s (oil crises), have a more permanent character. Most commodity prices are now two or even three times higher compared to a decade earlier; from 1997–2004 to 2005–12 nominal prices of energy, fertilizers, and precious metals tripled, metal prices went up by more than 150 percent, and most food prices doubled. The price increases, espe-cially those of food, alarmed governments and, not surprisingly, led to calls for coordinated policy actions, reminiscent of the 1970s. Because understanding the relative contribution of key drivers to commodity price movements should be an essential part of any policy recommendation, this chapter focuses on assessing such contributions.
The increases in commodity prices took place in a period when most econo-mies, especially emerging ones, sustained strong economic growth. For example, during 2004–12, income and industrial production growth in middle-income countries averaged 6.2 percent and 7.3 percent, respectively, up from 4.6 percent and 5.4 percent, respectively, during the previous eight-year period. Fiscal expan-sion in many countries created an environment that favored high commodity prices. The depreciation of the U.S. dollar—the currency of choice for most international commodity transactions—strengthened demand (and limited supply) from non-U.S. dollar commodity consumers (and producers), thus sup-porting higher prices. Other factors contributed as well, including low past investment, especially in extractive commodities (in turn, a response to a pro-longed period of low prices), investment fund activity by financial institutions that chose to include commodities in their portfolios, and geopolitical concerns, especially in energy markets.
In addition to the above drivers, prices of agricultural commodities were affected by higher energy and chemical input prices, more-frequent-than-usual adverse weather conditions, and the diversion of some food commodities to the
c H A p t e r 1

14 Long-Term Drivers of Food Prices
Trade Policy and Food Security • http://dx.doi.org/10.1596/978-1-4648-0305-5
production of biofuels—notably maize in the United States and edible oils in Europe. These conditions led global stock-to-use ratios of some grains down to levels not seen since the early 1970s. Last, policy responses, including export bans and high export taxes (especially in the rice market) implemented to offset the impact of increasing world prices, contributed to creating the conditions of what has often been termed a “perfect storm.”
The coexistence of so many factors implies that any analysis of commod-ity price movements should entail both sectoral and common drivers. In fact, the importance of common factors was a key conclusion reached by Cooper and Lawrence (1975) for the commodity price boom of the 1970s (the com-parison between the 1970s price boom and the recent one has been made frequently; see, for example, Radetzki 2006, Piesse and Thirtle 2009, and World Bank 2009).
The chapter applies a reduced-form price-determination model to maize, wheat, rice, soybeans, and palm oil, using annual data for 1960–2012 (see figure 1.1 for the nominal and real food price index). The price determinants include one supply-side variable (energy prices), three macroeconomic indi-cators (exchange rate, interest rate, and inflation), income on the demand side, and a driver reflecting market fundamentals (stocks and consumption expressed as a single stocks-to-use ratio variable).
The chapter finds that food prices respond strongly to stock-to-use (S/U) ratios (except rice), crude oil prices (all commodities), and exchange rate movements (in a mixed manner). With a few exceptions, interest rate and income growth do not matter. Crude oil prices matter the most because they
Figure 1.1 Food price index, 1960–2012
Source: Based on World Bank data.Note: MUV = manufacture unit value.
0
50
100
Food
pri
ce in
dex
(200
5 =
100)
150
200
250
300
19601964
19681972
19761980
19841988
19921996
20002004
20082012
Real (MUV-deflated) Nominal
Long-Term Drivers of Food Prices 15
Trade Policy and Food Security • http://dx.doi.org/10.1596/978-1-4648-0305-5
experienced the largest increase after 2004. The remaining portion of the chap-ter proceeds as follows. The next section discusses the model, data, and estima-tion procedure. The third section identifies and elaborates on the relative impact of each driver. The fourth section applies a number of robustness checks to assess the performance of the model, especially the post-2004 price move-ments. The last section concludes and identifies likely directions for future research.
explaining l ong-term price t rends
To identify the relative impact of various drivers on long-term food price trends, we use a reduced-form econometric model. The model is based on equating aggregate demand to the supply of a commodity, and then expressing the equi-librium price as a function of sectoral and macroeconomic fundamentals. The theoretical underpinning of the model can be found in Turnovsky (1983), Stein (1986), Holtham (1988), and Deaton and Laroque (1992). Empirical applica-tions include Pindyck and Rotemberg (1990), who examined excess comove-ment among various commodity prices; Reinhart (1991) and Borensztein and Reinhart (1994), who analyzed the factors behind the weakness of commodity prices during the late 1980s and early 1990s; Gilbert (1989), who looked at the effect of developing country debt on commodity prices; and Baffes (1997), who examined the long-term determinants of metal prices.
ModelThe model takes the following form:
log(Pti) = b0 + b1 log(S/Ut−1) + b2 log(Pt
OIL) + b3 log(XRt) + b4 log(Rt)
+ b5 log(GDPt) + b6 log(MUVt) + et,
where Pti denotes the nominal price of commodity i (i = maize, wheat, rice,
soybeans, and palm oil). S/Ut−1 denotes the lagged stock-to-use ratio, PtOIL is the
price of crude oil, XRt is the exchange rate, Rt denotes the interest rate, GDPt denotes gross domestic product (GDP), and MUVt represents a measure of inflation. The bi s are parameters to be estimated, and et is the error term.
Although some of the drivers often cited as key in explaining post-2004 price movements do not appear explicitly in the model, they are accounted for indi-rectly by the S/U ratio. The diversion of food commodities to the production of biofuels increases the use or reduces stocks or both, therefore leading to a lower S/U ratio. Similarly, to the extent that weather patterns affect global production, they are accounted for by the S/U ratio. Furthermore, the S/U ratio captures the income effect because higher (lower) income leads to higher (lower) food con-sumption, with reverse impacts on the S/U ratio. Investment fund activity is likely to affect price variability rather than long-term trends; therefore, its exclu-sion is unlikely to alter the results. The most notable exclusion is trade policies, which remained stable at a global level during this period, except for exceptional

16 Long-Term Drivers of Food Prices
Trade Policy and Food Security • http://dx.doi.org/10.1596/978-1-4648-0305-5
interventions with impacts within a specific year that targeted a few commodi-ties (mostly rice and less so wheat).
The interpretation and signs of most of the parameters are straightforward. The S/U ratio is expected to be negative because a low S/U ratio (associated with scarcity) leads to high prices and vice versa. To account for likely simulta-neity bias between stocks and prices, the S/U ratio enters the regression in lagged form. The price of crude oil should have a positive effect on the prices of food commodities because it is a key factor of production (Baffes 2007). The depreciation of the U.S. dollar—the currency of choice for most international commodity transactions—strengthens demand (limits supply) from non-U.S. dollar commodity consumers (producers), thus increasing prices. In contrast, the effect of interest rates is ambiguous. High interest rates can be associated with lower commodity prices because they dampen current commodity demand and may change expectations about future economic activity because of lower investment; however, they may be associated with higher prices because high interest rates increase the required rate of return on storage (Newbery and Stiglitz 1989). Income growth (proxied by GDP of low- and middle-income countries, where most of the commodity demand growth is tak-ing place) is expected to lead to higher prices. Last, because of the long period under consideration, inflation was also included in the model, but the deflator was treated as an explanatory variable (instead of deflating all prices) to relax the homogeneity restriction and obtain a direct estimate of the effect of infla-tion (Houthakker 1975).
DataWorld prices were taken from the World Bank’s database and represent annual (calendar) averages, expressed in U.S. dollar per metric ton (mt), except crude oil, which is expressed in U.S. dollars per barrel. The description of commodity prices is as follows: maize (the United States), no. 2, yellow, FOB (free on board) U.S. Gulf ports; rice (Thailand), 5 percent broken, white rice, milled, indicative price based on weekly surveys of export transactions, government standard, FOB Bangkok; wheat (the United States), no. 1, hard red winter, ordinary protein, export price delivered at the U.S. Gulf port for prompt or 30 days shipment; soybeans (the United States), CIF (cost, insurance, and freight) Rotterdam; palm oil (Malaysia), 5 percent bulk, CIF N. W. Europe; and crude oil, average price of Brent, Dubai, and West Texas Intermediate, equally weighed. As a measure of inflation, we used the manufacture unit value (MUV), often viewed as a global inflation index. The MUV is a U.S. dollar trade-weighted index of manufactures exported from 15 economies (Brazil, Canada, China, Germany, France, India, Italy, Japan, Mexico, the Republic of Korea, South Africa, Spain, Thailand, the United Kingdom, and the United States). More details on the prices along with the MUV can be found at the World Bank’s Commodity Price Data (database), http://data.worldbank.org/data-catalog/commodity-price-data.
The S/U ratio was calculated as the ratio of end-of-season stocks to consump-tion taken from the U.S. Department of Agriculture’s Production, Supply, and

Long-Term Drivers of Food Prices 17
Trade Policy and Food Security • http://dx.doi.org/10.1596/978-1-4648-0305-5
Distribution Online (database), http://www.fas.usda.gov/psdonline. The exchange rate measure was the International Monetary Fund’s Special Drawing Rights rate representing an index of the U.S. dollar against four currencies, namely the euro, pound sterling, Japanese yen, and U.S. dollar, http://www.imf .org/external/np/fin /data/sdr_ir.aspx. The 10-year U.S. Treasury bill was used as interest rate proxy, taken from the U.S. Federal Reserve’s Selected Interest Rates (database), http://www.federalreserve.gov/releases/h15/data.htm. Last, GDP was taken from the World Bank’s World Development Indicators database, http://data.worldbank .org/indicator/all.
EstimationPrior to estimating the model, we examined the stationarity properties of all variables, applying unit root tests to levels with and without trend as well as first differences. Two tests were used, the ADF (Augmented Dickey-Fuller) and the PP (Phillips-Perron). Results are reported in table 1.1. The statistics indicate overwhelming rejection of stationarity and trend stationarity for all
t able 1.1 stationarity properties
Levels without trend Levels with trend First differences
ADF PP ADF PP ADF PP
PricesMaize −1.06 −0.90 −2.12 −2.17 −6.41*** −6.61***Wheat −1.40 −1.21 −2.45 −2.43 −5.70*** −6.20***Rice −2.00 −1.87 −2.60 −2.54 −5.64*** −6.29***Soybeans −1.14 −1.28 −1.83 −2.29 −6.75*** −6.87***Palm oil −0.78 −1.65 −1.52 −2.64 −6.24*** −8.21***Crude oil −0.70 −0.76 −1.59 −1.79 −6.59*** −6.58***
Macroeconomic variablesMUV −1.55 −1.36 −1.45 −1.08 −3.90*** −3.83***Exchange rate −1.47 −0.88 −4.05** −2.92 −5.35*** −5.48***Interest rate −1.36 −1.45 −1.46 −1.11 −6.66*** −4.61***GDP −0.65 −0.22 −2.72 −1.48 −3.54** −3.53**
S/U ratiosMaize −1.88 −1.91 −1.22 −1.89 −7.30*** −7.37***Wheat −2.54 −3.92*** −2.53 −3.89*** −5.88*** −10.65***Rice −1.66 −2.35 −1.01 −1.26 −3.85*** −5.97***Soybeans −3.41** −3.34** −4.22*** −3.71** −3.07** −10.25***Palm oil −2.98** −2.83* −2.82 −2.58 −9.80*** −10.66***
Sources: Based on World Bank, Commodity Price Data (database), http://data.worldbank.org/data-catalog/commodity-price-data, and World Development Indicators (database), http://data.worldbank.org/indicator/all; U.S. Department of Agriculture, Production, Supply and Distribution Online (database), http://www.fas.usda.gov/psdonline; International Monetary Fund, Special Drawing Rights (database), http://www.imf.org /external/np/fin/data/sdr_ir.aspx; U.S. Federal Reserve, Selected Interest Rates (database), http://www.federalreserve.gov/releases/h15/data.htm.Note: All variables are expressed in logarithms. ADF and PP denote the Augmented Dickey-Fuller and Phillips-Perron statistic for unit roots, respectively (Dickey and Fuller 1979; Phillips and Perron 1988). The lag length of the ADF statistic was based on the Akaike information criterion (up to 10 lags were allowed), while the spectral estimation for the PP statistics was based on the Bartlett kernel method. GDP = gross domestic product; MUV = manufacture unit value; S/U = stock-to-use.Significance level of stationarity: * = 10 percent, ** = 5 percent, *** = 1 percent.

18 Long-Term Drivers of Food Prices
Trade Policy and Food Security • http://dx.doi.org/10.1596/978-1-4648-0305-5
five food prices and the crude oil price in favor of stationarity in first differ-ences (see upper panel of table 1.1). Stationarity and trend stationarity were rejected for all three macroeconomic variables and GDP, again in favor of stationarity in first differences (see middle panel of table 1.1). However, the unit root test results for the S/U ratios were mixed. The statistics of maize and rice point to difference stationarity, and to a lesser extent, this is the case with wheat and palm oil. However, both unit root statistics indicate stationar-ity for soybeans (see lower panel of table 1.1). Given that, with the single S/U soybean exception, the variables are nonstationary, the performance of the models must be complemented by cointegration statistics (in addition to conventional statistics).
Table 1.2 reports parameter estimates for 1960–2012 for maize, wheat, and rice and (because of data unavailability) for 1965–2012 for soybeans and palm oil. Half of the parameter estimates are significantly different from zero at the 5 percent level while the adjusted-R2 averaged 0.82 (ranging from 0.67 for palm oil to 0.90 for wheat). More important, in most cases the ADF and PP statistics confirm stationarity of the error term at the 1 percent level.
Discussion
Stock-to-Use RatiosAs expected, the S/U ratio estimates are negative, ranging from a high of −0.61 for maize to a low of −0.21 for rice—the only S/U estimate not significantly dif-ferent from zero. These estimates imply that, on average, a 10 percent decline in
t able 1.2 parameter estimates from o rdinary l east s quares r egressions, 1960–2012
Maize Wheat Rice Soybeans Palm oil
Constant (β0) 8.21*** (5.92) 5.29*** (3.95) 6.74 (1.62) 6.69** (2.04) 10.92** (2.49)Stock-to-use ratio (S/Ut−1) −0.61*** (5.92) −0.50*** (3.12) −0.21 (0.81) −0.20* (2.13) −0.39** (2.38)Oil price (Pt
OIL) 0.23*** (4.89) 0.28*** (6.05) 0.27** (2.22) 0.34*** (6.42) 0.50*** (5.05)Exchange rate (XRt) 0.33 (1.01) −0.86** (2.45) −2.45*** (3.88) −1.08*** (2.91) −1.02 (1.34)Interest rate (Rt) 0.16* (1.80) −0.02 (0.22) 0.31** (2.07) −0.03 (0.21) −0.04 (0.25)Income (GDPt) −0.54*** (3.79) −0.12 (1.17) −0.11 (0.48) −0.14 (0.61) −0.43 (1.45)Inflation (MUVt) 0.87*** (3.34) −0.02 (0.13) −0.42 (0.79) −0.13 (0.70) −0.12 (0.36)Adjusted-R2 0.87 0.90 0.73 0.84 0.67DW 0.88 1.00 0.77 1.14 1.16ADF −4.08*** −5.00*** −3.47** −4.42*** −4.17***PP −3.47** −3.47** −3.52** −4.42*** −4.16***
Sources: Based on World Bank, Commodity Price Data (database), http://data.worldbank.org/data-catalog/commodity-price-data, and World Development Indicators (database), http://data.worldbank.org/indicator/all; U.S. Department of Agriculture, Production, Supply and Distribution Online (database), http://www.fas.usda.gov/psdonline; International Monetary Fund, Special Drawing Rights (database), http://www.imf.org /external/np/fin/data/sdr_ir.aspx; U.S. Federal Reserve, Selected Interest Rates (database), http://www.federalreserve.gov/releases/h15/data.htm.Note: The independent variable is the logarithm of the respective price. Heteroskedasticity-consistent absolute t-statistics are reported in parentheses; they are based on White’s method. DW denotes the Durbin-Watson statistic of serial correlation. Because of data unavailability, the regressions for soybeans and palm oil begin in 1965. For other notes, see table 1.1. ADF = Augmented Dickey-Fuller (statistic for unit roots); GDP = gross domestic product; MUV = manufacture unit value; PP = Phillips-Perron (statistic for unit roots).Significance level: * = 10 percent, ** = 5 percent, *** = 1 percent.

Long-Term Drivers of Food Prices 19
Trade Policy and Food Security • http://dx.doi.org/10.1596/978-1-4648-0305-5
the S/U ratio is associated with a 3 percent increase in food prices. The smaller parameter estimate for soybeans (compared to wheat and maize) may reflect not only the fact that soybean stocks can be held in bean, meal, or oil form, while only beans were used in this study, but also the generally low levels of stock-holding in that sector. From an econometric perspective, such a result may also be associated with the stationarity properties of the S/U ratio for soybeans—it was the only variable for which stationarity was not rejected according to both ADF and PP statistics.
The S/U ratio elasticity estimates for grains reported here are remarkably similar to the ones reported by Bobenrieth, Wright, and Zeng (2012). They esti-mated correlation coefficients between S/U ratios and real de-trended prices for wheat, maize, and rice of −0.40, −0.50, and −0.17, respectively (compared to −0.61, −0.50, and −0.21, respectively, in the present study.) Similarly, FAO (2008, p. 6, figure 3) reported correlation coefficients between the cereals price index and various measures of S/U ratios ranging from −0.47 and −0.65. Such high correlations led FAO (2008) to conclude not only that the low stock levels caused grain prices to spike during 2007–08, but also that prices are expected to remain elevated for some time.
The S/U ratio estimate for rice (low and not significantly different from zero) is both troubling and interesting. It most likely reflects policy distortions, includ-ing the substantial quantities of rice stocks—especially in East Asia where rice is considered a strategic commodity—that are either handled by state trading enterprises (STEs) or heavily influenced by government policies (Alavi and others 2012). Indeed, Anderson and others (2009, p. 489, table 12.11), estimated that during 2000–04, rice exhibited the highest level of distortion (43 percent) compared to wheat (4 percent) and maize (3 percent), as measured by the Trade Restrictiveness Index (TRI). The economies that contributed the most to the TRI were (in order): India; Japan; Taiwan, China; Vietnam; Korea; China; and the United States. Similar distortion patterns apply to earlier years as well. More recently, Martin and Anderson (2012, p. 426) found that insulating policies dur-ing the 2006–08 price spike may explain as much as 45 percent of the increase in the international rice price; they also concluded that trade policies induced a 30 percent increase in wheat prices during the boom years. The distortions of the Thai rice sector alone may have cost as much as 1 percent of Thailand’s total GDP (World Bank 2012b).
Not only is the global rice market subjected to large distortions, but also such distortions apply to both export and import sides. Timmer and Slayton (2009), for example, discuss how large tenders by the Philippines—a large rice-importing country—may have affected rice prices. Examples of countries whose rice mar-keting and trade is either handled exclusively by STEs or heavily influenced by policies include (but are not limited to) India (Food Corporation), Indonesia (Badan Urusan Logistik, or BULOG), the Philippines (National Food Authority), and Thailand (Rice Paddy Pledging Program).
It is often argued that high rice price volatility observed during the past few years is partly due to the thin nature of the export market. Indeed, only 8 percent

20 Long-Term Drivers of Food Prices
Trade Policy and Food Security • http://dx.doi.org/10.1596/978-1-4648-0305-5
of global production is traded internationally, the lowest among the commodities examined in this study (table 1.3). Yet, historically, rice price volatility has been remarkably similar to that of other grains and oilseeds; in fact, during 2010–12, rice and soybean price volatility was the lowest among the five commodities examined here. Furthermore, concentration of the global trade of rice is, again, in line with other commodities. The Herfindahl concentration index for the rice export market is 15 percent, higher than maize (12 percent) but much lower than wheat (21 percent). These characteristics suggest that it is policy concentra-tion (not market concentration, market thinness, or price volatility) that matters most in the rice market and distinguishes it from other markets. The differ-ent nature of the problems in the rice market was also highlighted by Gilbert (2012, p. 141).
Crude OilThe estimate for oil price elasticity was significantly different from zero in all five regressions—the only highly significant driver across all five models (see table 1.2). It ranged from 0.23 (maize) to 0.50 (palm oil), implying that, on aver-age, a 10 percent increase in the price of crude oil is associated with a 3 percent increase in food prices. These estimates confirm findings of earlier studies that have used the price of energy as an explanatory variable and concluded that energy plays a key role in food price movements.
The strong relationship between energy and nonenergy prices has been estab-lished with models that do not include the post-2004 period. Gilbert (1989), for example, using quarterly data between 1965 and 1986, estimated transmission elasticity from energy to nonenergy commodities of 0.12 and from energy to
t able 1.3 Key c haracteristics of c ommodity markets
Maize Wheat Rice Soybeans Palm oil
Global production (million mt), 2011–12 857.0 674.0 457.0 251.0 49.0Global exports (million mt), 2011–12 103.0 145.0 37.0 91.0 38.0Exports as % of production, 2011–12 12.0 21.5 8.1 36.1 77.1H-index, exports (%), 2010–12 11.9 21.2 15.2 32.0 40.0H-index, imports (%), 2010–12 2.7 2.9 6.3 41.4 9.3Price volatility, 1975–2004 5.4 4.9 5.4 5.4 7.7Price volatility, 2005–09 8.0 8.3 9.1 6.9 9.4Price volatility, 2010–12 6.6 8.8 4.4 4.4 5.2Global TRI (%), 1965–99 6.0 12.0 48.0 6.0 —Global TRI (%), 2000–04 3.0 4.0 43.0 6.0 —
Sources: Based on data from World Bank, U.S. Department of Agriculture, and Anderson and others 2009.Note: “Exports as % of production” is a measure of market thinness. “H-index” is the Herfindahl index of market concentration (used often in the industrial organization literature) and is calculated as Σi = 1, NSi
2, where Si is the export share of country i; and values of H close to zero indicate low concentration while values exceeding 0.25 (or 25 percent) indicate high concentration. However, when there are close substitutes (as in the case of palm oil, which has many close substitutes such as soybean oil), even an H-index close to unity may not be consistent with high concentration; same argument applies to market thinness. The upper bound of the index is 1 (100 percent), implying that the industry (global commodity market) is dominated by one firm (country). Price volatility has been calculated as 100*STDEV[log p(t) − log p(t−1)], where STDEV denotes standard deviation, p(t) is the current, and p(t−1) is the lagged monthly average price of each commodity. Global TRI (Trade Restrictiveness Index) was taken from Anderson and others (2009, p. 489, table 12.11). mt = metric tons; — = not available.

Long-Term Drivers of Food Prices 21
Trade Policy and Food Security • http://dx.doi.org/10.1596/978-1-4648-0305-5
food commodities of 0.25. Hanson, Robinson, and Schluter (1993) found a sig-nificant effect of oil price changes to agricultural producer prices based on a General Equilibrium Model. Borensztein and Reinhart (1994), using quarterly data from 1970 to 1992, estimated transmission elasticity to nonenergy com-modities of 0.11. Baffes (2007), using annual data from 1960 to 2005, estimated elasticities of 0.16 and 0.18 for nonenergy and food commodities, respectively. A strong relationship between energy and nonenergy prices was found by Chaudhuri (2001) as well.
Not all studies agree on the strength and nature of the relationship between energy and food prices. Pindyck and Rotemberg (1990) analyzed the nature of the comovement among seven commodity prices (cocoa, copper, cotton, crude oil, gold, lumber, and wheat) and concluded that these prices comoved in excess of what the macroeconomic fundamentals could explain, in turn leading to the “excess comovement” hypothesis. More important, they assumed that none of these commodities is used as a major input for the production of another, clearly a strong assumption considering that energy is the most important cost- production component to most agricultural commodities (either directly through fuel or indirectly through chemical inputs, especially fertilizers.) Subsequent research, however, challenged this hypothesis (see, for example, Ai, Chatrath, and Song 2006; Cashin, McDermott, and Scott 1999; Deb, Trivedi, and Varangis 1996; and LeyBourne, Lloyd, and Reed 1994).
At the other end of the spectrum—and in sharp contrast to the findings reported here—Zhang and others (2010) found no direct long-run relationship between fuel and agricultural commodity prices and only a limited short-run relationship. More recently, Reboredo (2012), in a study based on weekly data from 1998 to 2012, concluded that the prices of maize, wheat, and soybeans are not driven by oil price fluctuations.
IncomeThe results show no contemporaneous effect of income on food prices (maize is an exception, but the sign of the parameter estimate is negative). Although table 1.2 reports results for GDP purchasing power parity (PPP) of low- and middle-income countries, we run the models by using a total of six measures of GDP: global, low- and middle-income countries, and low-income countries, each in both PPP terms and current prices None of these measures resulted in coef-ficients significantly different from zero.
Income growth by emerging economies has been often cited as a key driver to the post-2004 food price increases. For example, the June 2009 issue of National Geographic noted that demand for grains has increased because people in countries like China and India have prospered and moved up the food ladder. Similarly, Krugman (2008) argued that the upward pressure on grain prices is due to the growing number of people in emerging economies, especially China, who are becoming wealthy enough to start eating like Westerners. Likewise, Wolf (2008) asked: “So why have prices of food risen so strongly?” and then answered “… strong rises in incomes per head in China, India, and other

22 Long-Term Drivers of Food Prices
Trade Policy and Food Security • http://dx.doi.org/10.1596/978-1-4648-0305-5
emerging countries have raised demand for food, notably meat and the related animal feeds.”
The results on income growth, which are in sharp contrast to what has been assumed in the above-cited (and other) literature, should not be surprising. As noted earlier, in the context of the present model, income affects prices indirectly through the S/U ratio, because higher income leads to higher consumption. Therefore, the inclusion of income as a separate variable would capture only the contemporaneous effect; hence, the insignificant parameter estimate implies that, if income affects prices, it does so with lags. Indeed, most empirical models that have explicitly used the income variable have not found a significant direct impact (for example, Ai, Chatrath, and Song 2006).
More important, there is no evidence that grain consumption by emerging economies has experienced growth rates that are either high by historical standards or comparable to income growth rates by emerging economies. For example, Alexandratos (2008, p. 673) found that China’s and India’s combined average annual increment in consumption—in terms of both growth rates and absolute increments—was lower in 2002–08 than in 1995–2001. In a similar vein, FAO (2008, p. 12) noted the following:
China and India have usually been cited as the main contributors to this sudden change [in prices] because of the size of their populations and the high rates of economic growth they have achieved. However, since 1980, the imports of cereals in these two countries have been trending down, on average by 4 percent per year, from an average of 14.4 million tonnes in the early 1980s to 6.3 million tonnes over the past three years. Moreover, mainland China has been a net exporter of cereals since the late-1990s, with one exception in the 2004–05 season. Similarly, India has been a net importer of these commodities only once, in the 2006–07 season, since the beginning of the twenty-first century.
Numerous other studies have reported similar findings, including Alexandratos and Bruinsma (2012), Baffes and Haniotis (2010), FAO (2009), and Sarris (2010). In fact, Deaton and Drèze (2009), based on household survey data in India, found that, despite growing incomes, there has been a downward trend in calorie intake since the early 1990s. They added that although the reasons behind this trend are not clear, one likely explanation may be that calorie requirements have declined as a result of better health and lower physical activity levels.
It is important to note, however, that demand growth has played a key role in the post-2004 evolution of other commodity prices, notably, metals and energy. For example, in 2011 China accounted for more than 40 percent of the world’s metal consumption, up from a mere 4 percent two decades earlier. Similarly, nonmember countries of the Organisation for Economic Co-operation and Development consume currently almost half of the world’s crude oil, up from one-third 15 years ago (Baffes 2012). The role of demand in crude oil prices has been emphasized by numerous authors (for example, Kilian 2009).
To the extent that strong growth by emerging economies boosts energy demand and hence oil prices, food prices have been driven by the growth

Long-Term Drivers of Food Prices 23
Trade Policy and Food Security • http://dx.doi.org/10.1596/978-1-4648-0305-5
patterns of these economies as well. In fact, this point has been highlighted by Heady and Fan (2010, p. 15). Nevertheless, from a policy perspective, it is impor-tant to establish the channel through which income growth affects food prices, including the cost side (high oil prices, which are associated with a leftward shift of the supply schedule), changing preferences such as diets (that is, consuming more meat instead of grains, which is associated with a change in the composi-tion of demand), or consumption of more food (which is associated with a right-ward shift of the demand schedule).
Macroeconomic DriversResults on the effect of the exchange rate on food prices are mixed, but they are highly consistent with expectations. Exchange rate movement matters a lot in rice (the parameter estimate is −2.45, t-ratio = 3.88), followed by a moderate impact on soybeans (−1.08, t-ratio = 2.91) and wheat (−0.86, t-ratio = 2.45). It is not significantly different from zero for palm oil and maize. The smallest (maize) and largest (rice) elasticity estimates are consistent with initial expectations, given that the United States is the dominant player in the maize market and only a marginal player in the rice market (see Radetzki 1985 for a graphical exposition of the latter point and Sjaastad 2008 for an empirical application to the market of gold). Using a similar model, Dawe (2002) estimated that a 10 percent depre-ciation of the Thai baht against the U.S. dollar is associated with a US$22/mt decline in world rice prices, a result that is consistent with the present model when one considers Thailand’s dominant importance in the rice export market.
The importance of the effects of exchange rates on commodity prices and trade was highlighted as soon as flexibility in exchange rates was introduced following the collapse of Bretton Woods (Schuh 1974). In the context of U.S. agriculture, Gardner (1981) concluded that the exchange rate was the most significant variable in explaining real U.S. farm prices with an elasticity of 0.4. Lamm (1980) and Chambers and Just (1981) reported similar findings for U.S. agriculture. Abbott, Hurt, and Tyner (2008) have highlighted the role of exchange rates in the post-2004 food price increases as well.
With the exception of maize, inflation appears not to affect food prices, high-lighting the importance of not imposing the homogeneity restriction (that is, deflating prices). Arguably, most of the inflation effect, especially during the 1970s, may have been picked up by the price of crude oil. For example, when the MUV is removed from the maize equation, the parameter estimate for crude oil increases to 0.31 with a t-ratio of 7.36 (up from 0.23, t-ratio = 4.89 as reported in table 1.2), bringing the effect of oil price in par with the other commodities—the impact on the overall performance of the model and other elasticities is negligible.
The parameter estimate for interest rate was zero for wheat, soybean, and palm oil and positive for maize (0.16, t-ratio = 1.80) and rice (0.31, t-ratio = 2.07) (see table 1.2). As noted earlier, interest rate is the only driver whose effect on commodity prices is ambiguous and depends on the relative impact on the

24 Long-Term Drivers of Food Prices
Trade Policy and Food Security • http://dx.doi.org/10.1596/978-1-4648-0305-5
demand side (through higher purchasing power of consumers) or the supply side (through changes in the required rate of return on storage). Although most empirical studies have found a strong link between exchange rate movements and agricultural commodity prices (for example, Gardner 1981), the link between interest rate and prices is less clear (for example, Stamoulis and Rausser 1987, Frankel and Hardouvelis 1985). The relatively low impact of interest rates on food prices (as opposed to the impact of the exchange rate) may also reflect the fact that low interest rates (by the United States) depress the U.S. dollar. Thus, the exchange rate elasticity captures part of the interest rate effect—the same way in which the S/U ratio elasticity captures the impact of both supply tightness and income growth.
Assessing post-2004 price movements
The effects of the drivers on the post-2004 food price movements were further assessed in four ways. First, the model was reestimated by excluding the post-2004 observations to examine by how much (and in what direction) the param-eter estimates changed when the post-2004 period is included. Second, by using the parameter estimates of the full sample model, we measured the relative contribution of all explanatory variables to food price changes from 1997–2004 to 2005–12—the two 8-year periods can be viewed roughly as pre- and post-boom periods. Third, the parameter estimates from the 1960–2004 model were used to derive predicted prices for the 2005–12 period (that is, out-of-sample forecasts) and compare them with predicted prices from the full sample model (that is, in-sample forecasts). Fourth, the robustness of the model was further examined by reestimating the equations as a panel. The rest of this section elabo-rates on these extensions.
Excluding Post-2004Table 1.4 reports parameter estimates based on 1960–2004 observations. In terms of model performance, the average adjusted-R2 is the same as in the full sample model while the unit root statistics indicate a stationary error term. In terms of individual performance, the explanatory power of palm oil is lower while that of rice is higher. If one compares the full sample with the pre-2005 model, the S/U ratio yields mixed results; its elasticity increased for maize and palm oil but declined for wheat, rice, and soybeans (figure 1.2a).
Interestingly, the S/U ratio elasticity for rice is higher compared to the full sample model, implying that during the post-2004 period, the S/U ratio of that market played no role at all in the determination of rice prices. The relatively small and insignificant S/U ratio elasticity for rice has important policy implica-tions, especially in view of calls to introduce regional or global interventions, including virtual reserves (Von Braun and Torero 2009), emergency reserves (Sarris 2010), or other insurance mechanisms (Mendoza 2009). In contrast, crude oil price elasticity increased consistently across all five food commodities (figure 1.2b), implying that the role of energy may have strengthened after 2004.

Long-Term Drivers of Food Prices 25
Trade Policy and Food Security • http://dx.doi.org/10.1596/978-1-4648-0305-5
t able 1.4 parameter estimates from o rdinary l east s quares r egressions, 1960–2004
Maize Wheat Rice Soybeans Palm oil
Constant (β0) 7.92*** (8.37) 4.98*** (3.25) 3.98 (1.23) 5.49 (1.64) 9.77* (1.98)Stock-to-use ratio (S/Ut−1) −0.53*** (6.89) −0.54*** (3.36) −0.33* (1.73) −0.24*** (2.86) −0.28 (1.64)Oil price (Pt
OIL) 0.13*** (3.20) 0.22*** (4.19) 0.10 (0.88) 0.23*** (4.41) 0.40*** (4.11)Exchange rate (XRt) 0.32 (1.20) −0.79** (2.09) −2.38*** (3.71) −0.90** (2.58) −1.13 (1.46)Interest rate (Rt) 0.05 (1.06) 0.14* (1.79) 0.69*** (6.85) 0.18 (1.31) 0.16 (0.90)Income (GDPt) −0.55*** (5.86) −0.14 (1.09) −0.04 (0.22) −0.13 (0.53) −0.35 (0.97)Inflation (MUVt) 0.96*** (5.24) 0.09 (0.42) −0.14 (0.28) 0.08 (0.33) −0.16 (0.41)Adjusted-R2 0.91 0.90 0.83 0.84 0.55DW 1.50 1.24 1.24 1.41 1.21ADF −4.13*** −4.16*** −5.05*** −4.70*** −3.72**PP −4.90*** −4.43*** −4.30*** −4.46*** −3.68**
Sources: Based on World Bank, Commodity Price Data (database), http://data.worldbank.org/data-catalog/commodity-price-data, and World Development Indicators (database), http://data.worldbank.org/indicator/all; U.S. Department of Agriculture, Production, Supply and Distribution Online (database), http://www.fas.usda.gov/psdonline; International Monetary Fund, Special Drawing Rights (database), http://www.imf.org / external/np/fin/data/sdr_ir.aspx; U.S. Federal Reserve, Selected Interest Rates (database), http://www.federalreserve.gov/releases/h15/data.htm.Note: The independent variable is the logarithm of the respective price. For other notes, see tables 1.1 and 1.2. ADF = Augmented Dickey-Fuller (statistic for unit roots); DW = Durbin-Watson (statistic of serial correlation); GDP = gross domestic product; MUV = manufacture unit value; PP = Phillips-Perron (statistic for unit roots).Significance level: * = 10 percent, ** = 5 percent, *** = 1 percent.
Figure 1.2 elasticities (Absolute values)
Note: S/U = stock-to-use.
0
0.1
0.2
0.3
0.4
0.5
0.6
0.7
Maize
WheatRice
Soybeans
Palm oil
a. S/U ratio elasticity
Elas
ticity
1960–2004 1960–2012
Elas
ticity
b. Crude oil elasticity
Maize
WheatRice
Soybeans
Palm oil
0
0.1
0.2
0.3
0.4
0.5
0.6

26 Long-Term Drivers of Food Prices
Trade Policy and Food Security • http://dx.doi.org/10.1596/978-1-4648-0305-5
Baffes and Haniotis (2010) reported that a similar increase in the energy/ nonenergy transmission elasticity took place in all commodity groups, not just food. This, in turn, highlights the weakness of the argument that the increased correlation between crude oil food prices during the past few years is due to biofuels. Although our conclusions by no means imply that biofuels do not matter, they do indicate that the impact of biofuels on food prices should not be based on the food price correlation alone.
In addition to excluding the post-2004 observations, we reestimated the full model with dummies for the S/U ratio and crude oil (separate regressions for each dummy were run). The changes in the elasticities were quantitatively similar to the changes observed from the full to the limited sample model, that is, increases in the effect of crude oil and mixed results on the effect of the S/U ratio.
What Matters Most?Next, using the parameter estimates of the full sample, we calculated the relative contribution to price changes of each explanatory variable (table 1.5). Specifically, the estimated elasticities that were significantly different from zero were applied to the changes in the average values of the explanatory variables between 1997–2004 and 2005–12. During these two periods, the World Bank’s food price index increased by 80 percent whereas the price of crude oil increased by 228 percent (figure 1.3). In contrast, the changes in S/U ratios were more moderate and mixed, ranging from a 35 percent decline in maize to a 17 percent increase in soybeans (figure 1.4). Applying the elasticity estimates to these changes gives a measure of the relative contribution of each driver. Similar decompositions have often been used in the literature (for example, World Bank 2012a and Von Witzke and Noleppa 2011). The advantage of the present decomposition is that it uses elasticities that have been generated by the same data set used for the decomposition analysis.
t able 1.5 c ontribution of each Driver to Food price c hanges, 1997–2004 to 2005–12Percent
Maize Wheat Rice Soybeans Palm oil
Change in nominal price 90 81 99 77 81 Stock-to-use ratio (S/Ut−1) 22 9 .. −3 5 Oil price (Pt
OIL) 52 64 61 77 114 Exchange rate (XRt) .. 10 29 13 .. Interest rate (Rt) −4 .. −8 .. .. Income (GDPt) −32 .. .. .. .. Inflation (MUVt) 20 .. .. .. ..Total 58 83 82 87 119
Source: Based on table 1.2 estimates.Note: The contribution was based on the 1960–2012 model parameter estimates reported in table 1.2. .. implies that the respective parameter estimate was not significantly different from zero. GDP = gross domestic product; MUV = manufacture unit value.

Long-Term Drivers of Food Prices 27
Trade Policy and Food Security • http://dx.doi.org/10.1596/978-1-4648-0305-5
Figure 1.3 Food and c rude o il price indexes
Source: Based on World Bank data.
0
50
100
80% increase
228% increase
Food
and
cru
de o
il pr
ice
inde
xes
(nom
inal
, 200
5 =
100)
150
200
250
19971998
19992000
20012002
20032004
20052006
20072008
20092010
20112012
Food prices Crude oil prices
Figure 1.4 stock-to-Use r atios, 1997–2004 and 2005–12
Source: Based on U.S. Department of Agriculture data.
0
5
10
15
20
25
30
35
Maize
Perc
ent
Wheat Rice Soybeans Palm oil1997–2004 2005–12

28 Long-Term Drivers of Food Prices
Trade Policy and Food Security • http://dx.doi.org/10.1596/978-1-4648-0305-5
Most of the contribution to food price changes from 1997–2004 to 2005–12 comes from crude oil, which for maize and wheat accounts for 52 percent and 64 percent, respectively, with the corresponding S/U contribution of 22 percent and 9 percent, respectively. Crude oil’s strong effect compared to the S/U’s ratio’s more limited impact reflects the large increase in the price of oil during these two periods compared with the moderate changes in the S/U ratios. Moreover, as discussed earlier, removing the MUV from the maize equation increases the oil price elasticity from 0.23 to 0.31, and crude oil’s contribution from 52 percent to 73 percent, the highest among the three grains.
It is important to note that the larger (smaller) influence of crude oil (S/U ratio) on food prices is period specific. For example, during the late 1980s, when stocks were declining and oil prices were stable, the S/U ratios accounted for almost all of the food price movements. Indeed, from 1985–87 to 1988–90, the price of maize increased by 19 percent. However, because the S/U ratio declined by 32 percent (and the crude oil price declined by 7 percent), all change in the price of maize is explained by the S/U ratio [20% = −32%*(−0.61)].
The limited impact of the S/U ratio following the post-2004 price increases is in line with Dawe (2009), who noted that stocks did not have an important effect on the evolution of world grain prices during the recent boom, a conclusion shared by Heady and Fan (2008). Our results are also in line with Von Witzke and Noleppa (2011), who concluded that the combined contribution of crude oil prices and freight rates to price changes of wheat, maize, and soybeans during the 2007–08 spike ranged between 45 percent and 75 percent (calculations based on p. 15, figure 8). However, they are in contrast to Wright (2012) who argued that very low levels of stocks during 2007–08—at a time of strong biofuel demand and increased incomes by China and India—were key causes of the post-2007 grain price increases. And, to the extent that biofuels affect prices through the S/U channel, the results show that their effect on food prices is not as strong as has been reported in previous studies (for example, Mitchell 2008).
These findings are critical in view of the frequent calls for the establishment of stockpile mechanisms, especially for rice. For example, Mendoza (2009, p. 13) proposed a combination of an Asian grain reserve and a financing facility that could be accessed by member countries when their rice supplies face unexpected shocks. Likewise, Gilbert (2012, p. 135) argued that unless export restrictions come under World Trade Organization discipline, there is merit in considering the establishment of national or international rice stockpiles that poor rice-importing countries can access in the event of shortage. Attractive as it may appear, the recommendation that rice-producing and -consuming Asian nations establish stockpile mechanisms may not be an avenue to pursue for at least two reasons. First, the S/U ratio’s impact on rice prices is very limited. Second, if, as Martin and Anderson (2012) reported, almost half of the post-2007 increase in the price of rice is due to export policies, then one could question whether the policy makers who engaged in such actions will adhere to the rules and condi-tions of stockpiling mechanisms, which historically have a very poor success record.

Long-Term Drivers of Food Prices 29
Trade Policy and Food Security • http://dx.doi.org/10.1596/978-1-4648-0305-5
Assessing the ModelWe assessed the sensitivity of the results by comparing actual prices with those generated by the 1960–2012 and 1960–2004 models (table 1.6). First, both mod-els show that prior to 2006, prices were higher than what the fundamentals sug-gest, about the same for 2007, and much lower after 2008. That is, there was “undershooting” prior to the boom and “overshooting” during the boom. For example, in 2005, fitted and actual prices differed between 28 percent (soybeans)
t able 1.6 Actual prices c ompared to model-Generated prices
2005 2006 2007 2008 2009 2010 2011 2012
MaizeActual ($/mt) 99 122 164 223 166 186 292 280Fitted ($/mt), 1960–2012 146 150 167 184 158 173 212 207Difference (%), 1960–2012 48 23 2 −17 −5 −7 −27 −26Fitted ($/mt), 1960–2004 120 127 140 138 112 120 142 138Difference (%), 1960–2004 22 5 −15 −38 −32 −36 −51 −51
WheatActual ($/mt) 152 192 255 326 224 224 316 280Fitted ($/mt), 1960–2012 214 227 256 288 219 213 238 245Difference (%), 1960–2012 40 18 0 −12 −2 −5 −25 −12Fitted ($/mt), 1960–2004 193 209 237 249 182 173 192 197Difference (%), 1960–2004 27 9 −7 −24 −19 −22 −39 −30
RiceActual ($/mt) 286 305 326 650 555 489 453 550Fitted ($/mt), 1960–2012 420 462 512 497 361 366 415 412Difference (%), 1960–2012 47 52 57 −24 −35 −25 −24 −25Fitted ($/mt), 1960–2004 352 417 467 366 236 231 256 254Difference (%), 1960–2004 23 37 43 −44 −58 −53 −53 −54
SoybeansActual ($/mt) 275 269 384 523 437 450 541 540Fitted ($/mt), 1965–2012 351 361 373 444 390 392 432 459Difference (%), 1965–2012 28 34 −3 −15 −11 −13 −20 −15Fitted ($/mt), 1965–2004 293 314 322 343 286 280 302 324Difference (%), 1965–2004 7 17 −16 −33 −34 −38 −44 −40
Palm oilActual ($/mt) 422 478 780 949 683 901 1,125 1,125Fitted ($/mt), 1965–2012 649 670 687 889 699 739 871 883Difference (%), 1965–2012 54 40 −12 −6 2 −18 −23 −18Fitted ($/mt), 1965–2004 585 629 650 732 552 576 661 667Difference (%), 1965–2004 39 32 −17 −23 −19 −36 −41 −38
Source: Based on tables 1.2 and 1.4 estimates.Note: The first row of each panel denotes the price of the commodity, the logarithm of which is the dependent variable. The second row denotes the fitted price–based full sample model, and the third row denotes the percentage difference between the actual and fitted prices (based on the 1960–2012 sample, generated from the estimates reported in table 1.2). The fourth and fifth rows report fitted prices along with their percentage differences from actual prices based on the pre-2005 sample model (1960–2004, generated from the estimates reported in table 1.4); mt = metric ton.

30 Long-Term Drivers of Food Prices
Trade Policy and Food Security • http://dx.doi.org/10.1596/978-1-4648-0305-5
and 54 percent (palm oil). Conversely, the difference in 2011 ranged from −20 percent (soybeans) to −27 percent (maize). As expected, such differences are smaller for 2005 (and larger for 2011) when the 1960–2004 period is used, which is consistent with the differences in the elasticities reported in tables 1.2 and 1.4. These results are also consistent for both the full and the pre-2005 models.
The model identifies one similarity and one difference with respect to the patterns observed during the 1973–74 commodity price boom. The similarity is that in 1972 (the year before the spike), prices undershot by an average of 10 percent, whereas during 1973 and 1974, they overshot by an average of 22 percent. The difference is that the undershooting and overshooting of the 1970s was of much smaller magnitude and less duration compared with the recent price increases. That difference, in turn, indicates that while price increases of the 1970s could be characterized as a spike (quite visible in figure 1.1), the recent price increases appear to have a more permanent character.
Consistent with the statistics reported earlier, the models for maize and wheat performed the best while that of rice performed the worst. For example, the Mean Absolute Percent Error (MAPE) for the full sample model (table 1.7,
t able 1.7 Assessing the Fit of the models
Maize Wheat Rice Soybeans Palm oil
1960–2012 fitted prices based on the 1960–2012 modelMean Absolute Percent Error 10.97 10.57 18.34 12.11 20.03Theil’s inequality coefficient (U) 0.092 0.075 0.128 0.077 0.116Covariance proportion of U 0.767 0.921 0.878 0.839 0.829
1960–2004 fitted prices based on the 1960–2012 modelMean Absolute Percent Error 9.42 9.88 15.14 11.06 19.70Theil’s inequality coefficient (U) 0.070 0.067 0.098 0.069 0.123Covariance proportion of U 0.996 0.994 0.976 0.996 0.907
1960–2004 fitted prices based on the 1960–2004 modelMean Absolute Percent Error 7.42 9.34 12.16 10.23 18.57Theil’s inequality coefficient (U) 0.055 0.062 0.081 0.062 0.120Covariance proportion of U 0.967 0.985 0.981 0.977 0.817
2005–12 fitted prices based on the 1960–2012 model (in-sample forecast)Mean Absolute Percent Error 19.45 14.32 35.94 17.33 21.64Theil’s inequality coefficient (U) 0.120 0.085 0.168 0.088 0.106Covariance proportion of U 0.015 0.358 0.705 0.089 0.179
2005–12 fitted prices based on the 1960–2004 model (out-of-sample forecast)Mean Absolute Percent Error 31.14 22.11 45.44 28.84 30.51Theil’s inequality coefficient (U) 0.257 0.144 0.293 0.208 0.189Covariance proportion of U 0.069 0.364 0.618 0.127 0.163
Source: Based on tables 1.2 and 1.4 estimates.Note: The Mean Absolute Percent Error (MAPE) is the percentage difference between actual and fitted price. For example, the value of the MAPE statistic for maize in the in-sample forecast panel, 19.45, is the average of the absolute values reported in the third row of the maize panel in table 1.6 (48 percent, 23 percent, 2 percent, −17 percent, −5 percent, −7 percent, −27 percent, and −26 percent). The Theil’s inequality coefficient (U-statistic) shows how well the fitted prices compare with the actual prices.

Long-Term Drivers of Food Prices 31
Trade Policy and Food Security • http://dx.doi.org/10.1596/978-1-4648-0305-5
first row of top panel) is the lowest for maize and wheat and the highest for rice and palm oil with similar results applying to pre- and post-2005 fitted prices based on both models.
In addition to the MAPE criterion, the performance of the model was assessed by using Theil’s inequality coefficient (U-statistic, table 1.7). The U-statistic lies between zero and one, with zero indicating perfect fit. The covariance proportion of the U-statistic is a measure of the unsystematic forecasting error, thus measur-ing the quality of the forecasts (values close to unity indicate higher-quality forecasts), and the other two components of the U-statistic are the bias propor-tion and the variance proportion; all three add to unity. Most U-statistics are less than 0.1, which implies that the model’s forecasting ability is quite good (an exception to this is the bottom panel of table 1.7, which reports the out-of-sample forecast, where the out-of-sample component corresponds to the post-2004 period). In contrast, the covariance proportion for the rice model of the 2005–12 fitted prices based on the 1960–2004 model is much higher than the other commodities (0.618, see table 1.7, bottom panel), implying that, while the addition of the post-2004 period improves the performance of the model for all four commodities, it does not do so for rice. That finding, combined with the insignificant parameter estimate for the S/U ratio, further confirms that rice stocks did not play any role during the recent price boom.
Checking RobustnessTo check the model’s robustness, we estimated it as a panel (Pedroni 2004). Table 1.8 reports a total of four panel estimates: full sample (1960–2012) and shorter sample (1960–2004) for all five food prices (left-hand two columns) and the three grains (right-hand two columns). In all four regressions, the adjusted-R2s meet or exceed 0.90 while the parameter estimates for the S/U ratio, oil price, and exchange rate are significantly different from zero at the 1 percent level.
t able 1.8 parameter estimates from panel r egressions
All 5 commodities Three grains
1960–2012 1960–2004 1960–2012 1960–2004
Constant (β0) 7.08*** (6.05) 6.37*** (5.73) 6.14*** (4.51) 5.64*** (4.71)Stock-to-use ratio (S/Ut−1) −0.22*** (5.07) −0.23*** (5.55) −0.26*** (4.41) −0.26*** (5.15)Oil price (Pt
OIL) 0.34*** (11.23) 0.24*** (7.62) 0.28*** (7.37) 0.18*** (4.98)Exchange rate (XRt) −1.25*** (5.60) −1.20*** (5.71) −1.28*** (4.52) −1.27*** (5.15)Interest rate (Rt) 0.06 (1.15) 0.28*** (5.51) 0.10* (1.76) 0.33*** (6.04)Income (GDPt) −0.17** (2.04) −0.18** (2.08) −0.15 (1.50) −0.17* (1.78)Inflation (MUVt) 0.18 (1.63) −0.03 (0.27) −0.09 (0.63) 0.04 (0.24)Adjusted-R2 0.92 0.93 0.90 0.92DW 0.88 1.08 0.77 0.99
Sources: Based on World Bank, Commodity Price Data (database), http://data.worldbank.org/data-catalog/commodity-price-data, and World Development Indicators (database), http://data.worldbank.org/indicator/all; U.S. Department of Agriculture, Production, Supply and Distribution Online (database), http://www.fas.usda.gov/psdonline; International Monetary Fund, Special Drawing Rights (database), http://www.imf.org /external/np/fin/data/sdr_ir.aspx; U.S. Federal Reserve, Selected Interest Rates (database), http://www.federalreserve.gov/releases/h15/data.htm.Note: See table 1.1. DW = Durbin-Watson (statistic of serial correlation); GDP = gross domestic product; MUV = manufacture unit value.Significance level: * = 10 percent, ** = 5 percent, *** = 1 percent.

32 Long-Term Drivers of Food Prices
Trade Policy and Food Security • http://dx.doi.org/10.1596/978-1-4648-0305-5
The panel regressions, which broadly confirm the results of the individual regressions, offer a useful summary assessment of the relative impact of the key drivers. They can be summarized as follows. First, both the crude oil and the S/U ratio elasticities are highly significant in all regressions, thus further confirming the importance of these two drivers (especially the former) in determining long-term price trends. Second, when the post-2004 observations are included, oil elasticity increases but the S/U does not. In fact, the S/U ratio elasticities for the three grains were identical in both regressions (−0.26, with t-ratios of 4.41 and 5.15). Third, the exchange rate elasticities of all four models were remarkably similar (around −1.25) and highly significant at the 1 percent level. Fourth, the impact of interest rates is positive and strong for 1960–2004 but weakens con-siderably when the entire sample is used. Fifth, inflation does not seem to matter. Last, income has either a marginal (albeit negative) or zero impact.
However, based on the unit root statistics, cointegration could not be confirmed—it was rejected by four panel measures (v, ρ, PP, and ADF) as well as three group measures (ρ, PP, and ADF) with all p-values exceeding 0.30. Such rejection is important for at least two reasons. First, it confirms the presence of significant qualitative and quantitative differences in the way in which food prices respond to fundamentals. Thus, any analysis of the causes of food price movements along with policy recommendations should be undertaken on a commodity-specific rather than broad basis. To see this point, consider the simi-larities and differences between maize and rice prices. Both prices respond in a nearly identical fashion to oil price changes; yet, maize prices respond strongly to S/U ratio but not to exchange rate movements, while rice prices do not respond to S/U ratio but respond strongly to exchange rate movements. Second, from a methodological perspective, the rejection of cointegration may lead to the erro-neous conclusion that there is no long-run relationship between food prices and fundamentals, whereas such relationship not only exists but is very strong.
c onclusions and Further r esearch
This chapter uses a reduced-form price-determination model on 1960–2012 annual data of five food commodities (maize, wheat, rice, soybeans, and palm oil) to assess the relative contribution of various factors to their respective price changes. The factors include crude oil prices on the supply side, stock-to-use ratios, three macroeconomic indicators (exchange rate movements, interest rates, and inflation), and income on the demand side. The chapter concludes that food commodity prices respond strongly to energy prices, stock-to-use ratios, and (in a mixed manner) to exchange rate movements. With a few exceptions, interest rates and income growth do not matter. Yet, crude oil prices mattered the most during the recent boom period because they experienced the largest increase. In terms of model performance, wheat and maize per-formed the best, while rice performed poorly, the latter a likely reflection of the fact that the rice market is subjected to policy distortions the most among the commodities analyzed.

Long-Term Drivers of Food Prices 33
Trade Policy and Food Security • http://dx.doi.org/10.1596/978-1-4648-0305-5
From a methodological perspective, the research presented here can be extended in a number of ways. By applying the model to other commodities (either food or raw materials and metals), one could explore whether the drivers discussed here are relevant to these commodities as well. Another direction could entail the use of alternative measures for the key drivers and examining whether they are associated with significant differences in the elasticity esti-mates. In contrast, the differences between the limited and full sample models imply that a time-varying parameter model may yield further insights into the nature of the recent (and earlier) commodity price booms. The role of policies is another important extension that can shed more light on the undershooting and overshooting observed during the years before and after 2004–05 as well as the poor performance of the rice model. Last, measuring price volatility through the lenses of higher-frequency data (for example, monthly or even daily data) is another direction where further research is warranted, especially in view of the ongoing policy debate surrounding the causes and consequences of food price volatility.
r eferences
Abbott, Phillip C., Christopher Hurt, and Wallace E. Tyner. 2008. What’s Driving Food Prices? Oak Brook, IL: The Farm Foundation.
Ai, Chunrong, Arjun Chatrath, and Frank Song. 2006. “On the Co-Movement of Commodity Prices.” American Journal of Agricultural Economics 88: 574–88.
Alavi, Hamid A., Aira Htenas, Ron Kopicki, Andrew W. Shepherd, and Ramon Clarete. 2012. Trusting Trade and Private Sector for Food Security in Southeast Asia. Directions in Development Series. Washington, DC: World Bank.
Alexandratos, Nikos. 2008. “Food Price Surges: Possible Causes, Past Experience, and Long-Term Relevance.” Population and Development Review 34: 599–629.
Alexandratos, Nikos, and Jelle Bruinsma. 2012. “World Agriculture towards 2030/2050: The 2012 Revision.” ESA Working Paper 12–03, Agricultural Development Economics Division, Food and Agriculture Organization of the United Nations, Rome.
Anderson, Kym, Johanna L. Croser, Signe Nelgen, and Ernesto Valenzuela. 2009. “Global Distortion to Key Commodity Markets.” In Distortions to Agricultural Incentives: A Global Perspective, 1955–2007, edited by Kym Anderson, 459–504. Washington, DC: Palgrave and McMillan for the World Bank.
Baffes, John. 1997. “Explaining Stationary Variables with Nonstationary Regressors.” Applied Economics Letters 4: 69–75.
———. 2007. “Oil Spills on Other Commodities.” Resources Policy 32: 126–34.
———. 2010. “More on the Energy/Non-Energy Commodity Price Link.” Applied Economics Letters 17: 1555–58.
———. 2012. “Going against the Grain on the Post-2005 Commodity Price Boom.” International Economic Bulletin, April. http://seekingalpha.com/article/519111 -going-against-the-grain-on-the-post-2005-commodity-price-boom.
Baffes, John, and Tassos Haniotis. 2010. “Placing the Recent Commodity Boom into Perspective.” In Food Prices and Rural Poverty, edited by Ataman Aksoy and Bernard

34 Long-Term Drivers of Food Prices
Trade Policy and Food Security • http://dx.doi.org/10.1596/978-1-4648-0305-5
Hoekman, 40–70. Washington, DC: Centre for Economic Policy Research and the World Bank.
Bobenrieth, Eugenio, Brian Wright, and Di Zeng. 2012. “Stocks-to-Use Ratios as Indicator of Vulnerability to Spikes in Global Cereal Markets.” Paper presented at the Second Session of the Agricultural Market Information System Global Food Market Information Group, Food and Agriculture Organization of the United Nations, Rome, October 3.
Borensztein, Eduardo, and Carmen M. Reinhart. 1994. “The Macroeconomic Determinants of Commodity Prices.” IMF Staff Papers 41: 236–61.
Cashin, Paul, C. John McDermott, and Alasdair Scott. 1999. “The Myth of Co-Moving Commodity Prices.” IMF Working Paper 169, International Monetary Fund, Washington, DC.
Chambers, Robert G., and Richard E. Just. 1981. “Effects of Exchange Rate Changes on U.S. Agriculture: A Dynamic Analysis.” American Journal of Agricultural Economics 63: 32–46.
Chaudhuri, Kausik. 2001. “Long-Run Prices of Primary Commodities and Oil Prices.” Applied Economics 33: 531–38.
Cooper, Richard N., and Robert Z. Lawrence. 1975. “The 1972–75 Commodity Boom.” Brookings Papers on Economic Activity 3: 672–715.
Dawe, David. 2002. “The Changing Structure of the World Rice Market, 1950–2000.” Food Policy 27: 335–70.
———. 2009. “The Unimportance of ‘Low’ World Grain Stocks for Recent World Price Increases.” ESA Working Paper 09–01, Agricultural Development and Economics Division, Food and Agriculture Organization of the United Nations, Rome.
Deaton, Angus, and Jean Drèze. 2009. “Nutrition in India: Facts and Interpretations.” Economic and Political Weekly 44 (7): 42–65.
Deaton, Angus, and Guy Laroque. 1992. “On the Behaviour of Commodity Prices.” Review of Economic Studies 59, 1–23.
Deb, Partha, Pravin K. Trivedi, and Panayotis Varangis. 1996. “The Excess Co-Movement of Commodity Prices Reconsidered.” Journal of Applied Econometrics 11 (3): 275–91.
Dickey, David A., and Wayne A. Fuller. 1979. “Distribution of the Estimators for Autoregressive Time Series with a Unit Root.” Journal of the American Statistical Association 74 (366): 427–31.
FAO (Food and Agriculture Organization of the United Nations). 2008. “Soaring Food Prices: Facts, Perspectives, Impacts, and Actions Required.” Technical report presented at the FAO’s “High-Level Conference on World Food Security: The Challenges of Climate Change and Bioenergy,” Rome, June 3–5.
———. 2009. The State of Agricultural Commodity Markets: High Food Prices and the Food Crisis—Experiences and Lessons Learned. Rome: FAO.
Frankel, Jeffrey A., and Gikas Hardouvelis. 1985. “Commodity Prices, Monetary Surprises, and Fed Credibility.” Journal of Money, Credit and Banking 17 (4): 425–38.
Gardner, Bruce. 1981. “On the Power of Macroeconomic Linkages to Explain Events in U.S. Agriculture.” American Journal of Agricultural Economics 63: 871–78.
Gilbert, Christopher L. 1989. “The Impact of Exchange Rates and Developing Country Debt on Commodity Prices.” Economic Journal 99 (397): 773–84.
———. 2012. “International Agreements to Manage Food Price Volatility.” Global Food Security 1 (2): 134–42.

Long-Term Drivers of Food Prices 35
Trade Policy and Food Security • http://dx.doi.org/10.1596/978-1-4648-0305-5
Hanson, Kenneth, Sherman Robinson, and Gerald E. Schluter. 1993. “Sectoral Effects of a World Oil Price Shock: Economywide Linkages to the Agricultural Sector.” Journal of Agricultural and Resource Economics 18 (1): 96–116.
Heady, Derek, and Shenggen Fan. 2008. “Anatomy of a Crisis: The Causes and Consequences of Surging Food Prices.” Agricultural Economics 39: 375–91.
———. 2010. Reflections on the Global Food Crisis: How Did It Happen? How Has It Hurt? And How Can We Prevent the Next One? Research Monograph 165. Washington, DC: International Food Policy Research Institute.
Holtham, Gerald H. 1988. “Modeling Commodity Prices in a World Macroeconomic Model.” In International Commodity Market Models and Policy Analysis, edited by Orhan Guvenen, 221–50. Boston, MA: Kluwer Academic Publishers.
Houthakker, Hendrik S. 1975. “Comments and Discussion on ‘The 1972–75 Commodity Boom’ by Richard N. Cooper and Robert Z. Lawrence.” Brookings Papers on Economic Activity (3): 718–20.
Kilian, Lutz. 2009. “Not All Oil Price Shocks Are Alike: Disentangling Demand and Supply Shocks in the Crude Oil Market.” American Economic Review 99 (3): 1053–69.
Krugman, Paul. 2008. “Grains Gone Wild.” Op-Ed, New York Times, April 7.
Lamm, R. McFall, Jr. 1980. “The Role of Agriculture in the Macroeconomy: A Sectoral Analysis.” Applied Economics 12: 19–35.
LeyBourne, Stephen J., Tim A. Lloyd, and Geoffrey V. Reed. 1994. “The Excess Co-Movement of Commodity Prices Revisited.” World Development 22: 1747–58.
Martin, William, and Kym Anderson. 2012. “Export Restrictions and Price Insulation during Commodity Price Booms.” American Journal of Agricultural Economics 94: 422–27.
Mendoza, Ronald U. 2009. “A Proposal for an Asian Rice Insurance Mechanism.” Global Economy Journal 9 (1): 1–31.
Mitchell, Donald. 2008. “A Note on Rising Food Prices.” Policy Research Working Paper 4682, World Bank, Washington, DC.
Newbery, David M. G., and Joseph E. Stiglitz. 1981. The Theory of Commodity Price Stabilization: Study in the Economics of Risk. Oxford, U.K.: Oxford University Press.
Pedroni, Peter. 2004. “Panel Cointegration: Asymptotic and Finite Sample Properties of Pooled Time Series Tests with an Application to the PPP Hypothesis.” Econometric Theory 20: 597–625.
Phillips, Peter C. B., and Pierre Perron. 1988. “Testing for a Unit Root in Time Series Regression.” Biometrika 75 (2): 335–46.
Piesse, Jenifer, and Colin Thirtle. 2009. “Three Bubbles and a Panic: An Explanatory Review of the Recent Food Commodity Price Events.” Food Policy 34: 119–29.
Pindyck, Robert S., and Julio J. Rotemberg. 1990. “The Excess Co-Movement of Commodity Prices.” Economic Journal 100: 1173–89.
Radetzki, Marian. 1985. “Effects of a Dollar Appreciation on Dollar Prices in International Commodity Markets.” Resources Policy 11 (3): 158–59.
———. 2006. “The Anatomy of Three Commodity Booms.” Resources Policy 31: 56–64.
Reboredo, Juan C. 2012. “Do Food and Oil Prices Co-Move?” Energy Policy 49: 456–67.
Reinhart, Carmen M. 1991. “Fiscal Policy, the Real Exchange Rate, and Commodity Prices.” IMF Staff Papers 38: 506–24.

36 Long-Term Drivers of Food Prices
Trade Policy and Food Security • http://dx.doi.org/10.1596/978-1-4648-0305-5
Sarris, Alexander. 2010. “Trade-Related Policies to Ensure Food (Rice) Security in Asia.” In The Rice Crisis: Markets, Policies and Food Security, edited by David Dawe, 61–87. London: Earthscan.
Schuh, G. Edward. 1974. “The Exchange Rate and U.S. Agriculture.” American Journal of Agricultural Economics 56: 1–13.
Sjaastad, Larry A. 2008. “The Price of Gold and the Exchange Rates: Once Again.” Resources Policy 33 (2): 118–24.
Stamoulis, Kostas G., and Gordon C. Rausser. 1987. “Overshooting of Agricultural Prices.” CUDARE Working Paper 493, Department of Agricultural and Resource Economics, University of California, Berkeley.
Stein, Jerome L. 1986. The Economics of Futures Markets. Oxford, U.K.: Basil-Blackwell.
Timmer, C. Peter, and Tom Slayton. 2009. “Arson Alert: Philippines Is Playing with Fire! Again!” Center for Global Development Notes, December.
Turnovsky, Stephen J. 1983. “The Determinants of Spot and Futures Prices with Storable Commodities.” Econometrica 51: 1363–87.
von Braun, Joachim, and Maximo Torero. 2009. “Implementing Physical and Virtual Food Reserves to Protect the Poor and Prevent Market Failure.” IFPRI Policy Brief 10, International Food Policy Research Institute, Washington, DC.
Von Witzke, Harald, and Steffen Noleppa. 2011. “The Economics of Rumpelstiltskin: Why Speculation Is Not a Prime Cause of High and Volatile International Agricultural Commodity Prices: An Economic Analysis of the 2007–08 Price Spike.” HFFA Working Paper, Humboldt Forum for Food and Agriculture, Berlin.
Wolf, Martin. 2008. “Food Crisis Is a Chance to Reform Global Agriculture.” Financial Times, April 27.
World Bank. 2009. Global Economic Prospects: Commodities at the Crossroads. Washington, DC: World Bank.
———. 2012a. Responding to Higher and More Volatile Food Prices. Report 68420-GLB, World Bank, Washington, DC.
———. 2012b. Thailand: Economic Monitor—December 2012. Bangkok: World Bank Regional Office.
Wright, Brian. 2012. “International Grain Reserves and Other Instruments to Address Volatility in Grain Markets.” World Bank Research Observer 27 (2): 222–60.
Zhang, Zibin, Luanne Lohr, Cesar Escalante, and Michael Wetzstein. 2010. “Food versus Fuel: What Do Prices Tell Us?” Energy Policy 38 (1): 445–51.

37 Trade Policy and Food Security • http://dx.doi.org/10.1596/978-1-4648-0305-5
The Role of Biofuel Policies on Grain and Oilseed PricesHarry de Gorter, Dusan Drabik, and Erika M. Kliauga
introduction
Following three decades of decline, world grain and oilseed prices have spiked three times in six years, with comovement among commodity prices. High food prices and increased price volatility have most severely hit poor net food con-sumers in developing countries, especially those living in urban areas, along with value-added industries (dairy, livestock, and poultry) worldwide. The greatest economic and social impact is on developing nations because agriculture accounts for a sizable share of their gross domestic product and many of these economies depend heavily on food commodity trade. Food commodity price spikes—and volatility in general—resonate with the public and affect social welfare more dramatically than price volatility in other products.
Under the rubric of environmental and energy legislation in countries of the Organisation for Economic Co-operation and Development (OECD), biofuel policies contributed directly to the unprecedented price spikes in the food grain and oilseed sectors by creating the link between biofuel and food grain prices. This chapter argues that the catalyst for this new era of high and volatile com-modity markets was the dramatic increase in corn prices in October 2006. Both the U.S. ban on a fuel additive that competes with ethanol and the activation of the long dormant U.S. ethanol tax credit by unprecedented high oil prices ele-vated ethanol prices, thereby creating a direct link between ethanol and corn prices for the first time (de Gorter and Just 2008; Tyner 2008).1
Rausser and de Gorter (2012) show that in the years before October 2006, no visual link existed between corn and either oil or ethanol prices even though ethanol and oil prices more than doubled. Corn prices were basically flat over the 33 months in which oil prices rose sharply, even though corn market partici-pants were well aware corn production is energy intensive, so the observed corn price was adjusted for the higher input costs (Baffes 2007). Ethanol prices soared to a peak of US$3.65 per gallon in July 2006; they never reached that level again, however. Ethanol prices fell toward US$2.00 per gallon in early 2012
c H A p t e r 2

38 The Role of Biofuel Policies on Grain and Oilseed Prices
Trade Policy and Food Security • http://dx.doi.org/10.1596/978-1-4648-0305-5
while corn prices peaked at over four times their average level from the first 33 months of 2004–06.
Figure 2.1 summarizes how, after the market realized corn-ethanol processing capacity was to double in one year, the U.S. farm price of corn increased 88 percent (Kansas City #2 white corn price up 107 percent) in five months, causing tortilla prices to double, thereby precipitating the Mexican Tortilla Crisis in January 2007. The ensuing political anxiety led to the February 2007 ban on wheat exports by India and later by Ukraine, the beginning of many developing countries’ policy responses to come (Slayton 2009; Timmer 2008, 2010; Timmer and Dawe 2010); all these policy reactions exacerbated grain price increases (Anderson 2012; Martin and Anderson 2012).2 Finally, figure 2.1 shows the United States doubled its ethanol mandate in December 2007, at which point the high grain and oilseed price boom was in full swing.3
By August 2007, corn and ethanol prices were in lockstep, as were bio-diesel and diesel prices, and reached an equilibrium that de Gorter and Just’s
Figure 2.1 c orn prices and ethanol production c apacity
Source: Adapted from Rausser and de Gorter 2012.Note: KC = Kansas City.
0
1
2
3
4
5
6
0
2,000
4,000
6,000
8,000
10,000
12,000
14,000
16,000
Jan-0
3
Mar
-03
May
-03Ju
l-03
Sep-03
Nov-03
Jan-0
4
Mar
-04
May
-04Ju
l-04
Sep-04
Nov-04
Jan-0
5
Mar
-05
May
-05Ju
l-05
Sep-05
Nov-05
Jan-0
6
Mar
-06
May
-06Ju
l-06
Sep-06
Nov-06
Jan-0
7
Mar
-07
May
-07Ju
l-07
Sep-07
Nov-07
Jan-0
8
US$
/bus
hel
Gal
lons
(mill
ion)
Ethanol plant capacity plus under construction Corn price
Corn prices flat
Farm price of corn up 88% (KC #2 white corn up 107%)
Oct 06
Mexican tortilla crisis Jan 07
Indian wheat import ban Feb 07
Doubling of U.S. mandate in Dec 07

The Role of Biofuel Policies on Grain and Oilseed Prices 39
Trade Policy and Food Security • http://dx.doi.org/10.1596/978-1-4648-0305-5
(2008, 2009a, 2009b) theory of biofuel policy predicts (Drabik 2011). Wheat prices were pulled up by this sudden increase in corn prices right after the export bans by India and Ukraine, themselves precipitated by the skyrocket-ing corn price to its interim peak in February 2007 (having finally reacted to and become linked to high ethanol prices).4 Wheat price increases began their last leg (basically straight up) after the October 2007 rice export ban by India, moving from US$7 to US$11 per bushel in a very short time. Rice prices did not move until the Indian rice ban in October 2007. Because rice was by far the last price to react, it increased even faster than corn in March 2008. But after mid-2010, corn (and hence soybean and other oilseed) prices reemerged as the price leader and went their own way, again following crude oil prices. Not surprisingly, wheat and rice followed along because both compete for land with coarse grains and oilseeds and are substitutable in demand; for instance, wheat can be fed to livestock and rice consumers can substitute wheat in their diets (for example, in India).5
With the aid of arrows and descriptors, figure 2.2 provides an overall summary of the influence of biofuel policies. In the early period, oil prices led cereal prices for the first time (Baffes and Haniotis 2010). This hints that the current trend may be different where the link between oil and cereal prices is due to the demand for biofuels so that biofuel policies may have played a key role. Then in 2006–07, cereal prices were jolted by the corn price increase, even though cereal and oil prices went in opposite directions in that period. But as cereal prices
Figure 2.2 o il and c ereal prices
Source: de Gorter, Drabik, and Just 2013a.
0
20
40
60
80
100
120
140
160
0
50
100
150
200
250
300
US$
/bar
rel
Cere
al p
rice
inde
x
Cereal price index Oil price
Mandate premiums kick in
Oil led cereal price
Jan-03
Aug-03
Mar-04
Oct-04
May-05
Dec-05
Jul-0
6
Feb-07
Sep-07
Apr-08
Nov-08
Jun-09
Jun-10
Aug-10
Mar-11
Oct-11
May-12
Corn wakeup call onbiofuels
Wheat/rice led oil(corn at discount)
Corn/oilseeds led withpremiums
U.S. tax creditexpired and
drought
2008 U.S. financial crisis inducingbiggest economic recession since the
Great Depression

40 The Role of Biofuel Policies on Grain and Oilseed Prices
Trade Policy and Food Security • http://dx.doi.org/10.1596/978-1-4648-0305-5
flattened out in 2007, oil prices continued their steep rise. By the last quarter of 2007, cereal and oil prices were rising in lockstep. In fact, cereal prices seemingly led oil prices in 2008. This outcome can be explained as follows. Because of the wheat and rice export bans (and bad weather reducing world wheat production by 3.9 percent), wheat and rice prices actually went up faster than corn prices in early 2008.6 But the near futures prices of corn (and hence other feed grains) and soybeans (and hence other oilseeds) were locked onto each other and to the near futures prices of oil on the way up and down from their peaks in 2008 (see McCalla 2009, slides 3–5). Thus no crop supply and demand shift could have affected feed grain and oilseed prices in 2008: they were locked onto the oil price because of biofuel policies. But wheat and rice prices reacted earlier (or one could argue overreacted), given the developing-country policy responses and reduced wheat production.
After the 2008 U.S. financial crisis that caused the biggest economic depres-sion since the Great Depression (during which the Illinois farm price of corn plummeted to a low of US$3.21 per bushel—not the US$1.77 per bushel low in 2005–06 when the world was enjoying its biggest economic boom ever), corn prices, like all other crop prices, fell precipitously with oil prices. Hence, U.S. monetary and fiscal policies, devised in response to the 2008 financial crisis—which itself was induced by failed regulatory and financial policies—also substan-tially affected commodity prices and thus volatility. In the last quarter of 2008 and in all of 2009, however, oil prices declined much more than cereal prices because the huge ethanol price premiums imposed by the mandate held crop prices up. Ethanol prices (and hence corn and soybean prices) were above that dictated in the case where ethanol prices were directly linked to oil (through gasoline) prices plus the ethanol consumption subsidy (called the blender’s tax credit in the United States).
In 2010, oil prices began their march right back up again, but this time corn prices led the way with premiums imposed by the mandate. Corn (and hence all other crops that are direct substitutes in demand and compete for the same land in production) led oil prices in 2010 and beyond (as shown in figure 2.2 by the cereal price index). Corn prices could only rise because ethanol prices dictated their rise (or vice versa in 2010 onward because corn prices have more influence on ethanol prices when the mandate is binding).7 Wheat prices touched January 2005 lows in mid-2010 but quickly reversed and followed corn prices upward as oil prices began to rise and coarse grain and oilseed prices were then at a pre-mium to oil (compared to a discount in 2008) and therefore rose even faster compared with 2008. Hence, corn and oilseed prices peaked in April 2011 at a higher price than in 2008 with lower oil prices. Wheat prices followed, as did rice prices, after some hesitation during the October 2010 to June 2011 period. Although the very high ethanol price premiums caused by the mandates begin-ning in October 2008 evaporated several times, the mandate premium was at a record high in 2012 because of the expired U.S. blender’s tax credit and drought, thereby generating a large gap between the cereal price index and the oil price (figure 2.2).8

The Role of Biofuel Policies on Grain and Oilseed Prices 41
Trade Policy and Food Security • http://dx.doi.org/10.1596/978-1-4648-0305-5
A key indicator that the 2006–07 crop year was a watershed event is the sudden and unexpected outward shift in demand in terms of the relationship between the corn price and the stock-to-use ratio. Analyses by Byrd (2012) and de Gorter, Drabik, and Just (2013b) show how the market’s sudden realization of biofuels affected corn stockholding where ending stocks increased with prices in 2007–08 in anticipation of ethanol production (Carter, Rausser, and Smith 2012; Wright 2011). In all other years, stocks and prices moved in oppo-site directions, indicating any shock was treated by the market as an aberration—not as a change in mean price but rather as a one-time shock—so as prices increased, stocks were depleted. Thus, in 2007–08 the market realized that biofuels would be a permanent shift in demand; stocks increased with prices, reflecting a watershed event.
This chapter draws attention to how biofuel policies are a key driver of high and volatile grain and oilseed prices and what the key implications are for developing countries and trade. We argue that biofuels’ effect on food markets is all due to policy, although we explain later that for Brazil, ethanol may have been taxed in some situations. But we argue that without biofuel policy in OECD countries, biofuel production would not have increased dramatically. Biofuel policies vary: mandates, consumption and production subsidies (including for feedstocks), environmental regulations, import tariffs, and binary sustainability standard thresholds requiring biofuels to reduce greenhouse gas (GHG) emissions relative to gasoline.
Each of these biofuel policy categories has its own particular impact on grain prices—some fleeting, some long run, some large—especially when used in combination with other biofuel or agricultural policies within a country or across countries. It is important to understand that the effects of shocks in oil prices or grain supply depend critically on the policy determining the world commodity price (Yano, Blandford, and Surry 2010) and the nature of policy interactions within and among countries. It is also important to note that mandates and tax exemptions do not discriminate against international trade, but the other policies do, and that along with the sudden imposition of man-dates, environmental regulations, and high oil prices activating tax exemp-tions, developing countries have been unable to benefit directly from OECD countries’ biofuel policies. Multilateral rules on biofuels policies are therefore required.
The remainder of this chapter is organized as follows. The next section briefly summarizes the key biofuel policies and the methodology for analyzing their impact on crop prices, including the effect of trade discriminatory policies. The following section provides a summary of the net impact of bio-fuel policies on crop prices, given a counterfactual of the new reality of an ethanol-crop price link through biofuel demand. We conclude that the maxi-mum effect of nonbiofuel factors is around 15 percent of the corn price change. The next section summarizes the sugarcane-ethanol policy impacts in Brazil. The final section concludes and draws some implications for food security in developing countries.

42 The Role of Biofuel Policies on Grain and Oilseed Prices
Trade Policy and Food Security • http://dx.doi.org/10.1596/978-1-4648-0305-5
measuring the support and t rade Distortion c aused by Biofuel policies
The magnitude and impact of these [biofuel] subsidies is imperfectly understood, as is their relation to the reporting and monitoring … in the [World Trade Organization] … [T]ime is ripe for an initiative to clarify both the status of biofuel subsidies in the WTO rules and the magnitude of these subsidies. The alternative is continued contention and confusion.
—Josling, Blandford, and Earley 2010, p. 4–5.
This section outlines a consistent economic framework for measuring the “support” component of biofuel policies. This information can be used directly as inputs for World Trade Organization (WTO) reporting and monitoring require-ments of the Agreement on Subsidies and Countervailing Measures (ASCM); the Agreement on Agriculture (AoA), which forbids subsidies in excess of the “aggregate measurement of support” (AMS) (and where taxpayer-funded subsi-dies are only one part of “support”); and the OECD Trade Mandate on reporting “producer subsidy equivalents” (PSEs). Subsidies to biofuels and agricultural commodities need to be in compliance not only with the ASCM, but also with the AoA (where ethanol is classified as an agricultural product) to avoid chal-lenges from other WTO members (Josling, Blandford, and Earley 2010). The analysis in this section can also be used as inputs for assessing the market impacts of these subsidies, as required to determine serious prejudice (measured by changes in market share, imports displaced, or price suppression), material injury to domestic producers (thus allowing a countervailing subsidy, or nullification and impairment in any WTO dispute. Understanding the subsidy component of biofuel policies is no less important to influence debate over reforms in domestic biofuel policies and to inform the public of the causes for escalating food grain commodity prices.
Measuring the subsidy component of biofuel policies is not as straightforward as measuring this component for traditional policies, however, because of links to oil markets, the complex interaction effects between different agricultural and biofuel policies, and the way in which international biofuel prices are determined (de Gorter and Just 2010b; Drabik 2011; Kliauga, de Gorter, and Just 2011).
We address issues in the following categories:
1. What is the subsidy or support component? This is analogous to determining the level of an import tariff, a production subsidy, or a dumping margin in traditional analysis for WTO monitoring purposes. No consideration is made for market effects or for redundancy (an example of redundancy is the WTO does not consider “water” in tariffs).9 Should ethanol be part of the AMS? And should the AoA’s wording—“measures directed at agricultural processors shall be included to the extent that such measures benefit the producers of basic agricultural products”—be interpreted to mean ethanol subsidies help U.S. corn producers directly and so should be included as part of the U.S. AMS? But the benefit to corn producers derived from an ethanol policy is not a concern of the WTO’s ASCM.

The Role of Biofuel Policies on Grain and Oilseed Prices 43
Trade Policy and Food Security • http://dx.doi.org/10.1596/978-1-4648-0305-5
2. What is the rate of protection? The OECD does adjust policy measures into “protection equivalents.” For example, water in the tariff is netted out by calcu-lating actual rates of protection through comparing domestic and world prices.
3. What is the market impact? Answering this question requires performing eco-nomic modeling where the data collected under the first two items are pro-cessed further to determine the magnitude of serious prejudice, material injury, or nullification and impairment.
Categories 1 and 2 are analogous to current reporting requirements in the ASCM and AoA and in OECD PSE measures. The third category of issues involves standard procedures of measuring market impacts required to resolve disputes in domestic trade remedy laws or in WTO dispute settlement body determinations.
The first category does not typically require the simulation of an economic model of the market (but it may be required for the analysis of biofuel policies); it uses observed data only. Therefore, unlike the issues in category 3, no counter-factuals are required. Category 2 lies somewhere in between the other two cat-egories where some adjustment is made to the data calculated in category 1 to include only that part of the policy that has a market effect (without actually measuring the market effect). As we show later, the last is very important in the case of analyzing biofuel policies because we show there is water in the ethanol price premium because of biofuel policies.
Before providing the framework of analysis, we first explain the various cate-gories of biofuel policies, given the new and unique role of energy and environ-mental policies in linking biofuel prices to crop prices. Those policies that significantly affected the crop market include
• Biofuel consumption subsidies, such as the U.S. federal tax credit (imple-mented in 1978) that expired at the end of 2011, or tax exemptions at the fuel pump in most other countries (for example, the European Union [EU]). The federal tax credit provides a per gallon subsidy to firms that blend biofuels with gasoline for end consumption and results in a higher biofuel price.
• Formal biofuel consumption blend mandates, such as that implemented by the U.S. Energy Independence and Security Act of 2007. A blend mandate is a requirement that, at minimum, a certain percentage of fuel consumed be biofuels.
• Informal mandates for ethanol in the form of environmental regulations, for example, U.S. environmental policy on air pollution and the ban on the use of the fuel additive methyl tertiary butyl ether (MTBE). MTBE, although a low-cost and close substitute to ethanol as a fuel oxygenator, pollutes water supplies.
• Production subsidies for both biofuels and feedstocks (for example, for corn).• Import tariffs and tariff-rate quotas, such as the US$0.54 per gallon ethanol
import tariff (implemented in 1980) that expired at the end of 2011 or the stiff EU ethanol import tariffs, which still remain in place.

44 The Role of Biofuel Policies on Grain and Oilseed Prices
Trade Policy and Food Security • http://dx.doi.org/10.1596/978-1-4648-0305-5
• Binary 0,1 sustainability standards, such as the standard according to which one (energy-equivalent) gallon of corn-ethanol is required to reduce GHG emissions by 20 percent relative to the gallon of gasoline it is assumed to replace or it cannot be counted as a biofuel in the mandate.
Various U.S. biofuel policies have interacted both with each other and with biofuel policies in the rest of the world. The economics of commodity price volatility have become more complex; the interaction effects now depend not only on the source of the shock (oil prices versus crop supply and demand shocks) or on which biofuel policy determines the world biofuel market price (for example, tax credit versus mandate), but also on the interactions across the various environmental, energy, and agricultural policy instruments within a country as well as across countries. We argue the food grain price volatility may have had as much to do with policy regime changes within or across countries, because of market shocks or individual policy changes, as with shocks in either oil prices or crop markets for a given policy regime. Although higher food grain commodity prices means the subsidy component of traditional agricultural policies is lower, the interaction effects of agricultural, energy, and environmen-tal policies are unique, thereby affecting price volatility.
The centerpieces of most countries’ biofuel policy portfolio are blend mandates and biofuel consumption subsidies (called blender’s tax credits in the United States and fuel tax exemptions at the retail gasoline and diesel pumps in most other countries). A biofuel mandate or biofuel tax credit, by itself, does not discriminate against international trade in biofuels or the bio-mass feedstock. In other words, a mandate that raises the price of ethanol in the United States does not adversely affect Brazilian ethanol or sugarcane producers (nor would a tax credit adversely affect Brazilian producers). Subsidies are not specific to feedstock and biofuel producers—every corn (and sugarcane and wheat) producer in the world would benefit from a U.S. blender’s tax credit.
Biofuel feedstock production subsidies can act as a subsidy for domestic bio-fuel production, thereby adversely affecting other biofuel producers. For exam-ple, a corn production subsidy adversely affects ethanol producers in Brazil as well as sugarcane producers but not a Canadian ethanol producer using corn. Therefore, production subsidies for the feedstock (for example, corn) discrimi-nate against trade in biofuels only for those countries that use another feedstock for ethanol.
Biofuel production subsidies also provide support to feedstock producers in the form of higher prices but are not trade discriminatory in the feedstock. However, an ethanol production subsidy adversely affects not only gasoline and oil producers, but also other biofuel producers; for example, U.S. ethanol subsi-dies adversely affect ethanol producers in Brazil.
A tax credit (or exemption) with a binding mandate does the opposite of what would be expected: it subsidizes fuel consumption, most of which is gasoline

The Role of Biofuel Policies on Grain and Oilseed Prices 45
Trade Policy and Food Security • http://dx.doi.org/10.1596/978-1-4648-0305-5
(diesel), and so increases gasoline prices (de Gorter and Just 2010b). Likewise, corn and ethanol production subsidies subsidize fuel (that is, ethanol and gasoline) consumption. Regardless of either the tax credit or the mandate determining the ethanol market price, a corn production subsidy reduces both ethanol and corn market prices. The situation differs, however, for the ethanol production subsidy where the ethanol market price decreases, but the corn price increases.
If the market price of the biofuel is determined outside the country, then a biofuel consumption subsidy in the form of a tax credit (as was the case in the United States) subsidizes the export of the biofuel (this does not happen if a tax exemption existed instead).10 Neither an exemption nor a blender’s tax credit discriminates against international trade in specific circumstances: for example, in the world biodiesel market, the U.S. blender’s tax credit is a production subsidy. In theory, a tax credit is not specific because the other countries, for example, the European Union (EU), can—and did—get the U.S. blender’s tax credit. But transaction costs might have prevented most EU production from being able to get the tax credit, so it was a de facto specific subsidy.
To ease the understanding of the complexities of market effects of biofuel policies, we first analyze them at a national level and then proceed by includ-ing their interaction effects at an international level. The latter effects can result, for example, from where (and how) the biofuel price is determined or from policy regime switching within a country or across countries (for exam-ple, because of market shocks or changes in biofuel policy somewhere in the world).
National-Level EffectsBiofuel mandates usually take the form of formal blending requirements for a biofuel in the final fuel blend (that is, ethanol and gasoline or biodiesel and diesel). But environmental regulations in the United States resulted in an infor-mal (de facto) ethanol blend mandate. Biofuel consumption subsidies are imple-mented as biofuel tax credits in the United States and as tax exemptions at the pump level in other countries. In a closed economy (the focus of this subsection), the market effects of tax credits and exemptions are identical—they increase the market price of the biofuel above the gasoline and diesel price by the amount of the subsidy—but the effects differ in an open economy framework (see the discussion in the next subsection).
By exerting upward pressure on biofuel and feedstock prices, biofuel policies support the biofuel and agricultural sectors both domestically and internation-ally. To analyze and quantify the support to corn producers owing to biofuel policies, one needs to start with how ethanol prices, determined by biofuel poli-cies, affect corn prices.11 Recently, de Gorter and Just (2008, 2009a) and Lapan and Moschini (2012) have theoretically determined, and Drabik (2011), Cui and others (2011), and Mallory, Irwin, and Hayes (2012) have empirically veri-fied, that the link between ethanol and corn prices holds regardless of the bind-ing biofuel policy (a mandate or a tax credit) and that a US$0.01 per gallon

46 The Role of Biofuel Policies on Grain and Oilseed Prices
Trade Policy and Food Security • http://dx.doi.org/10.1596/978-1-4648-0305-5
increase in the ethanol market price results in approximately a US$0.04 per bushel increase in the corn price.
Now that we can quantify the effects of a biofuel policy, we need to determine the ethanol market price that would exist without ethanol policies. Because of a lower energy content, the mileage obtained from 1 gallon of ethanol is only 70 percent of that obtained from 1 gallon of gasoline. If consumers value ethanol and gasoline according to miles traveled, and if they are free to choose between ethanol and gasoline, then the market price of ethanol in U.S. dollars per gallon that consumers are willing to pay (and be indifferent to purchasing a gallon of gasoline) is substantially less than the price of gasoline for two reasons: the lower mileage per gallon from ethanol and the volumetric fuel tax, which represents a penalty to blenders. That is, blenders have to pay the tax, but consumers are willing to pay only a fuel tax on ethanol proportional to its mileage per gallon, which is only 70 percent of the fuel tax.
With the definition of the “no-policy” ethanol price, we are in a position to define the ethanol price premium as the difference between the observed and the no-policy ethanol market price. The average ethanol price premium in 2008–11 was US$0.81 per gallon, or 59 percent above the average US$0.51 per gallon (federal plus state) tax credits. This means mandates were binding on average for each year and hence on average for the period.12
This ethanol price premium is very high, but not all of it results in a direct increase in corn prices because of water in the ethanol price premium.13
Water averaged 61 percent of the ethanol price premium generated by poli-cies and 44 percent of the observed corn price in the 2008–11 period.14 Combining the effects of water and the reduced price of gasoline (and hence in oil and ethanol market prices) owing to ethanol supplies (all due to policy), then the net support to corn producers averaged US$1.21 per bushel,15 much lower than the average ethanol price premium of US$3.15 per bushel (Drabik 2011).
If there had been no water, the entire ethanol price premium would have gone to ethanol and corn producers. Estimates of this hypothetical transfer to corn producers averaged US$39 billion per year (Drabik 2011). Overall, the gross corn producer support equivalent reached US$155 billion over the period under analysis. But because water tempered the corn price, increasing the effect of the ethanol price premium, the net corn support equivalent averaged only US$15 billion per year, for a total of US$59 billion over the period.
An unresolved issue is what number would be reported to the WTO’s AMS and be included in the OECD’s PSE. Would water be netted out? Clearly, the taxpayer costs are a poor indicator of the support received by ethanol and corn producers.
The influence of U.S. ethanol policy is large. The next question becomes, if all crop prices move together because of substitution in demand and competition for land, was U.S. ethanol policy, which tied corn prices to oil through the tax credit, the major driver of all crop prices? In the 2008 price run-up, corn and soybean near futures prices were very closely tied to near futures prices of oil (McCalla 2009). Clearly, the U.S. ethanol tax credit was linking corn to oil prices,

The Role of Biofuel Policies on Grain and Oilseed Prices 47
Trade Policy and Food Security • http://dx.doi.org/10.1596/978-1-4648-0305-5
and we would expect a tight link between corn and soybeans because of the competition for land and the nature of their feed demands. Hence, any change in biodiesel production on land use will have one-to-one effects on oilseed and corn prices and vice versa for corn-ethanol production on oilseed prices. Although the volume of total biofuel production in OECD countries (excluding U.S. corn-ethanol) is only half that of U.S. ethanol production, this OECD biodiesel production requires much more land area per gallon of biofuel yielded (for example, wheat for ethanol or rapeseed and soybeans for biodiesel). As a result, biodiesel production has a disproportionate impact on food grain prices.
Although the preceding quantitative estimates implicitly include the effects of all four biofuel policies—that is, a mandate, a tax credit, and each of ethanol and corn production subsidies—the particular effects of consumption and production subsidies in conjunction with a binding mandate have not been spelled out. As shown in Drabik (2011), a common feature of all three subsi-dies listed is to reduce the consumer fuel price, which implies higher fuel (mostly gasoline) consumption. Given a fixed blend requirement, higher fuel consumption results in a higher need for gasoline to complement a higher volume of ethanol. Notice, however, that the three policies do not result in identical market effects.
Because the ethanol price is determined by the mandate, the tax credit’s effect on the ethanol price is small. But to obtain the tax credit and increase their market share, blenders lower the price of fuel to consumers until the benefits of the tax credit in the form of windfall profits are completely dissipated. Thus, the tax-payer’s money collected for the tax credit becomes a transfer to fuel consumers and gasoline producers. Gasoline producers gain from higher production. Being directly linked to the ethanol price, the corn price also increases when a tax credit is combined with a binding mandate, though this increase is likely very small.
Corn and ethanol production subsidies affect the fuel price through a differ-ent channel. They both reduce the marginal cost of ethanol production, but in addition, corn production subsidies generate more of less expensive corn for ethanol producers. Because the marginal cost of ethanol production declines, blenders see a lower ethanol price. In the case of the corn production subsidy, the lower ethanol price for blenders coincides with the one received by ethanol pro-ducers, which is directly linked to the corn price. The ethanol production subsidy drives a wedge between the market price of ethanol (faced by fuel blenders) and the ethanol producer price, however. Hence the ethanol price increases, as does the corn price.
Finally, how do biofuel policies affect the impact of alternative production subsidies on corn prices? If a tax credit is binding, corn production subsidies have minimal effects on corn prices because any impact has to go through oil prices, but under a mandate, corn prices fall by almost 50 percent more than if no biofuel policy existed (Drabik 2011). In contrast, an ethanol production subsidy alone is not large enough to bridge the existing water and only negligi-bly increases corn prices when used in combination with the mandate (which determines the ethanol and hence corn price). However, the ethanol

48 The Role of Biofuel Policies on Grain and Oilseed Prices
Trade Policy and Food Security • http://dx.doi.org/10.1596/978-1-4648-0305-5
production subsidy has a full effect in increasing corn prices (and has no impact on ethanol prices) when used in combination with a binding tax credit because the subsidy drives a wedge between ethanol producers’ and blenders’ prices.
Cross-Country InteractionAlthough a tax credit and tax exemption have identical effects in a closed economy, their effects differ in an open economy, depending on where and how the world biofuel price is determined. This factor poses an important question: What effects do the tax credits or tax exemptions have in the countries that do not determine the world price? Either policy (a tax exemption or a tax credit) in the price-determining country is an actionable subsidy by itself, from the point of view of oil producers (but not for biofuel producers, because biodiesel produc-ers gain worldwide). The reason is that either the tax exemption or the tax credit, depending on which determines the world market price, increases the market price of a biofuel; hence, its production is above a level that would have other-wise existed.
If we assume a two-country world, the question now becomes whether a tax credit (tax exemption) in the other country is also necessarily an actionable subsidy. Not always, as de Gorter, Drabik, and Just (2011) explain. The reason is that once the world market price of a biofuel is established by country A, a tax credit or a tax exemption in country B cannot affect it, but acts as a production subsidy in the case of a tax credit and fuel consumption subsidy with a tax exemption. Therefore, if country B has a tax credit, then it is an actionable sub-sidy, but a tax exemption is not (oil producers can even benefit from it because fuel consumption increases, as does consumption of diesel). Furthermore, if country B has a tax credit (as was the case with the United States and the “splash and dash” program), it expands biofuel exports because of increased biodiesel production and imports from third countries that are “splashed” and then “dashed” to country A (the EU). If the United States determined the world bio-diesel price (country A in this case) through a tax exemption, then the EU tax exemption would subsidize fuel consumption and have little (or no) effect on U.S. biodiesel prices. In contrast, if the EU had a tax credit, it would subsidize biodiesel production.
One implication of the preceding discussion is that the entire “splash and dash” controversy would not have existed had the EU switched its tax exemption to a blender’s tax credit, or had the United States switched its tax credit to a tax exemption. Thus, no country could “double dip.”
An example of the complexities of the mutual interaction effects of interna-tional biofuel policies is the Canadian “triple dipping” during the EU–U.S. “splash and dash” trade dispute: first, by getting the Canadian biodiesel production sub-sidy; second, by exporting biodiesel to the United States, where it obtained the U.S. tax credit after a shipment had been “splashed” with less than 1 percent diesel; and third, by then exporting to the EU where the Canadian producers enjoyed the third benefit—the EU biodiesel tax exemption. Not surprisingly, Canada exported all of its biodiesel production. We give another example of the

The Role of Biofuel Policies on Grain and Oilseed Prices 49
Trade Policy and Food Security • http://dx.doi.org/10.1596/978-1-4648-0305-5
importance of interactions of policies across countries in the later discussion of Brazil’s sugarcane-ethanol situation.
Trade Barriers to BiofuelsThe United States has never been a major importer of sugarcane-ethanol from Brazil, despite the significant cost and comparative advantages in ethanol produc-tion that Brazil enjoys. This is largely because the United States (and the EU) had a bevy of trade discriminatory policies that have been in place for more than 30 years. These import barriers included hefty import tariffs and tariff rate import quotas (Jank and others 2007; Kojima, Mitchell, and Ward 2007).
These import barriers are inconsistent with both energy and environmental goals. Brazil is currently the least-cost supplier of ethanol. Moreover, sugarcane-ethanol contributes far more in reducing GHG emissions than corn-based ethanol. Costs of production are lower (twice the amount of ethanol is produced per hectare), and crops displaced by U.S. ethanol production have to be produced elsewhere (for example, corn yields in Brazil are significantly less than those of the United States). In addition, annual net sequestration per hectare is much higher in Brazil.
When ethanol prices increased sharply in 2006 because of the MTBE ban, and higher oil prices had activated the tax credit, Brazil was unable to fill the demand because of the perennial nature and long production cycle of sugarcane. (Increasing sugarcane production takes time and significant investment, not to mention the lack of investment to develop the infrastructure in Brazil necessary to carry ethanol to Brazilian ports.16) Meanwhile, U.S. corn-ethanol production increased sharply as corn farmers simply grabbed land from other uses to increase supply immediately. The lesson here is that long-run trade-distorting policies have short-run trade and economic welfare implications.
Also important is that tariffs have short-run effects on commodity prices, too. Because the EU has an overall mandate and differential import tariffs for ethanol and biodiesel, ethanol prices are too high relative to biodiesel. Although the United States does not have differential tariffs any longer, it has a specific man-date for biodiesel, so the price of biodiesel is about twice that of ethanol. This mandate further distorts commodity markets because too much land is devoted to oilseeds for the production of a more inefficient biofuel.17
Binary Sustainability StandardsThe binary sustainability standards have also had market effects, with the EU currently arguing that U.S. biodiesel from soybean oil does not meet its standard, while accepting Argentinean biodiesel from soybean oil and U.S. corn-ethanol. This happens even though the U.S. Environmental Protection Agency admit-ted that U.S. corn-ethanol does not meet the EU sustainability standard of a 30 percent reduction on GHG emissions. Interestingly, this all occurs despite the fact that Argentina has differential export taxes on soybeans, soybean oil, and biodiesel, thus effectively subsidizing biodiesel exports. Both the United States and the EU disallow use of palm oil as biodiesel, but the United States allowed

50 The Role of Biofuel Policies on Grain and Oilseed Prices
Trade Policy and Food Security • http://dx.doi.org/10.1596/978-1-4648-0305-5
palm oil as part of the “splash and dash” scheme for exports to the EU (de Gorter, Drabik, and Just 2011). All of this has increased rapeseed oil prices and its price premium vis-à-vis both soybean and palm oil. Canada now plants more land to rapeseed than to wheat. Argentina’s biodiesel also does not fulfill the U.S. stan-dard, but it meets the EU one, allowing the EU to import biodiesel from Argentina. Moreover, the EU bars genetically modified canola oil–based biodiesel from Canada and the United States. The EU either imports biodiesel or the veg-etable oil that replaces the domestic rapeseed oil used in EU biodiesel produc-tion, thereby having dubious effects on EU energy security. Hence, binary biofuel standards, when combined with other policies, have introduced a variety of market distortions and created trade that would not have occurred otherwise.
Binary sustainability standards are often ineffective because they can be cir-cumvented by shuffling and leakage. Sustainability standards induce shuffling because incentives are given for ethanol producers to use relatively clean inputs (for example, natural gas) while the dirtier inputs (for example, coal) that might otherwise have been used are simply used by other producers to make products not covered by the sustainability standard. With shuffling, neither the location nor the costs of production change, but the sustainability standard is nevertheless nominally met. The standard is thus ineffective because it simply drives dirtier fuels to other uses rather than forcing them from the market entirely. International shuffling also occurs: Indonesia may export sustainable biodiesel and consume unsustainable biodiesel at home, or California may purchase Brazilian ethanol to comply with its low-carbon fuel standard while the rest of the United States purchases Midwestern ethanol, which has a higher carbon footprint. Expanding measures of indirect land use change to account for all indirect changes should mean measuring the indirect output use change as well (de Gorter 2010; Drabik, de Gorter, and Just 2010).
Sustainability standards would be illegal under WTO law because they dis-criminate between domestic and imported products based on the processes or production methods used to produce them. This is a prima facie violation of WTO rules, imposing a burden on the United States to bring the ethanol sustain-ability standard within the exception for trade laws protecting the environment under article XX (g) of the General Agreement on Tariffs and Trade (de Gorter and Just 2009c). This burden is not always easy to meet, because the United States may not survive a legal challenge under the “chapeau” of article XX, which requires the U.S. standard not to constitute arbitrary or unjustified discrimination or a disguised restriction on international trade and to be least trade restrictive (Harmer 2009; Switzer and McMahon 2010).
t he impact of Biofuel policy c ompared to o ther “perfect storm” Factors
The literature on the role of biofuel policies on the level of grain and oilseed prices takes very different approaches and reaches a wide range of conclusions.18 The most popular view is that the food grains price boom from 2006 onward was

The Role of Biofuel Policies on Grain and Oilseed Prices 51
Trade Policy and Food Security • http://dx.doi.org/10.1596/978-1-4648-0305-5
due to a “perfect storm” of many factors of which biofuels was merely one.19 Another burgeoning strand of literature analyzes the dynamic links between crop, biofuel, and energy prices using statistical time-series models to determine the influence of higher energy prices on crop prices.20 These reduced-form time-series analyses do not identify the key periods in the process of biofuel policies linking crop prices to biofuels and in the link between biofuel and gasoline and diesel prices, so any conclusions reached in this literature are of limited value. This literature so far has been unable to control for the switch in regimes between biofuel policies within a country21 or across countries. A third strand of literature argues that biofuel policies play a much bigger role; this literature uses specialized models that closely look at the biofuel policy that is binding and the specific relations between the gasoline (diesel), biofuel, and feedstock or crop prices domestically and internationally (see, for example, de Gorter 2008; de Gorter and Just 2010a; and de Gorter and Drabik 2012a, 2012b). We take this approach in this chapter.
Each of the various biofuel policies discussed in the previous section affected corn prices but did so through different channels at different times and magnitudes. The key to understanding how these biofuel policies did and do affect grain commodity prices is to recognize the link between ethanol and corn prices (and between biodiesel and soybean oil prices). Ethanol prices can be linked to gasoline prices either directly (through a tax credit) or indirectly (through mandated premiums above the tax credit). Gasoline prices, in con-trast, are a direct function of oil prices. Understanding the corn-ethanol price multiplier of four discussed previously is extremely important (although tem-pered somewhat by water representing the distance by which the intercept of the ethanol supply curve is above the free market ethanol price).22 This coef-ficient is the key driver for corn prices and, because all grains and oilseeds compete for the same land and are substitutable in demand, for all grain and oilseed prices.23
The theoretical model linking corn and ethanol prices as summarized in Drabik (2011) predicts very well with only three periods where corn prices are overpredicted, each mostly because of constraints in ethanol processing capacity (de Gorter, Drabik, and Just forthcoming). This means corn price volatility was moderated, compared with what otherwise would have been the case. Note that these three periods (a) occurred when the ethanol price premium over the tax credit was rising, and (b) were followed immediately by a period of a gasoline price higher than the ethanol price. Hence, ethanol was relatively overvalued, thereby generating the constraints in the first place.
Now the issue becomes how much of the change in corn prices was due to perfect storm factors other than biofuel policies? Clearly, when the corn price is tied to the oil price with the tax credit, no crop supply and demand shift could have affected corn prices except for changes in oil prices (through the gasoline price). So the maximum effect perfect storm factors (other than biofuel policy) could have had was to eliminate the ethanol price premium (in U.S. dollars per bushel) that was caused by the mandate. Any premium above the tax credit

52 The Role of Biofuel Policies on Grain and Oilseed Prices
Trade Policy and Food Security • http://dx.doi.org/10.1596/978-1-4648-0305-5
allows shifts in supply and demand curves to affect corn prices (until the mandate premium disappears, after which the corn price is solely determined by oil prices and the tax credit). So the maximum effect of perfect storm factors (all factors other than U.S. ethanol policy) is US$0.53 per bushel, or 12.3 percent of the average corn price in this period (see de Gorter, Drabik, and Just 2013a). This outcome is because the difference between the actual corn price and that if the tax credit was the only binding policy is US$0.53 per bushel.24 This represents the maximum contribution to corn prices of all other (non–U.S. ethanol policy) market factors.25
Another consideration is that the calibrated supply and demand curves for corn incorporate effects of biofuel policies everywhere else. The corn supply curve and nonethanol demand curve shift up because of other U.S. and rest-of-world biofuel policies, thereby overestimating the intercept of the corn-ethanol supply curve and so underestimating the effect of U.S. ethanol policy on corn prices. For example, U.S. biodiesel policy causes land to be pulled out of corn into soybeans, thus causing the nonethanol corn price to rise. The preceding estimate of a 43 percent increase in corn prices for 2010 (from US$2.67 per bushel to US$3.83 per bushel) is underestimated because other biofuel policies (including those in the rest of the world) have caused the counterfactual corn price with no U.S. ethanol production to be higher than would otherwise have been the case. However, if a mandate price premium existed, it, too, could have been lowered, so the net effect may not be so big in times of high mandate premiums.
How wheat and rice prices follow coarse grain and oilseed prices will depend on the length of run of analysis, the ability to switch between different products in consumption, and the competition for land and other inputs. Coarse grains and oilseeds account for 59 percent of total world crop area, and adding wheat brings the total to 83 percent. One would expect wheat to be tightly linked to both corn (and coarse grains in general) and oilseed prices because of both competi-tion for land and substitutability in demand. But the link between rice and coarse grain and oilseed prices would be expected to be weaker in the short run, although more wheat is consumed in some developing countries than rice, so rice prices are also expected to follow other crop prices to some extent.
What conclusions can we draw from this qualitative empirical analysis? Was biofuel policy not only the key instigator of grain and oilseed prices, but given the covariability in grain and oilseed prices, also the major contributor to price levels? Part of the answer depends on (a) how much the developing-country policy response that hit the rice market especially hard (plus panic and speculation) was due to coarse grains and oilseeds tied directly to oil prices that became especially tight after September 2007, and (b) how much of the wheat market moves were independent of the coarse grains and oilseeds market and hence of biofuel policy influence. This controversy will never be completely resolved or a consensus obtained in the economics profession, but the argument put forward in this chapter is that biofuel policies were and continue to be a major force affecting the level, and especially the volatility, of grain and oilseed prices.

The Role of Biofuel Policies on Grain and Oilseed Prices 53
Trade Policy and Food Security • http://dx.doi.org/10.1596/978-1-4648-0305-5
t he r ole of sugarcane-ethanol in Brazil on Grain and o ilseed prices
Mitchell (2008) argued correctly that sugarcane-ethanol production (and hence policy) in Brazil—regarded as the lowest-cost producer of ethanol in the world—had little influence on grain and oilseed prices. But that all changed in mid-2009 when Brazil’s market price of ethanol surpassed that in the United States, and by mid-2010 Brazil was a major importer of ethanol from the United States. Sugar prices became linked with grain and oilseed prices for the first time.
Brazil’s ethanol exports peaked at almost 20 percent of its production in the 2008–09 crop year, but net exports have collapsed since.26 The reasons for the high ethanol prices in Brazil include strong domestic demand for ethanol, world-record sugar prices, bad weather affecting the sugarcane harvest, revaluation of the Brazilian currency, and high costs of expanding sugarcane production in the near term (de Gorter, Drabik, and Just forthcoming). Some argue Brazil’s ethanol policies are to blame, but the analysis by de Gorter, Drabik, and Just (forthcom-ing) shows that although removal of all policies will reduce ethanol prices signifi-cantly, Brazil’s policy changes in recent years had small market effects.27
High demand and short supply are reflected in the patterns of consumption over time: gasoline consumption in Brazil increased by 2 billion liters from 2000–01 to 2009–10, but ethanol consumption increased a whopping 24 billion liters. Since 2009, however, ethanol consumption has declined almost 20 percent. Recently, about 50 percent of total consumption of gasoline and ethanol in Brazil has been ethanol, compared with 10 percent in the United States.28 In 2008, U.S. per capita fuel (gasoline and ethanol combined) consumption was 18 times larger than that of Brazil. Achieving a 50 percent share of ethanol in the fuel mix will be difficult if Brazil’s economy continues to grow and investment in ethanol production is curtailed.
This difficulty is reflected in the trends shown in figures 2.3 and 2.4. After the 2008 financial crisis, Brazil’s expansion in sugarcane production has stagnated,
Figure 2.3 sugarcane production in Brazil over the past Decade
Sources: UNICA (Brazilian Sugarcane Industry Association), http://english.unica.com.br/, and MAPA (Ministério da Agricultura, Pescuária e Abastecimento), http://www.agricultura.gov.br/.Note: e = estimate.
0
100
200
300
400
500
600
700
Rapid expansion:
10.4% per year
Stagnation
2000/01
2001/02
2002/03
2003/04
2004/05
2005/06
2006/07
2007/08
2008/09
2009/10
2010/11
2011/12
2012/13e
Tons
(mill
ion)

54 The Role of Biofuel Policies on Grain and Oilseed Prices
Trade Policy and Food Security • http://dx.doi.org/10.1596/978-1-4648-0305-5
and investments in new sugarcane processing plants have almost come to a halt. The industry estimates that, on average, 12.5 plants need to be constructed between 2014 and 2020 to fill projected ethanol demand (88 new mills by 2020). To maintain world market share in sugar, given sugar’s projected demand growth, Brazil will need an additional 32 mills by 2020. Sugarcane production must more than double in this period.
Beginning in 2010, the United States became a significant net exporter of ethanol and the leading exporter of ethanol, even to Brazil. World ethanol prices were determined on the margin in the EU and Brazil. The U.S. tax credit acted as a production subsidy for U.S. ethanol but in the form of higher market prices for ethanol (de Gorter, Drabik, and Just 2011; Kliauga, de Gorter, and Just 2011). So the tax credit had a very special effect for 2010 and 2011, after which it expired.
The various tiers of binary sustainability standards, each with its (extremely arbitrary) GHG reduction requirement, have introduced a variety of market distortions and created trade patterns that would not have occurred otherwise. For example, the United States imports ethanol from and exports it to Brazil, often using the same ship (called the “Houston shuffle”), because sugarcane-ethanol is eligible for both the advanced ethanol standard and California’s low-carbon fuel standard, which command price premiums even though ethanol from any source is an identical product.29 Since June 2012, Brazil exports corn to the United States, and it is expected to export soybeans in the near future.
The importance of the EU trade policy, the U.S. tax credit, and the change in Brazil’s market situation is illustrated in figure 2.5. Brazilian and U.S. ethanol
Figure 2.4 evolution of the number of new ethanol production Facilities in c enter-s outh Brazil
Source: UNICA (Brazilian Sugarcane Industry Association), http://english.unica.com.br/.Note: e = estimate.
Num
ber o
f fac
ilitie
s
2005/06
2006/07
2007/08
2008/09
2009/10
2010/11
2011/12
2012/13e
5
0
10
15 High levels of in
vestment
20
25
30
35

The Role of Biofuel Policies on Grain and Oilseed Prices 55
Trade Policy and Food Security • http://dx.doi.org/10.1596/978-1-4648-0305-5
prices followed each other and the U.S. gasoline price until November 2011 when the EU closed the tariff loophole and the U.S. tax credit expired at the end of December 2011. Both U.S. and Brazilian ethanol prices dove, with the spread increasing (because the tax credit expired), and broke away from the U.S. gaso-line price. The connection between ethanol prices in Brazil and the United States links sugar prices to corn prices. By May 2012, Brazil no longer imported U.S. ethanol, and prices converged again. Developments after June 2012 are related to the U.S. drought. But figure 2.5 illustrates how changes in biofuel policies and their interaction significantly affect grain and oilseed prices. This has been the story all along since that fateful month of October 2006.
c oncluding r emarks
This chapter offers an explanation of the recent surge in world grain and oilseed prices and its implications for developing countries. Biofuel policies in the key biofuel-producing economies—the United States, the EU, and Brazil—have led these unprecedented price increases. We have shown comovement between ethanol, corn, and other grain and oilseed prices since October 2006.
Figure 2.5 evolution of U.s. and Brazilian ethanol prices since s eptember 2010
Sources: CEPEA (Centro de Estudos Avançados em Economica Aplicada), Indicator Mensal Ethanol Anhydrous and Hydrous, http://www.cepea .esalq.usp.br/etanol/?page=407, and Nebraska Energy Office, Ethanol and Unleaded Gasoline Average Rack Prices, http://www.neo.ne.gov /stateshtml/66.html; U.S. Energy Information Administration, http://www.eia.giv/dnav/pet/hist/LeafHandler.ashx?n=PET&s=EER_EPMRU_PF4 _Y35NY_DPG&f=M.Note: Value for April 2011 was trunked to equal March R$1.60/liter (actual value was R$4/liter); EU = European Union.
0.70
0.80
0.90
1.00
1.10
1.20
1.30
1.40
1.50
1.60
1.70
1.80
1.90
0.40
Sep-10
Oct-10
Nov-10
Dec-10
Jan-11
Feb-11
Mar-11
Apr-11
May-11
Jun-11
Jul-1
1
Aug-11
Sep-11
Oct-11
Nov-11
Dec-11
Jan-12
Feb-12
Mar-12
Apr-12
May-12
Jun-12
Jul-1
2
Aug-12
Sep-12
0.60
0.80
1.00
1.20
1.40
1.60
1.80
Brazilian ethanol price U.S. ethanol price U.S. gasoline price
Etha
nol (
R$/li
ter)
Etha
nol a
nd g
asol
ine
(US$
/lite
r)
U.S. tax credit expires end 2011
EU closes tariff loophole

56 The Role of Biofuel Policies on Grain and Oilseed Prices
Trade Policy and Food Security • http://dx.doi.org/10.1596/978-1-4648-0305-5
We document a large ethanol-to-corn price multiplier: every US$0.01 per gallon increase in the ethanol price results in about a US$0.04 per bushel increase in the corn price.
Because the existing U.S. biofuel policies—mandates, tax credits, and ethanol and corn production subsidies—generate a significant ethanol price premium over the no-policy ethanol price, this high premium should be reflected in a considerable rise in corn prices. However, this expected increase is not consistent with the observed market realities. We argue that discrepancy exists because some of the ethanol price premium is used just to get ethanol production started; in other words, we find a significant gap between the ethanol free market price and the intercept of the ethanol supply curve (termed water in the ethanol price premium) in each year of the period analyzed period—2008–11. The implication is that corn prices could have increased even more under a different market constellation (for example, if oil prices had been higher or the corn price with no ethanol production was lower).
The magnitude of the ethanol price premium critically depends on which biofuel policy is binding (that is, a mandate or a tax credit or tax exemption) and what other policy instruments accompany the binding policy (for example, an ethanol or corn production subsidy). With a binding mandate, we show that all other subsidies support the consumption of fuel, most of which is gasoline. However, the market effects of individual subsidies differ under a binding man-date. For example, an ethanol production subsidy by itself has no effect on the ethanol price, and thus the corn price, because under the observed market reality an ethanol production subsidy by itself has been unable to generate any ethanol production. Under a binding tax credit, the ethanol production subsidy is found to increase corn prices by about US$0.51 per bushel but has hardly any effect if the mandate is binding. In contrast, a corn production subsidy by itself reduces corn prices by US$0.05 per bushel (if ethanol is not produced) but reduces corn prices even more if a mandate is binding by US$0.07 per bushel (but has hardly any effect if the tax credit is binding).
We argue that the biofuel policies’ interactions (especially the mandate versus the tax credit) critically affect the volatility of grain and oilseed prices because of oil price or grain supply shocks. For instance, when a tax credit or tax exemption is binding, the corn price is directly linked to the oil price and any supply and demand shocks in the grain and oilseed market have no effect unless they cause the mandate to be binding. Alternatively, when the mandate is binding in the United States, an increase in oil prices reduces ethanol (and hence corn) prices, and supply and demand shocks in the crop sector now matter. The effects of these shocks on prices are exacerbated because corn stocks are lower and the storage supply curve is steeper. We argue low stocks and steeper storage supply curves are due to the unexpected effects of biofuel policies. Hence, the econom-ics of crop price volatility have become increasingly complex, with biofuel policy playing the central role.
In addition to analyzing the market and interaction effects of biofuel policies at the national level, focusing mostly on the United States, we have examined

The Role of Biofuel Policies on Grain and Oilseed Prices 57
Trade Policy and Food Security • http://dx.doi.org/10.1596/978-1-4648-0305-5
the cross-country interaction effects of these policies, thus investigating them from an international trade perspective. We find that long-term OECD biofuel policies were trade discriminatory, not only because of biofuel and feedstock production subsidies, but also because the recently expired U.S. ethanol import tariff effectively shut down long-run investment in lower-cost sugarcane- ethanol production in Brazil over the past 30 years. Had it not been for the import tariff, the United States would likely have been importing ethanol, thus tempering any volatility caused by corn-ethanol links. Fuel market develop-ments in Brazil along with Brazilian policy also contributed to the price volatility. After the United States became the biggest ethanol exporter in the world, sugar prices became directly linked to corn and therefore to other grain and oilseed prices.
This chapter outlines a framework to identify the magnitude of the subsidy or support afforded corn and ethanol producers and to analyze market effects of biofuel mandates and the various subsidies. The gross support afforded U.S. ethanol and corn producers is found to be very high, but the net support is sub-stantially lower if one takes into account water in the ethanol price premium. Nevertheless, the net support exceeds taxpayer cost of the tax credit by a wide margin, primarily because of an observed price premium above the tax credit. An overriding issue for monitoring subsidies under the WTO’s ASCM and AoA and of the OECD’s PSE is what measure should be reported—the gross or net sub-sidy? Should it be measured with or without other policies in place? The issue gets more complicated if the ethanol market price is determined outside the United States. These questions are left open for further research.
The implications of the recent developments in the world energy and agricul-tural markets for developing countries are many. The sudden and unexpected imposition of mandates and environmental regulations, along with high oil prices activating long-standing tax credits and exemptions, caused an unexpected sharp increase in grain and oilseed prices. Developing countries were unable to take advantage of their comparative advantage in biofuel production and so were unable to maximize any direct benefit from OECD countries’ biofuel policies; for example, expansion in sugarcane production requires larger investments and more time, unlike for corn-ethanol. Developing countries responded to higher commodity prices by imposing export taxes or reducing import barriers, thus exacerbating grain and oilseed price volatility. In a way, the new era of OECD biofuel policies continues the saga of decades of agricultural policies that depressed the prices of commodities in which developing countries have a com-parative advantage and for which agricultural development is so critical in reduc-ing poverty.
In our view, the ongoing policy discussion should not be about high or low prices or about a determination of the optimal food price, but rather about where we came from (low prices distorted by rich countries’ agricultural policies) and how we arrived here: high prices that were sudden and unplanned results from rich countries’ biofuel policies such that the welfare of developing countries was not maximized.

58 The Role of Biofuel Policies on Grain and Oilseed Prices
Trade Policy and Food Security • http://dx.doi.org/10.1596/978-1-4648-0305-5
notes
1. As we show later, the ethanol-corn price multiplier is very high: every US$0.01 per gallon increase in ethanol prices translates into a US$0.04 per bushel increase in corn prices.
2. These studies show that export restrictions and lowering of import barriers increased rice prices by 40 percent and wheat prices by 20 percent. Abbott (2012) points out that this is a conservative estimate because it does not account for government market power or the effects of storage and other policies (for details of the rice market, see Slayton 2009).
3. Mitchell (2008) also emphasizes that biodiesel production in Europe was taking its toll on wheat stocks in the two years before 2008.
4. For a detailed summary of how each price moved in relation to each other, see Rausser and de Gorter (2012) and de Gorter, Drabik, and Just (2013a, 2013b, forthcoming).
5. Our interpretation of events is by no means unanimous among economists. For example, Zhang and others (2010, p. 445) is one of many papers that question the central role of biofuels policy: “Results indicate no direct long-run price relations between fuel and agricultural commodity prices, and limited if any direct short-run relationships. In terms of short-run price movements, sugar prices are influ-encing all the other agricultural commodity prices except rice.” Sugar prices remained flat through 2007–08 whereas grain and oilseed prices went up three and a half times.
6. Another reason wheat and rice prices rose faster than corn prices was that ethanol was sold at a discount to gasoline in 2008, reducing corn prices compared to their fair market value (see data in de Gorter, Drabik, and Just 2013a).
7. For a detailed theoretical explanation of mandates versus tax credits, see de Gorter and Just (2009a, 2009b).
8. At high oil prices in 2008 (and again in 2011), the ethanol price premium caused by the mandate fell to zero. The tax credit was binding, and corn and oilseed prices were firmly locked on to oil prices in these situations.
9. “Water” in the tariff means a reduction in the tariff will initially have no impact on trade. Later in this chapter, we show that there is a lot of water in the ethanol price premium and other redundancies in the effect of various biofuels and agricultural policies when combined where “water” refers to the intercept of the ethanol supply curve exceeding the free market ethanol price.
10. U.S. biodiesel prices up to mid-2008 and U.S. ethanol prices after early 2010 were determined on world markets, where U.S. tax credits increased the domestic market price of biofuels (de Gorter and Drabik 2012a; de Gorter, Drabik, and Just 2011; de Gorter, Drabik, and Kliauga 2012).
11. Ethanol prices can be linked to gasoline prices either directly (through a tax credit) or indirectly (through mandate premiums above the tax credit); in contrast, gasoline prices are a direct function of oil prices.
12. Mandates refer to formal mandates, informal mandates caused by environmental regu-lations, lack of choice in choosing gasoline over ethanol according to miles traveled because of inadequate flex cars and E-85 stations, or determination of the market price of ethanol outside the United States.
13. See the discussion of figure 1 in Drabik (2011) for a complete explanation of water in the ethanol price premium because of a policy.

The Role of Biofuel Policies on Grain and Oilseed Prices 59
Trade Policy and Food Security • http://dx.doi.org/10.1596/978-1-4648-0305-5
14. Not all economists agree there is water in the ethanol price premium (for example, Babcock 2013). Cui and others (2011) calibrate their model to a federal tax credit in 2009 and have no water, estimating a 54 percent increase in corn prices because of ethanol policy. Drabik (2011) calibrates his model to a mandate premium and deter-mines water to be US$2.01 per bushel and a net increase in corn prices of US$1.04, or 39 percent. If no water were assumed, the implied increase in the corn price because of biofuel policy would be 115 percent.
15. The net support to corn producers per bushel of corn is the difference between the observed corn price and the corn price that would occur without biofuels.
16. The fixed cost of ethanol production in the United States is estimated to be US$0.25 per gallon, whereas in Brazil it is currently as high as US$0.60 per gallon.
17. Recently, because of high biodiesel prices, ethanol processors are extracting more oil out of the feed by-product from processed corn and receiving an extra US$0.05–US$0.07 per gallon, translating into a higher corn price of US$0.20–US$0.35 per bushel. So interaction effects exist between biofuel policies.
18. See de Gorter, Drabik, and Just (2013b) for a brief overview of this literature.
19. Typical studies include Abbott, Hurt, and Tyner (2008) and Baffes and Haniotis (2010), which conclude biofuels have a small effect and biofuel policy an even smaller one. See table 1 in both Trostle (2008) and de Gorter and Drabik (2012b) for a sum-mary of all the factors considered by the perfect storm literature.
20. See Zilberman and others (2013) and Serra (2012) for surveys of this literature. A very typical result is in Zhang and others (2009, p. 320): “no long-run relations among fuel (ethanol, oil and gasoline) prices and agricultural commodity (corn and soybean) prices.”
21. For example, crop and oil prices are negatively related when a mandate is binding but positively related if crop prices are linked directly to oil prices through a tax credit.
22. Similarly, a US$0.01 per gallon increase in the biodiesel price results in a US$11.00 per metric tonne increase in the soybean oil price (de Gorter, Drabik, and Just 2013a). The effect of a change in the ethanol price premium because of Brazilian sugarcane-ethanol policies is very complex and does not reduce to one equation (de Gorter and others 2013).
23. See Rausser and de Gorter (2012) and de Gorter, Drabik, and Just (2013a) for a detailed discussion on how all grain and oilseed prices are highly correlated and follow each other, regardless of the source of shock.
24. The difference is the mandate premium over the tax credit. Clearly, a negative man-date premium would attribute negative influences to perfect storm factors, so we eliminate these cases.
25. The average premium caused by the mandate from January 2007 to October 2008 (after the price collapse resulting from the recession) was only US$0.12 per bushel. In this period, perfect storm factors were basically absent (except for those reflected in the oil price only). Nothing directly affecting crop supply and demand could have significantly influenced corn prices in this period.
26. Kliauga, de Gorter, and Just (2011) show that net benefits of tax exemptions to Brazilian ethanol producers are much lower than the profession realizes, and de Gorter, Drabik, and Just (forthcoming) indicate that the anhydrous ethanol tax exemption and gasoline tax policy hurt the ethanol industry and that under some market situations, the mandate may be an upper bound on ethanol prices (unlike in the United States) and hence suppresses them.

60 The Role of Biofuel Policies on Grain and Oilseed Prices
Trade Policy and Food Security • http://dx.doi.org/10.1596/978-1-4648-0305-5
27. These policies include an ethanol blend mandate; ethanol tax exemptions; and manipulating the gasoline price, the gasoline tax, or both.
28. Note that the impressive share of biofuels in Brazil’s transportation mix is muted somewhat if one takes into account the fact that diesel represents 52 percent of total transportation fuels in Brazil compared with only 21 percent in the United States (and both countries have similar biodiesel shares).
29. Meyer, Schmidhuber, and Barreiro-Hurlé (2012) recommend a coordinated “book and claim” system to eliminate the perverse exchange of physically identical products.
r eferences
Abbott, Philip C. 2012. “Export Restrictions as Stabilization Responses to Food Crisis.” American Journal of Agricultural Economics 94 (2): 428–34.
Abbott, Phillip C., Christopher Hurt, and Wallace E. Tyner. 2008. What’s Driving Food Prices? Oak Brook, IL: The Farm Foundation.
Anderson, Kym. 2012. “Agricultural Price Distortions: Trends and Volatility, Past and Prospective.” Plenary paper for the International Association of Agricultural Economists Triennial Conference, Foz do Iguaçu, Brazil, August 18–24.
Babcock, Bruce. 2013. “Biofuels without Subsidies: Oxymoron or Reality?” Paper presented at the Allied Social Science Associations Meetings, San Diego, CA, January 4–6.
Baffes, John. 2007. “Oil Spills on Other Commodities.” Resources Policy 32 (1): 126–34.
Baffes John, and Tassos Haniotis. 2010. “Placing the 2006/08 Commodity Price Boom into Perspective.” Policy Research Working Paper 5371, World Bank, Washington, DC.
Byrd, Elizabeth S. 2012. “Application of the Competitive Storage Model to U.S. Corn Ethanol Policy.” MSc thesis, Charles H. Dyson School of Applied Economics and Management, Cornell University, Ithaca, NY.
Carter, Colin, Gordon C. Rausser, and Aaron Smith. 2012. “The Effect of the U.S. Ethanol Mandate on Corn Prices.” Unpublished manuscript, Department of Agricultural and Resource Economics, University of California—Davis.
Cui, Jingbo, Harvey Lapan, GianCarlo Moschini, and Joseph Cooper. 2011. “Welfare Impacts of Alternative Biofuel and Energy Policies.” American Journal of Agricultural Economics 93 (5): 1235–56.
de Gorter, Harry. 2008. “Explaining Agricultural Commodity Price Increases: The Role of Biofuel Policies.” Paper presented at the conference “Rising Food and Energy Prices: U.S. Food Policy at a Crossroads,” Oregon State University, Corvallis, OR, October 2. http://arec.oregonstate.edu/sites/default/files/faculty/perry/degorter.pdf.
———. 2010. “Does US Corn-Ethanol Really Reduce Emissions by 21%? Lessons for Europe.” Biofuels 1 (5): 671–73. http://www.future-science.com/doi/pdf/10.4155 / bfs.10.54.
de Gorter, Harry, and Dusan Drabik. 2012a. “Biofuel Policies and Grain Crop Price Volatility.” Biofuels 3 (2): 111–13. http://www.future-science.com/toc/bfs/3/2.
———. 2012b. “The Effect of Biofuel Policies on Food Grain Commodity Prices.” Biofuels 3 (1): 21–24. http://www.future-science.com/doi/pdf/10.4155/bfs.11.149.
de Gorter, Harry, Dusan Drabik, and David R. Just. 2011. “The Economics of a Blender’s Tax Credit versus a Tax Exemption: The Case of U.S. ‘Splash and Dash’ Biodiesel

The Role of Biofuel Policies on Grain and Oilseed Prices 61
Trade Policy and Food Security • http://dx.doi.org/10.1596/978-1-4648-0305-5
Exports to the European Union.” Applied Economic Perspectives and Policy 33 (4): 510–27.
———. 2013a. “Biofuel Policies and Food Grain Commodity Prices 2006–2012: All Boom and No Bust?” AgBioForum 16 (1): 1–13.
———. 2013b. “How Biofuels Policies Affect the Level of Grains and Oilseed Prices: Theory, Models and Evidence.” Global Food Security 2 (2): 82–88.
———. Forthcoming. “The Perverse Effects of Biofuel Public-Sector Policies.” Annual Review of Resource Economics 5.
de Gorter, Harry, Dusan Drabik, and Erika M. Kliauga. 2012. “Why Ethanol Prices Are So High in Brazil.” Biofuels 3 (4): 371–73.
de Gorter, Harry, Dusan Drabik, Erika M. Kliauga, and Govinda Timilsina. 2013. “An Economic Model of Brazil’s Ethanol-Sugar Markets and Impacts of Fuel Policies.” Policy Research Working Paper 6524, World Bank, Washington, DC.
de Gorter, Harry, and David R. Just. 2008. “‘Water’ in the U.S. Ethanol Tax Credit and Mandate: Implications for Rectangular Deadweight Costs and the Corn-Oil Price Relationship.” Review of Agricultural Economics 30 (3): 397–410.
———. 2009a. “The Welfare Economics of a Biofuel Tax Credit and the Interaction Effects with Price Contingent Farm Subsidies.” American Journal of Agricultural Economics 91 (2): 477–88.
———. 2009b. “The Economics of a Blend Mandate for Biofuels.” American Journal of Agricultural Economics 91 (3): 738–50.
———. 2009c. “Why Sustainability Standards for Biofuel Production Make Little Economic Sense.” Policy Analysis 647, Cato Institute, Washington, DC. http://www .cato.org/pubs/pas/pa647.pdf.
———. 2010a. “Ethanol and Corn Prices: The Role of US Tax Credits, Mandates and Import Tariffs.” In The Economic Impact of Public Support to Agriculture: An International Perspective, edited by V. Eldon Ball, Roberto Fanfani, and Luciano Gutierrez, 155–69. Studies in Productivity and Efficiency 7. New York: Springer.
———. 2010b. “The Social Costs and Benefits of Biofuels: The Intersection of Environmental, Energy and Agricultural Policy.” Applied Economic Perspectives and Policy 32 (1): 4–32. http://aepp.oxfordjournals.org/content/32/1/4.full.pdf+html.
Drabik, Dusan. 2011. “The Theory of Biofuel Policy and Food Grain Prices.” Working Paper 2011–20, Charles H. Dyson School of Applied Economics and Management, Cornell University, Ithaca, NY. http://dyson.cornell.edu/research/researchpdf / wp /2011/Cornell-Dyson-wp1120.pdf.
Drabik, Dusan, Harry de Gorter, and David R. Just. 2010. “The Implications of Alternative Biofuel Policies on Carbon Leakage.” Working Paper 2010–22, Charles H. Dyson School of Applied Economics and Management, Cornell University, Ithaca, NY.
Harmer, Toni. 2009. “Biofuels Subsidies and the Law of the WTO.” Issue Paper 20, International Centre for Trade and Sustainable Development, Geneva.
Jank, Marcos J., Géraldine Kutas, Luiz Fernando do Amaral, and André M. Nassar. 2007. EU and U.S. Policies on Biofuels: Potential Impacts on Developing Countries. Washington, DC: The German Marshall Fund of the United States.
Josling, Tim, David Blandford, and Jane Earley. 2010. “Biofuel and Biomass Subsidies in the U.S., EU and Brazil: Towards a Transparent System of Notification.” IPC Position Paper, International Food and Agricultural Trade Policy Council, Washington, DC.

62 The Role of Biofuel Policies on Grain and Oilseed Prices
Trade Policy and Food Security • http://dx.doi.org/10.1596/978-1-4648-0305-5
Kliauga, Erika M., Harry de Gorter, and David R. Just. 2011. “Measuring the Subsidy Component of Biofuel Tax Credits and Exemptions.” In The Economics of Alternative Energy Sources and Globalization, edited by Andrew Schmitz, Norbert Wilson, Charles Moss, and David Zilberman, 49–64. Oak Park, IL: Bentham Science Publishers.
Kojima, Masami, Donald Mitchell, and William Ward. 2007. Considering Trade Policies for Liquid Biofuels. Washington, DC: Energy Sector Management Assistance Program.
Lapan, Harvey, and GianCarlo Moschini. 2012. “Second-Best Biofuel Policies and the Welfare Effects of Quantity Mandates and Subsidies.” Journal of Environmental Economics and Management 63 (2): 224–41.
Mallory, Mindy L., Scott H. Irwin, and Dermot J. Hayes. 2012. “How Market Efficiency and the Theory of Storage Link Corn and Ethanol Markets.” Energy Economics 34 (6): 2157–66.
Martin, William, and Kym Anderson. 2012. “Export Restrictions and Price Insulation during Commodity Price Booms.” American Journal of Agricultural Economics 94 (2): 422–27.
McCalla, Alex F. 2009. “What Is Next for Commodity and Food Prices?” PowerPoint pre-sentation at University of Alberta’s International Week, Edmonton, Canada, February 5. http://www.doc-txt.com/WHAT-IS-NEXT-FOR-COMMODITY-AND-FOOD -PRICES-%3F.ppt.
Meyer, Seth, Josef Schmidhuber, and Jesús Barreiro-Hurlé. 2012. “Intra-Industry Trade in Biofuels: How Environmental Legislation Fuels Resource Use and GHG Emissions.” ESA Working Paper 12–08, Agricultural Development Economics Division, Food and Agriculture Organization of the United Nations, Rome.
Mitchell, Donald. 2008. “A Note on Rising Food Prices.” Policy Research Working Paper 4682, Development Prospects Group, World Bank, Washington. DC.
Rausser, Gordon C., and Harry de Gorter. 2012. “U.S. Policy Contributions to Food Grain Commodity Prices.” Paper for UNU-Wider Workshop “The Political Economy of Food Price Policy,” Cornell University, Ithaca, NY, July 9–12.
Serra, Teresa. 2012. “Biofuel-Related Price Transmission Literature: A Review.” Unpublished manuscript, Centre de recerca en economia i desenvolupament agroalimentari (CREDA), Castelldefels, Spain.
Slayton, Tom. 2009. “Arson Forensics: What Set the World Rice Market on Fire in 2008?” Presented at the Food and Agriculture Organization of the United Nations workshop “Rice Policies in Asia,” Chiang Mai, Thailand, February 9–12.
Switzer, Stephanie, and Joe McMahon. 2010. “EU Biofuels Policy—Raising the Question of WTO Compatibility.” Criminology and Socio-Legal Studies Research Paper 26/2010, University College Dublin, Ireland.
Timmer, Peter C. 2008. “Causes of High Food Prices.” ADB Economics Working Paper Series 128, Asian Development Bank, Manila.
———. 2010. “Reflections on Food Crises Past.” Food Policy 35: 1–11.
Timmer, Peter C., and David Dawe. 2010. “Food Crises Past, Present (and Future?): Will We Ever Learn?” In The Rice Crisis: Markets, Policies and Food Security, edited by David Dawe, 3–14. Washington, DC: Earthscan; Rome: Food and Agriculture Organization of the United Nations.
Trostle, Ronald. 2008. “Global Agricultural Supply and Demand: Factors Contributing to the Recent Increase in Food Commodity Prices.” WRS-0801, Economic Research Service, U.S. Department of Agriculture, Washington, DC.

The Role of Biofuel Policies on Grain and Oilseed Prices 63
Trade Policy and Food Security • http://dx.doi.org/10.1596/978-1-4648-0305-5
Tyner, Wallace E. 2008. “The U.S. Ethanol and Biofuels Boom: Its Origins, Current Status, and Future Prospectus.” BioScience 58: 646–53.
Wright, Brian D. 2011. “The Economics of Grain Price Volatility.” Applied Economic Perspectives and Policy 33 (1): 32–58.
Yano, Yuki, David Blandford, and Yves Surry. 2010. “The Impact of Feedstock Supply and Petroleum Price Variability on Domestic Biofuel and Feedstock Markets: The Case of the United States.” Working Paper 2010/3, Swedish University of Agricultural Sciences, Department of Economics, Uppsala.
Zhang, Zibin, Luanne Lohr, Cesar Escalante, and Michael Wetzstein. 2009. “Ethanol, Corn, and Soybean Price Relations in a Volatile Vehicle-Fuels Market.” Energies 2 (2): 320–39.
———. 2010. “Food versus Fuel: What Do Prices Tell Us?” Energy Policy 38 (1): 445–51.
Zilberman, David, Gal Hochman, Deepak Rajagopal, Steve Sexton, and Govinda Timilsina. 2013. “The Impact of Biofuels on Commodity Food Prices: Assessment of Findings.” American Journal of Agricultural Economics 95 (2): 275–81.


65 Trade Policy and Food Security • http://dx.doi.org/10.1596/978-1-4648-0305-5
Price Transmission from World to Local Grain Markets in Developing CountriesWhy It Matters, How It Works, and How It Should Be Enhanced
Sergiy Zorya, Stephan von Cramon-Taubadel, Friederike Greb, Nelissa Jamora, Carolin Mengel, and Nadine Würriehausen
Why it matters
The recently increased volatility of global food prices described in chapter 5 of this book is a matter of great concern in developing countries. Volatile and unpredictable prices undermine incentives for farmers to respond to high price levels with the critical increase in production needed to bring food prices down. This uncertainty keeps food prices high for a longer period, leading to fundamental food security risks for consumers and governments (World Bank 2012b).
Does this mean that developing countries would be well advised to separate from world markets to reduce exposure to this increased price volatility? The answer is definitely no, for the following reasons:
• Price volatility in many local markets continues to exceed price volatility observed in international markets, despite the recent increase in the latter. Many developing countries could use stronger integration with the world and regional markets to reduce their local price volatility.
• Transmission of international food prices to domestic prices is essential to pursue comparative-advantage-based, sustainable agricultural production. International prices are opportunity costs for most price-taking developing countries and thus are crucial in determining an efficient distribution of domestic resources. When the long-term trend of international prices is
c H A p t e r 3
66 Price Transmission from World to Local Grain Markets in Developing Countries
Trade Policy and Food Security • http://dx.doi.org/10.1596/978-1-4648-0305-5
transmitted slowly and imperfectly to domestic markets, consumers and pro-ducers make decisions based on prices that do not represent their real social costs and benefits. Strong empirical evidence from both developing and developed countries indicates that any large, sustained deviation of domestic prices from world prices in either direction leads to substantially suboptimal food security outcomes and slows the rate of economic growth (Dawe 2009; Timmer 2004).
• Because international food prices reflect global scarcity or surplus, their trans-mission to domestic prices can help improve the responsiveness of the global food system to shocks.
• When local prices are not well correlated with prices on international com-modity exchanges, basis risk is too high to allow the effective use of hedges and other price risk instruments to manage the impact of price volatility on government expenditures, producers, and consumers (World Bank 2012a).
Differentiating between the short and the longer term, some countries with a large share of food in total imports may need to mitigate excessive price fluctuations in the short term to protect consumers (through reduction of import tariffs, emergency food reserves, and safety nets), but in the medium to longer term, international prices remain the best measure of opportunity costs to guide economic decisions on allocation, consumption, and distribution. The most efficient and sustainable response to international food price spikes is per-mitting domestic prices to rise (to stimulate an efficient supply response) while increasing assistance to the poor through safety nets. Faster and fuller price transmission (that is, stronger market integration) is desirable and necessary in most instances.
How it Works
Not all countries and not all markets within countries are similarly integrated with world markets. The extent to which international prices are transmitted to domestic markets depends on many factors, including transport and market-ing costs, policy measures, local currency valuation, market structure, and degree of processing of final consumption goods, as summarized in a 2011 joint report by international organizations to the Group of 20 (FAO and others 2011):
• Transport and other marketing costs, when substantial, cause a rise in world prices to be underreflected in import parity prices and overreflected in export parity prices (see box 3.1).
• Policy measures such as export bans, import duties, export taxes, and nontariff barriers or domestic policies such as price support all influence the extent to which the price changes in domestic markets mirror those on international markets.

Price Transmission from World to Local Grain Markets in Developing Countries 67
Trade Policy and Food Security • http://dx.doi.org/10.1596/978-1-4648-0305-5
Box 3.1 interplay between t ransport c osts and policy measures in price t ransmission in ethiopia
In Ethiopia, high transport and other marketing costs result in a large gap between export and import parity prices, which makes private trade profitable only when domestic harvests are unusually high or low. In 2011, for example, the import of wheat was profitable only when domestic prices were above US$700 per ton, whereas export was profitable at domestic prices below US$450 per ton (figure B3.1.1). Changes in international prices within this US$250- per-ton structural price band would have no effect on countries such as Ethiopia. However, policy mea-sures, such as import registration and licensing of private traders, and ad hoc public imports, including government-to-government contracts, can result in a domestic price that far exceeds the import parity prices, as was the case in 1998, 2006, and 2008–09.
Figure B3.1.1 Domestic Wheat prices and export/import parity Band in Addis Ababa, January 1998–o ctober 2011
Source: Rashid and Lemma 2011.Note: Import and export parity figures are calculated using U.S. Hard Red Winter Wheat price (FOB [free on board] Gulf of Mexico) + international shipping (US$30/ton in December 2008) + domestic handling and transport from Djibouti to Addis (1,350 Birr/ton in December 2008).
0
100
200
300
400
500
600
700
800
900
Nom
inal
pri
ces
(US$
/ton
)
Export parity priceDomestic price Import parity price
Jan-98
Dec-98
Nov-99
Oct-00
Sep-01
Aug-02Ju
l-03
Jun-04
May-05
Apr-06
Mar-07
Feb-08
Jan-09
Dec-09
Nov-10
Oct-11

68 Price Transmission from World to Local Grain Markets in Developing Countries
Trade Policy and Food Security • http://dx.doi.org/10.1596/978-1-4648-0305-5
• When the local currency of a country appreciates against the U.S. dollar, food prices in local currency rise less than they do internationally.
• Market structure is also important. In monopsonistic markets, whether private or state controlled, higher international prices may not always result in higher prices for producers or consumers.
• The degree of processing of final consumption goods also affects price transmis-sion. The higher the cost share of raw production in the final product and the less the scope for substitution, the more a price change for the raw product will be transmitted into a price change for the final product.
These and other local factors determine two aspects related to price trans-mission and cointegration of markets. First, they define the extent of price transmission, or how much of a change in international prices is transmitted to local markets. This correlation is often referred to as the long-term elasticity of price transmission. Second, they determine the speed of transmission, or how quickly a change in international prices is reflected in local markets. The styl-ized facts presented below show differences in the long-term elasticities of price transmission and in the speed of transmission by region and by type of cereal.
stylized Facts pertaining to r ecent c ereal price t ransmission
The presentation of stylized facts on cereal price transmission is based on a three-part approach. First, a nonparametric analysis of agreements and disagreements in price increases and decreases in local markets compared to international mar-kets is carried out, using the monthly price data for 77 countries from the Global Information and Early Warning System (GIEWS) of the Food and Agriculture Organization (FAO) of the United Nations.1 This approach is free of any assumptions about the functional relationship between domestic and interna-tional prices, but it produces results that are correspondingly less informative. Even if domestic and international prices show a tendency to increase and decrease together, this symmetry does not mean that producers and consumers on domestic markets are receiving undistorted price signals. The magnitude of the domestic price changes could be considerably larger (or smaller) on average than the magnitude of the corresponding international price changes or prices may not be linked at all. More informative results are derived from an economet-ric analysis of price transmission. The first source of information is a review of published reports studying price transmission listed in annex 3A. The second source is based on our own estimates of long-term elasticity coefficients and adjustment parameters for a large number of countries, using the vector error correction model2 for the FAO GIEWS price data set.
The analysis focuses on cereals (maize, rice, and wheat), the main food security staples. Local prices include both wholesale and retail prices, and international prices are proxied by wholesale prices of (a) maize (U.S. No. 2 Yellow, free on board [FOB] Gulf of Mexico); (b) rice (5 percent Broken, FOB Bangkok); and

Price Transmission from World to Local Grain Markets in Developing Countries 69
Trade Policy and Food Security • http://dx.doi.org/10.1596/978-1-4648-0305-5
(c) wheat (U.S. No. 1 Hard Wheat, FOB Gulf of Mexico). Annex 3B shows that these prices are mostly frequently used as proxies for international prices in the literature.
Analysis of Price Agreements and DisagreementsComovement of international and domestic prices for cereals is more frequent than movement in opposite directions, but the imbalance is not pronounced and movement in opposite directions occurs often. A slight preponderance of positive changes occurs in international market prices over the time periods covered by the GIEWS data; international prices increased in 55 percent of all months (32 percent + 23 percent in the bottom row of table 3.1) and decreased in 45 percent of all months. In 58 percent of the months in which international prices increased, domestic prices increased as well (32 of 55 percentage points). However, domestic prices decreased in only 49 percent of the months in which international prices decreased (22 of 45 percentage points). Overall, the agreement between the direction of price changes in international markets and in domestic markets is quite low, especially when international prices are falling.
This result holds quite uniformly across regions and products. The only slight exception is that prices in Europe tend to move in the same direction as interna-tional prices in a slightly higher proportion of all months (56 percent), whereas prices in Latin America tend to move in the same direction somewhat less
t able 3.1 t he Direction of monthly price movements on Domestic and international markets, Agreement and Disagreement, by r egion and c erealPercent
Agree: ∆pw<0 and
∆pd<0
Agree: ∆pw>0
and ∆pd>0
Disagree: ∆pw>0 and
∆pd<0
Disagree: ∆pw<0 and
∆pd>0Sum: agree
Sum: disagree
RegionAsia and the Middle East 23 30 21 26 53 47East Africa 22 31 25 22 53 47West Africa 21 33 23 22 54 46Europe 27 29 24 20 56 44Latin America 19 33 23 26 51 49
CerealMaize 20 32 25 23 52 48White maize 20 34 24 21 54 46Rice 24 30 22 25 54 46Wheat 24 30 22 25 53 47
All regions and cerealsTotal 22 32 23 23 54 46
Source: Based on Global Information and Early Warning System (GIEWS) price data.Note: ∆pw is the change in the international or world price, and ∆pd is the corresponding change in the domestic price.

70 Price Transmission from World to Local Grain Markets in Developing Countries
Trade Policy and Food Security • http://dx.doi.org/10.1596/978-1-4648-0305-5
often (51 percent). Although in Europe domestic prices fell in over one-half of all the cases in which international prices had fallen (in 27 percent of the 47 percent of such cases), this is not the case in Latin America (in 19 percent of the 45 percent of such cases) (table 3.1).
Agreement between the direction of international and domestic prices becomes more frequent when quarterly rather than monthly price changes are considered. Focusing on quarterly rather than on monthly price changes elimi-nates smaller short-run price fluctuations and accounts for possible lags in price transmission. With quarterly data, the overall share of agreements in the direction of price changes increases to 56 percent, from 54 percent in table 3.1. Repeating this analysis with annual data leads to a further increase in the share of agree-ments in the direction of international and domestic price changes, especially for Asia and the Middle East and for Europe, as well as for rice and wheat. Yet overall the results presented here support the findings of generally weak price transmis-sion that are derived from the econometric analysis presented in the next subsection.
CointegrationNot all the changes in domestic prices are due to price transmission from global markets. Some local markets are not integrated with international markets, and in such cases, local and regional events drive domestic prices. Typically, such markets are in countries with large infrastructure deficits or in countries that pursue insulating policies. Tables 3.2 and 3.3 present information on the numbers and shares of international–domestic price pairs that are found to be cointegrated according to the literature sample and the GIEWS estimates, respectively.
Overall, the literature sample from annex 3A suggests that international and domestic prices are cointegrated more often than is indicated by our own estimation with GIEWS data. Of all market pairs for all cereals reported in the literature sample, 79 percent are cointegrated, compared with 43 percent in the GIEWS sample (tables 3.2 and 3.3, respectively). The difference between these results may be caused by a publication bias in the literature that favors findings of cointegration. The literature sample indicates the low-est prevalence of cointegration for East and West Africa and Oceania com-pared with Asia and Pacific and especially Europe, Latin America, and North America, but this pattern is not confirmed by the GIEWS results. In the lit-erature sample, the lower prevalence of cointegration for East and West Africa is primarily because of maize (46 and 58 percent shares of cointegration for East and West Africa, respectively) rather than rice, for which most African prices are cointegrated with international prices (83 percent and 73 percent, respectively), or wheat (for which there are, however, only eight observations for Africa).
In both the literature and the GIEWS results, evidence of cointegration is less frequent for maize than for rice. For wheat, the literature indicates that

71
t able 3.2 t he prevalence of c ointegration in the l iterature s ample
Region
Maize Rice Wheat Total
Number of observations
Number cointegrated
Percentage cointegrated
Number of observations
Number cointegrated
Percentage cointegrated
Number of observations
Number cointegrated
Percentage cointegrated
Number of observations
Number cointegrated
Percentage cointegrated
East Africa 107 49 46 24 20 83 8 5 63 139 74 53West Africa 12 7 58 26 19 73 0 0 — 38 26 68Asia and Pacific 25 17 68 93 79 85 28 17 61 146 113 77Latin America 44 38 86 64 57 89 61 57 93 169 152 90Europe 4 4 100 7 6 86 20 18 90 31 28 90North America 0 0 — 1 1 100 122 122 100 123 123 100Oceania 0 0 — 0 0 — 32 20 63 32 20 63Total 192 115 60 215 182 85 271 239 88 678 536 79
Source: Based on the literature sample in annex 3A.Note: Results of cointegration tests are reported in the individual studies in the literature sample. There is no uniform methodology: different authors use different tests and levels of significance; — = not available.

72
t able 3.3 t he prevalence of c ointegration in the GieWs estimates
Region
Maize Rice Wheat Total
Number of observations
Number cointegrated
Percentage cointegrated
Number of observations
Number cointegrated
Percentage cointegrated
Number of observations
Number cointegrated
Percentage cointegrated
Number of observations
Number cointegrated
Percentage cointegrated
East Africa 59 21 36 35 22 63 14 8 57 108 51 47West Africa 43 9 21 81 58 72 6 1 17 130 68 52Asia and
Pacific 15 2 13 63 18 29 24 3 13 102 23 23Latin
America 58 22 38 70 39 56 11 2 18 139 63 45Europe 4 1 25 1 1 100 2 0 0 7 2 29North
America 0 0 — 0 0 — 0 0 — 0 0 —Oceania 0 0 — 1 1 100 0 0 — 1 1 100Total 179 55 31 251 139 55 57 14 25 487 208 43
Source: Based on GIEWS price data.Note: Cointegration is determined by Johansen Test with 5 percent significance level; — = not available.

Price Transmission from World to Local Grain Markets in Developing Countries 73
Trade Policy and Food Security • http://dx.doi.org/10.1596/978-1-4648-0305-5
cointegration is relatively frequent (88 percent of all international–domestic price pairs), whereas the GIEWS results suggest that it is considerably less fre-quent (25 percent). However, the wheat results in the literature sample are strongly influenced by a single study that produced more than 100 observations for North America, all of which indicate that domestic and international prices are cointegrated.
In the majority of cases in the GIEWS data set, domestic prices adjust to dis-equilibrium between themselves and the corresponding international prices, while international prices do not adjust. However, the estimates show that inter-national prices adjust in 24 percent of all price pairs, almost all of which involve rice. These exceptions account for roughly 40 percent of all price pairs involving rice and involve many countries of all sizes. Overall, these results suggest that international price determination for rice differs fundamentally from that for wheat and maize. Although we can conclude that most countries are price takers on wheat and maize markets, the evidence for rice is mixed.
When markets are cointegrated, changes in international prices are transmit-ted by roughly three-quarters to domestic prices on average. Table 3.4 sum-marizes the average estimates of the long-run price transmission coefficient taken from the literature and GIEWS samples by cereal product and region, respectively. On average, the literature and the GIEWS estimates of elasticity coefficients are similar (0.74 and 0.76, respectively). However, for all regions with the exception of West Africa, the GIEWS estimates are on average roughly 0.2 higher than the literature estimates. The average coefficients are similar for maize and rice, but the GIEWS average for wheat is much higher than the corresponding average from the literature sample. These results change very little if only those product and country combinations are retained in the comparison for which observations exist in both the GIEWS and the literature samples.
t able 3.4 Average estimates of the l ong-r un r ice t ransmission c oefficients t aken from the GieWs and l iterature s amples, by product and r egion
Region
Maize Rice Wheat All three cereals
GIEWS Literature GIEWS Literature GIEWS Literature GIEWS Literature
Asia and Middle East 0.77 1.03 0.53 0.60 1.97 1.09 0.87 0.67
East Africa 0.93 0.76 0.87 0.48 0.76 0.65 0.89 0.72West Africa 0.42 1.74 0.64 0.46 1.27 — 0.60 0.63Europe 0.82 0.61 0.92 0.54 0.98 0.94 0.88 0.71Latin America 0.69 — 0.69 0.55 1.14 — 0.73 0.55North America — — — 1.00 — 0.89 — 0.89Oceania — — 0.91 — — — 0.91 —All regions 0.72 0.78 0.66 0.55 1.41 0.89 0.76 0.74
Source: Based on the literature sample and GIEWS price data.Note: Averages by region and cereal are weighted by the number of observations in each category; GGIEWS = Global Information and Early Warning System; — = not available.

74 Price Transmission from World to Local Grain Markets in Developing Countries
Trade Policy and Food Security • http://dx.doi.org/10.1596/978-1-4648-0305-5
Domestic agricultural and food prices are less cointegrated with interna-tional prices than are domestic nonagricultural prices. Figure 3.1 illustrates that the average extent (elasticity) of price transmission for fuel and metals is higher than the average price transmission for agricultural and food products. The estimates of price transmission elasticities for all agricultural products, including cereals, generated using annual data and presented in figure 3.1, are slightly lower than for our monthly price data for cereals. Nevertheless, these results confirm that even when market pairs are cointe-grated, only a partial share of changes of international prices is typically passed through to domestic prices. Another conclusion for assessments of anticipated effect of spikes of international food prices on developing coun-tries is that the movements of local agricultural and food prices are still largely determined by local and regional factors listed in the previous section rather than international prices.
When prices are transmitted, the speed of transmission is found to be rela-tively slow. The average adjustment parameter estimated using GIEWS data is slightly larger in magnitude than the average in the literature (−0.11 as opposed to −0.09), but both indicate a relatively slow rate of price transmission, whereby
Figure 3.1 estimates of l ong-term elasticity of price t ransmission by Different c ommodities, 1970–2010
Source: IMF and World Bank 2011.Note: The length of the bars denotes the average elasticity of country-specific commodity prices in respect to international commodity prices; R2 denotes the fraction of the variation in country-specific commodity prices accounted for by movement in international commodity prices. The estimates are based on regressions of log country-specific commodity prices on log world commodity prices using annual data over the period 1970–2010.
0 0.1 0.2 0.3 0.4 0.5Elasticity
0.6 0.7 0.8 0.9 1.0
Food
Agriculturaland raw
materials
Metals
Fuel
R2
0.53
0.44
0.44
0.53

Price Transmission from World to Local Grain Markets in Developing Countries 75
Trade Policy and Food Security • http://dx.doi.org/10.1596/978-1-4648-0305-5
roughly 10 percent of any deviation from the long-run equilibrium relationship between international and domestic prices is corrected in the course of one month (table 3.5). This finding implies that between six and seven months are necessary to correct one-half of any disequilibrium that emerges because of unexpected price movements on international or domestic markets.
The recent spikes of international food prices may have changed the relation-ship between domestic and international prices, but the period after 2007 is still too short for any strong conclusion to be drawn. Table 3.6 contrasts median estimates of the coefficients of price transmission on cereal markets before and after the onset of the recent phase of price peaks and increased price volatility in mid-2007. No clear pattern emerges. On maize markets, the long-run transmis-sion coefficients have fallen considerably since mid-2007, from 0.438 to 0.103, but they increased for rice, from 0.547 to 0.705, and for wheat, from 0.576 to 1.013. At the same time, however, the short-run adjustment coefficients have fallen, from 0.201 to 0.140 for rice and from 0.683 to 0.212 for wheat.
t able 3.5 Average estimates of the speed of Adjustment Based on the GieWs and l iterature s amples, by product and r egion
Region
Maize Rice Wheat All three cereals
GIEWS Literature GIEWS Literature GIEWS Literature GIEWS Literature
Asia and Middle East −0.11 0.10 −0.04 −0.14 −0.05 −0.07 −0.05 −0.13
East Africa −0.16 0.02 −0.17 0.37 −0.12 −0.25 −0.16 0.06West Africa −0.14 −0.10 −0.13 −0.16 −0.18 — −0.14 −0.16Europe −0.10 −0.09 −0.04 −0.15 −0.10 −0.08 −0.09 −0.11Latin America −0.14 — −0.09 −0.36 −0.07 −0.10 −0.11 −0.26North America — — — — — −0.14 — −0.14Oceania — — −0.10 — — −0.08 −0.10 −0.08All regions −0.13 −0.02 −0.10 −0.09 −0.10 −0.12 −0.11 −0.09
Source: Based on the literature sample and GIEWS price data.Note: Averages by region and cereal are weighted by the number of observations in each category. The expected sign of the adjustment parameter is negative; GIEWS = Global Information and Early Warning System; — = not available.
t able 3.6 median price t ransmission parameters estimated with GieWs Data, before and after July 2007
Time period
Maize Rice Wheat
Long-run elasticity
Speed of adjustment
Long-run elasticity
Speed of adjustment
Long-run elasticity
Speed of adjustment
Before July 2007 0.438 −0.216 0.547 −0.201 0.576 −0.683After July 2007 0.103 −0.308 0.705 −0.140 1.013 −0.212
Source: Based on GIEWS price data. The expected sign of the adjustment parameter is negative.Note: Estimates are made only for international-domestic price pairs that are cointegrated.

76 Price Transmission from World to Local Grain Markets in Developing Countries
Trade Policy and Food Security • http://dx.doi.org/10.1596/978-1-4648-0305-5
This suggests that price transmission has become more complete but slower since mid-2007 for rice and wheat and less complete but more rapid for maize.
Our efforts to identify a typology of factors that determines the extent and speed of price transmission using the available data sets have been unsuccess-ful so far. As discussed in the previous section, price transmission may be affected by transport and marketing costs, policy measures, local currency valuation, market structure, and the degree of processing of final consumption goods, but being able to isolate and quantify the specific effects of individual factors would be useful. Table 3.7, however, illustrates that meta-regressions based on the literature or GIEWS data sets do not produce a clear picture. The analysis of the literature sample indicates that price transmission is more com-plete in West Africa and in large net importing countries overall, less complete in Latin America, and, interestingly, less complete in countries with greater ease of trade. The analysis of the GIEWS sample shows only that maize price changes are passed through to domestic prices faster than rice and wheat price changes.
Because the cross-sectional analysis of many country-product pairs does not produce robust, broad conclusions, we conclude that understanding the role of various factors in price transmission requires more in-depth country-level analysis. The analysis of maize price transmission between South Africa and
t able 3.7 estimated meta-r egression c oefficients
Covariate
Literature GIEWS entire period
Long-run elasticity
Speed of adjustment
Long-run elasticity
Speed of adjustment
Intercept 4.834** 0.720** 0.725 −0.262*Maize 0.187 0.035 0.057 −0.069**Wheat 0.218 0.139** 0.146 0.034East Africa −0.298 0.446*** −0.017 −0.033West Africa 0.790* 0.087 −0.008 −0.031Europe — — 0.393 0.078Latin America −0.460* −0.130** 0.142 −0.015Trade openness 0.005 0.001 0.001 0.000Net importer 0.666** 0.021 −0.160 0.053State trade enterprises −0.117 −0.060 0.141 −0.023Retail −0.268 −0.084 0.004 −0.020Ease of trade −6.490* −1.498** 0.433 0.118Logistics −0.125 0.037 −0.282 0.038Landlocked −0.865 −0.711*** 0.156 0.008R² 0.538 0.435 0.032 0.101
Source: Based on the literature sample and GIEWS price data.Note: GIEWS results are based on estimates only from cointegrated international−domestic price pairs. Meta-regression with literature data are estimated using the Heckman two-step procedure; — = not available.Significance level: * = 10 percent, ** = 5 percent, *** = 1 percent.

Price Transmission from World to Local Grain Markets in Developing Countries 77
Trade Policy and Food Security • http://dx.doi.org/10.1596/978-1-4648-0305-5
Zambia, for example, shows the importance of the role of government in trade (Myers and Jayne 2011). When the government of Zambia is heavily involved in maize imports, usually during the periods of large production shortfalls, no price transmission takes place. But strong market integration occurs during the periods of low imports when the private sector, not the government, is importing.
The effect of export bans and country-specific factors on price transmission can also be captured by more targeted analysis. A case in point is the maize markets in Kenya, Tanzania, and Uganda, all members of the East African Community (table 3.8). Analysis shows that although maize prices in these countries are not integrated with international maize prices, they do affect each other (World Bank 2009). Kenya and Uganda, both individually and together, represent a relatively integrated common market, with comparatively high long-run elasticities of price transmission and adjustment parameters correcting deviations from long-run equilibrium levels. Although some evidence exists of integration within Tanzania and between Tanzania and Kenya, price transmis-sion involving Tanzania is for the most part considerably weaker and slower than in the rest of the region. Table 3.8 shows that on average the speed of price transmission is 26.45 percent slower for market pairs that involve Tanzania. This finding is explained in part by Tanzania’s size and the market links of the Southern Highlands, which is the main surplus area, with southern neighbors (distance), but it is also a result of export bans in Tanzania.
What c an Be Done to enhance Food price t ransmission?
The empirical analysis presented above suggests a low average level of price transmission for cereals. This result raises questions of what can be done and why, which are answered as follows. The quantitative analysis presented in the previ-ous section is not able to identify concrete common factors that determine the extent and speed of price transmission. Thus, a country-specific, in-depth analysis would be required to identify concrete reasons for slow price transmission and actions for removing barriers at the country level. Yet the qualitative evidence
t able 3.8 t he effect of Distance and Border on c ombined r ates of Adjustment for market pairs in Kenya, t anzania, and Uganda: r egression r esults
Variable Coefficient Standard error t-statistic p-value
Constant 54.20 8.49 6.38 0.000Distance (100 km) −6.33 2.75 −2.29 0.028(Distance)² 0.35 0.19 1.85 0.073DNairobi 30.55 5.87 5.21 0.000DBorder to Tanzania −26.45 8.67 −3.05 0.004
Source: World Bank 2009.Note: n = 39, R² = 0.500, and adjusted R² = 0.441. The dependent variable is the combined rate of adjustment; D = distance; km = kilometer.

78 Price Transmission from World to Local Grain Markets in Developing Countries
Trade Policy and Food Security • http://dx.doi.org/10.1596/978-1-4648-0305-5
suggests the following actions that could help strengthen price transmission for the majority of countries.
First, countries should invest in domestic market infrastructure and align their policies to better integrate domestic and international markets. Even in the current more volatile price environment, many countries would benefit from a stronger integration with international markets: (a), to import lower volatility onto their domestic markets and, (b), to ensure that supply and demand decisions are guided by opportunity costs. Investment in market infra-structure (ports, roads, and so forth), along with more market-based trade poli-cies and domestic competition reforms, are essential to enhance price transmission. At times of price spikes, instead of introducing export bans, countries should target their cash and food transfer programs to the poorest (through safety nets) and permit prices to be transmitted to domestic markets to induce timely supply responses and to ensure that consumption adjusts to opportunity costs. Promotion of crop diversification, thereby making more diverse food available for consumption, is another way to strengthen resilience to volatility.
Second, policy makers should pursue open trade policies to regain the trust of countries in international markets. Irrespective of the extent of price trans-mission in the short term, recent volatility has been so dramatic that many governments have reverted to isolationist policies. Such policies have already influenced many national agricultural investment plans, moving them in the direction of a bias toward food self-sufficiency objectives. This strategy may lead to further price volatility. Countries pursuing food self-sufficiency policies need (a) to shift away from price support to less distortive types of farm sup-port, (b) to reduce spillover effects on international markets, and (c) to pro-mote sustainable growth. More discipline in trade policy, particularly on limiting the use of export restrictions, is necessary to reduce incentives for beggar-thy-neighbor policies and increase the reliability of international sup-plies for food-importing countries.
Third, countries should strengthen their safety nets, using them effectively to focus on the poor and vulnerable to mitigate the effect of price spikes, while allowing domestic prices to rise to induce a food supply response. Untargeted support often leads to large amounts of scarce public resources flowing to higher-income consumers. Targeting support programs to the poor and vulnerable is therefore essential to provide social protection without jeopardizing fiscal sustainability. Support can be provided by giving condi-tional and unconditional cash or food transfers, offering short-term employ-ment, and discouraging negative mechanisms for coping with the setbacks caused by a food price crisis. Investing in safety nets before a crisis allows their rapid and cost-efficient scale-up. Even relatively small-scale programs may provide the administrative infrastructure, including rules of operation and eligibility that can be adapted to a major crisis without costly implementation bottlenecks.

Price Transmission from World to Local Grain Markets in Developing Countries 79
Trade Policy and Food Security • http://dx.doi.org/10.1596/978-1-4648-0305-5
t able 3A.1 studies included in the l iterature r eview
Author(s) and year published Title Institution or publication
Type of publication
Number of market pairs
Baquedano, Liefert, and Shapouri 2011
“World Market Integration for Export and Food Crops in Developing Countries: A Case Study for Mali and Nicaragua”
Agricultural Economics Journal 4
Djuric, Götz, and Glauben 2011
“Effects of the Governmental Market Interventions on the Wheat Market in Serbia during the Food Crisis 2007/2008”
IAMO Conference 2
Ghoshray 2011 “Underlying Trends and International Price Transmission of Agricultural Commodities”
Asian Development Bank Report 10
Gilbert 2011 “Grains Price Pass-Through, 2005–09” FAO Book 10Minot 2011 “Transmission of World Food Price
Changes to Markets in Sub-Saharan Africa”
IFPRI Report 58
Myers and Jayne 2011
“Multiple-Regime Spatial Price Transmission with an Application to Maize Markets in Southern Africa”
American Journal of Agricultural Economics
Journal 3
Aldaz-Carroll, Varela, and Iacovone 2010
Boom, Bust and Up Again? Evolution, Drivers and Impact of Commodity Prices: Implications for Indonesia
World Bank Book 2
Goetz, Glauben, and Brummer 2010
“How Did Policy Interventions in Wheat Export Markets in Russia and Ukraine during the Food Crisis 2007/2008 Influence World Market Price Transmission?”
German Association of Agricultural Economists
Conference 10
Robles and Torero 2010
“Understanding the Impact of High Food Prices in Latin America”
Economía Journal 4
Araujo-Enciso 2009 “Evidence of Non-linear Price Transmission between Maize Markets in Mexico and the US”
University of Göttingen Conference 18
Bamuturaki 2009 “World Market Integration and Price Transmission in Selected Markets in Tanzania”
University of Hohenheim Thesis 2
Dutoit, Hernandez-Villafuerte, and Urrutia 2009
“Price Transmission in Latin American Maize and Rice Markets”
United Nations Economic Commission for Latin America and the Caribbean, University of Göttingen
Report 46
Rapsomanikis, Hallam, and Conforti 2009
The 2007–2008 Food Price Episode: Impact and Policies in Eastern and Southern Africa
FAO Book 42
World Bank 2009 “Eastern Africa: A Study of the Regional Maize Market and Marketing Costs”
Eastern African Grain Council, University of Göttingen, World Bank
Report 12
Cudjoe, Breisinger, and Diao 2008
“Local Impacts of a Global Crisis: Food Price Transmission and Poverty Impacts in Ghana”
IFPRI Report 2
table continues next page
Annex 3A: l iterature r eview

80 Price Transmission from World to Local Grain Markets in Developing Countries
Trade Policy and Food Security • http://dx.doi.org/10.1596/978-1-4648-0305-5
t able 3A.1 studies included in the l iterature r eview (continued)
Author(s) and year published Title Institution or publication
Type of publication
Number of market pairs
Ghoshray 2008 “Asymmetric Adjustment of Rice Export Prices: The Case of Thailand and Vietnam”
International Journal of Applied Economics
Journal 5
Imai, Gaiha, and Thapa 2008
“Transmission of World Commodity Prices to Domestic Commodity Prices in India and China”
Brooks World Poverty Institute
Report 12
Listorti and Esposti 2008
“Making the World Market Price Endogenous within AGMEMOD Modeling Framework: An Econometric Solution”
Università Politecnica delle Marche
Conference 1
Warr 2008 “The Transmission of Import Prices to Domestic Prices: An Application to Indonesia”
Applied Economics Letters Journal 3
Myint 2007 “Myanmar Rice Market: Market Integration and Price Causality”
Yezin Agricultural University
Thesis 2
Reddy 2006 “Commodity Market Integration: Case of Asian Rice Markets”
Centre for Studies in International Relations and Development
Report 18
Thomas 2006 Trade Reforms and Food Security: Country Case Studies and Synthesis
FAO Book 18
Yavapolkul, Gopinath, and Gulati 2006
“Post–Uruguay Round Price Linkages between Developed and Developing Countries: The Case of Rice and Wheat Markets”
Agricultural Economics Journal 4
Conforti 2004 “Price Transmission in Selected Agricultural Markets”
FAO Report 134
Sagidova 2004 “Price Transmission in Grain Market: Case of Ukraine”
National University of Kyiv-Mohyla Academy
Thesis 4
Baffes and Gardner 2003
“The Transmission of World Commodity Prices to Domestic Markets under Policy Reforms in Developing Countries”
Journal of Economic Policy Reform
Journal 44
Hai 2003 “Rice Markets in the Mekong River Delta, Vietnam: A Market Integration Analysis”
Centre for ASEAN Studies Report 1
Rapsomanikis, Hallam, and Conforti 2003
“Market Integration and Price Transmission in Selected Food and Cash Crop Markets of Developing Countries: Review and Applications”
FAO Book 3
Sharma 2003 “The Transmission of World Price Signals: The Concept, Issues, and Some Evidence from Asian Cereal Markets”
Organisation for Economic Co-operation and Development
Book 16
Ghoshray 2002 “Asymmetric Price Adjustment and the World Wheat Market”
Journal of Agricultural Economics
Journal 180
Mohanty, Smith, and Peterson 1996
“Time Series Evidence of Relationships between U.S. and Canadian Wheat Prices”
Iowa State University Report 8
Note: FAO = Food and Agriculture Organization of the United Nations; IAMO = Leibniz-Institut für Agrarentwicklung in Mittel und Osteuropa; IFPRI = International Food Policy Research Institute.

Price Transmission from World to Local Grain Markets in Developing Countries 81
Trade Policy and Food Security • http://dx.doi.org/10.1596/978-1-4648-0305-5
Annex 3B: prevalence of Different international prices in the l iterature
Figure 3B.1 t he prevalence of Different international maize prices in the l iterature s ample
Source: Based on calculations with literature sample.Note: FOB = free on board.
0 20 40 60 80 100 120 140
South African white maize,FOB Johannesburg
U.S. No. 2 Yellow, FOB Gulf
U.S. Yellow, FOB Louisiana Gulf
White maize export, Durban
Not specified
Number of cases

82 Price Transmission from World to Local Grain Markets in Developing Countries
Trade Policy and Food Security • http://dx.doi.org/10.1596/978-1-4648-0305-5
Figure 3B.2 t he prevalence of Different international r ice prices in the l iterature s ample
Source: Based on literature sample.
0 20 40 60 80 100 120 140
Argentina
India
Thai 100
Thai 15%
Thai 35%
Thai 5%
Thai A1
Uruguay
United States
Not specified
Number of cases
Figure 3B.3 t he prevalence of Different international Wheat prices in the l iterature s ample
Source: Based on literature sample.Note: FOB = free on board.
0 20 40 60 80
Australian Standard WhiteAmber Durum No. 1, Vancouver
Amber Durum No. 1, Great LakesCanadian Western Red Spring No. 1, Pacific Northwest
Canadian Western Red Spring No. 1, St. LawrenceEuropean Union
French Channel Class 1, FOB RouenU.S. Dark Northern Spring, Gulf of Mexico
U.S. Dark Northern Spring, Pacific NorthwestU.S. No. 1 Hard Red Winter, FOB Gulf of MexicoU.S. No. 2 Hard Red Winter, FOB Gulf of Mexico
U.S. Soft Red Winter, Gulf of MexicoU.S. Western White, Pacific Northwest
Not specified
Number of cases

Price Transmission from World to Local Grain Markets in Developing Countries 83
Trade Policy and Food Security • http://dx.doi.org/10.1596/978-1-4648-0305-5
notes
1. The FAO GIEWS food price data set was established in 2009 as part of the FAO Initiative on Soaring Food Prices. The prices reported in GIEWS are collected from national official sources and nonofficial institutions. The GIEWS price series are monthly, and most run through to the end of 2011; some start as early as 1995, others as late as 2008. There are in total 57 domestic prices for wheat, 262 domestic prices for rice, and 180 domestic prices for maize. We impose a minimum length of 10 observations for a time series to be considered in our analysis and analyze price transmission between domestic prices and those international prices presented in this chapter. We are grateful to David Hallam from FAO for providing us with these data in electronic form.
2. Although many methods exist for estimating price transmission, the use of a compara-tively simple vector error correction model permits an automated analysis of a large number of domestic–international price pairs. See the brief description of various models, including their pros and cons, and the rationale for using the vector error cor-rection model in Greb and others (2012).
r eferences
Aldaz-Carroll, Enrique, Gonzalo Varela, and Leonardo Iacovone. 2010. “Commodity Price Shocks and Market Integration in Indonesia.” In Boom, Bust and Up Again? Evolution, Drivers and Impact of Commodity Prices: Implications for Indonesia, 51–71. Washington, DC: World Bank.
Araujo-Enciso, Sergio René. 2009. “Evidence of Non-Linear Price Transmission between Maize Markets in Mexico and the US.” Paper prepared for conference, International Association of Agricultural Economists, Beijing, August 16–22.
Baffes, John, and Bruce Gardner. 2003. “The Transmission of World Commodity Prices to Domestic Markets under Policy Reforms in Developing Countries.” Journal of Economic Policy Reform 6 (3): 159–80.
Bamuturaki. 2009. “World Market Integration and Price Transmission in Selected Markets in Tanzania.” PhD thesis, Institute of Agricultural Policy and Agricultural Markets, University of Hohenheim, Stuttgart, Germany.
Baquedano, Felix, William Liefert, and Shahla Shapouri. 2011. “World Market Integration for Export and Food Crops in Developing Countries: A Case Study for Mali and Nicaragua.” Agricultural Economics 42 (5): 619–30.
Conforti, Piero. 2004. “Price Transmission in Selected Agricultural Markets.” Commodity and Trade Policy Working Paper 7, Food and Agriculture Organization of the United Nations, Rome.
Cudjoe, Godsway, Clemens Breisinger, and Xinshen Diao. 2008. “Local Impacts of a Global Crisis: Food Price Transmission and Poverty Impacts in Ghana.” IFPRI Discussion Paper 00842, Washington, DC.
Dawe, David. 2009. “Price Stabilization for Staple Foods: Costs and Benefits, Implications for Modeling, and Using Trade Policy as a Safety Net.” Paper prepared for “Meeting on Uncertainty and Price Volatility of Agricultural Commodities,” Mouvement pour une organisation mondiale de l’agriculture, Paris, June.
Djuric, Ivan, Linde Götz, and Thomas Glauben. 2011. “Effects of the Governmental Market Interventions on the Wheat Market in Serbia during the Food Crisis 2007/2008.”

84 Price Transmission from World to Local Grain Markets in Developing Countries
Trade Policy and Food Security • http://dx.doi.org/10.1596/978-1-4648-0305-5
German Association of Agricultural Economists (GEWISOLA), 51st Annual Conference, Halle, Germany, September 28–30.
Dutoit, Laure, Karla Hernández-Villafuerte, and Cristóbal Urrutia. 2009. “Price Transmission in Latin American Maize and Rice Markets.” Unpublished manuscript, Economic Commission for Latin America and the Caribbean, Santiago.
FAO (Food and Agriculture Organization of the United Nations), IFAD (International Fund for Agricultural Development), IMF (International Monetary Fund), OECD (Organisation for Economic Co-operation and Development), UNCTAD (United Nations Conference on Trade and Development), WFP (World Food Programme), World Bank, WTO (World Trade Organization), IFPRI (International Food Policy Research Institute), and UN High-Level Task Force on Global Food Security. 2011. Price Volatility in Food and Agricultural Markets: Policy Responses. Policy report to the Group of 20. http://www.ifad.org/operations/food/documents/g20.pdf.
Ghoshray, Atanu. 2002. “Asymmetric Price Adjustment and the World Wheat Market.” Journal of Agricultural Economics 53 (2): 299–317.
———. 2008. “Asymmetric Adjustment of Rice Export Prices: The Case of Thailand and Vietnam.” International Journal of Applied Economics 5 (2): 80–91.
———. 2011. “Underlying Trends and International Price Transmission of Agricultural Commodities,” Economics Working Papers 257, Asian Development Bank, Manila.
Gilbert, Christopher. 2011. “Grains Price Pass-Through, 2005–09.” In Safeguarding Food Security in Volatile Global Markets, edited by Adam Prakash, 122–48. Rome: Food and Agriculture Organization of the United Nations.
Goetz, Linda, Thomas Glauben, and Bernhard Brummer. 2010. “How Did Policy Interventions in Wheat Export Markets in Russia and Ukraine during the Food Crisis 2007/2008 Influence World Market Price Transmission?” Paper presented at the 50th Annual Conference, German Association of Agricultural Economists, Braunschweig, Germany, September 29–October 1.
Greb, Friederike, Nelissa Jamora, Carolin Mengel, Stephan von Cramon-Taubadel, and Nadine Würriehausen. 2012. “Price Transmission from World to Domestic Markets.” Discussion Paper 125, Courant Research Centre, Department of Agricultural Economics and Rural Development, University of Göttingen, Göttingen, Germany.
Hai, Luu Thanh Duc. 2003. “Rice Markets in the Mekong River Delta, Vietnam: A Market Integration Analysis.” CAS discussion Paper 40, Centre for ASEAN Studies, University of Antwerp, Belgium.
Imai, Katsushi, Raghav Gaiha, and Ganesh Bahadur Thapa. 2008. “Transmission of World Commodity Prices to Domestic Commodity Prices in India and China.” Working Paper 45, Brooks World Poverty Institute, University of Manchester, Manchester, U.K.
IMF (International Monetary Fund) and World Bank. 2011. Managing Volatility in Low-Income Countries: The Role and Potential for Contingent Financial Instruments. Washington, DC: IMF and World Bank.
Listorti, Giulia, and Roberto Esposti. 2008. “Making the World Market Price Endogenous within AGMEMOD Modeling Framework: An Econometric Solution.” Paper pre-sented at the 107th Seminar, European Association of Agricultural Economists, Seville, Spain, January 30–February 1.
Minot, Nicholas. 2011. “Transmission of World Food Price Changes to Markets in Sub-Saharan Africa.” IFPRI Discussion Paper 01059, Washington, DC.

Price Transmission from World to Local Grain Markets in Developing Countries 85
Trade Policy and Food Security • http://dx.doi.org/10.1596/978-1-4648-0305-5
Mohanty, Samarendu, Darnell B. Smith, and E. Wesley Peterson. 1996. “Time Series Evidence of Relationships between U.S. and Canadian Wheat Prices.” Working Paper 96-WP 154, Center for Agricultural and Rural Development, Iowa State University, Ames, Iowa.
Myers, Robert J., and T. S. Jayne. 2011. “Multiple-Regime Spatial Price Transmission with an Application to Maize Markets in Southern Africa.” American Journal of Agricultural Economics 94 (1): 174–88.
Myint, Theingi. 2007. “Myanmar Rice Market: Market Integration and Price Causality.” PhD thesis, Yezin Agricultural University, Naypyidaw, Republic of the Union of Myanmar.
Rapsomanikis, George, David Hallam, and Piero Conforti. 2003. “Market Integration and Price Transmission in Selected Food and Cash Crop Markets of Developing Countries: Review and Applications.” In Commodity Market Review: 2003–2004, 51–76. Rome: Food and Agriculture Organization of the United Nations.
———. 2009. The 2007–2008 Food Price Policy: Impact and Policies in Eastern and Southern Africa. Rome: Food and Agriculture Organization of the United Nations.
Reddy, Amarender. 2006. “Commodity Market Integration: Case of Asian Rice Markets.” CSIRD Discussion Paper 16/2006, Centre for Studies in International Relations and Development, Kolkata, India.
Robles, Miguel, and Máximo Torero. 2010. “Understanding the Impact of High Food Prices in Latin America.” Economía 10 (2): 117–64.
Sagidova, Gyulnara. 2004. “Price Transmission in Grain Market: Case of Ukraine.” Master’s thesis, National University of Kyiv-Mohyla Academy, Kyiv, Ukraine.
Sharma, Ramesh. 2003. “The Transmission of World Price Signals: The Concept, Issues, and Some Evidence from Asian Cereal Markets.” In Agricultural Trade and Poverty: Making Policy Analysis Count,” 119–39. Paris: Organisation for Economic Co-operation and Development.
Thomas, Harmon. 2006. Trade Reforms and Food Security: Country Case Studies and Synthesis. Rome: Food and Agriculture Organization of the United Nations.
Timmer, C. Peter. 2004. “Food Security in Indonesia: Current Challenges and the Long-Term Outlook.” Working Paper 48, Center for Global Development, Washington, DC.
Warr, Peter. 2008. “The Transmission of Import Prices to Domestic Prices: An Application to Indonesia.” Applied Economics Letters 15 (7): 499–503.
World Bank. 2009. Eastern Africa: A Study of the Regional Maize Market and Marketing Costs. Report 49831, Agriculture and Rural Development, Africa Region, Washington, DC, World Bank.
———. 2012a. “Market-Based Approaches to Managing Commodity Price Risk.” Contribution from the World Bank to the G-20 Commodity Markets Sub Working Group, World Bank, Washington, DC, April 10.
———. 2012b. Responding to Higher and More Volatile World Food Prices. Agriculture and Rural Development Department Report 68420-GLB. Washington, DC: World Bank.
Yavapolkul, Navin, Munisaamy Gopinath, and Ashok Gulati. 2006. “Post–Uruguay Round Price Linkages between Developed and Developing Countries: The Case of Rice and Wheat Markets.” Agricultural Economics 34 (2006): 259–72.


87 Trade Policy and Food Security • http://dx.doi.org/10.1596/978-1-4648-0305-5
Trade Policy Responses to High and Volatile Food PricesIan Gillson and Christina Busch
introduction
Following three decades of decline, world food prices have spiked three times in the past five years. Poor net food consumers, especially those living in urban areas of developing countries, have been the hardest hit by high food prices and increased volatility. Yet there is no global food shortage: the problem is local, or sometimes regional, and involves moving food, often across borders, from surplus production areas to deficit ones. Increased trade in food, therefore, would be an excellent buffer for domestic fluctuations in food supply because world output of a given food commodity is far less variable than output in individual countries. Thus, increased trade integration holds considerable potential to stabilize food prices, boost returns to farmers, and reduce consumer prices in developing countries.
Trade liberalization protects national food markets against domestic supply shocks by allowing more food to be imported in times of shortage and exported in periods of plenty. However, most countries have taken the opposite approach by restricting imports of food and discouraging exports in often failed attempts to keep domestic markets isolated from world prices. A country that is a natural exporter should not hinder its comparative advantage with export bans, and a country that tends to import food should allow its domestic market to remain linked to the world market. Food security therefore requires encouraging more trade, including through a more open, rules-based multilateral trade regime—best achieved by concluding the Doha Round of World Trade Organization (WTO) negotiations and supported by further work toward developing new disciplines on export restrictions.
Efforts to extend trade integration to developing countries should also focus on promoting more effective regional integration among them, includ-ing for food products. Facilitating food trade is also important through increased use of Aid for Trade to support reforms to logistics and promote frictionless borders.
c H A p t e r 4

88 Trade Policy Responses to High and Volatile Food Prices
Trade Policy and Food Security • http://dx.doi.org/10.1596/978-1-4648-0305-5
t rade in Food
Global production of cereals has almost tripled in the past 50 years, outpacing the twofold rise in world population. Yet over a billion people in the world remain hungry. Cereals form the staple diet of poor people and are their main imported food item. In 2012, 40 percent of least developed country (LDC) imports of food were cereals. Increasing consumption of vegetables and meat is indicative of growing incomes, and these items typically account for half of the food imports by developed countries.
Wheat, maize, and rice account for the majority of trade in cereals; maize and other coarse grains are not only consumed by humans, but also used as animal feed in meat production and for the manufacture of biofuels. Most cereal pro-duction is for domestic consumption (figure 4.1), with just 10 percent of world production traded globally. During the past decade, only 20 percent of all wheat produced globally was traded, and rice trade accounted for only 6 percent of global rice production (Kshirsagar and Baffes 2011). In these markets, therefore, any shocks to demand and supply have the potential to create significant instabil-ity in prices, at least for the portion of the goods that are traded. In 2012, adverse weather drove world maize prices to all-time highs and world wheat prices up 50 percent (World Bank 2012). Poorly integrated markets exacerbated the problem when price signals failed to induce supply responses by producers.
In value terms, approximately two-thirds of world food exports go to devel-oped countries and just under one-third to middle-income countries. LDCs are insignificant in world food trade: their share is just 1 percent. However, food trade forms a higher share of the total trade basket of developing countries compared to developed countries (figure 4.2; FAO 2010). Compared to other
Figure 4.1 most c ereal production is c onsumed Domestically and not t raded
a. Wheat, by global share
Perc
ent
0
5
10
15
20
25
30
35
EU-2
7
China
India
United St
ates
Russian
Feder
atio
nCan
ada
Pakist
anAustr
alia
Turk
eyEg
ypt, A
rab Rep
Other
s
Production Consumption
figure continues next page

Trade Policy Responses to High and Volatile Food Prices 89
Trade Policy and Food Security • http://dx.doi.org/10.1596/978-1-4648-0305-5
Sources: U.S. Department of Agriculture, 2006–10 averages; Kshirsagar and Baffes 2011.Note: EU-27 = Austria, Belgium, Bulgaria, Cyprus, the Czech Republic, Denmark, Estonia, Finland, France, Germany, Greece, Hungary, Ireland, Italy, Latvia, Lithuania, Luxembourg, Malta, the Netherlands, Poland, Portugal, Romania, the Slovak Republic, Slovenia, Spain, Sweden, and the United Kingdom.
Production Consumption
0
5
10
15
20
25
30
35
ChinaIndia
Indonesia
Bangladesh
Vietnam
Thailand
Myanmar
Philippines
Others
b. Rice, by global share
Perc
ent
Figure 4.1 most c ereal production is c onsumed Domestically and not t raded (continued)
Figure 4.2 Food t rade matters most for l ow-income c ountries
0
5
10
15
20
25
30
35
a. Food exports, by country income group
19901991
19931992
19941995
19961997
19981999
20002001
20022003
20042005
20062007
20082009
Shar
e of
exp
orte
d go
ods
(%)
High incomeLow income Middle income World
figure continues next page

90 Trade Policy Responses to High and Volatile Food Prices
Trade Policy and Food Security • http://dx.doi.org/10.1596/978-1-4648-0305-5
parts of the world, Sub-Saharan Africa has some of the highest shares of food imports in total imports. Although not all developing countries depend on food imports, how food is moved within and across borders has clear implications for poor farmers and consumers, who spend a large share of their household income on food.
Markets in key cereals are often dominated by just a few players (figure 4.3). Exports of wheat come mainly from developed countries, while those of rice come from developing ones. In the case of wheat, over 62 percent is exported by the United States, the European Union (EU), Canada, and Australia—all countries with highly protected agricultural sectors. Exports of rice are domi-nated by South and East Asian economies, but only 6–7 percent of global pro-duction is traded. Market concentration in cereals has reduced over time, with an increasingly diversified export base, though the United States continues to dominate trade in maize (Kshirsagar and Baffes 2011). Import markets are, and have historically been, less concentrated than export markets (Kshirsagar and Baffes 2011).
Trade policy actions by exporting and importing countries can have indirect effects in food markets, often related to food commodity prices. For example, an export restriction on rice exports, even if it does not directly influence the world price, can still lead to market behavior that indirectly affects the world price. This circumstance happened in 2008 when a new export restriction in India prompted other rice exporters to impose restrictions of their own. Wheat, rice, and maize prices share a positive correlation—price changes as a result of temporary production or export disruptions can affect the price of substitute products (Ivanic, Martin, and Zaman 2011).
Sources: World Bank Development Data Platform, http://data.worldbank.org/; Comtrade Database, United Nations, http://comtrade.un.org.
02468
101214161820
b. Food imports, by country income group
19901991
19921993
19941995
19961997
19981999
20002001
20022003
20042005
20062007
20082009
Shar
e of
exp
orte
d go
ods
(%)
High incomeLow income Middle income World
Figure 4.2 Food t rade matters most for l ow-income c ountries (continued)

Trade Policy Responses to High and Volatile Food Prices 91
Trade Policy and Food Security • http://dx.doi.org/10.1596/978-1-4648-0305-5
Figure 4.3 t rade in Key c ereals is Dominated by Just a Few c ountriesPercent
a. Global share of top wheat exporters
United States,23
EU-27,15
Canada,14
Australia,10
Russian Federation,10
Argentina,7
Kazakhstan,6
Ukraine,5
Others,10
b. Global share of top rice exporters
Thailand,31
Vietnam,18
India,11
Pakistan,10
United States,11
China,3
Uruguay,3
Cambodia,3
Others,10
figure continues next page

92 Trade Policy Responses to High and Volatile Food Prices
Trade Policy and Food Security • http://dx.doi.org/10.1596/978-1-4648-0305-5
Higher World Food prices and t heir t rade effects
Food prices remain at historically high levels (figure 4.4), contributing to differ-ing terms-of-trade effects across developing countries as well as distributional effects within them.
The effect of global food inflation on external balances, growth, and welfare critically depends on the terms-of-trade effects of higher food prices. The increase in world food prices implies terms-of-trade gains for net exporting coun-tries of food products and losses as food deficits for net importing countries (figure 4.5). For example, net food importers in the Horn of Africa, such as Ethiopia, Kenya, and Somalia, currently face droughts, famines, and humanitarian emergencies affecting more than 13 million people, as well as soaring domestic food prices (between 30 and 240 percent for red sorghum and maize in the case of Somalia). Tanzania and Uganda, in contrast, have benefited from the higher prices because they remain net exporters (mostly for maize).
However, differences in aggregate food trade balances can also be deceptive and conceal large variations at the product level (Canuto 2011). In the Andean
Sources: U.S. Department of Agriculture, 2006–10 averages; Kshirsagar and Baffes 2011.Note: EU-27 = Austria, Belgium, Bulgaria, Cyprus, the Czech Republic, Denmark, Estonia, Finland, France, Germany, Greece, Hungary, Ireland, Italy, Latvia, Lithuania, Luxembourg, Malta, the Netherlands, Poland, Portugal, Romania, the Slovak Republic, Slovenia, Spain, Sweden, and the United Kingdom.a. Coarse grains are those used as feed (maize, millet, sorghum, and barley).
c. Global share of top exporters of coarse grainsa
United States,48
Argentina,14
Brazil,8
Ukraine,7
EU-27,4
Canada,4
Australia,4
India,2
Others,9
Figure 4.3 t rade in Key c ereals is Dominated by Just a Few c ountries (continued)Percent

Trade Policy Responses to High and Volatile Food Prices 93
Trade Policy and Food Security • http://dx.doi.org/10.1596/978-1-4648-0305-5
Figure 4.4 r ecent Food price spikes
Source: Food and Agricultural Organization of the United Nations, http://faostat3.fao.org/faostat-gateway /go/to/home/E.
0
50
19901992
19941996
19982000
20022004
20062008
20102012
2014
100
150
200
250
a. Aggregate food price index, 1990–2013
Food
pri
ce in
dex
(199
0 =
100)
b. Food commodity price indexes, 2012–13
150
175
200
225
Food
com
mod
ity p
rice
inde
xes
(200
2–04
= 1
00)
250
275
300
325
350
J F M A M J J A S O N D J F M A M J J A S O N D
2012 2013
MeatSugar CerealsOils and fats Dairy

94 Trade Policy Responses to High and Volatile Food Prices
Trade Policy and Food Security • http://dx.doi.org/10.1596/978-1-4648-0305-5
region, for example, Bolivia, Colombia, Ecuador, and Peru are all net food export-ers, but they do not export the same food commodities. Bolivia is the only net exporter of cereals and vegetable oils, the prices of which have spiked. In the other three countries, however, coffee and bananas drive the net exporting positions.
Moreover, increases in global prices do not always translate into equivalent food price increases in domestic markets. Rather, a variety of other factors helps explain stark differences in domestic price fluctuations across countries even when world food prices decline or remain unchanged. These factors include changes in the value of the dollar (commodity prices are frequently expressed in dollars); local transport costs (often arising from inadequate competition in road transport markets); market distortions and price controls set by govern-ments; the persistence of trade barriers; and good harvests in some developing countries despite bad ones in a number of the largest grain-exporting economies (for example, good maize, sorghum, millet, and cassava harvests in some African countries, which have allowed for substitution of imported wheat and rice).
t rade policy r esponses
Given that the trade effects of higher food prices vary depending on whether a country is a net importer or a net exporter of food, the trade policy responses have been mixed. Generally, however, the trade policy environment has not
Figure 4.5 net Food-importing r egions l ose from Higher Food prices and vice versa
Source: World Bank, http://data.worldbank.org/.Note: Terms-of-trade changes in food trade, by developing region, year-on-year change as a share of gross domestic product (GDP).
–0.65
–0.45
–0.25
–0.05
0.15
0.35
0.55
East Asia
and
Pacific
Europe and Centra
l
Asia
Latin Americ
a and
the Carib
bean
Middle East and
North Afri
ca
South Asia
Sub-Saharan
Africa
Chan
ge in
term
s of
trad
e (%
)
2006/2005 2007/2006 2008/2007 2009/2008 2010/2009 2011/2010

Trade Policy Responses to High and Volatile Food Prices 95
Trade Policy and Food Security • http://dx.doi.org/10.1596/978-1-4648-0305-5
changed in favor of food security over the past several years. According to surveys by the International Trade Centre, nontariff measures (NTMs) affect trade in agricultural products more than trade in manufactured products.
For a number of staple food commodities, many governments intervene in their food markets, including through the use of various export and import restrictions, in attempts to reduce the volatility of domestic prices relative to world prices. In developing countries, this approach often reflects the sensi-tivity of governments to volatile prices for important staples, either to protect consumers against low prices or to maintain higher domestic prices for producers. Although such measures may be second-best complements to storage policies for small and open developing countries concerned about the adverse effects of high prices for staple foods (Gouel and Jean 2012), trade restrictions are not a cooperative way to address price volatility and can even exacerbate the problem.
Trade restrictions have both direct and indirect effects on world food prices. Trade-distorting policies displace and reduce the efficiency of agricultural pro-duction globally and make it less resilient to exogenous shocks. Policies that dis-tort production and trade in food commodities also potentially impede the achievement of long-run food security by promoting production in areas where it would otherwise not occur and by obscuring the transmission of price signals to efficient producers elsewhere. Furthermore, a collective action problem may emerge. Countries that simultaneously insulate their domestic markets against global price shocks through restrictive trade measures may well create higher volatility for global food prices (Martin and Anderson 2011).
Traditionally, the trade policies of developed countries have been responsible for pushing down the world prices of agricultural products, including those exported by developing countries. Tariffs on food trade are highest for middle-income and high-income countries, averaging 22 percent (Boumellassa, Laborde, and Mitaritonna 2009). In developed countries, agricultural protection indeed remains high, but it has declined from its peak level during the 1980s. Over the past two decades, there has been a shift in the use of agricultural protection by developing countries, with increases in protection on import-competing goods despite reductions in export taxes. Although lowering global protection can be expected to raise demand and therefore increase world food prices by a relatively small degree, global trade liberalization is likely to lower prices faced by consum-ers in developing countries; the rise in world prices would then be offset by reductions in domestic ones.
Cooperative options to lowering domestic food prices therefore include permanently reducing import tariffs and other taxes on key staples and agricul-tural inputs. Instead, countries often tactically lower import barriers on food temporarily during periods of domestic food scarcity only to reimpose them later when yields have improved, again exacerbating world price volatility. In regions such as the Middle East and North Africa, congestion within the supply chain and ports can result when traders hoard in expectation of a rise in tariffs (World Bank and FAO 2012). “Water” in the tariff (the difference between bound and

96 Trade Policy Responses to High and Volatile Food Prices
Trade Policy and Food Security • http://dx.doi.org/10.1596/978-1-4648-0305-5
applied rates) can leave significant room for countries to raise their applied tariffs on food imports, also compounding world price volatility.
Other trade measures such as export restrictions and NTMs, including domestic policies such as price support, also influence the extent to which price changes in domestic markets reflect world prices. The WTO reports that the incidence of trade restrictions has been on the rise since May 2012. Protection measures by the Group of Twenty (G-20) countries—the main users of trade restrictions—now account for nearly 4 percent of world mer-chandise imports, with over 1,000 trade restrictive measures introduced between September 2008 and November 2013 (WTO 2013). NTMs, espe-cially quantitative import restrictions, have been a prominent instrument in the trade policy portfolios of many countries during that time (Datt, Hoekman, and Malouche 2011; Malouche, Reyes, and Fouad 2013), and the increased use of export restrictions for agricultural products is at least partially attributable to higher world food prices. Since September 2008, G-20 countries have been slightly more active users of trade restrictions on food products, which have been applied most frequently to trade in meat, livestock, and grains. Trade rem-edy measures are among the most frequently used restrictions on food products (figure 4.6).
Direct subsidies to farmers in developed countries remain a major source of support, but pose disadvantages to producers in other countries and distort world
Figure 4.6 t he most Frequent Users of t rade r estrictive measures on Food products Are G-20 c ountries
a. Food products facing new trade restrictions,September 2008 through July 2014
0 20 40 60 80 100
Beverages
Dairy products
Number of restrictions
Grain mill products,starches and starch products
Live animals andanimal products
Meat, fish, fruit,vegetables, oils and fats
Non-G-20 G-20
figure continues next page
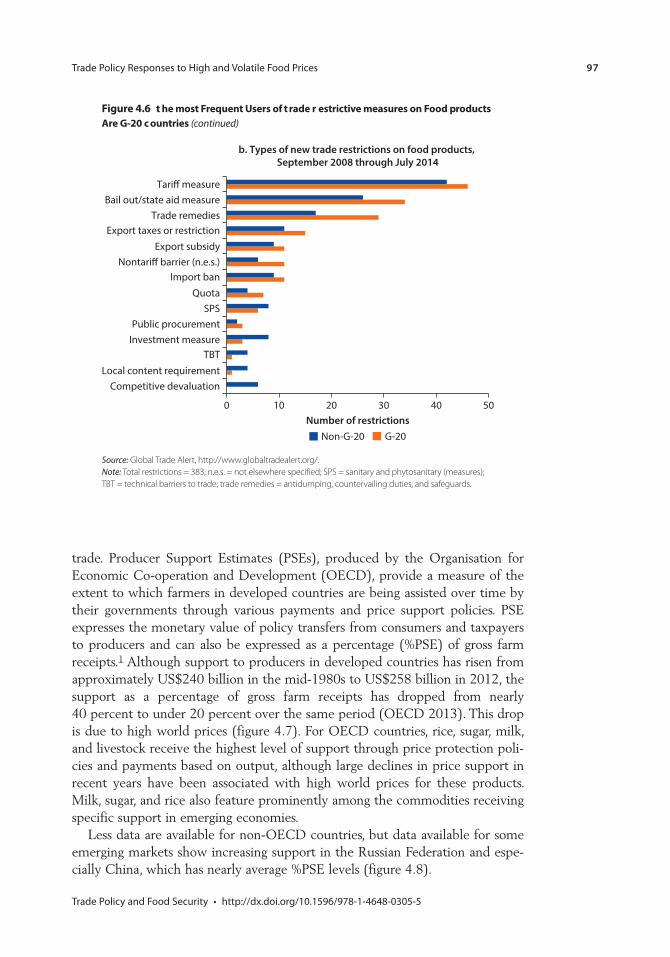
Trade Policy Responses to High and Volatile Food Prices 97
Trade Policy and Food Security • http://dx.doi.org/10.1596/978-1-4648-0305-5
trade. Producer Support Estimates (PSEs), produced by the Organisation for Economic Co-operation and Development (OECD), provide a measure of the extent to which farmers in developed countries are being assisted over time by their governments through various payments and price support policies. PSE expresses the monetary value of policy transfers from consumers and taxpayers to producers and can also be expressed as a percentage (%PSE) of gross farm receipts.1 Although support to producers in developed countries has risen from approximately US$240 billion in the mid-1980s to US$258 billion in 2012, the support as a percentage of gross farm receipts has dropped from nearly 40 percent to under 20 percent over the same period (OECD 2013). This drop is due to high world prices (figure 4.7). For OECD countries, rice, sugar, milk, and livestock receive the highest level of support through price protection poli-cies and payments based on output, although large declines in price support in recent years have been associated with high world prices for these products. Milk, sugar, and rice also feature prominently among the commodities receiving specific support in emerging economies.
Less data are available for non-OECD countries, but data available for some emerging markets show increasing support in the Russian Federation and espe-cially China, which has nearly average %PSE levels (figure 4.8).
Source: Global Trade Alert, http://www.globaltradealert.org/.Note: Total restrictions = 383; n.e.s. = not elsewhere specified; SPS = sanitary and phytosanitary (measures); TBT = technical barriers to trade; trade remedies = antidumping, countervailing duties, and safeguards.
b. Types of new trade restrictions on food products, September 2008 through July 2014
Number of restrictionsNon-G-20 G-20
0 10 20 30 40 50
Competitive devaluationLocal content requirement
Investment measureTBT
Public procurementSPS
Import ban
Quota
Nontari� barrier (n.e.s.)
Export taxes or restrictionExport subsidy
Trade remediesBail out/state aid measure
Tari� measure
Figure 4.6 t he most Frequent Users of t rade r estrictive measures on Food products Are G-20 c ountries (continued)

98 Trade Policy Responses to High and Volatile Food Prices
Trade Policy and Food Security • http://dx.doi.org/10.1596/978-1-4648-0305-5
Figure 4.7 support by Developed oec D c ountries to Agricultural producers, 1996–2010
0102030405060708090100
0
200,000
400,000
600,000
800,000
1,000,000
1,200,000
19961997
19981999
20002001
20022003
20042005
20062007
20082009
2010
a. Developed country OECD members
US$
(mill
ions
)
Shar
e of
tota
l far
m re
ceip
ts (%
)
19961997
19981999
20002001
20022003
20042005
20062007
20082009
20100102030405060708090100
0
100,000
200,000
300,000
400,000
500,000
600,000
b. European Union
US$
(mill
ions
)
Shar
e of
tota
l far
m re
ceip
ts (%
)
Total value of production (at farm gate) PSE MPS Percentage of PSE
0102030405060708090100
010,00020,00030,00040,00050,00060,00070,00080,00090,000
100,000
19961997
19981999
20002001
20022003
20042005
20062007
20082009
2010
c. Japan
US$
(mill
ions
)
Shar
e of
tota
l far
m re
ceip
ts (%
)
figure continues next page

Trade Policy Responses to High and Volatile Food Prices 99
Trade Policy and Food Security • http://dx.doi.org/10.1596/978-1-4648-0305-5
A noteworthy feature of trade policy action since the financial crisis is that countries have also pursued trade liberalization and protection in efforts to lower domestic prices for households and industries. Although some countries have increased their import tariffs on food products—for example, Russia increased its tariffs to 5,080 percent on imports of pigs, pork, and poultry—tariff reductions on food imports were far more frequent over this period. In some cases, the reductions in import tariffs were significant. For example, Turkey reduced its tariffs on livestock from 135–225 percent to 0–20 percent. Most food tariff reductions were on grains and sugar, followed by meat, edible oil, and dairy products. Additionally, some countries have tried to stimulate exports with various incentives: Brazil, through duty drawback schemes on meat exports, and the EU and the United States, with refunds and incentives for their dairy industries.
Developing countries also use policies that adversely affect food trade and are highly restrictive, such as food marketing boards, oligopolistic market structures in key parts of the food value chain (for example, milling), price controls, and trade bans. For countries that are net exporters of food, there may be political pressure to restrict food exports in periods of high domestic prices. However, although these policies tend to have a limited effect on domestic price levels, they can have a significant negative effect on earnings from export production (see box 4.1). Countries that insulate their domestic markets foster instability in international markets, especially if they are major producers or consumers of food. For example, the food price problem has been compounded by restrictions on exports of wheat (by Argentina, Kazakhstan, Russia, and Ukraine) and rice (by Vietnam, India, and China) in attempts to decouple domestic markets from global markets to keep domestic prices low.
Sources: World Trade Organization Secretariat based on Organisation for Economic Co-operation and Development data.Note: MPS = market price support; OECD = Organisation for Economic Co-operation and Development; PSE = producer support estimate.
Total value of production (at farm gate) PSE MPS Percentage of PSE
19961997
19981999
20002001
20022003
20042005
20062007
20082009
20100102030405060708090100
0
50,000
100,000
150,000
200,000
250,000
300,000
350,000
400,000
d. United States
US$
(mill
ions
)
Shar
e of
tota
l far
m re
ceip
ts (%
)
Figure 4.7 support by Developed oec D c ountries to Agricultural producers, 1996–2010 (continued)

100 Trade Policy Responses to High and Volatile Food Prices
Trade Policy and Food Security • http://dx.doi.org/10.1596/978-1-4648-0305-5
Figure 4.8 support by s elected non-oec D c ountries to Agricultural producers
–20
0
20
40
60
80
100
–200,000
0
200,000
400,000
600,000
800,000
1,000,000
1,200,000
19961997
19981999
20002001
20022003
20042005
20062007
20082009
2010
a. Selected non-OECD members
Shar
e of
tota
l far
m re
ceip
ts (%
)
–11
0
11
44
66
99
–20,000
0
20,000
19961997
19981999
20002001
20022003
20042005
20062007
20082009
2010
b. Brazil
Shar
e of
tota
l far
m re
ceip
ts (%
)
40,000
60,000
80,000
100,000
120,000
140,000
160,000
180,000
22
33
55
77
88
Total value of production (at farm gate) PSE MPS Percentage of PSE
–12012
46
69
–100,0000
100,000
19961997
19981999
20002001
20022003
20042005
20062007
20082009
2010
c. China
US$
(mill
ions
)U
S$ (m
illio
ns)
US$
(mill
ions
)
Shar
e of
tota
l far
m re
ceip
ts (%
)
200,000300,000400,000500,000600,000700,000800,000900,000
2335
58
8192
figure continues next page

Trade Policy Responses to High and Volatile Food Prices 101
Trade Policy and Food Security • http://dx.doi.org/10.1596/978-1-4648-0305-5
Source: World Trade Organization Secretariat based on Organisation for Economic Co-operation and Development data.Note: Selected non-OECD members are Brazil, China, the Russian Federation, South Africa, and Ukraine. MPS = market price support; OECD = Organisation for Economic Co-operation and Development; PSE = producer support estimate.
–10010
40
–10,0000
20,000
19961997
19981999
20002001
20022003
20042005
20062007
20082009
2010
d. Russian Federation
US$
(mill
ions
)
Shar
e of
tota
l far
m re
ceip
ts (%
)
10,000
30,00040,00050,00060,00070,00080,00090,000
100,000
2030
5060708090100
Total value of production (at farm gate) PSE MPS Percentage of PSE
Figure 4.8 support by s elected non-oec D c ountries to Agricultural producers (continued)
Box 4.1 t he r ussian Federation’s export Ban on Grains
In August 2010, in response to escalating grain prices, Russia imposed a temporary export ban on wheat, barley, rye, and maize, as well as wheat and rye flour, until the end of December 2010. In October 2010, the export ban on grain (not including flour) was extended until the end of June 2011.
The export bans were originally a response to a drought that caused a shortfall in the grain harvest and an associated rapid grain price increase in both domestic and international mar-kets. According to official estimates, farmers harvested almost 37 percent less grain compared to harvests in 2009. The export ban was designed to insulate Russia from highly volatile grain prices by reducing exports in 2010–11 to the 3 million tons already shipped at that time. This resulted in a drop of nearly 12 million tons of exports compared to initial projections for the year. Nevertheless, given current production estimates, together with domestic consump-tion estimated at 78 million tons, it was likely that Russia would become a net importer of grain, depending on the use of stocks.
The export restrictions had unintended and undesirable consequences such as undermin-ing Russia’s long-term policy of becoming an even more important player in the global grain market; encouraging hoarding in expectation of the bans’ removal; distorting prices; and affecting the investment and production decisions of its farmers.
Source: World Bank 2011c.

102 Trade Policy Responses to High and Volatile Food Prices
Trade Policy and Food Security • http://dx.doi.org/10.1596/978-1-4648-0305-5
Smaller developing countries (for example, Malawi, Tanzania, and Zambia) also routinely impose strict controls on food trade, especially if their agricultural sectors remain highly regulated by various interventions at local and national levels. Some countries often ban imports during good harvest years to ensure that domestic production is consumed first, and they also limit exports during periods of low yields to contain domestic price increases. Although these policies are often implemented ostensibly to promote food security in the form of self-sufficiency, they rarely work and can exacerbate food insecurity rather than reduce it (see box 4.2).
Some barriers to trade are not always as visible as outright bans, but come in more nebulous, less apparent forms that nevertheless increase trade costs. Trade costs between Maghreb countries in North Africa—Algeria, Libya, Mauritania, Morocco, and Tunisia—are two to three times higher than those faced by coun-tries just north of the Mediterranean rim (for example, France, Italy, and Spain). This is partly attributable to more NTMs and constraints to intraregional trade versus interregional trade, such as more border controls and limited cross-border cooperation to facilitate trade across land borders (see box 4.3). These regional barriers to trade drive up the costs of trading agricultural products, with signifi-cant implications not only for food security, but also for political stability and economic development.
The persistence of NTMs to trade in food reduces trade in these products. Recent research at the World Bank suggests that the ad valorem equivalent of NTMs on African cross-border trade in food is very high (Gourdon and Cadot 2011). For example, sanitary and phytosanitary regulations on imports of rice raise prices by as much as 42 percent in Kenya and 30 percent in Uganda (see box 4.4).
Bans and other restrictions on food trade as well as government interventions that foment distortions might allow a country to shield consumers from the initial implications of a price hike. However, they do not provide the incentive for a domestic supply response, and these implications should be considered when implementing policies that restrict international trade. Encouraging more trade in food—not less—is essential for achieving food security. Increased reli-ance on trade for production and consumption of food, as well as for inputs, increases farm gate prices without necessarily inflating consumer prices—a win–win for farmers and consumers alike. Indeed, those developing countries that have adopted more open trade policies for food have seen benefits through higher production, exports, and trade in these products together with lower domestic price volatility (see box 4.5).
However, national self-sufficiency in food production remains a highly sensi-tive issue in both developed and developing countries in which political struggles are sometimes played out in food marketing and trade policies. Price shocks on net food-importing countries can also widen current account deficits, put addi-tional pressure on exchange rates, cause a shortage of foreign reserves, and increase social safety net expenditures. For example, during the Arab Spring, the government of Jordan overturned the food subsidy cuts it made in 2008 and introduced tax exemptions for 13 food products. In the Arab Republic of Egypt,

Trade Policy Responses to High and Volatile Food Prices 103
Trade Policy and Food Security • http://dx.doi.org/10.1596/978-1-4648-0305-5
Box 4.2 Zambian Government imports of maize during the s outhern Africa Food c risis
In 2001–02, the Zambian government publicly announced that it would import 200,000 tons of maize from selected South African suppliers to cover the national food deficit and to sell it below market price to a small number of large millers in the formal sector. A subsidy was intended to limit consumer price increases, paid directly to the South African suppliers and importers. Because of liquidity problems, the subsidy was not paid on time, causing a delay in maize imports. When the government finally imported only 130,000 tons of maize late in the season, maize and maize flour shortages occurred and local market prices exceeded import parity. Zambian traders and millers who had not been selected to benefit from the scheme, including informal traders from Mozambique, refrained from importing maize for fear of not being able to sell their own supplies once subsidized maize reached the market. Because grain was channeled to the largest millers only, consumers paid a higher price for already-refined flour instead of sourcing grain and milling it themselves or through the informal network of small hammer mills.
In the same year, Malawi also faced a modest maize production deficit—8 percent below the country’s 10-year average. In September 2001, Malawi’s grain trading parastatal (Agricultural Development and Marketing Corporation [ADMARC]) announced a fixed price for maize to be sold at its distribution centers and declared its intention to import maize from South Africa to maintain this price. Because the selling price was set considerably lower than the landed cost of imported maize, private traders had no incentive to import maize commercially. As with Zambia, the government imports also arrived late and were insufficient to meet demand, so prices soared to a peak of US$450 per ton in early 2002. To make matters worse, the late ADMARC imports arrived during the good 2002 harvest. The imports were then released onto the market—much to the detriment of farmers—resulting in 16 months of continuously falling maize prices. At other times, the sourcing of grain from South Africa and subsequent release onto the domestic market through government contracts with South African suppliers has also depressed informal maize trade with Mozambique. Because Mozambique is the source of informal trade in maize to southern Malawi, these government imports also add greater risks and price instability for Mozambique’s smallholder farmers.
Sources: Jayne, Chapoto, and Govereh 2007; Nijhoff and others 2002, 2003; Rubey 2005.
Box 4.3 t he middle east and north Africa r egion Faces High t rade c osts in Food
The Mediterranean basin, including its European and North African rims, has been an active trading area for over three millennia. Yet trade and logistics patterns between the two rims vary considerably, with the cost of trading between the Middle East and North Africa countries being very high. Trade costs for agricultural goods between countries on the developing, southern rim are three times higher than those experienced between the wealthier, European
box continues next page

104 Trade Policy Responses to High and Volatile Food Prices
Trade Policy and Food Security • http://dx.doi.org/10.1596/978-1-4648-0305-5
Box 4.4 Quantifying the effects of nt ms on t rade in African Food staples
Quantifying the price-raising effect of NTMs was, until recently, constrained by the availability of comparable data across countries. Thanks to a collaborative effort between the World Bank and other agencies, including the United Nations Conference on Trade and Development (UNCTAD) and the African Development Bank, a new wave of data collection has been under-taken. Presently, 65 countries have been covered with NTMs coded for each of the Harmonized System’s 5,000 product lines. Combining this data with price data from the World Bank’s International Comparison project (for a smaller set of products) allows one to estimate directly, using econometric methods, the price-raising effect of NTMs on African food staples.
The approach used consisted of running regressions of country-level product prices on dummy (binary) variables marking the application of NTMs of various types and using a panel of 1,260 country-product pairs. The regressions control for systematic differences in cost of living across countries, as well as in market-structure diversity across products, with a full array of country and product fixed effects. Interaction terms between NTMs and either region or country dummies provide tentative estimates of their price-raising effect in Africa or in specific countries.
box continues next page
Box 4.3 t he middle east and north Africa r egion Faces High t rade c osts in Food (continued)
counterparts (that is, France, Italy, and Spain). Moreover, trade costs within, for example, the Maghreb region or between the Levant countries in the Eastern Mediterranean exceed those incurred externally with Europe.
Four explanatory factors stand out, in descending order of restrictiveness: NTMs that con-strain trade processes; the low quality and fragmentation, by country, of logistics services such as trucking; less developed intraregional infrastructure in terms of ports that easily connect the Maghreb to the Mashreq; and few active transport corridors between countries. Trucking and railway movements are still suspended or heavily controlled at several borders, driven not only by security concerns, but also by a mutual lack of trust regarding standards or origins, especially in the context of the Pan Arab free trade agreement, which will remove tariffs on all goods of Arab origin.
A 2009 World Bank mission counted as many as 10 separate control stops at the Syria–Jordan border, equally distributed on either side. Container dwell time in Morocco and Tunisia is about one week, three days longer than the OECD benchmark. It also exceeds the container dwell time of such emerging Asian economies as Malaysia (4.0 days) and Shanghai (2.5 days). Small reductions in trade costs can result in considerable trade expansion: reduc-ing trade costs by just 5 percent between the Maghreb and Western Europe could increase trade by 22 percent and increase intra-Maghreb trade by 20 percent. The reductions would also facilitate production sharing within a larger market, resulting in more competitive exports to Europe.
Sources: Arvis 2012; Hoekman and Zarrouk 2009; Shepherd 2011.

Trade Policy Responses to High and Volatile Food Prices 105
Trade Policy and Food Security • http://dx.doi.org/10.1596/978-1-4648-0305-5
As is usual with this type of exercise, results should be interpreted with caution, because many confounding influences can affect estimates. Although many controls are used in the regressions to limit these confounding influences, they put heavy demands on the data and result in many coefficients being estimated with large confidence intervals. Nevertheless, the results are telling (see figure B4.4.1). On average, Africa’s sanitary and phytosanitary (SPS) mea-sures, which often suffer from lack of harmonization, poor design, and haphazard enforce-ment, raise the price of food staples by 13–15 percent. Quantitative restrictions, where they are applied, add another 20 percent. Such price increases have the potential to significantly affect the real income of poor households.
Product-specific estimates suggest substantial effects of SPS regulations in Kenya on rice prices (+42 percent), meat (+34–37 percent), fish (+33 percent), and edible oils and fats (29 percent). Rice prices seem to be similarly affected in Uganda (+30 percent), as are meat and fish prices (+41 percent).
Source: Gourdon and Cadot 2011.
Figure B4.4.1 price-r aising effect of nt ms, Africa Average (All Affected products)
Source: Gourdon and Cadot 2011.Note: FE = fixed effect; NTM = nontariff measure; PSI = preshipment inspection; QR = quantitative restriction; SPS = sanitary and phytosanitary (measures); TBT = technical barriers to trade.
–20
–15
–10
–5
0
5
10
Perc
ent
15
20
25
SPS(A)
TBT(B)
PSI and formalities
(C)
Pricecontrols
(D)
QRs(E)
Region FE Country FE
Box 4.4 Quantifying the effects of nt ms on t rade in African Food staples (continued)

106 Trade Policy Responses to High and Volatile Food Prices
Trade Policy and Food Security • http://dx.doi.org/10.1596/978-1-4648-0305-5
the bread subsidy is now estimated to reach around 85 percent of the population (World Bank 2011a). The risk with such measures, however, is that they can become entrenched, incurring high fiscal costs. Moreover, counterproductive disincentives for domestic food producers can ensue if consumer subsidies are met by price controls and trade restrictions.
o pening Food t rade in the pursuit of Food s ecurity
Although the agricultural sector accounts for as little as 6 percent of world trade, it ranks among those sectors that promise the largest potential gains from trade liberalization. And though the agricultural sector suffers from a
Box 4.5 o pen Border policies for t rade in Food
Unlike many other countries in the region, Uganda and Mozambique have consistently retained liberal border policies for food staples. Uganda’s open trade policy for food staples enables traders to offer products and services competitively and reliably and on a sustainable basis. Uganda serves as a food basket for East Africa. The government has not instituted an export restriction on agricultural products, nor has it instituted any recent ban on trade in food. Consequently, the flow of maize from Uganda to Kenya is one of the larger and more consistent cross-border flows in the region (approximately 120,000 tons per year). There is cross-border trade with Rwanda (50,000 tons), and southern Sudan is also becoming a growth market for Ugandan products.
Nevertheless, the most distinct feature of the Ugandan market is the significant presence of the World Food Programme (WFP) and its procurement program. Maize and beans are procured through it, and Uganda accounts for the largest proportion of maize procured by the WFP in Africa (21 percent in 2010), excluding South Africa (which accounted for 24 percent in 2010). The WFP not only buys Ugandan maize and beans for distribution to internally displaced people in the country, but also sends shipments to Burundi, the Democratic Republic of Congo, Kenya, Rwanda, Sudan, and Tanzania. The volumes purchased reached 109,000 tons in 2010. Uganda’s maize policy allows and encourages cross-border trade and supports the WFP pro-curement program. This approach has resulted in greater production of maize and beans, from mostly larger farms that are able to meet the WFP’s quality and quantity requirements.
Mozambique, since the end of its civil war in 1992, has also freely allowed both imports and exports of maize. Because Northern Mozambique is typically a maize surplus area, and because Malawi offers better prices than Southern Mozambique (because of longer distances and higher transport costs to Maputo), traders in Northern Mozambique routinely sell their grain to Malawi and Eastern Zambia. The open border policy enables the resulting deficits in Mozambique’s southern cities to be met by large millers who import grain from South Africa and mill it for domestic sale. Trade (coupled with a 30 percent subsidy on flour for wheat and bread production) has therefore helped stabilize prices in Maputo compared to other capital cities in the region.
Sources: Adapted from Haggblade and others 2008 and World Bank 2009a.

Trade Policy Responses to High and Volatile Food Prices 107
Trade Policy and Food Security • http://dx.doi.org/10.1596/978-1-4648-0305-5
high degree of distortion, it accounts for almost 70 percent of the potential real income gains from trade reform, thus making a strong case for its contin-ued inclusion in WTO negotiations (Laborde and Martin 2012). As a start, at the WTO’s 9th Ministerial Conference in Bali in December 2013, members agreed upon a package of trade measures that included a component on the rules governing agricultural trade. Specifically, the agreement promotes greater information sharing on export subsidies; prescribes methods for governments to partially or fully fill unused tariff rate quotas; and temporar-ily sanctions the use of public stockholding programs for food security in developing countries without the threat of legal reprimand. The agreement also expands the list of WTO-approved subsidy programs, which includes land rehabilitation, soil conservation, resource management, rural employ-ment, and other programs of particular concern to least developed African countries.
However, a broad conclusion to the Doha Round of WTO negotiations could do more to contribute to food price stability by reducing distortions and strengthening disciplines on food trade restrictions, thereby limiting a country’s ability to implement destabilizing policies on world food markets. It would also provide a boost to the world economy, generating a potential stimulus of US$160 billion in real income (Laborde, Martin, and van der Mensbrugghe 2011). The primary deliverable would be enforceable policy commitments by member governments to (a) provide greater security of market access by not raising support for domestic agricultural sectors above a given level (high com-modity prices, for example, could cause farmers in developed countries to resist less to such an agreement); (b) place greater restrictions on the level of permitted tariffs for food imports; and (c) refrain from using certain policies at all, such as export subsidies. Although the Bali Agreement reaffirmed the WTO members’ commitment to “exercise utmost restraint” in implementing export subsidies and other policies with similar effects, it stopped short of instituting a legally binding provision in that regard.
The agreement in Bali also produced a political commitment among developed country members to ensure unfettered duty-free and quota-free market access for LDCs. However, the initiative will be successful only if high-income economies do not exclude certain vital products—including agricultural products—an outcome that remains to be seen. Broader negotia-tions in the context of the Doha Round face a similar dilemma: proposals often stipulate tariff cuts for the most highly regulated products, but allow countries to choose certain products that will be excluded from the cuts, a policy that carries the risk of countries choosing essential and highly protected products to exclude. Depending on the products chosen, a large share of LDC exports could remain affected. For example, more than 70 percent of Bangladesh’s exports to the United States are covered by only 70 tariff lines, which together account for less than 1 percent of all U.S. tariff lines. Similarly, only 39 tariff lines account for 76 percent of Cambodia’s exports to the United States. Therefore, rather than focusing on the number of products,

108 Trade Policy Responses to High and Volatile Food Prices
Trade Policy and Food Security • http://dx.doi.org/10.1596/978-1-4648-0305-5
a better approach might be to limit the volume of imports affected (Laborde and Martin 2012).
Yet the Doha Round is about much more than market access. Concluding the negotiations arguably requires greater recognition of the value that new trade policy disciplines could bring as part of an agreement (Hoekman 2011). For example, although a complete ban on export subsidies for crops such as cotton would be a major step forward, it should not be quantified by estimating the effect of removing extant subsidies—especially in a period where high prices have reduced the prevalence of their use. The ban would be more significant if world prices fell in the future because the decline would not trigger an increase in export subsidies.
WTO disciplines for food export restrictions are weak. There are very few export tariffs that have been bound, and although quantitative restrictions (including for exports) are generally prohibited by Article XI of the General Agreement on Tariffs and Trade, an exception allows members to restrict food exports in times of food shortage. A key issue in the negotiations has also con-cerned flexibilities for developing countries, namely, the treatment of Special Products and a Special Safeguard Mechanism (SSM). Special Products would allow developing countries to designate a percentage of their tariff lines to lower-than-average reductions in import duties with some products not requir-ing any cuts at all. Such a provision would be quite restrictive because, for example, four products alone account for 80 percent of U.S. agricultural exports to China (soya, cotton, bovine hides, and chicken) (Boonekamp 2012). The problem would be compounded by proposals for an SSM that would allow developing countries to raise tariffs in response to increases in import volumes or sharp declines in import prices.
At a minimum, developing a code of conduct to exempt food aid from export restrictions should remain an important priority for the international community. For example, G-20 members in their deliberations have agreed to remove export restrictions and taxes on food purchased for humanitarian purposes by the WFP and not to impose them in the future.
The centerpiece of the Bali package, the Trade Facilitation Agreement, represents a win–win for all countries and could go a long way in restoring confidence in the WTO. Developing countries stand to gain the most from improved trade facilitation, because outdated and inefficient procedures often mean high costs and long delays, which are highly detrimental to food trade. The new agreement is designed to streamline border procedures, increase trans-parency, reduce inefficiencies, and improve competitiveness, but much work remains to help countries, especially the poorest, implement the agreement and reap its benefits. The agreement calls for developed countries to provide tech-nical assistance and capacity building to developing countries and LDCs on mutually agreed terms either bilaterally or through international organizations. A credible commitment on the part of developed countries to support imple-mentation costs was instrumental in passing the deal. According to World Bank

Trade Policy Responses to High and Volatile Food Prices 109
Trade Policy and Food Security • http://dx.doi.org/10.1596/978-1-4648-0305-5
estimates, those costs could range between US$7 million and US$11 million for most developing countries.
The potential for faster agricultural growth in many developing countries could also be unlocked by deeper regional trade integration to complement multilateral liberalization efforts, especially for those trade barriers not handled well to date by WTO negotiations. Recent work done in the Africa region on trade in food staples suggests two main opportunities for closer regional integration: (a) dealing with overly restrictive NTMs, both for food and inputs such as fertilizers and seeds where product standards are a key constraint; and (b) improving conditions for small traders through the development of simplified trade regimes or traders’ charters. Simplifying rules of origin would also help boost regional trade in sensi-tive products, such as wheat flour, as well as harmonize commitments in the various regional trade agreements (RTAs) to deal with the spaghetti bowl effect.
Examples of regional trade in food, both recorded and unrecorded, are numer-ous and include (a) Northern Zambia, where cassava production ensures domes-tic food security, even in drought years, enabling the region to export maize to the Democratic Republic of Congo, Malawi, and elsewhere in Zambia; (b) Eastern Uganda, where bananas and cassava guarantee food security, thereby enhancing maize exports to Kenya with its chronic food deficits; (c) Northern Mozambique, where cassava and Irish potato cultivation provide local food, allowing regular maize exports both north into Kenya and south into Malawi; (d) most of Tanzania, where a combination of rice, cassava, bananas, and maize enables regular cereal exports both north into Kenya and south into Malawi; and (e) South Africa, where large-scale commercialization and mechanization com-bined with modern inputs and irrigation methods enable high yields for the export of cereals northward to Malawi, Southern Mozambique, and Zimbabwe (Haggblade 2008).
To better exploit these opportunities, countries must develop more effective regional trade policy and regulations to link smallholder farmers to urban demand centers across borders. Groups of developing countries have been actively pursuing RTAs that include the formation of free trade areas and cus-toms unions, which for the most part have largely succeeded in reducing tariffs on most goods traded among them. However, as with global trade, the gradual removal of tariffs has made NTMs more visible. For example, export bans, country-specific standards, complex rules of origin, and cumbersome customs requirements across countries often serve to reduce regional trade and destabilize regional food prices.
Additionally, governments have retained the use of safeguards under their various RTAs to exclude food from open regional trade, on the grounds of health and public safety. This approach provides governments with a great deal of dis-cretion over food-related trade policy. Consequently, regional trade policy for agricultural products has essentially become a patchwork of rules implemented unevenly across different countries and enforced inconsistently, generating an opaque policy environment that severely limits trade in food.

110 Trade Policy Responses to High and Volatile Food Prices
Trade Policy and Food Security • http://dx.doi.org/10.1596/978-1-4648-0305-5
t rade and t ransport Facilitation to promote Access to Food
Trade policy restrictions are not the only impediment to the free movement of food across borders. Efficient transport and logistics are critically important to agricultural marketing and are a key component of prices. Yet in developing countries, particularly landlocked LDCs, transport and logistics costs are gener-ally far higher than OECD benchmarks of around 9 percent. For example, on average, transport and logistics account for 48 percent of the cost of U.S. corn imported by Nicaragua and 40 percent of the cost of wheat imported by Honduras (Arvis and others 2012). Of the bottom 10 performers in the 2012 Logistics Performance Index, 8 are African, with 155 countries examined in total (Arvis and others 2012).
Recent work undertaken in the Middle East and North Africa on the grain supply chain for 10 Arab countries finds that the average cost to move wheat from the port to the flour mill is US$40 per ton compared with US$11 per ton in the Netherlands and US$17 per ton in the Republic of Korea—other major wheat-importing countries. It also shows that one of the most significant bottle-necks occurs at the destination port, where vessel waiting and unloading times are relatively long and costly (World Bank and FAO 2012). Proposals to reduce these turnaround times include (a) streamlining customs procedures and inspec-tions and (b) easing congestion through regional cooperation to use ports in neighboring countries rather than relying only on national ones.
Transport and logistics costs are also an important determinant of food costs for importing countries, as well as food price variations within them. For exam-ple, maize prices have increased significantly more in Guatemala than in the rest of Latin America because of higher transport costs. Similarly, sharp increases in the prices of wheat-related products in Azerbaijan, the Kyrgyz Republic, and Tajikistan partly reflect increased transport costs from Kazakhstan (World Bank 2011b). Transport costs are further affected by changes in oil prices (World Bank 2012). Although individual countries cannot do much to reduce ocean freight costs (which may be a significant part of final prices) for bulk, relatively low value commodities such as grains and edible oils, they can pursue proactive policy initiatives to lower costs associated with regional and domestic distribu-tion. Investments in transport infrastructure have a proven record of reducing consumer prices, especially in remote locations such as Nepal. However, a stron-ger focus on the software (regulatory) dimensions of transport, logistics, and trade facilitation projects is also needed (Arvis, Raballand, and Marteau 2010).
Improvements in trade facilitation and logistics reforms, as well as streamlining of regulatory frameworks in the context of simplified border management procedures, can have significant benefits for consumers, while generating a favor-able supply response. When moving formal consignments of food across borders, traders in developing countries often face a host of repetitive fees, permissions, redundant documentation procedures, and uneven certificate-of-origin require-ments. As a result, customs clearance in many developing countries involves long delays, even for perishable goods such as food that should require minimum

Trade Policy Responses to High and Volatile Food Prices 111
Trade Policy and Food Security • http://dx.doi.org/10.1596/978-1-4648-0305-5
clearance times. Individually, most of these requirements may constitute a small delay or expense to traders, but collectively, they represent a significant barrier to trade.
Even when Single Entry Documents have been introduced, the information and accompanying documents—for example, import declaration forms, origin certificates, invoices, import permits, and standards compliance—required from traders can be burdensome. Additionally, small cross-border traders may be unable to provide all of the information for the entry document. For exam-ple, in Tanzania all certificates and permits can be obtained only in person in Dar es Salaam. In Kenya, permits to legally import grain are available only in Nairobi (Nyameino, Kagira, and Njukia 2003). And traders wanting to export food staples from Northern Mozambique to Southern Malawi are required to obtain an export permit from Quelimane on the central coast of Mozambique (Tschirley, Abdula, and Weber 2006). Consequently, food trade can be effec-tively prohibited, subject to tariffs (even if undertaken within the context of an RTA), or pushed into informal channels.
At the global level, gains in trade and GDP growth could be significantly magnified by the liberalization of transport services. The World Bank Services Trade Restrictions Database (http://iresearch.worldbank.org/servicetrade /default.htm) reveals that transport is among the most protected services sectors in both advanced and emerging economies. But the liberalization of international transport requires cooperative action. Even though several important liberaliza-tion initiatives have formed among groups of countries, there have been no meaningful multilateral initiatives, nor has liberalization of air or maritime transport been seriously negotiated as part of the WTO’s services agreement. Access to food will improve considerably if and when the political will to over-come this obstacle finally materializes.
policy measures to support Food s ecurity
Simple, structured, stable, and predictable trade regimes are needed to facilitate food trade that is based on (a) harmonized and easy-to-satisfy border procedures that reflect the capacities of farmers and traders; (b) information on rules and regulations that are easily available and well known; and (c) clear notification procedures for new rules and regulations that allow traders, other governments, and agencies to contest proposed changes and give producers time to adjust.
Increasing the productivity of food production also requires an assessment of the problems that affect the whole value chain, particularly those relating to infrastructure and linkages to markets. The prices that farmers receive and consumers pay for food are influenced by the quality and availability of a range of services that include extension services, transport and logistics services, storage and distribution, and water. Increasing competition in these services can play a positive role in boosting agricultural productivity and improving cost-efficient access to food.

112 Trade Policy Responses to High and Volatile Food Prices
Trade Policy and Food Security • http://dx.doi.org/10.1596/978-1-4648-0305-5
Policy makers are often reluctant to open up to food trade because they are keenly aware that food price shocks can lead to food insecurity and consequently to social unrest. This is certainly the case if instruments such as social safety nets are not available to countries to mitigate the adverse effects on the poor and vulnerable. At the same time, the permanent or transitory nature of a food price shock is not always clear. Policy makers often treat shocks as transitory and use trade policies to protect their consumers. Those policies do not necessarily provide incentives to producers to increase productivity or production. Because various improvements in the food value chain (for example, in trade-related infrastructure) require time to materialize, social safety nets must be simultane-ously enhanced.
Although rising world food prices are currently perceived as a crisis and are clearly a burden to poor net consumers of food, over the long term they could bring significant opportunities to stimulate food production in developing coun-tries. This increased production would improve food security for the poor and enhance the contribution of agriculture to economic growth by attracting invest-ments in agricultural research and more productive agricultural techniques, thereby harnessing gains for small-scale farmers. Countries such as Brazil, Malaysia, and Thailand have made significant progress in agricultural commer-cialization in recent years and have undertaken investments in research and extension services while other countries, such as India and Mali, have improved their market information systems (World Bank 2009b). However, exploiting these opportunities will require an open and predictable trade policy environ-ment for food and food inputs. For example, those policies that seek to control domestic food markets through price controls, direct government involvement in marketing activities, and trade restrictions are all likely to lower the food supply response over the medium term.
In contrast, market-based mechanisms to manage food price risks are likely to mobilize significant new investments from the private sector (Gillson 2011). Market-driven risk management instruments such as futures and options markets, warehouse receipts systems, and weather-index insurance show considerable promise to alleviate government concerns regarding food security by managing food price risks. These instruments impose limited costs to trade and public resources while having the capacity to provide a guaranteed supply of food to feed hungry populations in the event of a shortfall in domestic food production.
One alternative to holding physical stocks of food staples through food secu-rity reserves or trade interventions is the acquisition of futures or options contracts that guarantee the supply of food commodities if needed. However, a major difficulty in using these instruments to manage food staples in developing countries is that there are few relevant markets. One exception is the South African Futures Exchange, which provides regional contracts for white maize, yellow maize, wheat, and sorghum in the form of call options on futures contracts—purchased by paying a premium, executed when needed, or forgone when not required—all without requiring governments to take ownership of the physical commodity unless they need it.

Trade Policy Responses to High and Volatile Food Prices 113
Trade Policy and Food Security • http://dx.doi.org/10.1596/978-1-4648-0305-5
Warehouse receipt systems could also be used as an alternative to holding physical stocks of food staples. These instruments allow farmers to deposit a certain quantity of a commodity into a private warehouse where it can be pooled with other commodities of a similar, specified quality. A receipt is issued to the owner as evidence of location and ownership. The receipt is a negotiable instru-ment that can be sold or used as collateral for a loan, backed by the claim to the commodity held in the warehouse (World Bank 2005). Warehouse receipt systems facilitate risk management in three main ways. First, they present farmers with improved access to formal credit because the receipt can be conveyed to a financial institution as verifiable collateral for loans to mitigate the consequences of a shock. Second, the system protects farmers against very low sale prices for their commodities by providing them with safe storage for these commodities until market prices become attractive, at which time the stock can be sold and any credit is reimbursed. This approach allows for diversification of sales across time, which helps reduce seasonal price volatility. Third, the system facilitates large-scale accumulation because the warehouse physically groups a set of consignments of known quality so that a large-scale buyer (for example, govern-ment, miller, or aid agency) can target these collectively.
For warehouse receipt systems to work, a government must restrict activities that undermine their success. For example, if cereal prices drop significantly after warehouse receipt system deposits are made, the value of the collateral may fall to a level less than that of the receipts, making the cereals risky assets. Though the free market could also bring about this situation, it would be aggravated by NTMs such as export bans, which tend to reduce prices. Thus, for warehouse receipt systems to work effectively, the use of NTMs should be better disciplined.
Although not designed specifically for food price risk management,2 weather-indexed insurance can mitigate the effects of climatic shocks on farm-ers, especially where domestic insurers are able to reinsure on global markets. Examples of adverse weather conditions that led to rising food prices in 2012 include the excessively hot and dry conditions in South America that pushed up sugar, maize, and soybean prices and the extreme cold in Russia that affected wheat prices (World Bank 2012). Weather-indexed insurance is a type of financial derivative written against deviations in average rainfall or tempera-ture indices constructed from data measured at weather stations. For example, if observed rainfall is below a set threshold, leading to low yields, an insured farmer would receive a payment to compensate for reduced production of food staples. Weather-indexed insurance is quite common in developed countries—and used by firms that are dependent on the weather (such as power companies)—but less so in developing countries, although a private market for rainfall insurance is being developed in India and several other schemes have been piloted or investigated (for example, in Malawi for its maize-producing regions).
Market-based instruments are rarely used in countries that are most suscep-tible to food insecurity, partly because the public sector often dominates food

114 Trade Policy Responses to High and Volatile Food Prices
Trade Policy and Food Security • http://dx.doi.org/10.1596/978-1-4648-0305-5
markets, but also because the enabling trade policy environment is lacking as a result of the persistence of restrictive NTMs. Transparent, open, and predictable regional trade policies are necessary conditions for the market-based mechanisms to succeed.
Aid for Trade could be used to support the policy reforms and supply-side upgrades needed for developing countries to better tap the opportunities created by more open multilateral and regional markets for food. In 2011, Aid for Trade commitments reached approximately US$41.5 billion—a 60 percent increase from 2002 to 2005.3 The share of Aid for Trade going to LDCs has also increased from 26.5 percent during the period 2002–05 to 32.0 percent in 2011. Furthermore, support for multicountry programs (both global and regional) reached US$7.7 billion in 2011—its highest level ever and more than three times the amount between 2002 and 2005. The World Bank is the largest multilateral provider of Aid for Trade, providing US$10.8 billion as of July 2012.
Lending for transport infrastructure is a critical component of the World Bank’s efforts to help developing countries achieve their trade integration and policy reform objectives. In 2013, more than 60 percent of World Bank support for transport infrastructure was for rural roads, with Sub-Saharan Africa being the largest recipient of World Bank support for transport projects.
With continued uncertainty in the global economy and fiscal pressures in key donor countries, a key challenge will be to sustain current levels of financing. Monitoring by the OECD and WTO as part of the self-assessment exercise for the Fourth Global Review of Aid for Trade indicates that Aid for Trade flows declined in 2011, although the poorest countries were least affected (OECD and WTO 2013). In this context, existing Aid for Trade pledges should continue to be honored and new pledges encouraged, particularly by G-20 countries.
notes
1. One of the components of the PSE is market price support (MPS). In most cases, nearly all of MPS is derived from the difference between border reference prices and domestic prices, although it can include some types of budgetary outlays that are intended to support prices.
2. Weather-indexed insurance is not focused directly on managing price risks because when farmers receive payments on their insurance, yields would be lower and prices higher.
3. In 2010, Aid for Trade commitments reached US$48 million. This exceptionally high amount stands as an outlier, given that the 2011 figure of US$41.5 million is more comparable and in line with figures from 2008 to 2009.
r eferences
Arvis, J. F. 2012. Trade and Transport Facilitation in the Middle East and North Africa (MENA) Region. Washington, DC: World Bank.
Arvis, J. F., M. A. Mustra, L. Ojala, B. Shepherd, and D. Saslavsky. 2012. Connecting to Compete 2012: Trade Logistics in the Global Economy. Washington, DC: World Bank.

Trade Policy Responses to High and Volatile Food Prices 115
Trade Policy and Food Security • http://dx.doi.org/10.1596/978-1-4648-0305-5
Arvis, J. F., G. Raballand, and J. F. Marteau. 2010. The Cost of Being Landlocked: Logistics Costs and Supply Chain Reliability. Washington, DC: World Bank.
Boonekamp, C. 2012. “Food Security and the WTO.” Unpublished Manuscript, World Bank, Washington, DC.
Boumellassa, H., D. Laborde, and C. Mitaritonna. 2009. “A Picture of Tariff Protection across the World in 2004.” MAcMap-HS6, Version 2, IFPRI Discussion Paper 903, International Food Policy Research Institute, Washington, DC.
Canuto, O. 2011. “Fiscal Consequences of Food and Agricultural Commodities Inflation.” Remarks for the GAIM/GMA, Geopolitical Risk, Macroeconomics and Alternative Investment Conference, New York, October 11–12.
Datt, M., B. Hoekman, and M. Malouche. 2011. “Taking Stock of Trade Protectionism since 2008.” Economic Premise Note 72, World Bank, Washington, DC.
FAO (Food and Agriculture Organization of the United Nations). 2010. FAO Statistical Yearbook 2010. Rome: FAO.
FAO (Food and Agriculture Organization of the United Nations) and OECD (Organisation for Economic Co-operation and Development. 2011. “Price Volatility in Food and Agricultural Markets: Policy Responses.” Policy report prepared for the G-20, including contributions by FAO, International Fund for Agricultural Development, International Monetary Fund, OECD, United Nations Conference on Trade and Development, World Food Programme, World Bank, World Trade Organization, International Food Policy Research Institute, and the UN HLTF.
Gillson, I. 2011. Non-Tariff Barriers to Sub-Saharan African Trade in Food Staples. Washington, DC: World Bank.
Gouel, C., and S. Jean. 2012. “Optimal Food Price Stabilization in a Small Open Developing Country.” Policy Research Working Paper 5943, World Bank, Washington, DC, and CEPII, Paris.
Gourdon, J., and O. Cadot. 2011. “Assessing the Price-Raising Impact of Non-Tariff Measures in Africa.” Policy Note 29, World Bank, Washington, DC.
Haggblade, S. 2008. “Enhancing African Food Security through Improved Regional Marketing Systems for Food Staples.” Policy Research Agenda for Common Market for Eastern and Southern Africa (COMESA) and Michigan State University, East Lansing.
Haggblade, S., J. Govereh, H. Nielson, D. Tschirley, and P. Dorosh. 2008. “Regional Trade in Food Staples: Prospects for Stimulating Agricultural Growth and Moderating Short-Term Food Security Crises in Eastern and Southern Africa.” Paper 7144132, prepared for World Bank, Washington, DC.
Hoekman, B. 2011. “The WTO and the Doha Round: Walking on Two Legs.” Economic Premise Number 68, Poverty Reduction and Economic Management Network, World Bank, Washington, DC.
Hoekman, B., and J. Zarrouk. 2009. “Changes in Cross-Border Trade Costs in the Pan-Arab Free Trade Area, 2001–2008.” Policy Research Working Paper 5031, World Bank, Washington, DC.
Ivanic, M., W. Martin, and H. Zaman, 2011. “Estimating the Short-Run Poverty Impacts of the 2010–2011 Surge in Food Prices.” Policy Research Working Paper 5633, World Bank, Washington, DC.
Jayne, T., A. Chapoto, and J. Govereh. 2007. “Grain Marketing Policy at the Crossroads: Challenges for Eastern and Southern Africa.” Paper prepared for the Food and

116 Trade Policy Responses to High and Volatile Food Prices
Trade Policy and Food Security • http://dx.doi.org/10.1596/978-1-4648-0305-5
Agricultural Organization of the United Nations Workshop on “Staple Food Trade and Market Policy Options for Promoting Development in Eastern and Southern Africa,” Rome, March 1–2.
Kshirsagar, V., and J. Baffes. 2011. “The Nature and Structure of Global Food Markets.” World Bank, Washington, DC.
Laborde, D., W. Martin, and D. van der Mensbrugghe. 2011. “Implications of the Doha Market Access Proposals for Developing Countries.” Policy Research Working Paper 5679, World Bank, Washington, DC.
Laborde, D., and W. Martin. 2012. “Agricultural Trade: What Matters in the Doha Round?” Policy Research Working Paper 6261, World Bank, Washington, DC.
Malouche, M., J. Reyes, and A. Fouad. 2013. “Making Trade Policy More Transparent: A New Database of Non-Tariff Measures.” Economic Premise 128, World Bank, Washington, DC.
Martin, W., and K. Anderson. 2011. “Export Restrictions and Price Insulation during Commodity Price Booms.” Policy Research Working Paper 5645, World Bank, Washington, DC.
Nijhoff, J., T. Jayne, B. Mwiinga, and J. Shaffer. 2002. “Markets Need Predictable Government Actions to Function Effectively: The Case of Importing Maize in Times of Deficit.” Policy Synthesis 6, Food Security Research Project, Lusaka.
Nijhoff, J., D. Tschirley, T. Jayne, G. Tembo, P. Arlindo, B. Mwiinga, J. Shaffer, M. Weber, C. Donovan, and D. Boughton. 2003. “Coordination for Long-Term Food Security by Government, Private Sector and Donors: Issues and Challenges.” Policy Synthesis 65, Michigan State University, East Lansing.
Nyameino, D., B. Kagira, and S. Njukia. 2003. Maize Market Assessment and Baseline Study for Kenya. Regional Agricultural Trade Expansion Support Program (RATES), Nairobi, Kenya.
OECD (Organisation for Economic Co-operation and Development). 2013. Agricultural Policy Monitoring and Evaluation 2013: OECD Countries and Emerging Economies. Paris: Organisation for Economic Co-operation and Development.
OECD (Organisation for Economic Co-operation and Development) and WTO (World Trade Organization). 2013. Aid for Trade at a Glance 2013: Connecting to Value Chains. http://dx.doi.org/10.1787/aid_glance-2013-en.
Rubey, L. 2005. Malawi’s Food Crisis: Causes and Solutions. Report for U.S. Agency for International Development, Lilongwe.
Shepherd, B. 2011. “Trade Costs in the Maghreb 2000–2009.” Developing Trade Consultants Ltd., New York.
Tschirley, D., D. Abdula, and M. Weber. 2006. “Toward Improved Marketing and Trade Policies to Promote Household Food Security in Central and Southern Mozambique.” Food Security Collaborative Working Paper 56065, Department of Agricultural, Food, and Resource Economics, Michigan State University, Lansing.
World Bank. 2005. Managing Food Price Risks and Instability in an Environment of Market Liberalization. Washington, DC: World Bank.
———. 2009a. “Eastern Africa: A Study of the Regional Maize Market and Marketing Costs.” Agriculture and Rural Development Unit, Africa Region, World Bank, Washington, DC.
———. 2009b. “Rising Food Prices: Policy Options and World Bank Response.” Note prepared by Poverty Reduction and Economic Management Network, Agriculture

Trade Policy Responses to High and Volatile Food Prices 117
Trade Policy and Food Security • http://dx.doi.org/10.1596/978-1-4648-0305-5
and Rural Development, and Development Economics Vice Presidency, World Bank, Washington, DC.
———. 2011a. Food Price Watch. Poverty Reduction and Equity Group, Washington, DC, February.
———. 2011b. Food Price Watch. Poverty Reduction and Equity Group , Washington, DC, April.
———. 2011c. “Russia and Central Asia: Win-Win Approaches in Trade Integration.” Europe and Central Asia Poverty Reduction and Economic Management Network of the World Bank and the Eurasian Development Bank Center for Integration, World Bank, Washington, DC.
———. 2012. Food Price Watch. Poverty Reduction and Equity Group, Washington, DC, April.
World Bank and FAO (Food and Agriculture Organization of the United Nations). 2012. The Grain Chain: Food Security and Managing Wheat Imports in Arab Countries. Washington, DC: World Bank; Rome: Food and Agriculture Organization of the United Nations.
WTO (World Trade Organization). 2013. Report on G-20 Trade Measures. Geneva, December 18.


119 Trade Policy and Food Security • http://dx.doi.org/10.1596/978-1-4648-0305-5
The Welfare Effects of Changes in Food PricesMaros Ivanic and Will Martin
introduction
The distributional effects of changes in food prices are extremely important both for their effects on poor and vulnerable households and for their implications for government policy responses to price changes. Although some households benefit from higher food prices, others are adversely affected by them depending on their status as net producers or consumers of food and the extent to which their incomes adjust to food price changes. Low-income households tend to spend a large share of their incomes on staple foods, making them potentially vulnerable to increases in prices. However, over three-fourths of the world’s poor live in rural areas, and most of them earn their incomes from agriculture, which might seem to leave them less vulnerable to increases in food prices.
This chapter considers the effect of a change in the world food prices on the income of a country as a whole. This is important for at least two reasons. First, it influences the need of the country as a whole to adjust to a food price shock. If a country faces a large income drop when food prices rise or fall, it is likely to experience more difficulty providing assistance to those disadvantaged by the shock than in the case where national income is unaffected or increases as a result of the shock. However, the size of the effect of a shock on national income pro-vides only a very limited indicator of the effect on vulnerable households. Even in an economy where national income is unaffected by a change in world food prices, the income and the food security of many households may be strongly adversely affected.
This chapter focuses first on the effects of food price changes on individual households, particularly on those living near the poverty line. One very simple indicator of the effect at the household level is the change in the number of people living below the poverty line. We focus primarily on the standard World Bank measure of poverty at US$1.25 per day in international purchasing power. An economic shock that increases the number of people below the poverty line is clearly an adverse development.
c H A p t e r 5

120 The Welfare Effects of Changes in Food Prices
Trade Policy and Food Security • http://dx.doi.org/10.1596/978-1-4648-0305-5
We then consider governments’ policy responses to such shocks and their effects on the welfare of individual households, and hence on the number of households below the poverty line. Finally, the implications of countries’ trade policy choices—initially from the viewpoint of an individual country, and then from the viewpoint of all countries—are discussed.
effects of Food price c hanges on national income
The net import share of food in the economy provides an initial assessment of the effect of a change in food prices on national income. If a country imports substantially more food than it exports, then a change in all food prices raises the cost of its food imports by more than the return that it receives on its exports. The net import share for food times the change in the price of food provides a simple and widely used measure of the change in national income resulting from the food price shock, although interactions with trade distor-tions may increase or reduce this measure (Martin 1997). The change in national income resulting from a food price shock may have an effect at the household level by changing both wage rates and the prices of nontraded goods (Jacoby 2013).
For many reasons, the food import share is too narrow a measure because it excludes agricultural raw materials, which have prices that are typically strongly correlated with food prices. As a rough indicator of the vulnerability of a country to changes in food prices, the net import share of agricultural products (as defined by the World Trade Organization [WTO]) for all economies for which 2012 trade and gross domestic product (GDP) data were available has been calculated. This is an update of one of the key indicators of food import status discussed by Ng and Aksoy (2008). The results for all available economies are presented in the annex to this chapter, and the results for the 30 countries most vulnerable to food price increases are shown in figure 5.1.
A striking feature of figure 5.1 is the number of food import–dependent economies that are small, island states where much large-scale food processing is likely to be uneconomical. Other members of this group are economies with overall trade deficits—of which food imports are a part—and low-income African economies. In general, management of the vulnerability associated with a large agricultural net import share is likely to be easier in high-income econo-mies such as Hong Kong SAR, China, than in smaller, poorer economies where access to financial resources can be more challenging. The potential scale of the shock to national incomes associated with a big increase in food prices, such as that experienced in 2008, is quite large—an increase of 50 percent in the price of agricultural goods relative to other goods. This increase would have caused a decline in national income of over 5 percent in the nine most import-dependent economies. Of course, the specific effect of a change in food prices on the national income of a particular country will depend on the specific set of price changes that occur, and so more specific analysis will be required when the price of only a subset of agricultural commodities changes.

The Welfare Effects of Changes in Food Prices 121
Trade Policy and Food Security • http://dx.doi.org/10.1596/978-1-4648-0305-5
Countries that have difficulty managing the effects of changes in food prices—perhaps because of difficulty in financing imports—frequently need assistance from the international community. An important part of the response of the World Bank and the International Monetary Fund to the 2008 food price surge was to ensure that credit lines were available, where needed, to finance imports.
effects of Food price c hanges on poverty
The effect of a food price change on national income—although often important— is not an adequate measure of its effect on individual households. As pointed out by Ferreira and others (2013), poverty may rise because of the vulnerability of individual households even in countries like Brazil where national income rises when food prices rise.
One widely accepted measure of the short-run effect of a small change in a commodity price on household welfare is given by the household’s net trade share for that good, as defined by Deaton (1989). A household that is a net seller of a good benefits when the price of that good rises. By contrast, a household that is a net buyer of that good loses when its price rises. Essentially, this is the same measure that is used here for determining the effect of a change in prices on national income. The concept of the short run used in this analysis is the length of time in which other effects, such as output adjustment or effects on wages, do
Figure 5.1 net Agricultural import shares as a percentage of GDp, 30 Highest
Sources: United Nations, Comtrade Database; World Trade Organization, definition of agricultural commodities.Note: GDP = gross domestic product.
02468
1012141618
Perc
ent
20
Kirib
ati
São
Tom
é an
d Pr
ínci
pePa
lau
Cape
Ver
deM
aurit
ania
Tong
aSa
moa
Antig
ua a
nd B
arbu
daD
omin
ica
Yem
en
St. V
ince
nt a
nd th
e G
rena
dine
sBu
rund
i
Bosn
ia a
nd H
erze
govi
naKy
rgyz
Rep
ublic
Sene
gal
Hon
g Ko
ng S
AR, C
hina
Jord
anBa
ham
as, T
heN
iger
Mal
taLe
bano
nAl
bani
aJa
mai
caM
aurit
ius
Barb
ados
Arm
enia
Geo
rgia
Alge
riaCy
prus
Bots
wan
a

122 The Welfare Effects of Changes in Food Prices
Trade Policy and Food Security • http://dx.doi.org/10.1596/978-1-4648-0305-5
not arise. Some analyses, such as that by Ravallion (1990), attempt to provide an indication of the calendar time associated with this effect.
At the household level, there are some important stylized facts that influ-ence the likely effect of this measure. Perhaps the oldest such stylized fact is that poor households spend a large share of their incomes on food. This might suggest that the poor always lose when food prices rise. However, this need not be the case, because most of the world’s poor live in rural areas and the major-ity of them earn their living from agriculture. If one makes the assumption generally applicable in high-income countries—that farmers are net sellers of food—this might suggest that poverty falls when food prices rise. However, many farmers in developing countries are also net buyers of food. Thus, the short-run effect of food prices on poverty becomes an empirical question that can be resolved only by using detailed data on the income sources and expen-diture patterns of households.
Farmers in poor countries are frequently net buyers of food for many reasons. For some households, their resources are so limited that they cannot produce enough food to meet their needs. However, for those who are shrewd portfolio managers, they can better manage the risks by allocating some of their resources to food production and some to other income sources, such as production of cash crops or sales of labor off-farm.
A great deal of evidence shows that short-run increases in most food prices, other things being equal, raise poverty in most developing countries (see, for example, de Hoyos and Medvedev 2011; Ivanic and Martin 2008; Ivanic, Martin, and Zaman 2012; Jacoby 2013; Wodon and Zaman 2010). This is often the case even in countries that are net food exporters and therefore benefit from the terms-of-trade effect of the shock (see Ferreira and others 2013, for Brazil). This usually occurs because of the large shares of food expenditures by the poor and the tendency for poor farmers to be net buyers of food, although this is not always the case. As emphasized by Aksoy and Isik-Dikmelik (2008), it is not suf-ficient for poor net food buyers to outnumber net sellers—the depth of each household’s net-buying and net-selling positions is also important. Given this, the only way to be sure of the net effect on poverty is to perform an experiment in which a food price changes and the effects on households’ real incomes are evaluated, and the effect on the poverty rate determined.
In some countries, such as Vietnam, where agricultural resources are relatively evenly distributed, higher prices of key products such as rice may lower poverty (Ivanic and Martin 2008). Similarly, higher prices for milk appear to have low-ered poverty in Peru, because the producers of milk were much poorer than their customers. The net increase in poverty associated with a food price rise does not mean that all people are adversely affected. Ivanic, Martin, and Zaman (2012) found, for example, that although higher prices in 2010 resulted in a net increase in the extreme poverty of 44 million people, 68 million dropped below the pov-erty line and 24 million rose above it.
An important distinction in this type of analysis exists between the partial effect of a change in food prices and the total effect of the changes in all

The Welfare Effects of Changes in Food Prices 123
Trade Policy and Food Security • http://dx.doi.org/10.1596/978-1-4648-0305-5
variables affecting the change in the poverty rate, or other measure of overall welfare. Headey (2013) and Headey and Fan (2010) make the important point that when food prices surged from 2006 to 2008, many developing countries enjoyed a period of rapid economic growth. Over this same period, the measures of subjective food insecurity that Headey analyzes declined, despite the apparently adverse effect of higher food prices obtained from simulation studies. One interpretation of these results is that higher food prices actually increase food security, perhaps by raising the incomes of farmers or the wages of nonfarm households. Another is that changes in measured food security reflect the changes in all of the variables affecting the well-being of the poor over the period considered. During this time, average incomes were rising rapidly in many developing countries because of exceptionally rapid economic growth, which may well have outweighed the adverse effects of higher food prices on poverty.
Because more time is allowed for markets to adjust to changes, two addi-tional factors need to be considered. First, changes in food prices may result in changes in factor returns. Second, changes in demand and output patterns of poor households may occur. The factor return most likely to affect poor households is the wage rate paid for unskilled labor outside the household’s farm (Lasco, Myers, and Bernsten 2008; Ravallion 1990). Changes in food prices in a small, open developing economy are likely to increase the factor return on unskilled wages because of the importance of unskilled labor in the production of staple foods such as rice and wheat. The effect on wage rates is likely to be much more important when the product considered is very labor intensive, a large share of the product mix, as in the case of rice in Bangladesh, and when the production of the good in question involves a large share of intermediate inputs.
Short-Run EffectsThe available evidence suggests that the full effect of food price changes on wage rates and output volume takes time to materialize. A useful measure of the short-run effects of higher food prices on poverty considers only the direct effect on incomes because of the initial net trade position of the households. The sign of this measure is an important building block toward longer-term measures that add wage rate and output change effects. These measures are, of course, poten-tially vulnerable to mismeasurement of the initial production or consumption levels of the households—an issue on which further research seems required (Carletto 2012; Headey and Fan 2010, p. 72). Table 5.1 presents results from a simulation analysis of these short-run effects based on survey data for 31 countries (Ivanic and Martin 2014a). Two key features of this analysis need to be taken into account. First, these results are based on a broad food price index, rather than changes in prices of particular foods. Second, they are based on a specific type of price change—one that results from shocks outside the developing countries considered. This is a realistic approach for an event such as the food price shock of 2006–08, which appears to have arisen primarily from external factors such as

124 The Welfare Effects of Changes in Food Prices
Trade Policy and Food Security • http://dx.doi.org/10.1596/978-1-4648-0305-5
the sharply increasing demand for foodstuffs from the biofuel sector in industrial countries (Wright 2014).
The short-run poverty effects presented in table 5.1 appear to adversely affect the poor in most countries with the exception of Albania, Cambodia, China, and Vietnam, for which 10 percent increases in food prices reduced pov-erty. Strikingly, the poverty effects are frequently highly nonlinear in food prices. In Albania and Vietnam, changes move in a positive direction when near-poor net sellers of food—faced with a small food price increase—rise above the pov-erty line, while net buyers of food faced with larger increases are negatively affected and fall below the poverty line. For most countries, the effects are monotonic, but frequently far from linear in the price change. This lack of
t able 5.1 short-r un poverty effects of Food price increases, Us$1.25 per Day
Country Survey year 10% 50% 100%
Albania 2005 −0.1 0.7 4.8Armenia 2004 0 1.3 4.9Bangladesh 2005 1.4 9.7 18.1Belize 2009 0.5 3.2 8.6Cambodia 2003 −3.0 −10.1 −14.9China 2002 −1.3 −4.0 −3.2Côte d’Ivoire 2002 1.1 7.2 17.6Ecuador 2006 0.3 2.3 7.2Guatemala 2006 1.4 9.7 27.2India 2005 2.6 14.2 25.8Indonesia 2007 1.7 10.2 25.2Malawi 2004 0.7 3.1 5.7Moldova 2009 0 1.1 7.9Mongolia 2002 1.4 8.7 21.6Nepal 2002 0.5 3.2 6.8Nicaragua 2005 1.1 5.8 17.4Niger 2007 0.6 6.9 17.1Nigeria 2003 1.0 5.6 9.8Pakistan 2005 2.7 14.0 27.5Panama 2003 0.3 2.5 8.0Peru 2007 0.2 1.5 6.9Rwanda 2005 1.1 4.4 8.5Sierra Leone 2011 2.4 12.5 22.1Sri Lanka 2007 1.8 11.6 29.1Tajikistan 2007 0.8 8.7 28.1Tanzania 2008 1.9 8.2 14.5Timor-Leste 2007 1.9 10.0 20.1Uganda 2005 0.7 3.8 8.7Vietnam 2010 −0.4 2.1 12.8Yemen, Rep. 2006 2.0 13.4 33.2Zambia 2010 1.1 6.0 12.5
Source: Based on survey data.

The Welfare Effects of Changes in Food Prices 125
Trade Policy and Food Security • http://dx.doi.org/10.1596/978-1-4648-0305-5
linearity in these effects is important for analysts seeking short-cut approaches to estimating the effects of food prices on poverty in the short run. It suggests that the poverty effects of a particular shock—a 10 percent increase, for example—cannot simply be scaled up to capture the effect of a larger price change. In some cases, the effect rises to very high levels in countries such as India, Indonesia, and Pakistan.
The results for the 31 countries presented in table 5.1 are used as a sample to infer the global effects on poverty, following the sampling methodology outlined in Ivanic, Martin, and Zaman (2012). This approach leads to the global estimates shown in table 5.2, which show that in the short run, global poverty rises with increases in food prices; for a 10.0 percent price increase, global poverty is esti-mated to rise by 0.8 percent with a standard error of 0.3 percent. The rate of the increase also appears to be increasing in the observed price range; when the food price shock increases fivefold to 50 percent, poverty is predicted to rise by 5.8 percent, and further doubling of the shock to 100 percent more than doubles global poverty estimates to 13.1 percent. The positive relationship between food prices and poverty reflects the fact that most poor people are net food buyers; because wages or food production cannot respond to higher prices in the short-run scenario, poverty inevitably grows.
As noted above, the results presented in tables 5.1 and 5.2 are for a specific type of shock arising from a situation external to developing countries. A shock arising from an adverse event within developing countries—such as one resulting from a drought in major areas of the developing world—would have very differ-ent (and more adverse) welfare implications. As noted in Ivanic and Martin (2014b), this shock would be more adverse for two reasons: (a) the adverse effect on the incomes of farmers resulting directly from the decline in their output and (b) the decline in the net sales position of farm households that would exacer-bate the adverse effect of higher food prices on these households.
Longer-Run EffectsAs noted above, the longer-run effects of a change in food prices differ from the short-run effects for two main reasons: (a) the effects of food price changes on wages, and (b) the change in the volume of output resulting from the food price increase (that is, the supply response). Several other potential effects may also be important in specific contexts, although they are not analyzed in detail here. If the change in domestic prices results from a change in trade policy, other welfare
t able 5.2 short-r un Global poverty effects of Food price increasesPercent
Scenario Points
10 0.850 5.8100 13.1
Source: Based on survey data.Note: The poverty line used is US$1.25 per day.

126 The Welfare Effects of Changes in Food Prices
Trade Policy and Food Security • http://dx.doi.org/10.1596/978-1-4648-0305-5
effects may occur as the government changes either tax or expenditure policies to restore fiscal balance. The effect of such a change on the budget will depend on the initial level of protection, the form of protection, and the change in the protection rate. If, for instance, protection for agriculture is provided by a high tariff, a small reduction in protection may increase government revenues by raising import volumes, hence allowing increases in government spending or reductions in other taxes (Martin 1997). In contrast, the abolition of a single tariff must reduce tariff revenues, requiring an increase in other taxes or a reduc-tion in expenditure elsewhere—it may, however, increase revenues from other taxes, such as excise or value added taxes, if these taxes are more effectively collected on imported than on domestically produced goods.
Another potentially important effect on poverty of a reduction in protection is through an effect on the rate of economic growth, as emphasized by Winters, McCulloch, and McKay (2004). This effect is likely much more important for general trade policy reforms than for reforms that are specific to the food sector, although food sector reforms that reduce the frequently large expenditures asso-ciated with this sector may have some effect.
A final channel of potential significance arises from the importance of food trade to the economy as a whole. If a country is a large next exporter of food, a rise in world prices may create a terms-of-trade improvement that raises national income. The spending effects of this increase in national income may help the poor by raising the prices of nontraded goods and by stimulating investment demand. To some degree, this channel of effect is captured in the estimated effects of food price changes on poverty (see, for example, Jacoby 2013).
Ravallion (1990) finds that a 1 percent increase in the price of rice in Bangladesh, which he treats as a proxy for an increase in all grains, results in an increase in the agricultural wage rate of 0.22 percent in the short run and 0.47 percent in the long run. This suggests that poor households in Bangladesh would be disadvantaged by an increase in the price of food in the short run. In the longer run, however, his results suggest that this adverse effect would essen-tially disappear. Lasco, Myers, and Bernsten (2008) find that a 1 percent rise in the price would have larger effects on agricultural wages in the Philippines. In the short run, they estimate that the wage rate would rise by between 0.29 and 0.57. In the long run, they find that the wage rate would rise by between 0.78 and 1.00 for the same change in rice prices. They conclude that most poor households that are net buyers of food and net sellers of unskilled labor would lose from a price rise in the short term but benefit in the longer term because of the induced increase in wage rates. Headey and others (2012) find in their study of Ethiopia a small effect of food price changes on urban wages in the short run but close to a unit elasticity in the long run.
Jacoby (2013) uses cross-section data from Indian districts to take into account the longer-run adjustments. He examines price changes for 18 major agricultural commodities over the 2004–09 period, with the changes in average prices between districts reflecting a combination of imperfect price transmission between districts and differences in the composition of crop output. With his

The Welfare Effects of Changes in Food Prices 127
Trade Policy and Food Security • http://dx.doi.org/10.1596/978-1-4648-0305-5
preferred models, he is unable to reject the hypothesis that a 1 percent increase in agricultural prices increases wages by the same proportion. He finds that the wage rate channel has an important influence on poverty outcomes. If this chan-nel, and the associated change in the price of services, is ignored, he finds (see Jacoby 2013, figure 6) that the poorest rural households would suffer a welfare loss of around 0.3 percent for a 1 percent increase in food prices. Taking this approach into account by using parameters estimated over his five-year adjust-ment period resulted in a gain to the same households of around 0.25 percent.
In earlier work on the effects of food prices on poverty, we focused on the short-run effects, with an allowance for potential short-run wage changes (Ivanic and Martin 2008). In current work, we are also examining longer-run effects, allowing for both changes in wage rates and changes in the quantities of output supplied. For consistency with the economy-wide analysis used to estimate the wage effects of food price changes, we use the structure of the Global Trade Analysis Project (GTAP) general equilibrium model to represent the response of households. The household models used are specialized from the broad structure of GTAP by their particular output mix, but share its structure in allowing large supply responses, particularly for individual commodities. The results from this analysis are sharply different from our findings for the short run. In the long run, we find that exogenously higher food prices tend to lower poverty in most of the countries considered, and for the world as a whole (table 5.3).
These long-run results are broadly consistent with those obtained by Headey (2014) using econometric techniques applied to data for 68 countries. They are also broadly consistent with the findings by Jacoby (2013) for India. These results lend support to the long-standing concern by authors such as Anderson (2009) and Anderson, Cockburn, and Martin (2010) about the adverse impli-cations of the widespread taxation of agriculture in developing countries for poverty.
policy implications
The first-best approach to dealing with problems of food price volatility at the national level involves policies that target the problem most directly—measures such as social safety nets for poor consumers and insurance measures for vulner-able producers. The technology for such targeted interventions has improved dramatically in recent years with innovations such as improved forms of identi-fication and index-based forms of insurance. These advances greatly strengthen
table 5.3 Global poverty effects of General Food price increases, Us$1.25 per Day
Scenario (%) Short run Long run
10 0.8 −1.350 5.8 −4.2100 13.0 −5.4
Source: Ivanic and Martin 2014a.

128 The Welfare Effects of Changes in Food Prices
Trade Policy and Food Security • http://dx.doi.org/10.1596/978-1-4648-0305-5
the case for using first-best approaches to manage these challenging problems. At the international level, another first-best approach would be efforts to pro-gressively reduce the extent of price insulation, perhaps through conversion of export restrictions into export taxes subject to bindings that are progressively reduced. Even if these measures cannot be implemented sufficiently effectively given timing and other constraints, it is worth considering steps toward imple-menting or upgrading measures of this type over time—especially given the weaknesses of alternative measures.
A widely observed policy response to fluctuations in world prices of food is for developing countries—and historically industrial countries as well—to insu-late their markets from these changes. When prices surged in 2007–08, many developing country exporters used export restrictions to lower their domestic prices relative to world prices. Even more countries lowered either their import or their consumption taxes on food (Wodon and Zaman 2010, p. 167). But this response is not confined to situations of sharp price increases. For staple food commodities such as rice, this insulation occurs more or less continuously. Figure 5.2 shows the strongly inverse relationship between the world average rate of protection for rice and the world price—a relationship consistent with consistent stabilization of domestic prices relative to world prices.
This policy approach is, for individual countries, an effective way of stabilizing its own prices. Use of trade measures is highly likely to be less costly than stabi-lization using storage policies alone. The fact that this approach to stabilization is so widely used, however, creates a serious collective action problem. One can easily show that if every country seeks to reduce its price by the same amount,
Figure 5.2 World prices and the Average protection r ate for r ice
Source: Calculations based on data from http://www.worldbank.org/agdistortions.Note: NRA = nominal rate of assistance.
–50
–40
–30
–20
–10
0
10
20
30
40
50
60
0
100
200
300
400
500
600
700
19701972
19741976
19781980
19821984
19861988
19901992
19941996
19982000
20022004
20062008
20102012
NRA
(%)
Inte
rnat
iona
l pri
ce (U
S$)
International price (US$)NRA, all countries

The Welfare Effects of Changes in Food Prices 129
Trade Policy and Food Security • http://dx.doi.org/10.1596/978-1-4648-0305-5
the domestic price is unaffected (Martin and Anderson 2012). The mechanism is simple—export restrictions in exporting countries push up world prices, as do import duty reductions in importing countries. Martin and Anderson (2012) point out that the problem is precisely the same as the collective action prob-lem that arises when everyone in a stadium stands up to get a better view of a game. Their analysis suggests that almost half of the increase in world rice prices during 2007–08 was the result of countries’ attempts to insulate their markets against the increases in world prices. This creates a serious collective action problem. Countries that would prefer not to use export controls or import barrier reductions in response to a rise in prices may feel compelled to do so because of the actions of others—and hence further reinforce the increase in world prices.
In reality, of course, countries insulate to different extents, and insulation might reduce poverty if the countries whose populations are the most vulnerable to increases in poverty when food prices surge insulate to a greater degree than others. If, for instance, developing countries insulated and forced the adjustment onto developed countries—which are much more capable of managing this problem—the global poverty effects of a food price surge might be reduced. There is no guarantee that interventions follow this pattern, however. Historically, some of the most enthusiastic users of price insulation have been relatively wealthy countries such as members of the European Community, with its pre-Uruguay Round system of variable import levies. To learn whether the pattern of interventions during the 2006–08 price surge actually reduced poverty, Anderson, Ivanic, and Martin (2013) examined the actual interventions used and assessed their effects on global poverty, taking into account the effects of the interventions on the world price. They conclude that the interventions used appeared to reduce poverty by around 80 million people as long as the effects of these trade interventions on world prices were not taken into account. Once these interven-tions were considered, the effect was to generate a small but not statistically significant increase in world prices.
Many countries seek to use combinations of trade and storage measures to reduce the volatility of their domestic prices. In principle, the combination of trade and storage measures has the potential to be more effective than trade or storage measures alone (Gouel and Jean 2014). Gautam, Gouel, and Martin (2014) found that the combination of trade measures, which are definitely beggar-thy-neighbor approaches, and storage measures, which might help neigh-bors, reduce—but do not eliminate—the adverse effects of one country’s policies on food price volatility on the rest of the world. These policies tend also to be extremely expensive to operate and to include rigidities that frequently cause them to collapse (Knudsen and Nash 1990).
The central role of the WTO is to deal with collective action problems that affect the level of world prices or their volatility. The use of bindings on import tariffs reduces the extent to which importing countries can depress world prices by discouraging imports. The Uruguay Round introduced important measures to discourage the insulation against world price changes that exacerbates the
130 The Welfare Effects of Changes in Food Prices
Trade Policy and Food Security • http://dx.doi.org/10.1596/978-1-4648-0305-5
volatility. These reforms included banning variable import levies and subjecting administered prices to disciplines under both the market access and the domestic support pillars.
Because of its mercantilist focus the WTO has done very little to discourage the use of export restrictions—from the point of view of another exporter, your export restrictions are my export opportunities. Although export quantitative restrictions are subject to the general proscription under Article XI of the General Agreement on Tariffs and Trade, export taxes are not constrained except in limited instances such as restrictions negotiated under WTO accession agree-ments. But unless all export restrictions are disciplined, they are likely to contrib-ute to upward pressure on food prices in times of crisis, making it difficult for other exporters not to follow suit and for importers to refrain from lowering domestic prices through duty and tax reductions—all of which put further upward pressure on world prices, while being collectively ineffective in dealing with the problem. Important, constructive suggestions for binding and progres-sive reduction of export taxes have been put forward (see the discussion in Anderson, Ivanic, and Martin 2013), but not enough attention appears to date to have been focused on dealing with this collective action problem rather than on maintaining countries’ rights to contribute to it.
c onclusions
This chapter has examined the critically important issue of the welfare effects of food price changes. At the national level, the short-run effect on national income is determined by the size of the price shock and the share of the net trade deficit in food or agricultural products. The simple net trade criterion allows us to iden-tify a set of countries—many of which are small island states—that appear to be particularly vulnerable to increases in food prices. The most vulnerable countries are exposed to substantial risk of income loss when prices surge, a risk that is likely to create more difficulty for their governments to respond to the needs of their most adversely affected people.
This chapter focuses on the effect of food price changes on individuals and households. As shown by Ferreira and others (2013) for Brazil, many people may be adversely affected by food price changes even when their country as a whole benefits from the change. The evidence surveyed here points strongly to rises in food prices resulting in net increases in poverty in the short run. Invariably, some people who are net sellers of food rise out of poverty, while others who are net buyers of food fall into poverty. But, in most countries, the number of people falling into poverty is greater than the number of people rising out of poverty.
The chapter also examines the much smaller body of evidence emerging on the longer-run effects of food price changes on poverty. In this case, there are two important differences: wages have time to fully adjust to the change in prices, and producers have the opportunity to adjust their output levels and output mix to the change in prices. Here, the evidence suggests that higher food prices tend to lower poverty in most countries. It is important to remember that the results

The Welfare Effects of Changes in Food Prices 131
Trade Policy and Food Security • http://dx.doi.org/10.1596/978-1-4648-0305-5
considered here for both the short and the long run are for changes in food prices that are purely exogenous to developing countries. A case in which a rise in prices is due, in whole or part, to a decline in productivity in developing countries will be more adverse for those countries, because the effect on income will need to include the direct adverse effect on incomes of the decline in productivity.
The concluding section reviews the policy options facing developing countries in dealing with the problem of food price volatility. As noted, the most com-monly adopted response—insulating domestic markets from changes in world market prices—introduces a collective action problem that appears to render the response ineffective in stabilizing most prices and in mitigating the adverse poverty effects of price surges. Augmenting trade policy measures with storage reduces the collective action problem but does not appear to overcome it and raises serious challenges of management, cost, and sustainability. There appears to be a strong case for first-best policies based on social safety nets at the national level and efforts to diminish the collective action problem through agreements that restrain the extent of beggar-thy-neighbor price insulation.
Annex 5A: Agricultural imports and GDp
t able 5A.1 Agricultural imports as a share of GDpPercent
Economy Share of GDP Economy Share of GDP Economy Share of GDP
Kiribati 18.1 Cambodia 2.0 Canada −0.6São Tomé and Príncipe 14.2 Portugal 1.8 Latvia −0.6Palau 13.4 Korea, Rep. 1.7 Papua New Guinea −0.6Cape Verde 11.2 Croatia 1.7 Mali −0.7Mauritania 10.7 Dominican Republic 1.7 France −0.8Tonga 10.6 Togo 1.3 Spain −0.8Samoa 10.6 United Kingdom 1.3 Belgium −1.0Antigua and Barbuda 10.6 Zimbabwe 1.2 Poland −1.0Dominica 10.0 Singapore 1.2 India −1.1Yemen, Rep. 9.6 Norway 1.2 Ireland −1.5St. Vincent and the Grenadines 9.3 Mozambique 1.2 Indonesia −1.5Burundi 8.6 Russian Federation 1.2 Australia −1.6Bosnia and Herzegovina 8.3 Finland 1.2 Moldova −1.7Kyrgyz Republic 8.0 Philippines 1.2 Tanzania −1.8Senegal 7.9 Sweden 1.2 Chile −1.8Hong Kong SAR, China 7.6 Estonia 1.1 Belarus −1.9Jordan 7.5 Japan 1.1 Uganda −2.4Bahamas, The 6.9 Afghanistan 0.9 Denmark −2.5Niger 6.0 Azerbaijan 0.9 Bulgaria −2.6Malta 5.9 Madagascar 0.8 Vietnam −2.7Lebanon 5.9 China 0.7 Ethiopia −2.9Albania 5.9 Cameroon 0.7 Lithuania −2.9Jamaica 5.7 Czech Republic 0.7 Brazil −3.2
table continues next page

132 The Welfare Effects of Changes in Food Prices
Trade Policy and Food Security • http://dx.doi.org/10.1596/978-1-4648-0305-5
r eferences
Aksoy, M. A., and A. Isik-Dikmelik. 2008. “Are Low Food Prices Pro-Poor? Net Food Buyers and Sellers in Low-Income Countries.” Policy Research Working Paper 4642, World Bank, Washington, DC.
Anderson, K., ed. 2009. Distortions to Agricultural Incentives: A Global Perspective, 1955 to 2007. London: Palgrave Macmillan; Washington, DC: World Bank.
Anderson, K., J. Cockburn, and W. Martin, eds. 2010. Agricultural Price Distortions, Inequality and Poverty. Washington, DC: World Bank.
Anderson, K., M. Ivanic, and W. Martin. 2013. “Food Price Spikes, Price Insulation, and Poverty.” Policy Research Working Paper 6535, World Bank, Washington, DC.
Carletto, C. 2012. “Presumed Poorer until Proven Net-Seller: Measuring Who Wins and Who Loses from High Food Prices.” Development Impact (blog), September 19. https://blogs.worldbank.org/impactevaluations/presumed-poorer-until-proven -net-seller-measuring-who-wins-and-who-loses-from-high-food-prices.
Deaton, A. 1989. “Rice Prices and Income Distribution in Thailand: A Non-Parametric Analysis.” The Economic Journal 99 (395): 1–37.
Ferreira, F., A. Fruttero, P. Leite, and L. Lucchetti. 2013. “Rising Food Prices and Household Welfare: Evidence from Brazil in 2008.” Journal of Agricultural Economics 64 (1): 151–76.
t able 5A.1 Agricultural imports as a share of GDp (continued)
Economy Share of GDP Economy Share of GDP Economy Share of GDP
Mauritius 5.5 Rwanda 0.7 Ecuador −3.3Barbados 5.2 Solomon Islands 0.6 Bolivia −3.6Armenia 5.1 Greece 0.6 Thailand −3.7Georgia 5.0 Fiji 0.6 Hungary −3.8Algeria 4.7 Kazakhstan 0.5 Malaysia −4.1Cyprus 4.3 Slovak Republic 0.5 Netherlands −4.1Botswana 4.1 Switzerland 0.5 Guatemala −4.6Egypt, Arab Rep. 4.0 Romania 0.4 Costa Rica −4.7Morocco 3.8 Pakistan 0.3 Honduras −5.4Bermuda 3.1 Austria 0.3 Guyana −5.5Oman 3.0 Italy 0.3 Belize −5.8Slovenia 2.8 Mexico 0.3 Ukraine −6.2Brunei 2.7 Germany 0.3 Argentina −8.4Macao SAR, China 2.6 Peru 0.1 Uruguay −9.2El Salvador 2.5 South Africa −0.1 Nicaragua −9.4Macedonia, FYR 2.5 Colombia −0.2 Ghana −9.8Saudi Arabia 2.5 United States −0.2 New Zealand −10.2Iceland 2.3 Nigeria −0.3 Paraguay −12.9Namibia 2.1 Turkey −0.3 Côte d’Ivoire −13.7Luxembourg 2.1 Sri Lanka −0.5
Source: Based on United Nations, Comtrade Database, data extracted using WITS, World Bank, http://wits.worldbank.org/wits.Note: GDP = gross domestic product.

The Welfare Effects of Changes in Food Prices 133
Trade Policy and Food Security • http://dx.doi.org/10.1596/978-1-4648-0305-5
Gautam, M., C. Gouel, and W. Martin. 2014. “Managing Wheat Price Volatility in India.” Unpublished draft, World Bank, Washington, DC.
Gouel, C., and S. Jean. 2014. “Optimal Food Price Stabilization in a Small Open Developing Country.” Policy Research Working Paper 5943, World Bank, Washington, DC.
Headey, D. 2011. “Was the Global Food Crisis Really a Crisis? Simulations versus Self-Reporting.” IFPRI Discussion Paper 01087, International Food Policy Research Institute, Washington, DC.
———. 2014. “Food Prices and Poverty Reduction in the ‘Long Run.’” Paper for presenta-tion to the Agriculture and Applied Economics Association Annual Conference, Minneapolis, MN, August.
Headey, D., and S. Fan. 2010. Reflections on the Global Food Crisis. Research Monograph 165. Washington, DC: International Food Policy Research Institute.
Headey, D., F. Nisrane, I. Worku, M. Dereje, and A. Seyoum Taffesse. 2012. “Urban Wage Behavior and Food Price Inflation: The Case of Ethiopia.” ESSP-II Working Paper 41, Ethiopia Strategy Support Program II, International Food Policy Research Institute (IFPRI), Addis Ababa.
Headey, Derek D. 2013. “The Impact of the Global Food Crisis on Self-Assessed Food Security.” World Bank Economic Review, World Bank Group, 27 (1): 1–27.
de Hoyos, R., and D. Medvedev. 2011. “Poverty Effects of Higher Food Prices: A Global Perspective.” Review of Development Economics 15 (3): 387–402.
Ivanic, M., and W. Martin. 2008. “Implications of Higher Global Food Prices for Poverty in Low-Income Countries.” Agricultural Economics 39: 405–16.
———. 2014a. “Short- and Long-Run Impacts of Food Price Changes on Poverty.” Unpublished draft, World Bank, Washington, DC.
———. 2014b. “Poverty Impacts of the Volume-Based Special Safeguard Mechanism.” Unpublished draft, World Bank, Washington, DC.
Ivanic, M., W. Martin, and H. Zaman. 2012. “Estimating the Short-Run Poverty Impacts of the 2010 Surge in Food Prices.” World Development 40 (11): 2302–17.
Jacoby. 2013. “Food Prices, Wages, and Welfare in Rural India.” Policy Research Working Paper 6412, World Bank, Washington, DC.
Knudsen, O., and J. Nash. 1990. “Domestic Price Stabilization Schemes in Developing Countries.” Economic Development and Cultural Change 38 (3): 539–58.
Lasco, C., R. Myers, and R. Bernsten. 2008. “Dynamics of Rice Prices and Agricultural Wages in the Philippines.” Agricultural Economics 38: 339–48.
Martin, W. 1997. “Measuring Welfare Changes with Distortions.” In Applied Methods for Trade Policy Analysis: A Handbook, edited by J. Francois and K. Reinert. Cambridge, U.K.: Cambridge University Press.
Martin, W., and K. Anderson. 2012. “Export Restrictions and Price Insulation during Commodity Price Booms.” American Journal of Agricultural Economics 94 (2): 422–27.
Ng, F., and M. A. Aksoy. 2008. “Who Are the Net Food Importing Countries?” Policy Research Working Paper 4457, World Bank, Washington, DC.
Nicita, A., M. Olarreaga, and G. Porto. Forthcoming. “Pro-Poor Trade Policy in Sub-Saharan Africa.” Journal of International Economics.

134 The Welfare Effects of Changes in Food Prices
Trade Policy and Food Security • http://dx.doi.org/10.1596/978-1-4648-0305-5
Ravallion, M. 1990. “Rural Welfare Effects of Food Price Changes under Induced Wage Rate Responses: Theory and Evidence for Bangladesh.” Oxford Economic Papers 42 (3): 574–85.
Winters, L. A., N. McCulloch, and A. McKay. 2004. “Trade Liberalization and Poverty: The Evidence So Far.” Journal of Economic Literature XLII: 72–115.
Wodon, Q., and H. Zaman. 2010. “Higher Food Prices in Sub-Saharan Africa: Poverty Impact and Policy Responses.” World Bank Research Observer 25 (1): 157–76.
Wright, B. 2014. “Global Biofuels: Key to the Puzzle of Grain Market Behavior.” Journal of Economic Perspectives 28 (1): 73–98.

135 Trade Policy and Food Security • http://dx.doi.org/10.1596/978-1-4648-0305-5
Food Security and the World Trade OrganizationClem Boonekamp
introduction
The world’s population recently surpassed 7 billion, having doubled in the past 50 years. Over the same period, global food production trebled, particularly in staple grains. Yet some 1 billion people go hungry. This situation undermines intelligence, growth, and development of both individuals and countries. Ensuring that people are appropriately fed is thus a moral, political, and economic imperative. The matter was given added urgency by the food price spike of 2007–08. In consequence, food security has become an important item on the Group of 20 (G-20) agenda, the United Nations (UN) has a high-level task force on the matter, and it is central to the work of the World Trade Organization (WTO) on agriculture.
The WTO’s Agreement on Agriculture seeks a more level playing field for trade in agriculture. However, it is careful to ensure that governments retain policy choices to support their agricultural sectors. More important, it does so in a manner that reduces infringement on the opportunities of partners to the agreement. Furthermore, the agreement encourages a deepening of markets, including by a potential diversification of supplies; in addition, by strengthening disciplines on food trade restrictions, the agreement limits the scope for countries to implement destabilizing policies abroad. As such, it can play an important role in contributing to mitigation of food price volatility, thereby contributing to food security. Overall, implementation of the WTO agreement improves the production and investment environment, guiding resources into more productive uses both within agriculture and throughout the economy, which is also an essential element of food security.
The present agreement is not perfect. The system remains tilted against those with a comparative advantage in agriculture, including a number of develop-ing countries. The agreement needs to be improved, particularly by reducing the scope for trade-distorting support and by increasing market access and strengthening disciplines in areas such as export competition and restrictions, thus
c H A p t e r 6

136 Food Security and the World Trade Organization
Trade Policy and Food Security • http://dx.doi.org/10.1596/978-1-4648-0305-5
fostering greater efficiency. Concurrently, many, especially developing, countries, argue that flexibilities need to be retained, if not enhanced, for governments to pursue their national goals. The WTO negotiations on agriculture seek to achieve these aims, but it is a difficult balancing act. Some of the proposals both for flexibilities (such as a special safeguard mechanism for developing countries) and for strengthened disciplines (such as for export measures)—each of which is often defended on food security grounds—create problems for others.
This chapter starts with a brief section describing the role of trade in food security, pointing to the fact that it can help improve access to and availability of food, both keys to food security. But trade is not enough on its own. It needs to be part of a coherent policy framework and to be embedded in an agreed, stable set of multilateral rules for its conduct. Framing this policy and agreeing on these rules is the role of the WTO. The chapter’s next section develops that role, including the policy space that governments have kept available for themselves in the pursuit of agricultural development. The section also looks at the work in other forums on food security, including that by the UN Special Rapporteur on the right to food, the G-20, and UN agencies. The section concludes with the negotiation in the WTO and the road ahead. The final part of this chapter stresses again the role of trade and the importance of bringing the Doha Round of multi-lateral trade negotiations to a successful conclusion.
t rade and Food s ecurity
Food security is a global challenge. In our Westphalian system of nation-states, the primary responsibility for meeting this challenge has devolved to individual governments. These governments are sovereign. They are free to implement policies they deem necessary to ensure food security for their own populations, paying due attention to their international obligations, including coming to the aid of those in need. But national policies can serve to distort world markets: for example, domestic support can lead to subsidized exports and/or to price volatility if large food importers or exporters impose trade restrictions or if countries act simultaneously.
Among the policy choices available to governments is self-sufficiency, that is, domestically producing a country’s food requirements. Few, if any, coun-tries are naturally equipped to do so, particularly if a varied diet and con-sumer choice are to be achieved; production constraints and climatic conditions are unlikely to allow this option. Clearly, policies designed to seek self-sufficiency are likely to divert resources from more efficient uses, reduc-ing potential gross domestic product and hence purchasing power: the economy’s ability to buy food is not optimized. Also, domestic prices in closed, self-sufficient markets probably will be more volatile than on world markets, where the risk of a sudden variation of supply is lower. As a corol-lary, less food may be available under self-sufficiency policies; at a given price, a larger volume of imports could be brought in from more efficient sources. A quest for self-sufficiency can thus undermine the two key aspects

Food Security and the World Trade Organization 137
Trade Policy and Food Security • http://dx.doi.org/10.1596/978-1-4648-0305-5
of food security: accessibility and availability. As such, trade is an essential element in achieving food security because it improves both.
But trade is not an end in and of itself; nor is it a magic bullet that will guarantee food security. Rather, trade is a necessary part of a comprehensive, coherent policy package to achieve food security. Accompanying policies—such as irrigation policies; nutrition policies; research and development policies; agricultural extension services; access to seeds, fertilizers, and credit (for which open trade policies are also important); appropriate sanitary and phytosanitary (SPS) requirements; and other policies, including sound macroeconomic and development strategies—are also key factors. An additional element is a sound, appropriate social safety net to protect the more vulnerable. Although little substitute exists for allowing price signals to allocate resources and consumer choice, the adjustment costs can be significant, especially for the urban poor. Thus, for example, in a period of rising food prices, governments, in the absence of effec-tive safety nets, may be tempted to take what are ultimately expensive measures to delay or slow the price increases. But low-income countries rarely have the needed financial resources for implementing well-functioning safety nets. This lack bespeaks the need for coordinated food aid, foreseen in the WTO’s Agreement on Agriculture; targeted support policies for the poor; and improved investment policies. Among these, alongside and in support of the social safety net, the development of market-based mechanisms to manage food price risks might also be viable. These mechanisms include futures and options markets, weather and income insurance, information systems, and storage and transport facilities. Such mechanisms could all encourage significant new private investment. The appropriate functioning of such mechanisms is enhanced by efficient markets, and these, in turn, are not abetted by trade restrictive policies.
Trade is a transmission belt. It provides price signals to guide resource alloca-tion, thus enhancing purchasing power, and connects “the land of the plenty to the land of the few,” thereby increasing the availability of food. Openness to trade in food can help both lower costs and better absorb shocks to domestic production. Restrictive measures encourage others to do the same. Food security in this context is supported by stabilizing the interconnectedness between markets, between the sources of supply and demand. That is, to enhance food security, policy makers need to ensure that this trade interdependence is as free of obstruction as negotiators are able to make it. This goal goes to the heart of the role of the WTO and the implementation of its Agreement on Agriculture, in particular; to the question of the extent to which other forums have come to see trade as an integral part of meeting the food security challenge; and finally, to the status of negotiations to improve the present system.
t he Wt o and o ther Forums
The WTO Agreement on Agriculture was a landmark achievement. The agree-ment entered into force with the establishment of the WTO on January 1, 1995, superseding the General Agreement on Tariffs and Trade (GATT) as the umbrella

138 Food Security and the World Trade Organization
Trade Policy and Food Security • http://dx.doi.org/10.1596/978-1-4648-0305-5
organization for international trade. It was the result of the Uruguay Round of multilateral trade negotiations, undertaken in the period 1986–94.
The WTO and Food SecurityThe GATT had always covered agriculture, but the disciplines were not as exacting as those for industrial products. Nor were there agreed, specific rules for agricultural domestic support, which had become an important element in con-straining opportunities for potentially more efficient producers, often developing countries. The result was a proliferation of barriers to international trade and rising self-sufficiency rates, especially in developed countries. Markets were often unstable, surpluses were dumped on world markets at subsidized prices, and incentives were reduced for farmers in poorer countries to maintain output.
The Agreement on Agriculture initiated a reform process, aimed at a more equitable, efficient agricultural trading system through specific commitments to reduce protection in the areas of domestic support, export subsidies, and market access and through the establishment of strengthened and more operationally effective WTO rules and disciplines. It also ensured, however, that non- or mini-mally trade-distortive support remained available—through what became known as the Green Box—and, more important, that for developing countries, certain agricultural and rural assistance measures that are integral to development strate-gies are exempt from commitments. The agreement thus explicitly gave effect to the requirement in its preamble that commitments have regard to food security concerns.
In the area of market access, the agreement brought systemic change. First, all parties to the agreement bound—that is, placed an upper limit on—each of its agricultural tariffs. In many cases, this strategy was combined with a commitment to reduce the bindings, over a period of 6 years for developed countries and 10 years for developing countries. Second, the agreement forbade, with exceptions, the use of agriculture-specific nontariff measures; existing measures were “tariffied,” that is, replaced with a tariff that provided an equivalent level of protection. As part of this process, parties to the agreement were required to maintain minimum and current access levels, tied to domestic consumption, for the tariffied products; these levels were expanded over a period of 6 years for developed countries and 10 years for developing countries.
These changes (a) enhanced the role of prices as the main link between national and international markets, thus improving signals for resource allocation, and (b) were instrumental in improving the predictability and transparency of agricultural market access. In short, the trade, production, and investment climate was enhanced, promoting food security.
“Tariffication” was not required for nontariff measures that are consistent with the provisions of the WTO. Such measures include those maintained under the WTO Agreement on the Application of Sanitary and Phytosanitary Measures. The basic aim of this agreement is to maintain the sovereign right of its members to provide the level of health and safety regulations for food, animals, and plants that they deem appropriate—literally an element of food security—but also to

Food Security and the World Trade Organization 139
Trade Policy and Food Security • http://dx.doi.org/10.1596/978-1-4648-0305-5
ensure that this right is not misused for protectionist purposes, thereby resulting in unnecessary barriers to trade. Thus, the measures must be science based and applied only to the extent necessary and should be applied neither arbitrarily nor in an unjustifiably discriminatory manner. Members are encouraged to use inter-national standards, where they exist.
Clearly, besides safeguarding health, appropriate SPS measures can help to prevent food waste and to maintain and improve the ability of countries to access markets. To this end, the WTO houses the Standards and Trade Development Facility to support developing countries in building their capacity to implement international SPS standards, guidelines, and recommendations.
The Agreement on Agriculture broke new ground in the area of domes-tic support. The fundamental consideration was to discipline and reduce trade-distorting support while leaving countries the scope to design and imple-ment agricultural policies that met their own needs. The key to achieving this goal was to divide support into two categories: that which distorts trade and hence impinges on the opportunities of others (the Amber Box) and that with minimal or no trade-distortive effect or effects on production (the Green Box). Included in the Amber Box are a variety of market-price supports, such as intervention prices and deficiency payments (dependent on a price gap), and direct production and input subsidies. Although potentially trade distort-ing, direct payments under production-limiting programs—thought of as the Blue Box—are not, subject to conditions, part of the Amber Box calculation, essentially because they serve to limit the exportable surplus (which otherwise might be dumped). Nor is trade-distortive de minimis support factored into the Amber Box; this is 5 percent of the value of production for developed countries and 10 percent for developing countries, with product-specific and non-product-specific support counted separately. Should the de minimis level be exceeded, the full amount enters the Amber Box.
Twenty-eight parties (with the European Union as one)—including all the then-major agricultural producers and exporters—reported their Amber Box support and made reduction commitments (20 percent over 6 years for devel-oped countries and 13 percent over 10 years for developing countries). These amounts are bound, that is, parties are committed to not exceeding them. Parties without Amber Box commitments are limited in their trade-distortive support to their de minimis entitlements, Blue Box measures, and for developing coun-tries, certain measures to assist agricultural and rural development.
Members are not limited in their Green Box supports. The provisions apply equally to both developed and developing countries, with additional flexibilities for developing countries for public stockholding programs for food security purposes and for food price subsidies to the poor. In general, the criteria for mea-sures to be eligible for Green Box treatment are that they be publicly funded (including revenue forgone) and that they entail neither price supports to producers nor consumer transfers.
The Green Box offers significant scope for national measures, both direct and indirect, in support of food security. Thus, if identified in national legislation,

140 Food Security and the World Trade Organization
Trade Policy and Food Security • http://dx.doi.org/10.1596/978-1-4648-0305-5
expenditure to build and maintain stocks for food security programs can be compatible with the Green Box: purchases into the stocks are to be made at current market prices and sales are to be at no less than the current domestic price, except that in the case of developing countries, both purchases and releases may be at administered prices (with any implied subsidy then counted toward that country’s Amber Box expenditure, which for most will fall into the de mini-mis category). Similarly, food aid to sections of the population in need can qualify for the Green Box. Such programs need to be transparent and have clearly defined criteria; those eligible can either be provided the food directly or be furnished with the means to buy food at market or subsidized prices; in the case of develop-ing countries, this includes programs with the objective of meeting the food requirements of the urban and rural poor on a regular basis at reasonable prices. Government purchases for food aid are to be made at current market prices.
Other government programs that affect food security that may be compatible with the Green Box include research and development, both general and that relating to specific products; extension services; inspection services, including for health, safety, and grading; pest and disease control programs; marketing and promotion services; and infrastructural programs, including electricity, transport, and water supply. The Green Box also provides for direct payments to producers that are not linked to production, prices, and factors of production, that is, decoupled payments: these can facilitate adjustment, thereby leading to a more rational allocation of resources. In addition, depending on conditions, income and safety-net programs are possible as are a range of structural adjustment measures. The Green Box thus allows governments to apply a range of innovative policies in support of agriculture, including therefore food security.
Developing countries have additional flexibilities available to support agricul-ture under what is known as the Development Box of the Agreement on Agriculture. Under the provisions of this box, expenditure on certain trade- distortive measures, direct or indirect, that are designed to promote agricultural and rural development and that are part of development programs is not counted toward the Amber Box outlays of those countries. These measures include gener-ally available agricultural input subsidies to resource- or income-poor producers, generally available investment subsidies, and support for crop diversification (away from illicit, narcotic crops).
The third pillar of the agreement is export competition. Export subsidies, particularly by developed countries, had become prevalent in the run-up to the Uruguay Round, largely as the result of surplus production under support poli-cies. These subsidies, subject to weak and essentially nonoperational disciplines, undermined the opportunities of more efficient producers, often in developing countries. One of the achievements of the round was significantly strengthening disciplines in the area, with partners to the agreement making product-specific reduction commitments. With limited exceptions, including to provide flexibili-ties to developing countries, these commitments put an upper bound on export subsidies, prohibiting their use in all other cases. Of note, the agreement also foresees that international food aid should not be used to circumvent the export

Food Security and the World Trade Organization 141
Trade Policy and Food Security • http://dx.doi.org/10.1596/978-1-4648-0305-5
subsidy commitments; for the same reason, it encourages the development of internationally agreed disciplines on export credits.
Also worth noting is that the agreement sought to bring additional disci-plines to the use of export prohibitions or restrictions for food. Under the WTO’s provisions, in Article XI of GATT 1994, prohibitions on imports or exports are not allowed other than by duties, taxes, or other charges; that is, quantitative restrictions are generally prohibited. However, an exception exists for export prohibitions or restrictions temporarily applied, inter alia, for food security reasons, to prevent or relieve critical shortages of foodstuffs or other essential products. The Agreement on Agriculture was clear that an exporting country applying such a measure was to take into account the food security needs of importers, should give advance notice of the measure, and should be ready to consult on the matter; these requirements do not apply to any developing coun-try unless it is a net food exporter of the product concerned. These disciplines have not been very effective, nor is it obvious how they might be. Any country faced with a perceived domestic food security crisis will give priority to its population. Thus, a ban on exports—quantitative restrictions on food—might well be ignored; it would make bad law. Perhaps the best that can be achieved are better surveillance conditions, reinforcing the temporary nature of such mea-sures. WTO negotiators are working on this.
Parties to the agreement are to regularly notify the WTO’s Committee on Agriculture about the implementation of their commitments. The committee oversees the implementation of the agreement and provides the opportunity for consultation on matters relating to the agreement. Generally, notifications are retrospective; moreover, very few parties are up to date in their notifications, and the notifications are not always uniform in their presentation of information. (Both these difficulties are now receiving increased attention, and certainly the timeliness of information is improving.) Consequently, detailed, verified informa-tion on the current agricultural policies of parties is not always available. Nevertheless, it would seem to be clear that little, if any, recent liberalization of trade in agriculture has occurred, particularly from an economic perspective.
In the area of market access, the average ad valorem tariff applied by WTO members on imports of agricultural products is around 15 percent. The average is approximately the same for developed and developing countries. Among the 10 largest traders in agriculture, the applied ad valorem rates have remained roughly unchanged since the early 2000s, except in the case of China, whose rate has fallen from around 23 percent to about 15 percent, largely as the result of its implementation of the commitments it made in its accession to the WTO in 2001. If the ad valorem equivalents of specific duties are taken into account, applied rates have declined marginally, but this is because of higher prices rather than unilateral liberalization.
Developments were much the same for domestic support. Among the devel-oped parties to the agreement, only the European Union—and to some extent Norway and Australia (except for 2007)—has shown a clear downward trend in its trade-distorting support since 2000, largely as a result of reforms to its

142 Food Security and the World Trade Organization
Trade Policy and Food Security • http://dx.doi.org/10.1596/978-1-4648-0305-5
Common Agricultural Policy; in parallel, however, its Green Box support has increased significantly. In the case of the United States, the trend in trade- distorting support was downward in the early 2000s but rose again in 2004–05 and 2008, as lower prices increased its countercyclical and loan-deficiency payments; U.S. Green Box supports have also increased substantially, mainly because of its domestic food aid program. The trend has been relatively flat for other developed countries, both in terms of trade-distortive and Green Box sup-port. Among major developing-country producers, the trend in trade-distorting support appears to be upward in Brazil, Chile, China, Colombia, India, Malaysia, and Uruguay and relatively flat elsewhere. Green Box support has risen in some of these countries, including Brazil, India, and, particularly, China.
By contrast, the trend in export competition has been toward liberalization. Export subsidies have declined significantly, particularly in the European Union, by far the main user. Part of this change is due to policy reform, such as the decline in support prices in the European Union; higher world food prices have also played a significant role. But the improvement is relative. Export subsidies have always been small in absolute terms when compared to domestic support, and their distortive effects, though significant, are minor by comparison to the joint impact of domestic subsidies and still high tariffs.1
Overall, the trade environment does not appear to have improved over the past several years. Indeed, it may have deteriorated with the recent increased use of export restrictions. Ramesh Sharma (2011) reports 87 such measures in the period 2007–March 2011; of these, at least 35 were export bans, often on cereals. The WTO in May 2012 confirmed an upward trend in the use of export-restrictive measures, with some 25 percent of new measures (19) in the six months to October 2011 affecting food products (WTO 2012).
The combined effect of all these measures shows up in economic terms in the producer subsidy estimates of the Organisation for Economic Co-operation and Development (OECD).2 Among developed-country traders, these estimates have remained relatively flat over the recent past. Where some improvements have occurred, as in the case of the European Union and the United States, they are attributable at least in part to higher world food prices. Data are harder to come by for non-OECD members, but the work by the OECD makes clear that in some major traders producer subsidy estimates are on a rising trend, including in Brazil, the Russian Federation, and, particularly, China. In general, the esti-mates tend to confirm that the agricultural trade policy environment has not improved over the past decade in favor of food security. Nevertheless, as a result of the significantly strengthened disciplines, limiting the resort to protectionist measures, the environment is certainly improved relative to that at the start of the implementation of the Agreement on Agriculture in 1995.
Concurrent with the Agreement on Agriculture, the Uruguay Round resulted in the “Ministerial Decision on Measures concerning the Possible Negative Effects of the Reform Programme on Least-Developed and Net Food-Importing Developing Countries.”3 It was well understood that although the reform pro-gram initiated by the Agreement on Agriculture would generate improved trade

Food Security and the World Trade Organization 143
Trade Policy and Food Security • http://dx.doi.org/10.1596/978-1-4648-0305-5
and economic growth opportunities for all parties, some countries could suffer negative interim effects, for example in terms of rising import prices as subsidies declined. Thus, WTO members agreed that food aid for developing countries, and in particular that for least-developed and net food-importing developing countries, should continue to be sufficient to meet their (food security) needs. Under the decision, technical and financial assistance is also to be provided to help these countries improve their agricultural productivity and infrastructure, and they were to be eligible for financing from international organizations under existing or future facilities. Members notify the WTO of their assistance measures taken within the framework of the decision. The decision’s implementation is monitored by the WTO’s Committee on Agriculture, assisted by a report by the WTO Secretariat4 and by contributions from the other main agencies concerned, including the Food and Agriculture Organization (FAO) of the UN, the International Monetary Fund (IMF), the World Bank, and the World Food Programme. In addition, to make the Ministerial Decision operational, the Committee on Agriculture has drawn up a list of countries covered by the deci-sion, based on members’ deliberations; as of March 2012, it comprises all UN-defined least-developed countries and 31 other developing countries.5
Other ForumsCommentators generally agree that trade is a critical factor in improving food security. There are, however, important exceptions to this view, as epitomized by Professor Olivier de Schutter (2011), UN Special Rapporteur on the Right to Food. He argues that countries would be better helped by being able to feed themselves and hence favors less reliance on international trade. The argument is self-defeating. Empirically, open economies tend to outperform closed econo-mies (see, for example, Wacziarg and Welch 2008): among other reasons, the former discard less information relevant to allocative efficiency and are thus likely to have relatively higher domestic purchasing power and to be more favor-ably placed to access food. The point is then about optimizing a country’s social welfare function, which includes choices on distribution. For this, food stocks for emergency purposes may be useful, as might be other instruments such as direct payments and income and crop insurance. Professor de Schutter agrees that these are possible under current international trade rules, although he argues for increased flexibility in the rules to implement domestic food security programs, with trade a complement, if needed, to domestic production.
Two points are relevant. First, such programs are often not so much about food stocks or other measures, per se, but rather about financing, investment, and infrastructure, including governance. These issues are matters of domestic policy, including revenue collection, and of international cooperation. For the latter reason, among others, the WTO’s initiative on Aid for Trade and the World Bank’s Global Agriculture and Food Security Program6 are important, as is implementation of the Ministerial Decision on Least-Developed and Net Food-Importing Developing Countries, including possible access to financing. Second, on increased flexibility, as recognized by Professor de Schutter, significant space

144 Food Security and the World Trade Organization
Trade Policy and Food Security • http://dx.doi.org/10.1596/978-1-4648-0305-5
is already available to developing countries under current WTO rules. New rules are under negotiation in the context of the WTO’s Doha Development Agenda. Each of the 157 members of the WTO brings its own agenda to these negotia-tions, making consensus difficult to achieve on what are to be legally binding disciplines. But it is important to note, as emphasized by the director-general of the WTO, that members have placed food security at the center of their deliberations.7 In this context, Professor de Schutter’s emphasis on investment and safety nets is important.
The G-20 has also recognized the importance of food security to the international community. Both the French and the Mexican presidencies of the G-20 gave food security prominence on the agenda for their deliberations in 2011 and 2012, respectively; and in 2011, G-20 ministers of agriculture con-vened on the matter to agree on an action plan for submission to leaders at their summit in November 2011.8 To assist ministers in their deliberations, the G-20 invited a number of concerned international organizations to prepare a policy report on price volatility in agriculture.9 The report was wide-ranging in its rec-ommendations, from longer-term measures to enhance agricultural productivity to improvements in market transparency and in a coordinated response in times of crisis (with a view to obviating unilateral measures, such as export restrictions, that can exacerbate a volatile market situation). The report recognized the importance of international trade, including as a means for diversifying sources of supply and reducing market volatility. Thus, it recommended that the WTO move immediately to strengthen international disciplines on all forms of import and export restrictions. The Ministerial Action Plan was explicit in endorsing the role of trade, noting that “policies that distort production and trade in agricultural policies can impede the achievement of long-term food security”; it added that significant barriers still needed to be reduced.
Significantly, in the action plan, G-20 members agreed to remove export restrictions or extraordinary taxes on food purchased for noncommercial human-itarian purposes by the World Food Programme and not to impose them in the future. The plan recommended consideration by the WTO of a specific resolu-tion to this effect: the matter has been considered in the WTO’S General Council, but to date no action has been taken.
An important follow-up result of the action plan has been the establishment of the Agricultural Market Information System (AMIS) in September 2011.10 Recognizing that reliable, verified information is a critical element in framing and implementing policies, and indeed that an absence of such transparency had contributed to the food price spikes of 2007–08, AMIS collects, analyzes, and forecasts, for public dissemination, market and policy data for four key staples: wheat, maize, rice, and soybeans. Participants in AMIS are the G-20 countries plus Spain and non-G-20 countries with a significant share in production and trade of the covered products. The AMIS Secretariat is housed in the FAO, with the WTO as one of its members. AMIS includes a Rapid Response Forum, which consists of senior agricultural officials from capitals, and meets as needed, when AMIS reports on abnormal conditions, to encourage the coordination of policies.

Food Security and the World Trade Organization 145
Trade Policy and Food Security • http://dx.doi.org/10.1596/978-1-4648-0305-5
AMIS is functional less than 1 year after the passage of the action plan, improving transparency and dialogue on food security, thus attesting to the importance the international community accords to the matter.
Another important voice on food security is that of the UN High-Level Task Force on the Global Food Security Crisis. Established in 2008, with the UN Secretary-General as its chair, the task force comprises the relevant UN agencies and the IMF, the World Bank, and the WTO. In 2008, when food prices were spiraling, the task force authored a Comprehensive Framework for Action on agriculture, which it updated in 2010 (UN HLTF 2010). The framework, which addresses food security in all its complexity, advances a two-track approach with actions that respond to immediate needs and those that promote longer-term agricultural resilience. Both tracks are clear on the importance of trade for food security. In particular, in considering short-term responses, countries should regard export restrictions as a last resort, recognizing the difficulties that these can cause for food importers. The performance of international food markets also needs to be improved, including by completing multilateral trade negotiations on agriculture, in the context of the Doha Round, to strengthen and make more transparent the agreed rules for trade in agriculture.
The upshot of the preceding is that the WTO is actively engaged with other forums on the matter of food security and that its role in negotiating and imple-menting disciplines for a more level playing field in agriculture is seen as vital. In this context, it participates in the work of the Committee on World Food Security (CFS). The committee serves as a forum in the UN system for the review of policies concerning food security. The CFS, which gives a voice to all stakeholders, is charged under its terms of reference with developing a global strategic framework for food security, building upon existing work such as the high-level task force’s Updated Comprehensive Framework for Action.11
Negotiations in the WTOMuch remains to be done. In concluding the Agreement on Agriculture, negotia-tors recognized that they had only started the reform process in agriculture. They therefore mandated in the agreement a continuation of the negotiations, to begin in 2000, under the built-in agenda of the Uruguay Round. In 2001, these negotiations became part of the new round of multilateral trade negotiations, the Doha Development Agenda. They progressed slowly but steadily to the point where in July 2008 an agreement was almost reached on modalities to conclude the round. The reasons for “failure” were varied, significantly including the fact that negotiators were not able to settle on the terms for a special safeguard mechanism (SSM) to limit agricultural imports into developing countries. Subsequently, intensive consultations were held, resulting in December 2008 in draft modalities for a significantly revised Agreement on Agriculture.12 The draft was clear on the limited number of areas in agriculture where consensus had yet to be reached. Since then, considerable technical work has been done and differ-ences on substance in the draft have been clarified. However, with significant differences in other areas of the round, especially with respect to market access

146 Food Security and the World Trade Organization
Trade Policy and Food Security • http://dx.doi.org/10.1596/978-1-4648-0305-5
for nonagricultural products, overall agreement to conclude the round has remained elusive, and negotiations are now stalled.
Disciplines for trade in agriculture would be strengthened under the modalities, particularly for developed countries. In market access, developed countries would lower the upper limit (bindings) on their tariffs by an average of at least 54 percent, significantly reducing the scope to raise tariffs. Given that there is still “water in the tariff”—with applied rates below bound rates—the average applied tariffs of developed countries would not decline by as much, but access would certainly improve. Developing countries would reduce their bind-ings by a maximum average of 36 percent; their flexibilities would be greater than those for developed countries, but, again, access to their markets would likely be enhanced, albeit less than that to developed countries. In all, there is “actually something quite worthwhile in the current draft agreements on agricul-tural market access” (Laborde and Martin 2012, 26), particularly in areas such as tropical products, of interest to developing countries, but less so in sensitive areas, such as dairy products and poultry. Tariff escalation—higher tariffs as pro-cessing increases—would also be reduced, improving the investment climate and market opportunities for primary producers. These improvements are signifi-cant. Although agriculture accounts for just 8 percent of world trade in goods, market access barriers in agriculture are responsible, by some accounts, for well over one-half of the costs of global trade protection (Laborde and Martin 2012).
A tiered formula would result in large reductions in trade-distorting domestic support for those countries with Amber Box reduction commitments, which include all developed countries; developing countries without such commit-ments and all net food-importing developing countries would be exempt from reductions in trade-distorting domestic support. Specific to a reference period, most countries would also schedule their base overall trade-distorting support.13 Subject to clarification by negotiators, this base level, after the implementation of applicable reduction commitments, would be the upper bound on permitted, annual trade-distorting support, except that it would not constrain the access of countries, including China, that have recently joined the WTO to their de mini-mis allowances of such support. These provisions would broaden the disciplines on trade-distorting support relative to the present Agreement on Agriculture and certainly reduce the entitlements to such support for what have historically been its main providers—the developed countries. However, it is not clear whether the overall level of domestic support to agriculture would decline. Under the draft modalities, access to the Green Box would be somewhat easier, particularly for developing countries, than is currently the case, and the Development Box and de minimis entitlements for most developing countries would remain unchanged. The de minimis allowances become particularly relevant because they are based on current values of production; these have risen significantly over the past decade in a number of major developing-country producers, increasing their potential for trade-distorting domestic support. Indeed, under the draft modali-ties, it is not impossible to envisage a situation where the total of the allowances for such support by some developing countries is well in excess of that for

Food Security and the World Trade Organization 147
Trade Policy and Food Security • http://dx.doi.org/10.1596/978-1-4648-0305-5
developed countries. In effect, policy space for developing countries to support agriculture would increase.
In the third pillar of the negotiations—export competition—export subsidies would be eliminated, and in parallel, disciplines would be strengthened on export credits (and export guarantees and insurance programs), agricultural exporting state trading enterprises, and food aid.
Overall, agreement on the draft modalities would improve the trading envi-ronment in agriculture: opportunities would improve for efficient producers, and disciplines on distortions would be strengthened, particularly in the case of developed countries. Concurrently, flexibilities would be maintained for devel-oping countries, especially the least-developed and net food-importing develop-ing countries, thereby allowing additional space for them to achieve their agricultural objectives. Potentially, each of these factors works to the advantage of food security.
The question is whether agreement can be reached, given both the differences that remain among negotiators on elements of the draft modalities and, in particu-lar, the changed economic environment. Important among the differences are two that would provide additional flexibilities to developing countries, namely, special products and an SSM. Under the draft modalities, and for reasons based, among others, on food security, developing countries would be allowed to self-designate 12 percent of their agricultural tariff lines as special products subject to lower-than-average reductions in customs duties; tariffs on 5 percent of the lines could be without any cuts.14 The difficulty for exporters lies in the products that importers might select: if an importer designates tariff lines of particular interest to an exporter, then the latter could face less-than-expected improvements in access to the importer’s market. Ultimately, this matter probably needs to become a de facto bilateral request-offer process, the results of which would then be extended to all parties. In this respect, it is important that the main players come to an agreement, particularly China and the United States, which is far from being the case. Five products15 alone account for over 80 percent of U.S. agricultural exports to China; a number of these products are potentially special to China’s food security needs, and yet U.S. negotiators would have difficulty selling an agreement at home that might not bring the possibility of market access gains, particularly for politically sensitive products such as cotton and poultry.
The problem is compounded by the SSM, which if used on a special product might actually reduce an exporter’s market access.16 Agreement exists that an SSM should be available for developing countries, who seek it in part on food security grounds, and that its use could be triggered by surges in import volumes or sharp declines in import prices. Either would permit an increase in applied tariffs, perhaps above previously agreed bound rates. Although the principle of such protection is well known in WTO rules,17 it is usually accompanied by a test to support its use, by provisions on its duration and scope, and by surveillance. These elements have not yet been clearly defined, and indeed, division on them is deep, with many wanting maximum flexibility and others seeking an instrument that is hard to abuse. Nor is this just a north-south issue; many developing-country

148 Food Security and the World Trade Organization
Trade Policy and Food Security • http://dx.doi.org/10.1596/978-1-4648-0305-5
exporters seek more clarity and discipline on the implementation of the SSM to avoid its misuse, with untoward consequences on their exports.
Other differences on the draft modalities may be more tractable than those above, although it may yet prove difficult to treat cotton “ambitiously, expedi-tiously and specifically,” as reaffirmed by members at the Ministerial Meeting in Hong Kong SAR, China, in 2005.18 Falling cotton prices, which may elicit more support, complicate the dossier. However, politically, final agreement on modali-ties is not possible without a resolution on cotton, and negotiators are committed to achieving it.
Negotiators will also need to deal with the fact that the modalities as drafted are complicated, with room for different interpretations; therefore, a clarification process is under way. Also, reporting requirements under the draft are likely to be more onerous and complicated than under the present Agreement on Agriculture, and considerable technical work and assistance will be needed to ensure transpar-ency in implementation; this too is under way. However, by and large, these latter issues are technical, not requiring politically difficult concessions.
More problematic is the changed economic environment relative to the mid-1980s. The Agreement on Agriculture and the draft modalities were both negotiated in a period of relatively low food prices; consequently, concern with the import side of the equation was greater than for the export side and hence on the development of disciplines on tariffs, domestic support, and export subsi-dies. But prices now appear to be on a rising trend—which actually started, slowly, in the early 2000s—with changing consumption patterns, biofuels, and climate change all playing a role. Now many are also concerned about keeping food at home to ensure domestic supplies at reasonable prices; thus, they may resort to export restrictions. But here, WTO disciplines are not as well developed as on the import side, and the draft modalities would not significantly strengthen them. This situation is now raising concerns, particularly among net food import-ers, for reasons of food security.
Recently, suggestions have been made about how export disciplines might be strengthened, including by banning food export prohibitions and export taxes. The latter, as the counterpoint of import tariffs, are legal under the WTO (as can be quantitative measures to restrict food exports).19 A proposal on behalf of the least-developed and net food-importing developing countries, explicitly citing trade as a key element in achieving food security, recommends that rules be established to exempt them from export restrictions taken by major exporters of basic foodstuffs. At present, these efforts do not have a great deal of traction among negotiators. This is not because the major exporters are opposed per se—none wants to be regarded as an unreliable supplier—but rather because the modalities as they stand have a certain internal balance. To now think of intro-ducing new disciplines would probably open other areas of the text, and indeed, some have noted trenchantly that food security is about both imports and exports; this would risk losing the text!
Another element in the changed environment is the increased production in some major players. For example, since 2000, the value of agricultural production,

Food Security and the World Trade Organization 149
Trade Policy and Food Security • http://dx.doi.org/10.1596/978-1-4648-0305-5
in current U.S. dollars, has virtually tripled in China and doubled in India.20 This means that under implementation of the draft modalities, entitlement to trade-distorting support increases in relative terms in favor of some countries compared with others. For example, counting only de minimis, China would be allowed annual support of over US$100 billion, unchanged relative to its present entitle-ment; total trade-distorting support for the European Union and the United States would be limited to about a24 billion and US$15 billion, respectively, down from about a72 billion and US$19 billion, respectively, at present. This case is extreme, made to illustrate a point. Thus, India’s entitlement would decrease from about US$40 billion in de minimis trade-distorting support at present to about US$25 billion in total trade-distorting support, under a binding on such support; nevertheless, its relative position could improve. Considerations of this sort lead some negotiators to wonder whether the playing field would indeed be made more level—as is the object of the negotiations—or whether it would be tilted, once again, as before the Uruguay Round and the resultant Agreement on Agriculture.
Yet a Doha agreement on agriculture is still very much worth having, for the reasons outlined previously: on balance, the system would be strengthened; market access, in particular, would improve; and the imperative of food security would be served. Ironically—and it is deeply ironic because agriculture traditionally has been the stumbling block in past rounds of multilateral trade negotiations—an agreement on the agricultural modalities might have been pos-sible as late as 2010, or early 2011, had the negotiators felt they were in an end game; certainly the outcome, if not all the details, was known. However, the thought that agreement on agriculture would weaken negotiating positions in other areas of the round, that the necessary balance would not be achieved, played a role in preventing the needed compromises from materializing. Since then, the changed environment has continued to complicate the situation.
Negotiators might proceed as follows: come to agreement on the basis of the present draft modalities and agree, concurrently, on a work program—a built-in agenda to continue negotiating on some critical issues. These would include export restrictions; a simplification and broadening of the disciplines on trade-distorting support; and a careful look at the Green Box, to which a lot of domes-tic support is being shifted. The gains would then be locked in, and the prospect of further improvement would be in place. However, achieving this outcome will more than probably need movement elsewhere in the negotiations, particularly on nonagricultural market access, but here the lack of momentum is precisely why the Doha Round is stalled.
c onclusion
Trade is a part of food security. Even critics, such as Professor de Schutter, acknowledge this point, although they would like to see its role reduced to complement a quest for greater self-reliance. Most see a better disciplined, more open trading system as a critical variable in the food security equation, in that it helps improve both resource allocation, and hence the ability to purchase food,

150 Food Security and the World Trade Organization
Trade Policy and Food Security • http://dx.doi.org/10.1596/978-1-4648-0305-5
and transmission of food to where it is needed. These factors give the WTO, as the guardian of the multilateral trading system, an important role in achieving food security.
The WTO’s Agreement on Agriculture was an important step in improving the international trading conditions for agriculture. But more needs to be done to level the playing field for trade—and investment—in agriculture; disciplines need to be strengthened and market access improved, both to allow those with a comparative advantage in agriculture greater scope to use that advantage and to facilitate importation by those who need food. The elements for the next step are on the table, in the form of the draft modalities for agriculture in the context of the Doha Round.
The modalities are just that—a step forward. Important issues would remain, including improved disciplines on export restrictions. But overall, improve-ments would be significant: access would be enhanced, disciplines strengthened, and flexibilities retained for countries to implement their chosen food security policies. In the context of an agreed Doha Round, the advantages would multiply. Thus, for example, negotiators would also reach an agreement on trade facilita-tion, easing nontariff measures on the entry of imports, and renew emphasis on Aid for Trade, potentially improving infrastructures. In all, the environment for efficient resource allocation and growth would improve and, hence, the pros-pects for food security would be enhanced. This is too much to leave on the table, particularly with so many people hungry.
notes
1. The information in the preceding paragraphs derives largely from notifications by members to the WTO’s Committee on Agriculture; they are publicly available on the WTO’s website at http://www.wto.org.
2. OECD, Producer and Consumer Support Estimates (database), OECD Agriculture Statistics, http://www.oecd-ilibrary.org/agriculture-and-food/data/oecd -agriculture -statistics_agr-data-en.
3. WTO, Uruguay Round agreements, http://www.wto.org.
4. See, for example, “Implementation of the Decision on Measures Concerning the Possible Negative Effects of the Reform Programme on Least Developed and Net Food-Importing Developing Countries,” WTO document G/AG/W/42/Rev.14, October 21, 2011. http://www.wtocenter.org.tw/SmartKMS/do/www/readDoc? document_id=117718.
5. These are Antigua and Barbuda, Barbados, Botswana, Côte d’Ivoire, Cuba, Dominica, the Dominican Republic, the Arab Republic of Egypt, El Salvador, Gabon, Grenada, Honduras, Jamaica, Jordan, Kenya, Maldives, Mauritius, Mongolia, Morocco, Namibia, Pakistan, Peru, Senegal, Sri Lanka, St. Kitts and Nevis, St. Lucia, St. Vincent and the Grenadines, Swaziland, Trinidad and Tobago, Tunisia, and República Bolivariana de Venezuela.
6. See, respectively, Aid for Trade, http://www.wto.org/english/tratop_e/devel_e/a4t_e /aid4trade_e.htm, and Global Agriculture and Food Security Program, http://www .gafspfund.org/gafsp/.

Food Security and the World Trade Organization 151
Trade Policy and Food Security • http://dx.doi.org/10.1596/978-1-4648-0305-5
7. On the WTO’s website, under Agriculture negotiations news archive, see “Lamy Rebuts UN Food Rapporteur’s Claim That WTO Talks Hold Food Tights ‘Hostage,’” December 14, 2011. http://www.wto.org/english/news_e/archive_e/agng_arc_e.htm.
8. “Ministerial Declaration: Action Plan on Food Price Volatility and Agriculture,” Meeting of G-20 Agriculture Ministers, Paris, June 22 and 23, 2011. http://agriculture .gouv.fr/IMG/pdf/2011-06-23_-_Action_Plan_-_VFinale.pdf.
9. The report, Price Volatility in Food and Agricultural Markets: Policy Responses, issued on June 2, 2011, as a collaborative effort by the FAO, the International Fund for Agricultural Development, the International Food Policy Research Institute, the IMF, the OECD, the United Nations Conference on Trade and Development, the World Food Programme, the World Bank, the WTO, and the UN High-Level Task Force, is available, for example, on http://www.wto.org.
10. For a detailed description of AMIS, see its brochure at http://www.amis-outlook.org.
11. FAO, Governing and Statutory Bodies website, Committee on World Food Security. http://www.fao.org/unfao/govbodies/en/.
12. WTO, Committee on Agriculture Special Session, “Revised Draft Modalities for Agriculture,” document TN/AG/W/Rev.4, December 6, 2008. http://www.wto.org /english/tratop_e/agric_e/agchairtxt_dec08_a_e.pdf.
13. Exemptions to this requirement include least-developed countries and those net food-importing developing countries that undertake not to use their Blue Box entitlements.
14. These percentages remain subject to confirmation, but informally they would seem to have been agreed to by the parties.
15. These include soya, cotton, bovine hides and skins, and chicken parts.
16. Technically, this could apply to all products, special or not. But because nonspecial products could be subject to larger (bound) tariff reductions, the likelihood is greater on special products.
17. See, for example, GATT Article XIX, “Emergency Action on Imports of Particular Products.” http://www.wto.org/english/res_e/booksp_e/analytic_index_e /gatt1994_07_e.htm.
18. Ministerial Declaration, 6th WTO Ministerial Conference, Doha Work Programme, WTO document WT/Min(05)/Dec, December 22, 2005. http://www.wto.org / english/thewto_e/minist_e/min05_e/final_text_e.htm.
19. See previous discussion about “bad law.”
20. See WTO, Committee on Agriculture Special Session, “Total Value of Agricultural Production,” WTO document TN/AG/S/21/Rev.5, October 25, 2010. http://www . wtocenter.org.tw/SmartKMS/do/www/readDoc? document _id=110545 &action =content.
r eferences
de Schutter, Olivier. 2011. “The World Trade Organization and the Post-Global Food Crisis Agenda: Putting Food Security First in the International Trade System.” United Nations Special Rapporteur on the Right to Food, Briefing Note 04, November 16. http://www .srfood.org/images/stories/pdf/otherdocuments/20111116_briefing_note_05_en.pdf.
Laborde, David, and Will Martin. 2012. “Agricultural Trade: What Matters in the Doha Round?” Policy Research Working Paper 6261, World Bank, Washington, DC.

152 Food Security and the World Trade Organization
Trade Policy and Food Security • http://dx.doi.org/10.1596/978-1-4648-0305-5
Sharma, Ramesh. 2011. “Food Export Restrictions: Review of the 2007–2010 Experience and Considerations for Disciplining Restrictive Measures.” FAO Commodity and Trade Policy Research Working Paper 32, Food and Agriculture Organization of the United Nations, Rome.
UN HLTF (United Nations High-Level Task Force on the Food Security Crisis). 2010. Updated Comprehensive Framework for Action. United Nations, New York, September. http://www.un-foodsecurity.org/node/842.
Wacziarg, Romain, and Karen Horn Welch. 2008. “Trade Liberalization and Growth: New Evidence.” World Bank Economic Review 22 (2): 187–231.
WTO (World Trade Organization). 2012. Report on G-20 Trade Measures (Mid-October 2011 to Mid-May 2012). WTO, Geneva. http://www.wto.org/english/news_e/news12 _e/g20_wto_report_may12_e.doc.

153 Trade Policy and Food Security • http://dx.doi.org/10.1596/978-1-4648-0305-5
Regional Trade of Food Staples and Crop Inputs in AfricaJohn C. Keyser
introduction
Rising prices for basic food products are back in the headlines, and when food prices rise, poor people in Africa, who spend the majority of their income on simple foodstuffs, suffer. Rising food prices are also having important macroeco-nomic effects on many African countries because more and more food is being imported from the global market, leading to worsening balances of trade. This issue is not going to go away. Demand for food in Africa is projected to double by 2020 with consumers increasingly located in rapidly growing cities.
Fortunately, as the World Bank (2012) shows in its recent report, Africa Can Help Feed Africa: Removing Barriers to Regional Trade in Food Staples, the conti-nent does have the means and opportunities to deliver improved food security to its citizens. If African farmers were to achieve the yields that farmers attain in other developing countries, the output of food staples would easily double or even triple, thereby reducing Africa’s dependence on imports from the rest of the world. For this to happen, however, farmers need to be better linked to both inputs and consumers. Often the nearest source of demand is across a border, yet fragmented regional markets and lack of predictable trade policies deter much needed private investments, from small investments by poor farm-ers in raising productivity to large investments in input supply, seed multiplica-tion, and food marketing. Given that different seasons and rainfall patterns are not conveniently confined within national borders and that variability in pro-duction is expected to increase with climate change, facilitating cross-border trade is more important than ever to provide farmers and traders the opportu-nities and incentives they need to supply Africa’s rapidly growing demand for staple commodities.
This chapter looks at the trade situation for food staples and crop inputs in different parts of Africa and the types of barriers that need to be overcome for the continent to achieve its potential in food trade. Despite having some of the lowest per hectare yields in the world, many places in Africa with good
c H A p t e r 7

154 Regional Trade of Food Staples and Crop Inputs in Africa
Trade Policy and Food Security • http://dx.doi.org/10.1596/978-1-4648-0305-5
growing conditions already produce food surpluses that are not traded inter-nationally because of various constraints. Following an overview of current trade conditions for food staples and crop inputs, the chapter gives two prac-tical examples of how efforts to reduce trade costs for crop inputs and food staples could have a leveraged effect on rural incomes and agriculture com-petitiveness. The final part of the chapter then describes a number of strategic areas where relatively clear-cut policy changes and institutional reforms could help set Africa on a path to realizing its full potential in agricultural produc-tion and trade.
c urrent t rade of Food staples
Most cross-border food trade in Africa currently takes place in informal value chains outside the legal system. This is particularly true in West Africa where small traders account for virtually all transactions and an estimated 70 percent of intraregional food trade among members of the Economic Community of West African States (ECOWAS) is unrecorded (Bromley and others 2011). Similarly, in the East African Community (EAC) and surrounding countries, small traders are said to account for about 80 percent of intraregional food trade, with the vast majority of them going around the legal system because of excessive costs and difficulties navigating official channels (FSNWG 2012; Ogalo 2010; Pannhausen and Untied 2010). Bearing in mind that informal trade is well adapted to current conditions and is important for providing employment to a great many people, one can see that these systems also have a number of inherent weaknesses in terms of poor economies of scale, lack of dependability, vulnerability to corrup-tion, exposure of traders to harassment, and risk of spreading disease across bor-ders that militate against the opportunities for Africans to benefit from trading in their own regional markets.
Equally apparent is that formal sector trade involves many cumbersome procedures, such as consignment-specific import and export licensing and detailed quality inspections in both importing and exporting countries that are often superfluous to actual buyer and seller requirements and do little more than provide revenue to government agencies and other certifying bodies. Governments have a responsibility to monitor what goes across their borders, yet the difficulty and expense of complying with formal trade procedures are often a large part of what drives small traders into the informal market. Large-scale formal transactions are no direct substitute for the employment created by small-scale trade, except that these deals often involve several thousand tons of product being handled in a single shipment, and so are strategically impor-tant for moving the kinds of volumes of food from surplus to deficit areas that Africa needs to feed itself. Development of efficient and predictable proce-dures that allow large- and small-scale traders to compete more effectively with each other and with global commodities is therefore an important part of the challenge to achieving food security, poverty reduction, and growth across the African continent.

Regional Trade of Food Staples and Crop Inputs in Africa 155
Trade Policy and Food Security • http://dx.doi.org/10.1596/978-1-4648-0305-5
Regional Food Trade in West AfricaIn West Africa, most regional food trade involves small consignments being traded in informal value chains based on personal or linguistic ties or both. These movements range from simple cross-border deals between extended family and tribe members to transactions along traditional corridors that sometimes extend over thousands of kilometers and multiple border posts. Precise figures are dif-ficult to come by, but in the Ashaiman market near Tema, Ghana, for example, female traders say that a dozen or so individuals travel to northern Togo once or twice a month to buy 20–50 bags of cowpeas for sale in their market stalls and to other domestic traders. Regional experts likewise report that Burkina Faso exports some 20,000–40,000 tons of maize to Niger and Mali in most years, with lesser volumes flowing into Benin, Ghana, and Togo, depending on annual supply and demand conditions (Bromley and others 2011). An established trade corri-dor for maize between Techiman, Ghana, and Niamey, Niger, is said to exist (1,100 kilometers [km] across two borders), and considerable volumes of sor-ghum reportedly travel from Kano, Nigeria, to Dakar, Senegal (3,600 km across four borders). Onions and tomatoes are also widely traded in regional markets.
Despite the importance of these transactions, the overall volume of regional food trade in West Africa is clearly low and significantly below its potential. Table 7.1 provides an overview of West Africa’s imports of selected commodities and shows that most internationally traded foods originate from outside the region. Regionally grown maize, for example, accounted for only 3 percent of recorded ECOWAS imports from 2005 to 2009 and probably no more than 10 percent of total imports, including informal transactions outside the legal system. Although many parts of West Africa have a maize deficit, surpluses in high production zones that could help meet the shortfall often go untraded because of high costs, fragmented markets, and other trade barriers. In table 7.1, a greater share of total imports of millet and sorghum originates in other ECOWAS countries, but even for these commodities, value-chain experts say that large quantities go untraded because breweries, stock feed manufacturers, and other buyers who need a regular supply find importing from outside the region easier and cheaper.
Indicative of these limited trade connections, large price differences from one West African country to another are frequent. During the 2008 food crisis, for
t able 7.1 ec o WAs imports of Basic Foods, by r egion, 2005–09Percent
Other ECOWAS Rest of world
Maize 3 97Millet 38 62
Sorghum 21 79
Livestock 98 2
Source: Compiled from Bromley and others 2011.Note: ECOWAS = Economic Community of West African States.

156 Regional Trade of Food Staples and Crop Inputs in Africa
Trade Policy and Food Security • http://dx.doi.org/10.1596/978-1-4648-0305-5
example, prevailing market prices for maize in the farm areas of southwestern Burkina Faso stood at only US$280 per ton against US$640–US$750 per ton in major coastal cities from Accra, Ghana, to Lagos, Nigeria. Similarly, in 2010, millet prices in Accra were around US$660 per ton, compared with US$260–US$360 per ton in the northern production zones of south-central Mali and northern Burkina Faso.1 Although West Africa has some of the highest transport costs in the world, these large price differences cannot be explained by transport alone.
With respect to livestock, table 7.1 shows that a very different situation prevails: 98 percent of imports originate in other ECOWAS countries. In this case, several thousand goats, sheep, and even cattle are shipped every day along traditional trade corridors from Sahelian countries to deficit zones in coastal areas. As for grains, these transactions are mostly informal and involve high costs, and so lead to low producer prices and high consumer prices that limit the potential for growth and livelihood improvement. With more and more people in West Africa living in large cities, policies to improve the efficiency of regional livestock markets also need to be a high priority for the future.
In both the livestock and the grain markets, most regional trade in West Africa relies on social, linguistic, and even family bonds. Even very-long-distance trade deals are typically based on oral contracting and, especially in the livestock sector, may involve credit sales and therefore require strong interpersonal relations. In these deals, commodities often change hands five or six times between the farm and the retail levels, with each intermediary incurring costs and needing to make a profit from the transaction. Rebagging, for example, is typically done each time grain is sold because no other guarantees for quality or even basic composition are available. Volumes are typically measured by the number of bags or tins per bag rather than in kilograms or metric tons. In physical terms, most traders work in small lots that range in size from just a few bags (300–400 kilograms of grain) to perhaps one or two full truckloads at most (30–80 tons).2
Although it is clear that these trading systems are well adapted to local condi-tions and institutional realities in West Africa, it is equally apparent that the lack of more systematic and larger-scale trade imposes a high cost on the region. In an open economy, price is determined competitively, and value flows upstream from the consumer to each producer and marketing agent in the chain. All costs and profit margins taken by processors, traders, and other value-chain partici-pants before the product’s value reaches the farm level therefore have a direct bearing on the price that can be paid to producers and thus on rural incomes and potential for growth and poverty reduction. Unlike in eastern and southern Africa, few, if any, large-scale commodity brokers are involved in regional trade of food staples in West Africa, and few impersonal institutions exist of the type needed for traditional traders to switch from one corridor to another to take advantage of new business opportunities.
The World Food Programme (WFP) is currently the largest regional trader in West Africa and seeks to procure a variety of staple foods for its relief operations. In practice, however, the WFP reports frequent problems in obtaining the

Regional Trade of Food Staples and Crop Inputs in Africa 157
Trade Policy and Food Security • http://dx.doi.org/10.1596/978-1-4648-0305-5
required export permits, quality certificates, and other documents needed from different countries for large transactions to succeed. Small traders mostly avoid these requirements, but large commercial traders, including the WFP, that need to comply with all rules and regulations cannot. Procurement of large quantities at a competitive price has also been a problem for the WFP because procurement usually must be done through government-controlled agencies. In 2010, for example, the government of Ghana offered rice to the WFP at US$970 per ton ex Tamale, Ghana, against the world market price of US$550 per ton landed in Monrovia, Liberia, where the supplies were needed. The WFP is obliged to buy regional grain when possible, but this very high offer was considered uncompeti-tive, and the deal was eventually stopped after exporting just 1,600 tons of a 4,000-ton procurement.
Regional Food Trade in Eastern and Southern AfricaAs in West Africa, the majority of food trade in eastern and southern Africa occurs in simple cross-border deals that often involve female traders traveling from one country to another to buy goods to sell in market stalls. Larger-scale informal trade routes from surplus food zones into deficit areas also exist. With just 9.3 percent of total land classified as arable, Kenya suffers from a structural deficit in staple food and relies in most years on informal imports from Uganda and Tanzania to make up at least some of its maize shortfall. Southern Malawi is another good example of a chronically deficient food zone that depends in most years on maize from northern Mozambique and eastern Zambia for at least some of its maize supply. Lubumbashi and other large mining towns in Katanga Province of the Democratic Republic of Congo are other major deficit areas.
As in West Africa, informal trade, even of full truckloads, often involves offloading the commodity at the border; transporting it around the border by bicycle, motorbike, head, wheelbarrow, or some other circuitous means; and then reloading it on the other side. Very often, these transactions are more expensive per ton than formal sector trade, but are still more appropriate for small traders because of poor economies of scale and other barriers to complying with formal sector procedures.
In contrast with West Africa where regional experts speak of annual trade flows in tens of thousands of tons, however, the overall scale of food trade is much larger in eastern and southern Africa. According to the Food Security and Nutrition Working Group (FSNWG) the total volume of informal trade between 11 countries at 36 eastern Africa border crossings was 1.2 million metric tons from October 2011 to September 2012, including 408,000 tons of maize (34 percent); 300,000 tons of beans (25 percent); 252,000 tons of rice (21 percent); 96,000 tons of sorghum (8 percent); and 144,000 tons of other foods, including cooking bananas, groundnuts, millet, and cassava (12 percent). Uganda in particular is identified as a major food exporter and accounted for 70 percent of these informal exports, compared with 13 percent for Ethiopia, 9 percent for Tanzania, and 4 percent for Rwanda (FSNWG 2012; see figure 7.1).3 Combined with formal sector shipments, traded volumes in eastern Africa are

158 Regional Trade of Food Staples and Crop Inputs in Africa
Trade Policy and Food Security • http://dx.doi.org/10.1596/978-1-4648-0305-5
Figure 7.1 Directions of informal Food t rade in eastern AfricaPercent
Source: FSNWG 2012.
a. Sources of informal trade
Tanzania,9
Rwanda,4
Somalia,2
Other,2
Uganda,70
Ethiopia,13
Kenya,39
Rwanda,30
Republic ofSouth Sudan,
9
Burundi,4
Other,7
Sudan,11
b. Destinations of informal trade

Regional Trade of Food Staples and Crop Inputs in Africa 159
Trade Policy and Food Security • http://dx.doi.org/10.1596/978-1-4648-0305-5
even larger, with around 7.3 million tons of imports of cereals and pulses by the same 11 countries in 2010 from regional and extraregional sources.4
Also in contrast with West Africa, upward of 20 percent of regional food trade in countries of the EAC and the Common Market for Eastern and Southern Africa (COMESA) involves some kind of formal contracting. In these deals, established trade houses and large-scale commodity brokers may be engaged to supply anywhere from a few hundred to several thousand tons of grain that meet the buyer’s specific quality requirements and designated delivery date. In these deals, superintendent companies are often used to help with quality certification and to oversee loading and unloading procedures. Depending on the terms of the contract, ownership may change at the time of loading or, more often, upon delivery to the buyer’s specified location. As in West Africa, procurement for the WFP accounts for a large share of formal transactions, but unlike in West Africa, privately owned mills and food-processing companies, breweries, stock feed manufacturers, bakeries, and other large users of staple commodities make many of the deals.
Despite the much larger scale of intraregional trade in eastern and southern Africa, many countries, including Kenya, Eritrea, Sudan, and the Republic of South Sudan, still rely heavily on global imports to satisfy their total food demand. Similar to the trade situation in West Africa, therefore, table 7.2 shows that just 2.2 percent of formal maize trade in the COMESA region from 2004 to 2008 originated in other COMESA countries. The share of local commodities in total trade would be higher if informal transactions and grain from South Africa and Tanzania were included in the COMESA picture. Nevertheless, as in West Africa, large amounts of grain go untraded in EAC and COMESA countries because of market barriers and infrastructure limitations.
In mid-2012, for instance, Zambia was acknowledged to have the world’s larg-est stockpile of nongenetically modified white maize available for export, equal to about 1.8 million tons, held in depots scattered around the country. Because of limited road and rail capacity and challenges of meeting the EAC’s minimum quality requirements, however, the WFP and other large traders reported that only about 30,000–50,000 tons per month could be exported, meaning three to five years would have been needed to export Zambia’s entire surplus. In practice,
t able 7.2 intraregional imports as a percentage of total c omes A imports of Basic Foods, 2004–08
Food 2004 2005 2006 2007 2008 Average
Maize 3.0 0.4 0.1 5.2 2.2 2.2Beans 8.5 6.4 12.3 20.3 8.2 11.1Pulses 4.8 18.4 1.2 4.01 1.6 6.0Rice 11.1 11.1 22.4 21.8 28.8 19.0Wheat 0.7 0.8 0.1 0.1 0.1 0.4
Source: Compiled from USAID COMPETE (2010) based on COMSTAT data.Note: COMESA = Common Market for Eastern and Southern Africa.

160 Regional Trade of Food Staples and Crop Inputs in Africa
Trade Policy and Food Security • http://dx.doi.org/10.1596/978-1-4648-0305-5
storage problems led to large grain losses, and in December 2012, the Zambian government announced that it would not issue any new export permits in response to rising domestic prices and an outbreak of armyworms that was threatening the 2012–13 crop.
In addition to the need for traditional phytosanitary certificates, formal sector traders face myriad trade licensing and inspection procedures that add to the cost of trade and make participation in the formal economy difficult and expensive, particularly for small traders. In Tanzania, for instance, all consignments of strate-gic grains, including maize, rice, and wheat, are subject to time-bound import and export permits by the Ministry of Agriculture, Food Security and Cooperatives. Although the permit requires no fee, the importer/exporter must have a valid trading license and be registered with the Tanzania Revenue Authority. Moreover, all food imports to Tanzania require a separate Food Import Permit issued by the Tanzania Food and Drugs Authority (TFDA). To obtain the Food Import Permit, traders must register annually with the TFDA in Dar es Salaam. The Food Import Permit itself is usually valid for one month and requires the applicant to provide information detailing the source of the product, quantity and quality to be imported, entry point, and expected date of delivery. For each consignment, importers must send a preshipment sample to the TFDA for analysis. The ship-ment is then subjected to physical inspection at the point of entry and may be put to further laboratory analysis if inspection reveals any reason to believe the consignment does not conform to the exact specifications on the permit.
Similarly, in Zambia, each vehicle carrying agricultural produce into or out of the country must carry an original trade permit issued by the Agribusiness Unit of the Ministry of Agriculture and Livestock (MAL). Although the US$6 fee for the permit is relatively modest, traders must be registered with the Zambia Revenue Authority and present a valid phytosanitary certificate and non- genetically modified organism (non-GMO) certificate to receive the trade permit. Moreover, until recently, all traders were required to specify the vehicle registration number and trailer number to be used when crossing the border. If the designated vehicle suffered a breakdown or was otherwise engaged, the permit could not be used and a trader had to apply for and receive a new one from MAL. In the longer term, Zambian and other regional traders also report that the unpredictable availability of trade permits is an even bigger problem and a major deterrent to private investment and forward contracting.
Many eastern and southern Africa countries, including Botswana, Malawi, Namibia, Tanzania, Zambia, and Zimbabwe, currently ask for non-GMO certifi-cation as part of the phytosanitary process. In Zambia, private inspectors were allowed to conduct non-GMO tests for the purpose of trade certification, but this procedure has now been made the sole responsibility of the Pathology Unit at Zambia Agriculture Research Institute (ZARI). Under the new system, desig-nated non-GMO inspectors must draw physical samples for laboratory analysis that can be performed only at ZARI headquarters at Mt. Mukulu, near Lusaka. Zambia does not allow any type of genetically modified seed into the country, but it still requires non-GMO testing as part of the certification process.

Regional Trade of Food Staples and Crop Inputs in Africa 161
Trade Policy and Food Security • http://dx.doi.org/10.1596/978-1-4648-0305-5
Currently, no fee is charged for non-GMO certification, but, as with phytosani-tary inspection, traders report that they must transport inspectors from ZARI to perform the certification and even arrange to deliver the sample to Mt. Mukulu if the grain is stored far from Lusaka.
Zambian grain traders further report they are required to obtain non-GMO certificates for exports to South Africa even though South Africa is not a non-GMO country and certification is not part of the buyer’s requirements. In July 2011, Kenya began to allow occasional GMO imports, and in late 2013, Zimbabwe began to allow GMO grain imports for domestic milling, but only with police escort to prevent the grain from being diverted and used for seed. Further complicating the matter, traders say Namibia allows GMO imports of South African maize meal but not unmilled grain, while Botswana sometimes allows GMO imports for stock feed but not for human consumption. Given that COMESA, EAC, and Southern African Development Community (SADC) countries are currently looking to establish a tripartite free trade area among the three regional bodies, the issue of non-GMO certification is likely to be a signifi-cant negotiating topic in the near future.
Moreover, in an effort to make trade more reliable and amenable to large-scale transactions, many governments in eastern and southern Africa have adopted a host of minimum quality standards and testing requirements for food staples promulgated by their national bureau of standards. The EAC has been particu-larly active in this regard and currently has mandatory regional standards for at least 29 different staple foods with a further 13 final draft standards awaiting formal adoption by the Council of Ministers. Ethiopia, Malawi, Zambia, and Zimbabwe also have national standard specifications covering a wide variety of food staples, and each requires formal sector imports to be accompanied by a test certificate issued by the exporting country’s national bureau of standards.
Because of concerns for the certifying capacity of other countries, however, many governments also require importers to obtain a domestic quality certificate or subject the consignment to further detailed inspection at the border. The Tanzania Bureau of Standards, for example, requires maize importers to apply for batch certification at least one week prior to arrival at a cost of US$6.50 for the application plus 0.2 percent of the value for actual certification (EAC 2005). Although food safety is understandably important, these high charges have led many traders to complain that the duplicate procedures in Tanzania and other countries are as much about generating revenue for the certifying body as they are about genuine public health concerns. Such procedures also have the effect of pushing small traders into using informal routes because following all pre-scribed procedures is uneconomical when dealing in loads below a certain size.
Another good example of apparently superfluous test requirements is in Tanzania, where all food imports and exports are subject to mandatory radiation testing by the Tanzania Atomic Energy Commission (TAEC) in Arusha. The TAEC charges 0.2 percent and 0.4 percent of the value of exports and imports for this service, respectively, which it says is to protect local consumers from radi-ated imports and to preserve the country’s reputation as a safe food exporter.

162 Regional Trade of Food Staples and Crop Inputs in Africa
Trade Policy and Food Security • http://dx.doi.org/10.1596/978-1-4648-0305-5
The testing policy, however, does not distinguish between foods that come from areas without risk of radiation exposure, and all consignments are required to pay for the inspection without allowing free passage of goods from locations that previously passed the test. Thus far, the TAEC says that not a single interception of tainted food has occurred and reports that other countries do not demand or even recognize the TAEC test certificate. Moreover, the TAEC says that it cur-rently tests only 10–15 samples per day, meaning a large gap exists between its stated policy of inspecting every shipment and current practice (Kweka, Zacchia, and Mehta 2012).
Despite these obstacles to regional trade, some countries in eastern and south-ern Africa have done very well with food exports and offer good examples of what other countries may realistically aspire to with liberal border policies. Since the end of its civil war in 1992, for example, Mozambique has allowed both imports and exports of maize without tariff or quantity restriction. Because northern Mozambique is a maize surplus area and because nearby Malawi and Zambia offer better prices than southern Mozambique after accounting for the high cost of north–south transportation, traders in northern Mozambique rou-tinely export grain across these regional borders. The open border policy in turn allows food deficits in Mozambique’s southern cities to be met by millers who import grain from South Africa for domestic processing and sale. This has allowed trade to stabilize prices in Maputo compared with other capital cities in the region (World Bank 2008, 2012).
Free trade policies have likewise helped Uganda to become a recognized food basket for East Africa with upward of about 180,000 tons of informal maize exports to Kenya each year and a further 70,000 tons of maize going to Rwanda and 20,000 tons to the Republic of South Sudan.5 Uganda is also Africa’s second-largest supplier of maize and beans to the WFP after South Africa, with 109,000 tons of commodity purchased at international parity prices in 2010 for use in various relief and development operations. Uganda has not imposed any export restrictions on agricultural products in recent years, and the consistent policy environment is widely credited with encouraging a supply response from farmers to meet regional demand (World Bank 2012). Free trade, therefore, is at least partly responsible for Uganda having achieved one of the fastest agriculture growth rates in Africa together with remarkable progress in poverty reduction from a rural headcount index of 60 percent in 1992 to just 23 percent in 2009–10 (World Bank 2011).
r egional t rade of s eed and Fertilizer
With respect to crop inputs, regional trade is almost nonexistent in West Africa and more advanced, but still limited, in eastern and southern Africa. This is par-ticularly true for fertilizer, where opportunities for regional trade are severely constrained by countries insisting on their own unique product formulations and by lengthy product-testing requirements. Some Zambian firms have started to export locally blended fertilizer to the Democratic Republic of Congo but say

Regional Trade of Food Staples and Crop Inputs in Africa 163
Trade Policy and Food Security • http://dx.doi.org/10.1596/978-1-4648-0305-5
this is not possible in other markets where tighter controls exist. With seed, the opportunities for regional trade are similarly constrained by extensive product registration and testing procedures. Zambia, Zimbabwe, and South Africa each has a long history of exporting several thousand tons of seed per year to other African countries, but only at a high cost to individual firms that have to test and register each new variety in every destination country, often for three to four years. To the extent that African suppliers are able to provide quality inputs geared to local conditions and at better prices than can domestic or world sup-pliers, trade barriers at the input supply stage of an agricultural value chain can have an even greater effect on farmer productivity, incomes, and competitiveness than can barriers to trade of food staples themselves.
The challenge of trading seed, fertilizer, and agrichemicals begins with the fact that each product must normally be tested and registered with the ministry of agriculture and possibly other statutory agencies in the importing country before they are allowed in. Product registration is customary to ensure the product is safe and effective to use given the country’s own agroclimatic conditions. Suitability trials typically require three to four crop cycles before a new product is approved. In Ghana, the Plants and Fertilizer Act of 2010 (Republic of Ghana 2010) specifically requires all varieties of seed to be tested domestically for a minimum of three years regardless of whether the variety has been approved and adopted in neighboring countries with similar growing conditions. Seed compa-nies pay the full cost of this service equal to a minimum of US$3,500 per year for expression of interest and seed entry plus the full cost of all materials used in on-station and farmer field trials agreed to with the Plant Protection and Regulatory Services Directorate (PPRSD). In some cases, private suppliers say these requirements have led them to register only a few products in their port-folio that are generally suitable for each country, rather than all available prod-ucts, including ones that could be more appropriate for some specific areas and types of farmers.
In another example of how registration procedures can have a high cost on trade competitiveness, table 7.3 compares the cost of pesticide registration in Tanzania and Kenya. Pesticides are not normally used for maize growing, but are beneficial to other staple foods, including wheat, rice, and cassava, and are widely used for fumigation of maize to prevent postharvest losses. As shown, the fees charged by the Tropical Pesticides Research Institute (TPRI) in Tanzania are
t able 7.3 pesticide r egistration Fees in t anzania and KenyaUS$ per product
Fee Tanzania Kenya
Application 50 0Field trial 4,500 1,500Registration 600 435Total 5,150 1,935
Source: TAHA 2007.

164 Regional Trade of Food Staples and Crop Inputs in Africa
Trade Policy and Food Security • http://dx.doi.org/10.1596/978-1-4648-0305-5
166 percent higher than the ones charged across the border by Tanzania’s main trade competitor. Moreover, because the domestic market for pesticides is much smaller in Tanzania than in Kenya, the cost of registration as a share of potential future sales is even higher than the data indicate. The TPRI generally does not recognize the testing and registration of chemicals done in other countries and requires a minimum of three full seasons for domestic field trials regardless of other international test results or safety certificates. According to the Tanzania Horticultural Association, whose members are the main users of pesticides in Tanzania, the high cost and time taken to comply with TPRI requirements mean there are many newer, more effective, and safer products on the world market that Tanzanian farmers cannot access (TAHA 2007).
To counter this problem, the TPRI reports that efforts are under way to insti-tute fast-track registration procedures as part of its negotiations with other EAC countries on a common Sanitary and Phytosanitary (SPS) Protocol. Under the draft agreement, pesticides that have been approved in Kenya or any other EAC country would require only two seasons of testing in Tanzania instead of the current three. Given that Kenya’s pesticide-testing capabilities are generally more advanced and rigorous than those in Tanzania and that the countries share many of the same environmental conditions, even this fast-track approach could still be regarded as a burden to Tanzania’s trade competitiveness.
Once a product has been approved, annual fees typically also apply for rereg-istration. In Zambia, importers must register each type of fertilizer, agrichemical, and seed they plan to import with the Zambia Environmental Management Agency each year at a cost of about US$325 per product. Similarly, in the live-stock sector, each veterinary medicine (and even each differently sized vile) must be registered annually with the Zambia Pharmaceutical Regulatory Authority at a cost of US$325 per product and with the Zambia Environmental Management Agency at a cost of around US$260 per product. In addition to these fees, 2 percent of the invoice amount for all veterinary medicines is paid to the Veterinary Department of the Ministry of Agriculture and Livestock as a screen-ing charge (World Bank 2014). Likewise, in Ghana, fertilizer importers must pay almost US$1,600 every two years to register each approved fertilizer product they wish to import while seed importers must pay US$1,000 per year to register each variety of seed. As with food staples, documentation requirements vary from country to country, but usually require traders to obtain import and export permits, quality certificates, phytosanitary certificates, and in many cases, non-GMO certificates for seed. Problems with duplicate testing are also common. Nigeria, for example, requires all fertilizer imports be held at the port of entry until a domestic laboratory confirms that the product matches the manufacturer’s claims regardless of other international test results or certificates of authenticity (USAID-EAT 2012).
To improve the regional trade situation for seed, COMESA, ECOWAS, and SADC have taken steps to develop harmonized systems for seed registration and seed certification. The ECOWAS system was formally adopted by the ECOWAS Council of Ministers in May 2008 and sets out guidelines in which any variety of

Regional Trade of Food Staples and Crop Inputs in Africa 165
Trade Policy and Food Security • http://dx.doi.org/10.1596/978-1-4648-0305-5
seed registered in one ECOWAS country would be eligible for production and commercial sale in any other ECOWAS country without further certification or testing (FAO 2008). The COMESA and SADC seed systems are somewhat more restrictive in that they allow only new varieties to be freely marketed in countries with similar agroclimatic conditions if they have been released in two other member states, but essentially follow the same principles (COMESA 2013; SADC 2008). Each regional seed system aims to establish a regional seed cata-logue backed by common procedures for seed testing and variety release, com-mon terminology and labeling standards, and common lists of quarantine pests to expedite phytosanitary control.
In southern Africa, discussion of harmonized seed policies began in 1987 when the idea was first presented as part of a review of seed system development strategies under the former Southern Africa Development Coordination Conference (SADCC) (Rohrbach, Minde, and Howard 2003). From this early beginning, discussion of harmonized seed polices continued intermittently throughout the 1990s until, in 2001, the Swiss Agency for Development and Cooperation (SDC) agreed to support establishment of the SADC Seed Security Network (SSSN). With Swiss and other donor support, including assistance from the United States Agency for International Development (USAID) through the International Crops Research Institute for the Semi-Arid Tropics (ICRISAT); Sustainable Commercialization of Seeds in Africa (SCOSA); Iowa State University, the International Maize and Wheat Improvement Center (CIMMYT); and the United Nations Food and Agriculture Organization (FAO), SADC even-tually launched a comprehensive set of Regional Seed Rules in 2008 (SADC 2008). In February 2010, five Ministers of Agriculture signed a memorandum of understanding (MOU) to implement the SADC Seed Rules, and in 2011, the SADC Seed Centre at Chalimbana, near Lusaka, was appointed to serve as sec-retariat (Keyser 2013).
According to the terms of the SADC Treaty, however, actual implementation of the seed system could not begin until at least two-thirds of SADC member countries signed the MOU. This target was finally reached in June 2013 with all but five SADC member countries having signed as parties to the MOU.6 Nevertheless, before harmonized seed trade can become reality, each participat-ing country must align its national seed laws to conform to the regional system through a process known as domestication. According to the SADC Seed Centre, this requirement means the full system might not be operating until 2015 or 2016, provided new national laws are enacted. Malawi is currently reviewing its seed laws to bring the text into compliance with the regional system, whereas Zambia has made the revisions already but still requires Parliamentary approval. In both cases, therefore, the new laws are not likely to take effect for some time (Keyser 2013).
Similarly, in West Africa members of ECOWAS, the West African Economic and Monetary Union (Union Économique et Monétaire Ouest Africaine, or UEMOA), and the Permanent Interstates Committee for Drought Control in the Sahel (Comité permanent Inter-États de Lutte contre la Sécheresse dans le Sahel,

166 Regional Trade of Food Staples and Crop Inputs in Africa
Trade Policy and Food Security • http://dx.doi.org/10.1596/978-1-4648-0305-5
or CILSS) agreed to a set of harmonized seed regulations in 2008 covering pro-cedures for variety release and seed certification (ECOWAS 2008). As in south-ern Africa, however, the reality five years later is that the seed system has yet to be operationalized and the region’s governments still recognize only their own variety lists and certification procedures. When asked about the implementation of 2008 ECOWAS Seed Regulations in 2012, for example, staff members at the Ghana PPRSD explained that there had been “some discussion” of harmonized trade policies for seed but that these talks were at a very early stage. In effect, many West African countries do not yet have a seed act, and considerable work is needed to build new capacities before the harmonized seed system can be put into practice. COMESA began its discussions of harmonized seed rules in 2008 and thus had the advantage of being able to model its draft regulations on those already put forward by other regional economic communities (RECs). However, it still faces challenges similar to SADC and ECOWAS with member states hav-ing to domesticate the regional rules and develop essential capacities before trade according to the system can begin (Keyser 2013).
Although many of Africa’s RECs have at least begun the process of harmoniz-ing seed policy, only ECOWAS has attempted to develop regional regulations for fertilizer. Similar to the development of seed regulations, ECOWAS adopted a set of regional regulations for fertilizer quality control in 2012 (ECOWAS 2012) and is now in the process of finalizing the required implementing regulations and building new capacities needed to bring the system into operation. Again, requirements vary from country to country, but fertilizer is often subject to man-datory preshipment inspections at ports and border crossings, which introduces delays in shipment caused by multiple inspections. In many countries, fertilizer also faces incompatible packaging and product specifications for accepted com-pounds that prevent legal trade across borders.
Although different soils and crops naturally need different amounts of nutri-ents for optimal growth, a recent study by the International Fertilizer Development Center and the International Food Policy Research Institute shows that product differentiation in West Africa has taken place for nontechnical reasons (Bumb, Johnson, and Fuentes 2011). As a result, different blends must be custom made for each country at a very small scale, which adds unnecessarily to production cost and price. By harmonizing fertilizer blends across countries and encouraging local blending capacity, West Africa could realize an estimated savings of at least US$30–US$40 per ton (US$1.50–US$2.50 per 50-kilogram bag). Moreover, given that fertilizer application rates in Africa are among the lowest in the world, any savings in trade costs would likely contribute to much higher crop yields simply as a result of more farmers being able to afford at least some product even if it is not always the most ideal type. According to the Ghana PPRSD and the Zambia Agriculture Research Institute, local blends are designed to help farmers achieve maximum yields, and the cost of preparing each formulation is not con-sidered when approving new products.
Similar constraints and opportunities exist in eastern and southern Africa where most countries insist on their own granulated formulations and therefore

Regional Trade of Food Staples and Crop Inputs in Africa 167
Trade Policy and Food Security • http://dx.doi.org/10.1596/978-1-4648-0305-5
incur high costs to manufacture and ship relatively small amounts. The main nitrogen, phosphorous, and potassium (NPK) fertilizer used in Zambia, for example, cannot legally enter Malawi because it does not meet Malawi’s specifi-cations (USAID-EAT 2012). A detailed study of Malawi’s agricultural compara-tive advantage in 2010 found that 80 percent of the farm-gate value of fertilizer was attributed to the price at the place of origin and to international shipping (Tchale and Keyser 2010). Even a minor savings in international procurement costs could therefore have a highly leveraged effect on fertilizer prices and opportunities to improve agricultural production and food security.
Input subsidy programs in different countries further complicate the trade situation in Africa with much of the fertilizer that crosses regional borders travelling illegally. In the 2012–13 crop season, for example, Ghana subsidized 176,000 tons of fertilizer for noncocoa crops at a cost of around US$64 million. In practice, however, even the Ministry of Food and Agriculture acknowledged that problems arose with smuggling. According to the Ghana News Agency (2012), less than 25 percent of the 1,700 tons of fertilizer meant for small farmers in Kassena-Nankana District ended up in local soils; the rest was smuggled to Burkina Faso where it could be sold for two times the subsidized price.
Input subsidy programs can also be risky in terms of the potential to deliver crop inputs late because of delays in budgetary approvals and funding shortfalls. Late delivery of seed and fertilizer has been a significant problem in Zambia for years with many farmers not receiving their inputs until well after the optimal time or in different quantities than they expected (World Bank 2010). Although subsidies can have many positive effects, these programs are inherently expensive to run and carry an ever-present risk of leakage and so raise many good reasons to look for complementary and more sustainable ways of reducing prices, such as improving the regional trade environment.
t he Benefits of minimizing t rade Barriers
To illustrate the practical importance of improving trade conditions for food staples and crop inputs, two case study examples are discussed below. The first looks at the costs of moving food staples across the Kasumbalesa border between Zambia and the Democratic Republic of Congo for informal and large- and small-scale formal sector traders. This example illustrates the highly regressive nature of formal sector trade costs: informal traders pay almost 40 percent more on a per ton basis for bribes and porters’ fees to cross the border than large trad-ers. However, informal traders would pay 76 percent more than they already do if they were to follow all legal procedures for a typical small-size load. The sec-ond example considers the costs of importing fertilizer to Ghana. It shows how a relatively modest 8.2 percent reduction in the trade costs for fertilizer could result in as much as a 134 percent increase in profits for medium input farmers who use 10 percent more fertilizer and achieve 15 percent higher yields as a result of the savings from improved trade conditions.

168 Regional Trade of Food Staples and Crop Inputs in Africa
Trade Policy and Food Security • http://dx.doi.org/10.1596/978-1-4648-0305-5
Trade Costs at KasumbalesaThe first example of how trade costs directly affect consumer prices and rural incomes is a look at the costs of cross-border movement at the Kasumbalesa border between Zambia and the Democratic Republic of Congo. Until Zambia introduced export restrictions in late 2012, the Democratic Republic of Congo was Zambia’s second-largest maize importer after Zimbabwe and accounted for about 100,000 tons of sales annually worth an estimated US$35 million.7 Almost all marketed maize in Zambia is grown by smallholder farmers and, because of limited milling capacity in the Democratic Republic of Congo, most of this prod-uct was exported as value-added maize meal.
First, table 7.4 summarizes the costs of moving two different-sized loads of maize meal across the Kasumbalesa border using the formal channel. As shown, formal sector costs are highly regressive: small traders using a 7-ton truck would pay 184 percent more per ton (US$107.92 per ton) compared with large traders using a 30-ton truck (US$37.88 per ton). These charges not only undermine the opportunities to bring small traders into the formal market, but also put signifi-cant pressure on Zambia’s competitiveness as an agricultural exporter. As indi-cated, the physical act of crossing the border alone is equal to 15 percent of the farm-gate price for maize in Zambia and 7 percent of the landed price for maize meal in Lubumbashi when transported in a full-size truck. For small traders, border costs are even higher at 42 percent of the farm-gate price and 19 percent of the Lubumbashi wholesale price when carried in a 7-ton truck. From a value-chain perspective, these costs take away directly from the total profits available to flow up the chain to smallholder farmers, transporters, and all other agents involved in the production and marketing of maize in Zambia.
In terms of trade documents, formal sector traders at Kasumbalesa require an export permit from the Zambia Ministry of Agriculture and Livestock and a phytosanitary certificate from the Zambia Agriculture Research Institute. The Democratic Republic of Congo does not require a non-GMO certificate, but traders must still pay for one because it needs to be shown when exiting Zambia and is required to obtain both the Zambia export permit and the phy-tosanitary certificate. Unlike maize exports to Kenya and other EAC countries, trade with the Democratic Republic of Congo does not require quality analysis by the Zambia Bureau of Standards. Nevertheless, the Congolese inspectors routinely draw one or two 25 kilogram bags from each truck for their own analysis and charge US$30 for the inspection. Exporters say they never hear anything about the test results and speculate that the samples are sold or used for food instead.
The Democratic Republic of Congo is not a free-trade-agreement member of COMESA, and border officials therefore do not recognize COMESA Certificates of Origin and instead charge a flat duty of US$1.50 per ton regardless of where the maize is from. Traders also noted that the Democratic Republic of Congo requires all maize meal to be packed in bags showing the expiry date. Zambia does not have the same requirement, and millers must print special bags to meet the Democratic Republic of Congo’s labeling standard.

Regional Trade of Food Staples and Crop Inputs in Africa 169
Trade Policy and Food Security • http://dx.doi.org/10.1596/978-1-4648-0305-5
In addition to the specific trade costs for food staples, table 7.4 shows that the Democratic Republic of Congo requires all foreign trucks to purchase a vehicle entry card, tourism card, and insurance card, as well as visas and health cards for the driver and mechanic. The total cost of these certificates was reported to be US$315, equal to US$10.50 per ton or 1.9 percent of the landed price of maize meal in Lubumbashi for a large 30-ton load, and US$40 per ton (7.1 percent of
t able 7.4 c osts of Formal s ector Border c rossing at Kasumbalesa, november 2011
Cost
30-ton truck 7-ton truck
NotesUS$/truck
US$/ton
US$/truck
US$/ton
Costs to exit ZambiaExport permit for maize or
mealie meal 8.76 0.29 5.32 0.76 US$150 for 510 tons (valid 30 days)Phytosanitary certificate 3.13 0.10 3.13 0.45 US$62.50 for book of 20 (1 per truck)Non-GMO certificate 30.00 1.00 30.00 4.29 Needed for Zambia permits, not required
by DRCASYCUDA fee 10.00 0.33 10.00 1.43 Fixed cost per customs entryClearing agent 75.00 2.50 75.00 10.71 Typically US$50–US$100 depending on
agentCrossing fee - out (to Zambian
Government) 133.00 4.43 48.00 6.86 Varies by truck sizetotal cost to exit Zambia 259.89 8.66 171.45 24.49
Costs to enter/exit DRCQuality testing (fee) 30.00 1.00 30.00 4.29 Quoted priceQuality testing (loss of 1 bag as
sample)28.50 0.95 28.50 4.07 Value of 1 bag per truck at Lubumbashi
wholesaleImport duty (COMESA Cert. not
accepted) 45.00 1.50 10.50 1.50 COMESA Certificates of Origin not acceptedEntry card 80.00 2.67 80.00 11.43 Quoted priceTourism card 25.00 0.83 25.00 3.57 Quoted priceInsurance card 100.00 3.33 100.00 14.29 Fixed price per truckVisas (for driver and mechanic) 90.00 3.00 90.00 12.86 Quoted priceHealth cards (for driver and
mechanic) 20.00 0.67 20.00 2.86 Quoted priceClearing agent (customs entry) 125.00 4.17 95.00 13.57 Estimate based on higer rate than in ZambiaR/T Crossing fee (to concessionaire) 200.00 6.67 80.00 11.43 Slightly cheaper than toll on Zambia sidetotal cost to enter/exit Dr c 743.50 24.78 559.00 79.86
Costs to return to Zambia (empty)Crossing fee - in (to Zambian
Government) 133.00 4.43 48.00 6.86 Varies by truck sizet o tAl c ost s o F Form Al
cr ossin G 1,136.39 37.88 778.45 111.21As % of Zambia farmgate price 15% 43% US$260/ton paid by Food Reserve AgencyAs % of Lubumbashi wholesale 7% 20% US$560/ton quoted price for maize meal
Source: Calculations based on visit to Kasumbalesa, the Democratic Republic of Congo, November 2011.Note: ASYCUDA = Automated System for Customs Data; Cert. = certificate; COMESA = Common Market for Eastern and Southern Africa; DRC = Democratic Republic of Congo; GMO = genetically modified organism; R/T = round trip.

170 Regional Trade of Food Staples and Crop Inputs in Africa
Trade Policy and Food Security • http://dx.doi.org/10.1596/978-1-4648-0305-5
the Lubumbashi price) for a small 7-ton load. Moreover, licensed clearing agents must be used on both sides of the border for a total reported cost of about US$200 per 30-ton truck (US$6.67 per ton) or US$170 (US$24.28 per ton) for a 7-ton truck.
Table 7.4 also shows that traders must pay very substantial toll fees on both the Zambian and the Congolese sides of the border to use the formal channel. New border facilities were opened in both countries in late 2011 by a concessionaire who was originally granted a license by the Zambian and the Congolese govern-ments to charge a toll, or “crossing fee,” to use the facilities it constructed. Toll charges vary by truck size but are very high at US$15.53 per ton for a 30-ton truck (41 percent of all border costs) and US$25.15 per ton for a 7-ton truck (23 percent of all costs). In January 2012, the Zambian government terminated the conces-sionaire’s contract over concerns of corruption with the way the concession was awarded and took over the revenue collection itself. The toll charges, however, have not been reduced, and traders continue to pay the same high fees as before.
Once on the Congolese side of the border, Zambian millers further report that they expect to pay an additional US$300 for official and unofficial fees and bribes to travel 100 km from Kasumbalesa to Lubumbashi plus US$200 for driver allowances. Millers report great difficulty in finding drivers willing to make the journey to Lubumbashi because of the many inconveniences and lack of security on this route. In one example, a driver reported he was fined US$10 at a Congolese roadblock because he was wearing sunglasses but did not have sun-glasses in his driver’s license photo. More seriously, a truck belonging to a Zambian miller accidentally knocked a cyclist off his bicycle when turning a corner. The cyclist was not seriously injured, but it eventually cost the miller more than US$15,000 in compensation and official and unofficial fines and took more than two weeks to get the driver and vehicle back to Zambia. A return trip from an Ndola mill in Zambia to Lubumbashi in the Democratic Republic of Congo (total distance about 475 km) reportedly took 7–10 days on average. The trucks usually return empty because no goods are available to send on a backload.
Other than the formal route, of course, large amounts of agricultural com-modities and other goods are smuggled through informal channels at Kasumbalesa. This smuggling is done in broad daylight immediately adjacent to the two border posts through which a steady stream of bicycles loaded with heavy bags are walked across the border with Zambian and Congolese agents standing in full view to meet the smugglers and collect bribes for allowing the goods to pass. Traders at the border reported that loads up to about 300 25-kilogram bags of maize meal (7.5 tons) go across by bicycle, but that anything larger must nor-mally use the formal route.
The standard prices charged by bicycle porters to smuggle goods from Zambia to the Democratic Republic of Congo are summarized in table 7.5. These prices cover the cost of delivery from Zambia to the “cleared side” of the Congolese border (that is, a parking zone used by buses and other motorists just outside the controlled concession area), including the cost of bribes to allow the goods to pass. Typically, owners of the commodity go through the formal border as

Regional Trade of Food Staples and Crop Inputs in Africa 171
Trade Policy and Food Security • http://dx.doi.org/10.1596/978-1-4648-0305-5
pedestrians to have their passports stamped and then meet the porter on the other side. In table 7.5, the quoted price of US$61.20 per ton for an informal crossing with maize meal is equal to 11 percent of the landed price in Lubumbashi and 25 percent of the Zambia farm-gate price for maize.
Finally, figure 7.2 compares the per ton costs of moving maize meal from Zambia to the Democratic Republic of Congo for informal, small formal, and large formal traders at Kasumbalesa and illustrates the hurdle informal traders face in joining the legal market. As shown, border costs are highly regressive in that informal traders pay about 62 percent more per ton to move a ton of com-modity across the border than large traders do, but would pay almost double if they switched to the small formal route. As a result, most small traders end up in the informal channel where they pay much higher costs than large traders do to their own disadvantage and to the disadvantage of all others in the value chain. Shipments of food from outside Africa, of course, normally go by the large formal route, and these data show how efforts to minimize border costs for small traders can be an important part of improving Africa’s global competitiveness and ability to feed itself.
Fertilizer Trade and Rural Incomes in GhanaThe second case study considers how efforts to reduce trade costs for fertilizer could have a leveraged effect on agriculture competitiveness and rural incomes in Ghana. The point of this analysis is not to recommend specific alternatives to Ghana’s subsidy program, but to demonstrate how even a modest reduction in trade costs could go a long way toward achieving many of the same objectives as a subsidy without being a drain on the national budget.
First, table 7.6 shows the estimated buildup of fertilizer prices in Ghana under two trade scenarios. The base scenario reflects actual conditions that prevailed in the 2009–10 agriculture season in which the unsubsidized price of NPK fertilizer was about US$39.00 per 50 kilogram bag. The reduced-cost scenario, in contrast, reflects the type of savings that could realistically be achieved through various trade improvements. A detailed study of the Ghana fertilizer market and underlying price structures found that market constraints and bottlenecks account for up to 50 percent of the commercial price of
t able 7.5 c ost of informal Border c rossing at Kasumbalesa for s elected c ommodities, november 2011
Commodity CGF/bag US$/ton
Maize meal (25 kg) 1,400 61.20Rice (50 kg) 3,400 74.32Salt (50 kg) 3,900 85.25Sugar (50 kg) 5,400 118.03Fertilizer (50 kg) 2,900 63.39
Source: Local reports at Kasumbalesa, the Democratic Republic of Congo, November 2011.Note: CGF = Congo franc; kg = kilogram.

172 Regional Trade of Food Staples and Crop Inputs in Africa
Trade Policy and Food Security • http://dx.doi.org/10.1596/978-1-4648-0305-5
fertilizer (Fuentes, Johnson, and Bumb 2011). The 8.2 percent price reduction modeled here is therefore a conservative estimate of the savings that could be realized from regional policies such as introducing harmonized fertilizer blends, streamlining import procedures, and reducing transport costs. Potential savings on finance charges and improved domestic marketing are not included in this analysis yet offer further potential for price reduction.
Figure 7.2 Border c osts for maize at Kasumbalesa
Source: Calculations based on visit to Kasumbalesa, the Democratic Republic of Congo, November 2011.
0
20
40
60
80
100
120
US$
/ton
Informal Small formal Large formal
t able 7.6 Buildup of Fertilizer prices in Ghana under Alternative t rade s cenarios
Cost component
Base scenario (2009 prices) Hypothetical savings Reduced cost scenario
Structure (%) US$/ton Savings (%) US$/ton Structure (%) US$/ton
International procurement and blending 20 156.00 −20 (31.20) 17 124.80Port services and stevedores 18 140.40 −5 (7.02) 19 133.38Credit for procurement 32 249.60 - 35 249.60Domestic transportation 21 163.80 −15 (24.57) 19 139.23Distribution/retail margins 7 54.60 - 8 54.60Other (clearing charges, etc.) 2 15.60 −5 (0.78) 2 14.82total 100 780.00 (63.57) 100 716.43
Source: Calculations based on structure reported by Fuentes, Johnson, and Bumb 2011.Note: Total reduction as percentage of base price is 8.2 percent.

Regional Trade of Food Staples and Crop Inputs in Africa 173
Trade Policy and Food Security • http://dx.doi.org/10.1596/978-1-4648-0305-5
Next, table 7.7 presents a set of financial indicators for medium- and high-input hybrid maize using the base price of fertilizer and hypothetical 8.2 percent reduction modeled above. For this analysis, production costs and returns are based on Ministry of Food and Agriculture crop budgets and a farm-gate price for maize of US$160 per ton (C| 30 per kilogram). Unless indicated, all values are expressed in U.S. dollars per hectare.
As demonstrated, Ghana could derive significant benefit from efforts to improve trade conditions for fertilizer. In the first place, scenario 1 shows how an 8.2 percent reduction in fertilizer costs would result in 44 percent and 17 percent higher gross and net profits, respectively, for medium- and high-input farmers than under base conditions. For medium-input farmers, the savings on trade costs translates to US$12.08 per hectare higher profits, while for high-input farmers, the savings on fertilizer results in US$24.16 per hectare extra profit. In scenario 2, the lower price of fertilizer is assumed to lead to 10 percent more use per hectare and 15 percent higher yields. Under these conditions, per hectare profits would be US$52.88 higher at the medium-input level and US$108.16 greater at the high-input level. For medium-input farmers, this change from improved trade procedures is equivalent to transforming maize from a loss-making activity
t able 7.7 Financial indicators for Ghana Hybrid maizeUS$ per hectare
Fertilizer use (bags basal × top dress per ha) Medium input 2 × 2 High input 4 × 4
Base conditionsc rop yield (tons/ha) 1.70 3.50Total revenue 272.00 560.00Variable costs 244.48 421.93Family labor and depreciation 47.34 56.38Gross margin (total revenue - variable costs) 27.52 138.07net profit (gross margin - family labor and depreciation) (19.82) 81.69
Scenario 1—Streamlined trade procedures (8.2% savings on fertilizer)c rop yield (tons/ha) 1.70 3.50Total revenue 272.00 560.00Variable costs 232.40 397.78Family labor and depreciation 47.34 56.38Gross margin (total revenue - variable costs) 39.60 162.22net profit (gross margin - family labor and depreciation) (7.74) 105.84
Scenario 2—8.2% savings on fertilizer, 10% more use, 15% more yieldc rop yield (tons/ha) 1.96 4.03Total revenue 312.80 644.00Variable costs 232.40 397.78Family labor and depreciation 47.34 56.38Gross margin (total revenue - variable costs) 80.40 246.22net profit (gross margin - family labor and depreciation) 33.06 189.84
Source: Calculations based on Ghana Ministry of Food and Agriculture crop budgets.Note: Farm-gate price = US$130 per ton (C| 30 per kilogram). ha = hectare.

174 Regional Trade of Food Staples and Crop Inputs in Africa
Trade Policy and Food Security • http://dx.doi.org/10.1596/978-1-4648-0305-5
into a profit-making one in net terms. As a percent change, the scenario 2 incre-ment is equal to a 134 percent increase in income for medium-input farmers and 64 percent increase for high-input farmers.
Finally, table 7.8 looks at the total available profits for regionally traded maize from a value-chain perspective, including the costs of primary assembly (trans-portation from the farm to a nearby collection point, a short period of storage, handling, and preparation of essential export documentation). For this part of the analysis, total accumulated costs at the assembly point exclude profits paid to farmers and local traders. This approach allows total accumulated costs to be subtracted from the export parity price to show how much total profit is avail-able to flow upstream to farmers and other value-chain participants. Unless indicated, all values for this part of the analysis are expressed in U.S. dollars per ton of tradable grain.
Again, the data demonstrate that Ghana could realize significant benefits from efforts to streamline trade procedures for fertilizer. Although nothing guarantees that incremental profits will flow all the way up the chain to farmers, scenario 1 shows how an 8.2 percent reduction in fertilizer costs would result in more than five times as much total profit being available per ton of exportable grain at the medium-input level. With high-input management, total profits per ton of export grain would be about 31 percent higher. In scenario 2, the total available
t able 7.8 value-c hain indicators for Ghana Hybrid maizeUS$ per ton of tradable grain
Fertilizer use (bags basal × top dress per ha) Medium input 2 × 2 High input 4 × 4
Base conditionsc rop yield (tons/ha) 1.70 3.50Farm costs 171.66 136.66Assembly costs (including documentation and storage) 62.55 62.55total value chain costs for export ready grain 234.21 199.21Total available profit at export parity 2.79 37.79
Scenario 1—Streamlined trade procedures (8.2% savings on fertilizer)c rop yield (tons/ha) 1.70 3.50Farm costs 164.55 129.76Assembly costs (including documentation and storage) 62.55 62.55total value chain costs for export ready grain 227.11 192.31Total available profit at export parity 14.89 49.69
Scenario 2—8.2% savings on fertilizer, 10% more use, 15% more yieldc rop yield (tons/ha) 1.96 4.03Farm costs 143.09 112.83Assembly costs (including documentation and storage) 62.55 62.55total value chain costs for export ready grain 205.64 175.39Total available profit at export parity 36.36 66.61
Source: Calculations based on Ghana Ministry of Food and Agriculture crop budgets.Note: Export parity = US$358 per ton CIF (cost, insurance, and freight)

Regional Trade of Food Staples and Crop Inputs in Africa 175
Trade Policy and Food Security • http://dx.doi.org/10.1596/978-1-4648-0305-5
profits per ton of exportable maize would be about 13 times higher with medium-input management and 76 percent greater with high-input manage-ment. Similar results would apply to maize grown as an import substitute, and the analysis overall clearly shows that modest improvements in trade conditions for fertilizer could have significant tangible benefits for farmer incomes and regional trade competitiveness.
o pportunities to improve t rade c onditions
Even though regional trade suffers from many constraints, there are a number of clear-cut areas where policy improvements or other institutional change could help African countries realize the type of benefits from trade described in the preceding examples. This chapter cannot possibly provide an exhaustive account of all that needs to be done, or even what could be done, to improve the regional trade of food staples and crop inputs. Instead, the aim is to highlight a few key areas of strategic importance where governments and other regional stakeholders could reasonably expect to reduce trade costs and create a more reliable environ-ment over the next few years to the benefit of small- and large-scale traders alike.
Better Awareness and Understanding of Trade RulesPresently, a lot of confusion exists in Africa over the requirements to move food staples from one country to another. Very often, border officials and even trade advisers do not know the correct procedures and will quote different rules depending on who is on duty. In West Africa, the use of certificates of origin to achieve duty-free status under the ECOWAS Trade Liberalization Scheme appears to be a particular area of confusion. Truckers complain that officials at the same border post sometimes request a certificate of origin for community-originating cereals and at other times they do not (Bromley and others 2011). Such inconsistency not only leads to unnecessary costs and opportunities for corruption, but also makes trade risky for large- and small-scale operators by creating difficulty in knowing what documents are required on any given day of the week. In another example of misapplied trade rules, Zambian fertilizer blenders say Congolese officials at Kasumbalesa require their products to be accompanied by a phytosanitary certificate even though fertilizer is not a plant product and should not be subject to phytosanitary control.
To help improve awareness in West Africa, the U.S. Agency for International Development (USAID) Agribusiness and Trade Promotion (ATP) project has produced a wallet-size card listing the requirements for regional food trade and distributes it to traders (see table 7.9). In a similar initiative, the regional nongov-ernmental organization Borderless (which was set up and funded in part by the ATP project) publishes its own pamphlets that list the requirements for import-ing products to Ghana at the Aflao border with Togo.8 Many of the documents listed by ATP, however, are not listed by Borderless and vice versa. Borderless, for example, does not mention the need for a phytosanitary certificate and instead says that all agriculture products must be certified by the Ghana Customs, Excise

176 Regional Trade of Food Staples and Crop Inputs in Africa
Trade Policy and Food Security • http://dx.doi.org/10.1596/978-1-4648-0305-5
and Preventive Service (CEPS) laboratory or Ghana Standards Authority (GSA). Traders in turn describe the CEPS/GSA inspection as being about phytosanitary control and say that officers will carry out a visual inspection to look for pests even when they have a phytosanitary certificate from Togo.
Although both the Borderless and the ATP initiatives are important steps in the right direction, greater coordination is evidently needed to ensure that infor-mation given to traders is complete and accurate. In the preceding example, standards covering quality attributes such as moisture content and total defect are a completely different matter from phytosanitary standards concerned with human, animal, and plant diseases. The mixing of these aspects by GSA and CEPS officials no doubt contributes to the opaque trade environment and is a specific area where trade facilitation projects like Borderless and ATP could help improve transparency and understanding.
Dissemination of product standards by official agencies is another area where much could be done to make trade conditions more transparent. If one puts aside the danger of making quality standards mandatory (particularly if modeled on developed-country norms), voluntary standards can be used as a language among traders and as a benchmark for determining value. Nevertheless, most standards bodies in Africa do not make their final work public and insist on charging traders and other users for a copy of each approved specification.9 GSA directors in Accra say this is the usual practice of standards organizations around the world, but (apart from the lost revenue) they could easily make Portable Document Format (PDF) copies available on the GSA website that would go a long way to building a constituency for standards and, ultimately, to improving regional trade conditions, product quality, and competitiveness. Similar to the situation in Ghana, all harmonized East Africa Standards must be purchased from one of the national standards organizations or the EAC Secretariat.
Even at the level of the standards bodies themselves, greater appreciation of the important differences between core SPS functions and distinctions between trade standards and technical regulations appears to be needed (see box 7.1). This is particularly important for East Africa where compliance with
t able 7.9 ec o WAs r egional t rade r equirements
ECOWAS rules for staple foods trade Documents for trading in staple foods
Customs duties—NOVAT or sales tax—NOStatistical tax—NOComputerization fee—NOFreight forwarder fee—YESTransit fee—NOISRT logbook—NOWeighbridge fee—YESOfficial road tolls—YES
ECOWAS Brown Card (insurance)—YESExport declaration—YESPhytosanitary Certificate—YESWaybill—YESNational and international driver’s license—YESCertificate of Origin—NOISRT logbook—NO (and NO transit fee)
Source: USAID Agribusiness and Trade Promotion project.Note: ECOWAS = Economic Community of West African States; ISRT = Inter-State Road Transit; VAT = value added tax.

Regional Trade of Food Staples and Crop Inputs in Africa 177
Trade Policy and Food Security • http://dx.doi.org/10.1596/978-1-4648-0305-5
harmonized regional standards for at least 42 different kinds of staple foods is already mandatory and increasingly well enforced through multiple certification and inspection requirements. The EAC justifies this approach largely on food safety grounds because the standards address the important issue of mycotoxin contamination. At the same time, however, many of the EAC specifications address matters of private importance, such as broken, shriveled, or discolored grains, that should not be mandatory. Indeed, because mycotoxins are an impor-tant SPS concern, the reasons for addressing this problem through a standards approach rather than traditional SPS certification are not entirely clear, espe-cially when a consolidated permit could eliminate duplicate procedures and save on trade costs.
This need for clear understanding of the important differences between man-datory regulations and voluntary standards is especially relevant to the negotia-tions among EAC, COMESA, and SADC countries on the establishment of a tripartite free trade area. Already, practical experience suggests that adoption of the harmonized EAC standards is a major problem for southern Africa producers with large grain traders in Kenya, Mozambique, Zambia, and other countries say-ing the EAC standards for broken grains and total grain defect make maize exports unnecessarily difficult and expensive. In Lusaka, WFP procurement officers report the EAC standards for total grain defect are a particular problem because of the tight tolerance for quality factors such as insect damage, discolor-ation, and undersize and shriveled grains that are difficult to meet. Although the overall quality of Zambian maize is regarded as very good, virtually the entire marketed crop is now grown by smallholder farmers, so is sundried and naturally prone to uneven color.10 Sun-bleached maize yields flour that is less than snow white, which can affect a miller’s financial return but is perfectly safe to consume and should not be subject to mandatory regulation. Likewise, immature and shriveled grains are common in smallholder maize when inputs are used late or in insufficient amounts. Such grain results in a lower milling outturn but has no inherent health risk.
Officials at the Kenya Bureau of Standards point out that a high share of dis-colored and shriveled grains can sometimes be an indicator of mycotoxin and say
Box 7.1 Difference between a technical r egulation and a standard
The difference between a standard and a technical regulation lies in compliance. Whereas conformity with standards is voluntary, technical regulations are by nature mandatory. They have different implications for international trade. If an imported product does not fulfill the requirements of a technical regulation, it will not be allowed for sale. In the case of standards, noncomplying imported products will be allowed on the market, but their market share may be affected if consumers prefer products that meet different local standards.
Source: World Trade Organization website, http://www.wto.org.

178 Regional Trade of Food Staples and Crop Inputs in Africa
Trade Policy and Food Security • http://dx.doi.org/10.1596/978-1-4648-0305-5
that is why these factors are included in the EAC standards. Given that the EAC already requires detailed tests for aflatoxin, aflatoxin B1, and fumonisin, however, such risks are unlikely to justify further mandatory analysis, particularly in the context of tripartite plans for closer economic integration. In practical terms, therefore, one option for EAC, SADC, and COMESA to consider would be to make the presence of discolored and shriveled grains an alternative indicator of mycotoxin to be used when scientific testing is not possible. Rather than apply multiple minimum standards for the same thing, such an approach would save on trade costs and ease the way for small traders to participate in the formal economy, thereby improving the overall level of food safety compared with the current situation in which most grain is not inspected at all.
Better Commitment to Free TradeBeyond the problem of confusion for everyday trade rules, a larger issue is that governments themselves are not always committed to free trade. Many countries in West Africa, notably Burkina Faso and Mali, often implement seasonal export bans on cereals (Bromley and others 2011). In late 2012, for example, Burkina Faso was reported to have export bans on both rice and beans, while in Ghana the WFP said it had been waiting since the end of August for a permit to export 10,000 tons of maize to Niger without any reply from government.11
In southern Africa, Zambia likewise has a long history of agricultural trade restrictions. This is particularly true for maize, which is inherently vulnerable to drought and subject to a great many political pressures as the main smallholder crop and daily staple food for almost the entire nation. Other than maize, Zambia has banned the import of wheat for many years to protect local produc-ers and, at various times, has imposed similar trade bans on soybeans, poultry, pork, beef, and other strategic commodities. Tanzania also has an extensive record of banning food exports. Tanzania’s most recent export ban on maize was lifted in September 2012 amid statements that the government is committed to the country becoming a regional food supplier, but of course, how long this will last remains to be seen, given that trade is still administratively controlled with time-bound import and export permits.
Addressing the problem of limited will to implement regional free trade agreements is therefore likely to be one of the more intractable trade constraints. Even though trade bans are seldom successful in achieving their objectives and have been shown to have many negative effects, including increased food price volatility, many governments continue to implement these policies in the name of food security and other political objectives.
As such, the best that may realistically be expected in the near term could be to help traders cope better with the risk of bans. Often trade bans are poorly communicated, meaning that traders and even border officials do not know the real situation. An obvious first step would be to improve communication of when bans are put in place and when they are lifted. In practical terms, such information could easily be communicated over the Internet by way of an official COMESA, EAC, ECOWAS, or SADC website.

Regional Trade of Food Staples and Crop Inputs in Africa 179
Trade Policy and Food Security • http://dx.doi.org/10.1596/978-1-4648-0305-5
A second area for improvement would be to make implementation of trade bans more predictable. This goal may be difficult to achieve, but efforts to define a set of verifiable conditions under which governments could exercise their dis-cretion to implement a trade ban could be a good area for dialogue, especially if systems were geared to provide an early warning of when a ban may be put in place. The USAID Famine Early Warning Systems Network (FEWS NET) proj-ect has done extensive work in Africa to develop systems for predicting food shortages that could be a good starting point for such a system. The use of export taxes and quotas during a time of food stress could be another option to explore and would at least be a more favorable approach than outright prohibitions on trade, but it may then have several other costs if the systems are not transparent or easy to follow.
On a day-to-day basis, in fact, much better commitment to free trade is needed among frontline border officials, police officers, and other control agents. Mercantilist attitudes that see the only good kind of trade as export trade still hold sway across Africa, and efforts to build awareness of the importance of free trade could help avoid shipments being held up on spurious grounds. Petty and not-so-petty corruption, for example, not only adds to the cost of regional trade, but also can render improved trade rules meaningless if the procedures are not implemented. Similar to the situation at Kasumbalesa described previously, small traders at Aflao, Ghana, say they commonly pay C| 4.00–C| 5.00 per bag (about US$21.30–US$26.60 per ton) to use the back channel to avoid inspection and paperwork requirements (Aidoo 2012).12 In another example, clearing agents at the port in Tema, Ghana, say standard procedure is to pay C| 100–C| 200 (US$53–US$106) per container to CEPS and GSA officers for their inspections to “go fast.” Although each cost may seem minor and better than being delayed, these charges add up and significantly affect competitiveness and profitability.
As a strategy for reducing illegal costs in West Africa, Borderless has been publishing quarterly reports on the number of controls, cost of bribes, and delays along 13 major trade corridors since 2007.13 Borderless says this strategy of “nam-ing and shaming” has helped reduce costs over time, but it acknowledges that much more needs to be done to change attitudes and make formal rules more transparent and easy to navigate. In one of its recent reports, the USAID West Africa Trade Hub lists all of the charges truckers reported paying on the Ghana to Nigeria corridor (White 2012). More systematic monitoring of these fees (including duplicate fees paid at borders) could be a useful way to build on the name-and-shame strategy (see box 7.2). Until now, no routine monitoring of trade costs or number of duplicate permits required to move food staples across borders in eastern and southern Africa has occurred, and development of such a system in this part of Africa could be a good strategy for trade projects to explore.
Clear, Easy-to-Meet RulesOne further practical area where much could be done to make regional trade easier would be to adopt rules and regulations based on the principles of mutual recognition and equivalence. One especially notable barrier in agriculture is that

180 Regional Trade of Food Staples and Crop Inputs in Africa
Trade Policy and Food Security • http://dx.doi.org/10.1596/978-1-4648-0305-5
none of the regional trade blocs, including ECOWAS, EAC, COMESA, SADC, and UEMOA, has a fully developed regional approach to SPS. As a result, traders are often required to pay for more than one SPS certificate or to obtain different inspection stamps when crossing borders. Discussions are under way in the EAC, COMESA, and SADC regions on establishing SPS protocols for each region, but none of these agreements is complete. UEMOA likewise adopted a framework SPS agreement in 2007 that is still in draft form, whereas ECOWAS has not taken similar steps, leading to problems for traders of long delays and multiple costs when moving from one trade bloc to another.
Given the historic trade ties that exist among African countries and the large amounts of food that presently go around the formal system without any inspec-tion at all, regional approaches based on equivalence and mutual recognition of each other’s SPS systems would likely be more meaningful than any attempt to harmonize with developed-country norms. Although the World Trade Organization’s SPS Agreement encourages member states to harmonize their
Box 7.2 c osts of r egional t rade on the Ghana-to-nigeria c orridor
In a survey by the USAID West Africa Trade Hub, truckers on the Ghana–Nigeria corridor said they have been asked to pay the following formal and informal charges to transport food products.
1. Administrative tax (1% FOB [free on board]) 21. Laisser Passer2. Association of Customs Agents levy 22. NAFDAC3. BIVAC 23. Parking/stationnement4. Certificat d’origine 24. Passage BMA5. Certificat d’origine douane 25. Passage magasin douane6. Certificat sanitaire (phytosanitary/SPS) 26. PC7. CNCB 27. Police levy8. Commune 28. Priseen charge9. Convoy fee/escorte 29. Redevance informatique
10. Custom agent 30. Section visite11. Declaration/quittance 31. Sortie12. Ecor 32. Standards Organization of Nigeria13. Ecotax 33. Statistical tax14. ECOWAS tax 34. Taxes de déclaration15. Enregistrement 35. Taxes globales16. Entry tax 36. Taxes supplémentaires17. Finance charge for reimbursables 37. Tolls/péage18. Gendarmerie levy 38. Transit fee19. Hygiene and sanitation 39. Veterinarian tax20. Import card 40. Visa
Source: White 2012.

Regional Trade of Food Staples and Crop Inputs in Africa 181
Trade Policy and Food Security • http://dx.doi.org/10.1596/978-1-4648-0305-5
SPS standards with international ones, it stops short of making this approach mandatory. Simply put, African countries have very different SPS problems from developed countries and only limited capacity to tackle these problems.
More specifically, many international standards assume the existence of a con-formity assessment infrastructure that is often nonexistent in developing countries or that can be established and maintained only at a very high cost. Moreover, in developed countries, domestic standards are often close to, if not exceeding, the international ones, meaning that harmonization is often a simple matter of making minor adjustments to match international best practice. In Africa, in contrast, making domestic standards equal to the international ones can demand a revolu-tionary new approach to SPS management with considerable upgrading of inspec-tion and public outreach capabilities required for the new standards to work (Jensen and Keyser 2010). Without basic awareness and promotion of good prac-tices for hygiene and safety, higher-level investments in standards diplomacy or development of advanced laboratory capabilities have little practical benefit and can even be counterproductive (World Bank 2005). In the EAC, governments say the adoption of standards based on international norms is justified by the need to keep world markets open for member states, but exporters who sell to developed countries already have many other ways to demonstrate compliance with their buyer requirements than to make these rules mandatory for every regional trader.
Other than SPS, attempts to make trade rules easier for small and medium-size traders to follow in some eastern and southern African countries have included introduction of simplified customs forms (to save on the cost of using a clearing agent) and duty waivers on goods valued below a certain amount (to eliminate the need for certificates of origin). Mozambique, for instance, introduced a simplified system in 1998, allowing traders to import any good with an FOB value less than US$500 without having to file a customs declaration form, provided the trader had not brought in any other goods within the past 30 days. Likewise, in COMESA, the Simplified Trade Regime (STR) between participating member countries allows simplified border procedures to be applied to a selected list of community-originating goods with a proven value less than US$500. Although this amount was later revised upward to US$1,000, there are currently fewer than 50 STR transactions per month at some borders using the STR and almost no transactions in agriculture. One main reason for this is that even under the STR, traders must comply with all other formal sector requirements, including import and export licensing, phytosanitary certification, non-GMO certification, and quality certifica-tion that are expensive if not completely impractical to follow for the majority of traders dealing in small amounts. Given the vast importance of small-scale trade in Africa, the development of comprehensive systems to address these other con-straints to formal sector participation by small traders is clearly important and could go a long way to helping governments address genuine food safety and phy-tosanitary concerns that are widely ignored today.
On the input side, a further area where trade rules could be made easier to follow would be to allow different blends of fertilizer to be traded between coun-tries. Member states would need to work out the details of such a system, but like

182 Regional Trade of Food Staples and Crop Inputs in Africa
Trade Policy and Food Security • http://dx.doi.org/10.1596/978-1-4648-0305-5
the SADC regulatory system for seed, the idea of such an approach would be (a) to permit free entry of fertilizer between members, (b) to provide for acceptance of fertilizer compounds that have been approved by another member, and (c) to allow shipments of fertilizer inspected by another member. Harmonized regional policies would reduce transaction costs, and the resulting common market might even be large enough to make local manufacture of fertilizer a viable investment option. According to one regional trade project, a fully integrated SADC or COMESA market could be large enough to sustain profitable ammonia or urea production in Mozambique (USAID-EAT 2012).
Another important lesson is to avoid making regulations that cannot be eas-ily implemented. This point may seem obvious enough, but it is a particular concern in Africa where institutional capacity is often very weak. Other than SPS, one trade constraint that donors often point to is the lack of harmonized quality standards. Writing in 2003, for example, the USAID-funded Regional Agriculture Trade Expansion Support Program identified these differences as a “technical barrier to trade” and recommended that the standards for food sta-ples should be harmonized across the entire EAC and COMESA region (RATES 2003). Although quality standards are indeed important for ensuring product safety and can be useful in determining value, recent experience in the EAC shows a significant risk of introducing mandatory requirements modeled on advanced-country conditions that are difficult for local farmers and traders to meet or that consumers do not want and cannot afford (see Keyser 2012). In the worst of conditions, these standards not only add unnecessarily to cost, but also can even become a trade barrier and new vector for corruption (see box 7.3). Like the EAC, the GSA has modeled most of its food standards on the international Codex Alimentarius but now says it is revising its standards for maize to allow higher tolerance for total grain defect in line with local reali-ties. Unlike the EAC, there has not yet been substantial work to develop har-monized regional standards for food staples by ECOWAS or UEMOA countries. For their part, COMESA and SADC have developed some harmo-nized standards for food staples but have not made these mandatory as the EAC has done.
Beyond the effort put into controlling quality at the border, further impor-tant issues arise with the risk of adulteration of products in domestic markets. Fertilizer, seed, agrichemicals, and even crop staples themselves are all vulnera-ble to adulteration and mislabeling in domestic markets where farmers and other consumers come in direct contact with the product and need to depend on quality. One can therefore argue that money spent on developing regional standards and mechanisms to control what comes into a country is wasted unless matched with effective systems for quality assurance after the cross-border movement. Controlling quality at the domestic level is a more difficult and politically sensitive task than inspection of foreign goods at border posts, but it is still a critical part of trade facilitation if only for higher-level investments in standards diplomacy and regional trade agreements to have practical meaning for end users.

Regional Trade of Food Staples and Crop Inputs in Africa 183
Trade Policy and Food Security • http://dx.doi.org/10.1596/978-1-4648-0305-5
Reduced Transport CostsA final important problem for agricultural trade that cannot be overlooked is the high cost of transportation. Compared with manufactured goods and high-value cash crops, food staples usually have a low value-to-weight ratio, so are particu-larly vulnerable to any inefficiency in the transport sector. Although much can still be done to improve road infrastructure throughout Africa, especially of rural feeder roads, physical limitations are increasingly viewed as less important than policy. In an exhaustive study of transport conditions in West Africa, for example, Bromley and others (2011) show how a host of factors ranging from the outdated truck-queuing system to excessive regulation of vehicle operators, corruption at multiple checkpoints, and poor condition of vehicles contribute to West Africa having some of the highest transport costs in the world (see box 7.4).
Roadblocks and control points are a particular problem in West Africa. In its 20th Road Governance Report, Borderless (2012) reported that truckers paid an average of US$4.40 in bribes, encountered 1.8 checkpoints, and suffered
Box 7.3 Harmonized eAc Dairy standards as a potential t rade Barrier
In 2006, the EAC adopted harmonized dairy standards for eight categories of product that follow the international Codex Alimentarius standards for dairy almost verbatim. The EAC standards therefore assume that consumer incomes and production infrastructure are equivalent with Western levels, which is obviously not the case in East Africa.
Consistent with developed-country norms, the EAC standards focus on pasteurization as the key to ensuring product safety. This technology is widespread in developed countries but is difficult and expensive to apply in the context of smallholder dairying, which is the dominant form of production in East Africa. Although smallholders in Africa can and do supply perfectly good raw milk for pasteurization, the infrastructure and quality control systems needed for delivery of smallholder supplies to a processing plant result in consumer prices that are four to five times higher than for raw milk traded through informal channels.
Moreover, consumers in East Africa have found an alternative to reducing health hazards not recognized in the EAC standards, which is to consume raw milk after boiling. This practice reduces the otherwise high bacteria levels found in East African milk to safe levels, a point not recognized during the harmonization process because the Codex Alimentarius standards were developed for Western countries that consume pasteurized milk.
As a result of setting the regional standards too high, the EAC’s harmonized dairy standards have been difficult to implement and provide little practical guidance for farmers, dairy traders, and large processors on how to upgrade their operation. According to the letter of the law, more than 95 percent of the EAC’s milk supply is likely to be technically illegal because it does not comply with the new standards requirements and could be stopped from regional trade at any time.
Source: Jensen and Keyser 2010.

184 Regional Trade of Food Staples and Crop Inputs in Africa
Trade Policy and Food Security • http://dx.doi.org/10.1596/978-1-4648-0305-5
16 minutes of delays for every 100 km travelled in the second quarter of 2012. Some countries, of course, did worse, with Mali recording US$10.40 in bribes and 22 checkpoints per 100 km, compared with US$1.42 in bribes and 10 checkpoints in Togo. In Ghana, traders encountered 20 checkpoints and paid US$1.47 in bribes per 100 km.
Although initiatives such as regular Road Governance Reports have done much to raise awareness of the effect of unofficial charges and have led to the elimina-tion of some checkpoints, much more needs to be done to improve the policy environment. High transit costs, including escort requirements and the need to pay (and reclaim) multiple customs bonds, have been a particular problem and should not even apply to staple foods or other products with duty-free status. Another area for improvement is the regional insurance system, which requires truckers to obtain an ECOWAS Brown Card to be covered outside their home country; but drivers say it is nearly impossible to make a claim when they need to do so.
Despite the better capacity use of trucks in eastern and southern Africa, problems with high transport costs are a significant constraint in this part of Africa as well. Roadblocks mounted by police, customs, immigration, trade unions, forest authorities, health authorities, and municipalities are not as big a problem as in West Africa but do still exist and can impose significant delays and costs on regional transporters. Problems with cross-border movement of foreign- registered trucks have been a particular problem in Kenya, where Ugandan and even Zambian truckers have complained that border authorities routinely prevent foreign vehicles with four or more axles from entering the country despite regional agreements on the free movement of freight.
c onclusion
This chapter reviews current trading conditions for food staples and crop inputs in different parts of Africa and highlights tangible opportunities for improvement. The example of reduced trade costs for fertilizer in Ghana helps
Box 7.4 poor Use of t rucks
Truck operators make money only when wheels are turning. The average monthly distances covered by transporters in different parts of Africa are as follows:
• 11,000–12,000 kilometers (km) per month for domestic transport within South Africa.• 8,000–9,000 km per month for international transport within southern Africa (for example,
South Africa to Zambia via Zimbabwe or Botswana).• 5,500 km per month in eastern Africa.• 2,500 km per month (at best) for transport between Ghana and Mali or Niger.
Source: Bromley and others 2011.

Regional Trade of Food Staples and Crop Inputs in Africa 185
Trade Policy and Food Security • http://dx.doi.org/10.1596/978-1-4648-0305-5
illustrate that trade facilitation is not just an esoteric pursuit but can have very significant, real-life implications for poverty reduction and food security. To the extent that savings on imported fertilizer can substitute for spending on subsidy programs, trade facilitation can also have an important effect on agri-culture budgets and ability of governments to deliver extension advice and other core services needed for agriculture growth. The case study of border costs at Kasumbalesa likewise shows how current trade arrangements impose very high costs on small traders in particular. With many duplicate and repeti-tive procedures, formal sector requirements not only militate against the opportunities for countless thousands of small traders to compete with large shipments, but also undermine the ability of African farmers to compete with global commodities.
Although governments can take a number of simple steps, improving the regional trade environment will require a long-term commitment and strong political will. Just as the costs of corruption and extraneous procedures are obvi-ous, so too are the vested interests in the status quo and rents these systems generate. Therefore, African leaders and agriculture stakeholders more generally need to stay focused on the ultimate objective of free trade and social benefits that improved trade systems can bring.
In this regard, a useful strategy for each country would be to define a set of actions to achieve its trade goals in coordination with regional partners around which the international community could organize appropriate support. Given the practical challenges of policy reform, part of the process should involve defining clear outcomes and indicators for each action item. These can be used to monitor progress and hold officials and leaders accountable to commitments they make to deliver open regional markets for food staples.14 Concrete actions to build a constituency for free trade will also be important. Although good progress has been made to build awareness for the high costs of roadblocks and control procedures in West Africa, complementary efforts to increase awareness for the current high costs of trade requirements and the benefits of free trade are important for Africa to realize its potential to feed itself.
notes
1. See Bromley and others (2011) for a series of isoprice maps with overlays of prevailing prices, population densities, and major trade corridors in West Africa for the 2008 and 2010 seasons.
2. See Bromley and others (2011) for a detailed description of regional value chains for leading commodities.
3. Countries covered by the FSNWG data are Burundi, the Democratic Republic of Congo, Djibouti, Ethiopia, Kenya, Somalia, South Sudan, Sudan, Rwanda, Tanzania, and Uganda.
4. See FAOSTAT data, Statistics Division of the Food and Agriculture Organization of the United Nations, http://www.faostat.fao.org.
5. Extrapolated from FSNWG (2012).

186 Regional Trade of Food Staples and Crop Inputs in Africa
Trade Policy and Food Security • http://dx.doi.org/10.1596/978-1-4648-0305-5
6. As of August 2013, countries that have not yet agreed to implement the SADC seed rules are Angola, Madagascar, Mauritius, Seychelles, and Zimbabwe. According to the SADC Seed Centre, Angola and Mauritius plan to sign soon.
7. Estimate based on Lubumbashi wholesale price for maize meal less transport and border costs for export-ready food on the Zambia side of the Kasumbalesa border.
8. See http://www.borderlesswa.com.
9. In Ghana, the price is currently C| 30 (US$15.95) per product standard, payable in person or by bank order to the GSA.
10. In Kenya, large commercial farmers with access to mechanical dryers grow most mar-keted maize.
11. Meanwhile, small traders were reportedly exporting from Ghana to Mali when the WFP as a large trader could not.
12. Traders at Aflao also report that they need to put a C| 5.00 banknote (about US$2.65) with their passport to avoid having it thrown back at them by Immigration officials for “missing pages.”
13. See http://www.borderlesswa.com.
14. See World Bank (2012) for an indicative action matrix.
r eferences
Aidoo, Francis. 2012. “Ghana and Togo Cross-Border Trade Experience.” Background docu-ment submitted to Poverty Reduction and Economic Management, World Bank, Accra.
Borderless. 2012. 20th Road Governance Report UEMOA: Results of Surveys during the Second Quarter of 2012. Accra: Borderless.
Bromley, Daniel, Andrew Cook, Savitri Singh, and Nathan Van Dusen. 2011. Regional Agricultural Transport and Trade Policy Study. West Africa Trade Hub Technical Report 41, U.S. Agency for International Development West Africa Trade Hub, Accra.
Bumb, Balu L., Michael E. Johnson, and Porfirio A. Fuentes. 2011. “Policy Options for Improving Regional Fertilizer Markets in West Africa.” IFPRI Discussion Paper 1084, International Food Policy Research Institute, Development Strategy Governance Division, Washington, DC.
COMESA (Common Market for Eastern and Southern Africa). 2013. “Draft COMESA Seed Trade Harmonization Regulations, 2013.” COMESA, Lusaka.
EAC (East African Community). 2005. A Guide for Maize Traders on Regulatory Requirements for Imports and Exports of Maize in East African Community 2005/2006. Arusha, Tanzania: EAC.
ECOWAS (Economic Community of West African States). 2008. “Regulation C/REG.4/05/2008 on Harmonization of the Rules Governing Quality Control, Certification and Marketing of Plant Seeds and Seedlings in ECOWAS Region.” Sixteenth Ordinary Session of the Council of Ministers, ECOWAS, May 17–18, Abuja.
———. 2012. “Regulation C/REG.13/12/12 Relating to Fertilizer Quality Control in the ECOWAS Region.” ECOWAS Commission, Abuja.
FAO (Food and Agriculture Organization of the United Nations). 2008. “Harmonized Seed Legislation in West Africa.” Information pamphlet, Plant Production and Protection Division, FAO, Rome.

Regional Trade of Food Staples and Crop Inputs in Africa 187
Trade Policy and Food Security • http://dx.doi.org/10.1596/978-1-4648-0305-5
FSNWG (Food Security and Nutrition Working Group). 2012. East Africa Crossborder Trade Bulletin (October). FSNWG, U.S. Agency for International Development Famine Early Warning Systems Network, Food and Agriculture Organization of the United Nations, and World Food Programme Joint Cross-Border Market and Trade Monitoring Initiative, Nairobi.
Fuentes, Porfirio A., Michael E. Johnson, and Balu L. Bumb. 2011. “Improving Fertilizer Markets in West Africa: The Fertilizer Supply Chain in Ghana.” Draft for Review, International Fertilizer Development Center and International Food Policy Research Institute, Washington, DC.
Ghana News Agency. 2012. “Farmers Lose 75 Percent Fertilizer Allocation to Smuggling.” September 6, Accra.
Jensen, Michael, and John Keyser. 2010. Non-Tariff Measures on Goods Trade in the East Africa Community: Assessment of Regional Dairy Trade. Washington, DC: World Bank.
Keyser, John C. 2012. “Regional Quality Standards for Food Staples in Africa: Harmonization Not Always Appropriate.” Africa Trade Policy Notes 33 (July), World Bank, Washington, DC.
———. 2013. “Opening Up the Markets for Seed Trade in Africa.” Africa Trade Practice Working Paper Series 2, World Bank, Washington, DC.
Kweka, Josaphat, Paolo Zacchia, and Elizabeth Mehta. 2012. “Addressing Standards Management Challenges from a Strategic Perspective.” Africa Trade Policy Notes 31 (May), World Bank, Washington, DC.
Ogalo, Victor. 2010. “Informal Cross-Border Trade in EAC: Implications for Regional Integration and Development.” Research Paper, CUTS Geneva Resource Centre.
Pannhausen, Christoph, and Bianca Untied. 2010. Regional Agricultural Trade in East Africa: A Focus on Kenya, Tanzania, and Uganda. Eschborn, Germany: Deutsche Gesellschaft für Technische Zusammenarbeit (GTZ) mbH.
RATES (Regional Agricultural Trade Expansion Support). 2003. “Regional Maize Trade Policy Paper.” U.S. Agency for International Development Center for Regional Agricultural Trade Expansion Support, Nairobi.
Republic of Ghana. 2010. “Plants and Fertilizer Act, 2010 (Act 803).” Government Printer, Assembly Press, Accra.
Rohrbach, D., I. Minde, and J. Howard. 2003. “Looking Beyond National Boundaries: Regional Harmonization of Seed Policies, Laws, and Regulations.” Food Policy 28 (4): 317–33.
SADC (Southern African Development Community). 2008. “Technical Agreements on Harmonization of Seed Regulations in the SADC Region: Seed Variety Release, Seed Certification and Quality Assurance, and Quarantine and Phytosanitary Measures for Seed.” SADC Secretariat, Gaborone, Botswana.
TAHA (Tanzania Horticultural Association). 2007. “Advocating for a Market Oriented Strategy for Pesticides Regulation and Control in Tanzania.” Report prepared by the Chemical Risks Foundation of Tanzania, Tanzania Horticultural Association, Arusha, Tanzania.
Tchale, Hardwick, and John Keyser. 2010. “Quantitative Value Chain Analysis: An Application to Malawi.” Policy Research Working Paper 5242, World Bank, Washington, DC.
USAID-COMPETE (U.S. Agency for International Development–Competitiveness and Trade Expansion). 2010. “A Regional Strategy for the Staple Foods Value Chain in

188 Regional Trade of Food Staples and Crop Inputs in Africa
Trade Policy and Food Security • http://dx.doi.org/10.1596/978-1-4648-0305-5
Eastern Africa.” USAID-COMPETE, Nairobi, and Chemonics International Inc., Washington, DC.
USAID-EAT (U.S. Agency for International Development–Enabling Agricultural Trade). 2012. “Building an Enabling Environment for Fertilizer Sector Growth.” Policy Brief 3 (July), USAID EAT Project and African Fertilizer and Agribusiness Partnership, Washington, DC.
White, Peter. 2012. “Impact of Open, Expedited Trade on Private Sector Investment in ECOWAS Region.” Report prepared by the U.S. Agency for International Development (USAID) by consultant to USAID West Africa Trade Hub, Accra.
World Bank. 2005. Food Safety and Agricultural Health Standards: Challenges and Opportunities for Developing Country Exports. Report 31207, Poverty Reduction and Economic Management Trade Unit and Agriculture and Rural Development Department. Washington, DC: World Bank.
———. 2008. Regional Trade in Food Staples: Prospects for Stimulating Agricultural Growth and Moderating Food Security Crises in Eastern and Southern Africa. Report 46929-AFR. Washington, DC: World Bank.
———. 2010. Zambia: Impact Assessment of the Fertilizer Support Program, Analysis of Effectiveness and Efficiency. Report 54864-ZM, Sustainable Development Department, Agriculture and Rural Development Unit, Africa Region. Washington, DC: World Bank.
———. 2011. Uganda: Agriculture for Inclusive Growth in Uganda, Draft Final Report. Washington, DC: World Bank.
———. 2012. Africa Can Help Feed Africa: Removing Barriers to Regional Trade in Food Staples. Washington, DC: World Bank.
———. 2014. The Republic of Zambia: Diagnostic Trade Integration Study (DTIS). Washington, DC: World Bank.

189 Trade Policy and Food Security • http://dx.doi.org/10.1596/978-1-4648-0305-5
The Grain ChainTrade and Food Security in Arab Countries
Michelle Battat and Julian Lampietti
t he importance of Food t rade for Arab c ountries
Arab countries are highly dependent on imported cereal, particularly wheat. As a region, they are the largest net importer of cereal calories in the world, import-ing roughly 56 percent of the cereal calories they consume. Wheat accounts for the largest share of cereal consumption and is a key part of the regional diet. Among Arab countries, Tunisians eat the most wheat (in terms of share of total caloric consumption), getting 48 percent of their total calories from wheat, and Kuwaitis eat the least wheat but still get 23 percent of their total calories from wheat.1 Demand for wheat in the Arab world is relatively inelastic, resulting in little substitution even when prices are high.
Growth in demand for food in Arab countries is expected to outpace the increase in domestic food production. Projections indicate that over the next 40 years demand for cereals will increase by 63 percent, whereas production of cereals in Arab countries will grow by only 43 percent. In 2010, Arab countries imported 30 percent of the world’s traded wheat, and Arab countries’ reliance on wheat imports is expected to grow as a result of structural factors, such as population and income growth, which are increasing faster in Arab countries than elsewhere.2 Projections of the region’s food balance indicate that wheat imports will increase by almost 95 percent over the next 40 years (IFPRI 2010).
Arab countries should pursue a three-pillar strategy to address the region’s unique set of challenges and to improve food security (figure 8.1). First, governments can address rapidly growing demand by using pro-poor safety nets. These may include targeted food subsidies and conditional cash transfer pro-grams to help protect the poor from agricultural price fluctuations, thus limiting the effect of price increases on overall poverty levels. Second, increasing agricul-tural productivity will help reduce rural poverty. Nevertheless, this approach should not be viewed as a policy of self-sufficiency, which is often a reactionary policy response to food security concerns, because it is not always the most
c H A p t e r 8

190 The Grain Chain
Trade Policy and Food Security • http://dx.doi.org/10.1596/978-1-4648-0305-5
strategic and effective solution. A strategy of self-sufficiency may be extremely costly in Arab countries because of the high opportunity cost of using the limited land and water resources for the production of low-value crops such as wheat, thereby committing wheat farmers to a life of poverty. To that effect, Arab coun-tries could pursue a strategy of agricultural self-reliance, where the revenues generated from the production and export of high-value agricultural crops finance the cost of importing food staples (Magnan and others 2011). The increase in value added may also help create additional nonfarm rural jobs.
A comprehensive food security policy must also include a third pillar through which Arab governments manage their country’s exposure to food-import risks. No matter how successful Arab countries are at implementing the first two pillars, they will still be dependent on imports and should focus on improving the efficiency of agricultural trade. This can be done by reducing exposure to inter-national price volatility and improving import logistics, two areas of particular concern for Arab countries.
Three price shocks in international commodity markets in the past 5 years have spurred much discussion on the drivers of cereal prices and the effect of these drivers on price volatility (see, for example, European Commission 2009; FAO 2009; FAO and others 2011; Heady and Fan 2008; World Bank 2011; Wright 2009, 2011). Although multiple factors contribute to higher and more volatile cereal prices,3 two factors that drive grain price volatility are of particular relevance to the Arab world: climate change and erratic trade policy behavior. Not only do both of these factors contribute to price shocks, but they also raise concerns about supply disruptions.
Climate change may contribute to an increased frequency of weather-induced supply shocks in local and global wheat markets.4 Severe weather events increase
Figure 8.1 Arab c ountries should pursue a t hree-pillar Approach to Food s ecurity
Source: Adapted from IFPRI 2010.Note: Data are based on a model that generates illustrative projections for Arab countries in the Middle East and North Africa region. Data from the “Baseline Perfect Mitigation” scenario were used. mt = metric ton.
0
10
20
30
40
50
60
70
80
90
2010 2015 2020 2025 2030 2035 2040 2045 2050
Total wheat demand Total wheat production
Volu
me
of w
heat
(mill
ion
mt)
1. Address demand
2. Increase agricultural productivity
3. Manage exposure to import risks

The Grain Chain 191
Trade Policy and Food Security • http://dx.doi.org/10.1596/978-1-4648-0305-5
the variability of agricultural yields, and the number of reported droughts, floods, and extreme temperatures appears to be on the rise (World Bank 2011).5 In 2010, for example, flooding in Australia, Pakistan, and West Africa, as well as heat waves in the Russian Federation and the United States, contributed to a reduction in global cereal production. This variability will be exacerbated by the expansion of agriculture into marginal lands in response to increased demand for food from rising population and incomes (Wiebe 2003).6 Arab countries will be doubly hit by climate change. First, their domestic production will suffer because farmers in the region generally face low and highly variable annual rainfall pat-terns as well as poor soils (Minot and others 2010). Second, global supplies, which they rely on for imports, will also be affected.
Unpredictable trade policy decisions by key grain-exporting countries further exacerbate existing market instability. In times of market volatility, exporters may impose export restrictions to ensure sufficient domestic supply and to stem any domestic price increases. The use of such trade measures can contribute to a rapid escalation of global market prices. For example, Vietnam and India, two of the world’s largest rice exporters, restricted rice exports in March 2008, contrib-uting to a price shock in the international rice market. Russian and Ukrainian export restrictions in 2010 put upward pressure on prices and led to short-term supply disruptions. Although existing contracts may have been based on prices that already accounted for a possible Russian wheat export ban, when the ban was imposed in August of that year, it resulted in contract defaults for many Arab countries.7 Importers were forced to return to the international market to fill their supply gap and were faced with increased prices partly because of the unex-pected export quotas imposed by Ukraine.8
Trade facilitation will help countries import food in a more reliable and cost-effective manner. Although there is some debate whether trade liberalization policies will result in lower or higher food prices (Minot and others 2010), addressing the operational side of trade is nevertheless crucial. In addition to the cost of the good and the transport of that good, other transaction costs build up, increasing the end cost. For agricultural products, these transaction costs can significantly affect food security. Therefore, regardless of the effect of trade liber-alization policies on food prices, implementation of measures that can help reduce or eliminate nontariff barriers, such as excessive documentation require-ments, unnecessary or duplicative regulatory authorizations, nontransparent or subjective tariff rules, and delays and uncertainties related to customs clearance, is important (Minot and others 2010).
Food security incorporates many aspects, including financial, physical, and nutritional access, and therefore requires a cross-sectoral policy framework to address the key challenges. Because the Arab world is collectively a net food importer, the region must focus on trade facilitation as one pillar to achieving food security. Given this context, this chapter focuses on improving trade policies related to food imports, improving grain procurement strategies, increasing the efficiency of import supply chain logistics, and designing strategic reserve policies in Arab countries.

192 The Grain Chain
Trade Policy and Food Security • http://dx.doi.org/10.1596/978-1-4648-0305-5
t rade policy implications for Food s ecurity
Agricultural tariff policies may have unintended consequences that threaten food security. Some Arab countries that produce wheat use a seasonal tariff to protect domestic wheat producers from foreign competition. For example, Morocco uses prohibitively high import tariffs on soft and hard wheat during the summer months, the time of the local harvest. The government of Morocco imposed a duty of 135 percent on soft wheat in May 2011 and of 170 percent on hard wheat in June 2011 (USDA 2012). These import tariffs were suspended in October and November, respectively, later the same year. The seasonal use of prohibitive tariffs is well known, but flour quality requirements that require imported wheat to be blended with local wheat mean imported wheat is needed year-round. Therefore, imports surge annually, just before the high-tariff regime starts and immediately following its suspension. Such a surge leads to serious port congestion and can significantly increase vessel waiting times in the harbor, thereby increasing possi-ble demurrage costs and the economic cost of importing wheat. Although each Arab country has its own agricultural tariff schedule, understanding the opera-tional implications of imposing import tariffs and the way they can inadvertently create nontariff barriers to importing wheat is important.
Developing preferential trade agreements with key grain-exporting countries could further facilitate importing wheat. Bahrain, Jordan, Morocco, and Oman each have free trade agreements (FTAs) with the United States, whereas Algeria, the Arab Republic of Egypt, Jordan, Lebanon, Morocco, the Syrian Arab Republic, and Tunisia each have FTAs with the European Union, which includes France and other important wheat exporters (table 8.1). Jordan’s FTA with Canada came into effect on October 1, 2012. Meanwhile, Russia and Ukraine were two of the largest wheat exporters to Arab countries in 2009; yet no trade agreements between Arab countries and these two key wheat exporters currently exist. Although an FTA with Russia might not have insulated Arab countries from Russia’s universal wheat export ban in August 2010, FTAs can offer benefits to both consumers and businesses in Arab countries across numerous sectors, including the wheat indus-try. Increasing diplomatic and economic ties between Arab countries and key grain exporters can have secondary benefits for food security.
t able 8.1 Arab c ountries Have existing FtAs with s ome but not All major Wheat exporters
Major wheat exporters Arab countries with FTAs
United Statesa Bahrain, Jordan, Morocco, OmanFrance, Germanyb Algeria; Egypt, Arab Rep.; Jordan; Lebanon; Morocco; Syrian Arab
Republic; TunisiaCanada Jordan
Source: World Trade Organization Regional Trade Agreements Information System (database), http://rtais . wto.org/UI /PublicMaintainRTAHome.aspx.Note: FTA = free trade agreement.a. Other Arab countries, including the Arab Republic of Egypt, have Trade and Investment Framework Agreements with the United States.b. The FTA is with the European Union, which includes major wheat exporters such as France and Germany.

The Grain Chain 193
Trade Policy and Food Security • http://dx.doi.org/10.1596/978-1-4648-0305-5
To increase the likelihood of purchasing the least expensive wheat for given quality standards, tenders should be written to allow flexibility in country of origin. Arab countries control the quality of wheat imported by stipulating specific standards that must be met by the winning bidder. Wheat tenders usually specify quality standards regarding protein content, moisture content, and impu-rities, among other standards, but some countries also specify in their tender that the imported wheat must come from a group of preidentified countries. By naming specific countries in the tender, grain suppliers limit their flexibility to obtain wheat at the lowest available price. For example, in mid-June 2011, Egypt issued a tender for delivery of wheat from the United States, Canada, Australia, France, Germany, the United Kingdom, and Argentina (Reuters 2011), but Russia and other countries from the Black Sea region were not listed.9 This omission may have been due to problems that Egypt had with the quality of Russian wheat in the past,10 but Egypt could have addressed quality concerns by specifying strict standards in the tender rather than by imposing restrictions on countries of origin.
Moreover, ensuring that tender documents are aligned with international standards may allow suppliers to offer lower cost and freight (CFR) wheat prices. The CFR price frequently includes the expected vessel turnaround time, includ-ing time estimates for inspections and unloading. To reduce potentially inflated CFR wheat prices, Arab countries could align their national phytosanitary requirements with international standards developed by organizations such as the Codex Alimentarius Commission. Harmonizing these safety standards for human, animal, and plant life will allow importing countries to rely more on the documentation provided by exporters and thereby reduce time required for inspections and analysis. Also, because tenders frequently stipulate expected vessel loading and unloading rates, when wheat tenders are issued, the stipulated rates should reflect either international standards or existing capacities. Currently, this is not always the case.11 Given that despatch costs are only 50 percent of demurrage costs, the incentive is to overestimate unloading times in the tender.12 Grain suppliers factor the cost of the charter vessel into the CFR price, and the cost of the charter vessel in turn depends partially on the estimated number of unloading days. Therefore, stipulating loading and unloading rates that accurately reflect port capacities may result in a lower CFR price and efficiency gains.
procurement strategies to manage Wheat t rade r isks
One of the most critical aspects of import risk management is a country’s wheat procurement strategy. A country must monitor and analyze, on an ongoing basis, the fundamentals of domestic and global wheat markets to understand and quan-tify price and supply risks. Although most Arab countries are already doing so to varying degrees, countries will find refining their analyses and reviewing their procurement strategies increasingly important. Given the recent increases in international price volatility and the projected variability of future harvests, because of climate change, Arab countries should have a robust procurement

194 The Grain Chain
Trade Policy and Food Security • http://dx.doi.org/10.1596/978-1-4648-0305-5
approach, tailored to mitigate each country’s specific wheat-import risks.13 Countries can choose to pursue a combination of risk management methods and tools, including strengthening market information, trading relationships, tender-ing process, regional cooperation, and hedging strategies.
The first step in proper risk management is to understand the existing risks. Robust analysis of domestic wheat production, domestic wheat consumption needs, and international wheat production and forecasts of wheat prices help countries better understand and quantify their risk exposure. However, because the international wheat market is volatile and small changes in global supply or demand can have significant price implications, Arab countries need to further improve their monitoring of wheat markets.
Participation in the Agricultural Market Information System (AMIS), estab-lished at the meeting of G-20 (Group of 20) Agriculture Ministers in June 2011, will provide Arab countries with access to better information regarding wheat markets and forecasts at the international and national levels.14 The goal of AMIS is to increase agriculture information transparency by aggregating data for pro-duction, consumption, and stocks of agricultural markets. By improving the qual-ity, reliability, accuracy, timeliness, and comparability of these data, AMIS can help limit food price volatility (G-20 Agriculture Ministers 2011), which in turn can help Arab countries better identify their exposures to wheat-import risks.
Purchasing wheat from reliable grain traders may reduce risks of nonfulfill-ment of supply contracts.15 Grain traders serve as the intermediaries between producers and consumers. Wheat buyers are concerned with counterparty risk, which may be lower with reputable grain traders.16 First, more reliable grain trad-ers have global networks with assets located across most continents. Second, as a global player, more well-established grain traders have existing relationships with wheat producers in most of the producing countries, which allows them to source wheat from numerous locations. Third, established grain traders have the financial stability that other companies may lack. Whereas all grain traders are exposed to the possibility of default by wheat producers, the more reputable traders are better equipped to absorb such conflicts without passing them on to the wheat buyer. Therefore, it is in the interest of Arab countries to develop for-mal or informal partnerships with reliable and financially solvent grain traders to manage their risk and survive major industry shocks.
Physical hedging instruments allow the purchaser to better insulate itself from wheat price volatility and, in doing so, actively manage its fiscal liability, all while addressing the need for physical wheat supplies. Arab countries can use two pri-mary instruments for a physical hedge: a forward contract and a physical call option.17 Although Arab countries frequently use these instruments in their wheat contracts, they could benefit from issuing similar contracts for wheat imports over a longer time horizon. In the Arab world, on average, wheat is deliv-ered within 3 months after the initial tender is issued. Although in some cases wheat is scheduled to be delivered 6 months or even a year after the tender is issued, this timing occurs less frequently. Given the availability of physical hedges, Arab countries could potentially use longer-term contracts to lock in the

The Grain Chain 195
Trade Policy and Food Security • http://dx.doi.org/10.1596/978-1-4648-0305-5
volume and price of wheat imports for up to 18–24 months in advance of deliv-ery of the wheat. In this way, the price of the commodity can be fixed well in advance of the delivery, and the expenditure can be more closely aligned with budget management. The use of such long-term supply contracts may also miti-gate counterparty risk, because suppliers will have more of an interest in ensuring delivery (Sadler and Magnan 2011).
Commodity derivatives may also be used to mitigate wheat-import price risks.18 Traditionally, two types of derivatives are commonly used in agricultural commodity markets: futures and options.19 Whereas wheat futures contracts can help smooth price volatility, importers who are primarily concerned with insulat-ing themselves from adverse price shocks may prefer to use call options, which offer more flexibility.20 Call options act as a form of insurance to protect the buyer of the contract from price shocks by allowing the buyer to take advantage of any increase in market wheat prices by exercising the option. When a call option contract is purchased, the buyer pays a premium for the option to pur-chase wheat at a predetermined price. If market prices are below this price, the buyer is not obligated to buy wheat through the exchange and can take advan-tage of lower market prices.
A successful hedging strategy will play out over the long term and include a mix of the various hedging instruments previously described. Arab countries face a number of identifiable wheat-import risks, and no single tool can be a stand-alone solution. If, for example, a country were to decide to manage its import risks by using only long-term forward contracts for all of its wheat-import needs, it would need to be able to accurately forecast well in advance the quantity of wheat that will be consumed, the capacity of storage infrastructure, and the capability of the supply chain to accommodate the throughput. Although reasonable estimates can be made, if forecasts are made far enough in advance, they might not account for possible domestic crop failures, which may result in an insufficient supply of wheat. Theoretically, in the event of a domestic crop failure, the country would have to purchase wheat on the physical market at the spot price and thereby expose itself to additional price risk. Alternatively, overestimating wheat-import volume for a long-term forward contract could result in surplus imports, increased strain on storage facilities, and misalignment between the volumes of wheat pur-chased and those consumed. Although commodity risk management can be com-plex, a lack of any risk management strategy may be an even riskier approach. A mix of hedging tools, including managing risk for a basket of commodities, can provide each country with greater flexibility to adapt its long-term risk manage-ment strategy, particularly as new risks arise. Each country can customize an appropriate combination of methods and tools to manage the specific risks it faces.
effect of Wheat-t rade l ogistics on Food s ecurity in Arab c ountries
Efficient logistics are critical in improving food security by delivering supplies in a timely and cost-effective manner. Given Arab countries’ high import depen-dency, inefficiencies or bottlenecks in their import supply chain may result in

196 The Grain Chain
Trade Policy and Food Security • http://dx.doi.org/10.1596/978-1-4648-0305-5
increased costs and product loss,21 thereby increasing the threat to food insecu-rity. Supply chain logistics are often overlooked in food security policy discus-sions; therefore, this section examines supply chain performance in 10 Arab countries,22 identifies possible bottlenecks, and offers recommendations to improve efficiency and thereby food security. Supply chain performance is mea-sured using logistics costs (US$/metric ton) and transit times (days).23
For the purposes of this analysis, performance is assessed at each segment of the wheat-import supply chain (WISC) from the unloading port to bulk storage at the flour mill (figure 8.2). Inefficiencies at any single point in the supply chain can delay the delivery of food and increase its cost.24 Moreover, all segments of the WISC are interconnected, and bottlenecks in one segment or node can have repercussions all along the supply chain. For example, one cause of vessel waiting times may be slow vessel unloading rates: vessel unloading rates depend on the effective capacity of the vessel unloading system, the effective capacity of the conveying system to the silo, and the space available in the silo, which itself depends on outtake capacity by trucks. If outtake capacity at the silo is low, the whole system can get backed up, causing costly vessel waiting time at the port. Conversely, if a port becomes congested by an import surge, long vessel turn-around times (waiting time in the harbor plus discharge time) might interrupt a smooth flow of wheat to flour mills. Here, an upstream bottleneck may cause insufficient supply of flour and bread downstream in the supply chain. For a country’s WISC to be robust, the entire chain must be free of bottlenecks to ensure a constant flow of wheat to the flour mills.
According to the selected corridors for each Arab country, in 2009 on average it cost US$40 and took 78 days to move one metric ton of wheat from the port to the flour mill (figure 8.3).25 WISC costs are broken down into four main cat-egories: port logistics (29 percent), storage (12 percent), transport to inland silos and mills (22 percent), and WISC management (36 percent).26 Given the differ-ent WISC structures throughout the region, total WISC costs range from US$19 per metric ton to US$47 per metric ton. WISC transit times are broken down into three categories: vessel turnaround time (12 percent), inland transit time (1 percent), and dwell time (87 percent).27 The WISC costs and transit times in Arab countries can be compared to approximately US$11 per metric ton and 18 days in the Netherlands and about US$17 per metric ton and 47 days in the Republic of Korea.28
One of the most significant bottlenecks in the WISC occurs at the destination port. Wheat vessels arriving at ports in Arab countries had an average turnaround time of 9.5 days, accounting for 65 percent of total port logistics costs.29
Unloading port Transport toinland silo
Storage atinland silo
Transport toflour mill
Bulk storage at flour mill
Figure 8.2 t he Analysis c overs the supply c hain from the Unloading port to Bulk storage at the Flour mill

The Grain Chain 197
Trade Policy and Food Security • http://dx.doi.org/10.1596/978-1-4648-0305-5
This means that vessel turnaround time, comprising both waiting time in the harbor and discharge time at the berth, is one of the largest drivers of a country’s total WISC costs and accounts for about 20 percent of total WISC costs in Arab countries.30 Vessel waiting times include any time required for customs proce-dures;31 time for inspections and analysis; and any delays caused by limited berthing space, priority for other vessels (container, cruise, and export), inadequate handling capacity, silos being full, poor scheduling, or inclement weather. On aver-age, vessels arriving at ports in Arab countries in 2009 waited about 3 days before they began discharging wheat.32 Arab countries had quite a range of waiting times, and depending on the country, vessels waited an average of less than 1 day to more than 7 days, significantly affecting overall vessel turnaround times ( figure 8.4). The waiting times in Arab countries can be compared to waiting times of less than 1 day in the Netherlands and nearly 6 days in Korea. Times also varied from vessel to vessel within a single country; the majority of vessels in 2009 spent less than 2 days waiting in the harbor, but a number of ships waited significantly longer, suggesting unpredictable waiting times (figure 8.5). Unpredictable waiting times can be considered a nontariff barrier that raises costs for shippers, and they may also impede the timely delivery of wheat to people in need.
Inland transport is another segment of the WISC in which poor logistics can threaten food security. Although some Arab countries have consolidated WISCs, with the flour mill located at the unloading port, others rely heavily on inland
Figure 8.3 o n Average, moving o ne metric ton of Wheat from the Destination port to the Flour mill c osts Us$40/metric ton and t akes 78 Days
Source: Based on data provided by client and data collected through interviews, surveys, and research.Note: mt = metric ton, WISC = wheat-import supply chain. Costs and transit times are weighted averages for the 10 participating Arab countries. Percentages may not add to 100, and values may not add to totals because of rounding. The cost of capital (US$/metric ton) was estimated assuming an annual interest rate of 4 percent. Product losses were conservatively estimated on the basis of 0.25 percent loss for each storage segment and 0.1 percent loss for each trucking segment. For the Arab Republic of Egypt, product losses were assumed to be 5 percent. Inland transit time may be zero for countries whose WISC is consolidated at the port (that is, flour mill is at the port) and all transport of wheat is by conveyors.
WISC management,36% ($15)
Port logistics,29% ($12)
Storage,12% ($5)
Transport to inland silos and mills,22% ($9)
Vessel turnaround
time,12% (9.5 days)
Inland transittime,
1% (0.7 days)
Dwell time,87% (67.7 days)
a. Average WISC costs, 2009 (total: US$40/mt)
b. Average WISC transit time, 2009 (total: 78 days/mt)

198 The Grain Chain
Trade Policy and Food Security • http://dx.doi.org/10.1596/978-1-4648-0305-5
Figure 8.4 vessel t urnaround t imes c an Be r educed by improving either Waiting or Unloading t imes
Source: Based on data provided by client and data collected through interviews, surveys, and research.Note: Data are for 2009. Turnaround time in the Netherlands is indexed to 1. Waiting and unloading times for other countries represent performance relative to the Netherlands.
Vess
el w
aitin
g an
d un
load
ing
times
(inde
xed
to th
e N
ethe
rlan
ds)
0
2
4
6
8
10
12
14
Saudi Arabia
Tunisia
Egypt, Arab Rep.
Yemen, Rep.
Jord
an
Morocc
o
Korea, Rep.
Qatar
BahrainOman
Lebanon
Netherla
nds
Waiting time Unloading time Benchmark country
Figure 8.5 in 2009, most vessels Waited l ess t han t wo Days in the Harbor, yet t here Was significant variability
Source: Based on data provided by client and data collected through interviews, surveys, and research.Note: Waiting time in harbor was available only for Bahrain, Morocco, Saudi Arabia, Tunisia, and the Republic of Yemen. Waiting time in harbor was rounded to the nearest 10th of a day. Probability is based on a sample of 263 vessels.
0
0.01
0.02
0.03
0.04
0.05
0.06
0.07
0.08
0.09
0.10
5 10 15 20 25 30Waiting time in harbor (days)
Prob
abili
ty

The Grain Chain 199
Trade Policy and Food Security • http://dx.doi.org/10.1596/978-1-4648-0305-5
transport networks to move the wheat through the supply chain. In this analysis, the structure of the WISC is the primary driver of the share of transport costs relative to total WISC costs.33 Other important factors include the country’s geographic size, quality of transport infrastructure, transportation regulations, truck waiting times,34 level of fuel subsidies,35 number of stakeholders through-out the supply chain, and the relative power of those stakeholders at each segment of the chain. Although a country may not be able to change some of these factors (such as its geographic size), it could invest in improving some of the other factors. Inadequate infrastructure such as poor road conditions or weak regulations in the transport sector may further increase the cost of trans-porting wheat, and they may also result in the loss of physical supplies caused by spillage.36 Therefore, improving the quality of roads, expanding transport networks, and reforming sector regulations can contribute to ensuring efficient delivery of wheat supplies and to reducing the cost of wheat-based products. Not only can a strong inland transport network reduce WISC transit times and costs, but it can also promote interregional connectivity.
Because Arab countries are nearly all dependent on wheat imports, regional cooperation may reduce import risks and contribute to economies of scale. Currently, each Arab country imports wheat through its own national ports. Given the importance of food security and the view that importing wheat is an issue of national security, each country understandably wants to have autono-mous control over its wheat imports. However, Arab countries may wish to pur-sue three regional cooperation strategies. First, in some instances gains may be had by importing wheat through a neighboring country’s port and then transporting the wheat by land to one’s own country. This approach may make sense for coun-tries whose supply chains are constrained by having to import all wheat through one port. In Jordan, for example, the choke point at the port of Aqaba could be relieved by importing some wheat through nearby Mediterranean ports and then trucking it to silos and mills in the northern part of the country (see box 8.1). Second, transshipment from large vessels at deepwater ports into smaller vessels serving shallow-water ports in the region is common practice. Using a hub-and-spoke model, such as that used in the Netherlands, large volumes of wheat could be shipped to a single deepwater port in the region, and then the
Box 8.1 r egional c ooperation: Jordan c ould import Wheat through nearby mediterranean ports
Currently, Jordan is importing nearly all its wheat through the port of Aqaba. As the country considers expanding storage capacity to increase its strategic reserves, Jordan might consider expanding storage capacity at the Jordan Silos and Supply General Company silo in Irbid. With additional capacity in the northern part of the country, Jordan could import part of its annual wheat requirements through the ports of Tartous, Tripoli, Beirut, or Haifa and then transport it
box continues next page

200 The Grain Chain
Trade Policy and Food Security • http://dx.doi.org/10.1596/978-1-4648-0305-5
Box 8.1 r egional c ooperation: Jordan c ould import Wheat through nearby mediterranean ports (continued)
to Irbid by truck (see map B8.1.1). This strategy could help eliminate congestion and create smooth logistics during import surges by reducing the likelihood of bottlenecks, such as the unnecessary queuing of vessels and trucks at Aqaba and throughout the chain from Aqaba to inland silos. This option would require developing relationships with the Syrian Arab Republic, Lebanon, or Israel and renting or contracting for handling and storage capacity at the selected Mediterranean ports.
Source: World Bank.Note: JSSGC = Jordan Silos and Supply General Company.
map B8.1.1 proposed t ransport network, Jordan

The Grain Chain 201
Trade Policy and Food Security • http://dx.doi.org/10.1596/978-1-4648-0305-5
wheat could be transported to multiple destinations throughout the Arab world. Third, Arab countries can take advantage of the idea of parcel service. Specifically, smaller countries such as Qatar and Bahrain may be able to benefit from import-ing wheat on shared vessels also carrying cargo for neighboring countries.
Operational storage is critical in ensuring a reliable flow of wheat through the WISC. Operational storage is required to smooth the flow of incoming and outgoing wheat in the supply chain,37 and in doing so it can prevent excessive waiting times of vessels and trucks. For example, wheat imports arrive in batches on vessels, whereas flour mills operate at a more or less constant rate. Thus, operational storage at the port allows unloading of the vessel as quickly as possible (inflow), while releasing wheat at a constant rate from the silo (outflow) into the downstream segments of the chain.
Efficient use of operational storage would help reduce bottlenecks throughout the chain and thereby ensure a regular flow of wheat coming into the mills. The analysis suggests that average dwell time in Arab countries is 68 days, reflecting both operational and strategic storage.38 However, because operational and stra-tegic storage (see below) are often combined in practice, analyzing the efficiency of operational storage based on dwell times can be difficult. Meanwhile, the total cost of storage,39 which depends largely on dwell time, can add up to an addi-tional 2 percent of the CFR price of total wheat costs. Although the authors advocate the reduction of costs in other WISC segments, for storage it is critical that countries consider the trade-off between minimizing operational storage costs and financing the cost of maintaining strategic reserves.40 In other words, although the unit cost of storage should be minimized, the total cost of storage should be weighed against possible financial and nonfinancial benefits associated with a country’s strategic reserve policy.
Each country should identify the supply chain segments in which it can achieve the greatest improvements for the lowest investment costs. One option may be to invest in multipurpose solutions to enhance throughput and promote economies of scale,41 which may also allow horizontal spillovers to other sectors. A one-time investment to improve logistics infrastructure will not only increase WISC efficiency and food security, but will also benefit other industries using the same transport corridors, storage facilities, and equipment. Although this analysis provides an initial assessment across the region, the type of bottleneck varies not only from country to country, but also from corridor to corridor within the same country. Therefore, each country will have to undertake a more comprehensive and detailed analysis to identify specific causes of, and potential solutions to, bottlenecks in each corridor within its borders.
r ole of strategic r eserves as a Food s ecurity policy
For a region heavily dependent on food imports, a strategic grain reserve policy may serve as a risk management tool, protecting the poor population from going hungry in times of crisis. Crises such as natural disasters or civil war and sudden infrastructure blockages that prevent imports from entering the country can

202 The Grain Chain
Trade Policy and Food Security • http://dx.doi.org/10.1596/978-1-4648-0305-5
cause food shortages and hunger. Independent of who manages the reserves,42 a government may establish such a policy to ensure the availability of physical reserves ready for immediate consumption. Doing so would provide the govern-ment critical lead time to secure alternative wheat supplies or supply routes in emergency situations.43
Moreover, a strategic grain reserve policy is countercyclical and can therefore reduce future market price volatility. Without any known reserves, volatility in commodity markets may drive a vicious circle of price shocks: volatility can encourage hoarding and pilferage, which ultimately reduces the available supply, further driving up prices, hurting poor consumers, and distorting market signals (Murphy 2009). Strategic reserves can also offer psychological benefits, reassuring markets that supply is sufficient and thereby calming possible fears of a supply shortage and reducing the inclination to hoard or steal wheat in anticipation of leaner times.44 In fact, historical data (figure 8.6) support this notion and suggest that a strong negative correlation exists between changes in wheat stocks and changes in world wheat prices. If one holds consumption constant, world wheat prices spike when global stocks-to-use ratios are low (Wright and Cafiero 2010). Although wheat reserves offer no protection against structural, long-term price increases, they can effectively serve as an insurance policy against isolated price shocks.
Within the Arab world, the use of strategic reserves is an ancient tradition, and many countries currently have in place some form of strategic wheat
Figure 8.6 Wheat stocks Are negatively c orrelated with Wheat prices
Sources: Based on Consumer Price Index Database, U.S. Department of Labor, Bureau of Labor Statistics, Washington, DC, http://www.bls.gov/cpi/data.htm (accessed April 7, 2011); Production, Supply and Distribution Online (database) 2011, U.S. Department of Agriculture (USDA), Foreign Agricultural Service, Washington, DC, http://www.fas.usda.gov/psdonline /psdDownload.aspx; and Wheat Yearbook Tables (database) 2011, USDA, Economic Research Service, Washington, DC, http://www.ers.usda.gov/Data/Wheat/WheatYearbook.aspx.Note: Correlation of world wheat stocks and prices is −0.8. World price of wheat was adjusted using the U.S. Consumer Price Index.
–60
–40
–20
0
20
40
60
80
100
120
1960 1965 1970 1975 1980 1985 1990 1995 2000 2005 2010
Chan
ge (p
erce
nt)
% Change in end-of-year world wheat stocks
% Change in average annual world price of wheat

The Grain Chain 203
Trade Policy and Food Security • http://dx.doi.org/10.1596/978-1-4648-0305-5
reserve policy. However, with heightened concerns about food security following the 2007–08 food crisis and another food price shock in 2010–11, many Arab governments have revisited the idea of strategic reserves and are planning to increase their level of stocks. Given their reliance on imports, Arab countries may benefit from economies of scale of an import surge to build up reserves. Overall storage capacity in the region is equivalent to an average of 6 months of con-sumption, and estimated ending stocks are approximately 4.5 months.45 Syria has the largest existing storage capacity in terms of volume, while Syria and Saudi Arabia both have existing storage capacities that exceed 10 months of consump-tion.46 Nevertheless, Syria and Saudi Arabia—as well as many other Arab countries—plan to increase their strategic wheat storage capacity (figure 8.7) to accommodate wheat reserves that will last 1 year, or up to 2 years in some cases.
Maintaining larger wheat stocks could reduce both domestic and international price volatility as well as the frequency of price shocks. When production is vola-tile from year to year and starting inventory levels are high, a harvest shortfall can be handled by drawing down stocks to prevent prices from rising significantly.
Figure 8.7 many Arab c ountries Are planning to increase storage c apacity to Accommodate increasing strategic r eserves
Sources: Based on Carey 2011; La Tribune Online 2010; MuscatDaily.com 2011; Production, Supply and Distribution Online (database) 2011, U.S. Department of Agriculture (USDA), Foreign Agricultural Service, Washington, DC, http://www.fas.usda .gov/psdonline/psdDownload.aspx; USDA 2010, 2011; World Grain 2011.Note: This figure assumes that all storage capacity is dedicated to wheat and silos are kept 100 percent full. Qatar and Bahrain do not have concrete plans to increase storage capacity; however, they have discussed increasing their strategic stocks, and the authors assume for now that they will therefore double existing storage capacity. This estimate may be a lower bound, because demand is expected to grow. The Arab Republic of Egypt’s goal is to add an additional 4.5 million metric tons of storage, yet only 1.5 million metric tons of capacity is currently planned to be built. If all 4.5 million metric tons of storage were included in the chart, Egypt’s existing and planned storage capacity would be equivalent to roughly 3.9 months of consumption.
Stor
age
capa
city
(mon
ths
of c
onsu
mpt
ion)
0
4
8
12
16
20
Oman
Bahrain
Syrian Arab Republic
Qatar
Saudi Arabia
Jord
an
Algeria
Tunisia
Morocc
o
Yemen, Rep.
Lebanon
Egypt, Arab Rep.
Existing storage capacityPlanned storage capacity

204 The Grain Chain
Trade Policy and Food Security • http://dx.doi.org/10.1596/978-1-4648-0305-5
However, when starting inventories are low, the same harvest shortfall may result in a much greater price increase.47 A model by Larson and others (2012) mea-sures the effect of strategic reserves on price volatility.48 The results of the simu-lations suggest two main conclusions. First, for a given set of supply shocks simulated by the model, the domestic price distribution will lean toward higher prices when inventories are low, and vice versa. This result is indicative of the thin international wheat market. Without the buffer of wheat inventories, even small changes to supply can have significant price implications. Second, not only do strategic reserves reduce the volatility of domestic prices, but collectively increasing reserves in Arab countries can also have a positive externality by reducing volatility in international wheat prices (figures 8.8 and 8.9; Larson and others 2012).49 As a group, Arab countries are the largest importer of wheat, and in acting together they can affect the international market price. Therefore, higher levels of strategic reserves may be one way to smooth price volatility and buffer against some price shocks.
Of course, certain costs are required to manage a strategic grain reserve, and each country will need to evaluate the set of trade-offs it faces. As discussed, historical data and model simulations demonstrate that higher levels of storage provide greater protection against price volatility and price shocks. However, the marginal cost of increasing reserves tends to rise as the target stock level rises. Therefore, each country must evaluate how much it is willing to spend (and the
Figure 8.8 simulations suggest t hat Higher Global stock l evels may provide a Buffer to supply shocks and t hus mitigate price r isks
Source: Larson and others 2012.Note: mt = metric ton. These results are meant to illustrate the relationship between global stock levels and the expected price of wheat in Arab countries and do not predict actual wheat prices.
Current global stocks (million mt)
Nex
t per
iod
pric
e in
Ara
b co
untr
ies
(US$
/mt)
140
160
180
200
220
240
260
280
300
320
0 20 40 60 80 100 120 140 160
Realized priceExpected price

The Grain Chain 205
Trade Policy and Food Security • http://dx.doi.org/10.1596/978-1-4648-0305-5
opportunity cost of that investment) in exchange for the physical, financial, and psychological security that comes with various levels of strategic wheat reserves. Some countries may wish to use other safety policies either as a complement to or in lieu of a strategic reserve policy. For example, an alternative approach to protect vulnerable consumers from domestic price risk could be a cash transfer program. This policy may be less costly than maintaining strategic reserves (Larson and others 2012), but it does not protect consumers from possible wheat supply shortages.
To minimize existing trade-offs, an efficient strategic reserves policy requires diligent planning, analysis, and implementation. The full economic cost of increasing reserves must be evaluated. This expense includes not only the cost of building additional storage capacity and the cost of storage itself 50 but should also include the increased costs associated with increased throughput volumes throughout the supply chain during build up of reserves and future replenish-ments.51 Although investing in reserves can be beneficial, every extra metric ton of wheat stored has an associated monetary and opportunity cost. Each dollar invested in strategic reserves could alternatively be spent on other critical issues such as education and health care.
Three factors must be considered in establishing the guidelines for the reserves: the threshold domestic price that will trigger the drawdown of wheat reserves, the target reserve level, and the rate of reserve replenishment. A recent analysis argues (Larson and others 2012) that selecting a higher thresh-old domestic price turns the reserve into more of a safety net to be used in emergency situations rather than a tool for price stabilization; with a high threshold price, strategic reserves may not have much effect on domestic price
Figure 8.9 increasing r eserves in Arab c ountries not o nly r educes l ocal price volatility but Also r educes volatility in Global markets
Source: Larson and others 2012.Note: MENA = Middle East and North Africa; ROW = rest of the world.
10
15
20
25
0 0.05 0.15 0.30 0.50 0.70 1.00
MENAROW
MENA storage target (% of annual consumption)
Pric
e va
riat
ion
(%)

206 The Grain Chain
Trade Policy and Food Security • http://dx.doi.org/10.1596/978-1-4648-0305-5
volatility as long as prices remain below the threshold. The larger the targeted size of the reserve, the more costly it will be to maintain, but the more food security coverage the reserve will provide.52 Last, a more aggressive rate of building up and replenishing the reserves is more likely to smooth domestic price volatility, because reserves have less chance of being insufficient.53 However, replenishing reserves increases demand from international markets, which may aggravate international price volatility.
c onclusion
Given Arab countries’ dependency on food imports, trade is absolutely necessary for food security. Improvements to trade facilitation can address policy, institu-tional, and operational aspects regarding the importation of food, or specifically wheat. From a policy standpoint, reducing agricultural tariffs and promoting the use of preferential trade agreements with key grain-exporting countries can reduce the cost of imported wheat and may also have logistical spillover benefits. Nontariff barriers to trade may also threaten food security. Transparency in procurement and tendering strategies will allow importation of the lowest-cost wheat for a set of given quality specifications, while the use of hedging instruments can help governments mitigate the risk that their expected wheat-import bill suddenly increases. Efficient logistics, particularly at the port and during inland transport, are critical to food security. These trade facilitation measures are also important contributing factors to a successful strategic reserve policy. Without reliable trade and logistics systems, strategic reserves would not be effective in protecting against price shocks. Food security is a challenge all Arab countries face, yet each country has its own set of constraints and risk tolerance. Nevertheless, a comprehensive approach to managing wheat-import risks is critical to having the greatest effect on food security.
notes
1. FAOSTAT (FAO Statistical Database), Food and Agriculture Organization of the United Nations, Rome, http://faostat.fao.org/; Production, Supply and Distribution Online (database), U.S. Department of Agriculture, Foreign Agricultural Service, Washington, DC, http://www.fas.usda.gov/psdonline/psdDownload.aspx.
2. Since 2005, the population growth rate of Arab countries has averaged 2.1 percent compared to a world rate of 1.2 percent, and the average income growth rate of Arab countries is 3.0 percent, outpacing the global average of 1.1 percent (World Development Indicators [database], World Bank, Washington, DC, http://databank .worldbank.org/ddp/home.do?Step=12&id=4&CNO=2).
3. Promotion of biofuel production, high and volatile petroleum prices, the relative depreciation of the U.S. dollar, and increased commodity speculation have all contrib-uted to rising production costs and increasing volatility in international cereal markets.
4. The international wheat market is thin (less than 20 percent of wheat produced is traded across borders), suggesting that small shifts in supply may result in large

The Grain Chain 207
Trade Policy and Food Security • http://dx.doi.org/10.1596/978-1-4648-0305-5
price shifts. Therefore, although weather-induced supply shocks directly affect local markets, they can also have significant implications for international wheat prices.
5. EM-DAT: The International Disaster Database, Centre for Research on the Epidemiology of Disasters, http://www.emdat.be/ (accessed June 10, 2011). The apparent increase in extreme weather events may be because reporting of such events has likely increased, in addition to an increase in the actual number of occurrences.
6. Population growth will contribute to increased demand for cereals for food, while rising incomes will contribute to increased demand for cereals for feed.
7. Looking forward, Russia is now more limited in its use of export restrictions on wheat and barley since it formally joined the World Trade Organization (WTO) in August 2012. Russia may impose temporary export restrictions to relieve critical domestic shortages, but it must first notify the WTO Committee on Agriculture as to the nature and duration of the measures and must consider the effect such actions would have on other WTO member countries. This requirement will help developing, and in particular importing, countries have more time to react to possible export restrictions.
8. The reliability of production and stock forecasts also affects international wheat prices. When the U.S. Department of Agriculture suddenly revised downward its production forecasts for 2010, markets responded with an increase in price.
9. Although Russia’s wheat export ban was still in effect at the time of the tender, Russia had announced it would lift the ban as of July 1, 2011. Therefore, theoretically, Russia could have been a potential source of wheat imports for this tender.
10. In May 2009, well before Russia imposed its wheat export ban, the Arab Republic of Egypt had problems with Russian wheat imports. For some shipments, Egypt had to quarantine the wheat originating from Russia because of health concerns. Problems included dead bugs and other impurities above the allowed limit.
11. Some Arab countries often set the contractual unloading rate to be slower than the actual unloading capacity as determined by the destination port’s existing infrastruc-ture and equipment. This may be done to build in buffer time in case an unforeseen logistics glitch occurs during unloading; however, it could also be done to help the importer appear efficient by unloading within the terms of the contract, or even earlier than expected.
12. Demurrage costs are incurred when loading or unloading the charter vessel takes longer than is contractually allowed. Despatch may be received if the vessel is loaded or unloaded in less time than is stipulated in the contract.
13. Countries that grow some of their own wheat will need to improve their forecasting capabilities to have a better understanding of their short- and long-term import needs. According to U.S. Department of Agriculture data, Arab countries that produced more than 10 percent of the wheat they consumed in 2010 include Algeria, Egypt, Iraq, Lebanon, Morocco, Saudi Arabia, Sudan, Syria, and Tunisia.
14. Information on maize, rice, and soybeans will also be available, and additional com-modities will be added to AMIS in the future.
15. Reliable grain traders are companies with access to diverse sources of grain. Often, reliable suppliers have a global network and can obtain grains from various locations, depending on availability.
16. Counterparty risk is the risk that the supplier defaults and fails to deliver the wheat.
17. A forward contract is an agreement to purchase a specific volume of the commodity on a specified date in the future, for a predetermined price. Forward contracts

208 The Grain Chain
Trade Policy and Food Security • http://dx.doi.org/10.1596/978-1-4648-0305-5
enable the purchaser to lock in a price, effectively transferring the price risk to the seller. The purchaser bears the risk that prices may decline below the predetermined price at the time the contract is exercised. A physical call option is a right, but not an obligation, to purchase a commodity at a specified maximum price level (strike price). The purchaser pays a premium for this right. This effectively is a type of insurance, and the maximum price cap allows the purchaser to benefit from lower prices.
18. Although trading derivatives can be an effective risk management strategy, they do present challenges, such as that of addressing basis risk. Careful thought should be given to who is responsible for executing the trading decisions. For more information, see World Bank and FAO (2012).
19. A futures contract, like a forward contract, is an agreement between a purchaser and a seller to receive or deliver a product on a predetermined date at a negotiated price. Futures contracts are typically traded on an exchange and have standardized delivery periods, contract sizes, and qualities. A call option is a contract that gives an investor the right to buy a wheat futures contract at a specific price (strike price) within a certain time period. Some Arab countries may wish to explore other hedging instru-ments that are sharia compliant.
20. For example, a futures contract may not be the ideal instrument if the spot price of wheat falls below the negotiated price. The buyer of the futures contract will then bear the legal responsibility to fulfill that contract and pay the difference in the price movement to the market counterparty (FAO and others 2011).
21. Product loss caused by inefficient wheat-import supply chain (WISC) logistics is a significant contributing factor to WISC management costs. Reported estimates of product loss suggest that wide variation occurs across Arab countries, ranging from 0.5 percent to 5.0 percent of imported wheat (as estimated on the basis of the difference between the amount of wheat unloaded from the vessel and the amount of wheat delivered to the flour mills). Communications with public and private sector representatives from Arab countries indicate product losses in 2009 were up to US$15 per metric ton in some countries. Product loss can occur for a number of reasons; poor grain-handling systems, outdated storage facilities, inadequate transport networks, unnecessarily long dwell times, and insufficient quality control systems and procedures can all result in substantial spillage and spoilage. Product loss could also be due to pilferage and smuggling, which tend to be more likely when international wheat prices are high. Although governments may be able to reduce pilferage and smuggling rates through regulation and policy decisions, product loss could be mini-mized with an efficient WISC.
22. Bahrain, Egypt, Jordan, Lebanon, Morocco, Oman, Qatar, Saudi Arabia, Tunisia, and the Republic of Yemen. WISC data were collected from public and private sector representatives in each country. See World Bank and FAO (2012) for a description of methodology.
23. Logistics costs and transit time are inextricably linked, yet each measure of efficiency highlights a different set of risks that result from a poor-performing supply chain. For example, logistics inefficiencies such as long vessel turnaround times or assets that remain idle while waiting for delivery of wheat (including trucks waiting or mills not operating at full capacity) result in increased costs that further increase the final price of wheat-based products. In contrast, bottlenecks in the supply chain may cause exces-sive transit times from port to consumer, which can lead to more spoilage and to delays in the delivery of supplies to people in need.

The Grain Chain 209
Trade Policy and Food Security • http://dx.doi.org/10.1596/978-1-4648-0305-5
24. For example, in Tunisia, limited storage capacity appears to cause bottlenecks at the port because vessels cannot unload the wheat immediately due to full silos, causing longer vessel waiting times and increasing logistics costs.
25. For each country, the authors considered the corridor with the largest throughput volumes. See World Bank and FAO (2012) for a description of the methodology. Although this analysis is based on reported costs, hidden costs, in the form of a quasi-fiscal subsidy, must also be accounted for. Just as the domestic consumer price of wheat might not reflect the full economic cost of importing wheat because of government safety nets in the form of subsidized bread, flour, or wheat, the WISC costs discussed in this chapter might not be an accurate reflection of the full economic cost of logistics. Many Arab countries subsidize the cost of fuel, which effectively lowers reported WISC costs, including transport costs and the operation costs of equipment and storage facilities. Because of the quasi-fiscal subsidies that are imbed-ded in reported WISC costs, the figures cited in this chapter represent a lower bound of the full economic cost.
26. WISC management includes loading port costs, bank costs, insurance for the WISC, commissions, security costs, cost of capital, overhead and administration costs, risk and profit margins, and product loss. WISC management is not directly addressed in this chapter because the focus is primarily on logistics.
27. Dwell time of wheat, including both operational and strategic storage, is the major driver of overall transit time, reflecting throughput volumes and logistics as well as policy decisions. Dwell time was combined for all points of storage throughout the chain, including storage of wheat at the port, inland silos, and at flour mills.
28. The Netherlands was selected as a benchmark because it is a major wheat-importing country and has outstanding logistics performance. Korea was selected as an Asian benchmark because, like Arab countries, it is highly dependent on wheat imports (wheat-import dependency of 98 percent), and its WISC is somewhat comparable in size and structure to that of some Arab countries.
29. Port logistics costs include vessel wait time in harbor; inspection, sampling, and analy-sis; agent fees; fumigation prior to discharge; unloading and handling at the berth; and transport to port silo (if applicable).
30. Whereas discharge time is a function of unloading capacity and the cargo volume, waiting time is largely independent of vessel size and could be minimized.
31. One study estimates that the delays and uncertainties associated with customs clear-ance alone are equivalent to 10 percent of the cost of the goods being traded (Minot and others 2010).
32. This figure is based on the mean waiting time for the 10 selected corridors. If vessel wait times are weighted on the basis of volume of imports for each country, average waiting time in Arab countries is nearly 5.7 days.
33. In the analysis, inland transport costs could account for up to 51 percent of total WISC costs in countries such as Egypt, Jordan, and the Republic of Yemen, adding an additional US$10 to US$18 to the cost of importing 1 metric ton of wheat. In contrast, countries such as Bahrain, Qatar, and Oman all had inland transport costs that accounted for less than 2 percent of total WISC costs because their flour mills were located in or nearby the unloading port. Of course, this analysis considers only costs before the wheat is milled, therefore although a consolidated WISC may result in lower inland transport costs, one must still take into account downstream transport costs that could be incurred to move flour from the mill to population centers and to rural areas.

210 The Grain Chain
Trade Policy and Food Security • http://dx.doi.org/10.1596/978-1-4648-0305-5
34. Although a transport network could comprise different modes of transport, including road, rail, and waterways, the majority of wheat in Arab countries is transported by truck.
35. Among the 10 Arab countries participating in the WISC study, four countries (Bahrain, Egypt, Saudi Arabia, and the Republic of Yemen) subsidize diesel to a point that the retail price is below the price of crude oil on the world market, while another three countries (Jordan, Lebanon, and Oman) have retail diesel prices that are below U.S. retail prices (GTZ 2009).
36. Transport services in the region are characterized by a lack of competition and high costs (Minot and others 2010).
37. Operational storage is a “necessary evil” to create smooth logistics in normal situations, where predictable issues are present at the transfer points, including incidental and temporary interruptions in supply, change of transport mode, variations in arrival times of transport units, and local constraints (physical, operational, natural, and so forth).
38. Dwell time is the amount of time an average metric ton of wheat stays in storage.
39. The cost of storage accounts for both operational and strategic storage and includes handling, fumigation, and the storage itself.
40. For further discussion on the costs and benefits of strategic reserves, see World Bank and FAO (2012).
41. For example, a multiuser transport network would entail having infrastructure for inland transport (trucks, railcars, and vessels) that can be used to move multiple com-modities, not just wheat, through the same corridors. Similarly, storage facilities can hold several types of grains, although these may be marginally more expensive to manage. Last, whereas in some Arab countries pneumatic unloaders are used for wheat, ports could be equipped with multipurpose unloading equipment such as modern, high-capacity, dust-free unloaders that can unload multiple types of cargo, including grains, coal, iron ore, and fertilizer.
42. Because strategic wheat reserves are intended to be a safety net, governments are responsible for setting public policy about how they will operate. Many argue that the private sector can manage wheat stocks most efficiently, while others suggest that private grain traders are driven by profit and thus have less incentive to maintain socially optimal levels of stocks (Murphy 2009; Wright and Williams 1982). Here, the authors choose to focus not on who should manage the reserve but rather on the key public policy decisions and the subsequent trade-offs that should be considered.
43. Wheat accounts for a large share of the diet in Arab countries, and short-term demand is relatively inelastic. Constant demand coupled with a variable short-term supply may result in a supply gap, particularly during crisis situations (Murphy 2009). In the event that supplies run short, strategic reserves can provide a short-term bridge while the government considers some longer-term options (Murphy 2009). Reserves offer only a temporary solution to supply shortages, and therefore importers will eventually need to purchase wheat again from the international market, possibly at a time when prices are still high.
44. This assumes that the policy is effective in releasing wheat from the strategic reserve when prices are high.
45. Ending stocks for a given year are calculated by taking domestic production plus net imports, minus consumption.

The Grain Chain 211
Trade Policy and Food Security • http://dx.doi.org/10.1596/978-1-4648-0305-5
46. Estimates of storage capacity in terms of months of consumption assume that all silo storage capacity is dedicated to wheat and that silos are kept 100 percent full. These assumptions are not realistic, given that countries also store other grains such as barley, but the assumptions are used to give an idea of the maximum possible level of public stocks. These estimates also do not account for private storage for which comprehen-sive information is difficult to obtain.
47. The increased volatility in wheat production of the past few years, which is projected to continue, has been reflected in the increased volatility of international wheat prices.
48. The paper by Larson and others (2012) is based on an original applied numerical model by Wright and Williams (1982). Larson and others (2012) tailor the model to treat Arab countries as a single bloc. The model simulates two countries—(a) the Middle East and North Africa and (b) the rest of the world—and applies a distribution of production shocks to simulate the increasing uncertainty regarding production owing to climate change. Storage and transport costs are fixed in the model on the basis of regional averages.
49. Strategic reserves in any country can have a positive effect on international prices. Increasing stocks in any country, whether the country of origin or the importer, con-tributes to increasing global stock-to-use ratios. Thus, even if storage in an importing country is more costly, maintaining stocks to mitigate region-specific supply risks can affect the global wheat market and in turn mitigate international price volatility.
50. Cost of storage would include any recurring maintenance, fumigation, rotation, and training costs.
51. The increase in volumes places an additional burden on transport infrastructure and may necessitate an upgrade in existing transport and handling systems.
52. Strategic wheat reserves have no optimal level; the preferred size of the reserve depends on a country’s level of import dependency, vulnerability to supply disruptions and price shocks, and risk tolerance. To determine optimal levels of strategic wheat reserves, a country must first consider its degree of import dependency by examining current and projected wheat consumption and domestic production, keeping in mind that consumption patterns during food shortages can be lower than normal (Murphy 2009). Second, each country must assess its relative vulnerability to supply disrup-tions and price shocks, and the possible length of those disruptions. Last, the size of a strategic wheat reserve depends on a country’s own tolerance for risk. More risk-averse countries may be willing to spend more money to maintain larger reserves. Ultimately, however, the size of the reserve comes down to a trade-off between insur-ance against risk and the cost of that insurance.
53. To ensure a well-managed reserve, each country must establish a set of guiding prin-ciples regarding when to draw down and when to replenish the reserves, assuming the first-in-first-out principle. These guidelines must be clear and must be designed with the objective of mitigating supply and price risks in emergency situations. The pur-chase and sale of wheat reserves must be done in a competitive and transparent market.
r eferences
Carey, Glen. 2011. “Saudi Arabia to Raise Silo Capacity by 550,000 Tons.” Bloomberg.com, January 16. http://www.bloomberg.com/news/2011-01-16/saudi-arabia-to -raise-silo-capacity-by-550-000-tons-update1-.html.

212 The Grain Chain
Trade Policy and Food Security • http://dx.doi.org/10.1596/978-1-4648-0305-5
European Commission, Directorate-General for Agriculture and Rural Development. 2009. Historical Price Volatility. July 16. http://ec.europa.eu/agriculture/analysis/tradepol / commodityprices/volatility_en.pdf.
FAO (Food and Agriculture Organization of the United Nations). 2009. The State of Agriculture Commodity Markets: High Food Prices and the Food Crisis—Experiences and Lessons Learned. Rome: FAO. http://www.fao.org/docrep/012/i0854e/i0854e00.htm.
FAO (Food and Agriculture Organization), IFAD (International Fund for Agricultural Development), IMF (International Monetary Fund), OECD (Organisation for Economic Co-operation and Development), UNCTAD (United Nations Conference on Trade and Development), WFP (World Food Programme), World Bank, WTO (World Trade Organization), IFPRI (International Food Policy Research Institute), and UN High-Level Task Force on Global Food Security. 2011. Price Volatility in Food and Agricultural Markets: Policy Responses. Policy report to the Group of 20. http://www .ifad.org/operations/food/documents/g20.pdf.
G-20 Agriculture Ministers. 2011. “Action Plan on Food Price Volatility and Agriculture.” Ministerial Declaration, Draft 1 dated June 14, presented at the Meeting of G-20 Agriculture Ministers, Paris, June 22–23. http://www.euractiv.de/fileadmin/images / G20_Food_Price_Volatility_and_Agriculture_draft_Action_Plan_2011.pdf.
GTZ (Deutsche Gesellschaft für Technische Zusammenarbeit), ed. 2009. International Fuel Prices. 6th ed. Eschborn, Germany: GTZ. http://www.giz.de/Themen/en/SID -4E0F3AA8-36C6966F/dokumente/gtz2009-en-ifp-full-version.pdf.
Heady, Derek, and Shenggen Fan. 2008. “Anatomy of a Crisis: The Causes and Consequences of Surging Food Prices.” IFPRI Discussion Paper 00831, Development Strategy and Governance Division, International Food Policy Research Institute, Washington, DC.
IFPRI (International Food Policy Research Institute). 2010. “Food Security CASE Maps” (accessed June 19, 2012), http://www.ifpri.org/climatechange/casemaps.html.
La Tribune Online. 2010. “50% des capacités de stockage de l’OAIC sont occupées.” April 5. http://www.latribune-online.com/economie/32026.html.
Larson, Donald F., Julian Lampietti, Christophe Gouel, Carlo Cafiero, and John Roberts. 2012. “Food Security and Storage in the Middle East and North Africa.” Policy Research Working Paper 6031, World Bank, Washington, DC.
Magnan, Nicholas, Travis J. Lybbert, Alex F. McCalla, and Julian A. Lampietti. 2011. “Modeling the Limitations and Implicit Costs of Cereal Self-Sufficiency: The Case of Morocco.” Food Security 3 (Suppl. 1): S49–60.
Minot, Nicholas, Mohamed Abdelbasset Chemingui, Marcelle Thomas, Reno Dewina, and David Orden. 2010. Trade Liberalization and Poverty in the Middle East and North Africa. Washington, DC: International Food Policy Research Institute.
Murphy, Sophia. 2009. “Strategic Grain Reserves in an Era of Volatility.” Institute for Agriculture and Trade Policy, Minneapolis, MN. http://www.iatp.org/files /451_2_106857.pdf.
MuscatDaily.com. 2011. “Government Picks Greek Consultant for Grain Silos.” June 3. http://www.muscatdaily.com/Archive/Stories-Files/Government-picks-Greek -consultant-for-grain-silos.
Reuters. 2011. “Egypt’s GASC Holds First Global Wheat Tender since Feb.” June 14. http://af.reuters.com/article/investingNews/idAFJOE75D04020110614.

The Grain Chain 213
Trade Policy and Food Security • http://dx.doi.org/10.1596/978-1-4648-0305-5
Sadler, Marc, and Nicholas Magnan. 2011. “Grain Import Dependency in the MENA Region: Risk Management Options.” Food Security 3 (Suppl. 1): S77–89.
USDA (U.S. Department of Agriculture). 2010. Syria—Grain and Feed Annual: Improving Grain Situation. Global Agricultural Information Network Report, Foreign Agricultural Service, USDA, Washington, DC, March 18. http://gain.fas.usda.gov/Recent%20GAIN%20Publications/Grain%20and%20Feed%20Annual_Damascus_Syria_3-18 -2010.pdf.
———. 2011. Morocco—Grain and Feed Annual 2011. Global Agricultural Information Network Report MO 1103, Foreign Agricultural Service, USDA, Washington, DC, March 10. http://gain.fas.usda.gov/Recent%20GAIN%20Publications/Grain%20and%20Feed%20Annual_Rabat_Morocco_3-10-2011.pdf.
———. 2012. Morocco—Grain and Feed Annual 2012. Global Agricultural Information Network Report MO 1203, Foreign Agricultural Service, USDA, Washington, DC, March 12. http://gain.fas.usda.gov/Recent%20GAIN%20Publications/Grain%20and%20Feed%20Annual_Rabat_Morocco_3-12-2012.pdf.
Wiebe, Keith. 2003. “Linking Land Quality, Agricultural Productivity, and Food Security.” Agricultural Economic Report 823, Resource Economics Division, Economic Research Service, U.S. Department of Agriculture, Washington, DC. http://www.ers .usda.gov/publications/aer823/aer823.pdf.
World Bank. 2011. Responding to Global Food Price Volatility and Its Impact on Food Security. Washington, DC: World Bank.
World Bank and FAO (Food and Agriculture Organization of the United Nations). 2012. The Grain Chain: Food Security and Managing Wheat Imports in Arab Countries. Washington, DC: World Bank.
World Grain. 2011. “Algeria Approves Construction of 39 Grain Silos.” World-Grain.com, July 28. http://www.world-grain.com/News/News%20Home/World%20Grain%20News/2011/7/Algeria%20approves%20construction%20of%2039%20grain%20silos .aspx.
Wright, Brian D. 2009. “International Grain Reserves and Other Instruments to Address Volatility in Grain Markets.” Policy Research Working Paper 5028, World Bank, Washington, DC.
———. 2011. “The Economics of Grain Price Volatility.” Applied Economic Perspectives and Policy 33 (1): 32–58.
Wright, Brian, and Carlo Cafiero. 2010. “Grain Reserves and Food Security in MENA Countries.” Paper presented at “Agriculture for Development—Revisited,” Berkeley, California, October 1–2.
Wright, Brian D., and Jeffrey C. Williams. 1982. “The Economic Role of Commodity Storage.” Economic Journal 92 (367): 596–614.


215 Trade Policy and Food Security • http://dx.doi.org/10.1596/978-1-4648-0305-5
How Can Latin America and the Caribbean Contribute to Global Food Security?Nabil Chaherli and John Nash
introduction
With the global population expected to exceed 9 billion by 2050, food security—producing enough food of sufficient quality and making it accessible and affordable for consumers around the world—is one of the most important challenges of our time. Although countries in Latin America and the Caribbean (LAC) are quite heterogeneous in their production potential, overall the region is well equipped to contribute to meeting this challenge. LAC has always main-tained a strong advantage in agricultural production relative to the rest of the world, as indicated not only by its position as a net food exporter, but also by its high index of revealed comparative advantage (RCA). In a study of many countries worldwide, the eight LAC countries in the global sample (Argentina, Brazil, Chile, Colombia, the Dominican Republic, Ecuador, Mexico, and Nicaragua) displayed a revealed comparative advantage1 in agricultural produc-tion of 2.2 on average, well above the 1.0 global average (Anderson and Valdés 2008). LAC’s high potential for scaling up its agricultural output owes largely to its natural endowments, especially land and water. Of the 445.6 million hectares of land potentially suitable for sustainable expansion of cultivated area, about 28 percent is in LAC, more than in any region other than Sub-Saharan Africa (Deininger and others 2011). Accessibility considerations mag-nify this potential: the region has 36 percent of the 262.9 million hectares of such land situated within six hours of the closest market. Furthermore, this potential is not confined to Brazil and the powerhouse countries in the Southern Cone. In expansion potential as a percentage of area, Bolivia, Belize, and the República Bolivariana de Venezuela all rank higher than Brazil and the Southern Cone countries (excluding Uruguay), and Nicaragua and Colombia come close. LAC is also well endowed in renewable water resources, with about one-third of the 42,000 cubic kilometers worldwide. Per capita, LAC has
c H A p t e r 9

216 How Can Latin America and the Caribbean Contribute to Global Food Security?
Trade Policy and Food Security • http://dx.doi.org/10.1596/978-1-4648-0305-5
the highest endowment of renewable water among developing regions, though some subregions in LAC face higher-than-average scarcity (Bruinsma 2009).
This chapter considers evidence bearing on the questions of (a) how much LAC can contribute to global food security and (b) what will help LAC reach its full potential in that regard. The chapter is organized in three sections. The next section looks at recent developments in global agricultural trade and, particularly, at the way LAC food exports have evolved in relation to those of other regions. The following section considers the role of the enabling environment—domestic, regional, and external trade policies and logistics—in shaping the region’s trade patterns and future opportunities. The final section looks into the future to examine how climate change, superimposed on expected demographic and economic trends, could affect agricultural trade opportunities.
r ecent performance of l atin America and the c aribbean in Agricultural markets: o verall Good news
Since the mid-1990s, agriculture and agricultural trade in LAC have seen much good news. Although trade in agricultural products has declined as a percentage of overall trade worldwide, its value has grown substantially. The LAC region has captured an increasing share of this growing market and currently holds a much larger portion of world trade in agriculture (13 percent, up from about 8 percent in the mid-1990s) than in minerals and metals (8 percent) and manufactures (3 percent). Agriculture and food now represent about 23 percent of the region’s exports, compared with this sector’s share of global trade of only 10 percent.
From 1995 to 2009, export growth averaged 8 percent a year. Temperate products (cereals, oilseeds, and livestock products) accounted for more than half this growth. Seafood and fruits and vegetables made up about 15 percent, followed by processed products such as beverages and tobacco. Of course, this pattern varies by subregion; for example, fruits and vegetables are the dominant contributor in Mexico and the Andean region. Almost all LAC countries contrib-uted to this export growth, but Brazil made the largest contribution by far (more than 35 percent), followed by the Southern Cone (around 30 percent; figure 9.1). With the exception of Colombia, the region’s largest exporters have all increased their global market shares. Among the second tier of exporters, Ecuador, Paraguay, Peru, and Uruguay have also increased their market share. Central American and Caribbean countries, except Costa Rica and Guatemala, have maintained or lost market shares.
Both primary and processed products have contributed meaningfully to export growth. However, a recent study (Mandel 2012) showed that LAC agri-cultural exporters have been tilting their specialization from upstream industries to downstream (more highly processed). LAC appears to be deepening trade in processed products more quickly than other regions, benefiting from these higher-value-added products.

How Can Latin America and the Caribbean Contribute to Global Food Security? 217
Trade Policy and Food Security • http://dx.doi.org/10.1596/978-1-4648-0305-5
Furthermore, LAC has diversified its agricultural exports by country of desti-nation.2 The concentration of LAC export products increased on average from 1995 to 2009. But behind this regional trend lie two tendencies. Many major exporters of traditional tropical products have diversified exports, while produc-ers of temperate products have become less diversified, especially over the past few years, largely because of the food price spike and consequent policy responses. The first category includes Colombia, Costa Rica, Ecuador, Guatemala, and Mexico; the second includes Argentina, Bolivia, Brazil, Paraguay, and Uruguay. To some extent, the diversification of destination markets insulates LAC from shocks emanating from country-specific demand fluctuations. LAC countries that have increased their product concentrations are more exposed to shocks in these markets, although this is of less concern for larger economies like Brazil, with their highly diversified export baskets outside agriculture.
Although the European Union (EU) and the United States remain LAC’s most important destinations—accounting for a combined 45 percent of LAC’s exports in 2009, down from 57 percent in 1995—developing countries are becoming the most dynamic destination for the region’s exports (figure 9.2). From 1995 to 2009, China and the rest of the world, with a combined 30 percent
Figure 9.1 shares and c ontribution to Growth of l Ac ’s Agricultural exporters, by o rigin, 1995 and 2009
Sources: Calculations based on data from World Bank and United Nations Commodity Trade Statistics Database (UN Comtrade).
0
5
10
15
20
25
30
35
40
45
0
5
10
15
20
25
30
35
40
Shar
e of
gro
wth
(%)
Cont
ribu
tion
to g
row
th (%
)
SouthernCone
Brazil AndeanRegion
Mexico CentralAmerica
Caribbean
Share, 1995 Share, 2009 Contribution to growth

218 How Can Latin America and the Caribbean Contribute to Global Food Security?
Trade Policy and Food Security • http://dx.doi.org/10.1596/978-1-4648-0305-5
Figure 9.2 shares and c ontribution to Growth by export Destination, 1995 and 2009
Sources: Calculations based data from World Bank and UN Comtrade.Note: EU = European Union; LAC = Latin America and the Caribbean. The EU-27 are the 27 member states of the European Union: Austria, Belgium, Bulgaria, Cyprus, the Czech Republic, Denmark, Estonia, Finland, France, Germany, Greece, Hungary, Ireland, Italy, Latvia, Lithuania, Luxembourg, Malta, the Netherlands, Poland, Portugal, Romania, the Slovak Republic, Slovenia, Spain, Sweden, and the United Kingdom.
0
5
10
15
20
25
30
0
5
10
15
20
25
30
35
EU-27 United Statesand Canada
LAC(intratrade)
Rest of theWorld
Asia (withoutChina)
China
Shar
e of
gro
wth
(%)
Share, 1995 Share, 2009 Contribution to growth
Cont
ribu
tion
to g
row
th (%
)
of the market share, contributed 36 percent of the growth of exports from the region, nearly the 38 percent contribution of the EU (20 percent) and the United States (18 percent). In addition, the composition of the basket traded with developed economies tends to differ (figure 9.3). Whereas developed economies imported primarily fruits, animal fodder, coffee, beverages, and sea-food from LAC, products from the soybean complex (seeds, oil, and cake), meat, and sugar represented almost 60 percent of the trade with developing economies.
Notwithstanding the predominance of Argentina and Brazil in the region’s recent growth, looming logistics and policy issues threaten to derail these loco-motives of agricultural growth. But some past policy choices that contributed to their success—and that might be worth emulating—should be considered. In Argentina, macroeconomic and structural adjustment in the early 1990s created a propitious environment for agricultural growth that laid the groundwork for the subsequent production and export boom. Figure 9.4 shows the real take-off to date from the 1997–98 season. Trade reforms in 1991 lowered export taxes and encouraged technology transfer by lowering barriers to importing technology embedded in inputs. They also encouraged the development of a competitive farm services industry and attracted investment that improved the infrastructure for moving and storing grains. Innovative commercial arrangements emerged to

How Can Latin America and the Caribbean Contribute to Global Food Security? 219
Trade Policy and Food Security • http://dx.doi.org/10.1596/978-1-4648-0305-5
Figure 9.4 Argentine Grain production, 1979–2010
Source: O’Connor 2011, from data of Ministerio de Agricultura y Ganadería, Agritrend, and Fundación Producir Conservando (estimate).Note: e = estimated data.
Fiscal year
0
10
20
30
40
50
60
70
80
90
100
1979/80
1981/82
1983/84
1985/86
1987/88
1989/90
1991/92
1993/94
1995/96
1997/98
1999/00
2001/02
2003/04
2005/06
2007/08
2009/10 e
Mill
ion
tons
Corn Wheat SoybeanTotal
Figure 9.3 top 10 l atin American and c aribbean Agricultural exports to Developed and Developing economies, 2009
Sources: Calculations based on data from World Bank and UN Comtrade.
Meat,15
Oliseeds,14
Sugar,13
Animal fodder,
10
Vegetableoils,
9
Cereals,8
Fruits, 3
Beverages, 3Tobacco, 3
Seafood, 2
Others,20
a. Developing economies, total exports: US$77.2 billion
b. Developed economies, total exports: US$75.4 billion
Fruits, 15
Animalfodder,
12
Coffee, 10
Beverages, 8Seafood, 7Oilseeds,
6
Vegetables,6
Meat, 5
Foodpreparation,
5
Wood,4
Others, 22

220 How Can Latin America and the Caribbean Contribute to Global Food Security?
Trade Policy and Food Security • http://dx.doi.org/10.1596/978-1-4648-0305-5
attract nontraditional financing into the sector, take advantage of economies of scale, and vertically integrate the supply chain to improve efficiency. As a result, aggregate factor productivity growth in this sector—1.1 percent a year in agricul-ture and 0.9 percent in livestock—was higher than in others. Much more than is generally understood, the export-driven expansion of agricultural production after 1990 boosted employment and value added in upstream and downstream industries, more than import-substituting industries that traditionally have received high protection, like the auto industry (Regúnaga 2010).
In recent years, however, some of these reforms—particularly trade policies—have been partially reversed, shifting relative production incentives. The uncer-tainty and high export tax equivalent have induced farmers to reduce the area planted with corn and wheat and expand the area planted with soybeans, under-mining production sustainability. Export restrictions on beef and milk have slowed these sectors’ development. Agricultural growth has continued, stimu-lated by extremely high international prices, but the sector’s full potential has gone unrealized.
Further increases in production and exports will depend on resolving policy issues and improving logistics and infrastructure, because most of the current infrastructure was completed in the 1990s, with little improvement in the 2000s (O’Connor 2011). Argentina shows that both technical innovation and innova-tion in commercial organizations can be important drivers of competitiveness in the proper policy environment.
As in Argentina, Brazil’s rapid growth in production and exports was stimu-lated by macroeconomic stability and sector reforms put in place in the early to mid-1990s (Buainain, Ruiz, and Viera 2011). These included trade liberalization (including the elimination of export taxes) to improve incentive structure; vir-tual elimination of direct government purchase (including marketing boards); privatization of important state-owned enterprises; and deregulation of markets for sugarcane, wheat, and coffee. Agriculture’s share of public spending fell from 5.65 percent in the 1980s to 2.11 percent in 1995–99, but its composition improved. Although considerably less interventionist than in the past, govern-ment agricultural policy continues to be activist in some areas, including rural finance. Commercial banks are required by law to lend 25 percent of their sight deposits to agriculture. And the government has put in place two rather innova-tive programs to help farmers with finance and price risk management.
In addition to policy reform, technological innovation played a huge role in Brazil’s success. The federal research institute, the Brazilian Agricultural Research Corporation (Empresa Brasileira de Pesquisa Agropecuária, or EMBRAPA), was the most significant actor, but many other private companies, universities, and state research institutes also played important parts. EMBRAPA is credited by many with developing the soil enhancement technology that transformed the vast area of the cerrado from an agricultural wasteland to one of the country’s most produc-tive areas. But the recent expansion of agricultural production in no way compares to the dominant predatory pattern of the 1960s and 1970s, when growth was sustained by the continual incorporation of new land into production through

How Can Latin America and the Caribbean Contribute to Global Food Security? 221
Trade Policy and Food Security • http://dx.doi.org/10.1596/978-1-4648-0305-5
deforestation, with cut-and-burn, shifting, and extensive production systems. The expansion is based mostly on high investments and the application of advanced cultivation techniques, making it less land intensive and more sustainable.
Yet the geographic diversification of Brazilian agriculture during the past 35 years—and the legacy of a closed economy, which did not require efficient links to external markets—has created some bottlenecks to the sector’s competi-tiveness, particularly for grain crops, which will need to be loosened for Brazil to continue to supply a large share of world markets. The country’s transport efficiency remains inferior to that of Argentina and the United States, its two main competitors, because of the fairly large average distance (more than 1,000 kilometers) between ports and producer areas in the Center-West. The high dependence on road transport accounts for 60 percent of the total trans-ported cost, exacerbated by the excessive number of transshipments required (three or more before reaching the port). Other important potential bottlenecks are a deficit of rural storage capacity (estimated at 7–20 percent in static capacity terms) and inadequate port capacity.
t he enabling environment for Agricultural t rade: potential c onstraints and What c an Be Done to o vercome t hem
LAC clearly has done very well in global markets for food and agricultural products. But could it do better? What must occur for LAC to maximize its contribution to meeting future food demands? We consider from several angles how improving both external and internal enabling environments can support growth in productivity and trade.
Trade Policy—Global and LACOne key determinant of exports for a country or a region is the external trade environment—tariffs and nontariff barriers (NTBs) to its exports that it faces. One summary measure of this external environment is the Market Access Overall Trade Restrictiveness Index (MA-OTRI).3 LAC agricultural exports face fairly high market access barriers, particularly for exports to low-income coun-tries and South Asia. On average, agricultural exports from LAC face barriers (including nontariff and tariff) higher than those from any other region except East Asia and the Pacific (figure 9.5). Furthermore, a comparison of tariff indexes with the MA-OTRIs shows that the most significant barriers are NTBs. Manufactured products from LAC face lower barriers, indicating that agricul-tural exports suffer from an antiagriculture bias in the external trade regime. The restrictions facing LAC agricultural exports even to other LAC countries are high. This suggests that—at least in agricultural products—regional agreements have not lowered the barriers, corroborating one conclusion of the following discussion of regional trade agreements.
In their own trade policies, LAC countries have made great strides since the 1960s and 1970s, when highly protectionist trade policies and exchange rate regimes promoted industry-led development. This created in LAC and most

222 How Can Latin America and the Caribbean Contribute to Global Food Security?
Trade Policy and Food Security • http://dx.doi.org/10.1596/978-1-4648-0305-5
Figure 9.5 market Access o verall t rade r estrictiveness indexes for Agricultural exports, by r egion
Source: Computations using methodology described in Kee, Nicita, and Olarreaga 2009.Note: Each bar is an index of the barriers to exports from the region represented by the bar to the region or group of countries named below the bar. HIC = high-income countries; EAP = East Asia and Pacific; ECA = Europe and Central Asia; LAC = Latin America and the Caribbean; MNA = Middle East and North Africa; SAS = South Asia; SSA = Sub-Saharan Africa.
0
20
40
60
80
100
120
All HIC EAP ECA LAC MNA SAS SSA
Perc
ent
HIC ECA MNAEAP LAC SAS SSA
other developing countries a strong antiexport and antiagriculture incentive structure. Relative rates of assistance show the protection of manufacturing com-pared with that of agriculture, with negative values indicating an antiagriculture bias (figure 9.6). In LAC, the overall incentive structure has been close to neutral since the early 1990s. By contrast, some developing regions (including Sub-Saharan Africa) still maintain a net taxation of agriculture, whereas others have moved to the agricultural subsidization model of the high-income countries. This does not imply, however, that no need for further reform exists in LAC. The overall neutral structure masks a greater protection of import substitutes than of exportables, creating an antiexport bias for agricultural production. Nonetheless, this difference has greatly diminished since the 1980s, indicating that this antiex-port bias has lessened. Although biases and distortions persist in some LAC countries, the overall incentive structure is mostly conducive to an efficient agricultural supply response to higher prices and appropriate investments.
An emerging—or rather reemerging—issue for the region’s agricultural exports is the potential for Dutch disease effects from the boom in commodity prices and recent hydrocarbon and mineral discoveries. As the large study of agricultural policy by Krueger, Schiff, and Valdés (1991) underscores, macroeco-nomic policy in many countries greatly influences the incentive structure for agricultural production. Exchange rate policy has often implicitly taxed the sector. In the 2000s, good macroeconomic policy in many LAC countries gener-ally maintained real exchange rates at levels much more stable than in the past, avoiding large appreciations (figure 9.7). In recent years, however, exchange rates have begun to appreciate in important exporters (particularly Brazil and

How Can Latin America and the Caribbean Contribute to Global Food Security? 223
Trade Policy and Food Security • http://dx.doi.org/10.1596/978-1-4648-0305-5
Figure 9.7 r eal effective exchange r ates, 1980–2010
Sources: For Argentina, calculations based on data from the Bank for International Settlements; for the others, data from the International Monetary Fund database.Note: LAC = Latin America and the Caribbean.
0
50
100
150
200
250
Real
eff
ectiv
e ex
chan
ge ra
te (2
005
= 10
0)
19801982
19841986
19881990
19921994
19961998
20002002
20042006
20082010
Year
Latin America and theCaribbean (mean)
ColombiaBrazil MexicoArgentina Chile
Figure 9.6 r elative r ates of Assistance, by r egion, 1965–2009
Sources: Anderson 2009 for 1965–2004; calculations based on updated database for Anderson 2009, http://go.worldbank.org/5XY7A7LH40, for 2005–09.Note: LAC = Latin America and the Caribbean. Figure shows five-year weighted averages with value of production at undistorted prices as weights. LAC countries in the study were Argentina, Brazil, Chile, Colombia, the Dominican Republic, Ecuador, Mexico, and Nicaragua. The 2005–09 relative rate of assistance for Sub-Saharan Africa was heavily influenced by several countries that provided high positive protection to agriculture (particularly Ethiopia), but they are not representative of the continent as a whole. A majority of countries had negative relative rates of assistance, as in earlier periods.
–50
1965–69
1970–74
1975–79
1980–84
1985–89
1990–94
1995–99
2000–04
2005–09
–40
–30
–20
–10
Rate
of a
ssis
tanc
e (%
)
0
10
20
30
Sub-Saharan Africa LAC Asia

224 How Can Latin America and the Caribbean Contribute to Global Food Security?
Trade Policy and Food Security • http://dx.doi.org/10.1596/978-1-4648-0305-5
Colombia), threatening the sector’s competitiveness. This trend may become more pronounced as production from the new discoveries ramps up, making good management of the boom critical for agricultural (and other) trade.
Preferential trade agreements (PTAs) affect both the external trade environ-ment and each member country’s own trade regime. Since the 1992 North American Free Trade Agreement, Latin American countries have negotiated and notified to the World Trade Organization (WTO) almost three dozen PTAs, both bilateral and multilateral.4 As long as the Doha Round negotiations remain stalled, PTAs are the only instrument for negotiating mutual trade barrier reduc-tion. Mexico and Chile have been most prolific in this area: each has agreements with several LAC countries, as well as with the United States, the EU, and some Asian countries (Chile has a PTA with China). Many of these agreements go beyond tariff reductions to other trade issues, including some relevant to agricul-ture, such as sanitary and phytosanitary (SPS) measures. Virtually all agreements have a phase-in period of progressively reducing tariffs and subjecting more products to tariff reduction or elimination. By any measure, most of these agree-ments liberalize agricultural trade less than nonagricultural trade. Other research confirms the MA-OTRIs cited previously: notwithstanding the spaghetti bowl of agreements among the LAC countries and with extraregional partners, agricul-tural trade barriers remain relatively high. In some cases, however, PTAs have had important positive effects, more so in processed and higher-value-added products than in commodities. A gravity model distinguishing product groups clearly demonstrates such effect: PTAs are positively associated with exports of all prod-uct groups but more so for agroindustrial goods than for others. It appears that more recent agreements have had more positive effects than earlier ones, such as Mercosur (Southern Cone Common Market), and PTAs have reduced NTBs. One thing is clear from theory and practice: PTAs yield larger benefits when member countries have lower trade barriers with partners outside the preferen-tial area, because this reduces the possibility of trade diversion.
Improving the Trade EnvironmentClearly, the global trade reform agenda is highly relevant, especially for agri-cultural products, for which trade barriers remain much higher than for manufactured goods. Given agricultural trade’s importance to LAC and LAC’s importance as a world food supplier, lowering the barriers as quickly as possible is in everyone’s best interest. And as we saw when comparing tariffs with NTBs, the agenda should accord high priority to NTBs. Global gains from implementing the proposals on the table in the Doha Round could produce gains of US$160 billion a year—and even higher true gains from reducing the uncertainty associ-ated with gaps between bound and applied tariffs (Martin and Matoo 2011).
Although LAC countries have substantially reduced the antiexport and anti-agriculture biases in their trade regimes, these biases remain significant in some countries. Argentina, a major food exporter, imposes export taxes and quantita-tive controls with considerable adverse consequences for the sector and the global food trade system. The motivations behind this policy are understandable:

How Can Latin America and the Caribbean Contribute to Global Food Security? 225
Trade Policy and Food Security • http://dx.doi.org/10.1596/978-1-4648-0305-5
these taxes make up a substantial part of the government’s revenue (rising from about 1 percent of gross domestic product in 2004 to 4.1 percent in 2011) and keep domestic prices low for consumers when international prices spike. Yet quantitative controls produce no revenue, contribute to policy uncertainty, and, along with taxes, reduce domestic production in the medium term, poten-tially raising prices. Export controls are one explanation for the recent drop in Argentina’s beef production. And they can create the need for additional con-trols, as in Ecuador, where export bans had to be accompanied by price controls and government purchases to support producers. Furthermore, if several major exporters impose export taxes simultaneously, the effect on international prices will at least partly offset the first-round impact of the taxes in lowering domestic prices in those countries. In any case, alternative instruments could meet these objectives at lower costs than either taxes or controls. We hope future trade negotiations will address disciplining export taxes and controls, but until then, countries can act unilaterally to limit their use.
But the LAC region comprises more than big exporters. Numerous countries—especially the small economies of Central America and the Caribbean—are net food importers and impose tariffs or NTBs on food imports, especially items also produced locally. These countries should consider the costs of responding to price movements in international markets with policies that insulate their domestic economies while exacerbating international price volatility. These pol-icy responses include reducing tariffs on food imports when prices are high and raising them when prices fall. Such policies not only magnify world price move-ments, but also are inefficient for the country involved, because they encourage overconsumption and underproduction when prices are high and vice versa. To the extent that traders and processors anticipate such adjustments, they can adjust the timing of their own storage and import behavior, resulting in sharp import flow fluctuations and supply chain congestion. A better solution would lower tariffs permanently, reducing the antiexport bias that persists in the current trade and support regimes, as shown previously, as well as benefiting poor con-sumers. Another option, implemented by Mexico and Brazil, is to ramp up safety-net payments to compensate the poor when food prices rise. Nonetheless, from the frequency of ad hoc tariff reductions, strong political pressures clearly encourage this response when food prices spike. But such actions should be considered a policy of last resort.
While working within the multilateral system for further reforms, LAC coun-tries (and countries in other regions) could take more advantage of the opportu-nities provided by negotiating PTAs to address issues not handled well in WTO commitments5—particularly to reduce the effects of NTBs, as Chile has with its bilateral agreements. Some ways to use PTAs include the following:
• Remove the exemption of agricultural products from the “general tolerance” or de minimis exceptions in rules of origin, so that producers of agricultural products (primary and processed) could take as much advantage of low-cost imported inputs as producers in other sectors can. A second-best alternative

226 How Can Latin America and the Caribbean Contribute to Global Food Security?
Trade Policy and Food Security • http://dx.doi.org/10.1596/978-1-4648-0305-5
would be to exclude only especially sensitive agricultural products without excluding the whole sector, as many PTAs currently do.
• Improve the agreements’ treatment of SPS issues. This could include clarify-ing the rules under the multilateral SPS agreement to improve transpar-ency or, even better, committing countries not to impose more stringent protection than that recommended by international scientific organizations. Harmonization and mutual recognition of standards would also enhance trade. Some of these issues might be handled through current committees and work-ing groups.
• Harmonize PTAs through gradually converging their commitments.
• Explore agreements with countries with especially high trade barriers for LAC agricultural exports, especially in South Asia, the Middle East, and North Africa.
For LAC countries’ agricultural sectors to stay competitive, they must appro-priately manage the real exchange rate to minimize Dutch disease. Here, Chile is instructive. Notwithstanding large revenue increases from copper in recent years, its real exchange rate has not appreciated as much as that of other coun-tries, largely because of its macroeconomic policies, including a restrained fiscal response during the commodity boom and its use of stabilization and sovereign funds. The threat of Dutch disease magnifies the importance of national innova-tion and competitiveness policy. Here, policy should focus on incentives for technology generation and adoption that are fairly neutral toward specific prod-ucts or sectors (Sinnott, Nash, and de la Torre 2010), rather than on what Justin Lin (2012) calls comparative advantage–defying strategies, which single out new industries for special favors.
Infrastructure and LogisticsIn addition to trade policy, the quality of logistics and infrastructure critically influences trade’s enabling environment. Ferro and Portugal-Perez (2012) esti-mate the potential importance for LAC’s agricultural trade of improving logistics and several kinds of infrastructure. The study distinguishes the effects of “hard infrastructure,” “soft infrastructure” (institutions and regulations), and days required to export.6 Using these variables’ estimated impacts, it carries out a simu-lation of the effect if all LAC countries improve these indicators to the levels of Organisation for Economic Co-operation and Development (OECD) countries.
The average increase in LAC exports from improving hard infrastructure to OECD levels is 130 percent for total exports, 157 percent for industrial exports, and 49 percent for agricultural exports. Clearly, the benefit of this improvement is greater for industrial exports than for agricultural exports. Across LAC, the average effect on agricultural exports would equal a tariff reduction of 24.7 percent in the destination importing countries.

How Can Latin America and the Caribbean Contribute to Global Food Security? 227
Trade Policy and Food Security • http://dx.doi.org/10.1596/978-1-4648-0305-5
Upgrading LAC’s soft infrastructure to OECD levels would increase agricultural exports 158 percent,7 a much larger effect than on manufactured exports (figure 9.8). Even though improving soft infrastructure affects total exports less than does improving hard infrastructure, it is overwhelmingly impor-tant for agricultural exports. Across LAC, the average effect on agricultural exports would equal a tariff reduction of 79.3 percent in the destination import-ing countries. For many countries, the tariff concessions needed for such export levels are more than 100 percent, which would be equivalent to exporters receiv-ing an import subsidy from trading partners!
In addition, this study found that some logistics issues matter more to particu-lar kinds of products. Exports of heavier products, such as industrial and “bulk” agricultural items, depend more on hard infrastructure, whereas time-sensitive products depend more on soft infrastructure. For agricultural exports overall, and for all countries, this soft infrastructure is much more important than hard infrastructure.
The big picture is that trade logistics—both hard and soft infrastructure—matter a lot for agriculture and deserve to be at or near the top of trade policy priorities. But to transform this overarching policy message into an actionable agenda requires (a) seeing how close the region is to best practice elsewhere to assess its potential for improvement and (b) looking at logistics at a more granu-lar level, both more country specific and more focused on specific logistics and facilitation measures. Recent work has used a case study approach and value
0
100
Argentin
a
Bolivia
BrazilChile
Colombia
Costa Rica
Ecuador
Guatemala
Guyana
Jamaica
Mexico
Nicaragua
Peru
Panama
El Salvador
Paraguay
Honduras
Uruguay
Venezuela, R
B
Latin Americ
a and
the Carib
bean
200Incr
ease
in e
xpor
ts (%
)
300
400
500
600
700
800
Total exports Industrial exports Agricultural exports
Figure 9.8 increase in exports from an improvement in s oft infrastructure to the l evels of oec D c ountries
Source: Ferro and Portugal-Perez 2012.Note: OECD = Organisation for Economic Co-operation and Development.

228 How Can Latin America and the Caribbean Contribute to Global Food Security?
Trade Policy and Food Security • http://dx.doi.org/10.1596/978-1-4648-0305-5
chain analysis to look in more detail at specific logistics and infrastructure prob-lems faced by particular countries and regions, especially for agricultural trade. Where aggregate indicators were available, it benchmarked LAC’s performance against that of other regions and countries. The objective was to diagnose priority areas for improvement.
LAC’s poor infrastructure is a major factor underlying its consistently poor global competitiveness. The World Economic Forum’s Growth and Business Competitiveness Index and the World Bank’s investment climate assessments, for instance, have found that most surveyed firms regard poor infrastructure as a main obstacle to the operation and growth of their businesses. One measure of particular interest to agriculture—the Rural Access Index, which measures the percentage of the rural population living within 2 kilometers of an all-season road8—shows LAC lagging East Asia and middle-income countries along this dimension. Inadequate access to the road network translates into increased costs, losses, and delays; consequences are especially severe for perishable goods. Food logistics costs for Peru, Argentina, and Brazil are greater than 25 percent of product value, whereas Chile, a regional leader in logistics, has costs of about 18 percent, still double that of the OECD (figure 9.9).
On the production side, small firms, which make up the majority of firms in LAC countries and are the region’s employment and growth engines, also suffer disproportionately from high logistics costs (Schwartz, Guasch, and Wilmsmeier 2009). Perishable agricultural products have unique characteristics that require specialized logistics systems, including remote production zones, temperature control, and special sanitary inspection procedures. Because of the time sensitiv-ity of perishable agricultural goods, bottlenecks in the logistics system directly affect the quality and quantity of goods delivered. For nonperishable products, delays often result in increased logistics expenses for labor, fuel, and storage,
Figure 9.9 l ogistics c ost as a percentage of Food product value, 2004
Source: Gonzalez, Guasch, and Serebrisky 2008.Note: OECD = Organisation for Economic Co-operation and Development.
0
5
10
15
20
25
30
35
Peru Argentina Brazil Colombia Mexico Chile OECD
Perc
ent

How Can Latin America and the Caribbean Contribute to Global Food Security? 229
Trade Policy and Food Security • http://dx.doi.org/10.1596/978-1-4648-0305-5
as well as fees or fines for delays and demurrage. Remote production zones incur higher costs and greater losses for the first actors along the supply chain, the farmers themselves. Most perishable products cannot be easily consolidated with other types of cargo, including other refrigerated cargo. SPS systems are necessarily complex, involving coordination with customs agencies and other inspection and regulatory agents operating at borders and ports. Because of these characteristics, smaller producers and local agriculture traders are often heavily affected by poor-quality roads and uncompetitive trucking services. By contrast, large shippers benefit from integrated supply chains, greater access to the primary trade corridors, and better berth access at ports.
On average, LAC performs better than only Sub-Saharan Africa in physical infrastructure (figure 9.10). Even among LAC countries, great variability exists: Chile and Panama have infrastructure levels that reach those of OECD countries, whereas the region’s landlocked countries are the worst performers. LAC also underperforms in its business environment, which is only half as good as that of OECD countries and better than only Sub-Saharan Africa and South Asia. Within the region, the best performer is Chile and the worst is the República Bolivariana de Venezuela.
The Logistics Performance Index (LPI) shows that LAC’s logistics performance fares poorly compared with that of high- and upper-middle-income countries, though reasonably well compared with that of other developing regions.9 As seen in table 9.1, LAC’s overall LPI score of 2.74 (on a five-point scale) is similar to
Figure 9.10 t rade Facilitation: c omparing l Ac with o ther r egions
Source: Logistics Performance Index, 2010 (http://go.worldbank.org/7TEVSUEAR0).Note: SSA = Sub-Saharan Africa, LAC = Latin America and the Caribbean; ECA = Europe and Central Asia; SAS = South Asia; EAP = East Asia and Pacific; MNA = Middle East and North Africa; OECD = Organisation for Economic Co-operation and Development.
a. Physical infrastructure, by region
0
0.2
0.4
0.6
0.8
mea
n of
p_t
f_in
fras
truc
ture
SSALAC
ECASAS
EAPMNA
OECD
b. Business environment, by region
SASSSA
LACECA
EAPMNA
OECD
0
0.2
0.4
0.6
0.8
mea
n of
p_t
f_bu
sine
ss

230 How Can Latin America and the Caribbean Contribute to Global Food Security?
Trade Policy and Food Security • http://dx.doi.org/10.1596/978-1-4648-0305-5
that of Europe and Central Asia and of East Asia and Pacific. LAC performs poorly compared with the upper-middle-income group and many Asian countries, including Singapore (4.1), China (3.5), Thailand (3.3), and Indonesia (2.8).
The LPI also illustrates that overall logistics performance has improved in the LAC region, although more so from 2007 to 2010 than from 2010 to 2012. Mexico, the Southern Cone, and Andean countries have made the most prog-ress, whereas the Central America and Caribbean subregions have fallen back since 2010.
In all business survey–based reviews, LAC performs considerably worse in standards of export and import costs than does OECD. The required export and import procedures include the costs for documents, administrative fees for customs clearance and technical control, customs broker fees, terminal handling charges, and inland transport. The Doing Business indicators reveal that LAC’s average cost to export a container is US$1,257 and that the cost to import one is US$1,546 (figure 9.11). These costs are lower than in Sub-Saharan Africa, Eastern Europe, and South Asia, though still higher than in other developing regions, such as East Asia, and the OECD average. Within LAC, costs to export a container are lowest in Central America and highest in the Andean region: US$1,720 to export and US$1,951 to import.
Developing an Infrastructure and Logistics StrategyQuantitative estimates of potential cost reductions show substantial heterogeneity in how transport and logistics costs affect LAC countries, depending on the shares of different types of agriculture exports and imports. However, supply chain analyses indicate that logistics costs generally constitute a very high propor-tion of the final price of food products. (See figure 9.12 for an example in which land and ocean transport and port costs were found to account for 43 percent of the final retail price of pineapples imported into St. Lucia from Costa Rica.)
t able 9.1 l ogistics performance index, international, r egional, and income Group c omparisons
Region LPI Customs InfrastructureInternational
shipmentsLogistics
competenceTracking
and tracing Timeliness
Europe & Central Asia 2.74 2.35 2.41 2.92 2.60 2.75 3.33LAC 2.74 2.38 2.46 2.70 2.62 2.84 3.41East Asia & Pacific 2.73 2.41 2.46 2.79 2.58 2.74 3.33MENA 2.60 2.33 2.36 2.65 2.53 2.46 3.22South Asia 2.49 2.22 2.13 2.61 2.33 2.53 3.04Sub-Saharan Africa 2.42 2.18 2.05 2.51 2.28 2.49 2.94High Income: all 3.55 3.36 3.56 3.28 3.50 3.65 3.98Upper MIC (except LAC) 2.95 2.49 2.54 2.86 2.71 2.89 3.36Lower MIC 2.59 2.23 2.27 2.66 2.48 2.58 3.24Low Income 2.43 2.19 2.06 2.54 2.25 2.47 2.98
Source: Logistics Performance Index, 2010 (http://lpi.worldbank.org).Note: LAC = Latin America and the Caribbean; LPI = Logistics Performance Index; MENA = Middles East and North Africa; MIC = middle-income countries.

How Can Latin America and the Caribbean Contribute to Global Food Security? 231
Trade Policy and Food Security • http://dx.doi.org/10.1596/978-1-4648-0305-5
Figure 9.11 c ost to export and import: Global c omparison, 2011
Source: Calculations based on Doing Business Indicators (database), Trading across Borders, World Bank, Washington DC. http://www.doingbusiness.org/data/exploretopics/trading-across-borders.Note: OECD = Organisation for Economic Co-operation and Development.
East Asia and Pacific
Middle East and North Africa
Latin America and the Caribbean
South Asia
Eastern Europe and Central Asia
Sub-Saharan Africa
OECD high income
500 1,000 1,500 2,000 2,500US$/container
Cost to import Cost to export
So, heterogeneity notwithstanding, port efficiency gains, road haulage improve-ments, expedited customs clearance and border crossings, better inventory prac-tices, and increased capacity and competition in storage and warehousing could reduce logistics costs 20–50 percent. This could mean a permanent 5–25 percent reduction in the baseline cost of food and agriculture imports—and increased profits for exporters.
A trade supply chain is only as strong as its weakest link: poor performance in just one or two areas can have serious repercussions for overall competitiveness. The multidimensionality of logistics necessitates a coordinated strategy, devel-oped with input from public and private sector stakeholders alike, for improve-ments to result in lower costs, higher trade volumes, and increased reliability and competitiveness. Countries can ensure that all logistics constraints are identified and monitored by designating a national logistics entity to coordinate efforts and manage dialogue. For example, through the Plan Mesoamericana, as well as other regional organizations, Central America is moving toward strategic regional infra-structure planning, but it has encountered considerable difficulties harmoniz-ing procedures and standards. Argentina, Brazil, and Chile are also engaging in regional coordination to improve intraregional trade.
Breaking this analysis down by food types suggests that for net food importers, costs associated with refrigerated cargo capacity and services are the critical bottlenecks, because meat, fish, and dairy represent the largest share of all food imports by value (26 percent). In contrast, for LAC countries that are net food exporters, bulk storage, handling, and transporting are the primary concerns, because on a weighted-average basis, dry bulk items make up the largest share of food exports by value (31 percent). Thus, Organization of Eastern Caribbean

232 How Can Latin America and the Caribbean Contribute to Global Food Security?
Trade Policy and Food Security • http://dx.doi.org/10.1596/978-1-4648-0305-5
States island countries, for example, should work on reducing the costs of refrig-erated containerized traffic. Bolivia, Brazil, Colombia, and Peru, however, would benefit from improving the importing and distribution process for dry bulk goods. A more detailed look at logistics constraints of particular importance in specific countries and subregions is in Chaherli and Nash (forthcoming).
t he Future: How c an l Ac Help Feed the World?
Global and Regional Drivers of LAC Food ExportsWe conclude the chapter with a look at the future. With the need to increase food, fiber, and fuel production about 80 percent by 2050 to meet global demand, how will LAC contribute? A recent study by the International Food Policy Research Institute (Tokgoz, Bhandary, and Rosegrant 2012) assessed global and regional drivers of LAC food exports through 2050.10 The drivers are natural or human-induced factors that directly or indirectly cause changes in food demand and supply in domestic and global markets and in the global trad-ing system. The major issues explored are whether the world can feed itself into the future, what role the LAC could play, and how that role might change depending on developments in climate change and other drivers.
The study found that if current trends continue in income and population growth, use of technology and resources to produce food and fiber, distortions in agricultural and trade policies, and investments in irrigation and infrastructure
Figure 9.12 price Decomposition for pineapple supply c hain from c osta r ica to st. l ucia
Source: Schwartz, Guasch, and Wilmsmeier 2009.
Producerprice
Landtransport
Oceantransport+ port CR
PortMiami
Wholesaleconsolidated
cost
Other costs
Oceantransport + port SL
Duties
Landtransport
& handling
Landtransport+ storage
Retail profits+ other costs
10
8
35
17
15
15
0
0.2
0.4
0.6
0.8
1.0
1.2
1.4
1.6
1.8
2.0
Farm gate (C
R)
CR FAS
Ocean to
Miami
Miami port
Miami Warehouse
Miami FOB pric
e
Ocean to
St. Lucia
St. Lucia
n port
Wholesale
Distrib
ution
Retail pric
e
Final deco
mposition
Cost
(US$
/pou
nd)
Perc
enta
ge o
f cos
t
Total transport - land
Total transport - ocean + port
Producer priceWholesale - profits, logistics, and other costs
Retail - profits, logistics, and other costs
Import duties
Costa Rica (CR)St. Lucia (SL)

How Can Latin America and the Caribbean Contribute to Global Food Security? 233
Trade Policy and Food Security • http://dx.doi.org/10.1596/978-1-4648-0305-5
(the baseline or “business-as-usual” scenario), LAC’s share in global trade will probably grow in all four main food categories in the model—cereals, oilseeds, meats, and fruits and vegetables. By 2050, in this scenario LAC would be supply-ing more than one-third of meat exports, one-third of fruit and vegetable exports, one-half of oilseeds exports, and about one-tenth of cereal exports (table 9.2). In a “better business and logistics” scenario with greater emerging market growth, agricultural trade liberalization, investment in irrigation and improved agricul-tural technology, better infrastructure, and lower marketing costs (proxied by lower wedges between border and domestic prices), LAC could play an even greater role in meeting global food, fiber, and biofuel demand. In two other simulated scenarios—“green growth” (with more efficient water and fertilizer use and earlier development of efficient biofuel technologies) and “harmonious rebalancing” (with higher growth of incomes and meat consumption but lower population growth in developing countries, higher productivity growth, and earlier adoption of efficient biofuels)—LAC’s share would grow less than in the first two scenarios but would still be greater than in 2010 for all product groups.
The report also considered a more pessimistic but plausible forecast. This future pathway includes less rapid growth in emerging markets, high population growth, and a wetter and warmer climate. LAC’s share in 2050 would stay almost the same as in 2010 for meats, decline sharply to 13 percent for fruits and vegetables, and increase to 16 percent for cereals. Argentina and Brazil would expand their trade in cereals, while Mexico would increase its dependence on the
t able 9.2 r egional shares in World net exports in Business-as-Usual and Alternative s cenarios for 2050Percent
Region and food 2010Business as
usual in 2050Harmonious rebalancing
Pessimistic view of the world
Green growth
Better business and logistics
Latin America and the CaribbeanMeat 30 36 30 29 33 41Cereals 8 11 9 16 9 13Fruits and Vegetables 25 34 33 13 33 38Oilseeds 42 50 49 55 50 56
Developed economiesMeat 38 36 39 29 40 33Cereals 63 45 45 33 47 44Fruits and Vegetables 17 19 23 13 22 18Oilseeds 31 29 30 9 30 25
Rest of developing economies (non-LAC)Meat 32 28 31 42 27 26Cereals 29 44 46 51 44 43Fruits and Vegetables 58 47 44 74 45 44Oilseeds 27 21 21 36 20 19
Source: Tokgoz, Bhandary, and Rosegrant 2012.Note: LAC = Latin America and the Caribbean.

234 How Can Latin America and the Caribbean Contribute to Global Food Security?
Trade Policy and Food Security • http://dx.doi.org/10.1596/978-1-4648-0305-5
world market. Except for Chile, LAC countries would see their potential for exports of fruits and vegetables curtailed significantly, with Brazil hit the hardest. These shares would reflect an important switch in trade status for the region. This pessimistic scenario underscores trade’s importance as a climate change adjustment mechanism. Protectionism could pose a food security threat by preventing trade from compensating for surplus disappearance in developed countries. This is important for Argentina and Brazil, two countries called on to increase their cereal exports to regions facing large grain deficits.
Removing the Constraints: Future Priorities for Latin America and the Caribbean’s Sustainable Agricultural TradeConsonant with this chapter’s overall message, the International Food Policy Research Institute study (Tokgoz, Bhandary, and Rosegrant 2012) underscored infrastructure’s importance as a potential barrier to increasing production and trade in LAC. Improving LAC infrastructure and participation in the global grid could vastly improve agricultural production efficiency and volume, essential to meet rising global food demand, especially in developing markets. Improving its business environment and logistics could provide LAC with much greater oppor-tunities for meeting global food and fiber needs. LAC could thus capture an estimated 5–15 percent more market share than under a business-as-usual sce-nario. LAC would be capturing this extra market share from developed countries in meat and oilseeds and from other developing countries in fruits and vegetables and cereals. LAC’s export profile would also be restructured in this scenario, with a greater increase in exports of bulk commodities and of more processed items, such as soybean oil instead of beans. Exports of soybean meal would grow slower, because higher livestock production in LAC would require more meal, leaving less available for trade.
Another potential constraint to ramping up production worldwide to meet future demand is inefficient water use. Agriculture consumes about 70 percent of the world’s freshwater supply. Although LAC currently has fairly abundant supplies, water scarcity poses problems for increasing agricultural production in some parts of the region and in other parts of the world. The tension between rapidly rising natural resource consumption and environmental sustainability will be a critical pressure point over the coming decades in all regions, including LAC. Pricing resource use and adopting more sustainable practices in water and land management could help LAC green its growth and agricultural exports. If all regions use water more efficiently (as in a green growth scenario), LAC’s com-parative advantage from its abundant resources would shrink (as reflected in a reduced market share compared with some other scenarios), but its share would nonetheless increase over current levels.
Final constraints, as argued previously, are trade barriers. Maintaining an open, efficient trading system is critical if LAC is to continue—and even increase—its contributions to feeding the world. And the looming threat of climate change magnifies the importance of increasing the trade system’s flexibility—for two reasons. First, in the long run, as patterns of comparative advantage in food

How Can Latin America and the Caribbean Contribute to Global Food Security? 235
Trade Policy and Food Security • http://dx.doi.org/10.1596/978-1-4648-0305-5
production change, moving food from countries where it is produced efficiently to food-deficit countries will require new trade patterns. Second, on a year-to-year basis, greater weather variability will create short-term local shocks to food supply that will require rapidly adjusting food trade to avoid shortages. The recent precipitous food price increases demonstrated that when shortages arise, countries tend to react with “beggar thy neighbor” trade policies that insulate domestic consumers and producers from international price movements. In so doing, they increase global price volatility and shift the adjustment costs to others. Such actions included increases in export barriers (including in some LAC countries), which amplified the spike. Export bans accounted for an esti-mated 40 percent of the world price increase for rice and 25 percent of that for wheat. Less commonly understood, the ad hoc reductions in import barriers in many countries had a similar effect, reducing price fluctuations domestically while magnifying international price variability.
Global trade reform in biofuels is especially important in ensuring that LAC can sustainably ramp up its contribution to the global food supply while minimizing global greenhouse gas emissions. Liberalizing trade in biofuels could increase sector competition, improve efficiency, lower costs, and enable the world’s most efficient producers to expand their share of the biofuels market. For example, producing a liter of ethanol from sugarcane in Brazil requires only about half the land area needed to produce the same liter from corn in the United States. Transferring production from the United States to Brazil would thus reduce the amount of land diverted from growing food. But currently, bio-fuel promotion policies and trade barriers distort international trade patterns and impede this shift while imposing large costs on the populations of the countries employing them. Of course, to fully realize these benefits, Brazil would need to expand its production without deforesting land, but as argued earlier, the country has plenty of degraded pasturelands that could be used more productively for these crops.
notes
1. The revealed comparative advantage (RCA) is an index used in international econom-ics to calculate a country’s relative advantage or disadvantage in a class of goods or services as evidenced by trade flows. It usually refers to an index introduced by Bela Balassa (1965): RCA = (Eij/Eit) / (Enj/Ent), where E = exports; i = country index; n = set of countries; j = commodity index; and t = set of commodities. If RCA is greater than 1, then a comparative advantage is “revealed.” If RCA is less than unity, then the country is said to have a comparative disadvantage in the commodity or industry. See http://en.wikipedia.org/wiki/Revealed_comparative_advantage.
2. A notable exception is Mexico, which continues to export mainly to its North American Free Trade Agreement partners, reflecting its locational and climatic com-parative advantage, as well as the agreement.
3. The MA-OTRI answers the following question: “What is the uniform tariff that if imposed by all trading partners on exports of country c instead of their current struc-ture of protection (tariffs and non-tariff barriers) would leave exports of country c at

236 How Can Latin America and the Caribbean Contribute to Global Food Security?
Trade Policy and Food Security • http://dx.doi.org/10.1596/978-1-4648-0305-5
their current level?” See Kee, Nicita, and Olarreaga (2009) for a description of the methodology and a survey of trade restrictiveness indexes.
4. Although most of these agreements have the term free trade in their names, even when they are fully phased in, trade is not completely free. Referring to them generically as Preferential trade agreements (PTAs) is thus more accurate, although when referring to specific agreements, we use their official designation, free trade agreement.
5. This section draws from Shearer, Almeida, and Gutiérrez (2009), which discusses these recommendations and others in considerable detail.
6. The study used a gravity model and a novel factor analysis approach to overcome problems with multicollinearity that are common to this kind of econometric estima-tion because of the high correlation across countries in the quality of many logistics-related variables.
7. The large effect of facilitation is not because of our assumption of a linear effect in the model. Because these effects at first blush seemed extremely large, we tested for the possibility of diminishing returns to trade facilitation by including a squared term for each trade facilitation variable. The coefficient on each squared term was positive (negative for days to export), indicating increasing rather than diminishing returns to trade facilitation. Thus, though large, the results of our simulations do not have an upward statistical bias.
8. An all-season road is one that is passable year-round by the existing means of rural transport, normally a pick-up truck or a truck without four-wheel drive.
9. The LPI provides both quantitative and qualitative evaluations of a country in six areas: (a) efficiency of the clearance process (speed, simplicity, and predictability of formalities) by border control agencies; (b) quality of trade and transport-related infrastructure (ports, railroads, roads, and information technology); (c) ease of arrang-ing competitively priced shipments; (d) competence and quality of logistics services (transport operators and customs brokers); (e) ability to track and trace consignments; and (f) timeliness of shipments.
10. The study used IMPACT, a global multimarket, partial equilibrium model that pro-vides long-term projections of global food supply, demand, trade, prices, and food security, balancing water availability and uses within economic sectors at the global and regional levels. IMPACT uses 281 “food-producing units,” which represent the spatial intersection of 115 economic regions and 126 river basins. The model gener-ates projections for agricultural crop area and crop yields as a function of global market drivers (such as commodity demand and prices) and local availability of water resources. Crop area and yields also depend on the projected rate of exogenous ( nonprice) growth trends, labeled intrinsic growth rates. A detailed description can be found in Rosegrant and others (2008).
r eferences
Anderson, Kym, ed. 2009. Distortions to Agricultural Incentives: A Global Perspective, 1955–2007. London: Palgrave Macmillan; Washington, DC: World Bank.
Anderson, Kym, and Alberto Valdés, eds. 2008. Distortions to Agricultural Incentives in Latin America. Washington, DC: World Bank.
Balassa, Bela. 1965. “Trade Liberalisation and ‘Revealed’ Comparative Advantage.” The Manchester School 33 (2): 99–123.

How Can Latin America and the Caribbean Contribute to Global Food Security? 237
Trade Policy and Food Security • http://dx.doi.org/10.1596/978-1-4648-0305-5
Bruinsma, Jelle. 2009. “The Resource Outlook to 2050: By How Much Do Land, Water and Crop Yields Need to Increase by 2050?” Paper presented at the Food and Agriculture Organization of the United Nations Expert Meeting “How to Feed the World in 2050,” Rome, June 24–26.
Buainain, Antonio M., Junior R. Ruiz, and Pedro. A. Viera. 2011. “Recent Development Patterns and Challenges of Brazilian Agriculture.” Food and Agriculture Organization of the United Nations Cooperation Programme, Investment Centre Division, back-ground paper prepared for Chaherli and Nash (forthcoming), Agricultural Exports from Latin America and the Caribbean: Harnessing Trade to Feed the World and Promote Development. Washington, DC: World Bank, Sustainable Development Department, Latin America and the Caribbean Regional Vice Presidency.
Chaherli, Nabil, and John Nash. Forthcoming. Agricultural Exports from Latin America and the Caribbean: Harnessing Trade to Feed the World and Promote Development. Washington, DC: World Bank, Sustainable Development Department, Latin America and the Caribbean Regional Vice Presidency.
Deininger, Klaus, and Derek Byerlee, with Jonathan Lindsay, Andrew Norton, Harris Selod, and Mercedes Stickler. 2011. Rising Global Interest in Farmland: Can It Yield Sustainable and Equitable Benefits? Washington, DC: World Bank.
Ferro, Esteban, and Alberto Portugal-Perez. 2012. “Trade Facilitation in Latin America and Agricultural Exports.” International Food Policy Research Institute background paper prepared for Chaherli and Nash (forthcoming), Agricultural Exports from Latin America and the Caribbean: Harnessing Trade to Feed the World and Promote Development. Washington, DC: World Bank, Sustainable Development Department, Latin America and the Caribbean Regional Vice Presidency.
Gonzalez, Julio, Jose Luis Guasch, and Tomas Serebrisky. 2008. “Improving Logistics Costs for Transportation and Trade Facilitation.” Policy Research Working Paper 4558, World Bank, Washington, DC. http://www-wds.worldbank.org/external/default / WDSContentServer/IW3P/IB/2008/03/13/000158349_20080313132618/Rendered /PDF/wps4558.pdf.
Guasch, Jose Luis. 2011. “Logistics as a Driver for Competitiveness in Latin America and the Caribbean.” Presentation to the Fifth Americas Competitiveness Forum for the Inter-American Development Bank and Compete Caribbean, Santo Domingo, the Dominican Republic, October 5–7. http://www.competecaribbean.org/content/JL _ Guasch_final_Logistics%20as%20a%20Driver%20for%20Competitiveness%20%28english%29.pdf.
Kee, Haiu L., Alessandro Nicita, and Marcelo Olarreaga. 2009. “Estimating Trade Restrictiveness Indices.” Economic Journal 119 (534): 172–99.
Krueger, Anne O., Maurice Schiff, and Alberto Valdés. 1991. The Political Economy of Agricultural Pricing Policy. Baltimore, MD: Johns Hopkins University Press for the World Bank.
Lin, Justin Y. 2012. The Quest for Prosperity: How Developing Economies Can Take Off. Princeton, NJ: Princeton University Press.
Mandel, Benjamin. 2012. “The Differentiation and Dynamics of Latin American and Caribbean Agricultural Exports.” International Food Policy Research Institute back-ground paper prepared for Chaherli and Nash (forthcoming), Agricultural Exports from Latin America and the Caribbean: Harnessing Trade to Feed the World and Promote Development. Washington, DC: World Bank, Sustainable Development Department, Latin America and the Caribbean Regional Vice Presidency.

238 How Can Latin America and the Caribbean Contribute to Global Food Security?
Trade Policy and Food Security • http://dx.doi.org/10.1596/978-1-4648-0305-5
Martin, Will, and Aaditya Matoo, eds. 2011. Unfinished Business? The WTO’s Doha Agenda. Washington, DC: World Bank.
O’Connor, Ernesto. 2011. “The Agricultural Economy of Argentina: Recent Trends and Prospects.” Background paper for this book, Food and Agriculture Organization of the United Nations Cooperation Programme, Investment Centre Division, Rome.
Regúnaga, Marcelo. 2010. “Implications of the Organization of the Commodity Production and Processing Industry: The Soybean Chain in Argentina.” Background paper for Sinnott, Nash, and de la Torre (2010), Natural Resources in Latin America and the Caribbean: Beyond Booms and Busts? Washington, DC: World Bank.
Rosegrant, Mark W., Claudia Ringler, Siwa Msangi, Timothy B. Sulser, Tingju Zhu, and Sarah A. Cline. 2008. International Model for Policy Analysis of Agricultural Commodities and Trade (IMPACT): Model Description. Washington, DC: International Food Policy Research Institute.
Schwartz, Jordan, Jose Luis Guasch, and Gordon Wilmsmeier. 2009. “Logistics, Transport and Food Prices in LAC: Policy Guidance for Improving Efficiency and Reducing Costs.” World Bank policy discussion paper presented to the Second Meeting of the Finance Ministers of the Americas and the Caribbean, Viña del Mar, Chile, July 3.
Shearer, Matthew, Juliana S. Almeida, and Carlos H. Gutiérrez Jr. 2009. “The Treatment of Agriculture in Regional Trade Agreements in the Americas.” IDB Working Paper IDB-WP-145, Inter-American Development Bank, Vice Presidency for Sectors and Knowledge, Integration and Trade Sector, Washington, DC.
Sinnott, Emily, John Nash, and Augusto de la Torre. 2010. Natural Resources in Latin America and the Caribbean: Beyond Booms and Busts? Washington, DC: World Bank.
Tokgoz, Simla, Prapti Bhandary, and Mark Rosegrant. 2012. “Forces Shaping Present and Future Agricultural Trade Trends in Latin America and the Caribbean: Alternative Scenarios.” International Food Policy Research Institute background paper prepared for Chaherli and Nash (forthcoming), Agricultural Exports from Latin America and the Caribbean: Harnessing Trade to Feed the World and Promote Development. Washington, DC: World Bank, Sustainable Development Department, Latin America and the Caribbean Regional Vice Presidency.

239 Trade Policy and Food Security • http://dx.doi.org/10.1596/978-1-4648-0305-5
Trade Policy and Food Security in Latin AmericaLessons Learned from Policy Responses to High Food Prices
Ekaterina Krivonos and Rogerio Da Paixao*
introduction
The level of world prices, as measured in nominal terms by the Food Price Index of the Food and Agriculture Organization (FAO) of the United Nations, doubled between 2005 and 2011. The Food Price Index increased by 25 percent in 2007 and by 26 percent in 2008. After a decline of 22 percent in 2009, prices increased by 18 percent in 2010 and by 23 percent in 2011, reaching a higher level than the previous peak in mid-2008. They remain well above the level of the 1995–2005 decade, and price volatility continues to be relatively high. Although large price spikes on world markets have occurred relatively infrequently in the past, there are many reasons to think that high and volatile prices are here to stay.
The adverse impact of high food prices on food security and poverty prompted policy responses in most developing countries in an attempt to reduce the cost of food and increase its availability for vulnerable populations. For many countries in Latin America and the Caribbean (LAC), the price increases for staple grains such as wheat, rice, and maize constitute a significant problem in terms of food security, and most policy interventions that have occurred in the region concern these crops. Although as a whole, the region has sufficient availability of food and its role as a net supplier in global markets has been reinforced in recent years, this has been primarily due to the expansion of production in a small number of countries. At the same time, the still insuffi-cient access to basic foods for those segments of the population that suffer from
c H A p t e r 1 0
* The views expressed here are those of the authors and do not represent official views of the Food and Agriculture Organization (FAO) of the United Nations or its member countries.

240 Trade Policy and Food Security in Latin America
Trade Policy and Food Security • http://dx.doi.org/10.1596/978-1-4648-0305-5
poverty and malnutrition remains evident, and any price increase of staples is immediately translated into a substantial loss of purchasing power for these groups. LAC is therefore a highly heterogeneous region, with a few large food exporters and many smaller net food-importing economies that have been negatively affected by food price increases.
This chapter discusses the effectiveness of the policy response to high food prices in addressing food security concerns, with special focus on trade policy in LAC countries. Apart from measures to boost production and expand cash transfer programs, export restrictions and the elimination of import tariffs have been the preferred policy instruments in attempts to address food secu-rity concerns in the region in recent years. The analysis in this chapter draws from an evaluation of policy responses presented in six country case studies. The next section describes the food security situation in LAC and the changes in domestic food prices in the region. The following section analyzes the per-formance of LAC’s agricultural trade during the period of high food prices and its role as a supplier of food in global markets. The next section summa-rizes the main policy measures adopted in the six countries in response to food price increases and is followed by the section that presents evidence on the evolution of the domestic prices of main staples in the same countries studied and discusses the implications of the changes in trade policy for con-sumer and producer prices. The final section draws conclusions from the case studies with regard to the possible relationship between food security and trade policies, focusing on the evolution of domestic food prices in response to policy changes, and discusses the pros and cons of different trade policy instruments.
Food prices and Food s ecurity in l atin America and the c aribbean
Sharp upswings in food prices have led to an overall reduction in the amount of food purchased by poor households and to a substitution effect in which poor consumers are replacing basic food staples with cheaper alternatives that do not always have the same nutritional value. Net food-importing countries, especially, experienced severe negative impacts of this new environment of high and vola-tile prices, in terms of both trade balances and food security, especially as prices of staple foods such as maize skyrocketed; net food exporters gained in aggregate. In the latter, higher prices led to greater export earnings and higher incomes and, in some cases, offered an opportunity to increase domestic production and sub-stitute imports.
The LAC region has sufficient availability of basic foods, and its contribution to international trade in products that are important to food security has been increasing. This trend is reflected in a positive and growing trade balance, which has also benefited from the increase in world food prices. The expansion in food production and exports has positive implications for the availability of food at the regional level because intraregional trade has increased and

Trade Policy and Food Security in Latin America 241
Trade Policy and Food Security • http://dx.doi.org/10.1596/978-1-4648-0305-5
contributed to growth in incomes in the agriculture and fisheries sectors, which in turn has had positive implications for food security. On the flip side, a large share of LAC’s population still suffers from insufficient access to food, and this situation has been exacerbated by high and volatile food prices. Plagued by persistent income inequalities, many LAC countries are still facing serious problems of poverty and hunger.
Domestic Price EvolutionIn general, developing countries’ domestic prices experience less volatility than do global prices because of imperfect price transmission that is affected by market structure and policy measures, although exceptions exist. In some cases, price spikes have been exacerbated by unfavorable local conditions that affect domestic supply.
In LAC, average food price inflation has been far below the increase in global food prices. Figure 10.1 shows the gross domestic product (GDP)–weighted average annual changes in food prices in a subset of countries (Argentina, Brazil, Colombia, Mexico, and República Bolivariana de Venezuela) for which informa-tion is available since 2005 (LAC5) and a larger group that comprises
Figure 10.1 Annual Food inflation in l atin America and the c aribbean, 2005–11
Source: Food and Agricultural Organization Regional Office for Latin America and the Caribbean based on official country data.Note: LAC5 is a gross domestic product–weighted average of food inflation (official data) in five countries: Argentina, Brazil, Colombia, Mexico, and República Bolivariana de Venezuela. LAC10 is the same with the addition of five more countries: Chile, Costa Rica, the Dominican Republic, Ecuador, and Peru.
0
2
4
6
8
10
12
14
16
18
2005/01
2005/07
2006/01
2006/07
2007/01
2007/07
2008/01
2008/07
2009/01
2009/07
2010/01
2010/07
2011/01
2011/07
2012/01
Perc
ent
Change relative to the same month of the previous year
LAC5 LAC10

242 Trade Policy and Food Security in Latin America
Trade Policy and Food Security • http://dx.doi.org/10.1596/978-1-4648-0305-5
10 countries (LAC10) for which inflation data are available since 2007. The two inflation time series are closely correlated because the largest economies in the region, such as Brazil and Mexico, are included in both groups.
The highest increases in domestic food prices were registered during the first spike in global prices in 2007–08 (figure 10.2). At the peak of international food prices in mid-2008, food inflation in LAC was about 15 percent, while the global Food Price Index registered annual record growth rates of above 50 percent. However, as world market prices decreased in the second half of 2008, and then again in the first half of 2012, the domestic prices in LAC did not actually decline. Food inflation decreased but did not drop below 4 percent. Since the end of 2010, annual food infla-tion in LAC has fluctuated very little, remaining in the range of 8 to 9 percent, unaffected by the large increase in global prices during 2011 or the subsequent decline during the first half of 2012, suggesting that although the policy measures in place could have stabilized domestic price increases, the changes in world prices have not transmitted to domestic mar-kets when global prices decline.
Figure 10.2 Annual Food inflation in l atin America and the c aribbean and Growth in the FAo Food price index, 2005–11
Source: Food and Agricultural Organization Regional Office for Latin America and the Caribbean based on official country data.Note: LAC5 is a GDP-weighted average of food inflation (official data) in five countries: Argentina, Brazil, Colombia, Mexico, and República Bolivariana de Venezuela. FAO = Food and Agriculture Organization of the United Nations; FPI = Food Price Index.
2005/01
2005/07
2006/01
2006/07
2007/01
2007/07
2008/01
2008/07
2009/01
2009/07
2010/01
2010/07
2011/01
2011/07
2012/01
–40
–30
–20
–10
0
10
20
30
40
50
60
Perc
ent
Change relative to the same month of the previous year
LAC5 FAO FPI

Trade Policy and Food Security in Latin America 243
Trade Policy and Food Security • http://dx.doi.org/10.1596/978-1-4648-0305-5
Food Security SituationThe recently improved undernourishment estimates from FAO suggest that progress in reducing hunger worldwide has been more pronounced than previ-ously known (FAO 2012b). Most of the progress, however, was achieved before 2007–08, and since then, global progress in reducing hunger has slowed and is starting to level off. Considerable differences in performance among regions per-sist, however, with Asia and LAC having made substantial progress in reducing their proportion of undernourished people and Africa lagging.
The number of undernourished people in LAC has decreased steadily from 65 million people in the early 1990s to 49 million during 2010–12 (figure 10.3). Over the same period, the proportion of its population that suffers from hunger declined from 13.6 percent to 7.7 percent, while globally the share fell from 18.6 percent to 12.5 percent.
Progress toward the elimination of hunger has been uneven across LAC coun-tries (figure 10.4). For example, whereas Nicaragua reduced its proportion of undernourished people from 55.1 percent to 20.1 percent, the share of people affected by hunger in Guatemala has increased from 16.2 percent to 30.4 percent. In Paraguay, the only other country in the region where an increase has been registered, the prevalence of undernourishment declined steadily from 19.7 percent in 1991 to 11.2 percent 2003, but then the trend reverted and by 2011 the share was more than double at 25.5 percent.
In sum, despite a decline in the undernourishment rates in the region on the whole, much remains to be done at the country level to achieve the target of
Figure 10.3 Undernourishment indicators for l atin America and the c aribbean
Source: FAO 2012b.
0
2
4
6
8
10
12
14
16
0
10
20
30
40
50
60
70
1990–92 1999–2001 2004–06 2007–09 2010–12
Perc
ent
Mill
ions
Number of people(left axis)
Proportion in total population(right axis)

244 Trade Policy and Food Security in Latin America
Trade Policy and Food Security • http://dx.doi.org/10.1596/978-1-4648-0305-5
reducing by half the proportion of people who suffer from hunger by 2015, as set out in the Millennium Development Goals.
evolution of Food and Agricultural t rade
The LAC region is a net exporter of food and agricultural products1 and main-tains a solid trade surplus in the sector. In 2011, the value of agrifood exports reached US$210 billion, 26 percent higher than in 2010. Imports, in contrast, were slightly more than one-third of that amount (US$81 billion), leaving a trade surplus in food and agricultural products of US$129 billion in that year (see figure 10.5).
The LAC region is characterized by a high degree of trade openness, and agricultural trade plays an important role both in ensuring adequate supply to domestic markets and as a source of export-led growth and incomes in the agri-cultural sector. The region experienced fast growth in both import and export values in the first food price spike during 2006–08, and although imports grew faster than exports, the trade balance in food and agricultural products increased. The largest increases in the value of trade have coincided with periods of rising world prices. During 2007 and 2008, imports recorded annual growth rates of 29 percent and 34 percent, respectively, growing more than exports. Later in 2009 when global trade shrank and prices dropped, food and agricultural imports
Figure 10.4 t he c hange in Undernourishment r ates between 1990–92 and 2010–12, by c ountry
Source: FAO 2012b.
–40
Dominican Republic
Nicaragua
PeruHaiti
Guyana
Panama
Honduras
Bolivia
Brazil
Colombia
Suriname
Ecuador
Trinidad and Tobago
EI Salvador
Paraguay
Guatemala
–30
–20
–10
0
10
20
Perc
ent

Trade Policy and Food Security in Latin America 245
Trade Policy and Food Security • http://dx.doi.org/10.1596/978-1-4648-0305-5
fell by 17 percent, followed by a recovery in 2010 and 2011. Exports followed a similar pattern: in 2007 and 2008, exports grew dynamically at 21 percent and 25 percent, respectively, driven by high world prices of the main LAC export products such as soy and sugar; dropped in 2009 (although less than imports); and registered a recovery of 15 percent and 26 percent in 2010 and 2011, respectively.
A depiction of the movements in the Food Price Index and the agrifood trade balance of LAC shows a correlation between these two variables, which is expected, because world prices are a major factor affecting the values of agricul-tural trade flows (see figure 10.6). Agrifood trade balances increase sharply dur-ing periods of rising prices because of a high concentration of exports in which the region maintains a solid trade surplus (sugar, bovine meat, soy, and soy oil) and where some of the highest price increases have been recorded in recent years.
The LAC region maintains a trade surplus not only in total agricultural and food products, but also in the group of products that can be considered basic foods because of their high share in the total caloric intake of the region. Cereals, meats, dairy, eggs, oil, and sugar account for over 80 percent of the diet of any country in LAC. Between 2006 and 2011, the region’s trade balance in all agri-food products almost doubled, but the trade balance in these basic foods increased by 122 percent, reflecting a rise in exports of many of the basic food commodities, especially by Brazil and Argentina.
The variation in international food prices has had different effects on different countries, depending on whether they are net importers or net exporters of food. Clearly, the largest gains from food price increases accrue to Mercosur (Southern Cone Common Market; Mercado Común del Sur) countries that are the most important exporters of agricultural products in the region. Argentina and Brazil are the largest agricultural producers and exporters and have gained from the recent food commodity boom. As net exporters of agricultural products, these countries experienced significant gains in their agricultural export revenues.
Figure 10.5 evolution of Food and Agricultural t rade in l atin America and the c aribbean, 2006–11, by value
Source: Food and Agricultural Organization Regional Office for Latin America and the Caribbean based on Global Trade Atlas data.
a. Value
US$
(bill
ion)
0
50
100
150
200
250
2006 2007 2008 2009 2010 2011
Trade balance Exports Imports
Perc
ent
b. Annual growth rate
–20
–10
0
10
20
30
40
2007 2008 2009 2010 2011
Exports Imports Trade balance

246 Trade Policy and Food Security in Latin America
Trade Policy and Food Security • http://dx.doi.org/10.1596/978-1-4648-0305-5
In contrast, some countries in Central America, Mexico, and especially República Bolivariana de Venezuela suffered significant deterioration in their agrifood trade balances during 2007 and 2008, being net importers of food products, especially cereals (see figure 10.7).
Agrifood exports of the region are highly concentrated in a few commodities.2 The top eight products account for almost half the value of all agrifood exports from the region. Products derived from soy cultivation (bean, cake, and oil) accounted for 22 percent of total agrifood exports between 2005 and 2011. Other traditional products that generate large export earnings are sugar and coffee. Bovine meat is a product that has been gaining importance, increasing its share in total agrifood exports from 3.5 percent in the 2000–04 period to 5.2 percent in 2005–11.
On a global scale, the region contributes significantly to the supply of oilseeds, oils, sugar, corn, wheat, and bovine meat. Cereal exports from the region have grown much more than production, tripling in volume from 1990 to 2010. The share of the region in the global volume of production of cereals increased from 6.3 percent during 1990–99 to 7.5 percent during 2000–09, mainly because of the rapid expansion in Brazil. In 2011, this share reached a historical high of 8.2 percent. The contribution of LAC to global imports of cereals increased from an average of 14.9 percent in 1990–99 to 17.8 percent in 2000–09, while its share in world exports grew from an average of 8.0 percent to 12.4 percent (see figure 10.8).
Figure 10.6 evolution of the t rade Balance in Basic Foods and total Food and Agricultural products in l atin America and the c aribbean, 2006–11, by value
Sources: Food and Agricultural Organization (FAO) Regional Office for Latin America and the Caribbean, based on Global Trade Atlas data and FAO Food Price Index.Note: The agrifood sector is defined as the aggregate of all product lines in chapters 1 through 24 of the Harmonized System (HS). Basic foods are the products that are considered in the FAO’s Food Price Index: meat (chapter 2 of HS), dairy and eggs (chapter 4 of HS), cereals (chapter 10 of HS), fats and oils (chapter 15 of HS), and sugar (chapter 17 of HS).
0
50
100
150
200
250
0
5
10
15
20
25
30
35
2006 2007 2008 2009 2010 2011
Trade balance in basic foods (US$, billion) (left axis)FAO Food Price Index, 2002–04 = 100 (right axis)
Trade balance in agrifood (US$, billion) (left axis)FAO Food Price Index, 2002–04 = 100 (right axis)
a. Basic foods
0
50
100
150
200
250
0
20
40
60
80
100
120
140
2006 2007 2008 2009 2010 2011
b. Agrifood

Trade Policy and Food Security in Latin America 247
Trade Policy and Food Security • http://dx.doi.org/10.1596/978-1-4648-0305-5
Figure 10.7 FAo Food price index and Agrifood t rade Balance in s elected c ountries
Sources: Food and Agricultural Organization (FAO) Regional Office for Latin America and the Caribbean, based on Global Trade Atlas data and FAO Food Price Index.Note: FAO = Food and Agriculture Organization of the United Nations; FPI = Food Price Index; Mercosur = Southern Cone Common Market; TB = trade balance.
0
50
100
150
200
250
0
20,000
40,000
60,000
80,000
100,000
120,000
a. Mercosur140,000
2004 2005 2006 2007 2008 2009 2010 2011 2004 2005 2006 2007 2008 2009 2010 2011
Mercosur agrifood TB (left axis)
FAO FPI (right axis)
b. Mexico and República Bolivariana de Venezuela
0
50
100
150
200
250
–10,000
–9,000
–8,000
–7,000
–6,000
–5,000
–4,000
–3,000
–2,000
–1,000
0
Mexico agrifood TB (left axis)Venezuela agrifood TB (left axis)
FAO FPI (right axis)
Figure 10.8 share of l atin America and the c aribbean in Global production and t rade of c ereals, 1990–2012
Source: Food Outlook, various issues, Food and Agricultural Organization (http://www.fao.org/giews/english /fo/index.htm).
0
5
10
15
20
25
1990–91
1993–94
1996–97
1999–2000
2002–03
2005–06
2008–09
2011–12
Perc
ent (
by v
olum
e)
ProductionImports Exports
Among cereals, maize is the crop that registered most growth in terms of production: the region increased its global share from 10.3 percent in 1990 to 14.6 percent in 2008, declining slightly thereafter. In 2011, the region’s contribu-tion to global production and to exports was 13 percent and 25 percent, respec-tively (figure 10.9). Most maize exports originate from Argentina (14.1 percent

248 Trade Policy and Food Security in Latin America
Trade Policy and Food Security • http://dx.doi.org/10.1596/978-1-4648-0305-5
of world exports in 2011) and Brazil (9.4 percent of world exports). Argentina produces only between 2 percent and 3 percent of the global maize output, but because top producers such as the United States, China, and Brazil use most of their output to supply domestic markets, they have relatively small quantities for export, thus making Argentina an important player in global markets. The cases of wheat and rice are similar. Although regional production levels are not high relative to global production, the region is a significant exporter of these prod-ucts, contributing 9.1 percent to global wheat exports and 7.7 percent for rice in 2011. However, the region’s most significant role is in the markets for sugar, oilseeds, and bovine meat, where its share in global exports by volume is 58.1 percent, 46.9 percent, and 30 percent, respectively, and is highly concen-trated in Brazil and Argentina as origin countries.
Most countries in the LAC region also depend on imports to satisfy their domestic demand for cereals for human consumption. With the exception of the Mercosur countries and Chile, all countries in the region import most of the wheat that they consume (see table 10.1). Central American and Caribbean countries rely heavily on both maize and rice imports. In these countries, the rise in global food prices has strongly affected their food import bills.
In summary, LAC countries, especially in the Southern Cone, have the capacity to produce sufficient levels of basic foods (although not cereals alone), and the region has increased its contribution to global supply in prod-ucts that are vital for food security, such as cereals, oil, bovine meat, and sugar. Despite adequate supplies, access to food remains limited for a large share of the low-income population, thus threatening food security. High poverty levels combined with high and volatile food prices have resulted in dimin-ished real incomes.
Figure 10.9 share of l atin America and the c aribbean in Global production and t rade of s elected products, 2011
Source: Food Outlook, various issues, Food and Agricultural Organization (http://www.fao.org/giews/english /fo/index.htm)
0
10
20
30
40
50
60
Wheat Maize Rice Sugar Bovinemeat
Dairy Oilseeds
Perc
ent (
by v
olum
e)
Production Imports Exports

Trade Policy and Food Security in Latin America 249
Trade Policy and Food Security • http://dx.doi.org/10.1596/978-1-4648-0305-5
policy r esponses to High Food prices
The increase in food prices in 2006–08 and the consequent adverse implications for vulnerable segments of populations, in particular for those countries that depend heavily on food imports, has placed food security atop the political agenda in LAC, prompting policy responses to mitigate the negative effects of high prices on poverty and hunger. Most countries adopted measures in an attempt either to influence domestic prices directly through border measures and price controls or, more commonly, to create incentives for increasing domes-tic supply and boosting social protection measures. Few of these policies were introduced as completely new interventions. Typically, they were built upon existing policy frameworks and simply expanded coverage.
The majority of countries adopted measures to stimulate production by pro-viding greater access to credit or inputs or both. Other common measures included temporary reductions in import tariffs and the provision of safety nets, including cash transfers and food distribution. Table 10.2 summarizes the border measures implemented in LAC during 2008–10. They included reduction or elimination of import tariffs and quotas; increases in export taxes; imposition of export quotas or other controls, including export bans; and government-to- government trade (Valdés and Foster 2010).
Many countries, including Bolivia, Brazil, Ecuador, El Salvador, Guatemala, Honduras, Mexico, and Nicaragua, have lowered their import tariffs for food at one point or another since 2006, while Argentina, Bolivia, Honduras, and Ecuador
t able 10.1 t he r atio between volumes of net exports and Food c onsumption for Wheat, r ice, and maize, 2011–12Percent
Country or region Wheat Rice Maize
Argentina 187 139 4,564Bolivia −83 4 −12Brazil −58 −4 200Chile −31 −60 −515Colombia −105 −3 −172Cuba −125 −67 −238Ecuador −100 3 −223Mexico −65 −88 −55Nicaragua −98 −25 −33Panama −102 −35 −437Paraguay 119 211 443Peru −101 −11 −324Uruguay 278 3,500 −102Venezuela, RB −98 −41 −124Latin America and the Caribbean −28 −7 1
Source: Food Outlook, various issues, Food and Agriculture Organization, http://www.fao.org/giews/english / fo/index.htm.

250 Trade Policy and Food Security in Latin America
Trade Policy and Food Security • http://dx.doi.org/10.1596/978-1-4648-0305-5
introduced export restrictions. Border measures were particularly attractive for policy makers because they represented a quick option for containing the nega-tive effects of global price increases on domestic consumers. Moreover, export taxes were also seen as measures to boost fiscal revenues, especially for those countries that faced current account difficulties as a result of increases in their imports and the global recession triggered by the financial crisis in 2008.
The approaches taken by different countries regarding trade policy measures depended to a large extent on each country’s political and institutional environ-ment and net agricultural trade position. The set of instruments chosen for influ-encing domestic prices depended mainly on whether the country was a net importer or a net exporter of the products that are most widely consumed in each country. The policy measures were typically concentrated in products that weighed most in the basic consumption basket and in those situations where the negative effects of fluctuating world market prices were felt most strongly in terms of food security. The measures were also determined by the country’s dependence on agricultural income and the composition of the export basket.
c ountry c ase studies: policy r esponses to the increase in Food prices
This section discusses the results of six case studies that were conducted during 2011 to better understand the characteristics and outcomes of the policy responses to the 2006–08 international food price spike summarized previously. As discussed earlier, the policy responses varied greatly, depending on a country’s competitiveness in food production, priority given to food security, existing poli-cies and programs (especially social programs), and political environment.
t able 10.2 implementation of t rade-r elated policies in s elected l atin American and c aribbean c ountries as a r esult of the 2006–08 Food price spike
CountryReduction or elimination
of import tariff and quotaRaising of
export taxesExport quota
or controlExport
ban
Argentina X XBolivia X X XBrazil X XChileCubaDominican RepublicEcuador X XEl Salvador XGuatemala XHaitiHonduras X XMexico XNicaragua XPeru
Source: Valdés and Foster 2010.

Trade Policy and Food Security in Latin America 251
Trade Policy and Food Security • http://dx.doi.org/10.1596/978-1-4648-0305-5
ArgentinaFollowing a sovereign debt default in 2002, Argentina gradually increased taxation to raise fiscal revenues. As part of this process, export taxes were introduced in agriculture following a decade of open export policies (Nogués 2014). Export taxes in selected agricultural products increased considerably from 2002 to 2008, and especially as food prices increased worldwide (table 10.3). With the exception of bovine meat, where the tax level remained stable, taxes have increased substan-tially, especially for soybeans and sunflowers. Most notably, the increases in export taxes during 2008 occurred because of the introduction of a new variable export tax by the Ministry of Economy (ME). The new rates varied according to changes in international prices. The new tax was not received well by producers, who started a series of protests in several cities, and after four months the variable export taxes were abandoned and taxes returned to the previous fixed rates.
Figure 10.10 shows the monthly series of average export tax rates since 2001 for maize, soybeans, and wheat. The months when export tax rates reached their
t able 10.3 Argentine export t axes, 2002–07
Resolution Issue date Sunflowers (%) Soybeans (%) Wheat (%) Maize (%) Bovine meat (%)
ME 11 02 March 2002 13.5 13.5 10.0 10.0 15.0ME 35 02 April 2002 23.5 23.5 20.0 20.0 15.0ME 10 2007 January 2007 23.5 27.5 20.0 20.0 15.0ME 368 2007 November 2007 32.0 35.0 28.0 25.0 15.0ME 125 2008 (1) March 2008 41.0 41.4 33.0 24.4 15.0ME 64 2008 June 2008 41.0 46.0 33.0 31.4 15.0ME 80, 81, and 82 2008 July 2008 32.0 35.0 28.0 25.0 15.0ME 26 2008 December 2008 32.0 35.0 23.0 20.0 15.0
Source: Nogués 2014.
Figure 10.10 monthly Average export t ax r ates in Argentina, January 2001–January 2011
Source: Nogués 2014.
00.050.100.15
Perc
ent
0.200.250.300.350.400.450.50
Jan-01
Jan-02
Jan-03
Jan-04
Jan-05
Jan-06
Jan-07
Jan-08
Jan-09
Jan-10
Jan-11
MaizeSoybean Wheat

252 Trade Policy and Food Security in Latin America
Trade Policy and Food Security • http://dx.doi.org/10.1596/978-1-4648-0305-5
peak values during the first global food price spike were June and July 2008. Peak international prices coincided with peak tax rates. However, since then export tax rates have remained stable for these products. One important feature of the export taxes is that they are marked by tax escalation that benefits proces-sors to the detriment of primary producers: the export tax on wheat is much higher than that on processed products such as pasta.
Export bans and quotas were also implemented for bovine meat and wheat as world prices increased and then were expanded to other products such as maize. Export quotas are set at the beginning of the crop season and are often revised depending on production prospects, with the view to guaranteeing domestic sup-plies before allowing more exports.
The government has also granted subsidies to food processors to combat increasing domestic food costs. Initially, subsidies were introduced in early 2007 for wheat and maize mills, and thereafter the program was expanded to include other food products in an attempt to stabilize retail food prices. A substantial part of the payments was directed to wheat mills and bovine meat producers, because bovine meat and products based on wheat are the most important product groups consumed in Argentina.
BrazilSince 2003, Brazil has applied a comprehensive set of policies targeting food security that together with other measures have resulted in a substantial fall in poverty and inequality levels. Brazil maintains an open trade regime in agriculture and does not tax agricultural imports or exports, with the exception of wheat when a differentiated import tariff is applied to imports from Mercosur and from the rest of the world (Ferreira Filho and Vian 2014). The only trade measure adopted in response to rising food prices was the temporary elimination of the Common External Tariff (CET) for wheat imported from outside Mercosur in 2008, caused by disruptions in the supply of wheat from Argentina. Furthermore, policy response focused on strengthening rural credit programs, especially for smallholder farmers, and increasing the distribution of food, building upon the existing social programs. Additionally, conditional cash transfers in the Bolsa Família program were expanded to cover more than 13 million people.3
Brazil has also strengthened and expanded its Food Acquisition Program (Programa de Aquisição de Alimentos, or PAA), which purchases food from family farms. The food purchased through PAA is used partly for building up strategic reserves and partly for food security programs, such as school feeding, soup kitchens, and the food baskets distributed by the government to the most vulnerable segments of the population. The price, although set by the authorities, is constantly revised to reflect the prices in local markets. Another Brazilian program is the National School Feeding Program (Programa Nacional de Alimentação Escolar, or PNAE), which provides at least one meal a day for students in the public education system, reaching one-quarter of the Brazilian population. Brazilian law requires that at least 30 percent of the food procure-ment bill of PNAE is spent on food purchased directly from family farmers.

Trade Policy and Food Security in Latin America 253
Trade Policy and Food Security • http://dx.doi.org/10.1596/978-1-4648-0305-5
The Dominican RepublicTo counteract the negative effects of rising food prices on consumers in the Dominican Republic, the government distributed food bundles to poor families enrolled in social programs, provided school lunches, and provided direct cash transfers, expanding the number of beneficiaries in these programs (Quezada 2014). All these measures were in place before the spike in food prices. To foster food production, the government has also provided support to farmers, mainly for staple crops such as rice and beans. The support consisted of subsidized cred-its, extension services, distribution of free planting materials, marketing support, and cash rebate payments toward the adoption of modern technologies. The majority of support programs existed before 2006–08.
The government has continued with interventions in the rice sector with a combination of a guaranteed price to farmers, which is negotiated at the begin-ning of the growing season on the basis of estimated production costs, and import restrictions, which effectively provide price support as well as price stabilization. In particular, a guaranteed price to producers set in connection with a warehouse receipt system has been a key mechanism in keeping rice prices stable. In this way, domestic prices for rice have been insulated from international prices, gener-ally staying well above the world market price. In recent years, substantial levels of rice stocks have been accumulated in the Dominican Republic because of these policy measures. Even during the periods of world price increases, the minimum price paid to producers was adjusted upward, ostensibly to reflect increases in costs of production, mainly from imported fuels and inputs.
EcuadorIn Ecuador, price stabilization was pursued as the official objective of the policy mix applied in response to rising food prices. An array of new measures was implemented that focused on trade, price controls, farm subsidies, and other production incentives (Wong 2014). Trade policy interventions involved bans on exports for products for which Ecuador is a net exporter (for example, rice) and tariff reduction or elimination for commodities for which Ecuador has low domestic production and is a net importer (for example, wheat and wheat flour). The ban on rice exports was first introduced in September 2007 for a period of 90 days. It was extended for another 90 days in January 2008, and a series of “temporary” export bans followed. Finally, an executive decree made the ban on exports of rice a lasting policy that sought to regulate the domestic rice market by establishing a strategic reserve. Maize exports were also banned starting in August 2007, although up to that point Ecuador exported only small quantities of maize and just to Colombia.
The prohibition of rice exports in the context of rising world prices was hard to enforce. Rice smuggling to neighboring countries was reported. In response, the government tried to establish mechanisms at the border to avoid or reduce rice smuggling in the provinces neighboring Colombia and Peru, including the distri-bution of quotas of rice to each border province (Wong 2014). For maize, this did not occur because Ecuador’s domestic prices remained higher than world prices.

254 Trade Policy and Food Security in Latin America
Trade Policy and Food Security • http://dx.doi.org/10.1596/978-1-4648-0305-5
Because the export ban for rice put downward pressure on the domestic price, the reaction from small farmers was to ask the government to step in to guaran-tee prices that would be sufficient to cover their costs. In response, the govern-ment did establish support prices and eventually lifted the rice export ban. Support prices for maize were also put in place.
Moreover, the government began purchasing rice directly from farmers, paying them a set minimum “fair” price for rice and using the purchased rice to develop a strategic food reserve. This strategy led to accumulation of stocks that required public investments in storage facilities. Ecuador created the national grain storage institution in September 2007 (Unidad Nacional de Almacenamiento) to sell cereals and manage its grain stock.
To avoid support prices being translated into higher prices paid by consumers, the government, through agreements with supermarkets, introduced maximum consumer prices on some products, including pasta, bread, vegetable oils, milk, oats, sugar, tuna, and poultry, effectively imposing a price band. The price band was supported by government subsidies. A fund was established to pay, for example, wheat flour producers a price differential with the objective of stabiliz-ing prices to both producers and consumers. The government also established maximum prices for wheat flour that was sold to bakeries.
Tariffs on wheat and wheat products were eliminated, starting September 2007. Prior to that, wheat and wheat flour imports faced an ad valorem tariff of 10 percent and 20 percent, respectively.
MexicoIn 2008, the government of Mexico announced a series of measures in response to the increase in food prices. Three main goals were set: first, to facilitate supply and access to food at international prices; second, to encourage domestic food production and increase farm productivity; and third, to provide support to poor households’ incomes. To achieve these goals, Mexico relied on both existing poli-cies and programs and new measures designed specifically to influence price formation in domestic value chains, in particular in the maize sector.
On the trade policy side, import tariffs were lowered on many basic food products, such as wheat, maize, rice, sorghum, and soybeans, as well as fertilizers and chemical inputs. In an attempt to maintain stable prices on tortillas, the main staple in Mexico made of white maize, in 2007 the government negotiated a Tortilla Price Stabilization Pact with the main tortilla producers for a ceiling price to consumers. In addition, a price freeze agreement was signed with various producers’ associations and supermarkets to maintain the price to consumers on 150 final goods. The list included flour, preserves, sauces, canned chilies, cooking oil, beans, and some beverages. The agreement was implemented in June 2008 and lasted until the end of that year. Moreover, the government continued operating Diconsa—a network of retail stores in low-income areas with fixed prices on food products.
To prevent domestic maize shortages, the government decided to buy maize in 2008 to distribute to the vulnerable population until domestic production was

Trade Policy and Food Security in Latin America 255
Trade Policy and Food Security • http://dx.doi.org/10.1596/978-1-4648-0305-5
able to increase its supply the following year. On the production side, the bud-get for the Secretary of Agriculture, Livestock, Rural Development, Fisheries, and Food (Secretaría de Agricultura, Ganadería, Desarrollo Rural, Pesca, y Alimentación, or SAGARPA) was increased to expand its financial support to the rural sector to provide more credit and insurance. Soon after, the Credi Fertiliza program was established to finance the acquisition of fertilizers at dis-count prices to small producers. Finally, the ASERCA4 program modified its main function, going from being an income-support type of policy to providing subsi-dies to farmers and buyers to participate in options trading to manage price risks.
NicaraguaFollowing the increases in food prices during 2006–08, the government of Nicaragua implemented a number of measures seeking to boost the domestic sup-ply of food, which included import tariff reductions and incentives for agricultural producers. Tariffs on the main food products and agricultural inputs imported from outside Central America were temporally reduced, from 10–15 percent to zero (Rivera 2014). With regard to social programs, the policy response was to provide monthly food supplies to poorer households in rural areas and to children through a school feeding program. Producers received production incentives in the form of seeds and other inputs, technical assistance, and credit.
Food price controls were implemented through direct government purchasing and distribution. The state trading enterprise, Nicaraguan Basic Food Company (Empresa Nicaragüanese de Alimentos Básicos, or ENABAS), that had stopped operations was reopened in 2007 so it could channel government interventions in the agricultural sector to control food price increases and promote fair com-petition among farmers, wholesalers, and retailers (Rivera 2014). The company made investments in storage infrastructure, processing facilities, vehicles, and machinery. Since 2008, ENABAS has been responsible for the promotion of production, storage, and distribution of basic grains (rice, maize, beans, and sorghum). It also acts as an intermediary in the trading of basic food items such as pasta, cooking oil, sugar, wheat flour, and soybean products. ENABAS runs a network of wholesale distribution posts and retail sales points throughout the country. In 2010, it managed 78 storage centers and more than 3,000 retail stores. Through ENABAS, basic grains and other food products are purchased, stored, and distributed, and small farmers obtain minimum guaranteed prices for the produce they sell.
effects of the t rade policy measures on c onsumer prices for main Food staples
As reviewed in the previous sections, LAC countries took several measures to ease the negative effects of rising food prices on both poor consumers and pro-ducers. Trade policy measures were often the preferred instrument of choice. However, attributing all of the changes in domestic food prices that followed, positive as well as negative, to these interventions is difficult, if not impossible,

256 Trade Policy and Food Security in Latin America
Trade Policy and Food Security • http://dx.doi.org/10.1596/978-1-4648-0305-5
because the relationship between world and domestic prices is driven by many other factors, including exchange rates, domestic support to agriculture, composi-tion of the value chain, and market structure as well as elasticities of demand and supply. Moreover, in some cases, especially in Mexico, the negative effects of the international financial crisis demanded government action to mitigate the risks to poverty, and these two sets of policy measures are not easily distinguishable.
ArgentinaThe performance of consumer prices in Argentina has been uneven throughout the period of the first global price spike, with bovine meat prices stable through-out 2006–09 but prices of wheat-based products increasing. Between 2005 and 2008, bread and wheat flour prices increased by 93 percent and 166 percent,5 respectively. Moreover, as figure 10.11 shows, after 2008 the ratio between con-sumer prices (for wheat-based products) and wheat producer prices increased substantially. The figure shows that while export restrictions and wheat subsidies have been exercising downward pressure on wheat producer prices, consumer prices in general for those products that use wheat as an input have increased. One possible explanation is that the growth in the costs of other inputs such as rent and labor used in the production of bread and other wheat-based products has had a stronger effect on final prices than the policies implemented to keep raw wheat input prices low.
The elimination of trade restrictions could therefore have unequal effects on producers and consumers. Nogués (2014) calculates that the elimination of
Figure 10.11 Wheat producer prices and c onsumer prices of Wheat-Based products (Bread and c rackers) and packaged Wheat Flour in Argentina, 2005–January 2011
Source: Nogués 2014.Note: Consumer prices are the prices in Buenos Aires collected by SEL Consultores.
0
50
100
150
200
250
300
350
400
450
500
2005
Jan-08
Apr-08
Jul-0
8
Oct-08
Jan-09
Apr-09
Jul-0
9
Oct-09
Jan-10
Apr-10
Jul-1
0
Oct-10
Jan-11
Pric
e in
dex
(200
5 =
100)
Wheat producer price
Consumer price of wheat-based products
Consumer price of wheat flour

Trade Policy and Food Security in Latin America 257
Trade Policy and Food Security • http://dx.doi.org/10.1596/978-1-4648-0305-5
export taxes and quotas would increase the domestic price of wheat by 30 percent and 25 percent, respectively. Moreover, given the high incidence of wheat in the costs faced by mills, the cost of flour would increase by 16 percent and 12 percent if export taxes and quotas, respectively, were eliminated and by 36 percent if both export taxes and quotas were dismantled. Abolishing both measures would also increase the price of bread by 7.2 percent.
Maize is mostly used for ethanol production and as animal feed, and therefore the policies to keep domestic maize prices low have mainly targeted the reduc-tion of consumer prices of bovine meat. From 2005 to 2008, producer prices for maize increased at a faster pace than consumer prices for maize flour, but after that period, both moved in sync (figure 10.12).
Although the increases in producer prices of wheat remained contained by export restrictions, resulting in lower profitability of the crop, the prices received by farmers for soy and maize continued to grow, resulting in some reallocation of land toward these crops. Figure 10.13 shows the evolution of planted area for these three commodities. Whereas the area dedicated to wheat shrank by 29 percent from 2000–01 to 2010–11, the area for soy expanded by 77 percent, also reflecting the expansion in total cultivated area. The area planted with wheat is anticipated to decline further by 18 percent between 2011–12 and 2012–12, mainly as a result of diversion of land into more profit-able crops (FAO 2012a).
Meat prices to both consumers and producers increased between 2005 and 2007, but have shown relative price stability between 2007 and 2009, indicating
Figure 10.12 maize producer prices and c onsumer prices of maize Flour in Argentina, 2005–o ctober 2010
Source: Nogués 2014.
0
50
100
2005
Feb-08
Jun-08
Oct-08
Feb-09
Jun-09
Oct-09
Feb-10
Jun-10
Oct-10
150
200
250
300
350
400
450
Pric
e in
dex
(200
5 =
100)
Consumer prices of maize flourProducer prices of maize

258 Trade Policy and Food Security in Latin America
Trade Policy and Food Security • http://dx.doi.org/10.1596/978-1-4648-0305-5
that initial government actions were successful in containing the price spike ( figure 10.14). Rapid increases took place during 2010 in both consumer and producer prices, most likely explained by the depletion of cattle stocks.
One can conclude that export restrictions did manage to stabilize bovine meat prices to consumers initially, but eventually the increase in world prices trickled down to the domestic market. In the case of wheat, consumer prices increased steadily, while producer prices were contained by the continued quantitative restrictions on exports. These were opposed by farmers who claimed that the trade measures put in place lacked predictability, which in turn undermined their ability to plan ahead and make productive investments.
A second point to consider is the efficiency of export restrictions as measures to promote food security relative to other possible measures. For the mix between export taxes and quotas, Nogués (2014) argues that quantitative restric-tions should never be the first choice of policy instrument because they do not produce fiscal revenues, their administration is rather cumbersome, and they trigger rent-seeking activities and welfare losses that exceed losses from equiva-lent export taxes.
BrazilIn Brazil, the domestic prices of maize, rice, and wheat when measured in U.S. dollars have followed closely the evolution of international prices, because no
Figure 10.13 planted Area of Wheat, maize, and s oy in Argentina, 2000–11
Source: Based on data from Sistema Integrado de Información Agropecuaria, http://www.siia.gov.ar/index .php/series-por-tema/agricultura.
0
2000/01
2001/02
2002/03
2003/04
2004/05
2005/06
2006/07
2007/08
2008/09
2009/10
2010/11
2011/12
2
4
6
8
10
12
14
16
18
20
Hec
tare
s (m
illio
n)
Wheat MaizeSoy

Trade Policy and Food Security in Latin America 259
Trade Policy and Food Security • http://dx.doi.org/10.1596/978-1-4648-0305-5
trade restrictions or price stabilization schemes have been put in place. In other words, Brazil has near full price transmission to the domestic market ( figure 10.15). However, the strong exchange rate appreciation faced by the Brazilian currency between 2002 and 2008 (by 37.2 percent) helped cushion the effect of increas-ing world prices for imported food products.
Rather than introducing measures to stabilize domestic prices, the Brazilian government relied on social transfers to deal with the erosion of purchasing power, coupled with a solid system in support of family farming, including institutionalized prices and government purchases. This strategy has in gen-eral produced very positive results in terms of poverty reduction and food security, but an evaluation of these programs extends beyond the scope of this chapter.
The Dominican RepublicRice is the main food staple in the Dominican Republic, and the sector is charac-terized by a long history of government support to producers. The price support scheme and import restrictions have resulted in higher prices faced by consumers than the prices paid in the United States, the major exporter of rice to the Dominican Republic. As prices for U.S. paddy rice declined starting in mid-2008, in the Dominican Republic they remained high. In the United States, the farm-gate paddy price for the 2009–10 marketing year was US$284 per metric ton, much lower than the price of US$450 per metric ton established in the Dominican Republic rice program in that year (Quezada 2014; see figure 10.16).
Figure 10.14 producer and c onsumer prices of Bovine meat c uts in Argentina, 2005–o ctober 2010
Source: Nogués 2014.
0
50
100
2005
Feb-08
Jun-08
Oct-08
Feb-09
Jun-09
Oct-09
Feb-10
Jun-10
Oct-10
150
200
250
300
350
400
450
Pric
e in
dex
(200
5 =
100)
Consumer price (weighted average) Producer price

260 Trade Policy and Food Security in Latin America
Trade Policy and Food Security • http://dx.doi.org/10.1596/978-1-4648-0305-5
Figure 10.15 World prices and Domestic producer prices for maize, r ice, and Wheat in Brazil, 2002–09
Source: Ferreira Filho and Vian 2014.
0
50
100
150
200
250
300
Pric
e in
dex
(200
0 =
100)
c. Wheat
Correlation coefficient = 0.98
Brazil (US$) World (US$)
0
100
200
300
Pric
e in
dex
(200
0 =
100)
b. Maize
Correlation coefficient = 0.95
2000 2001 2002 2003 2004 2005 2006 2007 2008 2009
2000 2001 2002 2003 2004 2005 2006 2007 2008 2009
2000 2001 2002 2003 2004 2005 2006 2007 2008 2009
0
100
200
300
400Pr
ice
inde
x (2
000
= 10
0)
a. Rice
Correlation coefficient = 0.95

Trade Policy and Food Security in Latin America 261
Trade Policy and Food Security • http://dx.doi.org/10.1596/978-1-4648-0305-5
The government interventions in support of farm-gate rice prices allowed producers to bear the increasing costs of production during the period of sharp rises in international prices of oil and agricultural inputs. However, the imple-mentation of the Dominican Republic–Central America–United States Free Trade Agreement and the European Union–CARIFORUM (Forum of the Caribbean Group of African, Caribbean and Pacific States) Association Agreement will gradually open the Dominican market to rice imports, threatening the com-petitiveness of the Dominican producers but bringing benefits to consumers who will face lower prices. In these conditions, price support will become unsustain-able and the government may have to reorient fiscal expenditures to other types of support, such as direct income transfers to producers, as well as measures to boost the competitiveness of the Dominican rice sector, such as encouraging technology transfer and irrigation.
EcuadorDomestic rice prices in Ecuador did not experience the extreme volatility wit-nessed on world rice markets between 2007 and 2009. Rice prices (wholesale, consumer, and producer) did increase in 2007 and in the beginning of 2008, but reached a plateau later in 2008, although world prices continued to increase for several more months. In 2008, most government interventions took place within the context of a combined policy of price controls and public purchases in the rice sector in response to world price increases. In the case of both rice and maize, the difference between the wholesale price and the producer price was
Figure 10.16 producer prices in the Dominican r epublic and the United states, January 2007–november 2009
Source: Quezada 2014.
200
250
300
350
400
450
500
550
Jan-07
Mar-07
May-07Ju
l-07
Sep-07
Nov-07
Jan-08
Mar-08
May-08Ju
l-08
Sep-08
Nov-08
Jan-09
Mar-09
May-09Ju
l-09
Sep-09
Nov-09
U.S
.$ p
er m
etri
c to
n
DO floor price U.S. farm long grain

262 Trade Policy and Food Security in Latin America
Trade Policy and Food Security • http://dx.doi.org/10.1596/978-1-4648-0305-5
increasing (even in real terms) for some time, which points to higher benefits accruing to the wholesalers during the period (Wong 2014).
Despite a package of policy measures implemented, consumer prices of wheat flour, maize, and other products increased rapidly from mid-2007 to mid-2008 and have been at a high level since then, without registering price falls that occurred in global markets in the second half of 2009 (see figure 10.17). This result is explained in part by a highly concentrated market with few traders and importers. Those who appeared to benefit most from these measures were the wholesalers and farmers, especially when minimum prices to producers were established and the government began direct purchases from producers.
MexicoMexico’s reaction to high food prices focused on expanding existing safety nets for poor consumers. The main social programs (Oportunidades and Programa de Empleo Temporal) have the capacity to quickly reach at least 63 percent and 80 percent of the first and second quintile, respectively, of the poorest inhabit-ants of Mexico. The cash transfers received by the poorest households between 2006 and 2008 covered about 32 percent of the increase in the total cost of the food basket in rural areas and 23 percent in urban areas, diminishing the impact of food price increases. The low-income population also benefited from lower-than-market food prices in Diconsa’s distribution chain and from the tortilla price agreements. However, the only polices that could potentially have affected consumer prices directly are the reductions in import tariffs and the price agree-ments established with processing companies and supermarkets.
Figure 10.18 illustrates the evolution of domestic and international prices for maize, maize flour, and tortillas. The figure shows that the domestic maize prices did not increase as much as the international prices during 2007–08. Besides, the retail price of maize started to increase substantially after April 2009, whereas the price of tortillas increased steadily over the whole period, but by much less. Similar patterns can be found in the other two products (beans and rice) ana-lyzed by Soloaga (2014). This finding suggests the measures taken did manage to keep the prices of those products in check.
NicaraguaIn Nicaragua, on the one hand, government interventions brought benefits to producers as well as modest improvements in income and consumption and a reduction of poverty rates, particularly in rural areas. On the other hand, food prices faced by consumers remained high, even during periods of decline in world prices. Prices of rice and red beans more than doubled during 2008, while prices of the main maize products such as tortillas and pinolillo (maize drink powder) grew by 50 percent (figure 10.19). Rice, maize, and red bean prices stabilized in 2008 but remained substantially above 2006 levels. Negative pro-duction shocks (droughts in particular) caused a pronounced peak in black bean prices at the end of 2010. Nicaraguan wholesale rice prices have historically been above international prices. During the peak of world prices in 2008, domestic

263
Figure 10.17 c onsumer price index for s elected c ommodities in ecuador, 2007–11
Source: Wong 2014.
50
70
90
110
130
150
170
190
210
Jan-07
Feb-07Mar-0
7Apr-0
7May-07
Jun-07Ju
l-07
Aug-07Sep-07Oct-
07Nov-07Dec-0
7Ja
n-08Feb-08Mar-0
8Apr-0
8May-08
Jun-08Ju
l-08
Aug-08Sep-08
Oct-08
Nov-08Dec-0
8Ja
n-09Feb-09Mar-0
9Apr-0
9May-09
Jun-09Ju
l-09
Aug-09Sep-09Oct-
09Nov-09Dec-0
9Ja
n-10Feb-10Mar-1
0Apr-1
0May-10
Jun-10Ju
l-10
Aug-10Sep-10Oct-
10Nov-10Dec-1
0Ja
n-11Feb-11Mar-1
1Apr-1
1May-11
Jun-11Ju
l-11
Aug-11Sep-11
Oct-11
Nov-11Dec-1
1
Pric
e in
dex
(200
4 =
100)
GeneralFood RiceMaize Wheat flour

264 Trade Policy and Food Security in Latin America
Trade Policy and Food Security • http://dx.doi.org/10.1596/978-1-4648-0305-5
prices did not increase as much as world prices, and consequently the two series converged briefly. As world prices declined after 2008, domestic prices remained relatively high.
The domestic wholesale price of rice is insulated from the world market price by high tariffs on rice imports and the pricing system under the Programa de Apoyo al Productor Arrocero, which establishes relatively high minimum prices to producers. Furthermore, the differences between international and domestic prices could be explained by the oligopolistic market structures with high levels of concentration across the value chain (Rivera 2014). Nicaraguan markets of maize and red beans are less concentrated with structures that allow more com-petition among numerous small and medium-scale farmers, wholesalers, and retailers than in the case of rice.
The domestic price of maize experienced a similar pattern with a sharp increase from 2006 to 2008, and although prices have come down since, in many
Figure 10.18 index of maize, maize Flour, and tortilla prices in mexico, January 2007–January 2011
Source: Soloaga 2014.Note: kg = kilogram.
50
70
90
110
130
150
170
190
210
230In
dex
(Jan
uary
200
7 =
100)
INTERNATIONAL PRICES - USA:Gulf - Maize (US no. 2 yellow) - export (pesos/kg)INTERNATIONAL PRICES - Argentina:Up river - Maize (Argentina) - export (pesos/kg)
Mexico - Mexico City - Maize (tortillas) - retail (pesos/kg)Price of tortillas in tortillerias (MXN/kg)Average price corn flour (maseca and minsa)
Jan-07
May-07
Sep-07
Jan-08
May-08
Sep-08
Jan-09
May-09
Sep-09
Jan-10
May-10
Sep-10
Jan-11

Trade Policy and Food Security in Latin America 265
Trade Policy and Food Security • http://dx.doi.org/10.1596/978-1-4648-0305-5
periods the reduction has not matched the evolution in world prices. Red bean wholesale prices are higher in Nicaragua than in world markets. During the 2007 and 2010 peak prices, national prices were double the level of world prices ( figure 10.20).
Productivity growth was one of the main targets of government interventions in 2007 and afterward, especially through the seed programs and credit incen-tives for productive improvements (new technology adoption and better agricul-ture practices). Basic grain production recovered from the 2007–08 downturns and has been expanding since then, thanks to increases in yields. Government programs as well as high producer prices are likely to have contributed to this growth.
c onclusion
As with other low- and middle-income economies, LAC countries have faced the challenge of protecting their vulnerable populations from increasing and volatile food prices and the associated negative effects on food security. In general, price increases were steep during 2006–08, but much less pronounced in domestic markets than globally, partly because of currency appreciation in many countries in the region and partly because some staple crops are grown and consumed domestically, without much interaction with global markets, as is the case for white maize in Mexico. However, border measures and domestic policies also played a role in insulating domestic prices of internationally traded commodities, such as cereals, from fluctuations in world markets.
Figure 10.19 index of r etail prices of main Food staples in nicaragua, February 2007–January 2011
Source: Rivera 2014.
100
150
200
250
400
350
300
Aver
age
Feb-
07Ap
r-07
Jun-
07Au
g-07
Oct-0
7Dec
-07
Mar
-08
May
-08
Jul-0
8Se
p-08
Nov-0
8Ja
n-09
Mar
-09
May
-09
Jul-0
9Se
p-09
Nov-0
9Ja
n-10
Mar
-10
May
-10
Jul-1
0Se
p-10
Nov-1
0Ja
n-11
Inde
x (2
006
= 10
0)
Black beansMaize tortillaRice
Pinolillo(maize drink powder)

266 Trade Policy and Food Security in Latin America
Trade Policy and Food Security • http://dx.doi.org/10.1596/978-1-4648-0305-5
LAC governments applied a mix of policy measures, attempting either to contain the pass-through of world prices to consumers or to deal with the nega-tive consequences of high food prices after the fact through safety nets. Some countries intervened directly in the markets as buyers and sellers, especially in the case of grains. Others attempted to influence domestic prices through border measures and subsidies to producers, but both types of policies can, and did, distort prices and are very difficult to dismantle when they are no longer needed. Finally, policies implemented to counteract the negative implications of the price spikes after they occurred included expanding existing safety nets to compensate for loss of purchasing power by consumers. These have been adopted by most LAC countries with generally positive results, usually by building upon existing policies and programs. Other mitigation strategies include increasing emergency stocks to avoid shortages, encouraging diversification of consumption to include traditional and locally produced products, improving the efficiency of domestic markets, supporting agricultural research and development, and improving rural infrastructure to boost supply.
Trade policy responses varied substantially among countries, depending in part on the import dependency of food staples that are important in the diets of their populations, but perhaps more important, depending on the overall political setting and the country’s level of commitment to trade openness.
Figure 10.20 production of staple Foods in nicaragua, 2004/05–2010/11
Sources: Rivera 2014; Banco Central de Nicaragua; Ministry of Forestry and Agriculture.Note: Mzs = manzanas; QQ = quintales. Manzana = 0.7 hectare (1.72 acres); quintal = 46 kilograms.
0
2,000
4,000
6,000
8,000
10,000
12,000
14,000
0
100
200
300
400
500
600
Qui
ntal
es
Man
zana
s
2004/05
2005/06
2006/07
2007/08
2008/09
2009/10
2010/11*
Rice production(QQ, right axis)Beans production(QQ, right axis)Maize production(QQ, right axis)
Rice area(Mzs, left axis)
Maize area(Mzs, left axis)Beans area(Mzs, left axis)

Trade Policy and Food Security in Latin America 267
Trade Policy and Food Security • http://dx.doi.org/10.1596/978-1-4648-0305-5
Table 10.4 summarizes the main measures that affected the domestic prices of specific commodities in each country analyzed in this chapter and the outcomes of these measures. It demonstrates that for some commodities for which the countries depend heavily on imports (wheat in Brazil, maize in Mexico, and rice in Nicaragua), both the initial policy setting (the most-favored nation tariff) and the policy response have differed greatly among countries. The outcomes have also been very different. For example, the observed retail wheat flour prices in Argentina and Brazil registered higher increases than world market prices of wheat. In the case of rice in the Dominican Republic, the increase in the domes-tic retail price has been very low, corresponding to only 7 percent of the world price increase, because of the almost complete insulation of the domestic market through a combination of price subsidy and high import barriers.
Brazil and Mexico did not resort to border measures, except for isolated cases of tariff reductions to boost domestic supply of grains. In both countries, the
t able 10.4 summary of t rade policy r esponse and market interventions, by c ountry and product
Country Commodity
Trade policy response or market
intervention during 2007–09
Import dependency,a
2007 (%)
Average tariff,b 2007 (%)
Domestic price
increase, January
2006–June 2008 (%)
Change relative to
world price,c January 2006–
June 2008
Argentina Wheat flour, retail price (Buenos Aires)
Export taxes and quantitative export restrictions
0.3 6.2 203.5 1.59
Bolivia Wheat flour, wholesale price (La Paz)
Export ban and tariff elimination
22.3 10.0 151.4 1.37
Brazil Wheat flour, retail price (national)
Temporary tariff reduction
14.7 6.2 127.0 1.15
Dominican Republic
Rice (first quality), retail price (Santo Domingo)
None 76.8 14.9 14.0 0.07
Ecuador Rice (long grain), wholesale (Quito)
Export ban, administered prices, and state purchasing
38.6 10.7 58.9 0.29
Mexico White maize, wholesale (Mexico City)
Tariff reduction and agreement on prices
36.5 48.9 76.2 0.49
Nicaragua Rice (first quality), retail price (Managua)
Temporary tariff reduction, price controls, and state purchasing
37.9 17.6 70.8 0.35
Peru Wheat flour, wholesale price (national average)
Tariff reduction 50.0 8.9 33.0 0.31
Sources: Country chapters; Food and Agriculture Organization of the United Nations, GIEWS Food Price Data and Analysis Tool, http://www.fao .org/giews/pricetool/; World Trade Organization.a. Share of cereal imports in food consumption.b. Ad valorem most favored nation tariff (average of tariff lines).c. Change in domestic price/change in the world market price.

268 Trade Policy and Food Security in Latin America
Trade Policy and Food Security • http://dx.doi.org/10.1596/978-1-4648-0305-5
social programs responded rapidly to the increases in international food prices in 2006–08 that placed a large number of people below the poverty line, because both countries had the resources and the mechanisms in place to scale up exist-ing cash transfer programs. In Mexico, even though the Oportunidades program was not designed to address food price increases, its presence and efficiency helped deal with the problem almost instantaneously and reached about three-quarters of the poor. In the case of Brazil, poverty reduction and food security are the top priorities at the state level and are supported by a number of coordinated programs and policies.
Other countries, most notably Argentina and Ecuador, resorted to export restrictions in combination with subsidies to producers. The effectiveness of trade restrictions is debatable, not only because they can generate smuggling and therefore undermine the effect on domestic markets, but also because of the potential reduction in production in response to lower prices afforded to produc-ers. Regulated prices and state involvement in marketing were reactivated in Ecuador and Nicaragua, while the Dominican Republic continued with price support to rice producers. These measures benefited producers but put pressure on food prices to consumers.
Some measures implemented to counteract high prices were temporary in nature, such as Mexico’s tortilla agreements, and therefore are no longer in place. Some temporary measures, such as Ecuador’s ban on rice exports, have been extended several times but were eventually abandoned. In other cases, as with Argentina’s export quota, the new measures became permanent and even tight-ened in the case of maize. Additional administrative procedures were introduced for both imports and exports, such as nonautomatic import licensing require-ments, and in February 2012, Argentina implemented a regime under which importers must request approval from the Argentine Tax and Customs Authority before making purchases from abroad. However, export taxes for agricultural commodities have declined in Argentina since their peak in 2008.
In the short run, exporting countries may have incentives to impose export restrictions to ensure domestic supply at affordable prices. However, the long-term implications of these measures must also be considered, including the reduced supply response by domestic producers. Moreover, reduced, banned, or taxed exports diminish global food supplies and can make world markets more volatile, causing additional upward pressure on prices (see, for example, FAO 2011 and FAO and others 2011).
As a trade restriction instrument, export taxes are preferable to quantitative constraints, because they constitute an important and easily managed source of government revenues. But just as with quotas, in the longer run, export taxes provide a disincentive for investment in agriculture with negative effects for the growth of the sector. Overall, one can argue that targeted subsidies to the poor are both more efficient and more effective as measures to improve food security. One possible instrument worth considering is payouts to poor consumers to compensate for the increase in the cost of the basic food basket activated when food prices reach a certain predetermined level. This strategy would have fewer

Trade Policy and Food Security in Latin America 269
Trade Policy and Food Security • http://dx.doi.org/10.1596/978-1-4648-0305-5
market-distorting effects and would be relatively easy to implement in a trans-parent and predictable manner.
In many cases, new trade barriers have had to be accompanied by other mea-sures such as price controls and government purchases to support producers, contributing to further market distortions and imposing substantial fiscal burdens. Price stabilization in the traditional sense has proven to be costly and overall unmanageable, as well as regressive, given its indiscriminate effect on all consumers, rich or poor. Irrespective of the policy goals, any new proposed mea-sure should compare the short-term and long-term effects on food security and cost-effectiveness relative to other policy options that could achieve the same result.
Policy predictability is another issue. Because many export restrictions were initially temporary but have later been extended, producers find making informed decisions about production difficult and other value chain actors can-not operate efficiently. Moreover, in the case of quotas, their allocation can encourage rent seeking. Frequent policy changes have been observed in many of the countries where export restrictions were implemented, generating an uncer-tain policy environment that harms the private sector. For the agricultural sector to thrive, long-term measures or programs implemented to foster productivity and resilience to adverse weather conditions are preferable.
Initial analysis suggests that some of the policies yielded moderate positive results in terms of containing price increases, because food inflation in LAC has been considerably lower than the increases registered in world prices. Much of this difference can be explained by the appreciation of many currencies in LAC in relation to the U.S. dollar. Moreover, in many cases local conditions, such as the weather and domestic market structure, play a more important role as driv-ers of prices to consumers. Thus, the severe drought in Mexico in 2011 was the main reason for skyrocketing maize prices, as was the case in Nicaragua in 2010 with beans, and not developments in world markets.
Although border measures can have significant implications for supply and demand of food products in the short run, they are not, nor should they be, the principal instrument for dealing with food insecurity and poverty. Trade policy alone does not guarantee stable prices and does not, by itself, lead to greater food security.
In the long run, the preferable solution to lower the risk of unexpected move-ments in food prices and guarantee sufficient access to food is having a wide and stable supply as well as social policies that improve the purchasing power of the poor. To ensure sufficient supplies, countries in LAC should reevaluate the role of agriculture in their economies, giving priority to increased productivity, greater competitiveness, more transparent and efficient domestic markets, and enhanced resilience to risks associated with climate variability. This strategy requires poli-cies in support of agriculture that promote greater investment in farming, better rural infrastructure, transfer of technological innovation, and better extension services that differentiate between the needs of small farmers and larger-scale agricultural operations.

270 Trade Policy and Food Security in Latin America
Trade Policy and Food Security • http://dx.doi.org/10.1596/978-1-4648-0305-5
notes
1. In this chapter, the group of food and agricultural products is defined as the aggregate of all product lines in chapters 0 through 24 of the Harmonized System. Global Trade Atlas data are used in calculations.
2. Driven by China’s growing demand for commodities over the past decade and the high level of world prices, LAC has increased its dependency on exports of not only basic food products, but also metals and energy. The growth of exports to China, which became the most important trading partner for many LAC countries in a short period of time, can almost entirely be attributed to these products. In the current environ-ment of high price volatility and uncertainty regarding global growth, this tendency has raised preoccupation with the so-called recommoditization of LAC exports and the reliance on incomes generated by them. According to the Economic Commission of Latin America and the Caribbean of the United Nations, between 2000 and 2010 the share of exports of commodities and natural resource–based manufacture increased from 45 percent to 57 percent in nominal terms (ECLAC 2012).
3. Information was extracted from the website of the Ministry of Social Development, http://www.mds.gov.br/bolsafamilia.
4. ASERCA (Apoyo y Servicios a la Comercialización Agropecuaria, or Support and Services for Agricultural Trading), is one of SAGARPA’s programs.
5. Data received from SEL Consultores, Buenos Aires, http://www.selconsultores.com.ar/.
r eferences
ECLAC (Economic Commission of Latin America and the Caribbean). 2012. Panorama de la inserción internacional de América Latina y el Caribe 2011–2012: Crisis duradera en el centro y nuevas oportunidades para las economías en desarrollo. Santiago: ECLAC.
FAO (Food and Agriculture Organization of the United Nations). 2011. Guide for Policy and Programmatic Actions at Country Level to Address High Food Prices. Rome: FAO.
———. 2012a. “GIEWS Country Briefs: Argentina.” July 12, http://www.fao.org/giews / countrybrief/country.jsp?code=ARG.
———. 2012b. The State of Food Insecurity in the World 2012. Rome: FAO.
FAO (Food and Agriculture Organization of the United Nations), CEPAL (Comisión Económica para América Latina y el Caribe), and IICA (Instituto Interamericano de Cooperación para la Agricultura). 2012. “Respuestas de los países de América Latina y el Caribe al alza de la volatilidad de precios de los alimentos y opciones de colabo-ración.” Boletín CEPAL/FAO/IICA No. 1.
FAO (Food and Agriculture Organization of the United Nations), IFAD (International Fund for Agricultural Development), IMF (International Monetary Fund), OECD (Organisation for Economic Co-operation and Development), UNCTAD (United Nations Conference on Trade and Development), WFP (World Food Programme), World Bank, WTO (World Trade Organization), IFPRI (International Food Policy Research Institute), and UN High-Level Task Force on Global Food Security. 2011. Price Volatility in Food and Agricultural Markets: Policy Responses. Policy report to the Group of 20. http://www.ifad.org/operations/food/documents/g20.pdf.
Ferreira Filho, J. B. S., and C. E. F. Vian. 2014. “Brazil.” In Policy Responses to High Prices in Latin America and the Caribbean: Country Case Studies, edited by Ekaterina Krivonos

Trade Policy and Food Security in Latin America 271
Trade Policy and Food Security • http://dx.doi.org/10.1596/978-1-4648-0305-5
and David Dawe, 55–73. Food and Agriculture Organization of the United Nations, Rome.
Nogués, Julio J. 2014. “Argentina.” In Policy Responses to High Prices in Latin America and the Caribbean: Country Case Studies, edited by Ekaterina Krivonos and David Dawe, 13–33. Food and Agriculture Organization of the United Nations, Rome.
Quezada, N. A. 2014. “Dominican Republic.” In Policy Responses to High Prices in Latin America and the Caribbean: Country Case Studies, edited by Ekaterina Krivonos and David Dawe, 75–85. Food and Agriculture Organization of the United Nations, Rome.
Rivera, L. 2014. “Nicaragua.” In Policy Responses to High Prices in Latin America and the Caribbean: Country Case Studies, edited by Ekaterina Krivonos and David Dawe, 141–71. Food and Agriculture Organization of the United Nations, Rome.
Soloaga, Isidro. 2014. “Mexico.” In Policy Responses to High Prices in Latin America and the Caribbean: Country Case Studies, edited by Ekaterina Krivonos and David Dawe, 121–39. Food and Agriculture Organization of the United Nations, Rome.
Valdés, Alberto, and William Foster. 2010. “Un breve resumen de las políticas y mecanis-mos para hacer frente a la volatilidad del precio de los alimentos en América Latina.” Unpublished memorandum.
Wong, Sara A. 2014. “Ecuador.” In Policy Responses to High Prices in Latin America and the Caribbean: Country Case Studies, edited by Ekaterina Krivonos and David Dawe, 87–119. Food and Agriculture Organization of the United Nations, Rome.


273 Trade Policy and Food Security • http://dx.doi.org/10.1596/978-1-4648-0305-5
Using Trade to Enhance Food Security in Southeast AsiaHamid R. Alavi and Aira Htenas
introduction
Recent international spikes in the price of food have served as a wake-up call for policy makers within the Southeast Asia region and have created an opportunity to revisit existing regional policies for food security, a difficult task during normal circumstances. As an essential first step, policy makers have been called to rede-fine the concept of food security. Fixating on national self-sufficiency, specifically in rice, has been costly and counterproductive. Instead, coordination and coop-eration between countries can both improve food production at home and facili-tate the expansion of trade, especially to regional markets. The 2007–08 food price crisis exemplified how unilateral trade policy decisions and panicky responses were the primary factors behind soaring (and later, diminishing) rice prices. Unfortunately, a number of government interventions since then seem simply to recycle past attempts, harking back to the role of Green Revolution production technology. Instead, complementing those policies by focusing on domestic markets with policies to enhance reliance on trade is required.
The first section of this chapter describes the state of rice trade in the region covered by the Association of Southeast Asian Nations (ASEAN). This section is followed by a summary of the broad objectives and fea-tures of food security policies in the rice market for five Southeast Asian countries: Indonesia, Malaysia, the Philippines, Thailand, and Vietnam. It covers trade policies for rice as well as the role of state trading enterprises (STEs), farm support policies for rice, and rice distribution policies. The third section summarizes the effects of these government policies on regional markets. Because of its strategic importance, rice is the subject of more pro-grammatic interventions than any other farm crop, which makes the market for rice among the most distorted in the region and, indeed, the world. The final section concludes with recommendations on enhancing regional trade coordination under ASEAN.
c H A p t e r 1 1

274 Using Trade to Enhance Food Security in Southeast Asia
Trade Policy and Food Security • http://dx.doi.org/10.1596/978-1-4648-0305-5
state of r ice production and t rade in the Ase An r egion
Historically, rice exports have not figured much in the ASEAN context. Trade in rice among ASEAN member states in 2008 totaled just 3.5 million tons of the nearly 101 million tons produced by these countries. In world markets, as well, rice is very thinly traded, accounting for less than 30 million (7 percent) of the 420 million tons produced globally in 2008 and rarely involving more than 7 percent of total rice production in most years. Moreover, nearly half of all exports come from Thailand (10 million tons in 2008) and Vietnam (over 4.6 million tons in 2008).
In such a thinly traded market, convincing reasons that rice exporting and importing countries should start developing rice trade agreements are admittedly not easy to see. Those reasons, however, do exist. They can be found quite con-cretely in supply chain inefficiencies that translate into significant rice losses. For example, a reduction of postharvest physical losses by 5 percentage points (from nearly 14 percent to 9 percent) would create 4.3 million tons of rice-equivalent for the five countries covered in this chapter. This volume is more than the entire intra-ASEAN rice trade. If waste could be significantly reduced, the amounts available for trade would grow in proportion. At the same time, the savings would at least slow and possibly reverse the growth of budgetary outlays going to subsidize rice and the heavy losses of state enterprises that have long controlled the sector.
Not surprisingly, up to 15 percent of the crop is lost, particularly in situations where rice is harvested and threshed by hand; dried in the sun; milled by low-capacity, outdated machinery; and stored so poorly that pests and even rain can attack the grain. Millions of actors are involved in national supply chains in ASEAN countries, with rice supply chains remaining reservoirs of marginally productive farmers, processors, and loosely associated ancillary service providers whose internal business processes remain independent and uncoordinated. Moreover, when rice is moved over bad roads by inefficient trucks, or by sea in small vessels and through clogged ports, inadequate logistics can raise consumer prices by 20–25 percent. Many—sometimes all—of these weaknesses feature, in varying degrees of severity, in the supply chains of the five ASEAN countries studied, although Thailand’s supply chains are more efficient than those of the other four countries.
o bjectives and Features of Food s ecurity policies in the r ice market in s outheast Asian c ountries
Because of its strategic importance, rice is subject to more interventions than any other farm crop in the region. These interventions greatly distort the market for rice. Public programs affect market performance both in targeted, expected ways and in collateral, unexpected ways. Among such interventions in rice markets, the primary ones are (a) technology choices, (b) land use choices, (c) subsidies and price supports, (d) directed credits for farm inputs, (e) controls over domestic

Using Trade to Enhance Food Security in Southeast Asia 275
Trade Policy and Food Security • http://dx.doi.org/10.1596/978-1-4648-0305-5
market prices, (f) stockpile management, (g) import controls, (h) direct procure-ment and internal distribution, and (i) food safety and quality controls.
Most food security programs serve two or more objectives that are sometimes countervailing and mutually contradictory. Most programs are designed to move toward promoting rice self-sufficiency in rice production, even though the path selected for achieving this objective often represents the more costly option. Some program elements require that others be adopted to ensure the effective-ness of the original program or to overcome unforeseen problems resulting from its implementation. Import restrictions, for instance, are frequently used to pro-tect local producers from foreign competition. In turn, these restrictions have prompted policy makers to undertake complementary expenditures to stabilize producer and consumer prices or to ensure that rice supply is always available to the poor, independent of prevailing market conditions. Another example involves STEs, or parastatals. In many policy contexts, these entities have been created as implementation instruments, using direct modes of intervention. For reasons unrelated to their cost-effectiveness, STEs have become privileged participants in many rice-trading activities. Their procurement practices and regulations have become the default rules under which regional rice markets operate. For example, the Philippines’ National Food Authority (NFA), the most independent and powerful of the STEs in the region, possesses authority to regulate the nation’s rice trade and thus owns the sole right to import or export rice. Its influence even transcends national borders by virtue of the procurement procedures it applies.
ASEAN countries’ policies and programs have also significantly shaped the current structure of rice trade worldwide. The high level of distortion derived from public sector–managed procurement activities within the region, combined with the relative thinness of trade, makes for a commercial environment prone to periodic crisis and volatility. Small changes in the balance of supply and demand can have large effects on world prices.
The thinness of international trade in rice is a result of, and also given as a reason for, highly protective policies that continue to be geared toward self- sufficiency. National governments, especially those of the major rice-producing nations, are often reluctant to rely on a world rice market perceived to be too unstable to provide dependable prices or reliable supplies for the relatively large volumes they need to support food security programs. Thailand, for example, as the world’s largest exporter of rice and undoubtedly one of the most efficient rice producers, opposes any liberalization of its rice trade because of the government’s desire to keep complete autonomy over its rice policy should market conditions become unstable (Warr and Kohpaiboon 2009). The revealed behavior of the major exporting countries clarifies their collective, market-distorting effect. When their own inventories reach low levels, their respective national laws pre-vent food security agencies from doing business as usual. Unilateral, country-specific rice policies, such as India’s and Vietnam’s export restrictions in 2008, resulted in destabilizing prices in world markets (Timmer and Slayton 2009).
The following examines two sets of policies in more detail: rice trade policies and the role of STEs.

276 Using Trade to Enhance Food Security in Southeast Asia
Trade Policy and Food Security • http://dx.doi.org/10.1596/978-1-4648-0305-5
Rice Trade PoliciesBoth formal and informal trade barriers continue to impede the development of an efficient regional market for rice. Among the formal practices is the continued imposition of most-favored nation (MFN) tariff rates that are higher on agricul-tural imports than on nonagricultural ones. For example, the ASEAN+3 countries,1 except for Brunei Darussalam, continue to support average agricul-tural tariffs higher than those of all imports. The agricultural tariff premium—that is, the gap between the average agricultural tariff and the average tariff on all goods—is highest in the case of Japan by a multiple of 7.5. Malaysia, the Philippines, and Thailand tax their respective agricultural imports at levels higher than those on all imports by a multiple ranging from 3.0 to 4.2. China’s average applied agricultural tariff is 14.8 percent, compared with 4.4 percent for all goods. Cambodia, the Republic of the Union of Myanmar, the Lao People’s Democratic Republic, and Vietnam support lower premiums, ranging from 1.50 to 1.61, indicating that they have a more uniform tariff structure than Malaysia, the Philippines, and Thailand. The average agricultural tariff in ASEAN countries is 14.15 percent, 2.1 times higher than the 6.85 percent regional average tariff on all products.
Applied MFN tariff rates on all goods have been falling in accordance with multilateral and preferential tariff reduction obligations that countries have negotiated, with average agricultural tariffs gradually declining in East Asia, except for Indonesia and the Republic of Korea. The average ASEAN agricultural tariff rate of 14.15 percent is less than the world average tariff on agricultural goods of 16.74 percent.
The agriculture sector therefore holds significant potential for further trade integration. Table 11.1 shows that for the world and the ASEAN region in par-ticular, tariff peaks in agriculture in relation to all tariff lines exceed those for all imports by multiples of 1.8 and 1.4, respectively.
The average share of agricultural tariff peaks in ASEAN is 18.22 percent, compared with the world average of 38.96 percent. The same pattern is reflected in the case of the ASEAN+3 group, except for Brunei Darussalam, Malaysia, and Myanmar. These three countries have lower shares of tariff peaks in agriculture compared with all goods. Among countries with many tariff peaks in agriculture, Thailand and Vietnam top the list, with 58.72 percent and 61.27 percent, respectively.
As a result of the Agreement on Agriculture (AoA) of the World Trade Organization (WTO), many countries now apply a tariff quota on key agricul-tural imports, rather than the quantitative restrictions previously imposed. Under this system, a specified but often relatively small volume of agricultural imports, such as those of rice, may be imported at very low tariffs, while unlimited amounts may be imported at higher tariff rates. These arrangements are the out-come of the tariff process that WTO members are legally bound to follow.2 For example, China imposes a 1 percent tariff on half its tariff quota of 5.3 million tons of rice, which it allows to be imported by private licensed traders. The other

Using Trade to Enhance Food Security in Southeast Asia 277
Trade Policy and Food Security • http://dx.doi.org/10.1596/978-1-4648-0305-5
half of the tariff quota is set aside for STEs. China’s out-of-quota import tariff rate for rice is 65 percent.
The Philippines continues to maintain a quantitative import restriction on rice, however, having availed itself twice of the special treatment provision in the AoA. The country opened a minimum access quota applicable to 240,000 tons beginning in 2004, subject to a 50 percent in-quota tariff. This special treatment expired in 2012.
Trade-restrictive policies on agriculture imposed by most ASEAN policy makers reduce the volume of rice traded, which in turn induces relatively wide price fluctuations of rice internationally. In Asia as a whole, Anderson and Martin (2009) argue that although the region produces and consumes four-fifths of the world’s rice supply (compared with about one-third of the world’s wheat and maize), these policies resulted in just 6.9 percent of global rice production being traded internationally between 2000 and 2004.
Given the current policies of most ASEAN countries to insulate their domestic rice sectors from fluctuations in the world price, nominal rates of pro-tection for rice can be expected to be used in a way that compensates for swings in international rice prices: high protection rates in times of low world prices, and low otherwise. Empirical investigation done by Anderson and Martin (2009) supports this claim. From 1990 to 2005, a high negative correlation was present between the rice nominal rate of assistance (NRA)3 and international rice prices:
t able 11.1 share in total product l ines with mFn t ariff r ates exceeding 15 percentPercent
Country or region Agricultural goods All goods
Vietnam 61.27 41.74Thailand 58.72 23.07Korea, Rep. 48.77 8.91Lao PDR 44.65 18.81Cambodia 34.62 20.30Japan 34.22 8.04China 34.04 14.54Philippines 13.53 9.31Malaysia 12.34 27.18Indonesia 7.31 4.64Myanmar 6.25 7.41Brunei Darussalam 0.66 14.61Singapore 0.52 0.07World average 38.96 22.01ASEAN average 18.22 13.09
Sources: World Trade Indicators (database), World Bank, Washington, DC, http://info.worldbank.org/etools / wti/1a.asp (accessed January 2010). Reproduced from Alavi and others 2012.Note: ASEAN = Association of Southeast Asian Nations; MFN = most-favored nation.

278 Using Trade to Enhance Food Security in Southeast Asia
Trade Policy and Food Security • http://dx.doi.org/10.1596/978-1-4648-0305-5
−0.59 for Southeast Asia and −0.75 for South Asia. This pattern is evident whether the NRA is rising or falling.
Protectionist policies considerably discount the important role that trade plays in bringing stability to the world’s food markets, particularly that of rice. The more countries attempt to insulate their domestic markets from world prices, the more unstable world rice prices become. Anderson and Martin (2009) argue that this may, in turn, induce protectionist behavior by other countries. They claim that net importing countries export domestic rice price volatility to world markets by varying their import tariffs, while net exporting countries do the same by imposing or relaxing export restrictions. As they vary trade policies to suit their domestic food price stabilization objectives, their actions can affect world prices, so that even larger adjustments in domes-tic NRAs become necessary.
The Role of State Trading Enterprises (Parastatals)STEs are the main institutions through which ASEAN governments have chosen to regulate nearly all aspects of their rice supply chains, including international trade; to channel domestic farm support to rice producers; and to intervene in rice markets. STEs continue to provide a great deal of direct and indirect support for government policies. Not only are they direct participants in food marketing, but in many national markets they also have performed double duty as regulators of entire food systems. In this latter capacity they manage multiple aspects of government control, from licensing of business establishments to licensing of imports and exports to pricing and procurement. In the course of implementing their mandates, STEs have been accorded preferential treatment by their govern-ments over the private sector, including access to credit and transportation, as well as direct budgetary support.
Governments in the region that accord wide-ranging regulatory support to parastatals (and, in Malaysia, to the privatized successor) do not provide a level playing field for domestic markets (Rashid, Gulati, and Cummings 2008). Briefly recalling examples of such interventions during the 2007–08 food price crisis is worthwhile:
• Establishment of what was effectively a minimum farmer price in Thailand that significantly exceeded prevailing market prices and the government’s con-sequent reluctance to release accumulated stocks for export at a loss
• Setting of minimum buying prices in Vietnam, backed up by minimum export prices (MEPs) and export licensing, together with favorable interest rates applied to state bodies
• Sale of rice by the parastatal in the Philippines at prices that the private sector found uncompetitive
• Interstate restrictions on the movement of paddy and rice in Malaysia
At least two factors persuade governments to use parastatals to advance their agenda on rice self-sufficiency. First, governments perceive the private sector as

Using Trade to Enhance Food Security in Southeast Asia 279
Trade Policy and Food Security • http://dx.doi.org/10.1596/978-1-4648-0305-5
likely to squeeze earnings from rice farmers if left alone. The farmers, for instance, may need to sell their output during harvest seasons when prices are low or may have pledged their output to lenders in exchange for production loans or multi-purpose credit lines.
Second, using public corporations is administratively convenient. This is par-ticularly the case when governments must account to legislatures for the finan-cial resources used to support overall food security programs.
Generally in the name of food security, all the five countries studied incur budgetary costs of some importance, and giving STEs the responsibility for deci-sions on procurement and import or export restrictions grants these bodies a significant role in shaping and sometimes distorting local and global rice markets, on occasion by setting prices that are lower than necessary for farmers and higher than would otherwise be the case for consumers. The role of STEs in each of the five countries is discussed in more detail in annex 11A.
t he effects of Food s ecurity policies on production, c onsumption, and t rade
Trade restrictions and the interventions of STE rice programs incur costs by distorting markets and market prices. Except in Malaysia, parastatals require budgetary support, if only for operating costs or, as in the Philippines, to finance a large and steadily mounting debt. In addition, prevailing agricultural policies in the ASEAN countries studied entail large public expenditures from farm support outlays that are incurred in acquiring rice inventories. Nevertheless, these costs are often discounted because these policies have food security objectives. This section examines whether these objectives have been met, namely with respect to their effects on rice self-sufficiency and rice distribution.
Effects on Rice Self-SufficiencyAs with other government interventions, farm support programs often arise from commitments to self-sufficiency. Vietnam and Thailand, two of the world’s leading rice exporters, produce more rice than they require for domestic con-sumption. Their self-sufficiency ratios are 125 percent and 190 percent, respec-tively, while Indonesia, the Philippines, and Malaysia have ratios of 98 percent, 85 percent, and 73 percent, respectively.
The objective of all support programs in the region is to increase farm yields and to ensure reasonable returns from rice farming. Major rice-producing coun-tries in Southeast Asia, for example, set minimum price levels for public paddy procurement for the benefit of their respective rice farmers. Although several nondistorting programs have been designed to enhance efficiency in rice produc-tion, other subsidy programs, which are price distorting, continue to be used in the region in both net importing and net exporting countries.
Net rice-importing countries tend to have higher price supports than do net rice-exporting ones. Without data on actual public procurement, precisely

280 Using Trade to Enhance Food Security in Southeast Asia
Trade Policy and Food Security • http://dx.doi.org/10.1596/978-1-4648-0305-5
evaluating the extent of market distortions that have resulted from these incen-tives is difficult. Among the net importing ASEAN countries, Malaysia provided the highest price support in 2003, procuring paddy at US$210 per ton. Indonesia ranked second, with an official procurement price of US$193. The Philippines followed, settings its farm support price at US$169. As rice exporter, Thailand had the lowest price guarantee levels, ranging from US$176 (for fragrant rice) to US$132.
Effects on Net Importing CountriesIn the case of net importing countries, including Indonesia and the Philippines, which support minimum price guarantees for paddy, other forms of price sup-port also operate. For a time, both countries imposed import restrictions, allo-cated public resources to attain self-sufficiency in rice, and intervened actively in their domestic markets through trading companies (such as Indonesia’s state-run Board of Logistics [Badan Urusan Logistik, or BULOG] and the Philippines’ NFA). Both public trading companies procure paddy from rice farmers at min-imum prices. However, in the 1990s, the NFA procured significantly less than BULOG: 2–3 percent of production, compared with 6–7 percent, respectively (Sidik 2004).
The Philippines did not adjust the levels of its price guarantees for a long time, providing rice farmers with high returns. Because minimum prices offered by the NFA were marginally less attractive than market clearing prices, traders and credi-tors purchased nearly all the rice produced in the Philippines. The NFA’s interven-tion shifted increasingly toward stabilizing consumer prices and providing supplies for emergency purposes. By contrast, BULOG continued to commit large fiscal resources in paddy procurement and to lead rather than follow the market.
Other differences are worth noting. With its procurement, the NFA follows a parity rule between paddy and milled rice prices of 1:2. The NFA distributes milled rice to the market at official prices to stabilize them. Once it has set its official rice price, the NFA pegs its paddy price at half that price. Preceding the 2008 rice price crisis, and for a fairly long period, paddy prices remained low and in line with world prices. When fertilizer costs started to rise sharply in 2007, political pressures mounted on the NFA to recalibrate its long-standing parity. However, the parastatal’s management ignored the pressures and continued to peg paddy prices at half that of milled rice prices.
BULOG, in contrast, increased its price guarantees from 1,500 rupiah (Rp) per kilogram to Rp 1,700 per kilogram in 2004. Because of this adjustment, rice prices shot up in Indonesia to Rp 2,750 per kilogram. This was higher than the imputed wholesale price for imported rice of Rp 2,200 per kilogram inclusive of the tariff on imports at Rp 430 per kilogram (Sidik 2004). In sum, Indonesia’s subsidy policies have been more supportive of producers, whereas the Philippines’ subsidy policies have favored rice consumers.
In 2008, when world rice prices reached 40 pesos (P) per kilogram, the Philippines suffered growing financial losses by releasing rice at P25 per kilogram.

Using Trade to Enhance Food Security in Southeast Asia 281
Trade Policy and Food Security • http://dx.doi.org/10.1596/978-1-4648-0305-5
At that time, the NFA was forced to adjust its official rice prices to P34 per kilogram. This meant that paddy support prices were set at P17 per kilogram in accordance with the price parity of 1:2. Immediately after it made the adjust-ment, the NFA was inundated with offers from farmers to sell, so that in 2008 it reached its second-highest level of procurement of paddy in 30 years. Once again these developments had their origins in what was happening in the rice con-sumer market, rather than at the other end of the chain.
Not all rice farmers are able to avail themselves of the minimum prices that STEs offer, however. STEs buy paddy from specific sets of local farmers for well-defined reasons, including stabilizing domestic paddy prices, procur-ing sufficient volumes of paddy to build up buffer stocks, stabilizing con-sumer prices, and providing emergency relief to local areas after natural disasters. Once these objectives are met, no need exists for further procure-ment. For instance, if market prices remain high at harvest time and attain levels that ensure reasonable returns to rice farmers, STEs will stay out of the domestic market unless they need to replenish their buffer and emergency rice reserves.
Government trading companies ultimately decide to offer minimum prices to specific sets of farmers and not to others depending on factors related primarily to logistics costs that result from repositioning local paddy for use or sale once it is procured. The size of the harvest in any given locality and its distance to the nearest storage facility are important additional considerations when sourcing supply.
Effects on Net Exporting CountriesPublic procurement of paddy in net exporting countries such as Thailand and Vietnam is intended to increase overall production and thus increase rice exports.
In Thailand, the paddy pledging program, which ended in 2009, put the bulk of Thailand’s rice exports in the hands of the Public Warehouse Organization (PWO). The PWO auctions these stocks to private exporters, but the govern-ment can use them to ensure stable and affordable domestic rice prices. That said, domestic rice prices in Thailand normally reflect export parity.
Minimum price guarantees for paddy have not historically been a feature of Thailand’s rice policy. Indeed, for many years the government taxed the sector in favor of rice consumers. Rather than supporting rice farmers, exports were taxed and the government required traders to set aside part of their exports as rice requirement. Warr and Kohpaiboon (2009) note that the objective of the export tax, which reached levels as high as 40 percent, was to raise revenue for industri-alization. Siamwalla and Setboonsarng (1991) report that the Ministry of Commerce required exporters to sell rice accumulated as part of the nation’s reserve at below-world-price levels, which indeed is opposite of the way that current pro-farmer price supports work. These measures were phased out with the end of the government’s rice export monopoly.

282 Using Trade to Enhance Food Security in Southeast Asia
Trade Policy and Food Security • http://dx.doi.org/10.1596/978-1-4648-0305-5
A policy shift resulted in the government introducing rice price guarantees as part of a reorientation in rice policy toward supporting rice farmers and encouraging greater exports. The program entailed rice farmers depositing paddy with an accredited rice mill to collateralize the loan they had previously received from the state-owned Bank for Agriculture and Agricultural Cooperatives (BAAC). The value of the pledged paddy was set at official prices normally above market prices. The government offered participating farmers two options: to repay or to keep the loan they received from BAAC within three months after harvest. If the borrower-farmer retained the loan, the paddy sale was completed at the official price and the government took ownership of the pledged paddy. After ordering the mill to polish the paddy, the government paid BAAC the farmer’s outstanding loan balance and stored the milled rice.
One effect of the program was to concentrate rice stocks in the hands of the government, a plus for the government when world prices were high, as in the first half of 2008. However, when prices declined sharply, as they did in the second half of 2008, the government was forced to absorb losses associ-ated with the diminished value of its rice inventory. As stakeholders in the program, rice farmers petitioned the government to extend it, thus causing the government to suffer additional losses. According to Forssell (2009), the Thai government spent 35 million baht (B) after raising minimum prices from B 10,000 per ton in the first half of 2008 to B 14,000 in the second harvest of that year.
Because of these losses, the government of Thailand has stopped paddy pro-curement in favor of an income support program that benefits less-well-off rice farmers. The District Agricultural Cooperatives Board in each area determines the direct income subsidy, which is computed as the difference between a calcu-lated benchmark price and the average market price that local traders have paid. In this way, farmer beneficiaries are more precisely targeted.
In Vietnam, one of the world’s top rice exporters, internal rice policies are designed primarily to ensure that local populations have access to rice at afford-able prices. The government intervenes in rice markets in several unique ways. First, it regulates the use of farmland that is committed to rice cultivation and limits its use for other crops or other uses. In areas where rice productivity is low or unstable, the government, through Provincial Committees, normally permits farmers to use these lands for other uses from which they can derive higher incomes. If a rice farm exceeds 2.0 hectares (4.9 acres), however, the Office of the Prime Minister must grant an alternative use permit. Normally, these permits are not granted when the rice farms are located in areas in which the government has invested in rice-specific irrigation facilities.
Second, although the government allows private companies to export rice, it regulates them to ensure that no domestic shortage occurs. When the country needs to keep its rice stocks for domestic consumption, the government orders traders to stop contracting for export. All export contracts must be registered in any case with the Vietnam Food Association (VFA), which has a mandate to advise the government on food security issues. Another programmatic measure

Using Trade to Enhance Food Security in Southeast Asia 283
Trade Policy and Food Security • http://dx.doi.org/10.1596/978-1-4648-0305-5
is the mandate that private exporters pledge a part of their respective stocks to stabilize domestic rice prices.
VINAFOOD2 (Southern Food Corporation), which is the largest state-owned company operating in southern Vietnam, where most rice is grown, undertakes most of the public procurement of paddy. The company exports directly for its own account. However, it also sells rice to private traders to complete their orders if they already have 50 percent of the contracted volume in their stores.
Impacts on Rice DistributionTwo key public policy concerns affect rice consumers in Southeast Asian coun-tries: keeping domestic price fluctuations low and ensuring access to those groups identified as deserving beneficiaries of public subsidies. The latter covers those below the poverty line or special groups within the population, such as school-children, as well as those suffering from natural disasters when markets tempo-rarily break down and rice consumers in specific localities are adversely affected.
Before shifting to its Beras Miskin (Raskin) program in 1998, Indonesia imple-mented a general rice consumption subsidy tied to stabilizing rice prices. However, at the height of the Asian financial crisis, the government launched a subsidy program that targeted poor households, making them eligible to receive 20 kilograms of rice per month at the price of Rp 1,000, roughly 35 percent of the 2004 market price. The program is large, delivering around 2.2 million metric tons of rice to about 9 million beneficiaries. According to Sidik (2004), the sub-sidy amounted to Rp 4.6 trillion in 2004.
Indonesia has since adjusted its Raskin program. According to recent data, about 19.1 million poor households are eligible to receive 15 kilograms of subsi-dized rice. The program now accounts for 90 percent of BULOG’s market opera-tions. It is implemented through about 50,000 Raskin distribution centers located in 15 regions throughout the country. BULOG also provides supplies to the military and in times of disaster.
BULOG reports that Raskin rice accounts for about 90 percent of its total distribution. Although the distribution of rice is of some benefit to the recipi-ents, the costs of the exercise are extremely high. The overall benefit of sup-plying the poorest one-third or so of the population with just 10–20 percent of its needs (depending on household size) at a discount of approximately 35 percent may therefore be questionable, because this program effectively reduces the household expenditure on rice by only between 3.5 percent and 7.0 percent.
Even this calculation, however, may exaggerate the benefits for individual families, because local authorities can intervene in their areas to reallocate the 15 kilograms into smaller parcels to benefit a greater number of households. There are also suggestions that a significant percentage does not reach the intended beneficiaries. According to an earlier estimate, 18 percent went missing, on average, although the bulk of the disappearance was accounted for by a rela-tively small portion of villages (Olken 2006). The challenge is now to improve the cost-effectiveness of the program, concentrate more assistance on people

284 Using Trade to Enhance Food Security in Southeast Asia
Trade Policy and Food Security • http://dx.doi.org/10.1596/978-1-4648-0305-5
living in urban areas, tighten eligibility criteria and beneficiary reporting, and ensure that the program is placed on a financially sound footing.
In the Philippines, the NFA pursues policies very similar to those of BULOG in the rice market. The NFA has a mandate to stabilize domestic rice prices by selling the commodity directly to the general public when prices are high. This program normally comes into play during the third quarter of the year, which is considered to be the lean period for rice production. When natural disasters hit the country, seasonal drops in supply deteriorate even more rapidly, and the NFA is then charged with ensuring that rice stocks are available to carry the country through the lean period, doing so by injecting mostly imported rice into the domestic market through its accredited rice retailers.
In addition, the agency implements a rice subsidy program that benefits the poor. In cooperation with the Department of Social Welfare and Development, the NFA distributes rice at below-market prices. A third program executed by the NFA is designed to address humanitarian emergencies. The NFA implements this program in coordination with the National Disaster Coordination Committee and is expected to move rice stocks to areas hit by natural calamities, where nor-mal market operations have ceased. Stocks representing 15 days’ consumption of rice are stored in various strategic distribution centers for this purpose.
Malaysia, through Padiberas Nasional Berhad (BERNAS), manages the country’s rice stocks, which it obtains from local paddy procurement as well as from imports. However, unlike the agencies in Indonesia and the Philippines, BERNAS has no mandate to provide subsidies to the country’s poor. Incorporated in 1994, the state-owned company entered into a privatization contract with the government in 1996, under which it provides a range of ser-vices. These include maintaining the nation’s rice stockpile; acting as the buyer of last resort for paddy farmers; managing the Bumiputera Rice Millers Scheme, which benefits Malay Muslim rice millers; distributing paddy price subsidies to farmers on behalf of the government; and distributing and marketing rice in Malaysia. BERNAS currently controls about 24 percent of the nation’s paddy market and 45 percent of the domestic rice market.
Ensuring that low-income households have access to rice is not often a con-cern for a major rice exporter like Vietnam. However, in 2008, concerns arose within the government that the domestic rice market, particularly in Ho Chi Minh City, might run out of supply at the same time that rice was being exported to the more lucrative overseas markets. This possibility prompted the VFA to ask its members to allocate more of their supply to the domestic market. Concerns such as these have been attributed to underlying weakness in the local rice dis-tribution system. Export supply chains work smoothly, but larger food compa-nies that are better able to deal with the distribution of local rice and other food efficiently and quickly are needed domestically.
Other ConsiderationsAlthough the propriety of setting aside public resources for the public distribu-tion of food staples to the poor is not a controversial issue in Southeast Asia,

Using Trade to Enhance Food Security in Southeast Asia 285
Trade Policy and Food Security • http://dx.doi.org/10.1596/978-1-4648-0305-5
other closely related issues are. For example, how public expenditure programs for stabilizing rice prices are designed, what their appropriate costs are, and how they can be designed not to undermine economic incentives in the sector are among the issues that have engaged the attention of policy makers in all five of the countries studied.
The use of import restrictions to encourage domestic rice production usually requires two further sets of public outlays to protect consumers: one for price stabilization and another for consumer rice subsidies for the poor. Public invest-ment in national buffer stocks has often had to be increased to offset the increased volatility of domestic rice prices and to ensure economic access to rice for entitled populations. In countries such as Indonesia and the Philippines, where a significant share of the population lives below the poverty line, price stabilization activities have been commingled with a targeted consumer rice sub-sidy to compensate for the adverse effects of import restrictions on consumers.
Costly as they are, government policies and programs for ensuring food secu-rity have been designed to strike a balance between supporting producers and helping consumers. Policies that decoupled these two interests and dealt sepa-rately with rice affordability to consumers and livelihood assurance for farmers might have been easier to implement than the prevailing policies that attempt to combine the two.
Achieving the hoped-for outcomes of these policies—stabilized prices and enhanced farm-level productivity—is uncertain, at best. However, a still more adverse consequence is the crowding out of private sector investment in rice-related production and the consequent missed chances to supplement public investment with private investment, the lost opportunities for sector develop-ment, and the perpetual postponement of the transition from nontradable to globally tradable product status. Moreover, private investors face a strong deter-rent when they are forced to compete with public sector counterparts, which enjoy the power to regulate the food business and to set the rules for local buying. As a result, a self-perpetuating cycle can compel regional governments to believe they must make yearly commitments of budgetary resources to ensure food security.
This self-perpetuating cycle of thinly traded food and protectionist policies inflicts collateral damage on private sector investments. Restrictive policies that change frequently over time enhance risk and discourage investment in rice supply chains. These risks exacerbate those related to the already uncertain nature of rice production and can, indeed, lead to an unwinding cycle of continu-ously dwindling investment, reduced food production, and spiraling food prices.
Even exporting countries such as Thailand and Vietnam, which are more than self-sufficient in rice, use parastatals in the rice business, a practice traditionally explained by the desire of government to prevent farm prices from falling so low during harvest seasons as to discourage rice cultivation. However, the activities of parastatals have discouraged the participation of the private sector in the export business and thus reduced the efficiency, precision, and adaptability of regional supply chains.4

286 Using Trade to Enhance Food Security in Southeast Asia
Trade Policy and Food Security • http://dx.doi.org/10.1596/978-1-4648-0305-5
enhancing r egional t rade c oordination to improve Food s ecurity
Proposed measures to facilitate trade in rice and enable private sector participa-tion include enhancing regional trade coordination. Simplified and expanded trade is a critical element of the recommended shift in rice sector policies. The experience of the 2007–08 crisis has moved the issue of regional rice trade to a much higher place on the policy agenda. Since the issuance of the ASEAN Integrated Food Security framework in 2008 and the further successful adoption of the ASEAN Trade in Goods Agreement (ATIGA) in 2009, the probability of affecting regional food policy reforms has greatly improved.5 With that being said, it remains clear that rice-deficit countries within the region would still prefer to hang on tenaciously to their long-held goal of rice self-sufficiency.
At the 14th ASEAN Summit in Bangkok in February 2009, the heads of ASEAN member states signed the ATIGA to “achieve free flow of goods in ASEAN as one of the principal means to establish a single market and produc-tion base for the deeper economic integration of the region towards the realiza-tion of the AEC [ASEAN Economic Community] by 2015.”6 To facilitate private sector business transactions, the agreement codifies all trade-related agreements within ASEAN and clearly articulates the region’s free trade rules, making them more transparent, predictable, and certain.
The agreement encompasses the key provisions of the ASEAN Free Trade Agreement (AFTA) on tariff liberalization, as well as its related rules on origin, nontariff measures, trade facilitation, customs, standards, technical regulations and conformity assessment procedures, sanitary and phytosanitary measures, and trade remedies. ATIGA enters into force with the member states depositing their respective instruments of ratification with the secretary-general of ASEAN. The process is envisioned “not [to] take more than one hundred and eighty (180) days after the signing of this Agreement.”7
Even before the formal ratification of ATIGA, however, ASEAN member states could still move ahead with new structures for regional trade. A particu-larly attractive leverage point involves rice procurement policies and practices used by public sector entities to import food grains. Policy makers should be willing to explore the benefits of harmonizing these procurement practices and, in the process, set regional rules for grain trading.
To make this ambitious new approach possible, governments need to establish workable standards for several important aspects, including the following: (a) rice quality standards and controls; (b) technical capabilities of asset managers, ware-house personnel, and intermediary handlers; (c) liabilities of buyers and sellers under standard negotiable bills of sale; (d) clarity with respect to custodial responsibilities through the entire chain; (e) standard agreements for the reas-signment of ownership rights for products moving in transit; (f) standard securi-tized interests for third parties providing trade finance; and (g) carrier and port handling liability under standard bills of lading. Any such set of commercial rules would need to be collaboratively updated and revised from time to time with the private sector to reflect changes in technology and best business practices.

Using Trade to Enhance Food Security in Southeast Asia 287
Trade Policy and Food Security • http://dx.doi.org/10.1596/978-1-4648-0305-5
To this end, the NFA in the Philippines and BULOG in Indonesia could be tasked by ASEAN with formulating regionwide, rule-based procurement prac-tices, including the following:
• Setting standards for rice grades and quality levels• Establishing module lot sizes consistent with efficient transport and storage
capacities within the region• Establishing trading terms consistent with International Commercial Terms
(ICC 2010)• Defining the liabilities and responsibilities of all trading partners under nego-
tiable contracts of sale• Establishing standard custodial responsibilities for third-party warehouse per-
sonnel and transporters• Enabling third-party financial institutions to create secure interests in invento-
ries that they have financed
However, policy makers weighing the potential of such a trade structure will also have to acknowledge the remaining bias in the region against full integration of individual national rice markets into either global or regional markets. An underlying assumption—which prevailing policies make self-fulfilling—is that the world rice market is not a dependable source of food supply because of its relatively small size and associated price volatility. However, good evidence exists that full liberalization of regional rice markets would allow ASEAN countries to realize benefits that would dwarf any costs associated with perpetuating existing policies (McCulloch and Timmer 2008). In any case, adjustment costs should not be the determining factor that deters full engagement in more robust regional rice trade.
A key test of progress is the action that member states have taken to eliminate duties on all imported goods originating in ASEAN countries scheduled to be done by 2010 for Brunei Darussalam, Indonesia, Malaysia, the Philippines, Singapore, and Thailand (ASEAN 6), and by 2015–18 for Cambodia, Lao PDR, Myanmar, and Vietnam. For rice and maize, import duties are to be reduced to 0–5 percent from the respective rates that prevail at the time the agreement enters into force.
The new rates, referred to under the treaty as Common Effective Preferential Tariff (CEPT) rate levels, are legally binding. Although member states have com-mitted not to increase their import duties above CEPT, Indonesia, Myanmar, and the Philippines have placed rice on their respective “sensitive” or “highly sensi-tive” lists and have opted out of the tariff reform. Indonesia has agreed to impose a 25 percent import duty as its final AFTA rate. Myanmar has until 2015 to adjust its import duty on rice. After its bilateral negotiation with Thailand, the Philippines will be imposing a preferential tariff rate of 35 percent on rice, with a possible earmarking of its imports from Thailand and Vietnam.
The result of continuing restrictive trade policies for rice is that final AFTA rates on rice imports originating in ASEAN are far from those that
288 Using Trade to Enhance Food Security in Southeast Asia
Trade Policy and Food Security • http://dx.doi.org/10.1596/978-1-4648-0305-5
might be expected in a free trade area. For instance, Malaysia, which has not nominated rice as a sensitive commodity, has committed to a final AFTA rate of 20 percent, down from its MFN rate of 40 percent.8 The importation of rice will apparently continue for some time to be significantly restricted by high tariffs. However, tariffs are only one part of the problem: the most important constraint is the continuing dominant role of parastatals in rice trade.
As discussed earlier in this chapter, independent of ATIGA compliance, the NFA’s continued import monopoly complements the Philippine government’s continuing restriction on private importation of rice to very limited quantities. Thailand’s and Vietnam’s demands to secure a larger annual volume commit-ment from the Philippines would perpetuate the same arrangement that has kept the flow of rice trade in the region as low as it has been to date, because such arrangements would inevitably be government to government. Trade would have better prospects if the private sector on both sides of the market were legally enabled to participate. As of October 2011, the NFA is permitting private sector imports. They have to be organized through tenders to the NFA, however, and within quantity limits set by the government.
To end the NFA’s exclusive rice-importing privileges, however, the govern-ment of the Philippines would have to ask permission from its congress to amend the NFA charter. From the perspective of political viability, this would be diffi-cult to accomplish not only in the short term, but also even in the medium term. Legislative changes required to alter the NFA charter are in limbo, although in July 2010 the issues of overimportation and rotting rice stocks in NFA ware-houses did encourage discussions on NFA reform.9
Rather than holding the entire ATIGA hostage because of this impasse, the Philippines could commit itself to amending the NFA charter within a workable but specifically defined time period.10
ATIGA itself is silent on the role of STEs and the preferential treatment that member states accord them at the expense of private firms. The worst situation exists when STEs exercise regulatory oversight. The resulting conflict of interest poses an even more significant disincentive for the private sector to invest in regional food chains. Furthermore, because of the advantages some receive in fiscal subsidies and preferential access to commercial credit, large private compa-nies are deterred from entering the rice sector.
c onclusion
Today, concern about the future direction of food prices and the functioning of regional food markets remains acute in Southeast Asia. Market uncertainty is further exacerbated by policy uncertainty. Reduction of risk by addressing both types of uncertainty could help strengthen regional food security. ASEAN and its member countries can signal a new beginning by supporting efforts to remove policy obstacles to increased private sector participation and trade in regional rice markets. Specifically, reducing preferential tariffs on

Using Trade to Enhance Food Security in Southeast Asia 289
Trade Policy and Food Security • http://dx.doi.org/10.1596/978-1-4648-0305-5
rice trade below the current high levels already agreed and progressively lim-iting the participation of STEs in regional food staple markets are key reforms for which ASEAN member states could agree as an overdue invitation to private sector participation in rice supply chain development throughout the entire region.
Annex 11A: state t rading enterprises (parastatals) in s elected Ase An c ountries
IndonesiaIndonesia’s rice policy has been predicated on the view that food security is synonymous with self-sufficiency, together with the belief that farmers need to be supported and consumers need to be protected from high prices. From the mid-1960s until the late 1990s, the state parastatal in Indonesia, the Board of Logistics (Badan Urusan Logistik, or BULOG), was dominant in defending floor and ceiling prices through monopoly control over interna-tional rice trading and through domestic procurement, drawing on an unlim-ited line of credit from the Bank of Indonesia (Sidik 2004). Since then, BULOG’s intervention in the rice market has taken two forms. First, the parastatal is charged with distribution of rice to the poorest households (dis-cussed later in this annex). Second, BULOG intervenes in the market when the price to farmers for paddy goes below a certain price (2,500 rupiah [Rp] per kilogram in 2009).
Although it does buy some paddy, BULOG intervenes primarily by buying rice (20 percent brokens) from millers (at Rp 4,600 per kilogram in 2009).11 Given that BULOG apparently sets itself a procurement target every year and has limited resources, how it would respond if prices fell beyond the ability of its procurement target to influence the market is not clear. In addition to buying rice, BULOG also owns 132 rice mills, each with a capacity of 3 tons per hour. This volume appears excessive in light of the parastatal’s current involvement in the market, although clearly it has a perceived need to ensure nationwide coverage.
Indonesia did not suffer from the 2007–08 rises in world market prices, in part because of associated production increases. In 2008, virtually no change occurred in either the domestic producer or the consumer price for rice. When Indonesia has had to import significant quantities in the past, world prices were relatively low.
MalaysiaGovernment announcements from time to time commit Malaysia to rice self-sufficiency. However, its levels of self-sufficiency have fluctuated between 68 percent and 86 percent of domestic consumption since the 1970s. The levels are much higher on peninsular Malaysia (more than 80 percent) than in Sabah (30 percent) and Sarawak (50 percent).

290 Using Trade to Enhance Food Security in Southeast Asia
Trade Policy and Food Security • http://dx.doi.org/10.1596/978-1-4648-0305-5
The emphasis of government policy in Malaysia has historically been on promoting rice production. From 1931, when the Rice Cultivation Committee was formed, a succession of government organizations have been devoted to rice promotion, culminating in the formation of the Padi and Rice Board (Lembaga Padi dan Beras Negara, or LPN), in 1981. In 1974, LPN was given the sole import rights for rice. In 1994, it was corporatized into Padiberas Nasional Berhad (BERNAS), which was to take over all commercial functions. In 1996, BERNAS was fully privatized (the government retained a “golden share”), while still being charged with social obligations such as subsidy distribution to farmers and functioning as a buyer of last resort. It was also given sole import rights for 15 years.12
Because rice millers are required to produce 30 percent of their output at standard and premium quality, BERNAS is free to determine the price of its superior-quality rice, the profits from which are used to cross-subsidize the mini-mum production required in standard- and medium-quality rice. Although its responsibilities in many ways duplicate those of the NFA in the Philippines and BULOG in Indonesia, BERNAS is a private company traded on the Kuala Lumpur Stock Exchange.
The rice industry in Malaysia is heavily regulated, with the aim of assisting farmers, who are mainly poor, through subsidies and income support. Significant improvements have occurred in productivity, but production in many parts of peninsular Malaysia seems to have reached a plateau because of competition for land from housing and industrial development. Given constraints on further developing the rice sector and because the nation has a large trading surplus, some have argued that the country should aim for self-reliance rather than self-sufficiency and develop innovative sourcing and trading strategies rather than concentrating purely on production.
The PhilippinesState intervention in agricultural production and marketing in the Philippines started when bad weather caused a drastic shortfall in staple food grain in 1962 (David, Intal, and Balisacan 2009). During the same year, the National Rice and Corn Administration was established to ensure low, stable prices for consumers and adequate price incentives for farmers to produce. A monopoly over the importation of rice was then granted to the agency, as well as budgetary support and a credit line to undertake domestic market procurement and distribution in pursuit of maintaining domestic price stability. The agency’s power over importa-tion was expanded in the early 1970s during the surge in world commodity prices. Renamed the National Grains Administration, it was allowed to import rice and maize duty free. In 1981, the agency was further renamed the NFA, and it expanded its import monopoly to cover wheat, soybean meal, soybeans, rumi-nant livestock, and beef.
Paddy support prices are provided under a two-tiered price mechanism, which the NFA operates. In 2002, paddy support prices were 9,000 pesos (P) (US$715) per ton for wet-season paddy and P10,000 (US$194) per ton for

Using Trade to Enhance Food Security in Southeast Asia 291
Trade Policy and Food Security • http://dx.doi.org/10.1596/978-1-4648-0305-5
dry-season paddy, with an additional P500 (US$10) per ton granted to members of farmers cooperatives.
The effectiveness of the government’s intervention in paddy markets depends on the volume traded, which in turn is determined by the amount of resources available for the program. After 2008, the procurement price of paddy rose to P17,000 per ton, but until then the Philippines had not adjusted its procurement price because it relied on rice imports to influence the domestic rice market. Besides, prices that private traders paid farmers for paddy were considered rea-sonable, at least until fertilizer prices rose dramatically in 2006 and 2007. Until those pressures adversely affected farm profitability, the paddy market in the Philippines had largely been determined by farmers and private traders.
By law, only the NFA is allowed to import rice in the Philippines. However, it delegates the importation of about 200,000 metric tons to hotels, restaurants, and farmers cooperatives. Accredited farmers cooperatives that wish to supple-ment their locally procured rice with imported rice and that have experience with importing can obtain import permits from the NFA. The agency sets aside 10,000 tons for this purpose. A financing facility is also provided to cooperatives through the Land Bank of the Philippines.
Between 1995, when the last rice queues were observed, and 2008, the NFA had managed to stabilize prices successfully by using rice imports.13 Not even the El Niño phenomenon in 1997 and 1998 challenged the agency’s capacity to drive domestic prices to levels it determined reasonable. Private traders acknowledged the NFA’s ability to intervene and successfully stabilize prices and operated with that expectation. Paddy prices likewise tracked rice prices, except for the few weeks following harvests.
In 2008, however, the market shifted against the NFA when its announced prices failed to move the market. Rice queues returned, and speculation grew as traders bet on the volume of rice imports that the NFA could secure. Essentially betting against the NFA’s ability to make official prices stick, traders started to hold on to rice stocks, adding further upward pressure to domestic prices. Many of these traders’ precautionary moves lost them money, but their initial expecta-tions had a real impact.
The cost of running the Philippines’ food security program is exceedingly high. The NFA is provided a fiscal subsidy of about P1.5 billion a year to cover its overhead.14 The cost of its operations is financed with corporate debt, which the Department of Finance fully guarantees. The agency has been accumulating additional debt year after year with commercial banks and continues to float long-term bonds to cover its accumulating deficit. The program has become financially unsustainable, and it requires a major rethinking to keep costs in line.
As an instrument for the implementation of government food security policy, the NFA suffers from several disadvantages, which include its charter mandate, its management processes, and a lack of competition to challenge its decisions and market directions. Not all of the NFA’s costs can be recovered, because the nation’s rice distribution policies, which the NFA executes, entail the distribution of subsidized rice to the poor. The NFA also holds stocks longer than private

292 Using Trade to Enhance Food Security in Southeast Asia
Trade Policy and Food Security • http://dx.doi.org/10.1596/978-1-4648-0305-5
sector traders would because of its mandate to manage the country’s buffer stocks. These constraints, traceable to the agency’s charter, are exacerbated by management inefficiencies, relative to the private sector, in undertaking trading operations. Thus, with nearly all imports in the hands of the NFA, the govern-ment ends up paying more than the price it recovers for every ton of rice it injects into the market. The debt of the enterprise will continue to rise each year until the government makes appropriate changes both in policy and in mode of implementation.
One notable opportunity to reform the NFA involves decentralizing its rice import activities. Currently, the NFA absorbs the entire cost of rice imports, because it is the only entity allowed by law to import. In 2010, it announced that it would import between 2.5 million and 3.0 million metric tons. At US$600 per metric ton, this amounts to an inventory financing requirement of US$1.5 billion to US$1.8 billion. If import activities had been decentralized, some of these costs could have been absorbed by the private sector.
Another benefit of decentralizing rice imports would come from spreading the risk of making market decisions that turn out to be incorrect. If the NFA misreads the market, the cost of rice imports can become unnecessarily high, as happened in 2008, when according to Slayton (2009), the NFA “panicked” and disturbed the world’s rice market by issuing unprecedented large rice tenders, thus pushing the world rice price up. Distributed among many private traders, these imports would have been more appropriately priced to the benefit of both the country and the regional market.
ThailandThe BAAC, in cooperation with another government-owned company, the PWO, procured paddy directly from farmers at minimum prices until 2009 through the government’s paddy mortgage and pledging scheme. In 2001–02, the paddy-pledging scheme was extended to the highest-grade fragrant rice and the overall quantities targeted for intervention were substantially increased. Guaranteed prices were kept unchanged between 1999 and 2001 and were raised marginally in 2002 (FAO Commodities and Trade Division 2003).
In addition to channeling farm support to rice farmers, the program enabled the government to control the country’s rice export supply. By November 2009, the government had achieved a virtual export monopoly by accumulating 6 million metric tons in storage, about two-thirds of Thailand’s annual rice exports. As explained below, the program had the unanticipated effect of passing on the government’s subsidy to rice consumers in the rest of the world—or, if other, more competitive rice suppliers like Vietnam did not implement similar programs, of inducing financial losses for Thailand itself. This happened in 2009.
In the first crop of 2008, Thailand set its minimum price at 10,000 baht (B) per metric ton and raised this to B 14,000 in the second crop to reflect rising world prices in the global market and to encourage more supply from its farmers. According to Forssell (2009), the increase amounted to providing

Using Trade to Enhance Food Security in Southeast Asia 293
Trade Policy and Food Security • http://dx.doi.org/10.1596/978-1-4648-0305-5
a subsidy of 20 percent to all farmers in Thailand. However, because world prices began to fall in the second half of 2008, the subsidy proved to be higher. The recovery price associated with the minimum price of B 14,000 was US$900 per metric ton. Unfortunately for Thailand, world prices fell to less than US$700 in that period.
Forssell (2009) reports that export orders ceased in the second half of 2008 as importing countries waited for Vietnam’s harvest. In the meantime, Thailand was forced to absorb the cost of the subsidy it had provided to its rice farmers. Thailand’s experience in 2008 indicates that the additional transaction costs asso-ciated with government management of large stocks can have a major impact on global trade, particularly when markets are thin. Large stocks in the hands of governments cannot move fast enough to relieve serious shortages. Public sector decision making can be slow when officials are trying to achieve multiple objec-tives with the stocks they control, including efforts to recover sunk costs. In the case just cited, shortages persisted while the Thai authorities were slow to respond, before new suppliers could provide relief. The previous anecdote further illustrates the lack of a level playing field on which both private and public sector entities can operate. This lack of competitive equity appears to be a general char-acteristic of domestic paddy and rice markets in the region. Private traders are often hampered because of limited access to a ready supply of rice. They are sometimes forced to stop procuring because they become uncompetitive relative to the government, which can buy paddy at higher prices. Many of them decide to provide milling and warehouse services to the government instead, hoping they might be able to gain advantage in tenders that governments are almost certain to undertake when these governments later attempt to unload their stocks.
The experience also highlights the importance of decentralizing decision making. Decentralized decisions, as contrasted with single-government-agency decision making, enable a country to read market signals better and avoid unnec-essary financial losses. For example, the Thai government misread the market when it increased the minimum price for its second crop. It failed to anticipate that the world price might go down in the second half of 2008, as it did.
In 2009, the government of Thailand replaced the program with direct income support to rice farmers. However, this new program remains tied to production. It pays subsidies based on evaluations made by District Agricultural Cooperatives Boards in the local areas and based on differences between a benchmark price and the average market price paid by traders. Although the government no longer procures paddy, if the difference is too high it can resume past paddy procure-ment actions. A quality requirement also applies to the new program, which is intended to avoid the dumping of poor-quality rice. Only farmers whose rice has no more than 15 percent moisture content are eligible for support.
VietnamSince the late 1980s, Vietnam has made remarkable progress in transforming from a closed command economy to an open market economy (Athukorala, Huong, and Thanh 2009). Key to this transition has been the implementation of

294 Using Trade to Enhance Food Security in Southeast Asia
Trade Policy and Food Security • http://dx.doi.org/10.1596/978-1-4648-0305-5
agricultural reforms, including the transition from collective regimes to a system in which farmers can freely make production decisions and market their produce.
Vietnam abolished quantitative restrictions on its rice exports in 2001. This initiative opened up international trade to private players. Rice-exporting com-panies, however, were still required to preregister their export contracts. Hence, the bulk of Vietnamese rice exports remain highly regulated by the government through the VFA, a government body that works in close collaboration with the state-owned Northern Food Corporation (VINAFOOD1) and Southern Food Corporation (VINAFOOD2).
Vietnam’s Export-Import Management Mechanism15 replaced the nation’s export quota with regulation through MEPs between 2001 and 2005. These regulated prices were intended to ensure that sufficient rice was retained within the country to cover domestic needs. The use of MEPs and the uncertainties caused by frequent changes in them continue to distort the decisions of private traders. MEPs are supposedly set so that farmers can realize at least a 30 percent return on rice farming.
On May 1, 2005, all Vietnamese companies holding a license to trade in food or agricultural commodities were permitted to participate in rice exporting. However, VINAFOOD2 maintains an effective monopoly. Exportation of rice now falls under the direction of a management team led by the Deputy Minister of Industry and Trade. Other high-level ministries that participate include the Ministry of Agriculture and Rural Development, the Ministry of Finance, the Government Office, the Ministry of Planning and Investment, and the State Bank. Through this mechanism, the government often imposes various tempo-rary market intervention measures, such as pledging to purchase all rice in storage (at the peak of the harvest, when supply exceeds demand) to maintain stable prices. Another type of intervention involves the VFA, which may be directed from time to time to request enterprises to desist from exporting and stop signing further export contracts to stabilize domestic prices.
In the first half of 2008, a series of disruptive policy interventions took place in Vietnam (Slayton 2009). These involved first setting export targets and then reducing them, advising private exporters not to open new export contracts, ban-ning export sales outright, and canceling or changing MEPs. The purpose of these regulations was to keep rice within Vietnam’s borders to safeguard local supply and to keep it affordable. By raising the MEP, the government effectively signaled private traders not to procure paddy, since a high MEP set above world prices deprived them from a reasonable return in the export business.
At the same time, the government through VINAFOOD2 continued to export rice to the Philippines according to a government-to-government agree-ment. This government direct dealing represented a clear conflict of interest vis-à-vis the private sector. Essentially, the government-owned exporter cornered available export contracts and drove the private traders out of the market. Interestingly, domestic prices failed to decline in response to these initiatives undertaken in the name of food security. Indeed, by April 2008, rice prices in

Using Trade to Enhance Food Security in Southeast Asia 295
Trade Policy and Food Security • http://dx.doi.org/10.1596/978-1-4648-0305-5
Ho Chi Minh City had doubled. Slayton (2009) suggests that when the head of the VFA projected that rice prices could reach US$1,400 per ton, local traders expected further increases and increased their purchases. Unfortunately, they held those stocks longer than they should have; in the second half of 2008, these traders were caught with large volumes of rice when the world price fell by half in just a matter of months. As a result of financial losses, private trading company procurement slowed down, thus pulling down farm prices.
Frequent changes in regulations introduce uncertainty in the domestic rice market in Vietnam. This uncertainty typically induces speculation and ultimately results in financial losses to all players. In the end, those regulations intended to help have also incurred significant losses. Farmers had to discount the value of their stocks in the summer of harvest of 2008, and rice consumers were forced to adjust their consumption as well in response to rising prices. Private traders who changed their fundamental mode of operations in an effort to stay out in front of government maneuvers ultimately incurred losses as well.
notes
1. The group includes the 10 ASEAN member states, plus China, Japan, and the Republic of Korea.
2. Under the Agreement on Agriculture (AoA), the use of quantitative import restric-tions on agricultural products is prohibited. Existing restrictions are to be converted into ordinary customs duties, unless a member avails itself of a right under the agree-ment to defer implementation of this commitment.
3. The nominal rate of assistance (NRA) to producers is the percentage by which the domestic producer price is above (or, if negative, below) the border price of a like product. This measure is an estimate of direct government policy intervention (because of trade taxes, taxes, or subsidies to domestic production, for example, or government intervention in the domestic market for foreign exchange). It is net of transportation and trade margins. Anderson and Martin (2009) define NRA as the percentage by which government policies have raised the gross returns to producers above the gross returns they would have received without government intervention.
4. Slayton (2009) points out that profit considerations drove the government of Vietnam to adjust its export policies through the 2008 crisis.
5. The agreement encompasses the key provisions of the ASEAN Free Trade Agreement (AFTA) on tariff liberalization, as well as its related rules on origin; nontariff measures; trade facilitation; customs; standards; technical regulations and conformity assessment procedures; sanitary and phytosanitary measures; and trade remedies.
6. ASEAN Trade in Goods Agreement, chap. 1, art. 1, ASEAN, Jakarta, http://www .aseansec.org/22223.pdf.
7. ASEAN Trade in Goods Agreement, chap. 11, art. 96, ASEAN, Jakarta, http://www .aseansec.org/22223.pdf.
8. According to World Trade Organization (WTO) agreements, WTO members cannot treat their trading partners differently. This principle is known as MFN treatment. See WTO, “Principles of the Trading System,” http://www.wto.org/english/thewto_e / whatis_e/tif_e/fact2_e.htm.

296 Using Trade to Enhance Food Security in Southeast Asia
Trade Policy and Food Security • http://dx.doi.org/10.1596/978-1-4648-0305-5
9. For more on the issues, see “Philippines to Review Rice Import Program amid Excessive Supply,” Commodity News for Tomorrow, July 27, 2010, and relevant articles at Rice Online, http://www.riceonline.com/home.shtml.
10. Adding to the complexity of the issue is that although the president may lower the high import duty on rice in the context of AFTA, the congress can always restore it. Avoiding confrontation with the legislative body, previous presidents have resorted to tax expenditures for the National Food Authority (NFA) and occasionally for the few private sector importers that the NFA authorized to participate.
11. Broken rice is rice with kernels that are less than three-quarters the length of the whole kernel (FAO 1998). The percentage of rice that is considered broken is a measure of the quality, or level of refinement, of rice. Brokens are the rice fragments produced during threshing and hulling. They are removed in the rice mill by screening at the end of processing and are usually further processed into rice flour or rice semolina.
12. See Athukorala and Loke (2009) for an enumeration of other specific roles of BERNAS besides importing.
13. In 1995, the government overestimated the country’s local rice supply. The NFA had inadequate rice stocks as the Philippines went into lean months for rice from June to August, and it had to ration to household representatives waiting in line at its branch offices.
14. Please note that the Philippines moved to a system of conditional cash transfers at the beginning of 2011, and, as a result, the NFA is no longer responsible for subsidized distribution.
15. Slayton (2009) points out that profit considerations drove the government of Vietnam to adjust its export policies through the crisis.
r eferencesACI (Agrifood Consulting International). 2010. Enhancing Food Security in ASEAN: Policy
Reforms, Private Investment in Food Supply Chains, and Cross-Border Trade Facilitation; Supply Chain Organization and Infrastructure. Final report prepared for the World Bank, ACI, Bethesda, MD, February 1.
Alavi, Hamid, with Aira Htenas, Ron Kopicki, Andrew W. Shepherd, and Ramon Clarete. 2012. Trusting Trade and the Private Sector for Food Security in Southeast Asia. Directions in Development Series: Trade. Washington, DC: World Bank.
Anderson, Kym, and Will Martin. 2009. “Introduction and Summary.” In Distortions to Agricultural Incentives in Asia, edited by Kym Anderson and Will Martin, 3–82. Washington, DC: World Bank.
Anderson, Kym, and Ernesto Valenzuela. 2008. “Estimates of Global Distortions to Agricultural Incentives, 1955 to 2007.” World Bank, Washington, DC. http://www .go .worldbank.org/5XY7A7LH40.
Armas, Enrique Blanca, Camilo Gomez Osorio, and Blanca Moreno-Dodson. 2010. “Agriculture Public Spending and Growth: The Example of Indonesia.” Economic Premise 9 (April), Poverty Reduction and Economic Management Network, World Bank, Washington, DC.
Athukorala, Prema-Chandra, Pham Lan Huong, and Vo Tri Thanh. 2009. “Vietnam.” In Distortions to Agricultural Incentives in Asia, edited by Kym Anderson and Will Martin, 281–302. Washington, DC: World Bank.

Using Trade to Enhance Food Security in Southeast Asia 297
Trade Policy and Food Security • http://dx.doi.org/10.1596/978-1-4648-0305-5
Athukorala, Prema-Chandra, and Wai-Heng Loke. 2009. “Malaysia.” In Distortions to Agricultural Incentives in Asia, edited by Kym Anderson and Will Martin, 197–221. Washington, DC: World Bank.
Brennan, D. 1995. Policies for Stabilizing Rice Prices in Bangladesh. Final research, Report of the Bangladesh Foodgrains Management Operations Project, Chemonics International, Washington, DC.
Clarete, Ramon. 2010. Breaking Out of Food Insecurity: Prospects for Reforms of Food Policies in ASEAN. Report prepared for the World Bank, Washington, DC.
David, Cristina, Ponciano Intal, and Arsenio M. Balisacan. 2009. “The Philippines.” In Distortions to Agricultural Incentives in Asia, edited by Kym Anderson and Will Martin, 223–54. Washington, DC: World Bank.
Dorosh, Paul. 2008. “Food Price Stabilisation and Food Security: International Experience.” Bulletin of Indonesian Economic Studies 44 (1): 93–114.
Dorosh, Paul, and Quazi Shahabuddin. 2002. “Rice Price Stabilization in Bangladesh: An Analysis of Policy Options.” MSSD Discussion Paper 46, International Food Policy Research Institute, Washington, DC.
FAO (Food and Agriculture Organization of the United Nations). 1998. “Crop and Grassland Service: International Rice Commission.” FAO, Rome. http://www.fao.org / WAICENT/FAOINFO/AGRICULT/AGP/AGPC/doc/riceinfo/Riceinfo.htm.
FAO (Food and Agriculture Organization of the United Nations) Commodities and Trade Division. 2003. Review of Basic Food Policies. Rome: FAO. ftp://ftp.fao.org/docrep / fao/007/y5073e/y5073e00.pdf.
Forssell, Sara. 2009. Rice Policy in Thailand: Policy Making and Recent Developments. Minor Field Study Series 189, Department of Economics, University of Lund, Sweden.
Goletti, Francesco, Raisuddin Ahmed, and Nuimuddin Chowdhury. 1991. “Optimal Stock for the Public Foodgrain Distribution System in Bangladesh.” Working Paper 4, Food Policy in Bangladesh, International Food Policy Research Institute, Washington, DC.
ICC (International Chamber of Commerce). 2010. Incoterms® 2010. Paris: ICC. http://www.iccwbo.org/incoterms/.
Jha, Shikha, and Aashish Mehta. 2008. “Effectiveness of Public Spending: The Case of Rice Subsidies in the Philippines.” ADB Economic Working Paper Series 138, Asian Development Bank, Manila.
McCulloch, Neil. 2008. “Rice Prices and Poverty in Indonesia.” Bulletin of Indonesian Economic Studies 44 (1): 45–63.
McCulloch, Neil, and C. Peter Timmer. 2008. “Rice Policy in Indonesia.” Bulletin of Indonesian Economic Studies 44 (1): 33–44.
Olken, Benjamin A. 2006. “Corruption and the Costs of Redistribution: Micro Evidence from Indonesia.” Journal of Public Economics 90: 853–70.
Rashid, Shahidur, Ashok Gulati, and Ralph Cummings Jr. 2008. “Grain Marketing Parastatals in Asia: Why Do They Have to Change Now?” In From Parastatals to Private Trade: Lessons from Asian Agriculture, edited by Ashok Gulati, Shahidur Rashid, and Ralph Cummings Jr., 10–48. Baltimore, MD: International Food Policy Research Institute and Johns Hopkins University Press.
Rokotoarisoa, Manitra A. 2006. “Policy Distortions in the Segmented Rice Market.” Markets, Trade, and Institutions Division Discussion Paper 94, International Food Policy Research Institute, Washington, DC.

298 Using Trade to Enhance Food Security in Southeast Asia
Trade Policy and Food Security • http://dx.doi.org/10.1596/978-1-4648-0305-5
Rosner, L. Peter, and Neil McCulloch. 2008. “A Note on Rice Production, Consumption, and Import Data in Indonesia.” Bulletin of Indonesian Economic Studies 44 (1): 81–89.
Siamwalla, Ammar, and Suthad Setboonsarng. 1991. “Thailand.” In The Political Economy of Agricultural Pricing Policy, edited by Anne O Krueger, Maurice Schiff, and Alberto Valdés, 236–80. Washington, DC: World Bank; Baltimore, MD: John Hopkins University Press.
Sidik, Mulyo. 2004. “Indonesia Rice Policy in View of Trade Liberalization.” Paper presented at the Food and Agriculture Organization of the United Nations Rice Conference, Rome, February 12–13.
Simatupang, Pantjar, and C. Peter Timmer. 2008. “Indonesian Rice Production: Policies and Realities.” Bulletin of Indonesian Economic Studies 44 (1): 65–79.
Slayton, Tom. 2009. “Rice Crisis Forensics: How Asian Governments Carelessly Set the World Rice Market on Fire.” Working Paper 163, Center for Global Development, Washington, DC.
Sugden, Craig. 2009. “Responding to High Commodity Prices.” Asian-Pacific Economic Literature 23 (1): 79–105.
The Star. 2009. “86% Self-Sufficiency in Rice Production Next Year.” February 15. http://thestar.com.my/news/story.asp?file=/2009/2/15/nation/3272851&sec=nation.
Timmer, C. Peter, Walter P. Falcon, and Scott R. Pearson. 1983. Food Policy Analysis. Baltimore, MD: Johns Hopkins University Press for the World Bank.
Timmer, C. Peter, and Tom Slayton. 2009. “Arson Alert: Philippines Is Playing with Fire! Again!” Center for Global Development Notes, Center for Global Development, Washington, DC.
Warr, Peter, and Achanun Kohpaiboon. 2009. “Thailand.” In Distortions to Agricultural Incentives in Asia, edited by Kym Anderson and Will Martin, 255–79. Washington, DC: World Bank.
World Bank. 2001. Philippines: Filipino Report Card on Pro-Poor Services. Report 22181-PH, World Bank, Washington, DC.


Trade Policy and Food Security • http://dx.doi.org/10.1596/978-1-4648-0305-5
Environmental Benefits Statement
The World Bank Group is committed to reducing its environmental footprint. In support of this commitment, the Publishing and Knowledge Division lever-ages electronic publishing options and print-on-demand technology, which is located in regional hubs worldwide. Together, these initiatives enable print runs to be lowered and shipping distances decreased, resulting in reduced paper consumption, chemical use, greenhouse gas emissions, and waste.
The Publishing and Knowledge Division follows the recommended standards for paper use set by the Green Press Initiative. Whenever possible, books are printed on 50 percent to 100 percent postconsumer recycled paper, and at least 50 percent of the fiber in our book paper is either unbleached or bleached using Totally Chlorine Free (TCF), Processed Chlorine Free (PCF), or Enhanced Elemental Chlorine Free (EECF) processes.
More information about the Bank’s environmental philosophy can be found at http://crinfo.worldbank.org/wbcrinfo/node/4.

Based on forecasts of global population growth, food security will remain an important economic development issue over the next several decades. Real food prices have risen in recent years after decades of decline, bringing the issue of food security even further into the public spotlight. However, there is no global shortage of food; the problem is one of moving food, often across borders, from areas with a production surplus to those with a deficit, and doing so at prices that low-income consumers in developing countries can afford.
Many countries restrict imports of food and discourage exports to keep domestic markets isolated from international price changes. As a result, food commodity markets often remain highly distorted despite the wave of liberalization that has swept world trade since the 1980s. In fact, trade can be an excellent buffer for domestic fluctuations in food supply. Worldwide output of a given food commodity varies much less than does output on a country-by-country basis, so increased trade integration holds considerable potential to stabilize food prices, boost returns to farmers, and reduce the prices faced by consumers. Trade liberalization ultimately protects national food markets against domestic shocks by allowing more food to be imported in times of shortage and exported in times of plenty.
In addition to examining the determinants of recent food price spikes, Trade Policy and Food Security explores the impact of food prices on economic welfare, and how the effect of price changes on food insecurity in developing countries can be mitigated through appropriate policies. The book highlights the importance of extending existing World Trade Organization disciplines on trade-distorting agricultural policies. Doing so serves as a key resolution to the collective action problem witnessed during the recent food price spikes, whereby unilateral border policies—especially export controls—simply exacerbated the initial price increases.
ISBN 978-1-4648-0305-5
SKU 210305
Trade Policy and Food SecurityG
illson and Fouad