Studies on India–Bangladesh Trade - World Bank Documents
214
October 15, 2006 Document of the World Bank Report No. 37863-BD Studies on India–Bangladesh Trade (In Two Volumes) Volume II: Methodology and Selected Case Studies Poverty Reduction and Economic Management Sector Unit South Asia Region Trade Policies and Potential FTA Public Disclosure Authorized Public Disclosure Authorized Public Disclosure Authorized Public Disclosure Authorized Public Disclosure Authorized Public Disclosure Authorized Public Disclosure Authorized Public Disclosure Authorized
-
Upload
khangminh22 -
Category
Documents
-
view
0 -
download
0
Transcript of Studies on India–Bangladesh Trade - World Bank Documents
October 15, 2006
Document of the World Bank
Report No. 37863-BD
Studies on India–Bangladesh Trade
(In Two Volumes) Volume II: Methodology and Selected Case Studies
Poverty Reduction and Economic Management Sector UnitSouth Asia Region
Report N
o. 37863-BD
Studies on India–Bangladesh Trade V
olume II
Trade Policies and Potential FTA
Pub
lic D
iscl
osur
e A
utho
rized
Pub
lic D
iscl
osur
e A
utho
rized
Pub
lic D
iscl
osur
e A
utho
rized
Pub
lic D
iscl
osur
e A
utho
rized
Pub
lic D
iscl
osur
e A
utho
rized
Pub
lic D
iscl
osur
e A
utho
rized
Pub
lic D
iscl
osur
e A
utho
rized
Pub
lic D
iscl
osur
e A
utho
rized

ACKNOWLEDGMENTS
l k s report was prepared by Gany Purse11 (consultant, SASPR) and Zaidi Sattar (SASPR). Component studies on various aspects o f India-Bangladesh trade were made by Abdul Bayes, Sanjib Pohit and Samanthak Das, Rajesh Mehta, Arun Goyal and Ashu Garg (consultants). Data International conducted field survey on informal trade while Ziaul Ahsan compiled and analyzed essential data and provided superb general research support. Subject to time and other constraints, the authors did their best to take account o f suggestions made by Aaditya Mattoo, Will Martin, Paul Brenton, David Tarr, Phillip Schuler (all at Bank headquarters in Washington), and many insightful and thoughtful detailed comments received from peer reviewers Marcel0 Olareaga, I.N. Mukherjee (India), Zaid Bakht and Ismail Hossain (Bangladesh). The report was prepared under the overall guidance o f Sadiq Ahmed, Shanta Devarajan, and Alastair J. McKechnie. Ijaz Nabi and Ejaz Syed Ghani provided useful oversight and direction when they were needed. In the World Bank Dhaka office Aneeka Rahman and Nermeen Shams Rouf provided research support while Mehar Akhter Khan put the report together and skillfully formatted the voluminous text in record time. The study also relied on secretarial support at various stages from Oxana Bricha (Washington), Jyoti Sriram (Delhi) and Joyce Mormita Das (Dhaka). Lastly, the authors would like to express their appreciation to Suman Bery (NCAER) and Farooq Sobhan (BEI) for sponsoring the Dhaka and Delhi workshops, and to the many government officials, businessmen, academics, researchers, and others in India and Bangladesh, who attended and provided feedback, essential information and guidance during the preparation o f this report. Finally, the cooperation and support o f SEDF for the workshops i s gratefully acknowledged.
Vice President: Director for Regional Program: Sector Director: Sadiq Ahmed, SASPR Sector Manager: Ijaz Nabi, SASPR Task Manager: Zaidi Sattar, SASPR
Praful C. Patel, SARVP
Alastair J. McKechnie, SAC01
The report has been discussed with the Government o f India and Government o f Bangladesh but does not necessarily bear their approval for all its contents, especially where the Bank has stated i t s judgmentslopinionslconclusionslpolicy recommendations.


TABLE OF CONTENTS
1 . Analyzing the Economic Welfare Consequences of a Free Trade Agreement: Partial Equilibrium Methods for Industry Level Studies .......................................................................... 1
2 . Study of India-Bangladesh Trade and Trade Policies: Simulations of Economic Welfare Effects of a Free Trade Agreement ................................................................................................ 41
A Case Study of Light Bulbs .......................................................................................................... 41
A Case Study ofthe Cement Industry .......................................................................................... 63
A Case Study ofthe Sugar Industry ............................................................................................. 79
A Case Study ofthe Ready Made Garment Industry ............................................................... 133
A Case Study of Bicycle Rickshaw Tyres ................................................................................... 189

ANALYZING THE ECONOMIC WELFARE CONSEQUENCES OF A FREE TRADE AGREEMENT: PARTIAL EQUILIBRIUM METHODS FOR INDUSTRY LEVEL
STUDIES
This paper describes some simple methods which can be used to provide approximations at industry level o f the potential economic welfare consequences o f a free trade agreement (FTA) between two countries’. The methods have been designed with the Indian proposal (under discussion since about 2002) for an FTA with Bangladesh in mind, but they apply general principles and could be used for similar analyses o f actual FTAs or FTA proposals between other countries. Because the India-Bangladesh FTA i s a proposal and not a realized agreement, the methods discussed refer to ex ante simulations o f possible future outcomes, but the same principles would be relevant for ex post industry level studies of actual FTA agreements. They could also be applied directly w i th little modification to other bilateral preferential trading agreements between two countries, since a free trade agreement i s really just a preferential agreement where the tariff preferences are 100 percent instead o f a range o f intermediate percentages between zero and 100 percent. However, if more than two countries are parties to a preferential agreement or an FTA (such as the SAFTA in South Asia which involves seven countries) the analysis becomes more complex, because (subject to rules o f origin) all the countries in the grouping obtain duty free access to each others’ markets, and so the economic welfare consequences for any one o f the countries are affected by supply and demand conditions in al l the other countries. Consequently, quantifying the potential economic outcomes at industry level will usually require more information and w i l l be more demanding analytically, even though the basic principles remain the same.’
The suggested approaches to analyzing the l ikely economic welfare costs and benefits o f an FTA at the level o f individual products are quite general in principle, but they mainly have manufactured products in mind. I t i s recognized that there are many aspects o f primary agricultural and livestock product markets-for example their susceptibility to weather related disturbances, generally inelastic demand, the large swings in the world prices o f some commodities, and the propensity o f many governments, including the South Asian governments, to intervene as regards both the final products and their principal inputs-that require separate treatment. To do this satisfactorily would be a large task and it has not been attempted in this paper.
Even though SAPTA and various bilateral preferential trade agreements have been operating in South Asia for a number o f years, there i s little n o recognition o f their potential economic costs and benefits, either in the texts o f the agreements or in the general statements and discussions that have accompanied them. The negotiations and the debates have been almost entirely mercantilist, focusing on the extent to which under the agreements national industries do or do not obtain new export opportunities, resisting concessions that might provide serious competition for established local industries, and worrying
Here is a very extensive economics literature on preferential trading arrangements-both theoretical and applied- which deals with most o f the topics discussed in this paper. A non-technical summary o f the main issues covered by this literature i s in Wor ld Bank (2000) Trade Blocs, which also provides a comprehensive bibliography. A paper by Arvind Panagariya (“South Asia: Does Preferential Trade Liberalization Make Sense”? Mimeo, 2000) provides a succinct summary o f the basic theory underlying the economic welfare issues, using South Asia as an example. An account o f regional trade initiatives in South Asia up to 2001 i s in Garry Purse11 and Niha l Pitigala,”Trade Agreements in the South Asian Region”, Wor ld Bank mimeo, August 2001, and an update with a brief description and analysis o f more recent developments in South Asia i s in Chapter 5, Volume 1 o f Wor ld Bank (June 2004), Trade Polices in South Asia: an Overview. In the case o f SAFTA, India i s the only producer o f many industrial products, so for those products i t is equivalent to a series o f bilateral FTAs between India and each o f the other SAFTA members, w h c h could be analyzed along the lines o f the methods proposed in th i s paper. However, when more than one SAFTA member produces a product, i t would be necessary to take account o f and compare the l ikely competitiveness o f the industry in each country.

India-Bangladesh FTA: Methodology and Selected Case Studies
about losses o f Customs duty revenue. Lit t le or n o attention has been paid to the potential for trade diversion costs, by which trade may be diverted from low cost suppliers in other parts o f the world to higher cost suppliers in South Asia, or to the potential consumer costs and benefits. One purpose o f this paper and o f the applications o f the methodology to some industry case studies o f free trade between India and Bangladesh, i s to make these basic issues clear, realistic and i t is hoped easily understood by non-specialists in these two countries and in South Asia more generally. With this in mind a traditional and highly simplified comparative static framework has been used and applied to bring out the main points, fil ly recognizing that the simulated results for individual industries would need to be modified if general equilibrium including macro-economic repercussions (e.g. exchange rate effects) were considered. To simplify the presentation and also the empirical estimation o f welfare changes, the models use linear demand and supply functions, and except where otherwise indicated, assume competitive behavior on both the supply and demand sides. Market structures in South Asia-especially in manufacturing-are often far from competitive, but as a first approximation it i s useful to look at the outcomes on the assumption that f i rms behave as though they are competitive. Th is provides a benchmark which can be modified to allow for various forms o f non-competitive behavior in simulating the l ikely outcome o f an FTA.
The rest o f the paper i s divided into ten sections which provide a partial but by no means complete taxonomy o f the many possible outcomes at the level o f individual industries, o f a bilateral FTA between India and Bangladesh. I t i s hoped that the principles illustrated by the somewhat tedious task o f worlung through these examples will be sufficient to guide applied researchers in treating the many cases that will not exactly f i t these simplified models. T h e f i rst section deals with the economic welfare effects in three variants o f a basic “trade diversion” case. The second section covers some examples o f the possible economic welfare effects when there i s “trade creation” as a result o f the FTA. Both these sections assume that wi th the FTA Indian f i rms export to Bangladesh, but the principles illustrated are equally applicable to Bangladesh exports to India. In order to keep the analysis as simple as possible, the f i rst two sections do not deal wi th intermediate inputs: how these might affect the welfare outcomes in the importing country i s discussed in section three, and in the exporting country in section four. The fifth section deals wi th the potential consumption repercussions in the exporting country, using an example in which the FTA induces exports by Bangladesh f i rms to India. The sixth section discusses complications that arise when prior to the FTA there i s “bootleg” smuggling over the border that bypasses Customs posts, and which generally avoids domestic taxes in the importing country (especially VAT-style indirect taxes). The seventh section discusses how the economic welfare consequences o f an FTA may be affected by the prior existence o f “technical” smuggling that comes through Customs posts and which involves corruption o f Customs and other officials. Section 8 discusses how the existence o f economies o f scale in the industry being studied might affect the welfare outcomes, and sections 9 and 10 do the same for productivity changes and the presence o f foreign direct investment. The appendix summarize various practical suggestions for researchers on such things as the data they need to collect and shortcuts to use when data i s incomplete or not available, or when the resources for field work are limited.
Before proceeding a few points should be made about the some o f the assumptions and concepts that are standard for this kind o f analysis, but which are sometimes not well understood.
First, changes in ‘Leconomic welfare” resulting from an FTA are treated as the sum o f changes in consumers’ surplus, producers’ surplus and government revenue from tariffs (customs duties). Consumers’ and producers’ surpluses are a shorthand way o f summarizing economic benefits that may accrue to a variety o f economic agents, not just final consumers and producers. For example, governments normally share in producer surpluses through taxes on profits, and some shares may go to foreigners if there i s portfolio andor foreign direct investment (FDI). It may be especially important to take account o f the latter if a substantial part o f increased exports going to an FTA partner country are from firms fully or partly owned in the importing country. I t i s also likely that traders (e.g. wholesale distributors and
2

Partial Equilibrium Methods for Industry Level Studies
exporters) may share in producer surpluses, especially exporters who undertake marketing functions. Consumers’ surpluses may refer to benefits to buyers o f intermediate goods and equipment, not only benefits to final consumers. A s discussed in the following examples, changes in consumers’ surplus are the result o f increases or decreases in the price o f a single homogeneous good, but in practice the benefit or loss to consumers i s l ikely to also include increases or decreases in the number o f specifications, qualities or brands o f a given good that are available to consumers as a result o f trade pol icy changes such as an FTA e.g. consumers may benefit just because o f an increase in the number o f brands and varieties that are available, even if there i s no change in the prices o f the existing varieties. H o w to treat product heterogeneity i s discussed in the final section o f the paper.
Secondly, the paper only deals with FTAs in the context o f tariff protection, not QRs. As o f mid 2004, explicit QRs were not being used in India, and with some important exceptions-notably textile fabrics- tariffs and tariff-like import taxes (para-tariffs) were the principal protective instrument in Bangladesh. If the l ikely effects o f an FTA were to be simulated for an industry protected in either o f the countries by an explicit or de facto QR (e.g. para-statal import monopolies or prohibitively high anti- dumping duties in India) the same basic principles outlined below would be applied but would need to be adapted to the particular case, taking account o f whether and to what extent the FTA i s a true FTA by exempting bilateral trade from the QRs, even though they remain in place with respect to the imports from the rest o f the world.
Thirdly, except when there i s smuggling, only protective tar i f fs have been considered in estimating the fiscal costs o f FTAs, not indirect domestic taxes such as the VAT in Bangladesh and the additional (excise) duties and sales taxes in India. The latter are general taxes which are applied to both imports as well as domestic sales, and imports under preferential agreements such as FTAs are not exempt. Therefore, i f as a result o f an FTA duty free imports into Bangladesh o f product x from India replace imports o f x from the rest o f the world (ROW), the loss o f Customs revenue i s just the protective tariff (customs duty plus para-tariffs) that would have been paid on the imports from ROW, not the Bangladesh VAT on those imports, since that i s also charged on the imports from India. However smuggled goods w i l l usually avoid domestic indirect taxes as wel l as tariffs, so i f there i s smuggling this needs be taken into account in simulating the fiscal effects o f an FTA.
Fourth, the comparisons o f pre and post-FTA situations are o f standard comparative static “long run” equilibria which assume that al l the short run adjustments have been made on both the supply and demand side. As with any comparative static analysis, in principle i t i s possible to estimate the l ikely path to a new equilibrium and to calculate the present value o f the change, but the information required to do that with confidence i s generally difficult to obtain.
Fifth, for convenience the economic welfare comparisons use a common numeraire which could either be the currency o f one o f the countries (in the examples below the Taka or the Indian Rupee) or a common foreign exchange numeraire (e.g. the U S dollar). This means that changes in consumer surpluses, producer surpluses, and customs revenue are valued equally, both within each country and across countries. These could obviously be valued differently e.g. in Bangladesh a Taka or dollar o f customs revenue could be valued more or less than a Taka or dollar o f consumer benefits resulting from a reduced price o f some commodity, and a dollar o f producer surpluses in India could b e weighted differently from a dollar o f producer surpluses in Bangladesh. This i s always possible in any kind o f economic welfare analysis, but before this i s done, it i s useh l to calculate a starting point with known weights to provide the direction and provisional size o f the welfare changes.
Finally, it should be borne in mind that a free trade agreement i s very different from a common market. In particular, whereas a common market w i l l tend equalize prices in the member countries, with an FTA domestic prices for a given commodity in participating countries can differ, perhaps
3

India-Bangladesh FTA: Methodology and Selected Case Studies
substantially-in fact that i s l ikely to be the norm rather than the exception. Apart from differing domestic indirect taxes, for internationally traded goods, this i s principally because the member countries maintain their own tariff structures, and because duty free access to the markets o f the other FTA member or members i s always subject to rules o f origin requiring minimum levels o f national content which have to be verified wi th documentation presented as part o f Customs clearance. Unless there i s smuggling, these formal Customs requirements for trade prevent the kind o f arbitrage that tends to equalize prices at al l stages-ex factory, wholesale and retail-within a common market. Moreover, goods exported to an FTA partner country can normally be sold equally profitably at lower prices than the prices o f the same goods sold domestically, because (as i s the case with al l exports) the tar i f fs on the imported inputs used in their production are rebated or exempt. For these and other reasons, as discussed in the following sections, how domestic prices are determined following an FTA, and the resulting repercussions on the economic welfare o f the various groups that are affected, can be quite complex.
1 SOME BASIC TRADE DIVERSION CASES
F ig 1 illustrates a highly simplified but basic case, where prior to an FTA between India and Bangladesh, there i s production o f a particular product in India but no production in Bangladesh, and the Bangladesh market i s entirely supplied by imports which come from the rest o f the world (ROW) but not from India. The diagram shows the pre-and post FTA situation in the Bangladesh market for this product, with the vertical axis representing the price (which could be in Bangladesh taka or in any other currency . ..say U S dollars) and the horizontal axis representing the quantity o f this product supplied and demanded in Bangladesh. For simplicity, this example and the six following examples ignore intermediate inputs. As discussed later, allowing for intermediate internationally tradable inputs, o f which some may be purchased domestically and some imported, complicates the exposition and empirical analyses but does not change the basic principles.
Before the FTA the domestic price i s OA (also indicated as Pw+t) which i s the import price cif (Pw) plus the Bangladesh tariff BA. At t h i s price imports from ROW are distance OH, and customs revenue (in the absence o f smuggling) i s area ABCD. There are no Indian exports to Bangladesh, because the potential Indian supply curve o f this product inclusive o f the Bangladesh tari f f (indicated by the dotted supply curve S,+t) l ies above the tari f f inclusive price from ROW.
Following the FTA, Indian exporters no longer pay the Bangladesh customs duty, and the Indian supply curve to the Bangladesh market i s SI, allowing Indian f i rms to export profitably quantity OG, diverting this amount from the Bangladesh imports from ROW. There i s n o welfare change for Bangladesh consumers, since they buy the same quantity o f the product at the same pre-FTA price. However, the diverted imports involve reduced Bangladesh customs duties equivalent to area ABFE. This amount i s equal to the sum o f areas AGE and area GBFE. Area AGE (j3) i s a producers’ surplus benefit for the Indian exporting f i rms (the excess o f the price they receive in the Bangladesh market over the cost o f supplying this quantity), and area GBFE (a) i s the excess o f the production and marketing cost o f the quantity supplied from India over the cost at world (cif) prices o f the imports (OG) that previously came from the rest o f the world. Hence, by excluding exports from India from its general tariff and thereby making the protection o f the general tari f f available to Indian firms, Bangladesh has incurred an economic loss equivalent to the lost tariff revenue, and this in turn i s made up o f the higher production cost o f the imports from India, plus the producers’ surplus o f the Indian firms. I f these changes in economic welfare are valued equally, it i s apparent that in the case o f this product, the FTA has involved a net economic welfare loss for Bangladesh, an economic welfare gain for India, and a net economic welfare loss for Bangladesh and India taken together, since the gain to the Indian exporters i s less than the loss o f Bangladesh Customs revenue. In turn, this net joint loss i s equal to the excess cost 01 o f the trade diverted from ROW to India by the FTA tariff preference.
4
Partial Equilibrium Methods for Industry Level Studies
Two other economic welfare repercussions o f the FTA have been omitted from the above discussion. First, in some circumstances the Indian exports to Bangladesh may lead to increased prices in India, and consequently to consumer surplus losses for Indian consumers which should be offset against the producer surplus gains for Indian exporters. The factors affecting the welfare effects in the exporting country are discussed separately below: here it i s just noted that, because the Indian economy i s so much larger than the Bangladesh economy, consumption effects in India are l ikely to be small and perhaps negligible in the case o f preferential Indian exports to Bangladesh, but in some circumstances could be significant in the case o f FTA-induced Bangladesh exports to India. A second welfare repercussion i s the economic cost (represented by reduced producer surpluses) o f the exports from ROW countries that the FTA diverts to India. Depending on the production costs o f these exporters and the tax situations they face in their home countries, these producer surplus losses might exceed or might be less than the producer surplus gains to the Indian exporters. In any case they should be recognized in any overall accounting o f the net economic welfare effects o f an FTA.
F ig 2 illustrates a case which i s identical to the case just discussed, except that before the FTA part o f the Bangladesh market i s supplied by Bangladesh producers. T h i s i s indicated by the Bangladesh supply curve Sg, which intersects the duty inclusive import price line at point M, indicating that before the FTA the Bangladesh industry supplies output OH while imports are represented by distance HK. Hence before the FTA customs revenue i s area MFCD. Following the FTA, Indian exports to Bangladesh become feasible and this i s represented by the Indian export supply curve to Bangladesh SI. The combined supply from Bangladesh producers and Indian f i r m s to the Bangladesh market can be represented by the aggregate supply curve (SB+SI), which i s the horizontal summation o f the two national supply curves. Th is supply curve intersects the tariff inclusive price l ine at K, indicating unchanged production and supply O H from Bangladesh f i rms and Indian exports to Bangladesh HJ.
As in the previous example, since the Bangladesh price does not change, there is no change in the economic welfare o f Bangladesh consumers, and there are also no price or production adjustments for Bangladesh producers, and therefore no welfare losses for them, since their producer surplus (area AGM) remains the same. However, imports from ROW have declined by HJ, resulting in a Customs revenue loss to Bangladesh o f area MFGK. The benefit to Indian exporters to Bangladesh i s represented by the triangular area between the duty inclusive price l ine and the Indian supply curve: for convenience this area has been replicated as area MLK by drawing the dotted line LK parallel to the Indian supply curve starting at the supply OH coming from the Bangladesh producers. Hence, the FTA causes an economic welfare loss to Bangladesh equal to i t s reduced customs revenue, an economic gain to Indian exporters measured by their producers’ surplus, and a net joint combined economic welfare loss to India and Bangladesh o f area LFGK, which measures the excess cost o f the Indian production over the cost to Bangladesh of the displaced imports from ROW. As previously, these economic welfare consequences o f the FTA for this industry need to be supplemented by the potential consumption costs in India resulting from the new Indian exports, and the producer surplus losses resulting from the exports diverted from other countries to India.
F ig 3 illustrates the same case as Fig 2, but with the difference that the Indian industry i s exporting to Bangladesh prior to the FTA and therefore i s able to compete in the Bangladesh market with ROW producers while paying normal tar i f fs and without the benefit o f the FTA. In F ig 3, before the FTA Indian exports to Bangladesh are OS, Bangladesh producers’ supply to the domestic market i s OT=SU, imports are UX, and Customs revenue i s area VKNG=Customs revenue on imports f rom India= area AHJB+Customs revenue on imports from ROW=area DLNG. Following the FTA, the Indian producers n o longer pay the general Customs duty HA, and this i s represented by the downward shift in the Indian supply curve from the dotted supply curve SI+t, to the the duty free supply curve SI. The new combined supply curve o f Bangladesh and Indian producers (obtained by horizontally summing SB and SI) now intersects the duty inclusive import price line at F, and imports from ROW go down from UX to VX. T h i s
5

IndiaBangladesh FTA: Methodology and Selected Case Studies
causes Bangladesh Customs revenues to decline by area CKME, which i s the sum o f the Customs duties previously collected on the pre-FTA imports from India (area ABHJ=area CKLD) plus the reduction in Customs duties (area DLME) resulting from the expansion o f imports from India which have replaced imports from ROW. Once again there i s no change in the Bangladesh price and therefore n o change in Bangladesh consumer or producer welfare, and so the economic welfare loss to Bangladesh i s given by the lost Customs revenue. The economic welfare gain for India i s the producer surplus on the increased exports, area HJEA =area K L F C (where the dotted l ine LF i s drawn parallel to the Indian post-FTA supply curve). So the combined net economic loss to Bangladesh and India i s area LFM, which as before i s the trade diversion cost o f the FTA, as measured by the excess o f the production cost o f the new Indian exports to Bangladesh over the cost at c i f prices o f the imports from ROW that they have displaced. Once again, these simulations o f welfare changes need to be supplemented by considering the potential consumer welfare costs in India, and by the economic losses resulting from the exports to Bangladesh diverted from other countries.
2 SOME BASIC TRADE CREATION CASES
Th is section illustrates cases where there i s “trade creation”, meaning that the FTA causes the total volume o f international trade in the product to increase, by reducing the price in the importing FTA country. This is f i rst illustrated in F ig 4, where before the FTA there i s no domestic production in Bangladesh and the total Bangladesh demand O H at the tariff inclusive price OA i s met by imports from ROW, which generate customs revenue represented by area ABCN. As in F ig 1, after paying the Bangladesh tariff Indian producers (represented by the dotted supply curve SI+t) cannot compete with ROW producers and do not supply the Bangladesh market. However, the Indian supply curve i s highly elastic, and following the FTA Indian producers not only displace all the Bangladesh imports from ROW but competing wi th each other push down the price in Bangladesh from OA to OL, which i s lower than the pre-FTA price. Consequently Bangladesh demand expands from OG to OF, and total trade in the product increases by HF. The economic welfare change in Bangladesh now includes a consumer surplus benefit represented by area ALJD which must be balanced against a Customs revenue loss o f ABCD. As drawn in this example, it i s apparent that if the same weights are assigned to each Taka o f consumer surplus benefits as to each Taka o f government revenue losses, that there will be a net welfare loss. However, it i s also apparent that this i s not necessarily the case: with sufficiently elastic demand and a sufficiently large downward shift in the Indian supply curve after the FTA, the consumers’ surplus gain in Bangladesh may exceed the customs revenue loss.
As in the previous examples, the economic benefit to India i s represented by the producers’surplus on the Indian exports to Bangladesh that are generated by the FTA. In this example this i s represented by LGJ, which i s the area above the Indian supply curve SI and below the new price in Bangladesh. The total net economic welfare change for Bangladesh and India combined (AW) i s the sum o f the two welfare effects in Bangladesh and the increased producer surplus in India i.e. AW=(-area ABCD+area ALJD+area LGJ), and in the example illustrated in F ig 4 it i s negative. However, it could be positive or negative, depending on the demand elasticity in Bangladesh and the size o f the price reduction in Bangladesh. As discussed previously, this i s before allowing for possible consumer welfare effects in India, and the net economic welfare effect for the world as whole would need to deduct the producer surplus losses o f the ROW exporters excluded by the FTA from the Bangladesh market, from the total net effect in India and Bangladesh.
Fig 5 illustrates a variant o f the simple trade creation case in Fig 4, the only difference being that the new equilibrium price and demand in Bangladesh following the FTA fal l sufficiently to generate a sufficiently large consumer surplus benefit that, when combined with the Indian exporter producer surplus, more then offsets the Customs revenue loss in Bangladesh, thus producing a net welfare gain for Bangladesh and India together. That is, after the FTA, AW=(-area ABCD+area AGMD+area GNM)>O.
6

Partial Equilibrium Methods for Industry Level Studies
As noted previously, wi th a sufficiently l ow post FTA price in Bangladesh and sufficiently elastic Bangladesh demand, there could also be a net welfare gain in Bangladesh, despite the excess cost o f the Indian supply over the displaced imports from ROW.
Fig 6 illustrates a similar case as F ig 5, the main difference being that before the FTA Bangladesh producers (represented by supply curve SB) supply OM o f the Bangladesh demand, with the rest (quantity MH) supplied by imports, on which the tari f f revenue collected i s area BRCD. In this situation, before the FTA, as indicated by the dotted supply curve SI+t, Indian producers cannot compete in Bangladesh if they pay the normal Bangladesh tariff BA. After the FTA, however, the Indian suppliers undercut the Bangladesh producers, eliminating Bangladesh production, and supply the entire Bangladesh market at a price OL which i s wel l below the pre-FTA price OA. In Bangladesh, the reduced price and the consequent increased demand generate consumer surplus benefits represented by area ALND, producer surplus losses represented by area AJB resulting from the closure o f the Bangladesh producers, and reduced customs duties equivalent to area BRCD. In t h s example, as drawn there i s net economic welfare gain for Bangladesh, equivalent to the excess o f areas (JLTB+DVN) over area TRCV. It i s apparent that the net welfare effect in Bangladesh i s more likely to be positive in this example than in the example given in F ig 6, because trade i s created not only by the lower price in Bangladesh and the increased demand, but also because higher cost Bangladesh production is replaced by lower cost Indian production. For India, there i s a producer surplus benefit (area LGN) on the Indian exports made possible by the FTA. For Bangladesh and India together, there i s a net overall welfare gain equivalent to the net gain in Bangladesh plus the producer surplus benefits in India resulting from the Indian exports, but as before the ne t joint welfare outcome could be negative wi th different demand and supply parameters, and could be affected by consumer welfare changes in India resulting from the Indian exports. Also as before, the net global welfare change would be affected by the producer surplus losses o f the ROW suppliers that previously supplied Bangladesh.
F ig 7 illustrates the same case as F ig 6, except that only some o f the Bangladesh production is eliminated and some o f the lower cost Bangladesh producers are able to compete wi th the Indian suppliers. Consequently the aggregate supply curve &+SI (the horizontal sum o f the Bangladesh and Indian exporter supply curves) intersects the Bangladesh demand curve at new equilibrium price OJ (=RV) which i s lower than it otherwise would have been, because o f the supply and competition f rom the remaining Bangladesh production. As in the previous example, because following the FTA the tariff o n imports from ROW i s redundant and the domestic price has declined by distance AJ, there i s a consumer surplus benefit in Bangladesh o f area AJVD. There i s a producer surplus loss for the Bangladesh producers (area AJKF) corresponding to the decline in their production from OM to OW, and there i s a loss o f tariff revenue (area FRCD) on the imports from ROW (distance MH) which are eliminated by the FTA. Overall, in this example as drawn, there i s a net welfare loss for Bangladesh as the consumer surplus benefit i s not enough to offset the lost Customs revenue and the decline in the Bangladesh industry’s producer surplus. However, as in the previous example, it i s apparent that if the reduction price i s sufficient, the resulting benefit to Bangladesh consumers will begin to exceed the sum o f the Customs revenue and producer surplus losses. For India, there i s a producer surplus benefit for the exporters (area LJT), but with the parameters assumed for the diagram the net welfare change for India and Bangladesh taken together i s negative. The global welfare outcome i s also negative since the consumer welfare effects in India must be negative and the ROW exporters lose producer surpluses. But a sufficiently large price reduction in Bangladesh could outweigh al l the other negative welfare repercussions and increase global welfare (assuming as before that common currency unit changes in the welfare o f the various actors are valued equally).
7

India-Bangladesh FTA: Methodology and Selected Case Studies
3. TREATING TRADABLE INTERMEDIATE INPUTS IN THE IMPORTING COUNTRY
To bring out basic principles more clearly, the cases discussed so far have not dealt with the impact o f an FTA on the internationally tradable intermediate materials andor components used in the industries being studied. I s some o f these are imported or are exportables, changes in the production o f finished products will have secondary effects on trade and government revenue through changes in the imports or exports o f these intermediate inputs. F ig 7 illustrates a case where the intermediate inputs are imported into Bangladesh for the use o f the local industry at a border (cif) price (per unit o f the finished product) Ob, and customs duties ba are paid, so that before the FTA tari f f revenue represented by the shaded area abfe i s collected. If after the FTA there i s n o change in the pre-FTA price o f the final product (OA) and no change in domestic production there w i l l be no change in the quantity o f inputs imported, and therefore n o change in the customs revenue on these inputs. In that case the welfare analysis i s the same as discussed previously in F ig 2, and there i s no need to consider secondary welfare effects via intermediate inputs in the importing country.
However, if Indian exports to Bangladesh following the FTA cause the domestic price in Bangladesh to fall (as for example in the cases illustrated by Figs 6 and 7), Bangladesh production will decline and there w i l l be an accompanying decline in imports o f the intermediate inputs and o f customs revenue collected on those imports. For example, in F ig 8, if the domestic price were to decline from OA to OG, the production o f the Bangladesh industry would be cut from distance OM to OS, with a corresponding decline in imports o f intermediate inputs with a value in border prices equal to area dSMf, and a customs revenue reduction equal to area cdfe. From Bangladesh’s point o f view, this customs revenue loss would need to be added to the loss o f customs revenue on finished products n o longer imported from ROW (area ERCD) and the loss o f producers’ surplus in the domestic industry (area AGXE) before balancing these welfare losses against the consumer surplus benefit o f the lower domestic price (area AGKD). The reduction in imports o f intermediates i s also a secondary welfare (producer surplus) loss for the ROW exporters which previously supplied them in addition to the loss o f the market for the finished product.
There i s a similar outcome if the competition o f the Indian suppliers after the FTA cuts the Bangladesh price sufficiently to eliminate Bangladesh production altogether. In Fig 8, if the post-FTA price in Bangladesh falls to OL (an outcome equivalent to the case illustrated in F i g 6) imports o f intermediates would also disappear and the government would lose tariff revenue represented by area abfe. As in the previous example, this welfare loss would need to be accounted for in quantifying the welfare repercussions in Bangladesh. In addition, the full value o f the intermediate inputs imported prior to the FTA would need to be added to the total trade diverted from ROW.
The above examples have considered cases where the intermediate inputs are imported by the domestic industry. If the inputs are produced domestically but are “fully traded” in the sense that any cut in demand-including reduced purchases from local producers- leads to an equivalent cut in imports, in principle the resulting indirect customs revenue loss would need to be calculated even though there were no direct imports by the industry being studied. But another possibility i s that i f the inputs are being purchased domestically there will be tariff redundancy, wi th no direct impact on imports or tariff revenue resulting from changes in demand. Talung account o f the approximations involved in many aspects o f these types o f simulation, and bearing in mind that in most cases second order effects are at issue, it i s probably better to just treat the intermediates that are directly imported by the industry being studied, and to ignore the potential repercussions via domestically produced inputs.
Similar decisions about the treatment o f intermediate inputs need to be made if they are exportables e.g. domestically produced materials or components that would be exported if they were not used as in inputs by the domestic industry being studied. In that case, there will be a fiscal cost i f the
8

Partial Equilibrium Methods for Industry Level Studies
contraction o f the domestic industry releases intermediate products which are then exported and become eligible for a standard export subsidy, and a fiscal benefit i f the exports are taxed. However, in South Asia at present, while there are some export subsidies (e.g. interest subsidies for export finance) most are very small relative to the border values o f exports-certainly much lower than typical import duty rates-and very few products are subject to export taxes. The principal export facilitation measures are duty drawback or duty exemption for imported inputs used by exporters, but by definition these are not relevant in the case o f exportable intermediates, except possibly at second remove if the exportable intermediates themselves are manufactured in part from imported intermediates. Domestic indirect taxes (such as a VAT or VAT equivalent) are also normally refunded for exports, but as a general principle (see later discussion) it i s recommended that these be ignored. For al l these reasons, in the kind o f partial equilibrium welfare simulations being discussed in this paper, unless there are strong reasons for doing otherwise, not much will generally be lost by disregarding potential welfare repercussions via changes in the purchases o f exportable intermediate inputs.
4. TREATING TRADABLE INTERMEDIATE INPUTS IN THE EXPORTING COUNTRY
The South Asian countries al l operate drawback or import duty exemption systems for inputs used in the production o f exports, including exports to neighboring countries under preferential trading arrangements. These mechanisms would also apply to free trade agreements, and their impact needs to be considered in simulating the l ikely effects o f a bilateral FTA. There are various possibilities.
If the industry which starts exports (or increases i t s existing exports) to the other country following the FTA, i s already exporting to ROW, and if the FTA-induced exports are al l incremental and not switched either from exports to ROW or from supplies to i ts domestic market, then the exports will not directly change either domestic prices or tari f f revenue. This i s because-if normal export mechanisms are functioning-there i s no change in government revenue since any customs duties on imported inputs w i l l be refunded or exempted, and if there i s no change in domestic supply there will be no upward effect on domestic prices. In this case the producer surplus o f the exporters to the FTA partner country on i t s own provides a good first approximation o f the welfare benefit to the exporting country.
However, if the exporting industry switches production from its domestic market to the market o f i t s FTA partner, the tariff revenue and price effects in the domestic market will need to be considered. If the product i s being imported into the domestic market, there will be no change in the domestic price and no consumption effects, but the production switched to the FTA partner market wil l be replaced by increased imports. On the other hand tariff revenue on the inputs used in the production that i s now exported rather than sold locally, w i l l either be exempted or refunded to the exporters under normal duty drawback systems. Hence the FTA will create an additional welfare benefit to the exporting country (in addition to the exporter producers’ surplus) equal to the excess o f the increased revenue on the fmished products that are now imported, over the input tariff revenue that i s now refunded or exempted. In effect, by switching production to the FTA partner wi th the higher protection level, the exporting country reduces some o f the deadweight costs o f i t s own protection by importing at world prices from ROW and collecting import duties, rather than supplying this part o f its demand at production costs that exceed world prices.
A third possibility (discussed in more detail in the next section) i s that the exporting industry, though protected by a tari f f and not exporting to ROW, i s setting a price in the domestic market that i s lower than the duty inclusive import price. When the more highly protected market o f a neighboring country i s opened by the commencement o f an FTA, total demand for the industry’s product increases and-to an extent depending on the supply elasticity- the price in the domestic market will rise, wi th a ceiling at the duty inclusive price from ROW. As noted below, in that case consumption costs (losses o f consumer surplus) need to be deducted from the industry’s producer surplus benefits resulting from the
9

India-Bangladesh FTA: Methodology and Selected Case Studies
FTA, but there w i l l also be tariff revenue losses, since with the higher domestic price domestic sales are lower than they otherwise would be and the corresponding production will be switched to exports going to the FTA partner country, the imported inputs o f which are eligible for drawback or duty exemption.
5. CONSUMPTION EFFECTS IN THE EXPORTING COUNTRY
The previous sections have focused on the country (in the examples assumed to be Bangladesh) which, following a bilateral FTA, imports from the other, and apart from the exporter producer surpluses, have not considered the possible internal welfare repercussions in the exporting country. T h i s section discusses the possibility o f consumer welfare losses resulting from increases in the domestic price o f the exported product, and possible reductions in Customs revenue on imported intermediates used in the production for the domestic market.
If the product i s being produced in both countries and imported from ROW in both countries over binding tariffs, after the FTA (assuming transport costs and other logistics costs do not prevent them) there will be exports from the country with the lower tari f f to the higher tariff country, since incremental production costs in the lower tariff country must be lower in the low tariff country. T h i s may mean that some production-in an extreme cases al l o f it-will be switched from the l ow tari f f market to high tar i f f market. However, there will be no price or consumer welfare effects in the exporting country, since domestic prices will continue to be determined by imports from ROW.
However, if tariffs are not binding in the exporting country, there will be some price and consumer welfare effects when trade i s opened up by the FTA. This i s because the tari f f redundancy means that, before the FTA, there are no competing imports and that domestic prices are lower than the border price plus the tariff i.e. Pd<(Pw+t). Hence i f the costs go up with production i.e. the domestic supply i s less than infinitely elastic, the increased demand from the importing country w i l l push up the domestic price in the exporting country, with an upper limit at the point at which imports start to come in. The resulting consumer welfare loss in the exporting country then has to be deducted from the producer surplus benefits resulting from the new exports. In addition, because o f the decline in domestic demand and production (from production switched from the domestic market to the FTA-induced exports) there w i l l be a fiscal cost i f there if there are duty drawback or tari f f and other tax exemptions for inputs previously used for production for the domestic market.
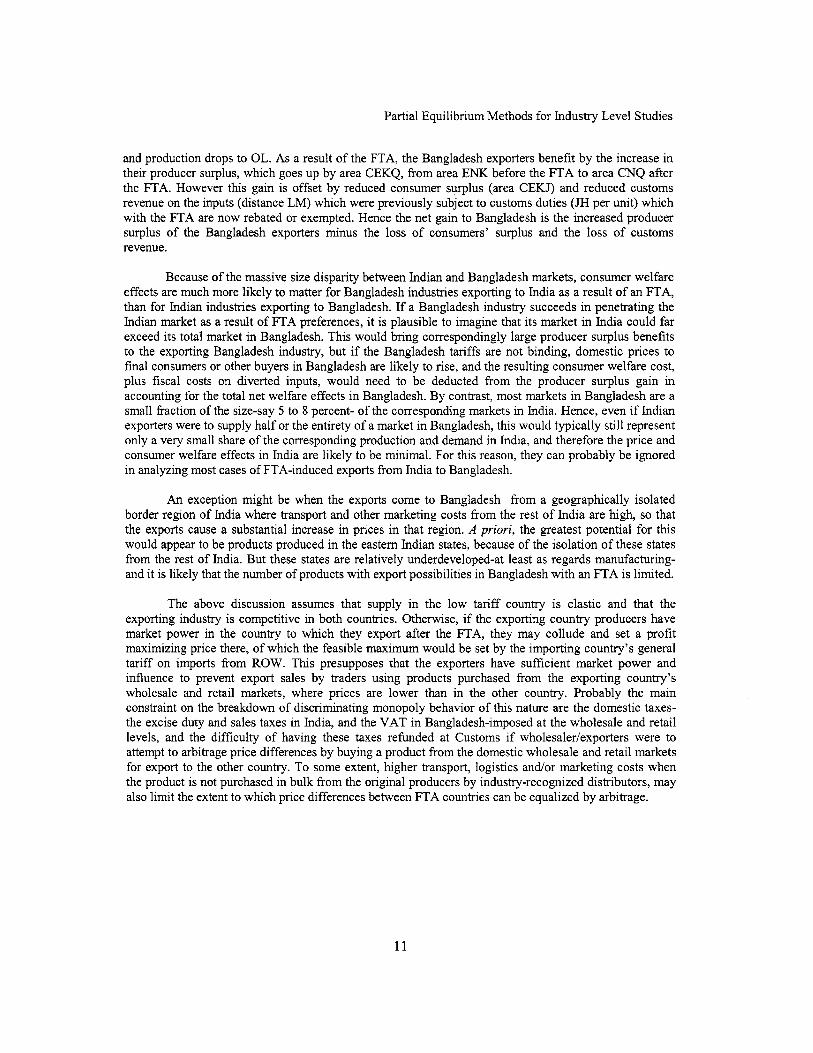
This case i s illustrated in F ig 9, which illustrates the welfare effects in Bangladesh when, as a result o f an FTA, a Bangladesh industry exports to India. In the pre-FTA situation, there is tari f f redundancy (distance CE) and the Bangladesh industry supplies the entire domestic market (quantity OM) at a price that i s above the world price OB (denoted by P w which i s the c i f price at the Bangladesh border), but well below the world price plus the Bangladesh tari f f (distance OA). After the FTA the Bangladesh industry has tariff free access to the Indian market, and this i s represented by the Indian demand curve for Bangladesh exports Di. There i s a fixed per unit cost o f tradable inputs used in production (distance OH) which includes tariffs which are rebated or exempted (through drawback, duty free admission etc) when the final product exported. This rebateable duty and tax component i s the vertical difference JH between the tradable unit input cost l ine O H and the dotted line below and parallel to i t . This distance i s added vertically to the Indian demand curve for the Bangladesh exports to give an effective demand curve which includes the duty drawback per unit o f exports as well as the explicit demand price. The Bangladesh domestic demand curve and the drawback - inclusive export demand curve are then summed horizontally to give an aggregate demand curve which incorporates both domestic demand and export demand from India as a result o f the FTA. In the new equilibrium in this example, after the FTA total demand and Bangladesh supply expand by a factor o f about four and at the new equilibrium supply OF, the price in the domestic market r ises from OE to OC and domestic demand
10
Partial Equilibrium Methods for Industry Level Studies
and production drops to OL. As a result o f the FTA, the Bangladesh exporters benefit by the increase in their producer surplus, which goes up by area CEKQ, from area ENK before the FTA to area CNQ after the FTA. However this gain i s offset by reduced consumer surplus (area CEKJ) and reduced customs revenue on the inputs (distance LM) which were previously subject to customs duties (JH per unit) which with the FTA are now rebated or exempted. Hence the net gain to Bangladesh i s the increased producer surplus o f the Bangladesh exporters minus the loss o f consumers’ surplus and the loss o f customs revenue.
Because o f the massive size disparity between Indian and Bangladesh markets, consumer welfare effects are much more l ikely to matter for Bangladesh industries exporting to India as a result o f an FTA, than for Indian industries exporting to Bangladesh. If a Bangladesh industry succeeds in penetrating the Indian market as a result o f FTA preferences, i t i s plausible to imagine that i t s market in India could far exceed i t s total market in Bangladesh. This would bring correspondingly large producer surplus benefits to the exporting Bangladesh industry, but if the Bangladesh tariffs are not binding, domestic prices to final consumers or other buyers in Bangladesh are likely to rise, and the resulting consumer welfare cost, plus fiscal costs on diverted inputs, would need to be deducted from the producer surplus gain in accounting for the total net welfare effects in Bangladesh. By contrast, most markets in Bangladesh are a small fraction o f the size-say 5 to 8 percent- o f the corresponding markets in India. Hence, even if Indian exporters were to supply hal f or the entirety o f a market in Bangladesh, this would typically s t i l l represent only a very small share o f the corresponding production and demand in India, and therefore the price and consumer welfare effects in India are likely to be minimal. For this reason, they can probably be ignored in analyzing most cases o f FTA-induced exports from India to Bangladesh.
An exception might be when the exports come to Bangladesh from a geographically isolated border region o f India where transport and other marketing costs from the rest o f India are high, so that the exports cause a substantial increase in prices in that region. A priori, the greatest potential for this would appear to be products produced in the eastern Indian states, because o f the isolation o f these states from the rest o f India. But these states are relatively underdeveloped-at least as regards manufacturing- and it i s likely that the number o f products with export possibilities in Bangladesh with an FTA i s limited.
The above discussion assumes that supply in the low tari f f country i s elastic and that the exporting industry i s competitive in both countries. Otherwise, if the exporting country producers have market power in the country to which they export after the FTA, they may collude and set a prof i t maximizing price there, o f which the feasible maximum would be set by the importing country’s general tariff on imports from ROW. This presupposes that the exporters have sufficient market power and influence to prevent export sales by traders using products purchased from the exporting country’s wholesale and retail markets, where prices are lower than in the other country. Probably the main constraint on the breakdown o f discriminating monopoly behavior o f this nature are the domestic taxes- the excise duty and sales taxes in India, and the VAT in Bangladesh-imposed at the wholesale and retail levels, and the difficulty o f having these taxes refunded at Customs if wholesaler/exporters were to attempt to arbitrage price differences by buying a product from the domestic wholesale and retail markets for export to the other country. To some extent, higher transport, logistics and/or marketing costs when the product i s not purchased in bulk from the original producers by industry-recognized distributors, may also l imi t the extent to which price differences between FTA countries can be equalized by arbitrage.
11

India-Bangladesh FTA: Methodology and Selected Case Studies
6. WELFARE EFFECTS WHEN THERE I S “BOOTLEG” BORDER SMUGGLING
Various lunds o f smuggling and illegal trade are prevalent in South Asia, especially in Bangladesh. I t i s useful to distinguish two kinds o f illegal trade, traditional smuggling or “bootleg” trade which by-passes Customs posts altogether, and “official” or “technical” smuggling trade which comes through and i s processed at Customs posts, but which i s misclassified or under invoiced to reduce Customs duties or avoid them altogether. Both types o f illegal trade usually involve collusion between, on the one hand exporters, importers, service providers such as shipping agents, Customs agents, bankers and money lenders, and on the other hand Customs, border security, police and various other government officials. “Bootlegging” or traditional smuggling is prevalent along the South Asian land borders, and “technical” smuggling i s more important at the principal sea ports and at the major land Customs posts, in the case o f India-Bangladesh trade, especially at the Petrapole-Benapole border crossing, which l ies on the main roads that link Kolkata and West Bengal with Dhaka and the rest o f Bangladesh.
This section discusses “bootleg” smuggling which typically physically avoids Customs posts and uses other border crossings. In principle i t could be organized by large and medium scale manufacturers and traders, but the evidence in South Asia i s that most o f i t i s organized by relatively small local traders and occurs in border areas with the participation o f local people wi th contacts on both sides o f the border. Apart from the obvious difficulty o f finding border locations that could unobtrusively handle large volumes o f bulky goods, medium and large scale exporters have an interest in using official channels in order to avoid paying domestic indirect taxes, to have import duties on their imported intermediate inputs exempted or refunded, and to receive other export incentives if there are any (such as preferential working capital loans). Consequently, in the case o f “bootleg” smuggling (say from India to Bangladesh by the land border) the smuggled exported goods will typically be purchased from or supplied by local wholesalers or retailers, and buying prices will therefore include not only indirect taxes but also domestic wholesale margins and possibly retail margins as well. They w i l l also include any import duties on the inputs used by the local producer, which would otherwise have been refunded if the same goods had been legally exported. To this must be added the transport costs, bribes and other transaction costs o f smuggling the goods across the border, and the transaction will only take place if the price received exceeds the sum o f al l these costs by a margin that i s sufficient to compensate for the effort and risk involved. However, i f the exports do take place, the sum o f the Indian domestic indirect taxes included in the price paid by the Bangladesh informal importer i s effectively an export tax. Insofar as the smuggled Indian goods substitute for either imported or locally produced goods that would have been subject to Bangladesh indirect taxes, and assuming that the smuggled goods avoid Bangladesh indirect taxes, one result o f the smuggling is therefore the transfer o f indirect tax revenue from Bangladesh to India. The reverse would be the case with “bootleg” border smuggling o f goods from Bangladesh into India.
“Bootleg” border smuggling carried out by small traders and individuals in border area (the total value o f which can nevertheless be substantial i f enough people are involved) is effectively a part ial informal free trade arrangement, and the welfare consequences can be analyzed following the same principals discussed previously. Taking the example o f informal border area exports from India to Bangladesh, the potential welfare consequences are the following:
For the importing country (example Bangladesh’) + consumers’ surplus benefit if the smuggling reduces the domestic price o f this more varieties and specifications o f the good available) + share o f Bangladeshis in smuggling rents - lost tari f f revenue from ROW imports displaced by the smuggled Indian goods - lost indirect taxes (VAT) on the goods displaced by the smuggled goods (assuming the smuggled goods evade Bangladesh indirect taxes)
good (andor makes
12

Partial Equilibrium Methods for Industry Level Studies
- reduced producer surplus from any Bangladesh production displaced by the smuggled imports - reduced tariff revenue from the imported inputs used by displaced domestic production (if any)
For the exporting country (example India) + producers’ surplus o f the Indian producers o f the smuggled exports + tariffs on imported inputs used to produce the smuggled exports + Indian domestic indirect taxes on the goods that are smuggled + the Indian share o f the smuggling rents - the producers’ surplus component o f the Indian share (if any) o f the ROW displaced by the smuggled exports3 - consumers’ surplus loss if the smuggled exports lead to price increases in India
exports to Bangladesh
As discussed previously in connection with formal FTAs, assuming a single homogeneous good, the key element in the overall net welfare outcome for the importing country i s whether and to what extent the smuggled goods reduce the domestic price level. If the domestic price level does not change, there w i l l be a net economic welfare loss. If the smuggling forces the domestic price down, the net welfare loss continues but becomes smaller, until at some point the price may fal l sufficiently to create a consumer welfare benefit sufficient to outweigh the trade diversion costs.
For the exporting country, the first four positive (+) components o f the welfare change above wil l normally outweigh the potential negative components4. Compared with a formal FTA, the input tari f f and domestic tax components push up the supply price o f the smuggled exports and this will tend to reduce the quantity exported. On the other hand smuggled imports avoid paying the importing country’s domestic tax at the border (in Bangladesh the VAT) as well as the tariff, whereas under a properly administered formal FTA imports from the partner country are exempt from the tari f f but s t i l l pay the domestic indirect tax. Hence, for a given product, it i s not possible to state a priori whether the export supply with bootleg smuggling will be lower or higher than export supply wi th a formal FTA. But, as noted previously, the exporting country’s domestic taxes effectively act as export taxes, the revenue from which should be counted in estimating the net welfare change’.
Already existing “bootleg” border trade will frequently need to be considered in analyzing the likely welfare effects o f an FTA. From the importing country’s point o f view, the resulting overall reduction in Customs revenue w i l l be offset to the extent that domestic taxes (e.g. the Bangladesh VAT) are now collected on formal imports that displace previously smuggled imports. On the other hand there wil l b e some loss o f the Bangladesh share in smuggling rents. If the formal FTA imports displace more ROW imports than were displaced by the smuggled trade but leave domestic prices unchanged, it i s likely that there w i l l still be a net loss o f revenue and an overall net welfare loss. However, it i s conceivable that the FTA-generated imports w i l l displace all or most o f the smuggled imports but that the total volume o f imports diverted from ROW will decline. In that case, even if domestic prices are unchanged, for this product, the FTA wi l l lead to a net increase in government revenue and a net increase in welfare
I t i s quite feasible for the same goods -even f rom the same firms-to be legally exported paying the full ta r i f f and indirect taxes in the importing country, and to be smuggled avoiding both the importing country’s tariff and indirect taxes. See discussion below. In South Asia, agricultural and other unprocessed primary goods are typically exempt f rom indirect taxes. On the one hand this reduces the price to potential smugglers and increases the probability that it will be profitable to smuggle them. O n the other hand, once they are smuggled there i s less o f an “export tax” benefit to the exporting country than would be the case w i th smuggled manufactured goods. Under the India-Nepal Treaty o f Trade, the declared value o f Indian excise taxes (but not sales taxes) included in the cost o f goods imported by Nepal, are calculated and periodically paid by the Indian government to the Nepalese government. For obvious reasons there i s no such arrangement between India and Bangladesh as regards the border “bootleg” trade, which i s i l legal and undeclared.
13

India-Bangladesh FTA: Methodology and Selected Case Studies
compared to the pre-FTA situation, essentially because trade diversion with the formal FTA i s less than with the informal defacto FTA.
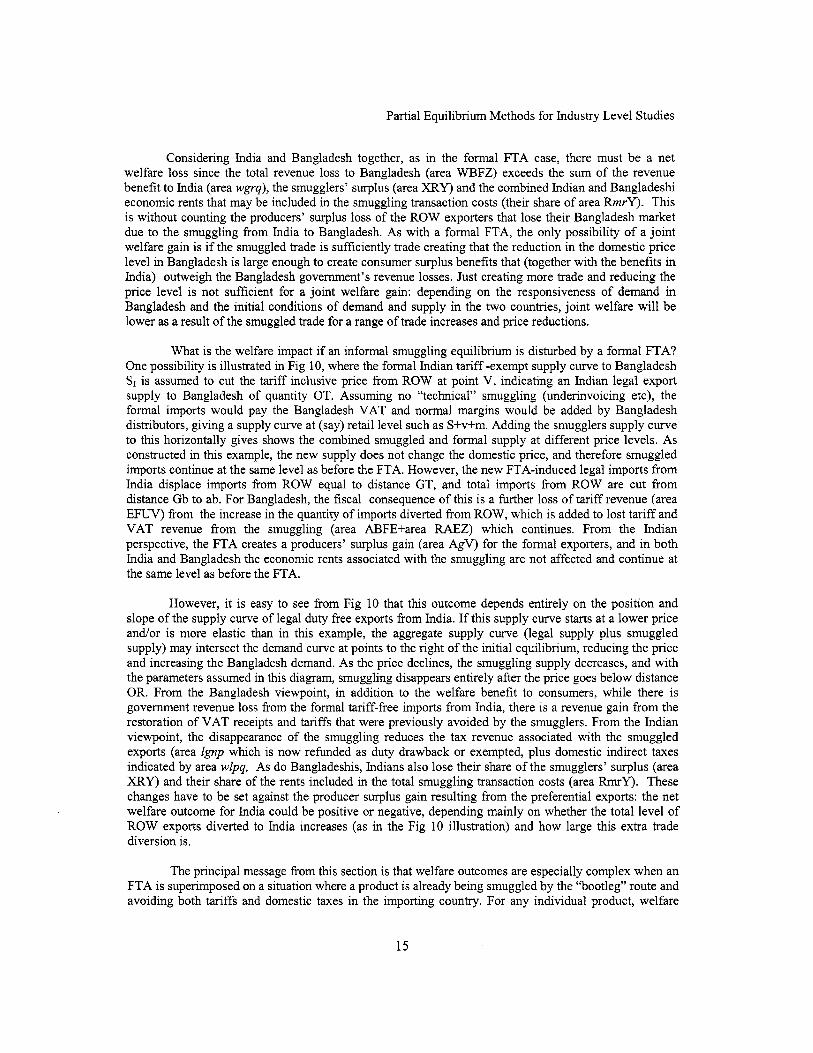
From the viewpoint o f the exporting country, if a formal FTA displaces some or al l o f i ts own “bootleg” smuggling, economic welfare may increase or decline. There will be welfare benefits (producers’ surplus) associated with the new formal exports, but there w i l l b e a welfare loss consisting o f the domestic indirect taxes and smuggling rents associated with the displaced bootleg smuggled exports. The principal elements in this kind o f welfare calculation are illustrated in f ig 10, which for simplicity takes the case o f a product which is imported from ROW into Bangladesh but which is not produced domestically. In an initial equilibrium (before allowing for “bootleg” smuggling f rom India) total demand OH i s l l l y met by imports from ROW at a tariff-inclusive price Pw+t, equivalent to distance OA consisting o f a c i f price OB and a tari f f BA. In order to analyze smuggling from India which avoids the Bangladesh VAT as well as the tariff, the diagram shows the VAT-inclusive price Pw+t+v, and the final retail price Pw+t+v+m. In the initial equilibrium before smuggling from India, government revenue from imports i s the total tariff revenue (area ABCD) plus the total VAT on imports (area WADJ). In this initial equilibrium SI i s the potential tariff-free Indian supply curve to Bangladesh, but there are n o Indian exports because after adding the Bangladesh tari f f a l l Indian supply prices exceed the price tari f f inclusive price OA at which the product i s imported from ROW.
I t i s now assumed that “bootleg” smuggling from India to Bangladesh becomes possible, and that the bootleggers avoid both the Bangladesh tari f f and the Bangladesh VAT. On the Indian side they buy the product from traders at price OM. Th is price includes marketing margins in India (distance MW), Indian indirect taxes -excise and sales taxes- (distance WL), and tar i f fs on imported inputs used to produce the product (distance LG). The smugglers incur transport and various transaction costs including bribes, f i rs t in India, then in getting the goods across the border, and finally in distributing the goods in Bangladesh. The total transaction costs are represented by the area between the purchase cost o f the goods in India and the smugglers’ supply curve Ss. T h e upward slope o f the smugglers’ supply curve indicates that the per unit transaction costs rise as the quantity smuggled increases, representing for example increasing costs (including perhaps increasing bribe rates) o f distributing the goods to more distant markets inside Bangladesh. In this example the smugglers are assumed to distribute to final consumers and will do so as long as they can undercut the going tax- inclusive retail price OX. Given the smugglers’ supply curve, this determines an equilibrium quantity o f bootleg smuggling OG, which displaces the same quantity o f imports from ROW.
I t can be seen that from the Bangladesh perspective, the bootleg smuggling i s similar to the FTA trade diversion case discussed previously, except that the revenue loss from the trade which i s diverted to India from ROW in this case includes the VAT on the diverted imports (area WAEZ) in addition to the tari f f revenue (area ABFE). There will be some offsetting gains, however: the share o f Bangladeshis in the smuggling surplus i.e. a share o f area XRY, and the Bangladeshi share o f bribes and other economic rents (e.g. bribes to border police, tax officials and others) subsumed in the general heading o f “transaction costs” (i.e. a share o f area RmrY). But there are no consumer welfare benefits- the same goods are being supplied to consumers at the same price-and i t i s apparent f rom the diagram that the government revenue loss from tariffs and VAT must exceed the Bangladeshi share o f the smuggling rents: hence the smuggling in this example involves an overall net welfare loss for Bangladesh.
By contrast, from the Indian perspective, the bootleg smuggling OG provides a clear net welfare gain. This consists o f input tariff revenue (area lgnp) which would have been exempted or refunded if the products had been legally exported, domestic indirect taxes (area wlpq), the Indian share o f the smuggling surplus (area XRY), and the Indian share o f bribes and economic rents subsumed in the smuggling transaction costs (RmrY). The fiscal component o f this total benefit (area lgnp plus area wlpq) i s effectively an export tax.
14
Partial Equilibrium Methods for Industry Level Studies
Considering India and Bangladesh together, as in the formal FTA case, there must be a net welfare loss since the total revenue loss to Bangladesh (area WBFZ) exceeds the sum o f the revenue benefit to India (area wgrq), the smugglers’ surplus (area XRY) and the combined Indian and Bangladeshi economic rents that may be included in the smuggling transaction costs (their share o f area RmrY). T h i s i s without counting the producers’ surplus loss o f the ROW exporters that lose their Bangladesh market due to the smuggling from India to Bangladesh. As with a formal FTA, the only possibility o f a jo int welfare gain i s if the smuggled trade is sufficiently trade creating that the reduction in the domestic price level in Bangladesh i s large enough to create consumer surplus benefits that (together with the benefits in India) outweigh the Bangladesh government’s revenue losses. Just creating more bade and reducing the price level i s not sufficient for a joint welfare gain: depending on the responsiveness o f demand in Bangladesh and the initial conditions o f demand and supply in the two countries, joint welfare wil l be lower as a result o f the smuggled trade for a range o f trade increases and price reductions.
What i s the welfare impact if an informal smuggling equilibrium i s disturbed by a formal FTA? One possibility i s illustrated in F ig 10, where the formal Indian tari f f -exempt supply curve to Bangladesh SI i s assumed to cut the tariff inclusive price from ROW at point V, indicating an Indian legal export supply to Bangladesh o f quantity OT. Assuming no “technical” smuggling (underinvoicing etc), the formal imports would pay the Bangladesh VAT and normal margins would be added by Bangladesh distributors, giving a supply curve at (say) retail level such as S+v+m. Adding the smugglers supply curve to this horizontally gives shows the combined smuggled and formal supply at different price levels. As constructed in this example, the new supply does not change the domestic price, and therefore smuggled imports continue at the same level as before the FTA. However, the new FTA-induced legal imports f rom India displace imports from R O W equal to distance GT, and total imports from ROW are cut f rom distance Gb to ab. For Bangladesh, the fiscal consequence o f this i s a further loss o f tariff revenue (area EFUV) from the increase in the quantity o f imports diverted from ROW, which i s added to lost tar i f f and VAT revenue from the smuggling (area ABFE+area RAEZ) which continues. From the Indian perspective, the FTA creates a producers’ surplus gain (area AgV) for the formal exporters, and in both India and Bangladesh the economic rents associated with the smuggling are not affected and continue at the same level as before the FTA.
However, it i s easy to see from Fig 10 that this outcome depends entirely on the position and slope o f the supply curve o f legal duty free exports from India. If this supply curve starts at a lower price andor i s more elastic than in this example, the aggregate supply curve (legal supply plus smuggled supply) may intersect the demand curve at points to the right o f the initial equilibrium, reducing the price and increasing the Bangladesh demand. As the price declines, the smuggling supply decreases, and with the parameters assumed in this diagram, smuggling disappears entirely after the price goes below distance OR. From the Bangladesh viewpoint, in addition to the welfare benefit to consumers, while there i s government revenue loss from the formal tariff-free imports from India, there i s a revenue gain f rom the restoration o f VAT receipts and tar i f fs that were previously avoided by the smugglers. From the Indian viewpoint, the disappearance o f the smuggling reduces the tax revenue associated with the smuggled exports (area Zgnp which i s now refunded as duty drawback or exempted, plus domestic indirect taxes indicated by area wlpq, As do Bangladeshis, Indians also lose their share o f the smugglers’ surplus (area XRY) and their share o f the rents included in the total smuggling transaction costs (area RmrY). These changes have to be set against the producer surplus gain resulting from the preferential exports: the net welfare outcome for India could be positive or negative, depending mainly on whether the total level o f R O W exports diverted to India increases (as in the Fig 10 illustration) and how large this extra trade diversion is.
The principal message from this section i s that welfare outcomes are especially complex when an FTA i s superimposed on a situation where a product i s already being smuggled by the “bootleg” route and avoiding both tariffs and domestic taxes in the importing country. For any individual product, welfare
15
India-Bangladesh FTA: Methodology and Selected Case Studies
predictions cannot be easily made without first looking carefully at the main parameters, including especially what can be discovered about the volume and nature o f the smuggled trade, including the extent to which the cost o f the smuggled goods to the smugglers includes domestic taxes in the exporting country. It i s also important to recognize that after an FTA, formal exports and smuggled “bootleg” exports o f the same good to the same market may coexist, as illustrated in F ig 10. Both these export sources could be supplied by the same Indian f i rms, some coming from normal domestic sales o f goods including domestic taxes and distribution margins which are purchased by smugglers and sold in Bangladesh, avoiding both the Bangladesh tari f f and the Bangladesh VAT, while the same goods could also be exported to Bangladesh while benefiting from drawback o f input tar i f fs and exemption f i om the Bangladesh tariff, but paying the normal Bangladesh VAT and any other indirect taxes.
7. WELFARE EFFECTS WITH “OFFICIAL” (“TECHNICAL”) SMUGGLING (UNDER- INVOICING ETC)
Many techniques are used to avoid or reduce the import duties paid at Customs posts, for example under invoicing, false descriptions o f high duty items as l ow duty items, and understating quantities. A major problem in South Asia are duty exemptions or drawback payments for materials which are supposedly for use to produce exports, but some or al l o f which in fact are used to produce products sold in the domestic market. In extreme cases entire containers or truck loads may be allowed to pass through Customs without being recorded, in which case “official” or “technical” smuggling really becomes a type o f “bootleg” smuggling.
For many years both India and Bangladesh have had programs to improve Customs administration and to cut down on these kinds o f illegal activity. These programs include the automation o f Customs procedures through the use o f computers, in order to reduce the scope for discretion and to facilitate operational controls and audits, and in Bangladesh import shipments have to be certified by pre- shipment inspection (PSI) f i rms in the exporting country. Combined with the removal o f most QRs and reductions in the general level o f tariffs since the 198Os, in both countries Customs administration i s reported to have improved considerably and the incidence of “technical” smuggling to have declined. Nevertheless, it i s s t i l l an issue which would need to be considered in product level simulations o f the effects o f an FTA o f the kind being discussed in this paper, especially for products in Bangladesh protected by various kinds o f para-tariffs in addition to customs duties. These are especially likely to be susceptible to illegal practices at the border, because o f the incentive to do so from the very high total protective import duty rates (many ranging from 40% to over 100%) they frequently create, as wel l as their complexity.
As with “bootleg” smuggling, for obvious reasons the dimensions and nature o f technical smuggling are difficult to ascertain. Nevertheless some feel for it can usually be obtained from interviews with manufacturers, importers, wholesalers, Customs agents and others. One key b i t o f information that can usually be obtained without too much difficulty, i s the relation between the domestic price o f an imported product and the c i f price plus the official Customs duties (the tariff plus the indirect tax) that i s supposed to be paid when it i s imported. If (after allowing for port costs and distribution margins) the domestic price i s about the same, there are a number o f possibilities:
(a) For the particular product being studied, the Customs system i s operating as intended without bribes and side payments, and customs duties and indirect taxes (e.g. in India the “additional” duty and in Bangladesh the VAT) are being fully collected. In that case, the revenue and other effects o f an FTA could be analyzed as discussed in the previous sections.
(b) Customs duties are being fully collected at the official rates, but “speed money” i s being paid i.e. payments to Customs officials for doing without delay and without making difficulties, what they are supposed to be doing as a normal part o f their job. This can be interpreted as an additional transaction
16

Partial Equilibrium Methods for Industry Level Studies
cost in the Customs clearance process, and it i s likely to be included in the fees to Customs agents and other intermediaries rather than being paid directly by the importer. “Speed money” payments on their own and not involving evasion o f Customs duties, in most circumstances are unlikely to be very large. The effect i s to increase the protection rate, but probably not by much, and in any case speed money i s l ikely to also be required to process tariff-exempt imports from an FTA partner country. Hence, unless there are special reasons for doing otherwise, in most circumstances they can probably be safely ignored in simulating the l ikely effects o f an FTA.
(c) Some quantities (perhaps at particular Customs posts) o f the good are being imported at reduced duties (through under invoicing, for example) wi th side payments to officials, but others are being legally imported at the full official rates. In that case, in effect part o f the Customs duties have been privatized in the form o f economic rents going in part to some importers and in part to the officials and intermediaries involved in these transactions. In this case, trade diverted from R O W suppliers by an FTA would subtract from both the government share o f the Customs revenue and from the economic rents associated with the technical smuggling.
(d) A going side-payment or bribe rate i s established that i s about the same for al l importers in return for a discount on the legal Customs duty rate, but the sum o f the two i s about equal to the official legal Customs duty rate. Since there i s no financial benefit for importers, this i s really a modified form o f a “speed money” bribe, make the arrangement more attractive by offering a discount on the Customs duty rate. As in the previous example, in this case trade diverted from ROW suppliers by an FTA eliminates both tariff revenue and the side payments.
The last o f these possibilities (d) i s illustrated in F ig 11, which i s a modified version o f F ig 1, assuming that Bangladesh i s the importing country and that there i s no local production. Before the FTA the price O A i s set at the intersection o f the Bangladesh demand curve DB and the import supply curve AD, at price P,+k, where to i s the official tariff. However importers are actually charged L, which i s lower than the official tariff by a per unit bribe b. Hence before the FTA the government i s collecting tari f f revenue equivalent to area JBCL and total bribes equivalent to area AJLD are going to Customs and other officials. Since the per unit bribe plus the actual discounted tari f f i s equal to the official tariff, the protection rate that i s available to domestic producers if there were any, and i s potentially available to Indian exporters under an FTA, i s the same as the official tari f f to.
If the market i s now opened to Indian exporters under an FTA, with the supply conditions assumed, they will export quantity OG, diverting this amount from ROW exporters. Because there are no tariffs due on the imports from India, i t i s assumed here (but see discussion below) that there are no bribes affecting this trade. The consequences for India and Bangladesh are the same as illustrated in F ig 1, except that the Customs revenue loss (area JBFK) i s less, the difference being the reduction in bribe money (area AJKE). As previously, the total welfare loss for Bangladesh (area ABFE) consists o f the real trade diversion resource cost (area GBFE) plus the producers’ surplus o f the Indian exporters.
The fixed bribe rate illustrated in Fig 11 i s perhaps unusual and a more heterogeneous situation o f the type described in example (c) above may be more common i.e. differing bribe rates and Customs duty discounts, perhaps varying by importer and Customs post. In that case al l that will be known or that can be inferred i s that some share o f the total potential tariff revenue (area ABCD) i s being absorbed in economic rents and bribes. For obvious reasons i t will be very difficult for applied researchers to estimate the latter, unless they were to have access to detailed Customs records. Some estimates might be possible if there were independent estimates o f the quantities being imported and the prevailing international prices, by comparing Customs revenue actually collected with what theoretically should have been collected if the full Customs duty rates had been applied. But none o f this information i s likely to be easily available, certainly not from official trade statistics, given that the Customs duty “discounts” are never explicit: rather they typically involve understating international prices, understating quantities
17
India-Bangladesh FTA: Methodology and Selected Case Studies
included in containers, misclassification, and misusing drawback and other export mechanisms.6 Hence, in simulating the impact o f an FTA, in most cases only some general qualitative statements about the possible impact on economic rents and bribe payments w i l l usually be possible, with at best ranges o f the possible dimensions based on interviews with people involved in the industry. However, it will usually be possible to say something about the Customs revenue loss, if sufficiently disaggregated official information i s available on the amounts actually collected for the product being studied.
As already noted, Fig 11 illustrates the simplest possible trade diversion case when there i s technical smuggling. The other possibilities illustrated in Figs 2-10, including trade creation and price reductions in the importing country could be analyzed as described previously, the only change being that the trade diversion effects will involve generally unknown losses o f technical smuggling rents in the importing country, in addition to Customs revenue losses.
When there i s technical smuggling, another possibility i s a “leaky” Customs system which allows imports through at a total per unit cost (actual tari f f plus bribe) that i s lower than the official tariff. If this happens, domestic prices will turn out to be lower than c i f prices plus the official Customs duties. If that i s the case and it i s known that the imports are in fact coming through Customs (they are not entirely “bootleg” imports, for example) then it i s likely that for this product some kind o f equilibrium arrangement has been established between Customs and other officials and importers in which the reduced Customs duty plus the bribe rate i s lower than the full official Customs duty rate. If that happens, the official tari f f i s no longer binding and among other things the tariff protection level for local producers i s lower than the apparent level as shown in the official tari f f schedule. In analyzing the effects o f an FTA in this situation, it would be necessary to work wi th what appears to be the de facto tariff (the total o f the actual tariff plus the bribe rate) as indicated by the price difference, and as previously to recognize that any trade diverted from ROW removes or reduces the bribes as well as cutting government tari f f revenue.
This case i s illustrated in F ig 12, where P,+t,+b (the actual duty and bribe-inclusive import price) i s lower than the official tariff inclusive price P,+t,,. Consequently the actual protection rate i s distance B J and imports are OQ, more than they would have been with the official tari f f or with the actual tar i f f plus the bribe rate equivalent to the official tariff. There i s consumer surplus benefit (area AJLD) which exceeds the net loss o f Customs revenue plus bribe payments (area AJYD), giving a standard “welfare triangle” gain (area DYL). Since the starting defacto protection rate i s lower than the official tariff, following the FTA the trade diverted from ROW (distance OS) i s less than it would have been (distance OG) had the official tariff been operative. As a result, the net welfare cost o f the FTA to the importing country (area JBTV) i s less than it would have been without the existence o f the technical smuggling from ROW (area ABFE). T h i s i s essentially because the protection extended to the Indian suppliers under the FTA is reduced by the technical smuggling. Of course, the same result could have been achieved by reducing the official tariff: this jus t illustrates the general point that the potential economic welfare costs o f an FTA for importing industries w i l l always be lower, the lower the general protection rate wi th respect to ROW.
“Technical” smuggling has been discussed so far as though the Customs duty or tariff is the only import tax, but in most countnes there i s also a domestic indirect tax which in principle i s also applied to domestically produced products. In India and Bangladesh these are respectively the “additional” duty (normally 16%) and the VAT (normally 15%) which are value added style taxes imposed on top o f
One possibility would be to look at exporter country trade statistics, which in some cases may be more reliable as regards invoiced prices and quantities than the importing country’s statistics. However, there are other we l l known problems with this, including differences due to freight, insurance and the time lag between clearing Customs in the exporting country and in the importing country.
18
Partial Equilibrium Methods for Industry Level Studies
customs duties, and which can be credited against subsequent liabilities for the value added tax when the imported good i s used as input in production, or resold in a wholesale and retail distribution chain until it reaches final consumers. A major strength o f the VAT indirect tax system i s that it i s largely self reinforcing, because if it i s fully or partially avoided at one stage, the subsequent seller loses the corresponding tax credit and therefore has a motive to ensure either that the seller to him pays the full appropriate tax, or offers him a discount on the selling price to compensate for the higher net tax he will now have to pay. This feature reduces the benefit to an importer if for example the amount o f VAT paid on an import shipment i s reduced through underinvoicing. If the underinvoicing for the particular product i s not universal and is not affecting the going domestic price o f the good (the case illustrated by Fig 11 rather than by F ig 12), the subsequent buyer w i l l have to make a larger net VAT payment and this presumably will reduce the price he i s wi l l ing to pay to the importer. By contrast, reducing the protective customs duty through underinvoicing provides a corresponding gross benefit to the importer.
Of course, this auto-enforcing characteristic o f a VAT-style indirect tax w i l l not operate smoothly if-as i s likely-there is also corruption in the domestic indirect tax administration. For example, if the quantities o f a product shipped (e.g. in containers) are being understated at Customs or described as a different lower-duty product, it i s possible that the deception will continue after the Customs stage in the domestic distnbution o f the good. With an FTA, the normal domestic indirect taxes such as a VAT are payable at Customs, and this means that there may s t i l l be incentives for “technical smuggling” even though there are no protective import duties. The FTA will also provide an incentive to make it appear that imports from ROW are coming from the FTA partner country, involving falsification o f invoices and other corrupt practices. In addition, an FTA o f i t se l f i s unlikely to remove the conditions and incentives for the existence o f “speed money”, and in fact may increase the potential for delays (for example, due to the need to check the compatibility o f shipments wi th rules o f origin) and hence also increase the “speed money” leverage o f Customs and other officials. Eliminating or reducing speed money will normally require major long te rm reforms o f the Customs and indirect tax administrations, and in some ways these reforms will be made more, not less difficult, by the existence o f an FTA together with i t s origin and other rules, alongside a separate Customs regime for other countries. Another possibility i s that without protective tariffs, some products-for example machinery and equipment- will be over invoiced as a way o f understating profits, avoiding profit taxes and perhaps accumulating unrecorded foreign exchange7.
As does “bootleg” border smuggling, “technical smuggling” and the associated corruption o f Customs clearance processes can considerably complicate the task o f simulating the l ikely welfare consequences o f an FTA. However, the principal determinants o f the broad outcome remain the same i.e. whether or not the diversion o f trade from ROW that occurs i s accompanied by price reductions in the importing country. I f there i s no change in the domestic price, there will be a welfare loss, the principal difference with the “clean” n o smuggling case being that part o f the loss i s l ikely to consist o f reduced smuggling rents and bribes. At another extreme, if the imports from the FTA partner country eliminate imports from ROW and come in at close to the world price, there will probably be a net positive welfare outcome for the importing country that will also remove that part o f the incentive for “technical smuggling” previously provided by the protective tariff on imports from ROW. However, bribes and rent seeking associated with the domestic indirect taxes that will s t i l l be collected at Customs, as wel l as “speed money”, are likely to continue, and new opportunities for prof i t tax evasion through over- invoicing, and the fraudulent redirection o f trade through the duty free FTA route may be created. These and similar possibilities should be recognized in welfare simulations o f such cases.
O f course th is might happen with any tar i f f reduction or exemption, not just exemptions that are part o f an FTA. In South Asia, the disappearance o f substantial black market foreign exchange premia has largely removed this incentive to overinvoice, but overinvoicing to avoid profit taxes-especially o f duty free imported machinery- i s reported to be a continuing problem.
19
India-Bangladesh FTA: Methodology and Selected Case Studies
8. ECONOMIES OF SCALE
The cases discussed so far assume that supply curves o f domestic producers in the FTA partner countries slope upwards, indicating that higher prices are needed to elicit increased supplies. T h i s could reflect increasing per unit production costs, but also increasing marketing costs, if an industry in one country begins to supply an FTA partner country for the f i rs t time. However, in some industries (especially manufacturing industries) the access to the other country’s market provided by an FTA may allow some functions to be performed on a larger scale with resulting cost reductions in production and/or marketing. If that happens, the resulting decline in unit (average) costs i s an economic benefit that needs to be considered in evaluating the economic welfare consequences o f the FTA.
Fig 13 works through the principal elements o f the economic welfare outcome o f an FTA for one o f many possible cases with economies o f scale. The principal general points that this example brings out are the following:
If an industry i s operating wi th unexhausted economies o f scale, prima facie i t s costs at larger-even at “optimal”- scales, are too high for it to compete profitably in world export markets. Otherwise it would expand and export, and perhaps export to i t s potential partner FTA country without the benefit o f the FTA. Consequently there must be some conditions and/or policies in the domestic economy that explain why this has not happened-e.g. high energy costs, lack o f skilled manpower, labor market problems, imperfect duty drawback systems at Customs, an inefficient banking system, an unfavorable business environment that discourages investment and r i sk taking. Hence, unless the FTA removes or reduces some o f these constraints, even if, following the agreement, the industry expands and benefits from economies o f scale, it will s t i l l be uncompetitive by world standards, in the sense that its unit costs will exceed world prices at the country’s border. On the other hand, if, given its tariff protection in the domestic market, an industry with unexhausted economies o f scale i s able to compete with imports, in general i t will supply the whole domestic market and eliminate imports altogether (at least imports o f the particular specifications and brands that i t produces). This i s because, if the industry i s profitable competing with imports at scale SI, it will be even more profitable competing at a larger scale S2. T h i s assumption i s made in the example illustrated in F ig 13, but it should be recognized that policies and business environment conditions may be such as to deter expansion and competition, even when there would substantial unit cost reductions for the f i rms undertaking the expansion. However, if this i s the case, expansion to take advantage o f an FTA i s also l ikely to be deterred, except insofar as the opportunities for extra prof i t from access to the partner country’s market from the FTA, help override the inertia and perceived r isks that have hitherto discouraged f i rms from expanding and taking advantage o f economies o f scale in the domestic market. If this happens, the resulting impact in the domestic market o f the exporting country should be allowed for in analyzing the welfare costs and benefits of the FTA. There will be a welfare gain if less efficient domestic production i s replaced, but a welfare loss if the expansion replaces imports subject to tariffs and does not change the domestic price level. Economies o f scale can be interpreted in a number o f ways. Two possibilities are shown in F ig 13, where the line showing unit cost declining with supply i s f i rst interpreted as a textbook long run average cost “envelope” curve o f a single producer with monopoly power, and secondly as a line indicating the declining unit costs o f a number o f competitive firms, where one or more cost factors that are common to al l (e.g. key industry-specific infrastructures such as specialized labor training, quality and research facilities, and the availability o f specialized services) improve as a hnc t ion o f the industry’s scale*. The economic welfare outcomes o f an FTA are worked out under these two assumptions i.e. first assuming a single firm with (discriminating) monopoly in both the markets considered (assumed to be Bangladesh and India), and secondly assuming a competitive industry in which f i rms just break even at a common price in both markets. However, in practice it i s likely that
This i s the standard textbook Marshallian “external economies” case
20
Partial Equilibrium Methods for Industry Level Studies
actual cases will include both elements i.e. economies o f scale that are internal to individual firms and which provide them with some individual market power, as well as external economies o f scale that reduce costs for al l f i rms in the industry, but which, being available to all, are compatible with competition between them. The nature o f the welfare outcomes with scale economies will depend on how much weight it seems reasonable to give to these two possibilities in individual cases: it wil l generally be somewhere in between the two polar possibilities outlined in F ig 13. If an FTA permits an industry in one o f the partner countries to benefit from scale economies, it does not follow that there will be “trade creation”. Instead, if the firm that benefits i s a monopoly (or if a group o f f i r m s behave as a monopoly), the profi t maximizing level o f exports to the importing FTA country’s market may remain at the same level as the imports from ROW that are displaced. However, especially if there i s competition among the FTA member firms, it i s more l ikely (as in the polar competition case illustrated in Fig 13) that there wil l be “trade creation”, because prices will fa l l in the importing FTA country, leading to a larger volume o f exports from the exporting FTA member than the exports displaced from ROW suppliers. As in the earlier examples wi th positively sloped domestic supply curves, when there are economies o f scale the overall net welfare outcome, both for the two FTA countries jointly, and globally including ROW, may be positive or negative, As in those cases, the outcome depends crucially on the extent to which the economies o f scale pass through to price reductions in the FTA member countries, creating sufficiently large consumer welfare benefits to offset the Customs revenue losses that result from the replacement o f lower cost imports from ROW by higher cost production f rom the exporting FTA country. Finally, just because an FTA allows an industry in one o f the countries to benefit f rom scale economies and cut i t s costs, does not mean that the ne t joint welfare outcome for the two countries will necessarily be superior to an outcome with increasing costs i.e. with an upward sloping supply curve. On the one hand, provided there i s competition, the economies o f scale will produce lower prices and consumer benefits: on the other hand they w i l l allow the exports from the FTA partner country to displace a larger volume o f imports from R O W (in the homogeneous good case illustrated in F ig 13, all the imports from ROW) with a correspondingly larger loss o f tariff revenue for the importing country. If the consumer benefits are small relative to the loss o f Customs revenue, the existence o f the scale economies that are released by the FTA may worsen rather than improve the net welfare outcome.
F ig 13 illustrates some o f these general points. Both the Bangladesh and the Indian markets for a product are shown on a single diagram using a common currency. Before the FTA the Bangladesh market (demand curve DB) i s entirely supplied by the Bangladesh industry at price O A at which quantity OL i s supplied and demanded. The domestic industry i s protected from imports (ci f import price Pw) by tari f f KA which gives a tariff inclusive price Pw+tB. The Indian market i s entirely supplied by imports at a lower tariff inclusive price OG (Pw+tI) than the prevailing price in Bangladesh owing to a lower tar i f f (tI) in India than in Bangladesh (tB)’. The Indian government collects tariff revenue equivalent to area GKVQ. There are economies o f scale in production, indicated by the line passing through point B and declining through points H and E, which can be interpreted alternatively as the long run average cost curve o f a single firm which i s an “envelope” o f short run cost functions at successively increasing plant scales, or as indicating the minimum average cost level o f numbers o f f i rms in a competitive industry which go down as various external economies come into play as the industry’s total output increases. In this example the line i s drawn so that the industry (whether an individual monopoly firm or a competitive
If there were also Indian production, the economies o f scale following the FTA might be achieved in various ways; e.g. through a merger o f the Indian and Bangladesh producers, or by the relocation o f competing producers in one o f the countries to take advantage of external (“agglomeration”) economies there.
21
India-Bangladesh FTA: Methodology and Selected Case Studies
industry) just breaks even in selling in the Bangladesh market, at point B.” However, even though there are economies o f scale and average costs decline with increasing output, the long run cost curve flattens out at some point beyond point E and remains above the going world price Pw, so that the Bangladesh industry i s not competitive internationally even when al l the available scale economies are exhausted. Hence, before the FTA when it has to pay the general Indian tariff, the Bangladesh industry cannot compete with ROW suppliers in the Indian market.
After the signing o f an FTA between Indian and Bangladesh, the Bangladesh industry has duty free access to the Indian market. First considering the case o f a single discriminating monopoly producer, total output expands to OM, o f which OY (=WM) i s sold in the domestic Bangladesh market, and OW i s exported to India. Profit i s maximized by equating long run marginal cost wi th marginal revenue in the two markets. In F ig 13 as drawn, t h s turns out to require a price reduction and sales expansion in the Bangladesh market, but the price and output supplied to the Indian market remains the same as before the FTA (or strictly speaking lower by a margin small enough for buyers to switch al l their purchases from imported supplies to the Bangladesh based producer).” From the Bangladesh perspective, these changes increase economic welfare by producer surplus (monopoly profit) area GFuQ on sales in the Indian market (the excess o f the selling price OG over the cost o f production MH (=OF) times the quantity sold), plus producers’ surplus on sales in the Bangladesh market equivalent to area UFZP, plus increased consumers’surplus in Bangladesh equivalent to area AUPB. However the Indian government loses al l the tariff revenue on the displaced imports from ROW (area GKVQ) and there i s n o change in Indian consumer welfare. With the demand, supply and cost parameters given in Fig 13, the tari f f revenue loss to India exceeds the Bangladesh welfare gains, so that the FTA for this industry results in a net jo int welfare loss for India and Bangladesh together, and ipsefucto a net global welfare loss after accounting for the unknown loss to the ROW exports to India that have been displaced.
F ig 13 next illustrates an alternative scenario in which the Bangladesh industry i s competitive in the sense that at al l points along the long run economies o f scale curve, competition between f i rms drives prices down so as to just cover their total costs including “normal” profits on their investments. After the FTA the Indian market becomes accessible and industry output expands from OL to ON, and the pre-FTA price O A in Bangladesh drops to OJ (=NE). The new equilibrium point at E i s determined by the intersection o f the economies o f scale supply l ine and an aggregate demand curve which i s the horizontal sum o f the demand curves in the Bangladesh and Indian markets. T h i s i s represented by the segmented line ABCDE, the flat portions indicating that prices cannot exceed the tariff- inclusive prices f rom ROW in Bangladesh and India, the first downward sloping segment representing the Bangladesh demand at price below the tariff inclusive price, and the second and final downward sloping segment representing the total demand in both Bangladesh and India at prices below the Indian tar i f f inclusive price i.e. the horizontal sum o f the segments CS and QR o f Bangladesh and Indian demand at those prices. In the new
T h i s i s an arbitrary starting point to simplify the diagram and the exposition. The same general points could be made with a lower or higher cost curve over th is range. In the former case, the base scenario for the monopoly interpretation would involve some profits earned in Bangladesh, and in the base scenario under competition the starting price in Bangladesh would be lower than in Fig 13. In the latter case there would be no initial production in Bangladesh, but production might become feasible once access to the Indian market becomes possible with the FTA. The new total production level and the discriminating monopoly profit maximizing prices are determined by the intersection o f the long run marginal cost curve (not shown in this diagram) associated with the long run average cost curve, and the marginal revenue from incremental sales in the two markets (the dashed “total” marginal revenue line). Because o f the discontinuity in the Indian market marginal revenue curve resulting from the kink in the demand curve at point Q, i t turns out that the profit maximizing price in India i s just marginally lower than the pre-FTA price WQ, while the profit maximizing price in the Bangladesh market i s somewhat below (by distance AU) the pre-FTA price.
10
22

Partial Equilibrium Methods for Industry Level Studies
equilibrium, competition between the f i rms keeps the price in the two markets the same”. From the Bangladesh perspective, compared to the pre-FTA situation there are no producer surplus welfare gains, but on the other hand in this example there is a major consumer welfare benefit equivalent to consumer surplus area AJSB, the result o f the price cut from OA to OJ, and a consequent demand expansion from quantity OL to quantity OT. From the Indian perspective, tariff revenue equivalent to area GKVQ has been lost, but this i s to a large extent compensated by a welfare benefit to Indian consumers equivalent to consumer surplus area GJRQ. Overall, wi th the parameters assumed in F i g 13, there i s joint net welfare gain for Bangladesh and India taken together, with the consumers’ surplus benefits in both countries exceeding the Indian Customs revenue loss. Conceivably there would also be a net global welfare improvement, depending on the producer surplus losses o f the displaced ROW exporters to India. However, as emphasized previously, i t i s evident from the diagram that whether or not there i s a jo int or a global welfare gain from the FTA depends entirely on the parameters. The presence o f competition increases the probability that economies o f scale will lead to positive joint and global outcomes, but certainly does not guarantee that this will be the case. Conversely, it should be noted that economies of scale accompanied by monopoly power do not necessarily mean that there will be a negative jo int welfare outcome, because discriminating monopoly prices may be far enough below the pre-FTA prices as to create consumer welfare gains which, added to monopoly profits, exceed the Customs revenue losses from the diverted ROW trade.
9. ALLOWING FOR PRODUCTIVITY CHANGES
Many factors affecting the costs and productivity o f the industnes that will be affected by an FTA are occurring continuously. Unless there are good reasons to do otherwise, in most circumstances it w i l l be preferable to work with current or recent observed prices, and costs inferred from these prices after allowing for known indirect taxes. However, if there are well substantiated reasons for believing that the observed prices and the costs inferred from them are influenced by temporary factors (e.g. a drought or a strike may temporarily increase the price o f a key raw material), or if already observed trends in important variables are expected to continue, the interest o f the FTA simulation may be increased if it i s also run with estimated supply functions which assume that the temporary factors have abated or that the trend factors have continued. If they are likely to be substantial, productivity improvements may be o f special interest in this regard. For example, in a case study to simulate the l ikely effects o f an India- Bangladesh FTA on the cement industry, it turned out that the Bangladesh industry had been through a very recent expansion in which many small high cost cement grinding plants had been established and considerable excess capacity created. However, at the time o f the study a shakeout o f small unviable firms was already under way, prices were coming down, and there were good prospects that higher capacity utilization o f the remaining f i rms would substantially further reduce the prices at which they could be viable. Consequently, based on estimates provided by industry executives o f break-even prices for medium scale plants at higher capacity utilization levels, two simulations o f the likely effects on this industry o f an FTA with India were run, one using a Bangladesh supply function based on actual prices and costs, and another using a supply function based on estimated alternative lower costs at higher average capacity utilization levels and with on average larger cement grinding plants.
In terms o f the simple diagrams used in this paper, this kind o f productivity improvement would be represented by a downward shift in the relevant supply curve, which could occur in either or both o f the FTA member countries. Other exogenous changes in costs could similarly be represented by upward
’* I f the industry uses imported inputs that are subject to tariffs, prices wil l generally be lower in the importing FTA market, because tariffs on the inputs will be exempted or rebated when production i s exported, but not when the production i s sold domestically. In this case, with competition, the value-added margin in the two markets (between the cost of the imported inputs and the selling prices o f the final product) will be equalized, not the selling prices themselves.
23
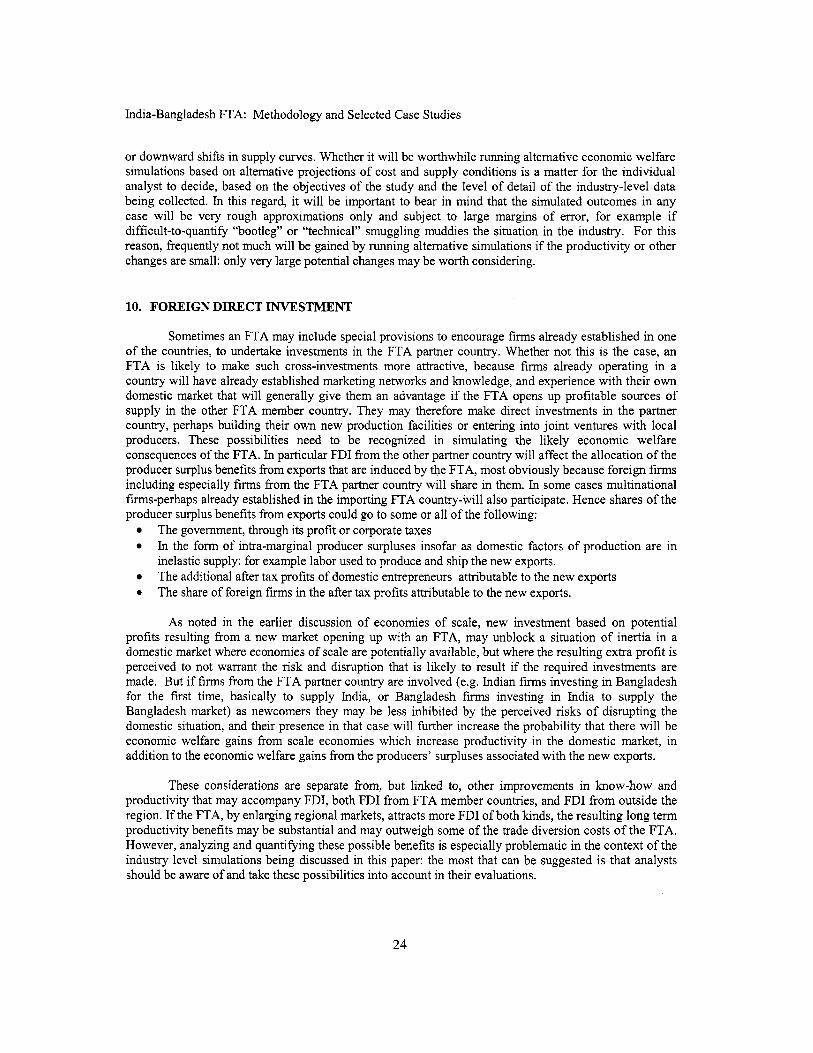
India-Bangladesh FTA: Methodology and Selected Case Studies
or downward shifts in supply curves. Whether i t will be worthwhile running alternative economic welfare simulations based on alternative projections o f cost and supply conditions is a matter for the individual analyst to decide, based on the objectives o f the study and the level o f detail o f the industry-level data being collected. In this regard, it will be important to bear in mind that the simulated outcomes in any case will be very rough approximations only and subject to large margins o f error, for example if difficult-to-quantify “bootleg” or “technical” smuggling muddies the situation in the industry. For this reason, frequently not much will be gained by running alternative simulations if the productivity or other changes are small: only very large potential changes may be worth considering.
10. FOREIGN DIRECT INVESTMENT
Sometimes an FTA may include special provisions to encourage f i rms already established in one o f the countries, to undertake investments in the FTA partner country. Whether not this i s the case, an FTA i s likely to make such cross-investments more attractive, because f i rms already operating in a country w i l l have already established marketing networks and knowledge, and experience with their own domestic market that w i l l generally give them an advantage if the FTA opens up profitable sources o f supply in the other FTA member country. They may therefore make direct investments in the partner country, perhaps building their own new production facilities or entering into jo int ventures with local producers. These possibilities need to be recognized in simulating the l ikely economic welfare consequences o f the FTA. In particular FDI from the other partner country will affect the allocation o f the producer surplus benefits from exports that are induced by the FTA, most obviously because foreign f i rms including especially f i rms from the FTA partner country will share in them. In some cases multinational firms-perhaps already established in the importing FTA country-will also participate. Hence shares o f the producer surplus benefits from exports could go to some or al l o f the following:
0
The government, through i t s prof i t or corporate taxes In the form o f intra-marginal producer surpluses insofar as domestic factors o f production are in inelastic supply: for example labor used to produce and ship the new exports. T h e additional after tax profits o f domestic entrepreneurs attributable to the new exports The share o f foreign f i rms in the after tax profits attributable to the new exports.
As noted in the earlier discussion o f economies o f scale, new investment based on potential profits resulting from a new market opening up with an FTA, may unblock a situation o f inertia in a domestic market where economies o f scale are potentially available, but where the resulting extra prof i t i s perceived to not warrant the risk and disruption that i s l ikely to result if the required investments are made. But if f i rms from the FTA partner country are involved (e.g. Indian f i rms investing in Bangladesh for the first time, basically to supply India, or Bangladesh f i rms investing in India to supply the Bangladesh market) as newcomers they may be less inhibited by the perceived r isks o f disrupting the domestic situation, and their presence in that case w i l l further increase the probability that there will be economic welfare gains from scale economies which increase productivity in the domestic market, in addition to the economic welfare gains from the producers’ surpluses associated w i th the new exports.
These considerations are separate from, but linked to, other improvements in know-how and productivity that may accompany FDI, both FDI from FTA member countries, and FDI from outside the region. If the FTA, by enlarging regional markets, attracts more FDI o f both kinds, the resulting long te rm productivity benefits may be substantial and may outweigh some o f the trade diversion costs o f the FTA. However, analyzing and quantifying these possible benefits i s especially problematic in the context o f the industry level simulations being discussed in this paper: the most that can be suggested i s that analysts should be aware o f and take these possibilities into account in their evaluations.
24

Partial Equilibrium Methods for Industry Level Studies
Concluding comments
As noted at the beginning, the taxonomy o f possible cases presented in this paper i s far f r o m complete, but it i s hoped that it will nevertheless b e useful in dealing with the many variants that are sure to arise in practice. To supplement it, the appendix outlines some practical suggestions that were made in connection with industry level case studies o f the l ike ly welfare outcomes o f a proposal for an India- Bangladesh FTA, that was periodically discussed by the two governments f rom about 2002 onwards. Similar practical questions, sometimes involving conceptual issues, wou ld b e sure to come up in empirical studies involving either FTAs or preferential trading agreements between other countries.
25

India-Bangladesh FTA: Methodology and Selected Case Studies
P
c Pw+t
E p w
C
Fig 1 FTA with no Bangladesh production and no Indian supply before the FTA. Simple trade diversion case,AW<O
H Demandlsupply in Bangladesh - ,ssumptions:
No Bdesh production No smuggling FTA case: zero preferential tariff (100% preference) No price effects in India=no consumer welfare effects in India No VAT or other domestic taxes
Bdesh price=OA=cif price from ROW=OM+tariff=Pw+t Demand=lmports from ROW=OH Customs revenue=area ABCD=a+p+6 Indian supply=zero
Bdesh price unchanged=OA Indian supply=OG Imports from ROW=GH Reduced Bdesh Customs revenue=area ABFE=u+,8 Indian exporters' producer surplus=area A G E d Bdesh terms of trade loss=area GBFE=o Bdesh economic loss=reduced Customs revenue=a+,8 Net economic loss (India+Bdesh)=o Economic loss for ROW: producer surpluses on displaced exports OG=?
're-FTA:
'ost FTA:
26

Partial Equilibrium Methods for Industry Leve l Studies
Fig 2 FTA with Bangladesh production and no Indian supply before the FTA: simple trade diversion case, AW<O
pwT 0 t
a
I
i J N Demand/supply in Bangladesh -
Flg 3 FTA with Bangladesh production and with Indian supply before the FTA: simple trade diversion case, AWcO
Demand and supply in Bangladesh b
27
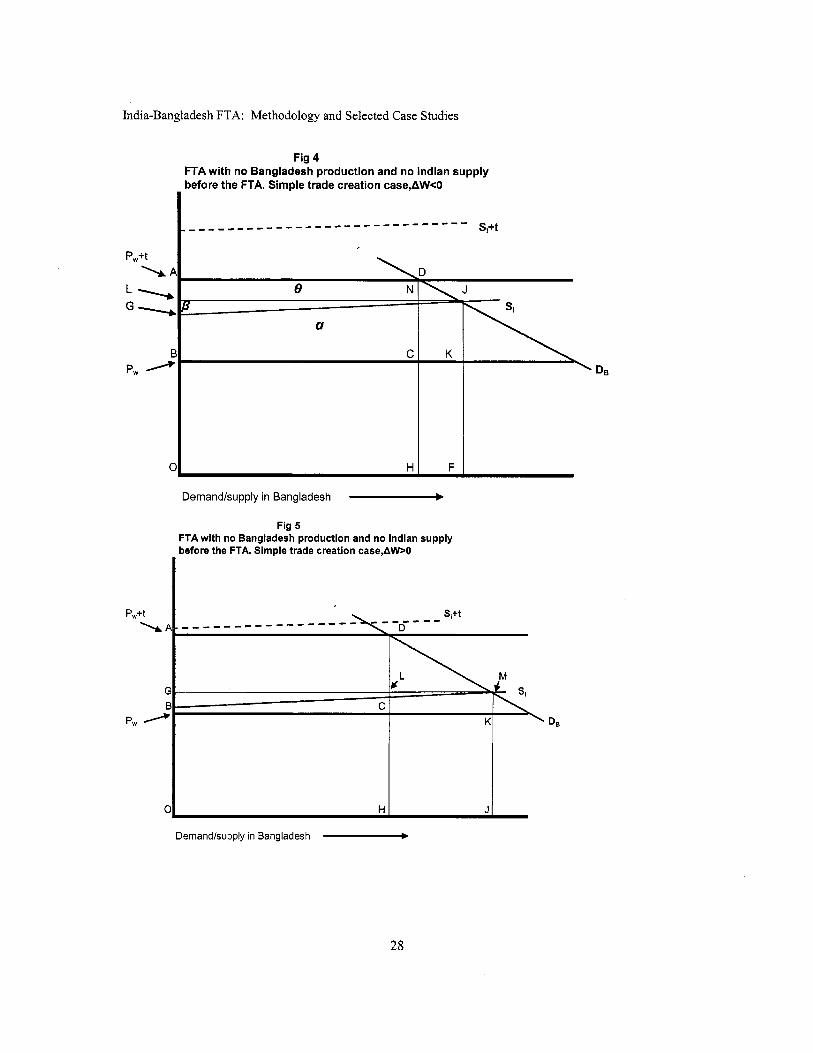
India-Bangladesh FTA: Methodology and Selected Case Studies
Fig 4 FTA with no Bangladesh production and no Indian supply before the FTA. Simple trade creation case,AW<O
- . . . . . . . . . . . . . . . . . . . . . . . . . . . . . S,+t
P,+t \ A
L \ e J
Demandlsupply in Bangladesh - Fig 5
FTA with no Bangladesh production and no Indian supply before the FTA. Simple trade creation case,AW>O
Demand/supply in Bangladesh - 28
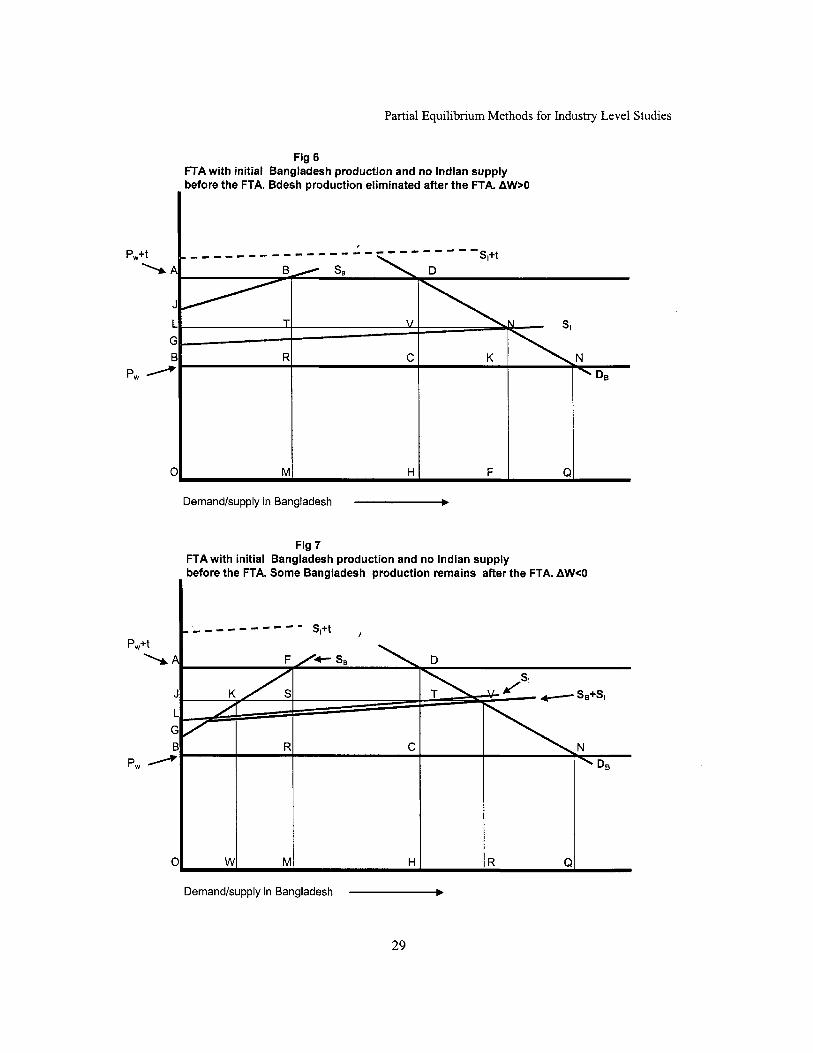
Partial Equilibrium Methods for Industry Leve l Studies
W
Fig 6 FTA with initial Bangladesh production and no Indian supply before the FTA. Bdesh production eliminated after the FTA. AWrO
Dernandlsupply in Bangladesh ,-b
M H R (
Pw+t \rf
1 c E
p w
C
Fig 7 FTA with initial Bangladesh production and no Indian supply before the FTA. Some Bangladesh production remains after the FTA. AWcO
R C rl ' DB
Demandlsupply in Bangladesh - 29
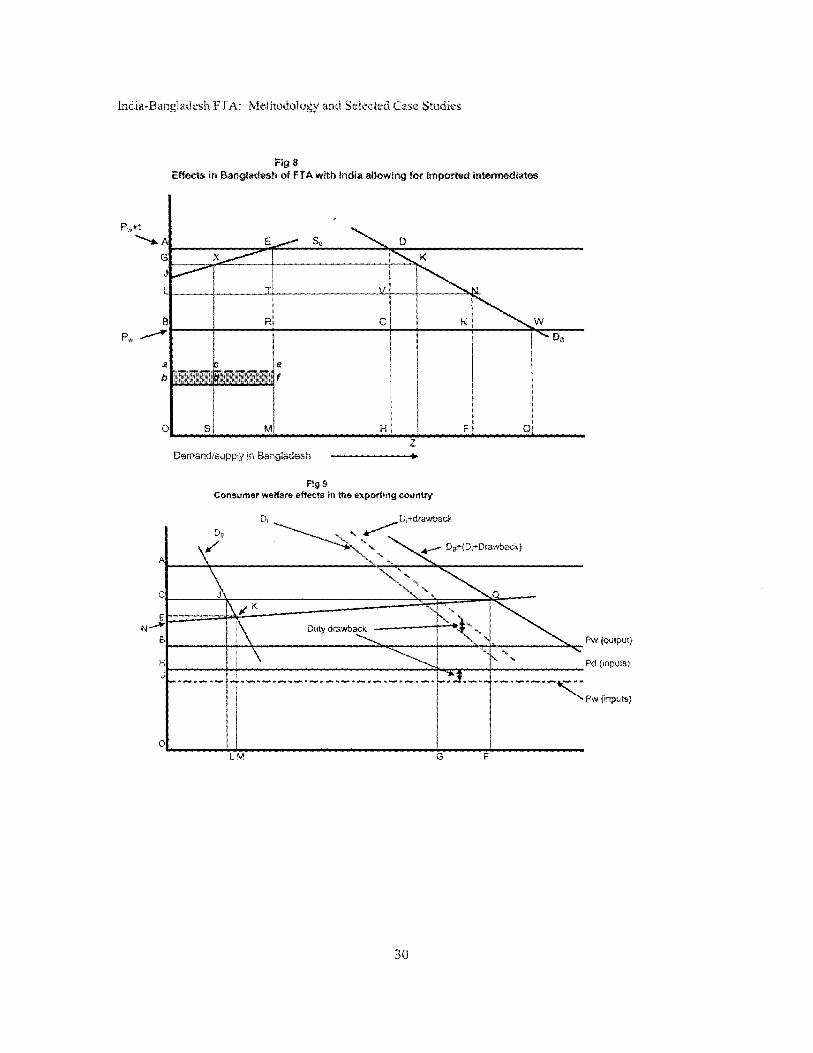
30
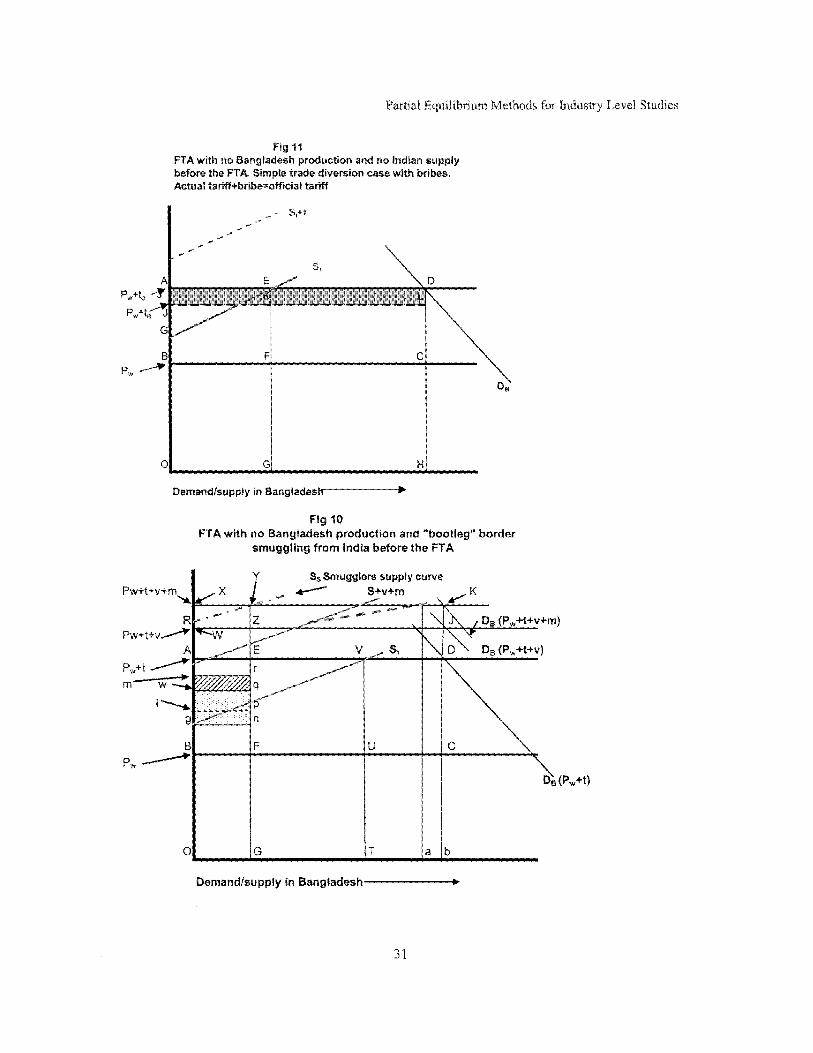
Fig 11 FTA with no Ba~gladesh ~ r o ~ ~ c t ~ o ~ and no Indian supply before the FTA, Simple trade diversion case with bribes. Actual ~ a r j ~ ~ b ~ ~ ~ e = # f f i c i a ~ tariff
Fig 10 FTA with no BangIadesh production and '~boo~~egr' border
~ ~ u g g ~ ~ n ~ from India before the F f A

India-Bangladesh FTA: Methodology and Selected Case Studies
Fig 12 FTA with no Bangladesh production and no Indian supply before the FTA Simple trade diversion case with bribes. Actual tariff+bribe<official tariff
Demand/supply in Banglades-
Pw+ta=world price + actual tariff Pw+ta+b=world price + actual tariff + bribe
Fig 13 FTA with economies of scale. Bangladesh production, no Indian production, higher tariff in Bangladesh than in India
Demand/supply in Bangladesh and India _____*
32
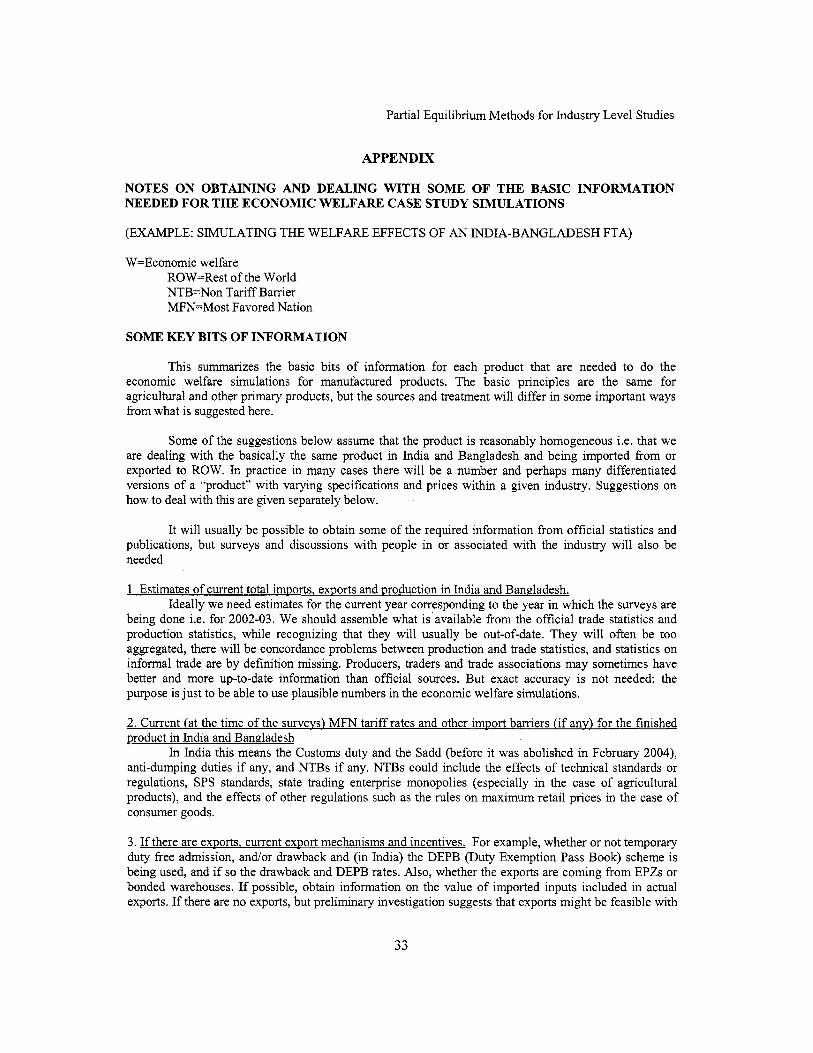
Partial Equilibrium Methods for Industry Level Studies
APPENDIX
NOTES ON OBTAINING AND DEALING WITH SOME OF THE BASIC INFORMATION NEEDED FOR THE. ECONOMIC WELFARE CASE STUDY SIMULATIONS
(EXAMPLE: SIMULATING THE WELFARE EFFECTS OF AN INDIA-BANGLADESH FTA)
W=Economic welfare ROW=Rest o f the World NTB=Non Tarif f Barrier MFN=Most Favored Nation
SOME KEY BITS OF INFORMATION
This summarizes the basic bits o f information for each product that are needed to do the economic welfare simulations for manufactured products. The basic principles are the same for agricultural and other primary products, but the sources and treatment will differ in some important ways from what i s suggested here.
Some o f the suggestions below assume that the product i s reasonably homogeneous i.e. that we are dealing with the basically the same product in India and Bangladesh and being imported from or exported to ROW. In practice in many cases there will be a number and perhaps many differentiated versions o f a “product” with varying specifications and pr ices within a given industry. Suggestions on how to deal with this are given separately below.
It will usually be possible to obtain some o f the required information f rom official statistics and publications, but surveys and discussions with people in or associated with the industry will also be needed
1 Estimates o f current total imports. exports and production in India and Bangladesh. Ideally we need estimates for the current year corresponding to the year in which the surveys are
being done i.e. for 2002-03. We should assemble what is’available from the official trade statistics and production statistics, while recognizing that they wi l l usually be out-of-date. They will often be too aggregated, there will be concordance problems between production and trade statistics, and statistics on informal trade are by definition missing. Producers, traders and trade associations may sometimes have better and more up-to-date information than official sources. But exact accuracy i s not needed: the purpose i s just to be able to use plausible numbers in the economic welfare simulations.
2. Current (at the time o f the survevs) MFN tarif f rates and other import barriers (if any) for the finished product in India and Bangladesh
In India this means the Customs duty and the Sadd (before it was abolished in February 2004), anti-dumping duties if any, and NTBs i f any. NTBs could include the effects o f technical standards or regulations, SPS standards, state trading enterprise monopolies (especially in the case o f agricultural products), and the effects o f other regulations such as the ru les on maximum retail prices in the case o f consumer goods.
3. I f there are exports, current export mechanisms and incentives. For example, whether or not temporary duty free admission, and/or drawback and (in India) the DEPB (Duty Exemption Pass Book) scheme i s being used, and if so the drawback and DEPB rates. Also, whether the exports are coming from EPZs or bonded warehouses. If possible, obtain information on the value o f imported inputs included in actual exports. If there are no exports, but preliminary investigation suggests that exports might be feasible with
33
India-Bangladesh FTA: Methodology and Selected Case Studies
an FTA, ask people in the industry for an approximation o f the import duty component o f their inputs which would be rehnded or exempt if they were to export.
4. Estimates o f the border prices (cif) o f the sample finished products being produced in India and estimates o f the border prices o f the sample finished products being produced in Bangladesh
This means estimates o f the actual price difference between the locally produced product and the price o f the same product at the border (ideally cif, but c&f will suffice). The relevant domestic price is the ex-factory price before excise duty and sales taxes in India, and before VAT or other taxes in Bangladesh. There will be various cases to deal with.
(a) Producers and/or traders consider that the domestically produced product i s competing with the same or similar imported products which are paying normal import duties. Note that the imported products with which the local product i s competing need not be identical; they may have different specs and se l l in different price brackets, for example. But if local producers and/or traders consider them to be competing I suggest we assume that the ex-factory price o f the domestic product has been raised above i t s border (cif) price by the tariffs which apply to imports plus prevailing importer/distributor margins.
The importer/distributor margins w i l l include port and transport costs to get the imported products to the place and point in the distribution chain at which they are competing with the domestic product e.g. a trader in Calcutta if we were estimating the border price o f a domestic product selling to traders there. In practice we should probably use an approximate percentage distribution margin rather than absolute values. This could be expressed as a percentage o f the CIF price e.g. if the relevant margin o f an importer/wholesaler i s 15% o f the c i f price, and the protective import duty rate i s 25% o f the c i f price, then the c i f price o f the domestic product would be derived from the domestic price as follows: Pcif=Pd/(l.40). To summarize, in order to estimate the border (international price) o f the sample domestically produced product, we need to know:
Whether or not the product i s competing wi th imports The protective import duty rate being paid by the competing imports The point in the distribution chain at which the competition with imports i s talung place, and the distribution margins (including port and transport costs) on imported products that are being incurred up to that point by the importers.
(b) Producers and traders consider that the sample local product i s not directly competing with imported products and the local product i s not exported. This may happen when there are no or few imports, or if imports are o f specifications or qualities which are quite different from and have little influence on sales o f the domestic product. In this case, if the only protection against imports i s from protective tariffs, by definition the tariffs are redundant in the sense that domestic prices exceed border prices by less than the sum o f the tariffs and distnbution margins. In this case the border (cif) price o f the domestic product would ideally be directly estimated by comparing i t s domestic price with the international prices o f the same or close substitutes. It may be possible to get rough estimates o f international prices by asking the local producers and traders and by checking industry and trade magazines. However, because o f quality and specification differences and many other problems price comparisons o f this kind are difficult and unreliable. In that case it may be necessary to make some arbitrary assumptions e.g. that the excess o f the domestic price over i t s border price i s equivalent to say hal f the mfn protective tariff plus an estimate o f the import distribution margins on different but similar products. Guesses o f this kind, that the realized nominal protection is somewhere between zero and the applicable tariff, are plausible since some exports would be expected if the realized nominal protection were below zero i.e. the domestic price were lower than the international price, and imports would be expected if the domestic product were priced up to fully take advantage o f the tariff. (Note however that
34
Partial Equilibrium Methods for Industry Level Studies
this i s not so simple if there are b ig gaps between c i f and fob prices due to international transport costs that are high relative to the values o f the goods being shipped. These gaps are very large in the case of major primary agricultural commodities such as wheat, rice and coarse grains in South Asia).
(c ) Producers and traders consider that the local product i s principally competing with smuggled imports. In this case nominal protection i s determined by the expenses and margins o f the smugglers which are presumably less than the tariff protection plus trading margins o f legal imports (or what these would be if smuggling has driven out formal importing). If the smuggling expenses and margins cannot be estimated directly, as in the redundant protection case it may be necessary to guess levels that are somewhere in between zero and the formal tariffs plus formal margins. Note that this case covers both conventional smuggling which physically bypasses Customs posts, and “technical smuggling” in which there i s misclassification, under invoicing etc and associated bribes at the Customs posts. When either form o f smuggling i s important, it w i l l generally be useful to ask traders and affected businesses about the approximate order o f magnitude o f price differences resulting from smuggling. For example, manufacturers and traders could be asked by approximately what percentage domestic prices are lower than they otherwise would be if there were no smuggling. Bear in mind, however, that import prices may fully reflect the official ta r i f f s even i f there i s substantial smuggling, if at the margin there are some fully legal imports that pay the legal tariff, or more likely, if most o f the difference between the official tariff and actual tariffs paid consists o f bribes.
(d) There are no competing imports but the product i s being exported. In this case the export price i s by definition the world price, except that it i s fob rather than c i f and hence can be used directly in the economic welfare simulations o f preferential exports without the need to f i rst estimate fob prices corresponding to c i f prices. However, even if the product i s an exportable we s t i l l need an estimation o f the nominal protection o f the product in the domestic market i.e. by how much domestic prices exceed world prices (in order to estimate whether wi th an FTA there would be exports fkom Bangladesh to India or vice versa). If the exported products and the domestically sold products are identical, we would just need the domestic and the export prices. However, frequently there i s quality, specification, and other (shipment quantities, credit terms, packaging etc) differences between apparently otherwise identical domestically sold and exported products which invalidate direct price comparisons even in this case. If so, as a f i rst cut, I suggest assuming that the domestic prices exceed export prices by tradable input nominal protection i.e. by the extent to which the cost o f tradable inputs i s increased by tar i f fs and other forms of protection above their cost when the final product i s exported i.e. when the producers benefit from drawback, duty free admission and other benefits received when the product i s exported. This would approximate a competitive equilibrium in which domestic prices o f the finished products exceed export prices owing to the generally tariff free conditions for tradable inputs, but where value added margins o f domestically sold products would equal value added margins o f exported products. However, i f there i s reliable information that the industry i s not competitive, the value added margins on domestic sales could exceed the export value added margins, in which case the domestic would fall somewhere between the competitive equilibrium price and the c i f price plus protective ta r i f f s plus importer margins.
(5) Estimates o f the tradeable input and import duty component in the prices o f the finished products. Some information on this i s basic: it i s needed to (1) if there are no actual exports, estimate potential export prices after allowing for l ikely duty drawback or tari f f exemption for inputs used in exports (2) discuss the compatibility o f FTA exports with rules o f origin ratios being proposed for the FTA (3) estimate the indirect fiscal costs if a domestic industry using imported inputs contracts as a result o f competition following an FTA
However, extremely detailed information (e.g. a detailed breakdown o f the cost o f a l l the inputs used to make each product) i s not essential and i t i s not recommended that firms be asked to provide it. Instead, I suggest just asking them for the total cost o f imported inputs and the customs duty and the
35

India-Bangladesh FTA: Methodology and Selected Case Studies
indirect tax (e.g. VAT in Bangladesh, additional duty in India) components o f that, if possible for individual products, but failing that in relation to their total sales. Equivalent information on domestically produced inputs would be useful but i s not essential and I suggest not asking for it unless the f i rms indicate that they would switch to sourcing a substantial share o f their inputs if they were to export.
Strictly speaking, i f local inputs are “fully tradable” the indirect fiscal tariff revenue effects should be allowed for, but I suggest ignoring this complication initially and just following it up later if it would make enough o f a difference to the final outcome.
Th is means provisionally treating local intermediate inputs as non-tradables, and not worrying about the tariff revenue effects if the simulations suggest that the industry would contract wi th an FTA. In that case the revenue effect would occur through domestic indirect taxes, to which imports o f final goods that substitute for the displaced domestic production are also subject. Specifically, if with an FTA production o f x in Bangladesh declines and is substituted by imports from India, VAT on the increased imports from India substitutes for VAT lost on the local production. I t doesn’t matter if local tradeable inputs subject to VAT are used to produce x, because the total loss o f VAT resulting from the decline in production i s unaffected owing to the VAT credit available to the producers o f x. There would be some net revenue changes from indirect tax repercussions if the price o f x goes down after the FTA, but this effect w i l l generally not be b ig enough to worry about given the other approximations being made.
As a practical matter, manufacturing industries in India are mostly much more integrated with local suppliers o f intermediates than manufacturing industries in Bangladesh. Consequently i t will be more important to obtain at least rough estimates o f the role o f imported intermediates for a Bangladesh industry than for the same industry in India. If information on intermediates i s difficult to obtain in India, I suggest we deal wi th that in two phases (1) by pretending that the Indian f i rms don’t use any imported tradeable inputs and just calculating the welfare changes in India on that assumption (2) having a look at the l ikely indirect impact in India through tradeable inputs on the basis o f whatever evidence on their l ikely role can be obtained, and reporting some upper and lower bound adjustments to the welfare changes based on that.
SUMMARY OF PROCEDURES
J1) Find or estimate ex-factorv prices Preferably directly from manufacturers or indirectly by workmg back from wholesaler prices (need in that case to know/estimate/guess typical wholesaler margins). For primary agricultural products domestic wholesale prices are good enough. No need to go back to farm gate prices. But to work out trade direction potential need to remove domestic taxes, if any (as for manufactured products discussed below).
(2) Remove domestic indirect taxes from ex-factory prices (if included) India: excise tax (=VAT) and sales taxes (state or central) Bangladesh: VAT Price (2) in India i s the price with which Bangladesh exporters would have to compete. Price (2) in Bangladesh i s the price wi th which Indian exporters would have to compete Need to have a clear understanding o f how these taxes operate, especially the bases for the taxes and how they relate to each other.
13) If the product i s not being exported anwhere: estimate potential export supply price Find or estimate drawback amount and other incentives the product would receive if it were exported and deduct them from the tax-free ex-factory domestic price.
36

Partial Equilibrium Methods for Industry Level Studies
In India and Bangladesh: estimate the import duty component o f tradeable inputs (raw materials) and the VAT on inputs if included in the costs o f raw materials. Add any other export incentives if significant (usually they won’t be estimates are very rough anyway).
In India, if the firm providing the price information (e.g. a wholesaler) i s not i tse l f exporting, but other firms are exporting the product, could use the standard published drawback or DEPB (Duty Exemption Passbook) rates for that product
(4) If the product i s actually being exported: obtain or estimate actual export prices. Beware o f unit values however!! Use them as a cross check, but recognize that they can be very misleading. The export prices are to any non-preferential markets.
(5) Check if the product i s already being exported from India to Bangladesh or vice versa and the prices in this trade. I s this trade legal or illegal or both?
(6) If the Bangladesh actual export price or potential export supply price <the Indian tax -free ex-factory price, the product could potentially be exported to India with an FTA. Note: need to allow for port costs to fob stage and transport costs to India. If the exports would be feasible with an FTA, the W simulations should be done
J7) If the Bangladesh export supply price> the Indian domestic ex-factory price go no firther. Then n o W simulation i s needed o f Bangladesh exports to India under an FTA
J8) If the Indian export or potential export supply price< the Bangladesh ex-factory tax free price. with an FTA exports will increase or there will be exports o f products that were potential exports prior to the FTA
W simulations needed o f effects in both India and Bangladesh
(9) If the Indian export price to ROW or the potential export supply price > Bdesh domestic ex-factorv price, no exports will occur. N o W simulation needed.
(10) For some products there will be no trade either way with an FTA (unlikely however)
(1 1) For other products, wi th an FTA it i s possible that Bangladesh exports could PO to India and that the same products would be exported by the same Indian f i rms to Bangladesh.
If this happens it i s probably because o f high duty drawback rates in one or both countries. When selling domestically the f i rms pay the normal duties on their inputs and could be at a disadvantage in competing with an exporter in the other country which receive drawback. But the same thing could happen in reverse i.e. f i rms in country X can compete in country Y using drawback, and the f i rms with which they compete in country Y can compete in country X’s domestic market, also through access to drawback.
In that case the exports might be excluded by rules o f origin under the FTA. Discuss when doing the simulations.
T h i s i s obviously a perverse case with negative welfare consequences in both countries.
37
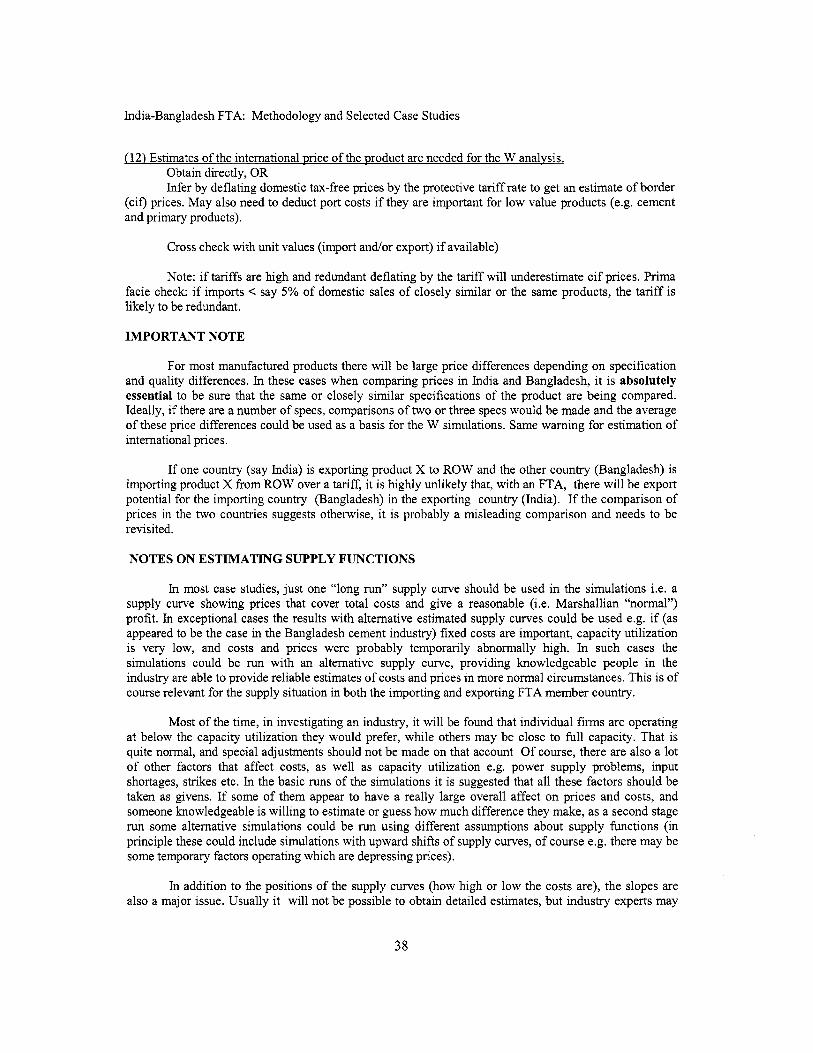
India-Bangladesh FTA: Methodology and Selected Case Studies
(12) Estimates o f the international price o f the product are needed for the W analysis. Obtain directly, OR Infer by deflating domestic tax-free prices by the protective tari f f rate to get an estimate o f border
(cif) prices. May also need to deduct port costs if they are important for l ow value products (e.g. cement and primary products).
Cross check with unit values (import and/or export) if available)
Note: if tariffs are high and redundant deflating by the tariff will underestimate c i f prices. Prima facie check if imports < say 5% o f domestic sales of closely similar or the same products, the tariff i s l ikely to be redundant.
IMPORTANT NOTE
For most manufactured products there will be large price differences depending on specification and quality differences. In these cases when comparing prices in India and Bangladesh, it i s absolutely essential to be sure that the same or closely similar specifications o f the product are being compared. Ideally, if there are a number o f specs, comparisons o f two or three specs would be made and the average o f these price differences could be used as a basis for the W simulations. Same warning for estimation of international prices.
If one country (say India) i s exporting product X to ROW and the other country (Bangladesh) i s importing product X from ROW over a tariff, i t i s highly unlikely that, wi th an FTA, there will be export potential for the importing country (Bangladesh) in the exporting country (India). If the comparison o f prices in the two countries suggests otherwise, it i s probably a misleading comparison and needs to be revisited.
NOTES ON ESTIMATING SUPPLY FUNCTIONS
In most case studies, just one “long run” supply curve should be used in the simulations i.e. a supply curve showing prices that cover total costs and give a reasonable (i.e. Marshallian “normal”) profit. In exceptional cases the results wi th alternative estimated supply curves could be used e.g. i f (as appeared to be the case in the Bangladesh cement industry) fixed costs are important, capacity utilization i s very low, and costs and prices were probably temporarily abnormally high. In such cases the simulations could be run with an alternative supply curve, providing knowledgeable people in the industry are able to provide reliable estimates o f costs and prices in more normal circumstances. T h i s i s o f course relevant for the supply situation in both the importing and exporting FTA member country.
Most o f the time, in investigating an industry, it will be found that individual f i rms are operating at below the capacity utilization they would prefer, while others may be close to full capacity. That i s quite normal, and special adjustments should not be made on that account Of course, there are also a lot o f other factors that affect costs, as well as capacity utilization e.g. power supply problems, input shortages, strikes etc. In the basic runs o f the simulations i t i s suggested that al l these factors should be taken as givens. If some o f them appear to have a really large overall affect on prices and costs, and someone knowledgeable i s willing to estimate or guess how much difference they make, as a second stage run some alternative simulations could be run using different assumptions about supply functions (in principle these could include simulations wi th upward shifts o f supply curves, o f course e.g. there may be some temporary factors operating which are depressing prices).
In addition to the positions o f the supply curves (how high or l ow the costs are), the slopes are also a major issue. Usually it will not be possible to obtain detailed estimates, but industry experts may
38
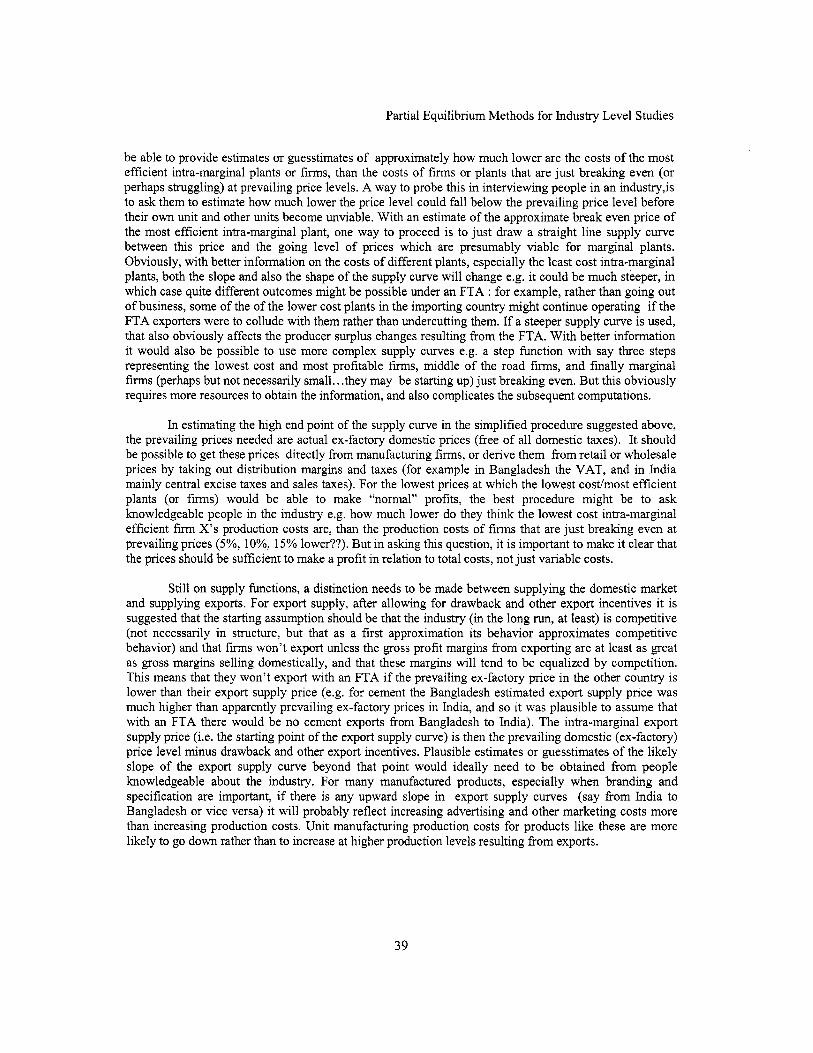
Partial Equilibrium Methods for Industry Level Studies
be able to provide estimates or guesstimates o f approximately how much lower are the costs o f the most efficient intra-marginal plants or firms, than the costs o f f i r m s or plants that are just breaking even (or perhaps struggling) at prevailing price levels. A way to probe this in interviewing people in an industryjs to ask them to estimate how much lower the price level could fall below the prevailing price level before their own unit and other units become unviable. With an estimate o f the approximate break even price o f the most efficient intra-marginal plant, one way to proceed i s to just draw a straight line supply curve between this price and the going level o f prices which are presumably viable for marginal plants. Obviously, wi th better information on the costs o f different plants, especially the least cost intra-marginal plants, both the slope and also the shape o f the supply curve will change e.g. it could be much steeper, in which case quite different outcomes might be possible under an FTA : for example, rather than going out o f business, some o f the o f the lower cost plants in the importing country might continue operating if the FTA exporters were to collude with them rather than undercutting them. If a steeper supply curve i s used, that also obviously affects the producer surplus changes resulting f rom the FTA. With better information i t would also be possible to use more complex supply curves e.g. a step function with say three steps representing the lowest cost and most profitable firms, middle o f the road firms, and finally marginal f i r m s (perhaps but not necessarily small.. .they may be starting up) just breaking even. But this obviously requires more resources to obtain the information, and also complicates the subsequent computations.
In estimating the high end point o f the supply curve in the simplified procedure suggested above, the prevailing prices needed are actual ex-factory domestic prices (free o f al l domestic taxes). It should be possible to get these prices directly from manufacturing f i rms , or derive them from retail or wholesale prices by taking out distribution margins and taxes (for example in Bangladesh the VAT, and in India mainly central excise taxes and sales taxes). For the lowest prices at which the lowest cost/most efficient plants (or firms) would be able to make “normal” profits, the best procedure might be to ask knowledgeable people in the industry e.g. how much lower do they think the lowest cost intra-marginal efficient firm X’s production costs are, than the production costs o f f i rms that are just breaking even at prevailing prices (5%, lo%, 15% lower??). But in asking this question, it i s important to make it clear that the prices should be sufficient to make a profi t in relation to total costs, not just variable costs.
Still on supply functions, a distinction needs to be made between supplying the domestic market and supplying exports. For export supply, after allowing for drawback and other export incentives it i s suggested that the starting assumption should be that the industry (in the long run, at least) i s competitive (not necessarily in structure, but that as a first approximation i t s behavior approximates competitive behavior) and that f i r m s won’t export unless the gross profit margins from exporting are at least as great as gross margins selling domestically, and that these margins w i l l tend to be equalized by competition. This means that they won’t export with an FTA if the prevailing ex-factory price in the other country i s lower than their export supply price (e.g. for cement the Bangladesh estimated export supply price was much higher than apparently prevailing ex-factory prices in India, and so it was plausible to assume that wi th an FTA there would be no cement exports from Bangladesh to India). T h e intra-marginal export supply price (i.e. the starting point o f the export supply curve) i s then the prevailing domestic (ex-factory) price level minus drawback and other export incentives. Plausible estimates or guesstimates o f the l ikely slope o f the export supply curve beyond that point would ideally need to be obtained from people howledgeable about the industry. For many manufactured products, especially when branding and specification are important, if there i s any upward slope in export supply curves (say from India to Bangladesh or vice versa) it will probably reflect increasing advertising and other marketing costs more than increasing production costs. Unit manufacturing production costs for products l ike these are more likely to go down rather than to increase at higher production levels resulting from exports.
39

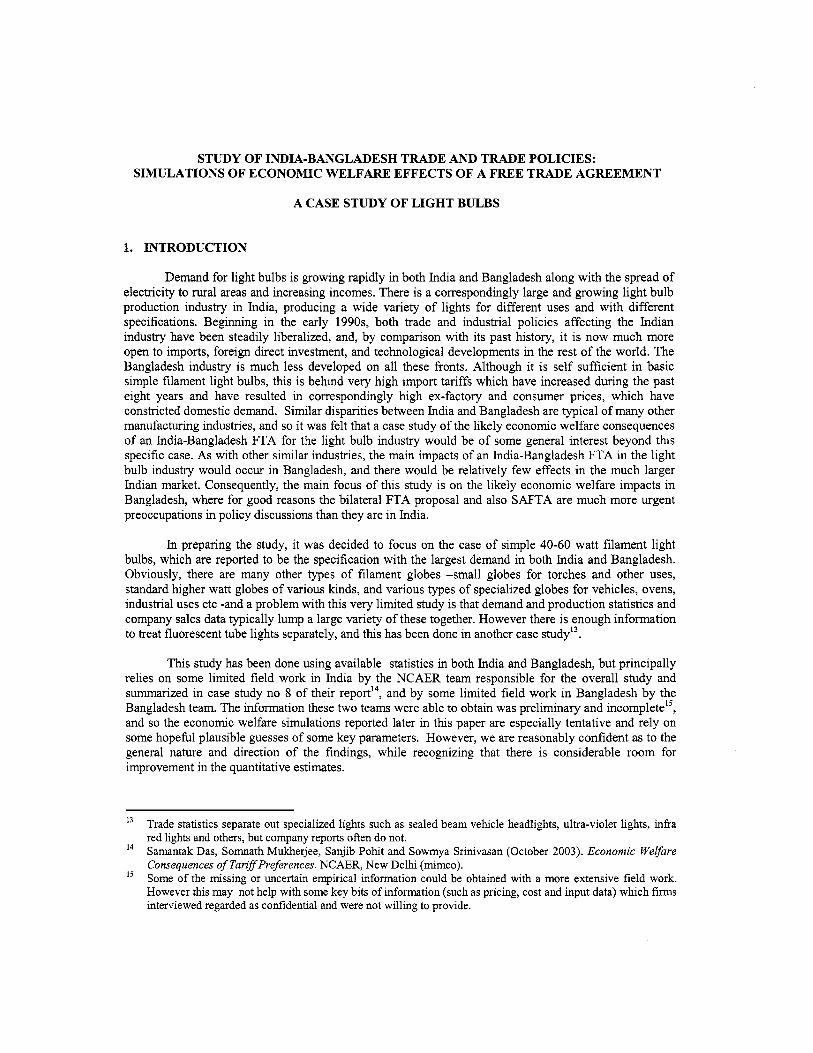
STUDY OF INDIA-BANGLADESH TRADE AND TRADE POLICIES: SIMULATIONS OF ECONOMIC WELFARE EFFECTS OF A FREE TRADE AGREEMENT
A CASE STUDY OF LIGHT BULBS
1. INTRODUCTION
Demand for light bulbs i s growing rapidly in both India and Bangladesh along with the spread o f electricity to rural areas and increasing incomes. There i s a correspondingly large and growing l ight bulb production industry in India, producing a wide variety o f lights for different uses and with different specifications. Beginning in the early 199Os, both trade and industrial policies affecting the Indian industry have been steadily liberalized, and, by comparison with i t s past history, it i s now much more open to imports, foreign direct investment, and technological developments in the rest o f the world. The Bangladesh industry i s much less developed on al l these fronts. Although it i s self sufficient in basic simple filament light bulbs, this i s behind very high import tariffs which have increased during the past eight years and have resulted in correspondingly high ex-factory and consumer prices, which have constricted domestic demand. Similar disparities between India and Bangladesh are typical o f many other manufactunng industries, and so it was felt that a case study o f the likely economic welfare consequences o f an India-Bangladesh FTA for the light bulb industry would be o f some general interest beyond this specific case. As with other similar industries, the main impacts o f an India-Bangladesh FTA in the light bulb industry would occur in Bangladesh, and there would be relatively few effects in the much larger Indian market. Consequently, the main focus o f this study i s on the likely economic welfare impacts in Bangladesh, where for good reasons the bilateral FTA proposal and also SAFTA are much more urgent preoccupations in policy discussions than they are in India.
In preparing the study, it was decided to focus on the case o f simple 40-60 watt filament light bulbs, which are reported to be the specification wi th the largest demand in both India and Bangladesh. Obviously, there are many other types o f filament globes -small globes for torches and other uses, standard higher watt globes o f various kinds, and various types o f specialized globes for vehicles, ovens, industrial uses etc -and a problem with this very limited study i s that demand and production statistics and company sales data typically lump a large variety o f these together. However there i s enough information to treat fluorescent tube lights separately, and this has been done in another case studyI3.
This study has been done using available statistics in both India and Bangladesh, but principally relies on some limited field work in India by the NCAER team responsible for the overall study and summarized in case study n o 8 o f their reportI4, and by some limited field work in Bangladesh by the Bangladesh team. The information these two teams were able to obtain was preliminary and incomplete'', and so the economic welfare simulations reported later in this paper are especially tentative and rely on some hopeful plausible guesses o f some key parameters. However, we are reasonably confident as to the general nature and direction o f the findings, while recognizing that there i s considerable room for improvement in the quantitative estimates.
l3
l4
Trade statistics separate out specialized lights such as sealed beam vehicle headlights, ultra-violet lights, infra red lights and others, but company reports often do not. Samantak Das, Somnath Mukherjee, Sanjib Pohit and Sowmya Srinivasan (October 2003). Economic Welfare Consequences of TurzflPreferences. NCAER, N e w De lh i (mimeo). Some o f the missing or uncertain empirical information could be obtained with a more extensive f ie ld work. However t h i s may not help wi th some key bits o f information (such as pricing, cost and input data) wh ich fim interviewed regarded as confidential and were not willing to provide.

India-Bangladesh FTA: Methodology and Selected Case Studies
2. LIGHT BULBS IN BANGLADESH
2.1 Production, consumption and imports
Electricity i s the major source o f lighting in urban areas o f Bangladesh. Most growth centres in rural areas now have electric lighting as well. The high density o f population coupled with high growth rate o f urbanization explain the rapidly growing demand for electric bulbs and fluorescent tube lights. According to BBS (2003), 3 1% o f the households in Bangladesh have access to electricity. While 80% o f urban households have that access, the share i s only 18% for rural households16. However, wi th increased emphasis on roads and telecommunications and also with a rise in per capita income, an accelerated demand for electric light bulbs and fluorescent lamps can be predicted for the near future. The lighting industry currently estimates a growth rate o f roughly 8 percent per annum for the demand o f light bulbs.
Managers in a leading light bulb manufacturing firm were interviewed to elicit information on domestic production, consumption and imports as well as to get some ideas on market structure and size. According to the surveyed firm (company X) and other sources o f information, import o f standard light bulbs (40-60W) i s minimal and practically the whole o f domestic demand i s met from domestic production. In the past, some attempts to import small quantities o f light bulbs from abroad did not succeed in stimulating import demand. Smuggling o f light bulbs from India i s practically absentI7. Knowledgeable sources argue that there are some important factors behind the absence o f or l ow level of imports o f light bulbs. First, light bulbs are extremely fragile items requiring extra care during transportation and distribution. There are not many agents who could cater to this need. Second, l ight bulbs are low-priced products but claim more space in transshipment. Third, light bulbs need an organized marketing and distribution network, not in evidence by many f i rms. In Bangladesh, for example, the interviewed firm had 100 distributors across the country to serve 27000 outlets. On that score alone, company X has a comparative advantage in distribution which explains the fact that it continues to hold 50-60% market share o f light bulbs. Finally, being a low-priced commodity with relatively high transportation costs per unit, and high protective duty, volume import o f light bulbs i s pretty much excluded.
For example, the landed cost (66% protective duty inclusive) o f a 60W light bulb imported from India would be around Tk.9lunit. Adding transport cost from Benapole to Dhaka and 15% margin each, o f importers, wholesalers and retailers, the price would easily be in the range o f Tk. 14-15. Poor infrastructure and transport problems result in market segmentation, at least between rural and urban markets. In consequence, local company X i s able to exercise price discrimination in selling light bulbs at rural and urban markets. For example, a 60 watt bulb may cost Tk. 11-12/unit in a rural market, while the same might be sold at Tk. 20 in an urban supermarket. There i s thus some market segmentation by rural- urban or high and low-income characteristics, allowing for the company to practice price discrimination. Given that the ex-factory price o f the local bulb i s Tk. 8.7 before VAT (equivalent to a border price o f 8.711.66 = 5.2), it i s easy to see why, at Tk. 9lunit, Indian bulbs might not be imported. Add VAT (more evasion on domestic than on imports), transportation and customs clearance costs, and the fact that the local company X has a strong distribution network al l over the country, it becomes clear why imports from India, and even from ROW, are hard to come by. About Tk. 6.45 mi l l ion worth o f imports (5% from India) did come in FY04, but these were o f various types (such as energy savers, etc ) other than the standard 40-60W bulbs.
In consequence, domestic production meets practically al l requirements o f local consumption o f the standard 60W bulb, yet leaving substantial excess capacity in the local production units. To describe
l6 BBS (2003), Monthly Statistical Bulletin. Con f i i ed by recent 2002 World Bank survey and another survey by Data International for Maxwell Stamp.
42

A Case Study o f Light Bulbs
demand supply balance, we need to assume that domestic demand equals domestic supply plus stocks held. In Table 1, we present information on production and consumption o f light bulbs o f al l watts. Valued at an average international border price (cif) o f Tk 5.4/bulb, the 32 mil l ion or so bulbs sold in 2003/04 were worth about $3 million, at an average ex-factory price o f Tk 10.5hulb about $5.7 million, and at average retai l prices about $7.6 million. Reportedly, 60-watt bulbs constitute the l ion share o f the total bulb supply. Therefore, our analysis will focus on this item.
Table 1: Production and consumption o f light bulbs (all watts) in Bangladesh
Year Domestic Proddconsumption(mil1ion units)
199912000 23.6 2000101 25.6 2001102 27.7 2002I03 29.9
2 003 I04 * 32.3
Note: Figures for 199912000 from Statistical Pocket Book Bangladesh, BBS (2000). The rest comes from an extrapolation by assuming a growth rate o f 8% per annum. The manufacturers and the traders have confirmed this growth rate o f light bulbs in recent years. * According to the surveyed firm, the total consumption would be around 46 mil l ion units. However, for the sake o f simplicity, we shall assume a domestic demand and supply of 32 mil l ion units as provided by official sources (BBS).
2.2 Market structure
There are many f i rms that produce light bulbs. According to our survey information, there are some 50 manufacturing plants producing light bulbs in Bangladesh. But only one firm, company X, producing the Phillips and two other brands, claims 50-60% o f the market share (Table 2). Production o f light bulbs i s very capital intensive where a line that produces two bulbs per second would need an investment o f $5 million. Not many f i rms can muster that kind o f resource, but some firms are allegedly producing l ow quality bulbs by investing in poor quality lines.
Table 2: Distribution o f market shares o f light bulbs
Name o f fm Transcom (TEL) 60
Crown 7 HRC 1 Hero 1 Tiger 1 Others 19 Total: 50 100
Market share (%)
Super Star 10
Source: Surveyedfirm and informed retailers.
2.3 Cost structure
Raw materials typically constitute 55% o f the total cost. Labor accounts for 15%, on average for al l f i r m s (but 25% for firm X). Business overheads are around 30% (with interest payments claiming 7% and utility charges 8% o f total costs)
43
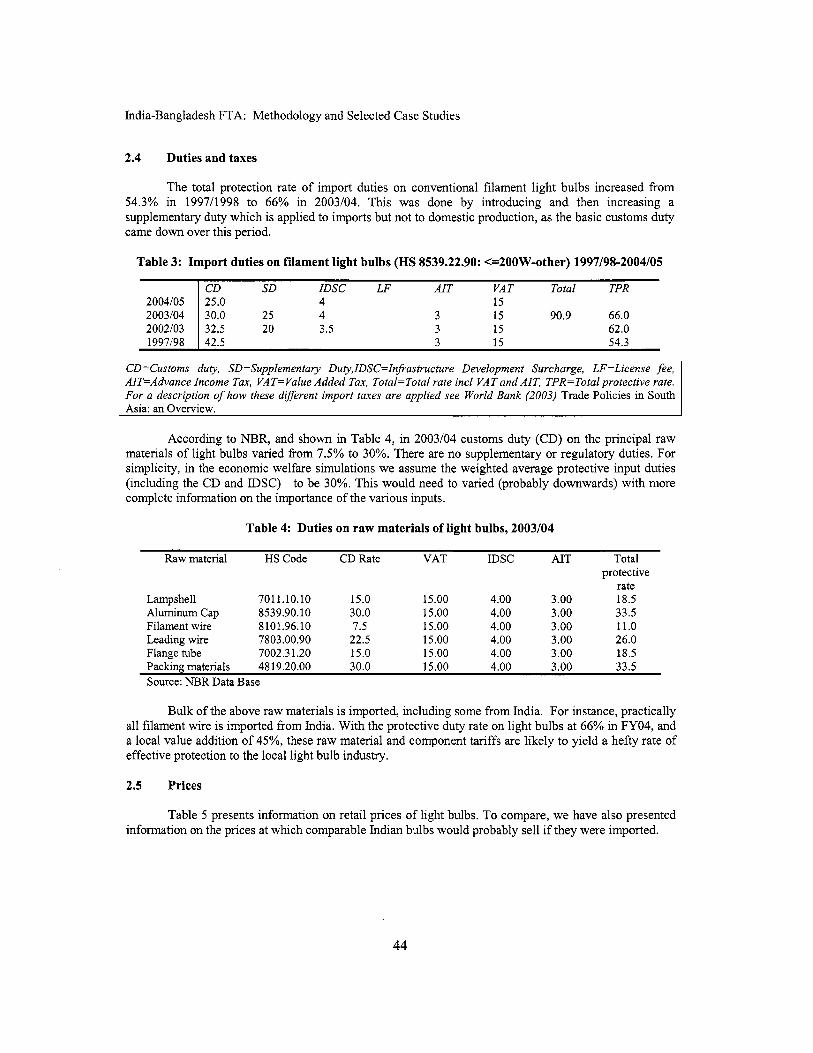
India-Bangladesh FTA: Methodology and Selected Case Studies
2004105 2003104 2002103 1997198
2.4 Duties and taxes
The total protection rate o f import duties on conventional filament ight bulbs increased from 54.3% in 1997/1998 to 66% in 2003104. This was done by introducing and then increasing a supplementary duty which i s applied to imports but not to domestic production, as the basic customs duty came down over this period.
CD SD IDSC LF AIT VAT Total TPR 25.0 4 15 30.0 25 4 3 15 90.9 66.0 32.5 20 3.5 3 15 62.0 42.5 3 15 54.3
Table 4: Duties on raw materials of light bulbs, 2003/04
Raw material H S Code C D Rate VAT IDSC AIT Total protective
rate Lampshell 7011.10.10 15.0 15.00 4.00 3.00 18.5 Aluminum Cap 8539.90.10 30.0 15.00 4.00 3.00 33.5 Filament wire 8101.96.10 7.5 15.00 4.00 3.00 11.0 Leading wire 7803.00.90 22.5 15.00 4.00 3.00 26.0 Flange tube 7002.3 1.20 15.0 15.00 4.00 3.00 18.5
Source: NBR Data Base Packing materials 4819.20.00 30.0 15.00 4.00 3.00 33.5
Bulk o f the above raw materials i s imported, including some from India. For instance, practically all filament wire i s imported from India. With the protective duty rate on light bulbs at 66% in FY04, and a local value addition o f 45%, these raw material and component ta r i f f s are l ikely to yield a hefty rate o f effective protection to the local light bulb industry.
2.5 Prices
Table 5 presents information on retail prices o f light bulbs. To compare, we have also presented information on the prices at which comparable Indian bulbs would probably sell if they were imported.
44

A Case Study o f Light Bulbs
Table 5: Price per unit of a 60-watt light bulb (TWunit)
Origin Ex-factory/ landed Retail price in Bangladesh
Bangladeshi 8.7-9.0 (estimated) 12-20; 16 (avg) Indian 9 (estimated) 15 (estimated)
cost (excl VAT) (incl VAT)
Source: Surveyed firm and informed retailers
Information on prices in Table 5 could give the impression that Indian light bulbs should be trading in the Bangladesh market given the closeness o f the two retai l prices, even after the 66% protective duty. But, as noted earlier, in Bangladesh, the dominant firm pursues a policy o f price discrimination where, for example, for a 60-watt bulb it offers three price levels: a brand (“Transtec”) which retails at about Tk 12 for remote rural consumers and l o w income urban consumers, a brand (“Transtec super”) which retails at Tk. 15-1 7 for middle income buyers in urban and semi-urban areas, and a brand (“Phillips”) which retails for about Tk. 20 in urban supermarkets and other retail outlets in high income areas. The three brands are reported to be essentially the same product with only minor variations in inputs. There are corresponding differences in the ex-factory prices, but these prices were not provided. This unusual price discrimination i s apparently practiced with the cooperation o f the network o f 100 or so wholesale distributors which supply a large network o f about 27,000 outlets. It i s likely that there are quality differences between the dominant firm X’s bulbs and bulbs produced by the small producers and sold in rural versus urban centers. Higher wattage bulbs and energy saver bulbs are also now becoming popular and are sold at higher prices. As for the standard 40-60W bulb, the basic message i s that without the 66% protective duty, local bulbs could face stiff competition from Indian suppliers in an FTA situation.
Assuming an FTA situation, for example, Indian 60W light bulbs could land at the border at Tk.5.4 (export supply price ), and, with transport cost up to Dhaka @5%, would yield a notional ex- factory price at Dhaka o f Tk.5.7. This would then easily beat the ex-factory price o f the principal Bangladeshi manufacturer in the low income segment o f the market (probably about Tk 8.7-9.0).
2.6 Elasticity of demand
The NCAER study reports industry views that the demand elasticity o f light bulbs i s between about -1.3 to -2, which i s a plausible assumption for Bangladesh demand as well. The economic welfare simulations below have first been done conservatively assuming considerably lower demand elasticities than this, and then with higher elasticities at about this level.
2.7 Capacity utilization
Bangladesh has the capacity to produce 90 mil l ion light bulbs annually. But at the moment the country i s producing 30-40 mil l ion units implying a capacity utilization o f roughly 40%, on,average. T h e firm we surveyed i s the largest producer controlling 50-60% o f sales. It has the capacity to produce 36 mi l l ion using double shift and 50 mil l ion using triple shift. In 2004/05 the surveyed firm was producing at an annual rate o f 25 million- implying 50% capacity for 3 shifts and 70% for double shifts. In the 2003/04 base scenario for the economic welfare simulations i t s production i s taken to be 19 million.
2.8 Export potentials?
The surveyed firm, company X, would l ike to argue that Bangladeshi light bulbs could compete in India in the event o f an FTA. In fact, the same firm says that i t has been negotiating deals to export light bulbs to China. I t s argument i s that Bangladesh could have a distinct edge over Indian counterparts
45

India-Bangladesh FTA: Methodology and Selected Case Studies
in the NE Indian markets since transport cost o f bulb from other parts o f India to NE India i s very high. Taking advantage o f the geographic proximity, Bangladesh could capture a sizeable part o f the Indian market. Second, Phillips India could subcontract production to local Phillips in Bangladesh to cater to the needs o f a wider market following an FTA. And finally, according to the surveyed firm, if the duties on raw materials and interest rate on worlang capital were lower, there would be immense potentials o f Bangladesh to emerge as a competitive supplier o f light bulbs in the region. N o mention, however, was made o f the high protective duties on light bulb imports.
To check out the validity o f the above argument, we need only modify OUT earlier estimate o f the ex-factory price o f Indian bulbs in DelhdKolkata by adding transportation costs which admittedly i s substantial if trucks have to move over the chicken’s neck to NE India. Transportation cost would easily double to, say, 10% instead o f the 5% we have assumed for transportation to Dhaka. Even then, landed cost o f Indian bulbs in NE1 would amount to Tk. 6.6/unit, compared to the landed cost o f a Bangladeshi bulb at ex-factory price, after duty drawback, plus 2% transportation charges o f about Tk. 8.0 to 8.3 per unit (low income segment ex-factory price (Tk 8.7 to 9.0) minus duty drawback (Tk 0.9) plus 2% transport cost). Unless the local distribution network can leverage other formal/informal contacts, it seems unlikely that export potential will be high, unless, o f course, greater capacity utilization (Bangladesh manufacturers have 60% excess capacity) leads to substantial reductions in per unit ex-factory cost. On the other hand, if Phillips India were to contract firm X to cater to the NE1 market, that could result provide a distribution network for this particular supplier to export to the NE1 market segment in India. Note however that Bangladesh light globes would appear to satisfy current SAPTA rules o f origin requirements for Bangladesh, which are that national value added defined as the fob price minus the cost o f imported inputs at c i f prices should exceed 35% o f the fob price. It i s unlikely that rules o f origin for Bangladesh that would be agreed under a bilateral FTA or under SAFTA would be more demanding than this. The per bulb cost o f imported inputs at c i f prices at present appears to be about Taka 2.9, so if a Bangladesh producer could successfully export to the north and eastern Indian states for say Taka 6.4 fob, i t s value added ratio would be about 55%, well in excess o f the likely minimum rule o f origin requirement.
3. LIGHT BULBS IN INDIA
3.1 Production
In i t s case study NCAER was not able to separate obtain separate production data for electric bulbs and fluorescent tube lights. According to C M I E data, in 2001/02 Indian production o f both was about 690 mil l ion units sold for about 13.9 bi l l ion Rupees. At the average past rate o f growth o f sales estimated by CMIE (10.4%) the industry’s sales in 2003104 o f globes and lights o f al l lands would have been about $367 mil l ion in 2003/04. However the volume and value o f the production o f simple 40-60 watt electric bulbs in these totals are unknown. Al lowing for India’s much larger population, greater access to electricity, higher per capita income and the fact that retail light globe prices are far lower than in Bangladesh, it i s quite possible that Indian demand and production could be 15 to 20 times larger than in Bangladesh. In that case annual demand could be o f the order o f $45 to $60 mi l l ion when valued at border prices, and say $55 to $75 mi l l ion at ex-factory prices.
3.2 Trade
The Indian trade statistics lump imports and exports o f the 40-60 watt light bulbs together with a large variety o f other types o f filament lamps and bulbs. Both imports and exports o f these broader categories were very small during most o f the 1990s-only just over $US one mil l ion during 1997-99- but
46
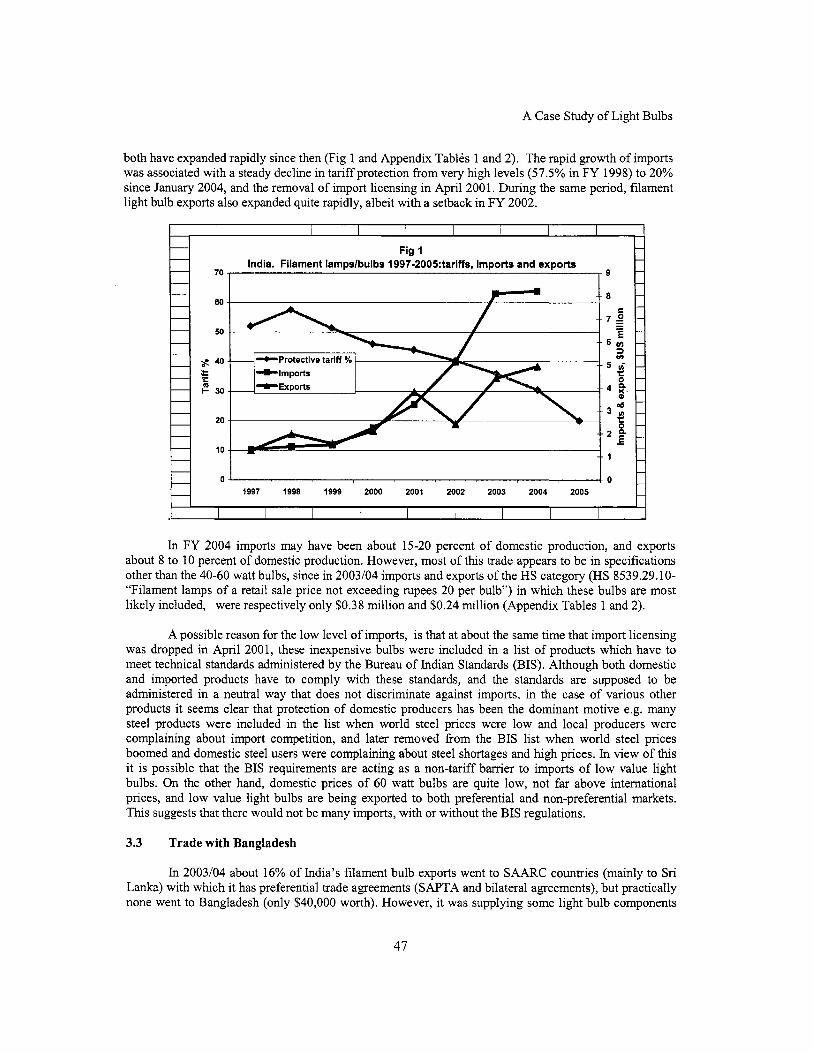
A Case Study o f Light Bulbs
both have expanded rapidly since then (Fig 1 and Appendix Tables 1 and 2). The rapid growth o f imports was associated with a steady decline in tariff protection from very high levels (57.5% in FY 1998) to 20% since January 2004, and the removal o f import licensing in April 200 1. During the same period, filament light bulb exports also expanded quite rapidly, albeit wi th a setback in FY 2002.
Fig 1 India. Filament lampslbulbs 1997-2005:tariffq imports and exports
7 0 , , 9
a
0
In FY 2004 imports may have been about 15-20 percent o f domestic production, and exports about 8 to 10 percent o f domestic production. However, most o f this trade appears to be in specifications other than the 40-60 watt bulbs, since in 2003/04 imports and exports of the H S category (HS 8539.29.10- “Filament lamps o f a retail sale price not exceeding rupees 20 per bulb”) in which these bulbs are most likely included, were respectively only $0.38 mi l l ion and $0.24 mil l ion (Appendix Tables 1 and 2).
A possible reason for the low level o f imports, i s that at about the same time that import licensing was dropped in April 2001, these inexpensive bulbs were included in a l i s t o f products which have to meet technical standards administered by the Bureau o f Indian Standards (BIS). Although both domestic and imported products have to comply with these standards, and the standards are supposed to be administered in a neutral way that does not discriminate against imports, in the case o f various other products it seems clear that protection o f domestic producers has been the dominant motive e.g. many steel products were included in the list when world steel prices were l o w and local producers were complaining about import competition, and later removed from the BIS l i s t when world steel prices boomed and domestic steel users were complaining about steel shortages and high prices. In view o f this it i s possible that the BIS requirements are acting as a non-tariff barrier to imports o f l ow value light bulbs. On the other hand, domestic prices o f 60 watt bulbs are quite low, not far above international prices, and low value light bulbs are being exported to both preferential and non-preferential markets. This suggests that there would not be many imports, with or without the BIS regulations.
3.3 Trade with Bangladesh
In 2003104 about 16% o f India’s filament bulb exports went to SAARC countries (mainly to Sri Lanka) with which it has preferential trade agreements (SAPTA and bilateral agreements), but practically none went to Bangladesh (only $40,000 worth). However, it was supplying some light bulb components
47
India-Bangladesh FTA: Methodology and Selected Case Studies
to Bangladesh, principally tungsten filament wire, and glass tubing and packaging materials, some types o f which could have been used in light bulb manufacture. There were no recorded Indian imports o f l ight bulbs or light bulb components from Bangladesh.
3.4 Market structure and conduct
According to the NCAER study, a typical bulb manufacturer in India earns a return o f 15% on sales and the market i s perceived by traders and producers to consist o f a large number o f competitors. Exporters said they face “medium” levels o f competition in export markets.
3.5 Import policies and tariffs
As noted above, since April 2001-together with other consumer goods- imports o f light bulbs have been free o f import licensing, but globes retailing for less than Rs 20 each are subject to B IS controls on technical standards. In January 2004 the protective tari f f was reduced from 30.4% (the combined effect o f a 30% Customs duty and the Special Additional Duty) to 20%. T h e steady decline in tariffs in India since 1998 contrasts wi th light bulb tariffs in Bangladesh, where tariffs have increased very substantially during the same period.
Under SAPTA, India provides a 50% tariff preference for Bangladesh. This means that since January 2004 the Indian tariff on imports o f light bulbs from Bangladesh has been just 10%. Bangladesh does not provide any tariff preferences to India for either finished light bulbs or light bulb components.
Indian imports o f raw materials and light bulb components have been free o f non-tariff controls since 1991. Tariffs on light bulb material inputs in the past were always lower than tar i f fs on the finished products, but since the January 2004 reforms, tariffs on most light bulb inputs have also been 20%. During 2003/04 imports o f four intermediate products which probably include light bulb inputs were $9.4 million. However, not al l o f these were necessarily used in lamp and light bulb production (e.g. H S 70023 100“Tubes o f fused quartz”) They could have been used for non-lighting products and many varieties o f lighting products (including fluorescent lights) and in case only represent a very small fraction o f the lighting industry’s total sales -probably only a few percent. This suggests that Indian l ight bulb production i s quite integrated and probably easily meets SAPTA rules o f origin and rules o f origin that would be agreed under a bilateral FTA with Bangladesh or under SAFTA.
4. ECONOMIC WELFARE ANALYSIS
4.1 Introduction and base scenario
The information obtained on production, trade, prices and costs in the light bulb industry in India and Bangladesh makes it clear that under an FTA there would be substantial exports from India to Bangladesh, that major adjustments would be likely to occur in the Bangladesh market, but that the effects and welfare consequences would probably be quite minor in India. Therefore this section focuses on the likely changes and welfare effects in Bangladesh, using the apparent situation during 2003104 as a basis. However, this task is especially problematic owing to very limited data and major gaps and deficiencies in the information obtained on the Bangladesh market and industry. In particular:
The market i s dominated by one major firm (Firm X) which has a 60% market share and considerable market power, reportedly based on control o f or influence over wholesale distribution. The remaining 40% o f the market i s reportedly supplied by a fringe o f very small and apparently high cost/low quality producers. However, there i s no further information on the basis for X’s market power, and in
48

A Case Study o f Light Bulbs
particular why there are no competing imports, even though domestic light bulbs seemed to be fully priced at, and in some segments far above, c i f prices plus the 66% protective tariff. The dominant firm i s reported to sel l essentially the same 60 watt light bulb in three different market segments at different prices, and i s apparently able to prevent arbitrage between these markets and competition from imports by a the use o f separate brand names and its influence over the distributors. In the following analysis (see Fig 2) it i s assumed that the ex-factory prices (before VAT) o f the light bulb in these markets are (1) Taka 15hulb in the high income segment (2) Taka 12hulb in the medium income segment (3) Taka 9hu lb in the low income segment. I t i s assumed that the small fnnge producers were also selling at Taka 9hu lb ex-factory (or the equivalent after adjusting for quality differences) in the l ow income segment. These ex-factory prices were not supplied by the industry and are rough estimates only derived from apparent retail prices after deducting VAT and guessed retai l and wholesale margins. There i s n o information on the quantities sold in the three segmented markets. In the analysis below it i s arbitrarily assumed that sales are divided as indicated in Table 6. Arbitrary assumptions are also made as to the demand elasticities in the three markets and the consequent increases in demand at lower prices. The average (arc) elasticities o f the three demand curves over the price range from 9 Taka/bulb to 5.4 Taka/bulb are shown in the last column o f Table 6. A rather l o w elasticity has been assumed in the high income segment, somewhat higher in the middle income segment, and higher again in the l ow income segment.
Table 6: Assumed demand parameters: ex-factory price Takabulb: Qty million bulbs
Base scenario Market power eliminated FTA with India : first Average demand
Incomesegment Price Qty Price Qty Qty Price Qty Qty Low 1 Highi simulation elasticity (4)
low fi high low fi high fi High 15 4 9 5.5 7 5.4 6.4 9.8 -0.25 -0.80 Middle 12 8 9 11 14 5.4 14.6 21.2 -0.45 -1.64 Low 9 20 9 20 30 5.4 40 60 -1.08 -1.60
Aggregate 32 36.5 51 61 91 demand Supplied by Dominant fm 19 23.5 38 0 0 Peripheral firms 13 13 13 0 0 Impbrts 0 0 0 61 91
Notes: The demand elasticities (6) are the averages of the linear demand curves shown in F ig I over the price range j?om Taka 9hulb to Taka 5.4hulb. For simplicity it is assumed that there would be no imports if the dominant firm's market power were eliminated but the tariflwere maintained at 66% i.e. f the price were to remain at Taka 9hulb.
There i s just a little information on the production costs o f the dominant producer and n o information on its financial results. There i s also no information on the production costs and supply conditions o f the fringe o f small and very small producers. Starting wi th the information from firm X, a first run at the economic welfare simulations uses the parameters given in Table 7 and illustrated in Fig 1.
Using this partial information and many guesses, in the base 2003104 scenario the 66% protective tari f f plus X's apparent market power over distribution kept out al l competing imports. Of the total market demand o f about 32 mil l ion globes, X supplied 19 mil l ion and the small fringe producers 13 million. 20 mi l l ion globes were sold at ex-factory prices approximately equal to .the c i f import prices o f equivalent imported globes, plus the tariff plus port costs. Of these 20 mil l ion globes, 7 mi l l ion were sold by X and 13 mi l l ion by the h n g e producers. Of the remaining 12 mi l l ion globes, 4 mi l l ion and 8 mi l l ion were sold using separate brand names by X at Taka 15 and Taka 12 per bulb respectively. As indicated
49
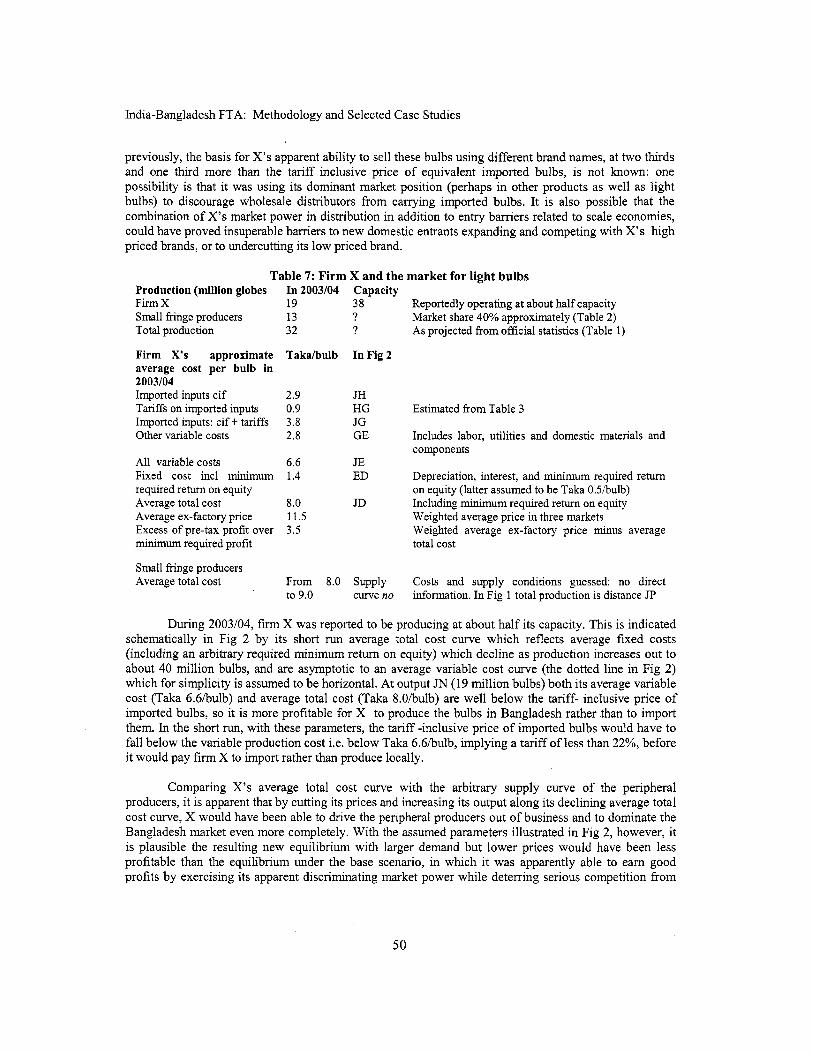
India-Bangladesh FTA: Methodology and Selected Case Studies
previously, the basis for X’s apparent ability to sel l these bulbs using different brand names, at two thirds and one third more than the tariff inclusive price o f equivalent imported bulbs, i s not known: one possibility i s that it was using its dominant market position (perhaps in other products as well as light bulbs) to discourage wholesale distributors from carrying imported bulbs. I t i s also possible that the combination o f X’s market power in distribution in addition to entry barriers related to scale economies, could have proved insuperable bamers to new domestic entrants expanding and competing wi th X’s high priced brands, or to undercutting i t s l ow priced brand.
Table 7: Firm X and the market for light bulbs Product ion (mi l l ion globes In 2003/04 Capacity FirmX 19 38 Small fiinge producers 13 ? Total production 32 ?
Firm X’s approximate T a k a h u l b In Fig 2 average cost pe r bulb in 2003/04
Tariffs on imported inputs 0.9 HG Imported inputs: c i f + tariffs 3.8 JG Other variable costs 2.8 GE
Imported inputs c i f 2.9 JH
All variable costs 6.6 JE Fixed cost incl minimum 1.4 ED required return on equity
Average ex-factory price 11.5 Excess o f pre-tax profit over minimum required profit
Small fiinge producers Average total cost From 8.0 Supply
Average total cost 8.0 JD
3.5
to 9.0 curve no
Reportedly operating at about ha l f capacity Market share 40% approximately (Table 2) As projected f rom official statistics (Table 1)
Estimated f rom Table 3
Includes labor, utilities and domestic materials and components
Depreciation, interest, and minimum required return on equity (latter assumed to be Taka 0.5ibulb) Including minimum required return on equity Weighted average price in three markets Weighted average ex-factory price minus average total cost
Costs and supply conditions guessed: no direct information. In F i g 1 total production i s distance JP
During 2003104, firm X was reported to be producing at about ha l f its capacity. T h i s i s indicated schematically in F ig 2 by its short m average total cost curve which reflects average fixed costs (including an arbitrary required minimum return on equity) which decline as production increases out to about 40 mi l l ion bulbs, and are asymptotic to an average variable cost curve (the dotted l ine in F i g 2) which for simplicity i s assumed to be horizontal. At output JN (19 mi l l ion bulbs) both i t s average variable cost (Taka 6.6hulb) and average total cost (Taka 8.0hulb) are wel l below the tariff- inclusive price o f imported bulbs, so it i s more profitable for X to produce the bulbs in Bangladesh rather than to import them. In the short run, with these parameters, the tari f f -inclusive price o f imported bulbs would have to fall below the variable production cost i.e. below Taka 6.6hulb, implying a tari f f of less than 22%, before it would pay firm X to import rather than produce locally.
Comparing X’s average total cost curve with the arbitrary supply curve o f the peripheral producers, it i s apparent that by cutting i t s prices and increasing i t s output along its declining average total cost curve, X would have been able to drive the peripheral producers out of business and to dominate the Bangladesh market even more completely. With the assumed parameters illustrated in F ig 2, however, it i s plausible the resulting new equilibrium with larger demand but lower prices would have been less profitable than the equilibrium under the base scenario, in which it was apparently able to earn good profits by exercising its apparent discriminating market power while deterring serious competition from
50

A Case Study o f Light Bulbs
the fringe producers and supporting the low income segment price at approximately the duty inclusive import price.
Fig 2 Llght bulbs: Analysis of economic welfare effects of an FTA In Bangladesh
Demand CUNB: high i n m e segment
mand CUN~: middle income segment
Supply WNE: peripheral producers
4 8 12 19 20 31.1 32 40 61
Annual demand and supply; million llght bulbs F
Because there were no competing imports o f 40-60 watt bulbs in the base scenario, there i s n o government revenue from protective import duties on finished products. However, tari f f revenue was collected from the imported inputs. Assuming an average protective input tari f f o f 30%, equivalent to Take 0.9/bulb, this revenue was Taka 28.8 mil l ion =$US 0.49 mi l l ion (area GHqp in F i g 2). T h i s assumes that the per bulb c i f cost o f imported inputs used by the fringe producers and the average tari f f rate on them (giving revenue equivalent to area ghqp) were the same as the averages estimated for X.
4.2 Free trade with India: first simulation
For the light bulb industry, in Bangladesh an India-Bangladesh FTA would mean that the bulbs could be imported duty-free from India but that (starting f rom the 2003/04 base scenario) light bulbs imported from the rest o f the world (ROW) would still be subject to a 66% protective tariff. Likewise, light bulb inputs could be imported duty free from India but would remain subject to the general MFN tariffs, averaging about 30%, if imported from ROW. Other prices-including the prices o f machinery and equipment-would also be affected, but this section focuses on the l ikely principal direct effects, which would be on the prices o f the finished products and the raw materials and components used in production.
I t i s apparent that the economic welfare outcome for Bangladesh will depend principally on (a) the competitiveness o f the Indian light bulb exporters and the prices they would charge for sales to Bangladesh, and (b) the competitiveness and prices o f Indian supplies o f l ight bulb inputs. In both cases, the FTA in effect extends Bangladesh’s tariff protection to Indian producers, and so their export prices to
51
India-Bangladesh FTA: Methodology and Selected Case Studies
Bangladesh could in principle exceed world prices to this extent without attracting competition from ROW. However, how Indian exporters would actually price would depend on their production costs, the value to them o f Indian DEPB, duty drawback etc, the opportunity cost o f supplying Bangladesh rather than the domestic market or other export markets, and the intensity o f the competition both among themselves and between them and Bangladesh producers. For this case study the information on the Indian light bulb industry i s sparse, but what i s available indicates (a) a highly competitive industry with a large number o f producers and domestic prices nation-wide not far above international prices (b) only minor imports o f the principal light-bulb raw materials and components, indicating that nearly al l are supplied domestically, either in integrated production facilities or by independent specialized suppliers (c) the presence in the domestic market o f a number o f the major multinational f i rms in the lighting business (including Phillips, the owner o f the principal brand supplied in Bangladesh), suggesting that the industry has the capability or at least the potential to keep up with international technical standards.
Based on this characterization o f the Indian industry, one o f a number o f possible outcomes i s that the Indian industry would supply both finished light bulbs and intermediate inputs o f competitive international qualities at about going international prices. In that case, with the largely guessed Bangladesh base scenario parameters (supply curve no), the small peripheral Bangladesh producers would be drastically undercut and would cease production. H o w about the dominant Bangladesh producer? Much would depend on whether it would be able to maintain i t s apparent discriminatory market power and restrict the access o f the Indian exporters to the Bangladesh market and continue i t s discriminatory pricing practices. In that case it i s possible that i t would remain profitable, with lower profits or losses i t s low-income segment sales offset by lower input prices and the maintenance o f higher prices and profits on i t s middle income and high income sales. However, experience in many other countries suggests that high tari f f protection i s ofien the major source o f this kmd o f market power, because (a) high prices restrict the size o f the market and increase entry barriers when there are economies o f scale (b) make it difficult and expensive for importers to import in sufficient volume to break into to established marketing networks. If so, a plausible outcome o f the FTA i s that the dominant f i rm ’s market power would be destroyed and it would be forced to compete wi th imports at world prices in al l three market segments. If that were the case, with the base scenario parameters, the dominant firm would also cease production, since even if were able to obtain all i t s inputs from Indian suppliers at world prices, i t s per bulb variable costs (distance JE minus HG=Taka 6.6-0.9=Taka 5.7) would slightly exceed the c i f import price (distance JF=Taka 5Ahulb). In a more l ikely scenario in which it would s t i l l import some inputs from ROW and pay tariffs on them, i t s average variable costs would exceed the price o f light bulbs imported from India by a larger margin. If this happened and the entire Bangladesh market were supplied by imports, two possible welfare outcomes in Bangladesh are summarized in Table 8, the f i rs t using the demand elasticities assumed in Table 6 and F ig 2, and the second arbitrarily doubling the demand expansion that would occur in each o f the market segments wi th imports from India at world prices.
Not surprisingly, the very large price reductions in this simulation produce substantial consumer surplus benefits, with total annual demand almost doubling from 32 mi l l ion globes to 61 mi l l ion globes using the lower demand elasticities, and almost trebling to 90 mil l ion globes using the higher demand elasticities. Even though these basic light globes are a l ow value item in consumer budgets, the resulting consumer surplus benefits are substantial, respectively $3.94 mil l ion and $5.06 mi l l ion annually, and with the assumed parameters, most o f the benefit occurs in the l ow income market segment.
52
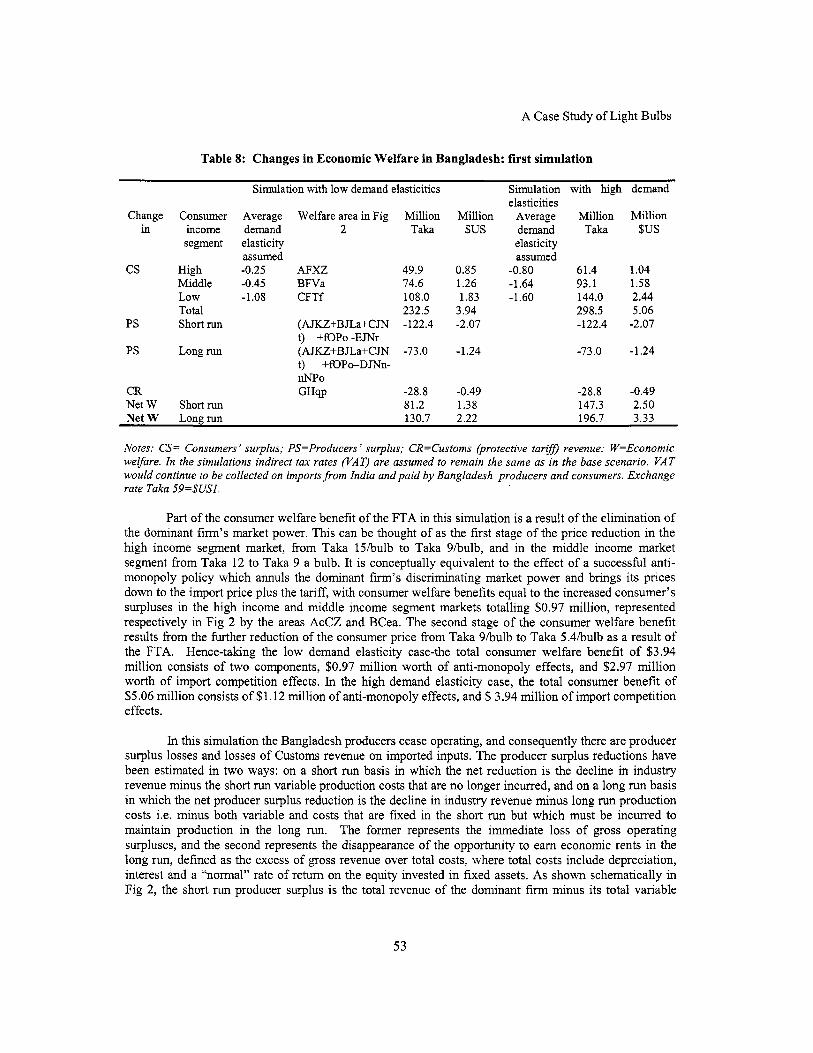
A Case Study o f Light Bulbs
Table 8: Changes in Economic Welfare in Bangladesh: first simulation
Simulation with l o w demand elasticities Simulation with high demand
Change Consumer Average Welfare area in Fig Mi l l i on M i l l i o n Average Mi l l ion M i l l i o n in income demand 2 Taka $US demand Taka $US
segment elasticity elasticity assumed assumed
elasticities
cs H igh -0.25 AFXZ 49.9 0.85 -0.80 61.4 1.04 Middle -0.45 BFVa 74.6 1.26 -1.64 93.1 1.58 Low -1.08 CFTf 108.0 1.83 -1.60 144.0 2.44 Total 232.5 3.94 298.5 5.06
PS Short run (AJKZ+BJLa+CJN -122.4 -2.07 -122.4 -2.07 t) +fOPo-EJNr
t) +fOPc-DJNn- nNP0
PS Long run (AJKZ+BJLa+CJN -73.0 -1.24 -73.0 -1.24
CR GHW -28.8 -0.49 -28.8 -0.49 Net W Short run 81.2 1.38 147.3 2.50 Net W Long run 130.7 2.22 196.7 3.33
Notes: CS= Consumers’ surplus: PS=Producers ’ surplus; CR=Customs (protective tariff) revenue; W=Economic welfare. I n the simulations indirect tax rates (VAT) are assumed to remain the same as in the base scenario. VAT would continue to be collected on imports from India and paid by Bangladesh producers and consumers. Exchange rate Taka 59=$USl.
Part o f the consumer welfare benefit o f the FTA in this simulation i s a result o f the elimination o f the dominant f i rm’s market power. T h i s can be thought o f as the first stage o f the price reduction in the high income segment market, from Taka 15hulb to Taka 9hulb, and in the middle income market segment from Taka 12 to Taka 9 a bulb. I t i s conceptually equivalent to the effect o f a successful anti- monopoly policy which annuls the dominant f i rm’s discriminating market power and brings its prices down to the import price plus the tariff, with consumer welfare benefits equal to the increased consumer’s surpluses in the high income and middle income segment markets totalling $0.97 million, represented respectively in F i g 2 by the areas AcCZ and BCea. The second stage o f the consumer welfare benefit results from the Mher reduction o f the consumer price from Taka 9hu lb to Taka 5.4hulb as a result o f the FTA. Hence-tahng the l ow demand elasticity case-the total consumer welfare benefit o f $3.94 mil l ion consists o f two components, $0.97 mil l ion worth o f anti-monopoly effects, and $2.97 mi l l ion worth o f import competition effects. In the high demand elasticity case, the total consumer benefit o f $5.06 mi l l ion consists o f $1.12 mi l l ion o f anti-monopoly effects, and $3.94 mi l l ion o f import competition effects.
In this simulation the Bangladesh producers cease operating, and consequently there are producer surplus losses and losses o f Customs revenue on imported inputs. The producer surplus reductions have been estimated in two ways: on a short run basis in which the net reduction i s the decline in industry revenue minus the short run variable production costs that are no longer incurred, and on a long run basis in which the net producer surplus reduction i s the decline in industry revenue minus long run production costs i.e. minus both variable and costs that are fixed in the short run but which must be incurred to maintain production in the long run. The former represents the immediate loss o f gross operating surpluses, and the second represents the disappearance o f the opportunity to earn economic rents in the long run, defined as the excess o f gross revenue over total costs, where total costs include depreciation, interest and a “normal” rate o f return on the equity invested in fixed assets. As shown schematically in F ig 2, the short run producer surplus i s the total revenue o f the dominant firm minus its total variable
53

India-Bangladesh FTA: Methodology and Selected Case Studies
costs. In the absence cost information on the smaller peripheral firms, their variable costs have provisionally been assumed to be the same as for the dominant firm, so their short run producer surplus i s simply their total revenue at a selling price o f Taka 9, minus their total variable costs i.e. area trvo in Fig 2. In the long run case, the producer surplus o f the dominant firm i s i t s gross revenue in the three segmented markets, minus its total production cost (area DJNn in F ig 2). The long run producers' surplus o f the small peripheral f i rms i s the area between the guessed long run supply curve no and the price in the low income market segment that they are assumed to supply i.e. area tno in F i g 2. Finally, there i s a government revenue loss equal to the protective tari f f revenue that was previously collected on the inputs used to produce the light bulbs i.e. equivalent to area ghqp. As indicated in Table 8, if the money values o f these losses are weighted equally with the money value o f the consumer surplus benefits, there are substantial net benefits for Bangladesh from the FTA. The net benefit i s somewhat larger in the long run case, and i s o f course larger wi th higher demand elasticities which produce bigger consumer benefits from the very substantial price cuts resulting from the FTA.
4.3 Free trade with India: second simulation
The scenario just discussed assumes that, following an FTA, even though they would be protected in the Bangladesh market by the 66% tanff, the Indian light bulb producers would export to Bangladesh at the going world price at the Bangladesh border. In view o f the competition and low prices in the Indian domestic market and the fact that there are Indian exports to ROW markets, this seems the most likely outcome. However, the possibility cannot be excluded that the preferential Indian exports could be sold to Bangladesh at prices in excess o f prevailing world prices, for example if world prices were to decline, if costs and prices in India were to go up, or as a result o f some kind o f collusive arrangement between Indian producers, perhaps together with one or more o f the Bangladesh producers. Without more information it i s impossible to even attach probabilities to the many possible outcomes o f this lund, but to illustrate the general nature o f the consequent economic welfare effects in Bangladesh, this section discusses one highly simplified simulation. In this scenario, the Indian exporters supply the Bangladesh market at a price just marginally below the dominant Bangladesh producer's average total cost (distance JD in F ig l=Taka 8.0hulb) but agree not to compete wi th it in i t s high income and middle income segment markets. In return firm X agrees to keep i t s sales in the low income segment at the pre-FTA level. As a result, the small peripheral Bangladesh producers go out o f business and their sales in the l ow income segment, plus the increased demand resulting from the price reduction from 9.0 Taka/bulb to 8.0 T a M u l b , are replaced by imports from India.
Starting from the base 2003104 scenario, the economic welfare consequences o f these arrangements in Bangladesh are shown in Table 9. There i s no benefit for high and middle income buyers, but some benefit for l ow income segment buyers, measured'by a consumer surplus gain o f $0.39 mi l l ion in the l ow demand elasticity case, and $0.43 mi l l ion in the higher demand elasticity case. However, these consumer gains are more than offset by the combination o f the reduction in the profitability o f the dominant Bangladesh firm, the producer surplus losses o f the small Bangladesh f i rms which leave the business, and the reduction in Customs revenue on imported inputs previously imported by the small f i rms.
On the other hand there are substantial benefits for the Indian exporters. If their costs are the same as in the first simulation i.e. Taka 5.4hulb (distance JF) but, in agreement with the dominant Bangladesh producers, they sell at the agreed price o f Taka 8.0hulb (distance JD), there i s a producer surplus benefit to them o f $0.82 mi l l ion in the low demand elasticity case, and $1.06 mi l l ion in the high demand elasticity case.18 Overall, if the money value o f al l components o f these welfare changes are weighted
l8 Assuming the Indian exporters replace the bulbs previously supplied by the small Bangladesh producers plus all o f the increment in demand resulting from the price cut in the low income segment, the producer surplus benefits to them are:
54
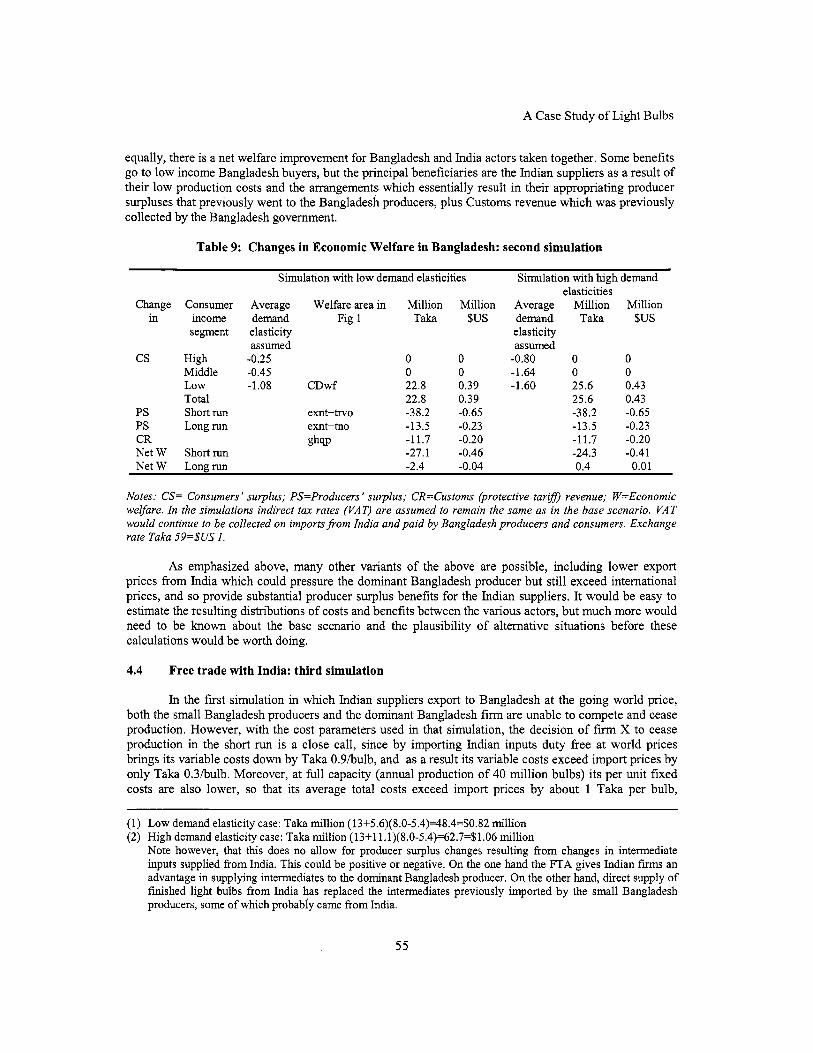
A Case Study o f L ight Bulbs
equally, there i s a net welfare improvement for Bangladesh and India actors taken together. Some benefits go to l ow income Bangladesh buyers, but the principal beneficiaries are the Indian suppliers as a result of their low production costs and the arrangements which essentially result in their appropriating producer surpluses that previously went to the Bangladesh producers, plus Customs revenue which was previously collected by the Bangladesh government.
Table 9: Changes in Economic Welfare in Bangladesh: second simulation
Simulation with low demand elasticities Simulation with high demand elasticities
Change Consumer Average Welfare area in Million Million Average Million Million in income demand Fig 1 Taka $US demand Taka $US
segment elasticity elasticity assumed assumed
CS High -0.25 0 0 -0.80 0 0 Middle -0.45 0 0 -1.64 0 0 Low -1.08 CDwf 22.8 0.39 -1.60 25.6 0.43 Total 22.8 0.39 25.6 0.43
PS Short run exnt+trvo -38.2 -0.65 -38.2 -0.65 PS Long run exnt+tno -13.5 -0.23 -13.5 -0.23
-11.7 -0.20 -11.7 -0.20 Net W Short run -27.1 -0.46 -24.3 -0.41 CR ghsp
Net W Long run -2.4 -0.04 0.4 0.01
Notes: CS= Consumers' surplus; PS=Producers ' surplus; CR=Customs (protective tariff) revenue; W=Economic weyare. I n the simulations indirect tax rates (VAT) are assumed to remain the same as in the base scenario. VAT would continue to be collected on imports @om India and paid by Bangladesh producers and consumers. Exchange rate Taka 59=$US 1.
As emphasized above, many other variants o f the above are possible, including lower export prices from India which could pressure the dominant Bangladesh producer but s t i l l exceed international prices, and so provide substantial producer surplus benefits for the Indian suppliers. I t would be easy to estimate the resulting distributions o f costs and benefits between the various actors, but much more would need to be known about the base scenario and the plausibility o f alternative situations before these calculations would be worth doing.
4.4 Free trade with India: third simulation
In the f i r s t simulation in which Indian suppliers export to Bangladesh at the going world price, both the small Bangladesh producers and the dominant Bangladesh firm are unable to compete and cease production. However, wi th the cost parameters used in that simulation, the decision o f firm X to cease production in the short run i s a close call, since by importing Indian inputs duty free at world prices brings i t s variable costs down by Taka O.B/bulb, and as a result i t s variable costs exceed import prices by only Taka 0.3hulb. Moreover, at full capacity (annual production o f 40 mi l l ion bulbs) i t s per unit fixed costs are also lower, so that i t s average total costs exceed import prices by about 1 Taka per bulb,
(1) Low demand elasticity case: Taka million (13+5.6)(8.0-5.4)=48.4=$0.82 million (2) High demand elasticity case: Taka million (13+1 l.l)(S.O-5.4)=62.7=$1.06 million
Note however, that this does no allow for producer surplus changes resulting from changes in intermediate inputs supplied from India. This could be positive or negative. On the one hand the FTA gives Indian f m an advantage in supplying intermediates to the dominant Bangladesh producer. On the other hand, direct supply of f ~ s h e d light bulbs from India has replaced the intermediates previously imported by the small Bangladesh producers, some o f which probably came from India.
55
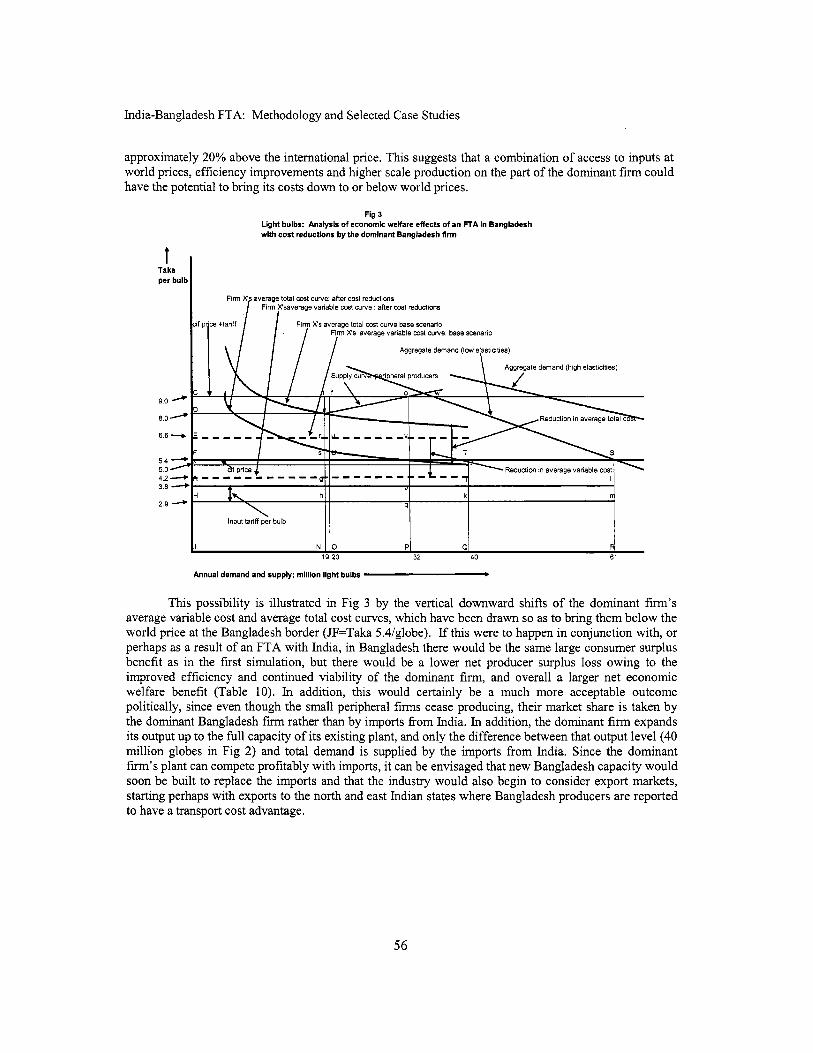
India-Bangladesh FTA: Methodology and Selected Case Studies
I\ h
Input tanff per bulb
approximately 20% above the international price. This suggests that a combination o f access to inputs at world prices, efficiency improvements and higher scale production on the part o f the dominant firm could have the potential to bring i t s costs down to or below world prices.
Fig 3 Light bulbs: Analysis of economic welfare effects of an FTA in Bangladesh with cost reductions by the dominant Bangladesh flrm
v k n
q
t Taka per bull
9.0 A
8.0 A
6.6 -C
5.4 - 5.0 ’ 4.2 4 3.8 - 2.9 4
Annual demand and supply; million light bulbs c
This possibility i s illustrated in F ig 3 by the vertical downward shifts o f the dominant f i rm ’s average variable cost and average total cost curves, which have been drawn so as to bring them below the world price at the Bangladesh border (JF=Taka 5.4iglobe). If this were to happen in conjunction with, or perhaps as a result o f an FTA with India, in Bangladesh there would be the same large consumer surplus benefit as in the f i rst simulation, but there would be a lower net producer surplus loss owing to the improved efficiency and continued viability o f the dominant firm, and overall a larger net economic welfare benefit (Table 10). In addition, this would certainly be a much more acceptable outcome politically, since even though the small peripheral f i rms cease producing, their market share i s taken by the dominant Bangladesh firm rather than by imports from India. In addition, the dominant firm expands i t s output up to the full capacity o f i t s existing plant, and only the difference between that output level (40 mi l l ion globes in F ig 2) and total demand i s supplied by the imports from India. Since the dominant f i rm ’s plant can compete profitably wi th imports, it can be envisaged that new Bangladesh capacity would soon be built to replace the imports and that the industry would also begin to consider export markets, starting perhaps with exports to the north and east Indian states where Bangladesh producers are reported to have a transport cost advantage.
56

A Case Study o f L ight Bulbs
Table 10: Changes in Economic Welfare in Bangladesh: third simulation
Simulation with l o w demand elasticities Simulation with high demand elasticities
Change Consumer Average Welfare area in Mi l l i on M i l l i on Average M i l l i on M i l l i o n in income demand Fig 1 Taka $US demand Taka $US
segment elasticity elasticity assumed assumed
CS H igh -0.25 AFXZ 49.9 0.85 -0.80 61.4 1.04 Middle -0.45 BFVa 74.6 1.26 -1.64 93.1 1.58 L o w -1.08 CFTf 108.0 1.83 -1.60 144.0 2.44 Total 232.5 3.94 298.5 5.06
PS Short run As in Table 8+ -74.4 -1.26 -74.4 -2.07 FAjT
+FxyT PS Long run A s in Table 8 -57.0 -0.97 -57.0 -1.24
-28.8 -0.49 -28.8 -0.49 CR GHw Net W Short run 129.3 2.19 195.3 3.31 Net W Long run 146.7 2.49 212.7 3.61
Notes: CS= Consumers' surplus; PS=Producers ' surplus; CR=Customs (protective tars revenue; W=Economic welfare. I n the simulations indirect tax rates (KAT) are assumed to remain the same as in the base scenario. VAT would continue to be collected on imports fLom India and paid by Bangladesh producers and consumers. Exchange rate Taka S9=$US 1.
There i s no information on the realism o f these hypothesized cost reductions, but in a number o f respects they and other aspects o f the framework outlined above, are consistent w i th a number o f suggestions made during informal discussions with industry representatives. In particular:
For the industry to be able to compete with imports without protection, it would probably need to obtain all or most o f i t s intermediate inputs at world prices, either by importing them over zero or l ow tariffs, buying them from Bangladesh producers, or from in-house production. Consequently, following an FTA with India, if the Indian industry were to export finished light bulbs to Bangladesh at world prices, a necessary condition for the Bangladesh industry to remain viable would be that Indian light bulb materials and components would also be supplied to Bangladesh at about world prices. However, with the hypothesized costs illustrated in F ig 2, this would not be a sufficient condition for the survival o f the Bangladesh industry. In addition, it would need to reduce i t s other variable costs- labor, uti l i t ies etc-in order for it to be worthwhile to continue production even in the short run, and to reduce i t s per unit overhead costs so that i t s total average costs would be low enough to compete wi th imports, in order to be viable in the long run. Th is last point i s consistent wi th the fact that the Bangladesh industry has not been exporting to the northern and eastern Indian states, even though it i s reported to have considerable excess capacity, there i s a substantial transport cost advantage for Bangladesh producers over light bulb producers in the principal Indian industrial states, the Indian light bulb tariff with the SAPTA preference has been at a moderate 10% since January 2004, and such exports would benefit from duty drawback on their imported inputs.
0
4.4 Overall welfare effects: Bangladesh, India and the rest of the world
The discussion so far has focused on the l ikely consequences o f an FTA in Bangladesh where- because o f very high protection o f the domestic industry-the impact would be greatest. However, an India-Bangladesh FTA would also have repercussions in India and in the rest o f the world, mainly on
57
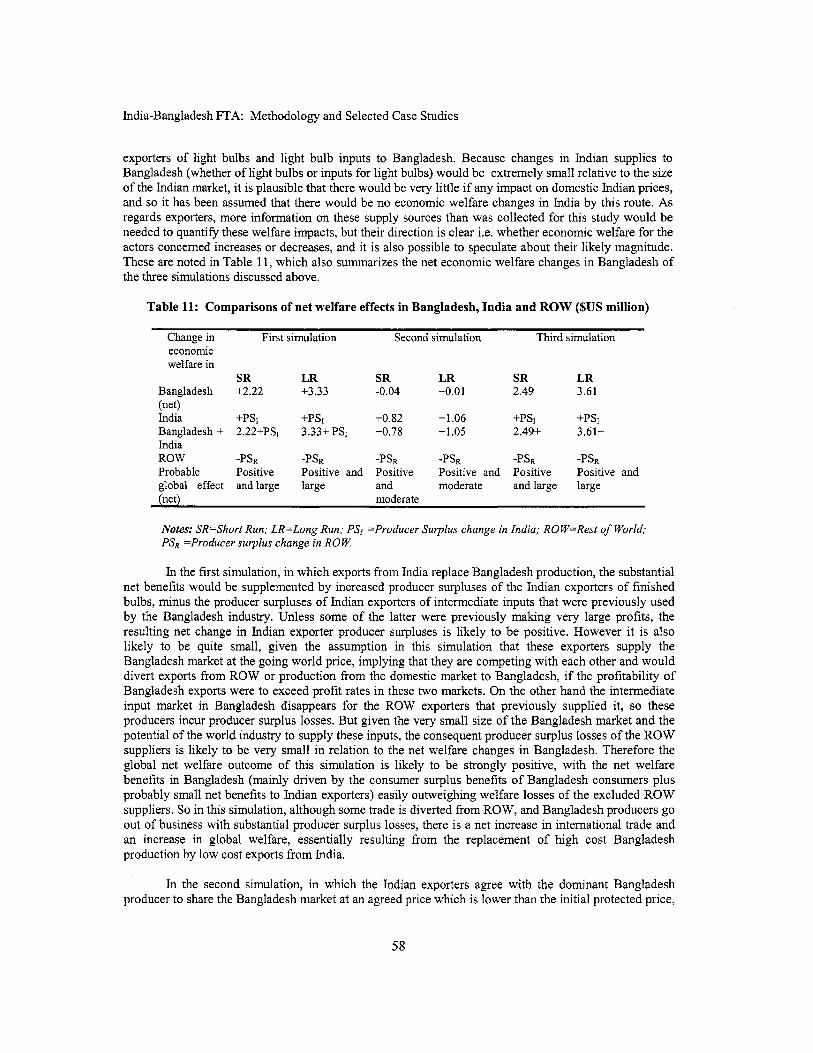
India-Bangladesh FTA: Methodology and Selected Case Studies
exporters of light bulbs and light bulb inputs to Bangladesh. Because changes in Indian supplies to Bangladesh (whether o f light bulbs or inputs for light bulbs) would be extremely small relative to the size o f the Indian market, it i s plausible that there would be very little if any impact on domestic Indian prices, and so it has been assumed that there would be n o economic welfare changes in India by this route. As regards exporters, more information on these supply sources than was collected for this study would be needed to quantify these welfare impacts, but their direction is clear i.e. whether economic welfare for the actors concerned increases or decreases, and it i s also possible to speculate about their l ikely magnitude. These are noted in Table 11, which also summarizes the net economic welfare changes in Bangladesh of the three simulations discussed above.
Table 11: Comparisons o f net welfare effects in Bangladesh, India and ROW (%US million)
Change in First simulation Second simulation Third simulation economic welfare in
SR LR SR LR SR LR Bangladesh +2.22 +3.33 -0.04 +0.01 2.49 3.61 (net) India +PSI +PSI +0.82 +1.06 +PSI +PSI Bangladesh + 2.22+PS1 3.33+ PSI +0.78 +1.05 2.49+ 3.61+ India ROW -PSR -PSR -PSR -PsR -PsR -PsR Probable Positive Positive and Positive Positive and Positive Positive and global effect and large large and moderate and large large (net) moderate
Notes: SR=Short Run; LR=Long Run; PSI =Producer Sulplus change in India; ROW=Rest of World; PSR =Producer surplus change in R O K
In the first simulation, in which exports from India replace Bangladesh production, the substantial net benefits would be supplemented by increased producer surpluses o f the Indian exporters o f finished bulbs, minus the producer surpluses o f Indian exporters o f intermediate inputs that were previously used by the Bangladesh industry. Unless some o f the latter were previously malung very large profits, the resulting net change in Indian exporter producer surpluses i s l ikely to be positive. However i t i s also likely to be quite small, given the assumption in this simulation that these exporters supply the Bangladesh market at the going world price, implying that they are competing with each other and would divert exports from ROW or production from the domestic market to Bangladesh, i f the profitability o f Bangladesh exports were to exceed profi t rates in these two markets. On the other hand the intermediate input market in Bangladesh disappears for the ROW exporters that previously supplied it, so these producers incur producer surplus losses. But given the very small size o f the Bangladesh market and the potential o f the world industry to supply these inputs, the consequent producer surplus losses o f the ROW suppliers i s likely to be very small in relation to the net welfare changes in Bangladesh. Therefore the global net welfare outcome o f this simulation i s likely to be strongly positive, with the net welfare benefits in Bangladesh (mainly driven by the consumer surplus benefits o f Bangladesh consumers plus probably small net benefits to Indian exporters) easily outweighing welfare losses o f the excluded ROW suppliers. So in this simulation, although some trade i s diverted from ROW, and Bangladesh producers go out o f business with substantial producer surplus losses, there i s a net increase in international trade and an increase in global welfare, essentially resulting from the replacement o f high cost Bangladesh production by low cost exports from India.
In the second simulation, in which the Indian exporters agree with the dominant Bangladesh producer to share the Bangladesh market at an agreed price which i s lower than the initial protected price,
58

A Case Study o f Light Bulbs
but much higher than going world prices, modest consumer surplus benefits in Bangladesh are approximately offset by producer surplus losses (mainly o f the small Bangladesh producers) and reduced government tariff revenue, so if the money values o f these changes are valued equally, the net welfare effect for Bangladesh i s about zero. However, the replacement o f the high cost production o f the small Bangladesh producers by low costs exports from India, gives large producer surplus benefits to the Indian suppliers o f finished light bulbs. Under the hypothesized arrangement, and takmg advantage o f the Bangladesh external tariff, these are sold in Bangladesh at prices far in excess o f their production costs. These producer surpluses are likely to outweigh whatever producer surpluses (not noted in Table 11) would be lost by Indian suppliers o f intermediates to the displaced small Bangladesh producers. There are also producer surplus losses for displaced ROW suppliers o f intermediates, but these again are l ikely to be small relative to the economic welfare changes in Bangladesh in India. The net welfare outcomes, both for Bangladesh and India taken together, and globally (i.e. India, Bangladesh and ROW), although smaller than in the f i rst simulation are positive despite the hypothesized collusion between the Indian suppliers and the dominant Bangladesh producer. The basic reason once again i s that the some (but not all) o f the high cost production in Bangladesh i s replaced by low cost Indian exports, and this gain in production efficiency leads to lower prices and some consumer benefits in Bangladesh and large producer surplus gains for the Indian exporters. As noted previously, the lower the negotiated price in Bangladesh, the greater the total economic welfare benefit and the greater the share o f that benefit going to Bangladesh consumers. Wi th the given demand and supply parameters, the total benefit overall and the total net benefit to Bangladesh, i s maximized when the negotiated price from India i s the same as the free market international price, wi th the welfare consequences discussed in the first simulation.
The third simulation, in which Indian f i rms export both finished globes and intermediate inputs to Bangladesh at world prices, and the dominant Bangladesh firm cuts i t s production costs to below the duty free import price, gives the largest net welfare benefit in Bangladesh. In this case there are also producer surplus benefits to Indian suppliers (not quantified in Fig 11) o f globes and o f intermediates, both o f which increase their exports substantially over the base scenario, because o f the much larger demand for globes at the lower price, and the increase in Bangladesh production for which the Indian f i rms supply the intermediate inputs. Finally, the ROW intermediate input suppliers lose their market, but for the reasons discussed previously, their producer surplus loss w i l l be small relative to the large price changes and the resulting large welfare changes in Bangladesh. Hence this simulation gives the largest overall net global welfare increase, not surprisingly because in addition to the production efficiency improvement resulting from the closing o f the small scale Bangladesh producers, there i s also a major autonomous increase in production efficiency on the part o f the dominant Bangladesh firm.
5 IMPLICATIONS FOR TRADE AND OTHER POLICIES
The absolute values o f the net economic welfare changes in Bangladesh that come out o f these light bulb simulations only amount to a a few mil l ion dollars, but it should be borne in mind that in the initial base scenario, at world prices the total demand and output o f this part o f the Bangladesh l ight bulb industry i s probably only about $3 million. Therefore the welfare changes-especially potential consumer welfare benefits which could be as high as $5 mi l l ion annually- are very large relative to the size o f the industry, and reflect the massive compression o f demand that i s a direct result o f the very high prices the industry i s able to charge behind the protection o f very high tariffs. This case i s probably also representative o f many other Bangladesh consumer good manufacturing industries with high protection (usually through the use o f supplementary duties or VAT exemptions for domestic producers) where the individual economic welfare impact might also be relatively small, but where the cumulative total impact o f al l taken together i s l ikely to be very large. In the case o f inexpensive light bulbs and also for many other consumer products, low income consumers would be major beneficiaries o f lower prices.
59

India-Bangladesh FTA: Methodology and Selected Case Studies
It i s apparent from the welfare simulations in this example, that the overall level o f the net welfare change from an India-Bangladesh FTA, and how the total net change i s distributed depends crucially on how competitive the Indian industry would be in supplying the Bangladesh market, both with the finished light bulbs, and with intermediate inputs needed in light bulb production. At one extreme, if the Indian industry were to supply the Bangladesh at world prices, there would be a very large net economic welfare benefit in Bangladesh, and at another extreme, if the Indian industry were to supply the Bangladesh market at the much higher prices that would be feasible given the Bangladesh external tariff, the net benefit to Bangladesh could be negative or quite low, but there could be large economic benefits to the Indian suppliers.
Because the main impact o f an FTA on this industry would be in Bangladesh, the principal questions and issues for trade and other policies affecting the industry also concern Bangladesh. Some issues which come out o f th is case study and which might deserve Bangladesh policy makers’ attention, include the following:
The simulated economic welfare outcomes are affected by the apparent market power o f the dominant Bangladesh producer and its ability to discriminate in pricing between different consumer segments. This market power could well be associated with the very high tari f f protection which benefits the industry, and it would possibly not survive more open import competition, whether from India under an FTA or directly induced by reductions in the general external tariff. If the government were to decide to not include this industry in a negative list under a bilateral FTA with India, the obvious way to limit the pricing power o f the Indian industry in exporting to Bangladesh would be to cut the general external tariff. General tariff cuts prior to implementing an FTA (or SAFTA) would be even better, as they would reduce the likelihood o f welfare reducing outcomes for Bangladesh when the preferential arrangements become effective Informal discussions and the welfare simulations (even though based on admittedly imperfect data) suggest that there i s probably some potential for the dominant Bangladesh firm to improve its performance, both as regards pricing in the Bangladesh domestic market, and perhaps by exporting to the Indian northern and eastern states. T h i s could be one eventual outcome o f an FTA with India, but pressure from general tariff cuts might also work. To better inform policy, much more detailed data and information would be needed than has been available for this study. While the general direction and nature o f the simulation results seem quite plausible, the welfare numbers could change considerably wi th better data. If an India-Bangladesh FTA does not eventuate, or i f SAFTA i s not implemented, major economic benefits in Bangladesh similar to those discussed in the first and third simulations would result from unilateral cuts in the MFN tariffs on light bulbs and their inputs. The principal missing benefit that would be provided by an FTA would be preferential access for Bangladesh light bulb exports to the Indian market, but without cost reductions and productivity improvements on the part o f the Bangladesh industry, the prospects for such exports at present do not appear promising. Pressure on the industry from lower t a r i f f s and import competition could be a way to bring such productivity improvements about.
60

A Case Study o f Light Bulbs
-Notes: The HS categories in this Table do not include ultra-violet and infra-red lamps, halogen lamps, and auto - -sealed beam lamps. However HS 8539.29 includes bulbs for torches, other miniature bulbs, and other auto bulbs. - - N.e.i. =not elsewhere included. Import statistics at 8 digit level are not available on the DGFT website before FY - -2004. The protective tariff rates are for low prices light bulbs: until January 2004 these rates were marginally - -lower than the protective tariffs on other types of light bulb. Before import licensing was lifted in 2001, some - - imports were allowed under special export-related import licences (SILs). However, when licensing was removed - -low priced (<=Rs 20/bulb retail) light bulbs were included in the list of products which have to meet compulsory - technical standards. These rules are administered by the Indian Bureau of Industrial Standards ( B E ) and - -satisfying them might act as a serious non-tariff barrier to imports. -
1 I I I I I I
61


FREE TRADE BETWEEN INDIA AND BANGLADESH? ANALYSING AND QUANTIFYING POTENTIAL ECONOMIC COSTS AND BENEFITS:
A CASE STUDY OF THE CEMENT INDUSTRY
Industry structure and trade policies
The economic welfare simulations use industry and trade data assembled from published sources and a few interviews by researchers in India and Bangladesh. The based year for the simulations was Bangladesh's fiscal year (July 1 at June 30) 2002/03, which corresponds most closely to India's (April 1 to March 3 1) 2002/03 fiscal year. More detail on the data and how it has been interpreted i s in the Annex. Some key features for interpreting the economic welfare simulations are the following:
(Portland) cement i s m a d e b y grinding clinker. Clinker i s produced from iimestone in capital intensive plants generating heat from various sources e.g. coal, fuel oil, natural gas. Bangladesh does not produce clinker. All the clinker used in cement production i s imported, mostly from Indonesia, Thailand, and Malaysia. India has i t s own limestone deposits and cement i s produced in hl ly integrated clinkedcement plants Most o f the Bangladesh cement plants are situated on r ivers so as directly unload the clinker into their plants. The barges carrying clinked go as far as Sylhet in the far north eastern comer o f Bangladesh. There are no clinker imports into Bangladesh through the land borders with India, either in the west or in the north or east. However, the NE Indian states (specifically Meghalaya) have good limestone deposits which could be used for clinker production. Bangladesh sharply increased its Portland cement tariffs between 1999 and 200 1, f rom around 36% to 70% in the case o f grey cement (Fig 6) and to almost 88% in the case o f white cement. As intended, this attracted investment into cement production and replaced imports. Prior to this imports - including imports from India-were substantial, but by 2001/02 it was reported that they had been entirely eliminatedlg, and in the base year (2002/03) for the economic welfare simulations reported below, it i s assumed that domestic production was fully meeting domestic demand o f 6 mil l ion tons. The tariff on Bangladesh's clinker imports during 2002103 was 26%. Both the clinker imports and cement sales are subject to Bangladesh's 15% VAT. According to published data and a survey o f cement firms, wholesale cement prices in Bangladesh in 2002/03 were about equivalent to international prices plus tariffs (including para-tariffs as well as Customs duties) plus transport costs plus the 15% VAT. Hence, in contrast to other products, smuggling (either conventional or "official"4nvolving bribery o f Customs and other officials) did not appear to be creating tariff redundancy. Cement prices in Bangladesh were about the same country-wide. Based on interviews with cement producers, the relative uniformity o f prices in widely scattered regions was probably due to fairly minor differences in delivered prices o f imported clinker at riverside plant locations, combined with some freight absorption by f i rms selling to distant markets to meet the competition o f plants in those markets. In 2003 there were about 60 cement grinding plants in Bangladesh and approximately the same number o f cement companies. Total grinding capacity was about 12 mil l ion tons, but production only about 6 mil l ion tons. The number o f f i rms and capacity had expanded very rapidly since about 1998/99. About 30 small firms (mostly recently established) were reported to be on the point o f closing or "sick". Most o f these were too small, with capacities o f only 50-100 tpd (tons per day). With low capacities overhead costs are too high, i t 's not possible to maintain quality, and bagging and
l 9 W e were unable to find reliable statistics o f Bangladesh's Portland cement and clinker imports. The statement that they had been fully replaced by 2002/03 i s f rom interviews w i th cement fm.

arc too sniall to bc efficient. The ~ e d ~ u r n size plants havc c rpd, and thc~c arc some large ~ n ~ e ~ a ~ ~ o n a ~ ~ y scaied plants o f 25tfQ tpd capacity. India appears to bc a low cost mment producer by tons annually, mainly to S n Lanka, Uubar and N p r o d ~ c t ~ ~ n (over 100 rniilion tons), but about half Bang
cittcs o f about 1000
ards, I t ii c ~ p ~ ~ r ~ ~ ~ i ~ about 3 rniilion i s less than 3 percent o f 11s totat
total ~ r o ~ u ~ ~ i o n . There are no clinker
e
s and ccmcnt imports a r t ~ t ~ l i ~ ~ b l e . * protectlye tariffs on both ccmeai and clinker during 2002103 and ~~~~~~#~ were ~ p p r o x ~ n ~ ~ ~ e l ~
However, actual ex-factory pnces appeared to be about e ~ ~ ~ v a l e n ~ to equal to fob cxpoft ng that c ~ m p e ~ i ~ ~ ( ~ n between cement f i rms was operliting in a textbook ~ a n n e ~ to t ic and export prices, making the import tanffs redundant.
Fig fi Bangladesh 1992-2004. Cement: Customs Duties and Mher
I Protective Import. Taxes ""_____
I
70
60
s e 8 40
2 30
20
ID
0
8 %
E! n
I
t 1932 1993 1994 I995 1936 1997 2898 1999 2000 2007 2002 2003 2004
An FTA would involve zcro tariffs and no QRs on a l l trade between India and BanglaJcsh. ~ n c ~ ~ ~ d ~ n ~ cement and i t s inputs, o f which the ~ r i n c i p a ~ input is clinker. IIowever, the present external MFN rar1fi:s ttould not changc. Based on data and analysis ofthe rndustry in ~ a n ~ ~ ~ d ~ ~ ~ and India:
( 2 ) Iiidia ecmcnt prices and costs arc about equal to prices in j ~ ~ ~ r n a ~ i ~ n ~ l markers. Consequently, with exports of cement to ~ 3 a n ~ ~ a ~ e s I ~ uou ld displace Rest of'tlic World (ROW) exports to any). Stncc lndm ~b afrcady exporting abctirt 3 lion tons o f cement to c o ~ ~ ~ e t i t i ~ e
markers such as Sri I.anka, Dubat and Xigerm, other expor to € ~ ~ ~ ~ l a ~ e s h cciuid not possibly compete with Indian c W 3 ) protcctivc ~ a ~ ~ l ~ ~ ~ s h import rters it' they had to pay thc prcsent taxes of o f 93.8'14, ( ccrnc~its and "otiiers") and 71.4% ("greytt cement). The same upas true in
64
A case study o f the cement industry
2002103 (the base year for the estimates) when these protective import taxes in Bangladesh were 66.7% and 87.7% respectively.
(2) With an FTA Indian exports o f clinker would also probably displace Bangladesh's present clinker imports from Indonesia, Thailand and Malaysia. The Bangladesh protective MFN tariff on clinker imported by cement manufacturers i s presently 26%. However, whether clinker would be imported by Bangladesh would depend on how much Bangladesh cement production capacity would remain after an FTA.
(3) Estimated Bangladesh export supply prices fob considerably exceed domestic ex-factory cement prices in India. Therefore at current marginal long run costs, there i s no potential for Bangladesh cement exports to the principal Indian markets with an FTA, except for the possibility o f some exports to the NE Indian states21
(4) The total Bangladesh market i s only about 6 percent o f Indian total cement production. Unless there are resource constraints in India (e.g. increasing costs in limestone production) it i s unlikely that substantial Indian exports to Bangladesh would have much affect on production costs or prices in India i.e. the long run Indian supply curve to the Bangladesh market i s probably highly elastic: plausibly (leaving aside transport costs inside Bangladesh) about horizontal. There would be transport constraints at the land borders but most o f the cement could come by sea from Indian ports to Chittagong and Mongla.
(5) Since Indian production i s integrated back to limestone and other minerals, there would be no ru les o f origin constraints on Indian exports to Bangladesh under an FTA. However, if some Bangladesh plants were to export cement to the Indian NE states using Indian clinker imported from there, there would be some rules o f origin issues, unless the FTA were to recognize the use o f materials supplied from the other country as qualifying under the rules o f origin.
(6) In Bangladesh imported clinker i s presently being unloaded from ships directly on to barges which deliver it with relatively low transshipment, barge transport and unloading costs to riverside cement plants. For simplicity, in the welfare simulations below it i s assumed that imported cement from India would be handled in the same manner and that the delivered prices with which local cement plants would have to compete are identical at al l locations, including the most distant inland locations. For example, in the first simulation in which the Indian exporters sell to Bangladesh at the going world price ( see below) this price i s $36/MT or Tk 2066MT. The actual price to cement consumers would exceed this by the 15% VAT, road transport costs from the riverside locations and distributor margins. Therefore, the demand curve used in the simulations i s a derived curve showing bulk demand at the riverside locations in relation to a price from which the VAT and these costs and margins have been deducted. More comprehensive and detailed cost- benefit analyses would allow for differences in barge transport costs according to location and distance from the ports, and for differences in local road transport delivery and marketing costs. However, unless there are very large
This potential might be larger in the future if Bangladesh firms were to establish clinker plants near the border o f the Indian NE states, say at Sylhet. These might be viable if based on limestone & dolomite etc imports f rom the Indian NE states. I t would also need l o w cost energy supplies (natural gas?). Th is production might also be able to compete w i th Indian cement in the Bangladesh domestic market under an FTA. However, th i s scenario assumes the establishment o f internationally competitive large scale clinker and cement plants in that region o f Bangladesh.
21
65
India-Bangladesh FTA: Methodology and Selected Case Studies
differences in transport costs between regions, it i s unlikely that doing so would greatly alter the outcome o f the economic welfare simulations.
(7) There are about 60-64 Bangladesh cement plants owned by approximately the same number of firms. There was no information on plant level costs except incomplete information for two plants. I t was assumed that the marginal plant was making normal profits at an ex-factory price excluding VAT of Tk 4200MT. T h i s price is assumed to include about TK 3 0 0 M T cement transport costs, so the marginal production cost i s Tk 3900/MT= $681 MT approx. According to a firm interview, about 30 small plants with about 50-100 tpd capacity were barely breakmg even or making losses, medium size plants o f 1000 tpd capacity were profitable, and there were also some large plants with about 2500 tpd capacity which presumably were profitable.
(8) T h e effects o f increased import competition from Indian suppliers with an FTA would probably (1) cause high cost producers -mainly small capacity plants-to close (2) cause the remaining Bangladesh producers to cut prices and reduce costs by operating at higher capacity utilization levels. (1) can be envisaged as a move down a short run supply curve with al l remaining producers continuing to operate at below full capacity. (2) can be envisaged as a downward shift o f the supply curve resulting from the remaining plants operating at normal competitive capacity i.e. as a kind o f long run supply curve where temporary excess capacity has been eliminated. The welfare simulations were done using both o f these in turn.
There was no data from the survey on capacity utilization by plant, or plant level costs, so some arbitrary assumptions were needed.
For the short run case (l), it was assumed that -with below capacity operations continuing- the marginal plant breaks even at Tk 3900MT and that the least cost plant could break even at an ex-plant price about 10% lower (say at Tk 3500iMT). It was then assumed that there was a linear supply curve between between these two points over total production o f 6 mi l l ion tons This corresponds to an average supply elasticity wi th respect to the ex-factory price over this range o f (6/3)/(400/3700) = 18 approx. If al l these plants were to close, the producer surplus loss would be Taka 0.5*400*6 million=Tk 1200 mi l l ion equiv approx $1200/57.4=$20.9 million. In addition there would be some producer surplus losses resulting from unemployed labor and other resources previously employed in cement production 1.e. resources employed in inelastic supply. The size o f this producer surplus loss depends on the slope o f the supply curve & the production costs o f the most efficient plant relative to the marginal plant. There could be further induced economic losses through the effects o f unrepayable recent bank loans which reportedly financed a very large expansion o f cement capacity and the entry o f new f i r m s since about 1997/98. In October 2003 there were already reports o f "sick" cement plants resulting from overcapacity o f about 50% relative to demand and some domestic competition.
For the long run case (2), the elimination o f excess capacity was represented by a downward vertical shift in the linear supply curve equivalent to 25% o f total costs in the short run case with excess capacity. This arbitrary assumption was based on an interview statement in which a medium scale firm stated that i t could be profitable at a price about 25% lower than i t s current price if i t could operate at full capacity instead o f at half capacity at the time o f the interview. Even with import competition prevented by prohibitive tariffs, clearing out o f non-viable plants was reported to be already underway during 2002 and 2003, and it i s plausible that this would enable the remaining plants to operate at closer to full capacity and reduce costs, thereby enabling them to operate profitably at lower prices than the current average domestic prices. Keeping the linear supply curve assumption, with a 25% downward shift the lowest cost intra-marginal plant would break even at Tk 2800/MT and the new marginal plant (at the 6 mi l l ion ton production point) would break even at Taka 390011.25 =Tk 3120MT. However, if the
66
A case study o f the cement industry
industry i s competitive, as estimated in the simulations, the new equilibrium i s at a higher production level at the intersection o f the demand curve and the “long run” full capacity supply curve.
Economic welfare simulations: results
The results o f five simulations are summarized in Table 1. The f i rst two simulations consider an FTA with India starting from the current cement supply curve in Bangladesh with excess capacity. The third simulation illustrates the welfare gains from the elimination o f excess capacity in Bangladesh but no FTA and no other trade policy changes. The final two simulations deal with the welfare effects o f an FTA starting from this latter situation i.e. with the productivity improvements in Bangladesh resulting f rom the removal o f excess capacity. The supply and demand parameters used for the simulations are illustrated in F ig 1. The equilibrium points were obtained by solving the linear demand and supply equations.
An FTA with the current (short run) Bangladesh supply curve with excess capacity. The f i rs t two simulations start from the Bangladesh supply curve with excess capacity and a domestic ex- factory cement price o f Tk 3900/MT ($67.90/MT). At this price it assumed that marginal cement grinding plants are just breaking even but that larger lower cost plants are profitable, illustrated by the gap between this price and the supply curve which i s assumed to cut the Y axis at Tk 3500/MT. The domestic price o f Tk 3900 exceeds the international price c i f Bangladesh (estimated at $36/MT or Tk 2066MT) by about 89%, approximately by the same percentage as protective import duties. With this tari f f there are no cement imports, but al l the clinker required by the Bangladesh plants i s imported.
In the first simulation, following the FTA Indian cement f i r m s export to India at the prevailing border price. It i s assumed that the Indian exporters have a transport cost advantage in supplying Bangladesh equivalent to Tk 166/MT (about $2.90/MT), so that the Indian supply to Bangladesh i s incremental i.e. it i s not switched from India’s cement exports to ROW destinations such as Sri Lanka and Africa. However the costs o f the Indian exports go up slightly as exports to Bangladesh expand: this i s illustrated by the slight upward slope o f the Indian export supply curve to Bangladesh with i t s Y intercept at Tk 1900MT (about $33/MT c i f Bangladesh). The Indian export price does not go above the international price owing to competition between the Indian cement exporters. At an Indian export price o f Tk 2066/MT c i f Bangladesh, demand expands from 6 mi l l ion MT to 8.82 mi l l ion MT and al l the Bangladesh production i s replaced by imports from India. This produces a large net annual economic welfare benefit for Bangladesh o f $171 million, consisting o f a consumers’ surplus benefit o f $237 million, a producers’ surplus loss (the area above the Bangladesh short run suppy curve and the pre-FTA price) o f $21 million, and a Customs revenue loss o f $45 million. The Customs revenue loss results from the cessation o f clinker imports (subject to a protective import tax rate o f 26%) previously used in the domestic cement industry. This cement-equivalent o f the clinker tariff i s estimated at Tk 430/MT and i s illustrated in Fig 1.
67
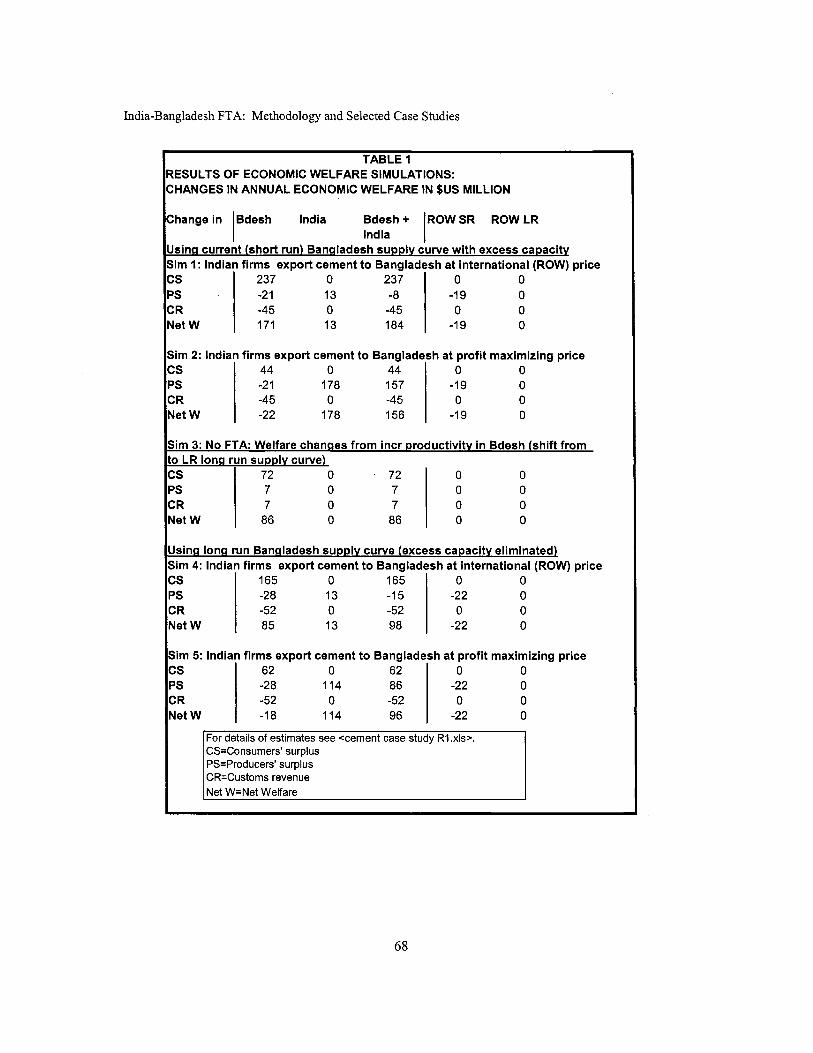
India-Bangladesh FTA: Methodology and Selected Case Studies
Bdesh+ ROWSR ROWLR India
Using current (short run) Bangladesh supplv curve with excess capacity Sim 1: Indian firms export cement to Bangladesh at international (ROW) price cs 237 0 237 0 0 PS -2 1 13 -8 -1 9 0 CR -4 5 0 -45 0 0 Net W 171 13 184 -1 9 0
Sim 2: Indian firms export cement to Bangladesh at profit maximizing price cs 44 0 44 0 0 PS -2 1 178 157 -1 9 0 CR -45 0 -45 0 0 Net W -22 178 156 -1 9 0
Sim 3: No FTA: Welfare channes from incr productivitv in Bdesh (shift from to LR long run supplv curve) cs 72 0 72 0 0 PS 7 0 7 0 0 CR 7 0 7 0 0 Net W 86 0 86 0 0
Using long run Bangladesh supplv curve (excess capacity eliminated) Sim 4: Indian firms export cement to Bangladesh at international (ROW) price cs 165 0 165 0 0 PS -28 13 -1 5 -22 0 CR -52 0 -52 0 0 Net W 85 13 98 -22 0
Sim 5: Indian firms export cement to Bangladesh at profit maximizing price cs 62 0 62 0 0 PS -28 114 86 -22 0 CR -52 0 -52 0 0 Net W -1 8 114 96 -22 0
CS=Consumers' surplus PS=Producers' surplus CR=Customs revenue
68
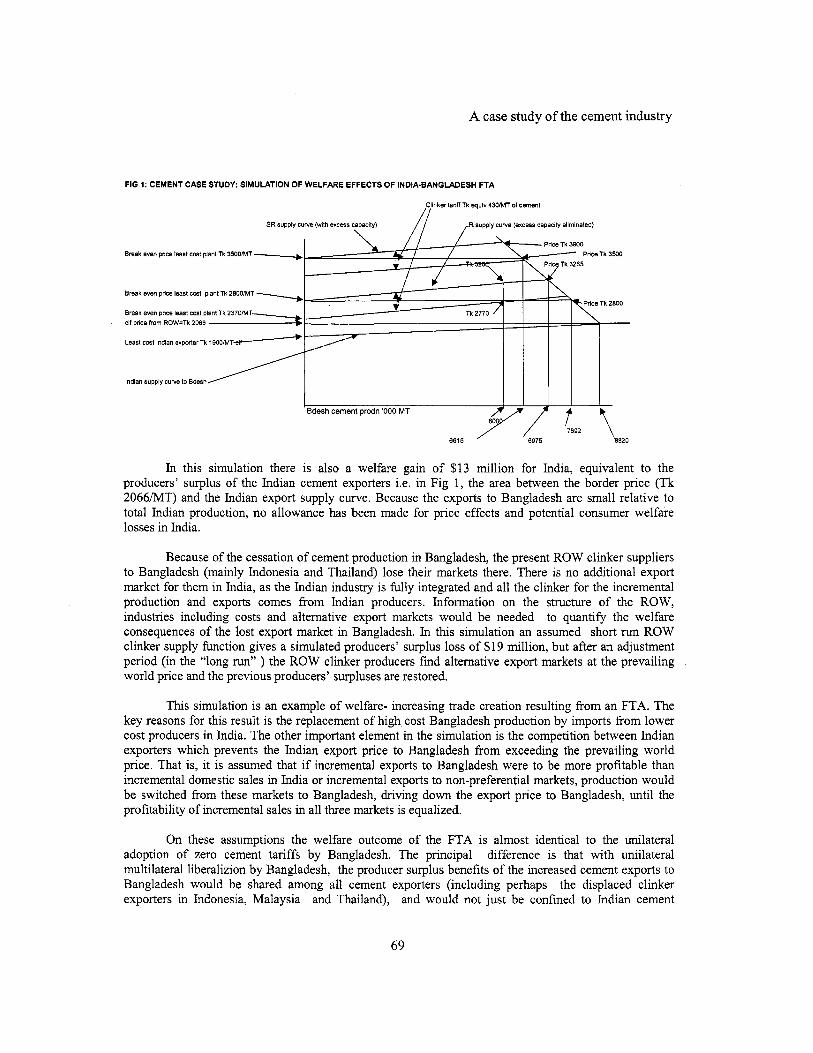
A case study o f the cement industry
FIG 1: CEMENT CASE STUDY: SIMULATION OF WELFARE EFFECTS OF INDIA-BANGLADESH FTA
,$linker tatiff Tk equlv 4 3 0 M of cement
SR supply curve (with excess capachy) R supply cuwe (excess capacity eliminated)
Price Tk 3900
Pricp Tk 328.5 Pdce Tk 3%
I Break e m price least cost plant Tk 35001MT -, Break even price least cast piant Tk 28WiMT
Break even price least cast PI cif phce fmm ROW=Tk 2066
Least cost Indian exporterTk 19OOiM
Indian supply cuwe l o Bdash
i I I I I
t 2 ’ Bdesh cement prodn ‘000 MT
6615 /, L,, ‘7s92 L 2 0
In this simulation there i s also a welfare gain o f $13 mi l l ion for India, equivalent to the producers’ surplus o f the Indian cement exporters i.e. in F ig 1, the area between the border price (Tk 2066/MT) and the Indian export supply curve. Because the exports to Bangladesh are small relative to total Indian production, no allowance has been made for price effects and potential consumer welfare losses in India.
Because o f the cessation o f cement production in Bangladesh, the present ROW clinker suppliers to Bangladesh (mainly Indonesia and Thailand) lose their markets there. There is no additional export market for them in India, as the Indian industry is fully integrated and al l the clinker for the incremental production and exports comes from Indian producers. Information on the structure o f the ROW, industries including costs and alternative export markets would be needed to quantify the welfare consequences o f the lost export market in Bangladesh. In this simulation an assumed short run ROW clinker supply function gives a simulated producers’ surplus loss o f $19 million, but after an adjustment period (in the “long run” ) the ROW clinker producers find alternative export markets at the prevailing world price and the previous producers’ surpluses are restored.
This simulation i s an example o f welfare- increasing trade creation resulting from an FTA. The key reasons for this result i s the replacement o f high, cost Bangladesh production by imports from lower cost producers in India. The other important element in the simulation i s the competition between Indian exporters which prevents the Indian export price to Bangladesh from exceeding the prevailing world price. That is, i t i s assumed that if incremental exports to Bangladesh were to be more profitable than incremental domestic sales in India or incremental exports to non-preferential markets, production would be switched from these markets to Bangladesh, driving down the export price to Bangladesh, until the profitability o f incremental sales in al l three markets i s equalized.
On these assumptions the welfare outcome o f the FTA i s almost identical to the unilateral adoption o f zero cement tariffs by Bangladesh. The principal difference is that with uniilateral multilateral liberalizion by Bangladesh, the producer surplus benefits o f the increased cement exports to Bangladesh would be shared among al l cement exporters (including perhaps the displaced clinker exporters in Indonesia, Malaysia and Thailand), and would not just be confined to Indian cement
69

India-Bangladesh FTA: Methodology and Selected Case Studies
exporters. A potential benefit to Bangladesh o f multilateral (mfn) import liberalization rather than liberalization achieved through an FTA with India, i s that the key price benefit to cement consumers would be more secure owing to the competition from actual or potential exporters from suppliers in a number o f countries.
The parameters o f the second simulation are the same as those used in the f i rst simulation, with the key difference that the Indian exporters are assumed to be able to collude effectively and set an export price which maximizes their jo int profits from exporting to Bangladesh. The profit maximizing price for them i s the price that marginally undercuts the lowest cost Bangladesh producer i.e. marginally below Tk 3500Mt. As indicated in Table 1, this produces a much smaller consumer surplus benefit ($ 44 million) in Bangladesh than with the first simulation. However, a l l Bangladesh production i s s t i l l eliminated, which involves the same producer surplus and Customs revenue losses as in the first simulation. The total o f these welfare losses exceeds the benefit to cement consumers, resulting in a net economic welfare loss for Bangladesh estimated at $22 million.
By setting a profit maximizing price in exporting to Bangladesh behind the protection o f the continuing very high Bangladesh mfn tariff, the Indian exporters in this simulation extract very large producer surpluses ($178 million) from the 6.615 mi l l ion tons o f cement they supply, equivalent in Fig 1 to the area between the new Bangladesh price line at Tk 3500/MT and the Indian export supply curve. Hence in this scenario, the FTA causes a net welfare loss for Bangladesh and a substantial welfare gain for India.
Despite the welfare loss for Bangladesh, however, the joint outcome i s trade creating and strongly welfare improving (by $156 mil l ion annually) because o f the replacement o f very high cost Bangladesh production by much lower cost Indian production. There is a net fiscal cost ($ 45 mi l l ion less Customs revenue in Bangladesh) but the joint fiscal cost to both countries could be less than this to the extent that there are Indian profi t and other taxes on the producer surpluses earned by the Indian cement exporters.
As in the first simulation, ROW loses the clinker export market in Bangladesh. The possible welfare consequences o f this loss are as discussed previously.
Increased productivity in Bangladesh, but no FTA and no other trade policy changes. third simulation illustrates the economic welfare effects o f productivity improvements, which are assumed to occur endogenously without the stimulus o f any trade policy changes. These involve substantial welfare gains for Bangladesh, and i t i s useful to look at how they manifest themselves in the simplified model illustrated in F ig 1. This i s assumed to occur through competition which has weeded out many small scale high cost grinding plants and caused the remaining plants to operate at or near f i l l capacity. In October 2003, this process was reported to have been under way for several years, with cement prices declining and many smaller companies making losses and finding survival difficult. The end result o f the process i s represented in F ig 1 by a vertical downward shift in the supply curve o f Tk 700/MT, with the new “long run” supply curve intersecting the Y axis at Tk 2800MT rather than at Tk 3500/MT, and with a new equilibrium competitive price o f Tk 3265/MT. As indicated in Table 1 (bottom four rows) if allowed to work itself out, wi th the given parameters, this process involves substantial welfare gains for Bangladesh, principally cement consumer surplus benefits ($ 72 million) but also some producer surplus and Customs revenue benefits, the latter from tariffs on increased clinker imports for use in the expanded production o f cement. Since there i s now considerable “water” in the Bangladesh cement tari f f i.e domestic Bangladesh cement prices are well below international prices plus the tariff, there are s t i l l no Bangladesh cement imports and no resulting welfare changes in India or ROW from increased cement exports. However as a result o f the increased clinker exports needed to support the increased Bangladesh cement production, there could be some (producer surplus) welfare gains in ROW clinker- exporting countries, and also in India if i t s clinker producers increase their exports.
70
A case study o f the cement industry
An FTA following increased cement productivity in Bangladesh. The next two simulations start from the scenario just discussed i.e. lower cement production costs represented by a downward shif t in the Bangladesh supply curve.
In the fourth simulation, following the FTA , as in the f i rst simulation, it i s assumed the the Indian cement exporters are competitive and sell to Bangladesh at the world price. Even though i t s costs have declined, the Bangladesh industry cannot compete at this price and cement production ceases, which in turn eliminates clinker imports. Once again there i s a substantial consumer benefit ($ 165 mi l l ion annually), only partially offset by producer surplus and Customs revenue losses o f $28 mi l l ion and $52 mi l l ion respectively), and a net welfare gain in Bangladesh o f $84 million. The Indian cement exporters sel l the same quantity o f cement to Bangladesh as in the first simulation and there is a producer surplus benefit to India o f $13 million, but the ROW clinker exporters to Bangladesh lose their market, leading to a short run welfare (producer surplus) loss in these countries o f $22 million. Aggregating these economic welfare changes, the FTA is welfare enhancing for both Bangladesh and India, and welfare enhancing in the aggregate even after allowing for the clinker exports diverted from the ROW exporters to Bangladesh. As in the f i rst two simulations, this outcome i s entirely the result o f the cement consumer benefit resulting from the replacement o f the higher cost Bangladesh cement production by lower cost exports from India.
In the fifth simulation, following the FTA it i s assumed that the Indian cement exporters collude and set a price for their exports to Bangladesh which maximizes their joint profits from these sales. As in the second simulation, with the given initial price in Bangladesh and the supply and demand parameters which have been assumed, this profi t maximizing price turns out to be marginally below the production costs o f the most efficient Bangladesh plant (Tk 2800/MT), so that once again al l the Bangladesh production i s displaced by exports from India. The new price in Bangladesh i s lower than the pre-FTA price and there are s t i l l substantial consumer surplus benefits ($63 mil l ion per annum) to cement buyers, but these benefits are offset by lower producer surpluses ($28 million) and reduced Customs revenues from clinker imports ($52 million), giving a net welfare loss to Bangladesh o f $18 million. But there i s a substantial welfare benefit to India resulting from the exports at the profi t maximizing price o f Tk 2800/MT, equivalent to $48.8/MT cif, compared to the international price o f $36/MT. Most o f the total benefit to India ($1 14 mi l l ion per year) i s economic rent which results from the ability o f the Indian cement exporters to price collusively as a result o f the FTA, which essentially transfers the protection provided by the Bangladesh protective import duties (assumed to continue at the init ial rate o f 71.4%) to them. Overall, there i s s t i l l a net welfare benefit (to India and Bangladesh taken together), and once again the key reason i s the trade creating and welfare increasing effect o f the replacement o f the higher cost Bangladesh production by lower cost production in India.
Economic welfare simulations: comments on parameters and other assumptions
The results o f the five simulations discussed above depend on a number o f supply and demand and parameters which seem plausible, but most are guesses based on very limited information. An obvious follow-up to these preliminary welfare simulations would be to have a more careful look at some o f these parameters and to adjust the estimates accordingly. Some o f the key parameters to look at in a more detailed cost-benefit analysis are the following:
The slope o f the cement demand function in Bangladesh. Over the very wide price range considered in the simulations, the average price elasticity i s -0.619. A flatter or steeper demand curve would change the welfare numbers but would not change the principal results. The slope o f the Bangladesh sumlv curve, and in particular the costs o f intra-marginal cement grinding plants. If some o f these are more efficient and have lower costs than assumed here, the producer surplus losses in Bangladesh resulting from an FTA would be greater than in the above simulations.
>
>
71

India-Bangladesh FTA: Methodology and Selected Case Studies
The level and slope o f the Indian cement export supplv curve to Bangladesh. In the present simulations, this i s assumed to be highly elastic (average price elasticity 23.9) and that transport cost advantages in relation to potential ROW cement suppliers would allow the most efficient Indian export plants to deliver cement to Bangladesh at Tk 1900 (=$33.10) c i f per MT, or about $3 below the going international price. These two parameters are the principal determinants o f the estimated potential producer surplus gains to India resulting from an FTA. The assumption that the Bangladesh government would leave the general clinker tariff unchanged after the commencement o f the FTA, and that the Bangladesh cement f i r m s would have to pay this tariff on clinker imports from ROW countries while attempting to compete with cement imports over a zero tariff from India. More plausibly, the cement f i rms would lobby for and probably obtain lower or zero clinker tariffs, thereby reducing their costs and increasing their ability to compete with the Indian cement f i rms. T h i s could be modeled as a downward shift in the Bangladesh cement supply curve, equivalent to the cement equivalent o f the clinker tariff. The assumDtion that under an FTA Indian exporters would supplv Bangladesh with cement and not clinker. T h i s in turn assumes that the Indian cement producers are integrated enterprises producing their own clinker. If there are independent Indian clinker producers, under an FTA wi th Bangladesh they could conceivably use the FTA preference to supply Bangladesh grinding f i rms at lower prices than the duty-inclusive prices o f clinker presently imported from Indonesia, Thailand and Malaysia. It would be necessary to investigate the structure o f the Indian clinker-cement industry to assess the plausibility o f this or similar outcomes. The assumption (which follows from the supply and demand parameters used) that the profi t maximizing price for Indian cement exporters were they to collude under an FTA, would undercut and drive al l the domestic Bangladesh cement producers out o f business. With a steeper Bangladesh supply curve (implying lower cost intra-marginal producers than assumed in the simulations) it i s possible that the profi t maximizing price for the Indian cement exporters would keep some o f the lower cost Bangladesh producers in business i.e. the Indian suppliers would do better by setting higher prices that would enable some o f the more efficient Bangladesh producers to stay in business and share in the economic rents made possible by the combination o f the very high Bangladesh cement tariffs and the FTA. The production costs, market structure, export supply conditions and other factors affecting. the l ikelv reaction and welfare conseauences in the countries (mainly Indonesia. Thailand and Malaysia) presently exporting clinker to Bangladesh. All that can be said without further information i s that an India-Bangladesh FTA would produce welfare losses for these countries, but how great these losses would be requires further investigation. The assumption that the delivered price o f imported cement would be the same at al l inland riverside locations. Dropping this assumption and allowing for higher delivered prices at more distant up-river locations would provide some transport-cost protection to cement grinding plants in these places, although probably not much on balance since the delivered prices o f imported clinker would also be higher. Al lowing for differences in final consumer prices as a result o f differences in local road transport and local marketing costs and in the incidence o f VAT, in assessing the effects o f an FTA on final cement demand. Doing this would greatly complicate the analysis, but again would probably not greatly change either the direction or the values o f the welfare simulations.
In interpreting the economic welfare estimates, it should be remembered that governments normally share in producer surpluses through taxes on profits. Hence, for Bangladesh the tax share o f the cement companies’ profits would need to be added to the Customs revenue loss to obtain the total fiscal loss from the FTA simulations, and in the case o f India there would be a fiscal gain from profi t taxes applied to the cement companies’ producer surpluses resulting from their cement exports to Bangladesh. There would also be fiscal effects through the effects on indirect tax receipts, notably through the VAT in Bangladesh and excise (countervailing) taxes in India. Hence the changes in Customs revenues given in
72
A case study o f the cement industry
the simulations are only very crude and preliminary estimates o f the total fiscal effects o f the FTA in relation to the cement sector.
To simplify the estimation o f welfare changes, this model has used linear demand and supply functions, and with more information this could be modified by using more realistic non-linear functions. However, before doing this, it would be important to be sure that the resulting gains in understanding and accuracy as regards welfare changes are l ikely to offset the considerable extra computational complexity normally involved. The advantages o f using straight line demand and supply curves i s that the welfare changes can be easily seen graphically, and easily calculated. At the same time there are inevitably large margins o f error in many o f the parameters, and by comparison the errors from assuming straight line supply and demand functions are likely to be small.
All the quantities in the model (quantities demand and produced, value o f production, consumer surpluses, producer surpluses, and Customs revenues) are annual, and in particular the estimated welfare changes are annual changes. It would be easy and useful to calculate the present value o f these welfare changes using plausible discount rates and assumptions about future changes in parameters such as demand,
For convenience al l the welfare simulations have used a common foreign exchange ($US) numeraire, under which the $US value o f consumer surpluses, producer surpluses, and Customs revenue changes are valued equally, both within each country and across countries. These could obviously be valued differently e.g. in Bangladesh Customs revenue losses could be weighted differently f rom consumer benefits resulting from lower cement prices, and changes in producer surpluses in India could be weighted differently from changes in producer surpluses in Bangladesh. This is always possible in any kind o f economic welfare analysis, but before this can be done a starting point with some known weights i s f irst needed to provide the direction and provisional size o f the changes.
Finally, it should be borne in mind that the welfare simulations are partial equilibrium and do not allow for general equilibrium effects either on the consumption side or on the production side. In this example, in Bangladesh the changes considered in the simulations are very large and general equilibrium effects are l ikely to be quite important: for example, the effects o f a 47% reduction in the wholesale price o f a commodity as important as cement, on other expenditures. These would also need to be considered in a more detailed assessment o f the likely consequences o f an FTA for this sector.
73


India-Bangladesh FTA: Methodology and Selected Case Studies
ANNEX
NOTES ON THE CEMENT INDUSTRIES IN BANGLADESH AND INDIA BANGLADESH
General notes
(Portland) cement i s made by grinding clinker. Clinker i s produced from limestone in capital intensive plants generating heat from various sources e.g. coal, fuel oil, natural gas. Bangladesh does not produce clinker. All the clinker used in cement production i s imported, mostly from Indonesia, Thailand, and Malaysia. Most o f the imported clinker goes to Chittagong and another part to Mongla. At both ports it i s transferred to barges which carry i t up the Bangladesh rivers. Most o f the Bangladesh ceinent plants are situated on rivers so as directly unload the clinker into their plants. The barges carrying clinked go as far as Sylhet in the far north eastem comer o f Bangladesh. There are no clinker imports into Bangladesh through the land borders with India, either in the west or in the north or east. However, the NE Indian states (specifically Meghalaya) have good limestone deposits which could be used for clinker production.
There are about (October 03) about 60 cement grinding plants and approximately the same number o f companies. Total grinding capacity i s about 12 mi l l ion tons, but production only about 6 mil l ion tons. The number o f f i rms and capacity has expanded very rapidly since about 1998/99. Currently about 30 small f i rms (mostly recently established) have closed and are “sick”. Most o f these are too small, with capacity o f only 50-100 tpd (tons per day). With low capacities overhead costs are too high, it’s not possible to maintain quality, and bagging and storage facilities are too small to be efficient. The medium size plants have capacities o f about 1000 tpd, and there are some large internationally scaled plants of 2500 tpd capacity.
At full capacity in a grinding plant, clinker i s about 80-90 percent o f total costs. Labor costs are only about 2%. The rest are some minor raw material costs, energy costs and overhead costs. The principal overhead costs are plant and equipment costs (depreciation, interest and return on capital). If a plant i s operating below full capacity the unit plant costs go up quite steeply. If there i s excess capacity this explains the willingness o f cement f i r m s in India and other countries (but not in Bangladesh) to sell in export markets as long as export prices cover their variable costs. They are generally less willing to cut prices in domestic markets owing to the likely reactions o f competitors. At present prices in Bangladesh are very high by international standards (see below), apparently allowing the larger f i r m s to be profitable even though they are operating at well below full capacity. One o f the f i rms interviewed had 1000 tpd capacity but was operating at only about 500 tpd capacity. However, prices were reported to be coming down e.g. retail prices in the Dhaka area had declined from Tk 230/240 per 50 kg bag in in 1998 to about Tk 215 per bag in October 2003. In addition f i rms are competing by extending credit to buyers, whereas four or five years ago they sold for cash.
Domestic transport costs
Transport costs for both clinker and cement are high relative to production costs and typical ex factory prices. However, Bangladesh has an advantage over most other countries owing to the possibility over most o f the country o f bulk transport using river barges to riverside locations.
All imported clinker i s shipped to the riverside cement plants by barge. The clinker i s transferred to the barges at the ports and i s not landed at the ports. Customs clearance i s done while the clinker i s on the ships. In October 2003 the clinker transport cost from Chittagong to a cement plant on the riverside near Dhaka was Tk 3 10/MT=$5.30/MT approx. This includes transfer from the ship to a river barge.
74
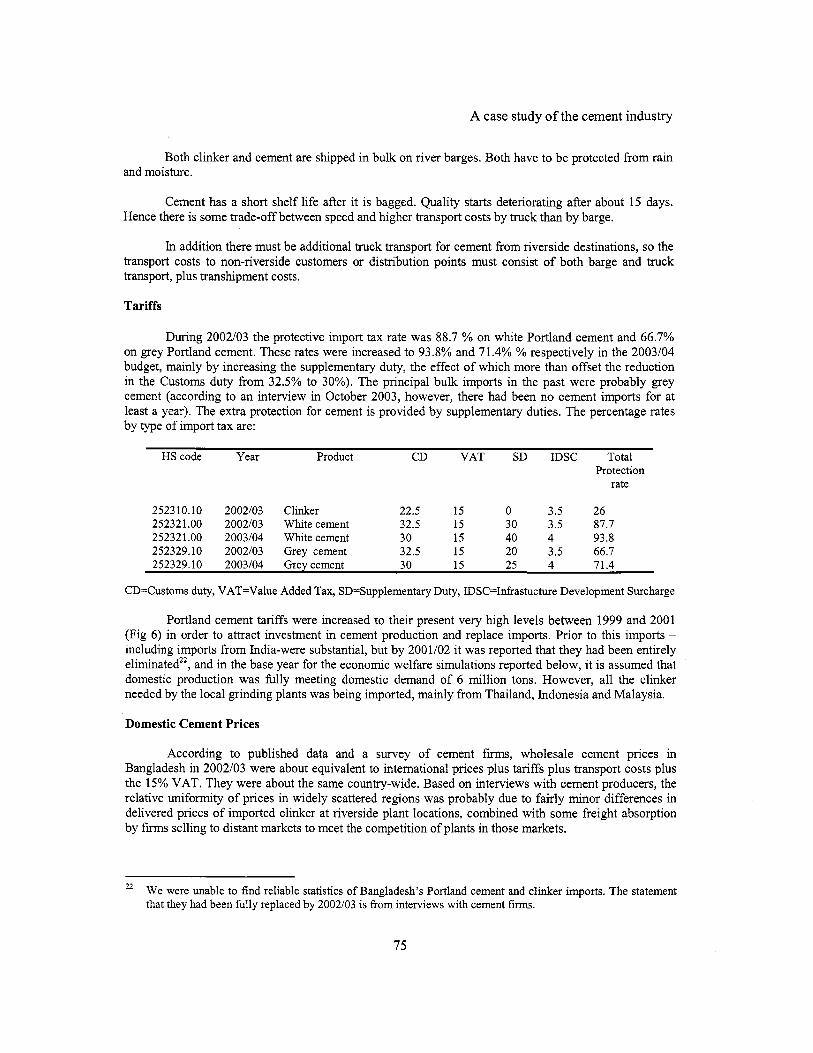
A case study o f the cement industry
Both clinker and cement are shipped in bulk on river barges. Both have to be protected from rain and moisture.
Cement has a short shelf l i fe after it i s bagged. Quality starts deteriorating after about 15 days. Hence there i s some trade-off between speed and higher transport costs by truck than by barge.
In addition there must be additional truck transport for cement from riverside destinations, so the transport costs to non-riverside customers or distribution points must consist o f both barge and truck transport, plus transhipment costs.
Tariffs
During 2002103 the protective import tax rate was 88.7 YO on white Portland cement and 66.7% on grey Portland cement. These rates were increased to 93.8% and 71.4% % respectively in the 2003104 budget, mainly by increasing the supplementary duty, the effect o f which more than offset the reduction in the Customs duty from 32.5% to 30%). The principal bulk imports in the past were probably grey cement (according to an interview in October 2003, however, there had been no cement imports for at least a year). The extra protection for cement i s provided by supplementary duties. The percentage rates by type o f import tax are:
H S code Year Product CD VAT S D I D S C Tota l Protection
rate
252310.10 2002/03 Clinker 22.5 15 0 3.5 26 252321.00 2002/03 Whi te cement 32.5 15 30 3.5 87.7 252321.00 2003/04 Whi te cement 30 15 40 4 93.8 252329.10 2002/03 Grey cement 32.5 15 20 3.5 66.7 252329.10 2003/04 Grey cement 30 15 25 4 71.4
CD=Customs duty, VAT=Value Added Tax, SD=Supplementary Duty, IDSC=Infrastucture Development Surcharge
Portland cement tariffs were increased to their present very high levels between 1999 and 2001 (Fig 6) in order to attract investment in cement production and replace imports. Prior to this imports - including imports from India-were substantial, but by 2001/02 it was reported that they had been entirely eliminated”, and in the base year for the economic welfare simulations reported below, it i s assumed that domestic production was f i l ly meeting domestic demand o f 6 mi l l ion tons. However, a l l the clinker needed by the local grinding plants was being imported, mainly from Thailand, Indonesia and Malaysia.
Domestic Cement Prices
According to published data and a survey o f cement f m s , wholesale cement prices in Bangladesh in 2002103 were about equivalent to international prices plus tariffs plus transport costs plus the 15% VAT. They were about the same country-wide. Based on interviews with cement producers, the relative uniformity o f prices in widely scattered regions was probably due to fairly minor differences in delivered prices o f imported clinker at riverside plant locations, combined with some freight absorption by f i rms selling to distant markets to meet the competition o f plants in those markets.
*’ W e were unable to find reliable statistics o f Bangladesh’s Port land cement and c l inker imports. The statement that they had been fully replaced by 2002103 i s from interviews with cement firms.
75

India-Bangladesh FTA: Methodology and Selected Case Studies
Border prices o f clinker and cement
According to a fm interview clinker transport costs from Indonesia in during 2002 until April 03 werl about $8-$10/MT and c i f prices of cl inker were about $30/MT. International cement prices were reportel to normally be very close to international clinker prices i.e. margins are narrow. Based on fob unit values of Indian cement exports to S r i Lanka in 2002/03, and adding freight and estimated river barge transport costs gave an estimated delivered price of cement to riverside grinding plant locations o f $36/MT which i t was decided to use in the in the economic welfare simulations.
When Indian cement was imported in the past, i t mainly came by sea going barges from Kolkata which went directly up the Bangladesh rivers. Higher fob unit values of Indian cement exported to Bangladesh during that period compared with fob unit values o f Indian exports to other markets (e.g. Africa) suggested that Indian exporters had lower overall shipping costs than exporters from Indonesia, Thailand etc and were able to absorb some of that saving in higher fob prices. Based on this a freight advantage for Indian exports to Bangladesh was incorporated in the welfare simulations.
Bangladesh export supply pr ice
Using data from a Chittagong grinding factory, and allowing for the approximate duty drawback on imported clinker, i t was estimated that to be equally profitable exporting as selling domestically, Bangladesh firms would have to sel l their exports for about $US 60 =Taka 3469iMT
This i s far above prevailing international cement prices ... about double, and also well above Indian domestic ex-factory prices. Therefore using imported c l inker and the present cement plants i t would not be possible to export cement from Bangladesh profitably. Therefore with an India-Bangladesh FTA there would be no Bangladesh exports to India, at least not by sea from existing plants. Even if the Bangladesh industry were to restructure with capacity utilization increasing and processing costs coming down considerably, profitable exports to India by sea would be unlikely because of the cost disadvantage resulting from reliance on imported clinker. Even with internationally competitive grinding plants in Bangladesh, these additional port and transport costs (say Tk 600-700iMT = $10-$12iMT) exceed the tar i f f advantage that an FTA would give the Bangladesh fm in exporting to India. This i s approximately 25.6 percent of the estimated c i f price (see India discussion) =$36*0.256=$9.20 approximately.
An exception to th is could be Bangladesh exports to the Indian NE states, especially from grinding plants near Sylhet in the north east (e.g a new plant being built by the French multinational Lafarge ), especially if clinker were produced based on limestone imports from these states. Cement prices in these states are reportedly high owing to the very high trucking transport costs from the rest o f India via the “Chicken’s Neck” route in northern India.
Border prices of cement TakalMT Dhaka wholesale price Tk/MT (assume includes all taxes) 4665 Less est cement transport cost ship to Dhaka -700
3965
3569 1689 29.4
Price excl transport cost to Dhaka Less wholesaler margin 10% -397 Landed cost incl import duties Approx cif price: Deflate by protective import duty+VAT 11 2.8% Equiv to cif $ price ($l=Taka 57.4)
I Cross check: unit values of Indian exports (HS 252329 other Portland cement):
$/MT
To Sri Lanka 2001-02 fob (large volumes) To Sri Lanka 2002-03 fob large volumes To Nigeria 2001-02 Large volumes To Nigeria 2002-03 Large volumes
26.8 25.7 25.4 22.8
76

A case study o f the cement industry
INDIA
General notes
India appears to be a low cost cement producer by world standards. It i s exporting about 3 mi l l ion tons annually. This i s less than 3 percent o f i t s total production (over 100 mil l ion tons), but about hal f Bangladesh's total production. Cement production in India i s fully integrated, using domestic limestone deposits and fuels (mainly coal and fue l oil) to produce clinker and then cement. Imports are negligible.
Domestic transport costs
As in Bangladesh and throughout the world, these are undoubtedly high relative to production costs and wholesale prices. Cement and clinker plants are probably located so as to mimimise total costs including transport costs taking account o f local demand densities, scale economies and other factors affecting costs. No information on transport costs i s provided in the NCAER study. These would be needed to estimate the welfare consequences if under an FTA Bangladesh would export cement to India, but exports to the principal Indian markets from Bangladesh seem to be ruled out by the much higher costs and prices in Bangladesh.
However, some Bangladesh exports to the NE Indian states may occur with an FTA and some has apparently taken place recently after paying normal tariffs. T h i s i s because transit across Bangladesh by Indian trucks i s not permitted, and so Indian cement i s carried by truck across the "chickens neck" area of northern India, leading to high cement prices in these states. On the other hand it seems there are ample limestone deposits in these states wi th proposals that the limestone could be processed if clinker plants were established nearby across the border in Bangladesh. The clinker could be processed in Bangladesh and the cement sold in Bangladesh and exported back to India. There was not enough information to deal wi th this possibility in the present study, however.
Domestic prices
According to the NCAER survey, these were (Sept -October 2002 in Kolkata) Rs 2 2 8 8 M T wholesale and Rs 2675MT retail. Cement prices in other regions are not provided.
Ex-factory prices
Indian domestic ex-factory prices are needed to judge whether Bangladesh exporters are l ikely to be competitive in India wi th an FTA or a PTA. The assumption here i s that they include only long run "normal" profit, so that there wouldn't be much scope for cutting prices in the face o f import competition from Bangladesh, at least in the long run (efficiency and cost reduction changes might occur, however). Domestic ex-factory prices are also a first step towards the estimation o f long run export supply prices i.e. the prices at which Indian exporters would be wil l ing to supply export markets profitably o n a long run basis. The main differences between domestic ex-factory prices and export supply prices are export incentives (e.g. drawback etc) that are paid on exports (deducted from the domestic ex-factory price) and costs that are or would be incurred in exporting but not when selling domestically e.g. port and Customs clearance costs. The purpose i s to arrive at an fob price that would be profitable on a long run basis for Indian producers. In the case o f cement, India i s a large exporter, and unit values o f exported cement provide an indication o f actual export prices fob which are a cross check on inferred export prices. In interpreting differences between inferred long run export supply prices and actual export prices, it should be recognized that it may be quite rational for f m s to export at prices exceeding average variable costs but lower than average total costs, especially in capital intensive industries wi th excess capacity. Cutting
77
India-Bangladesh FTA: Methodology and Selected Case Studies
prices domestically to use excess capacity may invite retaliation, whereas prices in international markets often reflect excess capacity in other countries which have to be met in order to export at all.
For cement, assuming the wholesale price o f Rs 2288/MT does not include transport and other distribution costs and i s from the cement factory (1.e. assuming no independent cement wholesalers.. .wholesaling i s done by the cement producers) the inferred ex-factory price is: wholesale price-sales tax-excise tax= Rs 2288-298=1990-274=1716/MT=17 16/47.7=$36/MT approx.This i s wel l below the estimated supply price from Bangladesh, suggesting that there i s n o possibility o f exports o f cement from Bangladesh to India wi th an FTA. As noted above, a possible exception to this would be Bangladesh exports to the Indian NE states from plants near the border, using limestone imported to Bangladesh from these states.
As noted previously it i s not known to what extent and where (at the manufacturing, wholesale, retai l levels??) domestic transport costs affect Indian cement prices. In Bangladesh average domestic transport costs included in Bangladesh ex-factory prices was estimated at about $13/MT. Given the large scale o f the Indian industry and the large f i rms involved, it i s plausible that distribution is considerably more efficient and involves lower costs on average. Assuming freight absorption with say $10/MT (Rs 477MT) added to ex-factory prices, ex-factory prices excluding distribution costs would be about $ 2 6 N T . T h i s i s close to apparent Indian export prices fob, suggesting that the Indian industry i s pricing domestically at close to world export prices This in turn suggests that Indian tariffs (in 2003104 30.8%..see below) are probably redundant Le. domestic prices are well below c i f prices plus tari f fs, suggesting that there would be no or few cement imports wi th much lower or even zero tariffs.
Border prices
World prices during 2001-02 appeared to have been around $22-$27/MT. Some relevant observations: Inferred c i f price Dhaka o f imported cement (see Bdesh notes) $24.60 Indian export unit values fob 2001102 $22.8 to $26.8 Inferred c i f price assuming domestic producers use al l available tariff protection. Assuming Indian ex- factory prices near a port are $36/MT Deflating this by protective tariff in 2002/03 (CD+SAD) o f 36% gives $26.50/MT
Further allowing for port costs (say $10/MT vs $13/MT in Bdesh) would take the implied c i f price far below the observed unit values for exports. Using an Indian ex-factory price o f $26/MT (on the assumption that ex-factory prices include averaged domestic transport costs) already brings the Indian price to about the world price level. Conclusion: Indian domestic ex-factory prices are about equal to world prices. Hence Indian tariffs are redundant.
78

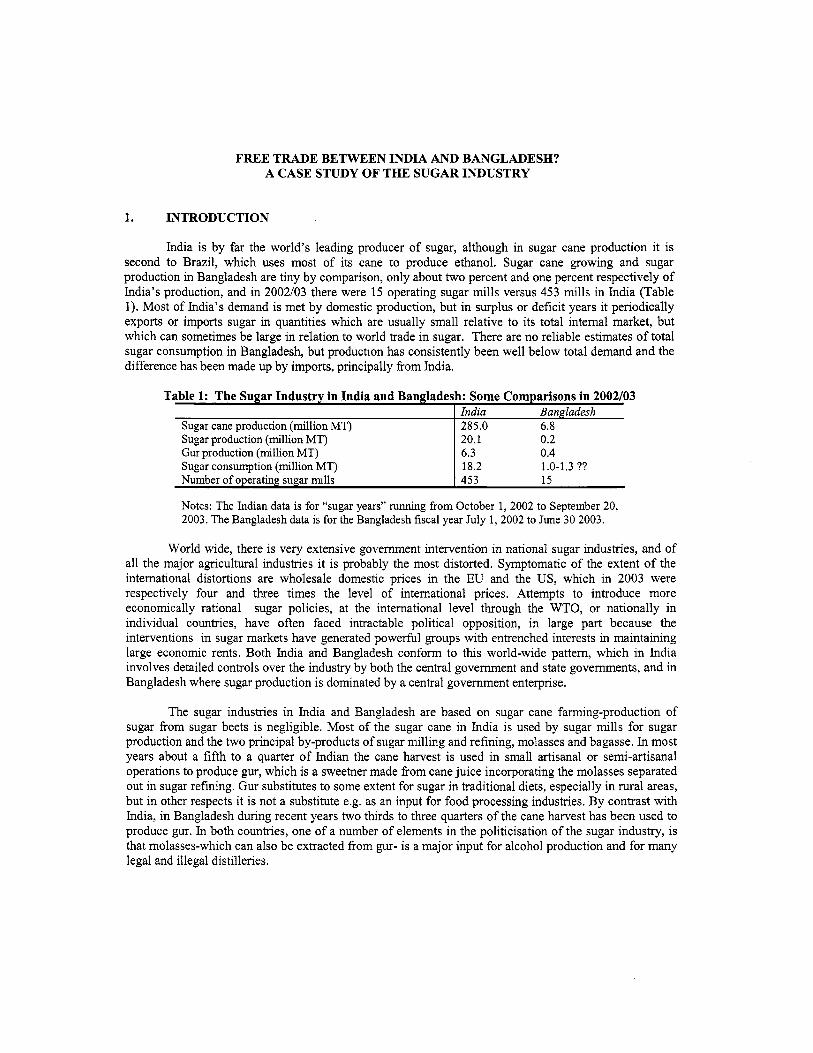
FREE TRADE BETWEEN INDIA AND BANGLADESH? A CASE STUDY OF THE SUGAR INDUSTRY
Sugar cane production (million MT)
Gur production (million MT)
Number of operating sugar m i l l s
Sugar production (million MT)
Sugar consumption (million MT)
1. INTRODUCTION
India Bangladesh 285.0 6.8 20.1 0.2 6.3 0.4 18.2 1.0-1.3 ?? 453 15
India i s by far the world’s leading producer o f sugar, although in sugar cane production it i s second to Brazil, which uses most o f i t s cane to produce ethanol. Sugar cane growing and sugar production in Bangladesh are tiny by comparison, only about two percent and one percent respectively o f India’s production, and in 2002/03 there were 15 operating sugar mills versus 453 mills in India (Table 1). Most o f India’s demand i s met by domestic production, but in surplus or deficit years it periodically exports or imports sugar in quantities which are usually small relative to i ts total internal market, but which can sometimes be large in relation to world trade in sugar. There are no reliable estimates o f total sugar consumption in Bangladesh, but production has consistently been well below total demand and the difference has been made up by imports, principally from India.
World wide, there i s very extensive government intervention in national sugar industries, and o f al l the major agricultural industries it i s probably the most distorted. Symptomatic o f the extent o f the international distortions are wholesale domestic prices in the EU and the US, which in 2003 were respectively four and three times the level o f international prices. Attempts to introduce more economically rational sugar policies, at the international level through the WTO, or nationally in individual countries, have often faced intractable political opposition, in large part because the interventions in sugar markets have generated powerh l groups with entrenched interests in maintaining large economic rents. Both India and Bangladesh conform to this world-wide pattern, which in India involves detailed controls over the industry by both the central government and state governments, and in Bangladesh where sugar production i s dominated by a central government enterprise.
The sugar industries in India and Bangladesh are based on sugar cane farming-production o f sugar from sugar beets i s negligible. Most o f the sugar cane in India i s used by sugar mills for sugar production and the two principal by-products o f sugar mil l ing and refining, molasses and bagasse. In most years about a fifth to a quarter o f Indian the cane harvest i s used in small artisanal or semi-artisanal operations to produce gur, which is a sweetner made from cane juice incorporating the molasses separated out in sugar refining. Gur substitutes to some extent for sugar in traditional diets, especially in rural areas, but in other respects it i s not a substitute e.g. as an input for food processing industries. By contrast with India, in Bangladesh during recent years two thirds to three quarters o f the cane harvest has been used to produce gur. In both countries, one o f a number o f elements in the politicisation o f the sugar industry, i s that molasses-which can also be extracted from gur- is's major input for alcohol production and for many legal and illegal distilleries.

India-Bangladesh FTA: Methodology and Selected Case Studies
Depending on relative prices, sugar normally accounts for about 90 to 95 percent o f the sales o f a typical sugar mill and molasses and bagasse for about 5 to 10 percent only. Gur sells at a fairly consistent discount from sugar -in both India and Bangladesh about 10-20 percent, and sugar and gur prices are quite highly correlated. In addition to mill sugar, smaller scale unregulated mil ls in India produce “khandsari” using similar techniques, and some hnds o f khandsari sugar are reported to achieve quality levels that make it difficult to distinguish from good quality mill sugar. However, reliable statistics on Indian khandsari production are lacking (khandsari and gur production statistics are often lumped together), and it seems that khandsari or i t s equivalent i s not produced in Bangladesh.
The abundance o f very low wage labour in India and Bangladesh-both in farming and processing- give them a marked cost advantage over the sugar industries in other sugar producing countries. But other elements are also important for efficiency and international competitiveness, in particular the quantity o f sucrose that i s extracted from the cane. At present average extraction rates in India are around 10.5 percent, but in Australia and Brazil they are approximately 14 percent. The determinants o f extraction rates include the nature and quality o f the cane that i s planted, farming techniques, scheduling o f cane cutting and delivery to mills23, and mil l ing processes. Processing costs are also heavily influenced by the length o f the crushing season, since for given total production, unit costs will be lower in a smaller capacity mill that works for more o f the year than in a larger capacity mill that would be needed to crush the cane during a shorter crushing season. Since cane growing i s very water intensive, the vital importance o f a reliable supply o f cane and reliable and predictable delivery times to mills, means that weather conditions and the quality and cost o f irrigation are key determinants o f production costs. Most Indian cane production i s irrigated, but the water i s priced far below i t s opportunity cost, and this i s a major issue in thinking about the long term h tu re o f the industry.
This paper discusses the Indian and Bangladesh sugar industries in the context o f a possible free trade agreement (FTA) between the two countries. The next section (section 2) summarizes some principal features o f the Indian industry and Indian economic policies-especially trade policies-which have affected i t in recent years, and this i s followed in section 3 by an account o f the situation in the Bangladesh industry. Section 4 discusses Bangladesh’s sugar imports from India, in particular the large scale trade in smuggled sugar. Sections 5 outlines the state o f the industry during Bangladesh’s FY 03, which i s the base scenario for subsequent simulations o f the l ikely impact o f various pol icy changes. During t h s year, India was subsidizing i t s sugar exports and in Bangladesh sugar imports had been opened up to private importers for part o f the year, but BISFC s t i l l retained i t s monopoly over sugar milling. Starting from this, sections 6 and 7 discuss some possible economic welfare consequences for the industry, o f an FTA between India and Bangladesh based on some simplified, stylized partial equilibrium models. Using the same 2002/03 base scenario, section 8 compares the gains and losses to the various affected groups under an FTA, with unilateral cuts (including a cut to zero) in Bangladesh’s sugar tariffs. Section 9 discusses, and provides some speculative numbers, on how an FTA is l ikely to affect smuggling, and how the prior existence o f smuggling i s likely to affect the economic welfare outcomes o f an FTA. Finally, section 10 summarizes some o f the implications o f this analysis for ongoing discussions on potential free trade arrangements, both bilateral and under SAFTA.
23 The sucrose content of sugar cane starts to decline after 24 hours o f i ts being cut. Therefore detailed planning of both planting and harvesting t imes i s required.
80

A Case Study o f the Sugar Industry
2. THE INDIAN INDUSTRY: STRUCTURE, POLICIES AND RECENT DEVELOPMENTS
There i s a very extensive literature on most aspects o f the Indian sugar cane and sugar processing industries. This section summarizes a few principal features o f the industry which seem to be relevant in considering the possibility o f free trade in sugar and sugar products between India and Bangladesh. More detail can be found in studies o f the economics o f the industry and in various official and other reports. 24
Structure A t present there are about 507 officially recognized sugar mi l l s , o f which 174 are private, 33 public sector, and 300 cooperatives with farmer participation. The cooperatives are mostly in the Maharashtra. According to the Indian Sugar Mills Association (ISMA) in mid 2004 only 461 o f the 507 mills were operating. Most o f the non-operating mills are in Indian terminology “sick” i.e. bankrupt and not producing, but kept open with payments to their workforces through workmg capital infusions from government banks and/or state government subsidies. About 16 o f the sick mills are owned by a UP government state enterprise.
Most licensing controls over expansion and the establishment o f new mills were removed during the 1990s (see below) and there have been a number o f takeovers and mergers in recent years. A number o f sugar producers are public companies listed on Indian stock exchanges, but a large number -notably in Maharashtra- are grower owned cooperatives. Industrial concentration i s very low: for example, the market share o f the company with the largest sales among 126 sugar companies analyzed by CMIE in 2002/03 was only 2.48%:’ I t seems highly unlikely that-absent government intervention- any individual company or group o f companies would have any market power in selling sugar, although individual mills may have considerable market power with respect to the sugar cane farmers in their allotted areas.
During the mid 1980s approximately ha l f o f the sugar cane harvest was purchased and crushed by the regulated sugar mill sector, and hal f used by the unregulated gur and khandsari producers. According to ISMA, the regulated mills are now consuming about two thirds o f the cane and the share o f the gur and khandsari producers i s about one-third. This partly reflects increased demand for sugar relative to gur as l iv ing standards have r isen. Per capita sugar consumption (which includes industrial use in the food processing and other industries26) has increased from about 11 k g /person in the mid 1980s to about 15.5 kgiperson in 2004, whereas combined gur and khandsari consumption has declined from about 11 kgiperson to 9.8 kgiperson in 2004.2’
About 60 percent o f India’s mill sugar is produced in Maharashtra and UP, and nearly al l the rest in Tamil Nadu, Karnataka, Gujarat and Andhra Pradesh, none o f which have borders wi th Bangladesh. There i s not much sugar production in West Bengal, Bihar or the Indian eastern and north-eastern states. However both sugar and gur are traded nation-wide and road transport costs are l ow relative to their value, so that distance from India’s sugar producing areas i s unlikely to be a deterrent to cross border trade when there are substantial price differences.
For the period up to 1994 see in particular Goldar and Gulati (1991), Kalra and Gulati (1992), Bore11 (1991), Pursell and Gupta (1998), Mahajan Committee Report (1998), and Ahluwalia and Gulati (1999) Some more recent studies and reports are Gulati, Pursell and Mul len (2003), U S D A (2003), Directorate o f Sugar (2004), and Indian Sugar Mills Association (2004).
According to one study (India Infoline (2004)) about 75% o f open market sugar i s consumed by bulk buyers such as bakeries, candy and sweet makers, and soft drink manufacturers. Available statistics do not distinguish gur and khandsari production and consumption. As khandsari i s a slightly lower quality sugar and substitutes closely for regulated mill sugar, i t i s plausible that the total sh i f t away f rom gur has been greater than this.
24
*’ CMIE (2004, July) 26
2’
81
India-Bangladesh FTA: Methodology and Selected Case Studies
Government controls and policies. In the past the operations o f Indian sugar mill sector was subject to very detailed government regulation and controls. During the past 15 years or so these controls have been gradually relaxed, and the industry-although s t i l l constrained in important respects-is freer than it was in the past. Some o f the principal government interventions and policies are the following:
Industrial licensing and other industrial Dolicies. During the 1980s and before, like al l other large scale industries, sugar mil ls were subject to the industrial licensing regime which regulated new entry, set maximum production capacities, and controlled expansion investments. There were also rules which reserved specified cane growing “catchment areas” for individual mills, obliged the sugar mills to buy al l the cane delivered to them by farmers in their designated area at prices n o lower than annually announced minima, and prevented competition in cane purchasing in these areas from other sugar mills. In 1990 the licensing controls over capacity expansion by existing mills was removed, and in August 1998 licenses were no longer required from new sugar mills. However, the “catchment area” regulations have been retained, and new mills, although they can be established without f i rst obtaining a license, must establish themselves at least 15 la from existing mills.
After 1975, the establishment o f new sugar cane mills was subsidized, principally by allowing them a higher “free sale” sugar quota (see below), which effectively meant that they could sel l their sugar at a higher average price than established mills. This practice was discontinued during the 1990s.
Minimum sugar cane prices The central government sets Statutory Minimum Prices (SMPs) for cane that must be paid by the mills2’, but the principal cane producing states set minimum “State Advised Prices” ( S A P s ) which are much higher (in most years by 30 to 50 percent) than the SMPs. In 2002103 the sugar mills were squeezed between the S A P s and falling free market sugar prices, resulting in severe financial difficulties for many mil ls and very large payments arrears for cane farmers. The central government came to the rescue o f the industry and state governments wi th large subsidies, but on condition that the states abandon the S A P s in the future. This condition was challenged in the High Court which found against the central government, so i t seems that the highly political S A P s will be continued in some form. As discussed later, this i s a fundamental issue for the industry which affects al l other policies, including especially trade policies, because it i s the single most important component in the cost or producing sugar, and therefore affects the ability o f the sugar mills to compete with sugar imports and to export.
Price and selling controls for mill sugar. For many years sugar mills have been obliged to supply specified proportions o f their sugar output (known as “levy sugar”) to the Ministry o f Food and C iv i l Supplies, at a controlled low price for resale at l ow prices in the PDS (Public Distribution System). Starting in 2000, the “levy sugar” percentage (which had been 65% in the early 1980s and 40% for most o f the 1990s), was reduced and since March 2002 has been 10%. In February 200 1 the quantities needed for the PDS fair price shops were drastically reduced by confining PDS sugar sales to so called B P L (Below Poverty Level) families29. The balance o f their output (known as “free sale” sugar) can be sold for whatever it will fetch in the private market, but the quantity and timing o f each mill’s sales in this market i s regulated by the government (by the Sugar Controllers’ office). The purpose o f these “release order” controls i s to stabilize the free market price: in periods when production exceeds demand, this essentially means holding back sugar releases in order to support open market prices. Evasion o f these controls by understating production and malung unrecorded free market sales i s one o f the well recognized classic sources o f “black money” in India.
The SMP i s based on a sucrose recovery rate of 8.5% with a scale of premia for higher extraction rates. A 1998 Committee on sugar industry policies recommended that sugar should be removed from the PDS system altogether, but that recommendation has not been followed.
28
29
82

A Case Study o f the Sugar Industry
Sugar trading Sugar i s an “essential commodity” and al l aspects o f the industry can potentially be regulated under the Essential Commodities Ac t (ECA). Until July 2000 E C A was applied to regulate the stocks and turnover o f sugar traders, but these controls were lifted in July 2000 and August 2001. However in June 2003 (see below) ECA was invoked as a de facto import restriction by obliging importers to obtain permission to resel l imported sugar, on the grounds that they compete wi th Indian mills and therefore should be subject to the same “release order” restrictions. By contrast, in 2001 the government allowed futures trading in sugar (previously banned) and as o f M a y 2004 two private exchanges were dealing in sugar futures.
Indirect taxes. Both domestic sugar sales and sugar imports are subject to an excise tax o f Rs 7l/quintal and there i s a “sugar development levy” o f Rs 14/quintal. In principal these two taxes (during 2004 together equivalent to about US 1.8 centskg ) are neutral as between imports and domestic production. They are about 7-9 percent o f c i f import prices o f 20-25 U S centskg, and far lower than the Bangladesh 15% VAT, which i s applied on top o f Customs duties and at these border prices would be approximately equivalent to 5 to 6 centskg. Sugar cane, gur and khandsari are exempt from these or any other indirect taxes, and (together with sugar) are exempt from central and state sales taxes3’. However there are heavy indirect taxes on molasses which i s indirectly a major source o f state government revenue when it i s legally used to produce potable alcohol.
Import policies During the 1980s and before sugar Indian sugar imports were “canalised” by a government controlled import monopoly. Later private sector f i rms were allowed to import, but subject to import licensing. In March 1994, at a time o f high world sugar prices, import licensing was dropped and the tariff reduced to zero (Table 2), and these open import policies remained in place for the next four years3’. In response to declining world prices these policies were reversed in 1998. Between April 1998 and February 2000 tariffs were increased in steps from zero to 60 percent, and in January 1999 discretionary non-tariff restrictions on imports were indirectly introduced through the application o f the Essential Commodities Act to sugar importers. Since September 1998 i t has also been required that sugar imports be notified to AF’EDA32, which monitors them to evaluate their impact on the domestic industry. During the Uruguay Round, India bound i t s sugar ta r i f f s at 150 percent, so there i s n o effective GATT constraint on tari f f levels. Gur tar i f fs are the same as sugar tariffs, and sugar cane and molasses tariffs are currently 15 percent. As already noted, sugar imports are subject to the same domestic indirect taxes as domestically produced sugar, so these do not provide extra protection over and above the tariff. Molasses i s subject to a domestic excise tax when it used for alcohol production.
Export policies
Before India’s trade policy reforms during 1991 and 1992, sugar exports were “canalised” i.e. they were a legal monopoly o f the government trading company, STC33. The 1991/92 reforms “decanalised” sugar exports by allowing sugar to be exported by ISGIEIC34, a company owned by the
30
31
The sugar excise tax is Rs 34lquintal and there is an “Additional Duty o f Excise” o f Rs 37lquintal which substitutes for the central sales tax. During this period India reserved the right to reintroduce QRs on sugar under i t s general pol icy o f applying non- tar i f f restrictions to al l consumer good imports. Th is general policy -which India justif ied under the GATT balance o f payments clause (Article 18 (b))- was dropped for the SAPTA countries in 1998, and finally in April 2001 for the rest o f the world, after India lost a W T O case on i t s use o f this provision. APEDA is the Agricultural and Processed Food Products Export Development Authority. I t i s under the authority o f the Ministry o f Commerce. State Trading Corporation The Indian Sugar and General Export Import Corporation. I t s name was later changed to the Indian Sugar Exim Corporation (ISEC)
32
33
34
83

India-Bangladesh FTA: Methodology and Selected Case Studies
sugar mi l ls , but, as previously, the quantities exported were controlled by the Ministry o f Food and C iv i l Supplies. During
Table 2: Indian Sugar Tariffs and QR Status 1991-2005
Tariffs (raw) YO Tariffs(refined) YO Domestic taxes RsiQtl Q R status 1991 40 60 64 Restricted 1992 40 60 85 Restricted 1993 40 60 85 Restricted 1994 0 0 85 Restricted 1995 0 0 85 Free 1996 0 0 85 Free 1997 0 0 85 Free 1998 0 0 85 Free
Apl98-Jan 99 5 5 85 Free Jan 99-Apl99 20 20 85 E C A Apl99-Dec 99 35 35 85 E C A Dec 99-Feb 00 40 40 85 E C A Feb 00-Mch 00 60 40 85 E C A
200 1 40 40 85 E C A 2002 60 60 85 E C A 2003 60 60 85 E C A 2004 60 60 85 E C A 2005 60 60 85 E C A
Notes: For Indian fiscal years. Protective import duties other than Customs duties have not been applied to sugar, except between January and April 1999 when a general 10% surcharge was also applied to sugar. The domestic taxes are also applied to domestic sugar production and do not provide extra protection against imports to the Indian industry. ECA refers to regulations under the Essential Commodities Ac t which have been applicable to sugar importers since 1999-see text for an explanation. Since April 1998 sugar imports have also been subject to surveillance by APEDA
the period o f the STC export monopoly and while this scheme was operating, when the Ministry judged that there were excess supplies in the domestic market, if necessary sugar was exported at a loss, and the sugar export quotas and losses were allocated between the sugar mills. In January 1997 individual sugar mills and private traders were allowed to export sugar, but the overall level o f exports was s t i l l controlled by the government, and export quotas were allocated by APEDA. In 1999 and 2000, under the stimulus o f the state government mandated minimum prices for sugar cane and favourable growing seasons, very large stocks o f sugar-far in excess o f normal requirements- accumulated, and policy was reversed to actively encourage rather than l imi t sugar exports as a way o f reducing excess stocks and assisting sugar mills which faced severe financial difficulties. This was done in April 2001 by f i rst removing the APEDA- administered export controls, and by introducing and gradually increasing export subsidies for sugar. The export subsidies are:
DEPB3’ at 4% o f the fob value o f the exported sugar Since June 2002, Rs 1000MT for internal transport and freight charges Since February 2003, Rs 3 5 0 M T for ocean freight Since October 2003, Rs 5 0 0 M T for handling and marketing charges
Duty Exemption Pass Book. This i s meant to compensate exporters for import duties on inputs which are used to produce exported products, and increase their cost. The DEPB rate for sugar i s principally on account o f . . . .
35
84

A Case Study o f the Sugar Industry
Raw sugar HS 170111 Refined sugar H S 170199 Gur & khandsari HS 1701 11 Sugar cane H S 12129990 Cane molasses H S 1703 10
Tariff % Domestic taxes NTBs 60 Rs 8514 ECA plus APEDA surveillance 60 Rs 8514 ECA plus APEDA surveillance 60 15 ---- Agriculture permit required
----- -----------
15 Zero or 5014 _ _ _ _ _ _ _ _ _ _ _ _ _ _ _
In addition there i s a small extra subsidy for exporting sugar mills, because the quantities exported reduce the base used for calculating the quantities they are required to sell domestically at the low “levy” price for use in the public distribution system. By exporting, the mills also reduce the interest cost o f any excess sugar stocks they are obliged to hold by the government’s “release order” controls over free market sugar sales. These controls have been employed to fend o f f the downward pressure that the sale o f excess stocks would otherwise exert on domestic sugar prices.
During 2003 and the f i rs t 9 months o f fiscal 2004, India was exporting refined sugar at about U S $220/MT fob. At the average 2004 US dollar exchange rate (about Rs 46l$US) the combined value o f these export subsidies was $49/MT, equivalent to 22.2 percent o f fob prices. This almost exactly accounted for the difference between prevailing domestic “free sale” mill prices at the time (in FY04 approximately $274/ MT) and export prices.
Under the stimulus o f these export promotional measures, substantial sugar exports began in FY 2001 and were continuing during FY 2004. In the 2003104 sugar season36, there was sharp drop (principally weather related) in sugar cane production, and as a result a large cut in sugar production (estimated at around 28% less than the record production in the 2002103 season.. .see discussion below), and this combined with exports to substantially reduce Indian sugar stocks. At the same time it left many sugar mills with unused capacity, even during their normal crushing season. In response, in September 2004, the government arranged for ISEC3’ to import Brazilian raw sugar at zero (instead o f the normal 60 percent) import duties, and this raw sugar was allocated to mills for processing into white refined sugar38. The Brazilian raw sugar was formally imported under India’s “advance licensing” scheme, which permits duty-free imports o f inputs which are used to produce exported products. However, in this case it i s reported that the government i s permitting mills to sell the refined sugar in the domestic market, provided they export an equivalent quantity o f refined sugar within 24 months. As the raw sugar i s duty free, and the domestic market i s protected by a 60 percent tariff, under this arrangement the potentially available effective protection to the processing o f the Brazilian raw sugar i s extremely high. However, as discussed below, actual prices for refined sugar in the domestic market in recent years have been far below import prices plus tariffs, and the actual realized effective protection rates resulting from this arrangement would depend on the extent to which domestic prices diverge from c i f import prices. If raw sugar imports are open without any restrictions, the equilibrium effective protection rate would settle around the effective subsidy rate for exported refined sugar i.e. a rate determined by the duty free condition for the imported
36 In both India and Bangladesh industry production and some other data are reported for “sugar seasons” which run from September to October in the following year. The 2003/04 sugar season i s from the beginning of September 2003 to beginning October 2004. Indian Sugar Exim Corporation (the successor to ISGEIC)
ww w.hindubusinessline.com
31
38 Details o f these arrangements are in Hindu Business Line, September 30, 2004. Available at
85
India-Bangladesh FTA: Methodology and Selected Case Studies
raw sugar, and the approximate export subsidy rate for refined sugar, estimated above to average about 22 percent during FY04.
Subsidies. For many years the sugar industry has been the recipient o f an array o f government subsidies, some very large. These can be broadly classified as follows:
Export subsidies
Input subsidies for sugar cane farming Subsidies for “sick” sugar mills
Ad hoc subsidies to deal with financial crises
The principal input subsidies for sugar cane farming are for fertilizer, canal imgation, electricity for pumpsets, and credit. Because sugar cane cultivation i s very water intensive, by far the largest i s the subsidy resulting from the under pricing o f canal imgation water. None o f the input subsidies are targeted to sugar cane growing, however: they are generally available to India’s agricultural sector. They are a major issue in economic policy, not just for the agricultural sector, but, because o f their size, for central government fiscal policies. They have been analyzed in an extensive literature3’ and are not discussed in this paper. In considering the l ikely consequences o f an FTA between India and Bangladesh, it i s more realistic to treat them as givens, while recognizing that it would be important to work through the l ikely consequences for India-Bangladesh trade (not just in sugar but in agricultural products generally) if major changes were to be made in any o f them at some time in the future.
As noted previously, in mid-2004 46 sugar mills were not operating, and many o f these are being prevented from closing and are subsidized under India’s “industrial sickness” laws4’. Although these policies detract from the efficiency and performance o f the sugar mil l ing industry, the subsidies involved are not large relative to the size o f the industry, and l ike the sugar cane input subsidies, have been taken as a given in discussing India-Bangladesh trade in sugar.
By contrast, as already discussed, India’s export subsidy policies are highly relevant for India- Bangladesh trade, since they are in principle paid on Indian exports to Bangladesh, as wel l as on Indian exports to other countries. These policies are not new, although the current subsidies are more explicit than past subsidies, and their scope and scale are much greater than previously. A major question i s whether they would continue to be paid on Indian exports to Bangladesh, if some kind o f free (or preferential) trading arrangement between India and Bangladesh were to include the sugar industry.
Finally, reflecting very strong political pressures on both state governments (especially the Maharashtra and UP governments) and the central government, large ad hoc subsidies have been periodically paid to the industry in a variety o f forms. The usual trigger i s a combination o f widespread insolvency o f sugar mills and large consequent arrears in the mills’ payments for cane delivered by farmers. In turn, this situation-which has a long history-is the result o f high minimum sugar cane prices mandated by the states, which result in large harvests and high sugar production, which in favourable seasons runs ahead o f demand, causing free market sugar prices to decline and unsold sugar stocks to build up. This squeezes the margins and reduces the liquidity o f sugar mills, which react by delaying
39 For a comprehensive recent discussion, see Gulati and Narayanan (2003). SICA (The Sick Industrial Companies (Special Provisions) Act o f 1985) i s the principal relevant central government law. The sugar industry i s one o f a number o f industries with bankrupt m i l l s being kept alive by “industrial sickness” subsidies. As o f 31 December 2003, 5 1 bankrupt sugar companies with a combined negative net worth o f Rs 332 Crores (approximately $72 million) and 36, 400 employees were registered with the central government’s Board for Financial Reconstruction and Development (BIFR). More information i s on the BIFR website at http:/lbifi.nic.in
40
86

A Case Study o f the Sugar Industry
payments for farmers’ cane. In the most recent episode, which started with the 1999/2000 season, sugar stocks built up to 11.6 mi l l ion MT at the end o f the 2002/03 season, far in excess o f what i s needed to meet normal consumption during the off-season period. In April 2004, the financial pressure on sugar mills was such that arrears in payments to cane farmers for the 2003/04 season (valued at the central government’s minimum SMP price, not at state governments’ much higher S A P prices) were Rs 1987 Crores (about $US 430 million), equivalent to 22 percent o f the total payments due to them4’. In reaction to this situation, in addition to the export subsidies already mentioned, the central government:
Established a buffer stock policy, under which sugar mil ls were paid approximately $1 70 mi l l ion in calendar 2003, and will be paid another $170 mi l l ion approximately in calendar 2004, provided they use the money to pay o f f cane farmer arrears. Announced that it would pay o f f sugar cane arrears o f private sector mills in U P and four other states, covering the difference between the state SAP prices and the lower central government SMP prices. The subsidy i s in the form o f a soft loan o f about $150 million. Permitted state governments to undertake additional market borrowing which would finance soft loans to sugar mills at 4%, with the difference between this rate and the coupon rate on the state government bonds covered by a central government subsidy.
Although these subsidies seem large in absolute terms, they are modest in relation to the scale o f the Indian sugar industry. For example, for the 2003104 seasons, the f i rst two subsidies together amount to about $320 million: this i s around 10 % o f the approximate value o f sugar production valued at wor ld prices (about $3.2 billion) and about 16% o f the value o f sugar cane production valued at the central government’s statutory minimum price (roughly $2 billion). As in the past, modest increases in sugar prices in the domestic market which are unconstrained by world sugar prices given the present 60% tariff, would at least temporarily eliminate the pressures for the continuation o f the subsidies. However, in the longer run, unless the minimum S A P prices for cane mandated by the states are either abandoned or moderated, it i s likely that the recent episode w i l l be repeated in the future.
Production and trade. Since the early 1990s Indian sugar cane production has fluctuated between about 220 and 300 mil l ion tons, wi th a very slight upward trend (Fig 1). However, mill sugar production has grown rapidly, from around 10-12 mi l l ion tons in the early 1990s to 17-20 mi l l ion tons since 2000 (Fig 2). This change reflects the shift o f consumption away from gur to refined sugar already mentioned, which has meant that the share o f the sugar cane harvest used to produce refined mill sugar has increased. Most o f the increase in total sugar consumption has occurred since 1994 and i s associated with a steady and substantial decline in domestic sugar prices during this period. In U S dollar terms, average wholesale prices (including indirect taxes) came down by about a third, from around 42 centskg in 1994 to approximately 27 centskg in 2003 (Fig 3). In constant Rupees, the decline was even greater, about 39 percent between 1994 and 200442. F ig 3 also tracks an estimate o f average mill “free sale” prices, which are lower than wholesale prices by indirect taxes and an estimated 3% wholesale margin. These prices came down at almost the same rate as wholesale prices, indicating that falling indirect taxes (which during this period remained fixed in nominal terms at Rs Wquintal-see Table 2- and which therefore fe l l in real terms) were only a negligible reason for the decline in wholesale prices.
Although sugar production has been on a marked upward trend for the past 15 years, it has also been strongly cyclical, with three periods (1991-94, 1995-1998, and 1999-2004) in each of which expansion was followed by contraction. As discussed previously, the expansionary phases o f these
4’
42 These and the following information on subsidies are from Directorate of Sugar (2004) The average nominal Rupee price declined slightly between 2003 and 2004. The increase in the U S dollar price shown in Fig 3 i s due to appreciation of the Indian Rupee/dollar exchange rate in this year.
87

episodes were ted cane pnces which Icd to ~ncrcased eanc axid sugar ~ r ~ ~ ~ u ~ t i o n , with the e ~ ~ ~ n s ~ ~ n o f sugar p r ~ d u e ~ ~ ~ n overtaking demand growth e resulting decline ~n sugar prices typically lcads to financial $ ~ ~ ~ ~ e ~ c y 111 the milis an for fdmcrs’ cane, In
ers divert eanc to gur and ~ ~ n d s ~ ~ pxodu ane production. This i s follnwed by reduced sugar ~ r ~ ~ ~ c ~ ~ o ~ , ~ C T C ~ S ~ S in sugar prices, more I i ~ ~ ¶ ~ i ~ y r i i the milis,
t o f cane fame, arrears, increased cane deliveries to the mills, and e \ ~ ~ ~ ~ u a l l y the ~ o ~ ~ e ~ e e ~ e ~ ~ ~ of the ~ ~ ~ a ~ ~ ~ ~ n a ~ phase o f a new cycle.
Fig 1 India: Sugar Cane ~ r ~ d u ~ ~ ~ o n 1981 -2004
5 r .- - - iii
1991 1992 1993 1994 1995 1996 1997 1998 1999 2000 2009 2002 2003 2004
300
2 55
200
150
100
55
0
. . _ _ _ -
India: Mil1 Sugar Production and C Q n ~ u ~ ~ ~ ~ ~ n 1991-2004
i
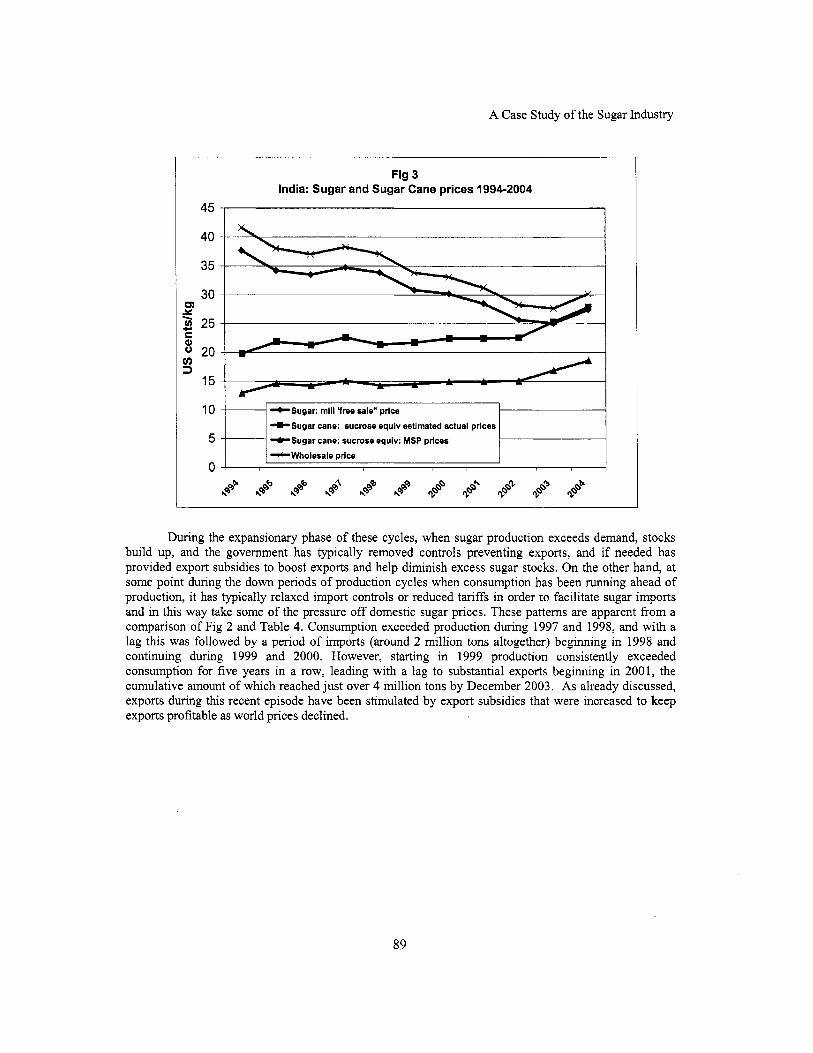
A Case Study o f the Sugar Industry
10
5
0
Fig 3 India: Sugar and Sugar Cane prices 1994-2004
- *Sugar: mill Wee sale" price +Sugar cane: sucrose equiv estimated actual prices +Sugar cane: sucrose equiv: MSP prices ++Wholesale price
45 I i
40
35
30
5 c 25 0
E
rn 3 E 20
15
During the expansionary phase o f these cycles, when sugar production exceeds demand, stocks build up, and the government has typically removed controls preventing exports, and if needed has provided export subsidies to boost exports and help diminish excess sugar stocks. On the other hand, at some point during the down periods o f production cycles when consumption has been running ahead o f production, it has typically relaxed import controls or reduced tariffs in order to facilitate sugar imports and in this way take some o f the pressure o f f domestic sugar prices. These patterns are apparent from a comparison o f F ig 2 and Table 4. Consumption exceeded production during 1997 and 1998, and with a lag this was followed by a period o f imports (around 2 mil l ion tons altogether) beginning in 1998 and continuing during 1999 and 2000. However, starting in 1999 production consistently exceeded consumption for five years in a row, leading with a lag to substantial exports beginning in 2001, the cumulative amount of which reached just over 4 mil l ion tons by December 2003. As already discussed, exports during this recent episode have been stimulated by export subsidies that were increased to keep exports profitable as world prices declined.
89

India-Bangladesh FTA: Methodology and Selected Case Studies
From the mid 1970s until 1994 in real terms average mill selling prices for sugar (i.e. the weighted average o f the sugar sold at the controlled l ow l e v y price and the “free sale” sugar sold in the open market) in India remained about the same with only minor year to year fluctuation^^^. During this period import and export controls insulated the domestic market from large swings in world sugar prices, especially in the mid 1970s’ and early 1980s when there were big spikes in world prices, and from 1982 to about 1988 when world prices were well below domestic prices. Starting in about 1994, however, there was a major break with the past, and for the past 10 years domestic free market prices in India have closely tracked international prices, which have steadily declined over this period. In 2004, in constant Rupees, the mill ‘‘free sale” price was about 40 percent lower than it had been in 1994, corresponding to an almost exactly equivalent decline in c i f import prices expressed in real Rupees. Because o f Rupee appreciation after 2003, the decline expressed in U S centskg i s somewhat less-about 30%-but s t i l l very substantial.
For comparability with Bangladesh, F ig 4 shows these trends with prices expressed in nominal U S centskg, and with the Indian free sale mill prices compared to (a) a constructed series o f c i f import prices for “plantation white” refined sugar4, and (b) Bangladesh import unit values for refined sugar, which include a sometimes large component o f sugar imports from India. During 1997 and after the Bangladesh unit values (which are the averages o f actual transactions recorded at Customs) were lower than the prices in the estimated border price series, and also consistently lower -usually by about 20%- than domestic free sale prices. T h i s suggests that the constructed border price series may be somewhat overstating relevant border prices in the South Asian region, and that India’s policies have been providing some modest protection to domestic free market prices. However, as noted previously, Indian mills are taxed by low prices paid for compulsory delivery o f “ levy sugar”, and allowing for this, actual average prices realized by the mills -especially before 2000 when the l e v y percentage was 40%-have been considerably below the free market prices, and probably as l o w as, or below, the Bangladesh import unit values during the 1990s. Ths i s important, because it suggests that Indian mills that were profitable during these years were internationally competitive at c i f import prices o f around U S 25 centsikg and perhaps less, even though they were being squeezed by sugar cane prices that were inflexible downwards owing to the state governments’ minimum prices for cane.
43
44 Pursell and Gupta (1998) T h i s series i s an estimated price for “plantation white”: sugar, which i s the principle variety o f refined sugar produced in India: for details see Goldar and Gulati (1991) and Pursell and Gupta (1998). The series i s based on Caribbean raw sugar prices c i f Europe plus a refining margin and estimated freight to India. I t was needed to compare Indian domestic prices with international prices, because in many years there were no imports.
90
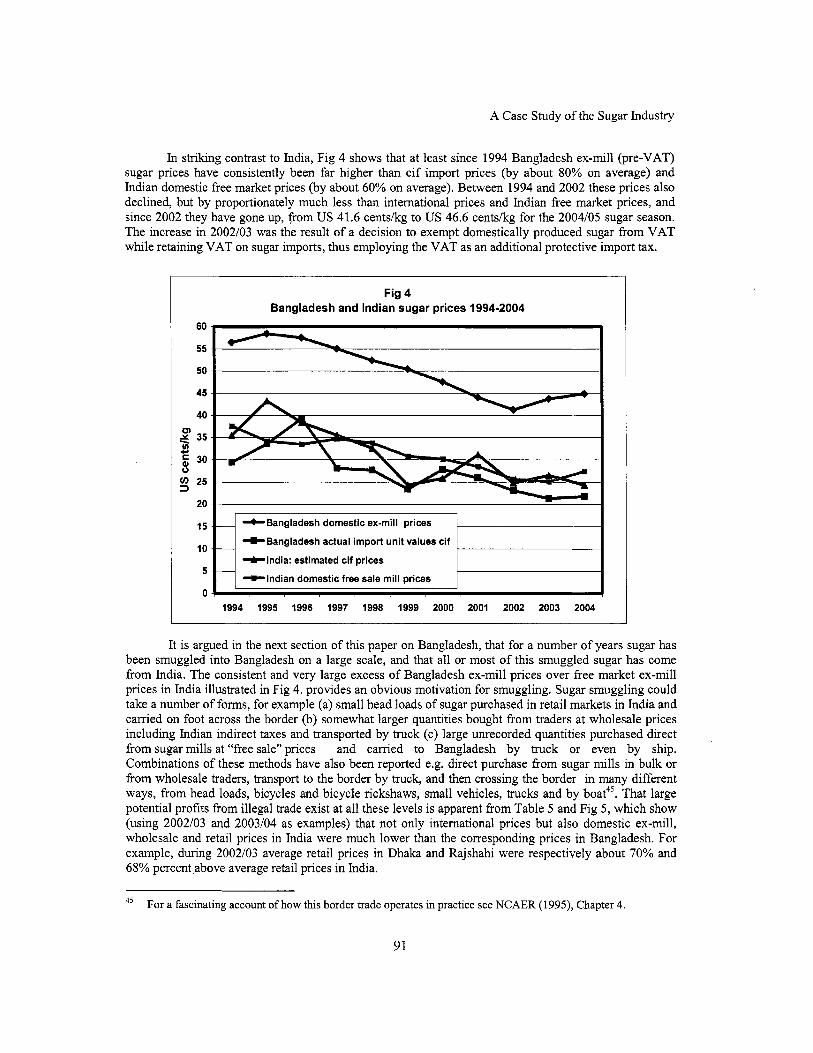
A Case Study o f the Sugar Industry
In striking contrast to India, F i g 4 shows that at least since 1994 Bangladesh ex-mill (pre-VAT) sugar prices have consistently been far higher than c i f import prices (by about 80% on average) and Indian domestic free market prices (by about 60% on average). Between 1994 and 2002 these prices also declined, but by proportionately much less than international prices and Indian free market prices, and since 2002 they have gone up, from U S 41.6 centskg to U S 46.6 centskg for the 2004/05 sugar season. The increase in 2002/03 was the result o f a decision to exempt domestically produced sugar from VAT while retaining VAT on sugar imports, thus employing the VAT as an additional protective import tax.
Fig 4 Bangladesh and Indian sugar prices 1994-2004
60
55
50
45
40
I 2 35 ul 5 30 0
25 3
CI
+Bangladesh actual import unit values cif
+India: estimated cif prices
-Indian domestic free sale mill prices
1994 1995 1996 1997 1998 1999 2000 2001 2002 2003 2004
It i s argued in the next section o f this paper on Bangladesh, that for a number o f years sugar has been smuggled into Bangladesh on a large scale, and that al l or most o f this smuggled sugar has come from India. The consistent and very large excess o f Bangladesh ex-mill prices over free market ex-mill prices in India illustrated in F ig 4. provides an obvious motivation for smuggling. Sugar smuggling could take a number o f forms, for example (a) small head loads o f sugar purchased in retail markets in India and carried on foot across the border (b) somewhat larger quantities bought from traders at wholesale prices including Indian indirect taxes and transported by truck (c) large unrecorded quantities purchased direct from sugar mills at “free sale” prices and camed to Bangladesh by truck or even by ship. Combinations o f these methods have also been reported e.g. direct purchase from sugar mills in bulk or from wholesale traders, transport to the border by truck, and then crossing the border in many different ways, from head loads, bicycles and bicycle rickshaws, small vehicles, trucks and by boat4’. That large potential profits from illegal trade exist at al l these levels i s apparent from Table 5 and F ig 5, which show (using 2002/03 and 2003/04 as examples) that not only international prices but also domestic ex-mill, wholesale and retail prices in India were much lower than the corresponding prices in Bangladesh. For example, during 2002/03 average retail prices in Dhaka and Rajshahi were respectively about 70% and 68% percent above average retail prices in India.
45 F o r a fascinating account o f how th is border trade operates in practice see NCAER (1995), Chapter 4.
91
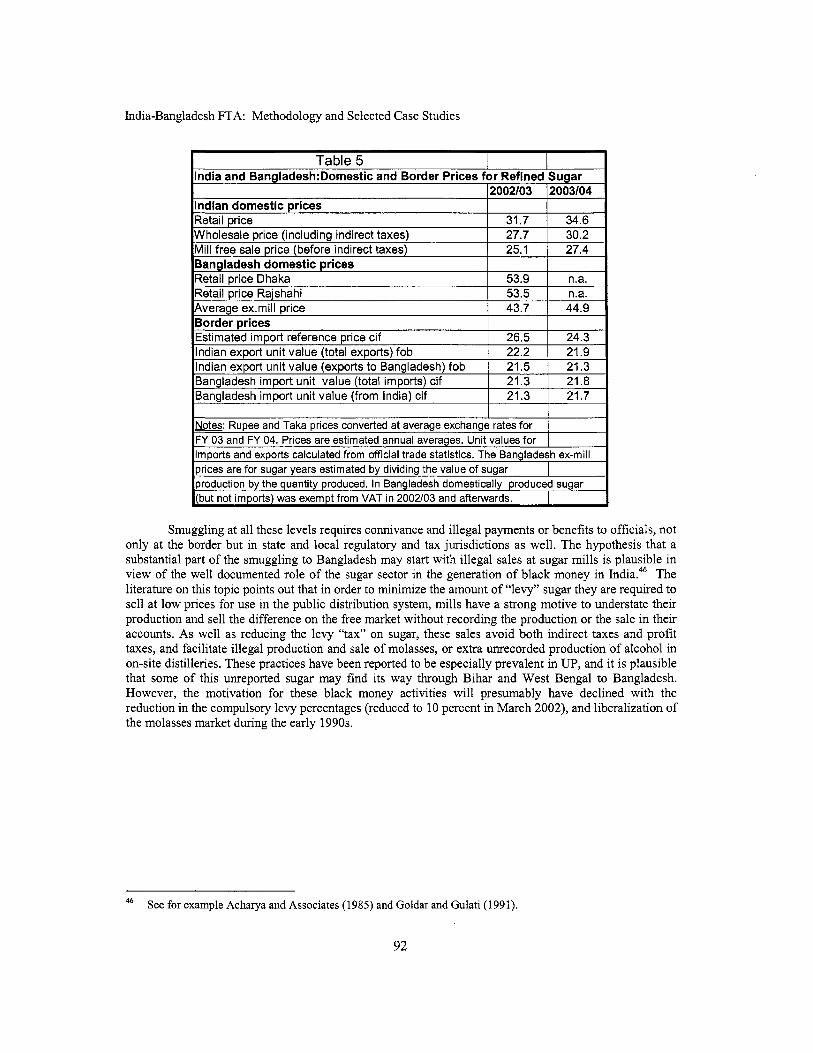
India-Bangladesh FTA: Methodology and Selected Case Studies
21.7 I (Bangladesh import unit value (from India) cif I I
Notes: Rupee and Taka prices converted at average exchange rates for
Smuggling at al l these levels requires connivance and illegal payments or benefits to officials, not only at the border but in state and local regulatory and tax jurisdictions as well. The hypothesis that a substantial part o f the smuggling to Bangladesh may start wi th illegal sales at sugar mills i s plausible in view o f the well documented role o f the sugar sector in the generation o f black money in India.46 The literature on this topic points out that in order to minimize the amount o f “levy” sugar they are required to sell at l ow prices for use in the public distribution system, mills have a strong motive to understate their production and sell the difference on the free market without recording the production or the sale in their accounts. As well as reducing the l e v y “tax” on sugar, these sales avoid both indirect taxes and profi t taxes, and facilitate illegal production and sale o f molasses, or extra unrecorded production o f alcohol in on-site distilleries. These practices have been reported to be especially prevalent in UP, and it i s plausible that some o f this unreported sugar may find i t s way through Bihar and West Bengal to Bangladesh. However, the motivation for these black money activities will presumably have declined with the reduction in the compulsory levy percentages (reduced to 10 percent in March 2002), and liberalization o f the molasses market during the early 1990s.
46 See for example Acharya and Associates (1985) and Goldar and Gulati (1991).
92

A Case Study o f the Sugar Industry
I I I I I I I - - Fig 5 - Sugar Prices in India and Bangladesh 2002103
60 55 50 45
w 40
30 f 35 c,
15 10 5 0
import cif Ex-mill Wholesale Retail
3. The Bangladesh industry: structure, policies and recent developments
The Bangladesh sugar industry i s much smaller the Indian industry, and i s not wel l documented. This section summarizes some o f the principal features that are relevant for thinking about free or preferential trade in sugar wi th India.
Structure. The sugar industry in Bangladesh i s dominated by the Bangladesh Sugar and Food Industries Corporation (BSFIC), a public sector monopoly, which until June 2002 also had a public sector monopoly o f imports which it shared with the Trading Corporation o f Bangladesh. Until 2004 BSFIC controlled 15 sugar mills: in March 2004 one mill was privatized and i s now owned by a private Bangladesh group with a 20% participation o f a Thai company. I t has been announced that two other mills are in the process o f being privatized. Despite very high protection against imports BSFIC has consistently been unprofitable: for example, i t s sugar production operations ran at a loss for 10 o f the 13 years between FY91 and FY2003. In some o f these years it made a small overall net prof i t after including profits from i t s monopoly o f imported sugar, but in FY03 following the removal o f i t s import monopoly i t s loss increased to Taka 1.3 billion, about one third o f i t s sales. I t s poor financial performance has been attributed to overmanning (it employs about 19000 people), poor management, obsolete equipment, and very low capacity utilization in many years. I t s capacity utilization problem i s related to fixed, government mandated prices for cane which prevents i t s mills from freely competing for cane supplies with gur producers4’. As a result, in any given season some o f i t s mills are not operating at all (for
47 World Bank (2003), Annex 1.
93
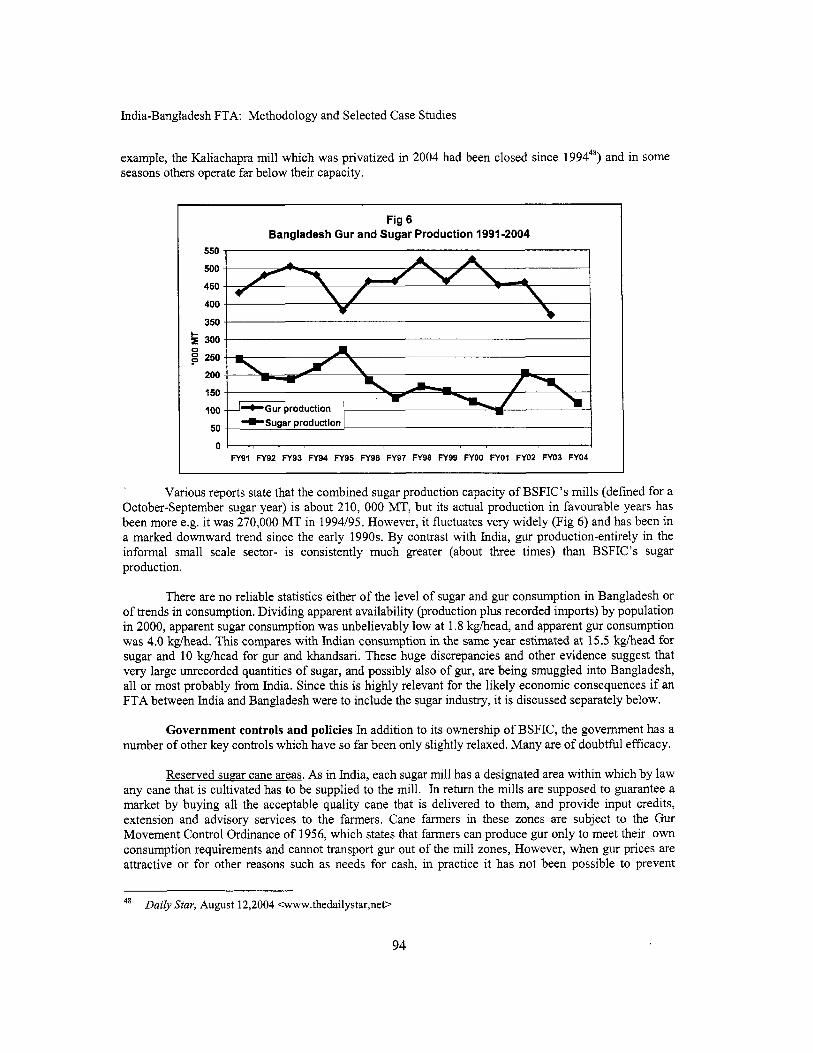
India-Bangladesh FTA: Methodology and Selected Case Studies
example, the Kaliachapra mill which was privatized in 2004 had been closed since 199448) and in some seasons others operate far below their capacity.
Fig 6 Bangladesh Gur and Sugar Production 1991-2004
5 300
S 250
200
150
100
50
0
0
FY91 FY92 FY93 FY94 FY95 FY96 FY97 FY98 FY99 N O 0 FYOI FYOZ FY03 FY04
Various reports state that the combined sugar production capacity o f BSFIC’s mills (defined for a October-September sugar year) i s about 210, 000 MT, but i t s actual production in favourable years has been more e.g. it was 270,000 MT in 1994/95. However, it fluctuates very widely (Fig 6) and has been in a marked downward trend since the early 1990s. By contrast wi th India, gur production-entirely in the informal small scale sector- i s consistently much greater (about three times) than BSFIC’s sugar production.
There are no reliable statistics either o f the level o f sugar and gur consumption in Bangladesh or o f trends in consumption. Dividing apparent availability (production plus recorded imports) by population in 2000, apparent sugar consumption was unbelievably low at 1.8 kghead, and apparent gur consumption was 4.0 kgihead. This compares with Indian consumption in the same year estimated at 15.5 kgihead for sugar and 10 kghead for gur and khandsari. These huge discrepancies and other evidence suggest that very large unrecorded quantities o f sugar, and possibly also o f gur, are being smuggled into Bangladesh, al l or most probably from India. Since this i s highly relevant for the l ikely economic consequences if an FTA between India and Bangladesh were to include the sugar industry, it i s discussed separately below.
G o v e r n m e n t controls and policies In addition to i t s ownership o f BSFIC, the government has a number o f other key controls which have so far been only slightly relaxed. Many are o f doubtful efficacy.
Reserved sugar cane areas. As in India, each sugar mill has a designated area within which by law any cane that i s cultivated has to be supplied to the mill. In return the mills are supposed to guarantee a market by buying al l the acceptable quality cane that i s delivered to them, and provide input credits, extension and advisory services to the farmers. Cane farmers in these zones are subject to the Gur Movement Control Ordinance o f 1956, which states that farmers can produce gur only to meet their own consumption requirements and cannot transport gur out o f the mill zones, However, when gur prices are attractive or for other reasons such as needs for cash, in practice it has not been possible to prevent
48 Daily Star, August 12,2004 <www.thedailystar,net>
94

A Case Study o f the Sugar Industry
10 -
5 -
farmers f rom crushing their own cane to make gur, o r from sell ing the cane to small scale gur producers who use crushing equipment dnven by bullocks o r by small machines such as tube we l l engines49. An unknown quantity o f the gur i s reported to b e used in i l legal distilleries, especially in the Chittagong hill areas and in border areas in Myanmar.
-Bangladesh +India
Fig 7 Sugar Cane Prices in Bangladesh and India FYl993-FY2005
30
25 - - 0 4
FY93 FY94 FY95 FY96 FY97 FY98 FY99 FYOO FYOI FY02 FY03 FY04 FY05
Controlled sugar cane urices. The cane prices i s f ixed by the government and since the early 1990s there have been only small, infrequent increases, so it has declined in real terms. Some studies attribute the problems o f the mills in procuring sufficient cane to l o w cane prices, but until 2002 Bangladesh’s cane prices were much higher than Indian prices (Fig 7)”. The difference i s even greater than shown here, because the Indian prices are for recovery rates of 8.5% whereas the Bangladesh prices are for recovery rates o f 8%.” As pointed out in discussing the Indian industry, there was a serious crisis beginning around 2002 when cane prices were just below $20/MT and sugar prices came d o w n t o around $250/MT. $20/MT i s the approximate current level o f Bangladesh cane prices, and with border prices for sugar at $250/MT or below, the experience in India suggests that very high sugar tariffs wou ld b e needed for financial viabi l i ty o f the Bangladesh mills, even if there were major improvements in management and m i l l i ng efficiency.
See for example, an article in The Independent September 24, 2004: “Farmers selling their crops to molasses producers”. According to the article, sources at Rajshahi Sugar Mills said that because o f a shortage o f “manpower, magistrates and police” it was not possible to take action against the i l legal power crushers T h e Indian cane prices are estimated actual prices which are influenced by state government announced minimum prices (SAP prices).They do not allow for payment arrears which at times have been very substantial. Taking account o f these would reduce the average effective Indian prices, especially during 2002103 and 2003/04. Until the 2002103 season, BSFIC based i ts cane purchase price on an 8% sucrose content, but there are reports that in practice BSFIC m i l l s paid this price regardless o f the quality o f the cane, owing to insufficient testing facilities. I f correct, this would have undermined the motivation o f farmers to deliver good quality cane to the m i l l s and could be an important part o f the explanation for their poor financial record. Beginning in 2002/03, the cane price goes up by a fmed amount for each 0.1 point increase over 8 percent. Before 2002103, the apparent absence o f quality control could mean that, by comparison with India, purchase prices were even higher than shown in Fig 7 if average sucrose content were lower than 8%, and lower if average sucrose content were higher than 8%.
49
50
5’
95

India-Bangladesh FTA: Methodology and Selected Case Studies
Fig 8 Bangladesh Import and Domestic Prices for Sugar 1992/93-2004105
(US centslkg) 90
80
70
60 0 Y
$ 5 0 a9 u 40 v) 3
30
20
10
0 4 1993 1994 1995 I996 1997 I998 1999 2000 2001 2002 2003 2004 2005
Sugar urices BSFIC’s sugar prices are set in advance for each sugar season by the government at Cabinet level. After increasing somewhat in the early 199Os, they remained approximately the same in nominal terms from 1995 until a slight reduction in 2002/03 followed by increases in 2003/04 and 2004/05. From 2002/03 domestically produced sugar (but not imported sugar) was exempted from the VAT, and after allowing for this, the nominal pre-VAT price received by BSFIC increased by about 16% between 2001/02 and 2004/05. T h i s reversed the decline in real sugar prices (whether expressed in $US or constant Taka) that had been under way for the previous 10 years (Fig 8). Since at least the early 199Os, before adding the 15% VAT, BSFIC’s prices have consistently exceeded c i f import prices (indicated by unit values o f recorded imports in F ig 8) by U S 20-25 centskg. Retail prices are not controlled but have followed these trends, continuing to decline in real terms after 2001/02 owing to the abolition o f the VAT on domestic production. However because o f BSFIC’s high prices, they have been far above retail sugar prices in India.
Gur prices. As in India gur prices are neither controlled nor subject to indirect taxes, but even though most gur i s produced in rural areas by small scale business including many illegal operators, there i s a market which seems to function effectively with prices that are systematically collected and reported by the Bangladesh Bureau o f Statistics. From FY 1992 to FY 2003 retail gur prices increased at about the same rate as the general rate o f inflation as measured by the CPI and also by the devaluation rate o f T a W S dollar exchange rate (Fig 9). As retail sugar prices came down after 1995, the margin between retail sugar and gur prices narrowed considerably, with gur selling at prices only slightly below the price o f refined sugar, especially in the Dhaka area. Consistent with this, gur prices in Bangladesh appear to be far higher than gur prices in India (Fig 10): about double during the early 1990s and about 50% higher in 2000. As with sugar, these very large price differences suggest that gur smuggling from India to Bangladesh would be highly profitable, but also raise the question why prices have not tended to equalize if smuggling in fact takes place on a large scale.
96
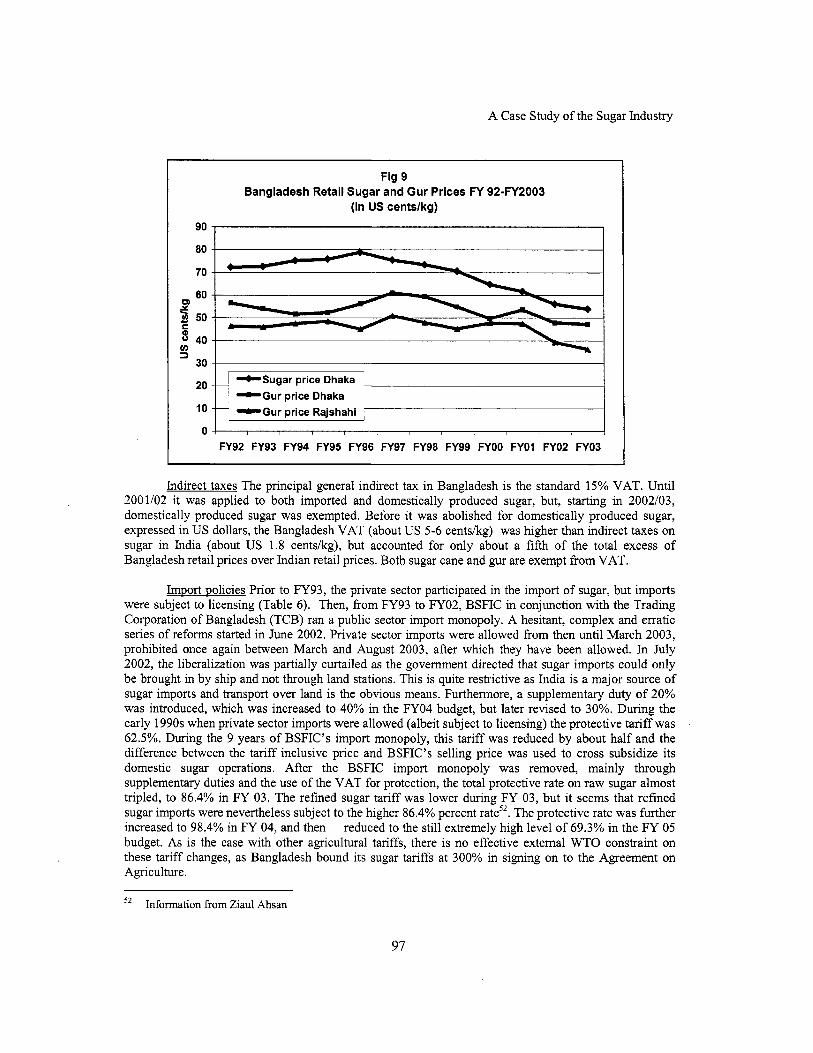
A Case Study o f the Sugar Industry
3 30
20
Fig 9 Bangladesh Retail Sugar and Gur Prices FY 92-FY2003
(In US centslkg)
-Sugar price Dhaka -A j -Gur price Dhaka
0
Indirect taxes The principal general indirect tax in Bangladesh i s the standard 15% VAT. Until 2001/02 i t was applied to both imported and domestically produced sugar, but, starting in 2002103, domestically produced sugar was exempted. Before i t was abolished for domestically produced sugar, expressed in U S dollars, the Bangladesh VAT (about U S 5-6 centskg) was higher than indirect taxes on sugar in India (about US 1.8 centskg), but accounted for only about a fifth o f the total excess o f Bangladesh retail prices over Indian retail prices. Both sugar cane and gur are exempt fi-om VAT.
Import policies Prior to FY93, the private sector participated in the import o f sugar, but imports were subject to licensing (Table 6). Then, from FY93 to FY02, BSFIC in conjunction with the Trading Corporation o f Bangladesh (TCB) ran a public sector import monopoly. A hesitant, complex and erratic series o f reforms started in June 2002. Private sector imports were allowed from then until March 2003, prohibited once again between March and August 2003, after which they have been allowed. In July 2002, the liberalization was partially curtailed as the government directed that sugar imports could only be brought in by ship and not through land stations. T h i s i s quite restrictive as India i s a major source o f sugar imports and transport over land i s the obvious means. Furthermore, a supplementary duty o f 20% was introduced, which was increased to 40% in the FY04 budget, but later revised to 30%. During the early 1990s when private sector imports were allowed (albeit subject to licensing) the protective tar i f f was 62.5%. During the 9 years o f BSFIC’s import monopoly, this tari f f was reduced by about ha l f and the difference between the tari f f inclusive price and BSFIC’s selling price was used to cross subsidize i t s domestic sugar operations. After the BSFIC import monopoly was removed, mainly through supplementary duties and the use o f the VAT for protection, the total protective rate on raw sugar almost tripled, to 86.4% in FY 03. The refined sugar tari f f was lower during FY 03, but it seems that refined sugar imports were nevertheless subject to the higher 86.4% percent rate5’. The protective rate was furfher increased to 98.4% in FY 04, and then reduced to the s t i l l extremely high level o f 69.3% in the FY 05 budget. As i s the case with other agricultural tariffs, there i s no effective external WTO constraint on these tariff changes, as Bangladesh bound i t s sugar tariffs at 300% in signing on to the Agreement on Agriculture.
52 Information from Ziaul Ahsan
97
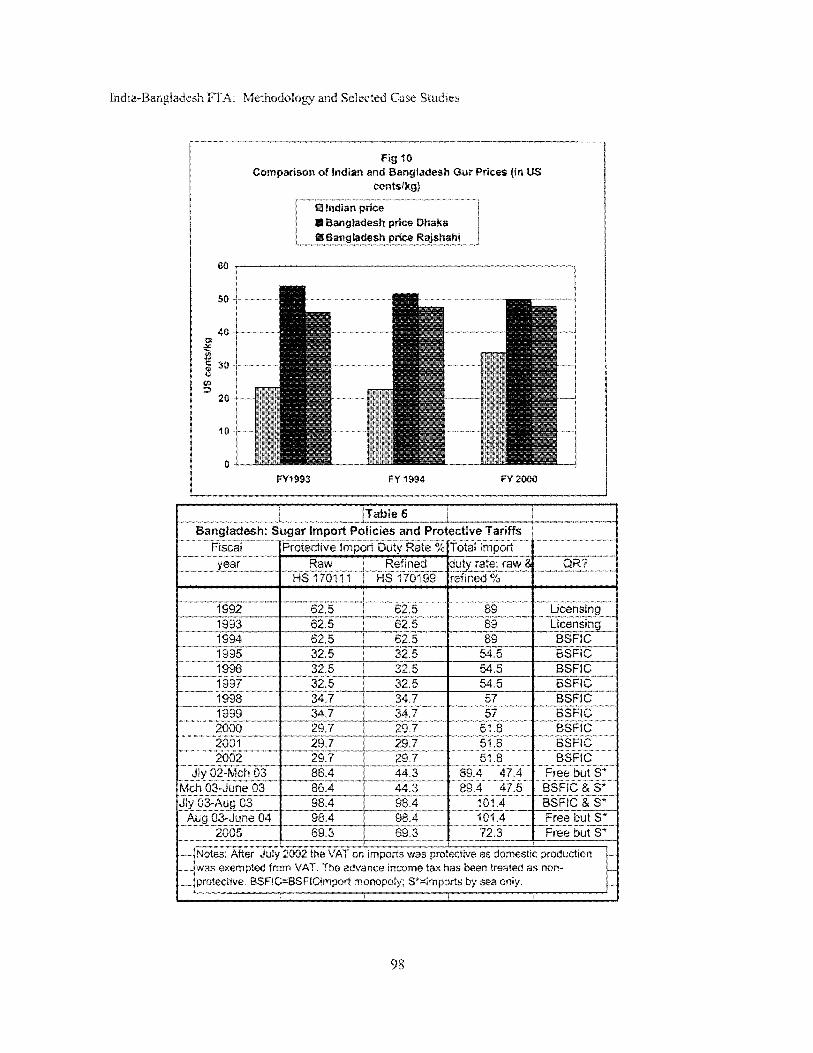
FY 1994 FY 2000

A Case Study o f the Sugar Industry
Bangladesh’s gur tar i f fs are the same as sugar tariffs, but there i s practically no international trade in gur, with the important exception o f trade in border areas o f contiguous countries which produce sugar cane. Bangladesh’s gur tariffs and import policies would therefore be highly relevant for trade with India, if it were not for the fact that gur imports are a monopoly o f BSFIC which it seems does not trade in gur at all, since n o gur imports or exports appear as separate items in either the import or the export statistics. The rationale for this apparent import ban seems to be equivalent treatment for imported and domestic gur, given the policy which makes it illegal to transport gur out o f the mill zones.
In 2003/04 Bangladesh’s protective tariffs for sugar cane and cane molasses were respectively 19% and 33.5%. For al l practical purposes sugar cane i s non-tradable owing to its l ow value, bulk, and the need to process it soon after cutting.
4. Sugar imports from India: how much smuggling?
I t i s generally recognized that large quantities o f sugar are regularly smuggled from India into Bangladesh. This i s a consistent finding o f al l the studies o f informal trade, both in India and Bang lade~h~~ , that have reported the results o f field surveys o f informal trade in border areas, and i s mentioned as a matter o f course in press and other reports on the Bangladesh sugar industrys4. A major unsettled question i s the scale and value o f the smuggled sugar, and an obvious way to estimate this i s to take the difference between total sugar consumption and recorded production plus recorded imports. However, it appears that there are no reliable estimates o f per capita consumption. According to the 2000 HIES (Household Income and Expenditure Survey) per capita sugar consumption was 0.13 kglmonth or 1.56 kglyear, but this i s for direct household consumption only and does not take account o f what i s normally the largest use o f sugar as an intermediate input for the food and dnnk industries.
In the absence o f better information F ig 11 shows estimated total consumption based on a conservative guess that per capita annual consumption in each year during FY92 to FY 2004 was 7.5 k g per capita. This compares with current average per capita consumption in rural areas o f three l o w income Indian states (UP, Rajasthan and Madhya Pradesh) o f between 9.9 kg and 10.6 kg, and with an all-India per capita consumption o f 14.3 kg.” Estimated this way, total national consumption went up f rom just above 800,000 MT in FY 1992 to just above a mil l ion MT in FY 2004. T h i s i s consistent with press reports (presumably derived from sugar industry sources), that total Bangladesh consumption in 2004 was about 900,000 to one mil l ion tons56. These consumption guesstimates have then been compared with official statistics o f available sugar, i.e. BSFIC’s production, imports recorded in the Bangladesh trade statistics, and the unexplained difference i s inferred to consist o f smuggled sugar”. Since about 1996 production has trended down, but this has been offset by increasing officially recorded imports, with a very sharp increase in 2003 and 2004. As indicated in Figs 11 and 12, this has meant that unexplained consumption, presumably sugar smuggled from India, was running at about 600,000 MT for a number o f
For example Chaudhari S.K and others (1995); Pohit, Sanjib and Taneja (2002); Bakht, Z. (1996); Rahman, A and A. Razzaque (1998);Bayes , Abdul(2003) For example the article headed “BSFIC dealers urge govt to check sugar smuggling.” The Daily Star, May 25, 2004. I S M A (2004). The year o f these per capita consumption estimates i s not indicated in the ISMA report. I t appears to be 2002/03 or 2003104 Daily Star May 25, 2004 : “more than nine lakh metric tons”; August 12 2004 : “10 lakh tones” News from Bangladesh, October 03,2004: “ 7 to 8 lakh tonne”; These estimates are obviously very rough approximations even assuming that the assumption o f 7.5 kgiper captita consumption i s about correct (it presumably would have changed-probably increased -over the period). Among other things, the sugar availability estimates have not allowed for changes in stocks. In particular, if part of the increased recorded imports during FY 03 and FY 04 went to build up stocks, the apparent smuggling level during these years would not have declined as shalply as indicated in Fig 12.
53
54
55
56
57
99
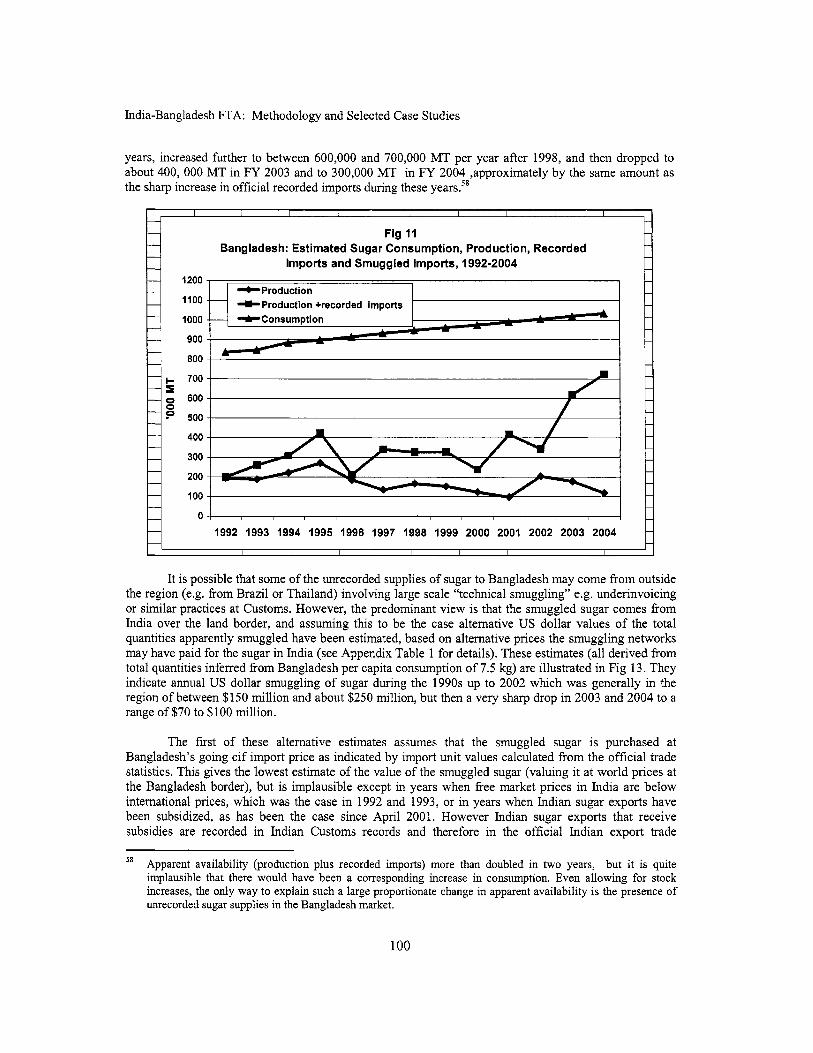
India-Bangladesh FTA: Methodology and Selected Case Studies
years, increased further to between 600,000 and 700,000 MT per year after 1998, and then dropped to about 400, 000 MT in FY 2003 and to 300,000 MT in FY 2004 ,approximately by the same amount as the sharp increase in official recorded imports during these years.’’
I I I I
!- I 0 0 P
Fig 11 Bangladesh: Estimated Sugar Consumption, Production, Recorded
Imports and Smuggled Imports, 1992-2004
+Production +Production +recorded irnoorts I
600 ’0° I 200
~~ 100
1992 1993 1994 1995 1996 1997 1998 1999 2000 2001 2002 2003 2004
It i s possible that some o f the unrecorded supplies o f sugar to Bangladesh may come from outside the region (e.g. from Brazil or Thailand) involving large scale “technical smuggling” e.g. underinvoicing or similar practices at Customs. However, the predominant view i s that the smuggled sugar comes from India over the land border, and assuming this to be the case alternative US dollar values o f the total quantities apparently smuggled have been estimated, based on alternative prices the smuggling networks may have paid for the sugar in India (see Appendix Table 1 for details). These estimates (all derived from total quantities inferred from Bangladesh per capita consumption o f 7.5 kg) are illustrated in F ig 13. They indicate annual U S dollar smuggling o f sugar during the 1990s up to 2002 which was generally in the region o f between $150 mil l ion and about $250 million, but then a very sharp drop in 2003 and 2004 to a range o f $70 to $100 million.
The first o f these alternative estimates assumes that the smuggled sugar i s purchased at Bangladesh’s going c i f import price as indicated by import unit values calculated from the official trade statistics. This gives the lowest estimate o f the value o f the smuggled sugar (valuing i t at wor ld prices at the Bangladesh border), but i s implausible except in years when free market prices in India are below international prices, which was the case in 1992 and 1993, or in years when Indian sugar exports have been subsidized, as has been the case since April 2001. However Indian sugar exports that receive subsidies are recorded in Indian Customs records and therefore in the official Indian export trade
Apparent availability (production plus recorded imports) more than doubled in two years, but it i s quite implausible that there would have been a corresponding increase in consumption. Even allowing for stock increases, the only way to explain such a large proportionate change in apparent availability i s the presence o f unrecorded sugar supplies in the Bangladesh market.
58
100

A Case Study o f the Sugar Industry
statistics, and i t seems highly unlikely (see later discussion) that they would not also pass through Bangladesh Customs and also be recorded there. For these reasons, this valuation o f the foreign exchange cost to Bangladesh o f the smuggled sugar seems to be a lower bound. Nevertheless, these values are o f considerable interest, because comparing them with the alternative values o f the sugar at Indian domestic prices, provides an indication o f the orders o f magnitude o f the terms o f trade effects o f the smuggling for Bangladesh, a substantial loss in each o f the 11 years 1994 to 2004, and a very small potential gain in 1992 and 1993, when Indian domestic sugar prices were lower than border prices.
300
250
200 .- s - - .- E 150 v) 3 Y)
100
50
0
Fig 13 Alternate Estimates of Sugar Smuggled to Bangladesh from India, 1992-2004
in $US million. Assuming consumption 7.5kglperson
1992
.Valued at Bangladesh import unit values
.Valued at Indian free sale mill prices
UValued at lndlan wholesale prices
OValued at Indian retail prices
1993 1994 1995 1996 1997 1998 1999 2000 2001 2002 2003 2004
The second alternative estimate o f the value o f the smuggled sugar assumes that it i s purchased in India at the Indian “free sale” mill price excluding indirect taxes, either direct from sugar mills or from the general market in Indian “black economy” sugar generated by the levy system and the more general motivation to avoid indirect taxes. T h i s price i s a protected domestic price which in most years has exceeded border prices. However, as pointed out previously, the levy percentage was cut to 10% in March 2002, and together with other liberalizing reforms, the opportunities for obtaining sugar for smuggling to Bangladesh in this way may have diminished since then.
The third alternative estimate assumes that the smuggled sugar i s purchased at the going Indian wholesale price, which includes Indian indirect taxes and both the margins o f the sugar mil ls and domestic wholesale trader margins. As noted previously, the Indian domestic indirect taxes on sugar purchased at this point and smuggled to Bangladesh in effect constitute an export tax, currently equivalent to about $19/MT i.e. the smuggling activity transfers this amount from buyers o f the sugar in Bangladesh to the Indian government.
The fourth and highest alternative estimate assumes that the sugar i s purchased in India at the retail price, which reflects protection o f the domestic market and includes al l domestic distribution margins as well as domestic indirect taxes. If the sugar i s carried over the border in relatively small head
101

India-Bangladesh FTA: Methodology and Selected Case Studies
loads, it i s very likely purchased in local retail markets and in border areas this may be the most plausible way to value it.
These four alternative ways o f valuing the smuggled sugar do not include transport and transaction costs and margins o f various kinds involved in getting the sugar to the Bangladesh border. These w i l l increase the price paid for the smuggled sugar by the importers involved in the smuggling network in Bangladesh, perhaps considerably.
If it had been possible for sugar to be freely and legally imported into Bangladesh subject only to Customs duties, insofar as smuggled sugar were to divert Bangladesh demand from legal imports, there would be a trade diversion cost equivalent to the Customs revenue (including in this case the Bangladesh VAT) that would have been collected on those imports. On the other hand, there would be some benefit to Bangladesh consumers if the smuggling were to bring down the prevailing level o f sugar prices. In other words, the sugar smuggling would act as a defacto free or preferential trade arrangement with potential economic welfare costs and benefits which are similar to the economic costs and benefits o f formal preferential trading arrangements. However, until June 2002, when the BSFIC import monopoly was partially lifted, this standard trade diversion interpretation does not fit the Bangladesh case, because the level o f legal sugar imports was entirely at the discretion o f BSFIC. Even though it made very high profits on the sugar it imported, it appears to have used i t s monopsony power very cautiously by importing much less than was needed to meet total demand, and giving f i rs t priority to supporting the domestic price in the interests o f its sugar mil l ing operations and o f sugar cane farmers. A t this price, there was very substantial excess demand, so that in effect BSFIC’s price support operations also benefited the smuggling networks. The excess demand was met by smuggled imports from India, but it seems that the transport and other transaction costs o f smuggling the sugar-or some other unknown constraints-were such that the quantities smuggled never greatly diminished the excess o f sugar prices in Bangladesh over sugar prices in India.
T h i s interpretation o f the massive scale o f sugar smuggling before 2002103, when i t accounted for 60 to 70 percent o f probable total Bangladesh demand, i s consistent with the dramatic jump in legal sugar imports during 2002/03 and the corresponding decline in apparent smuggled imports. The two key pol icy changes in Bangladesh that were made in June and July 2002-first allowing private traders to import, and then a month later banning imports across the land border, suggest that large quantities o f sugar were being smuggled through or in the vicinity o f the land Customs posts, perhaps under the cover o f legal shipments, and that the sea ports were less permeable. This change, together wi th the new export subsidy policy in India-suggest that large scale “wholesale” smuggling networks operating in both India and Bangladesh, may have switched some o f their exports to the legal trade by sea. The continued decline in apparent smuggling to around 300,000 tons in FY 04, despite somewhat higher tariffs on legally imported sugar, suggests that “wholesale” smuggling from India was s t i l l being constrained, even though in principle, wi th the new high tariffs, it would have been much more profitable than importing by the legal route. In turn i t may be surmised that the “wholesale” large scale component o f the smuggled sugar -of the order o f 300,000 to 400,000 tons annually-was probably occurring at land Customs stations under the cover o f legal trade, a high proportion perhaps at the Benapole-Petrapole crossing. If so, while it continues, the prohibition o f imports by land routes-though a very blunt and economically inefficient instrument-may in future confine sugar smuggling to smaller scale and probably higher cost operations in more remote border areas.
The next section o f this paper analyzes the likely effects o f a formal FTA between India and Bangladesh which would include sugar, given the prior existence o f large scale smuggling. The results are tentative, especially in view o f the necessarily uncertain information on the scale and nature o f the smuggling.
102
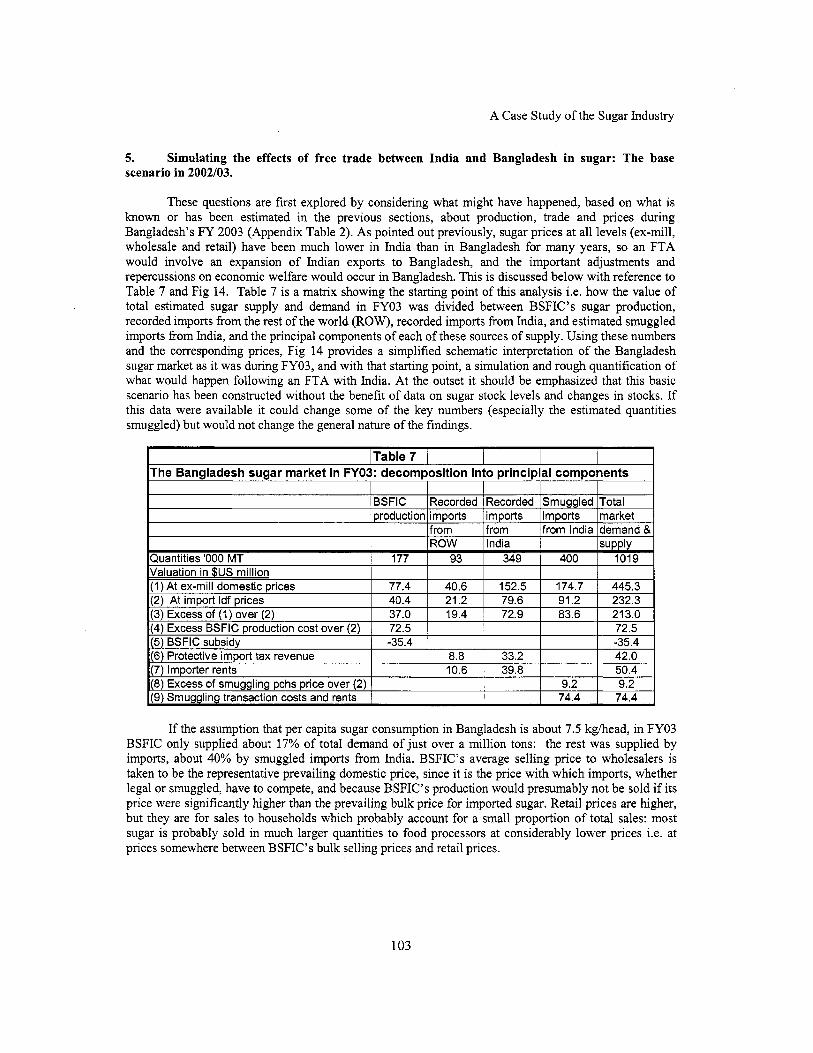
A Case Study o f the Sugar Industry
5. scenario in 2002/03.
Simulating the effects of free trade between India and Bangladesh in sugar: The base
These questions are first explored by considering what might have happened, based on what i s known or has been estimated in the previous sections, about production, trade and prices during Bangladesh’s FY 2003 (Appendix Table 2). A s pointed out previously, sugar prices at all levels (ex-mill, wholesale and retail) have been much lower in India than in Bangladesh for many years, so an FTA would involve an expansion o f Indian exports to Bangladesh, and the important adjustments and repercussions on economic welfare would occur in Bangladesh. T h i s i s discussed below with reference to Table 7 and F ig 14. Table 7 i s a matrix showing the starting point o f th is analysis i.e. how the value o f total estimated sugar supply and demand in FY03 was divided between BSFIC’s sugar production, recorded imports from the rest o f the world (ROW), recorded imports from India, and estimated smuggled imports from India, and the principal components o f each o f these sources o f supply. Using these numbers and the corresponding prices, F ig 14 provides a simplified schematic interpretation o f the Bangladesh sugar market as it was during FY03, and with that starting point, a simulation and rough quantification o f what would happen following an FTA with India. At the outset it should be emphasized that this basic scenario has been constructed without the benefit o f data on sugar stock levels and changes in stocks. If this data were available it could change some o f the key numbers (especially the estimated quantities smuggled) but would not change the general nature o f the findings.
ITable 7 1 The Bannladesh suaar market in FY03: decomDosition into DrinciDlal comDonents
If the assumption that per capita sugar consumption in Bangladesh i s about 7.5 kg/head, in FY03 BSFIC only supplied about 17% o f total demand o f just over a mil l ion tons: the rest was supplied by imports, about 40% by smuggled imports from India. BSFIC’s average selling price to wholesalers i s taken to be the representative prevailing domestic price, since it i s the price with which imports, whether legal or smuggled, have to compete, and because BSFIC’s production would presumably not be sold if i t s price were significantly higher than the prevailing bulk price for imported sugar. Retail prices are higher, but they are for sales to households which probably account for a small proportion o f total sales: most sugar i s probably sold in much larger quantities to food processors at considerably lower prices i.e. at prices somewhere between BSFIC’s bulk selling prices and retail prices.
103
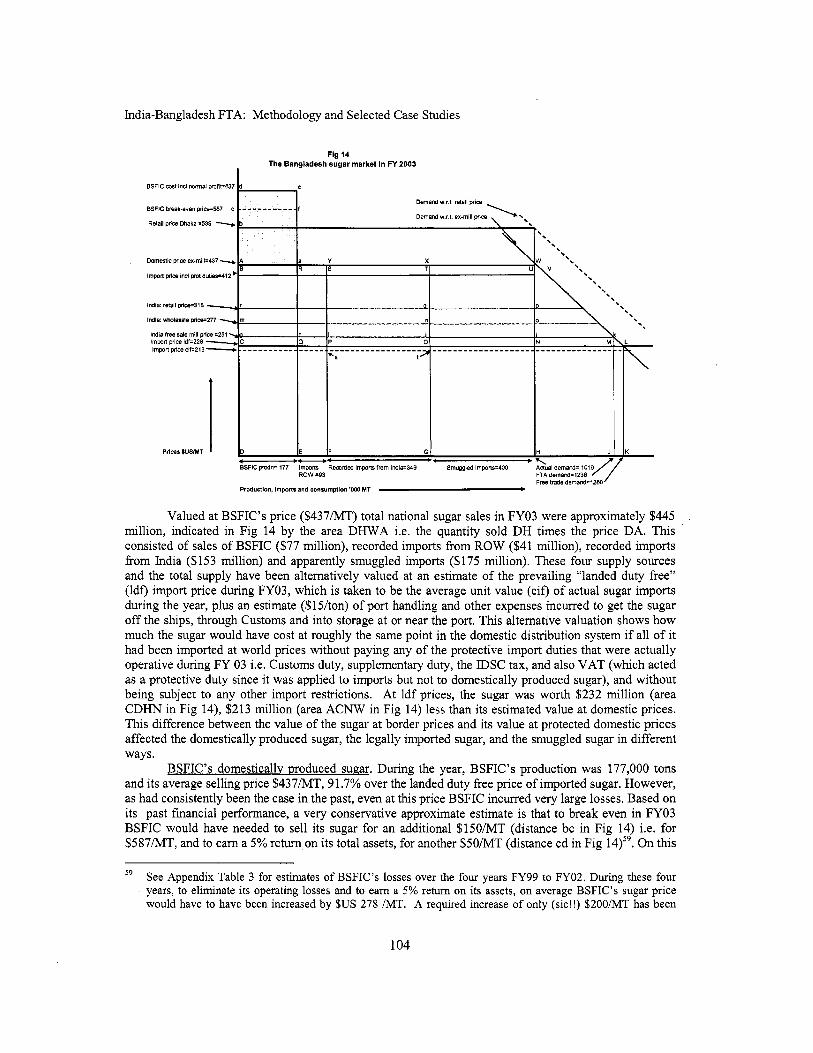
India-Bangladesh FTA: Methodology and Selected Case Studies
Fig 14 The Bangladesh sugar market In M 2003
Valued at BSFIC’s price ($437/MT) total national sugar sales in FY03 were approximately $445 million, indicated in F ig 14 by the area DHWA i.e. the quantity sold DH times the price DA. This consisted o f sales o f BSFIC ($77 million), recorded imports from ROW ($41 million), recorded imports from India ($153 million) and apparently smuggled imports ($175 million). These four supply sources and the total supply have been alternatively valued at an estimate o f the prevailing “landed duty free” (ldf) import price during FY03, which i s taken to be the average unit value (cif) o f actual sugar imports during the year, plus an estimate ($15/ton) o f port handling and other expenses incurred to get the sugar o f f the ships, through Customs and into storage at or near the port. This alternative valuation shows how much the sugar would have cost at roughly the same point in the domestic distribution system if al l o f it had been imported at world prices without paying any o f the protective import duties that were actually operative during FY 03 i.e. Customs duty, supplementary duty, the IDSC tax, and also VAT (which acted as a protective duty since it was applied to imports but not to domestically produced sugar), and without being subject to any other import restrictions. At ldf prices, the sugar was worth $232 mi l l ion (area C D H N in F ig 14), $213 mil l ion (area ACNW in F ig 14) less than i t s estimated value at domestic prices. T h i s difference between the value o f the sugar at border prices and its value at protected domestic prices affected the domestically produced sugar, the legally imported sugar, and the smuggled sugar in different ways.
BSFIC’s domesticallv woduced sugar. During the year, BSFIC’s production was 177,000 tons and i t s average selling price $437/MT, 91.7% over the landed duty free price o f imported sugar. However, as had consistently been the case in the past, even at th is price BSFIC incurred very large losses. Based on its past financial performance, a very conservative approximate estimate i s that to break even in FY03 BSFIC would have needed to sell its sugar for an additional $150/MT (distance bc in F ig 14) i.e. for $587/MT, and to earn a 5% return on i t s total assets, for another $50/MT (distance cd in F i g 14)59. On this
59 See Appendix Table 3 for estimates o f BSFIC’s losses over the four years FY99 to FY02. During these four years, to eliminate i t s operating losses and to earn a 5% return on its assets, on average BSFIC’s sugar price would have to have been increased by $US 278 IMT. A required increase o f only (sic!!) $200/MT has been
104

A Case Study o f the Sugar Industry
calculation, to operate with normal profits it would have required a selling price o f $637/MT, 2.79 times the import ldf price. The required subsidy to break even was $26.6 mil l ion (area cAaf in Fig 14), another $8.9 mil l ion to earn 5% on its total assets (area dcfe), making a total subsidy o f $35.4 mi l l ion in that year. I t i s possible that some part o f this subsidy might have come from profits on sugar imported during the year6’, although most o f the very large subsidy which BSFIC regularly received in the past in this way disappeared The rest had to be covered by the government in some other way, probably in the form o f unserviced loans and government-financed assets earning n o return.
Leaal suaar imports. During FY03, the total protective import duty rate was 86.4%, equivalent to $184/MT (distance C B in Fig 14). Adding this to average c i f prices and estimated port costs gives a landed duty paid sugar price o f $412/MT, $25/MT below BSFIC’s average selling price. With unimpeded private sector import competition it would be expected that domestic prices at the same or similar distribution levels would approximate c i f prices plus tariffs plus the port and other costs o f the imported sugar. As these statistics suggest that this was not the case in during FY03, the $25/MT has been treated as an economic rent which was shared in unknown proportions between BSFIC and the private importers.61 Leaving this aside, most o f the gap between import prices and BSFIC’s selling price i s explained by the protective import duties, which were $17.1 mil l ion on the 93,000 tons o f sugar imported from countries other than India (area RQPS), and $64.2 mi l l ion on the 349,000 tons imported from India (area TOW).
During FY03 free market (“free sale”) sugar prices in India averaged about $25 1/MT, well above Bangladesh’s apparent average import price for sugar imported from India ($213/MT). Despite this considerably lower price, Indian traders found it worthwhile to export to Bangladesh because o f the export subsidies and other incentives to export that were available to them (see previous discussion). The explicit subsidies on their exports to Bangladesh were worth about $32/MT, and the remaining difference between the prevailing free market domestic prices (about $6/MT) i s easily explained by other advantages o f exporting, especially the consequent reduction in the “levy” obligation, and the reduction in the cost o f financing sugar inventories. In Fig 14, the approximate total export subsidy (explicit $ l lmi l l ion, and implicit $2.3 million) i s indicated by area lsti, approximately $13.3 million. Th is i s an important consideration for both countries in thinking about the costs and benefits o f an FTA, because as long as Bangladesh retains high or even moderate tar i f fs on imports from ROW, in most circumstances the existence o f an FTA would mean that Indian sugar exports to Bangladesh would be profitable without any form o f export subsidy.
Smuggled sugar. In F i g 14 it i s f irst assumed that al l o f the smuggled sugar would have been purchased illegally in India (without paying the Indian excise tax and cess) at the mill “free-sale” price o f
assumed for FY03 to allow for the fact that BSFIC’s production in that year was higher than it had been on average during the previous four years. T h i s estimate wi l l need to be modified when BSFIC’s FY03 data becomes available. Starting w i th an average c i f price for imported sugar o f $213/MT and adding port charges ($15/MT) and protective import duties ($184/MT) gives a landed duty paid cost o f $412/MT, $25/MT below BSFIC’s selling price (distance AB in Fig 14). Whether i s an accurate estimate for BSFIC and private importers, o f the prof i t margin from importing sugar, depends on the accuracy o f the price and cost estimates.Errors in these could easily explain a l l or most o f this apparent $25/MT margin. On the other hand, the government’s reinstatement o f BSFIC’s import monopoly between March and August 03 suggests that it s t i l l saw these imports as a way o f cross-subsidizing BSFIC’s sugar production operations, even though i t kept import duties much higher than in the past. The $25/MT difference may have been due to estimation errors and unaccounted domestic transport and marketing costs rather than representing economic rents o f the importers. On the other hand, the erratic pol icy changes during the year (notably the ban on land border imports and the reinstatement o f BSFIC’s import monopoly f rom March 2003) suggest that some kind o f rent seeking may have occurred.
105
India-Bangladesh FTA: Methodology and Selected Case Studies
$25 1/MT, indicated by distance Dg i.e at $ 2 3 N T more than the Bangladesh ldf import price. The area iONj ( 4 9 . 2 million)-the excess cost o f buying the sugar at this price rather than at the prevailing international price- i s therefore a hnd o f “trade diversion” cost to Bangladesh resulting from the ability o f the smugglers to charge a higher price than the international price, by evading the normal import duties applied to legally imported sugar. The difference between this price and the price wi th which this sugar would have to compete in Bangladesh (area XijW=$74.4 million) i s an estimate o f the total smuggling transaction costs and economic rents involved in moving the sugar from the purchase points at the m i l l s in India, to and across the border with Bangladesh, and to wholesale locations inside Bangladesh.
As discussed previously, smuggling o f sugar that starts with purchases at Indian free sale prices i s likely to be on a relatively large scale. Also possible i s smuggling on a smaller scale that starts ‘in India wi th purchases at wholesale tax-inclusive prices (distance DM in F ig 14) or at retail prices (distance Dr). As these prices are higher than free sale prices, the price paid by the recipient o f the sugar in Bangladesh i s also likely to be higher, in addition to which unit transaction costs (transport, payments to couriers, payments to officials etc) are likely to be higher with smaller shipments. The three possibilities for the starting points o f the smuggling are compared in Table 8, which also shows the corresponding possible levels o f total transaction costs and margins o f the smuggling networks under each scenario, if al l the smuggled sugar were to go from just one of these starting points. If the starting point were purchase at the Indian wholesale price, before taking into account subsequent costs to get the sugar into the hands o f Bangladesh importers, the cost to Bangladesh o f this de facto trade diversion in FY03 would have amounted to $18.3 mil l ion (area nONp in F ig 14), and if al l the smuggled sugar had been purchased in India at retai l prices, the trade diversion cost would have been $33.6 mi l l ion (area qONp in F ig 14).
Table 8: Smuggled sugar FY03: Costs according to purchase source in India: $US million
Source and price in India Mill free Wholesale Retail
Value in ldf prices 91.2 91.2 91.2 Value at source in India 100.4 110.8 127.2 Trade diversion cost# 9.2 19.6 36 O f which Indian indirect taxes* 0 7 7 Transaction costs and margins** 74.3 63.9 47.5 # Value at source in India minus value at ldf prices * Excise & cess Rs 850/MT **Value at ex-mill prices in Bangladesh minus value at source in India
sale
By contrast wi th purchase o f Indian black market sugar at mill “free sale” prices, in principle the prices charged by legitimate wholesalers or retailers will include the Indian indirect taxes on sugar (excise plus cess). On the entire quantity apparently smuggled in FY03, these taxes would amount to $6.6 million. They would increase the cost o f the sugar to the smuggling network by this amount, and in al l probability this increase would be passed through to buyers o f the sugar in Bangladesh6’. In this way, the Indian indirect taxes act as de facto export taxes paid by Bangladeshis to the Indian government. In addition, the smuggling also creates private benefits in India which are ultimately paid for in Bangladesh, in the form o f trading margins and payoffs to officials and others before the sugar crosses the Bangladesh border.
I t i s possible that the taxes would squeeze the margins and economic rents o f some o f the Indian participants in the smuggling networks, rather than being passed on to final buyers o f the sugar in Bangladesh.
62
106
A Case Study o f the Sugar Industry
A careful reading o f the research studies based on f ield surveys which deal with informal India- Bangladesh trade, indicate that all three o f the smuggling models mentioned above exist, but the studies do not provide any indication o f the relative importance o f each, certainly not at the level o f individual smuggled commodities such as sugar. Therefore, in the discussion below o f the l ikely effects o f an India- Bangladesh FTA including sugar, it i s possible to say something about the l ikely effects on smuggling in the aggregate, but not about the effects on the different smuggling channels.
6. much? First simulation.
Free trade between India and Bangladesh in sugar: who gains, who loses, and by how
T h i s i s f i r s t considered by aslung: what would have happened if an FTA had been in place for
Indian exports to Bangladesh would be exempt from al l o f Bangladesh’s protective import duties during FY03 i.e. Customs duties, supplementary duties, IDSC, and the VAT. All o f these duties would continue to be applied at the total protective rate o f 86.4% to imports from ROW. Bangladesh’s ban on sugar imports by the land border would be l i f ted India would remove i t s export subsidies from sugar exported to Bangladesh (but would keep them for exports to ROW) Like al l exports, legal Indian sugar exports to Bangladesh would be exempt from Indian domestic taxes Indian sugar i s exported to Bangladesh at the Indian domestic bulk “free sale” price, and competition between Indian sugar exporters keeps the export price to Bangladesh at that level. Demand for sugar in Bangladesh with respect to bulk prices i s as shown in F i g 14, with an average elasticity o f -0.36 over the straight l ine demand curve range WL6’.
sugar during FY03? In order to roughly quantify the l ikely outcome it i s assumed that:
A key assumption in this first simulation i s that the Indian sugar i s sold in Bangladesh at the domestic Indian free sale price: in effect the Indian and Bangladesh and markets are integrated and effectively become one market, so that sugar i s sold in bulk at the same pre-tax price in both countries. This assumption i s varied in two further simulations reported later.
Under these conditions, the outcome o f the FTA in Bangladesh i s illustrated in Fig 14, where the new equilibrium price i s the Indian “free sale” price (distance D g =$251/MT) and demand expands to distance D J (1,236,000 tons). Legal imports from India under the FTA replace all o f domestic production, al l o f the previously legal imports from ROW, and al l o f the previously smuggled imports from India. T h e corresponding changes in economic welfare for the principal affected groups in Bangladesh, India and in ROW are shown in Table 9 and discussed in turn.
Economic welfare effects in Bangladesh. There i s a very large welfare benefit to Bangladesh sugar consumers o f $209.7 million, resulting f rom a 42.5% percent cut in the bulk sugar price, from $437/MT to $251/MT (from Taka 25.3kg to Taka 14.5kg). Most o f this benefit i s the reduced cost ($189.5 million) o f the sugar that was already being purchased at the original higher price, and part ($20.2 million) i s the estimated value to consumers o f the 217,000 tons o f additional sugar they now buy at the lower price. The proportionate reduction in the retail prices and prices to industrial consumers would be less than 42.5%, but the combined
63 T h i s i s a conservative guess based on an estimate o f -0.64 for India quoted in an article on the Indian sugar industry in India Infoline (2004). The point elasticity along the relevant range o f the straight l ine demand curve in Fig 14 (from a price o f $437/MT to $228/MT varies from -0.54 to -0.224 at the lower price. The simulations in t h i s paper could be run with alternative demand elasticities but alternative plausible values o f the elasticities would not greatly change the estimated changes in welfare.
107
India-Bangladesh FTA: Methodology and Selected Case Studies
welfare benefit to them would be the same if wholesale and retail margins did not change, and would be somewhat greater than $209.7 mil l ion if these margins were to fal l in absolute terms e.g. if they did not change as a percentage o f bulk prices. The consumer surplus benefit to sugar buyers comes from five major sources: Replacing BSFIC’s high priced sugar with the less expensive imported sugar from India : Le. BSFIC’s sugar sales minus the cost of the equivalent quantity o f imported Indian sugar= $32.9 mil l ion Lost Customs revenue ($17.1 million) and importer economic rents ($2.3 million) from replaced imports from ROW, minus a trade diversion cost ($2.1 million) due to the higher border price o f the Indian sugar relative to the ROW sugar. Lost Customs revenue ($64.2 million) and importer economic rents ($2.3 million) from replaced imports from India, minus a trade diversion cost ($8.0 million) due to the higher price o f the Indian sugar relative to the ROW sugar. Transaction costs ($74.4 million) o f al l kinds (including costs o f transport and storage) incurred, and economic rents (including bribes) earned, in the sugar smuggling networks that are replaced. Some o f these costs and economic rents are in India, and some in Bangladesh. Consumers’ surplus ($20.2 million) on the increased consumption o f sugar resulting from the lowered price
108

A Case Study o f the Sugar Industry
Sources of increase in consumer surplus Excess cost of BSFIC's production replaced
Table 9 CHANGES IN ECONOMIC WELFARE FROM FTA: FIRST SIMULATION
IArea in I $US million
Bghr 32.9
ImDorts from ROW Lost Customs revenue Lost importer economic rents Minus trade diversion cost
RQPS 17.1 aRSY 2.3 lPOi -2.1 17.3
ImDorts from India Lost Customs revenue
I I SliT 64.2
S I YSTX I 8.7
I I I NET CHANGE IN BANGLADESH AND INDIA 1 166.0-?
I I I
Smuaaled imports Transaction costs and economic rents eliminated
I I I
NET GLOBAL CHANGE INCLUDING ROW 1 166.0-?
XijW 74.4
A large decline ($81.3 million) in government receipts from the protective import taxes previously received on imports from ROW and legal imports from India. The disappearance o f apparent economic rents (worth $11.1 million) that may have gone to importers o f Indian and ROW sugar during FY03. As BSFIC was importing along with private traders and was the only legal importer for some o f the year, the FTA causes it to lose this last cross- subsidy o f i t s sugar production activities. However, as discussed previously, these
109

India-Bangladesh FTA: Methodology and Selected Case Studies
estimates o f importer economic rents during FY 03 are especially problematic and would need checking against more detailed price and cost data than was available for this simulation. Because o f the demise o f BSFIC, the disappearance o f the government’s large annual subsidy to keep it alive, in FY03 estimated at $35.4 million. Overall, a quantifiable net economic welfare gain for Bangladesh o f $152.7 million, after deducting the loss o f Customs revenue and the loss o f importer economic rents, from consumer benefits and the cessation o f subsidies for BSFIC. However, this very substantial net quantifiable gain for Bangladesh has to be qualified by potential welfare losses among participants in the two major activities that do not survive, BSFIC’s sugar production and sugar smuggling from India. As regards sugar production, there are likely to be welfare losses for BSFIC executives and employees, for owners, mangers and employees o f ancillary operations, and for sugar cane farmers. Th is simulation does not take account o f the possibility that wi th restructuring some mills might be able to survive, but without that al l sugar production ceases. While sugar cane farmers would lose their sales to the sugar mills, in FY03 that accounted for only about a third o f the cane: most o f the rest was used to produce gur. The consequences o f an FTA for Bangladesh’s gur production would require much better information than is currently available on demand and supply conditions for gur in both India and Bangladesh, and o n gur smuggling and its connection wi th trade in molasses and illegal alcohol production. The disappearance of sugar smuggling would involve substantial adjustments and losses o f economic rents by the Bangladeshis involved in, or otherwise benefiting from, the smuggling networks. Some guesses as to the possible orders o f magnitude o f these economic rents (both in Bangladesh and India) are provided in a later section o f this paper, but for obvious reasons these numbers are likely to remain highly speculative even i f it were possible to undertake field research focussing on the economic rents and side payments involved. To quantify the l ikely effects o f an India-Bangladesh FTA on sugar and sugar cane production in Bangladesh and the l ikely effects on sugar smuggling, much more detailed information than has been available for this paper would be needed, taking account o f how the relevant product, service and labor markets are likely to adjust, and distinguishing short term welfare losses o f producer surpluses and economic rents, from longer term effects. The consequences for sugar mill employees and sugar cane farmers are certain to be highly sensitive politically, and political connections wi th the smuggling networks cannot be excluded. Some brief comments are made on these points in the concluding section o f the paper.
Economic welfare effects in India In order to compete with Brazil and other countries that were exporting to Bangladesh, the Indian
government paid export subsidies estimated at $13.3 mi l l ion on the 400,000 tons it exported to Bangladesh in 2002103, and these subsidies would no longer be needed with an FTA. Apart f rom this clear benefit o f the FTA to the Indian central government, other economic welfare effects through the sugar price would most l ikely be very small. Even though as a result o f the simulated FTA India supplies the entire expanded Bangladesh market o f 1,284,000 tons, it was already supplying more than ha l f this amount through legal exports (349,000 tons) and smuggled exports (400,000 tons). The new exports to Bangladesh that result from the FTA (487,000 tons) represent only a very small shares (2.4% and 2.7% respectively ) o f total Indian sugar production (20.1 mi l l ion tons) and consumption (1 8.2 million tons) in sugar year 2002/03. In view of this it seems unlikely that the new sugar demand f i om Bangladesh would increase Indian sugar prices by much or have much effect on the welfare o f Indian sugar producers and consumers. As the market structure and behaviour o f the sugar Indian sugar industry seem to be highly competitive, wi th a large number o f competing sugar producers and traders, it i s also plausible that the export trade to Bangladesh would be competitive and best represented-as in F ig 14-by a horizontal or
110
A Case Study o f the Sugar Industry
almost horizontal export supply curve, with exports under an FTA generating at most only minor producer surplus benefits to the exporters.
However, i t i s likely that there would be some more significant welfare losses in India due to the disappearance o f the smuggling networks in sugar i.e. the shares o f Indians in the producer surpluses, bribes and other side-payments involved in getting the sugar to and over the border with Bangladesh. In this simulation, the total estimated transaction costs and economic rents o f smuggling are large ($74.4 million) and some part o f this sum consists o f producer surpluses and economic rents in India, the latter broadly defined to include super-normal profits o f the various smuggling network participants and side payments to officials. The basis for this i s the hypothesis that in 2002/03, the smuggled sugar was being purchased illegally in India at the mill free sale price, and the assumption that this same price would be the export price at the land border under the FTA. As argued earlier, it i s plausible that smuggled sugar would also be purchased at wholesale prices inclusive o f Indian indirect taxes, or at Indian retail prices. In both these cases, the disappearance o f the smuggling following the FTA involves a larger welfare benefit for Bangladesh, because the smuggled sugar purchased at Indian wholesale or retai l prices that i s replaced i s more expensive and includes Indian indirect taxes and domestic distribution margins. Conversely, the benefits o f the FTA in India are lower, because the legally exported sugar does not include the Indian indirect taxes and distribution margins which are ultimately recovered from Bangladesh buyers when sugar i s smuggled.
Economic welfare effects in the rest o f the world (ROW) Based on the situation in FY 03, as a result o f the FTA 93,000 tons o f sugar valued at $19.8
mil l ion at c i f prices, and previously imported by Bangladesh from Brazil and other countries, would be diverted to imports from India. There are clearly non-negligible welfare effects (most likely losses) in these sugar exporting countries, but more information on supply conditions in each country and alternative destinations for the sugar would be needed to quantify them.
Aggregate net economic welfare effects The quantifiable joint aggregate net welfare improvement in Bangladesh and India i s substantial
($166 million) and it seems highly unlikely that the potential negative welfare effects o f the FTA (both in India and Bangladesh and in the rest o f the world) that i t has not been possible to quantify wi th available information, would go close to outweighing this aggregate benefit, unless they were to be allocated much higher welfare weights.
7. much? Second and third simulations
Free trade between India and Bangladesh in sugar: who gains, who loses, and by how
The simulation discussed above assumes that after the FTA Indian sugar i s legally exported to Bangladesh and sold in bulk there at the same tax-free pr ice (the Indian free sale mill price) as in India. The results o f a second and third simulation using higher Bangladesh ldf import prices from India are shown in Table 10.
111

India-Bangladesh ETA: Methodology and Selected Case Studies
- $251 is the same as the mill free sale price in India - $307 is the mill free sale price in India plus estimated transport costs and transaction costs -of trade through the Petrapole-Benapole land route (see Annex 2, Table 1) - $354 assumes a mill price in India 40% above cif import prices plus transport and transaction cost to - Bangladesh by the PetrapoleBenapole land route
- - - - -
T h e second simulation takes account o f transport and other transaction costs o f getting the sugar to and across the Bangladesh border, and in particular the fact that the transport, storage and other infrastructure i s already highly inadequatea and would presumably come under even much greater strain if there were an FTA between the two countries. In order to provide a rough quantification o f the l ikely effects o f these factors, the simulation assumes that the sugar would be exported from India by the land route, but that the ldf price in Bangladesh would be $307, higher than the Indian free sale price by $56/MT. On the Indian side this probably more realistic price allows for estimates (based on a September 2002 exporter survey in Kolkata6’) o f transport costs to the border at Petrapole, “speed money”, delays in clearing Customs, and exporter margins. On the Bangladesh side it allows for “speed money” and handling charges assumed to be about the same as the equivalent expenses in India. The detailed breakdown o f these estimated expenses are given in Appendix Table 4.
The third simulation allows for variations in the relation between free sale mill prices in India and international prices (Fig 4). Over the 11 years 1994-2004, Indian free sale prices varied from being 15% below c i f import prices (as measured by Bangladesh annual average import unit values) to being 32% above c i f import prices, and on average exceeded import prices by 15%. To evaluate the effects o f an FTA with Indian prices at approximately the upper level o f this range o f variation, this simulation assumes that the Indian free sale domestic price i s 30% above world prices (cif India and Bangladesh in FY03), and adds to this the same transport and transaction costs used in the second simulation. This gives an ld f price o f sugar exported from India to Bangladesh by the land border o f $298+$56=$354/MT.
64 Das and Pohit (2004) 65 Das, Mishra and Poht (2003)
112
A Case Study o f the Sugar Industry
Table 10 compares the quantifiable welfare consequences o f the three simulations. Because of the smaller decline in the Bangladesh price level and the smaller expansion o f total demand, the second and third simulations give consumer surplus benefits in Bangladesh which are s t i l l considerable but much less than in the first simulation. In both cases the total Bangladesh market i s s t i l l supplied by India, so the welfare losses from reduced Customs revenue and reduced importer economic rents are the same, as i s the welfare gain from the closure o f BSFIC and the disappearance o f the government subsidy to i t s operations. Consequently, whereas the f i rst simulation estimates a net welfare benefit to Bangladesh o f $152.7 million, the net benefit with the second simulation i s $86.7 mi l l ion and with the third simulation much less again ($31.9 million). This i s essentially happening because the FTA i s diverting imports previously obtained in Bangladesh at international prices (including imports from India) to imports from India which are purchased at much hgher prices. T h i s i s possible because, with the FTA, the Indian suppliers no longer have to compete wi th ROW suppliers and are no longer assisted to do so by Indian export subsidies. Hence they are able to charge Bangladesh buyers the going free market price in India before indirect taxes, plus whatever transport and transaction costs are involved in getting the sugar to and over the border. It i s apparent that at some higher export price the consumer surplus benefits o f the FTA in Bangladesh will be insufficient to outweigh the combined net cost o f the other three welfare effects, and the net welfare effect for Bangladesh w i l l be negative. However, past experience in India i s that the government i s under strong pressures to keep sugar prices reasonably stable and to avoid abrupt increases, and will if necessary use import, export and subsidy policies to do so. T h i s includes in some periods allowing imports over l ow or zero tar i f fs in order to increase domestic supplies, as was the case during 1994-1998. T h i s past experience suggests that, compared with Bangladesh’s present policies, an FTA with India would in most circumstances be strongly welfare improving for Bangladesh, and moderately welfare improving for India to the extent that the resulting exports to Bangladesh reduce export subsidies that would otherwise be paid to reduce excessive sugar inventories.
8. Unilateral cuts in sugar tariffs by Bangladesh instead of an FTA with India: how do the gains and losses compare?
The simulations so far discussed have considered what might happen i s sugar were included in an India-Bangladesh FTA, and it turns out that nearly al l the large economic welfare changes would occur in Bangladesh. I t i s therefore interesting to consider the likely economic welfare changes, if instead of maintaining the same MFN tariff while including i t s sugar sector in an FTA with India, Bangladesh were to unilaterally liberalize i t s sugar import policy by removing any remaining QRs and reducing i t s general MFN import tariff. I t i s also assumed that the present explicit and implicit budgetary subsidies to BSFIC would be discontinued. Using the same 2002/03 base scenario, Table 15 reports the results o f four experiments with different reductions from the starting tariff.
In the first experiment, the welfare outcomes o f which are summarized in column (a), the protective tariff i s cut to zero, the domestic bulk price falls by 48% (in F ig 14 from distance DA to DC), and demand expands by 26% (from distance DH to DK). Legal imports (which could include imports from India) expand and replace al l o f domestic production and al l the smuggled production f rom India, wi th a consequent very large consumer surplus benefit ($240.2 million) for Bangladesh consumers. Since the tariff i s zero, there i s a large loss ($81.3 million) o f Customs revenue, and the apparent importer economic rents ($1 1.1 million) in the base scenario disappear. However, as in the FTA simulations, almost hal f the reduction in Customs revenue i s offset by discontinuing the BSFIC subsidy. Combining al l these changes, there is very large net quantifiable welfare gain ($183.3 million) for Bangladesh, which substantially exceeds the net Bangladesh welfare gains in the FTA simulations already reported. For example, compared to the FTA simulation which gives the biggest quantifiable net gain to Bangladesh ($ 152.7 million) the net welfare gain with this unilateral free trade simulation i s $30.6 mi l l ion greater. The reason i s simply that the sugar i s imported at a lower price than under the FTA wi th India, and so the consumer surplus benefit i s larger (by area gCLk in F ig 14) while the other welfare changes-resulting
113
India-Bangladesh FTA: Methodology and Selected Case Studies
from the disappearance o f importer rents, the replacement o f BSFIC production, and the disappearance o f sugar smuggling-are the same as they are in the FTA simulation (see Table 9). I t i s plausible that there would be no smuggling since the bulk price in Bangladesh in this simulation i s $23/MT lower than the lowest bulk price (the mill free sale price) at which the smugglers could buy the sugar in India. The non- quantifiable welfare changes (losses o f smuggler rents and bribes in Bangladesh, and welfare losses o f sugar and cane producers) are also the same as in the FTA Simulation, so as a policy alternative for Bangladesh, this seems unambiguously superior. However, from India’s viewpoint it i s inferior to an FTA, since if the Indian government were to continue promoting sugar exports, it would have to continue paying export subsidies, while at the same time the unilateral liberalization in Bangladesh removes the incentive for smuggling and the shares o f Indians in the economic rents and side payments that go with it. But ROW i.e. sugar exporters in other countries, are better o f f than under an FTA, because they continue to have access to the Bangladesh market and the total market i s larger owing to the cut in Bangladesh’s tariff.
In the second simulation o f unilateral liberalization (column (b) o f Table 15), instead o f cutting the MFN tariff to zero, it i s cut so that the landed duty paid price o f imported sugar, i s the same as the ldf price o f sugar imported from India in the f i rs t FTA simulation (Table 9 and Table 10, first column). In Fig 14, the new tariff i s distance gc, so the new domestic price in Bangladesh i s DG, and there i s a consumer surplus benefit equal to area AgkW. T h i s benefit i s identical to the consumer surplus benefit in the f i rst FTA simulation, but with unilateral liberalization Bangladesh collects tari f f revenue equal to area gCMk, which i s the trade diversion cost wi th the FTA. T h i s assumes that the tariff cut in Bangladesh reduces smuggling from India to zero, and this i s plausible because the bulk price in Bangladesh i s the same as the lowest price at which the smugglers could purchase sugar in India. Once again, the three other costs and benefits are the same as with the FTA, so the net welfare benefit to Bangladesh i s greater than under an FTA resulting in the same domestic sugar prices. As in al l the simulations o f unilateral liberalization by Bangladesh, India i s worse o f than it would be under an FTA, and rest- of- the- wor ld sugar exporters are better o f f as a result o f the larger export market in Bangladesh.
In the third simulation (column (c ) o f Table 15, Bangladesh cuts it MFN tariff to 37.1%, which has been selected for this experiment to give the same ldf duty-inclusive sugar price as the ldf price o f sugar imported from India in the second FTA simulation (Tables 9 and Table 10, second column). In the FTA simulation, this ldf price was estimated on the basis o f evidence on substantial delays, “speed money” and other transaction costs o f legal exports from India by the land border. Even so, this price i s s t i l l far below actual domestic prices in Bangladesh in the base scenario, so there is a very large benefit to sugar consumers in Bangladesh estimated at $143.7 million. Even though this consumer benefit i s much less than in the f i rs t two simulations, compared with the base scenario there i s now a slight increase ($3.3 million) in Customs revenue, since the 37.1% protective tariff i s now applied to imports which supply the entire domestic market, including the that part previously supplied by BSFIC and most o f the supply previously coming from smuggled imports. Regarding the smuggled sugar, it seems plausible that a 37.1% tariff would open up some opportunities for smuggling, since the Bangladesh bulk domestic price goes up to $307/MT, $56/MT more than the bulk price ($251/MT) at which smugglers could obtain the sugar in India. To provide a purely illustrative indication o f the difference th is might make in the economic welfare calculations, it has been assumed that the supply o f smuggled sugar i s a linear function o f the excess o f the Bangladesh over the Indian bulk price, starting at zero when the price in both India and Bangladesh i s $251/MT and reaching the estimated base scenario level o f 400,000 tons when the Bangladesh price i s $437/MT i.e. when the maximum gross smuggling margin for smuggled sugar purchased at Indian free sale prices i s $186/MT. As indicated in Table 15, on this assumption, with a 37.1% tariff, 120, 000 tons o f sugar i s smuggled, and consequently the Bangladesh government tari f f revenue i s lower than it would otherwise be, However, as before, government expenditure drops substantially with the cessation o f the BSFIC subsidies, and overall there i s a net fiscal gain ($3.3+$35.4=$38.7 million) compared to the base scenario. As in the simulations (a) and (b), compared
114

A Case Study o f the Sugar Industry
with the base scenario, in this simulation smugglers and bribe recipients in Bangladesh lose unknown amounts, but their losses are somewhat less since some smuggling continues. There are negative but unknown impacts on Bangladesh sugar producers (BSFIC and i ts employees and ancillary suppliers) and likewise for cane growers, subject to the qualification that it i s possible that higher domestic sugar than in the f i rs t two simulations might favourably impact (f iom their viewpoint) the price o f gur, which i s the principal market for their cane. The simulation results are unchanged for India, and are favourable to ROW sugar exporters, but somewhat less than in simulations (a) and (b), since Bangladesh imports are lower wi th the higher tariff.
Unilateral reductions of sugar tariffs by Bangladesh instead of an FTA with India: simulated changes in economic welfare compared with base scenario in 2002103
I I
Bangladesh policies (a) zero MFN sugar tariffs (b) MFN sugar tariff 10 8% (c ) mfn sugar tariff 37.1% (d) MFN sugar tariff 59.2%, In all the simulations it is assumed that sugar production in Bangladesh ceases and subsidies to BSFIC
cease. smuggling of sugar from India is zero with (a) and (b), but is guessed to increase with higher tariffs. The
In the fourth simulation o f unilateral liberalization by Bangladesh (Table 15 column (d)), the tariff cut by Bangladesh i s much smaller than in the other simulations (from the base scenario tari f f o f 86.4% to 59.2%). This tariff i s chosen to replicate the previously reported FTA simulation (Table 9, column (c)) in which the economic welfare effects o f an India-Bangladesh FTA are tested, under conditions in which the domestic Indian bulk price i s around the upper limit (relative to c i f import prices) reached during the past 13 years. As indicated previously, adding estimated land border transport, transaction and other costs to this price gives an ldf price in Bangladesh o f $354/MT, and a 59.2% MFN tariff applied to c i f import prices in the base scenario would gives the same ldf bulk price under this
115
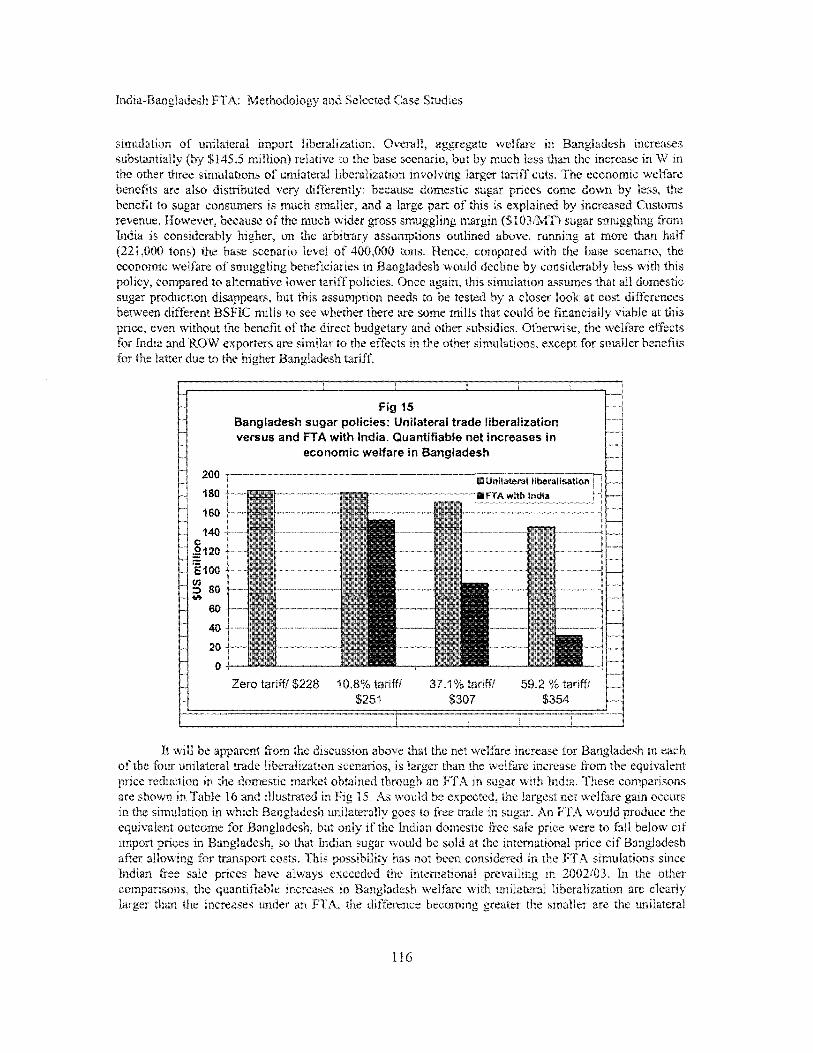
s I n ~ u ~ ~ ~ i o ~ uf u ~ i l a ~ e ~ d ~ import ~ i b e ~ ~ l ~ ~ ~ ~ ~ ~ i ~ . Ovcrali, ~ ~ ~ ~ r e ~ a ~ e In ~ a n g ~ ~ d e s h t y SIJS.5 ~ ~ l ~ ~ o n ~ relazrve to the base scenario, bur by than the increase in W rn simulations o f un i~a tera~ i i b ~ r a ~ i ~ a ~ i o ~ involv ing larger tar i f f cuts. The eeonon~~c
so d ~ s ~ ~ ~ ~ ~ e ~ very ~ i f ~ e r e n ~ ~ ~ : because domestic sugar pnces come down by 1 eonsumer~ i s much smaller, and a large part o f this IS expIained by increased Custortls er, because o f the much wider grass gling margin ($ IO31'MT) sugar s n ? u ~ g l ~ ~ ~ from
c o i i s ~ d e r a b ~ ~ higher, on the arbitrary assu ns outlined above, running at more than hal f ~ 2 2 ~ , ~ 0 ~ tonsf the base scenano level of ~~~,~~~ tons. Hence, pared with the base scenario, the e c ~ ~ i i ~ ~ i ~ c welfare of s ~ u ~ g j s n ~ b e n e ~ c ~ a ~ i e s in E ~ n g l a ~ e s ~ would decline by c ~ n s i d e r a b ~ ~ less with this policy, c ~ ~ p ~ r ~ d to altemativ wer tariff policies. Orice again, this ~ ~ ~ t ~ i a ~ i ~ n assumes that a l l domcstic
this a s ~ u ~ p ~ ~ o n needs to be tested by a closer look at cost differences Is to see whether there are some mills that could be financially viable at this
cnvisc, the welfare effects except for smaller benefits
price, even without the bcncfit of. for India and ROW exporters are for the latter due tu the higher Bang tar1 f f.
I 1 Fig 15
Bangladesh sugar policies: Unifateral trade liberaiiiati versus and FTA with India. ~ u a n t i ~ i a b ~ e net increases
economic welfare in ~ a ~ ~ l a d e s h __ __ -
~ ~ ~ l l a t ~ ~ l Ilbwalisation 7 200
I t 6

A Case Study o f the Sugar Industry
Price in Bangladesh Price in India Difference: incentive to smuggle
tari f f reductions. T h i s i s essentially because, wi th unilateral tariff reductions, the smaller consumer benefits resulting from smaller tari f f cuts, are partly offset by the resulting increases in Customs revenue. By contrast, if prices in Bangladesh go up in tandem with increases in free market prices in India, there i s no offsetting increase in Customs revenue from the imports from India which come in duty free under the FTA.
Basepre - First post Secondpost Thirdpost FTA FTA FTA FTA
scenario simulation simulation simulation 437 25 1 307 354 251 25 1 25 1 298 186 nil 56 56
Table 16: Bangladesh sugar policies: Unilateral liberalisation versus an FTA with India. Comparisons of net increases in quantifiable economic welfare (in $US million)
MFN tariffhdf price $/MT Unilateral FTA with liberalisation India
Zero tariff7 $228 183.3 10.8% tariff7 $251 181.2 152.7 37.1% tariff7$307 171.4 86.7 59.2 % tariff7 $354 145.5 31.9
Note: there is no FTA equivalent to the unilateral adoption o f zero protective tariffs by Bangladesh. The other tariffs under unilataral liberalisation are those required to give the indicated Idf prices o f sugar imported f rom India given in the FTA welfare simulations reported in Table 10
9. An FTA and sugar smuggling: some speculations
The simulations described above have taken account o f the large trade in smuggled sugar, but because o f lack o f information, have not discussed it in detail. Using some survey information on the transport and other transaction costs o f sugar legally exported to Bangladesh by the Petrapole-Benapole land route, and guesses about the level and distribution o f smuggling bribes and economic rents, this section f i rs t o f al l considers whether, and to what extent, legal trade stimulated by an FTA would replace the smuggled trade. Secondly, i t discusses the terms o f trade effects o f the three alternative modalities that have been discussed previously i.e. smuggling which starts wi th Indian free sale prices, Indian wholesale prices, and Indian retai l prices. Thirdly, it deals wi th the losses o f economic rents o f participants in the smuggling networks (“above normal” profits, bribes and other side payments) that would occur in both India and Bangladesh if, following an FTA, legal sugar exports from India to Bangladesh were to replace smuggled exports. Although they are earned illegally and may not receive a high weight in policy decisions, these economic rents should in principal be counted as part o f the change in national economic welfare resulting from policy changes such as the introduction o f an FTA. This section provides some indication o f the possible orders o f magnitude o f these economic rents based on guesstimates about the breakdown o f costs, payoffs and profits in the smuggling networks.
117

India-Bangladesh FTA: Methodology and Selected Case Studies
sugar prices in the two countries. In the second and third simulations, it i s plausible that there would be very substantial reduction as a result o f the reduction o f the price difference by more than two thirds. As already noted, in view o f the congestion that already exists at the principal land border Customs posts, fill equalization o f prices as hypothesized in the f i rst simulation would be unlikely to occur except with a long time lag and after major improvements to transport links and border infrastructure. The continuing price difference estimated at about $56/MT in the second and third simulations seems more realistic. I t has been estimated (see Annex Table ...) by assuming that averages o f expense items in relation to shipment values o f unspecified products, can be applied to sugar shipments. $14 o f the $56/MT consists of estimated transport costs by truck from sugar producing areas to the Petrapole-Benapole border crossing, and it i s possible that smugglers would have n o special advantage over legal exports in this regard. However, most o f the rest ($30/MT) consists o f what the Indian exporters surveyed considered to be excessive costs in clearing Customs, including time lost through excessive delays, “speed money” and bribes, and unnecessary delays in receiving export remittances. Equivalent information on the costs of Bangladesh importers on the Benapole side i s not available: based on the information provided by the Indian exporters (which includes the cost to them o f Bangladesh as well as Indian Customs procedures) it has been arbitrarily assumed that additional handling and “speed money” costs are incurred totalling $12NT, adding up to a total transaction cost o f handling and Customs clearance o f $42/MT.
Wi th an FTA, even though there would be no Bangladesh import duties to pay, exports f rom India would s t i l l require Customs clearance both on the Indian side and in Bangladesh, and if the physical infrastructure and Customs processing capacity remain as limited as they are at present, passing through Customs could be just as expensive66. Previous studies o f Indian informal trade have found that a major attraction o f trading informally rather than formally-especially for small and medium sized businesses-is the absence o f complicated procedures, red tape, “speed money” payments, and delays. Hence it i s quite possible that some smuggling would continue-in this case o f sugar-even if al l Customs duties were to be removed following an FTA. However, the feasibility o f continued smuggling might be confined to operators able to obtain the sugar illegally in bulk from sugar mills at the mill free sale price, since this i s the price that would be paid by traders in the legal export trade. In 2002/03, buying the sugar to be smuggled at the wholesale price-which includes excise taxes and cess-would have cost $26/MT more, offsetting most o f whatever cost advantage there might be o f avoiding the formal route to Bangladesh through the Customs posts. Beyond this, based on these estimates o f transaction costs at Customs, exports starting with purchases at Indian retail prices would not appear to be feasible, since the smugglers would be paying $67/MT more than legal exporters before incurring any o f the transport and other costs o f smuggling the sugar into Bangladesh.
& In order to get some feel for the l ikely magnitudes Table 12 compares estimates and guesstimates o f the ldf prices in Bangladesh o f six different delivery routes: i.e. o f actual imports during FY03 which came by the main sea ports; o f legal imports by the land border Petrapole-Benapole Customs post wi th India; o f smuggled sugar starting with free sale, wholesale, and retail initial purchase; and o f legal land border imports under an India-Bangladesh FTA. Details o f the four supply chains which start with purchase o f sugar at Indian free sale prices are given in Appendix Table 4. T h i s shows some principal components o f the l ikely supply chain between the purchase o f sugar in India at “free sale” mill prices and i t s delivery via the Petrapole-Benapole land crossing to a bulk handling location in Bangladesh, where it competes with BSFIC’s bulk sugar sales. In addition Appendix Table 5 gives one set o f highly speculative numbers on the breakdown o f expenses, bribes and smuggler rents for supply chains starting wi th Indian wholesale and retail prices. The alternative landed duty free
It i s probable, however, that congestion at Customs goes up with the level o f Customs duties on the importing side, since high duties induce greater avoidance efforts and correspondingly more detailed documentation and more time consuming checks and inspections. Hence, if an India-Bangladesh FTA, a new survey o f delays, “speed money” etc might find that the time and cost o f Customs clearance would be considerably lower.
66
118

A Case Study o f the Sugar Industry
prices of these six different ways o f delivering the sugar to Bangladesh are illustrated in F ig 16. Using these estimated Idf prices, and assuming that smuggled sugar originates in equal proportions from purchases at Indian free-sale, wholesale and retail prices, Table 13 provides an estimate o f the aggregate terms o f trade effect o f an FTA for Bangladesh.
Table 12: Bangladesh FY03: Estimates of ldf prices o f sugar according to source before and after an FTA with India
$US/MT Legal ocean imports pre-FTA 228 Legal border imports pre-FTA 234 Smuggled : free sale prices 361 Smuggled :wholesale prices 3 82 Smuggled: retail prices 388 Legal border imports with FTA 307
Table 13: Illustration o f possible terms of trade effect for Bangladesh o f F T A with India: Change in cost o f pre-FTA imports $US million
Replacement o f pre-FTA legal imports f rom India 27.6 7.3
-28.0 6.9
Replacement o f pre-FTA legal imports f rom ROW Replacement o f pre-FTA smuggled imports f rom India Net terms o f trade effect
Notes: Calculated as the difference between the cost o f the imports at ldf prices before the FTA and the cost after the FTA when it is assumed al l Bangladesh imports would come f rom India by the land border. A positive number means that the terms o f trade for Bangladesh worsens and a negative number means that it improves i.e. depending on whether the imports more o f less with the FTA. I t i s assumed that smuggled imports pre-FTA are equally divided between the three modes i.e. purchase in India at the mill free sale price, purchase at the wholesale price, and purchase at the retail price
These simulations illustrate the possibility that much o f the negative terms o f trade effect for Bangladesh resulting from the replacement o f legal sugar imports from ROW and from India, may be offset by a positive terms o f trade effect resulting from the replacement o f illegal imports from India. In this example, the latter i s principally due to the assumption that a substantial portion o f the economic rents in the smuggling activities would be captured in India by Indians, thus increasing the cost o f the sugar to the Bangladesh importers. Smuggled sugar purchased at Indian free sale prices i s assumed to pass through Indian and Bangladesh Customs and to incur the same transport and transaction costs as legal traded sugar, but that large bribes are paid (presumably to Customs and other officials) and above normal profits earned on the Indian side (see Appendix Table 5) before the sugar reaches the Bangladesh participants in the smuggling networks, where further transaction costs are incurred, profits earned and bribes paid. For smuggled sugar purchased in India at wholesale or retail prices, the purchase prices exceed the cost o f legally exported sugar, transport and transaction costs are incurred, and in addition it i s again plausible that some o f the economic rents w i l l be earned and bribes paid on the Indian side. In al l three cases the smuggling profits and bribes paid in India increase the cost o f the smuggled sugar in Bangladesh and, depending on how large they are and the other transport and transaction costs, may create substantial terms o f trade benefits to Bangladesh if legally traded sugar replaces the smuggled sugar following an FTA.
119

India-Bangladesh FTA: Methodology and Selected Case Studies
Pre-FTA smuggling rents: Bangladesh 8O%, India 20% Increase in W before adjustment (from Table 10, col 2)
Adjustment for loss o f smuggling rents
Adjustment for loss o f Indian excise tax and cess included in smuggled sugar
Change in W after adjustments Pre-FTA smuggling rents: Bangladesh 60%, India 40% Increase in W before adjustment (from Table 10, col 2)
Adjustment for loss o f smuggling rents
Adjustment for loss of Indian excise tax and cess included in smuggled sugar
Total adjusted change in W
Bangladesh India Bangladesh + India
86.7 13.3 100.0
-4.8 -4.8
-3 1.5 -7.9 -39.4 55.2 0.6 55.8
86.7 13.3 100.0
-4.8 -4.8
-23.6 -15.7 -39.4 63.1 -7.2 55.8
Economic rents in sugar smuggling: where and how large? As noted above, the economic rents from smuggling-bribes and excess profits o f the smugglers-would disappear if legal border trade were to replace smuggling. In addition, if the purchase price in India o f the smuggled sugar includes the Indian excise tax and cess, this benefit to the Indian central government also disappears. In Table 14 the total economic rent from the smuggling i s estimated as the unexplained difference between purchase prices in India, plus estimated transport and transaction costs, and the prevailing bulk price in Bangladesh. H o w much o f this rent goes to Indians and how much to Bangladeshis i s unknown, but it seems l ikely that the higher share would go to Bangladeshis, since the major barrier the smugglers bypass i s the Bangladesh Customs duties. Indian Customs and other border officials (including the police and border security forces) have less interest in holding up illegal exports since there are no export or other taxes to be collected on them. However, if smuggling i s a well established activity, Customs and other officials on the Indian side w i l l have a good idea o f the payoffs involved and may have considerable leverage resulting from their ability to hold up smuggled consignments-for example by insisting on standard export formalities, or by the explicit or implied threat o f alerting officials on the Bangladesh side. Table 14 illustrates the magnitudes o f the economic rents for two o f many possible splits between India and Bangladesh (20180 and 40160), to which i s added a benefit to India from the sugar excise tax and cess, when the smuggled sugar i s purchased at wholesale or retai l prices. With equal use o f the three smuggling modalities, when 20% o f the economic rents go to Indians and 80% to Bangladeshis, the total economic welfare benefit o f the smuggling in India i s $12.7 mil l ion (excise tax and cess $4.8 mil l ion plus economic rents $7.9 million) and the economic welfare benefit in Bangladesh (entirely smuggling rents) i s $3 1.5 million. With a 40160 percent split o f the economic rents, these two totals are $20.5 mil l ion for India and $23.6 mil l ion for Bangladesh. If legal sugar trade were to replace this smuggled trade following an FTA, these benefits to the people involved with the smuggling would disappear, and if valued equally with the other costs and benefits o f the sugar trade, the aggregate joint welfare increase for India and Bangladesh resulting from the FTA i s reduced very substantially. Using the simulation that recognizes road and other infrastructure constraints to border trade (Table 10 above, second column) the joint aggregate welfare
120
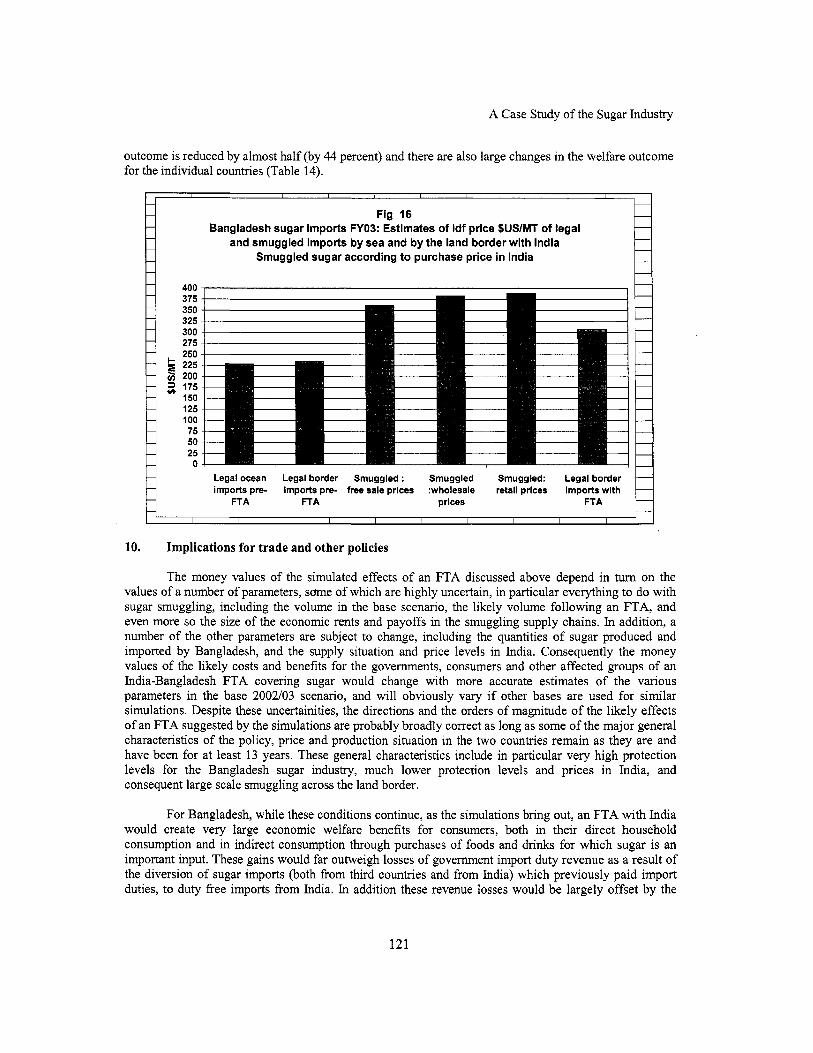
A Case Study o f the Sugar Industry
, 1 I - - Fig 16 -
Bangladesh sugar imports FY03: Estimates of Idf price $US/MT of legal - - - and smuggled imports by sea and by the land border with India - Smuggled sugar according to purchase price in India -
- - -
-
- Legal ocean Legal border Smuggled : Smuggled Smuggled: Legal border - - imports pre- imports pre- free sale prices :wholesale retail prices imports with - - FTA !=TA prices FTA - - -
I I I I I I I I I I
400 375 350 325 300 275 250 225 200 175 150 125 100 75 50 25 0
10. Implications for trade and other policies
The money values o f the simulated effects o f an FTA discussed above depend in turn on the values of a number o f parameters, s a n e o f which are highly uncertain, in particular everything to do with sugar smuggling, including the volume in the base scenario, the likely volume fol lowing an FTA, and even more so the size o f the economic rents and payoffs in the smuggling supply chains. In addition, a number of the other parameters are subject to change, including the quantities o f sugar produced and imported by Bangladesh, and the supply situation and price levels in India. Consequently the money values o f the l ikely costs and benefits for the governments, consumers and other affected groups o f an India-Bangladesh FTA covering sugar would change with more accurate estimates o f the various parameters in the base 2002/03 scenario, and will obviously vary i f other bases are used for similar simulations. Despite these uncertainities, the directions and the orders o f magnitude o f the l ikely effects o f an FTA suggested by the simulations are probably broadly correct as long as some o f the major general characteristics o f the policy, price and production situation in the two countries remain as they are and have been for at least 13 years. These general characteristics include in particular very high protection levels for the Bangladesh sugar industry, much lower protection levels and prices in India, and consequent large scale smuggling across the land border.
For Bangladesh, while these conditions continue, as the simulations bring out, an FTA with India would create very large economic welfare benefits for consumers, both in their direct household consumption and in indirect consumption through purchases o f foods and drinks for which sugar i s an important input. These gains would far outweigh losses o f government import duty revenue as a result of the diversion o f sugar imports (both from third countries and from India) which previously paid import duties, to duty free imports from India. In addition these revenue losses would be largely offset by the
121
India-Bangladesh FTA: Methodology and Selected Case Studies
cessation o f the annual large subsidies paid to keep BSFIC functioning. T h e other principal losers would be people involved in the Bangladesh side o f the sugar smuggling networks, either as direct participants or as recipients o f probably substantial bribes and other side payments, and the managers and employees o f the sugar mills, and sugar cane farmers. In preparing this study, only scraps o f information were available on the sugar industry and why the BSFIC mills and indirectly the farmers apparently require both extremely high protection against imports and high subsidies to remain viable, and one major recommendation for Bangladesh-whether or not an FTA for sugar i s pursued-if for a study which would identify the sources o f the persistent problems and suggest reforms and adjustments that would be compatible with less protectionist and more economically efficient policies67. One key aspect o f such a study would be an assessment o f the gur economy, which normally uses two thirds or more o f sugar cane production. I t should also be recognized that privatization o f BCFIC’s mills on its own i s unlikely to be a solution, if the new owners expect present policies-especially import policies- to continue.
For India, as long as Bangladesh maintains i t s very high protective import duties on imports f rom the rest o f the world, an FTA would make Bangladesh a captive export market and the Indian government would n o longer need to pay export subsidies to enable i t s exporters to compete there with Brazi l and other suppliers. As the Indian industry i s highly competitive with a large number o f producers, unless the Indian government were to intervene, there i s no reason to think that export prices to Bangladesh would diverge much from prevailing free market bulk prices in India Le. they would probably be the same as Indian “free sale” mill prices (excluding the excise and cess) plus transport and Customs clearance costs by the most direct land routes to Bangladesh. During the past 13 years, on average free sale mill prices have exceeded c i f import prices in South Asia by about 15%, and by n o more than about 30% in individual years, and trade and other policies have been managed to prevent large fluctuations in nominal prices. In particular, the Indian government has been wil l ing (as during 1994-98) to allow imports over l ow tar i f fs during periods o f high world prices when imports have been used to contain upward pressures on domestic prices. Recently, starting in about July 2004, in order to increase domestic supplies fol lowing a sharp partly drought- induced reduction in sugar cane production during the 2003104 sugar season, the government has been allowing duty free imports o f raw sugar for refining. Episodes such as these reflect the strong compulsions to keep sugar mills viable while at the same time keeping domestic sugar prices relatively l ow and stable.
The simulations suggest that export prices to Bangladesh under an FTA at price levels that are likely to prevail in India would probably displace two o f the other major sources o f supply i.e. Bangladesh production and imports from the rest o f the world. Legal exports under the FTA would also probably displace most smuggled imports from India, since the incentive to smuggle would be reduced by the narrowing o f the present very large gap between Bangladesh prices and Indian prices. At best, the
A study on comparative advantage in Bangladesh crop production (Shahabuddin and Dorosh (2002), Table 3) estimates low DRC (Domestic Resource Cost ) ratios for sugarcane, implying that sugarcane i s an economically eff icient crop, but very high DRC ratios for sugarcane used in gur production, implying that growing cane for gur i s very ineff icient economically. These estimates and the associated discussion (p 17) -which recognizes the inefficiency of sugar milling-are misleading because they assume that cane nominal protection rates are the same as the sugar and gur nominal protection rates. But cane i s not traded internationally, and protection and cost-benefit estimates should therefore consider cane growing and processing (whether into sugar or gur) as one integrated activity. However, in estimating the DRCs, the Shahabuddin and Dorosh paper only takes account of cane growing costs. Another problem i s that there i s practically no international trade in gur, so the significance o f the extremely high estimate for gur protection (a conversion factor o f 0.38 estimated in a 1994 study, equivalent to a nominal protection rate o f 163%) i s unclear. It i s quite possible the production in Bangladesh o f sugar cane i s low cost and efficient by international standards, but for i t to be worthwhile producing, the processing and marketing of the fmished products also has to be efficient. Sugar cane production for gur may also be economically efficient, but only if the total costs from cane growing to gur production are comparable to the equivalent costs in India, which i s effectively the only alternative source for gur.
67
122

A Case Study o f the Sugar Industry
smugglers would be able to obtain Indian sugar for smuggling at the same free sale price as the legal exporters, and would then have to fit whatever transport and other costs including bribes they need to incur, within narrower gross margins than i s the case at present. Consequently, from the Indian viewpoint, the welfare gain resulting from the absence o f export subsidies on legal exports would need to be balanced by the loss o f whatever economic rents and side payments are presently received by Indians participating in or benefiting from the smuggling trade. On the other hand the net increase in Indian sugar exports to Bangladesh (after allowing for already existing legal and smuggled trade) would be quite small (only two or three percent) in relation total Indian supply and demand, and would be unlikely to have much impact on domestic Indian prices, and hence would only involve small consumer surplus losses for Indian sugar consumers. Because o f the relatively limited l ikely impact o f an FTA with Bangladesh on the sugar industry in India, there are no special implications for the trade and other policies which affect India’s sugar industry.68 There is an extensive literature on this topic 69and i t i s not dealt with in th i s paper.
The economic welfare simulations and the above discussion have proceeded on the key assumption that Bangladesh would retain very high sugar tariffs following an FTA, but there would be l i t t le point in doing so if, as suggested by the simulations, production would cease in al l or most o f the BSFIC sugar mills and the sugar cane farmers which supply them, and al l imports from the rest o f the world would be replaced by duty free imports from India. In that case it would be rational for the Bangladesh government to rethink i t s tariff and tax policies: for example, it could withdraw the supplementary duty and cease using the VAT as an additional protective tariff by withdrawing the VAT exemption o f domestic sugar production, and could set a moderate or l ow general MFN protective sugar tariff as a way o f setting a competitive constraint and upper limit on the price o f sugar imported from India under the FTA. As part o f the FTA it would also be in Bangladesh’s interests to negotiate an agreement under which India would agree not to impose quantitative restrictions on sugar exports to Bangladesh, even though-as in the past-India might restrict exports to other countries in order to contain upward pressures on i t s own domestic prices. During periods o f shortages in India, Bangladesh could also allow imports from other countries over l ow or zero tariffs. Otherwise, it i s quite conceivable that sugar supplies in India might be augmented by low or zero tari f f imports, while locally produced Indian sugar might be simultaneously exported at higher prices under the FTA to Bangladesh. If that were to happen, even though l ikely FTA rules o f origin would prevent the imported sugar i t s e l f from being re-exported to Bangladesh, Indian producers and traders as a group would nevertheless make an arbitrage profi t at the expense o f Bangladesh consumers.
The above reforms o f Bangladesh sugar policies that would make sense i f sugar were to be included in an India-Bangladesh FTA or in SAFTA, underline the major general conclusion o f the simulation discussion that from Bangladesh’s viewpoint, unilateral tariff cuts that are large enough would have an even bigger net economic welfare payoff than the l ikely economic welfare net gains f rom an FTA. As noted in that discussion, under al l plausible scenarios, sugar imported duty fkee from India under an FTA will involve a terms o f trade loss to Bangladesh, because i t will generally cost more and will never cost less than the prevailing world price at the Bangladesh border. Wi th a zero MFN tariff, the gain to Bangladesh consumers will be bigger than the gain wi th an FTA, and if, in the absence o f an FTA, Bangladesh were to fix an import duty equal to the excess o f the domestic sugar price in India over c i f import prices, net economic welfare in the country would be higher than it would be under an FTA by the amount o f the import duties collected. A zero or low MFN tarif f would also eliminate or drastically reduce the incentive to smuggle by eliminating or cutting the excess o f Bangladesh over Indian domestic prices. However, if Bangladesh were to follow these policies, India would be worse o f f than it would be
If the sugar industry were included under SAFTA the impact in India would be greater owing to the inclusion o f Pakistan’s sugar industry as well as the Bangladesh industry. See Gulati, Purse11 and Mullen (2003) and references given there. 69
123
India-Bangladesh FTA: Methodology and Selected Case Studies
wi th an FTA, f i rst because Bangladesh would not be a captive market for Indian sugar exports, and exports would need to be subsidized if it was decided to promote them to help get rid of excess stocks created once again by defective domestic policies, and secondly because o f the loss o f the economic rents from the smuggling trade. On the other hand, exporters in Brazil, Thailand, Australia and other sugar exporting countries would not be shut out o f the Bangladesh market and would benefit from the larger volume o f exports to Bangladesh resulting from the reduced tar i f fs and prices.
124
A Case Study o f the Sugar Industry
References
Rahman, Aneeka (2003). Policy Regime in the Sugar Sector,World Bank Dhaka office. Policy note, July.
Bayes, Abdul(2004). Technical Smuggling: Impressions from Informal Investigations, India-Bangladesh trade study, draft project report
Bayes, Abdul(2004). India-Bangladesh Trade 2002: Informal Imports from India, India-Bangladesh trade study, draft project report
Goyal, Arun (2004). Study on Financing of India-Bangladesh Trade, India-Bangladesh trade study, draft project report
Mehta, Rajesh (2004). An Overview and Analysis of India ’s Trade with Bangladesh, India-Bangladesh trade study, draft project report
Das, Samantak and Sanjib Pohit (2003). Quanti5ing the Transport, Regulatory and Other Costs of Indian Overland Exports to Bangladesh, NCAER: India-Bangladesh trade study, project report
Pursell, Gany (2004). Analyzing the Economic Welfare Consequences of a Free Trade Agreement: Partial Equilibrium Methods fo Industry Level Studies, India-Bangladesh trade study, draft project report
Pohit, Sanjib and Nisha Taneja (2000). India’s Informal Trade with Bangladesh and Nepal: A Qualitative Assessment, ICRIER Working Paper no 58, New Delhi
Chadhuri, S.K. and others (1995). Cross Border Trade between India and Bangladesh, NCAER Working Paper, New Delhi
Taneja, Nisha (2001). “Informal Trade in SAARC Region”, Economic and Political Weekly, March 17- 9-l LJ
Das, Samantak, Somnath Mukherjee and Sowmya Srinivasan (2003). Study of a Sample ojProducts/ Industries, NCAER: India-Bangladesh trade study, project report
World Bank (2003). Bangladesh: Pubilic Expenditure Review, World Bank Report No. 24370 BD
Goyal, Arun (2004). Easy Reference Customs Tarij-2004-2005, Academy o f Business Studies, New Delhi
Faruquee, Rashid ed (1998). Bangladesh Agriculture in the 2Ist Century, University Press, Dhaka
CMIE (2004). Industry Market Size and Shares, Centre for Monitoring the Indian Economy, July. Mumbai
Bangladesh Bank. Economic Trends, Monthly. Various dates
Pursell, Gany and Anju Gupta (1998). Trade Policies and Incentives in Indian Agriculture. Background Paper I: Sugar and Sugarcane, World Bank Policy Research Working Paper no, 1953. August
Acharya, Shankar and Associates (1 985). Aspects of the Black Economy in India, Government o f India, Ministry of Finance. March
125
India-Bangladesh FTA: Methodology and Selected Case Studies
Goldar, B.N. and Ashok Gulati (1991). Effective Incentives for Sugarcane and Sugar, Mimeo. August
Kalra, G.D. and Ashok Gulati (1992). Effective Incentives in India’s Agriculture: Canegur and Sugar Cane in Uttar Pradesh, Mimeo. April
Bangladesh Bureau o f Statistics. Statistical Bulletin Bangladesh, Monthly. Various Issues
Gulati, Ashok, G a r y Pursell and Kathleen Mullen (2003). Indian Agriculture Since the Reforms: Pe$ormance, Policy Environment, and Incentives, Mimeo, May. Report prepared for the World Bank
Akram, Tanweer. “Public Enterprise Inefficiency and the Road to Privatization in Bangladesh”
Gulati, Ashok and Sudha Narayanan (2003). Subsidy Syndrome in Indian Agriculture, Oxford University Press. New Delhi
Ahluwalia, Deepak and Ashok Gulati (1 999). India s Sugar Industly- Priorities for Reform, Paper presented at NCAER-IEG-World Bank workshop, New Delhi April 15-16
India Infoline (2004). Sector Database: Sugar, www.indiainfoline.com 18 Feb 2004
USDA (2003). Indian Sugar Annual 2003, GAIN Report #IN3028 dated 4l1012003
Government o f India (1998). Mahajan Committee on Sugar Industly, Summary o f the Committee’s recommendations at http:l/members.tripod,com
Directorate o f Sugar, Ministry o f Food and Civi l Supplies (2004), Summary o f Indian sugar policies as o f October 2004 http://fcamin.nic.idDir Of Sue.htm
Borell, Brent (1999). A New Era in World Sugar Trade Implications for South Asian Countries, Chapter 11 in Blarel, Benoit
Gany Pursell and Albert0 Valdes (eds). Implications of the Uruguay Round Agreement for South Asia: The Case of Agriculture
Indian Sugar Mills Association (2004). Sugar Situation www.indiansuaar.com
Government o f India (2002). Report on the Committee on Informal Cross Border Trade, Ministry of Commerce and Industry, Department o f Commerce, Economic Division
Shahabuddin, Quazi and Paul Dorosh (2002). Comparative Advantage in Bangladesh Crop Production, International Food Policy Research Institute , MSSD Discussion Paper No 47. October
Rahman, A. and A. Razzaque (1998). Informal Border Trade between Bangladesh and India: an Empirical Study in Selected Areas, Bangladesh Institute o f Development Studies
Bakht,Z. (1996). Cross Border Illegal Trade in Bangladesh: Composition, Trends and Policy Issues. Bangladesh Institute o f Development Studies
126

A Case Study of the Sugar Industry
Ghafur, A, Mainul Islam and Naushad Faiz (1991). Illegal International Trade in Bangladesh: Impact on the Domestic Economy, Phase I and 11, Bangladesh Institute o f Development Studies
World Bank (2002). Bangladesh: Agricultural Growth and Rural Poverty Dynamics: A Regional Perspective, South Asia Rural Development Unit, July 1. Mimeo
127
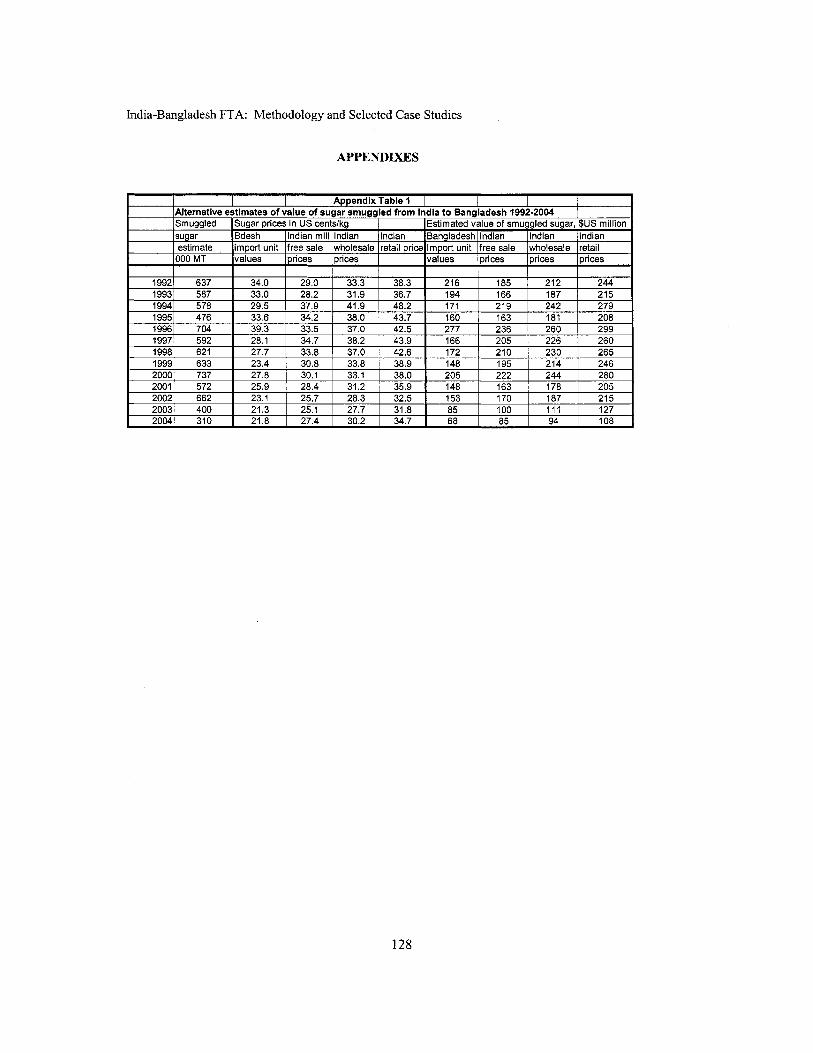
India-Bangladesh FTA: Methodology and Selected Case Studies
APPENDIXES
128

A Case Study o f the Sugar Industry
Bangladesh Production, imports, consumption '000 MT Production Recordered imports from ROW Recordered imports from India Smuggled imports from India Consumption
Appendix Table 2 Production and price parameters for economic welfare analysis FY03
177 93
349 400
1019
Average exchange rate Taka/$US Protective import tax rate Total imoort tax rate
57.9 86.4% 86.4%
IAverane demand elasticity 1 -0.361
Port costs Landed cost at port Landed duty free (Idf) price
Domestic prices $US/MT Ex-mill Retail Dhaka
ImDort unit value 21 3
15 329 228
I Domestic prices $US/MT
Retail Dhaka 539
-
I 437 -
I
India Avg exch rate Rupees/$US Prices $US/MT Export unit value to Bangladesh fob Explicit export subsidies Balance incl other export subidies Free sale mill price excl taxes Wholesale margin Indirect taxes
Protective import taxes 95 AIT 6
48.4
215 21 15
251 8
18 Wholesale price incl indirect taxes Distribution costs and retail margins
277 41
[Retail mice I 31 81
129

dia-Bangladesh FTA: Methodology and Selected Case Studies
130

A Case Study of the Sugar Industry
Appendix Table 41 Indian legal and smuggled sugar exports to Bangladesh by the land border in 2002/03: estimates and guesstimates of principal transport and transaction costs, taxes, subsidles,bribes and economic rents (Petrapole-Benapole route)
I I Z I I S ~ M T I I i i I
(1) From Appendix Table 3 (2) Guesstimate of average distance 300 km at Rs 18/km on a 10 ton truck. Freight rate estimate from Das, Mishra 8 Pohit
(3),(4),(5), (7), (9) calculated from survey data in Das, Mishra and Pohit (2003). Have used averages of shipment values. (6) is arbitrary: assumed only paid when legal import duties are avoided. For legal exports speed money only. (11) Calculated from export subsidy rates given in this paper (12) Excess of (13) over (10)+(11). includes estimation errors 13) From Das, Mishra and Pohit (2003)
al to speed money on indian side of Customs 5) Idf means “landed duty free” i.e. cif+handling and Customs clearance expenses
ney only when legal import duties are paid. Bribes only when duties are not paid. Bribe amount med with FTA, since there are no import duties: speed money only.
In Appendix Table 4, the f i rs t set o f estimates is for legal exports by the Petrapole-Benapole land route. It i s based on actual prices, Indian export subsidy rates and Bangladesh import duties during 2002103, estimates o f average costs and exporter margins on the Indian side from an exporter survey in September 2002, and the arbitrary assumptions that “speed money” payments and handling costs would have been the same in the Bangladesh part o f the Customs and transfer process as in the Indian part. T h i s gives an estimated “landed duty free” (ldf) price o f sugar in Bangladesh o f $234/MT: it slightly exceeds the estimated ldf price ($228/MT) at Bangladesh sea ports (principally Chittagong) because o f the assumption that delays and “speed money” payments are greater on both the Indian and Bangladesh sides, more than offsetting the other obvious cost advantages o f trade by the land border.
The second set o f estimates i s for sugar smuggled in bulk by the Petrapole-Benapole route, presumably involving complicity by on the part o f Customs and other officials on both sides. The cost components o f this logistics chain are assumed to be the same as for legally traded sugar, with the key differences that India’s export subsidies and Bangladesh’s very high protective import duties are not paid, the difference (Bangladesh import duties minus Indian export subsidies) being absorbed by bribes on the Indian side, exporter margins on the Indian side, bribes on the Bangladesh side, and importer margins on
131
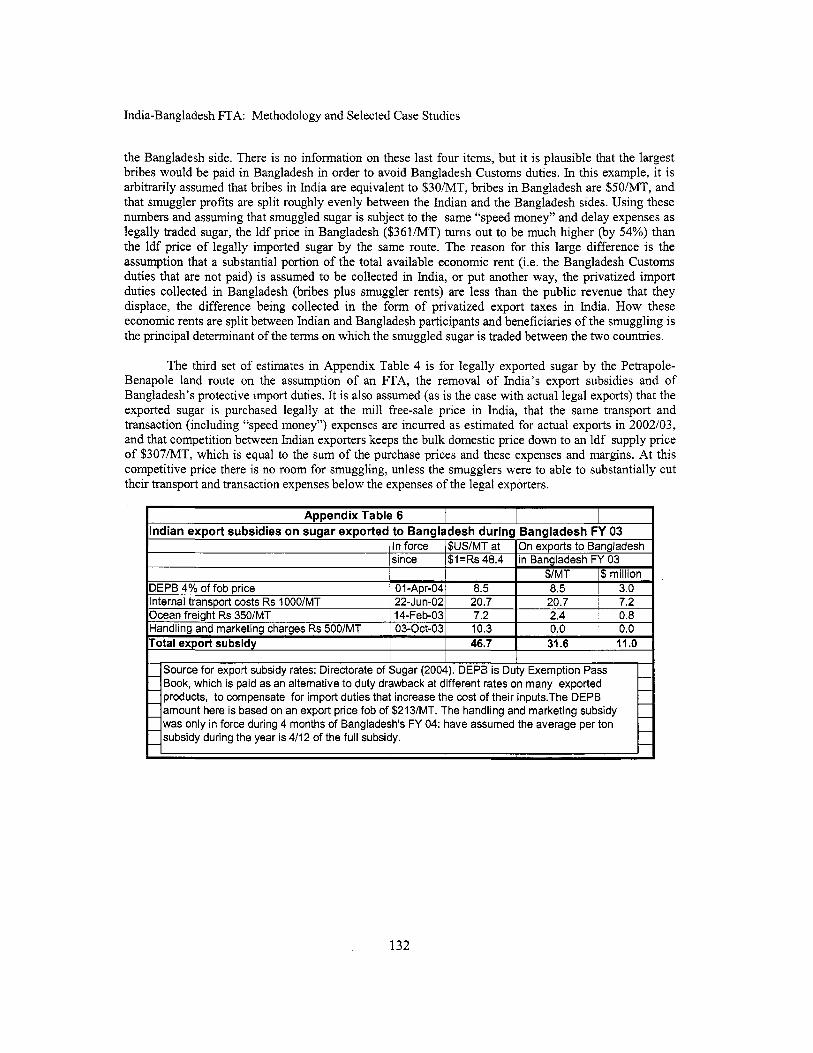
India-Bangladesh FTA: Methodology and Selected Case Studies
Source for export subsidy rates: Directorate of Sugar (2004). DEPB is Duty Exemption Pass - - -
- -
- Book, which is paid as an alternative to duty drawback at different rates on many exported - products, to compensate for import duties that increase the cost of their inputs.The DEPB
amount here is based on an export price fob of $213/MT. The handling and marketing subsidy - was only in force during 4 months of Bangladesh’s FY 04: have assumed the average per ton - subsidy during the year is 4/12 of the full subsidy.
the Bangladesh side. There i s no information on these last four items, but it i s plausible that the largest bribes would be paid in Bangladesh in order to avoid Bangladesh Customs duties. In this example, it i s arbitrarily assumed that bribes in India are equivalent to $30NT, bribes in Bangladesh are $50/MT, and that smuggler profits are split roughly evenly between the Indian and the Bangladesh sides. Using these numbers and assuming that smuggled sugar i s subject to the same ‘‘speed money” and delay expenses as legally traded sugar, the ldf price in Bangladesh ($361/MT) turns out to be much higher (by 54%) than the ldf price o f legally imported sugar by the same route. The reason for this large difference i s the assumption that a substantial portion o f the total available economic rent (i.e. the Bangladesh Customs duties that are not paid) i s assumed to be collected in India, or put another way, the privatized import duties collected in Bangladesh (bribes plus smuggler rents) are less than the public revenue that they displace, the difference being collected in the form o f privatized export taxes in India. H o w these economic rents are split between Indian and Bangladesh participants and beneficiaries o f the smuggling i s the principal determinant o f the terms on which the smuggled sugar i s traded between the two countries.
The third set o f estimates in Appendix Table 4 i s for legally exported sugar by the Petrapole- Benapole land route on the assumption o f an FTA, the removal o f India’s export subsidies and of Bangladesh’s protective import duties. I t i s also assumed (as i s the case with actual legal exports) that the exported sugar i s purchased legally at the mill free-sale price in India, that the same transport and transaction (including “speed money”) expenses are incurred as estimated for actual exports in 2002103, and that competition between Indian exporters keeps the bulk domestic price down to an ldf supply price o f $307/MT, which i s equal to the sum o f the purchase prices and these expenses and margins. At this competitive price there i s no room for smuggling, unless the smugglers were to able to substantially cut their transport and transaction expenses below the expenses o f the legal exporters.
132
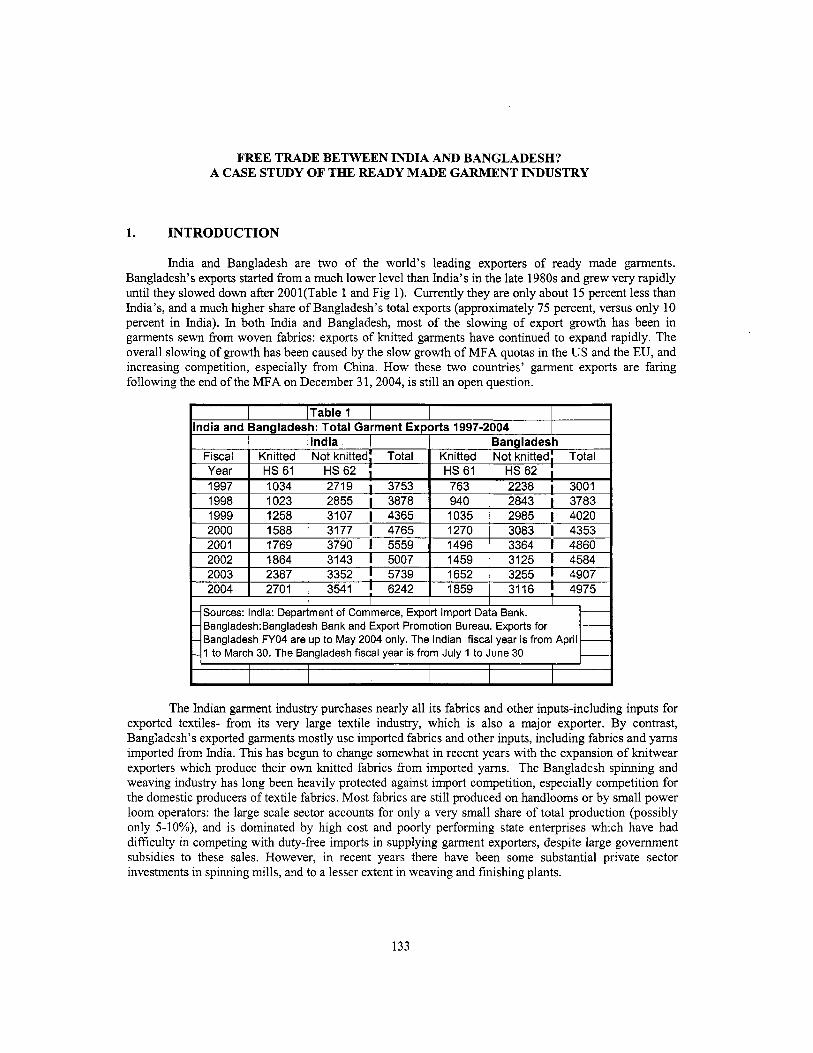
FREE TRADE BETWEEN INDIA AND BANGLADESH? A CASE STUDY OF THE READY MADE GARMENT INDUSTRY
- - -
1. INTRODUCTION
Bang1adesh:Bangladesh Bank and Export Promotion Bureau. Exports for - Bangladesh FY04 are up to May 2004 only. The Indian fiscal year is from April - 1 to March 30. The Bangladesh fiscal year is from July 1 to June 30 -
India and Bangladesh are two o f the world’s leading exporters o f ready made garments. Bangladesh’s exports started from a much lower level than India’s in the late 1980s and grew very rapidly until they slowed down after 2001(Table 1 and F ig 1). Currently they are only about 15 percent less than India’s, and a much higher share o f Bangladesh’s total exports (approximately 75 percent, versus only 10 percent in India). In both India and Bangladesh, most o f the slowing o f export growth has been in garments sewn from woven fabrics: exports o f knitted garments have continued to expand rapidly. The overall slowing o f growth has been caused by the slow growth o f MFA quotas in the U S and the EU, and increasing competition, especially from China. How these two countries’ garment exports are faring following the end o f the MFA on December 3 1,2004, i s s t i l l an open question.
T h e Indian garment industry purchases nearly al l i t s fabrics and other inputs-including inputs for exported textiles- from i t s very large textile industry, which i s also a major exporter. By contrast, Bangladesh’s exported garments mostly use imported fabrics and other inputs, including fabrics and yarns imported from India. T h i s has begun to change somewhat in recent years with the expansion o f knitwear exporters which produce their own knitted fabrics from imported yams. The Bangladesh spinning and weaving industry has long been heavily protected against import competition, especially competition for the domestic producers o f textile fabrics. Most fabrics are s t i l l produced on handlooms or by small power loom operators: the large scale sector accounts for only a very small share o f total production (possibly only 5-IO%), and i s dominated by high cost and poorly performing state enterprises which have had difficulty in competing wi th duty-free imports in supplying garment exporters, despite large government subsidies to these sales. However, in recent years there have been some substantial private sector investments in spinning mills, and to a lesser extent in weaving and finishing plants.
133

t I I I 1
7000
6000
5000 E s I 4000 2 9 3000 v1
a000
1000
0
I-I__ II I
1997 1998 l99S 2000 2001 2002 2003 2004
i~ fens ’ and boys’ cotton Frrst, they arc rrprrsen
i ~ ~ o r t a ~ ~ in both India’s and
study for a number ofreasons. from woven fabrics whreh 3re also very
notably men’s arid boy’b slttris ’ cotton and non -c~?~ t~n trousers.
~ ~ ~ ~ r d ~ y . M&B woven cotton shirts account for targc s’nare5 o f Xncha’s and ~ a ~ ~ l a d ~ ~ h ‘ ~ g ~ r ~ ~ ~ c ~ ~ ~ exports, about I O pcrccnt o f in both cot (EIS 62) garnicnt exports. If thcrc is p uouid sccni plausihlr to supposc that rherr would he a similar potenmi for bilateral trade In othcr s m h r
and 17 percent and 16
134

A Case Study o f the Ready Made Garment Industry
woven garments. To illustrate this point, Table 2 shows the available data on India’s and Bangladesh’s exports o f woven cotton trousers and shirts. Bangladesh exports o f cotton trousers have been more than three times India’s, whereas Indian exports o f cotton shirts are considerably greater than Bangladesh’s. A priori, this suggests that the prospects for Bangladesh cotton trouser exports to India would be better than the prospects for cotton shirts, but as noted in the next section in recent years there have been some non- negligible cotton shirt exports but practically no exports o f cotton trousers.
-Sources: India: Department of Commerce, Export Import Data Bank. - Bang1adesh:Banglades.h Bank and Export Promotion Bureau. The Indian - -fiscal year is from April 1 to March 30. The Bangladesh fiscal year is from - -July 1 to June 30. Bangldesh exports classified by these HS codes are not - -available after 2001 -
-
Fourth, although hard data i s missing (see later discussion) it i s obvious that there are very large domestic markets for cheap cotton shirts in both countries, and large markets for similar inexpensive garments.
Fifth, cotton shirts are representative o f low value mass- consumption garments in which many Bangladeshis believe they have a competitive advantage viz-a-viz India, and which are commonly considered to be one o f the few Bangladesh manufactured products with major potential markets in India if tariffs were to be removed.
Sixth, cotton shirts and similar garments provide an especially clear illustration o f the complex and difficult political economy issues in India and Bangladesh that complicate discussions o f more open trade relations between them. In both countries there are long histories o f government intervention, not only in the garment sectors per se, but even more in the two countries’ textile sectors, which inevitably would have to be included in discussions about more open trade in garments.
The next section o f this paper summarises some key features o f the structure of, and recent developments in the Indian industry, focusing especially on import and other policies that are relevant for Bangladesh RMG exports to India. The third section o f the paper brief ly outlines some o f the principal features o f the Bangladesh RMG industry and the trade and other policies which affect it. The fourth section discusses the l ikely economic welfare consequences o f a bilateral FTA between India and Bangladesh (or free trade under SAFTA) on the assumption that readymade garments would be included in the agreements, and includes some simulations o f the possible economic welfare effects o f Bangladesh exports o f cotton shirts to India. No attempt i s made to simulate the l ikely consequences o f garment
135
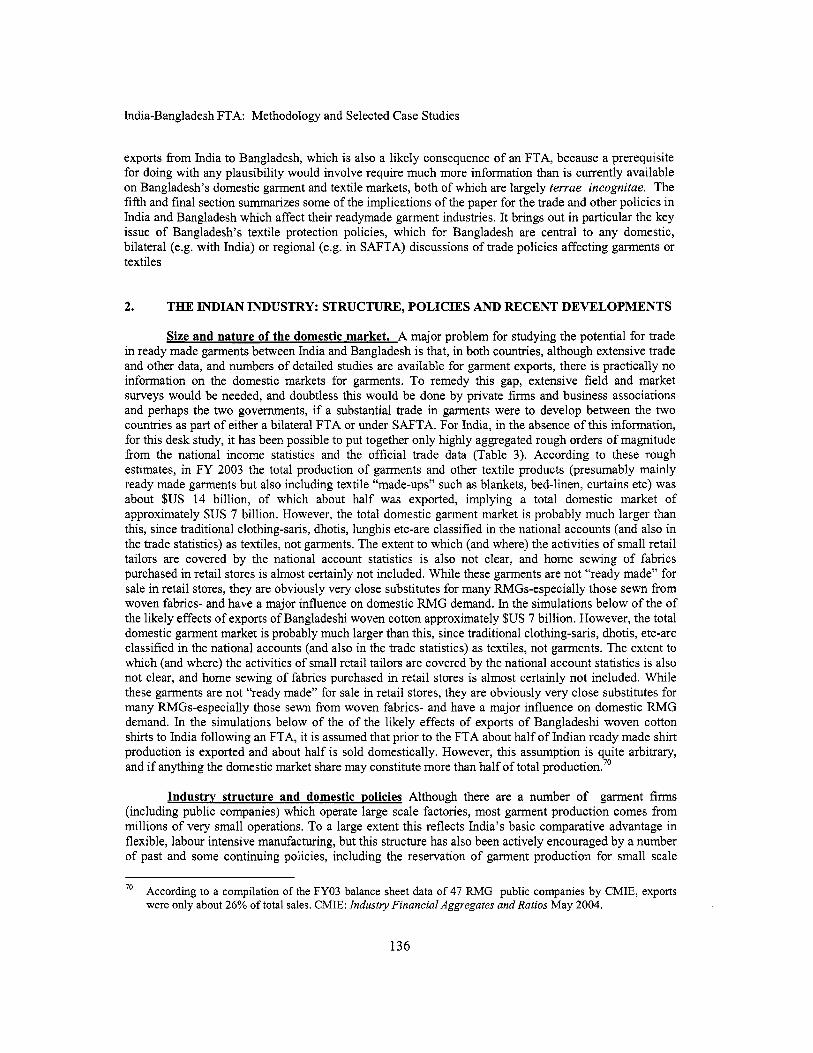
India-Bangladesh FTA: Methodology and Selected Case Studies
exports from India to Bangladesh, which i s also a l ikely consequence o f an FTA, because a prerequisite for doing with any plausibility would involve require much more information than is currently available on Bangladesh’s domestic garment and textile markets, both o f which are largely terrae incognitae. T h e fifth and final section summarizes some o f the implications o f the paper for the trade and other policies in India and Bangladesh which affect their readymade garment industries. I t brings out in particular the key issue o f Bangladesh’s textile protection policies, which for Bangladesh are central to any domestic, bilateral (e.g. wi th India) or regional (e.g. in SAFTA) discussions o f trade policies affecting garments or textiles
2. THE INDIAN INDUSTRY: STRUCTURE, POLICIES AND RECENT DEVELOPMENTS
Size and nature o f the domestic market. A major problem for studying the potential for trade in ready made garments between India and Bangladesh i s that, in both countries, although extensive trade and other data, and numbers o f detailed studies are available for garment exports, there i s practically no information on the domestic markets for garments. To remedy this gap, extensive f ield and market surveys would be needed, and doubtless this would be done by private f i rms and business associations and perhaps the two governments, if a substantial trade in garments were to develop between the two countries as part o f either a bilateral FTA or under SAFTA. For India, in the absence o f this information, for this desk study, it has been possible to put together only highly aggregated rough orders o f magnitude from the national income statistics and the official trade data (Table 3). According to these rough estimates, in FY 2003 the total production o f garments and other textile products (presumably mainly ready made garments but also including textile “made-ups’’ such as blankets, bed-linen, curtains etc) was about $US 14 billion, o f which about hal f was exported, implying a total domestic market o f approximately $US 7 billion. However, the total domestic garment market i s probably much larger than this, since traditional clothing-saris, dhotis, lunghis etc-are classified in the national accounts (and also in the trade statistics) as textiles, not garments. The extent to which (and where) the activities o f small retail tailors are covered by the national account statistics i s also not clear, and home sewing o f fabrics purchased in retail stores i s almost certainly not included. While these garments are not “ready made” for sale in retail stores, they are obviously very close substitutes for many RMGs-especially those sewn from woven fabrics- and have a major influence on domestic RMG demand. In the simulations below o f the of the l ikely effects o f exports o f Bangladeshi woven cotton approximately $US 7 billion. However, the total domestic garment market i s probably much larger than this, since traditional clothing-saris, dhotis, etc-are classified in the national accounts (and also in the trade statistics) as textiles, not garments. T h e extent to which (and where) the activities o f small retail tailors are covered by the national account statistics i s also not clear, and home sewing o f fabrics purchased in retail stores i s almost certainly not included. While these garments are not “ready made” for sale in retail stores, they are obviously very close substitutes for many RMGs-especially those sewn from woven fabrics- and have a major influence on domestic RMG demand. In the simulations below o f the o f the likely effects o f exports o f Bangladeshi woven cotton shirts to India following an FTA, it i s assumed that prior to the FTA about hal f o f Indian ready made shirt production i s exported and about half i s sold domestically. However, this assumption i s quite arbitrary, and if anything the domestic market share may constitute more than hal f o f total production.”
Industrv structure and domestic policies Although there are a number o f garment f i rms (including public companies) which operate large scale factories, most garment production comes from millions o f very small operations. To a large extent this reflects India’s basic comparative advantage in flexible, labour intensive manufacturing, but this structure has also been actively encouraged by a number o f past and some continuing policies, including the reservation o f garment production for small scale
According to a compilation o f the FY03 balance sheet data o f 47 RMG public companies by CMIE, exports were only about 26% o f total sales. CMIE: Industly Financial Aggregates and Ratios May 2004.
70
136
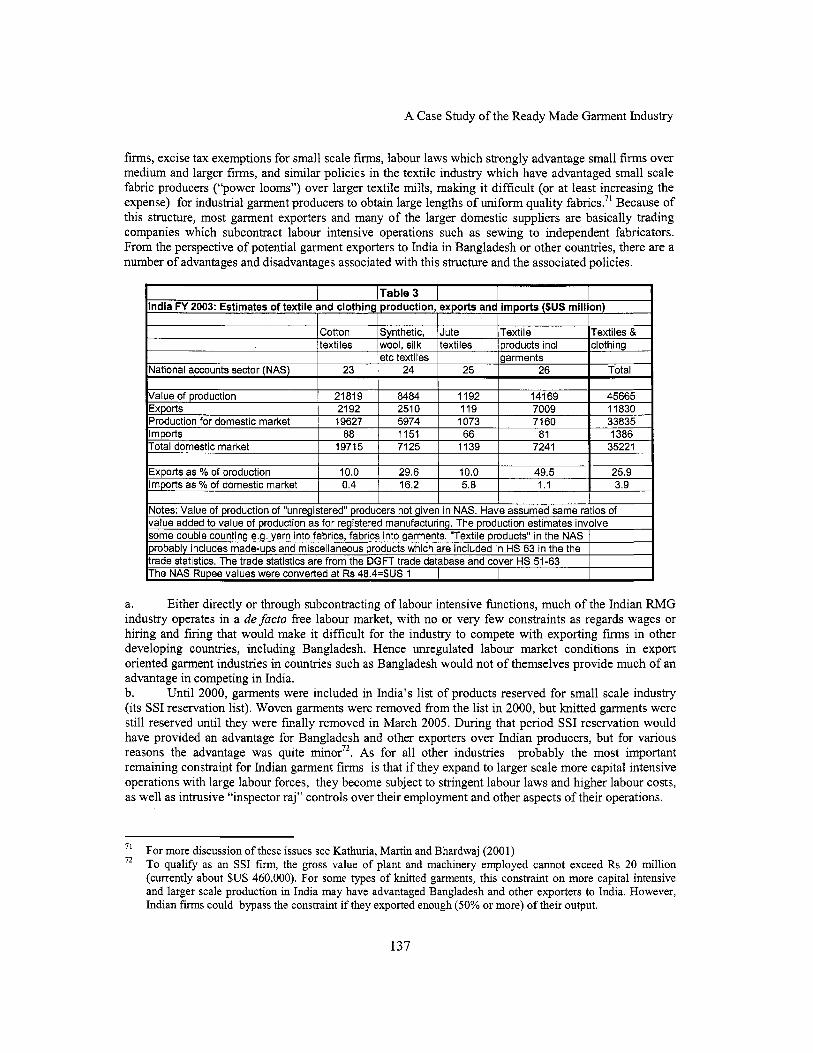
A Case Study o f the Ready Made Garment Industry
Exports as % of production Imports as % of domestic market
10.0 0.4
29.6 10.0 49.5 25.9 16.2 5.8 1 .I 3.9
I I 1
India FY 2003: Estimates of textile and clothing production, exports and imports ($US million) I I I I I I
Notes: Value of production of ”unregistered” producers not given in NAS. Have assumed same ratios of value added to value of production as for registered manufacturing. The production estimates involve some double counting e.g. yarn into fabrics, fabrics into garments. “Textile products” in the NAS probably includes madeups and miscellaneous products which are included in HS 63 in the the trade statistics. The trade statistics are from the DGFT trade database and cover HS 51-63 The NAS Rupee values were converted at Rs 48.4=$US 1
a. Either directly or through subcontracting o f labour intensive functions, much o f the Indian RMG industry operates in a de facto free labour market, with no or very few constraints as regards wages or hir ing and firing that would make it difficult for the industry to compete wi th exporting f i rms in other developing countries, including Bangladesh. Hence unregulated labour market conditions in export oriented garment industries in countries such as Bangladesh would not o f themselves provide much o f an advantage in competing in India. b. Unt i l 2000, garments were included in India’s l i s t o f products reserved for small scale industry (its SSI reservation list). Woven garments were removed from the l i s t in 2000, but hi t ted garments were s t i l l reserved until they were finally removed in March 2005. During that period S S I reservation would have provided an advantage for Bangladesh and other exporters over Indian producers, but for various reasons the advantage was quite minor7*. As for al l other industries probably the most important remaining constraint for Indian garment f i rms i s that if they expand to larger scale more capital intensive operations wi th large labour forces, they become subject to stringent labour laws and higher labour costs, as wel l as intrusive “inspector raj” controls over their employment and other aspects o f their operations.
71
12 For more discussion o f these issues see Kathuria, Mar t in and Bhardwaj (2001) To qualify as an SSI finn, the gross value o f plant and machinery employed cannot exceed Rs 20 mi l l ion (currently about $US 460,000). For some types o f knitted garments, th is constraint on more capital intensive and larger scale production in India may have advantaged Bangladesh and other exporters to India. However, Indian fm could bypass the constraint if they exported enough (50% or more) o f their output.
137

India-Bangladesh FTA: Methodology and Selected Case Studies
c. Indian small scale firms benefit from excise tax exemption^^^, whereas larger Indian firms and all imports are subject to normal excise tax rates. In the past, as intended, this considerably improved the position o f small scale f i rms competing against medium and larger Indian f m s , and increased the protection rate o f small f i rms against import competition. However, for a number o f reasons the extent of the extra protection provided in this way to small firms at present appears to be minimal, especially in the garment industry. At present the general rules are that firms with annual sales o f Rs 4 Crores or less (approximately $900,000 or less)74 can choose between75:
excise duty exemption on the first 1 crore ($225,000) o f sales but no CENVAT credit, plus normal excise duty on the next 3 crores ($690,000) o f sales, but subject to CENVAT credit; and 60% o f the normal excise duty on the first Crore o f sales but subject to CENVAT credit, and normal excise duty on the next 3 crores) of sales, but subject to CENVAT credit.
The CENVAT credit refers to VAT style credit for excise taxes on inputs, so that when a full exemption for the f i rst slab o f sales i s claimed under option (a) above, the net resulting benefit i s very small owing to the loss o f this credit. The subsidy to small garment f i rms i s even less, because the excise taxrate on pure cotton garments and fabrics i s only 4%, and non-cotton garments and fabrics 8%, compared to the general normal excise tax rate o f 16%. For a small firm with Rs 1 Crore sales o f cotton woven garments, the subsidy relative to non-SSI producers and to imports i s equivalent to only about 1.2% o f sales, and for an SSI firm with cotton garment sales o f 4 Crores, the subsidy i s equivalent to only 0.3% o f sales. The S S I excise tax benefit for hosiery f i rms using synthetic filament yams and polyester yams i s even less, since whereas the garment excise tax rate i s 8% the excise tax rates on these two yams are 16%.
Non-tariff barriers to imports. For about 40 years clothing and also textiles were included in India’s import licensing system for consumer goods, which, with only a few exceptions, amounted to an import ban. Import licensing o f consumer goods was lifted for SAPTA countries in 1998. Starting about then, for the rest o f the world it was removed in stages for different groups o f products: textiles and clothing were included in the final stage o f the process which became effective on April 1, 2001. During the long import licensing period, the principal exception to the de facto general import ban, was for textiles used as inputs into exported products. These could be imported duty free using special (“advance”) import licenses, or imported under other arrangements for exporters. During the late 1990s, some very limited imports o f textiles for use in the domestic market were also possible using “special” import licenses (SILs), which were issued to exporters as a special incentive and allowed them to import products which were otherwise restricted.
Two months after the removal o f general import licensing by the central government, in June 2001, West Bengal extended i t s luxury tax to include a l i s t o f products “not manufactured or made in India”. The l i s t included readymade garments on which the tax rate was set at 20%. A 5% luxury tax was also imposed on a few domestically made garments selling at “luxury” prices e.g. shirts and T-shirts selling for more than Rs 500, but otherwise Indian garments were exempt. The West Bengal finance minister referred to the tax as “a desperate bid to protect ... domestic industry”.76 Later on, in response to objections from the Bangladesh government, the Indian side was reported as saying that “the tax was not
The excise concessions for sma l l scale firms (based on sales and applying to a l l fm) are quite separate from the SSI reservation rules, which reserve certain products for production by small scale firms, where “small scale” i s defined by gross assets. This limit was increased from 3 Crores to 4 Crores in the 2005106 budget. The excise tax rules in relation to sma l l scale industries are at <www.laghu-udyog.codpolicies/centraV- ed.htm> The Hindu Business Line, July 22,2001. At www.thehindubusinessline.com
73
74
75
76
138
A Case Study o f the Ready Made Garment Industry
exclusively aimed at Bangladesh products””, but it undoubtedly would have had this effect, as the main land border crossings for trade with Bangladesh are in West Bengal, and Haldia i s the closest and most convenient seaport. In any case it was a clear breach o f the WTO national treatment pr in~iple’~, and seems to have been dropped in about August, 2002”. But it would have been a major impediment to Bangladesh readymade garment exports to India, and probably slowed down their growth during the 14 months that it was in force. At the time West Bengal imposed the tax, a number o f other Indian states were reported to be examining the possibility o f imitating it, but as o f February 2004 none appeared to have done soso. Consequently, since August 2002, it appears that garment imports in India have been free o f non-tariff barriers and that tar i f fs have been the sole protective instrument.
Tariffs Before the final removal o f the textile and clothing import ban, with the support o f the Ministry o f Textiles, the T&C industry lobbied the government to impose specific duties on a large number o f textile fabrics and garments. This was done in 2000. In 2002/03, the proportions o f H S 6-digit tariff lines subject to specific duties were: cotton fabrics, 49%; man-made filament fabrics 88%; man- made staple fibre fabrics 69%; special woven fabrics (including tyre cord fabrics) 51%; h i t t e d apparel 30%; apparel, not knitted 62%. The tariffs are compound i.e. the higher o f an amount calculated using an ad valorem rate or the specific amount. The specific component i s in Rupees per square metre or per k i lo in the case o f fabrics, and per item (e.g. per shirt) in the case o f garments. The basis for choosing the products protected by specific duties i s not known: it could be that they were considered to be more vulnerable to import competition than others, but given the long standing de facto import ban, whether or not this was the case could not have been well known at the time. For the products subject to specific duties, the objective and effect i s to target and keep out imports o f specifications and qualities that sell for l ow prices for which there i s the largest demand in the Indian domestic market, and o f which other developing countries are the most competitive foreign suppliers. The specific tariffs were initially set at very high levels during FY 2001: they were reduced somewhat in FY 2002 and have remained at that level since.81
Both the normal ad valorem and the specific tariffs are subject to India’s normal preferences under SAPTA and under its bilateral trade agreements. Under SAPTA there were no preferences for garments until they were introduced in FYO 1-but for “less developed” SAPTA countries only- following the third SAPTA negotiating round. Subject to meeting rules o f origin, the preference for Bangladesh and the other SAPTA LDCs (Nepal, Bhutan and Maldives) on most garments i s 50%, so the basic Customs duty would be the greater o f an amount calculated by applying hal f the ad valorem rate to the c i f price, and ha l f the specific amount8’. There are no garment tari f f preferences for the other “developed” SAPTA members i.e. Pakistan and Sri Lanka. However, under the bilateral agreement wi th Sri Lanka (ILFTA) the
77
78
79
Joint Press Statement Bangladesh-India Commerce Secretary Level Trade Talks 08-10 April, 2002. At http://meaindia.nic.in/declarestatement/2003/04/1Oisl.htm GATT article 111.1 says that internal taxes “should not be applied to imported or domestic products so as to afford protection to domestic production”. The Hindu Business Line, August 11,2002. Only a few possible cases (involving sugar) were seen in a look through the Indian state sales tax schedules. The schedules are published in Commercial’s All India Sales Tax Manual (Volume 111). Commercial L a w Publishers(1ndia) Pvt. Ltd, 2004 (February) The FY 2003/04 Customs tar i f f schedule extended the H S classification system from 6 to 8 digits, and in doing this the specific duty for any given 6-digit product was also used for i t s 8 digit subproducts. The preferences did not apply to India’s “Special additional duty” (Sadd). In most circumstances the Sadd provided significant extra protection, so the preferential protection rate was greater than impl ied by the apparent preference. For example, in 2002/03 the MFN ad valorem protective rate on garments (including the effect o f the Sadd) was 35.8% and the preferential protective rate on imports from Bangladesh was 20%. The Sadd was abolished in January 2004.
80
”
82
139

India-Bangladesh FTA: Methodology and Selected Case Studies
preference for garment imports from Sri Lanka i s 75%, and garment imports from Nepal (like imports of nearly al l other products) are duty free.
In order to qualify for the SAPTA preferences, garments imported from Bangladesh would have to satisfy the SAPTA origin rules. For the SAF’TA LDCs the principal requirement i s that the c i f value o f non-SAPTA imported inputs included in the exported product should not exceed 70% o f the fob price, or put another way, that national value added should be no less than 30% o f the fob price. In this respect Bangladesh and the other LDCs have an advantage over the “developed” SAF’TA members (India, Pakistan and Sri Lanka) for which the minimum value-added ratio i s 40%. Both were increased (from 40% and 50% respectively) in November 2000, mainly in response to complaints from the SAPTA members other than India, that the rules were too stringent for them to take advantage o f the SAPTA tariff preferences in exporting to India. However, there was already some built-in flexibility from a provision that excludes inputs obtained in other SAPTA members in calculating the imported input ratios i.e. by in effect treating such inputs as part o f the value-added. T h i s provision i s extremely important for f i rms in Bangladesh and other SAPTA countries wishing to export woven garments to India, because value-added margins in cutting, sewing and assembling garments from imported fabrics are typically around 30% of fob prices, and may be less. If these f i r m s use fabrics imported from China or other non-SAPTA countries, this limits their ability to compete in exporting to India, because if they cut their export prices they may breach the ru le o f origin conditions and find that these shipments are subject to the higher MFN tariffs in India, rather than the lower SAPTA preferential tariffs. To get around this constraint, they can use imported Indian fabrics, even though they might not have done so if they had a free choice unconstrained by this considerationa3. In this way the origin rules therefore provide some indirect protection to Indian exporters o f fabrics and other inputs. However, most exported Bangladesh knitted garments are reported to easily meet the SAPTA origin requirements, so that there would be no constraints on yam purchases and imports by Bangladesh f i rms interested in exporting to India.
Most o f Bangladesh’s high volume garment exports to developed countries are subject to specific tariffs in India e.g. knitted shirts, woven shirts, trousers, T-shirts, and sweaters. However, a number o f products which Bangladesh exports -mostly in smaller volumes-to other countries are not. Among knitted products (HS 61) these include suits and jackets, woollen trousers, pyjamas, babies’ garments, track suits and swimwear, panty hose, stockings etc, gloves and mittens, and shawls, scarves and ties. Among non- knitted products (HS 62) they include nightshirts and pyjamas, babies’ garments, swimwear, handkerchiefs, and gloves and mittens.
After 2001102, the first year without general import licensing o f garment imports, the MFN ad valorem tariff on most garments (including the protective effects o f other import taxes in addition to the basic Customs duty) was reduced from 40.8% to 35.8%, a drastically cut to 20% in 2004105, and then again to 15% in 2005106 (Table 4). There were corresponding reductions in the SAPTA preferential rate that would be applied to imports f rom Bangladesh provided they satisfy the SAPTA rule o f origin: these came down from 20% in 2003104, to 10% in 2004105, to 7.5% in 2005106. For Bangladeshi exporters o f these products, this represents a very considerable liberalisation o f the Indian import regime and gives them a substantial advantage over non-preferential suppliers who must pay the MFN tariff. However (also subject to rules o f origin) the preferential ad valorem garment tari f f for Sri Lanka under ILFTA i s lower (just 3.75%), and Nepal can export garments to India duty free.
As noted above, the garments wi th the largest export volumes in Bangladesh are mostly subject to specific duties in India. Some o f the past and current effects o f the specific tariffs are illustrated in Table 4
In principle i t would seem that Bangladesh woven garment exporters could also satisfy the origin rule by importing fabrics f rom Pakistan. India and Pakistan are the only SAF’TA members with substantial export- oriented textile industries.
a3
140

A Case Study o f the Ready Made Garment Industry
and Figs 2, 3, and 4, using the example o f mens’ and boys’ woven cotton shirts (HS 6205.20). One major effect has been to exclude shirts (and ipsefacto other garments and also fabrics subject to specific tariffs) from the major reductions in the general level o f ad valorem tariffs that have occurred since 1999/2000. For cotton shirts, the MFN ad valorem rate in 2005/06 (15%) i s about one -third o f i t s level in 1999/2000 (45.7%), but the MFW specific duty on a $4 shirt in 2005/06 (47.3%) i s higher than the tariff that would have been applied in 1999/2000 (45.7%). The ad valorem tari f f applicable to shirt imports from Bangladesh fell sharply between 1999/2000 and 2000/01 with the introduction o f the 50% SAPTA preference, but as a result o f the introduction o f specific tariffs the preferential rate on l o w value shirts went up or declined only very slightly. After 2001/02 the ad valorem preferential rate come down by more than half (from 22.6% to 7.5% in 2005/06) but because o f the specific duties, ad valorem equivalent rates were only very slightly lower in 2005/06 than they had been in 2001/02: for example 23.7% on a $4 shirt, versus 27.6% in 2001/0284.
A second major effect o f specific tariffs i s that the ad valorem equivalent o f the tar i f fs i s much higher for l ow priced products than for higher priced products. In the case o f men’s cotton shirts, in 2004105 the MFW tariff i s the higher o f 20% or Rs 85 per shirt, and the preferential tariff for SAPTA LDCs including Bangladesh i s hal f this i.e. the higher o f 10% or Rs 47.5 per shirt. At the average exchange rate during the first quarter o f FY05 these specific tariffs were equivalent to $US 1.89 per shirt and $US 0.95 per shirt respectively. For a shirt imported for $3.00 cif, the ad valorem equivalent o f this specific tariff i s 63.1% for imports from countries without preferences, and 31.6% for imports f rom Bangladesh. As illustrated in F ig 4, the ad valorem equivalents o f the specific tariffs are lower for more expensive shirts, but only at a c i f price between $12 and $13 do the general ad valorem rates (15% MFN and 7.5 % preferential) take over from the specific tariffs.
Because the specific duties are expressed in Rupees per unit (per shirt), they declined slightly relative to international prices (e.g. in U S dollars per shirt) during 2000101 to 2002/03 owing to Rupee devaluation, but have increased along w i th the Rupee appreciation since then
84
141

Fig 2 tndla: ad vatorern e ~ ~ ~ v a ~ ~ n t of speclfic NFN tariff, and specific preferential SAPTA tariff for ~ a n g ~ a ~ ~ ~ ~ , on a $3 cotton shirt
I i I
Fig 3 India: ad valorem equivalent of specific MFN tariff, and SAPTA
~ r e f ~ r ~ n t i a ~ tariff for BangSadesh, on a $4 cotton shirt
....... i
...............
f 32
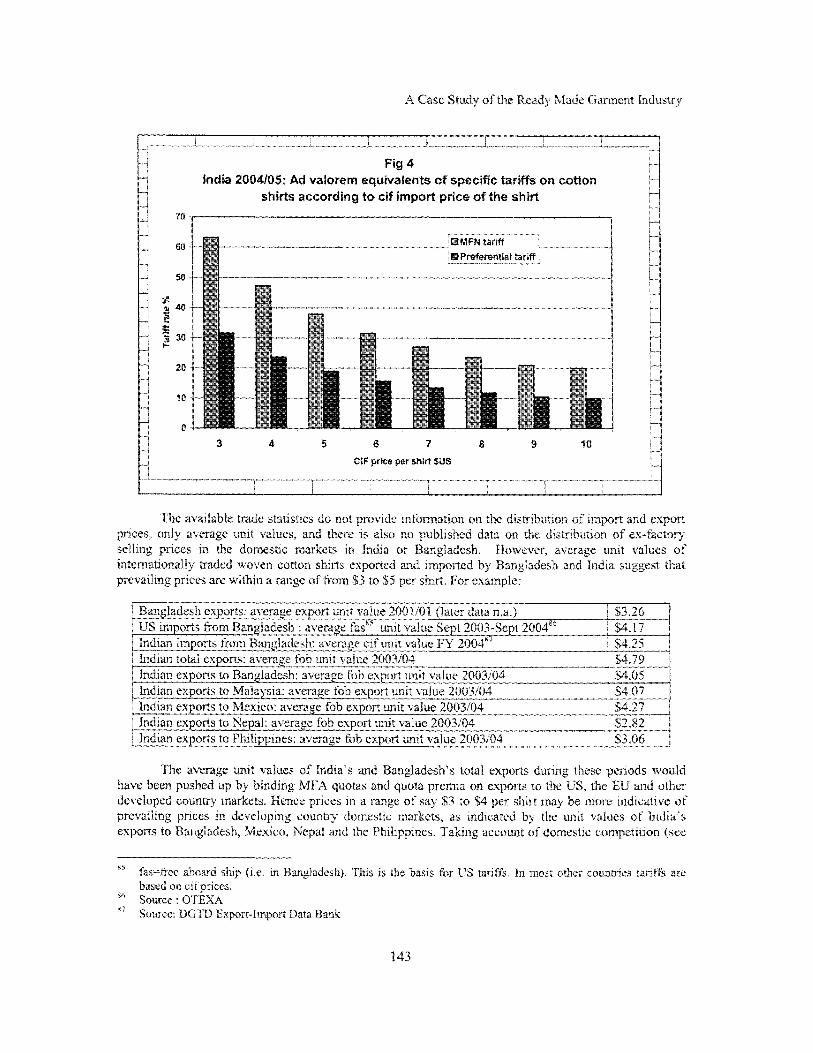
A Casc Study ofthe Ready blisde Ciiiment lndristry
The available trade statistics do not providc ~ n ~ ~ ~ ~ ~ ~ ~ o n on the nu ~ u ~ ~ ~ ~ h ~ ~ data
o f 1xnport and cxpurt 1brittan of ex-factory rage unit valucs of
angladesh and fntiia suggest that
prices, only average unit values, and there 1s sclling pnccs in the d o ~ ~ s t ~ ~ markets in In ~ ~ ~ ~ ~ a ~ ~ ~ n ~ ~ l ~ traded R o w n cotton shirts exported ~ ~ c ~ r a ~ l ~ ~ ~ prices are within a range oi‘frnm 53 to $5
The‘ average unxt values o f Iridza‘s arid B ~ n ~ l a d ~ ~ h ’ s total exports during thebe penods would n pushed up by binding MPtZ quotas and quota on exports to the CS. the EIJ and other
$4 per shirt may be niore mdic ndicarcd by the unit vatues o f
~ c ~ ~ l ~ ~ ~ ~ countq markets. Hence prices in prcvaiiing prices in d e ~ e ~ o ~ i n ~ country do
orts to ~ ~ ~ g i ~ d e ~ h , Mexico, Nepal and the ~ h ~ ~ ~ p i ) ~ n c ~ , Takrng il unt of domestic cumpe~~~ior i

India-Bangladesh FTA: Methodology and Selected Case Studies
below), at c i f prices over this range, India’s current specific tari f f would appear to be almost prohibitively high (between about 63% and 47%) for imports from MFN sources aimed at i t s domestic l ow and middle income mass market. Only expensive relatively high quality shirts from MFN sources (selling for say $6 each or more) wi th probably relatively restricted domestic sales potential, would appear to have much o f chance.
T h i s i s even more the case for products with higher specific duties than shirts. For example, the specific tariff on M&B woven cotton trousers i s Rs 135, in 2004/05 equivalent to an MFN tariff o f $3.01 and a preferential tari f f for Bangladesh o f $1.50. Prevailing l ow end cotton trouser prices are between $3 and $4, so these tariffs are equivalent to ad valorem MFN tariffs o f between 75% and loo%, and SAPTA preferential tariffs that would be applied to imports from Bangladesh o f between 37.5% and 50%. Since, judging from DEPB rates (see below) domestic Indian trouser prices are close to or below c i f prices, these specific tariffs are probably even more effective than the shirt tariffs at keeping out import competition from the l o w and middle income mass markets, including in this case import competition f rom preferential suppliers such as Bangladesh.
These examples suggest that a third consequence o f the Indian specific tariffs might be to provide potentially important export opportunities for l ow value exports to India from Bangladesh and the other South Asian countries benefiting from tari f f preferences, since the MFN specific tar i f fs are presumably keeping out imports from other l ow cost Asian garment exporters, especially China but also Indonesia, Vietnam and others. Using the example o f cotton shi r ts and cotton trousers, within a $3-$4 price range, the SAPTA preferences are substantial. However, such exports s t i l l have to surmount preferential tariffs o f ranging from 3 1.6% (for a $3 shirt) to 23.7% (for a $4 shirt) and from 50% (for a $3 pair o f trousers) to 37.5% (for a $4 pair o f trousers) and compete in the Indian domestic market with Indian shirts and trousers. Their ability to do so i s affected by the export and other policies that affect the domestic prices o f Indian exportable garments, discussed in the following section.
Export policies and domestic prices. India operates a number o f schemes to refund or offset the cost to exporters o f import duties on their imported inputs. The principal duty neutralization scheme for most exported Indian garments i s the DEPB (Duty Exemption Pass Book). In principle, the DEPB offsets the average Customs duty on imported inputs used by garment exportersBB. DEPB rates are expressed as percentages o f fob export prices. They are calculated and announced by the Directorate General o f Foreign Trade in the Ministry o f Commerce, and are supposed to only allow for import duties on materials which are actually imported: thus no allowance would be made for domestic material inputs, the presumption being that i f an exporter uses them instead o f imported materials, their prices (after allowing for quality, delivery times and other factors) must be lower than their c i f import prices. Once a DEPB rate i s established, the exporter i s automatically credited with the DEPB amount on the basis o f the FOB invoice value o f the exports, without the need to document the inputs actually used. These credits can be used against liabilities for import duties, and can be sold if the exporter does not wish to use them.
‘
DEPB i s popular wi th exporters because o f its simplicity and speed and the absence o f various constraints that go with other export facilitation schemes.
The principal other schemes are duty drawback, the use o f special duty free import licenses for imported inputs (“advance licenses”), bonded warehouse status (“100% EOUs”), operation in an export processing zone (EPZ) and most recently operation in a Special Economic Zone (SEZ). With drawback, the input import duties are refunded to the exporter by the Customs department, and under the other schemes they are obtained duty free. Under al l these schemes, f i rms wishing to sell in the domestic
8B “Additional” duties on imported inputs and the equivalent excise duties on domestic inputs going into exports are refunded separately.
144
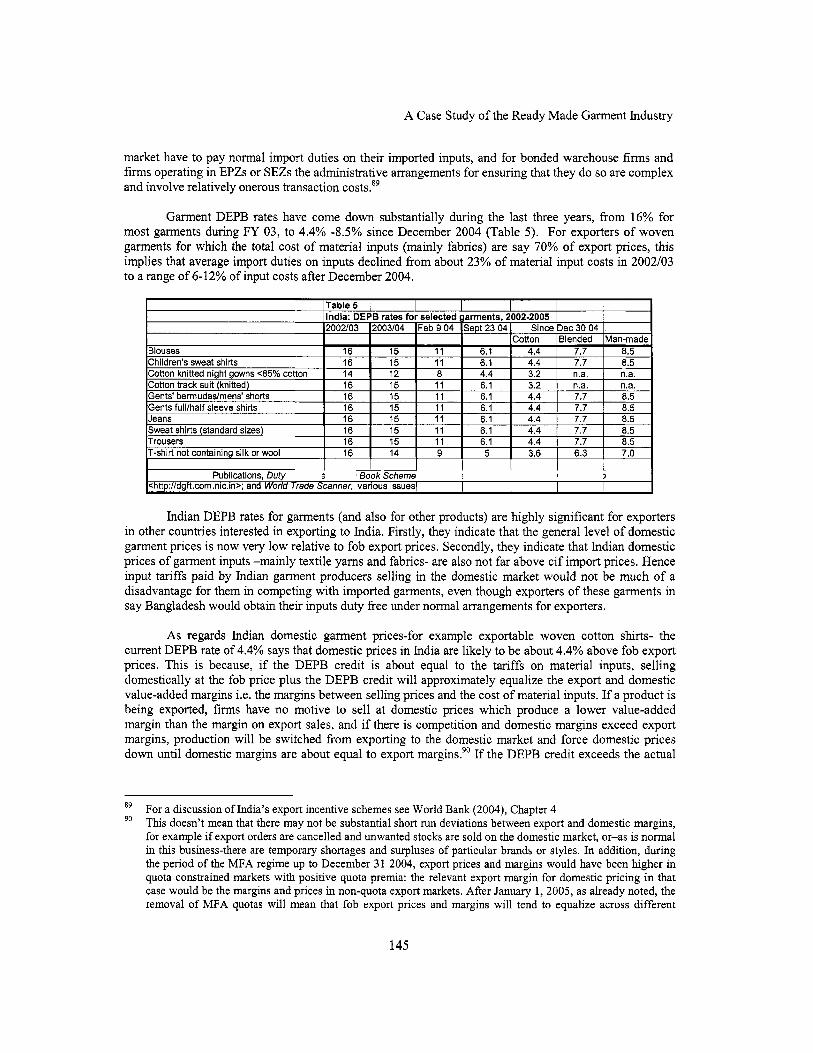
A Case Study o f the Ready Made Garment Industry
Sweat shirts (standard sizes) Trousers T-shirt not containing silk or wool
market have to pay normal import duties on their imported inputs, and for bonded warehouse f i rms and f i rms operating in EPZs or SEZs the administrative arrangements for ensuring that they do so are complex and involve relatively onerous transaction costs.89
16 15 11 6.1 4.4 7.7 8.5 16 15 11 6.1 4.4 7.7 8.5 16 14 9 5 3.6 6.3 7.0
Garment DEPB rates have come down substantially during the last three years, from 16% for most garments during FY 03, to 4.4% -8.5% since December 2004 (Table 5). For exporters o f woven garments for which the total cost o f material inputs (mainly fabrics) are say 70% o f export prices, this implies that average import duties on inputs declined from about 23% o f material input costs in 2002/03 to a range o f 6-12% o f input costs after December 2004.
<http:/ldgfl.corn.nic.in>: and World Trade Scanner, various sues1 I
Indian DEPB rates for garments (and also for other products) are highly significant for exporters in other countries interested in exporting to India. Firstly, they indicate that the general level o f domestic garment prices i s now very low relative to fob export prices. Secondly, they indicate that Indian domestic prices o f garment inputs -mainly textile yams and fabrics- are also not far above c i f import prices. Hence input tariffs paid by Indian garment producers selling in the domestic market would not be much o f a disadvantage for them in competing with imported garments, even though exporters o f these garments in say Bangladesh would obtain their inputs duty fiee under normal arrangements for exporters.
As regards Indian domestic garment prices-for example exportable woven cotton shirts- the current DEPB rate o f 4.4% says that domestic prices in India are l ikely to be about 4.4% above fob export prices. T h i s i s because, if the DEPB credit i s about equal to the tar i f fs on material inputs, selling domestically at the fob price plus the DEPB credit will approximately equalize the export and domestic value-added margins i.e. the margins between selling prices and the cost o f material inputs. If a product i s being exported, f i rms have no motive to sell at domestic prices which produce a lower value-added margin than the margin on export sales, and if there i s competition and domestic margins exceed export margins, production w i l l be switched from exporting to the domestic market and force domestic prices down until domestic margins are about equal to export margins?' If the DEPB credit exceeds the actual
For a discussion o f India's export incentive schemes see Wor ld Bank (2004), Chapter 4 This doesn't mean that there may not be substantial short run deviations between export and domestic margins, for example if export orders are cancelled and unwanted stocks are sold on the domestic market, or-as i s normal in th is business-there are temporary shortages and surpluses o f particular brands or styles. In addition, during the period o f the MFA regime up to December 3 1 2004, export prices and margins would have been higher in quota constrained markets with positive quota premia: the relevant export margin for domestic pricing in that case would be the margins and prices in non-quota export markets. After January 1,2005, as already noted, the removal o f MFA quotas w i l l mean that fob export prices and margins will tend to equalize across different
89
90
145
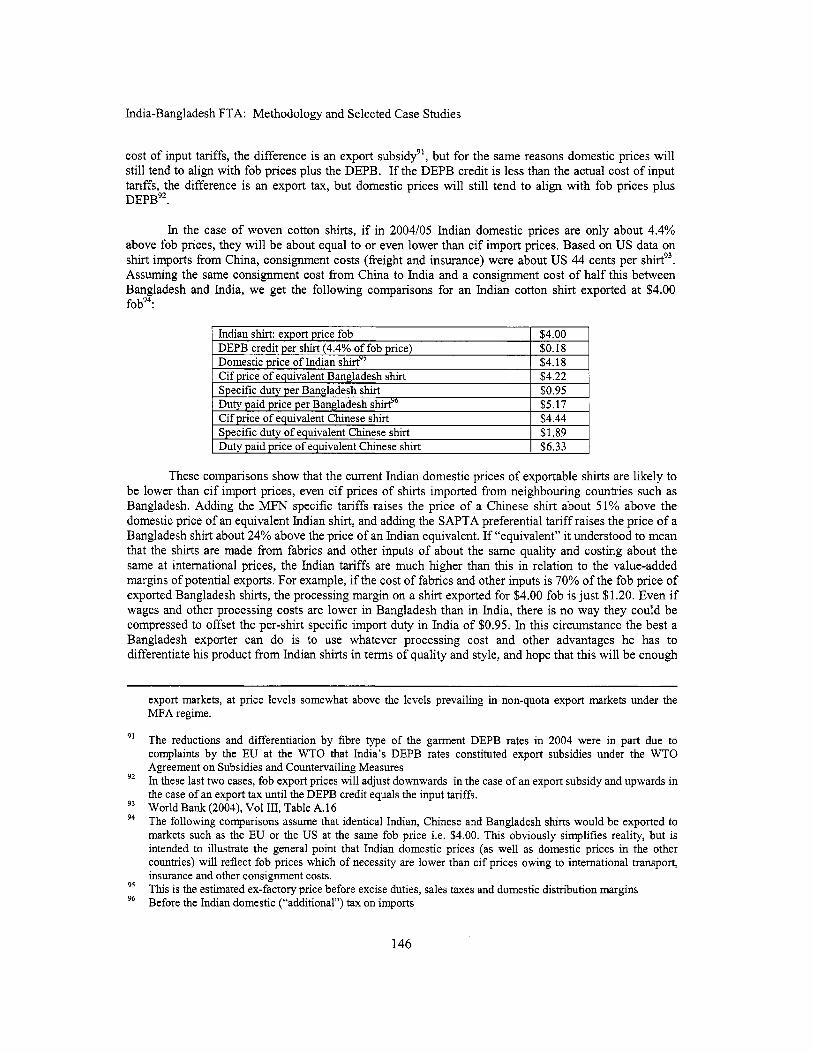
India-Bangladesh FTA: Methodology and Selected Case Studies
cost o f input tariffs, the difference is an export subsidy”, but for the same reasons domestic prices will s t i l l tend to align wi th fob prices plus the DEPB. If the DEPB credit i s less than the actual cost o f input tariffs, the difference i s an export tax, but domestic prices w i l l s t i l l tend to align with fob prices plus DEPB9*.
In the case o f woven cotton shirts, if in 2004/05 Indian domestic prices are only about 4.4% above fob prices, they wil l be about equal to or even lower than c i f import prices. Based on U S data on shirt imports from China, consignment costs (freight and insurance) were about U S 44 cents per shirt93. Assuming the same consignment cost from China to India and a consignment cost o f hal f this between Bangladesh and India, we get the following comparisons for an Indian cotton shirt exported at $4.00 fob94:
These comparisons show that the current Indian domestic prices o f exportable shirts are l ikely to be lower than c i f import prices, even c i f prices o f shirts imported from neighbouring countries such as Bangladesh. Adding the MFN specific tariffs raises the price o f a Chinese shirt about 51% above the domestic price o f an equivalent Indian shirt, and adding the SAPTA preferential tariff raises the price o f a Bangladesh shirt about 24% above the price o f an Indian equivalent. If “equivalent” it understood to mean that the shirts are made from fabrics and other inputs o f about the same quality and costing about the same at international prices, the Indian tariffs are much higher than this in relation to the value-added margins o f potential exports. For example, i f the cost o f fabrics and other inputs i s 70% o f the fob price o f exported Bangladesh shirts, the processing margin on a shirt exported for $4.00 fob i s just $1.20. Even i f wages and other processing costs are lower in Bangladesh than in India, there i s n o way they could be compressed to offset the per-shirt specific import duty in India o f $0.95. In this circumstance the best a Bangladesh exporter can do i s to use whatever processing cost and other advantages he has to differentiate his product from Indian shirts in terms o f quality and style, and hope that this will be enough
91
92
93 94
95
96
export markets, at price levels somewhat above the levels prevailing in non-quota export markets under the MFA regime.
The reductions and differentiation by fibre type o f the garment DEPB rates in 2004 were in part due to complaints by the EU at the W T O that India’s DEPB rates constituted export subsidies under the WTO Agreement on Subsidies and Countervailing Measures In these last two cases, fob export prices will adjust downwards in the case o f an export subsidy and upwards in the case o f an export tax until the DEPB credit equals the input tariffs. Wor ld Bank (2004), V o l 111, Table A.16 The following comparisons assume that identical Indian, Chinese and Bangladesh shirts would be exported to markets such as the EU or the U S at the same fob price i.e. $4.00. This obviously simplifies reality, but is intended to illustrate the general point that Indian domestic prices (as we l l as domestic prices in the other countries) will reflect fob prices which o f necessity are lower than c i f prices owing to international transport, insurance and other consignment costs. This i s the estimated ex-factory price before excise duties, sales taxes and domestic distribution margins Before the Indian domestic (“additional”) tax on imports
146
A Case Study o f the Ready Made Garment Industry
to generate some sales, even though his prices will be considerably higher than the prices o f competing Indian-made shirts.
However, this scenario would change with an FTA between India and Bangladesh. In the above example, following an FTA the Bangladesh c i f import price would only slightly exceed the domestic price o f the Indian shirt, and if the Bangladesh export firm pays lower wages and has other processing cost advantages over Indian producers, i t could use these advantages to either export better quality or more attractively designed shirts at the same or similar prices, or shirts with about the same quality and design attributes as Indian shirts, at lower prices. Alternatively i t could pay higher marketing fees or allow higher distribution margins to Indian importers handling i t s products. Either way it would be largely insulated from competition in the Indian domestic market from China and other actual or potential ROW exporters to India.
Trends in total imports. During the 1990s and before Indian garment imports were tiny: in 1996197 just over $4 million, less than 0.1 percent o f the domestic market. Starting in about 1997/98 they have grown very rapidly (Table 6 and Figs 5 and 6) and in 2003/04-including imports o f used clothing- total imports reached $98 million. From the perspective o f actual and potential garment exporters to India, a number o f points are worth noting about these developments:
Although much larger than previously, total garment imports o f $98 mil l ion in 2003/04 were s t i l l only about 1.4% o f the total Indian domestic market for garments and other fabricated textile products. Even a small increase in this percentage share would represent a fairly substantial total export opportunity from the perspective o f small and medium size developing economies such as Bangladesh. Most imports in 2003/04 (about $60 million) consisted o f used clothing (HS 6309) imported from developed countries (nearly al l from the US, Canada, Korea and Japan). The used clothing trade (actually mainly seasonal unsold stocks o f new clothes from developed countnes) was kept out o f India for many years by import licensing, but expanded very rapidly (Fig 6) after licensing was dropped on April 1, 20019’. Specific tariffs were not set for used clothing, so the import expansion has also been facilitated by the steady decline in used clothing ad valorem tariffs, from almost 60% in 1999, to 20% in 2004/05 and 15% in 2005106. T h i s new openness o f the Indian market to used clothing imports, increases the competition that Bangladeshi and other clothing exporters face in India. Imports o f new clothing (HS 61 and H S 62) in 2003/04 were about $39 million. Of these, just under $5 mil l ion were parts and accessories (Appendix Table A.l) which very likely were imported duty free and used as inputs by Indian garment exporters. So the probable total o f imports for the Indian domestic garment market may have been only about $34 million. Even so, this represents a substantial expansion from the late 1990s. Most o f th is expansion occurred, however, between 1996/97 and 2001/02, after which i s seems to have levelled of f (Fig 5) . During the f i r s t five o f these six years, imports o f garments were subject to the import licensing system, and very high specific duties were introduced and in force during 2000/0 1. The fact that imports expanded so rapidly may have been due to the use o f SJLs (issued as an incentive to exporters) to import garments. The subsequent levelling o f f o f import growth (and decline in 2002/03) i s possibly a lagged response to the introduction o f the specific duties. As discussed previously, the ad valorem equivalent rates o f these duties (as illustrated for cotton shirts in Figs 2 and 3) have remained about the same since 2001/02, and combined with low domestic prices for exportable
’’ It i s unlikely that import licenses would have been issued for used clothing before import licensing was abolished. I t i s possible that the imports that occurred before then may have been with the use o f the special import licenses (SILs) issued to exporters during this period. During th is period and before, a major preoccupation o f the import licensing authorities and the Customs department, was to prevent the surreptitious import o f used clothes in containers supposedly containing only rags (HS 6310).
147

India-Bangladesh FTA: Methodology and Selected Case Studies
Indian garments, this suggests that they may be sufficiently high to keep total garment imports at about their 2003/04 level in the future, or at least to slow down future import growth.
There were practically no imports from other South Asian countries during the expansion phase after 1996/97 up to 2000/01. T h i s was despite the fact that from 1998 imports from SAPTA countries were no longer subject to import licensing, whereas imports from al l other countries came under the licensing system. The probable explanation for this apparent paradox i s that S ILs were available and vitiated the ostensible QR preference for SAPTA countries, and that their users preferred to import from China and other East and South East Asian countries, especially because, up to and including 1999/2000, there was were no SAPTA tariff preferences for garments imported from the SAPTA LDC members. Th is implies that the SAPTA countries might have trouble in competing with other countries in exporting to India in the absence o f tari f f preferences.
L I I I
Fig 5 Indian garment imports 1997-2004
40
35
30
IMFrom Bangladesh
c .- : 25 E v) a 20 u)
1 1 5 E
10
5
0
-
1997 1998 1999 2000 2001 2002 2003 2004
I I I I I I I I
148
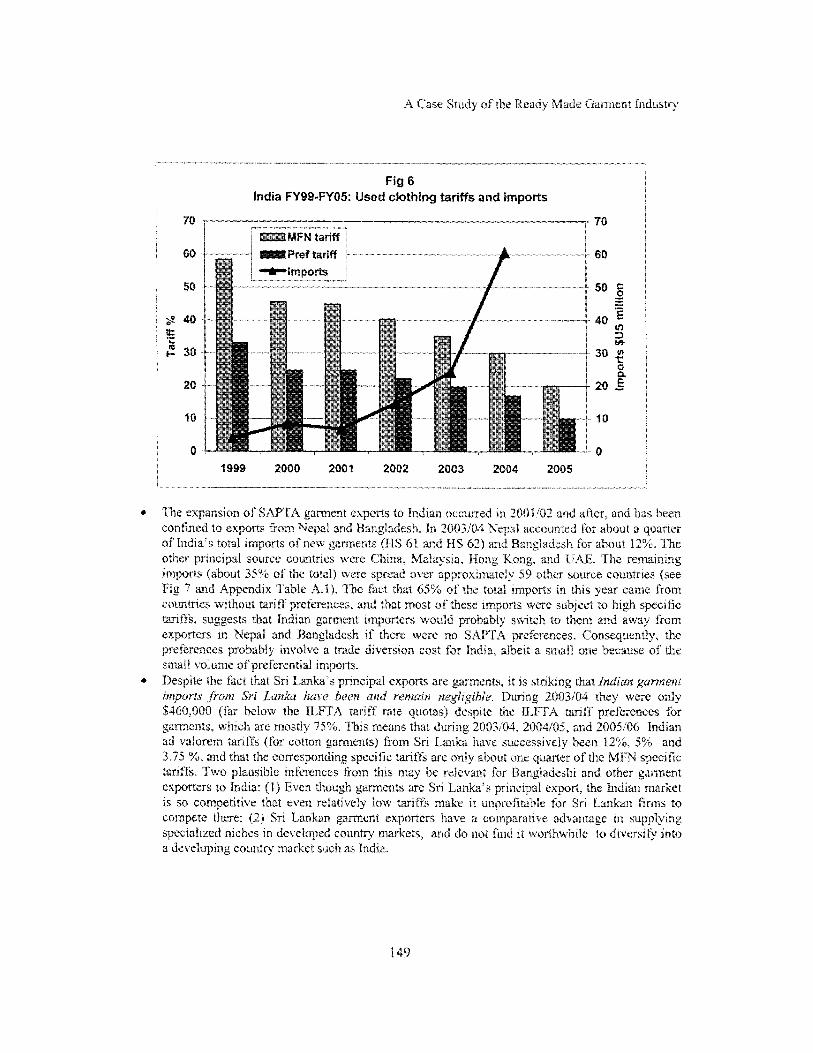
Fig 6 India FY99-FY05: Used clothing tariffs and imports
70
80
50
8 4# 5: E 30
20
15
0 1999 2000 2001 2002 2003 2004 2005
70
so
50 g
2 s
20 E
.- - L
40 E 30
P
10
0
i 49
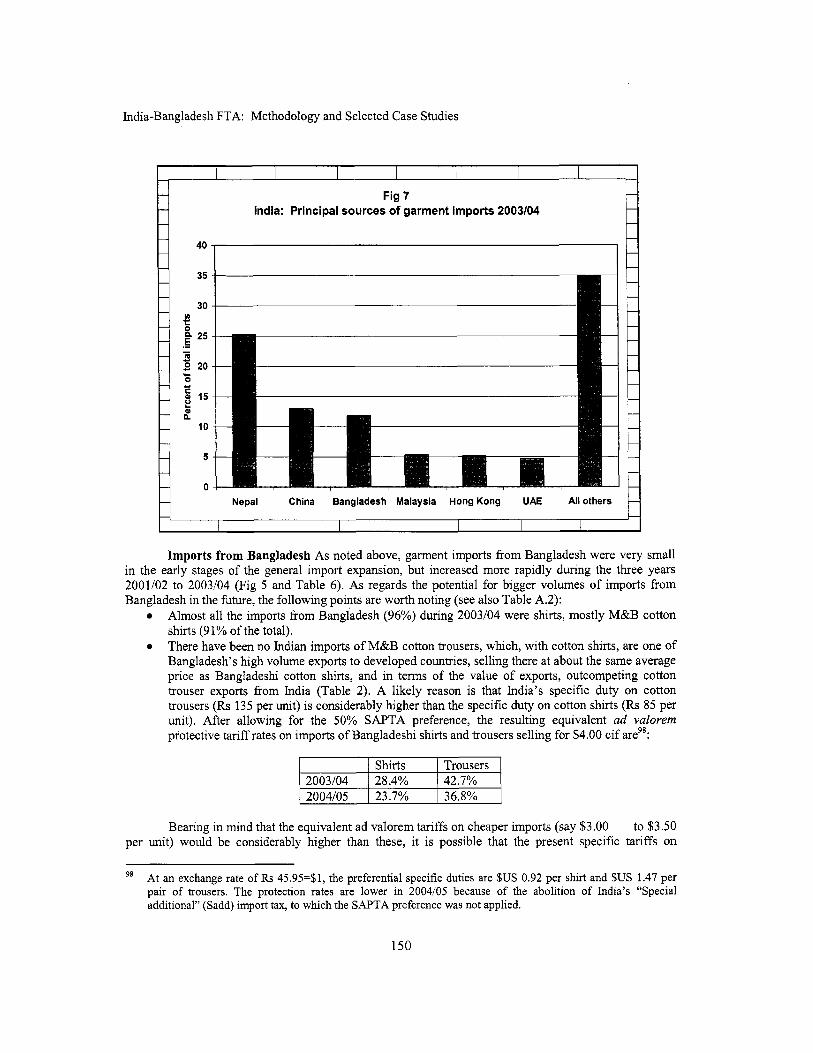
India-Bangladesh FTA: Methodology and Selected Case Studies
Fig 7 India: Principal sources of garment imports 2003104
Nepal China Bangladesh Malaysia Hong Kong UAE All others
Imports from Bangladesh As noted above, garment imports from Bangladesh were very small in the early stages o f the general import expansion, but increased more rapidly during the three years 2001102 to 2003/04 (Fig 5 and Table 6). As regards the potential for bigger volumes o f imports from Bangladesh in the future, the following points are worth noting (see also Table A.2):
Almost al l the imports from Bangladesh (96%) during 2003/04 were shirts, mostly M&B cotton shirts (91% of the total). There have been no Indian imports o f M&B cotton trousers, which, wi th cotton shirts, are one of Bangladesh’s high volume exports to developed countries, selling there at about the same average price as Bangladeshi cotton shirts, and in terms o f the value o f exports, outcompeting cotton trouser exports from India (Table 2). A likely reason i s that India’s specific duty on cotton trousers (Rs 135 per unit) i s considerably higher than the specific duty on cotton shirts (Rs 85 per unit). After allowing for the 50% SAPTA preference, the resulting equivalent ad valorem protective tari f f rates on imports o f Bangladeshi shirts and trousers selling for $4.00 c i f are98:
I Shirts I Trousers 2003104 128.4% 1 42.7% 1 2004105 I 23.7% I 36.8% I
Bearing in mind that the equivalent ad valorem tariffs on cheaper imports (say $3.00 to $3.50 per unit) would be considerably higher than these, it i s possible that the present specific tariffs on
At an exchange rate of Rs 45.95=$1, the preferential specific duties are $US 0.92 per shirt and $US 1.47 per pair o f trousers. The protection rates are lower in 2004/05 because of the abolition o f India’s “Special additional” (Sadd) import tax, to which the SAPTA preference was not applied.
98
150
A Case Study o f the Ready Made Garment Industry
trousers are high enough to preclude imports altogether, whereas some (if limited) imports have been possible at tariffs around the levels applied to Bangladeshi shirts.
There have been practically no imports o f knitted garments from Bangladesh, even though Bangladesh’s exports to other markets (about $1.9 bi l l ion in 2003/04) are highly competitive and have been growing rapidly (see Table 1). Indian specific duties may be the principal deterrent for some o f these products (e.g. knitted T-shirts and knitted cotton sweat shirts) but a number o f knitted products o f which there are some Bangladesh exports to other countries, are not subject to specific duties in India. These include the following knitted garments: suits and jackets, woollen trousers, pyjamas, babies’ garments, track suits and swimwear, panty hose, stockmgs etc, gloves and mittens, and shawls, scarves and ties. During 2003/04 the SAPTA preferential tari f f on these was 17.4% or 17.5%”, during 2004/05 it was reduced to a flat lo%, and then in 2005/06 to 7.5%. The absence o f any imports o f these products from Bangladesh during 2003/04 suggests that after allowing for the tari f f and additional transaction costs, Indian traders had nothing to gain by importing them. The response o f imports, if any, following the tari f f reduction to 10% in 2004/05 and 7.5% in 2005/06 will provide a better indication o f the l ikely response to a further tariff reduction to zero, if that were to occur as part o f a bilateral FTA or under SAFTA With the exception o f cotton shirts, the composition o f Indian imports o f Bangladeshi garments from year to year has been quite erratic: for example 11 products imported in 2002/03 disappeared from the import portfolio in 2003/04, and 7 products imported during 2003/04 were not imported during the previous year (Table A.2). T h i s and the very small import volumes o f most products, suggests that, despite the gradual overall increase that has been occurring, for Indian traders, importing garments from Bangladesh i s s t i l l an opportunistic business without decisive advantages that would warrant negotiating longer te rm and high volume arrangements with Bangladesh exporters.
Cotton shirts appear to be an exception to this last point, in view o f the steady increase in imports from Bangladesh during 2001/02 and 2002/03 and the jump in 2003/04 (Fig 8 and Table A.3). The fact that there was also a sharp increase in cotton shirt imports from Nepal during 2003/04 also suggests that the Indian market for cotton shirts was becoming more open to imports. The increased imports from Bangladesh were very likely triggered earlier by the cut in the preferential specific tariff in March 2001, the response being delayed by the West Bengal luxury tax which was in place between June 2001 and August 2002.
In order to interpret what may have been happening to Indian shirt imports, F ig 9 provides a simplified schematic outline o f the main features o f the Indian domestic market for garments over the past eight years, using as an example a shirt that could be imported at a c i f price o f $4.00. I t i s assumed that the same shirt i s exported from India at an fob export price shown by the bottom horizontal line. The fob price i s assumed to be $3.56, equal to the $4.00 c i f price in an export market outside South Asia minus consignment costs o f 44 U S cents. An Indian exporter would receive this price plus the DEPB credit for exports. Because the DEPB rate went down after 2002/03, this i s indicated by the line which starts in 2002/03 slightly above the c i f price line, and dips below it in 2003/04. DEPB rates prior to 2002 could not be found for this study, but they were probably slightly higher than in 2002/03, reflecting higher fabric import duties. As discussed previously, domestic prices o f exportable garments will tend to equal fob prices plus the DEPB credits, so this line also represents the equilibrium domestic price o f the Indian shirt. T h i s i s compared with a line showing the duty inclusive price o f a Bangladeshi shirt imported at a c i f pr ice o f $4.00, and a line (at the top o f the diagram) showing the duty inclusive price o f a shirt imported from a non-preferential source and paying the general MFN tariff. Before 2000/01 there were
99 The slight difference i s due to a higher additional duty on synthetic shirts (10%) than on cotton shirts, (8%) which slightly raisedthe protective effect of the SAdd tax in th is year.
151

India-Bangladesh FTA: Methodology and Selected Case Studies
I I I I I I I I - - - Fig 8 - - Indian imports of woven cotton shirts 1988-2004 - - - - -
no SAPTA preferences for garments, and so the duty inclusive price o f a Bangladeshi and (say) a Thai shirt would have been the same (around $6.00), as both would have paid the same ad valorem tariff. In 2000/01 very high specific duties were introduced, which would have pushed the duty inclusive price o f a Thai shirt to above $7.00. However, Bangladeshi shirts for the first time benefited from the 50% SAPTA preference, and despite the high specific duty, the duty inclusive price would have declined slightly. Then in 2001102 the specific duties were cut, and so, as the diagram shows, the duty inclusive prices o f both Thai and other MFN sources shirts and Bangladeshi shirts would have fallen quite sharply. Since then the specific duties (fixed in Rupees per shirt) have remained the same, and so there have been only slight changes (due to changes in the Rupeeldollar exchange rate and the abolition of the Sadd import tax in January 2004) in the estimated duty inclusive prices o f Bangladeshi and MFN sourced shirts.
7
6
= 5 E
S 0 ._ -
1
0
-Thailand
H 1998 1999 2000 2001 2002 2003 2004 H
152
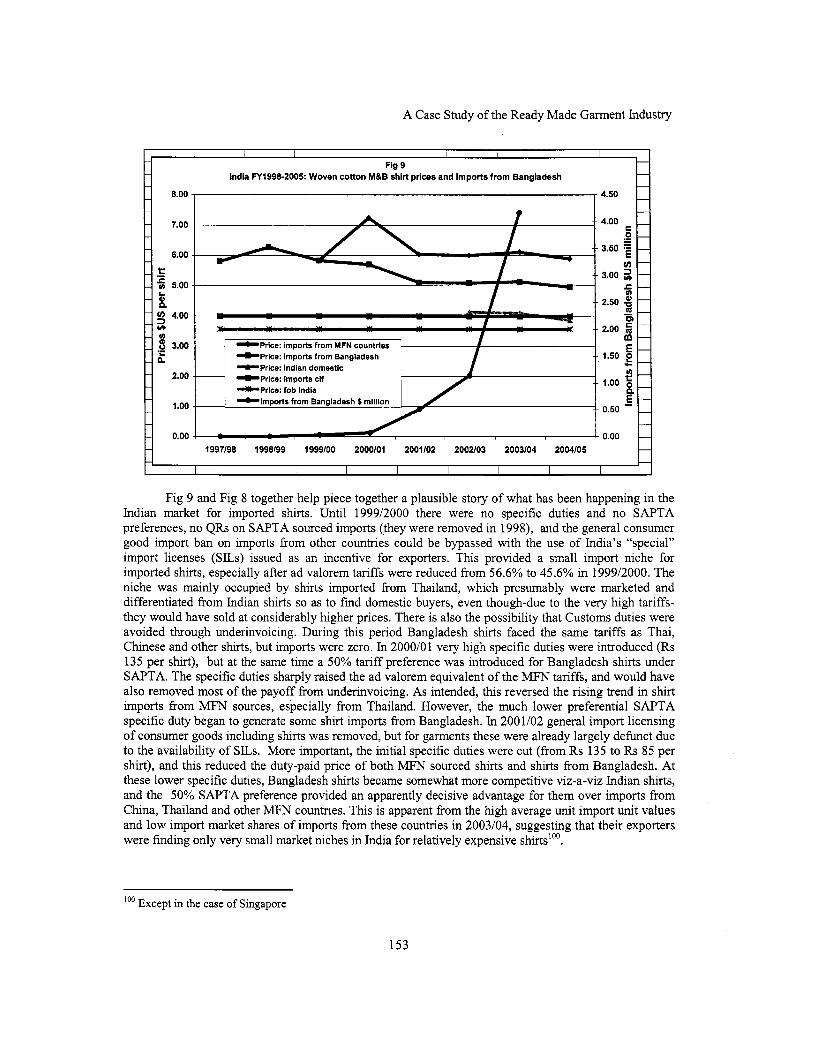
A Case Study o f the Ready Made Garment Industry
Fig 9 India FY1998-2005: Woven cotton MBB shirt prices and imports from Bangladesh
8.00 4.50
4.00 7.00
3.50 6.00
3.00 t: c tn 5.00
8 P 2.50 3 4.00 Y) 2.00
8 3.00
.-
1.50 .- I?
I .oo 2.00 -Price: imports cif
1.00
-Rice: fob India
0.50
0.00 0.00
Fig 9 and F ig 8 together help piece together a plausible story o f what has been happening in the Indian market for imported shirts. Until 1999/2000 there were no specific duties and no SAPTA preferences, no QRs on SAPTA sourced imports (they were removed in 1998), and the general consumer good import ban on imports from other countries could be bypassed with the use o f India’s “special” import licenses (SILs) issued as an incentive for exporters. This provided a small import niche for imported shirts, especially after ad valorem tariffs were reduced from 56.6% to 45.6% in 1999/2000. The niche was mainly occupied by shirts imported from Thailand, which presumably were marketed and differentiated from Indian shirts so as to find domestic buyers, even though-due to the very high tariffs- they would have sold at considerably higher prices. There i s also the possibility that Customs duties were avoided through underinvoicing. During this period Bangladesh shirts faced the same tariffs as Thai, Chinese and other shirts, but imports were zero. In 2000101 very high specific duties were introduced (Rs 135 per shirt), but at the same time a 50% tari f f preference was introduced for Bangladesh shirts under SAPTA. The specific duties sharply raised the ad valorem equivalent o f the MFN tariffs, and would have also removed most o f the payoff from underinvoicing. As intended, this reversed the rising trend in shirt imports from MFN sources, especially from Thailand. However, the much lower preferential SAPTA specific duty began to generate some shirt imports from Bangladesh. In 2001/02 general import licensing of consumer goods including shirts was removed, but for garments these were already largely defunct due to the availability o f SILs. More important, the initial specific duties were cut (from Rs 135 to Rs 85 per shirt), and this reduced the duty-paid price o f both MFN sourced shirts and shirts from Bangladesh. At these lower specific duties, Bangladesh shirts became somewhat more competitive viz-a-viz Indian shirts, and the 50% SAPTA preference provided an apparently decisive advantage for them over imports from China, Thailand and other MFN countries. This i s apparent from the high average unit import unit values and l o w import market shares o f imports from these countries in 2003/04, suggesting that their exporters were finding only very small market niches in India for relatively expensive shirts’oo.
Except in the case o f Singapore 100
153
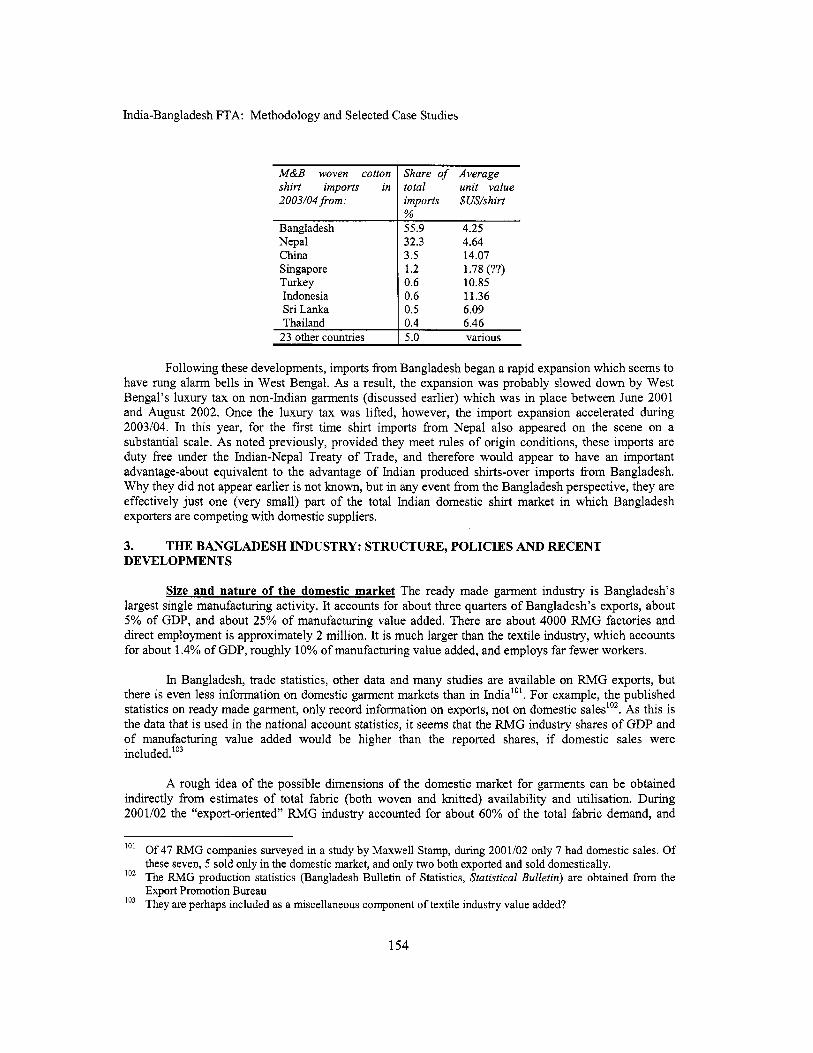
India-Bangladesh FTA: Methodology and Selected Case Studies
M&l3 woven cotton shirt imports in 2003/04fiom:
Bangladesh Nepal China Singapore Turkey Indonesia Sr i Lanka
Share of Average total unit value imports $US/shirt % 55.9 4.25 32.3 4.64 3.5 14.07 1.2 1.78 (??) 0.6 10.85 0.6 11.36 0.5 6.09
Thailand I 0.4 6.46 23 other countries I 5.0 various
Following these developments, imports from Bangladesh began a rapid expansion which seems to have rung alarm bells in West Bengal. As a result, the expansion was probably slowed down by West Bengal's luxury tax on non-Indian garments (discussed earlier) which was in place between June 2001 and August 2002. Once the luxury tax was lifted, however, the import expansion accelerated during 2003104. In this year, for the f i rst time shirt imports fi-om Nepal also appeared on the scene on a substantial scale. As noted previously, provided they meet ru les o f origin conditions, these imports are duty free under the Indian-Nepal Treaty o f Trade, and therefore would appear to have an important advantage-about equivalent to the advantage o f Indian produced shirts-over imports from Bangladesh. Why they did not appear earlier i s not known, but in any event from the Bangladesh perspective, they are effectively just one (very small) part o f the total Indian domestic shirt market in which Bangladesh exporters are competing wi th domestic suppliers.
3. DEVELOPMENTS
THE BANGLADESH INDUSTRY: STRUCTURE, POLICIES AND RECENT
Size and nature of the domestic market The ready made garment industry i s Bangladesh's largest single manufacturing activity. It accounts for about three quarters o f Bangladesh's exports, about 5% o f GDP, and about 25% o f manufacturing value added. There are about 4000 RMG factories and direct employment i s approximately 2 million. It i s much larger than the textile industry, which accounts for about 1.4% o f GDP, roughly 10% o f manufacturing value added, and employs far fewer workers.
In Bangladesh, trade statistics, other data and many studies are available on RMG exports, but there i s even less information on domestic garment markets than in India"'. For example, the published statistics on ready made garment, only record information on exports, not on domestic sales"'. As this i s the data that i s used in the national account statistics, it seems that the RMG industry shares o f GDP and o f manufacturing value added would be higher than the reported shares, if domestic sales were in~luded.'~'
A rough idea o f the possible dimensions o f the domestic market for garments can be obtained indirectly from estimates o f total fabric (both woven and knitted) availability and utilisation. During 2001/02 the "export-oriented" RMG industry accounted for about 60% o f the total fabric demand, and
Of 47 RMG companies surveyed in a study by Maxwel l Stamp, during 2001/02 only 7 had domestic sales. Of these seven, 5 sold only in the domestic market, and only two both exported and sold domestically. T h e RMG production statistics (Bangladesh Bulletin o f Statistics, Statistical Bulletin) are obtained f rom the Export Promotion Bureau They are perhaps included as a miscellaneous component o f textile industry value added?
101
102
I O 3
154

A Case Study o f the Ready Made Garment Industry
domestic demand for about 40%’04. As in India, this 40% (estimated at 1654 mi l l ion metres) was presumably shared between household sewing o f garments f i om fabrics purchased in retai l stores, sewing o f garments by artisan tailors, production o f textile articles other than clothing (drapes, curtains etc), and industrial ready made garment production. Guesses that domestic RMG production might have taken 20, 30, or 40 percent o f the available domestic fabrics, correspond to domestic market shares in total RMG sales o f 11.8%, 16.6% and 21%. These percentages seem plausible, even though they are much lower than probable domestic market shares in India, because o f the far higher share in Bangladesh o f RMGs in total exports and in GDP. In the absence o f better information, in the economic welfare simulations reported below, it i s assumed that domestic sales are 15% o f total RMG sales.
Industrv structure and domestic Dolicies The dominant export side o f the Bangladesh RMG industry i s quite well doc~mented”~. Aspects that are relevant for the possibility o f trade with India under an FTA include the following:
There are no restrictions or policies equivalent to the Indian small scale industry (SSI) ru les which aim to protect and promote small scale f i rms and which are still in force in India for knitted apparel. Most RMG f i r m s in Bangladesh are small and family owned, but if a firm wishes to expand there i s no formal government restriction preventing it from doing so. Employment policies are more flexible than in India, where medium and large f i r m s face extreme difficulties in firing workers once they are hired. Nearly al l RMG exports are arranged though foreign buying agents in Bangladesh. Until recently, in most cases the buying agents also arranged for the supply o f fabrics and other inputs, and many exports were negotiated on a C M T basis i.e. the RMG firm just charges for the cost o f manufacturing and transport (excluding the material input cost). T h i s pattern i s s t i l l important, but increasingly garment manufacturers are taking fob orders where they themselves arrange to procure fabrics and other inputs, though according to buyers’ specifications. However, only a few f i rms are directly involved in marketing their exports. Most exports are o f inexpensive, l ow end products. However, a 2002 survey reported that some upgrading into higher value fashion knitwear was beginninglo6. Most fabrics used in exported garments are imported, about 60% from China, Hong Kong and South Korea, and about 15% from India. Most yams are also imported, but the domestic spinning industry i s growing rapidly to meet the rising demand o f knitwear exporters. The domestic textile industry i s heavily protected and exports very little directly. A subsidy program intended to make i t worthwhile for garment exporters to buy domestic textiles has encountered many problems and i s to be finally phased out in June 2005. However, the domestic side o f the Bangladesh RMG industry would face difficulties if it were included in an India- Bangladesh FTA or under SAFTA, unless the textile industry was also included. Otherwise Bangladesh garment producers would face import competition from Indian exporters buying their textile inputs at world prices, while paying high protected prices for their own textile inputs.
Non-tariff barriers to imports Like many other products, garments were subject to import licensing during the 1980s and before, but were freed in 1991. Imports o f used clothing are allowed, but
104
105
106
From Gherzi report, Appendix 8, Table 6 See for example: Gherzi Textil Orgnisation (2002, August). Post- M F A Development Strategy and Technical Assistance for the RMG Sector. Report submitted to the Bangladesh Ministry of Commerce. Debapriya Bhattacharya (2000, November). Seeking Fair Market Accessfor Bangladesh Apparels in the USA: n Strategic View. CPD Occasional Paper no 11. Salma Chaudhwi Zohir (2003, January). Emerging Issues in the RMG Sector of Bangladesh: Insights porn an enterprise survey. BIDS and Oxfam Bangladesh Programme. World Bank (2004, September): Trade Policies in South Asia: an Overview. Volume 111, Chapter 3:”Textiles, Garments and the MFA Phaseout” and other references given there. Gherzi report, Ch 4, p.61.
155

India-Bangladesh FTA: Methodology and Selected Case Studies
restricted by licenses issued to approve importers. H o w this works in practice i s not clear: presumably there i s some control over the total quantities imported. Textile fibres and yams are free o f QRs, but until January 2005 the import o f al l textile fabrics was either banned or subject to licensing, unless the fabrics were imported for use as inputs into exports. The non-tariff protection o f fabric production was extended under P O 2003-06 (Import Policy Order) issued in March 2004, but then removed in January 2005. The earlier policy protected large numbers o f handloom and small power loom fabric producers, as well as some government owned textile mills which were and are st i l l in precarious financial condition."'
Garment tariffs Garment tariffs were reduced from very high levels in 1992193 (when they were 102.5%) and before, to 47.5% in 1995196. They came down gradually during the rest o f the 1990s and up to FY 02, were cut fairly sharply in FY 03 and again to 33.5% in FY04, but were then abruptly pushed up to 47.2% in FY05 (Fig 10 and Table A.4), about the same level as they had been 10 years previously.
Practically all garment tariffs, both knitted (HS 61) and non-knitted (HS 62) have been and remain identical. Important apparent exceptions are traditional garments (dhotis, lunghis, saris etc) on which the protective rate i s much lower (18 % in 2003/04 and 18.5% 2004/05). However, both imports and domestic production are subject to VAT, and in practice VAT is not collected from artisan and other small scale producers o f these garments. Allowing for this, their protection rate against imports i s 36.3%.'08 Other exceptions are worn clothing on which tariffs have been reduced since FY 2002, lower tariffs on swimwear, and sharp increases to very high levels o f tar i f fs on cotton trousers and shirts (both knitted and woven) during FY 2003 and FY 2004, most o f which were retracted in FY 2005. Bangladesh does not give any tariff preferences for garment imports under SAPTA or other bilateral arrangements, and none o f its garment tar i f fs are bound at the WTO.
Textile tariffs The cost o f textiles and other inputs to RMG firms, artisan tailors and households producing garments for domestic use, i s affected by tariffs and other import policies, especially the ban on the import o f textile fabrics. The cost raising effect o f tariffs i s complicated by the use o f the VAT as a way o f giving extra protection, by charging the normal 15% VAT on imports but exempting domestic producers o f the same products'0g. For a number o f years this technique was used for both yams and fabrics: in 2004105 i t was discontinued for yams but was continued for fabrics. Whether or not extra protection i s provided to the domestic producers which increases the costs o f users, depends on whether the users are themselves subject to the VAT. In principle, industrial RMG producers have to pay the VAT on their domestic sales, so (assuming fabric imports were allowed) in choosing between imported fabrics inclusive o f VAT and domestically produced fabrics wi th no VAT, they would take account o f the fact that if they buy the domestic fabrics there would be no VAT credit to set o f f against the VAT liabilities on their sales. Hence they would pay a lower price for the domestic fabrics by the amount o f the VAT included in the cost o f imports, so that in this case the VAT exemption for the fabric producers would not increase their protection in the domestic market, nor would it add to the fabric cost for the RMG producers. However, if the fabric i s used by artisan tailors who are de iure or de facto exempt from VAT, whether or not they use imported or local fabrics would not matter, and so in this case extra protection i s
lo' Subsidiary m i l l s of the Bangladesh Textile Mills Corporation (BTMC). For a discussion o f BTMC's performance and the subsidies it has received, see World Bank (2002). Bangladesh: A Review of Public Enterprise Pe$onnance and Strategy: Key Issues and Policy Implications Because o f the de facto VAT exemption, artisan and small producers o f traditional garments are also protected against competition from larger domestic producers. There i s also no VAT included in the price if they use domestic fabrics to produce these garments. Evasion o f VAT as well as Customs duties i s a motive for the fairly substantial smuggling of traditional garments from India. In Bangladesh th is practice i s used to give extra protection to many products, not just textiles. I t clearly breaches the basic WTO national treatment principle, which says that WTO members should not use domestic taxes as a means o f protection.
lo'
109
156
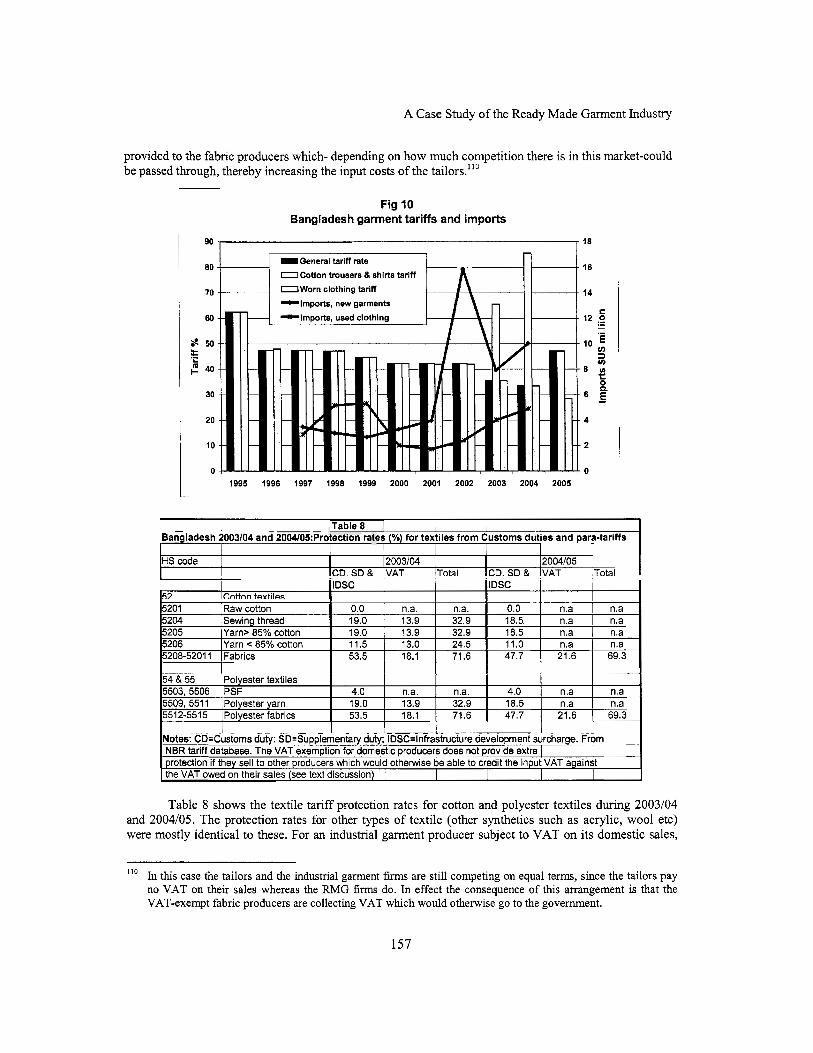
A Case Study of the Ready Made Garment Industry
provided to the fabric producers which- depending on how much competition there is in this market-could be passed through, thereby increasing the input costs o f the tailors."'
5201 5204 5205 5206 5208-5201 1
90
80
70
Raw cotton 0.0 1 n.a. n.a. 0.0 n.a n.a Sewing thread 19.0 13.9 32.9 18.5 n.a n.a Yarn> 85% cotton 19.0 , 13.9 32.9 18.5 n.a n.a Yarn 85% cotton 11.5 ' 13.0 24.5 11.0 n.a n.a Fabrics 53.5 18.1 71.6 47.7 21.6 69.3
I 30
54 & 55 5503, 5506 5509, 551 1 5512-5515
20
10
0
Polyester textiles PSF 4.0 n.a. n.a. 4.0 n.a n.a Polyester yarn 19.0 13.9 32.9 18.5 n.a n.a Polyester fabrics 53.5 18.1 71.6 47.7 21.6 69.3
Fig 10 Bangladesh garment tariffs and imports
18 - - 16 =General tariff rate
O C o t t o n trousers 8 shlrts tariff O W o r n clothing tariff -Imports, new garments
- -Imports, used clothing - - -
1995 1996 1997 1998 1999 2000 2001 2002 2003 2004 2005
I
Bangladesh 2003/04 and 2004/05:Protection rates (%) for textiles from Customs duties and para-tariffs I I I I I I I I I I 1
HScode I 12003/04 I I 12004/05 1 I k D . S D & IVAT ITotal ICD.SD& [VAT ITotal I IlDSC I I IlDSC I I
52 ICnttnn tpytilpC I I I
I I I I
Notes CJ=Customs duty SD=SuppleEerEry du_ty:_lDSC=Infrastructure aevelopment slrrcharge. From NBR tariff oataoase Tne VAT exemption for domest c producers does not prov oe extra I protection if they sell to other producers which would otherwise be able to credit the input VAT against the VAT owed on their sales (see text discussion) 1
Table 8 shows the textile tariff protection rates for cotton and polyester textiles during 2003/04 and 2004105. The protection rates for other types o f textile (other synthetics such as acrylic, wool etc) were mostly identical to these. For an industrial garment producer subject to VAT on i t s domestic sales,
In this case the tailors and the industrial garment fm are s t i l l competing on equal terms, since the tailors pay no VAT on their sales whereas the RMG fm do. In effect the consequence o f this arrangement i s that the VAT-exempt fabric producers are collecting VAT which would otherwise go to the government.
110
157
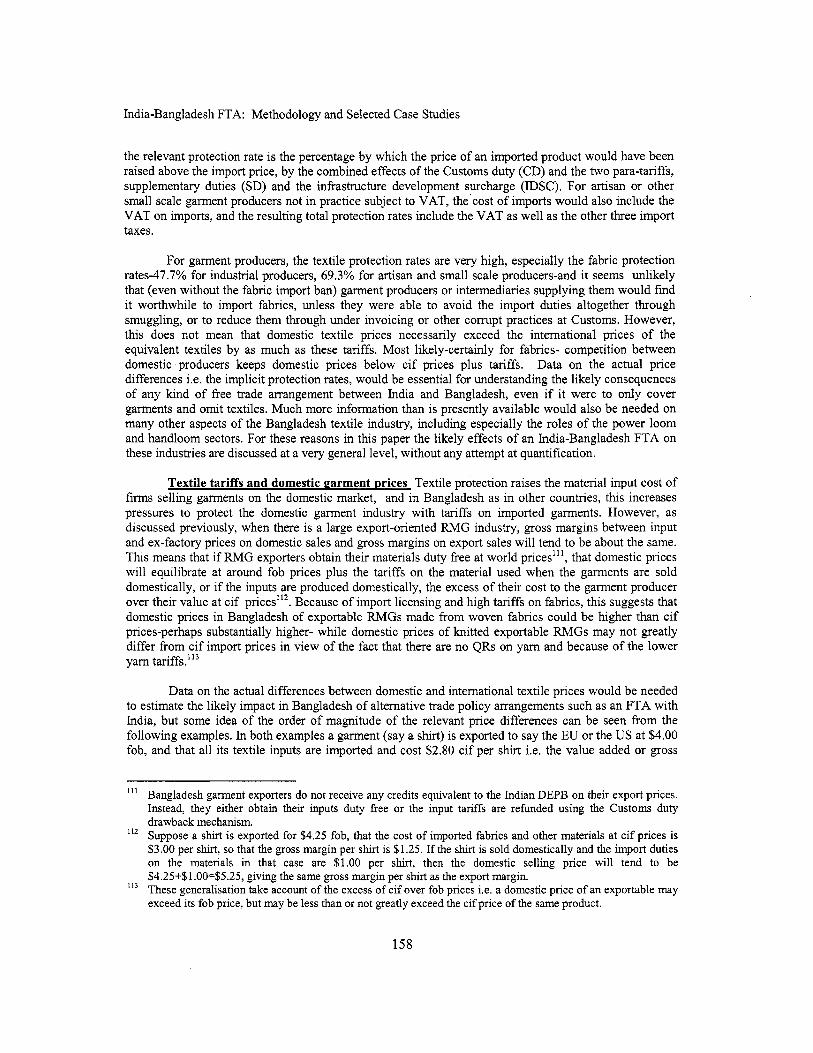
India-Bangladesh FTA: Methodology and Selected Case Studies
the relevant protection rate i s the percentage by which the price o f an imported product would have been raised above the import price, by the combined effects o f the Customs duty (CD) and the two para-tariffs, supplementary duties (SD) and the infrastructure development surcharge (IDSC). For artisan or other small scale garment producers not in practice subject to VAT, the'cost o f imports would also include the VAT on imports, and the resulting total protection rates include the VAT as well as the other three import taxes.
For garment producers, the textile protection rates are very high, especially the fabric protection rates-47.7% for industrial producers, 69.3% for artisan and small scale producers-and it seems unlikely that (even without the fabric import ban) garment producers or intermediaries supplying them would find it worthwhile to import fabrics, unless they were able to avoid the import duties altogether through smuggling, or to reduce them through under invoicing or other corrupt practices at Customs. However, this does not mean that domestic textile prices necessarily exceed the international prices o f the equivalent textiles by as much as these tariffs. Most likely-certainly for fabrics- competition between domestic producers keeps domestic prices below c i f prices plus tariffs. Data on the actual price differences i.e. the implicit protection rates, would be essential for understanding the likely consequences o f any kind o f free trade arrangement between India and Bangladesh, even if it were to only cover garments and omit textiles. Much more information than i s presently available would also be needed on many other aspects o f the Bangladesh textile industry, including especially the roles o f the power loom and handloom sectors. For these reasons in this paper the likely effects o f an India-Bangladesh FTA on these industries are discussed at a very general level, without any attempt at quantification.
Textile tariffs and domestic garment prices Textile protection raises the material input cost of f i rms selling garments on the domestic market, and in Bangladesh as in other countries, this increases pressures to protect the domestic garment industry with tariffs on imported garments. However, as discussed previously, when there i s a large export-oriented RMG industry, gross margins between input and ex-factory prices on domestic sales and gross margins on export sales w i l l tend to be about the same. Th is means that if RMG exporters obtain their materials duty free at world prices"', that domestic prices w i l l equilibrate at around fob prices plus the tariffs on the material used when the garments are sold domestically, or if the inputs are produced domestically, the excess o f their cost to the garment producer over their value at c i f prices"*. Because o f import licensing and high tar i f fs on fabrics, this suggests that domestic prices in Bangladesh o f exportable RMGs made from woven fabrics could be higher than c i f prices-perhaps substantially higher- while domestic prices o f knitted exportable RMGs may not greatly differ from c i f import prices in view o f the fact that there are no QRs on yam and because o f the lower yam tariff^."^
Data on the actual differences between domestic and international textile prices would be needed to estimate the likely impact in Bangladesh o f alternative trade policy arrangements such as an FTA with India, but some idea o f the order o f magnitude o f the relevant price differences can be seen from the following examples. In both examples a garment (say a shirt) i s exported to say the EU or the U S at $4.00 fob, and that al l i t s textile inputs are imported and cost $2.80 c i f per shirt i.e. the value added or gross
Bangladesh garment exporters do not receive any credits equivalent to the Indian DEPB on their export prices. Instead, they either obtain their inputs duty free or the input tariffs are refunded using the Customs duty drawback mechanism. Suppose a shirt i s exported for $4.25 fob, that the cost o f imported fabrics and other materials at c i f prices is $3.00 per shirt, so that the gross margin per sh i r t i s $1.25. If the sh i r t i s sold domestically and the import duties on the materials in that case are $1.00 per shirt, then the domestic selling price will tend to be $4.25+$1.00=$5.25, giving the same gross margin per shirt as the export margin. These generalisation take account o f the excess o f c i f over fob prices i.e. a domestic price o f an exportable may exceed i t s fob price, but may be less than or not greatly exceed the c i f price o f the same product.
111
113
158
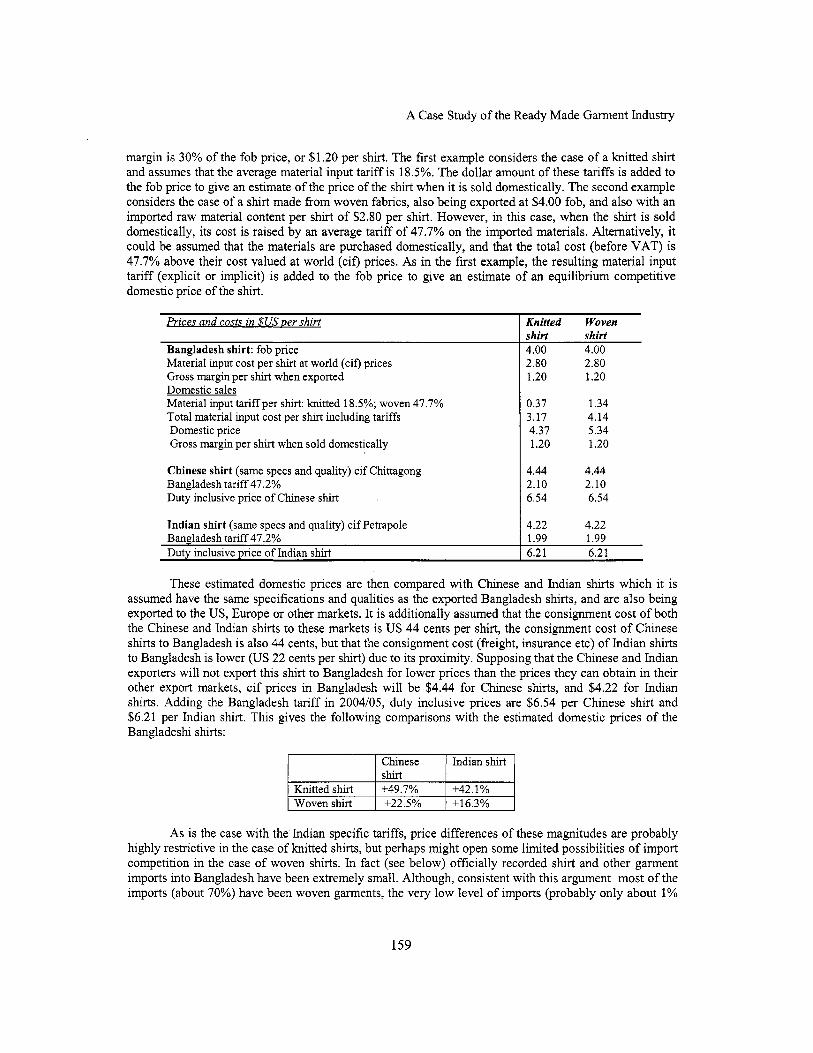
A Case Study o f the Ready Made Garment Industry
Indian shirt (same specs and quality) c i f Petrapole
Dutv inclusive mice o f Indian sh i r t Bangladesh tar i f f 47.2%
margin i s 30% o f the fob price, or $1.20 per shirt. The first example considers the case o f a knitted shirt and assumes that the average material input tariff i s 18.5%. The dollar amount o f these tariffs i s added to the fob price to give an estimate o f the price o f the shirt when it i s sold domestically. The second example considers the case o f a shirt made from woven fabrics, also being exported at $4.00 fob, and also wi th an imported raw material content per shirt o f $2.80 per shirt. However, in this case, when the shirt i s sold domestically, its cost i s raised by an average tari f f o f 47.7% on the imported materials. Alternatively, it could be assumed that the materials are purchased domestically, and that the total cost (before VAT) i s 47.7% above their cost valued at world (cif) prices. As in the first example, the resulting material input tariff (explicit or implicit) i s added to the fob price to give an estimate o f an equilibrium competitive domestic price o f the shirt.
Prices and costs in $US per shirt I Knitted Woven
4.22 4.22 1.99 1.99 6.21 6.21
Bangladesh shirt: fob price Material input cost per shirt at world (cif) prices Gross margin per s h i r t when exported Domestic sales Material input tar i f f per shir t : knitted 18.5%; woven 47.7% Total material input cost per s h i r t including tari f fs Domestic price Gross margin per shirt when sold domestically
Chinese shirt (same specs and quality) c i f Chittagong Bangladesh tar i f f 47.2% Duty inclusive price o f Chinese sh i r t
Knitted s h i r t Woven sh i r t
shirt shirt 4.00 4.00
Chnese Indian shirt S h i r t +49.7% +42.1% +22.5% +16.3%
2.80 2.80 1.20 1.20
0.37 1.34 3.17 4.14 4.37 5.34 1.20 1.20
4.44 4.44 2.10 2.10 6.54 6.54
As i s the case with the Indian specific tariffs, price differences o f these magnitudes are probably highly restrictive in the case o f knitted shirts, but perhaps might open some limited possibilities o f import competition in the case o f woven shirts. In fact (see below) officially recorded shirt and other garment imports into Bangladesh have been extremely small. Although, consistent with this argument most o f the imports (about 70%) have been woven garments, the very low level o f imports (probably only about 1%
159
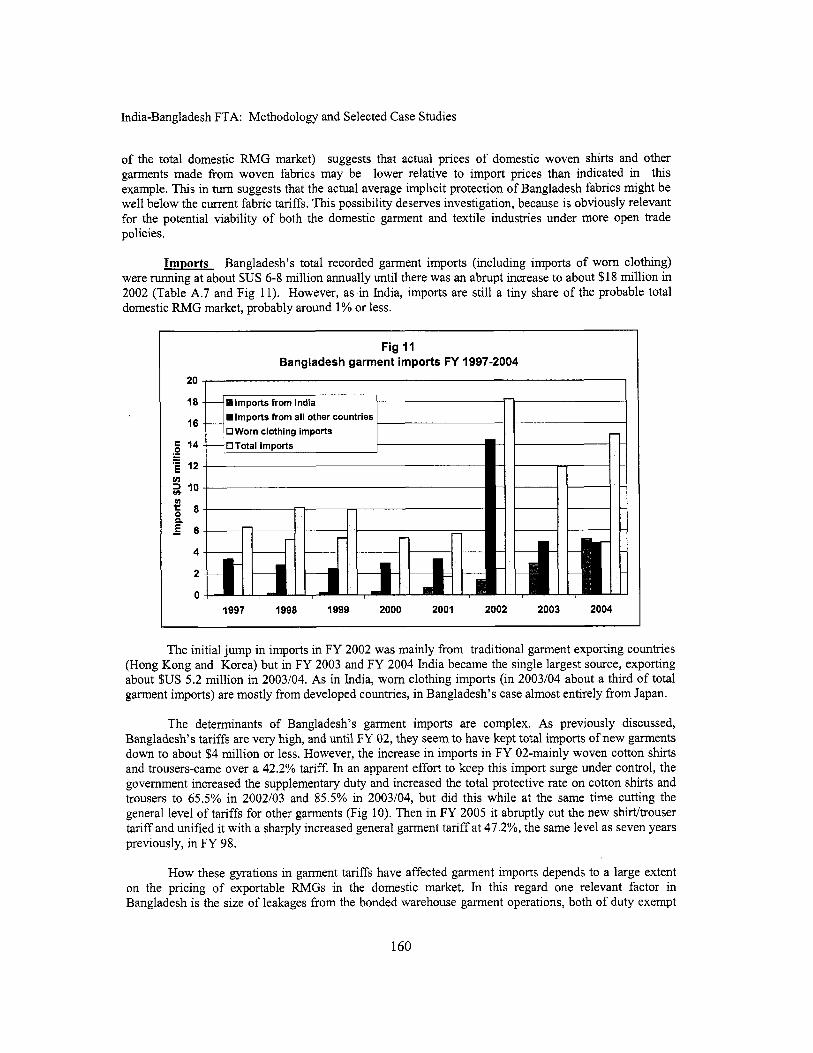
India-Bangladesh FTA: Methodology and Selected Case Studies
o f the total domestic RMG market) suggests that actual prices o f domestic woven shirts and other garments made from woven fabrics may be lower relative to import prices than indicated in this example. T h i s in turn suggests that the actual average implicit protection o f Bangladesh fabrics might be well below the current fabric tar i f fs . T h i s possibility deserves investigation, because i s obviously relevant for the potential viability o f both the domestic garment and textile industries under more open trade policies.
Imports Bangladesh’s total recorded garment imports (including imports o f worn clothng) were running at about $US 6-8 mil l ion annually until there was an abrupt increase to about $18 mi l l ion in 2002 (Table A.7 and F i g 11). However, as in India, imports are s t i l l a tiny share of the probable total domestic RMG market, probably around 1% or less.
Fig 11 Bangladesh garment imports FY 1997-2004
20 , 18
16
5 14
12 .- - rA 2 10
f a a
1 6
4
2
0
her countries
1997 1998 I999 2000 2001 2002 2003 2004
The initial jump in imports in FY 2002 was mainly from traditional garment exporting countries (Hong Kong and Korea) but in FY 2003 and FY 2004 India became the single largest source, exporting about $US 5.2 mi l l ion in 2003104. As in India, worn clothing imports (in 2003104 about a third o f total garment imports) are mostly from developed countries, in Bangladesh’s case almost entirely from Japan.
The determinants o f Bangladesh’s garment imports are complex. As previously discussed, Bangladesh’s tariffs are very high, and until FY 02, they seem to have kept total imports o f new garments down to about $4 mi l l ion or less. However, the increase in imports in FY 02-mainly woven cotton shirts and trousers-came over a 42.2% tariff. In an apparent effort to keep this import surge under control, the government increased the supplementary duty and increased the total protective rate on cotton shirts and trousers to 65.5% in 2002103 and 85.5% in 2003104, but did this while at the same time cutting the general level o f tariffs for other garments (Fig 10). Then in FY 2005 it abruptly cut the new shirt/trouser tariff and unified i t with a sharply increased general garment tariff at 47.2%, the same level as seven years previously, in FY 98.
H o w these gyrations in garment tariffs have affected garment imports depends to a large extent on the pricing o f exportable RMGs in the domestic market. In this regard one relevant factor in Bangladesh i s the size o f leakages from the bonded warehouse garment operations, both o f duty exempt
160
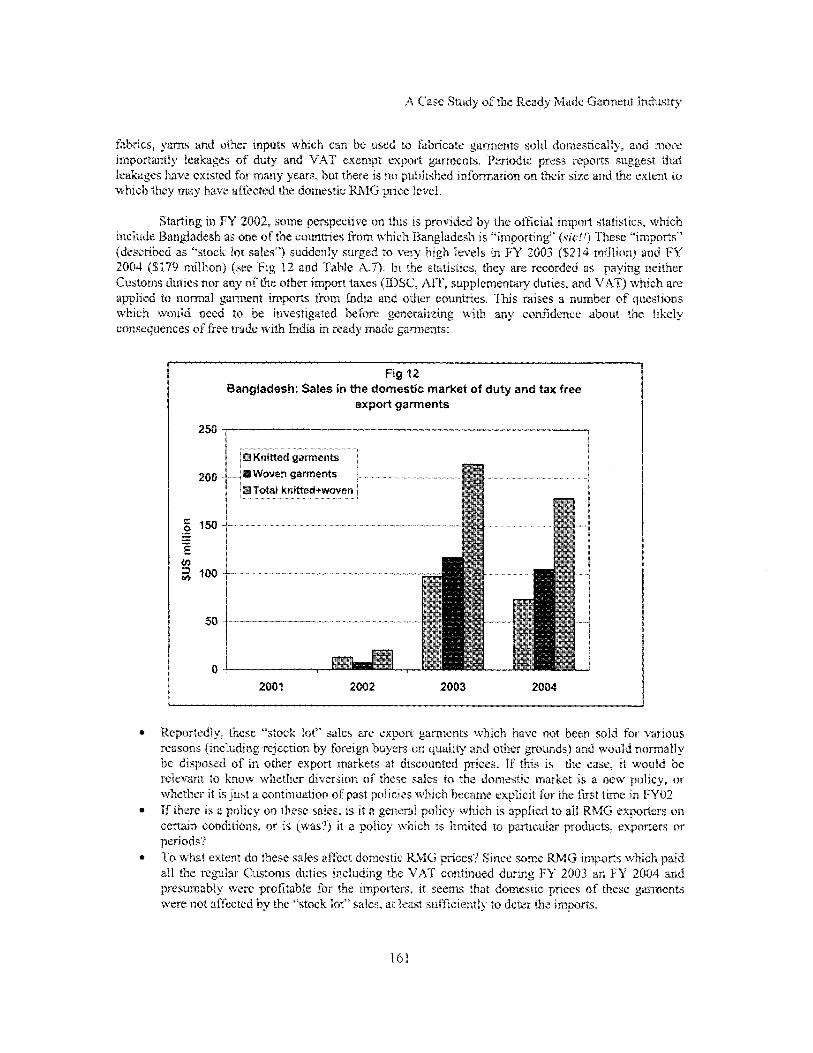
:1, Case Study ofthe Ready Made ~~~~~~~~ Industry
fahncs, yarns and other inputs which can be d to fabricate garments sold dornestteally, and inore
leakages have existed for many years, but there IS no p~ih~~shed ~ n ~ u ~ ~ ~ i u n on thcrr size and the extent to which they mny have affectcd the domestic LMCr prm level.
ges of duty and VAT exempt export ~ ~ r ~ t c ~ ~ s . Periodic pr
Starting in FY 2002, some ~ e ~ s p c c ~ ~ ~ r e on this IS p r o ~ ~ i ~ e d by the oniicisl import Statistics, which. include ~ ~ n ~ ~ a ~ ~ s h as one o f the countries from which Ranglad (described as "stock lot safes"') suddeniy surged to very high Z 2004 ($179 million) (see Fig 12 and 'C Customs duties nor any ofthe other imp applied to normal ~ a ~ ~ n ~ impom from which would need to be i eonseqL~ences o f fkee trrtde with India in rcady made gamcrrts:
1. In the statistics, t rccordcd as paying neither duties, and VAT) tvhich arc ises a numbcr o f questions
igated before ~ e n e r a l ~ z ~ n ~ with any confidence about the likely
Fig 12 ~ a ~ ~ l a d e ~ h : Sates in the domestic market of duty and fax free
axport garments
250 l..l.-...
2001 2002 2003 2004
"stock lot" saies are expcirt ~ ~ ~ ~ e n ~ s which have not heen sold for various
other export markets at discounted prkes. 1f t s the case, r t wotrld he to know whcther diversion o f these sates to the domesti rkct IS a t x k v pulicy. or
icy which i s applied to alt RMG expclrtcrs on s limrtcd to ~ a r t i ~ ~ l ~ ~ products, exporters DT
p ~ c e s ' t Since srtmc RMG imports which paid c o n ~ ~ n ~ e d dttring Fk' 21303 an FY 2003 and
c pnccs o f thcsc ~ ~ ~ ~ e t ~ ~ s
r€?J@CtiQn hy fOrelgn hUyWS 013 qUahw and other nds) and would ~ o ~ r ~ ~ a l l ?
ast policies which bcca
do these sales affect domestic Customs duties ~ n ~ ~ ~ ~ d ~ n g thc
p ~ ~ ~ u r ~ ~ a b ~ ~ were p ~ 0 ~ ~ ~ ~ b ~ c for the ~ ~ ~ ~ p o ~ e r ~ , t t SCGMS that do were rtot affected by thc "stock lot" sales. at least ~ ~ f ~ c ~ e ~ t l ~ to

India-Bangladesh FTA: Methodology and Selected Case Studies
On the other hand, the total “stock lot” sales seem to be large in relation to the l ikely total domestic Bangladesh RMG market (perhaps 1530% in FY 03 and FY 04), and this volume o f sales would be expected to have some effect on the general level o f domestic RMG prices. But the stock lo t sales are a much smaller proportion o f total RMG sales if exports ($US 4.58 bi l l ion in FY 2002) are included. In FY 2003 they were only about 4.3% o f total RMG exports. If, as argued in this paper, Bangladesh RMG prices are determined by total world demand for Bangladesh garments relative to the supply o f Bangladesh garments, with a premium in the internal Bangladesh market equal to the protection of garment inputs, then the stock lo t sales may have had only a minor impact on domestic prices. Nevertheless, given that the stock lot sales are exempt from al l taxes whereas RMG producers selling domestically, retail tailors using domestic fabrics and other inputs, and importers o f RMGs from other countries are al l subject to substantial taxes (about 70% on imports with VAT included), there i s a possibility that substantial economic rents could be associated with these sales. In this regard, it i s relevant to note that in India domestic sales o f export rejects or surplus stocks from bonded warehouse or EPZ operations must pay the normal import duties on their inputs, and the sales are also subject to normal domestic taxes including the central government excise tax and sales taxes. All these questions and issues would need to be clarified and clear policies agreed on if an FTA with India (including SAFTA) were to cover the RMG sector.
Smuggling Studies o f informal trade over the India-Bangladesh border have consistently found “textiles” (defined broadly to include garments) to be one o f the largest single product groups smuggled from India to Bangladesh. By contrast, there appears to be practically no smuggling in the other direction, except for gold as one o f the means by which Bangladesh traders pay for the smuggled Indian goods. In three separate studies114 based on surveys in 1984, 1998, and 2002, textiles were respectively 15%, 25%, and 15% o f the total estimated amounts smuggled into Bangladesh. Very roughly adjusting for differences in the coverage o f the surveys, the total value o f the smuggling estimated in these studies was (in $US million):
2002 As the three studies emphasize, given the nature o f the subject and the field methods used (interviews with traders and “knowledgeable persons” in border area trading and smuggling centres) these estimates are very approximate, and using them to infer trends in the total level o f smuggling would be especially hazardous. In particular, they do not deal wi th “technical” smuggling (i.e. goods that are imported through Customs posts but with false documentation by which they avoid or reduce import duties). There i s presumably some substitution between this and informal “bootleg” smuggling o f the kind covered in the informal trade surveys, in the sense that if organized smuggling through the Customs were to become easier and less expensive, there would be less incentive to smuggle by “bootleg” routes.
Most o f the textile products identified in the smuggling surveys are finished traditional consumer textile products, not ready made garments. In the 2002 survey, four products accounted for 99% o f the estimated total value o f the seven textile goods smuggled. They were:
S.K. Chaudhari (1995); Rahman and Razzaque (1998); Bayes (2004). 1 I 4
162
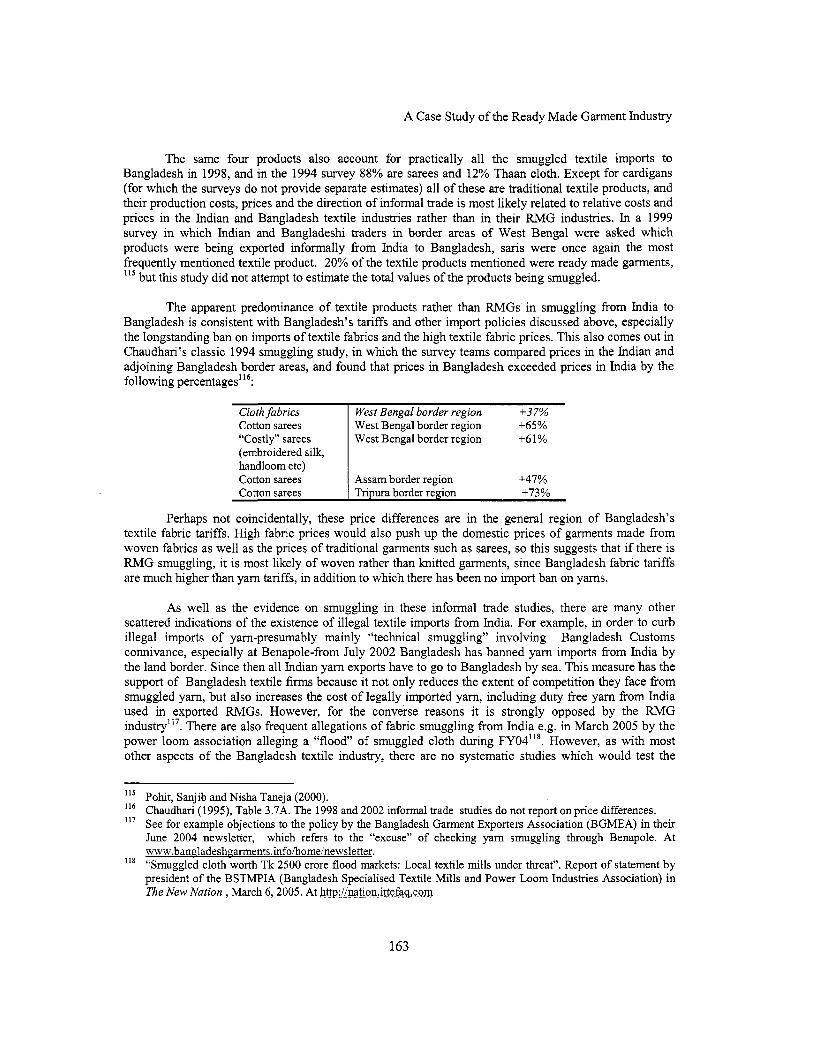
A Case Study o f the Ready Made Garment Industry
Cloth fabrics Cotton sarees “Costly” sarees (embroidered si lk, handloom etc) Cotton sarees Cotton sarees
The same four products also account for practically al l the smuggled textile imports to Bangladesh in 1998, and in the 1994 survey 88% are sarees and 12% Thaan cloth. Except for cardigans (for which the surveys do not provide separate estimates) al l o f these are traditional textile products, and their production costs, prices and the direction o f informal trade i s most l ikely related to relative costs and prices in the Indian and Bangladesh textile industries rather than in their RMG industries. In a 1999 survey in which Indian and Bangladeshi traders in border areas o f West Bengal were asked which products were being exported informally from India to Bangladesh, sans were once again the most frequently mentioned textile product. 20% o f the textile products mentioned were ready made garments,
but this study did not attempt to estimate the total values o f the products being smuggled. 11s
West Bengal border region +37% West Bengal border region +65% West Bengal border region +61%
Assam border region +47% Tripura border region +73%
The apparent predominance o f textile products rather than RMGs in smuggling from India to Bangladesh i s consistent with Bangladesh’s tar i f fs and other import policies discussed above, especially the longstanding ban on imports o f textile fabrics and the high textile fabric prices. This also comes out in Chaudhari’s classic 1994 smuggling study, in which the survey teams compared prices in the Indian and adjoining Bangladesh border areas, and found that prices in Bangladesh exceeded prices in India by the following percentages’l6:
As wel l as the evidence on smuggling in these informal trade studies, there are many other scattered indications o f the existence o f illegal textile imports from India. For example, in order to curb illegal imports o f yam-presumably mainly “technical smuggling” involving Bangladesh Customs connivance, especially at Benapole-from July 2002 Bangladesh has banned yam imports from India by the land border. Since then all Indian yam exports have to go to Bangladesh by sea. T h i s measure has the support o f Bangladesh textile f i rms because it not only reduces the extent o f competition they face from smuggled yam, but also increases the cost o f legally imported yam, including duty free yam from India used in exported RMGs. However, for the converse reasons it i s strongly opposed by the RMG ind~stry”~. There are also frequent allegations o f fabric smuggling from India e.g. in March 2005 by the power loom association alleging a “flood” o f smuggled cloth during FY041’8. However, as with most other aspects o f the Bangladesh textile industry, there are no systematic studies which would test the
‘Is Pohit, Sanjib and Nisha Taneja (2000). ‘I6 Chaudhari (1995), Table 3.7A. The 1998 and 2002 informal trade studies do not report on price differences.
See for example objections to the policy by the Bangladesh Garment Exporters Association (BGMEA) in their June 2004 newsletter, which refers to the “excuse” of checking yarn smuggling through Benapole. At www.ban,gladeshrrarments.infoihome/newsletter.
‘I8 “Smuggled cloth worth Tk 2500 crore flood markets: Local textile m i l l s under threat”. Report of statement by president o f the BSTMPIA (Bangladesh Specialised Textile Mills and Power Loom Industries Association) in The New Nation , March 6,2005. At httv://nation,ittefaa.com
1 I 7
163
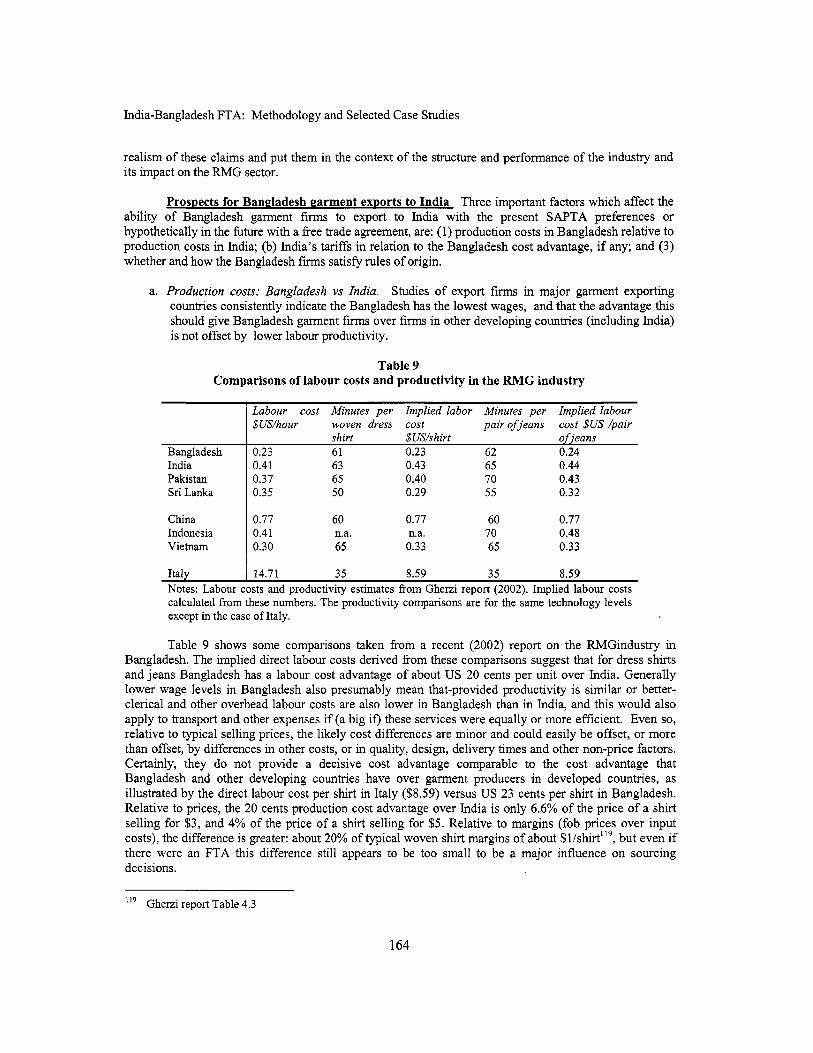
India-Bangladesh FTA: Methodology and Selected Case Studies
realism o f these claims and put them in the context o f the structure and performance o f the industry and i ts impact on the RMG sector.
Prospects for Bangladesh garment exDorts to India Three important factors which affect the ability o f Bangladesh garment f i rms to export to India with the present SAPTA preferences or hypothetically in the fbture with a free trade agreement, are: (1) production costs in Bangladesh relative to production costs in India; (b) India's tariffs in relation to the Bangladesh cost advantage, if any; and (3) whether and how the Bangladesh f i rms satisfy rules o f origin.
a. Production costs: Bangladesh vs India. Studies o f export f m s in major garment exporting countries consistently indicate the Bangladesh has the lowest wages, and that the advantage this should give Bangladesh garment f i rms over f irms in other developing countries (including India) i s not offset by lower labour productivity.
Table 9 Comparisons of labour costs and productivity in the RMG industry
Labour cost Minutes per Implied labor Minutes per Implied labour $US/hour woven dress cost uair of ieans cost $US h a i r
Bangladesh India Pakistan Sri Lanka
China Indonesia Vietnam
I ta ly
- _I
shirt $US/shirt ofjeans 0.23 61 0.23 62 0.24 0.41 63 0.43 65 0.44 0.37 65 0.40 70 0.43 0.35 50 0.29 55 0.32
0.77 60 0.77 60 0.77 0.4 1 n.a. n.a. 70 0.48 0.30 65 0.33 65 0.33
14.71 35 8.59 35 8.59 Notes: Labour costs and productivity estimates from Gherzi report (2002). Implied labour costs calculated f rom these numbers. The productivity comparisons are for the same technology levels except in the case o f Italy.
Table 9 shows some comparisons taken from a recent (2002) report on the RMGindustry in Bangladesh. The implied direct labour costs derived from these comparisons suggest that for dress shirts and jeans Bangladesh has a labour cost advantage o f about U S 20 cents per unit over India. Generally lower wage levels in Bangladesh also presumably mean that-provided productivity i s similar or better- clerical and other overhead labour costs are also lower in Bangladesh than in India, and this would also aoalv to transnort and other exnenses if (a hip i f l these services were eouallv or more efficient. Even so. relative to typical selling prices, the likely cost differences are minor and could easily be offset, or more than offset, by differences in other costs, or in quality, design, delivery times and other non-price factors. Certainly, they do not provide a decisive cost advantage comparable to the cost advantage that Bangladesh and other developing countries have over garment producers in developed countries, as illustrated by the direct labour cost per shirt in Italy ($8.59) versus US 23 cents per shirt in Bangladesh. Relative to prices, the 20 cents production cost advantage over India i s only 6.6% o f the price o f a shirt selling for $3, and 4% o f the price o f a shirt selling for $5. Relative to margins (fob prices over input costs), the difference i s greater: about 20% o f typical woven shirt margins o f about $ l / ~ h i r t " ~ , but even if there were an FTA this difference s t i l l appears to be too small to be a major influence on sourcing decisions.
' I 9 Gherzi report Table 4.3
164
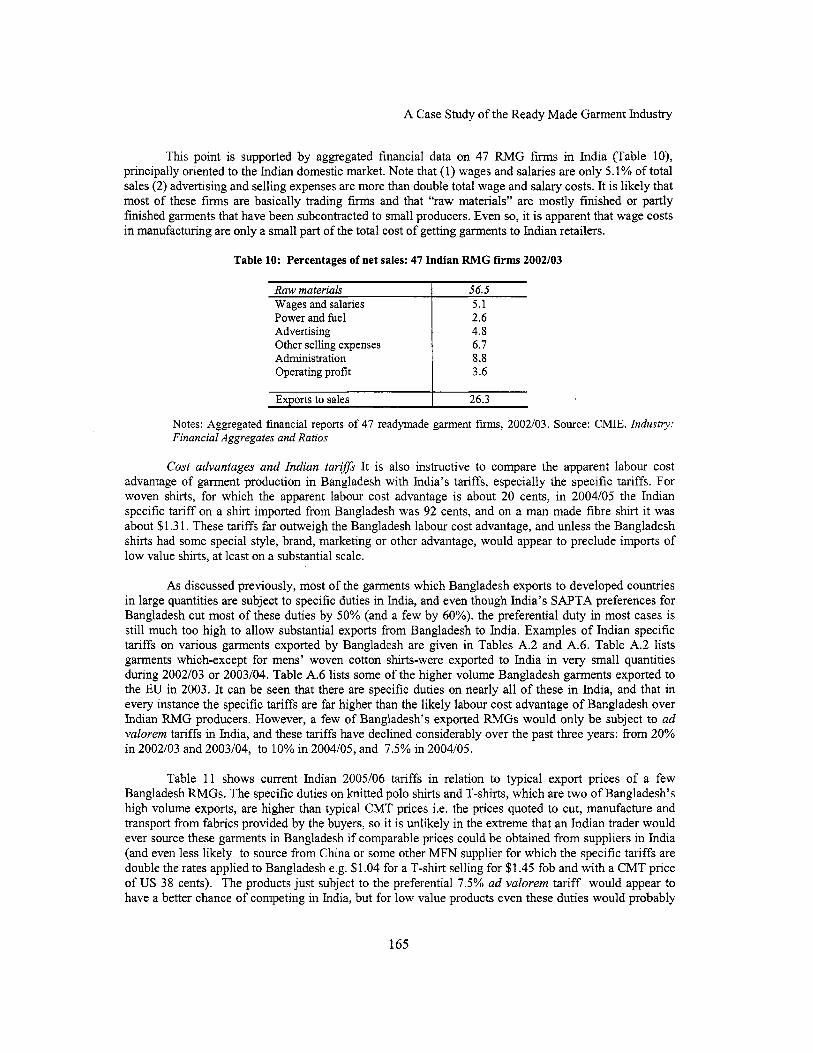
A Case Study o f the Ready Made Garment Industry
Raw materials
T h i s point i s supported by aggregated financial data on 47 RMG f i rms in India (Table lo), principally oriented to the Indian domestic market. Note that (1) wages and salaries are only 5.1% o f total sales (2) advertising and selling expenses are more than double total wage and salary costs. It i s l ikely that most o f these firms are basically trading f i rms and that “raw materials” are mostly finished or partly finished garments that have been subcontracted to small producers. Even so, it i s apparent that wage costs in manufacturing are only a small part o f the total cost o f getting garments to Indian retailers.
56.5
Table 10: Percentages of net sales: 47 Indian RMG firms 2002/03
Wages and salaries 5.1 Power and fuel Advertising Other selling expenses Administration Operating profit
Exports to sales
2.6 4.8 6.7 8.8 3.6
26.3
Cost advantages and Indian ta rgs I t i s also instructive to compare the apparent labour cost advantage o f garment production in Bangladesh with India’s tariffs, especially the specific tariffs. For woven shirts, for which the apparent labour cost advantage i s about 20 cents, in 2004105 the Indian specific tariff on a shirt imported from Bangladesh was 92 cents, and on a man made fibre shirt it was about $1.3 1. These tariffs far outweigh the Bangladesh labour cost advantage, and unless the Bangladesh shirts had some special style, brand, marketing or other advantage, would appear to preclude imports o f low value shirts, at least on a substantial scale.
As discussed previously, most o f the garments which Bangladesh exports to developed countries in large quantities are subject to specific duties in India, and even though India’s SAPTA preferences for Bangladesh cut most o f these duties by 50% (and a few by 60%). the preferential duty in most cases i s s t i l l much too high to allow substantial exports from Bangladesh to India. Examples o f Indian specific tariffs on various garments exported by Bangladesh are given in Tables A.2 and A.6. Table A.2 lists garments which-except for mens’ woven cotton shirts-were exported to India in very small quantities during 2002103 or 2003/04. Table A.6 l ists some o f the higher volume Bangladesh garments exported to the EU in 2003. I t can be seen that there are specific duties on nearly al l o f these in India, and that in every instance the specific tariffs are far higher than the l ikely labour cost advantage o f Bangladesh over Indian RMG producers. However, a few o f Bangladesh’s exported RMGs would only be subject to ad valorem tariffs in India, and these tar i f fs have declined considerably over the past three years: from 20% in 2002103 and 2003104, to 10% in 2004105, and 7.5% in 2004105.
Table 11 shows current Indian 2005106 tariffs in relation to typical export prices o f a few Bangladesh RMGs. The specific duties on knitted polo shirts and T-shirts, which are two o f Bangladesh’s high volume exports, are higher than typical C M T prices i.e. the prices quoted to cut, manufacture and transport from fabrics provided by the buyers, so it i s unlikely in the extreme that an Indian trader would ever source these garments in Bangladesh if comparable prices could be obtained from suppliers in India (and even less likely to source from China or some other MFN supplier for which the specific tariffs are double the rates applied to Bangladesh e.g. $1.04 for a T-shirt selling for $1.45 fob and with a C M T price o f U S 38 cents). The products just subject to the preferential 7.5% ad valorem tar i f f would appear to have a better chance o f competing in India, but for l ow value products even these duties would probably
165

India-Bangladesh FTA: Methodology and Selected Case Studies
make l i fe difficult for Bangladesh suppliers. For example, if India were to remove the specific duty on Bangladesh T-shirts, the ad valorem duty for Bangladesh suppliers would s t i l l be around 30% o f the C M T price. For these reasons, as emphasized elsewhere, given the highly competitive Indian RMG industry, Bangladesh garment exporters would probably need duty free access to India to have much hope of winning substantial market shares in high volume products. If India abolishes the specific duties, even at the current reduced ad valorem tar i f fs and with a substantial advantage over MFN suppliers, export prospects would be modest, and if the present specific duties are maintained, Bangladesh suppliers would probably be confined to small, mostly specialised or opportunistic fimges o f the Indian RMG market.
Notes: prices from Gherri report. Ch 4, p.64. HS classifications are not given, so the Indian tariffs may vary from these e.g. depending on the predominant material used
Rules of origin. For the SAPTA LDCs (Bangladesh, Nepal, Bhutan and the Maldives) to obtain tari f f preferences in exporting to India, the maximum material input content (valued at c i f prices) that can be imported from non-SAPTA countries, i s 70% o f the fob price. This was increased from 60% in November 2000, following complaints from Bangladesh and the other SAPTA LDCs that the previous origin rule was too demanding. In this respect, Bangladesh has an advantage over Palustan and Sri Lanka, for which the maximum imported content i s s t i l l 60%. As i s usual in preferential trading areas, the minimum local content requirement can be met by importing materials from other SAPTA members, but subject to the additional constraint that if this i s done, the content requirement increases to 40% o f the fob price. For Bangladesh f i rms exporting to India, this means that if they use imported materials from India to help satisfy the SAPTA origin rule, they have to buy sufficient o f these materials to raise the regional content (i.e. processing costs and Bangladesh materials, plus the materials imported from India) to at least 40% o f the fob price.
As India i s in any case supplying a substantial share o f the imported inputs o f Bangladesh’s exported RMGs, satisfying the SAPTA rules o f origin i s probably not at present a serious problem for most Bangladesh RMG exports to India. Moreover, backward integration into hitting already reportedly allows most Bangladesh knitted garment producers to easily satisfy this requirement. Therefore the application o f the same or similar origin rules in a bilateral India-Bangladesh FTA, or in SAFTA, would constrain Bangladesh exporters to some extent, but not seriously. Nevertheless, i f Indian materials that would otherwise not be used, are used to satisfy the origin rules, by definition the Bangladesh exporters to India are disadvantaged relative to a situation without the ru les o f origin. In this regard, the Bangladesh ban on yarn imports from India by the land route(in force since 2002) obviously disadvantages Bangladesh RMG f i rms (especially h i tware firms, it seems) exporting to the rest o f the wor ld and actually exporting (or interested in exporting) to India.
166
A Case Study o f the Ready Made Garment Industry
4. ECONOMIC WELFARE ANALYSIS
Th is case study was done without the benefit o f field surveys, i s based on published data only, and uses guesses about key parameters, especially parameters relating to the Indian domestic RMG markets. Because o f an almost complete absence o f relevant published data and information on Bangladesh domestic garment markets, the economic welfare simulations are confined to alternative estimates o f the effects o f Bangladesh RMG exports to India following an FTA: n o attempt i s made to quantify the likely economic welfare consequences o f RMG trade in the reverse direction, from India to Bangladesh. Consequently the case study welfare simulations are provisional and incomplete, indicating possible orders o f magnitude o f some key l ikely effects, but ignoring others.
In thinlung about these potential economic welfare changes, two approaches are possible. If the relevant garment markets in India are taken to include home sewing o f fabrics and tailor made clothes as wel l as factory produced ready made garments, aggregate clothing demand i s probably relative inelastic, but on the other hand even substantial imports from Bangladesh are unlikely to account for more than a very small fraction o f th is huge total market. Consequently, despite the inelastic demand (e.g. an index o f aggregate clothing demand relative to a general index o f clothing prices) the induced decline in the general level o f clothing prices will be very small, so that the consumer and producer welfare effects would consist o f very small-almost imperceptible- changes in prices, but spread over very large demand and output ranges. Alternatively, if only ready made garments are taken to be the relevant markets, the impact o f RMG imports from Bangladesh could be greater relative to total demand and production, but on the other hand demand for ready made garments in the aggregate i s l ikely to be highly elastic, because o f substitution wi th home and tailor made garments. Hence the changes in CS and PS in the RMG markets are likely to reflect non-negligible changes in the supply and demand for RMGs, but small changes in average prices. Which o f these approaches would be best to use depends on data availability and research resources. In the following sections how these estimates might turn out i s illustrated using some alternative guessed parameters for ready made garments.
For the reasons discussed previously, this section focuses on the potential for and l ikely effects o f Bangladesh garment exports to India under an FTA: some brief comments on the reverse f low o f Indian garments to Bangladesh that would probably also occur are made later. Even though the latest available detailed trade data i s for India’s FY 2004, the discussion also recognizes that the MFA expired on December 31, 2004 and assumes that a bilateral FTA would be implemented in a much less complex global scenario for the T&C industries. In particular, in this scenario, in both India and Bangladesh market-specific quota premia wil l no longer exist, and for given garment types and qualities, fob prices and margins w i l l tend to equalize across export markets.
Effects in Bangladesh. As discussed previously, in Bangladesh the combination o f prohibitively high tariffs and a large, very l o w cost export-oriented RMG industry for al l practical purposes shuts out legal imports that would compete on any significant scale ’in domestic garment markets. Presumably because o f the highly competitive domestic garment industry and low domestic prices, smuggling o f garments i s also quite minor. This would undoubtedly change if an FTA with India were to include garments, but owing to inadequate data on Bangladesh domestic garment markets it i s not discussed in this paper.
If the Bangladesh garments going to India are international brands and styles that are the same or very similar to the garments that Bangladesh exports on a large scale to the rest o f the world, it i s l ikely that an initial effect o f the opening o f the Indian market under an FTA will be to divert some o f the exports that would have otherwise gone to ROW, thus reducing the net increase in Bangladesh exports. For a while, because o f Bangladesh’s freight advantage in supplying India, it i s l ikely that Bangladesh exporters supplying India will receive somewhat higher fob prices than prevailing fob prices to ROW, but
167

India-Bangladesh FTA: Methodology and Selected Case Studies
the premium will induce more exporters to divert supplies to India until fob prices in supplying India and ROW are about equal. The extent o f economic welfare benefit in Bangladesh-in the form o f increased exporter producer surpluses-will depend, however, on the extent to which the general level o f export prices-both to ROW and to India-increases. This in turn w i l l depend on (a) the size o f the new or enlarged market in India relative to Bangladesh’s total exports o f the products in question (b) the extent to which Bangladesh’s prices can go up without diverting demand to other ROW suppliers, and (c) the responsiveness o f Bangladesh exporters to increased export prices. At one extreme, if ROW demand is highly sensitive to increases in Bangladesh’s export prices, export prices might rise only very slightly and the main impact o f the FTA might be to divert exports away from ROW markets to India, with little or no increase in export prices or in the total volume o f exports. In that case the economic welfare improvement in Bangladesh could be small or negligible. There could be larger producer surplus benefits in Bangladesh, if the contraction o f the Bangladesh supply to the world market o f these particular products causes its export prices to go up. T h i s would be more likely to happen if the quantities diverted to the Indian market were large relative Bangladesh’s exports to ROW, and if garment exporters in other countries were not able to easily substitute for the Bangladesh garments. However, higher export prices would mean higher domestic prices in Bangladesh, and the resulting consumer surplus reductions would need to be deducted from the producer surplus increases. As discussed previously, there i s no comprehensive data on Bangladesh domestic RMG sales, but they are probably a quite l ow relative to RMG exports, so for any given price increase, the resulting consumer surplus adjustment would be small relative the producer surplus benefits from exports. An FTA would also very l ikely stimulate garment exports from India to Bangladesh. Th is i s discussed separately later and will somewhat modify the economic welfare outcome for Bangladesh.
Some effects on exports and domestic sales are illustrated in F ig 1 using the example o f cotton woven shirts. There are many varieties and qualities o f cotton shirts which sell at different prices. To bring out the principal points without dealing wi th these complications, prices refer to the average prices o f a large number o f shirt-types bundled in fixed proportions. In the pre-FTA scenario, Bangladesh i s producing a total o f DK shirts, o f which DJ are exported to ROW, DG are going to India, and DW are being sold domestically. The break in the X axis ( the wavy lines) i s intended to indicate that exports to ROW and total production are far greater than domestic sales or exports to India. For example, in FY 04 about 110 mi l l ion shirts were exported, but only about one mil l ion o f these went to India. Exports to India are restricted by a tari f f (CA per shirt) which reduces the net price received by Bangladesh exporters. The contractionary effect o f the Indian tariff from the perspective o f Bangladesh shirt exporters i s represented by the dotted pre-FTA demand curve. The domestic price i s Db, determined by competition between exporters in the domestic market, i s equal to the export price (DC) plus the per shirt cost o f input tar i f fs (distance cb). At this price domestic demand i s DW. The total demand curve is the horizontal sum of aggregate demand from ROW plus the constricted demand from India, plus domestic demand. The intersection o f this with the Bangladesh export supply curve gives an equilibrium fob price D C and total output and sales DK. As noted above, in a world without the MFA, competition between Bangladesh exporters i s assumed to equalize the prices for given types and qualities o f shirts across different ROW markets, and between ROW markets and India.
168
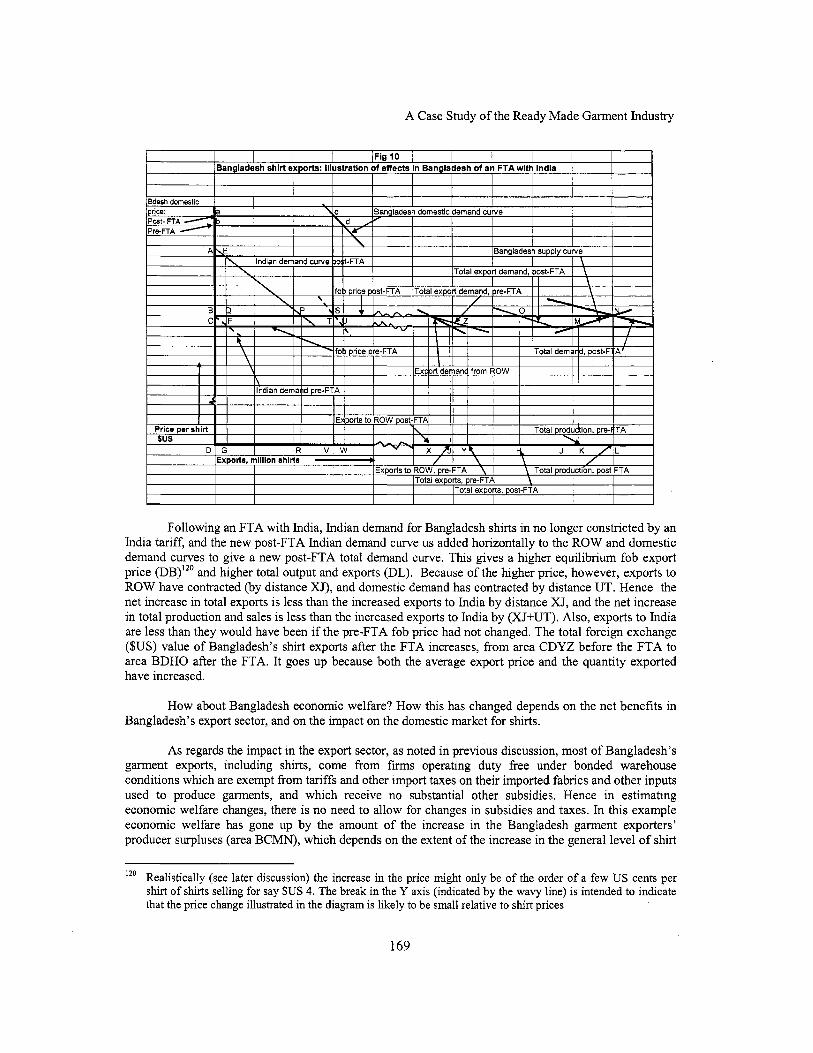
A Case Study o f the Ready Made Garment Industry
/Bangladesh shirt exports: illustration of effects in Bangladesh of an FTA with India I I I I I I I I I 1 I
1
Following an FTA with India, Indian demand for Bangladesh shirts in no longer constricted by an India tariff, and the new post-FTA Indian demand curve us added horizontally to the ROW and domestic demand curves to give a new post-FTA total demand curve. T h i s gives a higher equilibrium fob export price (DB)’” and higher total output and exports (DL). Because o f the higher price, however, exports to ROW have contracted (by distance XJ), and domestic demand has contracted by distance UT. Hence the net increase in total exports i s less than the increased exports to India by distance XJ, and the net increase in total production and sales i s less than the increased exports to India by (XJ+UT). Also, exports to India are less than they would have been i f the pre-FTA fob price had not changed. The total foreign exchange ($US) value o f Bangladesh’s shirt exports after the FTA increases, from area CDYZ before the FTA to area BDHO after the FTA. It goes up because both the average export price and the quantity exported have increased.
H o w about Bangladesh economic welfare? H o w this has changed depends on the net benefits in Bangladesh’s export sector, and on the impact on the domestic market for shirts.
As regards the impact in the export sector, as noted in previous discussion, most o f Bangladesh’s garment exports, including shirts, come from f i rms operating duty free under bonded warehouse conditions which are exempt from tariffs and other import taxes on their imported fabrics and other inputs used to produce garments, and which receive no substantial other subsidies. Hence in estimating economic welfare changes, there i s no need to allow for changes in subsidies and taxes. In this example economic welfare has gone up by the amount o f the increase in the Bangladesh garment exporters’ producer surpluses (area BCMN), which depends on the extent o f the increase in the general level o f shirt
Realistically (see later discussion) the increase in the price might only be o f the order o f a few U S cents per shirt o f shirts selling for say $US 4. The break in the Y axis (indicated by the wavy line) i s intended to indicate that the price change illustrated in the diagram i s l i ke ly to be small relative t o shirt prices
120
169
India-Bangladesh FTA: Methodology and Selected Case Studies
export prices. As pointed out above, this depends on how responsive Bangladesh exporters are to price increases (the elasticity o f their supplies) and on how elastic the demand for Bangladesh shirts i s in i t s export markets. The export demand elasticity in turn depends on how well the shirts are marketed and differentiated from the shirts supplied by other exporters and by domestic producers in the countries to which the exports are going. If there is little differentiation, there may be little o f n o producer surplus benefits from even a large increase in exports to India following an FTA, because export prices will not have changed much and most o f the increased exports to India w i l l very l ikely have been switched from ROW markets. On the other hand the economic benefit from the FTA may be quite large if there are even very modest increases in the general level o f export prices, because the increases would be spread over total shirt exports to al l countries, not just exports under the FTA to India. As illustrated later, an increase in average export shirt prices o f U S 5 cents, from $4.05 to $4.10 per shirt, represents a substantial producer surplus benefit when spread over 110 mil l ion exported shirts plus another 20 mi l l ion shirts sold domestically.
As regards the impact on the domestic market for shirts, garment f i rms which supply the domestic market as well as exporting will increase their domestic selling prices if export prices rise, so there will be consumer surplus losses partially offsetting the producer surplus gains on exports (area abdc=area BCUS in Fig 1). However, as already discussed, in Bangladesh domestic RMG markets seem to be quite small relative to export markets (much smaller than in India), and so there w i l l be a smaller impact on the overall economic welfare outcome. For example, if domestic sales were 15% o f total sales, the economic cost to Bangladesh consumers would offset about 15% o f the producer surplus gain to Bangladesh exporters.
Effects in India. If the Bangladesh exports are competing wi th domestic sales o f Indian exportable garments, they may cut into the domestic sales o f the Indian garments but the long run long run effects on their prices may be very small, since those prices are determined by supply conditions including input tariffs, total demand for the garments (which consists o f the total export demand plus total domestic demand) and export incentives. This i s because even an FTA-induced increase in Bangladesh exports to India which i s fairly large from a Bangladesh perspective, i s likely to be quite small relative to the total demand for the Indian garments. For example, during 2003/04 India was exporting about 130 mil l ion woven cotton shirts, and if the domestic market were about the same size as the export market, total annual demand would have been about 260 mil l ion shirts. If Bangladesh exports under an FTA were to expand from about 1 mi l l ion shirts annually to say 10 mi l l ion shirts and displace an equivalent number o f shirts previously supplied by Indian producers, this would only amount to a demand reduction for Indian shirts o f about 4%, and with elastic demand (especially in export markets) and elastic supply, any downward adjustment in Indian shirt prices i s likely to be proportionately much less than this. Nevertheless, even if the average price reduction i s very small, the economic welfare impact may be considerable, because it would affect a very large volume o f sales i.e. reduced prices on domestic sales that benefit domestic consumers, and price reductions spread over total production including exports that would hurt domestic producers.
In addition to these consumer and producer surplus changes, the economic welfare effects in India would also need to take account o f government revenue effects, since DEPB payments wil l now be paid on the production that i s switched from the domestic to the export markets. Hence, in analyzing the welfare consequences in India o f FTA-induced imports for this case, the main components can be summarized as follows:
Increase in CS on garments imported from Bangladesh due to reduced prices and increased imports Increased CS on domestic sales o f Indian exportable garments, to the extent that their prices fall as a result o f the increased imports from Bangladesh
170

A Case Study o f the Ready Made Garment Industry
Reduced PS in the Indian export garment industry due to lower prices in the domestic and the export markets Reduced Indian government revenue from imports from Bangladesh which were previously subject to the Indian preferential SAPTA tariff, and which are now tari f f free under the FTA Increased Indian government expenditure equal to DEPB payments on increased exports o f the exportable garments, and reduced input tari f f collections to the extent that production is switched from the domestic market to exports using duty drawback or duty free export facilities (e.g. advance licenses, bonded warehouses, EPZs or SEZs) rather than DEPB Since by assumption the MFN tariffs are prohibitive and there are no imports from MFN countries prior to or after the FTA, there i s no impact on tari f f revenue from changes in MFN imports. However, if there were some imports over MFN tariffs before the FTA, it i s possible that the increased competition and price reductions in the domestic market following the FTA would lead to cuts in demand for these imports. In that case allowance would need to be made for the associated reduction in tariff revenue.
These effects are illustrated in F ig 2, which i s drawn to represent the situation o f Indian produced shirts before and after an FTA. Before the FTA it i s assumed that demand i s equally split between exports and domestic sales (both FH mil l ion shirts) with a total o f FL mi l l ion shirts produced and sold at price FA. This equilibrium i s established at the intersection o f a total demand curve which i s the horizontal sum o f the domestic demand curve and the export demand curve. The export demand curve i s flatter than the domestic demand curve, representing the hypothesis that demand for Indian shirts in export markets i s more responsive to price changes, mainly because o f the actual and potential competition o f exporters from other countries which are for the most part excluded from the Indian domestic market by high tariffs. However, domestic demand for Indian RMG shirts i s probably also quite elastic, because o f the competition from fabrics which are sewn by the vast number o f small scale retail tailors and by consuming households.
I I I I lFig11 1 I I I I I I /The market for Indian produced shirts before and after an India-Bangladesh FTA I
I I I I I I I I I I I
The export demand curve shows demand as a function o f the fob price (FC) plus the DEPB payment on exported shirts (CA). For exporters, the DEPB payment i s assumed to offset the per- shirt cost o f input tar i f fs (ED), so that value added per exported shirt i s EC=DA. The input tariffs on shirts sold domestically are the same as on input tariffs on exported shirts (ED per shirt), but as discussed in the
171

India-Bangladesh FTA: Methodology and Selected Case Studies
previous section, with competition the domestic selling price will tend to the same level as export prices plus the DEPB payment i.e. to price FA. Otherwise, value added and profits in the shirts sold domestically will differ from value added in exported shirts, and under competition production would be shifted from one market to the other until the value added and profitability in the two markets are equalized. Hence, for the domestic market the DEPB export payment serves as a kind o f quasi tariff determining the domestic price level. Consequently, in the initial pre-FTA situation, if FH i s taken to represent domestic sales, input tariffs equivalent to area DEXZ are collected, but the f i rms fully pass this cost forward to consumers by pricing up to the average fob price plus the DEPB rate per shirt. The input tariffs combined with the effects o f the DEPB therefore amount to a consumption tax, with net government receipts equivalent to area DEXZ. For export sales (represented by FH=HL) input import duties equivalent to area ZXMN are collected, but this extra cost to exporters which cannot be recovered from their foreign buyers, is refunded to them by total DEPB payments equivalent to area beOX. Hence for the exported production the fiscal effect i s neutral, wi th the exporters f i rst paying input tariffs o f XZ per shirt, but then receiving an exactly offsetting DEPB payment o f eb per shirt.
The expansion o f Bangladesh shirt exports to India following an FTA, i s represented in this diagram by a backward shift in the domestic demand curve for Indian made shirts. H o w b ig this shift would be would depend on the size o f the reduction in the prices o f imported Bangladesh shirts, discussed later. The backward shift in domestic demand corresponds to an equivalent backward shift in total demand, and in Fig 2 this leads to a lower new equilibrium price FB and reduced total output and demand FK. The price reduction leads to slight increases in export demand (Hj) and in domestic demand (Gh), the latter along the post-FTA domestic demand curve. These two effects partly offset the f i rst impact o f the expanded imports from Bangladesh on demand for Indian shirts (GH=JL), and the net decline in demand and production (KL) i s less.
The economic welfare effects o f these adjustments in India can be seen in Fig 1 and F i g 2. They are: Increased CS (area ABPEA) from the cheaper Bangladesh imports (Fig 1) CS benefits from the reduced prices o f Indian produced shirts measured by area ABfa (Fig 2) 121 PS losses to Indian shirt producers equivalent to area ABWX (Fig 2) Reduced Indian government revenue from tariffs previously collected on the pre-FTA imports from Bangladesh (area Al3QE in F ig 1) Increased DEPB payments (a net revenue loss for the government) on the increase in Indian exports equivalent to area bekl122 (in Fig 2) Reduced input tariff revenue (area TJMN) resulting from the decline in total production (Fig 2)
0
Welfare simulations for M&B cotton shirts: base scenario Table A.5 summarizes the results o f a few simulations which start from a scenario in which some parameters are close to those reported in 2003/04 and others are guesses which seem plausible but which would have to be revised with better information. The simulations have been done using a simple spread sheet in which it i s easy to vary the parameters. The prices and quantities refer to bundles o f shirts o f different specifications and qualities which are sold in fixed proportions, and the price is the weighted average price o f the shirts in this bundle and i s therefore the same as the average unit value o f the shirts calculated from the trade statistics. The
The CS change i s measured with respect to the post-FTA demand curve. The CS effects o f the consumption that has switched to the Bangldeshi imported shirts i s already accounted for separately. In a general equil ibrium model o f these adjustments one would estimate the compensating income variation f rom the changed consumption and prices o f both the Indian and the Bangladesh shirts. Most DEPB rates are percentages o f fob prices, so the increased payment would be slightly less than this. However, in principle they are meant to represent actual input tar i f f payments, so they should rise as a percentage o f fob prices if fob prices decline.
122
172
A Case Study o f the Ready Made Garment Industry
assumption o f a fixed bundle o f shirt-types i s a drastic oversimplification, especially considering that India’s specific tariffs are designed to constrain l ow value garments more than higher value garments, so the composition o f imports from Bangladesh would shift towards lower value garments with an FTA. These effects could be allowed for if there were some information on the composition o f imports by price and specification, but would require some modifications o f the spread sheet model.
The base parameters are given in Table 12. To understand the simulations note the following: As discussed earlier, it i s assumed that both in India and Bangladesh competition equalizes gross margins across al l markets, export and domestic The average price o f the Indian sh i r t bundle i s higher than the price o f the Bangladesh bundle. This reflects export unit value statistics and observations in various studies that Bangladesh garment exports are concentrated in the bottom quartile o f world garment trade in terms o f quality and price. It i s arbitrarily assumed that domestic fabrics and other inputs in Bangladesh cost a dollar more per shirt than their cost at c i f prices. This i s equivalent to weighted average input protection o f 35.7%, lower than the present Bangladesh fabric tari f f o f 47.7% (implying some tari f f redundancy) but much higher than the average input protection rate o f 6.1% in India, which i s implied by the Indian DEPB rate o f 4.4%. T h i s reflects the key issue o f textile protection in Bangladesh and the contrast with the apparent situation in India, where implici t protection on fabrics and other garment inputs appears to be well below the current tar i f fs (especially the specific tariffs on fabrics). The material input shares in fob prices in both Bangladesh and India are assumed to be approximately 70%: The Indian tariff o f US 95 cents per shirt raises the duty inclusive price o f the imports from Bangladesh to $5.20 per shirt. At this price there i s only enough substitution away from domestic Indian shirts to generate imports o f 1 mi l l ion shirts (slightly above actual imports in 2003/04). The simulations summarized in Table A.5 work through the consequences o f five different assumptions on the reaction o f Indian demand for Bangladesh shirts under an FTA, which it i s assumed would reduce the average price o f the Bangladesh shirt bundle by $US 95 cents i.e. by 18.3%, from $5.20 per shirt to $4.25 per shirt. The resulting increase in Bangladesh shirt sales would principally result from substitution for the production o f competing Indian producers, but to some extent from increased aggregate Indian demand for RMG shirts through substitution for tailor made and domestically sewn shirts. Given the possibility o f substitution for Indian production, outcomes reflecting high import demand elasticities would seem to be plausible.
Discussion of simulation results The five simulations reported in Table A.5 alternatively assume that following the FTA and the 18.3% reduction in the Bangladesh duty-inclusive import price, that Indian demand for Bangladesh shirts initially expands from the base scenario quantity o f 1 mi l l ion shirts, to 2, 4, 6, 8, or 10 mil l ion shirts. However, this increase in the aggregate demand for the Bangladesh shirts slightly increases the average price, by 1,2, 3, 4 and 5 cents a shirt in the five simulations. As discussed previously, the size o f the increase will depend on (1) how wel l competing shirt suppliers can substitute for Bangladesh shirts in the markets which the Bangladesh producers supply, including the new expanded Indian market, the domestic market, and especially the ROW markets which in the aggregate are by far the largest, and (2) how responsive the supply o f Bangladesh shirts i s in response to price increases. In an extreme case in which Bangladesh shirts are perfectly substitutable by other suppliers’ shirts, the price would not change and the only result o f the FTA with India would be to divert exports from other markets to India, but with no or negligible net change in total Bangladesh exports and no or negligible economic welfare benefits (producer surpluses) for the Bangladesh suppliers. In these simulations it i s assumed that the increase in demand from India increases the average price as indicated, but that this increase slightly reduces the initial increase in Indian demand and in total demand.
173

India-Bangladesh FTA: Methodology and Selected Case Studies
For example, in simulation #3 Indian demand initially increases from 1 mi l l ion to 6 mi l l ion shirts, but the price adjustment cuts this increase back by 158,000 shirts to 5.842 million. The net increase in Indian demand has to be accommodated somehow, and it i s assumed that 60% comes from increased Bangladesh supply, 35% % from reduced supply to ROW, and 5% from reduced demand in the domestic Bangladesh market. As indicated in Table AS this corresponds to a net change in Bangladesh shirt exports consisting o f the increased exports to India minus the reduced exports to R O W e.g. in simulation #3,4.84-1.69=3.15 mil l ion shirts.
The combination o f increased production and the slightly higher average price creates an economic welfare benefit measured by the producer surplus (PS) o f the Bangladesh shirt producers. In
174

A Case Study o f the Ready Made Garment Industry
simulation #3 this i s $3.94 mil l ion and corresponds to area B C M N in F ig 10. However, domestic prices go up, and there i s a welfare (consumer surplus) loss for Bangladesh consumers o f $0.6 million. Since shirt exporters obtain al l their inputs duty free, and domestic shirt producers use only domestic textile inputs, there i s no directly induced change in government revenue from tariffs. Hence at this point the net welfare change in Bangladesh i s just the sum o f the producer surplus and consumer surplus (CS) changes e.g. for simulation #3 it i s $US mil l ion +3.94-0.6=+3.35. T h i s corresponds to a net increase in export receipts o f $16.8 million, o f which $3.4 mi l l ion i s due to the price increase, and the rest i s attributable to the net increase in exports valued at the pre-FTA price ($13.4 million). This in turn consists o f $20.6 mi l l ion o f new exports to India and reduced exports to ROW o f $7.2 mi l l ion (both valued at the pre-FTA price). As noted previously, these effects in Bangladesh take no account o f the repercussions o f increases in Bangladesh shirt imports from India that would undoubtedly occur under an FTA, in effect assuming that the agreement for garments and textiles consists entirely o f concessions by India, w i th India s t i l l subject to Bangladesh’s normal MFN trade regime.
How about the economic effects in India? In the spread sheet this has been handled by arbitrarily assuming that the domestic demand curve for Indian shirts shifts back by the increased imports o f Bangladesh shirts e.g. in simulation #3 imports o f Bangladesh shirts increase by 4.84 million, and so at al l prices domestic Indian demand for Indian made shirts i s 4.84 mil l ion less than it was before the FTA. The demand for the Indian shirts comes from exports and domestic sales, and this decline in demand causes a small reduction in the average price e.g. in simulation #3, a price reduction o f U S 2 cents per shirt in the fob price, and the same reduction in the domestic price. The domestic price in India i s the fob price plus DEPB, but as the DEPB i s intended to offset the cost to exporters o f input tariffs, and the input prices and tariffs do not change, this assumes that the DEPB percentage would be adjusted upwards to keep the Rupee (or dollar) value o f the DEPB payment unchanged.
These effects lead to adjustments in the Indian shirt market. The initial decline in domestic demand i s partially offset by increased export demand and increased domestic demand due to the reduction in average prices. Hence in simulation #3, the initial cut in domestic demand for Indian shirts o f 4.84 mil l ion becomes a net decline o f 4.29 million, export demand expands by 2.01 million, so the cut in production i s 2.27 million. Combining this production cut and the price decline gives a producer surplus reduction ($5.18 million), and the consumer surplus benefit to Indian consumers i s $2.51 million. But Indian consumers also benefit from the lower prices and increased sales o f the imported Bangladesh shirts, measured by a consumer surplus gain o f $3.13 million, so there i s a total CS gain in India o f 2.51+3.13=$ 5.64 million. Allowance also has to be made for changes in government revenue and expenditure. These consist o f DEPB payments on the increased exports o f Indian shirts ($0.43 million), the loss o f the tariff revenue on the pre-FTA imports o f Bangladesh shirts ($0.95 million), and the reduction in tari f f revenue on imported inputs corresponding to the net reduction in shirt output ($0.48 million). Adding al l these changes gives a net economic welfare loss in India o f $1.96 mil l ion.
Table 13 summarizes the changes in Bangladesh’s shirt exports and the welfare changes resulting from the five simulations. Many o f the key parameters which give these results are guesses which even some minimal field investigations could greatly improve. The most important are summarised below under the headings given in the table, together wi th some general comments on the results.
Bangladesh shirt exports The initial change in this system to which everything else adjusts i s the increased Indian demand
for Bangladesh shirts following an FTA. The import demand elasticities corresponding to the assumed demand increases are between -5.00 (simulation #1) and -8.54 (simulation #5)’23. These fairly high elasticities seem plausible a priori considering that the starting base for the imports i s very l ow (just one
These are the arc elasticities with respect to the average o f the beginning and ending prices and quantities
175
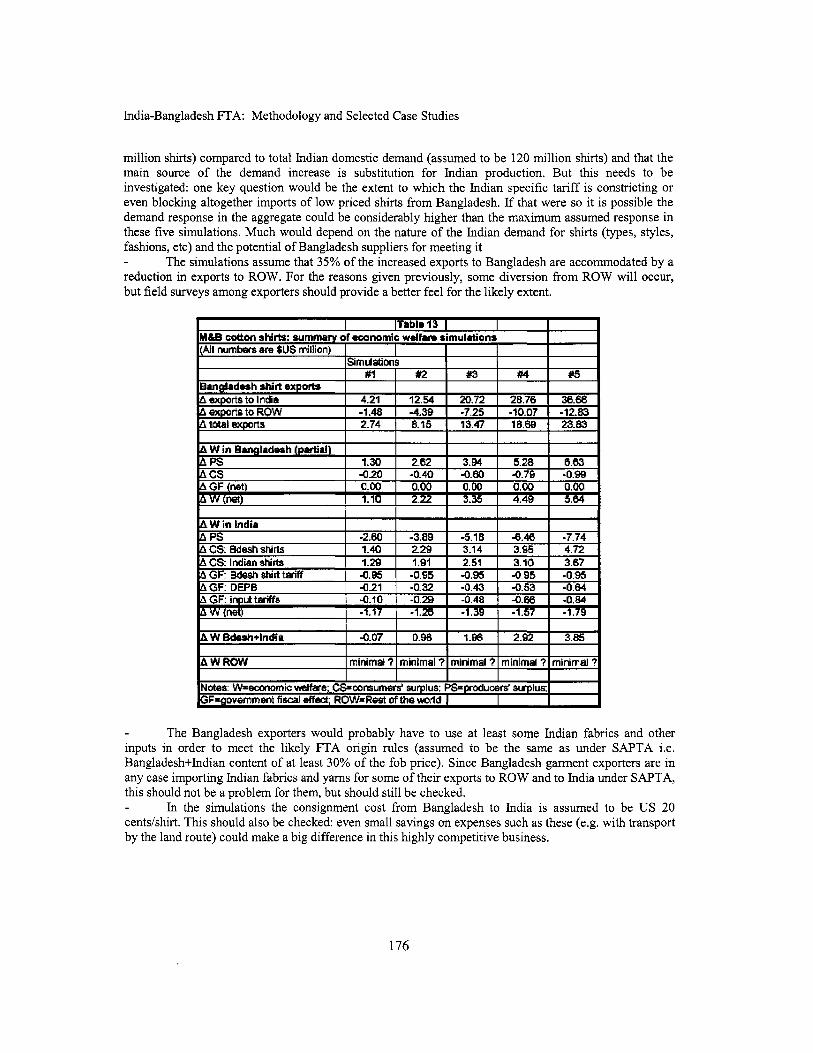
India-Bangladesh FTA: Methodology and Selected Case Studies
I I I I AWROW
Ndes Wecbmnnic vdfse; cslwrrsumers' surplus; l W q n r U u m ' suplus: GFrgovgmment fiscal effect, ROWRasi of the world I
I minimal 7 I minimal 71 mirimat 3 I minimal ? minimal ? I
I
mil l ion shirts) compared to total Indian domestic demand (assumed to be 120 mi l l ion shirts) and that the main source o f the demand increase is substitution for Indian production. But this needs to be investigated: one key question would be the extent to which the Indian specific tariff i s constricting or even blocking altogether imports o f l ow priced shirts from Bangladesh. If that were so it i s possible the demand response in the aggregate could be considerably higher than the maximum assumed response in these five simulations. Much would depend on the nature o f the Indian demand for shirts (types, styles, fashions, etc) and the potential o f Bangladesh suppliers for meeting it
The simulations assume that 35% o f the increased exports to Bangladesh are accommodated by a reduction in exports to ROW. For the reasons given previously, some diversion from ROW will occur, but field surveys among exporters should provide a better feel for the l ikely extent.
I lTable13 I I MBB C&MI shirks: summary of ecxrnornic welfam simulations (All numbers are $US millian)
Simulations #2 w
The Bangladesh exporters would probably have to use at least some Indian fabrics and other inputs in order to meet the likely FTA origin rules (assumed to be the same as under SAPTA i.e. Bangladesh+Indian content o f at least 30% o f the fob price). Since Bangladesh garment exporters are in any case importing Indian fabrics and yams for some o f their exports to ROW and to India under SAPTA, this should not be a problem for them, but should s t i l l be checked.
In the simulations the consignment cost from Bangladesh to India i s assumed to be U S 20 centshhirt. This should also be checked: even small savings on expenses such as these (e.g. wi th transport by the land route) could make a big difference in this highly competitive business.
176
A Case Study o f the Ready Made Garment Industry
Welfare changes in Bangladesh As noted previously, the simulations on this are partial and do not deal wi th the impact o f an FTA
via increased shirt exports from India to Bangladesh. Fi l l ing in the missing information to enable this to be done would be a high priority for field work in Bangladesh
The key economic welfare benefit for Bangladesh comes from the producer surpluses generated by increased shirt exports and production, and the increase in the average level o f shirt prices resulting from the new Indian demand. Both o f these parameters should be investigated
The corresponding welfare cost i s to Bangladesh consumers, and the size o f this depends on the size o f the domestic market for RMG shirts as well as the price increases.
The simulations assume no government fiscal effects in Bangladesh. T h i s in turn assumes that there i s free trade status for exported shirts (use o f bonded warehouses, operation in free trade zones etc) and that by contrast there are no imported inputs used by shirts sold domestically. Bo th are oversimplifications and would need to be modified following appropriate field surveys
Price changes o f exportable Bangladesh shirts in the domestic market would affect shirt imports and therefore tariff revenue from those imports. These effects would need to be dealt wi th in a more complete study even if does not take account o f l ikely FTA-induced imports from India.
Welfare changes in India A t least a rough estimate i s needed o f the actual size o f the Indian domestic market to replace the
50150 exportldomestic assumption. Some investigation i s also needed on the actual connections between export markets and
domestic markets, and also on the assumption in the simulations that they are closely linked through competition so that gross margins will tend to equalize
T h e plausibility o f the assumptions on the impact o f the demand increases for Bangladesh shirts following an FTA, on domestic demand for Indian shirts, and the impact on the price level o f Indian shirts, should both be checkedlZ4.
That there would be increased government DEPB payments if f i rms using DEPB switch some production previously sold domestically to export markets i s straightforward. In principle the fiscal cost would be the same if f i rms switch from domestic sales to exports using advance licenses, bonded warehouse (“100% EOU”) arrangements, or drawback, since the government would no longer collect tariffs on the imported inputs, or in the case o f drawback would refund the import duties. But whether these different export mechanisms would in practice give approximately the same fiscal results needs investigation.
As in Bangladesh, no account i s taken o f possible effects o f the FTA with Bangladesh on shirt imports from other countries. This seems reasonable, as the Indian MFN specific ta r i f f s seem to be excluding practically al l shirt imports from ROW, except for very small quantities o f high priced shirts.
The simulations estimate a tari f f revenue reduction from the contraction o f domestic sales o f Indian shirts based on the assumption that the tari f f component o f the cost o f imported inputs i s the same on domestic sales as on exports, and therefore can be estimated by applying the DEPB rate to the domestic sales reduction. Whether this i s roughly correct should be checked.
Combined welfare change in Bangladesh and India In al l the simulations net welfare increases in Bangladesh because the PS generated by the
preferential access to the Indian market outweighs the costs to Bangladesh consumers. Net welfare declines in India despite the CS benefit to Indian consumers from the lower price and expanded imports from Bangladesh. One reason for this outcome i s that the Indian garment industry i s forced by the FTA to compete in the Indian domestic market on unequal terms with the Bangladesh industry. In producing for the domestic market, the Indian garment producers pay normal tariffs on their inputs (or buy local fabrics and other inputs the prices o f which reflect the tar i f fs) and this i s reflected in their domestic shirt prices,
The elasticity o f substitution implied by the assumptions in the simulations i s -6.7
177

India-Bangladesh FTA: Methodology and Selected Case Studies
whereas the Bangladesh shirt exporters obtain their inputs duty free. The contraction o f the Indian industry resulting from the Bangladesh competition i s therefore greater than it otherwise would be, and this in turn increases the price reduction and the producer surplus loss, and also the decline in revenue from input tariffs.
Except in the first simulation, the combined joint economic welfare in Bangladesh and in India increases following the FTA. Ths happens even though both countries’ garment industries have been modelled as economically efficient and operating with zero implicit effective protection, both in exporting and in their domestic markets. The result that opening regional trade with a discriminatory FTA could increase their joint welfare in these circumstances i s essentially due to domestic consumers’ unsatisfied demand for differentiated products, quality and variety. In the base scenario, which i s intended to approximate the actual situation in 2003/04, high tariffs -and especially the specific tariffs in India-are keeping out imports from ROW that would meet this suppressed potential demand. The national garment industries are pricing what they sel l domestically at low prices approximately equivalent to their export prices plus input tariffs, but do not find it worthwhile and are not forced by import competition to meet the 111 domestic demand for variety. In the simulations, this demand i s partially met when the Indian market i s opened under the FTA to imports from Bangladesh, creating consumer welfare benefits in India which help offset the government revenue and producer surplus losses
Welfare changes in the rest of the world CROW) In the simulations for cotton shirts, on the sumlv side welfare changes in ROW are negligible
because in 2003104 and in the base scenario imports into India from ROW were blocked by prohibitively high MFN specific duties. T h i s does not change with the FTA, and therefore there is no or very l i t t le diversion o f imports from ROW.
This situation was also broadly the case for most other garments, for which imports into from MFN countries into India were increasing but were s t i l l very small during 2003/04, relative to the size o f the Indian market (see Table A.l). Some garments (especially some knitted garments) are not subject to specific tariffs, but these appear to be products for which there i s not much demand in India, or in which the domestic industry i s especially competitive. That either or both o f these possibilities i s the case i s suggested by the absence o f substantial imports despite moderate ad valorem MFN tariffs and lower ad valorem tariffs for Bangladesh under SAPTA and for Sri Lanka under ILFTA.
Used garments (actually mostly developed country seasonal unsold stocks) are an exception, with rapidly expanding imports over relatively l ow MFN ad valorem tariffs. The composition o f these imports i s unknown: it i s l ikely that they include inexpensive garments including shirts that would be substitutes for the garments that Bangladesh would export to India with an FTA. If that were the case, in principle some allowance would need to be made for the resulting diversion o f demand from these imports that the FTA would create.
Another exception i s Nepal, which during 2003/04 was the second largest supplier o f cotton shirts to India after Bangladesh. If Bangladesh shirts could be imported duty free under an FTA, they would substitute to some extent for Nepalese shirts and divert some imports from Nepal. However, because the Nepalese market share in India i s tiny (probably less than 0.2 percent o f the market), unless the characteristics o f Bangladesh shirts were especially close to the characteristics o f Nepalese shirts, the likely diversion i s very small. For example, if Bangladesh shirts were equally good substitutes for Indian and Nepalese shirts, and with an FTA were to take 5% o f the Indian market, Nepalese imports would only be cut by 5% o f 0.2%= 0.01% percent o f Indian demand.
On the demand side, however, there would be some be some welfare impacts (consumer surplus changes) in the rest o f the world due to the increase in the prices o f exported Bangladesh shirts, and the decline in the prices o f exported Indian shirts. The net effect o f these offsetting changes in ROW would possibly be very small: to say more than this would require information on the relevant demand and supply parameters in world markets, and would be best dealt with in the context o f a world T&C model embedded in a system such as GTAP.
178
A Case Study o f the Ready Made Garment Industry
5. IMPLICATIONS FOR INDIA’S AND BANGLADESH’S TRADE AND OTHER POLICIES
The RMG industries in both India and Bangladesh are very large, l o w cost, internationally competitive and economically efficient export industries. Therefore, the l ikely economic consequences o f their inclusion in a free trade agreement -whether bilateral or under SAFTA-are o f special interest. T h i s i s especially the case in Bangladesh, where the RMG industry’s shares o f exports, GDP and employment are much greater than in India, and because many Bangladeshis hope that RMG exports might help reduce Bangladesh’s large bilateral trade deficit with India.
But, as discussed in this paper, the effects-including the economic welfare effects- o f opening up R M G trade between the two countries in the context o f an FTA are complicated by:
India’s prohibitively high specific duties on most garments Bangladesh’s very high and recently increased RMG tariffs Bangladesh’s very high textile fabric tariffs Bangladesh’s ambiguous policies on domestic sales by exporting RMG f i rms
Bangladesh’s policies. An FTA with India, wi th both countries maintaining there present tariff and other policies wi th respect to the rest o f the world, would provide export opportunities in India for RMG products. This has been explored in the paper using the example o f mens’ and boys’cotton shirts, which i s one o f Bangladesh’s principal exports to developed countries and which are being exported to India in small volumes over India’s specific tariff, but with the assistance o f a 50% SAPTA preference. This i s done on the assumption that initially there would be just a one-way agreement, in which India would grant duty free access to Bangladesh RMGs, but Bangladesh would for the time being not provide any preferences for RMG imports from India.
With this as a starting point, the economic welfare consequences o f an FTA are worked through, based on plausible guesses o f export increases for shirts ranging from approximately $4 mil l ion to $ 37 million. As most o f Bangladesh’s principal RMG products are either not exported to India at all, or in negligible volumes, there i s no similar starting point for even making plausible guesses about the export prospects for them under an FTA. A better feel for this could be obtained with some field work and interviews with RMG producers and traders in both countries, and it i s possible that the export prospects for other products-for example mens’ & boys’ cotton trousers-would turn out to be similar or better than the export prospects o f cotton shirts. However, a number o f cautionary points need to be made in this regard:
India’s RMG industry i s highly competitive in i t s domestic market. Domestic prices o f exported garments are probably close to or below c i f import prices. Therefore, even with the advantages o f tariff exempt access and proximity, Bangladesh garment exporters would have to mainly compete for market niches based on styles, design, marketing, quality etc. For this they would need to work with Indian traders and distributors, and the Indian traders would have to find some clear advantage in sourcing from Bangladesh rather than from Indian suppliers A number o f RMGs which Bangladesh exports to other countries are not subject to specific duties in India, but until FY 04 none were being exported to India. For most RMGs India’s preferential ad valorem tariff for Bangladesh in 2003104 was 20%, and aRer that it was reduced to 10% in FY 05 and in FY 06 to 7.5%. Unless some Bangladesh exports have developed since FY 04, this suggests that even relatively l o w ad valorem tariffs are sufficient to deter exports o f these products to India. If that i s the case it i s not obvious that a further reduction to zero with an FTA would generate many -or even any-exports. Sri Lanka i s a major RMG exporter and under ILFTA it has more generous RMG tari f f preferences (mostly 75%) in India than Bangladesh’s SAPTA preferences (mostly 50%, some 60%). In 2005106
179

India-Bangladesh FTA: Methodology and Selected Case Studies
i t s preferential ad valorem tari f f for RMG products was 3.75%. Despite this, i t s RMG exports to India are practically nil. Garment industry direct labour costs are much lower in Bangladesh than in India, but these differences are minor relative to typical garment selling prices in world markets, and in selling to India could easily be offset, or more than offset, by differences in other costs (especially fabric and yarn costs), quality, design, delivery times and other non-price factors If Bangladesh garment exporters were to develop substantial exports o f some RMGs to India, for reasons discussed in the paper, part o f the new exports are likely to have been diverted from other export markets. Hence, the net increase in exports resulting from the preferential opening o f the Indian market will be less than the increase in exports to India. Some f ield interviews would be needed to obtain a better feel for the l ikely extent o f this diversion.
The principal economic welfare benefits for Bangladesh from a one-way FTA with India would come from the effects o f new Indian demand adding to ROW export demand and domestic Bangladesh demand, thereby increasing the general price level o f Bangladesh RMGs and increasing production. The price increases would also cause some consumer surplus losses in Bangladesh, but on the assumption that the domestic RMG market in Bangladesh i s small relative to exports, the producer surplus benefits would be considerably larger (in Taka or $US terms) than the consumer surplus losses. In the simulations' there are no direct fiscal effects in Bangladesh, on the assumption that al l the Bangladesh exports are from bonded warehouses where exporters have duty free access to inputs, and that al l the domestic RMG sales use domestically produced yarns, fabrics and other inputs. But the validity o f this assumption needs to be checked.
By definition an FTA would involve some reciprocal concessions and eventually duty free access for Indian RMGs to the Bangladesh domestic market. This was not treated in the study, owing to lack o f information on the domestic side o f the Bangladesh RMG industry, and also lack o f information relevant for these questions about the Bangladesh textile industry. However, some general remarks can be made:
In recent years there have been small imports o f RMGs coming over a very high Bangladesh tariff (47.2% in 2004/05), mainly from India but also from other countries. As was assumed in the case o f Bangladesh garment exports to India, if this tariff were removed for India it i s plausible that (a) imports from India would expand (b) they would replace imports from other countries (c) domestic garment prices in Bangladesh would fall (d) production o f RMGs for the domestic market would be cut (e) production o f domestic textiles used by RMG producers would fall Very high tar i f fs protecting Bangladesh fabric producers (48% and 69% in 2004/05) suggest that the impact could be particularly severe for Bangladeshi producers o f woven RMGs supplying the domestic market, if these ta r i f f s are an indication o f the actual excess o f domestic fabric prices over wor ld prices. Some information on actual domestic fabric prices and the extent o f tariff redundancy would be needed to get a better feel for these likely impacts, including the indirect impacts on textile fabric producers. This assumes that textile fabrics imported into Bangladesh from India would be excluded from the FTA. If they were included, the Bangladesh producers o f woven garments could use imported Indian fabrics, and depending on how these were priced, this could greatly improve the competitiveness o f the woven RMG industry in the Bangladesh market. But this might have drastic consequences for the Bangladesh fabric producers, depending on how well they would be able to adjust to duty free competition from India. The same considerations as the above are also relevant for knitted garments sold domestically, but Bangladesh yam tariffs (in 2004/05 11% and 18.5%) are much lower than fabric tariffs, suggesting that Bangladesh domestic knitted garment prices are probably lower relative to border prices than i s the case with woven garments. I f this i s correct, they might be in a stronger position to compete with Indian knitted garments following an FTA, even if yam could not be imported duty free from India.
180
A Case Study o f the Ready Made Garment Industry
To better understand the l ikely impacts o f an FTA in the Bangladesh domestic RMG market, it would be important to have a clearer appreciation o f Bangladesh government policies on sales o f export garments in the domestic market. During 2002/03 and 2003/04 RMG exporters were allowed to se l l large quantities (valued at $214 mil l ion and $178.5 mi l l ion respectively ) o f “stock loss” export garments in the domestic market without paying Customs duties or any other o f the normal import taxes and VAT. Continuing large scale sales o f this kmd, even supposing they are al l in fact rejected substandard export garments, would completely change the configuration o f the domestic RMG market and would also impact the domestic textile industry.
There are potentially substantial economic welfare benefits for Bangladesh from a one sided FTA agreement with India in which India would keep i t s present MFN tar i f fs while granting duty free access to Bangladesh RMGs, but in which no preferences would be granted by Bangladesh. However, just considering the direct welfare consequences for the RMG sector and leaving aside possible trade-offs wi th other sectors, it i s apparent from the shirt example worked through in this paper, that such an arrangement i s not in India’s interest. Therefore it would make sense for Bangladesh to begin a unilateral reform process aimed above al l at improving the international competitiveness o f i ts textile industry. One key component o f such a program could be pre-announced reductions in MFN textile tariffs, starting with fabrics. Th is could be done in advance o f entering into FTA commitments wi th India covering the T&C sectors, or it could be part o f a phased reform package in which (for example) India would grant increasing levels o f preference to imports o f RMGs from Bangladesh while benefiting in a first stage from Bangladesh’s MFN textile tari f f reductions, and in a second stage from reciprocal preferential reductions in Bangladesh’s RMG tariffs.
India’s policies Although the Indian and the Bangladesh RMG industries are both highly competitive in export markets, a major difference between them i s that the Indian RMG industry i s also very competitive in its domestic market because i t has in the background India’s very large, diverse and for the most part export oriented textile industry. The export orientation o f the Indian textile industry- especially o f cotton yams and fabrics-means that domestic textile prices are closely linked to export prices, and l ike garment prices, are often not far above fob prices and may actually be lower than c i f prices. The ability to buy a wide variety o f Indian yams and fabrics at low prices keeps down the costs o f RMG producers supplying the domestic market, and also means that many and perhaps most o f the very high specific garment tariffs are redundant i.e. they could be drastically reduced or removed without attracting many imports.
Nevertheless because o f the importance o f various kinds and levels o f product differentiation in the garment industry, it i s probable that the prohibitively high specific tariffs are keeping out some imports o f garments that would meet these diverse consumer preferences. As worked out in the shirt example in this paper, disturbing this situation with a one-sided FTA with Bangladesh, leads to a small net welfare loss for India, with producer surplus losses o f garment producers plus net government fiscal losses offsetting benefits to Indian consumers. The reason for. this outcome for India i s that despite the fact that i t s RMG industry-both in exporting and producing for the domestic market-is economically efficient, it i s forced by the FTA to compete on unequal terms with the Bangladesh industry. That is, when Bangladesh f m s export to India they obtain their inputs duty free (e.g. through duty exemption by operating as bonded warehouses), whereas the Indian producers either pay import duties on their imported inputs or buy inputs locally at protected prices. This i s an inherent problem wi th al l FTAs, and in the shirt example it leads to a larger contraction o f Indian production and larger losses o f producer surpluses and government revenue than would have been the case if the two industries had been competing on equal terms. As worked through in the example, these welfare losses exceed the consumer surplus benefits o f Indian consumers and produce a negative net welfare outcome for India from the one-way FTA in this product. This net loss would be larger if the FTA were to generate imports o f other RMG products from Bangladesh.
181
India-Bangladesh FTA: Methodology and Selected Case Studies
For this reason it would not be in India’s overall interest to agree to a one-sided FTA arrangement for RMGs, and as a normal part o f the bargaining it could ask for reciprocal preferential access -and eventually duty free access-to the Bangladesh RMG market. However, as discussed above, this would cause serious problems in Bangladesh unless it were to follow, or to be negotiated as an integral part of, a general reform program for the Bangladesh textile industry. Whether or not such a general reform program were adopted, it would make sense to have a careful look at India’s specific tariffs on T&C products. Eliminating these would have immediate welfare benefits for Indian consumers, and would make trade and trading relations in the T&C sector much simpler and more transparent. On the other hand it would reduce the potential economic benefits o f an FTA for Bangladesh RMG exporters, since, l ike domestic Indian RMG producers, in supplying the Indian market they would now only have the protection o f the Indian ad valorem tariff. But this would be a much more efficient outcome than one in which part o f the benefit to Bangladesh RMG manufacturers from exporting to India would be a consequence o f hlghly distortionary specific tariffs which effectively exclude other developing country RMG exporters from the Indian market.
182
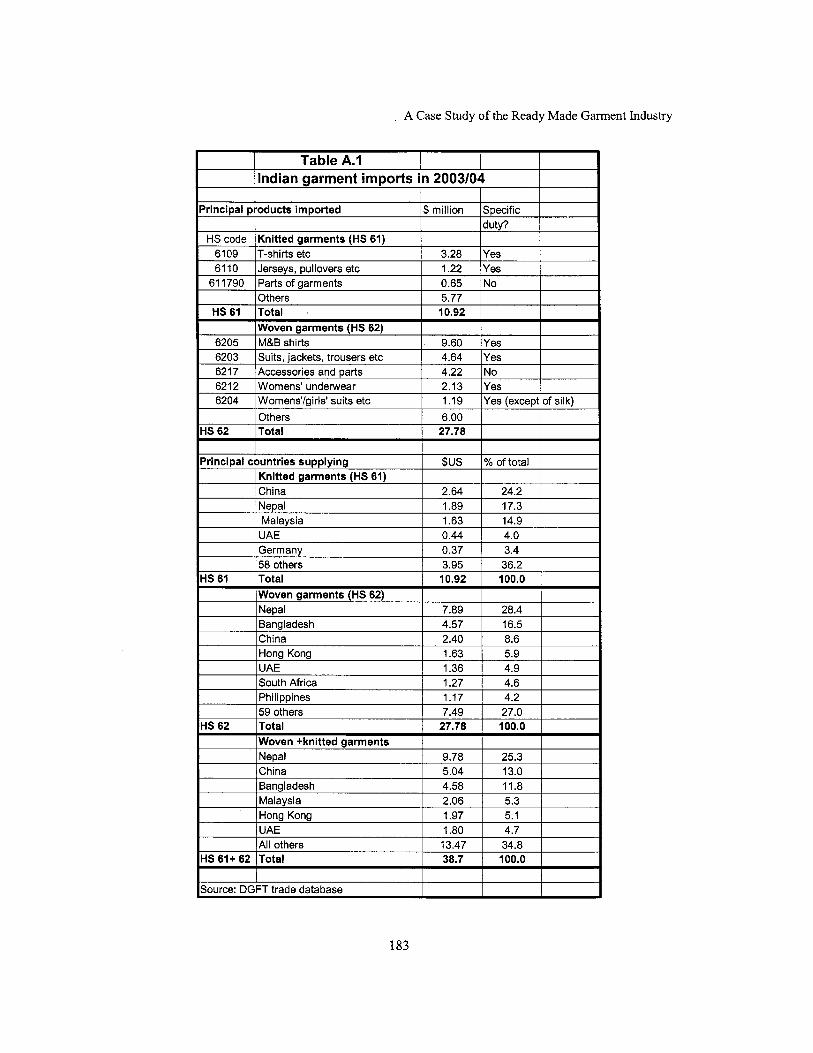
A Case Study o f the Ready Made Garment Industry
6212 Womens' underwear 6204 Womens'lgirls' suits etc
Others HS62 Total
2.13 Yes 1.19 Yes (except of silk) 6.00
27.78
~~
Source: DGFT trade database
183

India-Bangladesh FTA: Methodology and Selected Case Studies
184
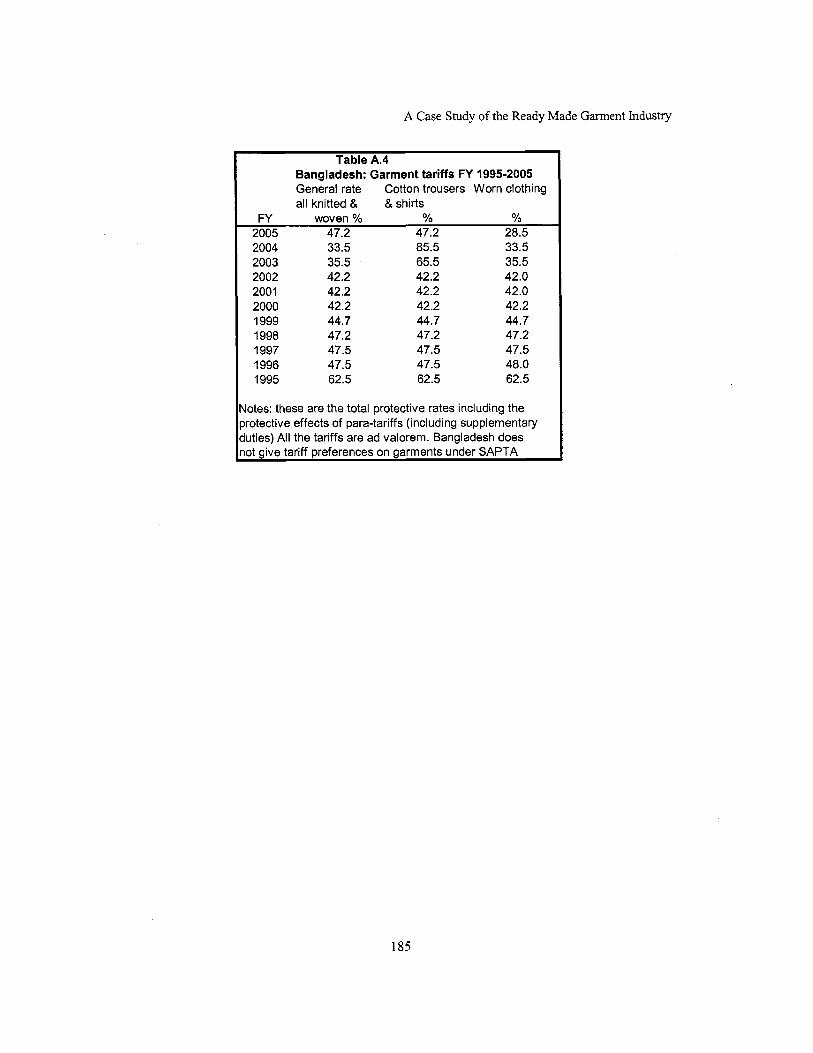
A Case Study o f the Ready Made Garment Industry
woven % % % 47.2 47.2 28.5
Table A.4 Bangladesh: Garment tariffs FY 1995-2005 General rate all knitted & & shirts
, Cotton trousers Worn clothing
FY 2005 2004 2003 2002 2001 2000 1999 1998 1997 1996 1995
33.5 35.5 42.2 42.2 42.2 44.7 47.2 47.5 47.5 62.5
85.5 65.5 42.2 42.2 42.2 44.7 47.2 47.5 47.5 62.5
33.5 35.5 42.0 42.0 42.2 44.7 47.2 47.5 48.0 62.5
Notes: these are the total protective rates including the protective effects of para-tariffs (including supplementary duties) All the tariffs are ad valorem. Bangladesh does not aive tariff preferences on aarments under SAPTA
185

India-Bangladesh FTA: Methodology and Selected Case Studies
186
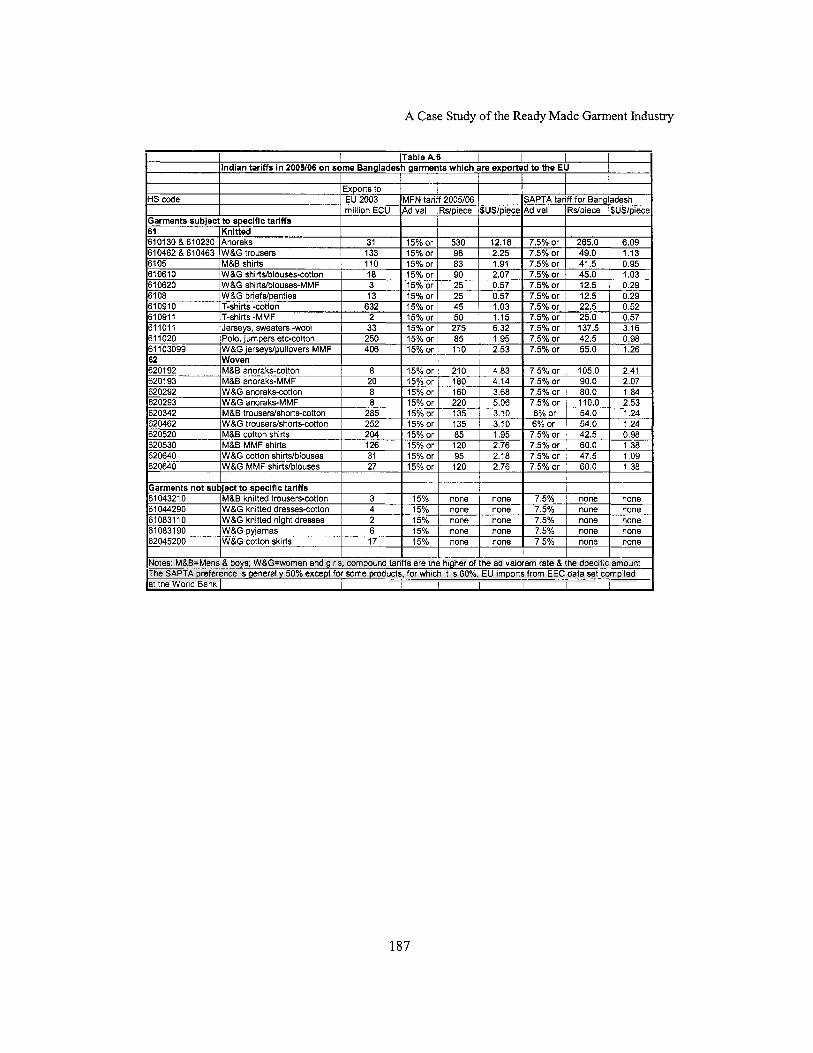
A Case Study of the Ready Made Garment Industry
Nom: M&B=.Men?m?oys; WBG=women and g r s; compomd tariffs are me h gher of the ad valorem rate 8 the dpeci!{c a m o m The SAPTA preference s general y 50% except for some proalrcrs. for wntch r s 60%. EU impons from EEC data ser comp leo ... - I far me won0 BanK I I I I I I I I I
187

India-Bangladesh FTA: Methodology and Selected Case Studies
Worn clothing 2.9 5.2 5.3 2.0 1.7 2.4 4.0 4.9
Total: new &worn 6.3 8.2 8.0 5.3 5.7 18.3 11.9 14.9
Bangladesh export garments sold duty free in Bangladesh ("stock lot" sales) 19971 1998) 19991 20001 20011 2002 2003 2004
HS 61-knitted HS 62-woven Total
188
-
0.0 0.0 0.0 0.0 0.0 13.0 97.1 73.6 0.0 0.0 0.0 0.0 0.0 7.2 116.9 104.9 0.0 0.0 0.0 0.0 0.0 20.2 214.0 178.5
STUDY OF INDIA-BANGLADESH TRADE AND TRADE POLICIES: SIMULATIONS OF ECONOMIC WELFARE EFFECTS OF A FREE TRADE AGREEMENT
A CASE STUDY OF TYRES
1. BANGLADESH CASE
1.1 General notes
Two types o f tyres are in use in Bangladesh: light and heavy. The former i s generally used for bicycles and rickshaws (a three wheeler manually driven or peddled) while the latter i s used for aeroplanes, buses, trucks, motorbikes etc. Bangladesh does not produce heavy tyres. Light tyres are both produced and imported.
Information on value and quantity o f tyres i s sketchy. Information on total value o f imports exists but not total quantity. While BBS records domestic production figures o f key manufacturing products, it does not do so for tyres. Production figures therefore have to be deduced from figures on existing number o f rickshaws and cycles based on some idea o f annual consumption rates. BBS (2000) reports that non-mechanized transport accounts for 47% o f the value-added in the Transport, Communication and Storage sector. And rickshaws and cycles account for more than four-fifths o f the modes in non-mechanized transport. In 1985/86, for example, rickshaws alone contributed to 34% o f the value-added by the transport sector in Bangladesh or roughly Tk.984 crores. T h i s was more than double the contribution o f all motorized road transport, 12 times the contribution o f Bangladesh Railways, and 12.5 times the contribution o f Bangladesh Biman.
During the last 15 years or so, the number o f rickshaws and the associated linkages grew faster. The development o f rural road net works, the growth o f peri-urban areas and commercialization o f agricultural sector paved the ways for a robust growth o f roads and rickshaws. In consequence, the growth o f the demand for tyres also increased during the same period o f time.
1.2 Demand for tyres
1.2.1 Rickshaw tyres
The demand for rickshaw tyres i s a derived demand based on the total number o f rickshaws in use countrywide. However, there i s some difficulty in precisely estimating the number o f rickshaws in use. Although there are statistics available on the number o f registered rickshaws in Dhaka and other areas, it i s common knowledge that the actual number o f rickshaws plying the streets far exceed the number registered. For example, one study (Gallagher, 1988) observed that in 1987 there were 88 thousand rickshaws officially registered with the Dhaka Municipal Corporation but news paper reports and numbers cited by officials and ministers put the true number around 150 to 200 thousand. With such a b ig difference in the number o f rickshaws, it i s quite obvious that the variations in the estimated demand for tyres could be substantial.
However, for the sake o f the present study, we attempted to arrive at a crude estimate based on official statistics as well as on our information about the operation o f the industry. In Table 1, we present

India-Bangladesh FTA: Methodology and Selected Case Studies
the number o f ‘registered’ rickshaws as documented by the Statistical Year Book, Bangladesh (BBS 2 0 0 0 ) . ~ ~ ~
Table 1: Number of rickshaws and demand for tyres Year Rickshaws (‘000) Growth rate Tyres (‘000 7 Tyres (million) 1995196 1181 3543 3.54 1996197 1249 5.6 3747 3.75 1997/98 1323 5.9 3969 3.97 1998199 1407 6.0 422 1 4.22 1999100 1497 6.4 449 1 4.49 2000101 1594 6.5 4782 4.78 200 1 102 1696 6.4 5088 5.09 2002103 1805 6.4 5415 5.42 2002/03‘26 2256 6768 6.77
Source: Statistical Pocket Book, Bangladesh-2000, Bangladesh Bureau o f Statistics (BBS).
Discussions with rickshaw pullers, traders and mechanics reveal that the replacement o f tyre tends to take place after, on average, every 4 months. What we have done i s to multiply the number o f rickshaws by a factor o f 3 to amve at a crude estimate o f the annual demand for tyres. On the basis o f this assumption, it appears that the demand for rickshaw tyres in 2002103 stood at 5.4 million. On average, the growth rates o f both tyres and rickshaws stood at over 6% per annum over the last three years.
However, if we conservatively assume that 25% o f the operating rickshaws are ‘unregistered’, the total number o f rickshaws in Bangladesh then stands at 2,256 thousands and the total demand for tyres would be 6.8 mi l l ion during 2002/03127.
1.2.2 Total demand for tyres
According to our survey, apart from the demand for rickshaw tyres, there i s also an additional demand for bicycle tyres to the tune o f 600 thousand pieces annually.
Table 2: Production of tyres in Bangladesh, 2003 Name o f company Yearly production (million) % o f sales
Gazi 2.9 60 Rupsha 0.7 15 Meghna 0.7 15 Other 0.5 10 Total 4.8 100 Source: Discussions w i th traders and users
That brings the total demand for rickshaw and bicycle tyres in Bangladesh to approximately 7368 thousand or 7.4 mi l l ion every year. Our survey also revealed that the bulk o f tyres (roughly 91%) produced and demanded are rickshaw tyres. Therefore, we will limit our analyses to this category o f tyres.
12’ At the national level, the gap between official statistics and reality i s wider. I t i s assumed conservatively that there are 20-30% more ‘unregistered’ rickshaws a l l over the country. Notes: (a) Figures for 199912000 onwards have been estimated on the basis o f the growth rate o f past three years. (b) Number o f tyres has been arrived at by multiplying the number rickshaws by a factor o f 3.
126 Assumed 25% additional ‘unregistered ricksahws’. ‘27 In fact, 6. 8 mi l l ion is the bench mark demand figures that we shall use in subsequent sections.
190
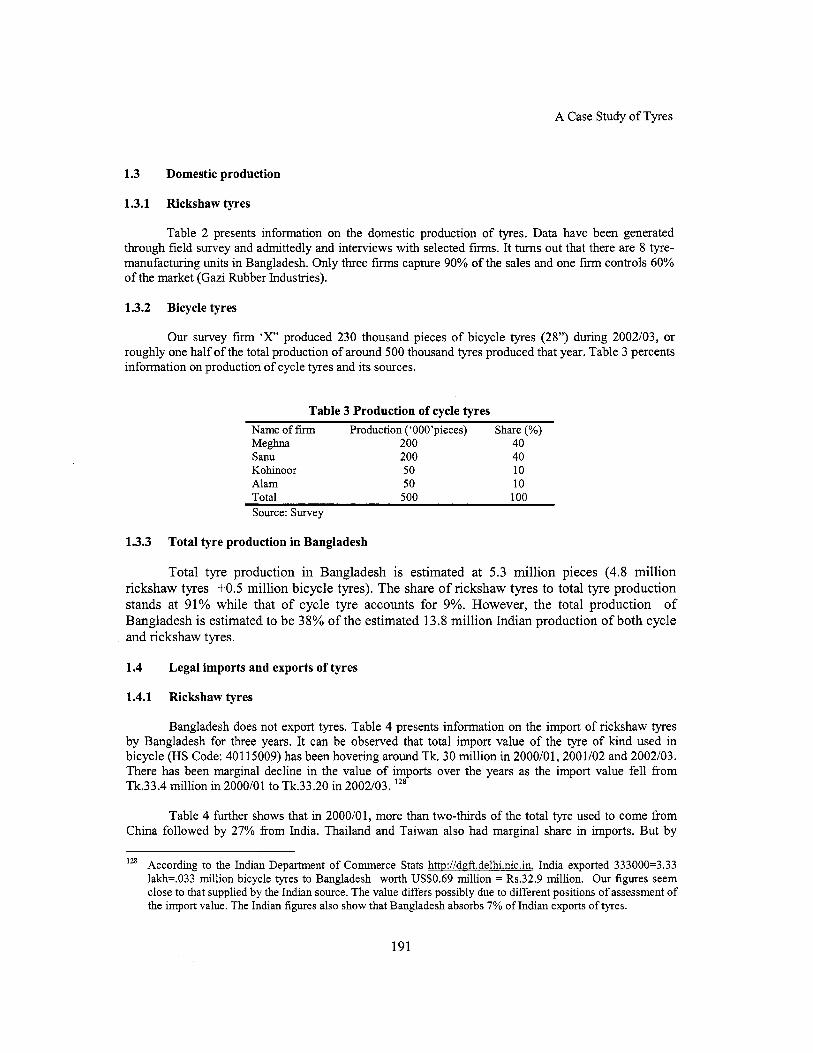
A Case Study o f Tyres
1.3 Domestic production
1.3.1 Rickshaw tyres
Table 2 presents information on the domestic production o f tyres. Data have been generated through field survey and admittedly and interviews with selected f m s . It turns out that there are 8 tyre- manufacturing units in Bangladesh. Only three f i rms capture 90% o f the sales and one firm controls 60% o f the market (Gazi Rubber Industries).
1.3.2 Bicycle tyres
Our survey firm ‘X ’ produced 230 thousand pieces o f bicycle tyres (28”) during 2002103, or roughly one hal f o f the total production o f around 500 thousand tyres produced that year. Table 3 percents information on production o f cycle tyres and i t s sources.
Table 3 Production o f cycle tyres Name o f firm Production (‘000’pieces) Share (%) Meghna 200 40 Sanu 200 40 Kohinoor 50 10 A lam 50 10 Total 500 100 Source: Survey
1.3.3 Total tyre production in Bangladesh
Tota l tyre production in Bangladesh i s estimated at 5.3 m i l l i o n pieces (4.8 million r ickshaw tyres + O S million bicycle tyres). The share o f r ickshaw tyres to total tyre product ion stands at 91% whi le that o f cycle tyre accounts fo r 9%. However, the total product ion o f Bangladesh i s estimated to be 38% o f the estimated 13.8 m i l l i o n Indian product ion o f b o t h cycle and rickshaw tyres.
1.4 Legal imports and exports of tyres
1.4.1 Rickshaw tyres
Bangladesh does not export tyres. Table 4 presents information on the import o f rickshaw tyres by Bangladesh for three years. I t can be observed that total import value o f the tyre o f kind used in bicycle (HS Code: 401 15009) has been hovering around Tk. 30 mi l l ion in 2000/01,2001/02 and 2002/03. There has been marginal decline in the value o f imports over the years as the import value fel l from Tk.33.4 mi l l ion in 2000/01 to Tk.33.20 in 2002/03. 12*
Table 4 further shows that in 2000/01, more than two-thirds o f the total tyre used to come from China followed by 27% from India. Thailand and Taiwan also had marginal share in imports. But by
lZ8 According to the Indian Department o f Commerce Stats http:/!daft.delhi.nic.in, India exported 333000=3.33 lakh=.033 mi l l ion bicycle tyres to Bangladesh worth US$0.69 mi l l ion = Rs.32.9 mill ion. Our figures seem close to that supplied by the Indian source. The value differs possibly due to different positions o f assessment o f the import value. The Indian figures also show that Bangladesh absorbs 7% o f Indian exports o f tyres.
191

India-Bangladesh FTA: Methodology and Selected Case Studies
2002103, India emerged as the largest source o f supply for Bangladesh. For example, China accounted for 47% while India’s share jumped to 45% over the same period o f time.
To arrive at the number o f tyres imported, we have approximated the c i f value at Tk.96 ($1.6) /per piece and determined the total number o f tyres imported into the country. As presented in Table 4, in 2002/03 and assuming that the c i f price o f tyre was Tk. 96, a total of 0.33 mi l l ion tyres were imported into the country. India accounted for about 47% o f the total imports and China claimed 45%.
Table 4: Estimated imports of tyres, 2002/03 Country o f origin Import value (Wmillion) Quantity (million) Share in imports (%)
India 14.9 0.16 46.72 China Thailand Indonesia
14.4 0.15 1.3 0.01 1.3 0.01
45.14 4.07 4.07
Total 31.9 0.33 100.00 Source: NBR Trade database. Quantity estimated on the basis o f ci f price o f Tk.93 /me.
1.4.2 Bicycle tyres
Official import statistics do not distinguish between imports o f cycle and rickshaw tyres; both categories are subsumed under the same H S code. Our survey, however, revealed that total imports o f cycle tyres i s approximately 100 thousand units every year. T h i s means, one-third o f the total tyre imported into the country are cycle tyres.
1.5 Illegal imports
1.5.1 Rickshaw tyres
As shown in Tables 1 and 2, the total demand for rickshaw tyres i s estimated at 6.8 mi l l ion while domestic production i s estimated at 4.8 million. That yields an import figure o f 2 mil l ion units. However, legal imports appearing in official statistics, show a figure o f 0.33 mi l l ion pieces (Table 4). The difference o f 1.7 mil l ion pieces can be attributed to illegal imports, not revealed in official statistics.
Illegal imports take place through two routes. First, there i s misdeclaration o f items- called ‘technical smuggling- whereby importers declare say 100 pieces while they actually import 150 pieces. We do not have information on how much o f tyres come through technical smuggling. But a recent survey by the World Bank in the context o f the Study on South Asian Regional Trade, shows that the share o f technical smuggling ranges between 25-40%, depending on the type o f commodity imported.
For the present exercise, we will assume that 30% o f the official imports are misdeclared in the case o f tyres. A further assumption i s that informal imports come from India only. In other words, out of 0.16 mil l ion pieces imported legally from India (Table 4), 30% more have been imported through misdeclaration. Th is gives the amount o f illegal imports o f tyres to be 48,000 or 0.05 mi l l ion pieces per year . Out o f this, rickshaw tyres accounts for 70% or 0.04 mi l l ion pieces and bicycle tyres, 30% or 0.01 mi l l ion pieces). The rest 1.6 mi l l ion pieces o f tyres (1 -7-0.05) supposedly enter through cross-border channels- called bootlegging smuggling.
Out o f this, 70% apply for rickshaw tyres. That i s 1.12 mil l ion pieces o f rickshaw tyres are imported through bootlegging imports and 23% or 48 thousand o f bicycle tyres come through the same
192
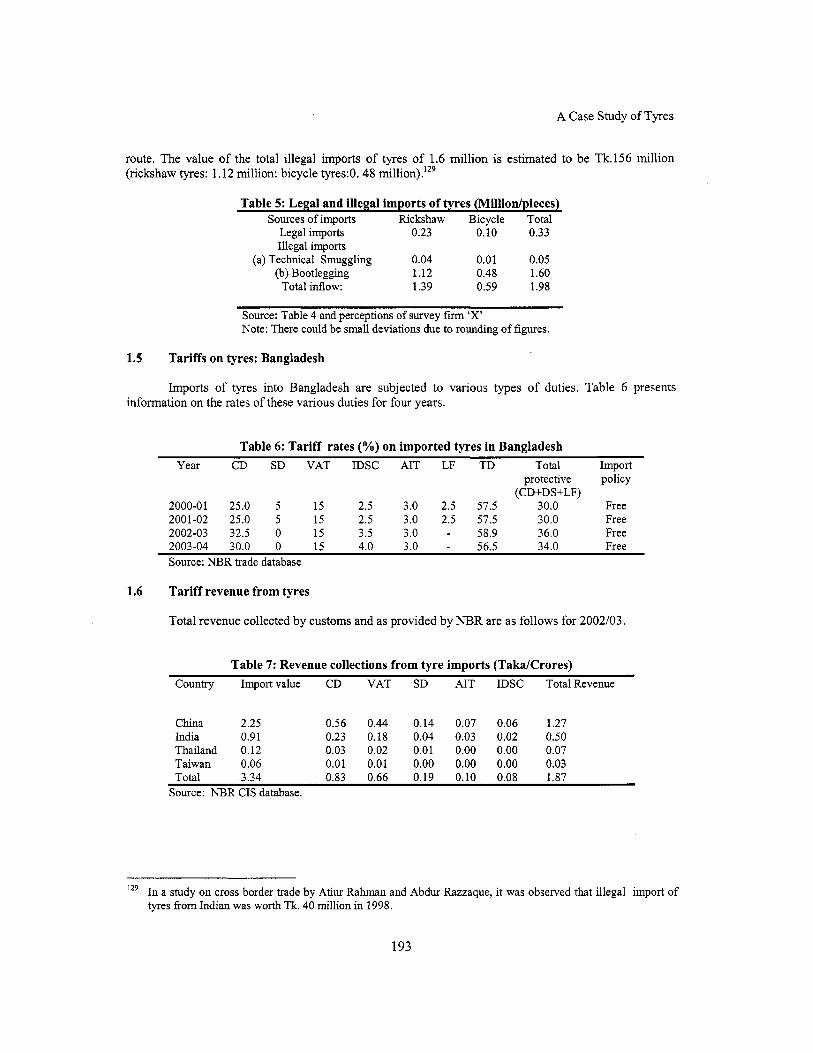
A Case Study o f Tyres
route. The value o f the total illegal imports o f tyres o f 1.6 mi l l ion i s estimated to be Tk.156 mil l ion (rickshaw tyres: 1.12 million: bicycle tyres:O. 48 million).’zg
Table 5: Legal and illegal imports of tyres (Milliodpieces) Sources o f imports Rickshaw Bicycle Total
Legal imports 0.23 0.10 0.33 Illegal imports
(a) Technical Smuggling 0.04 0.01 0.05 (b) Bootlegging 1.12 0.48 1.60
Total inflow: 1.39 0.59 1.98
Source: Table 4 and perceptions o f survey fm ‘X’ Note: There could be sma l l deviations due to rounding o f figures.
1.5 Tariffs on tyres: Bangladesh
Imports o f tyres into Bangladesh are subjected to various types o f duties. Table 6 presents information on the rates o f these various duties for four years.
Table 6: Tariff rates (YO) on imported tyres in Bangladesh Year CD SD VAT IDSC AIT LF TD Total Import
protective policy (CD+DS+LF)
2000-01 25.0 5 15 2.5 3.0 2.5 57.5 30.0 Free 2001-02 25.0 5 15 2.5 3.0 2.5 57.5 30.0 Free 2002-03 32.5 0 15 3.5 3.0 - 58.9 36.0 Free 2003-04 30.0 0 15 4.0 3.0 - 56.5 34.0 Free Source: NBR trade database
1.6 Tariff revenue from tyres
Total revenue collected by customs and as provided by NBR are as follows for 2002/03.
Table 7: Revenue collections from tyre imports (TakdCrores) Country Importvalue CD VAT SD AIT IDSC TotalRevenue
China 2.25 0.56 0.44 0.14 0.07 0.06 1.27 India 0.91 0.23 0.18 0.04 0.03 0.02 0.50 Thailand 0.12 0.03 0.02 0.01 0.00 0.00 0.07 Taiwan 0.06 0.01 0.01 0.00 0.00 0.00 0.03 Total 3.34 0.83 0.66 0.19 0.10 0.08 1.87
Source: NBR CIS database.
12’ In a study on cross border trade by Atiur Rahman and Abdur Razzaque, it was observed that illegal import o f tyres from Indian was worth Tk. 40 million in 1998.
193
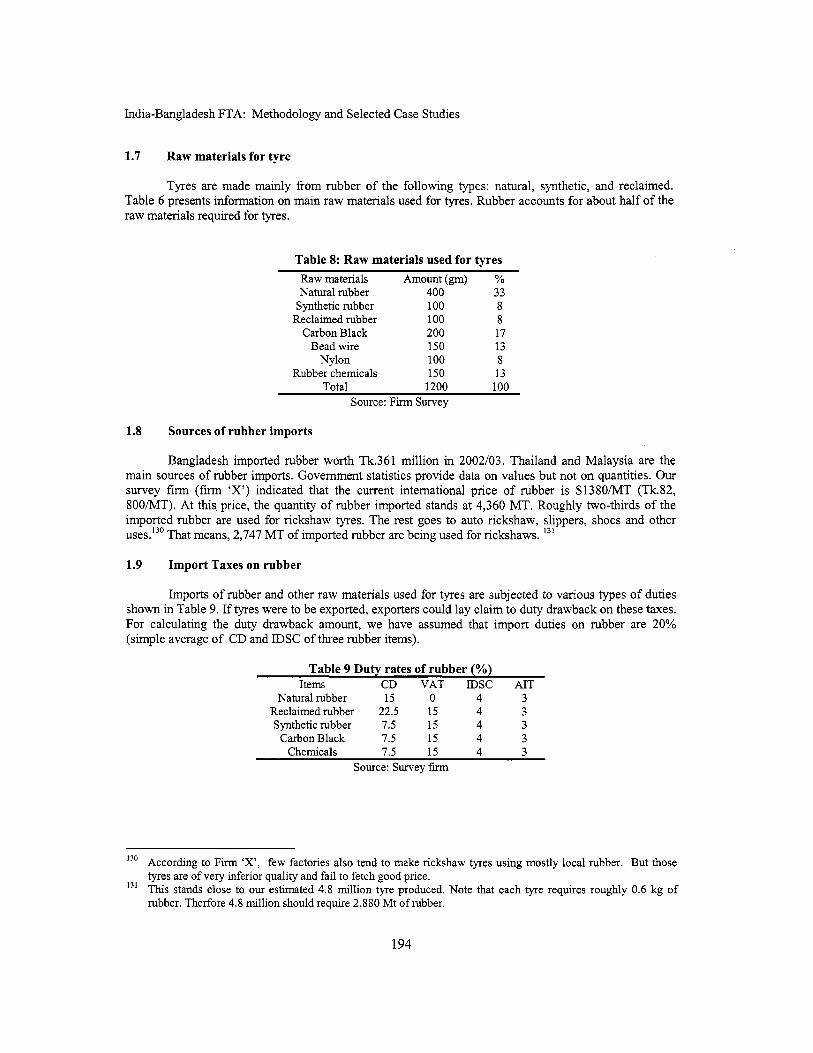
India-Bangladesh FTA: Methodology and Selected Case Studies
1.7 Raw materials for tyre
Tyres are made mainly from rubber o f the following types: natural, synthetic, and reclaimed. Table 6 presents information on main raw materials used for tyres. Rubber accounts for about half o f the raw materials required for tyres.
Table 8: Raw materials used for tyres Raw materials Amount (gm) YO Natural rubber 400 33
Synthetic rubber 100 8 Reclaimed rubber 100 8
Carbon Black 200 17 Bead wire 150 13
Rubber chemicals 150 13 Total 1200 100
Source: Firm Survey
Ny lon 100 8
1.8 Sources of rubber imports
Bangladesh imported rubber worth Tk.361 mil l ion in 2002/03. Thailand and Malaysia are the main sources o f rubber imports. Government statistics provide data on values but not on quantities. Our survey firm (firm ‘X’) indicated that the current international price o f rubber i s $1380/MT (Tk.82, 800MT). At this price, the quantity o f rubber imported stands at 4,360 MT. Roughly two-thirds o f the imported rubber are used for rickshaw tyres. The rest goes to auto rickshaw, slippers, shoes and other uses.13o That means, 2,747 MT o f imported rubber are being used for rickshaws. 13’
1.9 Import Taxes on rubber
Imports o f rubber and other raw materials used for tyres are subjected to various types o f duties shown in Table 9. If tyres were to be exported, exporters could lay claim to duty drawback on these taxes. For calculating the duty drawback amount, we have assumed that import duties on rubber are 20% (simple average o f CD and IDSC o f three rubber items).
Table 9 Duty rates of rubber (YO)
Natural rubber 15 0 4 3 Reclaimed rubber 22.5 15 4 3 Synthetic rubber 7.5 15 4 3
Carbon Black 7.5 15 4 3 Chemicals 7.5 15 4 3
Source: Survey fm
Items CD VAT IDSC AIT
I 3 O According to Firm ‘X’, few factories also tend to make rickshaw tyres using mostly local rubber. But those tyres are o f very inferior quality and fai l to fetch good price. Th is stands close to our estimated 4.8 mi l l ion tyre produced. Note that each tyre requires roughly 0.6 kg o f rubber. Therfore 4.8 mi l l ion should require 2,880 Mt o f rubber.
131
194

A Case Study o f Tyres
1.10 Duty Drawback
A tyre uses 600 gm of rubber. At the going international price o f rubber, it costs about Tk.50 I600 gm. Duty amount on this comes to Tk. 10. That means, if a producer decides to export tyres, she would get back Tk. 10 for every tyre exported. . For simplicity’s sake, duty drawback on al l raw materials (rubber plus chemicals, etc.) are subsumed under this rate.
1.11 Domestic taxes on tyres
Besides import duties, sales o f tyres in the domestic market are also being subjected to various types o f taxes. For example, sales o f tyres are subjected to VAT at 15% and SD at 5%, for a total tax of 20%.
Table 10: Domestic taxes on tyres in Bangladesh Taxes 2000-01 2001-02 20002-03 2003-04 VAT 15 15 15 15 SD 5 5 5 5
Source: NBR
1.12 E x - factory Price of tyres
The ex factory price o f Bangladeshi tyre i s shown in Table 11. We talked with several manufacturer and traders in the markets to te l l us about prices. Here we have noted ex-factory prices of the highest cost producer and the lowest cost producer.
Table 11: Ex-factory price of tyres.2004 (TWpiece) Serial Source o f costs Rate Total cost
1 Factory-gate price 129.00 ($2.15)
2 VATITaxes 20% 25.8
4 Supplier’s basic cost 155.8 5 Owner’s margin 3% 4.67 6 Whole seller’s procurement cost (4+5) 160.47 7 Whole seller’s margin 2% 3.2 8. Whole sale price at Bansal whole sale market 163.67
3 TranspodHandling 1 .oo
Source: Survey Firm ‘X’ and market information from visits
From the wholesale price, we have taken out (a) wholesale margin (b) transport cost (c) owners’ margin and (d) VAThaxes to arrive at the ex-factory prices o f Bangladeshi tyres. As can be seen from Table 11, the ex-factory tax fi-ee price o f Bangladeshi tyre i s estimated to be Tk.129 ($2.15).
1.13 Cif and fob prices of tyres
Table 12 presents information on the estimated prices o f imported tyers. We have considered Indian and Chinese tyers for the sake o f comparison. Again, the sources o f information are traders, importers and manufacturers.
195
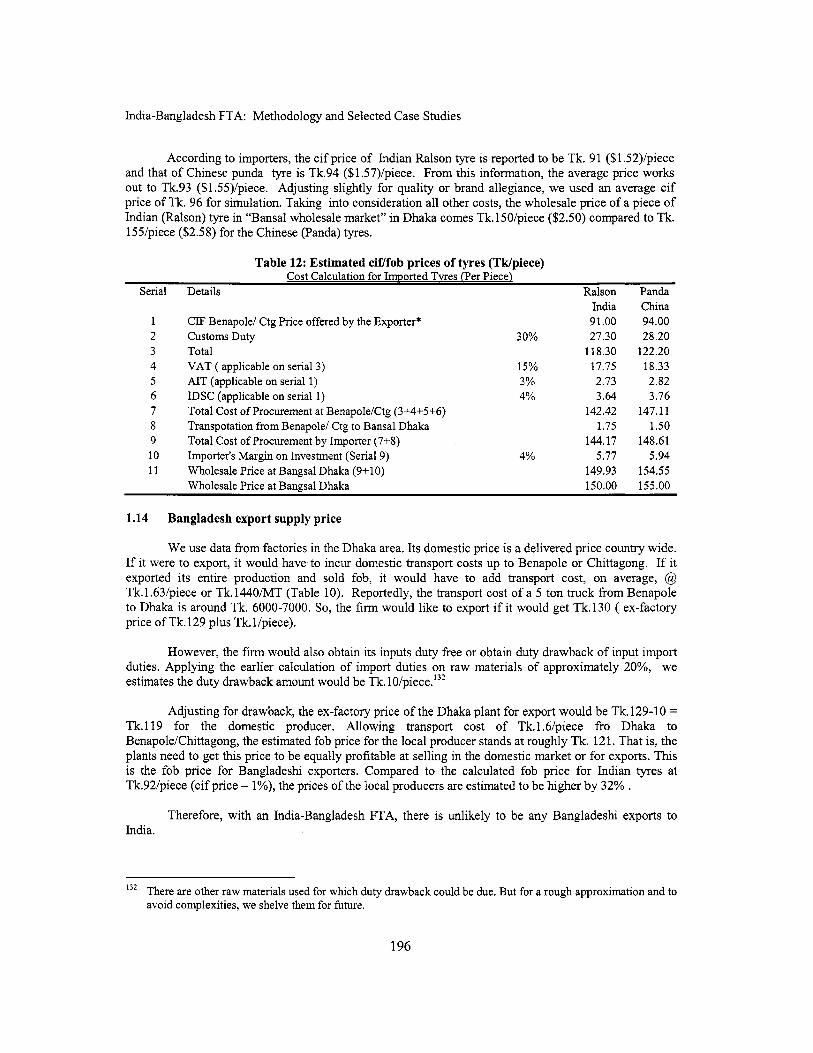
India-Bangladesh FTA: Methodology and Selected Case Studies
According to importers, the c i f price o f Indian Ralson tyre i s reported to be Tk. 91 ($1.52)/piece and that o f Chinese punda tyre i s Tk.94 ($1.57)/piece. From this information, the average price works out to Tk.93 ($1.55)/piece. Adjusting slightly for quality or brand allegiance, we used an average cif price o f Tk. 96 for simulation. Taking into consideration al l other costs, the wholesale price o f a piece o f Indian (Ralson) tyre in “Bansal wholesale market” in Dhaka comes Tk.l50/piece ($2.50) compared to Tk. 155/piece ($2.58) for the Chinese (Panda) tyres.
Table 12: Estimated cif/fob prices of tyres (TWpiece) Cost Calculation for Imported Tvres (Per Piece)
Serial Details Ralson Panda India China
1 CIF Benapole/ Ctg Price offered by the Exporter* 91.00 94.00 2 CustomsDuty 3 0% 27.30 28.20 3 Total 118.30 122.20 4 VAT ( applicable on serial 3) 15% 17.75 18.33 5 AIT (applicable on serial 1) 3% 2.73 2.82 6 IDSC (applicable on serial 1) 4% 3.64 3.76 7 Total Cost o f Procurement at BenapoleKtg (3+4+5+6) 142.42 147.1 1 8 Transpotation from Benapole/ Ctg to Bansal Dhaka 1.75 1.50 9 Total Cost o f Procurement by Importer (7+8) 144.17 148.61
11 Wholesale Price at Bangsal Dhaka (9+10) 149.93 154.55 Wholesale Price at Bangsal Dhaka 150.00 155.00
10 Importer’s Margin on Investment (Serial 9) 4% 5.77 5.94
1.14 Bangladesh export supply price
We use data from factories in the Dhaka area. I ts domestic price i s a delivered price country wide. If i t were to export, i t would have to incur domestic transport costs up to Benapole or Chittagong. If it exported i t s entire production and sold fob, i t would have to add transport cost, on average, @ Tk.l.63Ipiece or Tk.1440MT (Table 10). Reportedly, the transport cost o f a 5 ton truck from Benapole to Dhaka i s around Tk. 6000-7000. So, the firm would l ike to export i f it would get Tk.130 ( ex-factory price o f Tk.129 plus Tk.l/piece).
However, the firm would also obtain i t s inputs duty free or obtain duty drawback o f input import duties. Applying the earlier calculation o f import duties on raw materials o f approximately 20%, we estimates the duty drawback amount would be Tk. 10/piece.I3*
Adjusting for drawback, the ex-factory price o f the Dhaka plant for export would be Tk. 129-10 = Tk.119 for the domestic producer. Al lowing transport cost o f Tk.1.6/piece fro Dhaka to BenapoleEhittagong, the estimated fob price for the local producer stands at roughly Tk. 121. That is, the plants need to get this price to be equally profitable at selling in the domestic market or for exports. This i s the fob price for Bangladeshi exporters. Compared to the calculated fob price for Indian tyres at Tk.92ipiece (cif price - l%), the prices o f the local producers are estimated to be higher by 32% .
Therefore, wi th an India-Bangladesh FTA, there i s unlikely to be any Bangladeshi exports to India.
There are other raw materials used for which duty drawback could be due. But for a rough approximation and to avoid complexities, we shelve them for future.
132
196

A Case Study o f Tyres
1.15 Bangladesh domestic supply curve
As mentioned earlier, there are 8 tyre-manufacturing plants. We assume that the marginal unit i s making normal profit at ex-factory price excluding VAT o f Tk. 129/piece($2.15), and that al l other uni ts are operating profitably (since there was no report o f a shut down over the years). For example, the Report o f the Census on Manufacturing Industries (CMI) for 1997-98 reported that there were 6 plants producing tyres and tubes in Bangladesh. It appears that during the last six years or so, there was no plant closure; we can a priori assume that the tyre producing plants are running profitably. For the purpose o f drawing the Bangladesh supply curve, we assumed an intra-marginal supplier costing at 7% below that of the marginal supplier (see Figure 1).
The effects o f increased import competition from Indian suppliers with FTA would probably (1) cause high cost producers to close or (2) cause the Bangladesh producers to cut prices and reduce costs by operating at higher capacity utilization levels. Situation (1) could be envisaged as a move down a short run supply curve with al l remaining producers continuing to operate at below full capacity.
For the short run case, we suggest assuming that-with below capacity operation continuing-the marginal plant breaks even at Tk.l29/piece and that the least-cost plant could break even at an ex-factory price about 7% lower (say Tk. 121)'33. We will assume a linear supply domestic supply curve these two points over the total production o f 4.8 mi l l ion or approximately 5 mi l l ion pieces. This corresponds to an average supply elasticity'34 w.r.t. the ex-factory price over this range o f (4.8/2.4)/(8/125) = 31.25. I f al l the plants were to close, the producer surplus loss would be Tk.0.5*8*4.8 mi l l ion = Tk.19.2 mi l l ion =$0.32 mil l ion (at Tk.60=$1). [Figure 13
In addition, there would be some producer surplus losses resulting from unemployed labor and other resources previously employed in tyre production i.e. resources employed in inelastic supply. The size o f the producer surplus loss depends on the slope o f the supply curve and the production costs o f the most efficient plant relative to the marginal plant. There could also be induced economic losses through the effects o f any unrepayble bank loans which might have financed them.
2. INDIANCASE
2.1 Domestic production
We do not have up-to-date data on production o f tyres in India. However, we find from Samantak and Pohit (2003) study that, in 2001/02 ( the recent year shown in their paper), India produced 12700 thousand pieces o f tyres. They also assumed a compound growth rate o f 4.22% per annum. Applying the assumed growth rate to the benchmark period, we find that the total tyre production stands at 13.8 mi l l ion pieces in. Taking that figure into consideration, the total tyre production in Bangladesh accounts for about 38% o f the Indian production.
2.2 Tariffs on tyres: India
Table 13 presents information on the duty rates prevailing in India..
133 In fact, fm 'X 'informed us that the in the available situation, the dominating f m - o r the most efficient fm- can supply at 8-10% lower than the mid-efficient ones which again, supplies at 4 4 % lower than the most inefficient ones. We have assumed an average o f 10% in between.
134 Using the arc elasticity principle, ((Ql-Q2)/0.5(Ql+Q2))/((Pl-P2)/0.5(Pl+P2)
197

India-Bangladesh FTA: Methodology and Selected Case Studies
Table 13: Import duties in India Year Basic Tariff concession (% On Addle. Sadd. Total duty Import policy
basic) 2002-03 30 50 4 4 24.38 Free 2003-04 30 50 16 4 38.74 Free
Source: Smantak and Pohit (2003) Case study 4: Bicycles and Parts.
2.3 Domestic taxes: India
The study by Samantak and Pohit (2003) also provide information on the level o f taxes and duties on tyres in India and Bangladesh. According to them, Indian tyres tend to face 16% excise duties and 4% sales tax domestically. Domestic tax rates seem to be same in both countries.
2.4 Domestic transport costs
Information obtained from tyre traders in Kolkata suggest that a truck o f 10 tons costs Rs. 15000 (or Tk.18000) to transport tyres from Ludhiana to Kolkata. The cost o f transport per tyre i s then Rs. 1.9 or Tk.2.30. Added to this i s the transport costs from Kolkata to Benapole @ Tk.O.SO/piece. Thus the total transport cost from factory to the port i s Tk.2.80ipiece.
2.5 Ex-factory price
Indian domestic ex-factory prices are needed to ascertain whether Bangladesh exporters are l ikely to be competitive in India wi th an FTA or PTA. The assumption here i s that they include only long run “normal” profits, so that there would not be much scope for cutting prices in the face o f import competition from Bangladesh, at least in the long run. Of course there could be a parametric change in efficiency and cost reductions. Domestic ex-factory prices are also a f i rs t step towards the estimation o f long run export supply prices i.e. the price at which Indian exporters would be able to supply export markets profitably on a long run basis. The main differences between domestic ex-factory price and export supply price are export incentives (e.g. drawback) that are paid on exports (deducted from the domestic ex-factory price ) and costs that are or would be incurred in exporting but not in selling in domestic markets. The purpose is to amve at fob price that would be
Given the information from importer about c i f price, we have calculated the ex-factory prices by netting out some o f the costs associated with exports. To repeat, the c i f price o f a piece o f Indian Ralson tyre was shown to be Tk.91 ($1.52) (Table IO). Deducting 1% from this, we arrive at Tk.Tk.90 ($1.5) as fob price. The transport cost from factory to port i s estimated to be Tk. 2Wpiece. The ex-factory price thus stands at Tk.87 ($1.45)/piece, assuming no domestic taxes are imposed.
3.0 Economic Welfare Analysis
The following economic welfare analysis relates to rickshaw tyres, not tyres as a whole. Since rickshaw tyres account for 91% o f domestic tyre production and 77% o f the total imports-as argued earlier- we have considered only rickshaw tyres. Besides, we faced a serious dearth o f data pertaining to bicycle industry and its correlates.
3.1 Assumptions
An FTA would involve zero tariffs and no QRs on al l trade between India and Bangladesh. However, the present external MFN tariffs would not change.
198
A Case Study o f Tyres
a.
b.
C.
d.
3.2
Indian tyre prices and costs are about equal and on some case, lower than others. Consequently, wi th FTA, Indian supplies would replace ROW. The protective tariff to the tune o f 30 or so would make ROW uncompetitive. With FTA and assuming al l tyres come from India, imports o f arw materials l ike rubber would stop. At persent, 70% o f the total rubber imported is reported to be destined for tyre Industries. The protective MFN tariff on natural rubber i s 19%. However, whether rubber would be imported would depend on how much production capacity in tyre industries are increased after FTA. Estimated Bangladesh export supply price fob considerably exceed domestic ex-factory tyre prices in India. Therefore at current marginal long run costs, there i s no potential for Bangladesh exporting to India. The total Bangladesh production i s estimated to be 38% o f total tyre production in India. Given that India produces heavy tyres (for cars, trucks, motorcycles, etc.) t h s increase in demand for rickshawhicycle tyres i s unlikely to put a resource constraint on supplies to Bangladesh. Therefore the assumption i s that Indian supply curve i s horizontal or perfectly elastic.
Results
The results are shown in Figure 1. Though average c i f price was found to be Tk. 93, we adjusted the price upwards to reflect the fact that some Bangladeshi brands were selling at a wholesale rate higher than the imported brands. T h i s perhaps reflects brand loyalty or better quality. Thus, we assumed c i f price to be Tk. 96/piece and, adjusting for 34% protective tariff, arrived at Cif+ tariff price o f Tk. 129/piece. Elasticity o f demand for tyre was assumed to be -1.5. Following a reduction in the prices o f tyres (poet- FTA) by 34%, we have estimated that the total demand for tyres in Bangladesh would increase to 9.8 million. Of course, higher elasticity assumptions would yield higher demand figures.
Existing situation (pre-FTA, Figure 1)
At the market equilibrium price Tk. 129 (tariff inclusive), current demand for tyres i s 6.8 mi l l ion (N), o f which 4.8 mil l ion (M) i s supplied from domestic sources and the balance 2 mi l l ion pieces are imported. Of the two million, official imports account for 0.33 mil l ion (CD), while 1.67 mi l l ion comprise o f smuggled tyres (DQ, mostly boot-legged). Equilibrium i s at P. Government revenue i s GFDC while FPDQ reflects absence o f revenue but comprises smuggling transaction costs and rents. Due to the substantial quantity smuggled, it i s l ikely that equilibrium price may not fully reflect the incidence o f tariff.
First Simulation: (Post-FTA) India exports to Bangladesh at international (ROW) prices
Using short run Bangladesh supply curve
Imulications For Bangladesh Equilibrium price falls to the pre-tariff c i f price o f Tk. 96. Indian exporters supply at this price eliminating any imports from ROW. 1. Gain: Increase CS = area ABEP =33*6.8 + 0.5*(33~3) mil l ion pieces= Tk. 224.4 + 49.5 = Tk.273.9 million=$ 4.56 mil l ion 2. Loss: Decrease PS = area AHG= Tk.0.5(8x4.8)= Tk.90.2 = $0.32 mil l ion 3. Saving excess resource costs =Area HBCG - area JKLR. T h i s i s clearly positive and reflects trade creation. However, HBCG i s part o f CS already taken note of. So only JKLR = 10*4.8 (=48) need to be subtracted from CS, to obtain net gain. 4. Loss: Decrease in customs revenue from tyre imports=area GCDF= Tk.(129-96)* -33 mi l l ion = Tk.10.89 million=$ 0.18 million. However, at the new demand o f 9.8 mil l ion tyres, i f 5% valued addition
199

India-Bangladesh FTA: Methodology and Selected Case Studies
occurs in retail trade on imported tyres, and domestic VAT i s 15%, that could yield post-FTA revenues o f 0.15*0.49= Tk.0.07 million. In this event, net revenue loss for govt would be Tk. 10.89 - Tk. 0.07 = Tk. 10.82 mil l ion = $0.18 mil l ion 5. Decrease in customs revenue from rubber imports=area JKLR has already been covered in item 3 above. 6. Net economic welfare=(l-3 - 2 - 4 ) = Tk. 273.9 - Tk. 48 - Tk. 90.2 - Tk. 10.82 = Tk. 124.88 mi l l ion = $2.08 mil l ion
Thus, in the case o f rickshawlcycle tyres, we find that there is positive gain in economic welfare to Bangladesh.
However, this would change i f we allow for “technical” and “bootleg” smuggling, discussed earlier, which w i l l affect the Customs revenue loss on tyre imports. If most o f the goods are smuggled with low transaction costs, one could either count the loss o f the rents from smuggling as a welfare loss and treat that similarly to the Customs revenue reduction, or one could argue that the loss o f these economic rents should not b e counted in the overall welfare calculation, in which case they would not be deducted in estimating the net welfare effect. If the FTA eliminates the smuggling it will also eliminate the transaction costs o f the smuggling, which should count as an additional benefit o f the FTA. As mentioned before, it i s likely that imports from India diverted back to legal official channels will pay VAT and other domestic taxes that were previously avoided, and that could be counted as an additional benefit, depending on how you want to treat the economic rents from the evasion o f these taxes. On the other hand, our analysis o f informal trade shows that part o f the reason for smuggling i s that the transaction costs are actually lower than the transaction costs o f formal trade, the implication being that the smuggling would continue even under free trade. The point i s that an FTA while substantially reducing smuggling i s unlikely to eliminate such transactions due to the significant transaction costs involved in formal trade.
Implications For I nd ia
We assumed earlier that Bangladesh demand for tyres even after FTA would not result in resource constraints in India so as to allow India to export along a horizontal supply curve. Thus, following an FTA, Indian exporters would price their exports to Bangladesh at the world price, on a horizontal supply curve, or close to horizontal, so that the post-FTA equilibrium price i s the same as the world price, or exceeds it by a very small to negligible margin. This means in turn that the producer surplus for the Indian exporters (and indirectly for India, since the exporters’ profits are taxed) wil l also be very small to negligible. However, with Indian exports falling to 8.6 mil l ion tyres, there i s l ikely to be reduction in employment and incomes in India as a result.
Gain: Increased PS =area above Indian supply curve =negligible.
Net economic welfare: Bangladesh and Ind ia
Tk. 124.88 mil l ion = $2.08 mi l l ion +negligible gain o f India
N e t ROW
ROW would lose from the displacement o f rubber imports into Bangladesh; but this could wel l be compensated by rubber imports into India following FTA.
200
A Case Study o f Tyres
Second Simulation
(Post-FTA) India exports to Bangladesh at above international (ROW) price but at below cif+tariff prices
In this case, we assume that the equilibrium price lies between ROW and ROW+tariff (between Tk.96 and 129) at say Tk.108, point S. The total post-FTA demand for tyres would rise from 6.8 mi l l ion to 8.6 million, assuming an elasticity o f demand o f 1.5.
Using short run Bangladesh supply curve
Implications For Bangladesh
1. Gain: Increase CS = area ASUP =21*6.8 + 0.5*(21x1.8) mi l l ion = Tk. 142.8 + 18.9 = Tk.161.7 million=$ 2.69 million.
2. loss o f PS = area AHG = 0.5*8x4.8 = Tk. 19.2 mil l ion = $0.32 mi l l ion
3. Saving excess resource costs =Area HSXG - area JKLR. T h i s i s clearly positive and reflects trade creation. However, HSXG i s part o f CS already taken note of. So only JKLR = 10*4.8 ( 4 8 ) need to be subtracted from CS, to obtain net gain.
4. Loss: Decrease in customs revenue from tyre imports=area GCDF= Tk.(129-96)* .33 mi l l ion = Tk.10.89 million=$O.18 million. However, at the new demand o f 8.6 mi l l ion tyres, if 5% valued addition occurs in retail trade on imported tyres, and domestic VAT i s 15%, that could yield post-FTA revenues o f 0.15*0.43= Tk.0.06 million. In this event, net revenue loss for govt would be Tk. 10.89 - Tk. 0.06 = Tk. 10.83 mil l ion = $0.18 mil l ion
5. Decrease in customs revenue from rubber imports=area JKLR has already been covered in item 3 above.
6. Net economic welfare=(l-3 - 2 - 4 ) = Tk. 161.7- Tk. 48 - Tk. 19.2 - Tk. 10.83 = Tk. 83.67 million=$l.39 million.
Thus, in the case where Inida’s export supply curve i s upward sloping, we find that there i s positive gain in economic welfare to Bangladesh, but i t i s less than in the case where Indian exports are on a horizontal supply curve at the pre-FTA R O W c i f price. There i s thus some extra cost o f trade diversion taking place where Indian exporters face rising supply curves as compared to the horizontal ROW supply curve.
However, this would change if we allow for “technical” and “bootleg” smuggling, discussed earlier, which will affect the Customs revenue loss on tyre imports. If most o f the goods are smuggled with l ow transaction costs, one could either count the loss o f the rents from smuggling as a welfare loss and treat that similarly to the Customs revenue reduction, or one could argue that the loss o f these economic rents should not be counted in the overall welfare calculation, in which case they would not be deducted in estimating the net welfare effect. If the FTA eliminates the smuggling it will also eliminate the transaction costs o f the smuggling, which should count as an additional benefit o f the FTA. As mentioned before, it i s likely that imports from India diverted back to legal official channels will pay VAT and other domestic taxes that were previously avoided, and that could be counted as an additional benefit, depending on how you want to treat the economic rents from the evasion o f these taxes. On the other hand, our analysis o f informal trade shows that part o f the reason for smuggling i s that the
20 1

India-Bangladesh FTA: Methodology and Selected Case Studies
transaction costs are actually lower than the transaction costs o f formal trade, the implication being that the smuggling would continue even under free trade. The point i s that an FTA while substantially reducing smuggling i s unlikely to eliminate such transactions due to the significant transaction costs involved in formal trade.
Implications For India
We assumed earlier that Bangladesh demand for tyres even after FTA would not result in resource constraints in India so as to allow India to export along a horizontal supply curve. Thus, following an FTA, Indian exporters would price their exports to Bangladesh at the world price, on a horizontal supply curve, or close to horizontal, so that the post-FTA equilibrium price is the same as the world price, or exceeds it by a very small to negligible margin. T h i s means in turn that the producer surplus for the Indian exporters (and indirectly for India, since the exporters’ profits are taxed) will also be very small to negligible. However, with Indian exports rising to 8.6 mil l ion tyres, there i s decrease in employment and incomes in India as a result.
Gain: Increased PS =area above Indian supply curve = Area SBU =Tk.0.5*(108-96)* 8.6 mi l l ion = Tk.5 1.6 mil l ion = $0.86 million.
N e t economic welfare: Bangladesh and India Tk. 87.63 mil l ion (Bangladesh) +Tk. 51.6 mi l l ion (India)= Tk. 139.23 million=$2.3 million.
N e t R O W
ROW would lose from the displacement o f rubber imports into Bangladesh; but this could wel l be compensated by rubber imports into India following FTA.
Third Simulation (Post-FTA) India exports to Bangladesh at above international (ROW) price but at below cif+tariff prices. Collusion between Indian exporter and Bangladesh supplier could leave Bangladesh production in tact, but the profit-maximizing price o f the Indian exporter i s well above ROW cif price.
For simplicity, in this simulation, we ignore smuggling and al l 2 mi l l ion tyre imports are legal. Pre-FTA , domestic production is at 4.8 million, and most imports come from ROW, with India contributing a small amount. With R O W c i f price at Tk. 96, post tariff price i s Tk. 129, as in the other simulations.
Rather than let Bangladesh producer be wiped out o f the market, what happens if Indian exporters choose to collude. Given the demand (or average revenue) curve faced by Indian exporters, they can seek a profit-maximizing price at the intersection o f AR and LRMC (point Z), with price = MU=OH, sufficiently high to leave some relatively efficient Bangladeshi producers in the market, say Tk. 123. Total demand in Bangladesh, at the colluded price, will then be at OP (=7.5), with OL (=1.3) supplied by domestic intra-marginal suppliers at a price o f Tk. 123.
Welfare change in Bangladesh
1. Gain: Increase in CS = area AHQF = [(129-123)x 6.8 3 + 0.5*6*0.7= 6*6.8+3*0.7 = 40.8+2.1 = Tk. 42.9 mi l l ion = $0.72 mil l ion 2. Loss: Decrease in PS = area AHWG = AG*AH - WUG = 4.8*6 - 0.5*6*3.5 = Tk.18.3 mi l l ion = $0.3 1 mi l l ion
202

A Case Study o f Tyres
3. Loss: loss o f customs revenue = GCDF = (129 - 96)* = Tk. 66 mi l l ion Loss o f customs revenue = XYLR = revenue from tar i f f s on inputs = 10*3.5= Tk.35 million. Total loss o f customs revenue = Tk. 101 mi l l ion = $ 1.68 million, ignoring what VAT revenues might arise from domestic retail. 4. Net change in economic welfare in Bangladesh = 1 - 2- 3 = 42.9 - 18.3 - 101 = - Tk.76.4 mi l l ion = - $ 1.27 million.
Welfare change in India:
India’s gain i s captured from the huge increase in producer surplus = HUZVB = BH*HU - V Z C = 23*4.8 - 0.5*3.5*5.7 = 110.4 - 9.975 = Tk.100.425 mil l ion = $1.67 million.
Overall, there i s net gain in economic welfare between the two countries, but the distribution o f benefits i s skewed against Bangladesh, in this instance.
Th is situation could change if Indian producers decide to invest in Bangladesh tyre production bringing cost efficiency and thereby shifting the Bangladesh supply curve down. Higher production in Bangladesh would mean higher producer surplus which, in the case o f India, would be lower in this scenario. But Indian investors gain from profit repatriation. Such distribution o f gains emanating partly from trade and partly from investment, help raise aggregate economic welfare and are able to address some o f the contentious political economy issues that might impede trade if distribution o f gains happen to be uneven.
203
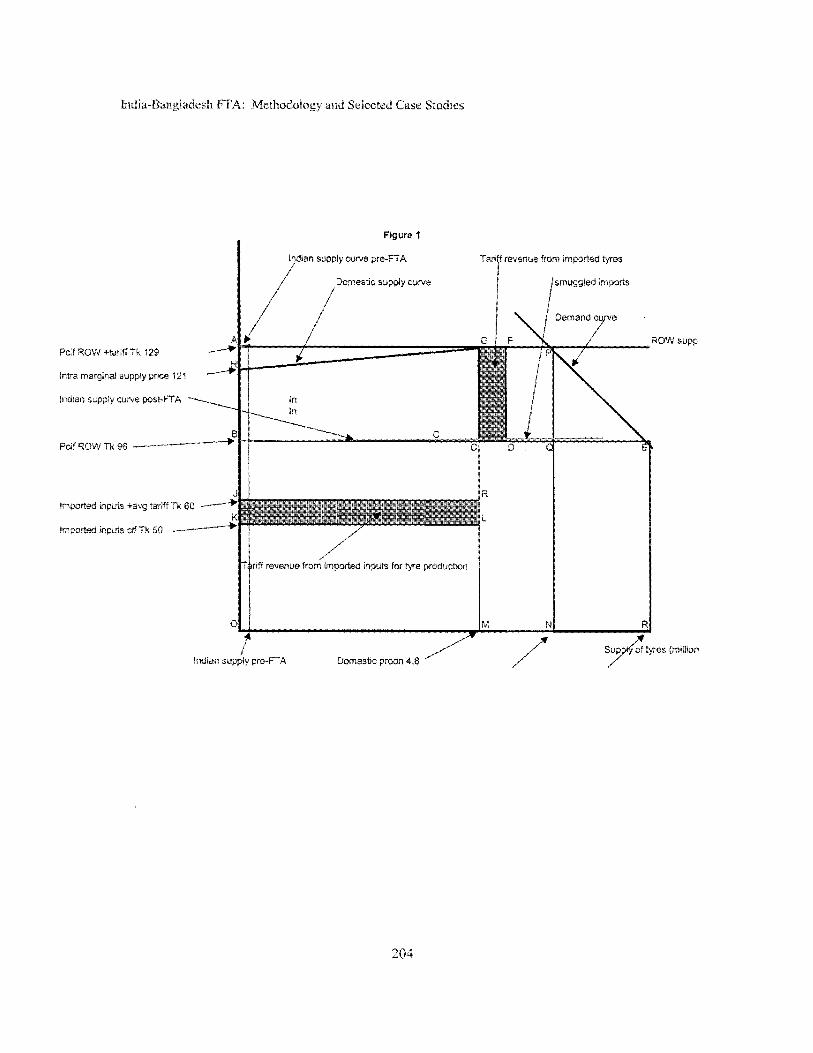
imported inputs *avg tarif+ Tk 60 ------4 i
imported rnputs crf Tk 50 4
Figure 1
lndtan supply curve pre-FTA
jkMeStlC Supply CUWe smuggled imports
i / / /
I IR
f F.
f: Indian sup& pre-FTA /
204
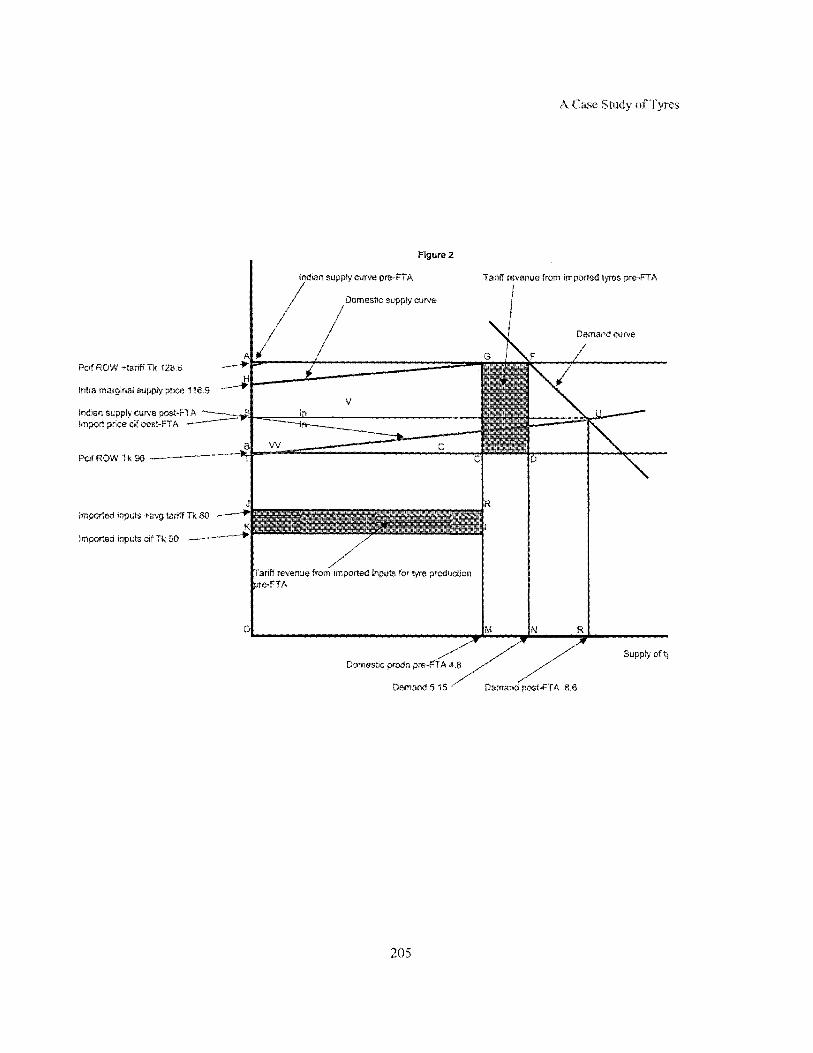
Figure 2
Indian supply curve pre-FTA Tan8 rsvanue from imported tye$ pre-FTA f
Domestic suppty curve
Pcif ROW +tariff Tk 128 6
Intra marginal supply price I16 9
Pcif ROW Tk 96
Demand curve
L
R l ~ ~ ~ ~ e ~ rnputs +avg tan8 Tk 60
imported inputs cif Tk 50 --+
Tariff revenue from imparted inputs for &re p r ~ u ~ € i o n
0
Domestic prcdn pre- Supply of 4)
205
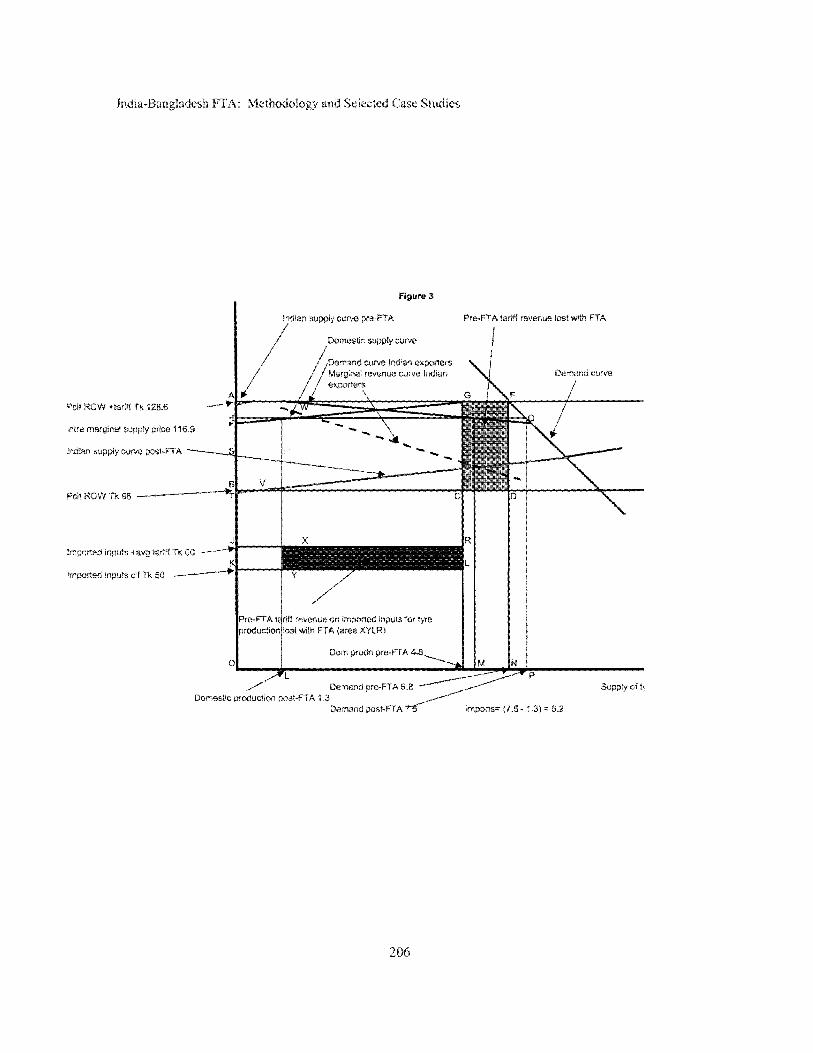
Figure 3 I
Indian supply curve pre-FTA Pre-FTA :anff revenue lost with FTA
O o ~ i e s t i ~ supply curve
Demand c u m Indian exporters Msrginal revenue curve Indian
Pcii ROW +tariff Tk 128 6
intre rnnrginel supply pncc I16 Y
Indian supply C U N ~ post-FTA
0
Demand pic-FTA 6 8 Dowestit: prcfuc'ron wi;l-FTA 1 3
Demand curve
Denand post-FTA rs" imports: (7.5.1 31 = 6 2
206