China in the WTO: Implications for International Trade and Policy Making in Agriculture
Upload
khangminh22Category
view
5download
0
New World Bank/WTO Services Trade Policy Database
–World Bank STRI
WTO “Simply Services”
Geneva, 16 January 2020
Ingo Borchert
(University of Sussex)
Joscelyn Madgeleine
(WTO)
Juan A. Marchetti
(WTO)
Aaditya Mattoo
(World Bank)

• Growing demand for information on trade in services, in particular on actual regulations and policies (advance national policy reform, inform international negotiations, transparency on applied services policies)
• Prior initiatives at WTO Secretariat and World Bank– WTO: GATS commitments database, services statistics,
RTAs database (1995- )– WB: 2012 Services Trade Restrictions Database (STRD)
• 2013: WTO-WB join forces (MoU)Services Integrated Trade Information Portal (I-TIP services)
• 2016: Enhanced cooperation with OECD which released its own STRI and regulatory database in 2014
2
Background

Agenda
3
1) Services Trade Policy Database
2) Quantification of restrictiveness
3) Some Patterns of Service Trade Policyby Mode of Supply
4) Services Policy Changes and Trade Costs Cross-modal policy impact on services trade Trade cost effects (AVE) of past policy changes
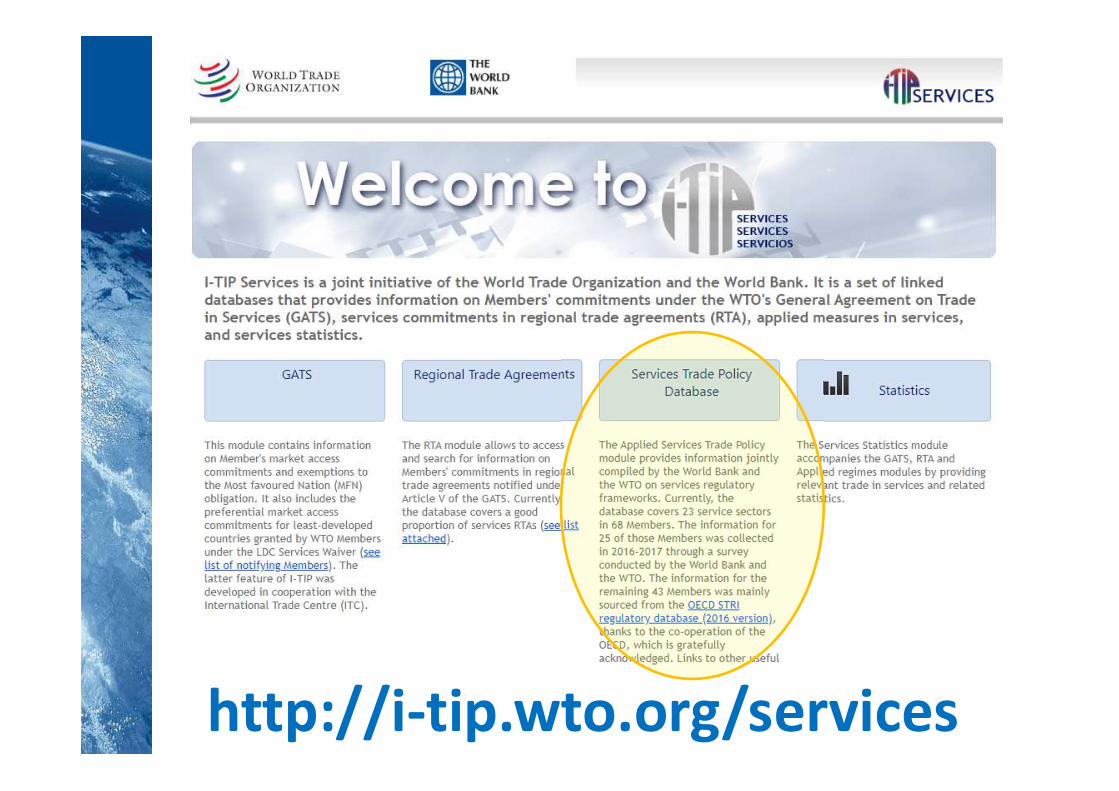
http://i-tip.wto.org/services

5
STPD Coverage:
2008 only (48)
2016 only (13)
2008 + 2016 (55)
No data or under review (87)
Coverage: 116 economies in total
Data collection:
25 non-OECD economies: 23 sector-specific questionnaires, each encompassing >150 questions, filled by local law firms for 2016
43 economies sourced from OECD STRI Regulatory Database for 2016, thanks to co-operation from the OECD, which is gratefully acknowledged(OECD members, BRIICS, Colombia)
Coverage being expanded (CEFTA economies, Jordan, 15 African countries)

6
Sectors Subsectors Mode 1 Mode 3 Mode 4
Financial Commercial banking (deposit-taking, lending) X X X
Non-life insurance (incl. MAT) X X X
Life Insurance X X X
Reinsurance X X X
Telecom Telecom fixed (international and local) X X
Telecom mobile X X
Internet X X
Distribution Retailing services X X X
Wholesale trade services X X X
Transportation Air passenger domestic and international X X
Air freight domestic and international X X
Maritime shipping international X X X
Maritime auxiliary (intermed., other services) X X X
Road freight domestic and international X X X
Rail freight domestic and international X X X
Professional Accounting X X X
Auditing X X X
Legal advice domestic law X X
Legal representation on domestic law X X
Legal advice foreign law X X X
Coverage: sectors and modesServices Trade Policy Database

WTO-WB Classification of Measures (1/2)
A. Conditions on market entryA.1 Forms of entry (including foreign equity limits)A.2 Quantitative measures (for firms and natural persons)A.3 Conditions on licensing/screening/qualifications relating
to market entry (firms /natural persons)A.4 Other conditions on market entry
B. Conditions on operationsB.1 Conditions on supply of servicesB.2 Conditions on services supplierB.3 Conditions on government procurementB.4 Other conditions on operations
Consistent with previous WB classification and current OECD classification
7
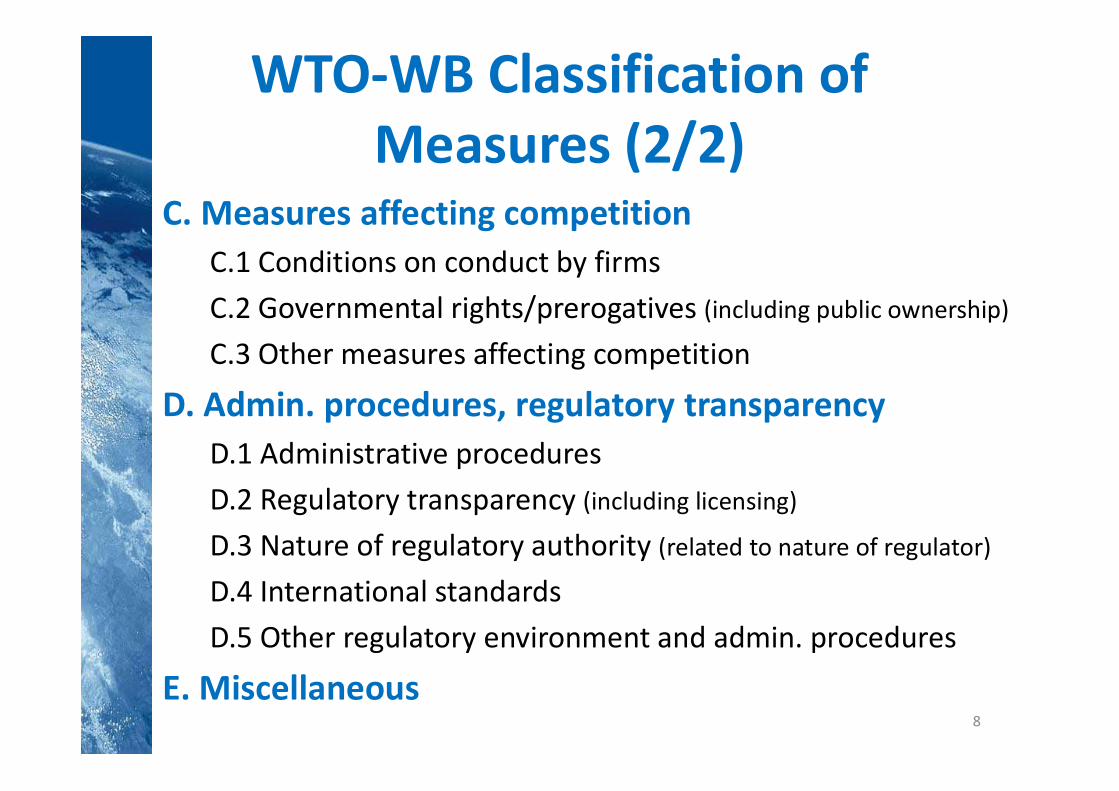
WTO-WB Classification of Measures (2/2)
C. Measures affecting competition C.1 Conditions on conduct by firmsC.2 Governmental rights/prerogatives (including public ownership)
C.3 Other measures affecting competition
D. Admin. procedures, regulatory transparencyD.1 Administrative proceduresD.2 Regulatory transparency (including licensing)
D.3 Nature of regulatory authority (related to nature of regulator)
D.4 International standardsD.5 Other regulatory environment and admin. procedures
E. Miscellaneous8
9
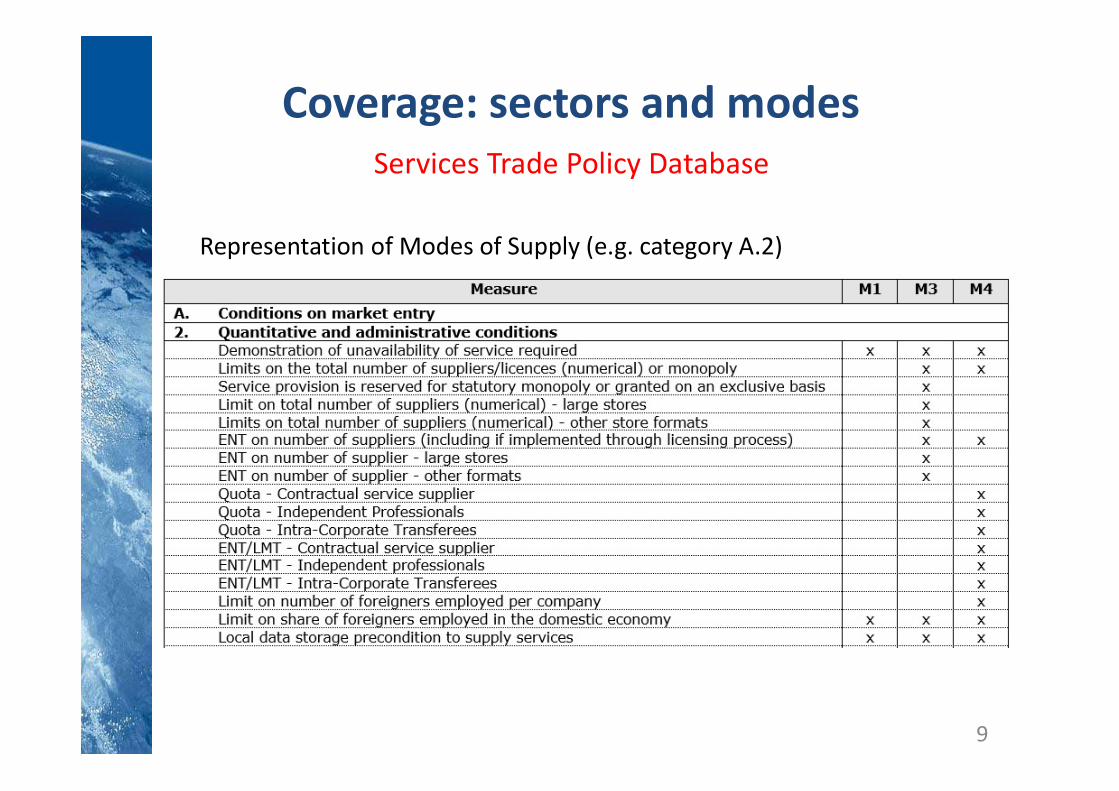
Coverage: sectors and modesServices Trade Policy Database
Representation of Modes of Supply (e.g. category A.2)

Agenda
10
1) Services Trade Policy Database
2) Quantification of restrictiveness
3) Some Patterns of Service Trade Policyby Mode of Supply
4) Services Policy Changes and Trade Costs Cross-modal policy impact on services trade Trade cost effects (AVE) of past policy changes

11
Quantifying Policy Restrictiveness
Approach to quantification as in 2008 WB STRI maintained, with improvements regarding reproducibility and consistent aggregation
Principal steps: Scoring and Aggregation
1. Selection of key policy measures(comparability with OECD and WB 2008)
2. Assignment of basic scores reflecting level of restrictiveness(mindful of relationship across certain measures)
3. Aggregation of subsector-mode scores through multiple nests
4. Aggregation to country level using value-added weights

12
Scoring
Level of restriction Examples ScoreNot restrictive No restriction on the type of legal
entity, no foreign equity limitation0
Not restrictive, butminimal transparencyissue
No provision for prior notice of, orcomment on, regulatory changes
0.125
Minor restriction Acquisition of land and real estate byforeigners prohibited
0.25
Neither minor normajor
Limit on number of suppliers 0.5
Major restriction Service provision is reserved forstatutory monopoly or granted on anexclusive basis
0.75
Closed Commercial presence is prohibited 1
Examples of measures, level of restriction and associated score
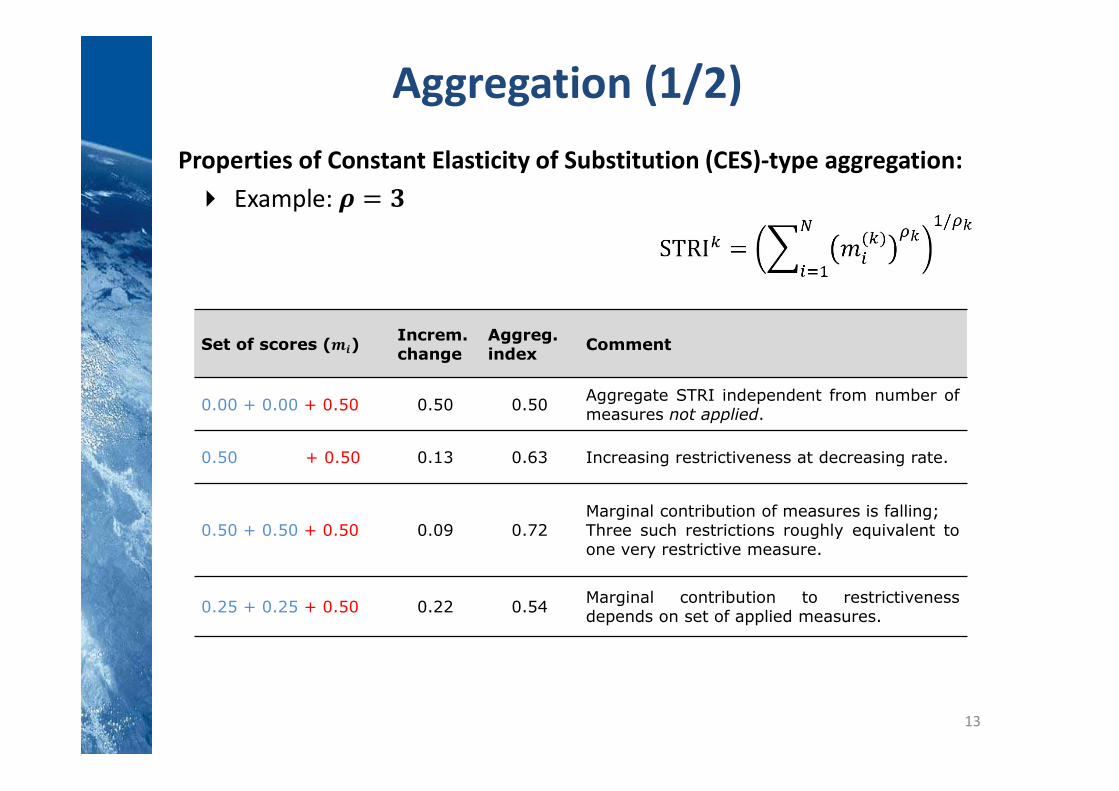
Properties of Constant Elasticity of Substitution (CES)-type aggregation: Example:
13
Aggregation (1/2)
Set of scores (𝒎𝒊)Increm.change
Aggreg.index Comment
0.00 + 0.00 + 0.50 0.50 0.50 Aggregate STRI independent from number ofmeasures not applied.
0.50 + 0.50 0.13 0.63 Increasing restrictiveness at decreasing rate.
0.50 + 0.50 + 0.50 0.09 0.72Marginal contribution of measures is falling;Three such restrictions roughly equivalent toone very restrictive measure.
0.25 + 0.25 + 0.50 0.22 0.54 Marginal contribution to restrictivenessdepends on set of applied measures.
14
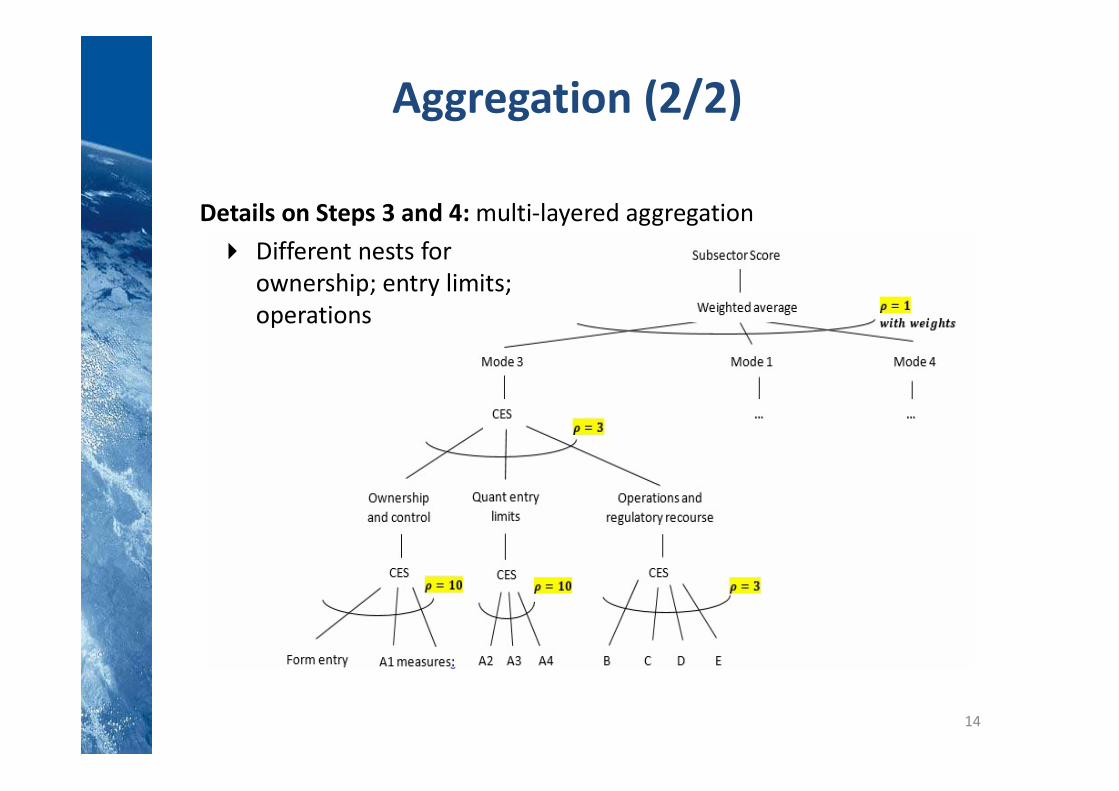
Aggregation (2/2)
Details on Steps 3 and 4: multi-layered aggregation Different nests for
ownership; entry limits;operations

Agenda
15
1) Services Trade Policy Database
2) Quantification of restrictiveness
3) Patterns of Services Trade Policy
4) Services Policy Changes and Trade Costs Cross-modal policy impact on services trade Trade cost effects (AVE) of past policy changes

Services trade policy in 2016- overall level of restrictiveness -
16
ARG
AUS
AUT
BELBGD BRA
CAN
CHE
CHL
CHN
CHTCOLCRI
CZE
DEU
DNK
DOM
ECU
EGY
ESP
EST
FIN
FRAGBR
GRC
HKG
HUN
IDNIND
IRL
ISLISR
ITA
JPN
KAZ
KEN
KOR
LKA
LTU
LUX
LVA
MEX
MMR
MYS
NGA
NLD
NORNZL
OMN
PAK
PAN
PER
PHL
POL
PRT
RUS
SGPSVKSVN
SWE
THA
TUN
TUR
UKRURY
USA
VNM
ZAF
020
4060
80S
TR
I 20
16
8 9 10 11
Log GDP/capita 2016Note: Correlation coefficient = -.29
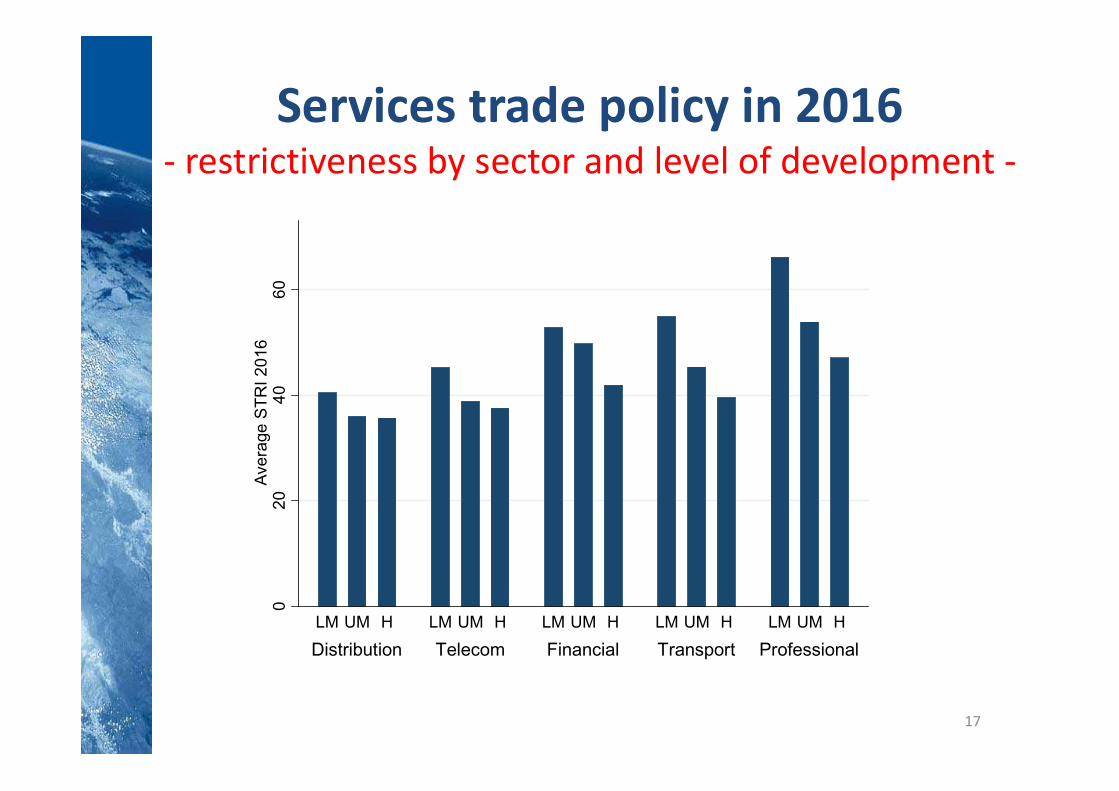
Services trade policy in 2016- restrictiveness by sector and level of development -
17
02
04
06
0A
vera
ge S
TR
I 2
016
Distribution Telecom Financial Transport Professional
LM UM H LM UM H LM UM H LM UM H LM UM H

18
Services trade policy in 2016- restrictiveness across modes of supply -

Evolution of services trade policy- 2008 vs 2016 -
19

Evolution of services trade policy- change in STRI by sector and income group -
20
Notes: Subsectors aggregated into the five broad services sectors displayed in column 1. Colour coding: deep green: <-5 STRI-points; light green: (-5, -1); grey: (-1, 1). Grey shading indicates that policy restrictiveness has remained qualitatively unchanged.
Sector Low Lower Mid Upper Mid HighDistribution -1.69 -4.45 0.24 -2.78Financial -6.42 -3.84 -0.90 -0.02Telecom -10.05 -1.68 -1.36 -3.21Professional -1.89 -6.31 -5.14 -8.06Transport -1.76 -7.87 -3.07 -22.37
Income Group

Evolution of services trade policy- Further liberalization and policy convergence -
Financial sectors
Fixed-line telecoms
21

22
Financial services - modal variation across sectors -
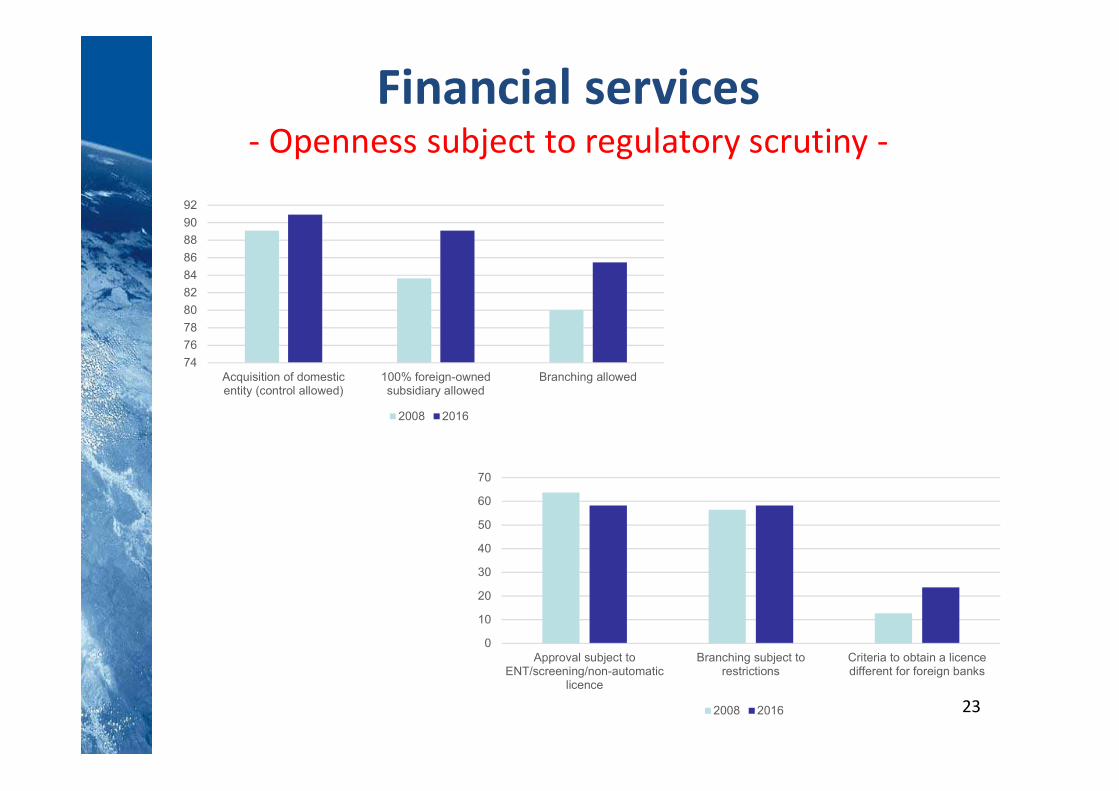
Financial services- Openness subject to regulatory scrutiny -
23
74
76
78
80
82
84
86
88
90
92
Acquisition of domesticentity (control allowed)
100% foreign-ownedsubsidiary allowed
Branching allowed
2008 2016
0
10
20
30
40
50
60
70
Approval subject toENT/screening/non-automatic
licence
Branching subject torestrictions
Criteria to obtain a licencedifferent for foreign banks
2008 2016
24
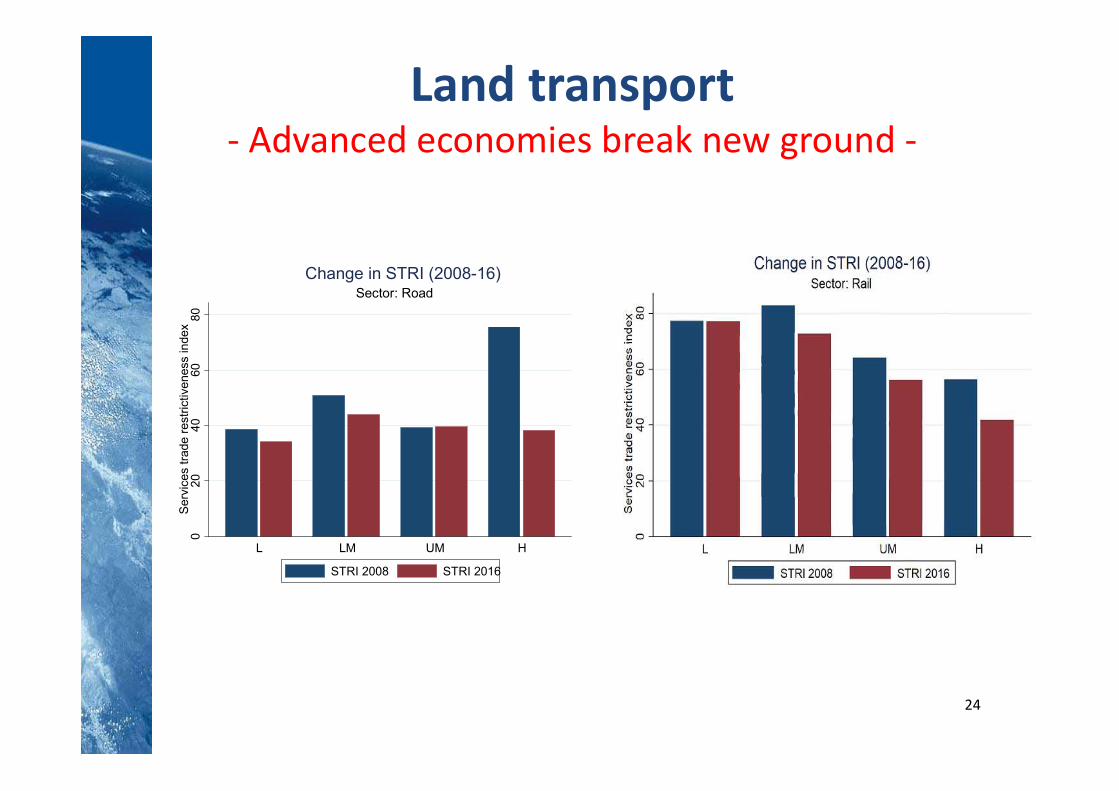
Land transport- Advanced economies break new ground -
020
4060
80S
ervi
ces
trad
e re
stric
tiven
ess
inde
x
L LM UM H
Sector: RoadChange in STRI (2008-16)
STRI 2008 STRI 2016
25
ARG
AUS
AUTBEL
BGD
BRA
CAN
CHL
CHNCOL
CRI
CZE
DEU
DNK
DOM
ECU
EGY
ESP
FINFRAGBRGRC
HUNIDN
IND
IRL
ITAJPN
KAZ
KEN
KOR
LKALTU
MEX
MYS
NGA
NLD
NZL
OMN
PAK
PAN
PER
PHL
POL
PRT
RUS
SWE
THA
TUN
TUR
UKR
URY
USAVNM
ZAF
ARG
AUS
AUT
BEL
BGD
BRA
CANCHL
CHN
COL
CRI
CZE
DEU
DNK
DOM
ECU
EGY
ESP
FIN
FRA
GBRGRCHUN
IDN
IND
IRL
ITA
JPN
KAZ
KEN
KOR
LKA
LTUMEXMYS
NGA
NLD
NZL
OMN
PAK
PAN
PER
PHL
POL
PRT
RUS
SWE
THA
TUN
TUR
UKR
URY
USA
VNM
ZAF
2040
6080
100
ST
RI 2
00
8, 2
016
8 9 10 11
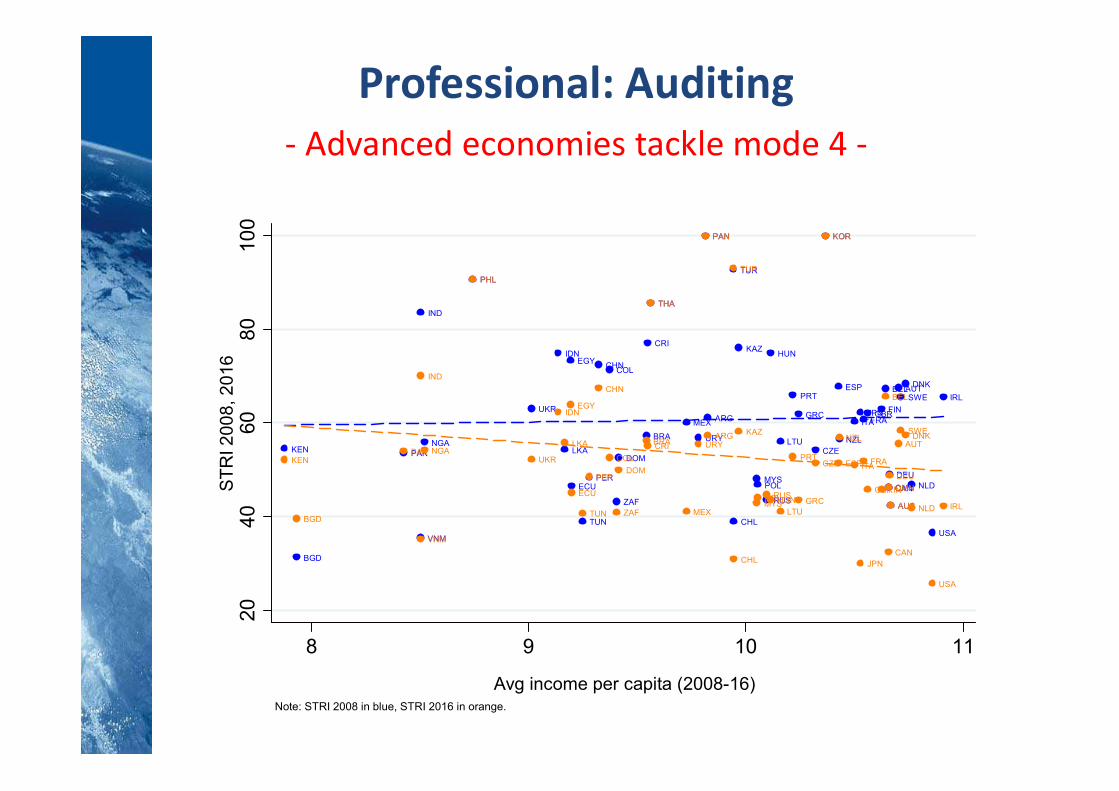
Avg income per capita (2008-16)Note: STRI 2008 in blue, STRI 2016 in orange.
Sector: 10892
Professional: Auditing- Advanced economies tackle mode 4 -

Agenda
26
1) Services Trade Policy Database
2) Quantification of restrictiveness
3) Some Patterns of Service Trade Policyby Mode of Supply
4) Services Policy Changes and Trade Costs Cross-modal policy impact on services trade Trade cost effects (AVE) of past policy changes
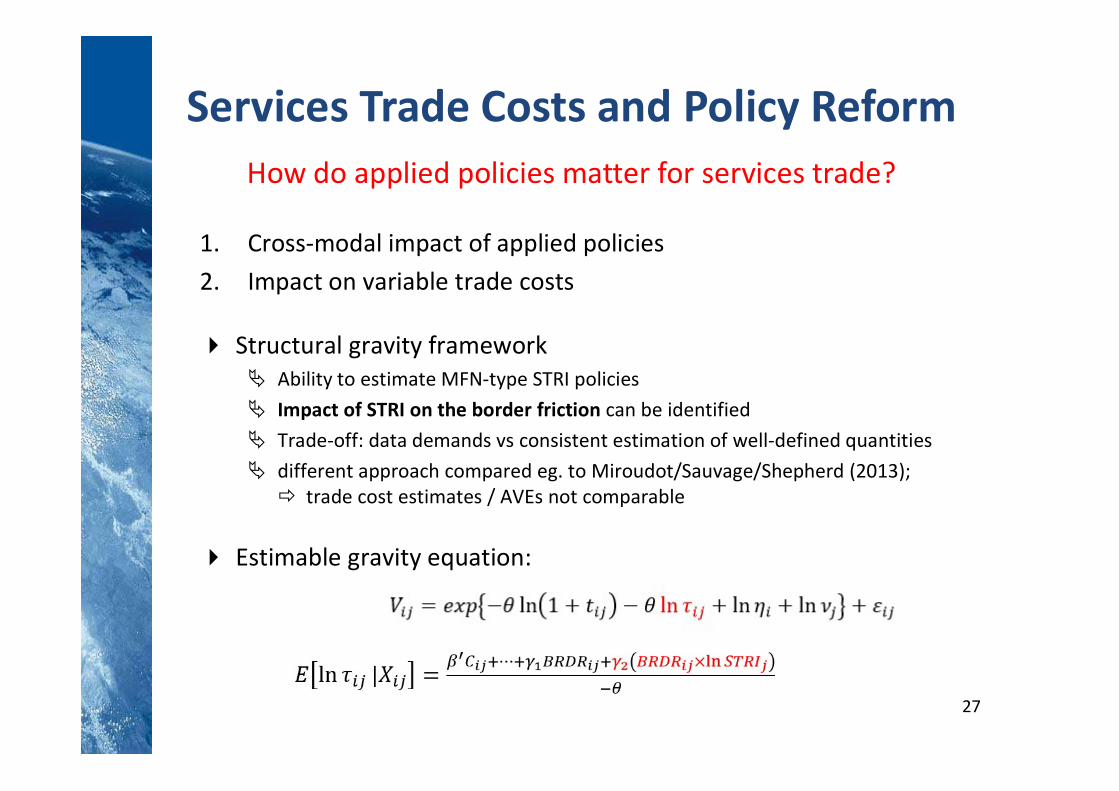
1. Cross-modal impact of applied policies2. Impact on variable trade costs
Structural gravity framework Ability to estimate MFN-type STRI policies Impact of STRI on the border friction can be identified Trade-off: data demands vs consistent estimation of well-defined quantities different approach compared eg. to Miroudot/Sauvage/Shepherd (2013); trade cost estimates / AVEs not comparable
Estimable gravity equation:
27
Services Trade Costs and Policy ReformHow do applied policies matter for services trade?
Linking 4 different data sources:1. WTO-UNCTAD-ITC Annual trade in services dataset;
various procedures to maximise coverage 2. Gross Output from UN SNA;
augmented from OECD IO tables so as to cover 66 economies3. Comprehensive set of gravity variables (CEPII GeoDist)4. STRI 2016 scores
Dimensions of the dataset: 5 services sectors: Transportation, Insurance, Financial,
Information/Communication, Professional services 66 economies EBOPS-ISIC bridge table developed by WTO
PPML estimation with full sets of exporter-/importer fixed effects
28
Services Trade Costs and Policy ReformHow do applied policies matter for services trade?

29
Services Trade Costs and Policy ReformCross-modal effects of policy restrictiveness

30
Services Trade Costs and Policy ReformCross-modal effects of policy restrictiveness
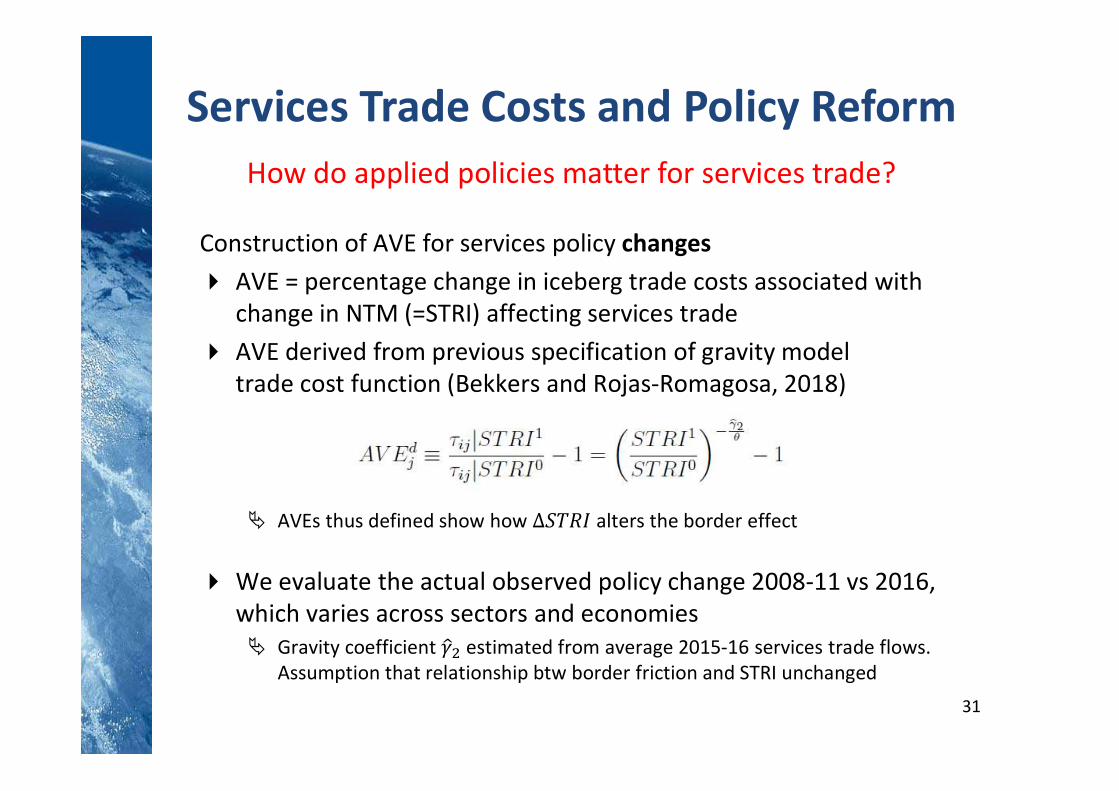
Construction of AVE for services policy changes AVE = percentage change in iceberg trade costs associated with
change in NTM (=STRI) affecting services trade AVE derived from previous specification of gravity model
trade cost function (Bekkers and Rojas-Romagosa, 2018)
AVEs thus defined show how ∆𝑆𝑇𝑅𝐼 alters the border effect
We evaluate the actual observed policy change 2008-11 vs 2016, which varies across sectors and economies Gravity coefficient 𝛾 estimated from average 2015-16 services trade flows.
Assumption that relationship btw border friction and STRI unchanged
31
Services Trade Costs and Policy ReformHow do applied policies matter for services trade?

32
Services Trade Costs and Policy Reform
Transportation:
Actual observed STRI changes (2008/11 – 2016)
-80 -60 -40 -20 0 20
AVE (%) of economy-specific STRI change 2008-16
DOMKENCOLAUSUKRTHAZAFLTU
SWEMEXPHLNZLRUSPOLKORPANCANUSAMYSARGCHNBRAKAZPERTUNLKA
OMNCRI
EGYBGDVNMCHLPAKJPNNGAINDIDNFIN
URYTURITA
GBRHUNDNKAUTDEUECUCZEIRL
PRTNLDFRAGRCESPBEL

33
Services Trade Costs and Policy Reform
-20 -10 0 10 20
AVE (%) of economy-specific STRI change 2008-16
TURKAZPHLPRTZAFKORBELUKRARG
SWENZLNLDLTUJPNFIN
CANAUSEGYDOMIND
GBRESPNGAPAKDNKAUTPANHUNPOLLKAIRL
CHNITA
DEUIDN
PERUSAFRACOLURYVNMBGDMYSTHABRACHLGRCRUSCZEECUCRI
OMNTUNKENMEX
Insurance:
Actual observed STRI changes (2008/11 – 2016)

34
Services Trade Costs and Policy Reform
-20 -15 -10 -5 0 5
AVE (%) of economy-specific STRI change 2008-16
MYSNLDPOLTUR
OMNTHATUNPERPANBGDURYNZLPHLBELVNMLKABRAAUSNGAKAZKENARGEGY
SWECHNCHL
DOMPRTRUSIND
MEXAUTGBRIRLITA
GRCIDNFRALTUFIN
ECUHUNDNKUSAESPZAFKORJPNPAKUKRCZEDEUCANCRI
COL
Professional Services:
Actual observed STRI changes (2008/11 – 2016)

35
Services Trade Costs and Policy Reform
Evidence that qualitative patterns of change also matter quantitatively
Holding everything else constant, policy reform associated with significant fall (often double-digit) in trade costs
Policy impact across modes of supply Policies affecting commercial presence change trade costs for
Mode 1 (complementarity) Some evidence of higher mode 1 trade when mode 4 is restricted; in sectors
most exposed to digitisation (Finance, Telecom, Prof services)
Gravity estimation results consistent with other work (e.g. OECD) These results pertain to cross-border services trade only
Scope for counterfactual policy simulations
Summary

1. WB-WTO Services Trade Policy Database: Updated services trade policy information for 68 economies
and 23 services subsectors
STRI scores obtained with improved methodology
Expanding coverage: e.g. CEFTA, selected African economies underway, and new sectors
2. Between 2008-11 and 2016: broad-based trend to more openness Lower income economies reform telecoms and finance
Advanced economies open up transport and professional services
New measures affecting services trade (scrutiny, data flows)
3. Policy changes matter substantially for services trade costs
36
Conclusions
Thank you
Copyright © 2022 FDOKUMEN