GIS approach to the definition of capacity and generation ceilings of renewable energy technologies
14
Energy Policy 35 (2007) 4879–4892 GIS approach to the definition of capacity and generation ceilings of renewable energy technologies Javier Domı´nguez Bravo a, , Xavier Garcı´a Casals b , Irene Pinedo Pascua a a Renewable Energy Department, Research Center for Energy, Environment and Technology (CIEMAT), Avda Complutense, 22 Madrid, 28040, Spain b Technology Research Institute, Pontificia University Comillas, Madrid, Spain Received 11 September 2006; accepted 13 April 2007 Available online 11 June 2007 Abstract There are no discrepancies about the advantages of achieving a sustainable energy system based on locally available natural resources. However, supporters of green energy generation system were lacking some scientific and consistent study to defend their proposals. In order to have such a study, Greenpeace commissioned Technology Research Institute at the Pontificia Comillas University to carry out a study to assess ceilings for the potential and generation of renewable technologies in Spain. It demonstrates firstly a far greater renewable potential than the targets set by long term policies, and secondly, the viability of meeting the entire electricity demand projected for 2050. GIS was used to add the geographical dimension to the original project in order to generate a technical analysis linked to the specific constrictions imposed by territory (natural and anthropogenic) and not just designed to cover a certain demand. Therefore, GIS spatial analysis took into account local conditions producing a more accurate assessment than evaluations made upon ‘‘virtual’’ electrical spaces. This approach could be applied to other small scale general studies in order to assess the maximum contribution of renewable energy sources to particular energy generation mix and to help set development policies supporting high participation of renewable technologies. r 2007 Elsevier Ltd. All rights reserved. Keywords: Generation mix; Spatial analysis; Geographic information systems 1. Introduction The globalized world we inhabit is facing an energetic crisis which becomes evident in environmental, economic, social and spatial aspects. There have been several proposals and attitudes adopted towards this crisis and there have been multitude organisations which have taken a stance based on an increasing share of energy produced by renewable sources. However, not enough studies have been carried out to determine renewables potentiality accurately. Apart from hydroelectric, only wind energy has mana- ged to overcome the barrier and be included within the commercial interests so private investments could help to develop a more efficient generation system. Other technol- ogies like concentrated solar power (CSP), biomass, solar photovoltaic, solar chimneys and waves (all of them considered significant potential contributors to our elec- trical generation system) are quite far from being real contributors. The maximum percentage that a particular technology could provide to generation system remains as a technical doubt that hinders the renewable energies support: is it feasible a system based completely in renewable sources? Is it absolutely needed to maintain nuclear or thermal contributions to control the generation system and the electricity transport? It is becoming imperative to find a technical solution to the current situation, which is mainly defined by partiality, empiricism and improvisation. It will be then possible to speed up the introduction of renewables within a planned process. As an example, it was thought that wind energy could only contribute in 5% to electricity generation. Later it was proven to reach around 10% and nowadays it seems possible to contribute in 25%. Meanwhile, in Denmark ARTICLE IN PRESS www.elsevier.com/locate/enpol 0301-4215/$ - see front matter r 2007 Elsevier Ltd. All rights reserved. doi:10.1016/j.enpol.2007.04.025 Corresponding author. Tel.: +34 91 3466041; fax: +34 91 3466604. E-mail address: [email protected] (J. Domı´nguez Bravo).
-
Upload
independent -
Category
Documents
-
view
5 -
download
0
Transcript of GIS approach to the definition of capacity and generation ceilings of renewable energy technologies

ARTICLE IN PRESS
0301-4215/$ - se
doi:10.1016/j.en
�CorrespondE-mail addr
Energy Policy 35 (2007) 4879–4892
www.elsevier.com/locate/enpol
GIS approach to the definition of capacity and generation ceilings ofrenewable energy technologies
Javier Domınguez Bravoa,�, Xavier Garcıa Casalsb, Irene Pinedo Pascuaa
aRenewable Energy Department, Research Center for Energy, Environment and Technology (CIEMAT), Avda Complutense, 22 Madrid, 28040, SpainbTechnology Research Institute, Pontificia University Comillas, Madrid, Spain
Received 11 September 2006; accepted 13 April 2007
Available online 11 June 2007
Abstract
There are no discrepancies about the advantages of achieving a sustainable energy system based on locally available natural resources.
However, supporters of green energy generation system were lacking some scientific and consistent study to defend their proposals. In
order to have such a study, Greenpeace commissioned Technology Research Institute at the Pontificia Comillas University to carry out a
study to assess ceilings for the potential and generation of renewable technologies in Spain. It demonstrates firstly a far greater renewable
potential than the targets set by long term policies, and secondly, the viability of meeting the entire electricity demand projected for 2050.
GIS was used to add the geographical dimension to the original project in order to generate a technical analysis linked to the specific
constrictions imposed by territory (natural and anthropogenic) and not just designed to cover a certain demand. Therefore, GIS spatial
analysis took into account local conditions producing a more accurate assessment than evaluations made upon ‘‘virtual’’ electrical
spaces. This approach could be applied to other small scale general studies in order to assess the maximum contribution of renewable
energy sources to particular energy generation mix and to help set development policies supporting high participation of renewable
technologies.
r 2007 Elsevier Ltd. All rights reserved.
Keywords: Generation mix; Spatial analysis; Geographic information systems
1. Introduction
The globalized world we inhabit is facing an energeticcrisis which becomes evident in environmental, economic,social and spatial aspects. There have been severalproposals and attitudes adopted towards this crisis andthere have been multitude organisations which have takena stance based on an increasing share of energy producedby renewable sources. However, not enough studies havebeen carried out to determine renewables potentialityaccurately.
Apart from hydroelectric, only wind energy has mana-ged to overcome the barrier and be included within thecommercial interests so private investments could help todevelop a more efficient generation system. Other technol-ogies like concentrated solar power (CSP), biomass, solar
e front matter r 2007 Elsevier Ltd. All rights reserved.
pol.2007.04.025
ing author. Tel.: +3491 3466041; fax: +34 91 3466604.
ess: [email protected] (J. Domınguez Bravo).
photovoltaic, solar chimneys and waves (all of themconsidered significant potential contributors to our elec-trical generation system) are quite far from being realcontributors.The maximum percentage that a particular technology
could provide to generation system remains as a technicaldoubt that hinders the renewable energies support: is itfeasible a system based completely in renewable sources? Isit absolutely needed to maintain nuclear or thermalcontributions to control the generation system and theelectricity transport? It is becoming imperative to find atechnical solution to the current situation, which is mainlydefined by partiality, empiricism and improvisation. It willbe then possible to speed up the introduction of renewableswithin a planned process.As an example, it was thought that wind energy could
only contribute in 5% to electricity generation. Later it wasproven to reach around 10% and nowadays it seemspossible to contribute in 25%. Meanwhile, in Denmark
ARTICLE IN PRESSJ. Domınguez Bravo et al. / Energy Policy 35 (2007) 4879–48924880
they have already satisfactorily checked the viability of anelectricity generation system with 50% of wind energycontribution. There is no doubt the hesitancy constitutes asignificant obstacle for those technologies at earlier stage ofdevelopment but with enormous prospects for large-scaledevelopment.
Generation technologies based on renewable energiesinvolve an important technical challenge to the generationsystem and transport capacity of the electricity networkdue to the discontinuity and randomness of renewablesources. However, because of the great diversity in renew-able generation technologies used in our country, it couldbe possible to reduce those technical restrictions takingadvantage of the technological synergy and the spatialdistribution.
2. The SIGER project
2.1. Definition and objectives
Greenpeace commissioned the Technology ResearchInstitute at the Pontificia Comillas University (IIT) tocarry out the SIGER project, ‘‘Technical analysis of theintroduction of high percentage of renewable energies inSpanish electrical generation system’’(Garcıa Casals et al.,2005a). With this project, Greenpeace intends to get anevaluation of the potential ceiling of renewable technolo-gies that could be installed in each Spanish region(autonomous community) (Fig. 1).
The provincial distribution of the potential ceilingconstitutes the main objective of SIGER in order tocalculate the generation mix with maximum possiblecontribution of renewable energies at regional scale.Obviously, these aspects do not depend only on the definedrenewable energy technology but also relies on thegeographical features of the potential sittings because land
Fig. 1. Spanish autono
is a critical resource for the achievement of this goal (Blok,2006). This is the reason why the SIGER coordinatorcommissioned CIEMAT to execute the spatial analysiswith GIS.Concerning the methodology followed, the SIGER
project took into account the availability of resources,environmental restrictions and other types of land use, thelink between demand and generating potential and thetransport capacity of the electricity network. Populationand energy demand scenarios were first drawn up (38.32millions inhabitants and a final energy demand of109 kWh/inhabitant/day) based on those already publishedby other institutions (National Institute of Statistics).Starting from these hypotheses, standard power stationswere designed as a means to delimitate the spatialdimension of every considered technological unit. Fromeach technological unit (proportional to standard powerstations) and the restrictions imposed by GIS, maximumarea available in every autonomous community wasestimated. This area was clearly related to maximumgeneration power and thus, to the definition of the capacityceiling per autonomous community.Current electricity transport system in Spain was
considered as the starting point of the project. This systemis characterized by its great development in Northern partof the country, giving evidences of the main generationsources location. However, existent power stations are notplace in the regions with highest renewable generatingpotential (for instance, highest solar generation potential islocated in the Southern part of Spain). In this sense,current electricity transport system clearly restricts spatialdistribution and proposed generation mix based onrenewables. Great adjustment of electricity network wouldsignificantly increase the renewable contribution but thisoption is not taken into account in this project. Never-theless some improvements are suggested.
mous communities.
ARTICLE IN PRESSJ. Domınguez Bravo et al. / Energy Policy 35 (2007) 4879–4892 4881
Therefore, it is really important to remark that theproject aimed to analyse technically and economically 2050scenario but definitely not to define the time sequentialimplementation of renewables from present times toprojected generation mix. It may be another ways toachieve similar (or even higher) contribution levels ofrenewable energies, with equal or less costs. However, themain purpose of SIGER is to outline a higher renewablepenetration scenario for 2050 while the definition of theoptimum way would require a more accurate analysis andmodelling.
In conclusion, the main objectives of SIGER project are:
�
To evaluate the maximum renewable contribution toSpanish electricity generation system. � To analyse the spatial distribution of the renewablesources.
� To detect and quantify the restrictions imposed bycurrent electricity transport network on the upper limitof renewables contribution, suggesting main desirablemodifications.
� To make an economical evaluation of generation systemimplementation with maximum renewables contribu-tion.
2.2. Technologies considered in the project
It is necessary to highlight that, in terms of technology; aconservative approach was adopted. Firstly, the besttechnology currently available was considered, rejectingany ‘learning by doing’ curve effect. Secondly, standardpower stations were chosen dismissing all possible optimi-zation processes and limiting energy consumption savingsand energy efficiency programs. Thirdly, the great potentialof electric connections with Northern Africa and the rest ofEurope was ignored. Last, current electric network wasconsidered instead of one network designed ex professo.
There is a need to remark that some renewabletechnologies are not included due to its low energypotential in Spanish mainland (such as Ocean ThermalEnergy Conversion or geothermal), its notable environ-mental impact or due to its low grade of development.Hybrid solar power plants are not included either: based onfossil fuels (cause of its incoherence with the aim of theproject) as much as biomass (although it is suggested toconsider this option in combination with CSP whentechnically and economically profitable).
Standard power stations have been defined within allpresent and future possibilities considering that this doesnot interfere in the prediction of maximum percentages ofrenewables contribution and because it is consistent withthe conservative philosophy of SIGER.
The generation technologies included in SIGER are asfollows:
�
Just existent hydroelectric big power stations wereconsidered while mini-hydraulic power stations haveseen extended its generation potential up to lowenvironmental impact.
� As CSP technology, it was chosen parabolic troughusing oil solution as a heat transfer fluid, with 6 h of heatstorage to supply energy to a Rankine cycle refrigeratedwith a solar mode operating tower. Three dimensionedplants were distinguished, depending on the directnormal irradiation of the location: 1500, 1750 and2000 kWh/m2yr. Solar chimneys were also included in apreliminary stage because of its high capacity factor(more than 80%). Nowadays, this technology is not atcommercial stage but there is already some plannedpower plants.
� Wind farms with 2MWe wind turbines. Data relatedwith quantity and spatial distribution of wind farms wastaken from already published studies (Ortega andBustos, 2003).
� Ranging from 1 to 10MWp interconnected photovoltaicpower plants.
� Concerning biomass use, direct combustion, biomassgasification and fast pyrolysis technologies have beenelected. Biomass contribution will be defined in terms ofresidual biomass and energy crops use viable in a 2050scenario.
� There are not power stations in Spain converting themechanical energy from waves into electricity, althoughsome projects are going on (Barcelona and Cantabria).However, given peninsular long coastline, assessingwave energy potential was thought as worthy. Datawas not available, so the analysis was done approxi-mately.
2.3. Methodology and GIS participation
The methodology followed is based in the calculation ofelectrical generation time series of every renewabletechnology, by means of dynamic simulations, takingtypical meteorological years (TMY) of prominent locationsin peninsular Spain with the purpose of sequencing theelectricity produced (according to the restrictions imposedby the electricity transport system).The different tasks defined in the project were:
�
T1: data gathering and scenarios checking. � T2: not available models preparation. � T3: dynamic energy simulation of every renewablesource in every feasible location.
� T4: analysis of renewable introduction sequence accord-ing to transport network capacity, as well as its spatialdistribution and technology mix to reach the higherpercentage of renewable contribution.
The GIS, with its array of functions, was considered apowerful and appropriate tool to contribute in the tasksmentioned above. In task 1, GIS was used to analysestarting data spatial distribution and to calculate the
ARTICLE IN PRESSJ. Domınguez Bravo et al. / Energy Policy 35 (2007) 4879–48924882
different potentials. In task 3 the time spatial distributionof electricity generation was calculated for each technologyas well as for each location and power plants were classifiedby the electricity cost they produced. Determination oftotal potential generation ceiling and renewable potentialgeneration ceiling was also needed to perform task 3.Finally, GIS application made possible to know thegeneration parameters (energy mix and plants location)to achieve maximum contribution of renewable energies,all included in task 4.
To conclude, it is important to remark that two reportswere presented with the results of the SIGER project, adetailed (Garcıa Casals et al., 2005b) and a summarizedone. Both of them included many maps obtained with GISthat contributed to the comprehension of the drawnconclusions.
3. Spatial analysis in the capacity ceilings determination for
each technology
In following lines main aspects from a GIS perspectiveare explained. Firstly, sources of geographical informationand criteria about land availability and environment issuesare described. Secondly, maximum power and generationceilings spatial distribution are explained.
3.1. Geographical and environmental considerations
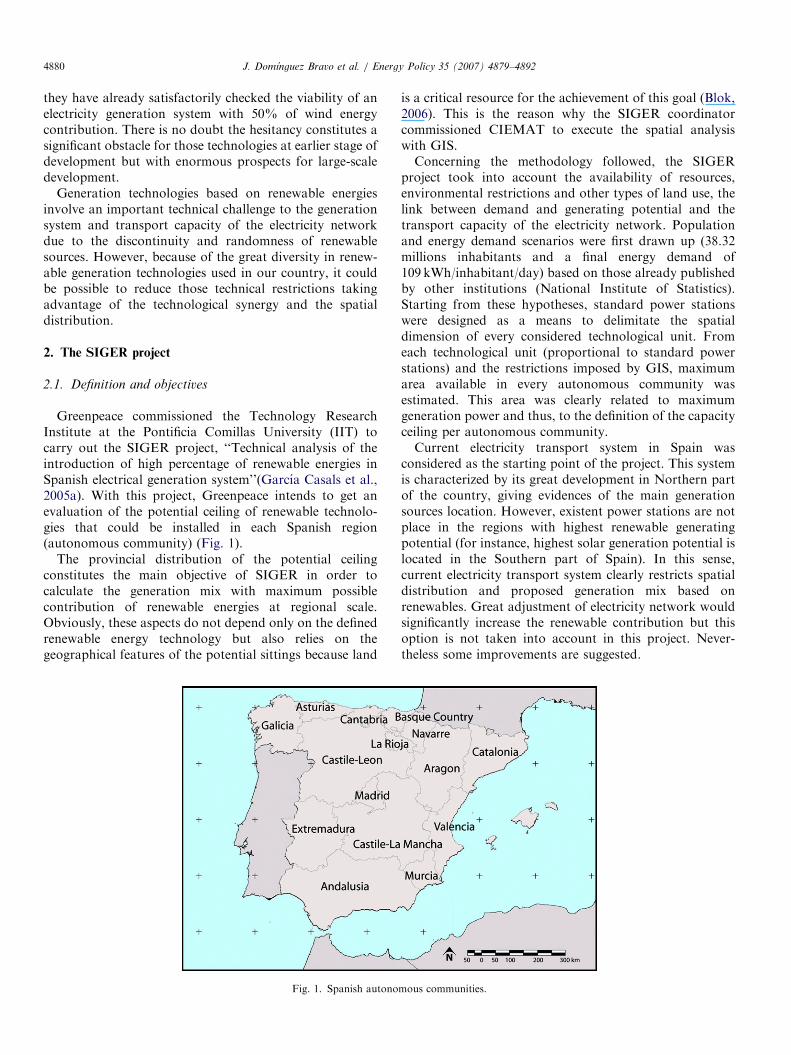
To assess the availability of land for each technologyaccording to land use, Corine Land Cover 2000 Database(CLC, available from http://dataservice.eea.europa.eu/da-taservice/) was analysed. It needs to be remarked that landuse classification, as CLC was defined at European scale, isnot fully adapted to Spanish diversity neither specificconditions of SIGER project. That is the reason why, inorder not to exclude categories straight away, some
Fig. 2. Spatial distribution of mean annual precipitation. So
percentage that could be used in particular cases wereassigned.One of the premises that rules the project is the
compatibility of land uses and renewable energies imple-mentation. Consequently, definition of compatible landuses and determination of which crops would be usefulfrom biomass perspective, were made carefully. As anexample, in the case of defining useful crops, it wasconsidered not to decrease its farming profitability and alsowhich could be its potential productivity based on currentuse and precipitation (Fig. 2).With the purpose of guarantying environmental compat-
ibility with capacity and generation ceilings evaluated inthe SIGER project, all areas with environmental protectionwere removed from the analysis at the preliminary stage.The excluded areas are as follows (Fig. 3):
�
urc
Natura 2000 Network: Special Protection Areas (SPAs)and Sites of Community Interest (SCIs). The consideredversion dates from January 2005 (required by and sentto EU).
� Zones associated with Protected Natural Areas (PNA),either declared or in the formal process of being declaredby the Spanish government and the AutonomousCommunities.
Environmental restrictions have resulted quite severe,excluding 28% of the peninsular Spain, and reaching morethan 40% of the total area of some Spanish AutonomousCommunities.
3.2. Maximum capacity and generation ceiling spatial
distribution
The most important contribution of GIS to SIGERproject was the calculation of generation ceilings for each
e of data: National Institute of Meteorology (INM).

ARTICLE IN PRESS
Fig. 3. Excluded areas due to environmental reasons. Source of data: Ministry of the Environment.
Table 1
Offshore wind energy constrains
Restrictions Deployment until
2010 2015 2020
Distance to shore 5–30km 5–40 km
Sea depth p30m p50m p100m
Extreme meteorological
conditions sites
NO NO
Possible sitting areas 7042km2 12,636 km2 33,340 km2
Capacity ceiling 56,336GW 101,088GW 26,672GW
Source: (Snodin, 2004).
J. Domınguez Bravo et al. / Energy Policy 35 (2007) 4879–4892 4883
renewable technology studied. Although all of them haveinterested particularities, some examples could give an ideaof the general way of processing the data.
3.2.1. Wind energy
In this case the installed capacity ceiling is clearly relatedto land availability to install wind farms and power densitychosen. With regard to the first concept, the calculation ismade using GIS analysis at province scale by imposingrestrictions in relation to land use compatibilities. In orderto choose the appropriate power density to install in aparticular site two criterion are used: (a) generatedelectricity cost, assessed by considering investment costsas well as operation and maintenance in every site; and (b)useful power density associated to a certain amount ofinstalled power, estimated by the product of installedpower and array performance that takes into account thewake effect (Milborrow, 1980).
In the project, three wind technologies were included:offshore, onshore applications in flat terrains and onshoreapplications in complex terrains. Each application isrelated to the use of particular wind turbines and resourceparameters. In order to determinate more precisely thewind characteristics, the terrain roughness, the scale andshape, parameters of Weibull distribution were set for eachsite (flat terrains: mean wind speed of 6.6m/s and shapeparameter of 1.5; complex terrains7 mean wind speed of8m/s and shape parameter of 2).
1. Offshore wind energy—To evaluate the offshore windpotential energy, the results published in Sea Wind EuropeReport (SWE) (Snodin, 2004) were used as a starting point.This report aimed to propose a development scenario to2020 but presents valuable information for SIGERparticular objectives since available land could be inferred.SWE employed GIS considering sea depth, distance to
shore, extreme meteorological conditions and incompatiblemarine uses (traffic zones, oil and gas platforms, pipelinesand cables). The main constrictions taken into accountand within bounding assumptions for scenarios to2010, 2015 and 2020 taken into account in mentionedreport, as well as GW installed assuming a medium-rangedeployment density of 8MW/km2 are illustrated in Table 1(at European level):Data provided by SWE were adapted to forecasted
demand for 2050 scenario. In order to allow a provincescale study, new parameters and constrains like naturalprotected areas were also included. According to theconclusions reached, 165MW could be installed based onoffshore wind energy and 334TWh/yr could be generated.Greater capacity power values are found in Asturias andCastellon, with more than 20GW, while energy generationrises above 10TWh/yr in Asturias, Castellon, Huelva andValencia.2. Onshore wind energy—It will be referred as flat terrain
applications those placed usually in grassy lands or dehesas(traditional Mediterranean silvopastoral system), based on2.05MWe turbines with 71m in diameter and hub height of

ARTICLE IN PRESSJ. Domınguez Bravo et al. / Energy Policy 35 (2007) 4879–48924884
70m. On the other hand, complex terrain applications willbe those installed in woodlands or higher superficialroughness, based on 0.81MWe turbines with 48m indiameter and hub height of 65m. In this case, smallermachines are required in order to be carried to remoteplaces.
The restrictions imposed in order to assess landavailability are as follows:
Fig.
Pub
4. P
lic W
1.
Criterion to distinguish between flat and complexterrains: � Flat terrain:(i) Mean slope less than 1%.
(ii) Surrounded by 10 km2 with slope less than 3%(to assure is an easy access place, so big windturbines can be carried there).� Complex terrain:
(i) Mean slope greater than 1% and less than 10%. (ii) No special requirements for surroundings.2.
Minimum area required for a wind farm installation.This area has been optimized by the consideration ofeffective power and electricity generated cost andestablishes the minimum geographical unit: � Flat terrain: 8 km2. � Complex terrain: 4 km2.3.
Land use restrictions: � Land uses described in 3.1 are considered unsui-table. � Following land uses, according to CLC nomencla-ture, are neither suitable:1.1. Urban fabric.
1.2. Industrial, commercial and transport units. 2.1.3. Rice fields. 3.1. Forests. 3.3.1. Beaches, dunes, sand plains. 3.3.2. Bare rocks.ossible site locations in case of complex terrain. Source of data: Natur
orks).
a 200
0 Ne3.3.3.2. Badlands and/or zones with erosion pro-cesses.
3.3.5. Glaciers and perpetual snows. 4.1. Inland wetlands. 5.1.1. Water courses. 5.1.2.1. Lakes and lagoons. 5.2.1. Coastal lagoons. 5.2.2. Estuaries.In Figs. 4 and 5 the locations that fulfil all restrictionsabove mentioned in the case of complex and flat terrains,respectively, are mapped.After imposing all referrer restrictions, the capacity
ceiling comes up to 313GW in case of flat terrains, and602GW in complex terrains, reaching a total amount of915GW. In order to be able to determine the electricitygeneration, capacity factors are needed and, therefore, it isnecessary to know the wind potential in every location.Once these data are included, an electricity generation ofnearly 2300TWhXyr is obtained. The greatest potential isin the two Castiles and Andalusia. The results show thegreat potential of onshore wind energy potential (816% ofpeninsular demand in 2050) although it will entail a highland occupation (56.64% of peninsular area). It must beconsidered that the low power density and wind turbineschosen would allow the coexistence with other land uses.This together with the high generation capacity obtainedmake possible a renewable generation mix which requiresonly a small fraction of the whole onshore potential.
3.2.2. Solar photovoltaic energy
Although it could be thought that solar photovoltaicenergy is not meant to play an important role because ofcosts and technology aspects, it can miss the relevantadvantages it can have in a high renewable penetration
twork (Ministry of the Environment) and CLC2000 (Ministry of

ARTICLE IN PRESS
Fig. 5. Possible site locations in case of flat terrain. Source of data: Natura 2000 Network (Ministry of the Environment) and CLC2000 (Ministry of Public
works).
J. Domınguez Bravo et al. / Energy Policy 35 (2007) 4879–4892 4885
scenario: decentralization, modularity, integration andappropriate technology.
Two solar technologies have been included in theanalysis: photovoltaic integrated into buildings and photo-voltaic with tracking. In the first case, published studieswere used to evaluate peninsular potential (Cueli et al.,2003) while GIS was employed with the second technologymentioned. The reason why both technologies wereevaluated separately is that there might be a significantportion of the population who will not be able to integratephotovoltaic modules in their buildings; secondly, becausesolar farms arise as the easiest way to integrate directparticipation from final users; and thirdly, because of thehigh competitiveness of CSP technologies in high latitudes,it would be recommended to include a certain participationof solar farms in these areas.
The criteria used to determine possible sitting areas forthis technology are as follows:
1.
Slope: � Gradient less than 3%: all aspects suitable. � Gradient between 3 and 10%: just SE to SWaspects suitable. � Gradient greater than 10%: unsuitable.2.
Land use restrictions. � According to CLC nomenclature, percentage isshown in brackets:1.1.2. Discontinuous urban fabric (5%).
1.2. Industrial, commercial and transport units(5%). 1.3. Mine, dump and construction sites (10%). 1.4. Artificial, non-agricultural vegetated areas(10%). 2.3. Pastures (30%). 2.4.2. Complex cultivation patterns (5%).2.4.3. Land principally occupied by agriculture(25%).
3.2.1. Natural grasslands (100%). 3.2.2.1. Moorlands and bushes (100%). 3.2.3.1. Big formations of dense or moderatelydense bush (25%). 3.2.3.2. Scarce bushes (100%). 3.2.4. Transitional woodland shrub (25%). 3.3.3.1. Subdesert Xerosteppe (100%). 3.3.3.3. High altitude spaces with scarce vegetation(100%). 3.3.4. Burnt areas (100%).� Additionally, percentage indicated next also suita-ble in case of low productivity non-irrigated lands(according to precipitation levels). Due to low biomassproductivity, solar power technology should be con-sidered an appropriate choice.
2.1.1. Non-irrigated arable land, precipitation lessthan or equals to 400mm/yr (50%).
2.1.1. Non-irrigated land with precipitation greaterthan 400 and less than 600mm/yr (25%).� Land uses described in 3.1 are considered unsui-table, as well as those which have not been mentionedformerly.
Fulfilling these restrictions, capacity ceiling for photo-
voltaic solar technology with tracking is 708.4GWp, whichimplies 18.5 kWp/inhabitant, for projected Spanish penin-sular population in 2050. The generation ceiling is1382.2 TWh/yr, which could meet 493.6% of projectedelectricity demand and 90.6% of total energy demand. Thedemanded area is about 8.82% of Spanish peninsularterritory.As it can be noticed, although all constrains, thepotential of this technology is really relevant.

ARTICLE IN PRESS
Table 2
Land use restrictions for CSP technologies
Land use (according to CLC
nomenclature)
Technology
Parabolic
trough
Solar
chimney
2.1.2.1. Irrigated herbaceous crops 5
2.1.2.2. Other irrigated lands 85
2.3. Pastures 30 60
2.4.3. Land principally occupied by
agriculture
35 45
3.2.1. Natural grasslands 50 100
3.2.2.1. Moorlands and bushes 85 100
3.2.3.1. Big formations of dense bushes 30 40
3.2.3.2. Scarce bushes 100 100
3.2.4. Transitional woodland shrub 30 30
3.3.3.1. Subdesert Xerosteppe 100 100
3.3.3.3 High altitude spaces with scarce
vegetation
100 100
J. Domınguez Bravo et al. / Energy Policy 35 (2007) 4879–48924886
With the exception of Asturias, Basque Country,Catalonia and Madrid, the rest of autonomous commu-nities could meet their own projected demand, reaching insome of them like both Castiles, Aragon and Extremadurareally superior values.
If those results are compared to photovoltaic integratedinto buildings ones, it can be noticed that there is a greatcomplementarity of both, cause autonomous communitieswith less photovoltaic solar with tracking potential, have ingeneral more buildings suitable to integrate photovoltaicmodules.
3.2.3. CSP
Two technologies are included in this section: parabolictrough and solar chimneys.
1. Parabolic trough technology—The criteria imposedduring GIS analysis are described next:
3.3.4. Burnt area 100 100
2.1.1. Non-irrigated arable land (400mm/ 50 50
1. yr)2.1.1. Non-irrigated arable land (400-
600mm/yr)
25 25
Slope:� Mean slope gradient less than 2% (surrounded by
4 km2 with slope gradient less than 3%): all slopeaspects suitable.� Mean slope gradient between 2% and 7% (sur-
rounded by 4 km2 with slope gradient less than 8%):just SE to SW aspects suitable.� Mean slope gradient greater than 7%: unsuitable
(taking in consideration that this correspond tocomplex lands, non possible sitting areas for50MW power station allocation. However, in suita-ble aspects smaller stations installation could bepossible).
2.
Land use restrictions.� According to CLC nomenclature, percentage shownin Table 2 (in brackets).� Additionally, percentage indicated is also suitable in
case of low productivity non-irrigated lands (accord-ing to precipitation levels) (Table 2).� Land uses described in 3.1 are considered unsuitable,
as well as those which have not been mentionedformerly.
The results of the analysis conclude with a capacityceiling of 2739GW and a generation ceiling of 9897TWh/yr, which represents 3534% of projected electricity demandby 2050. These high values confirm the enormous role to beplayed by CSP technology in Spain in terms of electricitygeneration capacity since it is much higher than needed.Fully implementation of this potential ceiling wouldrequire occupying 13.26% of peninsular territory. Fig. 6illustrates possible sitting areas according to land use.
2. Solar chimney—Solar chimney, the other CSPtechnology considered, consists of a large, flat solarcollector which, like a greenhouse, turns all the solar directand diffuse radiation into heat energy. Some of this energyis stored in the ground and used in the hours withoutradiation while the rest of the energy heats the air up and,by natural convection flows towards the middle of the
collector, where a very tall chimney is placed, activating aturbine allocated inside the chimney to generate electricity.The criteria established in order to predict suitable areas
for this technology are:
1.
Minimum area required for a solar chimney powerstation installation: 4 km2.2.
Slope:� Mean slope gradient less than 2%: all slope aspectssuitable.� Mean slope gradient between 2 and 7%: just SE to
SW aspects suitable.� Mean slope gradient greater than 7%: unsuitable.
3.
Land use restrictions.� According to CLC nomenclature, percentage shownin Table 2 (in brackets).� Additionally, percentage indicated also suitable in
case of low productivity non-irrigated lands (accord-ing to precipitation levels) (Table 2).� Land uses described in 3.1 are considered unsuitable,
as well as those which have not been mentionedformerly.
GIS analysis has shown possible sitting areas illustratedin Fig. 7. Based on land availability and standardtechnological parameters, it was calculated a capacityceiling of solar chimney technology of 324.3GW and ageneration ceiling of 836.2 TWh/yr, occupying 14.6% ofpeninsular territory. Great majority of Spanish autono-mous communities (with the exception of Basque Country,Catalonia and Madrid) could meet electricity demandprojected for 2050 (in lack of time analysis and transportcapacity of electricity network).

ARTICLE IN PRESS
Fig. 6. Possible site locations for parabolic trough technology. Source of data: CLC2000 (Ministry of Development) and National Institute of
Meteorology.
Fig. 7. Possible site locations for solar chimney technology. Source of data: CLC2000 (Ministry of Public Works) and National Institute of Meteorology.
J. Domınguez Bravo et al. / Energy Policy 35 (2007) 4879–4892 4887
3.2.4. Biomass
The main advantage of a renewable generation mix withelevated biomass contribution relays on biomass highcapacity factor and also its capacity to control the generalelectricity generation system using chemical energy storedinternally. In fact, lacking of a most effective energeticvector, renewable generation mix would need a reductionof capacity factor as the way to be controlled, whichimplies a LEC (equivalent electrification cost) increased ofthe outcome.
The biomass use for the determination of capacity ceilingdescribed next is more ambitious than the ones used up tonow. Other studies have considered just the use of organic
waste (from forestry, agricultural or stock rearing) andenergy crops in arable lands. In our case, options are widenby assessing the potential of energy crops in non-irrigatedlands, fast turn-over forest crops and scrub. As a result, thecapacity ceiling with this technology is higher than othersshowed formerly, though hard environmental restrictionsthat have been imposed.However, it must be taken into consideration that with
regard to other renewable technologies, power biomassdensity is noticeable inferior and keeps on decreasing asless productive biomass resources are used, like non-irrigated lands or scrubs. In these cases, biomass usecompetes against solar technologies and probably the last
ARTICLE IN PRESSJ. Domınguez Bravo et al. / Energy Policy 35 (2007) 4879–48924888
will win due to its power density. In order to avoidcompetition for land use with other technologies, it issuggested the development of biomass technologies issloping sites.
The biomass technologies included in SIGER projectare: organic waste, co-generation, energy crops, fast turn-over forest crops and scrub, but just the last three havebeen treated by GIS tools.
Energy crops—Apart from energy crops included in thePlan to Promote Renewable Energy (PFER, Ministry ofIndustry and Energy) (IDAE, 1999), energy crops in non-irrigated land were also included. The reason has beenalready mentioned: in a renewable generation mix, a highbiomass contribution on one hand allows controlling thesystem and, on the other makes this technology morecompetitive.
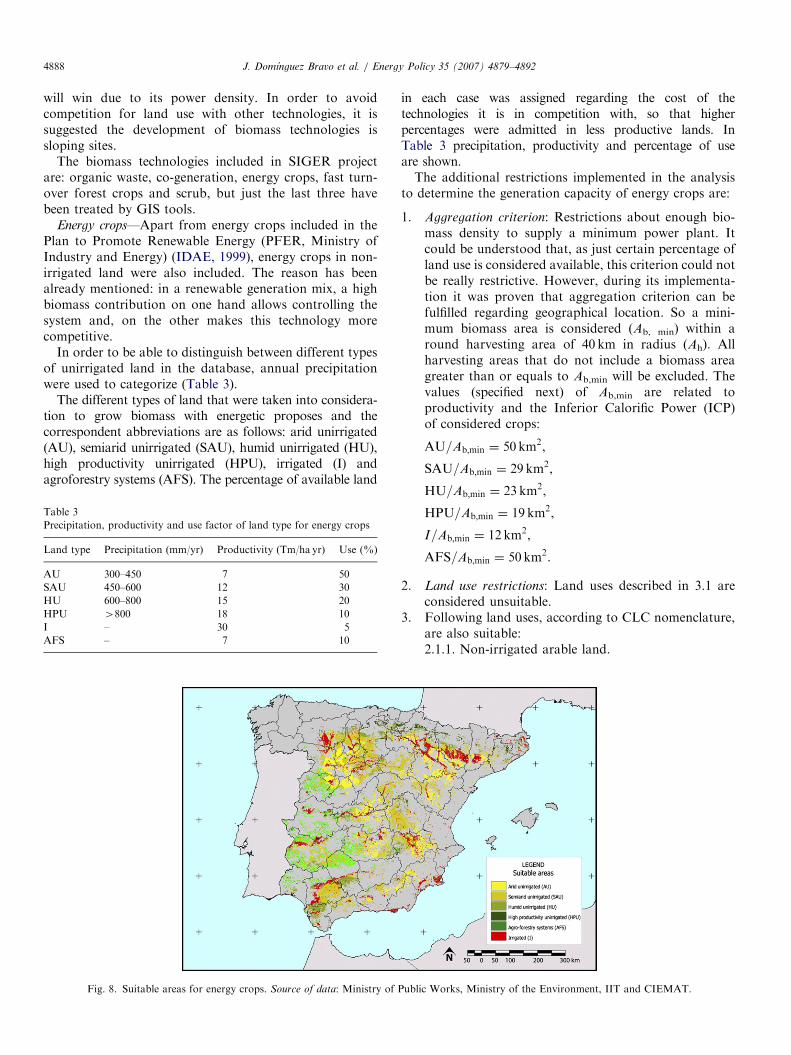
In order to be able to distinguish between different typesof unirrigated land in the database, annual precipitationwere used to categorize (Table 3).
The different types of land that were taken into considera-tion to grow biomass with energetic proposes and thecorrespondent abbreviations are as follows: arid unirrigated(AU), semiarid unirrigated (SAU), humid unirrigated (HU),high productivity unirrigated (HPU), irrigated (I) andagroforestry systems (AFS). The percentage of available land
Table 3
Precipitation, productivity and use factor of land type for energy crops
Land type Precipitation (mm/yr) Productivity (Tm/ha yr) Use (%)
AU 300–450 7 50
SAU 450–600 12 30
HU 600–800 15 20
HPU 4800 18 10
I – 30 5
AFS – 7 10
Fig. 8. Suitable areas for energy crops. Source of data: Ministry of P
in each case was assigned regarding the cost of thetechnologies it is in competition with, so that higherpercentages were admitted in less productive lands. InTable 3 precipitation, productivity and percentage of useare shown.The additional restrictions implemented in the analysis
to determine the generation capacity of energy crops are:
ubli
1.
Aggregation criterion: Restrictions about enough bio-mass density to supply a minimum power plant. Itcould be understood that, as just certain percentage ofland use is considered available, this criterion could notbe really restrictive. However, during its implementa-tion it was proven that aggregation criterion can befulfilled regarding geographical location. So a mini-mum biomass area is considered (Ab, min) within around harvesting area of 40 km in radius (Ah). Allharvesting areas that do not include a biomass areagreater than or equals to Ab,min will be excluded. Thevalues (specified next) of Ab,min are related toproductivity and the Inferior Calorific Power (ICP)of considered crops:AU=Ab;min ¼ 50 km2,
SAU=Ab;min ¼ 29 km2,
HU=Ab;min ¼ 23 km2,
HPU=Ab;min ¼ 19 km2,
I=Ab;min ¼ 12 km2,
AFS=Ab;min ¼ 50 km2.
2.
Land use restrictions: Land uses described in 3.1 areconsidered unsuitable.3.
Following land uses, according to CLC nomenclature,are also suitable: 2.1.1. Non-irrigated arable land.c Works, Ministry of the Environment, IIT and CIEMAT.
ARTICLE IN PRESSJ. Domınguez Bravo et al. / Energy Policy 35 (2007) 4879–4892 4889
Tabl
Prec
Grou
FTF
FTF
F
2.1.2. Permanently irrigated land.
2.4.4. Agro-forestry areas.In Fig. 8 available sites before applying percentages ofuse are shown. Once these percentages are applied, theenergy crops capacity ceiling is 4.73GW, requiring 6.34%of peninsular area, which would generate 35.22 TWh/yr(12.6% of 2050 peninsular electricity demand). As it can beseen in Fig. 8, the greater potentials are in both Castiles.Castile-Leon could use energy crops to generate 58.9% ofits projected demand for 2050. The figure goes up to 60.7%in the case of Castile-La Mancha.
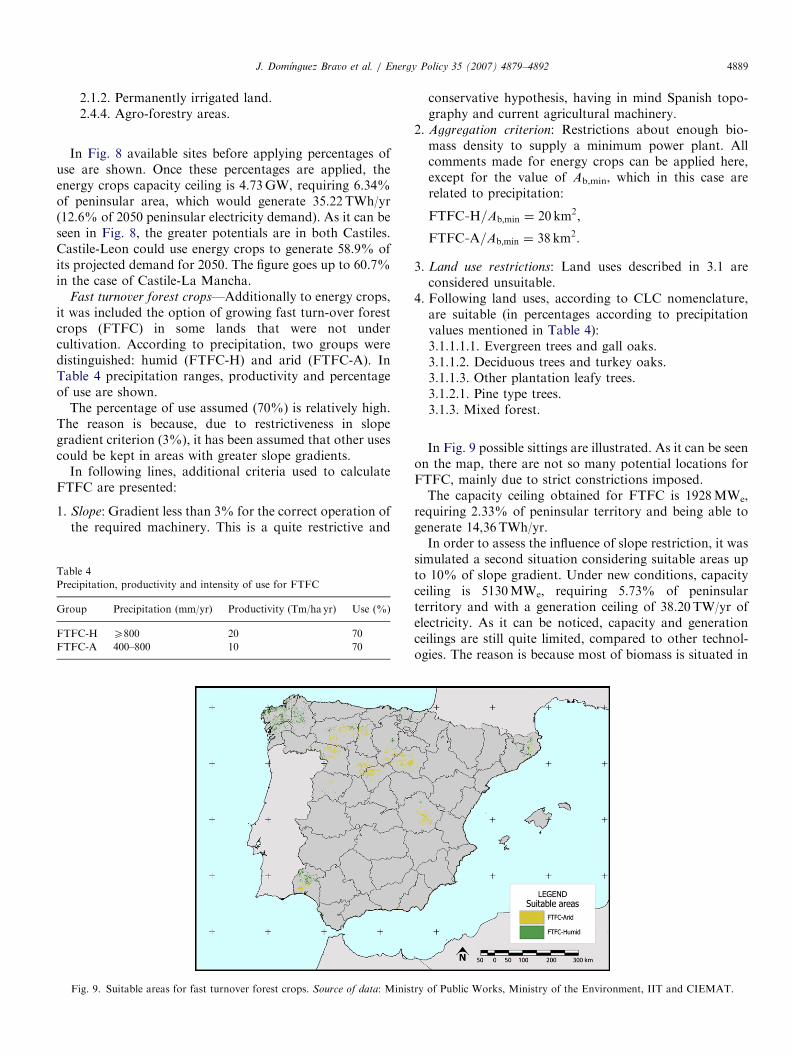
Fast turnover forest crops—Additionally to energy crops,it was included the option of growing fast turn-over forestcrops (FTFC) in some lands that were not undercultivation. According to precipitation, two groups weredistinguished: humid (FTFC-H) and arid (FTFC-A). InTable 4 precipitation ranges, productivity and percentageof use are shown.
The percentage of use assumed (70%) is relatively high.The reason is because, due to restrictiveness in slopegradient criterion (3%), it has been assumed that other usescould be kept in areas with greater slope gradients.
In following lines, additional criteria used to calculateFTFC are presented:
1.
Slope: Gradient less than 3% for the correct operation ofthe required machinery. This is a quite restrictive ande 4
ipitation, productivity and intensity of use for FTFC
p Precipitation (mm/yr) Productivity (Tm/ha yr) Use (%)
C-H X800 20 70
C-A 400–800 10 70
ig. 9. Suitable areas for fast turnover forest crops. Source of data: Ministry
conservative hypothesis, having in mind Spanish topo-graphy and current agricultural machinery.
2.
Aggregation criterion: Restrictions about enough bio-mass density to supply a minimum power plant. Allcomments made for energy crops can be applied here,except for the value of Ab,min, which in this case arerelated to precipitation:FTFC�H=Ab;min ¼ 20 km2,
FTFC�A=Ab;min ¼ 38 km2.
3.
Land use restrictions: Land uses described in 3.1 areconsidered unsuitable.4.
Following land uses, according to CLC nomenclature,are suitable (in percentages according to precipitationvalues mentioned in Table 4): 3.1.1.1.1. Evergreen trees and gall oaks. 3.1.1.2. Deciduous trees and turkey oaks. 3.1.1.3. Other plantation leafy trees. 3.1.2.1. Pine type trees. 3.1.3. Mixed forest.In Fig. 9 possible sittings are illustrated. As it can be seenon the map, there are not so many potential locations forFTFC, mainly due to strict constrictions imposed.The capacity ceiling obtained for FTFC is 1928MWe,
requiring 2.33% of peninsular territory and being able togenerate 14,36 TWh/yr.In order to assess the influence of slope restriction, it was
simulated a second situation considering suitable areas upto 10% of slope gradient. Under new conditions, capacityceiling is 5130MWe, requiring 5.73% of peninsularterritory and with a generation ceiling of 38.20 TW/yr ofelectricity. As it can be noticed, capacity and generationceilings are still quite limited, compared to other technol-ogies. The reason is because most of biomass is situated in
of Public Works, Ministry of the Environment, IIT and CIEMAT.

ARTICLE IN PRESSJ. Domınguez Bravo et al. / Energy Policy 35 (2007) 4879–48924890
areas with higher gradients and/or natural protected areasand secondly, because biomass power density is definitelylower than other renewable technologies.
Scrub—As it was mentioned before, the possibility ofincluding the potential of scrub constitutes and innovationof SIGER project, in view of formerly published studies. Itwas considered that Spain has a great energy biomasspotential on those areas which are not under use currently.Then, biomass technologies would not compete with otherland uses and, appropriately planned, would play as animportant mainstay regulating a renewable generation mix.
In order to evaluate the scrub potential, a linealdependence on precipitation levels was established. Ingeneral, pruning is suggested to be done once a year soannual productivity would be slightly lower than energycrops productivity. The considered scrub productivitieswere 2Tm/Ha/yr in 350mm/yr locations and up to 10Tm/Ha/yr in 2000mm/yr locations. Locations under 400mm/
Fig. 10. Minimum exploitation area and maximum power density
expected in case of scrub use.
Fig. 11. Suitable areas for scrub use (maximum slope gradient 3%). Source o
CIEMAT.
yr were not included because its low productivity andpossible impacts in woody plants are growing.Other used criteria are as follows:
f da
1.
Aggregation criterion: A minimum biomass area isconsidered (Ab, min) within a round harvesting area of40 km in radius (Ah). All harvesting areas that do notinclude a biomass area greater than or equals to Ab,minwill be excluded. The Ab,min value is function of itsproductivity.
2.
Slope: Gradient less than 4% for the correct operationof the required machinery. As mentioned in FTFCcase, this is a quite restrictive and conservativehypothesis, and it could be hoped that in 2050machinery would be able to operate in higher gradients.3.
Land use restrictions: Land uses described in 3.1 areconsidered unsuitable.4.
Following land uses, according to CLC nomenclature,are suitable (in percentages according to precipitationvalues before mentioned): 3.2.2.1. Moorlands and bushes. 3.2.3.1. Dense bushes. 3.2.4. Transitional woodland shrub.The relation between minimum area required imple-menting scrub exploitation and maximum power densityexpected against precipitation is shown in Fig. 10. Theeffective power density in a particular exploitation will be abit lower because the scarcity or the resource. Once more, itshould be remarked that the low density of this sourcecompares to other renewable resources. Scrub technologymight compete with other technologies, such as CSP andphotovoltaic, due to this disadvantage.In Fig. 11, geographical situation of potential locations
is shown. The availability is again quite low due to hard
ta: Ministry of Public Works, Ministry of the Environment, IIT and
ARTICLE IN PRESS
Table 6
Comparison between the capacity ceilings calculated and the target set by
the Renewable Energies Plan for Spain 2005–2010 (MW)
J. Domınguez Bravo et al. / Energy Policy 35 (2007) 4879–4892 4891
restrictions. The estimate for capacity ceiling is 1260MWe,requiring 5.42% of peninsular territory and with thecapacity of generating 9.38 TWh/yr of electricity (Fig. 11).
REP (2010) Capacity ceiling (2050)
Concentrated solar power 500 2738800
Solar PV 400 1202900
Wind 20155 1079900
Solar chimney 0 324300
Waves 0 84400
Total biomass 2.274 19400
Hydroelectric 18977 18800
Hot dry rock geothermal 0 2500
Solid urban wastea 189 0
Total 42495 5471000
Source: (IDAE, 2005).aGreenpeace does not consider the incineration of solid urban waste as
renewable energy.
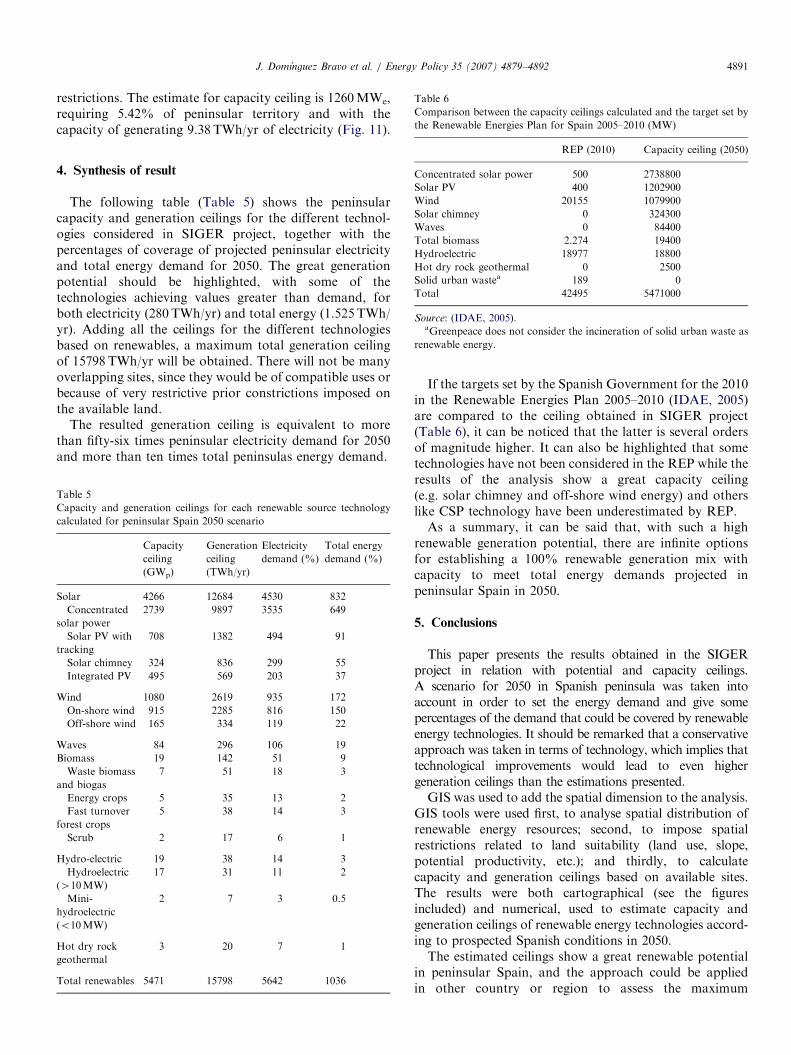
4. Synthesis of result
The following table (Table 5) shows the peninsularcapacity and generation ceilings for the different technol-ogies considered in SIGER project, together with thepercentages of coverage of projected peninsular electricityand total energy demand for 2050. The great generationpotential should be highlighted, with some of thetechnologies achieving values greater than demand, forboth electricity (280TWh/yr) and total energy (1.525TWh/yr). Adding all the ceilings for the different technologiesbased on renewables, a maximum total generation ceilingof 15798TWh/yr will be obtained. There will not be manyoverlapping sites, since they would be of compatible uses orbecause of very restrictive prior constrictions imposed onthe available land.
The resulted generation ceiling is equivalent to morethan fifty-six times peninsular electricity demand for 2050and more than ten times total peninsulas energy demand.
Table 5
Capacity and generation ceilings for each renewable source technology
calculated for peninsular Spain 2050 scenario
Capacity
ceiling
(GWp)
Generation
ceiling
(TWh/yr)
Electricity
demand (%)
Total energy
demand (%)
Solar 4266 12684 4530 832
Concentrated
solar power
2739 9897 3535 649
Solar PV with
tracking
708 1382 494 91
Solar chimney 324 836 299 55
Integrated PV 495 569 203 37
Wind 1080 2619 935 172
On-shore wind 915 2285 816 150
Off-shore wind 165 334 119 22
Waves 84 296 106 19
Biomass 19 142 51 9
Waste biomass
and biogas
7 51 18 3
Energy crops 5 35 13 2
Fast turnover
forest crops
5 38 14 3
Scrub 2 17 6 1
Hydro-electric 19 38 14 3
Hydroelectric
(410MW)
17 31 11 2
Mini-
hydroelectric
(o10MW)
2 7 3 0.5
Hot dry rock
geothermal
3 20 7 1
Total renewables 5471 15798 5642 1036
If the targets set by the Spanish Government for the 2010in the Renewable Energies Plan 2005–2010 (IDAE, 2005)are compared to the ceiling obtained in SIGER project(Table 6), it can be noticed that the latter is several ordersof magnitude higher. It can also be highlighted that sometechnologies have not been considered in the REP while theresults of the analysis show a great capacity ceiling(e.g. solar chimney and off-shore wind energy) and otherslike CSP technology have been underestimated by REP.As a summary, it can be said that, with such a high
renewable generation potential, there are infinite optionsfor establishing a 100% renewable generation mix withcapacity to meet total energy demands projected inpeninsular Spain in 2050.
5. Conclusions
This paper presents the results obtained in the SIGERproject in relation with potential and capacity ceilings.A scenario for 2050 in Spanish peninsula was taken intoaccount in order to set the energy demand and give somepercentages of the demand that could be covered by renewableenergy technologies. It should be remarked that a conservativeapproach was taken in terms of technology, which implies thattechnological improvements would lead to even highergeneration ceilings than the estimations presented.GIS was used to add the spatial dimension to the analysis.
GIS tools were used first, to analyse spatial distribution ofrenewable energy resources; second, to impose spatialrestrictions related to land suitability (land use, slope,potential productivity, etc.); and thirdly, to calculatecapacity and generation ceilings based on available sites.The results were both cartographical (see the figuresincluded) and numerical, used to estimate capacity andgeneration ceilings of renewable energy technologies accord-ing to prospected Spanish conditions in 2050.The estimated ceilings show a great renewable potential
in peninsular Spain, and the approach could be appliedin other country or region to assess the maximum

ARTICLE IN PRESSJ. Domınguez Bravo et al. / Energy Policy 35 (2007) 4879–48924892
contribution that renewable energy sources could have in amore sustainable generation mix. This type of studieswould help not only supporters of increasing renewableenergies participation in national generation mixes, butalso governments to set development targets more adaptedto renewables potential. In the case of Spanish peninsular,a 100% renewable generation mix would be viable to meettotal energy demands projected for 2050.
References
Blok, K., 2006. Renewable energy policies in the European Union. Energy
Policy 34, 251–255.
Cueli, A.B., Alonso, M.C., Chenlo, F., 2003. Potencial fotovoltaico en
edificios de viviendas por comunidades autonomas. Era Solar, 42–49.
Garcıa Casals, X., Domınguez Bravo, J., et al., 2005a. Proyecto SIGER:
Analisis Tecnico de la Introduccion de un Elevado Porcentaje de
Energıas Renovables en el sistema de Generacion Electrica Espanol.
UPCO, IIT.
Garcıa Casals, X., Domınguez Bravo, J., et al., 2005b. Renovables 2050.
Un informe sobre el potencial de las energıas renovables en la Espana
Peninsular. P. 261.
IDAE, 1999. Plan de Fomento de las Energıas Renovables en Espana,
Ministerio de Industria y Energıa, Madrid.
IDAE, 2005. Plan de Energıas Renovables en Espana 2005–2010,
Ministerio de Industria y Energıa, Madrid.
Milborrow, D.J., 1980. The performance of arrays of wind turbines.
Journal of Industrial Aerodynamics 5, 403–430.
Ortega, J.L.G., Bustos, M., 2003. Viento Fuerza 12- Una propuesta para
obtener el 12% de la electricidad mundial con energıa eolica en 2020.
European Wind Energy Association.
Snodin, H., 2004. Sea Wind Europe. Greenpeace.