ar1920.pdf - Alaska Division of Geological & Geophysical ...
Upload
independentCategory
view
0download
0
IOSR Journal of VLSI and Signal Processing (IOSR-JVSP)
Volume 4, Issue 3, Ver. I (May-Jun. 2014), PP 64-83
e-ISSN: 2319 – 4200, p-ISSN No. : 2319 – 4197
www.iosrjournals.org
www.iosrjournals.org 64 | Page
Geophysical Investigation of Shallow Subsurface Fracture
Distribution in Parts of the Eastern Basement Complex of Nigeria
George, A. Michael1, Okwueze, E. E
1, and Abong, A. Agwul
2
1 Department of Physics University of Calabar-Nigeria
2 Department of Physics Cross River University of Technology, Calabar-Nigeria
Abstract: Very low frequency electromagnetic method was carried out at twenty three (23) locations within
Parts of the Eastern Basement Complex of Nigeria. The field data were collected using ABEM Wadi VLF (very
low frequency) electromagnetic instrument with other accessories. A transmitter located at Cutler, Maine USA,
designated as NAA with 24.0 KHz frequency and 1000Kw transmission power was used throughout the data
collection exercise. The profiles were of lengths between 120m and 650m. The station interval along each
profile was 5m with profile lines oriented in N–S, and E–W directions. Data were analyzed using KHFFILT
software. The results of the study showed that majority of the fractures were oriented in the NE – SW direction,
followed by fractures oriented in the NW – SE direction indicating that the study area is well fractured and has
good potentials for ground water.
Key word: ABEM Wadi, Basement, fracture, groundwater, Very low frequency.
I. Introduction
The shortage of portable water supply in most parts of the crystalline bedrock environments of
Southeastern Nigeria has attracted the attention of not only the researchers but also the general public. This
shortage is due to collapse of many public water systems in most communities, and increasing demand resulting
from increase in agricultural activities in these communities. Borehole yield is generally low in the eastern
basement complex where this research is carried out. Due to this low yield, during dry season, water supplies
from boreholes do not have long-term sustainability, so it is imperative to locate boreholes within the fractured
and/or faulted basement rocks that are ubiquitous in this area. Detecting the location of these structures is often
difficult if the appropriate geophysical methods are not used, consequently most boreholes drilled in these areas
are either unproductive or sometimes have low yield.
Surface geophysical methods are the most rapid, inexpensive and widely used methods in geophysical
surveys. Direct current resistivity method has been used by many researchers [11], [4] and has been proven
successful on depth estimation, ground water potential and in hydrogeological estimation. The imaging
technique is particularly powerful and useful in the study of areas of complex geology, in groundwater problems
and in many other shallow subsurface investigations [3].
Research has shown that suitably sited boreholes that penetrate fracture zones have sustainable high
productivity [15]; [10]; [9]; [13]. Resistivity surveys are also commonly used to map fracture zones in hard rock
terrain [1] and [2] because high resistivity contrasts usually occur between solid rocks and saturated fracture
zones. It has also been revealed that the success of borehole siting in this kind of environment depends on the
borehole intersecting some fracture zone in the bedrock. Once the bedrock is covered by any thickness of
weathering, the fracture zone may be difficult to find, in which case geophysics provides the solution to the
problem [8].
1.1 Location and Geology of Study Area
The study area is situated within the Oban Massif located between latitudes 5o00
' and 50
o50
' N and
longitudes 8o00
' E and 8
o50
' E. Specifically, the study area lies between latitudes 5
o15
'N and 5
o27.5
'N and
longitudes 8o15
'E and 8
o25
'E (Fig.1). It covers an area of 198.125sq.km. The study area lies within the tropical
rain forest of Nigeria with two distinct seasons: wet season, which is between March and October and dry
season which starts in November and ends in March. The mean temperature in the study area is about 300C with
a mean annual rainfall of about 2300mm with annual daily relative humidity and evaporation of 80% and 3.85
mm/day respectively [14].
Geologically, Oban Massif is a Precambrian basement complex located in Southeastern Nigeria
surrounded by cretaceous and young sedimentary rocks. Lithologically, three major rock groups are recognized
in this region and are migmatitic and sheared gneissic rocks, older granite intrusive and unmetamorphosed
dolerite to microdolerite intrusive (Fig.2).

Geophysical Investigation of Shallow Subsurface Fracture Distribution in Parts of the …
www.iosrjournals.org 65 | Page
The Oban Massif is made up of two main sectors namely, the western sector (topographically sub-dued
with population density) and the eastern sector (topographically rugged country with peaks forested up to
summits and sparse human settlements [5]. The Oban massif is underlain by highly deformed Precambrian
crystalline rocks, mainlygranites, gneisses and schist. These rocks exhibit varying degrees of weathering across
the massif. They are intruded by pegmatite, granodiorites, diorites, tonolites, monzonites, charnokites and
dolerites [7]. The Oban Massif has a complex lithology and the differentiation of the rock types is difficult. One
of the difficulties is due to the location of Oban Massif which is in the thick equatorial rainforest inhibited by
wildlife. More so, rock outcrops in the area are generally intensely weathered thus making it difficult to see
fresh rock for geological studies [6]. In terms of the rock ages, the oldest is the banded gneisses while diorite is
the youngest rock in the Oban Massif.

Geophysical Investigation of Shallow Subsurface Fracture Distribution in Parts of the …
www.iosrjournals.org 66 | Page
II. Materials and method A total of twenty-three (23) profile lines were covered scattered throughout the surveyed area using
ABEM Wadi VLF instrument with other accessories. A transmitter located at Cutler, Maine USA, designated as
NAA with 24.0 KHz frequency and 1000Kw transmission power was used throughout the data collection
exercise. The profiles were of lengths between 120m and 650m. The station interval along each profile was 5m
with profile lines oriented in N – S, and E – W directions respectively. The location of each profile line is as
shown is Fig. 3.
Along each profile, measurements were made for in-phase and quadrature values respectively, but the
in-phase data was used for the interpretation as prescribed by the software used for the interpretation. The
profiles are denoted as VLF 01 to VLF 23
III. Data analysis VLF (very low frequency) datawere analyzed and processed by plotting the percentage in-phase (real)
component data against the sample point distances for both the raw field measured data and the filtered data
using KHFFILT software. The KHFFILT program was also used to perform Karous-Hjelt and Fraser filtering
on the field data. Lower values of relative current density correspond to higher values of resistivity and low
conductivity while higher values of relative current density correspond to lower values of resistivity and high
conductivity. The conductive targets were denoted with positive Fraser and Karous-Hjelt anomalies. The
European convention of using red color for conductive (hot) targets was employed in the pseudo section plot
[12].
IV. Results and discussion Interpretation of the data along these VLF traverses indicates both positive and negative Fraser and
Karous-Hjelt anomalies an indication of a probable fracture zones along each of the traverses. For each sample
point, a plot of the raw field data, the Fraser filtered data and the Karous-Hjelt plots are displayed. At location
VLF01, both the raw in-phase and the filtered data were plotted (Fig. 4 and Fig. 5). Positive Fraser filter
responses were observed between 10 – 30m and between 50 – 70m along the traverse (Fig. 5). These correspond
to probable fracture zones of depth between 0 – 20m and 0 – 25m oriented in the NW – SE and N – S directions
respectively (Fig. 6).

Geophysical Investigation of Shallow Subsurface Fracture Distribution in Parts of the …
www.iosrjournals.org 67 | Page

Geophysical Investigation of Shallow Subsurface Fracture Distribution in Parts of the …
www.iosrjournals.org 68 | Page
At location VLF 02, both raw field VLF data (Fig.7) and filtered VLF data (Fig.8) were plotted.
Prominent positive Fraser filter response was observed from the plot (Fig.18) between 50 – 80m, 230 – 260m,
270 – 300m and 340 – 360m respectively. These correspond to a probable fracture zone at a depth extending
from 0- 25m oriented NW – SE and another of depth extending from zero to over 65m oriented at NE – SW
direction (Fig.9).
The raw VLF data Figure 10 and filtered VLF data (Fig.11) collected at location VLF 03 were plotted
and three fracture zones with positive Fraser filter response was identified (Fig.12). These zones are located at a
horizontal distance of between 80 – 120m, 250 – 300m and 350 – 400m along the traverse. These correspond to
a probable fracture zones at a depth of between 0 – 40m, 0 – 80m and 0 – 60m respectively. These zones were
oriented at E – W and NW – SE respectively (Fig.12).

Geophysical Investigation of Shallow Subsurface Fracture Distribution in Parts of the …
www.iosrjournals.org 69 | Page
At location VLF 04, Fig. 13 shows a plot of the raw VLF data, many positive Fraser filter responses
were noticed along the traverse. Two of which were prominent and were located between 100 – 120m and
350 – 370m ( Fig.14), giving rise to probable fracture zones at depth extending from 0 – 60m and 0 – 80m
respectively. These fracture zones (Fig.15) were oriented at NW – SE and NE – SW direction respectively.

Geophysical Investigation of Shallow Subsurface Fracture Distribution in Parts of the …
www.iosrjournals.org 70 | Page
At location VLF 05, (Fig.16) shows a plot of the raw field data while (Fig.17) shows a plot of the
filtered VLF data, five (5) probable fracture zones were identified with one highly conductive. They were
located between
25 – 50m, 75–100m, 125 – 145m, 200 – 225m and 265 – 285m respectively. The depth to each
fracture zones was between 0 – 25m, 0 – 30m, 0 – 45m, 0 – 50m and 0 – 20m respectively. Their orientations
were NW – SE, NE – SW, NE – SW, NE – SW and NE – SW respectively (Fig.18).
The result of VLF data collected at location VLF 06 (Fig. 20) and (Fig. 21) shows four (4) positive
Fraser filter responses along the horizontal position between 50 –75m, 95–125m, 145–155m and 175– 225m
respectively. These correspond to a probable co-joint fracture zone at a depth extending from zero to 60m
oriented at NE – SW direction as shown in (Fig.31).

Geophysical Investigation of Shallow Subsurface Fracture Distribution in Parts of the …
www.iosrjournals.org 71 | Page
Fig. 22 and Fig. 23 show a plot of both raw and filtered VLF response against distance at location VLF
07. The plot shows two (2) prominent Positive Fraser filter responds between 10 – 40m and 50 - 75m .These
correspond to probable fracture zones located between10 – 75m along the horizontal axis at a depth extending
from 0 – 40m from the surface and oriented at NW – SE direction as shown in (Fig.24).

Geophysical Investigation of Shallow Subsurface Fracture Distribution in Parts of the …
www.iosrjournals.org 72 | Page
At location VLF 08, both raw VLF data Figure 25 and filtered data Figure 26 were plotted. Positive
Fraser filter responses were observed between 12 – 34m, 50 – 78m and 90 – 115m along the traverse Figure 26.
These give rise to probable fracture zones located between 20 – 25m, 56 – 70m, and 105 – 115m respectively
with an orientation of E – W direction Figure 27. They zones are at a depth of 0 – 10m, 10 – over 20m and
0 – 10m respectively.
At location VLF 09, both raw VLF data (Fig. 28) and filtered VLF data (Fig. 29) were plotted. Seven
positive Fraser filter responses were observed (Fig. 29), located between 10 – 35m, 60 – 80m, 95 – 105m,
115 – 130m, 155 – 175m, 200 – 220m and 250 – 265m respectively. The corresponding probable fracture
zones were located between 10 – 35m, 50 – 105m, 155 – 200m, 200 – 215 and 240 – 275m oriented at N – S,
(multiple fracture with orientation NW – SE, NE – SW, NE – SW), NW – SE, NW – SE and NW – SE
direction respectively. These zones were at a depth extending from 0- 20m, 0 – 45m,0 – 40m, 0 – 30m and
0 – 20m respectively (Fig 30).

Geophysical Investigation of Shallow Subsurface Fracture Distribution in Parts of the …
www.iosrjournals.org 73 | Page
At location VLF 10, raw field VLF data (Fig.31) and filtered data (Fig.32) were plotted. Three (3)
prominent positive Fraser responses were observed (Fig. 32) located between 110 – 200m, 275 – 300m and
325 – 360m respectively. These give rise to probable fracture zones located between 125 – 200m, 275 – 300m
and 350 – 370m oriented NW – SE, NE – SW and N – S direction respectively. They were at a depth extending
from 0 – over 60m, 0 – 20m and 0 – 10m respectively (Fig 33).

Geophysical Investigation of Shallow Subsurface Fracture Distribution in Parts of the …
www.iosrjournals.org 74 | Page
At location VLF 11, (Fig. 34) shows a plot of the raw VLF data while (Fig. 35) shows a plot of the
filtered VLF data. Five (5) positive Fraser filter responses, three of which closely spaced Figure 36 were
observed. These give rise to a probable fracture zones that are interconnected to each other, oriented at NE – SW
and NW – SE respectively. They were of depth extending from 0 – 60m and 0 – over 60m as shown in (Fig.
36).
The VLF response at location VLF 12 (Fig.37) raw field data and (Fig. 38) filtered VLF data show
more of positive response along the traverse resulting in a probable fracture zones located between 15 – 25m,
60 – 110m, 200 – 250m and 280 – 315m respectively with depth extending from 0 – 15m, 0 – 30m, 0 – 15m,
0 – 40m and 0 – 30m from the surface respectively. These zones Figure 39 were oriented at E – W, NE – SW,
SE – NW and E – W direction respectively.
Geophysical Investigation of Shallow Subsurface Fracture Distribution in Parts of the …
www.iosrjournals.org 75 | Page
At location VLF 13, the plot of raw field data ( Fig. 40) and the filtered data ( Fig. 41) show positive
response between 10 – 175m along the traverse (Fig.41) resulting in a probable interconnection of fracture zones
Figure 42 located between10 – 175m oriented NE – SW with depth extending from 0 – over 50m from the
surface.

Geophysical Investigation of Shallow Subsurface Fracture Distribution in Parts of the …
www.iosrjournals.org 76 | Page
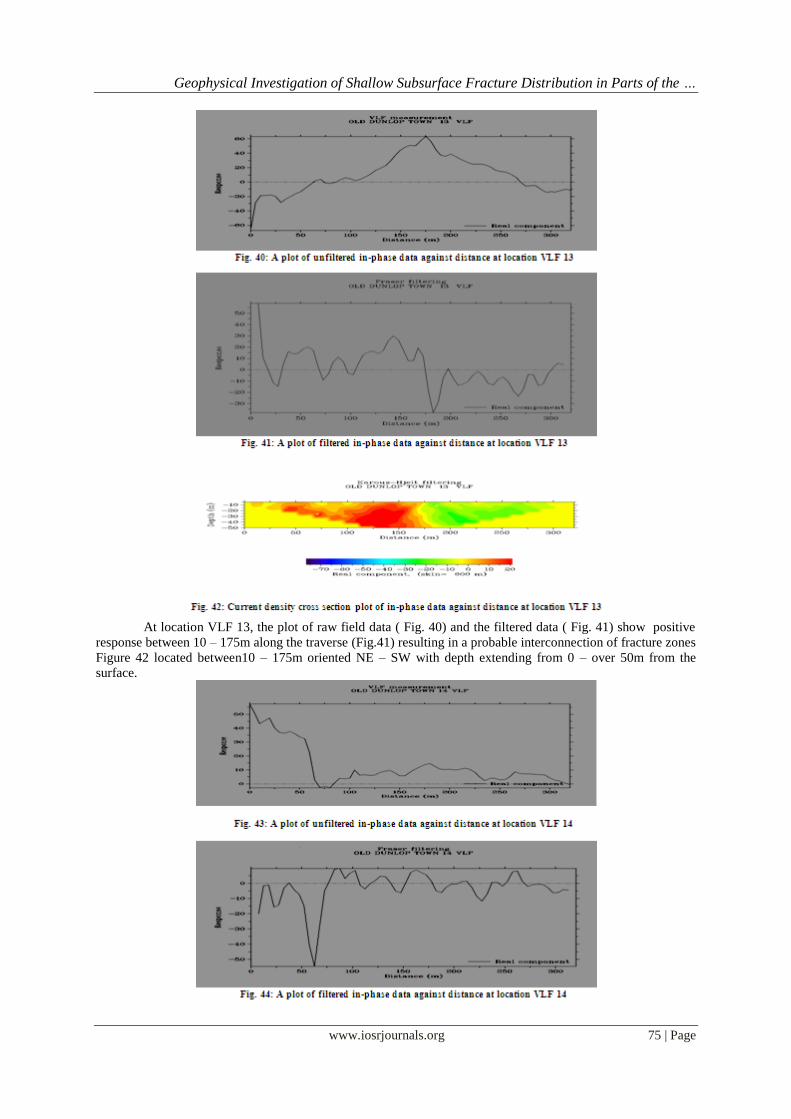
At location VLF 14, raw field data (Fig. 43) and filtered data (Fig.44) were plotted. Four (4) positive
filter responses position were identified along the traverse (Fig.44), these were between 75 – 100m, 115 – 130m,
150 – 175m and 250 – 265m respectively. The corresponding probable fracture zones were located between
80 – 145m, 130 – 190m and 250 – 265m respectively and they were at a depth (Fig 45) extending from
0 – over 50m, 0 – 20m, 0 – 40m and 0 –20m respectively, oriented at NW – SE, NE – SW and NE – SW
direction.

Geophysical Investigation of Shallow Subsurface Fracture Distribution in Parts of the …
www.iosrjournals.org 77 | Page
The result of VLF data collected and plotted for both raw data (Fig.46) and filtered data (Fig.47) at
location VLF 15 show four (4) positive Fraser filter responses (Fig. 44) between 50 – 75m, 110 – 125m,
190 – 200m and 230 – 250m respectively. These result in probable interconnection of fracture zones located
between 40 – 130m oriented at NW – SE direction with depth (Fig. 48) extending from 0 – over 50m.
At location VLF 16, raw field VLF data (Fig.49) and filtered VLF data (Fig 50) were plotted, many
positive Fraser filter responses were observed, giving rise to clusters of probable fracture zones located as
shown in figure 51 at a depth extending from 0 – over 60m oriented at NW – SE and NE – SW directions
respectively.

Geophysical Investigation of Shallow Subsurface Fracture Distribution in Parts of the …
www.iosrjournals.org 78 | Page
The VLF data plotted for both raw data (Fig 52) and filtered data (Fig.53) at location VLF 17 show
three (3) prominent positive Fraser filter responses (Fig 53) located between 25 – 40m, 125 – 145m, and
200 – 240m respectively. These results in probable fracture zones located between 25 – 40m, 125 – 175m and
190 – 260m respectively at depth (Fig.54) extending from 0 – 20m, 0 – over 50m and 0 – 50m respectively. The
orientations of these zones are NW – SE, NE – SW and E – W direction.

Geophysical Investigation of Shallow Subsurface Fracture Distribution in Parts of the …
www.iosrjournals.org 79 | Page
At VLF 18, a plot of raw VLF data (Fig.55) and filtered VLF data (Fig.56), show two (2) positive
Fraser filter responses. These are located between 60 – 90m and 150 – 180m respectively. The resulting
probable fracture zones are located Figure 57 between 60 – 90m and 125 – 175m at a depth extending from 15
– 40m and
10 – over 50m respectively. The zones at these location are oriented NW - SE and NE – SW respectively.
The result of VLF data collected and plotted for both raw field data (Fig 58) and filtered data (Fig 59 )
at location VLF 19 show many positive Fraser responses, giving rise to probable fracture zones located as
shown in (Fig 60).

Geophysical Investigation of Shallow Subsurface Fracture Distribution in Parts of the …
www.iosrjournals.org 80 | Page
At location VLF 20, a plot of raw VLF data (Fig 61) and filtered VLF data (Fig 62) show three (3)
prominent positive Fraser responses located between 50 – 150m, 280 – 380m and 440 – 480m respectively. The
associated probable fracture zones are located (Fig 63) between 60 – 140m, 300 – 360m and 450 – 470m. These
zones are oriented at NW - SE and NE – SW direction respectively.

Geophysical Investigation of Shallow Subsurface Fracture Distribution in Parts of the …
www.iosrjournals.org 81 | Page
The result of both raw VLF data (Fig. 64) and filtered VLF data (Fig. 65) collected at location VLF 21
show four (4) positive Fraser responses located between 22 – 40m, 48 – 58m, 68 – 78m and 110 – 130m
respectively. The associated probable fracture zones Figure 66 are located between 30 – 80m and 110 – 140m
with depth ranging from 0 -15m, 0 – over 20m and 0 – 12.5m. These zones are oriented at NE – SW and N – S
direction.
At location VLF 22, a plot of raw VLF data (Fig. 67) and filtered VLF data (Fig.68) show two (2)
positive Fraser responses. These were located at between 100 – 200m and 260 – 280m. The probable fracture
zones associated with these positive filter responses are located between 100 – 190m and 265 – 280m, Fig 69
at a depth extending from 0 – over 55m and 0 – 20m respectively. The zones had a NE – SW and NW – SE
orientation respectively.

Geophysical Investigation of Shallow Subsurface Fracture Distribution in Parts of the …
www.iosrjournals.org 82 | Page
The result of raw VLF data (Fig 70) and filtered data (Fig.71) collected at location VLF 23 show more
of positive responses than negative along the traverse. These results in fracture zones located are shown in
(Fig.72). These zones are at a depth extending from 0 – over 80m oriented at NW – SE and NE – SW direction.
A plot of the fracture orientation against orientation frequency shows that majority of the fractures
were oriented in the NE – SW direction, followed by fractures oriented in the NW – SE direction. This is as
shown in the bar chart of (Fig.73). Fractures were also ranked based on the Fraser-filtered VLF magnitude.
Fractures with lower positive VLF magnitude were observed to be closer to the surface as compared to those
with higher positive VLF magnitude. A plot of positive Fraser-filtered VLF magnitude against frequency of
occurrence (Fig.74) shows the distribution of fractures in this respect. Fracture depth distribution is as shown in
(Fig.75). The fractures identified were dominantly oriented in NE – SW and NW –SE direction with majority of
the fractures at a depth ranging from 0 to 20m. The ranking of the fracture using positive Fraser-filtered VLF
magnitude shows that majority of the fractures had a range of Fraser-filtered VLF magnitude between 0 and 20
indicating that they are shallow seated fractures.

Geophysical Investigation of Shallow Subsurface Fracture Distribution in Parts of the …
www.iosrjournals.org 83 | Page
V. Conclusion The presence of fracture zones with different orientations and depths in all the sampled points in the
study area showed that the area is well-fractured and hence has good potentials for groundwater development.
This study recommends the drilling of productive and sustainable boreholes at Awi, within College of Education
Campus, Mbarakom, 300m from the primary School, Ayaebam, 50m from the Community Secondary school,
Aniking within the settlement area, to a mean depth of 12.5m, 40m, 30m and 20m respectively. Drilling of
boreholes is also recommended to a mean depth of 50m, 40m and 30m at Akamkpa, 50m from the Council
Secretariat, Okom Ita, within the settlement area and at Nsan 100m from the quarry site respectively. Similarly,
at Uyanga, close to the town hall, Ojor, within the community secondary school and Igbofia borehole drilling is
recommended to a mean depth of 60m, 40m and 60m respectively. Also, this study recommends that since the
identified fractures are shallow seated, the study area is not recommended for waste disposal sites to avoid
contamination of the groundwater aquifers
References [1]. R. D . Barker, C. C White. and J. F. T. Houston Borehole siting in an African accelerated drought relief project. In Wright E. P.
and Burgess W. G. E (ed) Hydrogeology of Crystalline Basement Aquifers in Africa. London, Geological Society Special
Publication 66, 1992, 183-201.
[2]. R. M Carruthers . and I. F Smith.The use of ground electrical survey methods for sitting water supply boreholes in shallow crystalline basement terrains. In Wright E. P. and Burgess W. G. E (ed) Hydrogeology of Crystalline Basement Aquifers in Africa.
London, Geological Society Special Publication, 66, 1992, 203-220.
[3]. T. Dahlin2D resistivity surveying for environmental and engineering Applications. First Break, 14, 1996, 275-28 [4]. A. C .Ekwe , I.N. Nnodu , K.I Ugwubah and O.S Onwuka Estimation of of aquifer hydraulic characteristics of low
permeability formation from geosounding data: a case study of Oduma Town, Enugu state. Online Journal of Earth Sciences 4(1),
2010, 19-26 [5]. A. S Ekwere, A. EdetTrace metals in ground and surface waters of the Oban Massif area, SE NigeriaAdvances in Applied Science
Research, 3(1), 2012, 312-318
[6]. B. N. Ekwueme , E. E. Nyong and S. W Peters . Geological excursion guidebook to Oban Massif, Calabar flank and Mamfe Embayment, Southeastern Nigeria. Calabar, Dechord Press , 1995, 1-36
[7]. B. N. EkwuemeThe Precambrian geology and evolution of the Southeastern Nigerian basement complex. University of Calabar
Press, 2003, p135 [8]. A. M. George, E.E. Okwueze, A. E. Akpanand C. J. Uchegbu Comparative VES studies for the determination of fracture
orientation using azimuthal square array Schlumberger array data in Awi within the Oban Massif, S.E Nigeria. Nigerian Journal of
Physics, 20 (1), 2008, 136-144. [9]. E. E. Okwueze Preliminary findings of the groundwater resource potentials from a regional geoelectric survey of the Obudu
basement area, Nigeria. Global Journal of Pure and Applied Sciences, 2, 1996, 201-211.
[10]. A. L. Olayinka and A. Weller The inversion of geoelectrical data for hydrogeological application in crystalline basement areas Nigeria.Journal of Applied Geophysics, 37, 1997, 103-115.
[11]. K.O. Ozegi, D.O Isiwele and S.O Azi, Ground water investigation using combined VLF and VES.Journal of the Nigerian
Association of Mathematical Physics, 11, 2007, 403-410 [12]. M. PirttijarviKarous-Hjelt and Fraser filtering (KHFFILT) of VLF measurements Version 1.1a.Finland, 2004, University of Oulu
[13]. W. J. Seaton and T.J. Burbey Evolution of two-dimensional resistivity methods in a fractured crystalline terrain.Journal of
Applied Geophysics,51, 2002, 21-41. [14]. S. W. Petters, C. I. Adighije, E. B Essang, and I. E. Ekpo. A Regional Hydrogeological Study of rural water supply options for
planning and implementation of phase II rural water programme in Cross River State, Nigeria. Report for Directorate of Rural
Development. CRSG, 1989, Nigeria. [15]. W. E. Medeiros and O. A. L. Lima . A Geophysical investigation for groundwater in crystalline terrains of central Bahia,
Brazil. Groundwater, 28, 1990, 518-523.
Copyright © 2022 FDOKUMEN