GEOMATICS TECHNIQUES APPLIED TO GLACIERS, ROCK GLACIERS, AND ICE PATCHES IN SPAIN (1991–2012)
15
GEOMATICS TECHNIQUES APPLIED TO GLACIERS, ROCK GLACIERS,AND ICE PATCHES IN SPAIN (1991–2012) J.J. DE SANJOSÉ 1 , F. BERENGUER 1 , A.D.J. ATKINSON 1 , J. DE MATÍAS 1 , E. SERRANO 2 , A. GÓMEZ-ORTIZ 3 , M. GONZÁLEZ-GARCÍA 4 and I. RICO 5 1 Department of Graphic Expression, University of Extremadura, Cáceres, Spain 2 Department of Geography, University ofValladolid, Valladolid, Spain 3 Department of Geography and Regional Geographic Analysis, University of Barcelona, Barcelona, Spain 4 Department of Geography, University of Málaga, Málaga, Spain 5 Department of Geography, Prehistory and Archeology, University of País Vasco, Vitoria, Spain Sanjosé, J.J., Berenguer, F., Atkinson, A.D.J., De Matías, J., Serrano, E., Gómez-Ortiz, A., González-García, M. and Rico, I., 2014. Geomatics techniques applied to glaciers, rock glaciers, and ice-patches in Spain (1991–2012). Geo- grafiska Annaler: Series A, Physical Geography, 96, 307– 321. doi:10.1111/geoa.12047 ABSTRACT. At present there is a wide variety of geomatic techniques available to determine the dynamics of glaciers, rock glaciers and ice patches. Between 1991 and 2012, dif- ferent geomatic techniques – total station, global position- ing system, close-range photogrammetry and terrestrial laser scanner – were applied to monitor the movement of cryosphere landforms in the high mountains of the Iberian Peninsula. The applied techniques must be adapted to the dynamic conditions of cryospheric environments, and so there is no ideal general technique, and depending on the characteristics of the geomorphological structure to be studied, different geomatic techniques can be used. However, there are situations in which certain instruments cannot be used: global positioning system–real time kin- ematics shows difficulties when the presence of vertical walls cause a ‘multipath’ effect. The technique that pro- vides the best results in each case must be chosen, although they can all give good results in measuring and monitoring geomorphological processes. This paper analyses the tech- niques used and results on vertical and horizontal changes of glaciers, rock glaciers and ice patches in the Sierra Nevada, Pyrenees and Picos de Europa, and differences among them by location and topoclimatic setting. All gla- ciers and rock glaciers show a thinning tendency and annual variations in the flow velocity. In addition to the specific dynamic analysis, the geomatic techniques can be used to detail scale and volume changes and perimeter of the analysed landforms. Key words: cartography, climate change, geomatics, rock glaciers Introduction The cryosphere is made up of different elements whose most important characteristic is the dynamic related to the ice landforms. Glaciers, rock glaciers and ice-patches are ice masses or frozen bodies moving downslope at changing rates depending on local (emplacement, topography) and global (climate) factors. The velocities of frozen bodies are related to mass balance thermal change, and their dynamism is related to their current physical behaviour depending on melting or aggradation, and ice creep. Rock glaciers are an efficient indi- cator of permafrost environments, and are paleoin- dicators for the reconstruction of Quaternary periglacial environments in the Atlantic and Medi- terranean mountains from preserved relict forms. Their nature as indicators, both of present and past climates, has helped in the development of numer- ous morphogenetic, morphodynamic and regional studies, and in the development of a inventory of rock glaciers in many mountains worldwide. The study of glaciers using topographical tech- niques has been conducted since the XIX century, and more recently it has been applied to rock gla- ciers. Advances in geomatic techniques have made possible the incorporation of the techniques of global positioning system–real time kinematics (GPS-RTK) and terrestrial laser scanning (TLS) to study glaciers and rock glaciers (Eiken et al. 1997; Bauer et al. 2003; Lambiel and Delaloye 2004; Kenner et al. 2011; Avian 2012). These techniques give greater precision, and require less logistical © 2014 Swedish Society for Anthropology and Geography DOI:10.1111/geoa.12047 307
Transcript of GEOMATICS TECHNIQUES APPLIED TO GLACIERS, ROCK GLACIERS, AND ICE PATCHES IN SPAIN (1991–2012)

GEOMATICS TECHNIQUES APPLIED TO GLACIERS,ROCK GLACIERS, AND ICE PATCHES IN SPAIN
(1991–2012)
J.J. DE SANJOSÉ1, F. BERENGUER1, A.D.J. ATKINSON1, J. DE MATÍAS1, E. SERRANO2,A. GÓMEZ-ORTIZ3, M. GONZÁLEZ-GARCÍA4 and I. RICO5
1Department of Graphic Expression, University of Extremadura, Cáceres, Spain2Department of Geography, University of Valladolid, Valladolid, Spain
3Department of Geography and Regional Geographic Analysis, University of Barcelona,Barcelona, Spain
4Department of Geography, University of Málaga, Málaga, Spain5Department of Geography, Prehistory and Archeology, University of País Vasco, Vitoria, Spain
Sanjosé, J.J., Berenguer, F., Atkinson, A.D.J., De Matías, J.,Serrano, E., Gómez-Ortiz, A., González-García, M. andRico, I., 2014. Geomatics techniques applied to glaciers,rock glaciers, and ice-patches in Spain (1991–2012). Geo-grafiska Annaler: Series A, Physical Geography, 96, 307–321. doi:10.1111/geoa.12047
ABSTRACT. At present there is a wide variety of geomatictechniques available to determine the dynamics of glaciers,rock glaciers and ice patches. Between 1991 and 2012, dif-ferent geomatic techniques – total station, global position-ing system, close-range photogrammetry and terrestriallaser scanner – were applied to monitor the movement ofcryosphere landforms in the high mountains of the IberianPeninsula. The applied techniques must be adapted to thedynamic conditions of cryospheric environments, and sothere is no ideal general technique, and depending on thecharacteristics of the geomorphological structure to bestudied, different geomatic techniques can be used.However, there are situations in which certain instrumentscannot be used: global positioning system–real time kin-ematics shows difficulties when the presence of verticalwalls cause a ‘multipath’ effect. The technique that pro-vides the best results in each case must be chosen, althoughthey can all give good results in measuring and monitoringgeomorphological processes. This paper analyses the tech-niques used and results on vertical and horizontal changesof glaciers, rock glaciers and ice patches in the SierraNevada, Pyrenees and Picos de Europa, and differencesamong them by location and topoclimatic setting. All gla-ciers and rock glaciers show a thinning tendency andannual variations in the flow velocity. In addition to thespecific dynamic analysis, the geomatic techniques can beused to detail scale and volume changes and perimeter ofthe analysed landforms.
Key words: cartography, climate change, geomatics, rockglaciers
IntroductionThe cryosphere is made up of different elementswhose most important characteristic is the dynamicrelated to the ice landforms. Glaciers, rock glaciersand ice-patches are ice masses or frozen bodiesmoving downslope at changing rates dependingon local (emplacement, topography) and global(climate) factors. The velocities of frozen bodiesare related to mass balance thermal change, andtheir dynamism is related to their current physicalbehaviour depending on melting or aggradation,and ice creep. Rock glaciers are an efficient indi-cator of permafrost environments, and are paleoin-dicators for the reconstruction of Quaternaryperiglacial environments in the Atlantic and Medi-terranean mountains from preserved relict forms.Their nature as indicators, both of present and pastclimates, has helped in the development of numer-ous morphogenetic, morphodynamic and regionalstudies, and in the development of a inventory ofrock glaciers in many mountains worldwide.
The study of glaciers using topographical tech-niques has been conducted since the XIX century,and more recently it has been applied to rock gla-ciers. Advances in geomatic techniques have madepossible the incorporation of the techniques ofglobal positioning system–real time kinematics(GPS-RTK) and terrestrial laser scanning (TLS) tostudy glaciers and rock glaciers (Eiken et al. 1997;Bauer et al. 2003; Lambiel and Delaloye 2004;Kenner et al. 2011; Avian 2012). These techniquesgive greater precision, and require less logistical
© 2014 Swedish Society for Anthropology and GeographyDOI:10.1111/geoa.12047
307

effort and time, leading to lower costs and greaterquality in field studies (Bauer et al. 2003).
In this study, we centre our attention on themonitoring of glaciers and rock glaciers in Spain,considering the latter as frozen bodies deformed byflow and characterized by the existence of ridges,furrows and a steep front with a slope of greaterthan 35°, although there is great controversyregarding the genetic interpretation and origin ofice in rock glaciers (Haeberli et al. 2006; Berthling2011). Rock glaciers are displaced downwards atannual flow velocities varying from centimetre tometer values (in the most extreme cases) (Konradet al. 1999; Haeberli et al. 2006), carving outarches and furrows that express in their surface thefrozen body flow and deformation. This dynamicflow has been interpreted as creep and gelifluction,which generates the ridges and grooves associatedwith the emergence, thinning, and compression orstretching of the frozen body. Rock glaciers arealso related to thermal processes such as differen-tial thermal diffusion, frozen heave with segrega-tion ice processes or thermokarst, in accordancewith the internal classification processes generatedby the upwelling of fines in the front area (Whalleyand Martin 1992; Kääb et al. 2003; Kääb andWeber 2004; Haeberli et al. 2006). Many questionsremain on the rheology and dynamics of rock gla-ciers, in recognition of the complexity of the pro-cesses involved, but without any agreement on
which processes (creep deformation or thermody-namic changes) are dominant in each case(Haeberli 2000; Haeberli et al. 2006; Berthling2011). This means that more detailed field knowl-edge of rock glaciers is needed in order to improvethe environmental and paleoenvironmental inter-pretation of periglacial sites in temperate moun-tains, given the absence of other well preservedglacial or periglacial forms in marginal environ-ments and transition between periglacial and nivaldomains. In high mountain marginal periglacialenvironments, and in particular in the mountains ofthe Iberian Peninsula, rock glaciers are a usefulenvironmental and dynamic indicator, and are alsothe most characteristic active periglacial landformsfound here (Serrano et al. 1999, 2006, 2010).
The installation of surface rods and the monitor-ing of their movement by means of topographicalsurvey or GPS-RTK and the generation of a digitalelevation model (DEM) from TLS data reveal theirdisplacement, which is highly variable over timeand space. Knowledge of their exact movementand temporal and spatial variations are importantparameters related to the presence of permafrost, toestimate their age, the rates of potential erosion, orthe collapse processes associated with the disap-pearance of frozen bodies and mountain perma-frost. All of these measurements help to understandthe dynamic diversity of high mountain landformsin the Iberian Peninsula (Fig. 1). The displacement
Fig. 1. Location of the study areas. Pyrenees: 1, Argualas; 2, Posets; 3, Maladeta, Cantabrian Range, Picos de Europa; 4, Centralmassif-Jou Negro, The Sierra Nevada; 5, Corral del Veleta.
J.J. DE SANJOSÉ ET AL.
© 2014 Swedish Society for Anthropology and Geography308

rates are highly variable between glaciers, rockglaciers and other landforms related to the presenceof seasonal or permanent ice in a glacial or mar-ginal periglacial environment. In these cases theprocesses and landforms are closely related totopoclimatic factors.
The aim of this study is the comparative analysisof geomatic techniques applied to the monitoringof rock glaciers and glaciers in the Iberian Penin-sula, their problems and use, together with theresults obtained by means of these different tech-niques in different landforms (glaciers, rock gla-ciers, protalus lobes and ice patches) with the aimof identifying their similarities and differences.
Study areaThe high mountains of the Iberian Peninsula withperennial ice and frozen bodies are only located inthe Pyrenees and Cantabrian Range (Picos deEuropa) in the North, and the Sierra Nevada in theSouth (Fig. 1). The three mountains system havevery different environmental conditions derivedfrom their altitude, latitude and geographical posi-tions, varying from Atlantic to Continental andMediterranean high mountain with transitionalenvironments in the Pyrenees and CantabrianMountains. The loss of ice mass is common tomost mountains, and especially in the temperatehigh mountains of the Iberian Peninsula. Theretreat of glaciers results in a transition from icebodies to ice patches, with melting of non-movingresidual ice masses, and glacial environments areoften replaced by periglacial environments. Mar-ginal ice and frozen bodies are today a researchfield of increasing interest.
The Sierra Nevada, to the south of the IberianPeninsula, is formed by a high ridge reaching3483 m a.s.l. in the Mulhacen peak (Fig. 1). On thehigh mountains of the Sierra Nevada there is onerelict glacier ice mass, one active rock glacier andaround 40 relict rock glaciers mostly located above2800 m a.s.l. (Gómez-Ortiz et al. 2001; Gómez-Ortiz 2002). Relict ice masses are located on theNorth side of Veleta peak (3394 m). The Corral delVeleta rock glacier is located at the head of the oldcirque of the Guarnón (the Sierra Nevada, 37° 3′ N,3° 21′ W, 3100 m). It is made up of thick accumu-lations of blocks from rockfalls of the cirque wallthat have become a glacier-derived rock glacier(Gómez-Ortiz et al. 2008). The interest in this rockglacier lies in its latitudinal position (37° 3′ N, thesouthernmost of Western Europe) and its site, in
relict glacial ice from the Little Ice Age (LIA),which is currently degrading (Gómez-Ortiz et al.2008).
The Pyrenees is a complex mountain range400 km long with an Atlantic climate at the Westand Mediterranean one in the East, reaching3404 m a.s.l. In the Pyrenees there are at least 21glaciers (Martínez de Pisón and Arenillas 1988;ERHIN 2008), 14 rock glaciers (Serrano andAgudo 1997; Serrano et al. 1999) and thousands ofrelict rock glaciers, which were initially interpretedas highly complex retreat moraines, and later asrelict rock glaciers (Serrat 1979; Soutadé 1980).The detailed study of Pyrenean rock glaciers isrecent (Cazenave-Piarrot and Tihay 1983, 1986;Hamilton 1988; Martínez de Pisón and Arenillas1988; Agudo et al. 1989; Serrano and Rubio 1989;Serrano et al. 1991, 1995), and has led to the con-firmation of the current movement of the Argualas,Posets, Besiberri, Maladeta and Bastampé rockglaciers (Cazenave-Piarrot and Tihay 1983, 1986;Serrano et al. 1995, 2006, 2010; Chueca and Julián2003; González-García et al. 2011) and the possi-bility of current movement in another nine rockglaciers (Serrano et al. 1991, 1999; Martí andSerrat 1995; Serrano and Agudo 1997, 2004). TheArgualas (2590 m a.s.l.), Maladeta (2910 m a.s.l.)and Posets (2875 m a.s.l.) rock glaciers in theirrespective massifs have been under analysis since1991, as well as the glacier of La Paul (2830 ma.s.l.) in the Posets massif (Serrano et al. 2011a)(Fig. 1).
The Cantabrian Range forms a wide set of ridgesand massifs of moderate altitude with a strongasymmetry between the Atlantic North slope andthe transitional Atlantic-Mediterranean environ-ment to the South. The highest altitudes are locatedin the Picos de Europa (Torre Cerredo peak,2648 m a.s.l.), located in the North and Central partof the Cantabrian Range. In the Picos de Europa,there are no glaciers, and nivokarstic processes aredominant. The Jou Negro ice patch (2200 m a.s.l.)has been monitored since 2005, and that of Llam-brión (2350 m a.s.l.) since 2011 (Fig. 1). Both areremnants of ice from LIA glaciers (González-Trueba 2006; Serrano et al. 2011b).
MethodsPrecise measurements of the dynamics of land-forms in the Spanish high mountains (glaciers,rock glaciers, solifluction lobes, scree and plough-ing blocks) have been made since 1991. During the
GEOMATICS TECHNIQUES APPLIED TO GLACIERS, ROCK GLACIERS, AND ICE PATCHES IN SPAIN (1991–2012)
© 2014 Swedish Society for Anthropology and Geography 309

years of work different advances in geomatic tech-niques have permitted us to use different tech-niques such as total station topographical survey,GPS-RTK, TLS and close-range photogrammetry.Innovation in geomatic techniques gives greaterprecision and requires less logistical effort andtime, leading to lower costs and greater quality infield studies (Bauer et al. 2003). The monitoring ofrock glaciers is of special interest for monitoringvertical and horizontal displacements of the frozenbody, determining the processes that generate andmaintain the landforms, their activity or inactivityand their evolution over time. But in the field theefficiency of techniques varies depending on place-ment and orography, such that there may be prob-lems in the use of topographical survey, GPS-RTKor TLS. The lack of ideal placements for stations,which makes it impossible to collect suitable visualdata or scans, or the existence of vertical walls inits surroundings, thus blocking the direct receptionof satellite signals, produce low accuracy or errorsin the data (Sanjosé et al. 2010). For this reason,when planning the field study and repeat survey ofa glacier or rock glacier, the most efficient geo-matic technique must be chosen to obtain precisedata, which in our case is estimated at around ±3 cm (Sanjosé 2003).
Our studies began in the area of the Pyreneeswith the Argualas rock glacier (1991–2000)(Sanjosé 2003). Later, measurements continued onthe Posets (GPS-RTK), Maladeta (GPS-RTK) andCorral del Veleta rock glaciers (total station, GPS-RTK, close-range photogrammetry, TLS), solifluc-tion lobes in the Renclusa (TLS), and La Paúl,Monte Perdido, Maladeta and Ossue glaciers(GPS-RTK, TLS) (Serrano et al. 2006, 2010). Inthe Picos de Europa are being studied the JouNegro (close-range photogrammetry and TLS), theLlambrión ice-patch (TLS), debris talus and conesin La Vueltona (TLS), and mass movements relatedto seasonal ground ice (GPS-RTK and TLS).
The different geomatic techniques that havebeen applied throughout this time and which haveled to the determination of rock glacier dynamicswere the following:
• The use of GPS-RTK, which allowed thefollow-up of control points (marked by metalrods) distributed over the surface of frozenbodies (Eiken et al. 1997; Lambiel and Delaloye2004; Sanjosé et al. 2007a, 2007b; Gómez-Ortizet al. 2008) with an accuracy of around ±2 cm,but this technique is not applicable to all cirques.
When the walls are close to the measured pointsthe satellite signal is interrupted or there arerebounds of the ‘multipath’ signal and therequired accuracy is too low.
• The methodology used with a total station wasthe direct multiple angular intersection and dis-tances (control points placed on the rock gla-ciers), in the case of Argualas rock glacier fromthree fixed stations. On glaciers, using the totalstation, several transversal profiles are moni-tored, as well as the outline of the glacier androck glacier. With this technique the positionalprecision (planimetric and altimetric) of thecontrol points and profile points was ±3 cm.The use of the ‘reflectorless’ total station and thesupport of photographic images to trace the frontof rock glaciers by monitoring relevant fixedpoints in blocks. This precision was ±1 cm(Sanjosé et al. 2007a, 2007b; Matías et al. 2009).
• For many years detailed mapping has been doneusing new techniques of automatic restitution(Gwinner et al. 2000; Kaufmann and Ladstädter2008; Matías et al. 2009). Convergent photo-grammetry with the application of the program‘Restitutor’ and normal photogrammetry withthe use of analytical and digital restitutors havebeen combined to obtain a detailed morphologi-cal map. Our computerized studies have led tothe development of the software ‘Restitutor’,which allows 3D reconstructions to be madeautomatically and in great detail from the set ofimages collected (Matías et al. 2012).
• A scanner laser can be used for the precise moni-toring of sectors of interest and topographicmapping of the rock glaciers (Bauer et al. 2003).The aim is to know changes in vertical and hori-zontal with accuracy of around 1–3 cm. Theplacement conditions determine the use of long-range instruments, or short-range ones. The con-ventional scanner laser (C10 de Leica), used forsmall landforms, measures 50 000 points s–1 butits scope is limited to 200 m distance. The‘Image Station’ total station enables scans frommore than 1000 m with a positional accuracy of2 cm, but the accuracy depends of the distance.At less than 150 m the points measured are 20points/s, but when the distance is greater than150 m, it measures 1 point/s. This technique canbe applied to glaciers and rock glaciers. Ascanned net is obtain to get a triangular irregularnet (TIN) and so to build a DEM from whichannual spatial variations of volume lost or gaincan be calculated.
J.J. DE SANJOSÉ ET AL.
© 2014 Swedish Society for Anthropology and Geography310

Dynamics in the Sierra Nevada (Corral delVeleta rock glacier)The dynamics of this rock glacier are monitoredfrom 2001, using different geomatic techniques(Sanjosé et al. 2007a). Since then, the resultsobtained have revealed different types of move-ment over time at the control points. The controlsin place, most of which were measured annuallyand on the same dates (the last week in August)(Fig. 2a), allow us to conclude that this is a stabi-lized rock glacier owing to the fact that the frozenbodies housed in its interior tend to progressivedegradation (Salvador-Franch et al. 2011; Gómez-Ortiz et al. 2012).
General behaviourThe behaviour and values of the vertical (sinking)and horizontal displacements or planimetrics of therock glacier obtained using the total stationthroughout the period 2001–2009 have beendescribed elsewhere (Sanjosé et al. 2007a, 2007b;Gómez-Ortiz et al. 2008; Matías et al. 2009)(Table 1). The displacements detected show highvariability, more at the root and front of the rockglacier than in the middle. The main reason lies inthe topographic slope of each section that is beingmonitored.
The body of the rock glacier has compact andrigid behaviour during the cold and snowy season(winter) and is less rigid during the season of snowmelting and/or no snow (summer). As a result,movements only take place from the middle of thesummer, when the thermal wave of external radia-tion manages to melt the ground snow and pen-etrate through the active layer until it reaches the
underlying frozen body, which then degrades(Table 2) (Gómez-Ortiz et al. 2008).
Table 2 shows the dynamics of the same controlpoint as in Table 1, with data obtained in mid-Julyand the end of August (periodic observations). InTable 2, we can see that for full years (August–August) two pieces of data are available: August–
a b
Fig. 2. State of the Corral del Veleta rock glacier: (a) photograph in August 2009; (b) photograph in August 2010.
Table 1. Dynamic evolution of a ‘control point’ of the Corral delVeleta rock glacier during the period 2001–2009 (end ofAugust).
Annualperiod
Horizontalmovement
Verticalmovement
(m) (m)
2001–2002 0.13 −0.152002–2003 0.20 −0.382003–2004 0.05 −0.152004–2005 0.32 −0.752005–2006 0.27 −0.582006–2007 0.23 −0.582007–2008 0.14 −0.522008–2009 0.07 −0.35
Table 2. Dynamic evolution of a ‘control point’ of the Corral delVeleta rock glacier during 2005–2008 (periods July–August andAugust–July).
Annual period Horizontalmovement
Verticalmovement
(m) (m)
August 2005–July 2006 0.14 −0.29July 2006–August 2006 0.13 −0.29August 2006–July 2007 0.12 −0.29July 2007–August 2007 0.10 −0.28August 2007–July 2008 0.09 −0.27July 2008–August 2008 0.06 −0.24
GEOMATICS TECHNIQUES APPLIED TO GLACIERS, ROCK GLACIERS, AND ICE PATCHES IN SPAIN (1991–2012)
© 2014 Swedish Society for Anthropology and Geography 311

July (10 months and 15 days) and July–August (45days), and for each period the results are similar.However, rock glacier dynamics may also beaffected by the moment of the first winter snowfall(October or November), i.e. when the rock glacierbecomes covered with snow and when it is com-pletely free of snow (mid-July), the dynamicabsence during winter could be confirmed.Between November 2009 and August 2012, theentire body of the rock glacier remained coveredby 2 m deep snow cover, paralyzing possiblemovement (Fig. 2b).
Monitoring of the outline and profilesThe evolution of the outline and five profiles indifferent stretches of the rock glacier has beendetermined using a total station in some years andwith GPS-RTK in others (Fig. 7). This has beendone from the follow-up and monitoring of controlpoints. These controls were also annual with 68control points for the perimeter and 88 along theprofiles.
The results reveal very little variation in theoutline or surface shape but continuous deforma-tion in the profiles. For 2002–2009, vertical sinkingmovements gave a mean value per year of−34.4 cm. Profile 4, which is perpendicular to therock glacier displacement (Fig. 3a), behaves simi-larly to the rest of the transversal profiles (profiles1, 2, 3) (Fig. 7). Moreover, the behaviour of profile
5 is described (Fig. 3b), which is longitudinal tothe rock glacier. This profile shows the recession ofthe glacier, as described below.
Frontal monitoringWith the imaging station (IS) total station and TLS,monitoring of the front of the rock glacier wascarried out from the data collection of a pointcloud, without the need of the total station reflector.This instrumental technique has the advantage ofidentifying and monitoring the movement ofcontrol points at the same time that a general pho-tograph is obtained of the point observed (Fig. 4).
Using this technique it has been observed thatthe dynamics of the front of the glacier is nothomogeneous. There is a greater movement in theupper part, to a lesser extent in the central area, andlittle or none at all in the lower part (Fig. 5). Themovement of the upper and central parts lies in theinstability of the blocks of rocks on the ground, sothey are dependent on the sharp slope of the rockglacier front.
The follow-up of the reference points from 2005to 2009 shows that cumulative values of sinkinggreatly surpass their horizontal equivalents and therock glacier is actively sinking. The recession ofthe front of the rock glacier can be checked withthe points measured in the lower area, in whichthere was hardly any displacement in 2009 (hori-zontal: 3 cm; vertical: 0 cm) (Fig. 5).
Fig. 3. Corral del Veleta rock glacier, evolution of the profiles during 2002–2009: (a) transversal (profile 4); (b) frontal (profile 5). Theposition of the profiles is shown in Fig. 7.
J.J. DE SANJOSÉ ET AL.
© 2014 Swedish Society for Anthropology and Geography312

Fig. 4. Upper photograph: general image of the front of the Corral del Veleta rock glacier taken by IS station. Lower photographs:details of the same point during 2006, 2007 and 2008 (left to right).
Fig. 5. Net displacement (left to right) throughout the slope and horizontal advance of three points in the upper, central and lower partsof the front of the Corral del Veleta rock glacier.
GEOMATICS TECHNIQUES APPLIED TO GLACIERS, ROCK GLACIERS, AND ICE PATCHES IN SPAIN (1991–2012)
© 2014 Swedish Society for Anthropology and Geography 313

Detailed mappingFor many years detailed mapping has been doneusing new techniques of automatic restitution.‘Restitutor’ is a computer program, which calcu-lates a first 3D surface using a feature-based solu-tion (Matías et al. 2009, 2012). Next, it completesthis first approximation using a 3D multi-viewreconstruction algorithm (Goesele et al. 2006). Inthe end, a dense 3D reconstruction is obtained(millions of 3D points).
Also, the progress made in the image-matchingmethods and the use of techniques from computervision are leading to improvements in ‘Restitutor’.Figure 6 shows an example DEM obtained usingthis software.
Laser scanner surveyingIn August 2010 and 2011 the rock glacier wasburied under snow (Fig. 2b). Measurements usingother techniques were not viable and in the 2011survey it was decided to use laser scanning tocompare the topographic profiles of 2009 withthose obtained using the laser scanner.
The laser scanner was used to map the area ofthe rock glacier which, given its length and orien-tation, involves different positionings of the laserscanner which are then joined together using the‘target resection’ technique (Fig. 7).
From this laser scan it was observed that at theend of August 2011 the mean thickness of thewinter snow was 4 m on the rocky surface ofthe rock glacier. At the front of the rock glacier, the
thickness of the snow was 10 m in some places.Similarly, the data from 2009 showed the positionof the tube installed in the heart of the active layerof the rock glacier that housed the chain of sensorscontinually recording the internal temperature ofthe ground, and also that its displacement was3 cm. This displacement was attributed to theperiod between the measurement at the end ofAugust 2009 and the arrival of the first snowfallsthe following winter.
Rock glacier dynamics in the PyreneesThe aim of this research was to comparativelyanalyze the best known rock glaciers in the Pyr-enees to observe their morphological, dynamicand structural similarities and differences, particu-larly their internal structure and surface dynamics.Common aspects must be established for theirdescription and use as environmental indicators,as set against their different locations. Similarly,the structures and dynamics deriving from thedeformation of rock glaciers will be differentiatedfrom those attributable to thermal processes,which will lead to the definition of states ofbalance or instability.
Argualas rock glacierIn the Argualas rock glacier, six campaigns weremade with a total station between 1991 and 2000.This is the first rock glacier studied in Spain usingmodern geomatic techniques and a mean annual
Fig. 6. Triangulation network obtained with ‘Restitutor’ in the Corral del Veleta rock glacier. The red line indicates the outline of therock glacier.
J.J. DE SANJOSÉ ET AL.
© 2014 Swedish Society for Anthropology and Geography314

movement of 20–40 cm was measured (Serranoet al. 2006). The technique used (total station)achieved precision on planimetry and altimetry of±3 cm. Moreover, in 2000 the photogrammetrictechnique of ‘close-range and convergent’ wasused to map a small area of the rock glacier. Anattempt was made to use GPS techniques but theresults were unacceptable, possibly due to theproximity of high surrounding rock walls, leadingto the interruption of satellite signals (Sanjosé2003).
Posets rock glacierThe Posets rock glacier is in the same massif as theLa Paul glacier. Both are analysed annually withdifferent techniques due to their different charac-teristics (Fig. 8).
Measurements began on the Posets rock glacierin 2001, and two fixed stations were set up atstable sites and 10 control points on the rockglacier. The GPS-RTK technique was chosen,since the rock glacier is some distance from thesurrounding walls and therefore there are noobstacles that might interrupt the satellite signalor rebounds of the ‘multipath’ signal (Serranoet al. 2010). In this way, the coordinates of thepoints are obtained and measured at the sametime, and are analysed with those of the previousyear. If the coordinates are similar, the measure-ment is good and the difference shown is due tothe displacement. But if the values of the annualmeasurements are exaggerated (>1 m), the meas-urement is repeated in anticipation of the satelliteconfiguration having changed.
Table 3 shows the result of a control pointmeasured in the Posets rock glacier. As observedelsewhere, the dynamic (horizontal or vertical)movement is not uniform throughout the years.There are periods of greater displacement than
Fig. 7. Result of the scan with the position of the profiles in the Corral del Veleta rock glacier.
Fig. 8. Position of the Posets rock glacier (red) and the LaPaul glacier (green). The photograph was taken from www.komandokroketa.org
Table 3. Dynamic evolution of ‘control point’ number 6 in thePosets rock glacier between 2001 and 2011.
Annual period Horizontalmovement
Verticalmovement
(m) (m)
2001–2005 (4 years) 0.45 −0.132005–2006 0.08 −0.092006–2007 0.10 −0.092007–2008 0.07 −0.032008–2009 0.07 −0.052009–2011 (2 years) 0.17 −0.23
GEOMATICS TECHNIQUES APPLIED TO GLACIERS, ROCK GLACIERS, AND ICE PATCHES IN SPAIN (1991–2012)
© 2014 Swedish Society for Anthropology and Geography 315

others depending on climate variability during thestudy period. In general, the horizontal displace-ment is greater than vertical displacement, thoughfor a certain control point (Table 3) there is anexception for the period 2005–2006 and for thebi-annual period 2009–2011.
The averaged results of the Posets rock glacierannual movement coincide with the values of otherrock glaciers measured in the Pyrenees (Argualasand Maladeta). The mean horizontal displacementis 1.5 times the value of vertical displacement. Thisproportion applied to other European rock glaciersvaries as in, for example, the Doesen rock glacier(Austrian Alps), in which the relationship is 3/1and in the Corral del Veleta rock glacier, where it is1/6 (Fig. 9). Therefore, there may be a relationshipbetween the geographical latitude of Europeanrock glaciers and their movement (planimetric/altimetric) deriving from their marginality in envi-ronments with permafrost (Sanjosé et al. 2010). Inmarginal environments where topoclimatic condi-tions are particularly important, a decrease is seenin the horizontal displacement of rock glaciers andan increase in thinning (vertical displacement) dueto stretching and loss of frozen mass, in a transitiontowards instability (Fig. 9).
Maladeta rock glacierThe Maladeta rock glacier is found in the Maladetamountain massif, in the Alba cirque (Fig. 1). It has
a tongue 45 m in width and 210 m in length with anabrupt and unstable front 15 m high.
From 2008 to 2012 geomorphological, thermaland geomatic studies have been continuouslyunderway. The geomatic analyses consist of datacollection using GPS-RTK over 15 control points.The precision of measurements is ±3 cm andmean annual horizontal displacement of 6–8 cmhas been determined (González-García et al.2011).
The results of the data analyzed reveal consid-erable differences in the velocity of horizontal dis-placement across the rock glacier. The area withthe greatest movement is the front, with meanannual values of 8 cm, followed by the central areawith values of 6 cm. With respect to vertical dis-placement, which is indicative of mass accumula-tion or loss, most of the points analyzed register aloss of thickness at the rock glacier surface(Fig. 10).
This pattern of change corresponds to a lowactivity rock glacier in evident thermal disequilib-rium with interannual variations in climate. Itslocation in a marginal periglacial area of a temper-ate high mountain environment yields behaviourthat is similar to that recorded in the Argualas(Serrano et al. 2006) and Posets rock glaciers(Serrano et al. 2010). The study period is stillshort, but knowledge of its dynamics over timemakes it an efficient morphoclimatic geoindicator(Serrano et al. 2010).
Fig. 9. Comparison between mean horizontal/vertical displacement among four European rock glaciers: Doesen (Alps), Posets(Pyrenees), Maladeta (Pyrenees) and Corral de la Veleta (the Sierra Nevada).
J.J. DE SANJOSÉ ET AL.
© 2014 Swedish Society for Anthropology and Geography316

La Paul glacierThe glacier does not permit the installation ofcontrol points (rods) and so the glacier is analyzedusing the generation of DEMs. In each survey aDEM is generated and compared with the DEMs ofprevious years.
To generate these DEMs, a great number ofpoints must be measured in 3D, and for this reasonwe used the total station IS, which stores 20 points/sin its memory up to a distance of 150 m, and forgreater distances, it saves approximately 1 point/s.Each point observed has a precision of 1 cm andover 10 000 points were measured in each survey,with a mean mesh point interval of 4 m.
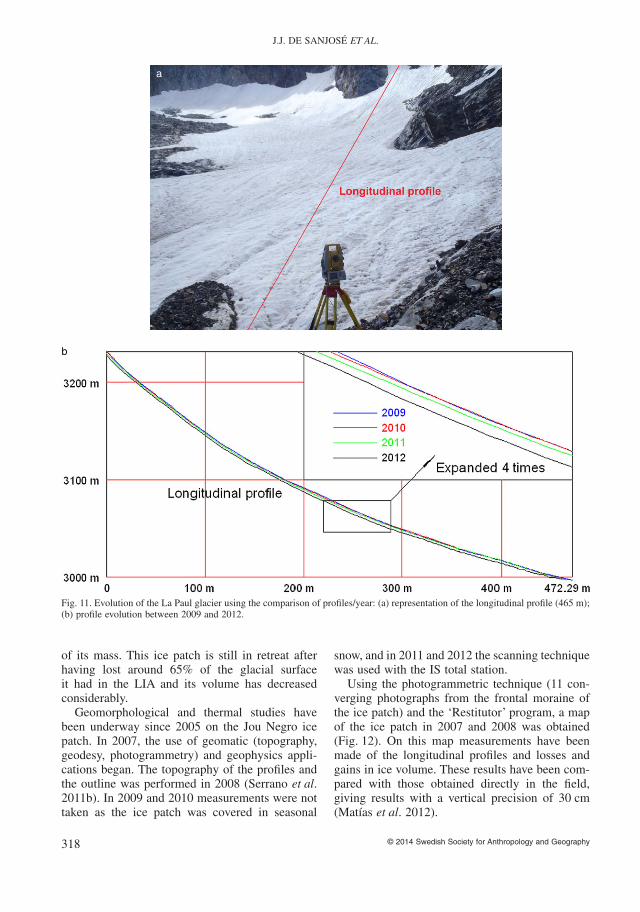
Profiles are made with each DEM and are com-pared for the different areas of the glacier(Fig. 11a). Values of losses and gains in volumeand thickness are obtained. Care must be taken toensure that measurements are not taken when thereis seasonal snow, as this would create uncertaintyin the measurements. For this reason, a laserscanner must be used on glacial ice.
The results from the comparison between thescan data between 2010 and 2011 are dramatic.The limited presence of snow in both summersenabled us to compare the surface of the glacier.The comparison of the longitudinal profilebetween 2010 and 2011 surfaces shows a loss of1.5 m (Fig. 11b). The loss of volume of theglacier accelerated in 2011 and 2012, thinning by2.5 m.
Dynamics in Picos de EuropaThe Jou Negro ice patchThe Jou Negro ice patch is located in a gla-ciokarstic cirque in the northwest of the CentralMassif of the Picos de Europa, on the northernface of Torre Cerredo peak. The Jou Negro cirquewas occupied during the LIA by a glacier cover-ing 0.52 km2 (González-Trueba 2006). Thisglacier has now been reduced to a remnantof glacial ice or ice patch, partially covered inclasts and without movement by deformation
Fig. 10. Net dynamics of the Maladeta rock glacier (2008–2011).
GEOMATICS TECHNIQUES APPLIED TO GLACIERS, ROCK GLACIERS, AND ICE PATCHES IN SPAIN (1991–2012)
© 2014 Swedish Society for Anthropology and Geography 317
of its mass. This ice patch is still in retreat afterhaving lost around 65% of the glacial surfaceit had in the LIA and its volume has decreasedconsiderably.
Geomorphological and thermal studies havebeen underway since 2005 on the Jou Negro icepatch. In 2007, the use of geomatic (topography,geodesy, photogrammetry) and geophysics appli-cations began. The topography of the profiles andthe outline was performed in 2008 (Serrano et al.2011b). In 2009 and 2010 measurements were nottaken as the ice patch was covered in seasonal
snow, and in 2011 and 2012 the scanning techniquewas used with the IS total station.
Using the photogrammetric technique (11 con-verging photographs from the frontal moraine ofthe ice patch) and the ‘Restitutor’ program, a mapof the ice patch in 2007 and 2008 was obtained(Fig. 12). On this map measurements have beenmade of the longitudinal profiles and losses andgains in ice volume. These results have been com-pared with those obtained directly in the field,giving results with a vertical precision of 30 cm(Matías et al. 2012).
a
b
Fig. 11. Evolution of the La Paul glacier using the comparison of profiles/year: (a) representation of the longitudinal profile (465 m);(b) profile evolution between 2009 and 2012.
J.J. DE SANJOSÉ ET AL.
© 2014 Swedish Society for Anthropology and Geography318

Discussion and conclusionsThere is a wide variety of geomatic techniques thatcan be used for the study of mountain geomorphol-ogy. They all seek maximum precision in the moni-toring of 3D displacements (horizontal andvertical). The technique applied must be adapted todynamic conditions of placement and accessibilityof tools and landscape topography, and so there isno ideal general technique.
In the different processes studied, greater orlesser precision is achieved depending on the fieldof distance and on the technique used. Laser scan-ning techniques with IS permit millimetre preci-sions in close measurements (lobes and ploughingblocks), although they are not dealt with in thispaper. For more distant measurements, between150 and 1000 m, on glaciers and rock glaciers, theprecision obtained has maximum values of ±4 cm,which are suitable for this kind of landform behav-iour. Through the use of GPS-RTK, the precisionsobtained are ±3 cm, ideal for monitoring creepingflows, and at the same time it is a fast, cheap andefficient method. Nevertheless, its application inmountains has some difficulties, such as the pres-ence of vertical walls that interrupt the satellitesignal, and rebounds causing the multipath effect,such that its use in the Argualas rock glacier, theJou Negro ice patch or the La Paul glacier is impos-sible. In these cases other techniques must beapplied, such as the total station or the TLS. Fromemplacement conditions, the rheology of theprocess and monitoring needs, the most appropri-ate geomatic technique must be chosen, thoughthey have all given good results in measuring andmonitoring geomorphological processes.
The rock glaciers analyzed show a complex andvaried pattern of movement, both spatial and tem-poral. Moderate horizontal displacements domi-nate except in Argualas, which has a greatervelocity but which is in line with the velocitiesrecorded in many alpine rock glaciers and in that ofCorral del Veleta, which reflects a more significantthinning. Horizontal displacement reveals distinctdynamics; some landforms increase their displace-ment velocity towards the front and others decreasemoderately from the source towards the front. Allshow a thinning tendency, with rheological stretch-ing and thermal diffusion processes, and sharpannual variations in flow velocity. From the hori-zontal and vertical velocities, two behaviouralmodels can be established. The pulsating rock gla-ciers are the most dynamic with higher horizontalflow velocities and greater capacity to transferdebris from the wall. The second is rock glacierswith small horizontal displacements and the pre-dominance of thinning, and attenuated dynamics inresponse to thermal diffusion of the internal frozenbodies, as in the case of the Corral del Veleta rockglacier.
The study of the dynamics of glaciers and rockglaciers is a good indicator of the local repercus-sion of climate change, although such a smallavailable data series prevents any conclusions frombeing reached. Therefore, we must continue moni-toring in order to make comparisons with events inthe future.
AcknowledgementsThis work was funded by the projects CGL-2010-19729/BTE (Ministry of Science & Innovation and
Fig. 12. DEM obtained by photogrammetry ‘Restitutor’ (2008) and profiles represented in red. The small photograph shows apanoramic view of the Jou Negro ice patch.
GEOMATICS TECHNIQUES APPLIED TO GLACIERS, ROCK GLACIERS, AND ICE PATCHES IN SPAIN (1991–2012)
© 2014 Swedish Society for Anthropology and Geography 319

FEDER) and the projects OAPN 053/2010 and018/2007 of Ministry of the Environment andRural and Marine Environment. Funding was alsoreceived from the Government of Extremadura andFEDER (file number GR10071). We thank FerránSalvador Franch, Montserrat Salva Catarineu, JuanJosé González Trueba and Manuel Gómez Lende,for field assistance. We would like to express ourappreciation to the people who have revised thisarticle and for the great interest they have taken inimproving it.
José Juan de Sanjosé, Fernando Berenguer, Alan D.J. Atkin-son, Javier de Matías, Department of Graphic Expression,University of Extremadura, Avenida de la Universidad s/n,Escuela Politécnica, 10003 Cáceres, SpainE-mail: [email protected], [email protected], [email protected], [email protected]
Enrique Serrano, Department of Geography, University ofValladolid, Paseo Prado de la Magdalena s/n, 47011 Val-ladolid, SpainE-mail: [email protected]
Antonio Gómez-Ortiz, Department of Geography andRegional Geographic Analysis, University of Barcelona,Gran Vía de las Cortes Catalanas 585, 08007 Barcelona,SpainE-mail: [email protected]
María González-García, Department of Geography, Univer-sity of Málaga, Campus de Teatinos, 29071 Málaga, SpainE-mail: [email protected]
Ibai Rico, Department of Geography, Prehistory and Arche-ology, University of País Vasco, Calle Tomás y Valiente s/n,01006 Vitoria, SpainE-mail: [email protected]
ReferencesAgudo, C., Serrano, E. and Martínez de Pisón, E., 1989. El
glaciar rocoso activo de los Gemelos en el Macizo delPosets (Pirineo Aragonés). Cuaternario y Geomor-fología, 3 (1–4), 83–91.
Avian, M., 2012. First results of repeated Terrestrial Laserscanning monitoring processes at the rock fall areaBurgstall/Pasterze Glacier, Hohe Tauern Range, CentralAustria. In: Geophysical Research Abstracts, Vol. 14,EGU2012-8905, EGU General Assembly 2012. Vienna.
Bauer, A., Paar, G. and Kaufmann, V., 2003. Terrestrial laserscanning for rock glacier monitoring. Permafrost. In:Proceedings of the Eighth International Conference onPermafrost, Balkema Publishers, Zurich. 55–60.
Berthling, I., 2011. Beyond confusion rock glaciers ascryo-conditioned landforms. Geomorfology, 132, 98–106.
Cazenave-Piarrot, F. and Tihay, J.P., 1983. Eboulis, forma-tions morainiques et glaciers rocheux dans le massifs deL’Ardiden (Pyrenees Centrales). In: Eboulis et envi-
ronnement géographique passé et actuel. AssociationGeographes Francaises, Publication Centre GéographiePhysique, París. 121–138.
Cazenave-Piarrot, F. and Tihay, J.P., 1986. Glaciersrocheaux dans les Pyrénées Centrales et Occidentales.Communication a la Societé Hydrotechnique de France(section Glaciologie), Paris, 8 p.
Chueca, J. and Julián, A., 2003. Movement of Besiberrisrock glaciar, Central Pyrenees, Spain: data from a10-year geodetic survey. Antarctic, Arctic and AlpineResearch, 37 (2), 163–170.
Eiken, T., Hagen, J.O. and Melvold, K., 1997. KinematicGPS survey of geometry changes on Svalbard glaciers.Annals of Glaciology, 24, 157–163.
ERHIN (Estudios de Recursos Hídricos y la Innivación),2008. Control general de los glaciares del Pirineoespañol. MAGRAMA, Madrid, 26 p.
Goesele, M., Curless, B. and Seitz, S., 2006. Multi-viewstereo revisited. IEEE Computer Vision and Pattern Rec-ognition, 2, 2402–2409.
Gómez-Ortiz, A., 2002. Mapa morfológico de SierraNevada. Morfología glaciar y periglaciar. Junta deAndalucía- Parque Nacional de Sierra Nevada y Univer-sidad de Barcelona, 86 p.
Gómez-Ortiz, A., Palacios, D., Ramos, M., Tanarro, L.M.,Schulte, L. and Salvador, F., 2001. Location of perma-frost in marginal regions: Corral del Veleta, SierraNevada, Spain. Permafrost and Periglacial Processes,12 (1), 93–110.
Gómez-Ortiz, A., Salvador-Franch, F., Sanjosé, J.J.,Palacios, D., Oliva, M., Salvà-Catarineu, M., Tanarro,L.M., Atkinson, A., Schulte, L., Plana, J.A. and Milheiro,B., 2012. Degradación de hielo fósil y permafrost yCambio climático en Sierra Nevada. Investigaciones enParques Nacionales. Organismo Autónomo ParquesNacionales, Madrid, 430 p.
Gómez-Ortiz, A., Salvador-Franch, F., Schulte, L., Sanjosé,J.J., Atkinson, A. and Palacios, D., 2008. Evolución mor-fodinámica de un enclave montañoso recién deglaciado:El caso del Corral del Veleta (Sierra Nevada), ¿conse-cuencia del cambio climático? Scripta Nova, 270 (26),1–18.
González-García, M., Serrano, E., Sanjosé, J.J. andGonzález, J.J., 2011. Dinámica superficial y estadoactual del glaciar rocoso de la Maladeta Occidental (Piri-neos). Cuadernos de Investigación Geográfica, 37 (2),81–94.
González-Trueba, J.J., 2006. Topoclimatical factors and verysmall glaciers in Atlantic Mountain of SW Europe: theLittle Ice Age glacier advance in Picos de Europa (NWSpain). Zeitschrift für Gletscherkunde und Glazialgeolo-gie, 39, 115–125.
Gwinner, K., Hauber, E., Jaumann, R., and Neukum, G. 2000.High-resolution, digital photogrammetric mapping: a toolfor Earth science. Eos, Transactions American Geophysi-cal Union, 81 (44), 513–520.
Haeberli, W., 2000. Modern research perspectives relating topermafrost creep and rock glaciers: a discussion. Perma-frost and Periglacial Processes, 11, 290–293.
Haeberli, W., Hallet, B., Arenson, L., Elconin, R., Humlum,O., Kääb, A., Kaufmann, V., Ladanyi, B. and Matusoka,N., 2006. Permafrost creep and rock glacier dynamics.Permafrost and Periglacial Processes, 17 (3), 189–214.
J.J. DE SANJOSÉ ET AL.
© 2014 Swedish Society for Anthropology and Geography320

Hamilton, L., 1988. The development, age and present statusof a rock glacier in the Posets Massif, Spanish Pyrenees.Pirineos, 131, 43–56.
Kääb, A. and Weber, M., 2004. Development of transverseridges on rock glaciers: field measurements and labora-tory experiments. Permafrost and Periglacial Processes,15 (4), 379–391.
Kääb, A., Kaufmann, V., Ladstäter, R. and Eiken, T., 2003.Rock glaciers dynamics: implications from high resolu-tion measurements of surface velocities fields. In: Per-mafrost, Philips, M., Springman, C., Arenson, H. (eds).Swets and Zeitlinger, Lisse. 501–506.
Kaufmann, V. and Ladstädter, R., 2008. Application of ter-restrial photogrammetry for glacier monitoring in Alpineenvironments. In: IAPRS, Vol. 37, Part B8, Proceedingsof the 21st Congress of ISPRS, Beijing. 813–818.
Kenner, R., Phillips, M., Danioth, C., Denier, C., Thee, P.and Zgraggen, A., 2011. Investigation of rock and iceloss in a recently deglaciated mountain rock wall usingterrestrial laser scanning: Gemsstock, Swiss Alps.Cold Regions Science and Technology, 67 (3), 157–164.
Konrad, S.K., Humphrey, N.F., Steig, E.J., Clark, D.H,Potter, J.R.N. and Pfeffer, W.T., 1999. Rock glacierdynamics and palaeoclimatic implications. Geology, 27(12), 1131–1134.
Lambiel, C. and Delaloye, R., 2004. Contribution of real-time kinematic GPS in the study of creeping mountainpermafrost: examples from the Western Swiss Alps. Per-mafrost and Periglacial Processes, 15, 229–241.
Martí, M. and Serrat, D., 1995. Les glaceres rocallosespirenenques. Terra, 25 (X), 24–34.
Martínez de Pisón, E. and Arenillas, M., 1988. Los Glaciaresactuales del Pirineo Español. In: La nieve en el pirineoespañol, Ministerio de Obras Públicas y Urbanismo,Madrid. 29–98.
Matías, J., Sanjosé, J.J. and Berenguer, F., 2012. Restitutor:desarrollo de técnicas automáticas para la creación demodelos 3D, In: TOPCART12. Congreso de Topografíay Cartografía, Madrid.
Matías, J., Sanjosé, J.J., López-Nicolás, G., Sagües, C. andGuerrero, J.J., 2009. Photogrammetric methodology forthe production of geomorphologic maps: application onthe Veleta rock glacier (Sierra Nevada, Spain). RemoteSensing, 1, 829–841.
Salvador-Franch, F., Gómez-Ortiz, A., Salvà-Catarineu, M.and Palacios, D., 2011. Caracterización térmica de lacapa activa de un glaciar rocoso en medio periglaciar dealta montaña mediterránea. El ejemplo del Corral delVeleta (Sierra Nevada, España). Cuadernos de Investi-gación Geográfica, 37 (2), 25–48.
Sanjosé, J.J., 2003. Estimación de la dinámica de los glaci-ares rocosos mediante modelización ambiental y técni-cas fotogramétricas automáticas. Tesis doctoral.Universidad Politécnica de Valencia, Valencia. 379 p.
Sanjosé, J.J., Atkinson, A., Gómez-Ortiz, A. and Salvador-Franch, F., 2007a. Glaciar rocoso del Corral del Veleta(Sierra Nevada): aplicaciones geomáticas en el periodo2001–2006. Topografía y Cartografía, 141, 8–17.
Sanjosé, J.J., Atkinson, A., Kaufmann, V., Gómez-Ortiz, A.,Salvador-Franch, F., Serrano, E. and González-Trueba,
J.J., 2010. Técnicas geomáticas aplicadas al control delos glaciares rocosos. Comparación de los glaciaresrocosos de Doesen (Alpes), Posets (Pirineo) y Corral delVeleta (Sierra Nevada). Revista Cartográfica, 85–86,45–62.
Sanjosé, J.J., Atkinson, A., Salvador-Franch, F. andGómez-Ortiz, A., 2007b. Application of geomatic tech-niques in controlling of the dynamics and cartography ofthe Veleta rock glacier (Sierra Nevada, Spain). Zeitschriftfür Geomorphologie, 51, 79–89.
Serrano, E. and Agudo, C., 1997. Los glaciares rocosos de losPirineos. Implicaciones ambientales. In: Gómez Ortíz, A.,Salvador Franch, F., Shulte, L. and García Navarro, A.(eds), Procesos biofísicos actuales en medios fríos. Estu-dios recientes. Universidad de Barcelona, Barcelona.133–154.
Serrano, E. and Agudo, C., 2004. Glaciares rocosos y degla-ciación en la alta montaña de los Pirineos aragoneses(España). Boletín de la Real Sociedad Española de His-toria Natural, 99, 159–172.
Serrano, E. and Rubio, V., 1989. El glaciar rocoso activo delas Argualas (Pirineo Aragones). Ería, 19–20, 195–198.
Serrano, E., Agudo, C. and Martínez de Pisón, E., 1999.Rock glaciers in the Pyrenees. Permafrost and Perigla-cial Processes, 10, 101–106.
Serrano, E., González-Trueba, J.J. and Sanjosé, J.J. 2011a.Dinámica, evolución y estructura de los glaciares rocososde los Pirineos. Cuadernos de Investigación Geográfica,37 (2), 145–170.
Serrano, E., González, J.J., Sanjosé, J.J. and Del Río, L.M.,2011b. Ice patch origin, evolution and dynamics in atemperate maritime high mountain: the Jou Negro, Picosde Europa (NW Spain). Geografiska Annaler, 93 (2),57–70.
Serrano, E., Martínez de Pisón, E., Cantarino, I. andNavarro, J., 1991. El glaciar noroccidental del Besiberri(Pirineo de Lérida). Pirineos, 137, 95–109.
Serrano, E., Sanjosé, J.J. and Agudo C., 2006. Rock glacierdynamics in a marginal periglacial high mountain envi-ronment: Flow, movement (1991–2000) and structure ofthe Argualas rock glacier, the Pyrenees. Geomorphology,74, 285–296.
Serrano, E., Sanjosé, J.J. and González, J.J., 2010. Rockglacier dynamics in marginal periglacial environments.Earth Surface Processes and Landforms, 35 (11), 1302–1314.
Serrano, E., Sanjosé, J.J., Silió, F.and Agudo, C., 1995. Mov-imiento superficial del glaciar rocoso de las Argualas.Pirineos, 145–146, 103–110.
Serrat, D., 1979. Rock glacier morainic deposits in theeastern Pyrenees. In: Schluchter, C. (ed.), Moraines andVarves. A. A. Balkema, Rotterdam. 93–100.
Soutadé, G., 1980. Modelé et dynamjque actualle des ver-sants supraforestiers des Pyrénées Orientales. Imprim-erie Coopérative du Sud-Ouest, Albi. 452 p.
Whalley, W. and Martin, H.E., 1992. Rock glaciers: a review.Part II: models and mechanisms. Progress in PhysicalGeography, 11, 127–186.
Manuscript received 29 Sep., 2013, revised and accepted 5Mar., 2014
GEOMATICS TECHNIQUES APPLIED TO GLACIERS, ROCK GLACIERS, AND ICE PATCHES IN SPAIN (1991–2012)
© 2014 Swedish Society for Anthropology and Geography 321