Integrating geomatics in archaeological research at the site of Thorikos (Greece)
19
Integrating geomatics in archaeological research at the site of Thorikos (Greece) Cornelis Stal 1* , Kim Van Liefferinge 2 , Jeroen De Reu 2 , Roald Docter 2 , Guy Dierkens 2 , Philippe De Maeyer 1 , Sophie Mortier 2 , Timothy Nuttens 1 , Thomas Pieters 2 , Floris van den Eijnde 3 , Winfred van de Put 2,4 , Alain De Wulf 1 1 Department of Geography, Ghent University, Belgium 2 Department of Archaeology, Ghent University, Belgium 3 Department of History, University of Utrecht, The Netherlands 4 Department of Archaeology, University of Amsterdam, The Netherlands * Corresponding author: [email protected] Ghent University, Department of Geography. Krijgslaan 281 (S8, WE12), 9000, Ghent (BELGIUM) Tel: +32(0)9 264 46 56. Fax: +32(0)9 264 49 85 Abstract Archaeological excavation is a destructive process, making accurate, fast and efficient 3D documentation of information essential. With this in mind, our research uses an integrated workflow of topographic measurements and image-based 3D modelling to generate highly accurate reconstructions of archaeological features at the site of Thorikos, Greece. Topographic ground control points and images are acquired using a total station and consumer digital camera respectively, and processed in a highly automated workflow using Structure from Motion and Multiview Stereo reconstruction software. These models were generated on a daily basis in order to map the on-going of a field campaign at this archaeological site in 2012. Moreover, a management system is presented as a consultation and analysis application, enabling the interaction with the 3D models, accompanied with attribute data and metadata. For the efficiency of the management system it was essential to integrate the 3D models in a Harris matrix. This matrix functions as an intermediate between a graphical user interface and the database system. Additionally, two applications of these 3D models are presented, focussing on capacity calculations and in situ mapping (orthophoto mapping) of stone wall remains. The presented management system, the linking of 3D models with excavation data, and the use of 3D models as a scientific tool demonstrate the huge potential of 3D data for archaeological research. Keywords: 3D modelling; data management; excavation; Geomatics; SfM-MVS; Thorikos 1. Introduction Next to range-based 3D modelling techniques (Pavlidis et al., 2007), image-based 3D modelling is increasingly applied in archaeology and heritage studies in recent years (e.g. Plets et al., 2012; Koutsoudis et al., 2013; Verhoeven et al., 2012). Among these, several studies have already illustrated the potential of image-based 3D modelling for the recording of archaeological excavations (De Reu et al., 2013; De Smedt et al., 2013; Dellepiane et al., 2013; Doneus et al., 2011; Forte et al., 2012; Pollefeys et al., 2000; 2003). Many studies have also shown that 3D modelling is a useful alternative when excavation is not an option or when it is not required. Airborne data acquisition is well known for archaeology and cultural heritage (Hendrickx et al., 2011; Koller et al., 2009; Remondino, 2011). Furthermore, terrestrial laser scanning and close-range photogrammetry are frequently used for the documentation, reconstruction and management of archaeological sites and cultural heritage (Boehler
Transcript of Integrating geomatics in archaeological research at the site of Thorikos (Greece)
Integrating geomatics in archaeological research at the site of Thorikos (Greece)
Cornelis Stal1*, Kim Van Liefferinge2, Jeroen De Reu2, Roald Docter2, Guy Dierkens2, Philippe De Maeyer1, Sophie
Mortier2, Timothy Nuttens1, Thomas Pieters2, Floris van den Eijnde3, Winfred van de Put2,4, Alain De Wulf1
1 Department of Geography, Ghent University, Belgium 2 Department of Archaeology, Ghent University, Belgium
3 Department of History, University of Utrecht, The Netherlands 4 Department of Archaeology, University of Amsterdam, The Netherlands
* Corresponding author: [email protected]
Ghent University, Department of Geography. Krijgslaan 281 (S8, WE12), 9000, Ghent (BELGIUM)
Tel: +32(0)9 264 46 56. Fax: +32(0)9 264 49 85
Abstract
Archaeological excavation is a destructive process, making accurate, fast and efficient 3D
documentation of information essential. With this in mind, our research uses an integrated workflow of
topographic measurements and image-based 3D modelling to generate highly accurate reconstructions
of archaeological features at the site of Thorikos, Greece. Topographic ground control points and images
are acquired using a total station and consumer digital camera respectively, and processed in a highly
automated workflow using Structure from Motion and Multiview Stereo reconstruction software. These
models were generated on a daily basis in order to map the on-going of a field campaign at this
archaeological site in 2012. Moreover, a management system is presented as a consultation and analysis
application, enabling the interaction with the 3D models, accompanied with attribute data and metadata.
For the efficiency of the management system it was essential to integrate the 3D models in a Harris
matrix. This matrix functions as an intermediate between a graphical user interface and the database
system. Additionally, two applications of these 3D models are presented, focussing on capacity
calculations and in situ mapping (orthophoto mapping) of stone wall remains. The presented
management system, the linking of 3D models with excavation data, and the use of 3D models as a
scientific tool demonstrate the huge potential of 3D data for archaeological research.
Keywords: 3D modelling; data management; excavation; Geomatics; SfM-MVS; Thorikos
1. Introduction
Next to range-based 3D modelling techniques (Pavlidis et al., 2007), image-based 3D modelling is
increasingly applied in archaeology and heritage studies in recent years (e.g. Plets et al., 2012;
Koutsoudis et al., 2013; Verhoeven et al., 2012). Among these, several studies have already illustrated
the potential of image-based 3D modelling for the recording of archaeological excavations (De Reu et
al., 2013; De Smedt et al., 2013; Dellepiane et al., 2013; Doneus et al., 2011; Forte et al., 2012; Pollefeys
et al., 2000; 2003). Many studies have also shown that 3D modelling is a useful alternative when
excavation is not an option or when it is not required. Airborne data acquisition is well known for
archaeology and cultural heritage (Hendrickx et al., 2011; Koller et al., 2009; Remondino, 2011).
Furthermore, terrestrial laser scanning and close-range photogrammetry are frequently used for the
documentation, reconstruction and management of archaeological sites and cultural heritage (Boehler
and Marbs, 2004; Tack et al, 2005). The flexibility of both techniques allows to generate high quality
3D models of a wide range of different relicts and artefacts. Even when sites have contaminated or when
sites are politically sensitive or environmentally sensitive, it is possible to generate 3D models. The
ability to perform contact-free measurements is therefore a huge advantage for these techniques.
Specifically for close-range photogrammetry, additional advantages of the methodology are the high
geometric accuracy of the 3D models, the clear procedure for the recordings and the photorealistic
texture. Furthermore, one can proceed from a traditional 2D documentation to a more realistic 3D
documentation of the archaeological heritage (e.g. De Reu et al., 2013). And finally, 3D excavation data
often have an important and attractive visual character (Hermon, 2008). Because an archaeological
excavation is a destructive process (Lucas, 2001), it requires highly accurate visual and scientific
recording techniques. Besides its visual value, the scientific value of 3D modelling for the study of
archaeological excavations is significant.
Although 3D models have already been used in archaeological research for some years, the construction
of these models has sometimes been restricted to the finalisation phase of the archaeological excavation.
However, there are examples of the construction of 3D models during excavations, where the advantages
of this technique are stress out (Losier et al., 2007; De Reu et al., 2014). An important question we have
to answer is how this 3D data can be made accessible, manageable and usable among the excavators
during the excavation and in the post-processing phase of the excavation. Large amounts of data are
difficult to manage without a powerful database system, especially when a sufficient infrastructure is
absent. Therefore, this paper investigates the implementation of a user-friendly management system for
very large 3D data sets, by linking the models with the Harris-matrix of the excavation. The combination
of the Harris matrix with 3D models allows a better insight on the site formation processes. A thorough
understanding of the different relations between features in time and space, as presented by these 3D
models, is facilitated by a solid data management. Consequently, the human interactions on the site can
be understood during the occupancy of the site. Furthermore, we explore two different applications on
how the 3D models can be used as base data for spatial analysis related to excavators. First, the
calculation of the volume or capacity of the cistern is explored and discussed. These calculations enable
the estimation of the volume or capacity of the reservoir. Second, the generation of orthophotomaps,
extracted from the 3D models, is explored as a tool for the contour mapping of stone walls. These
orthophotomaps are augmenting the traditional 2D manual recordings (e.g. drawings) to be used as an
excavation plan during the archaeological fieldwork and enable off-site feature digitalization.
2. The archaeological site of Thorikos, Greece
The archaeological site of Thorikos is located on the Velatouri Hill in southeast Attica (Greece, Figure
2-1), an area known for the presence of rich silver deposits. Since the late Neolithic, the history of the
region was largely determined by the exploitation and processing of these mineral resources. Mining
activities boomed especially during the Classical (400-323 BC) and the Early Hellenistic period (323-
250 BC), but also during the Late Classical period (400-500 AD) (Kakavoyiannis, 2005), when a large
amount of ore processing workshops consisting of an ore washery, a cistern and living quarters, were
scattered over the Laurion. Especially cisterns were vital, since water was an indispensable resource in
the silver production process.
To date, thirteen of such workshops have been recorded in Thorikos. In this paper, focus will be on the
so-called ‘Cistern no.1 workshop’, named after its eye-catching water reservoir and located north of the

‘Industrial Quarter’ (Figure 2-2, red ellipse). Thoroughly studied parts of this workshop were excavated
during three short campaigns (2010-2012, e.g. Van Liefferinge et al., 2011a) within the framework of a
wider research project on water use and management at Thorikos and the Laurion region (Van
Liefferinge et al., 2013). Given that the cistern of this workshop is by far the largest water reservoir of
the site, its closer study is particularly valuable for this project.
Figure 2-1: Overview of the Attica province in Greece
In the summer of 2012, an intensive archaeological campaign was organized on the ancient site of
Thorikos (Greece) by the department of Archaeology of Ghent University (Belgium) and the department
of History of the University of Utrecht (the Netherlands). One of the aims of this campaign was to finish
the documentation of a large cistern and its surroundings north of the ‘Industrial quarter’. To be more
precise, work was concentrated on two zones. First, a sounding was dug in the basin of the cistern in
order to establish its capacity and date of abandonment. Given its extensive size and the nature of the
filling (primarily consisting of large rocks tumbled into the cistern), it was not feasible to clear the entire
basin. Therefore, work was concentrated on one zone (A) only (Figure 2-3). Secondly, a room built
against the south wall of the cistern was investigated, with the aim to recover dates on the chronology
of the cistern (construction date and date of use). Light would be shed on the use of two overflow
channels. Two small trenches were dug in this room, focussing on each of these channels: Zone F was
located in the east and Zone G in the west.

Figure 2-2: Overview of the Thorikos archaeological site
Figure 2-3: Detailed map of the Cistern no 1 workshop.
In general, the stratigraphic conditions of the excavations in Thorikos are very complex. Being a multi-
period site, the majority of the houses and workshops knew multiple occupation phases, during which
many adjustments to the buildings were made. Since the investigated zone is no exception, it is
imperative to record the excavated contexts meticulously, in order to make a sound interpretation of the
stratigraphy. Furthermore, the partial excavation of the cistern involves some problems. The cistern has
an irregular outline, with planimetric dimensions of approximately 9.0 m x 7.5 m and an estimated depth
of 4.9 m. The shape of the basin is rather unconventional in comparison with other cisterns in the region.
The cistern is subdivided in two parts: the actual basin, which was nicely carved into the rock, and a
higher zone in the north, which consists of unadjusted bedrock (E), likely to be used for drawing water
out of the basin by low water level. As a result, establishing the capacity of the cistern would not prove
to be an easy task. However, by introducing 3D modelling in the archaeological workflow, both
discussed issues can be approached in a comprehensive and more accurate way than in the case of
traditional archaeological methods.

3. Virtual reconstruction procedure
3.1. Data acquisition
During the excavation, a systematic series of images was taken and topographic measurements were
performed. At the beginning of the campaign, 30 ground control points (GCPs) were materialised using
a water resistant felt-tip pen and chalk. These markers were put on solid rock and an approximately
equal spatial distribution of the GCPs was guaranteed in all directions. Besides, the targets are situated
in and around the site, and especially in and around possible areas of special interest. After installing all
GCPs, these points were measured using a Trimble S6 robotic total station. A maximal absolute error of
1 cm for the free stationing was respected, which is acceptable considering the field conditions. This
configuration resulted in an absolute error of only a few cm, although the relative accuracy is related to
the image pixels, corresponding with a few mm. At the last day of the campaign, an intensive survey
was performed in order to get the overall picture of the exposed structures in the immediate
neighbourhood of the cistern. It was important that these GCPs were photographed from at least two
camera positions, in order to perform a model referencing. The targets were measured using a total
station and oriented within the local grid of the Thorikos site. The concrete poles on the edges of this
grid had already been measured during previous fieldwork (De Wulf et al., 2000). The transformation
parameters for the conversion between the local grid and UTM 35N coordinates were defined during
the 2000 field campaign. Control measurements on the physical condition of the grid were performed
in 2008 (Van Liefferinge et al., 2011b).
A large number of images were taken on a daily basis between 6 and 7 AM, in order to avoid cast
shadows on the excavated structures. A thorough cleaning was also performed, in order to avoid
unwanted elements in the models. The images were taken with a Canon EOS 400D digital single lens
reflex camera with a 10.1 Mp CMOS sensor and a Canon EF-S 18-55 mm lens. In order to use the
images for 3D modelling, it is required that the images are taken from different positions. Varying the
positions will yield a parallax and enables the calculation of object coordinates in a 3D space. A
systematic linear movement of the camera around the site (as visualized in Figure 3-1), is preferred for
the fast image processing, but this is not an absolute requirement. Randomly taken images may result in
correct 3D models as well, as long as each spot is covered by at least two images (Shashua, A. and
Werman, M., 1995), even for very complex structures. A constant quality check should be performed
during the acquisition and a surplus of images is advisable.
3.2. Structure from motion and multi-view stereo software
The 3D models are based on a Structure from Motion - Multi-View Stereo (SfM-MVS) processing
workflow (Lourakis and Argyros, 2009). SfM-MVS is implemented in different software, such as
Agisoft PhotoScan, and enables the generation of 3D models based on a large series of images. SfM-
MVS is a technique to reconstruct the camera acquisition parameters and to calculate a sparse point set
of the scene (SfM). Moreover, it is a technique to acquire the 3D geometry of an object, or a series of
objects (MVS), using a series of 2D images. Agisoft PhotoScan is used during this project and covers
the entire workflow from the impact of the original images to the highly accurate and textured 3D
meshes. In order to construct these 3D meshes, three basic steps are performed (Verhoeven, 2011): photo
alignment (SfM), geometry reconstruction (MVS) and texture mapping.

The first step in the SfM process is the automatic detection of feature points. Characteristic points have
to be localised on each image. Thereafter, corresponding points are detected on other images, resulting
in a set of matching points. Different methods have been developed for image matching, e.g. methods
based on region growing algorithms using seeding points (Heipke et al., 1992), or the use of a GCP
database (Chen et al., 2000). The algorithms are based on a least squares estimation, so the solution is
obtained by an error minimisation estimator (Gruen, 1985). In order to detect feature points and to
perform the image matching, local contrasts or non-equally coloured textures and non-shininess surfaces
on the objects are required. This is not a problem for the site of Thorikos, but can be problematic in
other projects, e.g. with white limestone or glass. Next to these feature points, the intrinsic image
parameters, like the image size and the focal length of the camera, are used to perform the iterative
bundle adjustment. The solution of this adjustment corresponds with the best fitting virtual
reconstruction of the image scene in a 3D space. By adding GPCs to this scene, external parameters are
calculated and accurately metric measurements will be possible in the model.
An initial visualization of the scene structure and the position and the orientation of the images is
illustrated in Figure 3-1, which already gives a good geometrical impression by the 3D visualization of
the feature points. This scene represents the zones F and G of the excavated site. The rectangles represent
each image used for the reconstruction, numbered by the name of the corresponding image. Based on
this figure, it is clear that the requirement of different positions is respected. The numbered dots with
flags represent the measured GCPs.
The 3D feature points are not used for the actual 3D reconstruction. A 3D mesh is generated based on
the intersection of perspective pixel rays, which is the actual MVS. These rays are projected according
to the image frames. The orientation and position of these frames are determined after the image
alignment. The focal lengths of the cameras are also used to define the linear projection parameters of
the 2D image pixel rays in a 3D space. The result of this project is a series of depth maps, representing
the distance between the focal centre of the camera and the intersection of perspective rays. A dense
point set is then created by combining these depth maps from differently oriented positions. These points
are hereafter triangulated into a mesh. A mesh simplification could be performed for computational
performance reasons. More detailed information about SfM-MVS is presented in an extensive
discussion by Robertson and Cipolla (2009) and Seitz et al. (2006).
During the geometric 3D reconstruction, a single colour value, based on averaged colour values of all
corresponding pixels from the different images, is assigned to each face in the mesh. A detailed and
photorealistic texture map is obtained using uv-mapping (Hülksen et al., 2007). The geometry is textured
by projecting the original images on the mesh. Each pixel of the resulting texture map is assigned to a
position on the mesh. The colour of this pixel is defined by a function of the weighted value of the
corresponding pixels from the original images (Wang et al, 2001). Figure 3-2 illustrates the concept of
UV-mapping, where the geometry of the site (1) is draped with the texture map of the site (2), in order
to have the textured 3D mesh (3). The model can be exported as a 3D virtual model in combination with
a separate texture map, in order to use the model in other software.

Figure 3-1: Scene structure with matched feature points and positioned and oriented images
Alignment parameters, like the number of feature points, and geometry reconstruction parameters, like
the number of faces and accuracy thresholds, were chosen so that the software would give the highest
possible quality. However, for the sake of performance of the visualisation of the 3D models in the
management system, the 3D mesh was limited to two million faces. The 3D models were described by
the Virtual Reality Modelling Language (VRML), with compressed JPEGs as separate texture maps
with 100 megapixels. Finally, digital elevation models (DEMs) or orthophotos were generated to
facilitate capacity calculations and conventional site interpretations.
3.3. Towards an archaeological management system
During the campaign, a total of 38 3D models were generated. These models covered the cistern, as well
as the room immediately to its south with a different level of detail. Special attention was given to two
trial trenches (Zone F and G). Apart from the 3D models, the data was supplemented with attribute data,
describing the non-spatial properties of the model. These data were processed in a time dependent
manner. It was obvious that this large amount of data required an efficient way of storing and consulting
the data. In this context, it was vital that the performance of the management system and the degree of
detail of the models were in equilibrium. An example of a random time series, representing the evolution
of the excavation in Zone G, is presented in Figure 3-3. A more detailed application of time series is
discussed in section 5.

Figure 3-2: Geometry (1) and texture (2) result in a textured 3D model (3)
Figure 3-3: Exemplary time series of Zone G
The graphic user interface (GUI) of the management system was split in four sections (Figure 3-4, left):
the Harris matrix, the actual 3D model, an overview map and a metadata table. The main feature within
the management and consultation system was the Harris matrix. This graph-based matrix structure
enabled the description of topological and chronological relations between archaeological objects and
stratigraphic units (Harris, 1989). During the field campaign, both elements were recorded as contexts
and documented by a large number of images. The relations between contexts were modelled and
visualised by the creation of a diagram, where nodes represented each context. The sequence of the
context and relation between other contexts were represented by directed graphs and by the layered
order of the nodes. Some useful software tools exist for the composition of a Harris matrix (Hundack et
al., 1997; Traxler and Neubauer, 2008). However, MS Visio was used for the composition, in order to
enable the visualisation of the model in a browser, without required plug-ins. The software also enabled
to put a hyperlink on every feature within the model, which enabled interaction between the model and
different objects in the interface.

Figure 3-4: Sketch (left) and conceptual view (right) of the management system
The static Harris matrix provided the actual interaction between the user and the management system.
Each node contained a Uniform Recourse Locator (URL) linking features in different databases that
were related to the specific context. The URL was processed as a query and controls the 3D model view,
the location on the map and the metadata view within the database management system (DBMS, Figure
3-4, right). The 3D model viewer received an URL and will manage the geometry and texture in the
appropriate container, pointing to a certain 3D visualisation plug-in. The URL may optionally contain
of a view point definition, defining the virtual camera position, orientation and coordinates of the focus
point, where the camera points should aim at. The Virtual Reality Modelling Language (VRML) was
chosen to describe the 3D models. Although this language is already succeeded by X3D, VRML is still
a frequently used language for the description of virtual reality in archaeology and cultural heritage
(Mendes et al., 2012; Rua and Alvito, 2011). Because of its frequent usage, VRML is supported by
many commercial and non-commercial 3D viewers. When a specific context is selected, the
corresponding 3D model will be loaded using a 3D visualization browser plug-in.
The URL also requests for a map, which is loaded as a static image of the site provided with a marker
at the context’s location. The map window represents the precise location. In a later stadium, it should
be possible to manipulate the database using an interactive map interface. Such system may be
implemented as a web feature service (WFS) or web mapping service (WMS). For this pilot study, the
static map was used, loaded as portable network graphic (PNG). The base layer of this map was equal
to the topographic measurement map of Figure 2-3. An overview of the architecture of the prototype
management system is presented in Figure 3-5. The Harris matrix is used by the client to request data.
Each node is linked with its corresponding context. This context is the main identifier to a date, a series
of topographic measurements and metadata. The coordinates are linked with a GIS (Geographic
Information System), in order to generate a map. In further steps, the implementation of a WFS or WMS
is foreseen, as well as the assignment of a viewpoint to each coordinate (Koutsoudis et al., 2013).

Figure 3-5: Architecture of the prototype management system
These viewpoints may highlight objects of special interest in the 3D model, but in the current
implementation, an overview point suffices. The implementation of these concepts resulted in the actual
version of the management system, with a graphical user interface presented in Figure 3-6.
Figure 3-6: Screenshot of the management system, as implemented in the current version
In contrast with many other management systems, the presented implementation is not a final product
for the analysis and visualisation of the data. During the excavation and the post-processing of the finds,
many more data can be added to the system, from the field sheets of the excavated contexts to the artefact
database. This requires a large degree of flexibility of the management system for adding, removing and
modifying data. This important aspect is respected by implementing more complex protocols, like PHP
and SQL.
4. Other advanced applications
Besides the advantages of 3D modelling in the archaeological workflow of an excavation, it can also
have its use in more specific applications.
4.1. Capacity calculation of the cistern
In the context of this excavation and the wider research questions, a capacity calculation was a
particularly valuable technique. As mentioned above, a careful water management was crucial for the
metallurgical activities at Thorikos. A definition of the capacity of the site’s largest water reservoir will
contribute to our knowledge on the production output of the individual workshop and on a larger scale,
of Thorikos as an industrial site.
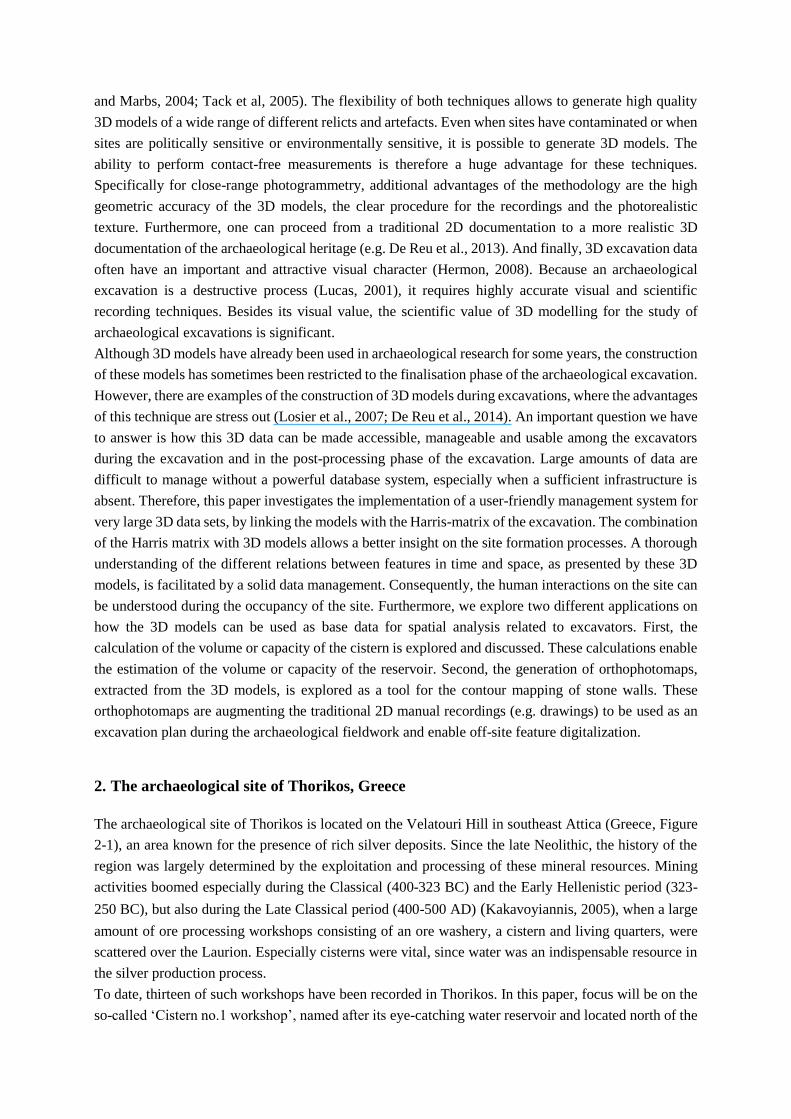
Figure 4-1: Screenshots of 3D model of the cistern after partial excavation (for dimensions: Figure 4-2)
Figure 4-1 shows several viewpoints of the 3D model of the cistern, built by using image-based 3D
modelling and total station measurements. Since the 3D model was constructed using a series of GCPs,
a horizontal reference plane could be defined. The elevation values were then projected on this plane, in
order to generate a Digital Elevation Model (DEM). This DEM and some characteristic elevation points
are visualised in Figure 4-2. Elevations (or depths) in this figure are related to the original surface, which
is used as a reference level. By converting the 3D model to a DEM, the geometric complexity was
reduced to 2.5D. This implies that every planimetric position had only one elevation value. Thus, it was
not possible to model overhanging parts in the DEM and volumes covered by these overhangs were not
included in the total capacity calculation.
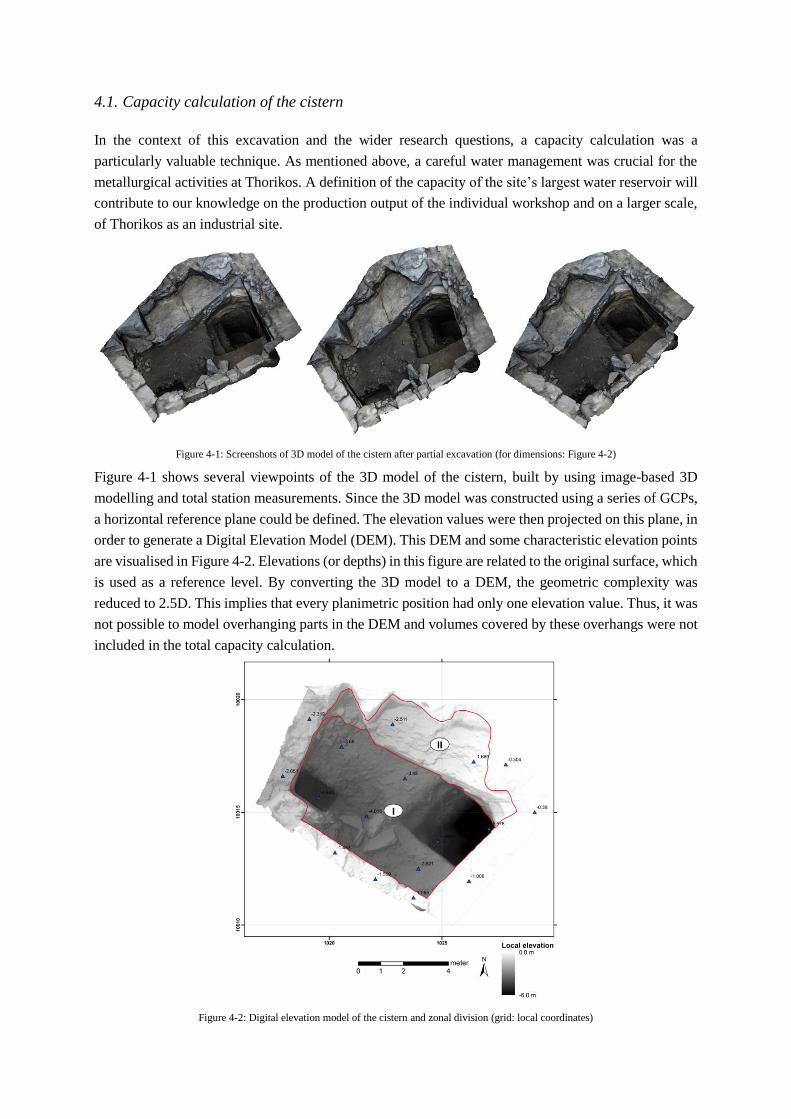
Figure 4-2: Digital elevation model of the cistern and zonal division (grid: local coordinates)

The cistern can be divided into two zones, both used for water storage, as demonstrated in Figure 4-2.
The first zone (I) was excavated until an elevation of -6.0 m, where the bottom of the cistern was reached,
corresponding with zone A in Figure 2-2. Other points in this zone, with an elevation of up to -3.5 m,
remained unexcavated. Based on other fully excavated cisterns elsewhere in the region, it was assumed
that the elevation of the entire bottom of the cistern is equal to -6.0 m. The second zone (II) consisted of
bare rock with elevations between -2.5 m and -1.7 m and corresponds with zone E in Figure 2-2. The
total capacity was calculated as the sum of the two separate volumes of zone (I) and zone (II), with an a
priori reference plane at an elevation of -1.1 m. This was the elevation of the highest stone at the southern
partition wall. It was assumed that this reference plane is horizontal and perpendicular to the gravity
normal.
The volume of zone (I) was calculated by taking the area of the convex hull of this zone, which was
39.02 m2. The a priori maximal elevation was -1.1 m, whereas the minimal elevation was -6.0 m,
corresponding with a range of 4.9 m. The volume of zone (I) was then equal to 191.2 m3. The solid rock
surface of zone (II) was totally excavated and sloping, so a grid-wise volume calculation was used. For
each pixel within the convex hull, the difference between the elevation of that pixel and the elevation of
the reference plane was calculated. The resolution of the DEM was equal to 0.01 m2 and the total area
of zone (II) was equal to 17.9 m2. The volume of zone (II) was thus equal to the sum of all elevation
differences times the area of the zone, corresponding with 18.42 m3. Consequently, the total capacity of
the cistern was equal to 209.6 m3.
4.2. Detailed wall mapping
The composition of stone suffers from important errors, which are caused by, inter alia, erroneous grid
construction and usage, human subjectivity and, environmental conditions in terms of temperature,
humidity and comfort, etc.
Figure 4-3: Stone plan and orthophoto (middle) of the intersecting area of Wall 2 and Wall 3, manual (left) and orthophoto digitising (right)
As mentioned in section 3, one of the products of a SfM-MVS workflow is an orthophoto. In contrast
with a conventional image, containing a central perspective, the advantage of such an image is the
absence of geometrical deformations, caused by the orthogonal projection of the image on a DEM. As
a result, orthophotos are very useful for in situ mapping. Characteristic lines were traced manually or
with the use of edge detection filters. The result of this procedure is demonstrated in Figure 4-3 (right),
where the lines represent the stone outlines.
A visual comparison between the manual stone mapping and orthophoto-based stone mapping states the
difference of the two approaches. In spite of the much smoother polylines in the manual map, a
misalignment with the orthophoto was apparent. This is most clear in the southernmost part of the image.
Furthermore, several break lines or marginal ridges were not or not correctly mapped, due to the often
difficult conditions on field (visibility, heat, time, etc.) … The orthophoto-based vector map had a much
better correspondence with the degree of detail of the orthophoto itself. This stresses out the user
dependency of the results of both techniques. However, since these maps could be made in post-
processing, and thus off-site, the extra time required for the orthophoto generation is partially
compensated by a significant saving of time during the excavation itself.
5. Discussion
Virtual 3D models were generated systematically on a daily base sequence, in order to evaluate the
excavation process and to place the archaeological contexts in a correct spatial neighbourhood. During
the campaign, almost 3000 images were taken and topographic measurements were performed. These
data were used for the construction of 38 digital 3D models of the excavation site. As demonstrated in
this paper, the advantages of using 3D models are manifold and apply on all phases of the archaeological
workflow. In contrast with conventional archaeological data processing, the entire processing chain was
digital and the research results in a systematic DEM of the evolution of the excavation during the three-
week campaign. The models allowed the archaeologist to perform intensive research on different
contexts in a digital 3D environment, even when this context had been removed. As a result, the
presented DEMs were useful for in situ documentation, interpretation and management. Besides, the
absolute orientation of the models by topographic means enabled geometric evaluation archaeological
objects in post processing, the definition of topological relations between contexts and the construction
of a wide range of derivatives, like orthophoto plans, wall drawings and contour line maps.
The 3D data facilitated to correlate, re-assess and re-assembly the sometimes fragmented information
obtained during the excavation and the post-processing of the acquired data (Katsianis et al., 2008).
Purely practically speaking, it guaranteed a smoother continuation of the activities on site, since a large
part of the drawing was consciously postponed to the post-processing phase. Especially in
Mediterranean excavations, where a regular day of an archaeological campaign is usually divided in
excavating before noon and data processing in the afternoon, this methodology could easily be adopted.
Newly recorded walls were for example photographed during the excavation in the early morning and
subsequently modelled and drawn in the office in the afternoon. Furthermore, excavation units could
more easily be investigated. Measurements could be performed from all angles, section cuttings could
fluently be created and volumes calculated. Vertical sections were an extremely important tool in
archaeology to record stratigraphic sequence (Zhukovsky, 2002). 3D models enabled to cut cross-
sections off-site and wherever they were considered to be profitable, whereas on field only a restricted
amount of cross-sections can be created due to time constraints. Another important advantage of the use
of 3D models is the fact that visual obstacles can be removed easily. The only requirement is that the
study object behind the obstacle is photographed in accordance with the rules (e.g. enough contrast,
overlap and different acquisition positions or non-zero baselines) of image-based modelling. An
example from this case study is the fact that the Greek Heritage Authorities were reluctant to grant the
removal of olive tries on the site. One of these trees is in the middle of zone F, obscuring some important
structures in a wider context from different viewpoints. It is easy to ignore this tree during the 3D

reconstruction, resulting in an obstacle-free visualisation. This concept is clearly visible in Figure 5-1,
where the original photograph (left) and the 3D reconstruction (right) correspond with the same
viewpoint.
Figure 5-1: Photograph (left) and 3D reconstruction (right) of zone F, demonstrating the advantageous effect of virtual obstruction removal
It must be mentioned that the proposed methodology may suffer from some drawbacks. The
environmental conditions at the Greek site oblige to take the images at a limited time frame at dawn and
after carefully cleaning the site. This implies that the excavation should be put on hold for a few
moments. The quality of the markers has to be verified frequently and all objects on the site have to be
terrestrially photographed. This is also an advantage of the methodology, since this systematic coverage
is guaranteed with high accuracy and high resolution. Furthermore, since it is not preferred to perform
the excavations as a function of the 3D data acquisition, the images can also be taken using sun screens
in order to avoid shades. In the case of the Thorikos excavation in 2012, the working area was limited
and could be fully covered by terrestrial images. If the site has larger dimensions or if the objects on the
site are too complex to fully cover terrestrially, the use of a low cost Unmanned Aerial Vehicle (UAV)
would be a very useful alternative (Pérez et al., 2013). Such a flying platform extends the spatial extend
of the image acquisition and also enables to cover difficultly reachable areas. Notwithstanding these two
different acquisition methodologies, the result is a series of images that have to be processed using the
same workflow. In our case, both the site cleaning and the acquisition of the images required only twenty
to thirty minutes. The excavation started immediately after the image acquisition, altering the entire
scene. The image acquisitions should be immediately successful, as the recording can only be done once.
This requires profound training and photogrammetric expertise.
The post-processing of the images is frequently considered as a time consuming process, motivated by
the performance of conventional photogrammetric procedures. Earlier research demonstrates that the
image processing workflow require a few minutes to a few hours, depending on the desired processing
parameters (Doneus et al., 2011). After selecting correct images, defining GCPs on the images and fine-
tuning the parameters, most of this time goes to the reconstruction itself, which does not require human
interaction but is fully automated.
During many excavation campaigns, a total station and a digital camera are standard equipment.
Consequently, no extra on-site hardware and resulting costs are needed. Agisoft Photoscan, which is
commercial software, was used for the 3D reconstruction and requires a powerful computer. In fact, this
is the only additional cost, but one could also opt for open-source software (Kersten and Lindstaedt,
2010). Next to the expertise on the data acquisition, a thorough knowledge about the processing is
indispensable. Recent publications about the use of 3D modelling in archaeological research indicate
3D modelling is already applied for entire sites (Verhoeven et al., 2012), but also for soil profiles (De

Reu et al., 2014) or rock art (Fritz and Tossello, 2007). These projects are just an example of the much
recent projects where 3D models and digital orthophotos facilitate archaeological research.
Capacity calculations were employed to estimate volumes of soil samples in relation to the excavation
unit volume and to calculate the amount of earth still to dig (Losier et al., 2007). The geometric accuracy
of these products is high, especially in comparison with many manually generated equivalents. Within
the framework of the Thorikos excavation, it proved to be a particularly useful tool to define the capacity
of ‘Cistern no.1’. Due to the restricted time frame in which the campaign had to be conducted, it was
only possible to clear one zone of the basin (zone A). Nonetheless, the model allowed the creation of an
accurate assessment of its capacity. An extra advantage of working with image-based 3D modelling was
that the texture and colour of the soil and archaeological features is also recorded. Investigating
archaeological contexts through 3D models was therefore not only more accurate, but also more realistic.
Up-to-date 3D information about the progress of the excavation is essential for various reasons:
It facilitates the decision making about the further continuation of the campaign: new areas of
interest, additions to existing areas or even adjustments on the excavation strategy can be
defined by the interpretation of the latest DEMs and orthophotos.
It enables fast exchange of information between the excavators and finds processors: on the one
hand, excavators can assign their findings to specific context by creating a digital link between
the feature and the model. On the other hand, finds processors can directly implement the results
of their analysis in the model allowing a better focus on specific areas of the site.
It allows the extension of a temporal GIS: contexts are modelled as closed 3D models. When a
Harris matrix is used as a conceptual model of the topological relations between features, the
3D GIS with temporal attribute forms the physical representation of the site. Temporal attributes
enables the easy definition of relations between different features and they may assist in a better
understanding of the spatial distribution of phenomenon.
The large number of 3D models requires the implementation of some management environment, in order
to enhance flexibility of the consultation and analysis of the models. Parallel with the daily construction
of the 3D models, a Harris matrix was generated for the documentation of different topological and
chronological relations. Since the same relations exist between different successive 3D models, it would
be obvious to generate a link between the Harris matrix and the virtual reconstructions. Not only is the
Harris matrix simultaneously generated during the campaign, its interpretation is common practice in
archaeological sciences. As a result, the conceptual file structure of the models within the matrix does
not require much effort for the field expert. Implementing the system in an online server-client based
environment improves the efficiently of the research work, as well as the visibility of the Thorikos-
project for a wider public.
6. Conclusion
In this paper, we demonstrated the use and management of archaeological 3D data. The 3D data were
collected during an excavation campaign of the Cistern no.1 workshop in Thorikos, Greece in 2012. It
involved topographic measurements and a large series of images. The data were processed in a SfM-
MVS based workflow, resulting in a series of daily 3D models of specific areas of interest. The large
number of models enabled the monitoring of the course of the excavation in a highly detailed and
accurate way, enhancing the interpretation of the contexts. However, the efficient and clear management

of these data was indispensable. We presented a management system focussing on the requirements of
fast model visualisation, clear metadata consultation and the ability to use the data for advanced analysis.
Using the system’s architecture, it was also possible to add, remove and modify data in a transparent
way. The implementation of more advanced protocols, like PHP and SQL, in the presented prototype,
improves the performance of the system and will be done in the near future.
We also demonstrated the advanced use of 3D models to answer archaeological research questions or to
improve the quality of the archaeological excavation documentation. Two examples were presented,
focussing on capacity calculations and in situ mapping of stone wall remains. Within the framework of
the Thorikos site, the calculation of the capacity of the cistern was essential for the research on the water
management within its industrial context. An accurate and mobile procedure of calculating capacity was
therefore indispensable. The presented SfM-MVS approach fitted these requirements. A second
application was the use of SfM-MVS-based orthophotos for mapping. Based on a visual comparison,
the orthophoto-based digitalisation of stone outlines tended to give significantly better results than its
manual-visual counterpart.
Acknowledgement
This research is part of the research project “3D CAD modelling of spatial architectural volumes, using
terrestrial laser scanning and LiDAR” (G082309N of the Fund for Scientific Research Flanders (FWO).
This project is promoted by Prof. Dr. Ir. A. De Wulf, Prof. Dr. Ph. De Maeyer, Prof. Dr. N. Van De
Weghe, Prof. Dr. S. Gautama, Prof. Dr. R. De Meyer and Arch. M. Mattys. The authors would like to
acknowledge the support of FWO-Flanders.
References
Boehler, W., Marbs, A., 2004. 3D scanning and photogrammetry for heritage recording: a comparison,
12th Conference of Geoinformatics - Geospatial Information Research: Bridging the Pacific and
Atlantic, Gävle, Sweden, pp. 291-298.
Chen, L., Lo, C., Liu, C., Chen, A., 2000. Orientation modeling by matching image templates of a GCP
database, 21th Asian Conference on Remote Sensing, Kuala Lumpur, Malaysia, pp. 6 (on CD-ROM)
De Reu, J., Plets, G., Verhoeven, G., De Smedt, P., Bats, M., Cherretté, B., De Maeyer, W., Deconynck,
J., Herremans, D., Laloo, P., Van Meirvenne, M., De Clercq, W., 2013. Towards a three-dimensional
cost-effective registration of the archaeological record. Journal of Archaeological science 40(2),
1108-1121.
De Reu, J., De Smedt, P., Herremans, D., Van Meirvenne, M., Laloo, P., De Clercq, W., 2014. On
introducing an image-based 3D reconstruction method in archaeological excavation practice. Journal
of Archaeological Science 41 (January), 251-262.
De Smedt P., Van Meirvenne M., Herremans D., De Reu J., Saey T., Meerschman E., Crombé P., De
Clercq W., 2013. The 3-D reconstruction of medieval wetland reclamation through electromagnetic
induction survey. Scientific Reports, 3 (1517). pp. 5.
De Wulf, A., Van Herck, T., De Dapper, M., De Vliegher, B.M., 2000. Analysis of the efficiency in
archaeology of GPS satellite surveying versus classical surveying using totalstations: Applications
in the Thorikos region and on the Pyrgari (Greece), in: Vermeulen, F., De Dapper, M. (Eds.),
Geoarchaeology of the Landscapes of Classical Antiquity, pp. 19207.

Dellepiane M., Dell’Unto N., Callieri M., Lindgren S., Scopigno R., 2013. Archeological excavation
monitoring using dense stereo matching techniques. Journal of Cultural Heritage 14 (3), 201-210.
Doneus M., Verhoeven G., Fera M., Briese C., Kucera M., Neubauer W., 2011. From Deposit to Point
Cloud - A Study of Low-Cost Computer Vision Approaches for the Straightforward Documentation
of Archaeological Excavations. In: Čepek A. (Ed.). XXIIIrd International CIPA Symposium, Prague,
12-16 September 2011. Geoinformatics, 6. Faculty of Civil Engineering, Czech Technical
University, Prague: 81-88.
Forte M., Dell’Unto N., Issavi J., Onsurez L., Lercari N., 2012. 3D Archaeology at Çatalhöyük.
International Journal of Heritage in the Digital Era, 1 (3): 351-378.
Fritz, C., Tosello, G., 2007. The hidden meaning of forms: methods of recording Paleolithic parietal art.
Journal of Archaeological Method and Theory 14 (1), 48-80.
Gruen, A., 1985. Adaptive least squares correlation: a powerful image matching technique. South Africa
Journal of Photogrammetry, Remote Sensing and Cartography 14 (3), 175-187.
Harris, E., 1989. Principles of archaeological stratigraphy. Academic Press, London, UK.
Heipke, C., Kornus, W., Strunz, G., Thiemann, R., Colomina, I., 1992. Automatic photogrammetric
processing of Spot imagery for point determination, DTM generation and orthoprojection.
International Archives of Photogrammetry and Remote Sensing 29 (4), 465-471.
Hendrickx, M., Gheyle, W., Bonne, J., Bourgeois, J., De Wulf, A., Goossens, R., 2011. The use of
stereoscopic images taken from a microdrone for the documentation of heritage - An example from
the Tuekta burial mounds in the Russian Altay. Journal of Archaeological Science 38 (11), 2968-
2978.
Hermon, S., 2008. Reasoning in 3D: a critical appraisal of the role of 3D modelling and virtual
reconstructions in archaeology. in: Frischer, B., Dakouri-Hild, A. (Eds.), Beyond Illustration: 2D and
3D Digital Technologies as Tools for Discovery in Archaeology, BAR International Series 1805,
Archaeopress, Oxford, pp. 35–44.
Hülksen, F., Eckes, C., Kuck, R., Unterberg, J., Jörg, S., 2007. Modeling and animating virtual humans
for real-time applications. International Journal of Virtual Reality 6 (4), 11-20.
Hundack, C., Mutzel, P., Pouchkarev, I., Thome, S., 1997. ArchE: A graph drawing system for
archaeology, in: Di Battista, G. (Ed.), Graph Drawing. Springer-Verlag, Heidelberg, Germany, pp.
29302.
Kakavoyiannis, E., 2005. Μέταλλα συγκεχωρημένα: η οργάνωση της εκμετάλλευσης του ορυκτού
πλούτου της Λαυρεωτικής από την Αθηναική Δημοκρατία (Metals “ergasima” and
“synkechoremena”. The exploitation of the mineral wealth of the Lavrion mines by the Athenian
Democracy). Archaeological Receipts, Athens, Greece.
Katsianis, M., Tsipidis, S., Kotsakis, K., Kousoulakou, A., 2008. A 3D digital workflow for
archaeological intra-site research using GIS. Journal of Archaeological science 35(3), 655-667.
Kersten, T., Lindstaedt, M., 2010. Reality-based 3D modeling, segmentation and web-based
visualization, in: Ioannides, M. (Ed.), 3rd International Euro-Mediterranean Conference on Digital
Heritage (EuroMed 2010). Springer, Limassol, Cyprus, pp. 140-152.
Koller, D., Frischer, B., Humphreys, G., 2009. Research challanges for digital archives of 3D cultural
heritage models. Journal on Computing and Cultural Heritage 2 (3), 1-17.
Koutsoudis, A., Stravroglou, K., Pavlidis, G., Chamzas, C., 2013. 3DSSE: A 3D scene search engine,
exploring 3D scenes using keywords. Journal of Cultural Heritage 13 (2), 18194.
Koutsoudis A., Vidmar B., Ioannakis G., Arnaoutoglou F., Pavlidis G., Chamzas C., 2013. Multi-image
3D reconstruction data evaluation. Journal of Cultural Heritage:
http://dx.doi.org/10.1016/j.culher.2012.1012.1003.
Losier, L.-M., Pouliot, J., Fortin, M., 2007. ED geometrical modeling of excavation units at the
archaeological site of Tell 'Acharneh (Syria). Journal of Archaeological science 34, 272-288
Lourakis, M., Argyros, A., 2009. SBA: A software package for generic sparse bundle adjustment. ACM
Transactions on Mathematical Software 36 (1), 1-30.
Lucas G., 2001. Destruction and the Rhetoric of Excavation. Norwegian Archaeological Review 34(1),
35-46.
Mendes, C., Silva, L., Bellon, O., 2012. IMAGO Visualization System: an interactive web-based 3D
visualization system for cultural heritage applications. Journal of Multimedia 7 (2), 205-210.
Pavlidis, G., Koutsoudis, A., Arnaoutoglou, F., Tsioukas, V., Chamzas, C., 2007, Methods for 3D
digitization of cultural heritage. Journal of Cultural Heritage 8 (1), 93-98.
Pérez, M., Agüera, F., Carvajal, F., 2013. Low cost surveying using an unmanned aerial vehicle.
International Archives of Photogrammetry and Remote Sensing and Spatial Information Sciences 40
(1/W2), 311-315.
Plets G., Gheyle W., Verhoeven G., De Reu J., Bourgeois J., Verhegge J., Stichelbaut B., 2012a.
Towards a Three-Dimensional Registration of the Archaeological Heritage of the Altai Mountains.
Antiquity, 86(333): 884–897.
Pollefeys M., Koch R., Vergauwen M., Van Gool L., 2000. Automated reconstruction of 3D scenes from
sequences of images. ISPRS Journal of Photogrammetry and Remote Sensing, 55(4), 251-267.
Pollefeys M., Van Gool L., Vergauwen M., Cornelis K., Verbiest F., Tops J., 2003. 3D recording for
archaeological fieldwork. Computer Graphics and Applications, IEEE, 23(3), 20-27.
Remondino, F., 2011. Heritage recording and 3D modeling with photogrammetry and 3D scanning.
Remote Sensing 3 (6), 1104-1138.
Robertson, D., Cipolla, R., 2009. Structure from motion, in: Varga, M. (Ed.), Practical image processing
and computer vision. John Wiley, Hoboken, NJ, USA., p. 49.
Rottensteiner, F., Trinder, J., Clode, S., Kubik, K., 2007. Building detection by fusion of airborne laser
scanner data and multi-spectral images: performance, evaluation and sensitivity analysis. ISPRS
Journal of Photogrammetry and Remote Sensing 62 (2), 135-149.
Rua, H., Alvito, P., 2011. Living the past: 3D models, virtual reality and game engines as tools for
supporting archaeology and the recontruction of cultural heritage: the case-study of the Roma villa
of Casa de Freiria. Journal of Archaeological Science 38 (12), 3296-3308.
Shashua, A., Werman, M., 1995. Trilinearity of three perspective views and its associated tensor, Fifth
International Conference on Computer Vision. IEEE, Boston, MA, USA, pp. 920-925.
Seitz, S., Curless, B., Diebel, J., Scharstein, D., Szeliski, R., 2006. A comparison and evaluation of
multi-view stereo reconstruction algorithms, IEEE Computer Society Conference on Computer
Vision and Pattern Recognition, New York, NY, USA, 122 June, pp. 519-528
Tack, F., Debie, J., Goossens, R., De Meulemeester, J., Devriendt, D., 2005. A feasible methodology
for the use of close range photogrammetry for the recording of archaeological excavations,
Proceedings of the CIPA 2005 XX International Symposium, Torino, Italy, pp. 561-565.
Tack, F., Buyuksalih, G., Goossens, R., 2012. 3D building reconstruction improvement based on given
ground plan information and surface models extracted from spaceborne imagery. ISPRS Journal of
Photogrammetry and Remote Sensing 67 (1), 52-64.

Traxler, C., Neubauer, W., 2008. The Harris matrix momposer: a new tool to manage archaeological
stratigraphy, in: Börner W., U.S. (Ed.), Archäologie und Computer: Kulturelles Erbe und Neue
Technologien, Vienna, Austria, pp. 12 (on CD-ROM)
Van Liefferinge, K., Docter, R., Pieters, T., van den Eijnde, F., 2011a. The excavation of Cistern no.1
at Thorikos, in: Docter, R., De Wulf, A., Monsieur, P., van den Eijnde, F., van de Put, W., Van
Gelder, K. (Eds.), Thorikos 10, Reports and Studies. University Press, Ghent, Belgium.
Van Liefferinge, K., Stal, C., De Wulf, A., 2011b. The Thorikos excavations 1963-2010 in maps, in:
Docter, R., De Wulf, A., Monsieur, P., van den Eijnde, F., van de Put, W., Van Gelder, K. (Eds.),
Thorikos 10, Reports and Studies. University Press, Ghent, Belgium.
Van Liefferinge, K., van den Berg, M., Stal, C., Docter, R., De Wulf, A., Verhoest, N., 2014.
Reconstructing the position of Thorikos in the Laurion silver mining district (Attica, Greece) through
hydrological analyses. Journal of Archaeological Science 41, 272-284.
Verhoeven, G., 2011. Taking computer vision aloft - archaeological three-dimensional reconstruction
from aerial photographs with PhotoScan. Archaeological Prospection 18 (1), 673.
Verhoeven G., Taelman D., Vermeulen F., 2012. Computer vision-based orthophoto mapping of
complex archaeological sites: the ancient quarry of Pitaranha (Portugal-Spain). Archaeometry, 54(6),
1114-1129.
Verhoeven, G., Doneus, M., Briese, C., Vermeulen, F., 2012. Mapping by matching: a computer vision-
based approach to fast and accurate georeferencing of archaeological aerial photographs. Journal of
Archaeological Science 39 (7), 2060-2070.
Wang, L., Kang, S., Szeliski, R., Shum, H., 2001. Optimal texture map reconstruction from multiple
views. IEEE Computer Vision and Pattern Recognition 1 (1), 1-8.
Zhukovsky, M., 2002. Handling digital 3-D record of archaeological excavation data. Archaeological
Informatics: Pushing the Envelope. CAA2001, BAR International Series 1016, 431-438.