Correlation of DNA Ploidy with Progression of Cervical Cancer
Upload
independentCategory
view
0download
0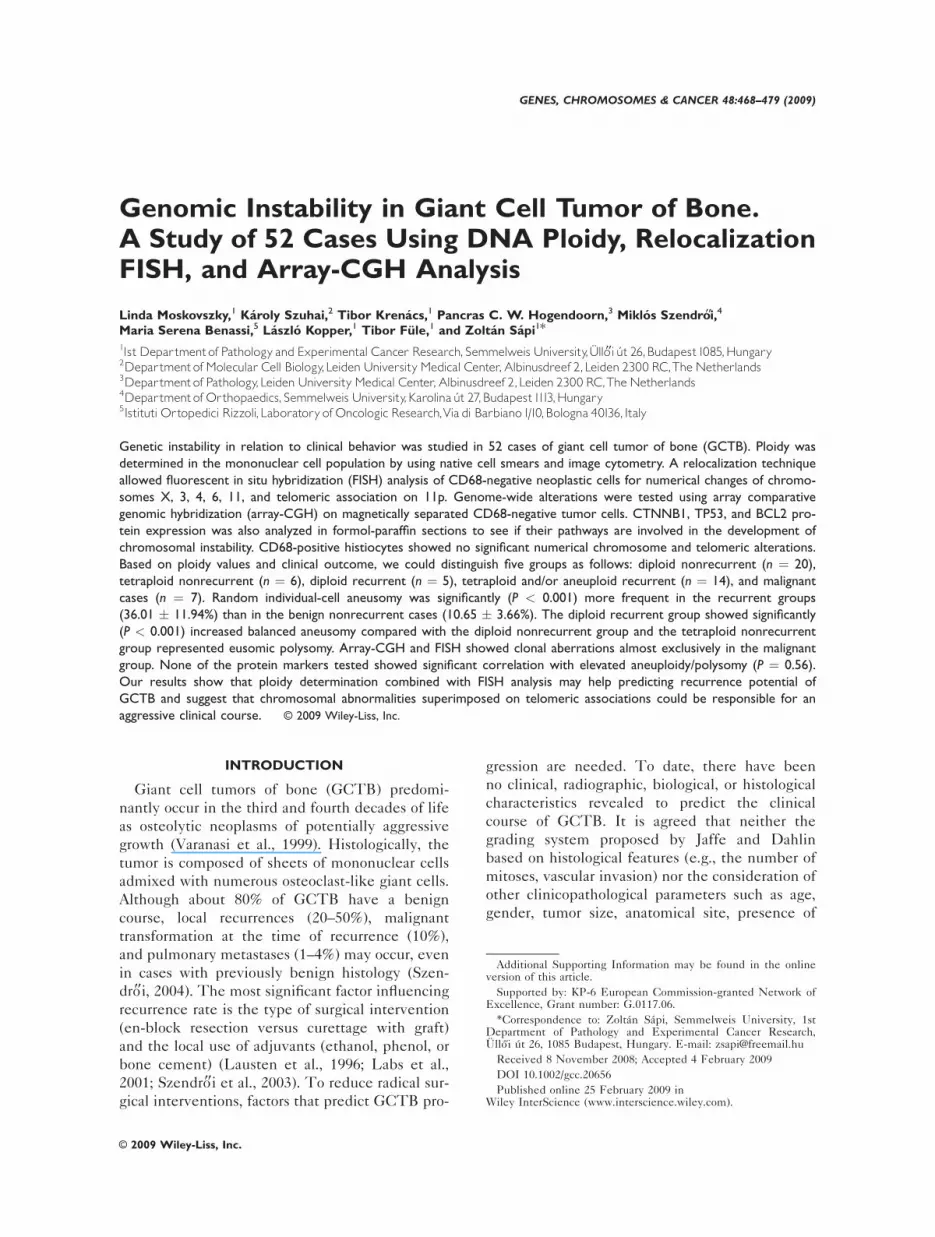
GENES, CHROMOSOMES & CANCER 48:468–479 (2009)
Genomic Instability in Giant Cell Tumor of Bone.A Study of 52 Cases Using DNA Ploidy, RelocalizationFISH, and Array-CGH Analysis
Linda Moskovszky,1 Karoly Szuhai,2 Tibor Krenacs,1 Pancras C. W. Hogendoorn,3 Miklos Szendro†i,4
Maria Serena Benassi,5 Laszlo Kopper,1 Tibor Fule,1 and Zoltan Sapi1*
11st Departmentof Pathology and Experimental Cancer Research,Semmelweis University,�llo†iu¤ t 26,Budapest1085,Hungary2Departmentof Molecular Cell Biology,Leiden University Medical Center,Albinusdreef 2,Leiden 2300 RC,The Netherlands3Departmentof Pathology,Leiden University Medical Center,Albinusdreef 2,Leiden 2300 RC,The Netherlands4Departmentof Orthopaedics,Semmelweis University,Karolina u¤ t 27,Budapest1113,Hungary5Istituti Ortopedici Rizzoli,Laboratoryof Oncologic Research,Via di Barbiano1/10,Bologna 40136,Italy
Genetic instability in relation to clinical behavior was studied in 52 cases of giant cell tumor of bone (GCTB). Ploidy was
determined in the mononuclear cell population by using native cell smears and image cytometry. A relocalization technique
allowed fluorescent in situ hybridization (FISH) analysis of CD68-negative neoplastic cells for numerical changes of chromo-
somes X, 3, 4, 6, 11, and telomeric association on 11p. Genome-wide alterations were tested using array comparative
genomic hybridization (array-CGH) on magnetically separated CD68-negative tumor cells. CTNNB1, TP53, and BCL2 pro-
tein expression was also analyzed in formol-paraffin sections to see if their pathways are involved in the development of
chromosomal instability. CD68-positive histiocytes showed no significant numerical chromosome and telomeric alterations.
Based on ploidy values and clinical outcome, we could distinguish five groups as follows: diploid nonrecurrent (n ¼ 20),
tetraploid nonrecurrent (n ¼ 6), diploid recurrent (n ¼ 5), tetraploid and/or aneuploid recurrent (n ¼ 14), and malignant
cases (n ¼ 7). Random individual-cell aneusomy was significantly (P < 0.001) more frequent in the recurrent groups
(36.01 � 11.94%) than in the benign nonrecurrent cases (10.65 � 3.66%). The diploid recurrent group showed significantly
(P < 0.001) increased balanced aneusomy compared with the diploid nonrecurrent group and the tetraploid nonrecurrent
group represented eusomic polysomy. Array-CGH and FISH showed clonal aberrations almost exclusively in the malignant
group. None of the protein markers tested showed significant correlation with elevated aneuploidy/polysomy (P ¼ 0.56).
Our results show that ploidy determination combined with FISH analysis may help predicting recurrence potential of
GCTB and suggest that chromosomal abnormalities superimposed on telomeric associations could be responsible for an
aggressive clinical course. VVC 2009 Wiley-Liss, Inc.
INTRODUCTION
Giant cell tumors of bone (GCTB) predomi-
nantly occur in the third and fourth decades of life
as osteolytic neoplasms of potentially aggressive
growth (Varanasi et al., 1999). Histologically, the
tumor is composed of sheets of mononuclear cells
admixed with numerous osteoclast-like giant cells.
Although about 80% of GCTB have a benign
course, local recurrences (20–50%), malignant
transformation at the time of recurrence (10%),
and pulmonary metastases (1–4%) may occur, even
in cases with previously benign histology (Szen-
dro†i, 2004). The most significant factor influencing
recurrence rate is the type of surgical intervention
(en-block resection versus curettage with graft)
and the local use of adjuvants (ethanol, phenol, or
bone cement) (Lausten et al., 1996; Labs et al.,
2001; Szendro†i et al., 2003). To reduce radical sur-
gical interventions, factors that predict GCTB pro-
gression are needed. To date, there have been
no clinical, radiographic, biological, or histological
characteristics revealed to predict the clinical
course of GCTB. It is agreed that neither the
grading system proposed by Jaffe and Dahlin
based on histological features (e.g., the number of
mitoses, vascular invasion) nor the consideration of
other clinicopathological parameters such as age,
gender, tumor size, anatomical site, presence of
Additional Supporting Information may be found in the onlineversion of this article.
Supported by: KP-6 European Commission-granted Network ofExcellence, Grant number: G.0117.06.
*Correspondence to: Zoltan Sapi, Semmelweis University, 1stDepartment of Pathology and Experimental Cancer Research,Ulloi ut 26, 1085 Budapest, Hungary. E-mail: [email protected]
Received 8 November 2008; Accepted 4 February 2009
DOI 10.1002/gcc.20656
Published online 25 February 2009 inWiley InterScience (www.interscience.wiley.com).
VVC 2009 Wiley-Liss, Inc.

pathological fracture at diagnosis, cortical involve-
ment, and distance from the joint, allow prediction
of the clinical course of GCTB (Sanerkin, 1980;
Masui et al., 1998a; Dominkus et al., 2006). The
prognostic significance of stratification (Enneking,
1983; Campanacci et al., 1987) based on clinical,
radiographic, and histological appearance and that
of DNA cytometry have also been disputed (Man-
kin et al., 1985; Ladanyi et al., 1989; Sara et al.,
1990; Siebenrock et al., 1998; Szendro†i et al.,
2003). Furthermore, the expression of none of the
proteins studied in GCTB, including those poten-
tially involved in cell cycle regulation/oncogenesis
(TP53, CDKN1B, CCND1, MYC, TGFBR2)
(Gamberi et al., 1998; Masui et al., 1998b; Kauz-
man et al., 2003; Kawaguchi et al., 2004; Kandel
et al., 2006), the stimulation of osteoclast-differen-
tiation and angiogenesis (VEGF) (Kumta et al.,
2003; Knowles and Athanasou, 2008), bone resorp-
tion (IL6) (Gamberi et al., 2004), or in the degrada-
tion of extracellular matrix (MMP9, PLAU)
(Kumta et al., 2003; Gamberi et al., 2004), have
been found to be of prognostic relevance in a sig-
nificant number of GCTB cases.
Although giant cells play an important role in
the osteolysis, they have been shown to be reac-
tive blood-derived osteoclasts (Forsyth et al.,
2009) and the mononuclear cells of stromal phe-
notype are considered the neoplastic population
(Joyner et al., 1992). However, in GCTB, the
neoplastic CD68-negative cells are mixed with
CD68-positive reactive histiocytes. Most of the
published reports have analyzed this mixed cell
population without separation, which may chal-
lenge the results. Therefore, in this study, we set
up a relocalization technique allowing to examine
genetic instability exclusively in the neoplastic
cells. Purified CD68-negative cells were used to
screen for numerical changes of chromosomes X,
3, 4, 6, 11, and telomeric associations involving
11p by using a multicolor fluorescent in situ
hybridization (FISH) technique and potential
gene losses and gains tested with array compara-
tive genomic hybridization (array-CGH) (Inazawa
et al., 2004). Image cytometry combining ploidy
analysis with the determination of cell prolifera-
tion activity was also performed on the mononu-
clear cell population (Antal et al., 1999, 2000;
Murata et al., 1999). In searching for the potential
cause of the genetic instability, we also tested
the expression of TP53, CTNNB1, and BCL2 in
formol-paraffin sections of the same cases.
MATERIALS AND METHODS
Patient Selection
A total of 52 snap-frozen tissue samples were
selected from the tumor bank of the Semmelweis
University Orthopaedic Clinic (44 cases) and Isti-
tuti Ortopedici Rizzoli Laboratory of Oncologic
Research (8 cases) based on the availability of
complete clinical follow-up including surgical and
radiological reports. There were 25 men and 27
women with a median age of 28.5 years (15–67
years) and a median follow-up of 48 months. The
tested GCTBs were localized to the knee region
(50%), distal forearm (13%), pelvis (10%), and
distal tibia (6%) and included 26 primary benign
nonrecurrent tumors, 17 benign local recurrences,
2 primary benign tumors that recurred, 2 primary
metastasizing cases, 1 metastasis, 1 primary malig-
nant case, and 3 malignant recurrences (Supporting
Table 1). Histological diagnoses were according
to the WHO criteria (Table 1; Figure 1) (Nasci-
mento et al., 1979; Sakkers et al., 1997; Reid et
al., 2002). Of the local recurrences, 11 were first,
6 were second, and 2 were third recurrences. In
TABLE 1. GCTB Classification
Type Features Cases
GCTBa Benign histological appearance: sheets of mononuclear cellsadmixed with numerous osteoclastic giant cells
DNRCb, TNRCc, TRCd, DRCe cases
Metastasizing GCTB Distant metastasis MALf-4, MAL-5, MAL-7Malignancy in GCTB A sarcoma appears at the site of previously documented
GCTB: progression in the same tumorMAL-1, MAL-3, MAL-6
Malignant GCTB/giantcell rich MFH
A high grade sarcoma arises within the GCTB MAL-2
aGCTB, giant cell tumor of bone.bDNRC, diploid non recurrent.cTNRC, tetraploid non recurrent.dTRC, tetraploid recurrent.eDRC, diploid recurrent.fMAL, malignant group.
GENOMIC INSTABILITY IN GIANT CELL TUMOR OF BONE 469
Genes, Chromosomes & Cancer DOI 10.1002/gcc

case of local curettage, all patients were treated
similarly by local adjuvant (phenol 75% and alco-
hol 96%) and bone cement or auto/homologous
bone implantation (Supporting Table 1). In one
case (MAL-4), the patient had been given radia-
tion therapy prior to the genetic analyses.
All cases with a malignant course were inde-
pendently reviewed to avoid inclusion of unrec-
ognized look-a-likes such as osteoclast-rich
osteosarcoma.
All patient information was coded, with com-
plete clinical data available only for physicians
involved in the treatment of these patients.
This study was approved by the ethics commit-
tee of the Semmelweis University (approval num-
ber: 230-151/2006-1018EKU), and all patients
gave their informed consent.
DNA Cytophotometry
DNA cytophotometry was performed on smears
prepared from 58 frozen GCTB samples of the
52 patients. In 4 patients (TRC-7, -8, -10, and
-11) each of the occurrences were analyzed. Fol-
lowing the quantitative determination of DNA
content in tumor cell nuclei after Feulgen stain-
ing (Merck, Darmstadt, Germany), data analysis
was done as previously described (Antal et al.,
1999) by using an image analyzer under the crite-
ria defined by Carey (1994).
DNA-ploidy values were calculated with respect
to a standard reference population (usually lym-
phocytes). Altogether 20–25 lymphocytes and 200
mononuclear cells were measured on each slide
with the exclusion of osteoclast type giant cells.
The given specimen was regarded as diploid if
the DNA-index of cells was between 0.9 and 1.1,
and less than 15% of the nuclei had a 4n DNA
content, representing the G2 fraction. The tumor
was considered aneuploid if the DNA-index was
below 0.9 or between 1.11 and 1.79, and tetra-
ploid if the DNA-index was between 1.8 and 2.2.
The lesion was considered to contain a tetraploid
subpopulation, if beside the diploid peak another
smaller peak (segregated population in the tetra-
ploid range with corresponding G2 phase)
appeared on the histogram.
Regular multiples of the normal chromosomal
sets (4n, 8n, 16n, 32n) are referred to as euploid
polyploidization.
Figure 1. Histological appearances of GCTBs with different bio-logical behavior. (A) Nonrecurrent GCTB with the characteristicmultinuclear osteoclast-like giant cells dispersed in a mixed mononu-clear-cell stroma (case DNRC-2). (B) Primary malignant GCTB. Con-ventional GCTB (upper part of the picture, osteoclasts showed byblack arrows) with abrupt transition to spindle cell tumor; note
atypical mitosis and marked nuclear atypia (inserts) (case MAL-3).(C) Lung metastasis of GCTB (case MAL-8). (D) Secondary malignantGCTB showing atypical spindle cell proliferation with no residualgiant cell tumor (case MAL-4). [Color figure can be viewed in theonline issue, which is available at www.interscience.wiley.com.]
470 MOSKOVSZKY ETAL.
Genes, Chromosomes & Cancer DOI 10.1002/gcc
Immunocytochemistry and Immunohistochemistry
Immunocyto/histochemistry was performed on
either native cell smears or formalin-fixed paraf-
fin-embedded tissue sections by using the iview
DAB detection kit (Ventana, AZ) with indirect
streptavidin-biotin peroxidase complex (S-PO)
method on a Ventana-automated immunostaining
system (Ventana 320). For antigen retrieval of
dewaxed paraffin sections, microwave cooking at
96�C for 30 min in 0.01 M citrate buffer (pH 6.0)
was done. Smears were methanol-fixed before im-
munostaining. All incubations were performed at
37�C with the primary antibodies including
mouse anti-human monoclonal CD68 (1:40, clone
514H12, Serotec, NC), TP53 (1:50, clone DO-7
Dako, Glostrup, Denmark), BCL2 (1:10, clone
124 Dako, Glostrup, Denmark), and CTNNB1
(1:100, clone NCL-B-CAT, Novo-Castra, New-
castle, United Kingdom) for 30 min. Then, the
biotinylated secondary antibody and the S-PO
reagent were sequentially used for 60 min each.
FISH-Relocalization
Five chromosomes were chosen, considering
their size and the combination of available stain-
ing colors, whereas the centromeric and subtelo-
meric regions of the short arm of chromosome 11
were chosen due to its frequent involvement in
telomeric associations (TAS).
After removing the coverslip from the immuno-
stained smears, commercially available probes
were used for each hybridization: centromeric
alpha satellite probes for chromosomes X, 3, 4,
and 6 were simultaneously hybridized. Screening
for possible telomeric alterations was made with
simultaneous hybridization with 11p subtelomeric
and chromosome 11 centromeric probes. All
probes were obtained from Vysis, Abott Molecu-
lar Inc. (Des Plaines, IL).
To distinguish the FISH images of CD68-
positive and negative cells, the Bioview Duet
Automated Scanning System (Bioview, Tel Aviv,
Israel) was used to relocate the previously
scanned CD68 immunostained images and match
with the FISH images of individual cells (Fig. 2).
To determine the specificity of each probe,
FISH was performed on 400 normal control cells
(striated muscle cells and fibroblasts). Based on
the results, cutoff levels for false monosomy and
trisomy (using the mean �2SD) were determined
at 2.93 and 3.54%, respectively (confidence inter-
val: 95%). Next, 100 nonoverlapping, morphologi-
cally well-preserved, mononuclear cells per slide
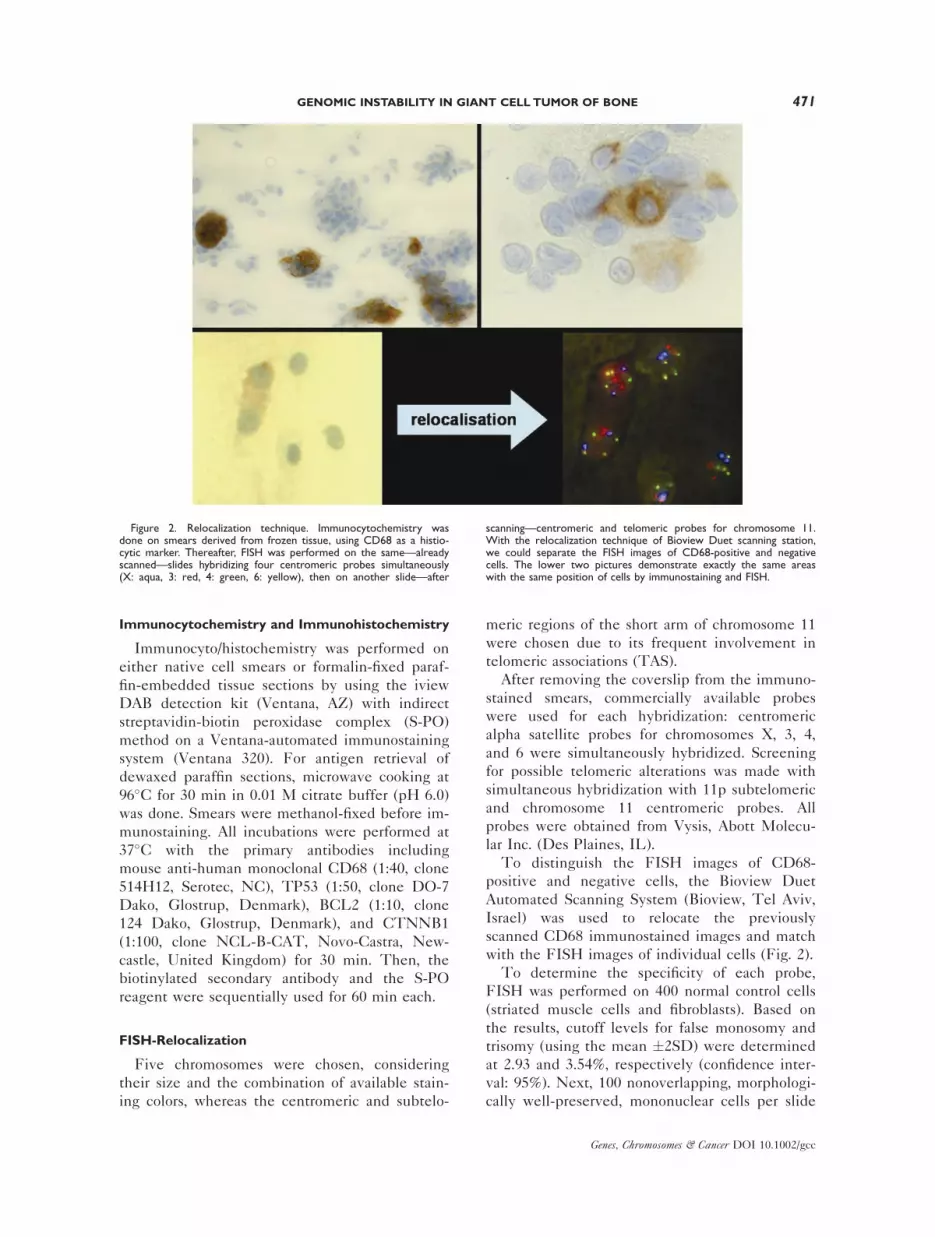
Figure 2. Relocalization technique. Immunocytochemistry wasdone on smears derived from frozen tissue, using CD68 as a histio-cytic marker. Thereafter, FISH was performed on the same—alreadyscanned—slides hybridizing four centromeric probes simultaneously(X: aqua, 3: red, 4: green, 6: yellow), then on another slide—after
scanning—centromeric and telomeric probes for chromosome 11.With the relocalization technique of Bioview Duet scanning station,we could separate the FISH images of CD68-positive and negativecells. The lower two pictures demonstrate exactly the same areaswith the same position of cells by immunostaining and FISH.
GENOMIC INSTABILITY IN GIANT CELL TUMOR OF BONE 471
Genes, Chromosomes & Cancer DOI 10.1002/gcc

were analyzed, 20–50% of which were CD68-pos-
itive cells depending on the histiocyte-content of
the given sample. Based on the individual centro-
meric signals of the examined chromosomes and
the overall signals, gains and losses were deter-
mined. Analyzing the number of signals of certain
chromosomes separately, the presence of monoso-
mies, trisomies, and other aneusomies were deter-
mined. The resulting frequencies of aneusomies
were calculated for the individual chromosomes as
well as for the individual cells, distinguishing
chromosomal aneusomy, (C-ANEU) and individ-
ual-cell aneusomy (I-ANEU). I-ANEU gives the
combined information on all four chromosomes
(3, 4, 6, and X), whereas C-ANEU represents
numeric alterations for each separate chromosome.
When regular multiple of centromeric signals (4x,
8x) for all tested chromosomes were observed, the
polysomy frequencies were calculated both for
individual chromosomes and for individual cells,
chromosomal polysomies (C-POLY) and individual
cell polysomies (I-POLY), respectively. To define
significant clonal aneusomy, we considered our
and other’s cutoff values (Qian et al., 1996; Yang
et al., 2006) and the Poisson model (Castagne
et al., 2003). Thus, the cutoff values were 20% for
each chromosome. If more than 20% of the CD68-
negative tested cells showed the same gain or loss,
the alteration was considered clonal.
Array-CGH
In GCTB samples, where the percentage of
CD68-negative cells did not reach at least 60% of
total cell content, magnetic cell separation was per-
formed to improve array-CGH analysis. Filtering
the homogenized GCTB cell suspension with
20 lm pore-size Filcon syringe filter (BD Bioscien-
ces, NJ) and incubating it with CD68 antibody-
coated metal beads (Dynabeads M-280 Sheep
anti-Mouse IgG, Invitrogen, Carlsbad, California)
in a ratio of 30 million cells:100 million CD68-
coated beads, the solution was put into a magnetic
field (MagnaRackTM magnetic separation rack,
Invitrogen, Carlsbad, CA), followed by collecting
the CD68-negative cell fraction. DNA was isolated
from frozen tissue as well as from the separated
cell suspension using the High Pure PCR Tem-
plate Preparation Kit (Roche, Mannheim, Germany).
Genome-wide analysis of DNA copy number
changes of samples was performed using slides
containing about 3,500 bacterial artificial chromo-
somes (BACs), obtained from the Welcome Trust
Sanger Institute and produced at the Leiden Uni-
versity Medical Center, the Netherlands. Samples
were labeled and hybridized and analyzed accord-
ing to previously described protocols (Knijnen-
burg et al., 2005, 2007).
Statistics
FISH results were statistically analyzed by
using the Pearson’s v2 test, with results consid-
ered significant at P < 0.001.
RESULTS
Subgroups Based on Ploidy Correlated with
Clinical Features
Out of 26 primary nonrecurrent cases, 20 proved
to be diploid (Fig. 3A) and 6 showed a tetraploid
subpopulation (more than 15% of the measured
cells). Of the 19 recurrent GCTBs, 5 were diploid,
1 was tetraploid, 12 showed a tetraploid subpop-
ulation (Fig. 3B), and 2 cases showed aneuploidy.
Three of the 7 malignant specimens showed a
tetraploid subpopulation, 1 was tetraploid, and the
remaining were aneuploid (Fig. 3C). In 3 out of the
4 examined cases, the ploidy value changed during
its clinical course: from diploid into tetraploid
(TRC-11, Table 2), from diploid into tetraploid sub-
population (TRC-7, Table 2), and tetraploid into
aneuploid (TRC-8, Table 2), respectively. Consid-
ering the relatively small number of patients, the
ploidy-differences found between the various clin-
ical groups were not significant. Further dissection
of results provided us with five different subgroups
clearly separable according to the ploidy value and
the clinical outcome. (1) Diploid nonrecurrent
group (DNRC—n ¼ 20) (we do not expect recur-
rence because of the diploid character); (2) Malig-
nant group (MAL—n ¼ 7) (we expect recurrence
and/or metastasis because of the aneuploid/tetra-
ploid character and/or malignant phenotype); (3)
Tetraploid recurrent group (TRC—n ¼ 14) (we
expect recurrence because of the tetraploid charac-
ter); (4) Diploid recurrent group (DRC—n ¼ 5)
(there is recurrence despite the diploid nature); (5)
Tetraploid nonrecurrent group (TNRC—n ¼ 6)
(there is no recurrence despite the tetraploid na-
ture). (Table 2)
FISH
Control cells
I-ANEU of control cells was 1.54 � 0.58%. C-
ANEUs were 0.00%, 0.97 � 0.35%, 0.33 �0.21%, 0.12 � 0.11%, and 2.87 � 0.96% for
472 MOSKOVSZKY ETAL.
Genes, Chromosomes & Cancer DOI 10.1002/gcc
chromosomes X, 3, 4, 6, and 11, respectively.
The frequency of chromosome 11p subtelomeric
loss was 1.28 � 0.85%.
CD68-positive group
Within the histiocytic cell population, I-ANEU
was 2.59 � 0.55%. There was no significant dif-
ference either between C-ANEUs of CD68-posi-
tive and normal control cells (P ¼ 0.27–0.91) or
between the 11p telomeric alteration frequencies
of these cells.
CD68-negative group
Typical FISH patterns in the different GCTB
groups are demonstrated in Figure 4. I-ANEU
was higher in CD68-negative neoplastic cell pop-
ulation (25.76 � 2.79%) compared with both con-
trol (P < 0.0001) and CD68-positive cell
populations (P < 0.0001) (Fig. 5). Comparing the
C-ANEUs, no significant difference in the fre-
quencies could be shown, which means there was
random aneusomy concerning all four groups
(DNRC, DRC, TNRC, and TRC).
In general, chromosomal gains and losses were
about equal in nonrecurrent and recurrent groups,
whereas gains predominated in the malignant
group (for results concerning C-ANEUs see Sup-
porting Table 2). Polysomy frequency (I-POLY
means) showed increasing tendency among the
different groups (DNRC: 1.13%, DRC: 3.19%,
TNRC: 9.71%, TRC: 11.86%, and MAL: 11.16%)
(Table 2).
The DNRC group showed a low percentage of
aneusomy but it was higher (I-ANEU, 9.45 �0.77%) than in control (P < 0.001) and CD68-
positive cell populations (P < 0.001) (Fig. 5).
The TNRC cases showed slightly higher aneus-
omy (I-ANEU: 14.63 � 3.62%) compared with
DNRC group, but the difference was not signifi-
cant (P ¼ 0.011). This group can be featured by
so-called eusomic polysomy, which means we
found exclusively multiples of 4x or 8x equally
for all of the examined four chromosomes in
fairly high frequency (I-POLY: 9.71 � 3.38%)
(Table 2). In the DRC group, aneusomy (I-
ANEU: 26.06 � 3.30%) was more frequent (P <0.001) compared with the DNRC group, with
gains and losses being about equally common
(3.78% and 3.15%, respectively). The TRC cases
contained a much higher percentage of aneusomy
(39.55 � 4.29%), than the TNRC group (P <0.001). Gains and losses in this group were 5.40%
and 2.89%, respectively. The MAL group showed
a high frequency of aneusomy by FISH (I-
ANEU: 54.02 � 7.24%).
Comparing diploid nonrecurrent to recurrent
and tetraploid nonrecurrent to recurrent groups,
individual-cell aneusomy could be detected more
frequently in recurrent compared with nonrecur-
rent cases (P < 0.001). Analyzing recurrent
GCTBs only, the TRC group contained more
individual-cell aneusomies than DRC cases. Both
I-ANEU and total C-ANEU values were much
higher in MAL compared with nonrecurrent and
recurrent GCTBs (detailed results in Table 2, in
Supporting Table 2 and Fig. 5). No clonal altera-
tion was found in DNRC and TNRC; clonality
could be detected in a few recurrent cases and in
the majority of malignant cases.
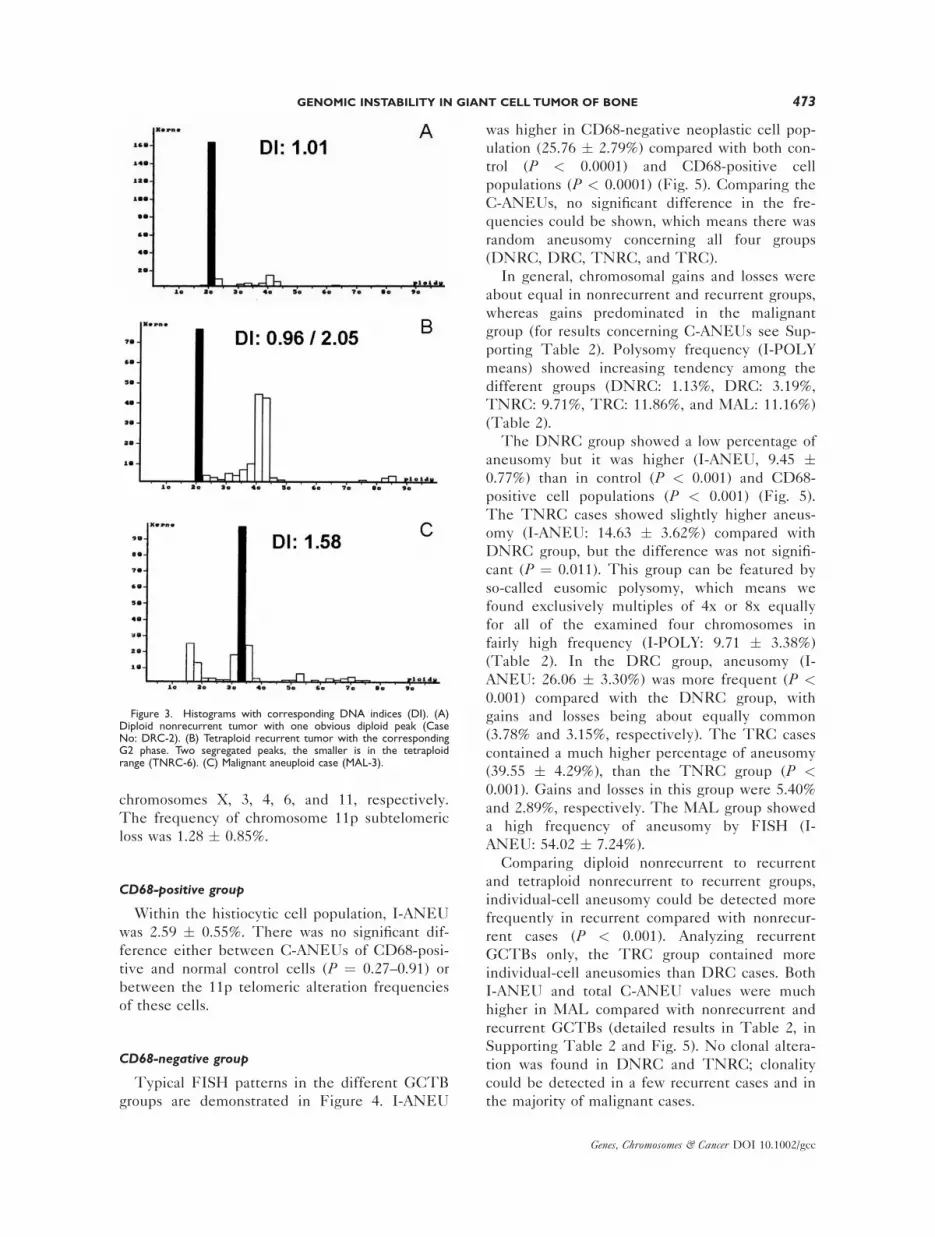
Figure 3. Histograms with corresponding DNA indices (DI). (A)Diploid nonrecurrent tumor with one obvious diploid peak (CaseNo: DRC-2). (B) Tetraploid recurrent tumor with the correspondingG2 phase. Two segregated peaks, the smaller is in the tetraploidrange (TNRC-6). (C) Malignant aneuploid case (MAL-3).
GENOMIC INSTABILITY IN GIANT CELL TUMOR OF BONE 473
Genes, Chromosomes & Cancer DOI 10.1002/gcc

TABLE 2. DNA Indices (DI) and I-ANEU Values
CaseDNAIndex I-POLYa (%)
Polysomymean I-ANEUb (%)
Aneusomymean
11p-alteration(%)
11p-alterationmean
DNRCc-1 1.00 0.00 Mean: 1.1352 11.49 Mean: 9.4580 10.00 Mean: 13.8148DNRC-2 0.95 0.00 SDd: 2.2147 3.33 SD: 3.4395 13.64 SD: 4.6958DNRC-3 1.04 0.00 SEMe: 0.4952 8.54 SEM: 0.7691 11.11 SEM: 1.0500DNRC-4 1.05 0.00 Range: 8.2192 8.62 Range: 13.4664 11.11 Range: 20.8827DNRC-5 1.01 1.52 7.58 14.55DNRC-6 1.00 1.98 13.86 11.59DNRC-7 1.04 0.00 12.50 15.56DNRC-8 1.02 0.00 10.87 19.05DNRC-9 0.98 1.16 8.14 23.91DNRC-10 1.00 0.00 4.31 12.22DNRC-11 0.97 0.00 9.91 14.44DNRC-12 1.00 0.00 10.81 8.33DNRC-13 1.00 8.22 12.33 21.11DNRC-14 1.05 6.06 10.61 17.78DNRC-15 0.99 0.00 8.45 16.67DNRC-16 0.96 0.00 2.50 13.33DNRC-17 1.09 0.00 6.94 12.20DNRC-18 1.00 1.79 12.50 3.03DNRC-19 0.95 1.98 9.90 10.00DNRC-20 0.90 0.00 15.97 16.67TNRCf-1 0.96/1.95 2.17 Mean: 9.7154 15.22 Mean: 14.6373 18.48 Mean: 9.3324TNRC-2 1.00/2.02 6.67 SD: 8.2775 20.00 SD: 8.8658 3.85 SD: 4.9740TNRC-3 1.04/2.10 6.82 SEM: 3.3793 9.09 SEM: 3.6195 8.96 SEM:2.0306TNRC-4 0.99/2.10 22.54 Range: 20.3613 5.63 Range: 23.6765 8.85 Range: 14.6321TNRC-5 0.98/2.00 17.24 29.31 6.25TNRC-6 0.96/2.05 2.86 8.57 9.62TRCg-1 1.02/2.08 3.13 Mean: 11.8650 40.63 Mean: 39.5564 7.78 Mean: 14.4713TRC-2 1.05/2.15 22.39 SD: 8.7401 50.75 SD: 16.0575 15.66 SD: 5.7371TRC-3 1.05/2.05 21.88 SEM: 2.3359 26.56 SEM: 4.2915 21.28 SEM:1.5333TRC-4 0.87/1.85 14.10 Range: 31.4286 44.87 Range: 66.4368 17.59 Range: 17.0498TRC-5 1.00/2.00 15.52 6.90 22.76TRC-6 1.01/2.02 12.35 50.62 17.39TRC-7 1.02!1.06/
2.000.00 73.33 13.44
TRC-8 2.1!1.63 31.43 42.86 15.22TRC-9 1.01/2.02 8.70 52.17 11.43TRC-10 1.05/2.02 3.57 35.71 24.83TRC-11 0.96!1.01/
2.00!1.856.32 22.11 7.84
TRC-12 1.05/2.05 8.93 44.64 9.59TRC-13 0.98/2.02 5.17 36.21 9.18TRC-14 0.99/2.00 12.64 26.44 8.60DRCh-1 1.06 1.79 Mean: 3.1914 37.50 Mean: 26.0687 7.49 Mean: 8.2266DRC-2 1.01 2.33 SD: 3.5389 20.93 SD: 7.3933 10.13 SD: 2.2011DRC-3 1.00 9.26 SEM: 1.5827 29.63 SEM: 3.3064 6.38 SEM:0.9844DRC-4 0.91 2.59 Range: 9.2593 21.55 Range: 16.7683 6.16 Range: 4.8145DRC-5 0.90 0.00 20.73 10.98MALi-1 1.06/2.10 27.66 Mean: 11.1586 65.96 Mean: 54.0241 21.43 Mean: 16.1927MAL-2 2.00 17.24 SD: 8.8685 41.38 SD: 19.1594 30.21 SD: 7.3914MAL-3 1.58 6.52 SEM: 3.3520 67.39 SEM: 7.2416 15.12 SEM:2.7937MAL-4 0.92/1.88 12.82 Range: 25.5319 84.62 Range: 50.5728 9.78 Range: 20.4257MAL-5 1.61 5.22 34.78 10.00MAL-6 0.98/2.00 6.52 50.00 15.38MAL-7 1.62 2.13 34.04 11.43
aI-POLY, individual polysomy.bI-ANEU, individual aneusomy.cDNRC, diploid non recurrent.dSD, standard deviation.eSEM, standard error of mean.fTNRC, tetraploid non recurrent.gTRC, tetraploid recurrent.hDRC, diploid recurrent.iMAL, malignant group.
Arrows indicate changes in ploidy-values during clinical course.
11p telomeric alterations
11p deletions that could reflect TAS were pres-
ent in all cases, regardless of ploidy-value or
recurrency-disposition. It appeared slightly but
not significantly more often in malignant cases
(16.19 � 2.8%) compared with the benign
GCTBs (12.80 � 2.17%) (P ¼ 0.15) (Table 2,
Figs. 4K, and 4L).
Array Comparative Genomic Hybridization
Excluding gains and losses involving regions
reported in the DGV database (http://project-
s.tcag.ca/variation/), a normal array-CGH profile
was found in 48/51 tumors.
One recurrent case (TRC-2) showed the imbal-
ances: gain of 4p (3.52–4.4 Mb) with an amplifica-
tion between 4.45 and 4.86 Mb; gain of 12p (152
Kb–3.74 Mb), amplifications in 12q (3.89–3.98
Mb, 5.61–5.78 Mb) (Fig. 6).
Clonal genomic imbalances were observed in 2
out of 7 malignant cases: MAL-2 case: a deletion
of 5q between 8.95–18.00 Mb; MAL-3 case: sev-
eral chromosomal aberrations were seen involving
chromosomal gains: 5, 6, 7, 20, and 21 and losses:
15 and 18. Loss of 1q and 16q was seen. Com-
plex rearrangements partial gains and losses were
observed for several chromosomes: gain of chro-
mosome 2 between 330 Kb and 16.90 Mb, gain
of 4q (7.33–11.18 Mb, 14.39–15.50 Mb, loss of 4q
(17.19–18.26 Mb); loss of 8p (250 Kb–3.00 Mb)
and a gain of 8q (7.72–14.61 Mb); loss of 9p (600
Kb–32.5 Mb); loss of 10p (300 Kb–5.55 Mb) and
gain of 10q (270 Kb–8.95 Mb), loss of 17q from
7.82 Mb to 18p 200 Kb.
CTNNB1 Expression and Chromosomal Instability
Immunohistochemistry was performed in 44
cases. In all positive cases membranous/cytoplasmic
expression of CTNNB1 was seen but no nuclear
positivity could be detected. The membranous/
cytoplasmic positivity was stronger in malignant
than in other cases. Three of the 26 nonrecurrent
(12%), and 8 of the 16 recurrent cases (50%)
showed weak positivity, whereas each of the exam-
ined 2 malignant samples proved to be moderate to
strongly positive. From six of the CTNNB1 posi-
tive cases we made smears, did the CTNNB1
immunocytochemistry and used the same relocali-
zation technique as for separation of CD68-positive
and CD68-negative cells. Here, we were not able
to find any relationship between CTNNB1 positive
cells and aneu/polysomy (P ¼ 0.56).
TP53 and BCL2 Expression
We found no BCL2 positivity in mononuclear
or in multinucleated giant cells, whereas weak
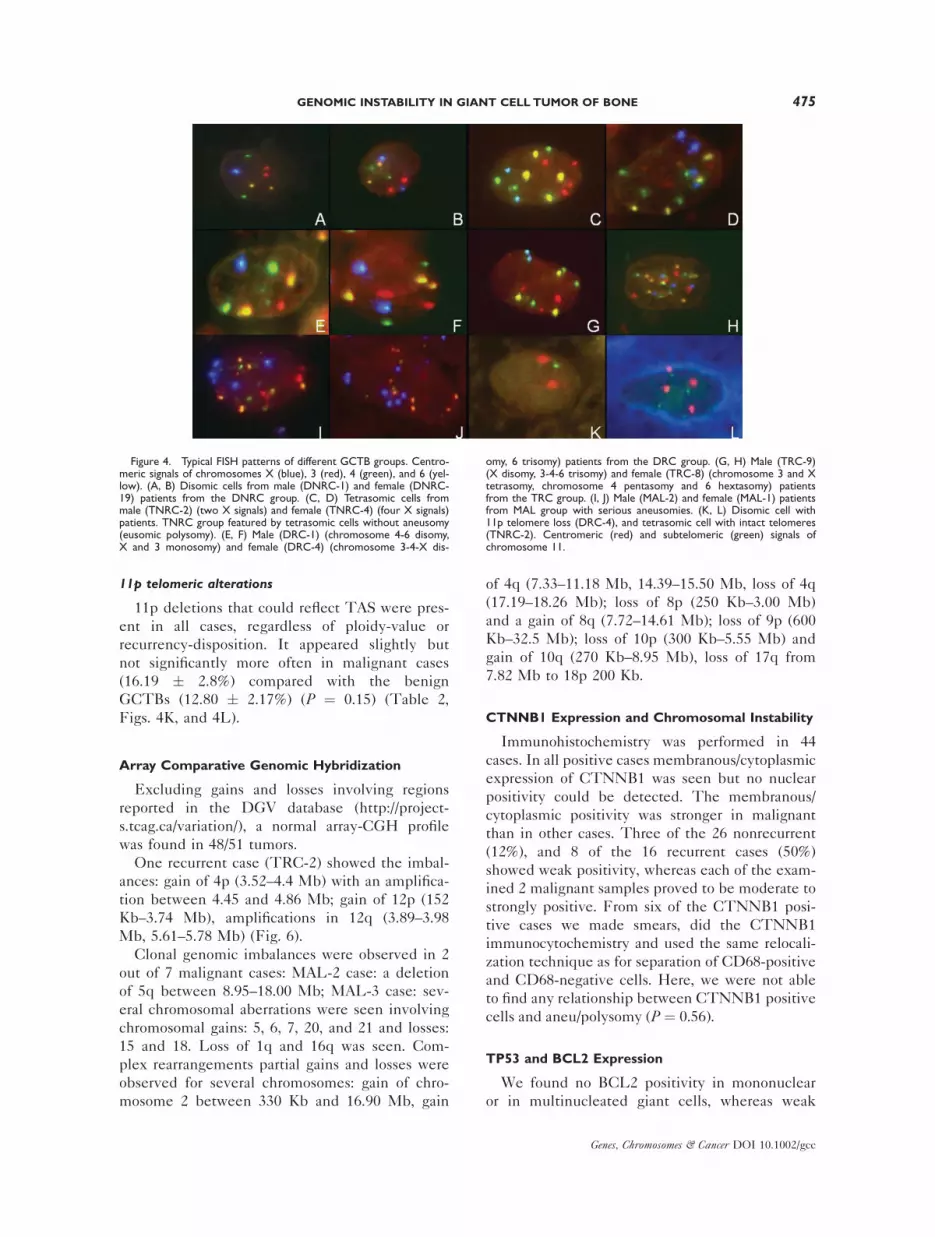
Figure 4. Typical FISH patterns of different GCTB groups. Centro-meric signals of chromosomes X (blue), 3 (red), 4 (green), and 6 (yel-low). (A, B) Disomic cells from male (DNRC-1) and female (DNRC-19) patients from the DNRC group. (C, D) Tetrasomic cells frommale (TNRC-2) (two X signals) and female (TNRC-4) (four X signals)patients. TNRC group featured by tetrasomic cells without aneusomy(eusomic polysomy). (E, F) Male (DRC-1) (chromosome 4-6 disomy,X and 3 monosomy) and female (DRC-4) (chromosome 3-4-X dis-
omy, 6 trisomy) patients from the DRC group. (G, H) Male (TRC-9)(X disomy, 3-4-6 trisomy) and female (TRC-8) (chromosome 3 and Xtetrasomy, chromosome 4 pentasomy and 6 hextasomy) patientsfrom the TRC group. (I, J) Male (MAL-2) and female (MAL-1) patientsfrom MAL group with serious aneusomies. (K, L) Disomic cell with11p telomere loss (DRC-4), and tetrasomic cell with intact telomeres(TNRC-2). Centromeric (red) and subtelomeric (green) signals ofchromosome 11.
GENOMIC INSTABILITY IN GIANT CELL TUMOR OF BONE 475
Genes, Chromosomes & Cancer DOI 10.1002/gcc

(þ) nuclear TP53 positivity in mononuclear cells
was detectable only in 2 malignant cases.
DISCUSSION
Although 80% of GCTBs are benign, local
recurrences and metastases can occur, even in
cases with a previously benign histology. Since
no reliable clinical and/or histopathological
parameters have been identified to predict the
outcome and help reducing radical surgical inter-
ventions in GCTB, we analyzed the genetic
instability in the CD68-negative neoplastic cell
population by using a combination of DNA
cytometry, interphase FISH, and array-CGH in
correlation with the clinical progression of the
disease. We found a significantly elevated num-
ber of random individual-cell aneusomies in
recurrent GCTB compared with nonrecurrent
cases and clonal alterations exclusively in the ma-
lignant group. Eusomic polysomy was seen in
several tetraploid nonrecurrent cases and bal-
anced aneusomy (gains as common as losses) was
more frequent in diploid recurrent than in diploid
nonrecurrent cases. These findings suggest that
chromosomal abnormalities superimposed on telo-
meric associations could be responsible for an
aggressive clinical course in GCTB.
One of the most commonly observed genetic
aberrations in GCTB is TAS (Bridge et al., 1992;
Sciot et al., 2000; Schwartz et al., 2002; Sawyer et
al., 2005). One concept is that telomeric instabil-
ity is responsible for a large degree of intratumor
heterogeneity and serves as a precursor lesion to
subsequent clonal structural aberrations of chro-
mosome 11 in GCTB (Sawyer et al., 2005). How-
ever, recently Forsyth et al. demonstrated that
the degree of telomere shortening in GCTB is
minimal compared with other malignant lesions,
and only the notably shortened telomeres could
be responsible for genetic instability. Telomerase
(hTERT) activity and an inactivated alternative
telomere lengthening mechanism were found,
which suggest that TAS alone does not contrib-
ute to the development of genetic instability
(Forsyth et al., 2008). Considering other genetic
alterations, there are convincing reports on abnor-
mal karyotypes in malignant (metastatic) GCTBs,
Figure 5. (A) I-ANEU values of normal control cells, CD68-posi-tive cell population, and different GCTB groups. Bars representstandard errors of means. Histiocytic cells contain no significant alter-ations compared with normal control cells (P ¼ 0.1992), whereas theneoplastic population shows more aberration compared with histio-cytes (*P < 0.001). Increasing I-ANEU values were seen in the differ-ent GCTB groups, with significant (P < 0.001) differences between
DRC** versus DNRC, TRC*** versus both DRC and TNRC, andMAL**** versus TRC group. (B) C-ANEU values regarding chromo-somes 3 (red), 4 (green), 6 (yellow), 11 (orange), X of females (pink),and X of males (blue) between GCTB groups. Bars represent stand-ard errors of means. [Color figure can be viewed in the online issue,which is available at www.interscience.wiley.com.]
476 MOSKOVSZKY ETAL.
Genes, Chromosomes & Cancer DOI 10.1002/gcc

clearly demonstrating that these tumors differ ge-
netically from the nonmetastasizing ones (Bridge
et al., 1992; Molenaar et al., 1994).
In this study, the DNA content of GCTBs as
measured by image cytometry was diploid in the
majority of cases, but there was a proportion con-
taining tetraploid subpopulations, on the other
hand. Although there was a tendency for recurrent
and malignant tumors to be tetraploid and aneu-
ploid, respectively, the ploidy value by itself was
not able to predict the clinical behavior of GCTB.
For the interpretation of the FISH results, we
set up a relocalization approach and could show
that the CD68-positive mononuclear histiocytes
do not contain chromosomal alterations. Examin-
ing the CD68-negative neoplastic cell population,
we could create five groups according to ploidy
combined with clinical behavior. It was conspicu-
ous, that all five groups showed random individ-
ual-cell aneusomy, i.e., there was no significant
difference between the aneusomy frequencies for
the different chromosomes (for the X chromo-
somes the numbers were corrected for sex) (Fig.
5B). However, the total individual-cell aneusomy
values between groups were significantly differ-
ent (Fig. 5A). Recurrent tumors showed higher
aneusomy rates than nonrecurrent ones, and ma-
lignant cases had higher frequencies than recur-
rent cases (Fig. 5A). The elevated aneusomy rate
in the DRC group (where the rates of mono- and
trisomy were almost equal) compared with the
DNRC group indicates a significantly higher
degree of chromosomal/genomic instability in line
with the tendency of recurrency, as we hypothe-
sized. A high frequency of polysomy was found
in the TNRC group (C-POLY: 9.98–22.54% in
TNRC, whereas 1.61–2.72% in DNRC and
0.00% in CD68-positive histiocytic population),
suggesting eusomic polisomy and euploid poly-
ploidisation, which is a benign phenomenon, e.g.,
in benign schwannomas (Saeter et al., 1988;
Hruska et al., 2004). Thus, tumors in TNRC
group contain tetraploid subpopulations analogous
to some kind of normal tissues (liver, seminal
vesicle) also containing high number of physio-
logical 4n cells (‘‘tetraploid subpopulation’’). This
phenomenon can explain why these tumors do
not recur. The practical conclusion from these
observations is that the increased individual-cell
aneusomy both in diploid and tetraploid tumors
predicts a recurrence, whereas tumors with euso-
mic polysomy are unlikely to recur.
In addition, we performed a whole-genome
screening by using array-CGH analysis (Inazawa et
al., 2004). To exclude bias of results resulting from
inherent tumor heterogeneity, the mononuclear
histiocytic cells and the histiocytic giant cells were
separated from the nonhistiocytic neoplastic cells
by magnetic-bead cell separation. Most previous
studies analyzed mixed mononuclear cell popula-
tions, which might have led to biased results.
Presumably, clonal chromosomal alterations
were found in 5 out of 7 malignant cases with
FISH, and in 2 out of 7 malignant cases with
array-CGH. Thus, clonal alterations could be
detected in 6 out of the 7 malignant cases. This
Figure 6. Array CGH profile after magnetic bead separation. The profile of the CD68-negative (dom-inantly tumor cell) pool showed clear patterns of alterations. Case TRC-2 with high-level amplificationon chromosomes 4 and 12.
GENOMIC INSTABILITY IN GIANT CELL TUMOR OF BONE 477
Genes, Chromosomes & Cancer DOI 10.1002/gcc

supports the conclusion, that a malignant behav-
ior is very likely if a GCTB shows imbalances at
array-CGH or has an aneusomy rate higher than
20% at FISH analysis in alignment to others
(Bridge et al., 1992; Molenaar et al., 1994).
Clonal alterations were found in 3 of the recur-
rent cases by FISH, whereas in only one recur-
rent case by array-CGH (in concordance with
FISH). There were no clonal alterations in the
nonrecurrent cases. The tendency of aneusomy
and clonal alterations suggests that there might
be a biological continuity of genetic instability in
GCTB.
The cause of genetic instability in GCTB still
remains obscure. TAS as causing mechanism is
disputed (Forsyth et al., 2008). To investigate
common factors participating in the regulation of
cell division and associated signaling pathways, we
examined the possible role of CTNNB1, a mem-
ber of the Wnt signaling pathway, as the failure of
this signaling route (usually with the nuclear accu-
mulation of CTNNB1) is well-known to cause
aneusomies and tetrasomies (Yang et al., 2006).
Although we found CTNNB1 positivity in 30% of
our cases, which is in line with a study published
by others on a smaller number of cases (Monaghan
et al., 2001), there was significant correlation nei-
ther between CTNNB1 positivity and the degree
of aneusomy nor between CTNNB1 expression
and the tendency to recur. Nuclear TP53 expres-
sion, indicating possible suppressor gene damage,
was found exclusively in a few malignant cases,
which is also in agreement with earlier studies
(Kandel et al., 2006). However, there might be
TP53 abnormalities which do not cause accumula-
tion of the protein; thus, further studies are needed
to safely exclude TP53 rearrangement as a cause
of genomic instability. As a possible indicator of
apoptotic pathway damage, we investigated the
expression of the anti-apoptotic BCL2, which
was, however, negative in all of our cases.
Although our studied factors behind the genetic
instability were not comprehensive, these and the
negative results of other published works (Gam-
beri et al., 1998; Kauzman et al., 2003; Kumta
et al., 2003; Kawaguchi et al., 2004; Kandel et al.,
2006; Knowles and Athanasou, 2008) support the
concept that genomic instability develops through
other mechanisms in GCTB.
ACKNOWLEDGMENTS
The Departments of Pathology of Semmelweis
University and Leiden University Medical Center
as well as Instituti Ortopedici Rizzoli are partners
of the EuroBoNeT consortium.
REFERENCES
Antal I, Sapi Z, Szendro†i M. 1999. The prognostic significance ofDNA cytophotometry and proliferation index (Ki-67) in giantcell tumors of bone. Int Orthop 23:315–319.
Antal I, Sapi Z, Szendro†i M. 2000. Malignant transformation ofgiant cell tumor in the distal radius. Value of the DNA cytopho-tometry. Orthopade 29:677–683.
Bridge JA, Neff JR, Mouron BJ. 1992. Giant cell tumor of bone.Chromosomal analysis of 48 specimens and review of the litera-ture. Cancer Genet Cytogenet 58:2–13.
Campanacci M, Baldini N, Boriani S, Sudanese A. 1987. Giant-cell tumor of bone. J Bone Joint Surg Am 69:106–114.
Carey FA. 1994. Measurement of nuclear DNA content in histo-logical and cytological specimens: Principles and applications.J Pathol 172:307–312.
Castagne C, Muhlematter D, Beyer V, Parlier V, van Melle G,Jotterand M. 2003. Determination of cutoff values to detectsmall aneuploid clones by interphase fluorescence in situhybridization: The Poisson model is a more appropriateapproach. Should single-cell trisomy 8 be considered a clonaldefect? Cancer Genet Cytogenet 147:99–109.
Dominkus M, Ruggieri P, Bertoni F, Briccoli A, Picci P, RoccaM, Mercuri M. 2006. Histologically verified lung metastases inbenign giant cell tumours—14 Cases from a single institution.Int Orthop 30:499–504.
Enneking WF. 1983.Musculoskeletal Tumor Surgery.New York:Churchill Livingstone.
Forsyth RG, Boeck G, Bekaert S, De Meyer T, Taminiau AH,Uyttendaele D, Roels H, Praet MM, Hogendoorn PCW. 2008.Telomere biology in giant cell tumour of bone. J Pathol 214:555–563.
Forsyth RG, De Boeck G, Baelde JJ, Taminiau AH, UyttendaeleD, Roels HR, Praet MM, Hogendoorn PCW. 2009. CD33(þ)CD14(-) Phenotype is characteristic of multinuclear osteoclast-like cells in giant cell tumor of bone. J Bone Miner Res 24:70–77.
Gamberi G, Benassi MS, Bohling T, Ragazzini P, Molendini L,Sollazo MR, Merli M, Ferrari C, Magagnoli G, Bertoni F, PicciP. 1998. Prognostic relevance of c-myc gene expression ingiant-cell tumor of bone. J Orthop Res 16:1–7.
Gamberi G, Benassi MS, Ragazzini P, Pazzaglia L, Ponticelli F,Ferrari C, Balladelli A, Mercuri M, Gigli M, Bertoni F, Picci P.2004. Proteases and interleukin-6 gene analysis in 92 giant celltumors of bone. Ann Oncol 15:498–503.
Hruska A, Bollmann R, Kovacs RB, Bollmann M, Bodo M, SapiZ. 2004. DNA ploidy and chromosome (FISH) pattern analysisof peripheral nerve sheath tumors. Cell Oncol 26:335–345.
Inazawa J, Inoue J, Imoto I. 2004. Comparative genomic hybrid-ization (CGH)-arrays pave the way for identification of novelcancer-related genes. Rev Cancer Sci 95:559–563.
Joyner CJ, Quinn JM, Triffitt JT, Owen ME, Athanasou NA.1992. Phenotypic characterisation of mononuclear and multi-nucleated cells of giant cell tumour of bone. Bone Miner 16:37–48.
Kandel R, Li SQ, Bell R, Wunder J, Ferguson P, Kauzman A,Diehl JA, Werier J. 2006. Cyclin D1 and p21 is elevated in thegiant cells of giant cell tumors. J Orthop Res 24:428–437.
Kauzman A, Li SQ, Bradley G, Bell RS, Wunder JS, Kandel R.2003. Cyclin alterations in giant cell tumor of bone. Mod Pathol16:210–218.
Kawaguchi K, Oda Y, Saito T, Yamamoto H, Takahira T, TamiyaS, Iwamoto Y, Tsuneyoshi M. 2004. Decreased expression oftransforming growth factor-b II receptor is associated with thatof p27KIP1 in giant cell tumor of bone: A possible link betweentransforming growth factor-b and cell cycle-related protein.Hum Pathol 35:61–68.
Knijnenburg J, Szuhai K, Giltay J, Molenaar L, Sloos W, Poot M,Tanke HJ, Rosenberg C. 2005. Insights from genomic microar-rays into structural chromosome rearrangements. Am J MedGenet 132:36–40.
Knijnenburg J, van der Burg M, Tanke HJ, Szuhai K. 2007. Opti-mized amplification and fluorescent labeling of small cell sam-ples for genomic array-CGH. Cytometry 71:585–591.
478 MOSKOVSZKY ETAL.
Genes, Chromosomes & Cancer DOI 10.1002/gcc

Knowles H, Athanasou N. 2008. Hypoxia-inducible factor isexpressed in giant cell tumour of bone and mediates paracrineeffects of hypoxia on monocyte-osteoclast differentiation viainduction of VEGF. J Pathol 215:56–66.
Kumta SM, Huang L, Cheng YY, Chow LT, Lee KM, ZhengMH. 2003. Expression of VEGF and MMP-9 in giant cell tumorof bone and other osteolytic lesions. Life Sci 73:1427–1436.
Labs K, Perka C, Schmidt GR. 2001. Treatment of stages 2 and 3giant-cell tumor. Arch Orthop Trauma Surg 121:83–86.
Ladanyi M, Tragano F, Huvos A. 1989. Benign metastasizinggiant cell tumours of bone. Cancer 64:1521–1526.
Lausten GS, Jensen PK, Schiodt T, Lund B. 1996. Local recur-rences in giant cell tumour of bone: Long-term follow up of 31cases. Int Orthop 20:172–176.
Mankin HJ, Connor JF, Schiller AL, Perlmutter N, Alho A,McGuire M. 1985. Grading of bone tumors by analysis of nu-clear DNA content using flow cytometry. J Bone Joint Surg Am67:404–413.
Masui F, Ushigome S, Fujii K. 1998a. Giant cell tumor of bone: Aclinicopathologic study of prognostic factors. Pathol Int 48:723–729.
Masui F, Ushigome S, Fuji K. 1998b. Giant cell tumor of bone: Animmunohistochemical comparative study. Pathol Int 48:355–361.
Molenaar WM, van den Berg E, Veth RP, Dijkhuizen T, de VriesEG. 1994. Tumor progression in a giant cell type malignant fi-brous histiocytoma of bone: Clinical, radiologic, histologic, andcytogenetic evidence. Genes Chromosomes Cancer 10:66–70.
Monaghan H, Bubb VJ, Sirimujalin R, Millward-Sadler SJ, SalterDM. 2001. Adenomatous polyposis coli (APC), b-catenin, andcadherin are expressed in human bone and cartilage. Histopa-thology 39:611–619.
Murata H, Kusuzaki K, Takeshita H, Hirata M, Hashiguchi S,Ashihara T, Hirasawa Y. 1999. Cytofluorometric DNA ploidyanalysis in giant cell tumor of bone: Histologic and prognosticvalue. Cancer Lett 136:223–229.
Nascimento AG, Huvos AG, Marcove RC. 1979. Primary malig-nant giant cell tumor of bone: A study of eight cases and reviewof the literature. Cancer 44:1393–1402.
Qian J, Bostwick DG, Takahashi S, Borell TJ, Brown JA, LieberMM, Jenkins RB. 1996. Comparison of fluorescence in situhybridization analysis of isolated nuclei and routine histologicalsections from paraffin-embedded prostatic adenocarcinomaspecimens. Am J Pathol 149:1193–1199.
Reid R, Banerjee SS, Sciot R. 2002. Giant cell tumour. In: FletcherCD, Unni KK, Mertens F, editors. World Health OrganizationClassification of Tumours. Pathology and Genetics of Tumours ofSoft Tissue and Bone. Lyon: IARC Press, pp. 310–312.
Saeter G, Lee CZ, Schwarze PE, Ous S, Chen DS, Sung JL,Seglen PO. 1988. Changes in ploidy distributions in humanliver carcinogenesis. J Natl Cancer Inst 80:1480–1485.
Sakkers RJB, Van der Heul RO, Kroon HM, Taminiau AHM,Hogendoorn PCW. 1997. Late malignant transformation of a be-nign giant-cell tumor of bone. A case report. J Bone Joint SurgAm 79:259–262.
Sanerkin NG. 1980. Malignancy, aggressiveness and recurrence ingiant cell tumor of bone. Cancer 46:1641–1649.
Sara AS, Ayala AG, el Naggar A, Ro JY, Raymond AK, Murray JA.1990. Giant cell tumor of bone a clinicopathologic and DNAflow cytometric analysis. Cancer 66:2186–2190.
Sawyer JR, Goosen LS, Binz RL, Swanson CM, Nicholas RW.2005. Evidence for telomeric fusions as a mechanism for recur-ring structural aberrations of chromosome 11 in giant cell tumorof bone. Cancer Genet Cytogenet 159:32–36.
Schwartz HS, Eskew JD, Butler MG. 2002. Clonality studies ingiant cell tumor of bone. J Orthop Res 20:387–390.
Sciot R, Dorfman H, Brys P, Dal Cin P, De Wever I, FletcherCD, Jonson K, Mandahl N, Mertens F, Mitelman F, Rosai J,Rydholm A, Samson I, Tallini G, Van den Berghe H, Vanni R,Willen H. 2000. Cytogenetic-morphologic correlations in aneur-ysmal bone cyst, giant cell tumor of bone and combined lesions.A report from the CHAMP study group. Mod Pathol 13:1206–1210.
Siebenrock KA, Unni KK, Rock MG. 1998. Giant-cell tumour ofbone metastasising to the lungs. A long-term follow-up. J BoneJoint Surg 80:43–47.
Szendro†i M. 2004. Giant-cell tumour of bone. J Bone Joint Surg86:5–12.
Szendro†i M, Kiss J, Antal I. 2003. Surgical treatment and prognos-tic factors in giant-cell tumor of bone. Acta Chir Orthop Trau-matol Cech 70:142–150.
Varanasi SS, Athanasou NA, Briceno I, Papiha SS, Datta HK.1999. Association of HLA-DRB1 alleles with giant cell tumourof bone. J Clin Pathol 52:782–784.
Yang Y, Fruehauf J, Xiang S, Li CJ. 2006. Genomic instability inprecancerous lesions before inactivation of tumor suppressorsTP53 and APC in patients. Cell Cycle 5:1443–1447.
GENOMIC INSTABILITY IN GIANT CELL TUMOR OF BONE 479
Genes, Chromosomes & Cancer DOI 10.1002/gcc
Copyright © 2022 FDOKUMEN