Ploidy variation in multinucleate cells changes under stress
18
Volume 26 March 15, 2015 1129 MBoC | ARTICLE Ploidy variation in multinucleate cells changes under stress Cori A. Anderson, Samantha Roberts*, Huaiying Zhang*, Courtney M. Kelly, Alexxy Kendall, ChangHwan Lee, John Gerstenberger, Aaron B. Koenig, Ruth Kabeche, and Amy S. Gladfelter Department of Biological Sciences, Dartmouth College, Hanover, NH 03755 ABSTRACT Ploidy variation is found in contexts as diverse as solid tumors, drug resistance in fungal infection, and normal development. Altering chromosome or genome copy number supports adaptation to fluctuating environments but is also associated with fitness defects attributed to protein imbalances. Both aneuploidy and polyploidy can arise from multinucle- ate states after failed cytokinesis or cell fusion. The consequences of ploidy variation in syn- cytia are difficult to predict because protein imbalances are theoretically buffered by a com- mon cytoplasm. We examined ploidy in a naturally multinucleate fungus, Ashbya gossypii. Using integrated lac operator arrays, we found that chromosome number varies substantially among nuclei sharing a common cytoplasm. Populations of nuclei range from 1N to >4N, with different polyploidies in the same cell and low levels of aneuploidy. The degree of ploidy variation increases as cells age. In response to cellular stress, polyploid nuclei diminish and haploid nuclei predominate. These data suggest that mixed ploidy is tolerated in these syn- cytia; however, there may be costs associated with variation as stress homogenizes the ge- nome content of nuclei. Furthermore, the results suggest that sharing of gene products is limited, and thus there is incomplete buffering of ploidy variation despite a common cytosol. INTRODUCTION Variation in ploidy within an organism can be a defining feature of either pathologies or normal developmental programs. Under- standing both the utility and the deleterious consequences of vary- ing DNA copy number relates to problems in fields as diverse as cancer biology, microbial pathogenesis and ecology, and plant de- velopment. Copy-number variation can be considered from the scale of small insertions or deletions that affect a single gene to amplifications of whole chromosomes (aneuploidy) or the entire ge- nome (polyploidy). DNA copy-number changes can lead to changes in the levels of the mRNA and proteins encoded in the amplified regions (Torres et al., 2007; Pavelka et al., 2010). Expression of al- tered copy-number regions thus has the potential to affect dramati- cally the physiology of cells. The consequences of aneuploidy on cell function are highly vari- able and context dependent. The majority of human solid tumors display aneuploid karyotypes and are also composed of rapidly pro- liferating cells (Weaver and Cleveland, 2006). Robust tumor growth is paradoxical in light of certain model aneuploid cells, which can be observed to grow slowly (Torres et al., 2007). The mechanisms by which tumors tolerate aneuploidy are still under study. However, one known function of key tumor suppressors is to monitor and ar- rest growth when cells display chromosome instability, a context in which aneuploidies arise (Li et al., 2010; Thompson and Compton, 2010). These programs are dismantled with inactivation of the tu- mor suppressors coincident with tumor progression. Work in model aneuploid yeast and fibroblast cells with engineered extra chromo- somes also indicates that one major cause of growth defects is pro- teotoxic stress. This stress emerges from the attempt to degrade excess proteins, and presumably tumor cells adapt to this stress (Torres et al., 2007; Pavelka et al., 2010; Oromendia et al., 2012). As in tumors, aneuploidy is also commonly observed in diverse fungal species in natural, clinical, and laboratory environments Monitoring Editor Kerry S. Bloom University of North Carolina Received: Sep 15, 2014 Revised: Jan 8, 2015 Accepted: Jan 16, 2015 This article was published online ahead of print in MBoC in Press (http://www .molbiolcell.org/cgi/doi/10.1091/mbc.E14-09-1375) on January 28, 2015. *These authors contributed equally. Address correspondence to: Amy S. Gladfelter ([email protected]). © 2015 Anderson et al. This article is distributed by The American Society for Cell Biology under license from the author(s). Two months after publication it is avail- able to the public under an Attribution–Noncommercial–Share Alike 3.0 Unport- ed Creative Commons License (http://creativecommons.org/licenses/by-nc -sa/3.0). “ASCB ® ,” “The American Society for Cell Biology ® ,” and “Molecular Biology of the Cell ® ” are registered trademarks of The American Society for Cell Biology. Abbreviation used: FISH, fluorescence in situ hybridization. http://www.molbiolcell.org/content/suppl/2015/01/27/mbc.E14-09-1375v1.DC1.html Supplemental Material can be found at:
Transcript of Ploidy variation in multinucleate cells changes under stress

Volume 26 March 15, 2015 1129
MBoC | ARTICLE
Ploidy variation in multinucleate cells changes under stressCori A. Anderson, Samantha Roberts*, Huaiying Zhang*, Courtney M. Kelly, Alexxy Kendall, ChangHwan Lee, John Gerstenberger, Aaron B. Koenig, Ruth Kabeche, and Amy S. GladfelterDepartment of Biological Sciences, Dartmouth College, Hanover, NH 03755
ABSTRACT Ploidy variation is found in contexts as diverse as solid tumors, drug resistance in fungal infection, and normal development. Altering chromosome or genome copy number supports adaptation to fluctuating environments but is also associated with fitness defects attributed to protein imbalances. Both aneuploidy and polyploidy can arise from multinucle-ate states after failed cytokinesis or cell fusion. The consequences of ploidy variation in syn-cytia are difficult to predict because protein imbalances are theoretically buffered by a com-mon cytoplasm. We examined ploidy in a naturally multinucleate fungus, Ashbya gossypii. Using integrated lac operator arrays, we found that chromosome number varies substantially among nuclei sharing a common cytoplasm. Populations of nuclei range from 1N to >4N, with different polyploidies in the same cell and low levels of aneuploidy. The degree of ploidy variation increases as cells age. In response to cellular stress, polyploid nuclei diminish and haploid nuclei predominate. These data suggest that mixed ploidy is tolerated in these syn-cytia; however, there may be costs associated with variation as stress homogenizes the ge-nome content of nuclei. Furthermore, the results suggest that sharing of gene products is limited, and thus there is incomplete buffering of ploidy variation despite a common cytosol.
INTRODUCTIONVariation in ploidy within an organism can be a defining feature of either pathologies or normal developmental programs. Under-standing both the utility and the deleterious consequences of vary-ing DNA copy number relates to problems in fields as diverse as cancer biology, microbial pathogenesis and ecology, and plant de-velopment. Copy-number variation can be considered from the scale of small insertions or deletions that affect a single gene to amplifications of whole chromosomes (aneuploidy) or the entire ge-nome (polyploidy). DNA copy-number changes can lead to changes in the levels of the mRNA and proteins encoded in the amplified
regions (Torres et al., 2007; Pavelka et al., 2010). Expression of al-tered copy-number regions thus has the potential to affect dramati-cally the physiology of cells.
The consequences of aneuploidy on cell function are highly vari-able and context dependent. The majority of human solid tumors display aneuploid karyotypes and are also composed of rapidly pro-liferating cells (Weaver and Cleveland, 2006). Robust tumor growth is paradoxical in light of certain model aneuploid cells, which can be observed to grow slowly (Torres et al., 2007). The mechanisms by which tumors tolerate aneuploidy are still under study. However, one known function of key tumor suppressors is to monitor and ar-rest growth when cells display chromosome instability, a context in which aneuploidies arise (Li et al., 2010; Thompson and Compton, 2010). These programs are dismantled with inactivation of the tu-mor suppressors coincident with tumor progression. Work in model aneuploid yeast and fibroblast cells with engineered extra chromo-somes also indicates that one major cause of growth defects is pro-teotoxic stress. This stress emerges from the attempt to degrade excess proteins, and presumably tumor cells adapt to this stress (Torres et al., 2007; Pavelka et al., 2010; Oromendia et al., 2012).
As in tumors, aneuploidy is also commonly observed in diverse fungal species in natural, clinical, and laboratory environments
Monitoring EditorKerry S. BloomUniversity of North Carolina
Received: Sep 15, 2014Revised: Jan 8, 2015Accepted: Jan 16, 2015
This article was published online ahead of print in MBoC in Press (http://www .molbiolcell.org/cgi/doi/10.1091/mbc.E14-09-1375) on January 28, 2015.*These authors contributed equally.Address correspondence to: Amy S. Gladfelter ([email protected]).
© 2015 Anderson et al. This article is distributed by The American Society for Cell Biology under license from the author(s). Two months after publication it is avail-able to the public under an Attribution–Noncommercial–Share Alike 3.0 Unport-ed Creative Commons License (http://creativecommons.org/licenses/by-nc -sa/3.0).“ASCB®,” “The American Society for Cell Biology®,” and “Molecular Biology of the Cell®” are registered trademarks of The American Society for Cell Biology.
Abbreviation used: FISH, fluorescence in situ hybridization.
http://www.molbiolcell.org/content/suppl/2015/01/27/mbc.E14-09-1375v1.DC1.htmlSupplemental Material can be found at:

1130 | C. A. Anderson et al. Molecular Biology of the Cell
between nuclei in the same cell and that aneuploidy is tolerated in syncytia.
RESULTSDNA content varies among nuclei in a single cellAshbya cells expressing green fluorescent protein–labeled his-tone-4 (Hhf1-GFP) were filmed, and the fluorescence intensity of the histone signal in single nuclei was measured at birth (pre–DNA replication) and moments before division (post–DNA replication). If all nuclei are haploid, we would predict two discrete peaks of his-tone intensities corresponding to 1N ploidy at birth and 2N ploidy before mitosis (Figure 1A). Surprisingly, nuclei showed a wide range of intensities at birth and immediately preceding mitosis (Figure 1B, N = 47 nuclei). The two distributions of intensities show substantial overlap, although the mean intensity at mitosis is modestly but significantly higher than at birth (birth mean, 12,720 ± 3970 a.u.; mitosis mean, 15,030 ± 5623 a.u.; two-sample t test, p <0.03). The signal variation is not due to differential photobleaching, as the Hhf1-GFP intensity of nuclei is not correlated with the time point in the image acquisition (Supplemental Figure S1). This suggests that nuclei are born and divide with variable amounts of DNA in the same cell.
To ensure that histone intensities increase with cell cycle progres-sion and DNA replication, we plotted the histone intensity for indi-vidual nuclei and found that for all nuclei the signal increases with progression toward mitosis. The time from minimum to maximum signal intensity ranged from 30 to 134 min (Figure 1C; mean, 83 min, SD = 21 min, N = 47), with an average 1.5-fold change in the histone intensity (Figure 1D). This change may not be twofold due to a sol-uble pool of histones that is present in the nucleus at birth and used to build nucleosomes during replication or because not all the DNA is replicated. These data suggest that the duration of S phase is likely highly variable, and this could be due to variable DNA con-tent, heterogeneous import of Hhf1-GFP, or other factors control-ling DNA replication being limiting. Therefore, as a second measure of DNA content through the cell cycle, we measured the incorpora-tion of the DNA dye 4′,6-diamidino-2-phenylindole (DAPI) into nu-clei that were scored for cell cycle stage based on the state of the spindle pole body (SPB). As seen in live cells, nuclei in the same SPB state, and presumably the same cell cycle stage, show a broad dis-tribution of DAPI intensities, supporting the idea that there may be substantial variation in the DNA content among nuclei in the same cell (Figure 1E).
Nuclei vary in the number of copies of individual chromosomesGiven the heterogeneity of histone and DAPI signals, we next inves-tigated the numbers of individual chromosomes by integrating 32 lac operator repeats into intergenic regions of either chromo-some I (smallest in size) or chromosome VI (largest in size) in a strain also expressing GFP-LacI-NLS (Figure 2, A and B). Nuclei had from zero to greater than four spots of GFP-LacI signals for each of the chromosomes; the largest number of spots detected was six (Figure 2, A–C; >300 nuclei for each chromosome, cells scored at a stage of >100 nuclei). At very low frequency, nuclei could be seen without a LacI signal, suggesting rare loss of the chromosome. Work using similarly marked chromosomes in S. cerevisiae showed that LacI signals on sister chromosomes are not resolvable until ana-phase as long as the repeat sequences are far from centromeres (Straight et al., 1997; Pearson et al., 2001). This suggests that the Ashbya nuclei with ≥2 spots in fact have extra chromosomes rather than having finished S phase. Nevertheless, we assessed the SPB
(Morrow and Fraser, 2013; Bennett et al., 2014). For example, in the fungal pathogen Candida albicans, aneuploid cells readily emerge through transient tetraploidization and in response to antifungals (Forche et al., 2008; Selmecki et al., 2010; Harrison et al., 2014). This capacity to remodel the genome is beneficial to the pathogen dur-ing infection and enables the development of drug resistance. Vari-ation in ploidy is also seen during the course of sexual development and infection with the human pathogen Cryptococcus neoformans (Idnurm, 2010; Semighini et al., 2011). In addition, under some stress conditions, aneuploid Saccharomyces cerevisiae cells are more fit than euploid strains, indicating that ploidy variation may be highly adaptive, depending on the environmental conditions (Pavelka et al., 2010; Yona et al., 2012; Zhu et al., 2012). Further-more, industrial Saccharomyces yeast strains developed for brewing and baking are largely polyploid and/or aneuploid (Querol and Bond, 2009). Thus the capacity to induce and tolerate large genome changes can provide an adaptive advantage for diverse fungi in the context of pathogenesis and environmental stress.
Aneuploidy can arise through multiple, distinct molecular mech-anisms. Current known routes to aneuploidy include failure in the spindle assembly checkpoint (SAC), altered error correction of misattached chromosomes, and transient polyploidization through cytokinesis failure or cell fusion (Burds et al., 2005; Lu and Kang, 2009; Krajcovic et al., 2011; Bakhoum and Compton, 2012). There is evidence that polyploidy can increase the probability of many cells, including those of budding yeast, of becoming aneuploid (Stor-chova et al., 2006). Similarly, aneuploid liver cells can arise from a polyploid starting population (Duncan et al., 2010). Whereas poly-ploidy has long been appreciated for functional relevance in plants and specific animal tissues, recent work in fungi has started to focus attention on polyploidy as an engine of evolution (Albertin and Marullo, 2012). Thus polyploidy could serve as a reservoir to gener-ate functional aneuploidies under specific stresses or be useful unto itself for specific metabolic needs in a given tissue or environment.
Most filamentous fungi exist in syncytial states, in which many nuclei share a common cytoplasm during mycelial growth. Further-more, it is clear that in many fungi, different genomes can coexist, cooperating and/or competing in a single cell (Roper et al., 2011). However, it is less clear how genomes that differ due to chromo-some imbalances may function in fungal syncytia. Syncytia theoreti-cally may be a highly permissive environment for aneuploidy, as imbalances may be complemented across multiple nuclei in the same cytoplasm. This would require that gene products are well mixed so that the cytosol buffers protein imbalances. In this case, syncytial cells may harbor high frequencies of aneuploidy and suffer fewer fitness consequences than uninucleate cells with a chromo-some imbalance. This idea is supported by the multinucleate states seen in tumors that are also aneuploid (Lu and Kang, 2009). Alterna-tively, if the cytosol is compartmentalized in large multinucleate cells such that gene products are not shared between nuclei, then ploidy may be more tightly controlled due to functionally heterogeneous cytosol.
We monitored ploidy in the multinucleate fungus Ashbya gos-sypii to examine the variability of chromosome content of individual nuclei within a single cell. Previous work in Ashbya suggested that the euploid state of the system is haploid in multinucleate mycelia and uninucleate haploid spores are produced by asexual sporula-tion (Dietrich et al., 2004). In Ashbya, nuclei have highly variable di-vision cycle durations, so that nuclei divide out of sync with their neighbors (Gladfelter et al., 2006). One possible source of timing variation between nuclei in a single cell is variable DNA content. In this study, we tested the hypotheses that there is ploidy variation

Volume 26 March 15, 2015 Ploidy variation in multinucleate cells | 1131
FIGURE 1: DNA content varies among Ashbya nuclei. (A) Schematic of predicted relative Hhf1-GFP intensity changes before replication and after replication. (B) Hhf1-GFP intensity at birth and mitosis. Background-corrected GFP intensity was measured by thresholding around the central nuclear coordinate, which was manually recorded immediately before and after mitosis (47 nuclei; Anderson et al., 2013). (C) Background-corrected Hhf1-GFP intensity summed for each nucleus over time. Each line represents one nucleus (47 nuclei). (D) Fold change in Hhf1-GFP intensity over time for each nucleus tracked. Fold change was defined as the maximum Hhf1-GFP intensity normalized to the starting Hhf1-GFP intensity for each nucleus (47 nuclei). (E) Histogram of DAPI intensity for all cell cycle phases. Cell cycle stage was scored by SPB state, and GFP intensity was normalized to the one-SPB population mean. Black bars represent one SPB (G1; N = 126), green bars represent two SPBd (S/G2; N = 117), and blue bars represent two SPBs that are bioriented (M; N = 19).

1132 | C. A. Anderson et al. Molecular Biology of the Cell
FIGURE 2: Individual chromosomes are variable between nuclei. (A, B) Schematic of Ashbya chromosomes. All seven chromosomes and the mitochondrial DNA are shown to scale. Red ovals indicate centromeres; green bars indicate the location of the 32lacO::Gen3 integration onto chromosomes I (A) and VI (B). The chromosome I and IV lacO integrations are 126 and 56 kb away from the centromere, respectively. Still images of Ashbya nuclei containing zero to four copies of both chromosomes I and VI are shown beside each schematic. (C) Quantification of chromosome counts in Ashbya nuclei. Chromosome I counts are indicated in black and chromosome VI counts are in gray (chromosome I, N = 350; VI, N = 364). (D) Chromosome I counts are independent of cell cycle phase, as indicated by SPB state. Dark blue bars represent chromosome I distribution for one SPB (G1), and light blue bars represent the chromosome I distribution for two SPBs (S/G2/M). One SPB, N = 112; two SPBs, N = 66. (E) RNA FISH of individual nuclei using CLN1/2-TAMRA probes that hybridize to mRNA. Signals in nucleus represent sites of gene expression, and >90% nuclei express CLN1/2 transcript. Images of DNA (Hoechst) and chromosomes and a merge image show that individual nuclei containing one or two signals indicate sites where CLN1/2 is expressed in a single nucleus.
Volume 26 March 15, 2015 Ploidy variation in multinucleate cells | 1133
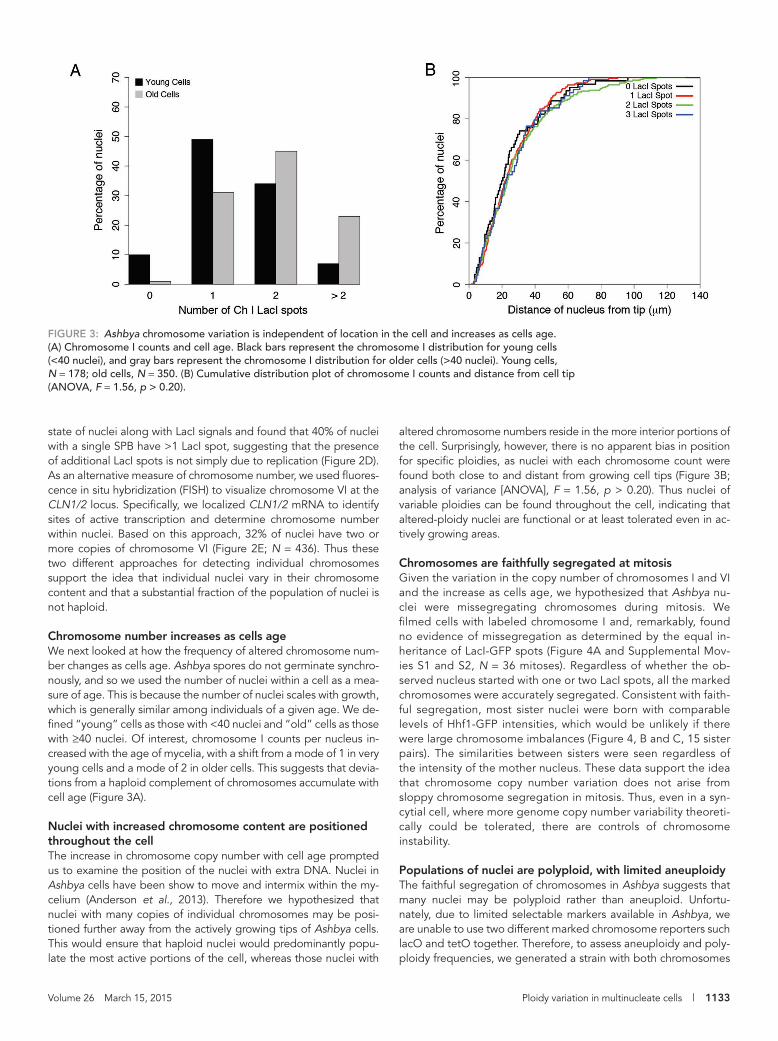
altered chromosome numbers reside in the more interior portions of the cell. Surprisingly, however, there is no apparent bias in position for specific ploidies, as nuclei with each chromosome count were found both close to and distant from growing cell tips (Figure 3B; analysis of variance [ANOVA], F = 1.56, p > 0.20). Thus nuclei of variable ploidies can be found throughout the cell, indicating that altered-ploidy nuclei are functional or at least tolerated even in ac-tively growing areas.
Chromosomes are faithfully segregated at mitosisGiven the variation in the copy number of chromosomes I and VI and the increase as cells age, we hypothesized that Ashbya nu-clei were missegregating chromosomes during mitosis. We filmed cells with labeled chromosome I and, remarkably, found no evidence of missegregation as determined by the equal in-heritance of LacI-GFP spots (Figure 4A and Supplemental Mov-ies S1 and S2, N = 36 mitoses). Regardless of whether the ob-served nucleus started with one or two LacI spots, all the marked chromosomes were accurately segregated. Consistent with faith-ful segregation, most sister nuclei were born with comparable levels of Hhf1-GFP intensities, which would be unlikely if there were large chromosome imbalances (Figure 4, B and C, 15 sister pairs). The similarities between sisters were seen regardless of the intensity of the mother nucleus. These data support the idea that chromosome copy number variation does not arise from sloppy chromosome segregation in mitosis. Thus, even in a syn-cytial cell, where more genome copy number variability theoreti-cally could be tolerated, there are controls of chromosome instability.
Populations of nuclei are polyploid, with limited aneuploidyThe faithful segregation of chromosomes in Ashbya suggests that many nuclei may be polyploid rather than aneuploid. Unfortu-nately, due to limited selectable markers available in Ashbya, we are unable to use two different marked chromosome reporters such lacO and tetO together. Therefore, to assess aneuploidy and poly-ploidy frequencies, we generated a strain with both chromosomes
state of nuclei along with LacI signals and found that 40% of nuclei with a single SPB have >1 LacI spot, suggesting that the presence of additional LacI spots is not simply due to replication (Figure 2D). As an alternative measure of chromosome number, we used fluores-cence in situ hybridization (FISH) to visualize chromosome VI at the CLN1/2 locus. Specifically, we localized CLN1/2 mRNA to identify sites of active transcription and determine chromosome number within nuclei. Based on this approach, 32% of nuclei have two or more copies of chromosome VI (Figure 2E; N = 436). Thus these two different approaches for detecting individual chromosomes support the idea that individual nuclei vary in their chromosome content and that a substantial fraction of the population of nuclei is not haploid.
Chromosome number increases as cells ageWe next looked at how the frequency of altered chromosome num-ber changes as cells age. Ashbya spores do not germinate synchro-nously, and so we used the number of nuclei within a cell as a mea-sure of age. This is because the number of nuclei scales with growth, which is generally similar among individuals of a given age. We de-fined “young” cells as those with <40 nuclei and “old” cells as those with ≥40 nuclei. Of interest, chromosome I counts per nucleus in-creased with the age of mycelia, with a shift from a mode of 1 in very young cells and a mode of 2 in older cells. This suggests that devia-tions from a haploid complement of chromosomes accumulate with cell age (Figure 3A).
Nuclei with increased chromosome content are positioned throughout the cellThe increase in chromosome copy number with cell age prompted us to examine the position of the nuclei with extra DNA. Nuclei in Ashbya cells have been show to move and intermix within the my-celium (Anderson et al., 2013). Therefore we hypothesized that nuclei with many copies of individual chromosomes may be posi-tioned further away from the actively growing tips of Ashbya cells. This would ensure that haploid nuclei would predominantly popu-late the most active portions of the cell, whereas those nuclei with
FIGURE 3: Ashbya chromosome variation is independent of location in the cell and increases as cells age. (A) Chromosome I counts and cell age. Black bars represent the chromosome I distribution for young cells (<40 nuclei), and gray bars represent the chromosome I distribution for older cells (>40 nuclei). Young cells, N = 178; old cells, N = 350. (B) Cumulative distribution plot of chromosome I counts and distance from cell tip (ANOVA, F = 1.56, p > 0.20).

1134 | C. A. Anderson et al. Molecular Biology of the Cell
FIGURE 4: Ashbya faithfully segregates chromosomes at mitosis. (A) Still images of chromosome segregation at mitosis. Top, frames from Supplemental Movie S1, showing one copy of chromosome I being faithfully segregated. Arrowheads point to single chromosome spots. Bottom, frames from Supplemental Movie S2, showing two copies of chromosome I being segregated. The asterisk is centered between the two copies of chromosome I in each nucleus. (B) Sister Hhf1-GFP intensity at birth. The sum Hhf1-GFP intensity of the brighter sister is plotted in black, with the dimmer sister overlaid in gray (15 pairs of sisters). (C) Kolmogorov–Smirnov (K-S) test plot of observed sister Hhf1-GFP intensities. The observed difference in sister Hhf1-GFP intensity at birth (immediately after mitosis) is displayed as a cumulative distribution plot in black. A randomized difference was calculated for two different populations of observed nuclei; the lowest 10 observed Hhf1-GFP intensities were used as a distribution for 1N, and the highest 10 observed Hhf1-GFP intensities were used as a distribution for 2N. No difference is observed between the difference in sister Hhf1-GFP intensity and randomly pairing nuclei in these two subpopulations (15 sister pairs; compared with 1N [red line], D = 0.26, p = 0.26; compared with 2N [blue line], D = 0.19, p = 0.65).
I and VI marked with lacO repeats in the same nuclei (Figure 5A). If nuclei are polyploid, nuclei should have LacI spots in multiples of two, such as two, four, or eight. However, if nuclei are aneuploid,
then odd numbers should be observed at some frequency, as by chance chromosome I or VI would be in excess or missing (Figure 5B). When scored in very young cells, the majority of nuclei in

Volume 26 March 15, 2015 Ploidy variation in multinucleate cells | 1135
Spindle checkpoint protein Mad2 is required for normal growthGiven that the frequency of aneuploidy is low in young cells, we hypothesized that the SAC is critical for keeping aneuploidy in check. Activity of the checkpoint may then decrease as the cells age when aneuploid nuclei appear. We generated mutants lacking Mad2—part of the conserved spindle assembly checkpoint machin-ery—and found that mad2Δ cells grow slowly and had highly irregu-lar borders, which reflects unequal growth across multiple hyphae (Figure 6). Such variable growth edges would be expected if there is stochastic loss of genome stability and therefore localized cell death or senescence in certain branches, leading to their inability to grow while others maintain growth. This observed growth phenotype is considered “haploinsufficient,” as these are heterokaryons and there is still wild-type Mad2 expressed from a subset of nontrans-formed nuclei. Therefore, in areas where there are many trans-formed mad2Δ nuclei, presumably growth cannot occur, whereas
the strain with two marked chromosomes contain two LacI spots, consistent with the idea that nuclei are haploid at a young age (<40 nuclei). As cells grow (≥40 nuclei), the distribution shifts to a modal number of four spots, indicative of two copies of each chromosome (Figure 5C, N = 118 [≥40 nuclei], N = 253 [<40 nuclei]). Coincident with aging, there is also an increase in nuclei with odd numbers of chromosomes, which reflects mod-est levels (∼25%) of aneuploidy. These data are consistent with the observed faithful segregation of chromosomes at mitosis in young cells (Figure 4A and Supplemental Movies S1 and S2) and supports the idea that nuclei within the syncytium can exist with chromosomal aneuploidies but are predominantly polyploid. We speculate that as the volume of cytosol increases with age, low levels of aneuploidy become tolerable. Thus nuclei vary in ploidy in the same cell, but the majority of the variation likely involves amplification of whole genomes rather than individual chromosomes.
FIGURE 5: Ashbya nuclei are predominantly polyploid. (A) Schematic of Ashbya chromosomes. All seven chromosomes and the mitochondrial DNA are shown to scale. Red ovals indicate centromeres, and green bars indicate the location of the 32lacO::Gen3 integration onto chromosomes I and VI. (B) Schematic of ChI 32lacO::Gen3/ChVI 32-lacO::Nat1 results. Nuclei with two, four, or eight resolvable LacI spots are polyploid. All other LacI spot counts would be evidence for aneuploidy. (C) Quantification of chromosome counts in ChI 32-lacO::Gen3/ChVI 32-lacO::Nat1 Ashbya nuclei. Black bars represent the distribution for young cells (<40 nuclei, N = 118), and gray bars represent the distribution for older cells (>40 nuclei, N = 253).

1136 | C. A. Anderson et al. Molecular Biology of the Cell
common feature of solid tumors and is associated with infection and drug resistance in human fungal pathogens, yet when artificially en-gineered into cells, aneuploidy can be a fitness disadvantage. Al-though many aneuploidies arise from cells that undergo a multinu-cleate stage, the functional consequences of having variable ploidies in one cytosol have not been examined. Given that in mul-tinucleate cells there is the potential for mixing and sharing of gene products between nuclei with different genotypes, it is unclear whether aneuploidy would be deleterious, beneficial, or neutral. Here we analyzed natural ploidy variation in the multinucleate fun-gus Ashbya, in which nuclei transit the division cycle asynchronously (Gladfelter et al., 2006; Nair et al., 2010). Thus the goal of this work was both to understand how ploidy might vary in syncytia and to see whether ploidy could be a source of differences among nuclei. Recent work has implicated aneuploidy in delaying cell cycle pro-gression (Thorburn et al., 2013), and we speculated that ploidy variation may be tolerated in a shared cytoplasm and be a source of division-timing variation among nuclei.
We observed in Ashbya that nuclei have variable numbers of chromosomes, ranging from one to greater than four copies of
those branches with enough Mad2-expressing nuclei continue to grow. Alternatively, the overall dose of Mad2 is insufficient for each nucleus to trigger a checkpoint when needed, or nuclei residing in the same cell do not generally share checkpoint components. We hypothesize that the loss of Mad2 in branches causes higher levels of aneuploidy than can be tolerated and localized growth arrest. Heterokaryon cells lacking Mad2 also fail to produce asexual spores, making it impossible to generate homokaryon, null mutants. This requirement for the spindle checkpoint suggests that aneuploidy in young cells is not well-tolerated and is likely kept in check by the SAC. It also suggests that chromosome imbalances are not com-pensated for even though there are multiple neighboring nuclei ca-pable of supplying missing or imbalanced gene products. The SAC is likely active and required even in nonperturbed conditions, indicating that there may be generally high levels of errors in chro-mosome attachment, perhaps due to the presence of extra chromo-somes in polyploid nuclei and insufficient spindle microtubules.
Stress promotes a redistribution of nuclei to a haploid stateIn previous studies, it was found or postulated that variation in ploidy—primarily aneuploidy— might be adaptive under stressful or fluctuating conditions. In fact, experimental evolution experiments show that aneuploidy can be one of the fastest ways in which yeast cells adapt to fluctuating conditions (Yona et al., 2012). If so, we predict that growing cells under stress may promote even more ex-treme ploidy differences and potentially increase the level of chro-mosome variation among nuclei. We subjected Ashbya strains with a lacO-marked chromosome I to a panel of stress conditions, includ-ing cell wall stress (2 mM caffeine), osmotic stress (200 mM NaCl), excess zinc (10 mM ZnSO4), the ergosterol synthesis inhibitor and clinical antifungal fluconazole (325 nM), and temperature (37°C). Remarkably, in all stress conditions except caffeine, the ploidy status shifted significantly to a euploid state rather than a more polyploid state, such that the majority of nuclei now contained a single detect-able LacI-GFP spot (Figure 7; Z test, p <0.05; >85 nuclei each condi-tion). This supports the idea that Ashbya cells can vary ploidy in re-sponse to external signals but that, remarkably, stress drives the cells to a more euploid state rather than more variable ploidy.
DISCUSSIONPloidy variation has been shown to be advantageous or deleterious, depending on the biological context. For example, aneuploidy is a
FIGURE 6: mad2Δ cells have decreased viability in Ashbya. Colony growth of wild-type (-ade2) and mad2Δ::NAT1 heterokaryon strains. Bars, SD; three plates/strain. Images represent colony growth after 5 d.
FIGURE 7: Chromosome number variation decreases in response to various cellular stresses. Quantification of chromosome I counts in Ashbya nuclei under normal growth and in the presence of various cellular stresses (>85 nuclei/condition).

Volume 26 March 15, 2015 Ploidy variation in multinucleate cells | 1137
achieve optimum stoichiometries in protein complexes (Oromendia et al., 2012). In Ashbya, in which a haploid, diploid, and tetraploid nucleus may all be neighbors, there is the possibility for some local imbalances in levels of proteins in complexes at the boundaries be-tween nuclear territories, and this may present some low baseline of proteotoxic stress. This stress may be outweighed in normal condi-tions by having some nuclei at enhanced biosynthetic capacity by housing more DNA. Under stress, perhaps the burden of proteo-toxic stress is too great, and haploid nuclei take over, as seen in the majority of stress conditions analyzed. Of interest, caffeine did not lead to a ploidy reduction, potentially due to a different response to this specific condition or because the level of stress was insufficient to generate proteotoxic strain. In any case, this work reveals another example in which ploidy changes under stress and shows that the number of nuclei in the cell might be an important factor in how ploidy state might change in stress. This is important in light of the observation of multinucleate cells in tumors.
How are ploidy differences established in Ashbya? In the filming of individual nuclei with marked chromosomes, which revealed no missegregation, there were unfortunately no hints of how nuclei become polyploid. We found no evidence of nuclear fusion, failed anaphases, or clear endoreduplication, but we predict that there must be some frequency of these events that potentially are sup-pressed during live-cell imaging and evade our detection. Although the direct mechanism of establishing ploidy variation remains elusive, the striking shift we observed from an apparently haploid state in very young cells to polyploid states with age suggests that germlings emerge from haploid spores. This is also supported by extensive application of reverse genetics in the system in which clean gene replacement strains are usually able to be gener-ated from single spores of a heterokaryon transformant (Wendland et al., 2000).
How do haploid spores arise out of mature polyploid/aneuploid mycelia? Ashbya cells form asexual spores only after colonies have matured for multiple days on an agar plate. The specific mecha-nisms of spore formation in Ashbya are poorly understood, and it is not known whether there is a meiotic component to sporulation. There are many conserved components for meiosis, and it has been speculated that nuclei fuse and then undergo meiotic-like reduc-tions to make spores (Wasserstrom et al., 2013). However, the lack of mechanistic evidence for meiotic-like reductions suggests that all spores examined in the lab are asexual. To generate haploid spores from the variable ploidy nuclei of mature mycelia means that there is a likely a reduction in ploidy and correction of the low levels of aneuploidy during spore formation. Alternatively, the population of asexual spores formed may have variable ploidy and be a bet-hedg-ing strategy for germination in different environments, which would be especially useful source of genetic diversity in an asexually re-producing population. We saw that only half of wild-type Ashbya spores germinate (N > 200; unpublished observations). This low germination frequency suggests that it is likely that spores of many ploidies are produced, but only haploids are able to germinate un-der lab conditions. Furthermore, spores from mad2Δ strains show an even lower germination rate of 33%, suggesting that altering the SAC and presumably increasing ploidy variation further decreased spore viability in lab conditions. In S. cerevisiae, >90% of spores undergo germination and are viable (Klapholz et al., 1985; Diaz et al., 2002). However, many fungi that under certain conditions have been shown to be aneuploid, including some strains of S. cere-visiae, Neurospora crassa, Sordaria macrospora, and the basidiomy-cetes C. neoformans and Coprinus cinereus, have decreased spore viability (Klapholz et al., 1985; Celerin et al., 2000; Diaz et al., 2002;
individually tagged chromosomes. Nuclei are able to faithfully seg-regate chromosomes and appear to be frequently polyploid and less frequently aneuploid. Deletion of MAD2 is deleterious, sug-gesting that a functional spindle assembly checkpoint is necessary for normal growth in Ashbya. Of note, growth under stress causes ploidy to decrease to near euploid, suggesting that chromosome count variability is not maintained under stress. Thus polyploidy and to a certain degree aneuploidy are tolerated in Ashbya under optimal growth conditions. Electron tomography analysis of a small number of nuclei in young Ashbya cells showed the mitotic spindle contains a similar number of kinetochore microtubules as budding yeast, and yet haploid A. gossypii has less than half the number of chromosomes (seven chromosomes in Ashbya vs. 16 in S. cerevi-siae; Gibeaux et al., 2012). Therefore it is probable that in diploid nuclei, sufficient kinetochore microtubules are made for correct chromosome attachments at mitosis but that, as ploidies increase with cell age, kinetochore microtubules become limiting and/or im-proper attachments are more common.
In addition to polyploidy, there is also a degree of aneuploidy among Ashbya nuclei, suggesting some level of chromosome loss. In the pathogenic fungus C. albicans, parasexual cycles result in tet-raploid nuclei that undergo concerted chromosome loss to reach near diploidy (Hull et al., 2000; Bennett, 2003; Forche et al., 2008). Chromosome loss after polyploidization was also observed in S. cerevisiae, in which the frequency of loss increased with increased ploidy (Mayer and Aguilera, 1990; Gerstein et al., 2006, 2008). Simi-larly, in Drosophila rectal cells, polyploid cells produce high levels of aneuploidy (Schoenfelder et al., 2014). It is possible that predomi-nantly polyploid nuclei infrequently undergo chromosome loss, resulting in the low levels of aneuploidy we observe in Ashbya. Con-sistent with this hypothesis, we see increased levels of aneuploidy in older cells, suggesting that the increased ploidy variation in more mature cells may be leading to increased chromosome loss.
Although limited aneuploidies are observed, they are likely not well tolerated in Ashbya. Deletion of MAD2 results in decreased colony growth and produces phenotypes even when some nuclei express Mad2. This indicates both that aneuploidy is likely not toler-ated and that checkpoints may be nuclear intrinsic in action, which has been seen in the context of binucleate yeast and marsupial cells (Rieder et al., 1997; Demeter et al., 2000). Why is aneuploidy not tolerated when gene products can theoretically be shared between nuclei in a syncytium? In fact, the cytosol may not be as functionally homogeneous as might be expected. These results are consistent with recent work in Ashbya showing that nuclei can create functional compartments, and neighboring nuclei do not completely intermix their surrounding cytosol. These nuclear territories require cytoplas-mic microtubules and functional protein aggregates that localize mRNAs (Anderson et al., 2013; Lee et al., 2013). The regionalization of cytosol around individual nuclei may decrease any hypothetical buffering capacity of the syncytium. In a context in which the cytosol is regionalized rather than homogenized, nuclei with polyploid complements of chromosomes create functional territories. Aneu-ploid nuclei may not be functionally complemented by neighboring nuclei and therefore may not be maintained.
The existence of functionally distinct regions of cytosol with lim-ited exchange might help explain why external cell stress reduces ploidy variation. It is well established that for proteins that form larger complexes to function (e.g., tubulin heterodimers), an imbal-ance in the expression of one of the components is deleterious (Weinstein and Solomon, 1990). In addition, it has been shown that excess proteins that arise from a chromosome amplification create a proteotoxic burden on cells as they degrade excess proteins to

1138 | C. A. Anderson et al. Molecular Biology of the Cell
yeast with 3′ chromosome I homology to generate AGB322/323, which were verified by digestion with XnmI/XhoI and sequencing with AGO678. AGB322/323 were digested using SpeI/StuI and transformed into AG302 to generate AG479.1-3. Primary transfor-mants were picked onto G418 plates (200 μg/ml), and single spores were picked to generate the homokaryon AG480. Strains were veri-fied using oligo pairs AGO757/AGO758, AGO98/AGO760, and AGO757/AGO760.
Chromosome I 32-lacO::Gen3/chromosome VI 32-lacO::Nat1To make strain AG514/515, AGB268/269 were digested using SpeI/StuI and transformed into AKH26.2. Primary transformants were picked onto G418 plates (200 μg/ml), and single spores were picked to generate the homokaryon AG517/518. Strains were veri-fied using oligo pairs AGO721/AGO761, AGO723/AGO759, and AGO721/AGO723. To make a chromosome VI homology Nat1 plasmid, a 1817–base pair fragment was gel extracted from AGB09 digested with SapI and NdeI. Using this band, Nat1 was PCR ampli-fied using AGO1050/968 and cotransformed with AGB322/323 to generate plasmid AGB403.1/403.2. Plasmids were verified using KpnI digests and sequencing with AGO234/235. AGB403.1 was transformed into AG517 to generate strain AG720. Strains were verified using oligo pairs AGO757/AGO758, AGO760/AGO234, and AGO757/AGO760.
mad2Δ::Nat1To generate strain AG600/601, AGB9 was cut with PvuII-HiFi. NAT1 was amplified off of this cut plasmid using AGO1101/AGO1102. PCR products were pooled and directly integrated into Ashbya. Primary transformants were picked onto CloNat plates (Werner Bioagents, Jena, Germany). Strains were verified using oligo pairs AGO1103/AGO235, AGO234/AGO1104, and AGO1103/AGO1105.
Microscope setup and imaging conditionsA Zeiss Axioimage-M1 upright light microscope (Carl Zeiss, Jena, Germany) equipped with a Plan-Apochromat 63×/1.4 numerical ap-erture oil objective was used. To visualize the fluorescence signals, an Exfo X-Cite 120 lamp was used in conjunction with Zeiss 38HE (GFP), Chroma 41002B (TAMRA), Zeiss 49 (Hoechst/DAPI), and Chroma 41043 (mCherry; Chroma Technology, Brattleboro, VT). Images were acquired on an Orca-AG charge-coupled device (CCD) camera (C4742-80-12AG; Hamamatsu, Bridgewater, NJ) driven by Volocity (Perkin-Elmer, Waltham, MA).
To image LacI chromosome spots, cells were grown for 16 h and imaged on thin gel pads containing 2% agarose and 100% 2× low-fluorescence minimal medium. Z-stacks were acquired with 0.5-μm slices spanning the hyphae. The images were exposed for 50–100 ms at 100% transmission. All images were processed by itera-tive deconvolution (100 iterations) using calculated point spread functions in Volocity, and nuclei were visually scored for number of LacI-GFP–labeled chromosomes.
To image chromosome segregations, cells were imaged on an OMX microscope equipped with a Hamamatsu electron-multiplying CCD. A 488-nm solid-state laser was used for GFP illumination, us-ing 1.08% laser power. Cells were imaged every minute through a 10-μm z-depth (21 slices at 0.5 μm).
Hhf1-GFP intensity quantificationTime-lapse movies and previous nuclear tracking were used to quantify Hhf1-GFP intensity over time (Anderson et al., 2013).
Storlazzi et al., 2003; Bowring et al., 2006). It is possible that differ-ences in genome copy number, even if balanced as in polyploidy, are more detrimental in spores with just a single nucleus, whereas ploidy variation is more tolerated in mature cells.
The high degree of ploidy variation in Ashbya is striking and may be a mechanism by which nuclei cycle asynchronously through the cell cycle. The connection between ploidy, cytoplasmic compart-mentalization, and adaptive fitness is fascinating, and further study will ideally link these traits to cell cycle timing variation within a com-mon cytoplasm.
MATERIALS AND METHODSGrowth conditions and strain constructionA. gossypii media, culturing, and transformation conditions were performed as described previously (Ayad-Durieux et al., 2000; Wendland et al., 2000). The strains in this study are described in Supplemental Table S1, the plasmids used are listed in Supplemen-tal Table S2, and the oligonucleotide primers used are listed in Supplemental Table S3. All restriction enzymes were from New England BioLabs, Ipswich, MA, and all oligos were from Integrated DNA Technologies, Coralville, IA.
lacO plasmid constructionTo generate plasmids AGB245/246, pAKH37 and AGB21 were di-gested with KpnI and NdeI (NEB). The ∼1600–base pair band (pAKH37) and the 4214–base pair band (AGB21) were gel extracted and ligated using T4 Ligase (NEB). Resulting plasmids were verified by digesting with KpnI and NdeI and sequencing. To generate plas-mids AGB264/265, AGB246 and pRS416 were digested with NdeI and SbfI. The 3343–base pair band from AGB246 was gel extracted and ligated with digested pRS416 using T4 Ligase (NEB). Resulting plasmids were verified with SacI digests and sequencing with AGO37.
Chromosome I 32-lacO::Gen3Chromosome I homology was engineered using gap repair. Ap-proximately 250 base pairs of 5′ homology to chromosome I were amplified from ΔlΔt genomic DNA using AGO638/639. AGB264/265 were digested with StuI and cotransformed into yeast with 5′ chro-mosome I homology to generate AGB266/267, which were verified by BglI digestion and sequencing with AGO640. Approximately 250 base pairs of 3′ homology to chromosome I were amplified from ΔlΔt genomic DNA using AGO641/642. AGB266/267 were di-gested with NdeI and cotransformed into yeast with 3′ chromosome I homology to generate AGB268/269, which were verified by diges-tion with SpeI/StuI and sequencing with AGO640 and AGO678. A 4260–base pair fragment was gel purified from AGB268/269 after digestion with SpeI/StuI and transformed into AG302 to generate AG459.1-4. Primary transformants were picked onto G418 plates (200 μg/ml), and single spores were picked to generate the homo-karyon AG460. Strains were verified using oligo pairs AGO721/AGO761, AGO723/AGO759, and AGO721/AGO723.
Chromosome VI 32-lacO::Gen3Approximately 200 base pairs of 5′ homology to chromosome VI were amplified from ΔlΔt genomic DNA using AGO753/754. AGB264/265 were digested with StuI and cotransformed into yeast with 5′ chromosome VI homology to generate AGB309/310, which were verified by digestion with XhoI and sequencing with AGO640. Approximately 250 base pairs of 3′ homology to chromosome VI were amplified from ΔlΔt genomic DNA using AGO765/766. AGB309/310 were digested with NdeI and cotransformed into

Volume 26 March 15, 2015 Ploidy variation in multinucleate cells | 1139
1.5% agarose, supplemented with varying concentrations of flucon-azole (Sigma-Aldrich). Control and heat-stressed cells were also transferred to fresh media after 10 h and returned to 30 or 37°C, respectively, for an additional 6 h. Cells were spun down at 300 rpm for 5 min, washed with 5 ml of 2× low-fluorescence minimal media, and spun as before. A 10-μl amount of cells was taken directly from the pellet and plated onto glass slides for imaging.
Statistical analysis of cellular stress populationsAll pairwise comparisons were performed between unstressed cells and each stress condition (0 chromosomes [control] vs. 0 chromo-somes [experimental], 1 chromosome [control] vs. 1 chromosome [experimental], … 5 chromosomes [control] vs. 5 chromosomes [experimental]). p1 = proportion of nuclei with a given number of chromosome copies (control) and p2 = proportion of nuclei with the same number of chromosome copies (experimental), and n1 and n2 = the number of nuclei scored (control and experimental, respec-tively). A two-sample Z test for proportions was applied to each population compared with the control population. For p < 0.05, the Z value must be >1.96 or <−1.96. Strains were considered sig-nificantly different from the control if two or more categories were p < 0.05.
p p
p p n n
( ) 0
(1 ) 1 11 2
1 2
− −
− +
Time-lapse images and nuclear coordinates were imported into MATLAB, and the nuclei around the central coordinates was found using thresholding. Photobleaching correction was applied to indi-vidual nuclei over time. Histone intensity was measured as the sum GFP intensity for each nucleus. Fold change for each nucleus was calculated using the maximum and minimum Hhf1-GFP signal throughout the tracking. S-phase duration was the time between maximum and minimum GFP intensity.
Spindle pole body scoringCell cycle stages were determined using SPBs as described previ-ously (Nair et al., 2010). Briefly, nuclei with a single SPB were as-signed to G1, nuclei with either a single SPB that was twice the intensity and size as a G1 SPB or with two adjacent SPBs that were <0.5 μm apart were assigned to S/G2, and nuclei with two SPBs that were >0.5 μm apart on opposite sides of the nucleus were assigned to M.
FISHA single-molecule RNA FISH protocol was used to visualize the chromosome expressing the CLN1/2 gene (Lee et al., 2013). This transcript is expressed in >90% of nuclei, and the site of expres-sion of the gene is readily detected as spots that are generally brighter than the intensity of single mature transcripts in the cy-tosol. Because all attempts at DNA FISH were unsuccessful and a DNA FISH protocol has never been established for Ashbya, we used RNA FISH of transcription as a proxy for chromosome num-ber. Cells were grown for 12–16 h at 30°C while shaking and fixed in 3.7% formaldehyde for 1 h. Cells were washed into buffer B (1.2 M sorbitol, 0.1 M potassium phosphate, pH 7.5), sphero-plasted using Zymolyase (15 μg/ml), and incubated at 37°C until phase dark. Cells were washed twice with wash buffer and mixed with hybridization solution (100 μl of hybridization buffer, 1.5 μl of probe). Cells were incubated at 92°C for 3 min and then over-night at 37°C. Cells were washed twice with wash buffer and in-cubated for 10 min at room temperature in 500 μl of wash buffer plus 1 μl Hoechst. Cells were washed twice more, mounted in Prolong Gold mounting media (Life Technologies), and imaged.
Germination and colony growth assaysFor germination assays, spores were spread onto Ashbya Full Media (AFM) plates with appropriate selection and allowed to ger-minate at 30°C for 8 h. Plates were imaged and scored in ImageJ (National Institutes of Health, Bethesda, MD) for spore germination. For colony growth assays, 10 μl of spores was plated in the center of AFM plates with appropriate selection. Colonies grew at 30°C, and plates were imaged daily for up to 10 d using a Bio-Rad Chemi-Doc XR5 molecular imager with ImageLab software. Colony area and perimeter were measured using a macro written in ImageJ, which “autothresholded” images and determined colony area and perimeter.
Cellular stress testsA. gossypii spores were germinated in liquid AFM in the presence of ampicillin (100 μg/ml), G418 (200 μg/ml), and Clonat (50 μg/ml) for 10 h while shaking in baffled flasks at 30°C. Cells were trans-ferred to fresh media with selection containing 2 mM caffeine (Sigma-Aldrich), 200 mM NaCl (Fisher Scientific), 10 mM ZnSO4 (Sigma-Aldrich), or 325 nM fluconazole (Sigma-Aldrich) and re-turned to 30°C with shaking for an additional 6 h. The appropriate fluconazole concentration was determined by comparing radial growth rates on AFM plates with ampicillin (100 μg/ml) and
ACKNOWLEDGMENTSWe thank Jennifer Fung for use of the OMX microscope at the Uni-versity of California, San Francisco, and the Gladfelter lab for useful discussion. We are grateful to MicroVideo Instruments and Nikon for supporting our instrument needs at the Marine Biological Labo-ratory in Woods Hole, MA. This work was supported by National Institutes of Health Grant R01-GM081506 (A.S.G.), Lemann and Col-win Fellowships (A.S.G.) from the Marine Biological Laboratory in Woods Hole, and National Institutes of Health Award T32GM008704 (C.A.A.).
REFERENCESAlbertin W, Marullo P (2012). Polyploidy in fungi: evolution after whole-
genome duplication. Proc Biol Sci 279, 2497–2509.Anderson CA, Eser U, Korndorf T, Borsuk ME, Skotheim JM, Gladfelter AS
(2013). Nuclear repulsion enables division autonomy in a single cyto-plasm. Curr Biol 23, 1999–2010.
Ayad-Durieux Y, Knechtle P, Goff S, Dietrich FS, Philippsen P (2000). A PAK-like protein kinase is required for maturation of young hyphae and septation in the filamentous ascomycete Ashbya gossypii. J Cell Sci 113, Pt 24, 4563–4575.
Bakhoum SF, Compton DA (2012). Chromosomal instability and cancer: a complex relationship with therapeutic potential. J Clin Invest 122, 1138–1143.
Bennett RJ (2003). Completion of a parasexual cycle in Candida albicans by induced chromosome loss in tetraploid strains. EMBO J 22, 2505–2515.
Bennett RJ, Forche A, Berman J (2014). Rapid mechanisms for generating genome diversity: whole ploidy shifts, aneuploidy, and loss of heterozy-gosity. Cold Spring Harb Perspect Med 4, a019604.
Bowring FJ, Yeadon PJ, Stainer RG, Catcheside DEA (2006). Chromosome pairing and meiotic recombination in Neurospora crassa spo11 mutants. Curr Genet 50, 115–123.
Burds AA, Lutum AS, Sorger PK (2005). Generating chromosome instability through the simultaneous deletion of Mad2 and p53. Proc Natl Acad Sci USA 102, 11296–11301.
Celerin M, Merino ST, Stone JE, Menzie AM, Zolan ME (2000). Multiple roles of Spo11 in meiotic chromosome behavior. EMBO J 19, 2739–2750.
Demeter J, Lee SE, Haber JE, Stearns T (2000). The DNA damage check-point signal in budding yeast is nuclear limited. Mol Cell 6, 487–492.

1140 | C. A. Anderson et al. Molecular Biology of the Cell
Pearson CG, Maddox PS, Salmon ED, Bloom K (2001). Budding yeast chromosome structure and dynamics during mitosis. J Cell Biol 152, 1255–1266.
Querol A, Bond U (2009). The complex and dynamic genomes of industrial yeasts. FEMS Microbiol Lett 293, 1–10.
Rieder CL, Khodjakov A, Paliulis LV, Fortier TM, Cole RW, Sluder G (1997). Mitosis in vertebrate somatic cells with two spindles: implications for the metaphase/anaphase transition checkpoint and cleavage. Proc Natl Acad Sci USA 94, 5107–5112.
Roper M, Ellison C, Taylor JW, Glass NL (2011). Nuclear and genome dynamics in multinucleate ascomycete fungi. Curr Biol 21, R786–R793.
Schoenfelder KP, Montague RA, Paramore SV, Lennox AL, Mahowald AP, Fox DT (2014). Indispensable pre-mitotic endocycles promote aneu-ploidy in the Drosophila rectum. Development 141, 3551–3560.
Selmecki A, Forche A, Berman J (2010). Genomic plasticity of the human fungal pathogen Candida albicans. Eukaryotic Cell 9, 991–1008.
Semighini CP, Averette AF, Perfect JR, Heitman J (2011). Deletion of Cryptococcus neoformans AIF ortholog promotes chromosome aneuploidy and fluconazole-resistance in a metacaspase-independent manner. PLoS Pathog 7, e1002364.
Storchova Z, Breneman A, Cande J, Dunn J, Burbank K, O’Toole E, Pellman D (2006). Genome-wide genetic analysis of polyploidy in yeast. Nature 443, 541–547.
Storlazzi A, Tessé S, Gargano S, James F, Kleckner N, Zickler D (2003). Meiotic double-strand breaks at the interface of chromosome move-ment, chromosome remodeling, and reductional division. Genes Dev 17, 2675–2687.
Straight AF, Marshall WF, Sedat JW, Murray AW (1997). Mitosis in living budding yeast: anaphase A but no metaphase plate. Science 277, 574–578.
Thompson SL, Compton DA (2010). Proliferation of aneuploid human cells is limited by a p53-dependent mechanism. J Cell Biol 188, 369–381.
Thorburn RR, Gonzalez C, Brar GA, Christen S, Carlile TM, Ingolia NT, Sauer U, Weissman JS, Amon A (2013). Aneuploid yeast strains exhibit defects in cell growth and passage through START. Mol Biol Cell 24, 1274–1289.
Torres EM, Sokolsky T, Tucker CM, Chan LY, Boselli M, Dunham MJ, Amon A (2007). Effects of aneuploidy on cellular physiology and cell division in haploid yeast. Science 317, 916–924.
Wasserstrom L, Lengeler KB, Walther A, Wendland J (2013). Molecular determinants of sporulation in Ashbya gossypii. Genetics 195, 87–99.
Weaver BA, Cleveland DW (2006). Does aneuploidy cause cancer? Curr Opin Cell Biol 18, 658–667.
Weinstein B, Solomon F (1990). Phenotypic consequences of tubulin over-production in Saccharomyces cerevisiae: differences between alpha-tubulin and beta-tubulin. Mol Cell Biol 10, 5295–5304.
Wendland J, Ayad-Durieux Y, Knechtle P, Rebischung C, Philippsen P (2000). PCR-based gene targeting in the filamentous fungus Ashbya gossypii. Gene 242, 381–391.
Yona AH, Manor YS, Herbst RH, Romano GH, Mitchell A, Kupiec M, Pilpel Y, Dahan O (2012). Chromosomal duplication is a transient evolutionary solution to stress. Proc Natl Acad Sci USA 109, 21010–21015.
Zhu J, Pavelka N, Bradford WD, Rancati G, Li R (2012). Karyotypic deter-minants of chromosome instability in aneuploid budding yeast. PLoS Genet 8, e1002719.
Diaz RL, Alcid AD, Berger JM, Keeney S (2002). Identification of residues in yeast Spo11p critical for meiotic DNA double-strand break formation. Mol Cell Biol 22, 1106–1115.
Dietrich FS, Voegeli S, Brachat S, Lerch A, Gates K, Steiner S, Mohr C, Pöhlmann R, Luedi P, Choi S, et al. (2004). The Ashbya gossypii genome as a tool for mapping the ancient Saccharomyces cerevisiae genome. Science 304, 304–307.
Duncan AW, Taylor MH, Hickey RD, Newell AEH, Lenzi ML, Olson SB, Fine-gold MJ, Grompe M (2010). The ploidy conveyor of mature hepatocytes as a source of genetic variation. Nature 467, 707–710.
Forche A, Alby K, Schaefer D, Johnson AD, Berman J, Bennett RJ (2008). The parasexual cycle in Candida albicans provides an alternative pathway to meiosis for the formation of recombinant strains. PLoS Biol 6, e110.
Gerstein AC, Chun H-JE, Grant A, Otto SP (2006). Genomic convergence toward diploidy in Saccharomyces cerevisiae. PLoS Genet 2, e145.
Gerstein AC, McBride RM, Otto SP (2008). Ploidy reduction in Saccharomy-ces cerevisiae. Biol Lett 4, 91–94.
Gibeaux R, Lang C, Politi AZ, Jaspersen SL, Philippsen P, Antony C (2012). Electron tomography of the microtubule cytoskeleton in multinucleated hyphae of Ashbya gossypii. J Cell Sci 125, 5830–5839.
Gladfelter AS, Hungerbuehler AK, Philippsen P (2006). Asynchronous nuclear division cycles in multinucleated cells. J Cell Biol 172, 347–362.
Harrison BD, Hashemi J, Bibi M, Pulver R, Bavli D, Nahmias Y, Wellington M, Sapiro G, Berman J (2014). A tetraploid intermediate precedes aneuploid formation in yeasts exposed to fluconazole. PLoS Biol 12, e1001815.
Hull CM, Raisner RM, Johnson AD (2000). Evidence for mating of the “asexual” yeast Candida albicans in a mammalian host. Science 289, 307–310.
Idnurm A (2010). A tetrad analysis of the basidiomycete fungus Cryptococ-cus neoformans. Genetics 185, 153–163.
Klapholz S, Waddell CS, Esposito RE (1985). The role of the SPO11 gene in meiotic recombination in yeast. Genetics 110, 187–216.
Krajcovic M, Johnson NB, Sun Q, Normand G, Hoover N, Yao E, Richardson AL, King RW, Cibas ES, Schnitt SJ, et al. (2011). A non-genetic route to aneuploidy in human cancers. Nat Cell Biol 13, 324–330.
Lee C, Zhang H, Baker AE, Occhipinti P, Borsuk ME, Gladfelter AS (2013). Protein aggregation behavior regulates cyclin transcript localization and cell-cycle control. Dev Cell 25, 572–584.
Li M, Fang X, Baker DJ, Guo L, Gao X, Wei Z, Han S, van Deursen JM, Zhang P (2010). The ATM-p53 pathway suppresses aneuploidy-induced tumorigenesis. Proc Natl Acad Sci USA 107, 14188–14193.
Lu X, Kang Y (2009). Cell fusion as a hidden force in tumor progression. Cancer Res 69, 8536–8539.
Mayer VW, Aguilera A (1990). High levels of chromosome instability in polyploids of Saccharomyces cerevisiae. Mutat Res 231, 177–186.
Morrow CA, Fraser JA (2013). Ploidy variation as an adaptive mechanism in human pathogenic fungi. Semin Cell Dev Biol 24, 339–346.
Nair DR, D’Ausilio CA, Occhipinti P, Borsuk ME, Gladfelter AS (2010). A con-served G₁ regulatory circuit promotes asynchronous behavior of nuclei sharing a common cytoplasm. Cell Cycle 9, 3771–3779.
Oromendia AB, Dodgson SE, Amon A (2012). Aneuploidy causes proteo-toxic stress in yeast. Genes Dev 26, 2696–2708.
Pavelka N, Rancati G, Zhu J, Bradford WD, Saraf A, Florens L, Sanderson BW, Hattem GL, Li R (2010). Aneuploidy confers quantitative proteome changes and phenotypic variation in budding yeast. Nature 468, 321–325.

Supplemental Materials Molecular Biology of the Cell Anderson et al.

Figure S1 – S-phase quantification controls A) Scatterplot of sum Hhf1-GFP intensity at birth vs. birth timepoint (N=47, r=-0.06). B) Scatterplot of sum Hhf1-GFP intensity at mitosis vs. mitosis timepoint (N=47, r=-0.34). C) Scatterplot of sum Hhf1-GFP intensity at birth vs. Sum Hhf1-GFP intensity at mitosis (N=47, r=0.49).
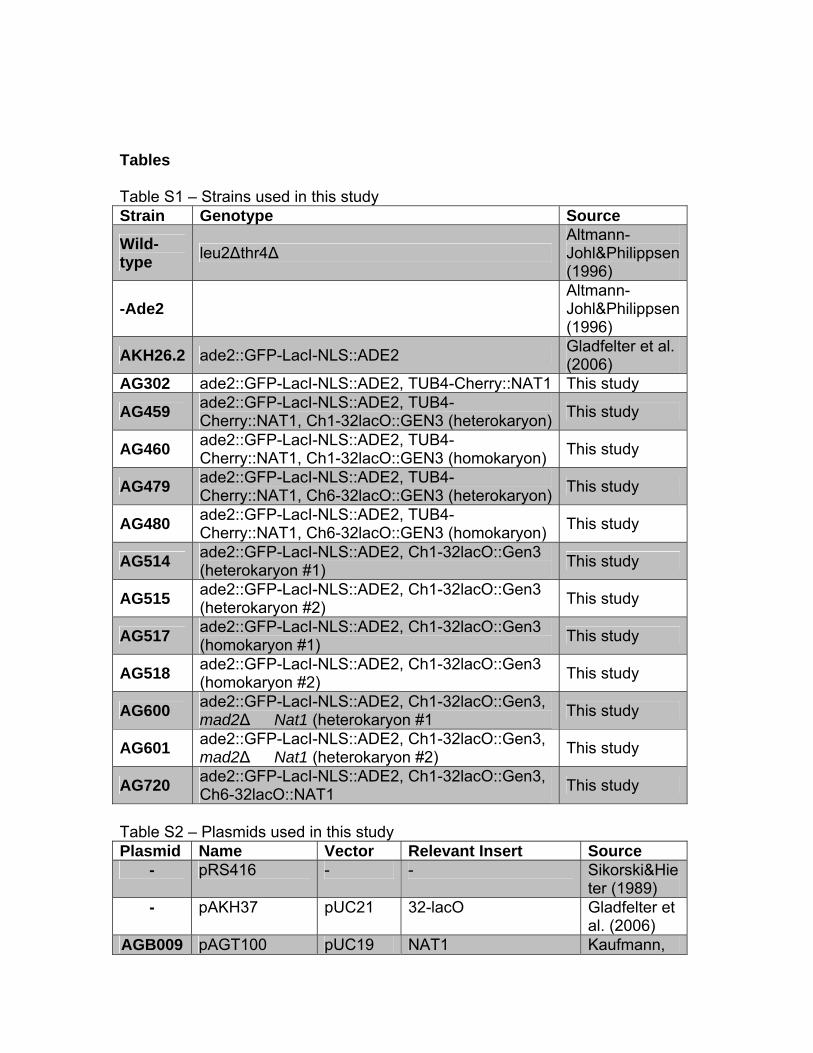
Tables Table S1 – Strains used in this study Strain Genotype Source
Wild-type leu2∆thr4∆
Altmann-Johl&Philippsen (1996)
-Ade2 Altmann-Johl&Philippsen (1996)
AKH26.2 ade2::GFP-LacI-NLS::ADE2 Gladfelter et al. (2006)
AG302 ade2::GFP-LacI-NLS::ADE2, TUB4-Cherry::NAT1 This study
AG459 ade2::GFP-LacI-NLS::ADE2, TUB4-Cherry::NAT1, Ch1-32lacO::GEN3 (heterokaryon) This study
AG460 ade2::GFP-LacI-NLS::ADE2, TUB4-Cherry::NAT1, Ch1-32lacO::GEN3 (homokaryon) This study
AG479 ade2::GFP-LacI-NLS::ADE2, TUB4-Cherry::NAT1, Ch6-32lacO::GEN3 (heterokaryon) This study
AG480 ade2::GFP-LacI-NLS::ADE2, TUB4-Cherry::NAT1, Ch6-32lacO::GEN3 (homokaryon) This study
AG514 ade2::GFP-LacI-NLS::ADE2, Ch1-32lacO::Gen3 (heterokaryon #1) This study
AG515 ade2::GFP-LacI-NLS::ADE2, Ch1-32lacO::Gen3 (heterokaryon #2) This study
AG517 ade2::GFP-LacI-NLS::ADE2, Ch1-32lacO::Gen3 (homokaryon #1) This study
AG518 ade2::GFP-LacI-NLS::ADE2, Ch1-32lacO::Gen3 (homokaryon #2) This study
AG600 ade2::GFP-LacI-NLS::ADE2, Ch1-32lacO::Gen3, mad2∆��Nat1 (heterokaryon #1 This study
AG601 ade2::GFP-LacI-NLS::ADE2, Ch1-32lacO::Gen3, mad2∆��Nat1 (heterokaryon #2) This study
AG720 ade2::GFP-LacI-NLS::ADE2, Ch1-32lacO::Gen3, Ch6-32lacO::NAT1 This study
Table S2 – Plasmids used in this study Plasmid Name Vector Relevant Insert Source
- pRS416 - - Sikorski&Hieter (1989)
- pAKH37 pUC21 32-lacO Gladfelter et al. (2006)
AGB009 pAGT100 pUC19 NAT1 Kaufmann,

2009 AGB021 pAGT140 pUC19 GEN3 Kaufmann,
2009 AGB245 pUC19lacO(32
mer)::GEN #1 pUC19 32-lacO::GEN3 This study
AGB246 pUC19lacO(32mer)::GEN #2
pUC19 32-lacO::GEN3 This study
AGB264 pRS416lacO(32mer)::GEN #1
pRS416 32-lacO::Gen3 This study
AGB265 pRS416lacO(32mer)::GEN #2
pRS416 32-lacO::Gen3 This study
AGB266 AGB264 w/ partial Ch1 Homology
pRS416 Chromosome I 5'homology/32-lacO::GEN3
This study
AGB267 AGB265 w/ partial Ch1 Homology
pRS416 Chromosome I 5'homology/32-lacO::GEN3
This study
AGB268 AGB266 w/ full Ch1 Homology
pRS416 Chromosome I 5'homology/32-lacO::GEN3/ Chromosome I 3'homology
This study
AGB269 AGB267 w/ full Ch1 Homology
pRS416 Chromosome I 5'homology/32-lacO::GEN3/ Chromosome I 3'homology
This study
AGB309 AGB264 w/ partial Ch6 Homology
pRS416 Chromosome VI 5'homology/32-lacO::GEN3
This study
AGB310 AGB265 w/ partial Ch6 Homology
pRS416 Chromosome VI 5'homology/32-lacO::GEN3
This study
AGB322 lacO-Gen3 in pRS416 w/ Full Ch6 Homology #1 (AGB309 parent)
pRS416 Chromosome VI 5'homology/32-lacO::GEN3/ Chromosome VI 3'homology
This study
AGB323 lacO-Gen3 in pRS416 w/ Full Ch6 Homology #2 (AGB310 parent)
pRS416 Chromosome VI 5'homology/32-lacO::GEN3/ Chromosome VI 3'homology
This study
AGB403 lacO-Nat1 in pRS416 w/ Full
pRS416 Chromosome VI 5'homology/32-
This study

Ch6 Homology #1
lacO::NAT1/ Chromosome VI 3'homology
Table S3 – Oligonucleotides used in this study Oligonucleotide
Name Sequence
AGO37 VG3 ATGTTGGACGAGTCGGAATC AGO98 New GEN3.3 CTTGCCATCCTATGGAACTG AGO234 V3 NAT1 ACATGAGCATGCCCTGCCCC AGO235 V2 NAT1 GTGGTGAAGGACCCATCCAG
AGO638 lacO into pRS416 F1
GTATTGTTAGCGGTTTGAAGCAGGCGGCAGCAGCACGGAGCGACCATTCTTTACGCGGCACGTCACAGTGCAGAG
AGO639 lacO into pRS416 R1
GTATATTCTCCAGTAGATAGGGAGCCCTTGAGGCCTGCACTTTATATCTTGTCTGGTCCGCGCTGGAATTGTTGGAATAGTG
AGO640 lacO into pRS416 sequencing 1
GCCGCTAAAGGCATTATCCGCCAAG
AGO641 lacO into pRS416 F2
GAAGGAAGAACGAAGGAAGGAGCACAGACTaggcctCTGCCCTCCTATGTATATTACAGCTAGAGTGTCGCAAGCAAGCC
AGO642 lacO into pRS416 R2
GTGGGTGGTCCTAAATGGGGTACGGGTTAACCGCGCATATGATGCTCTACGCGATGGGAACTCATGGAGGGAATC
AGO678 New lacO in pRS416 Sequencing 2
GCTTAACTATGCGGCATCAG
AGO721 Ch1 lacO 5' Forward TGTACACCCATGCTCTTCTG
AGO723 Ch1 lacO 3' Reverse AGCGCGGCAACTAAACATAC
AGO753 Ch6 Homology1 F
GTATTGTTAGCGGTTTGAAGCAGGCGGCAGTCCGGCTCGAGATCTTGGTTCGTCGATCCTTTACTAGGACTTTGC
AGO754 Ch6 Homology1 R
GTATATTCTCCAGTAGATAGGGAGCCCTTGAGGCCTCCCATCAACTTTAACACCTAACGTGCTCCTGGCCGACAGAAACCC
AGO755 Ch6 Homology2 F
GAAGGAAGAACGAAGGAAGGAGCACAGACTAGGCCTCCAGTGAGACATCCTTAGTCTCGGTTAACGGCTGCTGGATCTTGC
AGO756 Ch6 Homology2 R
GTGGGTGGTCCTAAATGGGGTACGGGTTAACACCAAGGTCCCGTGTACAGACAATCCGTAGCTGGCTTCAAGTCG
AGO757 Ch6 5’ F CTTACCGGGCTGTACTTTGG

AGO758 Ch6 5’ R CGACGATGCTACAGGTGTTC AGO759 Ch6 3’ F TGCTGCTACTCATCCTAGTC AGO760 Ch6 3’ R TCTCAACGGAAGTTGCTGTC AGO761 New Ch1 5’ R AGGTGTTCCACTTCCAGATG
AGO1101 Mad2 Del F
GAAGTCTTGTACACAGCCGCTATAAAATCAAGAGGGATCAGGTGCAACGACGGCCAGTGAATTCGGAAGTCTTGTACACAGCCGCTATAAAATCAAGAGGGATCAGGTGCAACGACGGCCAGTGAATTCG
AGO1102 Mad2 Del R CGTCTCGAACACAAGGTTCTTCAACAGAGGTGGGTAAGTGTAATGCCAGGAAACAGCTATGACCATG
AGO1103 Mad2 5' GTTGGCTTTCGCGTGTATTG AGO1104 Mad2 3' TGCGGCAATGCTGAAGGTCG AGO1105 Mad2 Internal CCGTGATTTGCCGTATCAAC