Species and population variation to salinity stress in Panicum hemitomon, Spartina patens, and...
21
Environmental and Experimental Botany 46 (2001) 277 – 297 Species and population variation to salinity stress in Panicum hemitomon, Spartina patens, and Spartina alterniflora : morphological and physiological constraints Mark W. Hester a, *, Irving A. Mendelssohn b , Karen L. McKee c a Department of Biological Sciences, Uniersity of New Orleans, New Orleans, LA 70148, USA b Wetland Biogeochemistry Institute & Department of Oceanography and Coastal Sciences, Louisiana State Uniersity, Baton Rouge, LA 70803, USA c US Geological Surey, National Wetlands Research Center, 700 Cajundome Bouleard, Lafayette, LA 70506, USA Received 2 January 2001; received in revised form 12 July 2001; accepted 16 July 2001 Abstract Panicum hemitomon, Spartina patens, and Spartina alterniflora are wide-spread dominant grasses of fresh, brackish, and salt marsh plant communities, respectively. Our previous research identified significant intraspecific variation in salt tolerance and morphology among populations within each species. In this study our objectives were to determine shorter-term physiological/biochemical responses to salinity stress and identify potential indicators of salt tolerance, with the ultimate goal of discerning similarities and differences in the mechanisms of salinity stress resistance. We subjected a subset of six populations within each species, ranging from high to low salt tolerance, to sublethal salinity levels (4, 20, and 30 ppt, respectively, for species) and monitored physiological and growth responses after 1 week (early harvest) and 5 weeks (late harvest). In all three species sublethal salinity levels generally resulted in significantly reduced net CO 2 assimilation, leaf expansion, midday leaf xylem pressure, water use efficiency, and live and total biomass; and significantly increased leaf Na + /K + ratio, leaf proline, leaf glycine betaine, leaf sucrose, root-to-shoot ratio, and dead:total aboveground biomass ratio. All three species displayed significant population (intraspecific) variation in net CO 2 assimilation, leaf expansion, water use efficiency, midday leaf xylem pressure, leaf proline, leaf glycine betaine (except Panicum, where it could not be accurately determined), leaf Na + /K + ratio, leaf sucrose, total plant biomass, dead:total aboveground biomass ratio, and root-to-shoot ratio. General indicators of salt tolerance (regardless of species) included high net CO 2 assimilation rates and water use efficiencies, and low ratios of root-to-shoot and dead:total aboveground biomass. Factor analysis and a-priori linear contrasts revealed some unique differences between species in terms of the relative importance of morphology and physiology in explaining intraspecific variation in salt tolerance. Plant morphology (size attributes) were strongly associated with salt tolerance in P. hemitomon, weakly associated with salt tolerance in S. patens, and not associated with salt tolerance in S. alterniflora. Highly salt-tolerant populations of Spartina alterniflora displayed the greatest ion selectivity (lower leaf Na + /K + ratios), which was not displayed by the other two species. These results suggest that plant size attributes can be very important in explaining population differences in salt tolerance in glycophytes, but may be independent of salt www.elsevier.com/locate/envexpbot * Corresponding author. Tel.: +1-504-280-6309; fax: +1-549-280-6121. E-mail address: [email protected] (M.W. Hester). S0098-8472/01/$ - see front matter © 2001 Elsevier Science B.V. All rights reserved. PII:S0098-8472(01)00100-9
Transcript of Species and population variation to salinity stress in Panicum hemitomon, Spartina patens, and...

Environmental and Experimental Botany 46 (2001) 277–297
Species and population variation to salinity stress inPanicum hemitomon, Spartina patens, and Spartina
alterniflora : morphological and physiological constraints
Mark W. Hester a,*, Irving A. Mendelssohn b, Karen L. McKee c
a Department of Biological Sciences, Uni�ersity of New Orleans, New Orleans, LA 70148, USAb Wetland Biogeochemistry Institute & Department of Oceanography and Coastal Sciences, Louisiana State Uni�ersity,
Baton Rouge, LA 70803, USAc US Geological Sur�ey, National Wetlands Research Center, 700 Cajundome Boule�ard, Lafayette, LA 70506, USA
Received 2 January 2001; received in revised form 12 July 2001; accepted 16 July 2001
Abstract
Panicum hemitomon, Spartina patens, and Spartina alterniflora are wide-spread dominant grasses of fresh, brackish,and salt marsh plant communities, respectively. Our previous research identified significant intraspecific variation insalt tolerance and morphology among populations within each species. In this study our objectives were to determineshorter-term physiological/biochemical responses to salinity stress and identify potential indicators of salt tolerance,with the ultimate goal of discerning similarities and differences in the mechanisms of salinity stress resistance. Wesubjected a subset of six populations within each species, ranging from high to low salt tolerance, to sublethal salinitylevels (4, 20, and 30 ppt, respectively, for species) and monitored physiological and growth responses after 1 week(early harvest) and 5 weeks (late harvest). In all three species sublethal salinity levels generally resulted in significantlyreduced net CO2 assimilation, leaf expansion, midday leaf xylem pressure, water use efficiency, and live and totalbiomass; and significantly increased leaf Na+/K+ ratio, leaf proline, leaf glycine betaine, leaf sucrose, root-to-shootratio, and dead:total aboveground biomass ratio. All three species displayed significant population (intraspecific)variation in net CO2 assimilation, leaf expansion, water use efficiency, midday leaf xylem pressure, leaf proline, leafglycine betaine (except Panicum, where it could not be accurately determined), leaf Na+/K+ ratio, leaf sucrose, totalplant biomass, dead:total aboveground biomass ratio, and root-to-shoot ratio. General indicators of salt tolerance(regardless of species) included high net CO2 assimilation rates and water use efficiencies, and low ratios ofroot-to-shoot and dead:total aboveground biomass. Factor analysis and a-priori linear contrasts revealed someunique differences between species in terms of the relative importance of morphology and physiology in explainingintraspecific variation in salt tolerance. Plant morphology (size attributes) were strongly associated with salt tolerancein P. hemitomon, weakly associated with salt tolerance in S. patens, and not associated with salt tolerance in S.alterniflora. Highly salt-tolerant populations of Spartina alterniflora displayed the greatest ion selectivity (lower leafNa+/K+ ratios), which was not displayed by the other two species. These results suggest that plant size attributes canbe very important in explaining population differences in salt tolerance in glycophytes, but may be independent of salt
www.elsevier.com/locate/envexpbot
* Corresponding author. Tel.: +1-504-280-6309; fax: +1-549-280-6121.E-mail address: [email protected] (M.W. Hester).
S0098-8472/01/$ - see front matter © 2001 Elsevier Science B.V. All rights reserved.
PII: S0098 -8472 (01 )00100 -9
M.W. Hester et al. / En�ironmental and Experimental Botany 46 (2001) 277–297278
tolerance in halophytes, which have specialized physiological (and/or anatomical) adaptations that can confer salinitystress resistance through mechanisms such as selective ion exclusion and secretion. © 2001 Elsevier Science B.V. Allrights reserved.
Keywords: Panicum hemitomon ; Spartina patens; Spartina alterniflora ; Salt tolerance; Morphology; Osmotica; Proline; Glycinebetaine; Water relations
1. Introduction
It is well recognized that interspecific variationto salinity stress plays an important role in thebroad zonation of coastal vegetation into whathas been classified as fresh, intermediate, brack-ish, and salt marsh plant communities (Chabreck,1972; Pomeroy and Wiegert, 1981; Mitch andGosselink, 1993; Day et al., 1989). In high marshareas and salt pans, species differences in salttolerance may also be important in explainingsmall-scale vegetation patterns and dynamics as-sociated with environmental heterogeneity insalinity (Bertness, 1991; Shumway and Bertness,1994). However, the relative importance and ex-tent of intraspecific variation in salt tolerance incoastal plant communities has not been inten-sively investigated. Intraspecific variation in salttolerance may be important in further explainingpatterns of abundance and distribution in wide-spread marsh dominants, as well as elucidatingthe range of response within species to alteredsalinity regimes, whether caused by natural oranthropogenic factors. Investigations of intra-specific variation to salinity stress provide anopportunity to better understand species-specific adaptations, including the relative impor-tance and variation of morphological and physio-logical adaptations within species and betweenspecies. Therefore, achieving a greater under-standing of intraspecific variation to salinity stressin dominant coastal plant species is of valueboth from a scientific perspective, which includesthe identification of traits associated withgreater stress resistance, as well as from an ap-plied perspective, which includes the identificationof superior planting stock for specific restorationneeds.
Panicum hemitomon, Spartina patens, andSpartina alterniflora are dominant, wide-spread
emergent macrophytes of North American fresh,brackish, and salt marsh plant communities, re-spectively. P. hemitomon Schult is a fresh marshgrass that is distributed continuously along thecoastal plain of the United States from NewJersey southward into Florida and westwardalong the Gulf coast into Texas. It is also foundin some fresh marshes in Tennessee and SouthAmerica (Godfrey and Wooten, 1979). Through-out its range P. hemitomon is a frequently encoun-tered species in fresh marsh plant communities,and in Louisiana it is the dominant emergentmacrophyte of the state’s southeastern coastalfreshwater marshes (Chabreck, 1972).
S. patens (Ait.) Muhl is a very importantcoastal grass species that is distributed continu-ously along the Atlantic and Gulf coasts of NorthAmerica from New Brunswick to south Texas. S.patens also occurs in the Yucatan peninsula,Cuba, the West Indies, and along some sandyshores of the Great Lakes (Mobberly, 1956; God-frey and Wooten, 1979). S. patens has a wideecological amplitude, ranging from dunes andswales to coastal intermediate and brackishmarshes, where it is frequently the dominant plantspecies (Duncan and Duncan, 1987; Chabreck,1972).
Spartina alterniflora Loisel is recognized as oneof the most important coastal grass species, andcommonly dominates coastal salt marshes(Pomeroy and Wiegert, 1981; Duncan and Dun-can, 1987; Eleuterius, 1990). Spartina alterniflorais distributed continuously along the Atlanticcoast of North America from New Foundlandsouthward to Florida and westward along theGulf coast to Texas (Godfrey and Wooten, 1979).It has also been introduced along the Pacific coastof North America, as well as numerous locationsin Europe and China.
M.W. Hester et al. / En�ironmental and Experimental Botany 46 (2001) 277–297 279
Although it is well known that these species,ranging from glycophytic to halophytic, exhibitconsiderable interspecific variation in salinitystress resistance, less is known concerning theamount of intraspecific variation in salinity stressresistance within each species and, moreimportantly, the underlying mechanisms of theintraspecific variation. The work of Silander(1979) and Silander and Antonovics (1979) ondune, swale, and marsh ecotypes of North Caro-lina populations of S. patens revealed thatpopulations growing in these different coastalhabitats were often genetically distinct and dis-played differences in salt tolerance. Pezeshki andDeLaune (1991, 1995) reported that populationdifferentiation in salinity tolerance appears to ex-ist in Louisiana marsh populations of S. patensand S. alterniflora. Although their researchwas based on a limited comparison of two popu-lations within each species located along the ex-tremes of a natural salinity gradient, theirresearch nonetheless showed that population dif-ferentiation to salinity tolerance may exist in thesetwo species. Recently, Hester et al. (1996, 1998)definitively documented significant intraspecificvariation in salt tolerance in Gulf coast popula-tions of P. hemitomon, S. patens, and S. al-terniflora. This work was unique because largenumbers of populations were investigated (19–25per species) and all population collections werede-acclimated from field conditions through sev-eral generations of vegetative propagation undernon-saline conditions before being challenged bystepwise salinity increases (Hester et al., 1996,1998).
Decreased growth of plants subjected to in-creased soil salinity occurs primarily for two rea-sons. Initially, the salts in soil solution lower theexternal water potential, thereby creating whathas been referred to as physiological drought,which is then followed by potential accumulationand toxicity of ions in the tissue (Gorham et al.,1985; Munns and Termaat, 1986; Munns, 1993).An additional impact of salinity is potential inhi-bition of nutrient ion uptake due to excessiveNa+ or Cl− concentrations in the soil solution,which can further decrease growth over time(Gorham et al., 1985).
Halophytes are often able to accumulate highconcentrations of salts in their tissues for osmoticadjustment through the compartmentalization ofions in vacuoles and the production of compatiblesolutes, or osmotica, in the cytoplasm (Gorham etal., 1985). Some compatible solutes that mayshow an increase in concentration under salinitystress, and thus may function in osmotic adjust-ment, include proline, glycine betaine, and sugars(Storey and Wyn Jones, 1978; Briens and Larher,1982; Cavalieri and Huang, 1979, 1981). Prolineand glycine betaine may also protect enzymes(proteins) from damage under salinity or dehydra-tion stress (Paleg et al., 1985; Smirnoff andCumbes, 1989; Shinozaki and Yamaguchi-Shinozaki, 1999). Interestingly, significant prolineaccumulation generally occurs only after athreshold of drought or salt stress is exceeded(Cavalieri and Huang, 1979; Hester et al., 1994)and, therefore, may prove useful in assessingsalinity stress resistance.
Halophytes may also control tissue Na+ or Cl−
concentrations through selective processes, suchas ion exclusion at the root and secretion of ionsfrom the leaves through salt glands (Flowers,1985). S. alterniflora and S. patens both possessthe ability to secrete salts out of the plant andonto the leaf surfaces through salt glands (Ander-son, 1974; Bradley and Morris, 1991). S. al-terniflora has been reported to be able to excludesalt (Smart and Barko, 1980), accumulate it in theleaf (Nestler, 1977), and exert some selectivityover which ions accumulate in its tissues (Bradleyand Morris, 1991). In addition, these two Spartinaspecies are known to accumulate compatible or-ganic solutes, such as proline and glycine betaine,that may aid in osmotic adjustment (Cavalieri andHuang, 1979, 1981).
Glycophytes (non-halophytes, such as P. hemit-omon) usually fall into two major categories ofresponse to salinity: (1) those that cannot avoidion uptake and experience adverse effects whenelectrolyte concentrations become excessive; and(2) those that avoid ion uptake (Greenway andMunns, 1980). Glycophytes that exclude ionsmust adjust osmotically by producing compatibleorganic solutes to avoid a water deficit, althoughthe cost of producing sufficient compatible solutes
M.W. Hester et al. / En�ironmental and Experimental Botany 46 (2001) 277–297280
generally limits this strategy to relatively low ex-ternal salt concentrations (Yeo, 1983). P. hemito-mon has been reported to accumulate Na+ in itsshoots when grown at elevated salinity levels (Mc-Kee and Mendelssohn, 1989). However, this accu-mulation can become excessive and severelyinhibit growth at higher salinities (McKee andMendelssohn, 1989) or lead to death if the salinityexposure is prolonged, even at relatively low salin-ities (Hester, 1995).
Morphological characteristics may also be asso-ciated with salinity tolerance. Since a primaryeffect of salt stress is a water deficit, morphomet-ric variables that influence transpirational waterloss, such as leaf size, shape, and number, may beassociated with salt tolerance within a species.Wetland plants grown under saline conditionsoften develop smaller leaves or a shorter growthform (Shea et al., 1975; Cain and Harvey, 1983;Eleuterius, 1989). Also, morphometric variablesassociated with plant size may be important interms of providing tissue for translocation ofions away from regions of active growth, espe-cially in glycophytes (Munns, 1993; Hester et al.,1998).
As mentioned above, we have previouslydocumented significant intraspecific variation insalt tolerance in Gulf Coast populations of P.hemitomon, S. patens, and S. alterniflora (Hesteret al., 1996, 1998). In this study, a subset ofpopulations from each species (ranging fromrelatively high to low salt tolerance) were sub-jected to a sublethal salinity excursion and plantgrowth responses and physiological/bio-chemical responses were determined in controland salt-challenged treatments. The specificobjectives of this study were to determine rela-tively short-term physiological/biochemical re-sponses to salinity stress and identify po-tential indicators of salt tolerance. Then, incorpo-rating data from our previous studies, our ulti-mate goal was to discern similarities anddifferences in mechanisms of salinity stressresistance, especially in regard to the relative im-portance of morphology and physiological/bio-chemical adaptations, in these important coastalgrasses.
2. Materials and methods
2.1. Plant material
Population selection was based on previous re-search, in which we subjected 19–25 populationsof each of the three species to weekly stepwisesalinity increases of 2, 5, and 10 ppt for P. hemit-omon, S. patens, and S. alterniflora, respectively(see Hester et al., 1996, 1998). All three speciesdisplayed highly significant intraspecific variationin lethal salinity level, which was defined as thatsalinity which resulted in 50% death of above-ground tissue. Based on these results, within eachspecies two of the most salt-tolerant populations,two populations of intermediate salt tolerance,and two of the least salt-tolerant populations wereselected. Within each species we will refer to thetwo most salt-tolerant populations as populations1 and 2, the two populations of intermediatesalinity tolerance as populations 3 and 4, and thetwo least salt-tolerant populations as populations5 and 6. The respective lethal salinity levels forthese populations are as follows: P. hemitomonpopulations 1 (12 ppt), 2 (11.2 ppt), 3 (10 ppt), 4(9.6 ppt), 5 (7.6 ppt), 6 (7.6 ppt); S. patens popu-lations 1 (93 ppt), 2 (89 ppt), 3 (83 ppt), 4 (81ppt), 5 (66 ppt), 6 (63 ppt); S. alterniflora popula-tions 1 (115 ppt), 2 (115 ppt), 3 (107 ppt), 4 (101ppt), 5 (93 ppt), 6 (93 ppt).
Plant material was obtained by vegetative prop-agation of the selected stock populations, whichhad been maintained under non-saline conditionsin a temperature-controlled glasshouse for six toeight vegetative generations prior to the beginningof this experiment. Plants were propagated in acommercial potting mix (Jiffy Mix®; Chicago, IL)and all pots were given equal amounts of half-strength (50%) Hoagland’s nutrient solution(Hoagland and Arnon, 1950) as needed to pro-duce vigorous growth.
2.2. Experimental design
The experimental design for each species was afactorial randomized block design of six repli-cates, or blocks, that blocked on position withinthe growth chamber. The three species experi-

M.W. Hester et al. / En�ironmental and Experimental Botany 46 (2001) 277–297 281
ments were run sequentially, not simultaneously.For each species the following 6×2×2 factorialarrangement of main effects was tested: pop-ulation effect (six populations ranging from highto low salinity tolerance), treatment effect (sub-lethal salinity level vs. control at non-saline condi-tions), harvest effect (early harvest 1 week afterexposure to sublethal salinity level and late har-vest 5 weeks after exposure to sublethal salinitylevel). This experimental design yielded a total of144 experimental units for each species experi-ment.
All experiments were conducted in a tempera-ture-controlled EGC (Environmental GrowthChambers) walk-in growth chamber set to 16 hdaylength at 30 °C and an 8 h dark period at24 °C. Photosynthetically active radiation(PAR) inside the growth chamber was approxi-mately 1200–1300 �mol m−2 s−1 at canopyheight. Depending on the size of the plants, twoto four young stems were planted per potin Jiffy Mix. Six replicates of each of the treat-ment combinations were potted in 0.7 l plasticpots equipped with bottom and side drainageholes. These pots were placed inside largerreservoir pots that contained the treatmentbathing solution of the desired salinity. Treatmentbathing solutions were maintained at a level of4–5 cm below the soil surface. This allowedexchange of soil interstitial water with the treat-ment bathing solution without flooding the soilsurface.
Each experiment consisted of two harvests: anearly harvest 1 week after exposure to thedesignated sublethal salinity level and a late har-vest after four additional weeks (5 weekstotal exposure to the sublethal salinity level). Thefollowing variables were measured duringboth harvests: leaf net CO2 assimilation rate andwater use efficiency, midday leaf xylem pressure,leaf expansion rate, aboveground biomass(partitioned into live and dead components),belowground biomass (partitioned into rootand rhizome components), leaf cation concentra-tions, and leaf proline and glycine betaineconcentrations. Additionally, during the earlyharvest leaf sucrose concentration was also deter-mined.
2.3. Salinity regime
The sublethal salinity level varied depending onthe species as follows: P. hemitomon, 4 ppt; S.patens, 20 ppt; and S. alterniflora, 30 ppt. Allexperimental units were initially maintained in atreatment bathing solution of half-strengthHoagland’s nutrient solution at 0 ppt salinity fora 2-week period following transplanting. Salinitywas then increased over a relatively short timeinterval (within 1 week) in half-strengthHoagland’s until the targeted sublethal salinitylevel was reached using a commercial sea salts mix(Instant Ocean®; Aquarium Systems, Mentor,OH) with major ionic composition expressed aspercentage of dry weight as follows: 46.9% Cl,26.0% Na, 6.4% SO4, 3.2% Mg, 1.0% Ca, and0.9% K (Bidwell and Spotte, 1985).
Controls were kept at 0 ppt salinity in half-strength Hoagland’s except for the S. alternifloracontrols, which were provided with 1 ppt sea saltin half-strength Hoagland’s. All bathing solutionswere drained and replaced at weekly intervals,solution levels were maintained daily, and salini-ties were checked twice weekly throughout eachexperiment.
2.4. Analytical techniques
Plant leaf photosynthesis (net CO2 assimilationrate) was measured on young, but fully expandedleaves (typically the second expanded leaf fromthe growing tip) during midday conditions (duringthe interval from 6 to 9 h into the 16-h photope-riod) on a mature stem haphazardly selected froma pool of representative stems. Measurementswere conducted with a portable infrared gas ana-lyzer (Analytical Development Company, Herts,England; model LCA-2). Sampling air was takenoutdoors at 5 m above the ground surface toobtain a relatively stable CO2 concentration notinfluenced by the presence of the investigator.Measurements were conducted under light-satu-rated photosynthetic conditions provided by aKodak projector lamp at a quantum flux densityof ca. 1400 �mol m−2 s−1. Gas exchange wasdetermined on a per unit leaf area, and molar airflow, transpiration rate and CO2 uptake were
M.W. Hester et al. / En�ironmental and Experimental Botany 46 (2001) 277–297282
calculated according to von Caemmerer and Far-quhar (1981). Water use efficiency was calculatedas �mol CO2 fixed per mmol H2O transpired(Griffiths, 1993).
Leaf expansion rate was measured on terminalleaves that were neither newly emergent nor fullyexpanded, but in the range of one-third to two-thirds expanded according to the methods de-scribed by Hester and Mendelssohn (1990), Kochet al. (1990), and Hester (1995). These authorsreport that leaf expansion rates measured in thesegrass species and others is a relatively sensitiveindicator of short-term growth, particularly inresponse to environmental stress.
Midday leaf xylem pressure was measured onthe second fully expanded leaf of a mature stemhaphazardly selected from a pool of representa-tive stems. Leaves were cleanly severed from theplant, inserted into a pressure equilibration cham-ber (Soil Moisture Equipment Co., Modelc3005) and the pressure gradually increased untilxylem fluid was observed to exude according tothe methods of Scholander et al. (1965).
At harvest, aboveground tissue was lightlyrinsed with distilled/deionized water to removeany encrusted salts on the leaf surfaces. Green leaftissue was clipped from the upper leaves of eachstem, frozen in liquid N2, lyophilized (freeze-dried), and then stored in a desiccator undervacuum until analysis of osmotica and leaf cationconcentrations. Soil from the belowground por-tion of each experimental unit was carefully rinsedwith tap water over a 2-mm mesh screen. Theattached aboveground stems and leaves were par-titioned into live and dead components. Below-ground biomass was partitioned into root andrhizome components. Samples were oven dried at65 °C until constant weight was achieved (4 days)and dry weight determined.
Leaf cation concentrations were determinedwith an inductively coupled argon plasma emis-sion spectrometer (Jarrell-Ash Atom Comp series800) after digestion of 0.25 g of lyophilized tissuein 3.0 ml concentrated nitric acid at 130 °C for 6h, which was then brought up to 35.0 ml finalvolume with distilled-deionized water.
Leaf sucrose was extracted from lyophilizedtissue after homogenizing in 95% HPLC-grade
ethanol for 45 s followed by a 30 min extractionperiod according to methods adapted from Picha(1985). Sucrose concentration was determined byhigh-performance liquid chromatography (HPLC)with a Bio-Sil Amino 5S column using an 80%CH3CN–20% H2O mobile phase and refractiveindex detection (Picha, 1985). Recoveries of su-crose standards using this technique averaged88%.
Leaf proline and glycine betaine were extractedusing a modification of Gorham (1984) as out-lined by Hester (1995). In this procedure it isimportant to note that regeneration of the anionexchange resin as OH− (utilizing 0.5 N NaOH)results in nearly complete loss (�90%) of prolinestandards, whereas regeneration utilizing sodiumacetate results in recoveries of 96–98% for bothproline and glycine betaine (Hester, 1995). Leafproline and glycine betaine were determined byHPLC with a Whatman SCX (strong cation ex-change) silica based (10 �m particle) column usinga buffer of 50 mol m−3 KH2PO4 (pH 5.0) for themobile phase at a flow rate of 1.0 ml min−1 anda UV detector at 200 nm (modified from Gorham1984). P. hemitomon samples contained anunidentified compound that interfered with theaccurate determination of glycine betaine. There-fore, only proline concentrations are reported forP. hemitomon.
2.5. Data analysis
Data were analyzed as a factorial randomizedblock design. Analysis of variance (ANOVA) wasused to test for significant main effects and inter-actions using SAS (SAS, 1989; Steel and Torrie,1980). A significance (alpha) level of 0.05 (P�0.05) was used for all analyses unless otherwisestated. Single-degree-of-freedom contrasts wereused to make a-priori comparisons between mostsalt-tolerant and least salt-tolerant populations.All data were tested for meeting the assumptionsof normality and homogeneity of variance byusing a combination of the Shapiro-Wilk teststatistic for tests of normality and the Bartlett testfor tests of homogeneity of variance (SAS, 1989).Data that did not meet these assumptions weretransformed until assumptions were met.

M.W. Hester et al. / En�ironmental and Experimental Botany 46 (2001) 277–297 283
Multivariate factor analyses were conducted byspecies on the mean population responses to salin-ity stress from this study plus the previous dataon mean population salt tolerance and morphol-ogy for the same set of populations using SYSTAT
8.0 software (Johnson and Wichern, 1988; SYS-TAT, 1998; see Hester et al., 1996, 1998 fordetails on previous studies). The objective was toreduce the large number of response variables fora species experiencing sublethal salinity stress to afewer number of factors and, in particular, toelucidate relationships between salt tolerance,physiological/biochemical responses, and morpho-metric variables. Within the factor that containedthe largest salinity factor score (i.e. the salinityfactor) we then further identified other variablesthat also had large factor scores (large loadings)on that salinity factor. In this manner we wereable to identify variables that were associated withspecies salt tolerance, and also determine if therelationship was positive or negative.
2.6. Data presentation
Because of the large size of the data set (numer-ous variables measured on three species, each withtwo harvests), it is not practical to present all thetreatment and control means in either tabular orgraphic form. Rather, the most important dataare summarized in tabular form by species (Tables1–3) in a manner that presents the treatmenteffect, treatment by population effect, the range ofmean population responses for the treatment ef-fect (sublethal salinity level vs. control), and theresults of a-priori linear contrasts that test theresponses of the two most salt-tolerant popula-tions to those of the two least salt-tolerantpopulations.
3. Results
3.1. O�erall patterns and trends
All three species displayed significant (to highlysignificant, P�0.01) population (intraspecific)variation for the following variables: leaf expan-sion rate, net CO2 assimilation rate, water use
efficiency, midday leaf xylem pressure, leaf pro-line, leaf glycine betaine (except P. hemitomon,where it could not be accurately determined), leafNa+/K+ ratio, leaf sucrose, total plant biomass,dead:total aboveground biomass ratio, and root-to-shoot ratio. Significant treatment effects (effectof sublethal salinity treatment vs. control) wereobserved in P. hemitomon and S. alterniflora forall of the variables mentioned above plus leafNa+/K+ ratio (Tables 1–3). Surprisingly, al-though S. patens also did display a significant(salinity) treatment effect for most of these vari-ables, a significant treatment effect was not de-tected for net CO2 assimilation, water useefficiency, leaf proline (P=0.078), or root-to-shoot ratio (Tables 1–3). Relative to the controlresponses of each species, sublethal salinity levelsgenerally resulted in significantly reduced net CO2
assimilation, leaf expansion, midday leaf xylempressure, water use efficiency, and live and totalbiomass; and significantly increased leaf Na+/K+
ratio, leaf proline, leaf glycine betaine, leaf su-crose, root-to-shoot ratio, and dead:total above-ground biomass ratio (Tables 1–3).
3.2. Short-term growth responses and plant waterrelations
As stated above, leaf expansion rates were sig-nificantly reduced in all three species when sub-jected to a sublethal salinity stress (Tables 1–3).Although net CO2 assimilation rates were corre-lated with leaf expansion and also displayed adecrease with salinity stress, S. patens failed todisplay a significant reduction in net CO2 assimi-lation at the sublethal salinity level of 20 ppt(Table 2). In P. hemitomon, prolonged exposureto 4 ppt salinity had a cumulative adverse effectthat resulted in limited green leaf tissue for severalof the late-harvest measurements and analyses inpopulation 5 (less salt-tolerant population), andactually proved to be lethal for some of thereplicates of this population.
Single-degree-of-freedom, a-priori, linear con-trasts revealed that net CO2 assimilation rate wasbetter able to distinguish between most and leastsalt-tolerant populations than leaf expansion rate(Tables 1–3). Both of these short-term growth

M.W
.H
esteret
al./E
n�ironmental
andE
xperimental
Botany
46(2001)
277–
297284
Table 1Summary of Panicum hemitomon growth and physiological responses when six populations of varying degree of salt tolerance were subjected to a sublethal salinity treatment (4 ppt) and non-saline conditions (control) foreither a 1 or 5 week duration
Population response range Salinity treatment contrast: 1+2Variable Treatment effect Treatment×population Exposure (week)vs. 5+6
Salinity treatment Control treatment F P�F M :LP�FFP�FF
Max. Min. Max. Min.
101.58 1 23.22 14.52 34.41 22.91 6.39 0.013 �0.001 4.00Net CO2 assimilation (�mol m−2 s−1) 0.0025 12.40 5.20 21.92 14.83 2.69 0.104 ns�
3.07 2.12 3.09 2.62 0.92 0.3391 ns�2.48 0.036Water use efficiency (�mol C mmol−1 H2O) 14.30 0.0015 2.92 1.17 3.00 2.56 14.51 0.001 �
−1.61 −2.41 −1.42 −1.82 7.01 0.009Midday leaf xylem pressure (MPa) �14.69 0.001 1.81 0.117 1−1.97 −2.16 −1.55 −2.44 0.00 0.9765 ns�
1282.20 0.93 0.60 0.22 0.13 0.01 0.923 ns�0.001 2.62 0.029Leaf Na+/K+ ratio1.98 0.92 0.96 0.45 0.85 0.362 ns�5
29.53 9.54 7.10 2.35 26.97 0.0011 �0.006Leaf proline (�mol g−1 dry wt) 44.26 0.001 3.9321.88 6.99 16.53 2.64 8.73 0.007 �557.19 37.19 42.51 18.08 0.13 0.7181 ns�Leaf sucrose (�mol g−1 dry wt) 0.3331.220.00311.52
155.38 3.23 1.97 3.71 2.87 0.40 0.529 ns�0.001 2.13 0.067Leaf expansion rate (cm day−1)1.95 1.40 3.19 1.36 1.42 0.2365 ns�
1189.11 18.04 11.28 21.78 14.09 2.15 0.145 ns�0.001 1.91 0.098Total plant biomass (g)5 20.55 5.91 33.16 26.17 25.48 0.001 �
0.37 0.13 0.14 0.08 10.84 0.0011 �5.22 0.001Dead:total aboveground biomass 47.25 0.0015 0.66 0.27 0.28 0.22 23.22 0.001 �
0.16Root-to-shoot ratio 0.1019.36 0.16 0.11 2.03 0.157 ns�0.001 2.41 0.040 10.27 0.15 0.19 0.12 11.12 0.0015 �
Statistical summary is provided for the main effect of treatment, treatment×population interaction, and the contrast of most salt-tolerant populations (1 and 2) vs. least salt-tolerant populations (5 and 6). M :L indicatesthe response of the most salt-tolerant populations (M) relative to the least salt-tolerant populations (L). Population response range values are population means (n=6).

M.W
.H
esteret
al./E
n�ironmental
andE
xperimental
Botany
46(2001)
277–
297285
Table 2Summary of Spartina patens growth and physiological responses when six populations of varying degree of salt tolerance were subjected to a sublethal salinity treatment (20 ppt) and non-saline conditions (control) for eithera 1 or 5 week duration
Population response range Salinity treatment contrast: 1+2 vs.Variable Treatment effect Treatment×population Exposure (week)5+6
Salinity treatment Control treatment F P�F M :LP�FFP�FF
Max. Min. Max. Min.
0.91 1 42.03 29.47 44.44 37.77 3.47 0.065 ns�0.342 0.50Net CO2 assimilation (�mol m−2 s−1) 0.77840.09 31.19 42.67 25.36 0.17 0.681 ns�5
5.01 4.08 5.62 4.06 2.74 0.1011 ns�Water use efficiency (�mol C mmol−1 H2O) 0.2241.420.7860.076.47 5.56 6.74 5.41 1.56 0.215 ns�5
−2.86 −3.27 −1.91 −2.22 2.89 0.0921 ns�Midday leaf xylem pressure (MPa) 0.8930.330.001211.205 −2.31 −2.86 −1.15 −1.66 3.89 0.050 �
1.49 0.72 0.45 0.20 1.78 0.1851 ns�568.03Leaf Na+/K+ ratio 0.0113.120.0015 2.10 1.27 1.02 0.43 6.42 0.013 �
Leaf proline (�mol g−1 dry wt.) 11.573.24 5.17 15.32 8.75 0.61 0.438 ns�0.078 2.07 0.086 113.09 7.54 5.75 3.69 0.20 0.6535 ns�21.41 15.76 19.91 11.05 1.90 0.175Leaf glycine betaine (�mol g−1 dry wt.) ns�88.64 0.001 1.06 0.396 120.75 15.35 11.32 7.31 0.44 0.5125 ns�
18.81 46.56 20.38 30.81 11.67 2.74 0.112 ns�0.007 1.06 0.407Leaf sucrose (�mol g−1 dry wt.)2.71 1.98 4.14 3.44 1.99 0.1611 ns�58.37Leaf expansion rate (cm day−1) 0.2431.360.001
5 1.99 1.50 2.55 1.67 0.17 0.682 ns�16.46Total plant biomass (g) 7.8979.43 18.14 10.46 0.01 0.916 ns�0.001 3.72 0.004 142.30 22.92 52.93 30.52 3.49 0.0645 ns�0.07 0.04 0.04 0.01 1.85 0.176Dead:total aboveground biomass ns�23.17 0.001 2.21 0.058 10.09 0.07 0.09 0.04 0.36 0.5475 ns�
0.408 1 0.16 0.07 0.12 0.07 39.39 0.001 �Root-to-shoot ratio 2.50 0.117 1.020.10 0.04 0.08 0.04 0.27 0.6015 ns�
Statistical summary is provided for the main effect of treatment, treatment×population interaction, and the contrast of most salt-tolerant populations (1 and 2) vs. least salt-tolerant populations (5 and 6). M :L indicatesthe response of the most salt-tolerant populations (M) relative to the least salt-tolerant populations (L). Population response range values are population means (n=6).
M.W
.H
esteret
al./E
n�ironmental
andE
xperimental
Botany
46(2001)
277–
297286
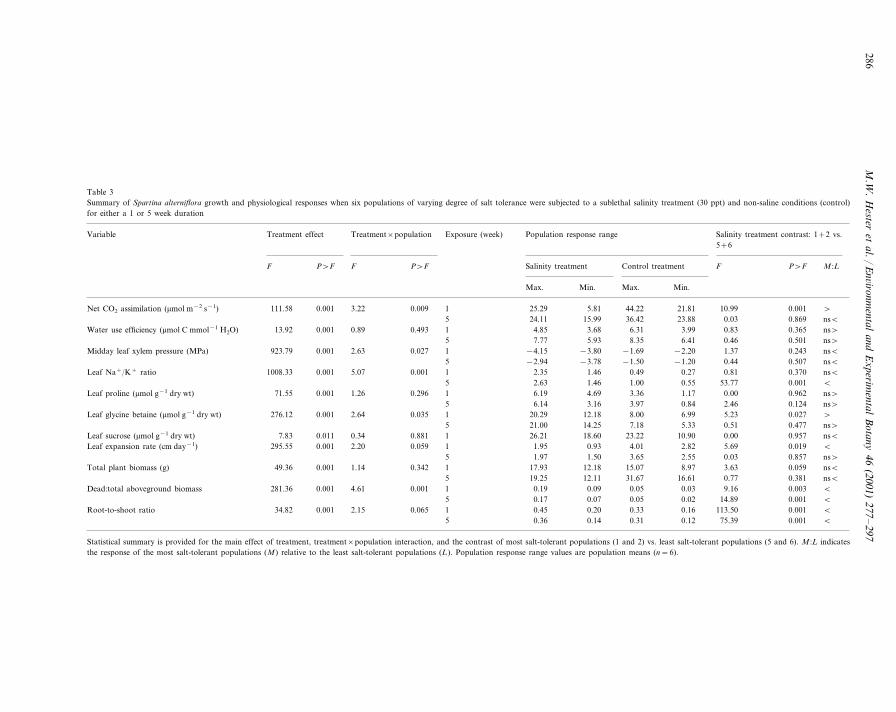
Table 3Summary of Spartina alterniflora growth and physiological responses when six populations of varying degree of salt tolerance were subjected to a sublethal salinity treatment (30 ppt) and non-saline conditions (control)for either a 1 or 5 week duration
Population response range Salinity treatment contrast: 1+2 vs.Variable Treatment effect Treatment×population Exposure (week)5+6
Salinity treatment Control treatment F P�F M :LP�FFP�FF
Max. Min. Max. Min.
111.58 1 25.29 5.81 44.22 21.81 10.99 0.001 �0.001 3.22Net CO2 assimilation (�mol m−2 s−1) 0.00924.11 15.99 36.42 23.88 0.03 0.869 ns�5
4.85 3.68 6.31 3.99 0.83 0.3651 ns�Water use efficiency (�mol C mmol−1 H2O) 0.4930.890.00113.927.77 5.93 8.35 6.41 0.46 0.501 ns�5
−4.15 −3.80 −1.69 −2.20 1.37 0.2431 ns�Midday leaf xylem pressure (MPa) 0.0272.630.001923.795 −2.94 −3.78 −1.50 −1.20 0.44 0.507 ns�
2.35 1.46 0.49 0.27 0.81 0.3701 ns�1008.33Leaf Na+/K+ ratio 0.0015.070.0015 2.63 1.46 1.00 0.55 53.77 0.001 �
Leaf proline (�mol g−1 dry wt) 6.1971.55 4.69 3.36 1.17 0.00 0.962 ns�0.001 1.26 0.296 16.14 3.16 3.97 0.84 2.46 0.1245 ns�
20.29 12.18 8.00 6.99 5.23 0.027Leaf glycine betaine (�mol g−1 dry wt) �276.12 0.001 2.64 0.035 121.00 14.25 7.18 5.33 0.51 0.4775 ns�
17.83 26.21 18.60 23.22 10.90 0.00 0.957 ns�0.011 0.34 0.881Leaf sucrose (�mol g−1 dry wt)1.95 0.93 4.01 2.82 5.69 0.0191 �295.55Leaf expansion rate (cm day−1) 0.0592.200.001
5 1.97 1.50 3.65 2.55 0.03 0.857 ns�17.93Total plant biomass (g) 12.1849.36 15.07 8.97 3.63 0.059 ns�0.001 1.14 0.342 119.25 12.11 31.67 16.61 0.77 0.3815 ns�
0.19 0.09 0.05 0.03 9.16 0.003Dead:total aboveground biomass �281.36 0.001 4.61 0.001 10.17 0.07 0.05 0.02 14.89 0.0015 �
0.065 1 0.45 0.20 0.33 0.16 113.50 0.001 �Root-to-shoot ratio 34.82 0.001 2.150.36 0.14 0.31 0.12 75.39 0.0015 �
Statistical summary is provided for the main effect of treatment, treatment×population interaction, and the contrast of most salt-tolerant populations (1 and 2) vs. least salt-tolerant populations (5 and 6). M :L indicatesthe response of the most salt-tolerant populations (M) relative to the least salt-tolerant populations (L). Population response range values are population means (n=6).
M.W. Hester et al. / En�ironmental and Experimental Botany 46 (2001) 277–297 287
indicators detected more differences between pop-ulations during the early harvest (1-week salinityexposure) measurements than late harvest (5-weeksalinity exposure) measurements. In all three spe-cies, contrasts utilizing leaf expansion rate failedto detect significant differences, with the exceptionof S. alterniflora in the early harvest (1-weeksalinity exposure), which interestingly showed thatmore salt-tolerant populations had significantlylower rates of leaf expansion than less salt-toler-ant populations.
Plant water use efficiency was significantlygreater in more salt-tolerant populations of P.hemitomon after 5 weeks of salinity exposure(Table 1), but not in either of the Spartina species,regardless of the length of salinity exposure (Ta-bles 2 and 3). Midday leaf xylem pressure wassignificantly greater in more salt-tolerant popula-tions of P. hemitomon after 1 week of salinityexposure, and after 5 weeks of salinity exposurefor S. patens, but not S. alterniflora (Tables 1–3).
3.3. Long-term growth responses and biomasspartitioning
Although all species displayed a significant re-duction in total plant biomass after 5 weeks ofexposure to sublethal salinity levels (relative totheir controls), only P. hemitomon showed a re-duction within 1 week of salinity exposure (Tables1–3). P. hemitomon was also unique in being theonly species that yielded a significant contrastbetween populations of differing salt tolerance fortotal plant biomass; after 5 weeks more salt-toler-ant populations had significantly greater totalplant biomass (Table 1).
Aboveground biomass also displayed some in-teresting differences. In P. hemitomon, contrastsof most versus least salt-tolerant populations re-vealed significant differences in live, dead, andtotal aboveground biomass in both harvests, withlate harvest differences being the most dramatic.Late harvest total aboveground biomass rangedfrom 12.2 g per pot in the most salt-tolerantpopulations to 5.1 g per pot in the least salt-toler-ant populations. Conversely, no significant popu-lation contrasts were detected in either Spartinaspecies for live or total aboveground biomass.
Dead:total aboveground biomass (i.e. the pro-portion of aboveground biomass that was dead)proved to be an excellent indicator for identifyinghighly salt-tolerant populations of both P. hemit-omon and S. alterniflora, but not S. patens (Tables1–3). The most salt-tolerant populations of bothP. hemitomon and S. alterniflora had significantly(P�0.01) lower proportions of dead above-ground tissue in both harvests than the leastsalt-tolerant populations (Tables 1 and 3). In S.patens, the sublethal salinity level of 20 ppt didnot result in greater than 9% dead abovegroundtissue in any of the populations (Table 2). This iscontrasted to 19 and 66% dead aboveground tis-sue in the least salt-tolerant populations of S.alterniflora and P. hemitomon after 5 weeks ofexposure to 30 and 4 ppt, respectively (Tables 1and 3).
Although all species did display significant re-ductions in belowground biomass when exposedto sublethal salinity levels, belowground biomassgenerally did not display as severe of a decrease aswas observed in the aboveground component. InS. alterniflora, it is interesting to note that themost salt-tolerant populations displayed signifi-cantly less root and total biomass than the leastsalt-tolerant populations. Late harvest rootbiomass of S. alterniflora averaged about 1.7 g perpot for the most salt-tolerant populations com-pared to 3.8 g per pot for the least salt-tolerantpopulations. This trend was not observed in P.hemitomon or S. patens, in which there were nosignificant differences in belowground compo-nents between populations of differing salttolerance.
Sublethal salinity stress resulted in significantlygreater root-to-shoot ratios (relative to the con-trols) in P. hemitomon and S. alterniflora, but notS. patens. However, root-to-shoot ratio was ableto differentiate population salt tolerance in allthree species; under salinity stress the most salt-tolerant populations displayed smaller root-to-shoot ratios than the least salt-tolerantpopulations. For S. alterniflora, both early andlate harvest root-to-shoot ratios produced signifi-cant contrasts, whereas in P. hemitomon only thelate harvest contrast, and in S. patens only theearly harvest contrast, was significant (Tables 1–3).

M.W. Hester et al. / En�ironmental and Experimental Botany 46 (2001) 277–297288
3.4. Leaf Na+/K+ and osmotica
Leave Na+/K+ ratios were significantly ele-vated in the sublethal salinity treatments in allthree species (Tables 1–3). When exposed to sub-lethal salinity levels, the most salt-tolerant popu-lations of S. alterniflora had leaf Na+/K+ ratiosthat were significantly less elevated than the leastsalt-tolerant populations, indicating greater abilityfor ion selectivity in these more salt-tolerant pop-ulations (Table 3). In contrast, there were nodifferences between the P. hemitomon populationsin their ability to alter Na+/K+ ratios (Table 1).
Sublethal salinity stress resulted in increasedaccumulation of osmotica (sucrose, proline, andglycine betaine) in all three species (Tables 1–3).In P. hemitomon the most salt-tolerant popula-tions accumulated significantly less proline undersalt stress than the least salt-tolerant populations(although all populations exposed to sublethalsalinity levels had proline levels that were signifi-cantly greater than their controls; Table 1). In S.patens, none of the osmotica proved useful indifferentiating between more and less salt-tolerantpopulations (Table 3). In contrast, S. alternifloraglycine betaine was significantly greater in themore salt-tolerant populations under salinitystress (Table 3). Leaf sucrose, although elevatedby sublethal salinity levels, proved to be not auseful indicator of population salt tolerance inany of the species (Tables 1–3).
3.5. Factor analyses
Physiological data from the sublethal salinitytreatment responses of this study plus lethal salin-ity level data and a subset of the morphometricdata (plant height and representative leaf lengthand leaf area) from our previous research on thesesame populations were entered into a factor anal-ysis for each species. For each species, we limitedthe number of factors to three; in P. hemitomonthis was the maximum number of factors witheigenvalues greater than 1.0. For both Spartinas,four factors had eigenvalues greater than 1.0, butsalinity always loaded on either the first or secondfactor. Therefore, since the primary focus of theseanalyses was to identify those variables that
loaded highly with salinity, we limited all speciesto a maximum of three factors. As stated below,this still resulted in a high proportion of the totalvariation in each species’ data set being explainedby the first three factors (81–93% of the totalvariation). These factor analyses generally confi-rmed the results from ANOVA and contrasts interms of identifying those physiological variablesmost associated with salt tolerance, and also eluci-dated some key differences between species in therelative importance of morphometric versus phys-iological adaptation in accounting for intraspecificvariation in salt tolerance.
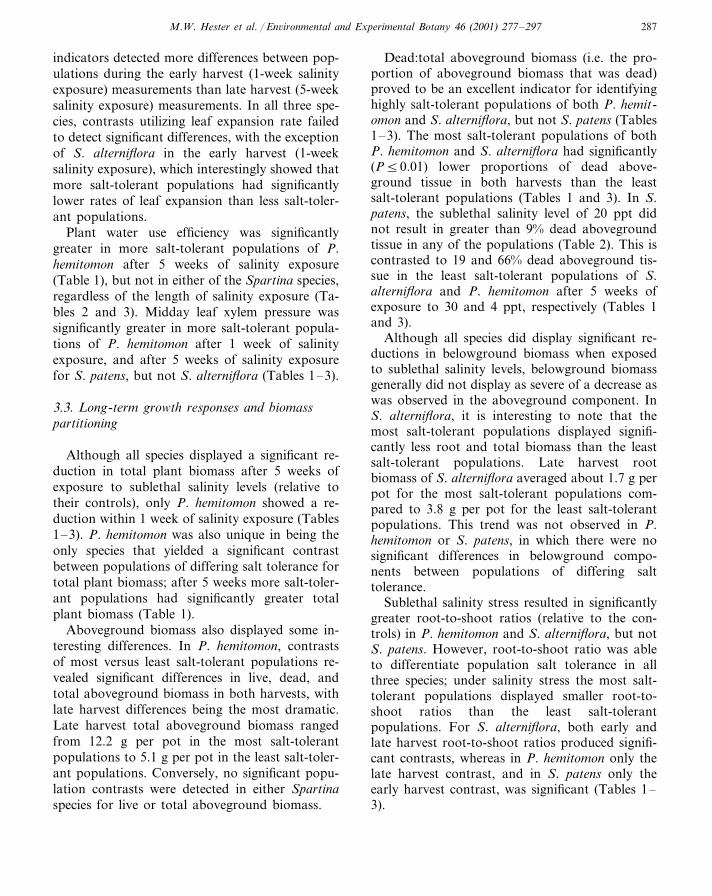
In P. hemitomon, lethal salinity level had a highpositive loading (large positive factor score) onthe first factor along with high positive loadingsof morphometric variables associated with plantsize (plant height, leaf length, and leaf area) andplant water status (early harvest midday leafxylem pressure and late harvest water use effi-ciency) (Table 4; Fig. 1). These high loadings ofmorphometric size variables with salt tolerancewere unique to P. hemitomon. P. hemitomon wasalso unique in that early harvest leaf prolinedisplayed a large negative loading on factor one;implying that although all populations showedsignificant proline accumulation with sublethalsalinity stress, greater salt tolerance was associ-ated with those populations that accumulatedproline to a lesser extent (Table 4; Fig. 1). Thefirst factor (salinity factor) accounted for 42.9% ofthe variation in the data and all three factorsaccounted for 93.4% of the total variation (Table4).
Lethal salinity level in S. patens had a highpositive loading on factor one along with earlyharvest net CO2 assimilation rate, early harvestwater use efficiency, and midday leaf xylem pres-sure in both harvests (Table 5; Fig. 2). Leaf lengthalso displayed a high positive loading on factorone. Leaf area had a moderate positive loading onfactor one, but plant height did not load highlyon any of the factors (Table 5; Fig. 2). The firstfactor (salinity factor) accounted for 37.8% of thevariation in the data, with the first three factorsaccounting for 81.2% of the total variation (Table5).
M.W. Hester et al. / En�ironmental and Experimental Botany 46 (2001) 277–297 289
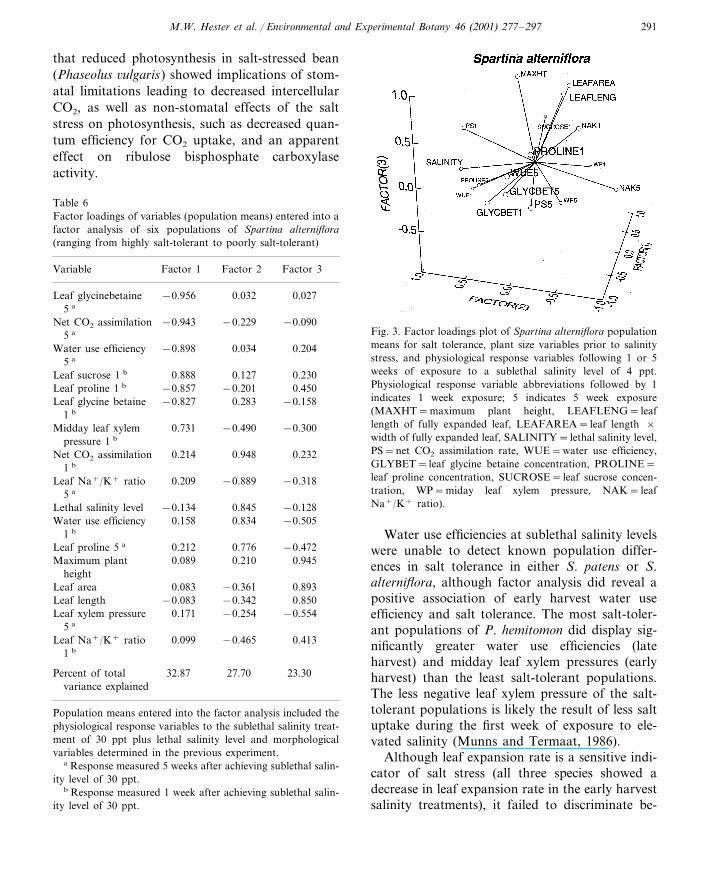
In S. alterniflora, lethal salinity level loadedhighly on factor two along with high positiveloadings of early harvest net CO2 assimilation rateand water use efficiency, late harvest proline, and,importantly, a large negative loading of late har-vest leaf Na+/K+ ratio (Table 6; Fig. 3). S.alterniflora was unique in being the only specieswith ion selectivity (leaf Na+/K+) being impor-tant in explaining population variation in salttolerance; the most salt-tolerant populations wereable to selectively lower leaf Na+ relative to K+
under salinity stress more than the least salt-toler-ant populations (Tables 3 and 6). Plant size at-
Fig. 1. Factor loadings plot of Panicum hemitomon populationmeans for salt tolerance, plant size variables prior to salinitystress, and physiological response variables following 1 or 5weeks of exposure to a sublethal salinity level of 4 ppt.Physiological response variable abbreviations followed by 1indicates 1 week exposure; 5 indicates 5 week exposure(MAXHT=maximum plant height, LEAFLENG= leaflength of fully expanded leaf, LEAFAREA= leaf length xwidth of fully expanded leaf, SALINITY= lethal salinity level,PS=net CO2 assimilation rate, WUE=water use efficiency,PROLINE= leaf proline concentration, SUCROSE= leaf su-crose concentration, WP=miday leaf xylem pressure, NAK=leaf Na+/K+ ratio).
Table 4Factor loadings of variables (population means) entered into afactor analysis of six Panicum hemitomon populations (rangingfrom most salt-tolerant to least salt-tolerant)
Factor 2Variable Factor 3Factor 1
0.268Midday leaf xylem 0.0390.963pressure 1 a
0.935 0.2190.277Leaf lengthLeaf proline 1 a −0.316−0.933 0.119Leaf area 0.906 −0.108 0.390Lethal salinity level 0.900 −0.225 −0.375
0.0060.6110.761Water use efficiency5 b
0.727 −0.075 0.646Maximum plantheight
−0.639Leaf proline 5 b 0.602 0.435Water use efficiency −0.190−0.504 0.830
1 a
−0.154 −0.380Na+/K+ ratio 1 a 0.9010.033Na+/K+ ratio 5 b 0.890 0.122
Leaf sucrose 1 a −0.346 0.697 0.145Net CO2 assimilation −0.053 −0.667 −0.742
1 a
−0.8900.194 0.248Net CO2 assimilation5 b
−0.7730.415Midday leaf xylem 0.357pressure 5 b
29.7542.86 20.80Percent of totalvariance explained
Population means entered into the factor analysis included thephysiological response variables to the sublethal salinity treat-ment of 4 ppt plus lethal salinity level and morphologicalvariables determined in the previous experiment.
a Response measured 1 week after achieving sublethal salin-ity level of 4 ppt.
b Response measured 5 weeks after achieving sublethal salin-ity level of 4 ppt.
tributes (plant height, leaf length, and leaf area)all loaded independently from lethal salinity onfactor three and are, therefore, not associatedwith salt tolerance in this species (Table 6; Fig. 3).The salinity factor accounted for 27.7% of thevariation in the data and the first three factorsaccounted for 83.9% of the total variation (Table6).
4. Discussion
4.1. Short-term growth and plant water relations
Net CO2 assimilation data of all three speciesindicated that the most salt-tolerant populationswere able to maintain higher rates of photosyn-thesis 1 week after being subjected to a sublethalsalinity stress, but not necessarily after 5 weeks. Inthe late harvest, photosynthetic response differ-

M.W. Hester et al. / En�ironmental and Experimental Botany 46 (2001) 277–297290
ences between the salinity treatments and controlsacross all populations, regardless of the salt toler-ance ranking, were lessened in S. patens and S.alterniflora, but became more pronounced in P.hemitomon. This is likely a reflection of the inabil-ity of P. hemitomon to exclude salt (McKee andMendelssohn, 1989), such that continued expo-sure to saline conditions had a cumulative nega-
Fig. 2. Factor loadings plot of Spartina patens populationmeans for salt tolerance, plant size variables prior to salinitystress, and physiological response variables following 1 or 5weeks of exposure to a sublethal salinity level of 4 ppt.Physiological response variable abbreviations followed by 1indicates 1 week exposure; 5 indicates 5 week exposure(MAXHT=maximum plant height, LEAFLENG= leaflength of fully expanded leaf, LEAFAREA= leaf length xwidth of fully expanded leaf, SALINITY= lethal salinity level,PS=net CO2 assimilation rate, WUE=water use efficiency,GLYBET= leaf glycine betaine concentration, PROLINE=leaf proline concentration, SUCROSE= leaf sucrose concen-tration, WP=miday leaf xylem pressure, NAK= leafNa+/K+ ratio).
Table 5Factor loadings of variables (population means) from a factoranalysis of six populations of Spartina patens (ranging frommost salt-tolerant to least salt-tolerant)
Variable Factor 2Factor 1 Factor 3
0.102−0.0370.976Lethal salinity level0.944 −0.070 0.024Water use efficiency
1 a
−0.057Midday leaf xylem 0.1790.897pressure a
−0.373Net CO2 assimilation 0.3140.8191 a
0.057Midday leaf xylem 0.4520.808pressure 5 b
Leaf length −0.147 −0.5860.796−0.474Leaf area 0.654 −0.396
0.5430.535Maximum plant 0.601height
Leaf glycine betaine 0.053−0.503 −0.1741 a
−0.430−0.783Leaf proline 5 b 0.207−0.527−0.229Leaf glycine betaine 0.765
5 b
Leaf Na+/K+ ratio 0.5110.089 0.7571 a
Leaf Na+/K+ ratio 0.6670.368 0.3615 b
−0.401Leaf sucrose 1 a 0.665 −0.177−0.7340.542Water use efficiency −0.392
5 b
0.358 0.520 −0.599Net CO2 assimilation5 b
−0.410Leaf proline 1 a −0.405 0.532
Percent of total 17.9337.76 25.54variance explained
Population means entered into the factor analysis included thephysiological response variables to the sublethal salinity treat-ment of 20 ppt plus lethal salinity level and morphologicalvariables determined in the previous experiment.
a Response measured 1 week after achieving sublethal salin-ity level of 20 ppt.
b Response measured 5 weeks after achieving sublethal salin-ity level of 20 ppt.
tive effect. In contrast, the two Spartinas did notnecessarily display reduced photosynthetic re-sponse beyond what occurred after 1 week, possi-bly because of their ability to exclude or secretesalt (Anderson, 1974; Smart and Barko, 1980;Bradley and Morris, 1991). The cumulative detri-mental effect of prolonged salinity exposure on P.hemitomon was evidenced by insufficient greenleaf tissue on several experimental units for com-plete late-harvest measurements. Decreases inphotosynthetic rate with prolonged salt stress maybe related to reduced utilization of photosynthatedue to tissue senescence and slowed new growth(Herold, 1980), stomatal control factors(Longstreth and Strain, 1977; Percy and Ustin,1984), as well as non-stomatal, or metabolic fac-tors (Longstreth and Nobel, 1979; Longstreth etal., 1984). Seemann and Critchley (1985) reported
M.W. Hester et al. / En�ironmental and Experimental Botany 46 (2001) 277–297 291
that reduced photosynthesis in salt-stressed bean(Phaseolus �ulgaris) showed implications of stom-atal limitations leading to decreased intercellularCO2, as well as non-stomatal effects of the saltstress on photosynthesis, such as decreased quan-tum efficiency for CO2 uptake, and an apparenteffect on ribulose bisphosphate carboxylaseactivity.
Fig. 3. Factor loadings plot of Spartina alterniflora populationmeans for salt tolerance, plant size variables prior to salinitystress, and physiological response variables following 1 or 5weeks of exposure to a sublethal salinity level of 4 ppt.Physiological response variable abbreviations followed by 1indicates 1 week exposure; 5 indicates 5 week exposure(MAXHT=maximum plant height, LEAFLENG= leaflength of fully expanded leaf, LEAFAREA= leaf length ×width of fully expanded leaf, SALINITY= lethal salinity level,PS=net CO2 assimilation rate, WUE=water use efficiency,GLYBET= leaf glycine betaine concentration, PROLINE=leaf proline concentration, SUCROSE= leaf sucrose concen-tration, WP=miday leaf xylem pressure, NAK= leafNa+/K+ ratio).
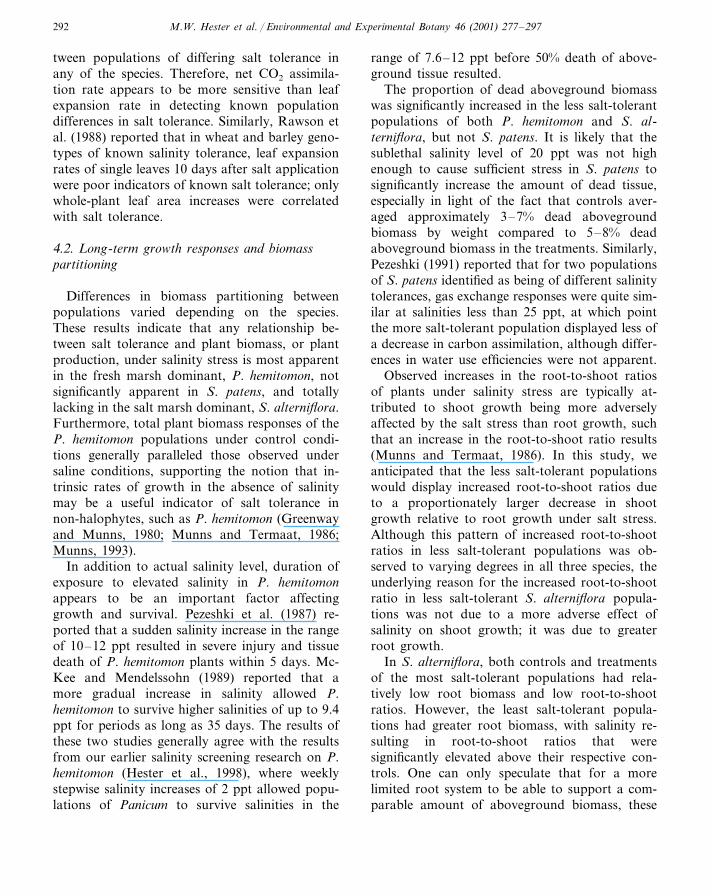
Table 6Factor loadings of variables (population means) entered into afactor analysis of six populations of Spartina alterniflora(ranging from highly salt-tolerant to poorly salt-tolerant)
Factor 1Variable Factor 3Factor 2
0.027Leaf glycinebetaine −0.956 0.0325 a
Net CO2 assimilation −0.229−0.943 −0.0905 a
Water use efficiency −0.898 0.034 0.2045 a
0.1270.888 0.230Leaf sucrose 1 b
−0.857Leaf proline 1 b −0.201 0.450Leaf glycine betaine 0.283−0.827 −0.158
1 b
Midday leaf xylem −0.4900.731 −0.300pressure 1 b
0.214 0.948 0.232Net CO2 assimilation1 b
−0.318Leaf Na+/K+ ratio 0.209 −0.8895 a
−0.134 −0.128Lethal salinity level 0.8450.158 0.834 −0.505Water use efficiency
1 b
0.212Leaf proline 5 a 0.776 −0.4720.089Maximum plant 0.210 0.945
height0.083Leaf area −0.361 0.893
Leaf length 0.850−0.083 −0.342−0.5540.171Leaf xylem pressure −0.254
5 a
Leaf Na+/K+ ratio 0.099 −0.465 0.4131 b
Percent of total 23.3032.87 27.70variance explained
Population means entered into the factor analysis included thephysiological response variables to the sublethal salinity treat-ment of 30 ppt plus lethal salinity level and morphologicalvariables determined in the previous experiment.
a Response measured 5 weeks after achieving sublethal salin-ity level of 30 ppt.
b Response measured 1 week after achieving sublethal salin-ity level of 30 ppt.
Water use efficiencies at sublethal salinity levelswere unable to detect known population differ-ences in salt tolerance in either S. patens or S.alterniflora, although factor analysis did reveal apositive association of early harvest water useefficiency and salt tolerance. The most salt-toler-ant populations of P. hemitomon did display sig-nificantly greater water use efficiencies (lateharvest) and midday leaf xylem pressures (earlyharvest) than the least salt-tolerant populations.The less negative leaf xylem pressure of the salt-tolerant populations is likely the result of less saltuptake during the first week of exposure to ele-vated salinity (Munns and Termaat, 1986).
Although leaf expansion rate is a sensitive indi-cator of salt stress (all three species showed adecrease in leaf expansion rate in the early harvestsalinity treatments), it failed to discriminate be-
M.W. Hester et al. / En�ironmental and Experimental Botany 46 (2001) 277–297292
tween populations of differing salt tolerance inany of the species. Therefore, net CO2 assimila-tion rate appears to be more sensitive than leafexpansion rate in detecting known populationdifferences in salt tolerance. Similarly, Rawson etal. (1988) reported that in wheat and barley geno-types of known salinity tolerance, leaf expansionrates of single leaves 10 days after salt applicationwere poor indicators of known salt tolerance; onlywhole-plant leaf area increases were correlatedwith salt tolerance.
4.2. Long-term growth responses and biomasspartitioning
Differences in biomass partitioning betweenpopulations varied depending on the species.These results indicate that any relationship be-tween salt tolerance and plant biomass, or plantproduction, under salinity stress is most apparentin the fresh marsh dominant, P. hemitomon, notsignificantly apparent in S. patens, and totallylacking in the salt marsh dominant, S. alterniflora.Furthermore, total plant biomass responses of theP. hemitomon populations under control condi-tions generally paralleled those observed undersaline conditions, supporting the notion that in-trinsic rates of growth in the absence of salinitymay be a useful indicator of salt tolerance innon-halophytes, such as P. hemitomon (Greenwayand Munns, 1980; Munns and Termaat, 1986;Munns, 1993).
In addition to actual salinity level, duration ofexposure to elevated salinity in P. hemitomonappears to be an important factor affectinggrowth and survival. Pezeshki et al. (1987) re-ported that a sudden salinity increase in the rangeof 10–12 ppt resulted in severe injury and tissuedeath of P. hemitomon plants within 5 days. Mc-Kee and Mendelssohn (1989) reported that amore gradual increase in salinity allowed P.hemitomon to survive higher salinities of up to 9.4ppt for periods as long as 35 days. The results ofthese two studies generally agree with the resultsfrom our earlier salinity screening research on P.hemitomon (Hester et al., 1998), where weeklystepwise salinity increases of 2 ppt allowed popu-lations of Panicum to survive salinities in the
range of 7.6–12 ppt before 50% death of above-ground tissue resulted.
The proportion of dead aboveground biomasswas significantly increased in the less salt-tolerantpopulations of both P. hemitomon and S. al-terniflora, but not S. patens. It is likely that thesublethal salinity level of 20 ppt was not highenough to cause sufficient stress in S. patens tosignificantly increase the amount of dead tissue,especially in light of the fact that controls aver-aged approximately 3–7% dead abovegroundbiomass by weight compared to 5–8% deadaboveground biomass in the treatments. Similarly,Pezeshki (1991) reported that for two populationsof S. patens identified as being of different salinitytolerances, gas exchange responses were quite sim-ilar at salinities less than 25 ppt, at which pointthe more salt-tolerant population displayed less ofa decrease in carbon assimilation, although differ-ences in water use efficiencies were not apparent.
Observed increases in the root-to-shoot ratiosof plants under salinity stress are typically at-tributed to shoot growth being more adverselyaffected by the salt stress than root growth, suchthat an increase in the root-to-shoot ratio results(Munns and Termaat, 1986). In this study, weanticipated that the less salt-tolerant populationswould display increased root-to-shoot ratios dueto a proportionately larger decrease in shootgrowth relative to root growth under salt stress.Although this pattern of increased root-to-shootratios in less salt-tolerant populations was ob-served to varying degrees in all three species, theunderlying reason for the increased root-to-shootratio in less salt-tolerant S. alterniflora popula-tions was not due to a more adverse effect ofsalinity on shoot growth; it was due to greaterroot growth.
In S. alterniflora, both controls and treatmentsof the most salt-tolerant populations had rela-tively low root biomass and low root-to-shootratios. However, the least salt-tolerant popula-tions had greater root biomass, with salinity re-sulting in root-to-shoot ratios that weresignificantly elevated above their respective con-trols. One can only speculate that for a morelimited root system to be able to support a com-parable amount of aboveground biomass, these
M.W. Hester et al. / En�ironmental and Experimental Botany 46 (2001) 277–297 293
most salt-tolerant populations have root systemsthat are, in some way, more efficient at nutrientand water acquisition, and possibly ion selectivity(Flowers et al., 1977; Blum, 1988; Shinozaki andYamaguchi-Shinozaki, 1999 and referencestherein).
The importance of plant size attributes in P.hemitomon as being a potential factor in salttolerance was recognized in our previous lethalsalinity level screening studies on a large numberof populations (Hester et al., 1998), and remainsimportant based on the results of this study whenexposure was maintained at a constant sublethalsalinity level. Both univariate and multivariate(factor) analyses confirmed the importance of sizeattributes in salinity resistance in P. hemitomon.We suggest that greater biomass results in moremature tissue available for translocation and stor-age of salts away from regions of active growth(Greenway and Munns, 1980; Munns and Ter-maat, 1986; Fitter and Hay, 1987; Munns, 1993).Total plant biomass and belowground biomasscomponents in P. hemitomon controls were alsosignificantly greater in more salt-tolerant popula-tions, indicating that in P. hemitomon, growthrate in the absence of salt (intrinsic rate ofgrowth) may be of value in assessing salt toler-ance. Rawson et al. (1988) similarly found thatgrowth of barley and wheat genotypes of knownsalt tolerance in the absence of salt stress was afairly good indicator of salt tolerance. Greenwayand Munns (1980) further state that in non-halo-phytes, genotypes of low intrinsic rates of growthare disadvantaged at high salinities.
4.3. Leaf Na+/K+ and osmotica
McKee and Mendelssohn (1989) reported thatP. hemitomon leaf Na+ was positively correlatedwith interstitial salinity, indicating that P. hemito-mon has very little control over Na+ uptake.Similarly, P. hemitomon leaf Na+ levels in oursalinity treatments were typically 3–4 timesgreater than their controls. Additionally, our re-sults indicate greater ion uptake by the less salt-tolerant populations during the initial week ofexposure to elevated salinities (data not shown).This agrees with the generality that an inverse
relationship typically exists between salt uptakeand salinity resistance in closely related varietiesor species of glycophytes (Greenway and Munns,1980; Yeo, 1983).
Many glycophytes are able to respond to mod-erate levels of salinity by excluding sodium andchloride as a mechanism of tolerance (Sacher etal., 1982), although accumulation of sodium andchloride in salt-adapted glycophyte cells in tissueculture and whole plants has also been observed(Greenway and Munns, 1980; Binzel et al., 1987;Cheeseman, 1988). Nonetheless, P. hemitomon ap-parently has only limited control over ion uptakein terms of selectivity or exclusion, since by thelate harvest all populations showed signs of cumu-lative salt stress with observed tissue necrosis andvery high leaf cation concentrations.
Halophytes, are able to accumulate fairly highconcentrations of salts in their tissues for osmoticadjustment through compartmentalization of ionsin vacuoles and the production of compatiblesolutes in the cytoplasm (Flowers, 1985; Gorhamet al., 1985). S. alterniflora was unlike P. hemito-mon and S. patens in that it did not displaysignificant differences in leaf xylem pressure andtotal cation concentrations between populationsof differing salt tolerance. More importantly, S.alterniflora did display ion selectivity; highly salt-tolerant populations achieved significantly lowerleaf Na+/K+ ratios by the late harvest, whereascontrols displayed no significant differences. It iswell documented that S. alterniflora can exertconsiderable control over ion accumulation viaselective processes of ion exclusion and secretion(Smart and Barko, 1980), particularly in terms ofselective exclusion and secretion of Na+ over K+
(Bradley and Morris, 1991). Ion exclusion is be-lieved to be the predominant mechanism con-trolling ion accumulation in S. alterniflora, andmay account for excluding greater than 90% ofthe theoretical maximum ion uptake that wouldresult from transpiration and growth (Bradleyand Morris, 1991). Furthermore, salt glands in theleaves of S. alterniflora are capable of secretingapproximately half of the ions that are taken up,although this process may be less ion specific(Bradley and Morris, 1991). Since abovegroundbiomass in this study did not differ significantly
M.W. Hester et al. / En�ironmental and Experimental Botany 46 (2001) 277–297294
between populations, it would appear that popu-lation differences in exclusion and secretion path-ways are largely responsible for the observeddifferences in tissue ion concentrations, not differ-ences in growth rates which may affect tissueconcentrations via ion dilution effects (Yeo et al.,1990).
Population differences in S. alterniflora leafCa2+ and Mg2+ concentrations were also ob-served in the early harvest (data not shown), butit is unclear whether the magnitude of these differ-ences in Ca2+ concentration would confer a salttolerance advantage via maintenance of plasmamembrane integrity (Blits and Gallagher,1990a,b), which has been suggested to be requiredfor functional K+/Na+ selectivity (Epstein, 1961;Lauchli and Epstein, 1970; Cramer et al., 1985).
Sublethal salinity levels resulted in elevated leafproline concentrations in all three species. How-ever, it is interesting to note that P. hemitomonleaf proline concentrations were most elevated inthe least salt-tolerant populations. Factor analysisconfirmed this pattern of proline accumulation inP. hemitomon. Although this confirms that popu-lations identified as least salt-tolerant were proba-bly experiencing earlier and more severe salt-stressthan the most salt-tolerant populations, it alsoindicates that care needs to be exercised in inter-preting proline concentrations in salinity screen-ing trials. This is because in plant breedingprograms it is often assumed that those popula-tions (or genotypes) that accumulate the greatestconcentrations of proline should be the most salttolerant because of proline’s osmotic and protec-tive functions (Shinozaki and Yamaguchi-Shinozaki, 1999). Proline accumulation under saltstress appears to not be the result of prolinesynthesis, but rather the result of the inhibition ofproline dehydrogenase (Rayapati and Stewart,1991; Peng and Verma, 1996). Although prolineaccumulation under salinity stress is certainly de-sirable, our results indicate that excessive accumu-lation of proline by P. hemitomon may beindicative of greater salinity stress, not tolerance,because proline generally accumulates to signifi-cant levels only after a certain threshold of salin-ity or water stress is exceeded (Cavalieri andHuang, 1979; Cavalieri, 1983; Hester et al., 1994).
Some of the variation between populations ofknown similar lethal salinity tolerance may be dueto different mechanisms of salt tolerance operat-ing at different intensities (Yeo et al., 1990).
Increases in sucrose concentration and othersoluble sugars under salinity stress have beenreported in glycophytes and halophytes (Green-way and Munns, 1980; Briens and Larher, 1982;Flowers, 1985; Binzel et al., 1987; Cheeseman,1988). All species displayed increased leaf sucroselevels with sublethal salinity stress, but not in amanner related to known salinity tolerance. Al-though the soluble sugar levels in this study weregenerally less than reported by Briens and Larher(1982), our results are consistent with their findingthat sucrose was the predominant soluble sugar inthe many halophytic species they investigated, andthat glucose accumulated to only a very limitedextent in halophytes (data not shown). Althoughnot statistically significant, in this study it ap-peared that there was a tendency for the mostsalt-tolerant populations of S. patens to displaylower sucrose levels under salt stress than the leastsalt-tolerant populations (P=0.11), as well asexhibit less of an increase in sucrose accumulationabove controls upon exposure to sublethal salinitylevels.
In summary, this research has elucidated im-portant similarities and differences in the mecha-nisms of salinity stress resistance in P. hemitomon,S. patens and S. alterniflora. Relative salt toler-ance of populations within each of these specieshad been previously determined based on weeklystepwise increases in salinity (salinity challenges).This study utilized constant, sublethal, salinitystresses for a duration of 1–5 weeks, during whichphysiological and growth responses were deter-mined. From these results we can infer both gen-eral and species-specific indicators of salinitystress resistance.
General indicators of salinity stress resistance(regardless of species) include high net CO2 assim-ilation rates and water use efficiencies, and lowratios of root-to-shoot and dead:total above-ground biomass. Of these variables, net CO2 as-similation (especially after 1 week of salinityexposure) and the proportion of dead above-ground biomass both show promise for future
M.W. Hester et al. / En�ironmental and Experimental Botany 46 (2001) 277–297 295
salinity screening trials in all of these species.Factor analysis consistently revealed a positiveassociation of water use efficiency and salt toler-ance that was not always detected with univariateanalyses. Factor analyses and a-priori linear con-trasts revealed some unique differences betweenspecies in terms of the relative importance ofmorphology and physiology in explaining in-traspecific variation in salinity stress resistance.Plant morphology (size attributes) were stronglyassociated with salinity stress resistance in P.hemitomon, weakly associated with salinity stressresistance in S. patens, and not associated withsalinity stress resistance in S. alterniflora. Uponexposure to salinity stress, the most salt-tolerantpopulations of both S. patens and S. alternifloradisplayed the most elevated leaf proline concen-trations, whereas in P. hemitomon the least salt-tolerant populations displayed the greatest prolineaccumulation. The most salt-tolerant populationsof S. alterniflora accumulated significantly greateramounts of glycine betaine (after 1 week) anddisplayed the greatest control of ion selectivity(lower leaf Na+/K+ ratios), which was not dis-played by the other two species. These resultssuggest that plant size attributes can be veryimportant in explaining population differences insalinity stress resistance in glycophytes, but maybe independent of salinity stress resistance inhalophytes, which have specialized physiological(and/or anatomical) adaptations that can confersalinity stress resistance through mechanisms suchas selective ion exclusion or secretion.
Together, these findings increase our under-standing of the mechanisms of salinity stress resis-tance in these species, as well as provide somepotentially useful indicators (or markers) of salin-ity tolerance for identifying superior plantingstock of these species that may be utilized formarsh rehabilitation (restoration and creation)projects. However, we recommend that sufficientgenetic variability always be incorporated into thedesign of marsh rehabilitation projects to increasethe potential for adaptation to environmental het-erogeneity, as well as to reduce the potential forlarge-scale loss should certain genotypes be moresusceptible to pests, pathogens, or changing envi-ronmental conditions.
Acknowledgements
We thank the Louisiana Board of Regents Lou-isiana Education Quality support Fund (LEQSF119093)-RD-B-04 for funding this research, MikeMatherne and the NRCS (Natural ResourcesConservation Service) for providing some of theplant populations utilized in this study, and JamesB. Grace and E. Barry Moser for providing help-ful comments and statistical advice. We gratefullyacknowledge the following individuals for provid-ing laboratory and field assistance: Robert Gam-brell, Tom Oswald, Jay Woodring, Brian Wilsey,Joseph Wagner, Karla Coreil, Mohan Davuluri,Radhika Mandava, Shanti Surapaneni, and Bal-akrishna ‘Shameer’ Pendyal.
References
Anderson, C.E., 1974. A review of structure in several NorthCarolina salt marsh plants. In: Reimold, R.J., Queens,W.H. (Eds.), Ecology of Halophytes. Academic Press, NewYork, NY, pp. 307–344.
Bertness, M.D., 1991. Interspecific interactions among highmarsh perennials in a New England salt marsh. Ecology72, 125–137.
Bidwell, J.P., Spotte, S., 1985. Artificial Seawaters. Jones andBartlett, Boston, MA.
Binzel, M.L., Hasegawa, P.M., Rhodes, D., Handa, S.,Handa, A.K., Bressan, R.A., 1987. Solute accumulation intobacco cells adapted to NaCl. Plant Physiol. 84, 1408–1415.
Blits, K.C., Gallagher, J.L., 1990a. Salinity tolerance of Kos-teletzkya �irginica. I. Shoot growth, ion and water rela-tions. Plant Cell Environ. 13, 419–425.
Blits, K.C., Gallagher, J.L., 1990b. Salinity tolerance of Kos-teletzkya �irginica. II. Root growth, lipid content, ion andwater relations. Plant Cell Environ. 13, 419–425.
Blum, A.B., 1988. Plant Breeding for Stress Environments.CRC Press, Boca Raton, FL.
Bradley, P.M., Morris, J.T., 1991. Relative importance of ionexclusion, secretion and accumulation in Spartina al-terniflora Loisel. J. Exp. Bot. 42, 1525–1532.
Briens, M., Larher, F., 1982. Osmoregulation on halophytichigher plants: a comparative study of soluble carbohy-drates, polyols, betaines and free proline. Plant Cell Envi-ron. 5, 287–292.
Cain, D.J., Harvey, H.T., 1983. Evidence of salinity-inducedecophenic variation in cordgrass (Spartina foliosa Trin.).Madrono 30, 50–62.
Cavalieri, A.J., 1983. Proline and glycine betaine accumulationby Spartina alterniflora Loisel in response to NaCl andnitrogen in a controlled environment. Oecologia 57, 20–24.

M.W. Hester et al. / En�ironmental and Experimental Botany 46 (2001) 277–297296
Cavalieri, A.J., Huang, A.C., 1979. Evaluation of prolineaccumulation in the adaptation of diverse species of marshhalophytes to the saline environment. Am. J. Bot. 66,307–312.
Cavalieri, A.J., Huang, A.C., 1981. Accumulation of prolineand glycine betaine in Spartina alterniflora Loisel in re-sponse to NaCl and nitrogen in the marsh. Oecologia 49,224–228.
Chabreck, R.H., 1972. Vegetation, Water and Soil Character-istics of the Louisiana Coastal Region, Louisiana Agricul-tural Experiment Station Bulletin no. 664.
Cheeseman, J.M., 1988. Mechanisms of salinity tolerance inplants. Plant Physiol. 87, 547–550.
Cramer, G.R., Lauchli, A., Polito, V.S., 1985. Displacement ofCa2+ by Na+ from the plasmalemma of root cells. Aprimary response to salt stress? Plant Physiol. 79, 207–211.
Day, J.W., Hall, C.A.S., Kemp, W.M., Yanez-Arancibia, A.,1989. Estuarine Ecology. Wiley, New York, NY.
Duncan, W.H., Duncan, M.B., 1987. Seaside Plants. Smithso-nian Institution Press, Washington, DC.
Eleuterius, L.N., 1989. Natural selection and genetic adapta-tion to hypersalinity in Juncus roemerianus Scheele. Aquat.Bot. 36, 45–53.
Eleuterius, L.N., 1990. Tidal Marsh Plants. Pelican, Gretna,LA.
Epstein, E., 1961. The essential role of calcium in selectivecation transport by plant cells. Plant Physiol. 36, 437–444.
Fitter, A.H., Hay, R.K.M., 1987. Environmental Physiologyof Plants. Academic Press, San Diego, CA.
Flowers, T.J., 1985. Physiology of halophytes. Plant Soil 89,41–56.
Flowers, T.J., Troke, P.F., Yeo, A.R., 1977. The mechanismof salt tolerance in halophytes. Annu. Rev. Plant Physiol.28, 89–121.
Godfrey, R.K., Wooten, J.W., 1979. Aquatic and WetlandPlants of the Southeastern United States. The University ofGeorgia Press, Athens, GA.
Gorham, J., 1984. Separation of plant betaines and theirsulphur analogues by cation-exchange high-performanceliquid chromatography. J. Chromatogr. 287, 345–351.
Gorham, J., Wyn Jones, R.G., McDonnell, E., 1985. Somemechanisms of salt tolerance in crop plants. Plant Soil 89,15–40.
Greenway, H., Munns, R., 1980. Mechanisms of salt tolerancein non-halophytes. Annu. Rev. Plant Physiol. 31, 149–190.
Griffiths, H., 1993. Carbon isotope discrimination. In: Hall,D.O., Scurlock, J.M.O., Bolhar-Nordenkampf, H.R., Lee-good, R.C., Long, S.P. (Eds.), Photosynthesis and Produc-tion in a Changing Environment. Chapman and Hall, NewYork, NY, pp. 181–192.
Herold, A., 1980. Regulation of photosynthesis by sink activ-ity— the missing link. New Phytol. 86, 131–144.
Hester, M.W., 1995. Intraspecific variation in salt tolerance inPanicum hemitomon, Spartina patens, and Spartina al-terniflora : Population differentiation and investigation ofunderlying factors. PhD dissertation, Louisiana State Uni-versity, Baton Rouge, LA.
Hester, M.W., Mendelssohn, I.A., 1990. Effects of macronutri-ent and micronutrient additions on photosynthesis, growthparameters, and leaf nutrient concentrations of Uniolapaniculata and Panicum amarum. Bot. Gaz. 151, 21–29.
Hester, M.W., McKee, K.L., Burdick, D.M., Koch, M.S.,Flynn, K.M., Patterson, S., Mendelssohn, I.A., 1994.Clonal integration in Spartina patens across a nitrogen andsalinity gradient. Can. J. Bot. 72, 767–770.
Hester, M.W., Mendelssohn, I.A., McKee, K.L., 1996. In-traspecific variation in salt tolerance and morphology inthe coastal grass Spartina patens. Am. J. Bot. 83, 1521–1527.
Hester, M.W., Mendelssohn, I.A., McKee, K.L., 1998. In-traspecific variation in salt tolerance and morphology inPanicum hemitomon and Spartina alterniflora. Int. J. PlantSci. 159, 127–138.
D.R. Hoagland, D.I. Arnon, 1950. The Water-culture Methodfor Growing Plants Without Soil. California AgriculturalExperiment Station Circular 347.
Johnson, R.A., Wichern, D.W., 1988. Applied MultivariateStatistical Analysis. Prentice-Hall, Englewood Cliffs, NJ.
Koch, M.S., Mendelssohn, I.A., McKee, K.L., 1990. Mecha-nism for hydrogen sulfide-induced growth limitation inwetland macrophytes. Limnol. Oceanogr. 35, 399–408.
Lauchli, A., Epstein, E., 1970. Transport of potassium andrubidium in plant roots: the significance of calcium. PlantPhysiol. 45, 639–641.
Longstreth, D.J., Nobel, P.S., 1979. Salinity effects on leafanatomy. Consequences for photosynthesis. Plant Physiol.63, 700–703.
Longstreth, D.J., Strain, B.R., 1977. Effects of salinity andillumination on photosynthesis of Spartina alterniflora. Oe-cologia 31, 191–199.
Longstreth, D.J., Bolanos, J.A., Smith, J.E., 1984. Salinityeffects on photosynthesis and growth in Alternantheraphiloxeroides. Plant Physiol. 75, 1044–1047.
McKee, K.L., Mendelssohn, I.A., 1989. Response of a fresh-water marsh plant community to increased salinity andincreased water level. Aquat. Bot. 34, 301–316.
Mitch, W.J., Gosselink, J.G., 1993. Wetlands, 2nd ed. VanNostrand Reinhold, New York, NY.
Mobberly, D.G., 1956. Taxonomy and distribution of thegenus Spartina. Iowa State Coll. J. Sci. 30, 471–574.
Munns, R., 1993. Physiological processes limiting plantgrowth in saline soils: some dogmas and hypotheses. PlantCell Environ. 16, 15–24.
Munns, R., Termaat, A., 1986. Whole-plant responses tosalinity. Aust. J. Plant Physiol. 13, 143–160.
Nestler, J., 1977. Interstitial salinity as a cause of ecophenicvariation in Spartina alterniflora. Estuar. Coast. Mar. Sci.5, 707–714.
Paleg, L.G., Stewart, G.R., Starr, R., 1985. The effect ofcompatible solutes on proteins. Plant Soil 89, 83–94.
Peng, Z., Verma, D.P.S., 1996. Reciprocal regulation ofdelta1-Pyrroline-5-carboxylate synthetase and proline de-hydrogenase genes control proline levels during and afterosmotic stress in plants. Mol. Gen. Genet. 253, 334–341.
M.W. Hester et al. / En�ironmental and Experimental Botany 46 (2001) 277–297 297
Percy, R.W., Ustin, S.L., 1984. Effects of salinity on growthand photosynthesis of three California tidal marsh species.Oecologia 62, 68–73.
Pezeshki, S.R., 1991. Population differentiation in Spartinapatens : gas-exchange responses to salinity. Mar. Ecol.:Prog. Ser. 72, 125–130.
Pezeshki, S.R., DeLaune, R.D., 1991. Ecophenic variations inwiregrass (Spartina patens). J. Aquat. Plant Manage. 29,99–102.
Pezeshki, S.R., DeLaune, R.D., 1995. Variation in response oftwo US Gulf Coast populations of Spartina alterniflora tohypersalinity. J. Coast. Res. 11, 89–95.
Pezeshki, S.R., DeLaune, R.D., Patrick, W.H. Jr., 1987. Re-sponse of the freshwater marsh species, Panicum hemito-mon Schult, to increased salinity. Freshw. Biol. 17,195–200.
Picha, D.H., 1985. HPLC determination of sugars in raw andbaked sweet potatoes. J. Food Sci. 50, 1189–1190 (see alsop. 1210.).
Pomeroy, L.R., Wiegert, R.G., 1981. The Ecology of a SaltMarsh. Springer, New York, NY.
Rawson, H.M., Richards, R.A., Munns, R., 1988. An exami-nation of selection criteria for salt tolerance in wheat,barley and triticale genotypes. Aust. J. Agric. Res. 39,759–772.
Rayapati, P.J., Stewart, C.R., 1991. Solubilization of prolinedehydrogenase from maize mitochondria. Plant Physiol.95, 787–791.
Sacher, R.F., Staples, R.C., Robinson, R.W., 1982. Salinetolerance in hybrids of Lycopersicon esculentum x Solanumpenellii and selected breeding lines. In: San Pietro, A. (Ed.),Biosaline Research: a Look to the Future. Plenum Press,New York, NY, pp. 325–336.
SAS Institute, Inc., 1989. SAS/STAT user’s guide, version 6.SAS Institute, Inc., Cary, NC, USA.
Scholander, P.F., Hammel, H.T., Bradstreet, E.D., Hem-mingsen, E.A., 1965. Sap pressure in vascular plants. Sci-ence 148, 339–346.
Seemann, J.R., Critchley, C., 1985. Effects of salt stress on thegrowth, ion content, stomatal behavior and photosyntheticcapacity of a salt-sensitive species, Phaseolus �ulgaris L.Planta 164, 151–162.
Shea, M.L., Warren, R.S., Niering, W.A., 1975. Biochemicaland transplantation studies of the growth form of Spartinaalterniflora on Connecticut salt marshes. Ecology 56, 461–466.
Shinozaki, K., Yamaguchi-Shinozaki, K., 1999. MolecularResponses to Cold Drought, Heat and Salt Stress inHigher Plants. R.G. Landes Company, Austin, TX.
Shumway, S.W., Bertness, M.D., 1994. Patch size effects onmarsh plant secondary succession mechanisms. Ecology 75,564–568.
Silander, J.A., 1979. Microevolution and clone structure inSpartina patens. Science 203, 658–660.
Silander, J.A., Antonovics, J., 1979. The genetic basis of theecological amplitude of Spartina patens. I. Morphometricand physiological traits. Evolution 33, 1114–1127.
Smart, R.M., Barko, J.W., 1980. Nitrogen and salinity toler-ance of Distichlis spicata and Spartina alterniflora. Ecology61, 630–638.
Smirnoff, N., Cumbes, Q.J., 1989. Hydroxyl radical scaveng-ing activity of compatible solutes. Phytochemistry 28,1057–1060.
Steel, R.G.D., Torrie, J.H., 1980. Principles and Procedures ofStatistics. McGraw-Hill, New York, NY.
Storey, R., Wyn Jones, R.G., 1978. Salt stress and compara-tive physiology in Gramineae. III. Effect of salinity uponion relations and glycine betaine and proline levels inSpartina x townsendii. Aust. J. Plant Physiol. 5, 831–838.
SYSTAT, 1998. SYSTAT Statistics, version 8.0. SPSS Inc.,Chicago, IL, USA.
von Caemmerer, S., Farquhar, G.D., 1981. Some relationshipsbetween the biochemistry of photosynthesis and the gasexchange of leaves. Planta 153, 376–387.
Yeo, A.R., 1983. Salinity resistance: physiologies and prices.Physiol. Plant. 58, 214–222.
Yeo, A.R., Yeo, M.E., Flowers, S.A., Flowers, T.J., 1990.Screening of rice (Oryza sati�a L) genotypes for physiolog-ical characters contributing to salinity resistance, and theirrelationship to overall performance. Theor. Appl. Genet.79, 377–384.