The Competitive Response of Panicum virgatum Cultivars to Non-Native Invasive Species
48
The Competitive Response of Panicum virgatum Cultivars to Non-Native Invasive Species In Partial Fulfillment of Master’s Degree in Plant Biology Lauren Schwartz 26 October 2011
Transcript of The Competitive Response of Panicum virgatum Cultivars to Non-Native Invasive Species

The Competitive Response of Panicum virgatum Cultivars to Non-Native Invasive Species
In Partial Fulfillment of Master’s Degree in Plant Biology
Lauren Schwartz26 October 2011

Acknowledgements • Committee Members:
– Dr. David Gibson (Advisor)– Dr. Sara Baer– Dr. Andrew Wood
• The Gibsonites

Overview
• Background• Research Questions
– Competitive Response of Cultivars to Invasive Species
– Mixture vs Monoculture– Trigonelline
• Synthesis• Restoration Implications
Tallgrass Prairie (TGP)• Historically was largest ecosystem in North America
• Suffered largest reduction of any grassland
• C4 grasses primarily• Three historical main factors:- fire- ungulate grazing
- climate• Invasive species
* Knapp et al., 1999

Panicum virgatum L.• Perennial• C4 grass• Grows up to 3m tall• Uses: forage, hay, soil erosion, wildlife habitat, biofuel
• Prairie dominant, especially in lowland areas
• Many ecotypes & cultivars
* Parrish and Fike 2005

Cultivars• McMillan 1959
– Ecotypes over climate gradient
• Variable species
• Upland vs. Lowland
• Ploidy levels vary

Invasive Species• 90% of invaders = C3 grasses
• Top 10 invaders in TGP are C3
• Problems: – alter soil chemistry – increase soil erosion– reduce forage quality and wildlife populations
– fragment plant populations– decrease native diversity
* Hobbs et al., 1992

Competition• Interspecific vs.Intraspecific
• Mediated through resource availability
• Competitive response vs. effect

Invasive Species
Bromus inermis(Smooth Brome)
Poa pratensis(Kentucky Bluegrass)
Schedonorus phoenix(Tall Fescue)

Invasive SpeciesInvasive Species Native to Introduced
Kentucky Bluegrass Europe and N. Asia Unknown
Smooth Brome Europe and Asia 1884
Tall Fescue Europe and Africa Late 1880’s

ObjectiveTo determine whether native Switchgrass (Panicum virgatum) cultivars would grow and
establish differently in the presence of non-native invasive species and how the upland and
lowland cultivars differ ecologically.

Preliminary Experiment
• Which cultivars to study?
• Seeding rates

Preliminary Experiment: Total Number of Seeds Germinated: Switchgrass cultivars
• Lowland cultivars had low germination rates (< 20 seeds)
• Cave in Rock and Blackwell had highest germination rates (> 60 seeds)

Preliminary Experiment: Total Percent of Viable Seed: Switchgrass cultivars
Cave in Rock Blackwell Nebraska 28 Pathfinder Shelter Trailblazer Alamo Kanlow0
10
20
30
40
50
60
70
80
90
Cultivar
Tota
l Pe
rcen
t of
Viabl
e Se
eds
• Lowland cultivars had very low total viable seeds (> sown seeds by x3)•Upland cultivars sown rates stay the same

Preliminary Experiment: Total Number of Seeds Germinated: Non-Native Invasive Species
1 3 5 7 9 11 13 15 17 19 21 23 25 27 290
20
40
60
80
100
120
140
Kentucky BluegrassSmooth BromeTall Fescue
Time (days)
Total Germinated Seeds
• Smooth Brome had only 1 seed germinate (increase sown seeds)• Tall Fescue germinated very well (reduce sown seeds)

Switchgrass Cultivars
* Elberson et al., 2001 and McLaughlin et al., 1999
Cultivar Lowland/Upland
Location Use
Alamo Lowland Texas Rust resistant
Kanlow Lowland Oklahoma (Central)
Soil erosion
Blackwell Upland Oklahoma (Northern)
Wildlife
Cave in Rock Upland Illinois (Southern)
Forage
Trailblazer Upland Kansas Forage

Study QuestionsQ1: What is the competitive response of Switchgrass cultivars to non-native invasive species?
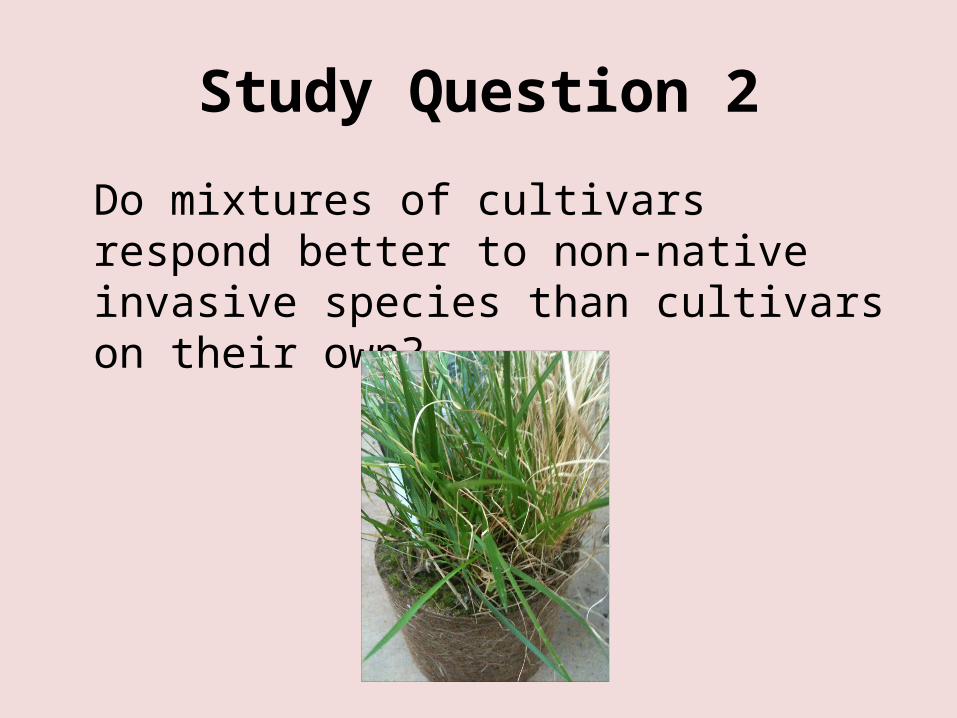
Q2: Do mixtures of cultivars respond better to non-native invasive species than cultivars on their own?
Q3: Can a signal of soil moisture stress be identified using a molecular marker, and, if so, how might that differ among lowland and upland Switchgrass cultivars?

Methods: Two Greenhouse Experiments
• Short vs. long effects
• Outcome of competition
• Statistical Analysis:– Mixed model repeated measures analysis

Methods: Greenhouse Experiment 1
• Simple pair-wise (SP) design (1:1 ratio)
• 5 cultivars and mixture (n=6)• Sown as monoculture or with one invasive (n=3)
• High moisture vs. low moisture• 15cm x 15cm pots• 20 seeds of cultivar/20 seeds of invasive • Thinned down to 10 cultivar/ 10 invasive seeds

Methods: Greenhouse Experiment 2
• Simple pair-wise (SP) design (1:1 ratio)
• 5 cultivars (n=5)• Transplanted as monoculture or with one invasive (n=3)
• High moisture vs. low moisture• 2.5 cm x 16cm cone-tainers• Seedlings transplanted to cone-tainers• 1 seed of cultivar/1 seed of invasive

Experimental Measurements
Response Variables:• Height• Number of leaves• Vegetative tiller density• Reproductive tiller density• BiomassResources:• Soil moisture• Light intensity• Soil pH• Soil EC

Study Question 1 What is the competitive response of Switchgrass cultivars to non-native invasive species? Do cultivars respond differently to non-native invasive species?

Results: Under low moisture, Switchgrass has more leaves when growing with Smooth Brome than when growing alone
(GH1).
Invasive S pecies
C ontrol
K entu
cky B lueg
rass
S moot
h Brom
e
Tall F
escue
Num
ber o
f Lea
ves
0
1
2
3
H igh M oistureLow M oisture
F 3,83.5=2.54 , P =0.0617
BA B A B A B A
A BA B
A B
• Response of cultivars to invasive spp. under moisture treatments

Results: Mean height of Switchgrass cultivars in response to moisture treatment (GH2).
• Upland cultivars grew taller than the lowland cultivars in both low and high moisture treatments (except for Blackwell under low moisture).
CultivarAlam o Kanlow Blackwell Cave in Rock Trailblazer
Heigh
t (cm
)
0
2
4
6
8
10
12
14
16
18High M oisture Low M oisture
F4,79= 3.55 , P = 0.0102
AA
AA
A
BBABB
B
L

Results: Mean total above ground biomass in response to Switchgrass cultivars (GH2).
• Lowland cultivars > Upland cultivars
Cultivars
Biom
ass (g)
0.00
0.02
0.04
0.06
0.08F4,80=2.54 , P=.0460
AA
BB
B
L

Results: Mean total above ground biomass in response to invasive species (GH1).
• Lowest above ground biomass in the presence of Smooth Brome.
Invasive Species
Biom
ass (g)
0.00
0.02
0.04
0.06
0.08A
B
C
B
F3,80=7.88 , P=0.0001

Results: Mean total below ground biomass in response to the invasive species (GH1).
• Smooth Brome: highest below ground biomass.
Invasive Species
Biom
ass (
g)
0.0
0.1
0.2
0.3
0.4
0.5
0.6
A
B
BB
F3,78= 51.57 , P <0.0001

Discussion: Cultivar Response to Invasive Species
• There was little response of the cultivars to the invasive species
• Smooth Brome affected the cultivars the most
• Number of leaves of the lowland cultivars were affected by the presence of the invasive species
• Height was affected by the soil moisture treatment
Study Question 2Do mixtures of cultivars respond better to non-native invasive species than cultivars on their own?

Cultivar Mixture• Increases diversity
• Could increase competitive response
• May increase ability to compete against invasive species

Results: Mean Switchgrass height between cultivars and with invasive species (GH1).
• Kanlow and Mix: reduced height in presence of invasive species on day 39
Day 39
CultivarAlam o Kanlow BlackwellCave in RockTrailblazer M ix
Heigh
t (cm
)
0
10
20
30
40ControlKentucky BluegrassSm ooth Brom eTall Fescue
F15,78.9=2.16 , P=0.0150
BB B
A
ABBCC
AB
BB
AAA AA
BB
AB
A AA
A
L

Results: Mean total above ground biomass in response to Switchgrass cultivars (GH1).
• The mixture of cultivars had a similar above ground biomass when compared to the monocultures (except Cave in Rock).
CultivarAlam o Kanlow BlackwellCave in RockTrailblazer M ix
Biom
ass (
g)
0.0
0.5
1.0
1.5
2.0
2.5
3.0
3.5F5,94.1=3.05 , P=0.0135 A
AA
B
ABAB
L

CultivarAlam o Kanlow BlackwellCave in RockTrailblazer M ix
Mean So
il Conducutivity (µ
mho/cm
)
80
81
82
83
84
85F5,94=9.02 , P<0.0001
ABAAB
A
B
B
Results: Mean soil electrical conductivity (EC) in response to the Switchgrass cultivars (GH1).
• Mix is intermediate. Lowland cultivars have the lowest EC; whereas the upland cultivars have the highest EC.
L

Results: Mean soil pH in response to Switchgrass cultivars grown with one of the three invasive
species or alone (control) (GH1).
• Soil pH is highest in the cultivar mixture when sown with Tall Fescue when compared with the other invasive species.
CultivarAlam o Kanlow BlackwellCave in RockTrailblazer M ix
Mea
n pH
0
2
4
6
8
ControlKentucky BluegrassSm ooth Brom eTall Fescue
F15, 96=2.78 , P=0.0013
C
AB B
BAB ABABB A B
AB AB B B
A ABB A
ABB B
L
Discussion: Mixture vs. Monoculture
• Mix had a similar biomass to the monocultures
• Mixture had an intermediate height when compared to monocultures
• Soil EC and soil pH was intermediate in mixture
• All invasive spp equally reduced the performance of the mixture
• Cultivar mixture responded similarly to the presence of the invasive species

Study Question 3Can a signal of soil moisture stress resulting from competition be identified using a molecular marker, and, if so, how might that differ among lowland and upland Switchgrass cultivars?

What is Trigonelline (TRG)?
• Molecular Marker
• Drought Stress
• Extensive studies of TRG done on Glycine max
• Highly concentrated in leaves and dry seeds
• Never been studied in grasses

Methods: Trigonelline• Ion Exchange Chromatography
• 10ml of methanol into glass vial with fresh plant material
• Leaves were removed after 24hrs
• Added 5ml chloroform and 6ml H2O to vial-sat at room temp for 3hrs
• Removed aqueous layer• Dried over night

Methods: Trigonelline• Place Dowex-1 column on top of clean vial and allow to drip through
• Aqueous layer redissolved into 1 ml of H2O and dripped through column
• Ran through spec absorbance 264nm for TRG

Results: Mean leaf TRG values in cultivars grown under high and low soil moisture levels
• Upland cultivars showed highest amount of TRG in low moisture.
• Lowland cultivars showed highest amount of TRG in high moisture.
CultivarAlam o Kanlow Blackwell Cave in Rock Trailblazer
Trigo
nellin
e (O
D 264gF
W-1 )
0.0
0.2
0.4
0.6
0.8
1.0
1.2
1.4HighLow
F4,80=12.50 , P<0.0001
A
B
CCC
CDD D DD
L

Results: Mean leaf TRG values in response to cultivars when grown with an invasive species.
• Lowland cultivars had lower amounts of TRG than upland cultivars
• Each upland cultivar had higher amounts of TRG with a different invasive species
CultivarAlam o Kanlow Blackwell Cave in Rock Trailblazer
Trigo
nellin
e (OD 2
64gFW
-1)
0.0
0.2
0.4
0.6
0.8
1.0
1.2Control Poa pratensisBromus inermisS chedonorus phoenix
F12,80=1.68 , P=0.0857
A
BB B
BCBC
CC
DD
DDDD
DD
DDD
D
L

Discussion: Trigonelline
• Upland cultivars showed higher amounts of TRG because they were more moisture stressed than the lowland cultivars under the low moisture treatment.
• Lowland cultivars were more moisture stressed under high moisture conditions than the upland cultivars.

Synthesis: Response Variables
• Smooth Brome affected cultivars the most
• Performance of Kanlow and Blackwell were differentially affected by invasive spp.
• Total above ground biomass and below ground biomass did not show an interaction with the invasive spp.
• Little advantage to having cultivar mixture
• Competitive response transitory

Synthesis: Resources• Soil moisture was lower in pots with lowland cultivars than upland cultivars
• Soil EC and pH differ among cultivars (only GH1)

Synthesis: Trigonelline• This study was the first to experimentally test for TRG in a dominant prairie grass.
• Detectable amounts were found in all cultivars.
• Upland cultivars showed higher amounts of TRG when grown in a low moisture environment (drought stressed).
• Lowland cultivars showed higher amounts of TRG in the high moisture treatment.

Restoration Implications
• Invasive species can affect Switchgrass cultivars in terms of response variables and resources.
• Cultivars showed early signs of allocating their resources to growth and not to competition.
• Once established resource allocation shifted towards competition.

Restoration Implications
Cultivar selection may act as a potential filter on community and ecosystem assembly– Depends on intraspecific variation in the dominant species
– Depends on the interspecific neighbors.

Questions?