Genome-wide association study of 14,000 cases of seven common diseases and 3,000 shared controls
10
ARTICLES Genome-wide association study of CNVs in 16,000 cases of eight common diseases and 3,000 shared controls The Wellcome Trust Case Control Consortium* Copy number variants (CNVs) account for a major proportion of human genetic polymorphism and have been predicted to have an important role in genetic susceptibility to common disease. To address this we undertook a large, direct genome-wide study of association between CNVs and eight common human diseases. Using a purpose-designed array we typed ,19,000 individuals into distinct copy-number classes at 3,432 polymorphic CNVs, including an estimated ,50% of all common CNVs larger than 500 base pairs. We identified several biological artefacts that lead to false-positive associations, including systematic CNV differences between DNAs derived from blood and cell lines. Association testing and follow-up replication analyses confirmed three loci where CNVs were associated with disease—IRGM for Crohn’s disease, HLA for Crohn’s disease, rheumatoid arthritis and type 1 diabetes, and TSPAN8 for type 2 diabetes—although in each case the locus had previously been identified in single nucleotide polymorphism (SNP)-based studies, reflecting our observation that most common CNVs that are well-typed on our array are well tagged by SNPs and so have been indirectly explored through SNP studies. We conclude that common CNVs that can be typed on existing platforms are unlikely to contribute greatly to the genetic basis of common human diseases. Genome-wide association studies (GWAS) have been extremely suc- cessful in associating SNPs with susceptibility to common diseases, but published SNP associations account for only a fraction of the genetic component of most common diseases, and there has been considerable speculation about where the ‘missing heritability’ 1 might lie. Chromosomal rearrangements can cause particular rare diseases and syndromes 2 , and recent reports have suggested a role for rare CNVs, either individually or in aggregate, in susceptibility for a range of common diseases, notably neurodevelopmental diseases 3–6 . So far, there have been relatively few reported associations between common diseases and common CNVs (see for example refs 7–11), which might simply reflect incomplete catalogues of common CNVs or the lack of reliable assays for their large-scale typing. Here we report the results of our direct association study, identify the popu- lation properties of the set of CNVs studied, describe novel analytical methods to facilitate robust analyses of CNV data, and document artefacts that can afflict CNV studies. We designed an array to measure copy number for the majority of a recently compiled inventory of CNVs from an extensive discovery experiment 12 , and several other sources. We then used the array to type 3,000 common controls and 2,000 cases of each of the diseases: bipolar disorder, breast cancer, coronary artery disease, Crohn’s disease, hyper- tension, rheumatoid arthritis, type 1 diabetes and type 2 diabetes. These eight diseases make a major impact on public ill health 13 , cover a range of aetiologies and genetic predispositions, and have been extensively studied via SNP-based GWAS, including our earlier Wellcome Trust Case Control Consortium (WTCCC) study 14 . Pilot experiment, array content, assay and samples Pilot experiment. We undertook a pilot experiment to compare three different platforms for assaying CNVs and to assess the merits of different experimental design parameters (see Supplementary Information for full details). On the basis of the pilot data, we chose the Agilent Comparative Genomic Hybridization (CGH) platform, and aimed to target each CNV with ten distinct probes, although in the analyses below we include any CNV targeted by at least one probe (Supplementary Fig. 9). Our analysis of the pilot CGH data indicated that the quality of the copy number signal for genotyping (rather than for discovery) at a CNV is reduced when the reference sample is homozygous deleted, in effect because the reference channel then just measures noise. To minimize this effect we used a fixed pool of DNAs as the reference sample throughout our main experiment. Array content. Informed by our pilot experiment, we designed the CNV-typing array in a collaboration with the Genome Structural Variation Consortium (GSV) in which a preliminary set of candidate CNVs was shared at an early stage with the WTCCC. Table 1 sum- marizes the design content of the array, and Fig. 1 illustrates the various categories of designed loci unsuitable for association analysis. (See Methods for further details.) Assay. In brief (see Supplementary Information for further details), the Agilent assay differentially labels parallel aliquots of the test sample and reference DNA (a pool of genomic UK lymphoblastoid cell-line DNAs from nine males and one female prepared in a single batch for all experiments) and then combines them, hybridizes to the array, washes and scans. Intensity measurements for the two different labels are made at each probe separately for the test and reference DNA. These act as surrogates for the amount of DNA present, with analyses typically relying on the ratio of test to reference intensity measure- ments at each probe. Samples. A total of 19,050 case-control samples were sent for assay- ing: ,2,000 for each of the eight diseases and ,3,000 common con- trols (these were equally split between the 1958 British Birth Cohort *Lists of authors and their affiliations appear at the end of the paper. Vol 464 | 1 April 2010 | doi:10.1038/nature08979 713 Macmillan Publishers Limited. All rights reserved ©2010
-
Upload
independent -
Category
Documents
-
view
2 -
download
0
Transcript of Genome-wide association study of 14,000 cases of seven common diseases and 3,000 shared controls
ARTICLES
Genome-wide association study of CNVs in16,000 cases of eight common diseasesand 3,000 shared controlsThe Wellcome Trust Case Control Consortium*
Copy number variants (CNVs) account for a major proportion of human genetic polymorphism and have been predicted tohave an important role in genetic susceptibility to common disease. To address this we undertook a large, directgenome-wide study of association between CNVs and eight common human diseases. Using a purpose-designed array wetyped ,19,000 individuals into distinct copy-number classes at 3,432 polymorphic CNVs, including an estimated ,50% ofall common CNVs larger than 500 base pairs. We identified several biological artefacts that lead to false-positiveassociations, including systematic CNV differences between DNAs derived from blood and cell lines. Association testing andfollow-up replication analyses confirmed three loci where CNVs were associated with disease—IRGM for Crohn’s disease,HLA for Crohn’s disease, rheumatoid arthritis and type 1 diabetes, and TSPAN8 for type 2 diabetes—although in each casethe locus had previously been identified in single nucleotide polymorphism (SNP)-based studies, reflecting our observationthat most common CNVs that are well-typed on our array are well tagged by SNPs and so have been indirectly exploredthrough SNP studies. We conclude that common CNVs that can be typed on existing platforms are unlikely to contributegreatly to the genetic basis of common human diseases.
Genome-wide association studies (GWAS) have been extremely suc-cessful in associating SNPs with susceptibility to common diseases,but published SNP associations account for only a fraction of thegenetic component of most common diseases, and there has beenconsiderable speculation about where the ‘missing heritability’1
might lie. Chromosomal rearrangements can cause particular rarediseases and syndromes2, and recent reports have suggested a role forrare CNVs, either individually or in aggregate, in susceptibility for arange of common diseases, notably neurodevelopmental diseases3–6.So far, there have been relatively few reported associations betweencommon diseases and common CNVs (see for example refs 7–11),which might simply reflect incomplete catalogues of common CNVsor the lack of reliable assays for their large-scale typing. Here wereport the results of our direct association study, identify the popu-lation properties of the set of CNVs studied, describe novel analyticalmethods to facilitate robust analyses of CNV data, and documentartefacts that can afflict CNV studies.
We designed an array to measure copy number for the majority of arecently compiled inventory of CNVs from an extensive discoveryexperiment12, and several other sources. We then used the array to type3,000 common controls and 2,000 cases of each of the diseases: bipolardisorder, breast cancer, coronary artery disease, Crohn’s disease, hyper-tension, rheumatoid arthritis, type 1 diabetes and type 2 diabetes. Theseeight diseases make a major impact on public ill health13, cover a rangeof aetiologies and genetic predispositions, and have been extensivelystudied via SNP-based GWAS, including our earlier Wellcome TrustCase Control Consortium (WTCCC) study14.
Pilot experiment, array content, assay and samplesPilot experiment. We undertook a pilot experiment to comparethree different platforms for assaying CNVs and to assess the merits
of different experimental design parameters (see SupplementaryInformation for full details). On the basis of the pilot data, we chosethe Agilent Comparative Genomic Hybridization (CGH) platform,and aimed to target each CNV with ten distinct probes, although inthe analyses below we include any CNV targeted by at least one probe(Supplementary Fig. 9). Our analysis of the pilot CGH data indicatedthat the quality of the copy number signal for genotyping (rather thanfor discovery) at a CNV is reduced when the reference sample ishomozygous deleted, in effect because the reference channel then justmeasures noise. To minimize this effect we used a fixed pool of DNAsas the reference sample throughout our main experiment.Array content. Informed by our pilot experiment, we designed theCNV-typing array in a collaboration with the Genome StructuralVariation Consortium (GSV) in which a preliminary set of candidateCNVs was shared at an early stage with the WTCCC. Table 1 sum-marizes the design content of the array, and Fig. 1 illustrates thevarious categories of designed loci unsuitable for association analysis.(See Methods for further details.)Assay. In brief (see Supplementary Information for further details),the Agilent assay differentially labels parallel aliquots of the test sampleand reference DNA (a pool of genomic UK lymphoblastoid cell-lineDNAs from nine males and one female prepared in a single batch forall experiments) and then combines them, hybridizes to the array,washes and scans. Intensity measurements for the two different labelsare made at each probe separately for the test and reference DNA.These act as surrogates for the amount of DNA present, with analysestypically relying on the ratio of test to reference intensity measure-ments at each probe.Samples. A total of 19,050 case-control samples were sent for assay-ing: ,2,000 for each of the eight diseases and ,3,000 common con-trols (these were equally split between the 1958 British Birth Cohort
*Lists of authors and their affiliations appear at the end of the paper.
Vol 464 | 1 April 2010 | doi:10.1038/nature08979
713Macmillan Publishers Limited. All rights reserved©2010
(58C) and the UK Blood Services (UKBS) controls). These wereaugmented by 270 HapMap1 samples (see ref. 12 for additional ana-lyses of the HapMap data) and 610 duplicate samples for qualitycontrol purposes. About 80% of samples from the WTCCC SNPGWAS were used here. (See Supplementary Information for furtherdetails of sample collections, inclusion criteria, and so on.)
Data pre-processing, CNV calling and quality controlData pre-processing. For each sample, raw data from the CNVexperiment consist of intensity measurements for the test andreference sample for each probe. There are numerous choices atthe data pre-processing stage, including how to normalize data toreduce inter-individual variation, and how to combine the informa-tion across the set of probes within a CNV. Several novel analyticaltools substantially improved data quality, but no single approachworks well for every CNV, so we carried through 16 pre-processingpipelines to maximize the number of CNVs that can be tested forassociation. (See Supplementary Information Section 4 for illustra-tions and a sense of the challenges.)CNV calling. The objective in CNV calling at each CNV is to assigneach assayed sample to a diploid copy-number class, which repre-sents the sum of copy numbers on each allele. This step is analogous
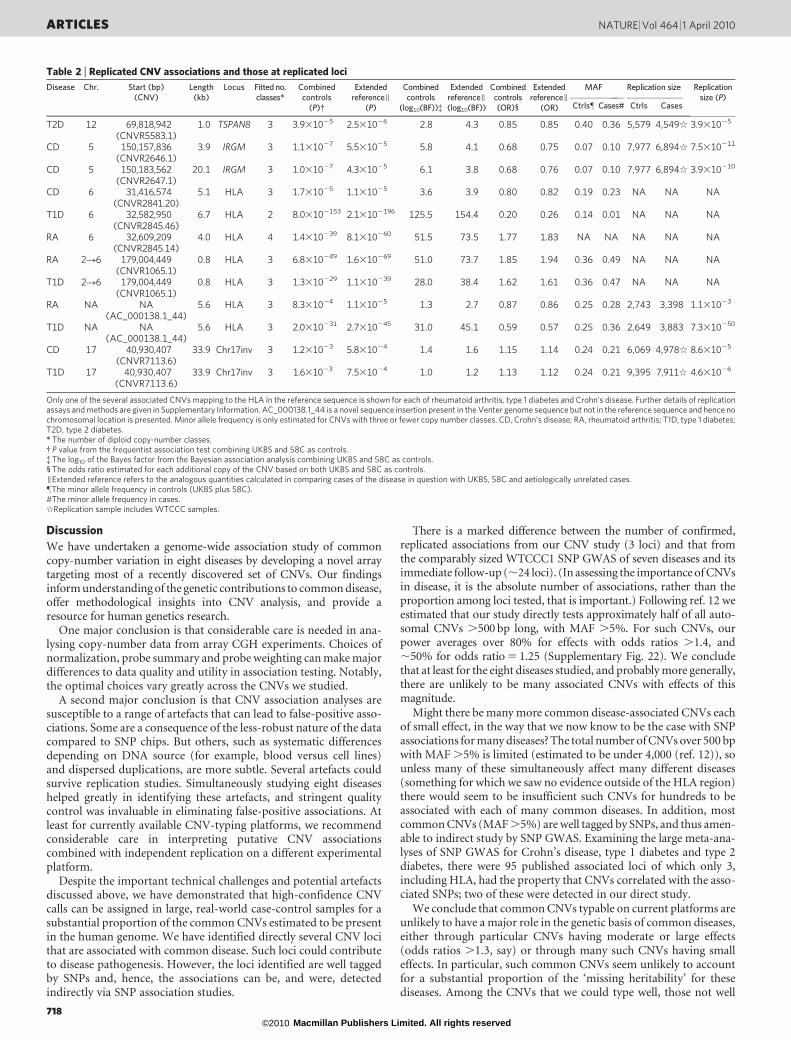
to, but typically considerably more challenging than, calling geno-types from SNP-chip data. Available assays for SNPs are more robustand have better signal-to-noise properties than do available assays forCNVs15. We used two different statistical methods (‘CNVtools’,which is available as a Bioconductor package, and ‘CNVCALL’) inparallel to estimate the number of copy-number classes at each CNVand assign individuals to these classes. (See Supplementary Informa-tion for further details.) Figure 2 illustrates three multi-allelic CNVsthat have attracted attention in the literature in part due to thedifficulties in obtaining reliable data.Quality control. After the application of quality control metrics to eachsample and each CNV (see Methods), 17,304 case-control samples (of19,050 initially) were available for association testing. There were 3,432CNVs with more than one copy-number class which passed qualitycontrol and were included in subsequent analyses. At these CNVs,concordance of calls between pairs of duplicate samples was 99.7%.
Properties of CNVsSingle-class CNVs. Of the 10,894 distinct putative CNVs typed on thearray after removal of detectable redundancies, 60% are called with asingle copy-number class, and so cannot be tested for association.After detailed analyses (see Methods) we estimate that just under halfof these are probably not polymorphic. For the remainder, the com-bination of the experimental assay and analytical methods we haveused do not allow separate copy-number classes to be distinguished.Multi-class CNVs. A total of 4,326 CNVs were called with multipleclasses. Of these, 3,432 passed quality control filters, which in practicemeans that the classes were well separated and thus that it was possibleto assign individuals to copy-number classes with high confidence.Most of these CNVs (88%) have two or three copy-number classes,consistent with their having only two variants, or alleles, present in thepopulation (we refer to these as bi-allelic CNVs). Note that some lociinvolving both duplications and deletions could be called with onlythree classes if both homozygote classes are very rare.
Table 1 | Discovery source for regions targeted on the genotyping array
Source of loci Number of locitargeted
Number of locianalysed
Number of locipolymorphic with
good calls
CNVsGSV discovery project 10,835 10,217 3,096
Affymetrix 500k 18 14 12
Affymetrix 6.0 83 81 47
Illumina 1M 82 81 18
WTCCC CNV loci 231 209 108
Novel sequenceNovel insert regions 292 292 151
Total 11,541 10,894 3,432
GSV CNVs were prioritized according to extent of polymorphism in European discoverysamples. See Methods for full details of other sources.
Loci targeted
11,541
Non-identical loci targeted
11,107
Non-identical multi-class CNVs
4,539
894 CNVs removed as theyfailed quality control
Non-identical well-separatedmulti-class CNVs
3,645
213 CNVs removed as they hadvery high calls correlation (r2 >
0.995) with an overlapping CNV
Non-duplicate well-separatedmulti-class CNVs
3,432
434 loci with identical probe setsremoved
(368 from pairs, 60 from triplesand 6 from quadruplicates)
6,568 loci removed as theyare called with 1 class
Figure 1 | Flowchart showing which CNVs are included on the array. Thechart shows the reasons for CNVs being removed from consideration (thecolumn of arrows and text to the right of the figure) from those originallytargeted on the array, and the number of CNVs remaining at each stage offiltering.
58C
x x x x x x
T1D
x x x x x x
RA
x x x x x x
CD
x x x x x x
58C
x x x x x
T1D
x x x x x
RA
x x x x x
CD
x x x x x
58C
x x x x
T1D
x x x x
RA
x x x x
CD
x x x x
Freq
uenc
y
β-Defensins
CCL3L1
FCGR3A/B
Normalized intensity ratio
Figure 2 | Illustrative CNVs. Histograms of three multi-allelic CNVs (oneper row) previously reported to be associated with autoimmune diseases:b-defensin (CNVR3771.10), CCL3L1 (CNVR7077.12) and FCGR3A/B(CNVR383.1), showing 6, 5 and 4 fitted copy number classes, respectively.The histogram of normalized intensity ratios is shown for one control andthe three autoimmune collections. Histograms are overlaid by the fitteddistribution used to model each class (variously the red, blue, light-green,cyan, magenta and dark green curves). In all such figures, the area under thefitted curve of a particular colour is the same for all collections at the sameCNV. 58C, 1958 British Birth Cohort; CD, Crohn’s disease; RA, rheumatoidarthritis; T1D, type 1 diabetes.
ARTICLES NATURE | Vol 464 | 1 April 2010
714Macmillan Publishers Limited. All rights reserved©2010

Allele frequencies. Supplementary Fig. 21 shows the distribution ofminor allele frequency (MAF) for bi-allelic CNVs passing quality con-trol. For example, 44% of autosomal CNVs passing quality control hadMAF ,5%. This is shifted towards lower MAFs compared to com-monly used SNP chips. One consequence is that for given sample sizesassociation studies will tend to have lower power than for SNP studies.(See Supplementary Fig. 22 for power estimates.) Extrapolating fromanalyses described in ref. 12 gives an estimate that the 3,432 CNVs wedirectly tested represent 42–50% of common (MAF .5%) CNVsgreater than 0.5 kilobases (kb) in length which are polymorphic in apopulation with European ancestry.Tagging by SNPs. In the literature discussing the possible role ofcommon CNVs in human disease there has been controversy overthe extent to which CNVs will be in linkage disequilibrium withSNPs. If linkage disequilibrium between CNVs and SNPs were similarto that between SNPs, SNPs typed in GWAS would act as tags not onlyfor untyped SNPs but also for untyped CNVs, and in turn SNP-basedGWAS would have indirectly explored CNVs for association withdisease. (See refs 16 and 17 for opposite views.) Our large-scale geno-typing of an extensive CNV catalogue allows us to settle this question.In fact, CNVs that are typed well in our experiment are in general well-tagged by SNPs—almost to the same extent that SNPs are well-taggedby SNPs (Supplementary Fig. 20). Among variable 2- and 3-classCNVs passing quality control with MAF .10%, 79% haver2 . 0.8 with at least one SNP; for those with MAF ,5%, 22% haver2 . 0.8 with at least one SNP. This is consistent with the vast majorityhaving arisen from unique mutational events at some time in the past.It follows that genetic variation in the form of common CNVs whichcan be typed on our array, has already been explored indirectly forassociation with common human disease through the SNP-basedGWAS. In passing, we note that the high correlations between ourCNV calls and SNP genotypes provide strong indirect evidence thatour CNV calls are capturing real variation. It is possible that the CNVsthat we cannot type well are systematically different from those that wecan type, for example in having many more copy-number classes, andhence perhaps that they arise from repeated mutational events in thesame region, in which case their linkage disequilibrium propertieswith SNPs could also be systematically different from the CNVs thatwe can type. We have no data that bear on this question, and it seemslikely that such CNVs will be difficult to type genome wide on anycurrently available platforms.
Association testing
We performed association testing at each of the CNVs that passedquality control, in two parallel approaches. First, we applied afrequentist likelihood ratio association test that combines calling(using CNVtools) and testing into a single procedure, using an exten-sion of an approach previously described18. Second, we undertookBayesian association analyses in which the posterior probabilitiesfrom CNVCALL were used to calculate a Bayes factor to measurestrength of association with the disease phenotypes. Importantfeatures of both sets of analyses are that they correctly handle un-certainty in assignment of individuals to copy-number classes, and byallowing for some systematic differences in intensities between casesand controls, that they provide robustness against certain artefactswhich could arise from differences in data properties between casesand controls. There were no substantial differences between thebroad conclusions from the frequentist and Bayesian approaches.
Our association analyses were based on a model in which a singleparameter quantifies the increase in disease risk between successivecopy-number classes, analogous to that underlying the trend test forSNP data. Various analyses of the robustness of our procedure,adequacy of the model, and lack of population structure wereencouraging (see Methods and Supplementary Information). Forexample, Supplementary Fig. 23 shows quantile–quantile plots forthe primary comparison of each case collection against the combinedcontrols, and for the analogous comparisons between the two control
groups. These show generally good agreement with the expectationunder the null hypothesis.
Careful analysis of our association testing revealed several sophi-sticated biological artefacts that can lead to false-positive associa-tions. These include dispersed duplications, whereby the variationat a CNV is not in the chromosomal location in the referencesequence to which the probes in the CNV uniquely match, and aDNA source effect whereby particular CNVs, and genome-wideintensity data, can look systematically different according to whetherthe assayed DNA was derived from blood or cell lines. (See Box 1 forillustrations and further details.)
Independent replication of putative association signals is a routineand essential aspect of SNP-based association studies. Particularly inview of the differences in data quality between SNP assays and CNVassays, and the wide range of possible artefacts in CNV studies, rep-lication is even more important in the CNV context. Several possibleapproaches to replication are available. When a CNV is well tagged bya SNP (or SNPs), replication can be undertaken by assessment of thesignal at the tag SNP(s) in an independent sample, either by typing theSNP or by reference to published data. Where no SNP tag is available,direct typing of the CNV in independent samples is necessary, eitherusing a qualitative breakpoint assay or a quantitative DNA dosageassay. In most cases there will be a choice of assays. Notably, replica-tion via SNPs was possible for 15 out of 18 of the CNVs for which weundertook replication based on analysis of our penultimate datafreeze.
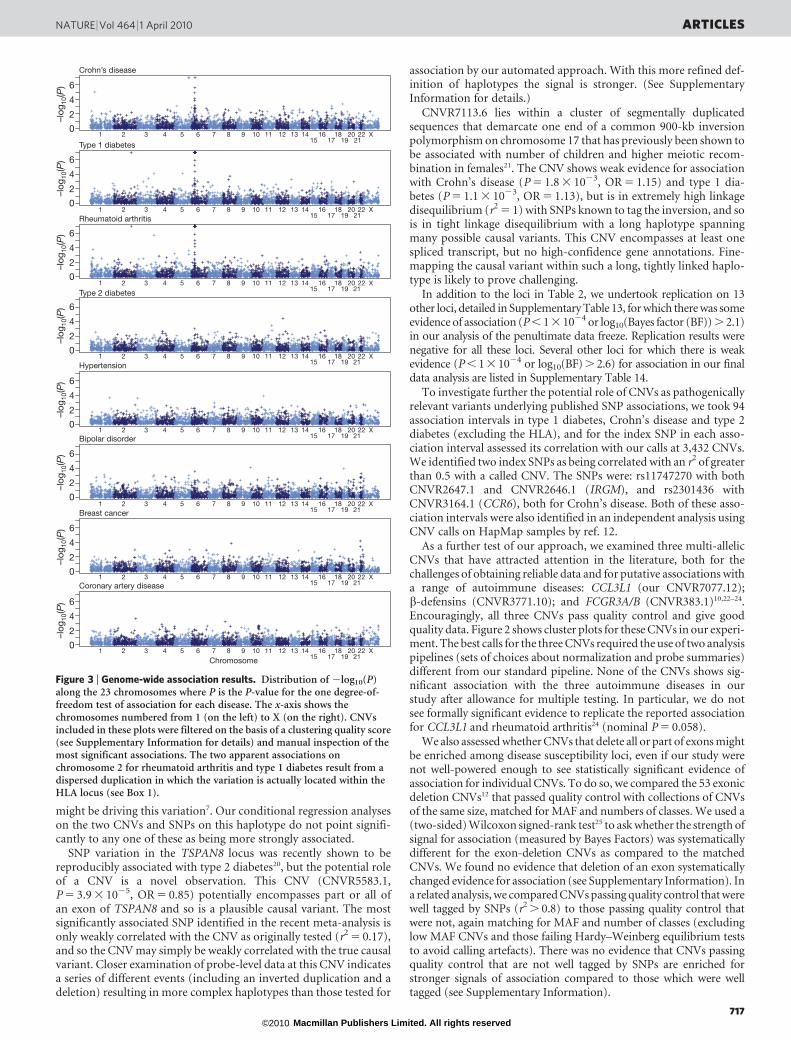
Figure 3 plots P values for the primary frequentist analysis for eachCNV in each collection. Table 2 provides details of the top, replicated,association signals in our experiment after visual inspection of clusterplots to detect artefacts not removed by earlier quality control.Cluster plots for each CNV in Table 2 are shown in SupplementaryFigs 18 and 19, and Supplementary Files 2 and 3.
There is one positive control for the diseases we studied, namelythe known CNV association at the IRGM locus in Crohn’s disease7.Reassuringly, our study found this association (P 5 1 3 1027, oddsratio (OR) 5 0.68; throughout, all ORs are with respect to increasingcopy number).
We identified three loci—HLA for Crohn’s disease, rheumatoidarthritis and type 1 diabetes; IRGM for Crohn’s disease; and TSPAN8for type 2 diabetes—at which CNVs seemed to be associated withdisease, all of which we convincingly replicated through previouslytyped SNPs that tag the CNV, and a fourth locus (CNV7113.6) atwhich there is suggestive evidence for association and replication inboth Crohn’s disease and type 1 diabetes.
We observed CNVs in the HLA region associated variously withCrohn’s disease (CNVR2841.20, P 5 1.2 3 1025, OR 5 0.80),rheumatoid arthritis (CNVR2845.14, P 5 1.4 3 10239, OR 5 1.77)and type 1 diabetes (CNVR2845.46, P 5 8 3 102153, OR 5 0.2).Copy number variation has previously been documented on variousHLA haplotypes19 and owing to the extensive linkage disequilibriumin the region it is perhaps not unexpected to have found CNV asso-ciations in our direct study. Linkage disequilibrium across the HLAregion has hampered attempts to fine-map causal variation acrossthis locus, and we have no evidence that suggests that the HLA CNVsassociated with autoimmune diseases in this study represent signalsindependent of the known associated haplotypes.
We identified two distinct CNVs 22 kb apart upstream of theIRGM gene, both of which are associated with Crohn’s disease. Thelonger CNV (CNVR2647.1, P 5 1.0 3 1027, OR 5 0.68) has previ-ously been identified7 as a possible causal variant on an associatedhaplotype first identified through SNP GWAS14, and acted as ourpositive control; however, the association of the smaller CNV(CNVR2646.1, P 5 1.1 3 1027, OR 5 0.68, located ,2 kb down-stream from a different gene, C5orf62) is a novel observation.Although direct experimental evidence links the associated haplo-types with variation in expression of the IRGM gene, it does not bearon the question of which of the two CNVs or the associated SNPs
NATURE | Vol 464 | 1 April 2010 ARTICLES
715Macmillan Publishers Limited. All rights reserved©2010
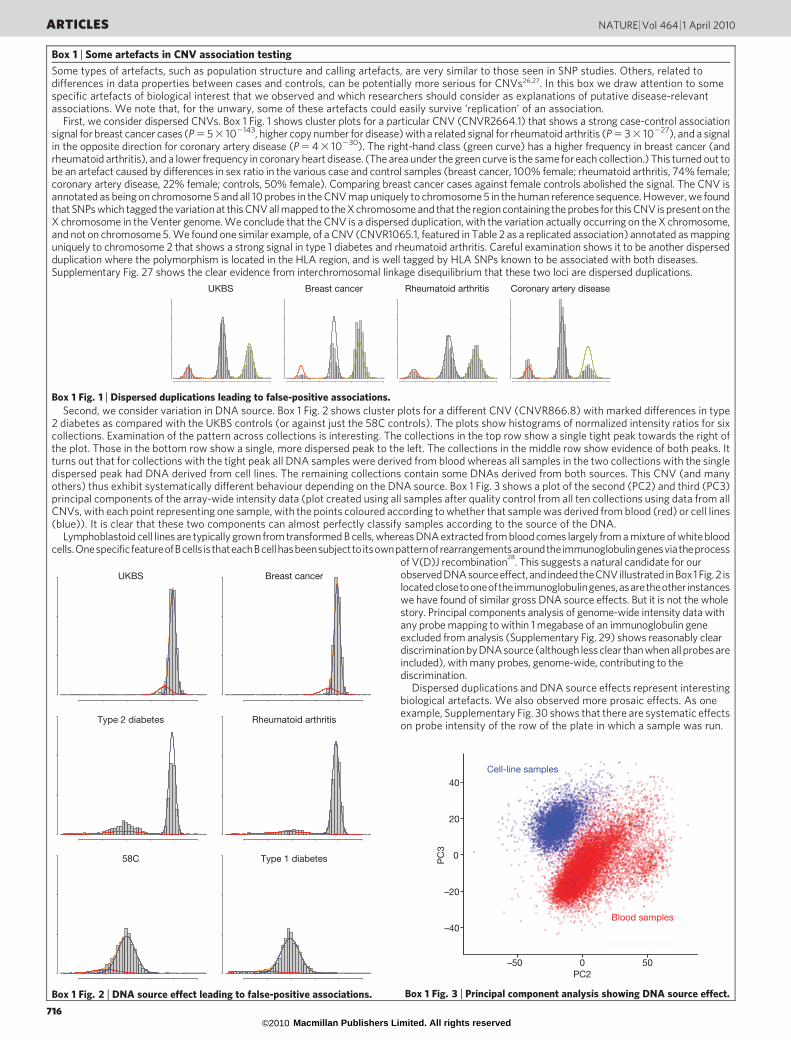
Box 1 | Some artefacts in CNV association testing
Some types of artefacts, such as population structure and calling artefacts, are very similar to those seen in SNP studies. Others, related todifferences in data properties between cases and controls, can be potentially more serious for CNVs26,27. In this box we draw attention to somespecific artefacts of biological interest that we observed and which researchers should consider as explanations of putative disease-relevantassociations. We note that, for the unwary, some of these artefacts could easily survive ‘replication’ of an association.
First, we consider dispersed CNVs. Box 1 Fig. 1 shows cluster plots for a particular CNV (CNVR2664.1) that shows a strong case-control associationsignal for breast cancer cases (P 5 5 3 102143, higher copy number for disease) with a related signal for rheumatoid arthritis (P 5 3 3 10227), and a signalin the opposite direction for coronary artery disease (P 5 4 3 10230). The right-hand class (green curve) has a higher frequency in breast cancer (andrheumatoid arthritis), and a lower frequency in coronary heart disease. (The area under the green curve is the same for each collection.) This turned out tobe an artefact caused by differences in sex ratio in the various case and control samples (breast cancer, 100% female; rheumatoid arthritis, 74% female;coronary artery disease, 22% female; controls, 50% female). Comparing breast cancer cases against female controls abolished the signal. The CNV isannotated as being on chromosome 5 and all 10 probes in the CNV map uniquely to chromosome 5 in the human reference sequence. However, we foundthat SNPs which tagged the variation at this CNV all mapped to the X chromosome and that the region containing the probes for this CNV is present on theX chromosome in the Venter genome. We conclude that the CNV is a dispersed duplication, with the variation actually occurring on the X chromosome,and not on chromosome 5. We found one similar example, of a CNV (CNVR1065.1, featured in Table 2 as a replicated association) annotated as mappinguniquely to chromosome 2 that shows a strong signal in type 1 diabetes and rheumatoid arthritis. Careful examination shows it to be another dispersedduplication where the polymorphism is located in the HLA region, and is well tagged by HLA SNPs known to be associated with both diseases.Supplementary Fig. 27 shows the clear evidence from interchromosomal linkage disequilibrium that these two loci are dispersed duplications.
Second, we consider variation in DNA source. Box 1 Fig. 2 shows cluster plots for a different CNV (CNVR866.8) with marked differences in type2 diabetes as compared with the UKBS controls (or against just the 58C controls). The plots show histograms of normalized intensity ratios for sixcollections. Examination of the pattern across collections is interesting. The collections in the top row show a single tight peak towards the right ofthe plot. Those in the bottom row show a single, more dispersed peak to the left. The collections in the middle row show evidence of both peaks. Itturns out that for collections with the tight peak all DNA samples were derived from blood whereas all samples in the two collections with the singledispersed peak had DNA derived from cell lines. The remaining collections contain some DNAs derived from both sources. This CNV (and manyothers) thus exhibit systematically different behaviour depending on the DNA source. Box 1 Fig. 3 shows a plot of the second (PC2) and third (PC3)principal components of the array-wide intensity data (plot created using all samples after quality control from all ten collections using data from allCNVs, with each point representing one sample, with the points coloured according to whether that sample was derived from blood (red) or cell lines(blue)). It is clear that these two components can almost perfectly classify samples according to the source of the DNA.
Lymphoblastoid cell lines are typically grown from transformed B cells, whereas DNA extracted from blood comes largely from a mixture of white bloodcells.OnespecificfeatureofBcells isthateachBcellhasbeensubjecttoitsownpatternofrearrangementsaroundtheimmunoglobulingenesviatheprocess
of V(D)J recombination28
. This suggests a natural candidate for ourobservedDNAsourceeffect,andindeedtheCNVillustrated inBox1 Fig. 2 islocatedclosetooneoftheimmunoglobulingenes,asaretheother instanceswe have found of similar gross DNA source effects. But it is not the wholestory. Principal components analysis of genome-wide intensity data withany probe mapping to within 1 megabase of an immunoglobulin geneexcluded from analysis (Supplementary Fig. 29) shows reasonably cleardiscriminationby DNAsource (although less clear than when all probes areincluded), with many probes, genome-wide, contributing to thediscrimination.
Dispersed duplications and DNA source effects represent interestingbiological artefacts. We also observed more prosaic effects. As oneexample, Supplementary Fig. 30 shows that there are systematic effectson probe intensity of the row of the plate in which a sample was run.
UKBS
x x x
Breast cancer
x x x
Rheumatoid arthritis
x x x
Coronary artery disease
x x x
Box 1 Fig. 1 | Dispersed duplications leading to false-positive associations.
UKBS
x x
Breast cancer
x x
Type 2 diabetes
x x
Rheumatoid arthritis
x x
58C
x x
Type 1 diabetes
x x
Box 1 Fig. 2 | DNA source effect leading to false-positive associations.
40
0
–20
–40
–50 0 50
20
PC
3
Cell-line samples
Blood samples
PC2
Box 1 Fig. 3 | Principal component analysis showing DNA source effect.
ARTICLES NATURE | Vol 464 | 1 April 2010
716Macmillan Publishers Limited. All rights reserved©2010
might be driving this variation7. Our conditional regression analyseson the two CNVs and SNPs on this haplotype do not point signifi-cantly to any one of these as being more strongly associated.
SNP variation in the TSPAN8 locus was recently shown to bereproducibly associated with type 2 diabetes20, but the potential roleof a CNV is a novel observation. This CNV (CNVR5583.1,P 5 3.9 3 1025, OR 5 0.85) potentially encompasses part or all ofan exon of TSPAN8 and so is a plausible causal variant. The mostsignificantly associated SNP identified in the recent meta-analysis isonly weakly correlated with the CNV as originally tested (r2 5 0.17),and so the CNV may simply be weakly correlated with the true causalvariant. Closer examination of probe-level data at this CNV indicatesa series of different events (including an inverted duplication and adeletion) resulting in more complex haplotypes than those tested for
association by our automated approach. With this more refined def-inition of haplotypes the signal is stronger. (See SupplementaryInformation for details.)
CNVR7113.6 lies within a cluster of segmentally duplicatedsequences that demarcate one end of a common 900-kb inversionpolymorphism on chromosome 17 that has previously been shown tobe associated with number of children and higher meiotic recom-bination in females21. The CNV shows weak evidence for associationwith Crohn’s disease (P 5 1.8 3 1023, OR 5 1.15) and type 1 dia-betes (P 5 1.1 3 1023, OR 5 1.13), but is in extremely high linkagedisequilibrium (r2 5 1) with SNPs known to tag the inversion, and sois in tight linkage disequilibrium with a long haplotype spanningmany possible causal variants. This CNV encompasses at least onespliced transcript, but no high-confidence gene annotations. Fine-mapping the causal variant within such a long, tightly linked haplo-type is likely to prove challenging.
In addition to the loci in Table 2, we undertook replication on 13other loci, detailed in Supplementary Table 13, for which there was someevidence of association (P , 1 3 1024 or log10(Bayes factor (BF)) . 2.1)in our analysis of the penultimate data freeze. Replication results werenegative for all these loci. Several other loci for which there is weakevidence (P , 1 3 1024 or log10(BF) . 2.6) for association in our finaldata analysis are listed in Supplementary Table 14.
To investigate further the potential role of CNVs as pathogenicallyrelevant variants underlying published SNP associations, we took 94association intervals in type 1 diabetes, Crohn’s disease and type 2diabetes (excluding the HLA), and for the index SNP in each asso-ciation interval assessed its correlation with our calls at 3,432 CNVs.We identified two index SNPs as being correlated with an r2 of greaterthan 0.5 with a called CNV. The SNPs were: rs11747270 with bothCNVR2647.1 and CNVR2646.1 (IRGM), and rs2301436 withCNVR3164.1 (CCR6), both for Crohn’s disease. Both of these asso-ciation intervals were also identified in an independent analysis usingCNV calls on HapMap samples by ref. 12.
As a further test of our approach, we examined three multi-allelicCNVs that have attracted attention in the literature, both for thechallenges of obtaining reliable data and for putative associations witha range of autoimmune diseases: CCL3L1 (our CNVR7077.12);b-defensins (CNVR3771.10); and FCGR3A/B (CNVR383.1)10,22–24.Encouragingly, all three CNVs pass quality control and give goodquality data. Figure 2 shows cluster plots for these CNVs in our experi-ment. The best calls for the three CNVs required the use of two analysispipelines (sets of choices about normalization and probe summaries)different from our standard pipeline. None of the CNVs shows sig-nificant association with the three autoimmune diseases in ourstudy after allowance for multiple testing. In particular, we do notsee formally significant evidence to replicate the reported associationfor CCL3L1 and rheumatoid arthritis24 (nominal P 5 0.058).
We also assessed whether CNVs that delete all or part of exons mightbe enriched among disease susceptibility loci, even if our study werenot well-powered enough to see statistically significant evidence ofassociation for individual CNVs. To do so, we compared the 53 exonicdeletion CNVs12 that passed quality control with collections of CNVsof the same size, matched for MAF and numbers of classes. We used a(two-sided) Wilcoxon signed-rank test25 to ask whether the strength ofsignal for association (measured by Bayes Factors) was systematicallydifferent for the exon-deletion CNVs as compared to the matchedCNVs. We found no evidence that deletion of an exon systematicallychanged evidence for association (see Supplementary Information). Ina related analysis, we compared CNVs passing quality control that werewell tagged by SNPs (r2 . 0.8) to those passing quality control thatwere not, again matching for MAF and number of classes (excludinglow MAF CNVs and those failing Hardy–Weinberg equilibrium teststo avoid calling artefacts). There was no evidence that CNVs passingquality control that are not well tagged by SNPs are enriched forstronger signals of association compared to those which were welltagged (see Supplementary Information).
4
2
0
6
–log
10(P
)
4
2
0
6
–log
10(P
)
4
2
0
6
–log
10(P
)
4
2
0
6
–log
10(P
)
4
2
0
6
–log
10(P
)
4
2
0
6
–log
10(P
)
4
2
0
6
–log
10(P
)
4
2
0
6
–log
10(P
)
1 2 3 4 5 6 7 8 9 10 11 12 13 1415
1617
1819
2021
22 X
1 2 3 4 5 6 7 8 9 10 11 12 13 1415
1617
1819
2021
22 X
1 2 3 4 5 6 7 8 9 10 11 12 13 1415
1617
1819
2021
22 X
1 2 3 4 5 6 7 8 9 10 11 12 13 1415
1617
1819
2021
22 X
1 2 3 4 5 6 7 8 9 10 11 12 13 1415
1617
1819
2021
22 X
1 2 3 4 5 6 7 8 9 10 11 12 13 1415
1617
1819
2021
22 X
1 2 3 4 5 6 7 8 9 10 11 12 13 1415
1617
1819
2021
22 X
1 2 3 4 5 6 7 8 9 10 11 12 13 1415
1617
1819
2021
22 X
Crohn’s disease
Type 1 diabetes
Rheumatoid arthritis
Type 2 diabetes
Hypertension
Bipolar disorder
Breast cancer
Coronary artery disease
Chromosome
Figure 3 | Genome-wide association results. Distribution of 2log10(P)along the 23 chromosomes where P is the P-value for the one degree-of-freedom test of association for each disease. The x-axis shows thechromosomes numbered from 1 (on the left) to X (on the right). CNVsincluded in these plots were filtered on the basis of a clustering quality score(see Supplementary Information for details) and manual inspection of themost significant associations. The two apparent associations onchromosome 2 for rheumatoid arthritis and type 1 diabetes result from adispersed duplication in which the variation is actually located within theHLA locus (see Box 1).
NATURE | Vol 464 | 1 April 2010 ARTICLES
717Macmillan Publishers Limited. All rights reserved©2010
Discussion
We have undertaken a genome-wide association study of commoncopy-number variation in eight diseases by developing a novel arraytargeting most of a recently discovered set of CNVs. Our findingsinform understanding of the genetic contributions to common disease,offer methodological insights into CNV analysis, and provide aresource for human genetics research.
One major conclusion is that considerable care is needed in ana-lysing copy-number data from array CGH experiments. Choices ofnormalization, probe summary and probe weighting can make majordifferences to data quality and utility in association testing. Notably,the optimal choices vary greatly across the CNVs we studied.
A second major conclusion is that CNV association analyses aresusceptible to a range of artefacts that can lead to false-positive asso-ciations. Some are a consequence of the less-robust nature of the datacompared to SNP chips. But others, such as systematic differencesdepending on DNA source (for example, blood versus cell lines)and dispersed duplications, are more subtle. Several artefacts couldsurvive replication studies. Simultaneously studying eight diseaseshelped greatly in identifying these artefacts, and stringent qualitycontrol was invaluable in eliminating false-positive associations. Atleast for currently available CNV-typing platforms, we recommendconsiderable care in interpreting putative CNV associationscombined with independent replication on a different experimentalplatform.
Despite the important technical challenges and potential artefactsdiscussed above, we have demonstrated that high-confidence CNVcalls can be assigned in large, real-world case-control samples for asubstantial proportion of the common CNVs estimated to be presentin the human genome. We have identified directly several CNV locithat are associated with common disease. Such loci could contributeto disease pathogenesis. However, the loci identified are well taggedby SNPs and, hence, the associations can be, and were, detectedindirectly via SNP association studies.
There is a marked difference between the number of confirmed,replicated associations from our CNV study (3 loci) and that fromthe comparably sized WTCCC1 SNP GWAS of seven diseases and itsimmediate follow-up (,24 loci). (In assessing the importance of CNVsin disease, it is the absolute number of associations, rather than theproportion among loci tested, that is important.) Following ref. 12 weestimated that our study directly tests approximately half of all auto-somal CNVs .500 bp long, with MAF .5%. For such CNVs, ourpower averages over 80% for effects with odds ratios .1.4, and,50% for odds ratio 5 1.25 (Supplementary Fig. 22). We concludethat at least for the eight diseases studied, and probably more generally,there are unlikely to be many associated CNVs with effects of thismagnitude.
Might there be many more common disease-associated CNVs eachof small effect, in the way that we now know to be the case with SNPassociations for many diseases? The total number of CNVs over 500 bpwith MAF .5% is limited (estimated to be under 4,000 (ref. 12)), sounless many of these simultaneously affect many different diseases(something for which we saw no evidence outside of the HLA region)there would seem to be insufficient such CNVs for hundreds to beassociated with each of many common diseases. In addition, mostcommon CNVs (MAF .5%) are well tagged by SNPs, and thus amen-able to indirect study by SNP GWAS. Examining the large meta-ana-lyses of SNP GWAS for Crohn’s disease, type 1 diabetes and type 2diabetes, there were 95 published associated loci of which only 3,including HLA, had the property that CNVs correlated with the asso-ciated SNPs; two of these were detected in our direct study.
We conclude that common CNVs typable on current platforms areunlikely to have a major role in the genetic basis of common diseases,either through particular CNVs having moderate or large effects(odds ratios .1.3, say) or through many such CNVs having smalleffects. In particular, such common CNVs seem unlikely to accountfor a substantial proportion of the ‘missing heritability’ for thesediseases. Among the CNVs that we could type well, those not well
Table 2 | Replicated CNV associations and those at replicated loci
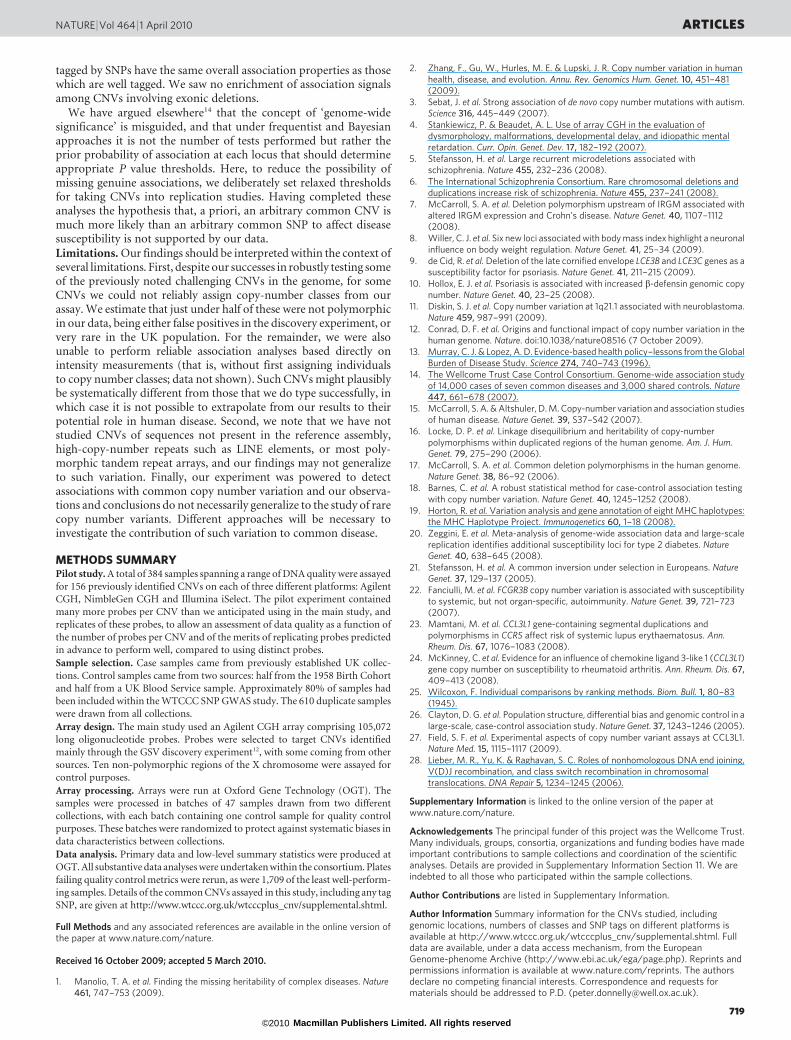
Disease Chr. Start (bp)(CNV)
Length(kb)
Locus Fitted no.classes*
Combinedcontrols
(P){
ExtendedreferenceI
(P)
Combinedcontrols
(log10
(BF)){
ExtendedreferenceI(log
10(BF))
Combinedcontrols(OR)1
ExtendedreferenceI
(OR)
MAF Replication size Replicationsize (P)
Ctrls" Cases# Ctrls Cases
T2D 12 69,818,942
(CNVR5583.1)1.0 TSPAN8 3 3.9310
25
2.531026
2.8 4.3 0.85 0.85 0.40 0.36 5,579 4,549q 3.931025
CD 5 150,157,836
(CNVR2646.1)3.9 IRGM 3 1.1310
27
5.531025
5.8 4.1 0.68 0.75 0.07 0.10 7,977 6,894q 7.5310211
CD 5 150,183,562
(CNVR2647.1)20.1 IRGM 3 1.0310
27
4.331025
6.1 3.8 0.68 0.76 0.07 0.10 7,977 6,894q 3.9310210
CD 6 31,416,574
(CNVR2841.20)5.1 HLA 3 1.7310
25
1.131025
3.6 3.9 0.80 0.82 0.19 0.23 NA NA NA
T1D 6 32,582,950
(CNVR2845.46)6.7 HLA 2 8.0310
2153
2.13102196
125.5 154.4 0.20 0.26 0.14 0.01 NA NA NA
RA 6 32,609,209
(CNVR2845.14)4.0 HLA 4 1.4310
239
8.1310260
51.5 73.5 1.77 1.83 NA NA NA NA NA
RA 2R6 179,004,449
(CNVR1065.1)0.8 HLA 3 6.8310
249
1.6310269
51.0 73.7 1.85 1.94 0.36 0.49 NA NA NA
T1D 2R6 179,004,449
(CNVR1065.1)0.8 HLA 3 1.3310
229
1.1310239
28.0 38.4 1.62 1.61 0.36 0.47 NA NA NA
RA NA NA(AC_000138.1_44)
5.6 HLA 3 8.331024
1.131025
1.3 2.7 0.87 0.86 0.25 0.28 2,743 3,398 1.131023
T1D NA NA(AC_000138.1_44)
5.6 HLA 3 2.0310231
2.7310245
31.0 45.1 0.59 0.57 0.25 0.36 2,649 3,883 7.3310250
CD 17 40,930,407
(CNVR7113.6)33.9 Chr17inv 3 1.2310
23
5.831024
1.4 1.6 1.15 1.14 0.24 0.21 6,069 4,978q 8.631025
T1D 17 40,930,407
(CNVR7113.6)33.9 Chr17inv 3 1.6310
23
7.531024
1.0 1.2 1.13 1.12 0.24 0.21 9,395 7,911q 4.631026
Only one of the several associated CNVs mapping to the HLA in the reference sequence is shown for each of rheumatoid arthritis, type 1 diabetes and Crohn’s disease. Further details of replicationassays and methods are given in Supplementary Information. AC_000138.1_44 is a novel sequence insertion present in the Venter genome sequence but not in the reference sequence and hence nochromosomal location is presented. Minor allele frequency is only estimated for CNVs with three or fewer copy number classes. CD, Crohn’s disease; RA, rheumatoid arthritis; T1D, type 1 diabetes;T2D, type 2 diabetes.*The number of diploid copy-number classes.{ P value from the frequentist association test combining UKBS and 58C as controls.{The log10 of the Bayes factor from the Bayesian association analysis combining UKBS and 58C as controls.1 The odds ratio estimated for each additional copy of the CNV based on both UKBS and 58C as controls.IExtended reference refers to the analogous quantities calculated in comparing cases of the disease in question with UKBS, 58C and aetiologically unrelated cases."The minor allele frequency in controls (UKBS plus 58C).#The minor allele frequency in cases.qReplication sample includes WTCCC samples.
ARTICLES NATURE | Vol 464 | 1 April 2010
718Macmillan Publishers Limited. All rights reserved©2010
tagged by SNPs have the same overall association properties as thosewhich are well tagged. We saw no enrichment of association signalsamong CNVs involving exonic deletions.
We have argued elsewhere14 that the concept of ‘genome-widesignificance’ is misguided, and that under frequentist and Bayesianapproaches it is not the number of tests performed but rather theprior probability of association at each locus that should determineappropriate P value thresholds. Here, to reduce the possibility ofmissing genuine associations, we deliberately set relaxed thresholdsfor taking CNVs into replication studies. Having completed theseanalyses the hypothesis that, a priori, an arbitrary common CNV ismuch more likely than an arbitrary common SNP to affect diseasesusceptibility is not supported by our data.Limitations. Our findings should be interpreted within the context ofseveral limitations. First, despite our successes in robustly testing someof the previously noted challenging CNVs in the genome, for someCNVs we could not reliably assign copy-number classes from ourassay. We estimate that just under half of these were not polymorphicin our data, being either false positives in the discovery experiment, orvery rare in the UK population. For the remainder, we were alsounable to perform reliable association analyses based directly onintensity measurements (that is, without first assigning individualsto copy number classes; data not shown). Such CNVs might plausiblybe systematically different from those that we do type successfully, inwhich case it is not possible to extrapolate from our results to theirpotential role in human disease. Second, we note that we have notstudied CNVs of sequences not present in the reference assembly,high-copy-number repeats such as LINE elements, or most poly-morphic tandem repeat arrays, and our findings may not generalizeto such variation. Finally, our experiment was powered to detectassociations with common copy number variation and our observa-tions and conclusions do not necessarily generalize to the study of rarecopy number variants. Different approaches will be necessary toinvestigate the contribution of such variation to common disease.
METHODS SUMMARYPilot study. A total of 384 samples spanning a range of DNA quality were assayed
for 156 previously identified CNVs on each of three different platforms: Agilent
CGH, NimbleGen CGH and Illumina iSelect. The pilot experiment contained
many more probes per CNV than we anticipated using in the main study, and
replicates of these probes, to allow an assessment of data quality as a function of
the number of probes per CNV and of the merits of replicating probes predicted
in advance to perform well, compared to using distinct probes.
Sample selection. Case samples came from previously established UK collec-
tions. Control samples came from two sources: half from the 1958 Birth Cohort
and half from a UK Blood Service sample. Approximately 80% of samples had
been included within the WTCCC SNP GWAS study. The 610 duplicate samples
were drawn from all collections.
Array design. The main study used an Agilent CGH array comprising 105,072
long oligonucleotide probes. Probes were selected to target CNVs identified
mainly through the GSV discovery experiment12, with some coming from other
sources. Ten non-polymorphic regions of the X chromosome were assayed for
control purposes.
Array processing. Arrays were run at Oxford Gene Technology (OGT). The
samples were processed in batches of 47 samples drawn from two different
collections, with each batch containing one control sample for quality control
purposes. These batches were randomized to protect against systematic biases in
data characteristics between collections.
Data analysis. Primary data and low-level summary statistics were produced at
OGT. All substantive data analyses were undertaken within the consortium. Plates
failing quality control metrics were rerun, as were 1,709 of the least well-perform-
ing samples. Details of the common CNVs assayed in this study, including any tag
SNP, are given at http://www.wtccc.org.uk/wtcccplus_cnv/supplemental.shtml.
Full Methods and any associated references are available in the online version ofthe paper at www.nature.com/nature.
Received 16 October 2009; accepted 5 March 2010.
1. Manolio, T. A. et al. Finding the missing heritability of complex diseases. Nature461, 747–753 (2009).
2. Zhang, F., Gu, W., Hurles, M. E. & Lupski, J. R. Copy number variation in humanhealth, disease, and evolution. Annu. Rev. Genomics Hum. Genet. 10, 451–481(2009).
3. Sebat, J. et al. Strong association of de novo copy number mutations with autism.Science 316, 445–449 (2007).
4. Stankiewicz, P. & Beaudet, A. L. Use of array CGH in the evaluation ofdysmorphology, malformations, developmental delay, and idiopathic mentalretardation. Curr. Opin. Genet. Dev. 17, 182–192 (2007).
5. Stefansson, H. et al. Large recurrent microdeletions associated withschizophrenia. Nature 455, 232–236 (2008).
6. The International Schizophrenia Consortium. Rare chromosomal deletions andduplications increase risk of schizophrenia. Nature 455, 237–241 (2008).
7. McCarroll, S. A. et al. Deletion polymorphism upstream of IRGM associated withaltered IRGM expression and Crohn’s disease. Nature Genet. 40, 1107–1112(2008).
8. Willer, C. J. et al. Six new loci associated with body mass index highlight a neuronalinfluence on body weight regulation. Nature Genet. 41, 25–34 (2009).
9. de Cid, R. et al. Deletion of the late cornified envelope LCE3B and LCE3C genes as asusceptibility factor for psoriasis. Nature Genet. 41, 211–215 (2009).
10. Hollox, E. J. et al. Psoriasis is associated with increased b-defensin genomic copynumber. Nature Genet. 40, 23–25 (2008).
11. Diskin, S. J. et al. Copy number variation at 1q21.1 associated with neuroblastoma.Nature 459, 987–991 (2009).
12. Conrad, D. F. et al. Origins and functional impact of copy number variation in thehuman genome. Nature. doi:10.1038/nature08516 (7 October 2009).
13. Murray, C. J. & Lopez, A. D. Evidence-based health policy–lessons from the GlobalBurden of Disease Study. Science 274, 740–743 (1996).
14. The Wellcome Trust Case Control Consortium. Genome-wide association studyof 14,000 cases of seven common diseases and 3,000 shared controls. Nature447, 661–678 (2007).
15. McCarroll, S. A. & Altshuler, D. M. Copy-number variation and association studiesof human disease. Nature Genet. 39, S37–S42 (2007).
16. Locke, D. P. et al. Linkage disequilibrium and heritability of copy-numberpolymorphisms within duplicated regions of the human genome. Am. J. Hum.Genet. 79, 275–290 (2006).
17. McCarroll, S. A. et al. Common deletion polymorphisms in the human genome.Nature Genet. 38, 86–92 (2006).
18. Barnes, C. et al. A robust statistical method for case-control association testingwith copy number variation. Nature Genet. 40, 1245–1252 (2008).
19. Horton, R. et al. Variation analysis and gene annotation of eight MHC haplotypes:the MHC Haplotype Project. Immunogenetics 60, 1–18 (2008).
20. Zeggini, E. et al. Meta-analysis of genome-wide association data and large-scalereplication identifies additional susceptibility loci for type 2 diabetes. NatureGenet. 40, 638–645 (2008).
21. Stefansson, H. et al. A common inversion under selection in Europeans. NatureGenet. 37, 129–137 (2005).
22. Fanciulli, M. et al. FCGR3B copy number variation is associated with susceptibilityto systemic, but not organ-specific, autoimmunity. Nature Genet. 39, 721–723(2007).
23. Mamtani, M. et al. CCL3L1 gene-containing segmental duplications andpolymorphisms in CCR5 affect risk of systemic lupus erythaematosus. Ann.Rheum. Dis. 67, 1076–1083 (2008).
24. McKinney, C. et al. Evidence for an influence of chemokine ligand 3-like 1 (CCL3L1)gene copy number on susceptibility to rheumatoid arthritis. Ann. Rheum. Dis. 67,409–413 (2008).
25. Wilcoxon, F. Individual comparisons by ranking methods. Biom. Bull. 1, 80–83(1945).
26. Clayton, D. G. et al. Population structure, differential bias and genomic control in alarge-scale, case-control association study. Nature Genet. 37, 1243–1246 (2005).
27. Field, S. F. et al. Experimental aspects of copy number variant assays at CCL3L1.Nature Med. 15, 1115–1117 (2009).
28. Lieber, M. R., Yu, K. & Raghavan, S. C. Roles of nonhomologous DNA end joining,V(D)J recombination, and class switch recombination in chromosomaltranslocations. DNA Repair 5, 1234–1245 (2006).
Supplementary Information is linked to the online version of the paper atwww.nature.com/nature.
Acknowledgements The principal funder of this project was the Wellcome Trust.Many individuals, groups, consortia, organizations and funding bodies have madeimportant contributions to sample collections and coordination of the scientificanalyses. Details are provided in Supplementary Information Section 11. We areindebted to all those who participated within the sample collections.
Author Contributions are listed in Supplementary Information.
Author Information Summary information for the CNVs studied, includinggenomic locations, numbers of classes and SNP tags on different platforms isavailable at http://www.wtccc.org.uk/wtcccplus_cnv/supplemental.shtml. Fulldata are available, under a data access mechanism, from the EuropeanGenome-phenome Archive (http://www.ebi.ac.uk/ega/page.php). Reprints andpermissions information is available at www.nature.com/reprints. The authorsdeclare no competing financial interests. Correspondence and requests formaterials should be addressed to P.D. ([email protected]).
NATURE | Vol 464 | 1 April 2010 ARTICLES
719Macmillan Publishers Limited. All rights reserved©2010
The Wellcome Trust Case Control Consortium
Nick Craddock1*, Matthew E. Hurles2*, Niall Cardin3, Richard D. Pearson4, VincentPlagnol5, Samuel Robson2, Damjan Vukcevic4, Chris Barnes2, Donald F. Conrad2, EleniGiannoulatou3, Chris Holmes3, Jonathan L. Marchini3, Kathy Stirrups2, Martin D.Tobin6, Louise V. Wain6, Chris Yau3, Jan Aerts2, Tariq Ahmad7, T. Daniel Andrews2,Hazel Arbury2, Anthony Attwood2,8,9, Adam Auton3, Stephen G. Ball10, Anthony J.Balmforth10, Jeffrey C. Barrett2, Ines Barroso2, Anne Barton11, Amanda J. Bennett12,Sanjeev Bhaskar2, Katarzyna Blaszczyk13, John Bowes11, Oliver J. Brand14, Peter S.Braund15, Francesca Bredin16, Gerome Breen17,18, Morris J. Brown19, Ian N. Bruce11,Jaswinder Bull20, Oliver S. Burren5, John Burton2, Jake Byrnes4, Sian Caesar21, Chris M.Clee2, Alison J. Coffey2, John M. C. Connell22, Jason D. Cooper5, Anna F. Dominiczak22,Kate Downes5, Hazel E. Drummond23, Darshna Dudakia20, Andrew Dunham2,Bernadette Ebbs20, Diana Eccles24, Sarah Edkins2, Cathryn Edwards25, Anna Elliot20,Paul Emery26, David M. Evans27, Gareth Evans28, Steve Eyre11, Anne Farmer18, I. NicolFerrier29, Lars Feuk30,31, Tomas Fitzgerald2, Edward Flynn11, Alistair Forbes32, LizForty1, Jayne A. Franklyn14,33, Rachel M. Freathy34, Polly Gibbs20, Paul Gilbert11, OmerGokumen35, Katherine Gordon-Smith1,21, Emma Gray2, Elaine Green1, Chris J. Groves12,Detelina Grozeva1, Rhian Gwilliam2, Anita Hall20, Naomi Hammond2, Matt Hardy5, PileHarrison36, Neelam Hassanali12, Husam Hebaishi2, Sarah Hines20, Anne Hinks11,Graham A Hitman37, Lynne Hocking38, Eleanor Howard2, Philip Howard39, Joanna M.M. Howson5, Debbie Hughes20, Sarah Hunt2, John D. Isaacs40, Mahim Jain4, Derek P.Jewell41, Toby Johnson39, Jennifer D. Jolley8,9, Ian R. Jones1, Lisa A. Jones21, GeorgeKirov1, Cordelia F. Langford2, Hana Lango-Allen34, G. Mark Lathrop42, James Lee16,Kate L. Lee39, Charlie Lees23, Kevin Lewis2, Cecilia M. Lindgren4,12, MeetaMaisuria-Armer5, Julian Maller4, John Mansfield43, Paul Martin11, Dunecan C. O.Massey16, Wendy L. McArdle44, Peter McGuffin18, Kirsten E. McLay2, Alex Mentzer45,Michael L. Mimmack2, Ann E. Morgan46, Andrew P. Morris4, Craig Mowat47, SimonMyers3, William Newman28, Elaine R. Nimmo23, Michael C. O’Donovan1, AbiodunOnipinla39, Ifejinelo Onyiah2, Nigel R. Ovington5, Michael J. Owen1, Kimmo Palin2,Kirstie Parnell34, David Pernet20, John R. B. Perry34, Anne Phillips47, Dalila Pinto30,Natalie J. Prescott13, Inga Prokopenko4,12, Michael A. Quail2, Suzanne Rafelt15, Nigel W.Rayner4,12, Richard Redon2,48, David M. Reid38, Anthony Renwick20, Susan M. Ring44,Neil Robertson4,12, Ellie Russell1, David St Clair17, Jennifer G. Sambrook8,9, Jeremy D.Sanderson45, Helen Schuilenburg5, Carol E. Scott2, Richard Scott20, Sheila Seal20, SueShaw-Hawkins39, Beverley M. Shields34, Matthew J. Simmonds14, Debbie J. Smyth5,Elilan Somaskantharajah2, Katarina Spanova20, Sophia Steer49, Jonathan Stephens8,9,Helen E. Stevens5, Millicent A. Stone50,51, Zhan Su3, Deborah P. M. Symmons11, John R.Thompson6, Wendy Thomson11, Mary E. Travers12, Clare Turnbull20, ArmandValsesia2, Mark Walker52, Neil M. Walker5, Chris Wallace5, MargaretWarren-Perry20, Nicholas A. Watkins8,9, John Webster53, Michael N. Weedon34,Anthony G. Wilson54, Matthew Woodburn5, B. Paul Wordsworth55, Allan H.Young29,56, Eleftheria Zeggini2,4, Nigel P. Carter2, Timothy M. Frayling34, CharlesLee35, Gil McVean3, Patricia B. Munroe39, Aarno Palotie2, Stephen J. Sawcer57,Stephen W. Scherer30,58, David P. Strachan59, Chris Tyler-Smith2, Matthew A.Brown55,60, Paul R. Burton6, Mark J. Caulfield39, Alastair Compston57, Martin Farrall61,Stephen C. L. Gough14,33, Alistair S. Hall10, Andrew T. Hattersley34,62, Adrian V. S. Hill4,Christopher G. Mathew13, Marcus Pembrey63, Jack Satsangi23, Michael R. Stratton2,20,Jane Worthington11, Panos Deloukas2, Audrey Duncanson64, Dominic P.Kwiatkowski2,4, Mark I. McCarthy4,12,65, Willem H. Ouwehand2,8,9, Miles Parkes16,Nazneen Rahman20, John A. Todd5, Nilesh J. Samani15,66 & Peter Donnelly4,3
*These authors contributed equally to this work.
1MRC Centre for Neuropsychiatric Genetics and Genomics, School of Medicine, CardiffUniversity, Heath Park, Cardiff CF14 4XN, UK. 2The Wellcome Trust Sanger Institute,Wellcome Trust Genome Campus, Hinxton, Cambridge CB10 1SA, UK. 3Department ofStatistics, University of Oxford, 1 South Parks Road, Oxford OX1 3TG, UK. 4TheWellcome Trust Centre for Human Genetics, University of Oxford, Roosevelt Drive,Oxford OX3 7BN, UK. 5Juvenile Diabetes Research Foundation/Wellcome TrustDiabetes and Inflammation Laboratory, Department of Medical Genetics, CambridgeInstitute for Medical Research, University of Cambridge, Wellcome Trust/MRC Building,Cambridge CB2 0XY, UK. 6Departments of Health Sciences and Genetics, University ofLeicester, 217 Adrian Building, University Road, Leicester LE1 7RH, UK. 7Genetics ofComplex Traits, Peninsula College of Medicine and Dentistry University of Exeter, ExeterEX1 2LU, UK. 8Department of Haematology, University of Cambridge, Long Road,Cambridge CB2 0PT, UK. 9National Health Service Blood and Transplant, CambridgeCentre, Long Road, Cambridge CB2 0PT, UK. 10Multidisciplinary CardiovascularResearch Centre (MCRC), Leeds Institute of Genetics, Health and Therapeutics (LIGHT),University of Leeds, Leeds LS2 9JT, UK. 11arc Epidemiology Unit, Stopford Building,University of Manchester, Oxford Road, Manchester M13 9PT, UK. 12Oxford Centre forDiabetes, Endocrinology and Medicine, University of Oxford, Churchill Hospital, OxfordOX3 7LJ, UK. 13Department of Medical and Molecular Genetics, King’s College LondonSchool of Medicine, 8th Floor Guy’s Tower, Guy’s Hospital, London SE1 9RT, UK. 14Centrefor Endocrinology, Diabetes and Metabolism, Institute of Biomedical Research,
University of Birmingham, Birmingham B15 2TT, UK. 15Department of CardiovascularSciences, University of Leicester, Glenfield Hospital, Groby Road, Leicester LE3 9QP, UK.16IBD Genetics Research Group, Addenbrooke’s Hospital, Cambridge CB2 0QQ, UK.17University of Aberdeen, Institute of Medical Sciences, Foresterhill, Aberdeen AB252ZD, UK. 18SGDP, The Institute of Psychiatry, King’s College London, De Crespigny Park,Denmark Hill, London SE5 8AF, UK. 19Clinical Pharmacology Unit, University ofCambridge, Addenbrooke’s Hospital, Hills Road, Cambridge CB2 2QQ, UK. 20Section ofCancer Genetics, Institute of Cancer Research, 15 Cotswold Road, Sutton SM2 5NG, UK.21Department of Psychiatry, University of Birmingham, National Centre for MentalHealth, 25 Vincent Drive, Birmingham B15 2FG, UK. 22BHF Glasgow CardiovascularResearch Centre, University of Glasgow, 126 University Place, Glasgow G12 8TA, UK.23Gastrointestinal Unit, Division of Medical Sciences, School of Molecular and ClinicalMedicine, University of Edinburgh, Western General Hospital, Edinburgh EH4 2XU, UK.24Academic Unit of Genetic Medicine, University of Southampton, Southampton SO165YA, UK. 25Endoscopy Regional Training Unit, Torbay Hospital, Torbay TQ2 7AA, UK.26Academic Unit of Musculoskeletal Disease, University of Leeds, Chapel AllertonHospital, Leeds, West Yorkshire LS7 4SA, UK. 27MRC Centre for Causal Analyses inTranslational Epidemiology, Department of Social Medicine, University of Bristol, BristolBS8 2BN, UK. 28Department of Medical Genetics, Manchester Academic Health ScienceCentre (MAHSC), University of Manchester, Manchester M13 0JH, UK. 29School ofNeurology, Neurobiology and Psychiatry, Royal Victoria Infirmary, Queen Victoria Road,Newcastle upon Tyne NE1 4LP, UK. 30The Centre for Applied Genomics and Program inGenetics and Genomic Biology, The Hospital for Sick Children, MaRS Centre–EastTower, 101 College St, Room 14-701, Toronto, Ontario M5G 1L7, Canada. 31Departmentof Genetics and Pathology, Rudbeck Laboratory, Uppsala University, Uppsala 75185,Sweden. 32Institute for Digestive Diseases, University College London Hospitals Trust,London NW1 2BU, UK. 33University Hospital Birmingham NHS Foundation Trust,Birmingham B15 2TT, UK. 34Genetics of Complex Traits, Peninsula College of Medicineand Dentistry, University of Exeter, Magdalen Road, Exeter EX1 2LU, UK. 35Department ofPathology, Brigham and Women’s Hospital and Harvard Medical School, Boston,Massachusetts 02115, USA. 36University of Oxford, Institute of MusculoskeletalSciences, Botnar Research Centre, Oxford OX3 7LD, UK. 37Centre for Diabetes andMetabolic Medicine, Barts and The London, Royal London Hospital, Whitechapel,London E1 1BB, UK. 38Bone Research Group, Department of Medicine and Therapeutics,University of Aberdeen, Aberdeen AB25 2ZD, UK. 39Clinical Pharmacology and Barts andThe London Genome Centre, William Harvey Research Institute, Barts and The LondonSchool of Medicine and Dentistry, Queen Mary University of London, CharterhouseSquare, London EC1M 6BQ, UK. 40Institute of Cellular Medicine, MusculoskeletalResearch Group, 4th Floor, Catherine Cookson Building, The Medical School,Framlington Place, Newcastle upon Tyne NE2 4HH, UK. 41Gastroenterology Unit,Radcliffe Infirmary, University of Oxford, Oxford OX2 6HE, UK. 42Centre National deGenotypage, 2 Rue Gaston Cremieux, Evry, Paris 91057, France. 43Department ofGastroenterology and Hepatology, University of Newcastle upon Tyne, Royal VictoriaInfirmary, Newcastle upon Tyne NE1 4LP, UK. 44ALSPAC Laboratory, Department ofSocial Medicine, University of Bristol, Bristol BS8 2BN, UK. 45Division of NutritionalSciences, King’s College London School of Biomedical and Health Sciences, London SE19NH, UK. 46NIHR-Leeds Musculoskeletal Biomedical Research Unit, University of Leeds,Chapel Allerton Hospital, Leeds, West Yorkshire LS7 4SA, UK. 47Department of GeneralInternal Medicine, Ninewells Hospital and Medical School, Ninewells Avenue, DundeeDD1 9SY, UK. 48INSERM UMR915, L’Institut du Thorax, Nantes 44035, France. 49Clinicaland Academic Rheumatology, Kings College Hospital National Health ServiceFoundation Trust, Denmark Hill, London SE5 9RS, UK. 50University of Toronto, StMichael’s Hospital, 30 Bond Street, Toronto, Ontario M5B 1W8, Canada. 51University ofBath, Claverdon, Norwood House, Room 5.11a, Bath, Somerset BA2 7AY, UK. 52DiabetesResearch Group, School of Clinical Medical Sciences, Newcastle University, FramlingtonPlace, Newcastle upon Tyne NE2 4HH, UK. 53Medicine and Therapeutics, AberdeenRoyal Infirmary, Foresterhill, Aberdeen, Grampian AB9 2ZB, UK. 54School of Medicineand Biomedical Sciences, University of Sheffield, Sheffield S10 2JF, UK. 55NuffieldDepartment of Orthopaedics, Rheumatology and Musculoskeletal Sciences, NuffieldOrthopaedic Centre, University of Oxford, Windmill Road, Headington, Oxford OX3 7LD,UK. 56UBC Institute of Mental Health, 430-5950 University Boulevard Vancouver,British Columbia V6T 1Z3, Canada. 57Department of Clinical Neurosciences, Universityof Cambridge, Addenbrooke’s Hospital, Hills Road, Cambridge CB2 2QQ, UK.58Department of Molecular Genetics, University of Toronto, Toronto, Ontario M5S 1A8,Canada. 59Division of Community Health Sciences, St George’s, University of London,London SW17 0RE, UK. 60Diamantina Institute of Cancer, Immunology and MetabolicMedicine, Princess Alexandra Hospital, University of Queensland, Ipswich Road,Woolloongabba, Brisbane, Queensland 4102, Australia. 61Cardiovascular Medicine,University of Oxford, Wellcome Trust Centre for Human Genetics, Roosevelt Drive,Oxford OX3 7BN, UK. 62Genetics of Diabetes, Peninsula College of Medicine andDentistry, University of Exeter, Barrack Road, Exeter EX2 5DW, UK. 63Clinical andMolecular Genetics Unit, Institute of Child Health, University College London, 30Guilford Street, London WC1N 1EH, UK. 64The Wellcome Trust, Gibbs Building, 215Euston Road, London NW1 2BE, UK. 65Oxford NIHR Biomedical Research Centre,Churchill Hospital, Oxford OX3 7LJ, UK. 66Leicester NIHR Biomedical Research Unit inCardiovascular Disease, Glenfield Hospital, Leicester LE3 9QP, UK.
ARTICLES NATURE | Vol 464 | 1 April 2010
720Macmillan Publishers Limited. All rights reserved©2010
METHODSPilot experiment. Full details of Methods are given in the Supplementary
Information, but in brief a total of 384 samples from four different collections
spanning the range of DNA quality encountered in our previous WTCCC SNP-
based association study14 were assayed for 156 previously identified CNVs on
each of three different platforms: Agilent Comparative Genomic Hybridization
(CGH), and NimbleGen CGH (run in service laboratories) and Illumina iSelect
(run at the Sanger Institute). The pilot experiment contained many more probes
per CNV (40–90 depending on platform) than we anticipated using in the main
study, and replicates of these probes, to allow an assessment of data quality as a
function of the number of probes per CNV and of the merits of replicating
probes predicted in advance to perform well, compared to using distinct probes.
The Agilent CGH platform performed best in our pilot and we settled on an
array that comprised 105,072 long oligonucleotide probes. On the basis of the
pilot data we aimed to target each CNV with 10 distinct probes. Actual numbers
of probes per CNV on the array varied from this for several reasons (see
Supplementary Information and Supplementary Fig. 9), and we included in
our analyses any CNV with at least one probe on the array.
Array content, assay and samples for the main experiment. Array content: the
GSV discovery experiment12 involved 20 HapMap Utah residents with Euro-
pean ancestry (CEU) and 20 HapMap Yoruban (YRI) individuals, and
1 Polymorphism Discovery Resource individual, assayed via 20 NimbleGen
arrays containing a total of 42,000,000 probes tiled across the assayable portion
of the human reference genome. We prioritized CNVs for our experiment based
on their frequency in the discovery sample, with those identified in CEU indi-
viduals given precedence. A total of 10,835 out of 11,700 CNVs were included
from the list provided by the GSV, with those not included on the array being
present in discovery in only 1 YRI individual and not overlapping genes or highly
conserved elements. This list was augmented by any common CNVs not present
among the GSV list found from analyses of Affymetrix SNP 6.0 data in HapMap
2 samples (83 CNVs), Illumina 1M data in HapMap 3 samples (82 CNVs),
analyses of Affymetrix 500K samples (18 CNVs)7,29,30, and from our own analyses
of WTCCC1 SNP data (231 CNVs). In addition, we sought to identify CNVs not
present in the human reference sequence through analyses of published31,32 novel
sequence insertions (292 CNVs in total). Thus in total, our array targeted 11,541
putative CNVs. Ten non-polymorphic regions of the X chromosome were also
assayed for control purposes.
Most loci targeted on the CNV-typing array derive from microarray-based
CNV discovery, which is inherently imprecise. In contrast to SNP discovery by
sequencing, arrays do not provide nucleotide-level resolution, nor do they locate
additional copies of a sequence in the genome. As a result, when CNVs called in
different individuals overlap, but are not identical, these could be called as one or
two different CNVs, and where discovered CNVs involve probes which map to
multiple places in the reference genome, they might be called as CNVs in each of
these locations. Interpretation of counts of CNVs from discovery experiments is
thus not straightforward. Data on CNVs across thousands of individuals provide
added power to refine CNV definitions and derive a non-redundant set of CNVs.
In addition, our CNV-typing array draws together CNVs from different sources,
and additional redundancy between these, although minimized during array
design, can be identified and removed. Analyses of the final array design revealed
434 of the 11,541 CNVs to be redundant because they were targeted by exactly the
same probes as other CNVs on the array, and analysis of our array data revealed a
further 213 of 562 CNVs to be redundant from instances where overlapping
CNVs passing quality control were called as distinct in discovery yet had effec-
tively identical copy-number calls. See Supplementary Information Section 3.1
for further details on array content.
Assay: arrays were run at Oxford Gene Technology (OGT), with each plate
containing one control sample for quality control purposes. Primary data and
low-level summary statistics were produced at OGT. All substantive data ana-
lyses were undertaken within the consortium. Plates that failed pre-specified
quality control metrics were rerun on the array, and in addition we repeated
1,709 of the least well-performing samples, chosen according to our own quality
control analyses. (See Supplementary Information for further details.)
Samples: the WTCCC CNV study analysed cases from eight common diseases
(breast cancer, bipolar disorder, coronary artery disease, Crohn’s disease, hyper-
tension, rheumatoid arthritis, type I diabetes, and type 2 diabetes) and two control
cohorts (1958 Birth Cohort (58C) and the UK Blood Service collection (UKBS)).
The number of subjects from each cohort that were analysed and the numbers that
passed each phase of the quality control procedures within this study are shown in
Supplementary Table 7. For bipolar disorder, coronary heart disease, Crohn’s
disease, hypertension, rheumatoid arthritis, type 1 diabetes, type 2 diabetes and
the two control cohorts, a large proportion of the subjects studied in this experi-
ment were the same as those in the WTCCC1 SNP GWAS (Supplementary
Table 2). Where sufficient DNA was not available for the original WTCCC1
individuals, additional new samples from the same cohorts were used, selected
using the same approaches used for the WTCCC1 samples. Any samples that
failed any of the relevant quality control metrics in WTCCC1 were excluded from
consideration for this experiment. The breast cancer cohort was not included in
the WTCCC1 SNP GWAS.
Data pre-processing, CNV calling and quality control. Data pre-processing: for
each of the targeted loci, the subset of probes that target the locus of interest (at
least 1-bp overlap) while also targeting the least number of additional CNVs was
selected for assaying (see Supplementary Information Section 4.2 for more
details). A total of 16 different analysis ‘pipelines’ were used to create one-
dimensional intensity summaries for each CNV. First, a range of different methods
were used to create single intensity measurements for each probe from the red
channel (test DNA) and green channel (reference DNA) intensity data. This
included different methods for normalization of the signals (see Supplementary
Information Section 4.3 for details). Second, some pipelines incorporated a new
method called probe variance scaling (PVS) that weights probes based on informa-
tion derived from duplicate samples (see Supplementary Information Section 4.5
for details). Third, some pipelines used the first principal component of the nor-
malized probe intensities to summarize the probe-level data to CNV-level data,
whereas other pipelines used the mean of the probe intensities. Finally, some
pipelines additionally used a linear discriminant function (LDF) to refine further
the summaries based on information from an initial round of genotype calling (see
Supplementary Information Section 4.4 for details).
CNV calling: algorithmic details of the two calling methods used (CNVtools
and CNVCALL) are provided in Supplementary Information Section 6. Each
method was applied separately to the intensity summaries created from each of
the 16 pre-processing pipelines for each CNV locus.
Quality control: samples were excluded on the basis of sample handling errors,
evidence of non-European ancestry, evidence of sample mixing, manufacturer’s
recommendations on data quality, outlying values of various pre-calling and
post-calling quality metrics, and identity or close relatedness to other samples
(see Supplementary Information Section 5.1 for further details). To choose
which pipeline to use for a given CNV we used the pipeline that gave the highest
number of classes and the highest average posterior probability in cases where
more than one pipeline gave the same maximum number of classes. CNVs were
excluded that had identical probe sets to other CNVs, that were called with one
class in all pre-processing pipelines, that had low average posterior calls in all pre-
processing pipelines, or that had a high calls correlation with an overlapping
CNV (see Supplementary Information Section 5.2 for further details).
Properties of CNVs. Single class CNVs: Supplementary Table 15 shows the
proportion of the single-class CNVs from the GSV discovery project broken down
according to the number of individuals and population(s) in which they were
discovered. Of the GSV CNVs discovered in CEU, 52% are single class in our data,
whereas a higher proportion (74%) of GSV CNVs discovered exclusively in YRI
are single class, as would be expected. CNVs at which distinct copy number classes
cannot be distinguished might result because: (1) although polymorphic, the
signal to noise ratio at that CNV does not allow reliable identification of distinct
copy-number classes; (2) the copy-number variant has an extremely low popu-
lation frequency; or (3) the CNV was a false positive in a discovery experiment and
is in fact monomorphic. In a genuinely polymorphic CNV, the intensity measure-
ments within a pair of duplicates should be more similar than between a random
pair of distinct individuals. Intensity comparisons between duplicates and
random pairs of individuals thus allow estimates of the proportion of single-class
CNVs which are not copy-number variable in our data (see Supplementary
Information). These estimates range from ,23% for single-class CNVs dis-
covered in two or more CEU individuals to ,50% of single-class CNVs dis-
covered exclusively in YRI (see Supplementary Information for details). We
estimate that 18% of GSV CNVs discovered in CEU do not exhibit polymorphism
in our UK sample. This figure is similar to the GSV estimate for false positives in
discovery of 15%12. Overall, considering CNVs on the array from all sources, we
estimate that 26% do not exhibit polymorphism, so that just under half of the
CNVs that seem in our data to have a single class are likely not to be polymorphic.
Not all of these will be false positives in discovery; some represent CNVs that are
either unique to the individual in which they were discovered or are extremely rare
in the UK population.
Multi-class CNVs: a companion study12 estimated that 83% of the bi-allelic
CNVs it genotyped represent deletions, with the remainder being duplications.
Supplementary Table 7 compares the number of copy-number classes estimated
by the two calling algorithms used in the analyses for each of the CNVs passing
quality control. Most differences in numbers of called classes between the algo-
rithms arise from CNVs where one class is very rare and is handled differently by
the algorithms (for example, called as a separate class in one algorithm but
classed as outlier samples or merged with a larger class by the other).
doi:10.1038/nature08979
Macmillan Publishers Limited. All rights reserved©2010
These 3,432 CNVs include 80% of the CNVs genotyped on the Affymetrix 6.0array that are common (MAF .5%) in a population with European ancestry33;
conversely only 15% of the common CNVs we called could be called using the
Affymetrix 6.0 array.
Allele frequencies: we calculated minor allele frequencies (MAFs) for 2- and
3-class CNVs by assuming that these CNVs were biallelic and using the expected
posterior genotype counts (see Supplementary Information Section 7.3 for further
details).
Tagging by SNPs: to determine how well tagged the CNVs analysed in our
experiment were by SNPs, we carried out correlation analyses using control
samples that were common to the current studies and other WTCCC studies.
We analysed three different collections of SNPs. We used imputed HapMap2
SNP calls in the WTCCC1 study that used the Affymetrix 500k array, and actual
calls from the WTCCC2 study using both the Affymetrix 6.0 array and a custom
Illumina 1.2M array. In all cases we used samples from the UKBS collection (see
Supplementary Information Section 7.1 for further details).
Geographical variation: geographical information, at the level of 13 pre-defined
regions of the UK, was available for 82% of the samples in our study and we
undertook analyses for differences in copy-number class frequencies betweenregions. The results, shown in Supplementary Fig. 24, confirm that there is no
major genome-wide population structure, but that, unsurprisingly, there is dif-
ferentiation at CNVs within HLA. It does not seem easy to determine whether
other regions with low P values in this test represent genuine departures from the
null hypothesis of no differentiation, rather than chance effects, although we note
that the third most regionally differentiated CNV outside the HLA (CNVR7722.1,
P 5 3 3 1025, 12-d.f.) is a deletion located within the gene LILRA3, which may act
as soluble receptor for class I MHC antigens, and so would be consistent with the
observed HLA stratification. This deletion is also the subject of a reported disease
association34 in multiple sclerosis, a finding that may require some caution given
the level of geographical stratification at this CNV in our data. (See
Supplementary Information Section 9.1 for further details.)
Association testing. Diagnostic plots such as quantile–quantile and cluster plots
were created using R. Cluster plots were visually inspected for all CNVs with
putative associations.
Principal component analysis (PCA) was applied to the summarized intensity
levels for all CNVs, and for all samples that passed quality control. Plots of the
first ten principal components were coloured by various sample parameters andthese revealed some of the artefacts described in Box 1.
Where possible, replication was carried out by using data from other studies
for SNPs that tag the CNVs of interest. Where there was no SNP tag available,
breakpoint or direct quantitative CNV assays were designed (see Supplementary
Information Section 9 for further details).
We used a two-sided Wilcoxon signed-rank test to test for differences between
distributions of Bayes factors between different subsets of CNVs (those that
delete all or part of an exon versus those that do not, and CNVs that are well-
tagged by SNPs versus those that are not well tagged). (See Supplementary
Information Section 9.5 for further details.)
Testing for population stratification: all our samples are from within the UK,
and we have excluded any for which the genetic data suggest evidence of non-
European ancestry. All collections in this study, apart from breast cancer, were
involved in the WTCCC SNP GWAS, and across these collections 80% of sam-
ples coincided between the two studies. Analysis of the WTCCC SNP data14
established that population structure was not a major factor confounding asso-
ciation testing. Similar analyses using SNP data available for the breast cancer
samples yielded similar results (data not shown). These SNP results reinforce the
evidence from the quantile–quantile plots in Supplementary Fig. 23 and our
geographical analyses of the CNV data.
Expanded reference group analysis: in addition to our primary case-control
analyses, following ref. 14 we also undertook expanded reference group analyses,
in which copy-number class frequencies in cases for a particular disease are
compared with those for controls and the other diseases with no aetiological
or known genetic connection (see Supplementary Table 10 for details).
Other analyses. We used information on variability between duplicate samples
to determine whether CNVs called with one class show signals of polymorphism
(details are given in Supplementary Information Section 9.2).
We used estimates of the number of common autosomal CNVs segregating in
a population of European ancestry from ref. 12 to estimate the coverage of
common autosomal CNVs in our study (see Supplementary Information
Section 9.3 for further details).
We designed a series of PCR primers to analyse further the complex signals
associated with CNVR5583.1 found in the TSPAN8 region. (See Supplementary
Information Section 9.4 for further details.)
29. International HapMap Project. Æhttp://hapmap.ncbi.nlm.nih.gov/æ (2010).30. Redon, R. et al. Global variation in copy number in the human genome. Nature 444,
444–454 (2006).31. Levy, S. et al. The diploid genome sequence of an individual human. PLoS Biol. 5,
e254 (2007).
32. Kidd, J. M. et al. Mapping and sequencing of structural variation from eight humangenomes. Nature 453, 56–64 (2008).
33. McCarroll, S. A. et al. Integrated detection and population-genetic analysis ofSNPs and copy number variation. Nature Genet. 40, 1166–1174 (2008).
34. Koch, S. et al. Association of multiple sclerosis with ILT6 deficiency. Genes Immun.6, 445–447 (2005).
doi:10.1038/nature08979
Macmillan Publishers Limited. All rights reserved©2010