Processing Phoneme Specific Segments for Cleft Lip ... - arXiv
Upload
independentCategory
view
1download
0
Fax +41 61 306 12 34E-Mail [email protected]
Original Paper
Hum Hered 2009;68:151–170 DOI: 10.1159/000224636
Genome Scan, Fine-Mapping, and Candidate Gene Analysis of Non-Syndromic Cleft Lip with or without Cleft Palate Reveals Phenotype-Specific Differences in Linkage and Association Results
Mary L. Marazita a–c Andrew C. Lidral e Jeffrey C. Murray f L. Leigh Field i Brion S. Maher h
Toby Goldstein McHenry a Margaret E. Cooper a Manika Govil a Sandra Daack-Hirsch g
Bridget Riley j Astanand Jugessur k Temis Felix l Lina Morene e M.Adela Mansilla f
Alexandre R. Vieira a, b, d Kim Doheny m Elizabeth Pugh m Consuelo Valencia-Ramirez n
Mauricio Arcos-Burgos o
a Center for Craniofacial and Dental Genetics, Department of Oral Biology, School of Dental Medicine, and b Department of Human Genetics, Graduate School of Public Health, c Department of Psychiatry, School of Medicine, and d Department of Pediatric Dentistry, School of Dental Medicine, University of Pittsburgh, Pittsburgh, Pa. ; Departments of e Orthodontics, College of Dentistry, f Pediatrics College of Medicine, and g College of Nursing, University of Iowa, Iowa City, Iowa ; h Department of Psychiatry, Virginia Commonwealth University, Richmond, Va. , USA; i Department of Medical Genetics, University of British Columbia, and B.C. Research Institute for Children’s and Women’s Health, Vancouver, BC , Canada; j New York University School of Medicine, New York, N.Y. , USA; k Craniofacial Development, Musculoskeletal Disorders, Murdoch Childrens Research Institute, Royal Children’s Hospital, Melbourne , Australia; l Hospital de Clinicas Porto Allegre-RS, Universidade Federal do Rio Grande do Sul , Brazil; m Center for Inherited Disease Research, Institute of Genetic Medicine, Johns Hopkins University School of Medicine, Baltimore, Md. , USA; n College of Dentistry, Universidad de Antioquia, Medellin , Colombia , and o Division of Child Psychiatry, Department of Psychiatry and Behavioral Sciences, Leonard M. Miller School of Medicine, University of Miami, Miami, Fla. , USA
testing and incorporate the genome scan results. Results: Significant (multipoint HLOD 6 3.2) or genome-wide-signif-icant (HLOD 6 4.02) linkage results were found for regions 1q32, 2p13, 3q27-28, 9q21, 12p11, 14q21-24 and 16q24. SNPs in IRF6 (1q32) and in or near FOXE1 (9q21) reached formal ge-nome-wide wFDR-adjusted significance. Further, results were phenotype dependent in that the IRF6 region results were most significant for families in which affected individu-als have CL alone, and the FOXE1 region results were most significant in families in which some or all of the affected in-dividuals have CL with CP. Conclusions: These results high-light the importance of careful phenotypic delineation in large samples of families for genetic analyses of complex, heterogeneous traits such as CL/P.
Copyright © 2009 S. Karger AG, Basel
Key Words
Cleft lip � Cleft palate � Linkage � Association � wFDR � IRF6 � FOXE1 � Genetics
Abstract
Objectives: Non-syndromic orofacial clefts, i.e. cleft lip (CL) and cleft palate (CP), are among the most common birth de-fects. The goal of this study was to identify genomic regions and genes for CL with or without CP (CL/P). Methods: We performed linkage analyses of a 10 cM genome scan in 820 multiplex CL/P families (6,565 individuals). Significant link-age results were followed by association analyses of 1,476 SNPs in candidate genes and regions, utilizing a weighted false discovery rate (wFDR) approach to control for multiple
Received: December 2, 2008 Accepted after revision: February 12, 2009 Published online: June 11, 2009
Mary L. Marazita, PhD Center for Craniofacial and Dental Genetics University of Pittsburgh, Suite 500 Bridgeside Point 100 Technology Dr., Pittsburgh, PA 15219 (USA) Tel. +1 412 648 8380, Fax +1 412 648 8779, E-Mail [email protected]
© 2009 S. Karger AG, Basel0001–5652/09/0683–0151$26.00/0
Accessible online at:www.karger.com/hhe

Marazita et al. Hum Hered 2009;68:151–170152
Introduction
Orofacial clefts (OFC) are a major public health prob-lem, affecting one in every 500–1000 births worldwide. It has become increasingly apparent that the genetic contri-bution to OFC is complex, probably heterogeneous, and likely due to interacting effects of multiple loci coupled to environmental covariates. Over 400 syndromes have been described in which a cleft of the lip and/or palate is a feature [1] . Among these syndromes are numerous ge-netic examples such as cytogenetic abnormalities (e.g., trisomies 13 and 18, 4p–), and single gene Mendelian dis-orders (e.g. van der Woude syndrome, Stickler syndrome). Non-syndromic (sometimes termed ‘isolated’) cleft lip with or without cleft palate (NS CL/P) is the most preva-lent type of OFC, and is the focus of the current study.
Familial aggregation of NS CL/P has been reported in the scientific literature for 250 years [2–7] . Since then, segregation analyses of CL/P have supported models that include genes of major effect [8–10] , and analyses of re-currence risk patterns have been consistent with esti-mates ranging from 3 to 14 genes (possibly interacting) for CL/P [11–15] .
Mutation screens of more than 20 NS CL/P candidate genes find that 2–6% of the total number of individuals with NS CL/P have mutations in genes such as MSX1, FOXE1, GLI2, JAG2, LHX8, SATB2, RYK1 and others [16–18] . That is, the large majority of individuals with NS CL/P (94–98%) do not have mutations in any of a wide range of plausible candidate genes. In parallel, many candidate gene association studies have also been carried out seek-ing specific polymorphic variants that increase the risk of NS CL/P [1, 19–22] .
Most notably, the gene identified in van der Woude syndrome ( IRF6 [23] ) has been shown by our group [24] and confirmed in multiple other populations (Italy [25] ; Belgium [26] ; US [27] ; Thailand [28] ; US/Taiwan/Singa-pore/Korea [29] ; South America [30] ; Norway [31] ) to show highly significant association with NS CL/P and may explain about 12–18% of NS CL/P [24] . Recently we have identified a specific SNP (rs642961) in IRF6 that dis-rupts the binding site for the transcription factor AP-2 � , and that represents the etiologic locus within IRF6 , at least in some populations [32] .
In addition to analyses of candidate genes/loci, several genome-wide linkage screens of NS CL/P have been pub-lished [33–38] . About 8–10 regions have positive, although not highly significant, results in the individual studies. We performed a genome scan meta-analysis of these 5 published genome scans plus data from our additional
studies in six countries and found several regions with genome-wide significant results [38] , notably a novel re-gion on 9q21. The purpose of this study is to describe a larger genome-wide scan for NS CL/P with twice as many families and individuals as were reported previously [38] , to summarize the results of our follow-up fine mapping and candidate gene efforts, and to perform phenotypic-specific analyses. Thus the aim was to identify those ge-netic regions that appear to contribute to OFC overall, and also those regions that appear to have an effect on specific OFC phenotypes.
Subjects and Methods
Study Populations This study was conducted in two phases: (1) linkage genome-
scan, and (2) fine mapping and candidate gene studies. For the genome-scan, there were 820 families ascertained in six countries (Philippines, Colombia, China, India, Turkey, USA), with 6,565 total individuals (summarized in table 1 ). Of the total family members, 4,373 were genotyped (1,514 affected and 2,859 unaf-fected). For fine-mapping and candidate gene studies, there were 861 families, with 7,047 total individuals (summarized in table 2 ), representing a subset of the 820 genome-scan families plus addi-tional families that were ascertained after the genome-scan was completed. Most of the families were extended multiplex kin-dreds, i.e. multigenerational families with 6 2 affected individu-als. The largest family had 51 individuals; there were 5 pedigrees with 40–50 individuals, 10 with 30–40; 46 with 20–30, many with 10–20 individuals. Each study had approval by the appropriate institutional review boards, and all study subjects provided in-formed consent to participate. Note that the original 388 genome-scan families [38] were also included in the current study (denot-ed ‘CIDR-7 families’ in the previous report [38] ).
The phenotype was NS CL/P, i.e. for families to be included, it was necessary that the proband have NS CL/P (i.e. no other anom-alies), and that no other family member have an indication of an OFC syndrome (e.g. lip pits). Each study included evaluations of family members by clinical geneticists to rule out syndromic forms of CL/P.
For some analyses, the total families were divided into the fol-lowing non-overlapping subsets based on family members report-ed to be affected (whether or not all affected family members par-ticipated in these studies): CL, those families in which all affected family members had CL only; CLP (all affected family members had CL plus CP); CL+CLP (at least one affected family member had CL only and at least one had CL plus CP). The numbers of families and individuals in each of these subsets are summarized in table 1 (genome-scan dataset) and table 2 (fine-mapping dataset). There was one additional subset that had very few families and was there-fore not included in the subset studies reported here, i.e. families in which at least one affected family member had CP only.
Genome Scan Genotyping The genome scans were conducted in multiple batches (the
previous report [38] summarized results from the first two batch-

Linkage and Fine-Mapping of CL/P Hum Hered 2009;68:151–170 153
es of genotyping). Microsatellite genotyping for all batches was performed at the Center for Inherited Disease Research (CIDR) using STRP markers with average spacing of about 9 cM (1–19 cM). Marker set details and methods are available at www.cidr.jhmi.edu.
Trace data was reviewed and genotypes were called using the software package Genotyper from Applied Biosystems. The raw genotype sizes for each genotype were exported from Genotyper and binned using SAS. Study samples were plated with 2 CEPH Utah control samples 1331-1 and 1331-2 repeated on each plate. For each microsatellite marker the CEPH control sample sizes for each plate were compared to the project average and used to adjust the raw sizes for all data for that plate. Data with similar raw sizes
were grouped into proposed ‘binned’ alleles. Plots were made for each marker showing the overall as well as by plate allele sizes and proposed bins for both the raw and adjusted size data. Each plot was manually reviewed by at least two data analysts. Trace data for unexpected sizes for CEPH controls and outliers that didn’t fall within bins were reviewed in Genotyper. Trace data was also reviewed for markers with high numbers of mendelian errors ac-cording to Pedcheck [39] . Binning parameters and plate adjust-ments were done manually if needed.
After the entire dataset was genotyped, all alleles were re-binned across batches before performing the analyses reported here. The final combined dataset consisted of 375 STRP markers which were genotyped in all three sample submissions. Quality
Table 1. Summary of families and individuals ascertained for genome-scan linkage analyses
Country Fam-ilies
Individuals Subsetsa
affected unaffected total CL CLP CL+CLP
genotyped genotyped genotyped nfams
n nfams
n nfams
n
yes no total yes no total yes no total
China 72 98 17 105 246 134 380 344 151 495 19 105 31 189 18 173Colombia 163 266 15 281 386 369 755 652 384 1,036 18 92 112 588 31 342India 11 18 4 22 63 77 140 81 81 162 5 71 0 0 6 91Philippines 462 928 44 972 1,848 1,292 3,140 2,776 1,336 4,112 79 362 230 1,504 132 1,900Turkey 6 8 0 8 9 32 41 17 32 49 0 0 0 0 2 12USA 106 196 24 220 307 184 491 503 208 711 15 70 47 245 33 298Total 820 1,514 104 1,618 2,859 2,088 4,947 4,373 2,192 6,565 136 700 420 2,526 222 2,816
a Subsets: CL = those families in which all affected members had CL alone; CLP = those families in which all affected members had CL and CP; CL+CLP = those families in which at least one affected member had CL alone and at least one had CL+CP; n fams = number of families.
Table 2. Summary of families and individuals ascertained for fine-mapping studies
Country Fam-ilies
Individuals Subsetsa
affected unaffected total CL CLP CL+CLP
genotyped genotyped genotyped nfams
n nfams
n nfams
n
yes no total yes no total yes no total
China 104 168 33 201 258 461 719 426 494 920 24 174 42 337 33 372Colombia 232 349 12 361 577 362 939 926 374 1,300 23 108 174 826 35 366India 53 94 42 136 210 380 590 304 422 726 22 253 5 86 24 356Philippines 221 600 47 647 1,090 1,108 2,198 1,690 1,155 2,845 20 178 82 932 112 1,589Spain 36 41 2 43 86 7 93 127 9 136 5 22 25 93 4 14Turkey 28 32 5 37 53 189 242 85 194 279 6 59 15 158 7 62USA 187 231 24 255 413 173 586 644 197 841 42 142 99 335 36 307Total 861 1,515 165 1,680 2,687 2,680 5,367 4,202 2,845 7,047 142 936 442 2,767 251 3,066
a Subsets: CL = those families in which all affected members had CL alone; CLP = those families in which all affected members had CL and CP; CL+CLP = those families in which at least one affected member had CL alone and at least one had CL+CP; n fams = number of families.

Marazita et al. Hum Hered 2009;68:151–170154
control was monitored by investigator-provided blind duplicate samples. 220 blind duplicate pairs across all three sample submis-sions resulted in a reproducibility rate of 99.95%.
Candidate Gene SNP Genotyping After the results of the linkage genome scan, the families were
genotyped by CIDR for a custom panel of 1,536 single nucleotide polymorphisms (SNPs), of which 1,476 were analyzed (list avail-able on request, see below for reasons some SNPs were not ana-lyzed).
SNPs were chosen to saturate the 1-LOD regions for each ge-nome-wide significant region found in the linkage scan, targeting all known genes in each region, with 2–6 SNPs per gene and fill-ing intergenic gaps 1 100 kb with 1 SNP per 20 kb. In addition, SNPs in cleft candidate genes were included in the custom panel, and were chosen from a variety of resources, including published linkage and association studies on clefts, genome-wide scans, gene knockout experiments in mice, studies of chromosomal re-arrangements in humans, and gene-expression analyses in hu-man and mouse embryonic tissues [20, 40–43] , including the Cra-niofacial and Oral Gene Expression Network [44] (COGENE). We also searched the Serial Analysis of Gene Expression (SAGE) li-braries to see whether a particular gene of interest is expressed in the relevant embryonic tissues at the pertinent developmental stage (weeks 5–6 for fusion of the embryonic lip and weeks 7–10 for fusion of the palatal shelves [45] ). Data from two gene expres-sion approaches were also considered, the ENU project [46] , and the Developmental Genome Anatomy Project (DGAP [47] ). Fi-nally genes involved in Mendelian forms of clefting, particularly those that may manifest as phenocopies of NS CL/P (identified through OMIM) were considered.
To guide the selection of SNPs within the candidate genes and regions, the genome browser of the International HapMap Con-sortium was used. SNPs were prioritized according to prior evi-dence of an association with clefting, a preference for coding SNPs and those located in putative regulatory regions, haplotype-tagging properties (htSNPs), and minor allele frequency (MAF) of at least 10%, ideally across the multiple ethnicities represented in this study.
A combination of software, including HAPLOVIEW version 2.05, BEST (Best Enumeration of SNP Tags [48] ), and SNP Brows-er) (Applied Biosystems; Foster City, Calif., USA), was used to evaluate MAF, deviations from Hardy-Weinberg equilibrium
(HWE), inter-marker distance, as well as LD patterns and haplo-type block structures (for the selection of htSNPs). SNP assays were designed by Illumina (San Diego, Calif., USA) and a ‘design score’ was computed for each SNP using an algorithm that rigor-ously tests the performance of that SNP on an Illumina Golden-Gate platform.
SNP genotyping was performed at CIDR on a BeadLab system using the Illumina GoldenGate technology [49] (Illumina; San Di-ego, Calif., USA). Genotypic data for 1,489 of 1,536 attempted SNPs were released by CIDR. The overall rate of missing geno-typic data was 0.35%. As part of quality control, CIDR genotyped a parent-child trio plus one duplicate child, which yielded a dupli-cate error rate of 0.009% and an overall parent-child discordance rate of zero. Of the 1,489 SNPs released after CIDR quality control checks, 13 more were not included in our analysis due to poor per-formance in one or more of the individual study populations (e.g. low MAF or high rates of mendelian inconsistencies). Therefore, results are reported here for the remaining 1,476 SNPs.
Statistical Genetic Analyses Preliminary Analyses The inheritance of each marker (genome-wide STRPs and
custom SNPs) was assessed with PedCheck [39] to test for incon-sistencies due to non-paternity or other errors. Marker allele fre-quencies are required by linkage analysis approaches and were estimated in the founders of the families, separately by country due to the diverse ethnicities. Other genetic model parameters are summarized in table 3 , and were taken from the results of segre-gation analysis (Philippines – unpublished results; China [10] ; In-dia [50] ; Colombia [51] ; Caucasians [9, 52, 53] ).
Parametric Linkage Analyses Standard multipoint parametric linkage statistics were calcu-
lated at each of the 375 genome-scan STRPs, in particular the heterogeneity LOD score or HLOD. HLODs are based on the ad-mixture heterogeneity test [54] where the recombination fraction ( � ) and the proportion of linked families ( � ) are simultaneously estimated. Simulation studies have shown that although the esti-mate of the proportion of linked families may be not be precise, HLODs are a powerful method for detecting linkage in the pres-ence of heterogeneity [55–57] . The descent graph method [58] im-plemented in computer program SIMWALK2 was used for the multipoint HLOD calculations.
Table 3. Summary of genetic model parameters used for parametric linkage analysis in each country, plus weights for meta-analysis
Recessive Dominant Weights formeta-analysisFreqA penAA penAB penBB FreqA penAA penAB penBB
China 0.05 0.002 0.002 0.9 0.001 0.002 0.6 0.6 0.93268Colombia 0.05 0.002 0.002 0.9 0.001 0.002 0.6 0.6 1.28306India 0.05 0.002 0.002 0.9 0.001 0.002 0.6 0.6 0.45258Philippines 0.04 0.002 0.002 0.9 0.002 0.002 0.6 0.6 2.61734Turkey 0.05 0.002 0.002 0.9 0.001 0.002 0.6 0.6 0.12318USA; Pittsburgh 0.05 0.002 0.002 0.9 0.001 0.002 0.6 0.6 0.71294USA; other than Pittsburgh 0.05 0.002 0.002 0.9 0.001 0.002 0.6 0.6 0.87822
Linkage and Fine-Mapping of CL/P Hum Hered 2009;68:151–170 155
HLOD calculations were done under the best-fitting domi-nant and recessive models for each study population (estimated from segregation analysis, see preliminary analyses section above and table 3 ). Maximizing LOD scores over a range of genetic mod-els is valid for simultaneously evaluating linkage and determining the most likely genetic model (without adjustment to significance levels and without need to correct for ascertainment) provided that there is indeed linkage [59] . Furthermore, if an oligogenic model is suspected (as seems likely for CL/P), or if significant het-erogeneity exists, some of the causal genes may act in a dominant fashion and others recessive.
To combine the multipoint results across the study popula-tions we summed the multipoint HLODs. Because each study population had different allele frequency estimates and different genetic model parameters it was not optimal to perform a com-bined linkage analysis pooling all families across all populations. Simulation studies [55] have shown that HLOD analyses that pooled multiple datasets resulted in a loss of power for detect-ing linkage compared to summing the HLODs from individual studies.
For determining genome-wide significance for the multipoint linkage calculations of the families, standard guidelines [60] were followed. A Bonferroni correction was applied to account for the multiple markers, data subsets, and genetic models tested. To do so, the desired � level of 0.05 was divided by [375 (number of markers) ! 4 (number of data subsets) ! 2 (number of genetic models tested)] to yield a Bonferroni-adjusted alpha of 0.000017. The �2 corresponding to the p value (i.e. 18.5) was divided by 2(log e 10) = 4.605 to yield 4.02 as the LOD score threshold for ge-nome-wide significance for this study. Values between 3.2 and 4.02 were considered as significant but not genome-wide signifi-cant.
Genome Scan Meta-Analysis As an additional method used primarily to estimate the
weighting factors for the weighted FDR approach summarized below, we used the genome scan meta-analysis method (GSMA [38, 61, 62] ). The GSMA is a nonparametric rank ordering meth-od that can combine genome scan methods across studies with different markers and different statistical tests. In simulation studies the GSMA detected linkage with power comparable to or greater than that obtained by performing a combined linkage analysis of all data [62, 63] .
For the GSMA procedure, the genome was divided into bins with bin-width selected such that there were at least two bins on the smallest chromosome and at least one marker was genotyped within each bin. Therefore, for combining the current 10 cM ge-nome scans a bin width of 30 cM was selected (i.e. 130 bins across the genome). For each of the individual populations, bins were assigned a rank (R, with values from 1 to 130) according to the maximum linkage statistic of markers in each bin (multipoint HLOD scores). Any tied bins were assigned equal R’s based on the mean of the sequential ranks for those bins.
Because the study populations covered a wide range of sample sizes (see table 1 ), we weighted the R statistics based on sample size. Various weighting strategies have been proposed for the GSMA [61, 62] , and simulation studies showed that weighting in-creased the power of the GSMA to detect linked loci [62] . We used a weighting factor based on the total number of genotyped indi-viduals ( N-genotyped) – the ranks within each population were
multiplied by the square root of N-genotyped divided by the mean of N- genotyped over all studies. The weighting factors calculated for each population are listed in table 3 .
The GSMA identified 30 cM bins that are best supported across the studies. In order to narrow the regions of positive find-ings, we used an extension of the GSMA that involves repeating the GSMA with different bin starting points and then determin-ing the Minimum Region of Maximum Significance (MRMS [64] ). In brief, we repeated the GSMA twice more shifting the starting point for the binning procedure to first 10 cM and then to 20 cM. This determined the 10 cM MRMS for each positive finding. Given that the genome scan STRP panel averaged 10 cM between markers, 10 cM was the limit of resolution for the meta-analyses.
Association Analysis Methods (Fine-Mapping and Candidate Genes) The transmission disequilibrium test (TDT) was used to as-
sess association in the presence of linkage disequilibrium be-tween the 1,476 fine-mapping markers and CL/P. The Family Based Association Test extension of the TDT (FBAT [65–67] ) was used to assess association between each SNP and CL/P. To control for multiple testing and to include information from the prior linkage genome scan we performed a weighted approach to false discovery rate (wFDR [68] ). In this approach, per marker FBAT p values were adjusted using weights derived from the GSMA/MRMS results, and allowing for a maximum 10% FDR.
Results
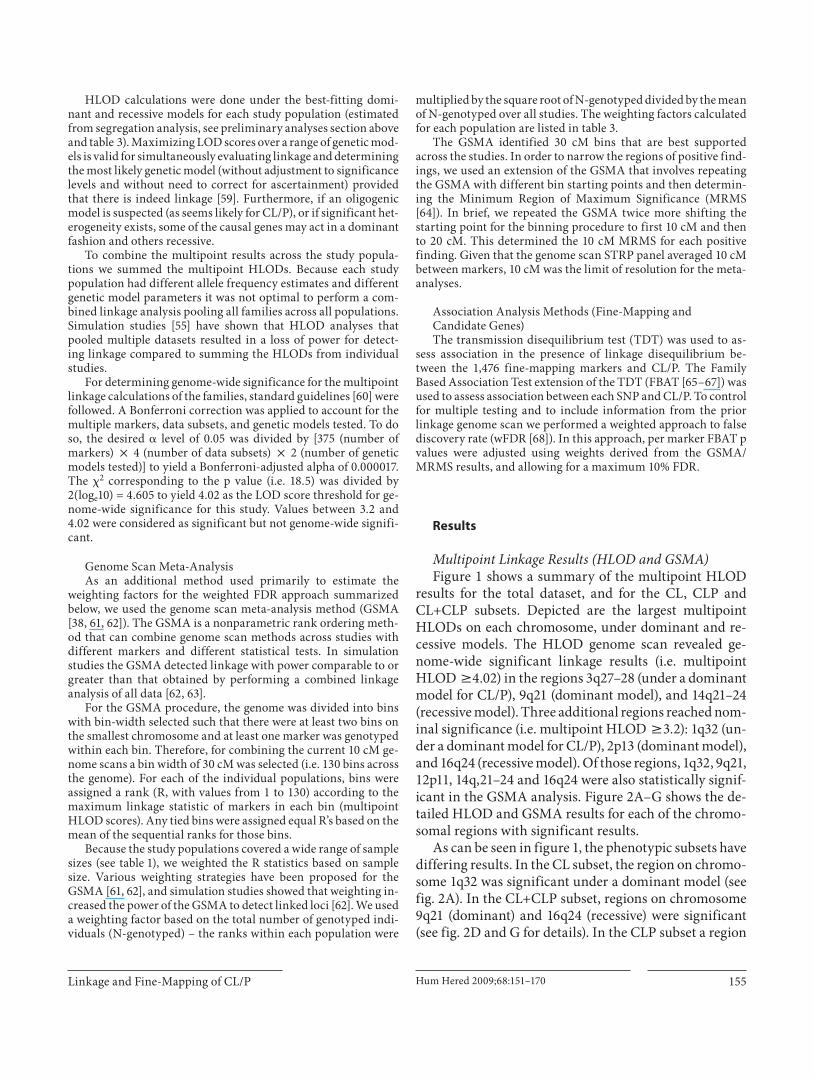
Multipoint Linkage Results (HLOD and GSMA) Figure 1 shows a summary of the multipoint HLOD
results for the total dataset, and for the CL, CLP and CL+CLP subsets. Depicted are the largest multipoint HLODs on each chromosome, under dominant and re-cessive models. The HLOD genome scan revealed ge-nome-wide significant linkage results (i.e. multipoint HLOD 6 4.02) in the regions 3q27–28 (under a dominant model for CL/P), 9q21 (dominant model), and 14q21–24 (recessive model). Three additional regions reached nom-inal significance (i.e. multipoint HLOD 6 3.2): 1q32 (un-der a dominant model for CL/P), 2p13 (dominant model), and 16q24 (recessive model). Of those regions, 1q32, 9q21, 12p11, 14q,21–24 and 16q24 were also statistically signif-icant in the GSMA analysis. Figure 2 A–G shows the de-tailed HLOD and GSMA results for each of the chromo-somal regions with significant results.
As can be seen in figure 1 , the phenotypic subsets have differing results. In the CL subset, the region on chromo-some 1q32 was significant under a dominant model (see fig. 2 A). In the CL+CLP subset, regions on chromosome 9q21 (dominant) and 16q24 (recessive) were significant (see fig. 2 D and G for details). In the CLP subset a region

Marazita et al. Hum Hered 2009;68:151–170156
on chromosome 12p11 was significant under a dominant model (see fig. 2 E). Table 4 summarizes the chromosom-al regions with significant linkage results in the TOTAL dataset and the phenotypic subsets, plus potential CL/P candidate genes in those significant regions.
Fine-Mapping and Candidate Gene Analyses Figure 3 shows the weighted p values and weighted FDR
alpha levels for the total dataset, and the CLP and CL+CLP datasets. One SNP in IRF6 and 3 SNPs in or near FOXE1 were the only ones reaching formal weighted-FDR-adjust-ed significance (p ! 10 –7 , and p ! 10 –6 , respectively) in the total dataset. Although not reaching formal genome-wide significance, additional SNPs on 1q, 6q and 9q were near significant (p ! 0.001, results not shown in detail).
Of the phenotypic subsets, only CLP had SNPs reach-ing genome-wide significance: i.e., 5 SNPs in or near FOXE1 on 9q. Although not reaching genome-wide sig-nificance, the most significant SNP in both the CL and
CL+CLP phenotypic subsets was in IRF6 (p ! 0.001 and p ! 0.002, respectively), and was the same SNP signifi-cant in the TOTAL dataset. Table 5 summarizes the ge-nome-wide significant SNPs in the total dataset and in the CLP subset.
Discussion
The genome scan revealed multiple significant linkage results (i.e. multipoint HLOD 6 3.2) in the regions 1q32, 2p13, 3q27–28, 9q21, 14q21–24 and 16q24 for the TOTAL dataset, with the 3q, 9q and 14q regions also genome-wide significant (HLOD 6 4.02). The 1q32 region result was also significant in the CL subset but not the others, imply-ing that the significant linkage was due to the CL families. Similarly, the 9q21 and 16q24 results were also genome-wide significant in the CL+CLP subset. In the CLP subset, an additional region of significance was found for the
0
1
a
2
3
4
5
6
Sum
med
mul
tip
oin
t LO
D
1 2 3 4 5 6 7 8 9 10 11 12 13 14 15 16 18 19 20 21 2217
All
Chromosome
0
1
b
2
3
4
5
6
Sum
med
mul
tip
oin
t LO
D
1 2 3 4 5 6 7 8 9 10 11 12 13 14 15 16 18 19 20 21 2217
CL-only
Chromosome
DOM LODREC LOD
0
1
c
2
3
4
5
6
Sum
med
mul
tip
oin
t LO
D
1 2 3 4 5 6 7 8 9 10 11 12 13 14 15 16 18 19 20 21 2217
CLCLP-only
Chromosome
0
1
d
2
3
4
5
6
Sum
med
mul
tip
oin
t LO
D
1 2 3 4 5 6 7 8 9 10 11 12 13 14 15 16 18 19 20 21 2217
CLP-only
Chromosome
Fig. 1. Summary of the 10 cM genome scan of CL/P. Each graph depicts the maximum summed multipoint HLOD on each chro-mosome, under both dominant (black) and recessive (grey) ge-netic models assumed. A Summary for TOTAL, the entire dataset. B Summary for the CL subset, i.e. those families in which all af-
fecteds have CL alone. C Summary for the CL+CLP subset, i.e. those families in which at least one affected has CL alone and at least one has CL+CP. D Summary for the CLP subset, i.e. those families in which all affected members have CL+CP.

Linkage and Fine-Mapping of CL/P Hum Hered 2009;68:151–170 157
12p11 region. The remaining two regions (2p11, 3q27–28) were not significant in any individual subset, implying that these regions may be involved in OFC overall, rather than any specific phenotype. Also, note that in each case where there were significant findings in one of the pheno-typic subgroups, the estimated proportion of linked fam-ilies ( � ) was larger in the subgroup than in the total data-
set (see table 4 ), further supporting the notion that phe-notypic sub-grouping may be a useful approach to reduce heterogeneity across cleft families.
Follow-up fine-mapping association studies found SNPs in IRF6 (chromosome 1q) and in or near FOXE1 (chromosome 9q) that reached formal FDR-adjusted sig-nificance (see table 5 ), and SNPs in 6q were near signifi-
Table 4. Significant linkage and meta-analysis results
Chromosomalregion
Phenotypicsubset
MaximumsummedmultipointHLODa
Linkagepeak: cMlocation
Model Average�
GSMA/MRMSpeak (p value)b
Candidate genes inregion
1q32 TOTAL 3.35 170.3 dom 0.29 150–160 (0.02) IRF6CL 3.24 171.0 dom 0.47 –
2p13 TOTAL 3.25 69.0 dom 0.31 – TGFA3q27–28 TOTAL 4.13 204.2 dom 0.34 – TP639q21 TOTAL 5.37 118.2 dom 0.41 100–110 (0.0007) FOXE1, PTCH, ROR2,
TGFBR1, ZNF189CL+CLP 5.44 116.4 dom 0.46 –
12p11 CLP 3.22 83.0 dom 0.25 40–50 (0.02)14q21–24 TOTAL 4.18 75.1 rec 0.31 60–70 (0.01) PAX9, TGFB3, BMP416q24 TOTAL 3.56 84.5 rec 0.16 100–110 (0.01) CRSPLD2, FOXC2
CL+CLP 3.42 81.0 rec 0.24 –
a Maximum summed HLOD = maximum multipoint HLOD summed over the individual studies (see table 1 for list; see fig. 1 and 2 for full HLOD plots), presented are significant regions,. i.e. with HLOD ≥3.2). Genome-wide significant results (i.e. HLOD ≥4.02) are in bold. Pe ak = cM location of the maximum summed multipoint HLOD; model = genetic model for the maximum summed HLOD; dom = dominant; rec = recessive); Average � = estimated proportion of linked families at the linkage peak, averaged over the stud-ies.
b GSMA/MRSA peak (p value) = significant results from Genome Scan Meta-Analysis over the individual studies; presented is the 10 cM interval best supported by the GSMA/MRMS with the corresponding p value (see fig. 2 for MRMS graphs).
Table 5. Genome-wide significant SNP results (from weighted FDR analyses of FBAT results) in the TOTAL dataset and CLP pheno-typic subset
Dataset Chromosome SNP name SNP Associatedallele (freq)
Gene Chromosomelocation
Weightedp value
TOTAL 1q32.3-q41 rs2013162 A/C C (62%) IRF6 208035307 1.0!10–7
9q22 rs1443434 G/T T (75%) FOXE1 99657300 7.0!10–7
9q22 rs993501 C/T T (81%) 99663198 2.1!10–6
9q22.33 rs6586 C/T T (63%) C9orf156 99706752 5.8!10–5
CLP 9q22 rs1443434 G/T T (72%) FOXE1 99657300 4.0!10–7
9q22.33 rs6586 C/T T (59%) C9orf156 99706752 7.5!10–6
9q22 rs993501 C/T T (77%) 99663198 1.4!10–5
9q22 rs1877431 A/G G (66%) 99573968 3.3!10–4
9q22.3 rs4743106 C/T T (78%) TMOD 99353614 3.3!10–4

Marazita et al. Hum Hered 2009;68:151–170158
cant. Consistent with the linkage results, the fine-map-ping results were also phenotype dependent. The IRF6 SNP rs2013162 (significant in the TOTAL dataset) was only positive in the CL and CL+CLP subsets (although not reaching formal genome-wide significance in those subsets). Similarly, FOXE1 SNPs (significant in the TO-TAL dataset) were genome-wide significant only in the CLP subset.
Following is a brief discussion of the most notable re-sults by chromosome. Although not summarized in de-tail, several of these regions also have chromosomal rear-rangements reported in CL/P [47, 69, 70] .
Chromosome 1q The 1q32 region with significant linkage and associa-
tion results is the location for the IRF6 gene that was iden-tified as the etiologic locus for van der Woude syndrome ( VDWS, MIM# 119300 [23] ) and also significantly associ-ated with non-syndromic CL/P (SNP rs2235371 [22, 24–26, 28–30, 71] ).
Recently we have identified a specific IRF6 SNP (rs642961) where the ancestral allele is highly evolution-arily conserved and where functional assays show dis-ruption of an AP-2 � binding site that likely represents the major NS CL/P etiologic locus within IRF6 [32] . Notably the results with SNP rs642961 were significant only in families with one or more CL-alone affected members
4
00 40 80 120
cM
Chromosome 1 dominant
160 200 240 280
1
2
3
5
6
Mul
tip
oin
t H
LOD
2.5
00
a
30 60 90 150120 180cM
Chromosome 1 META analysis
210 240 270 300
0.5
1.0
1.5
2.0
p = 0.001
p = 0.01
p = 0.05
3.0
3.5
Ab
s lo
g p
val
ue
ALLCL
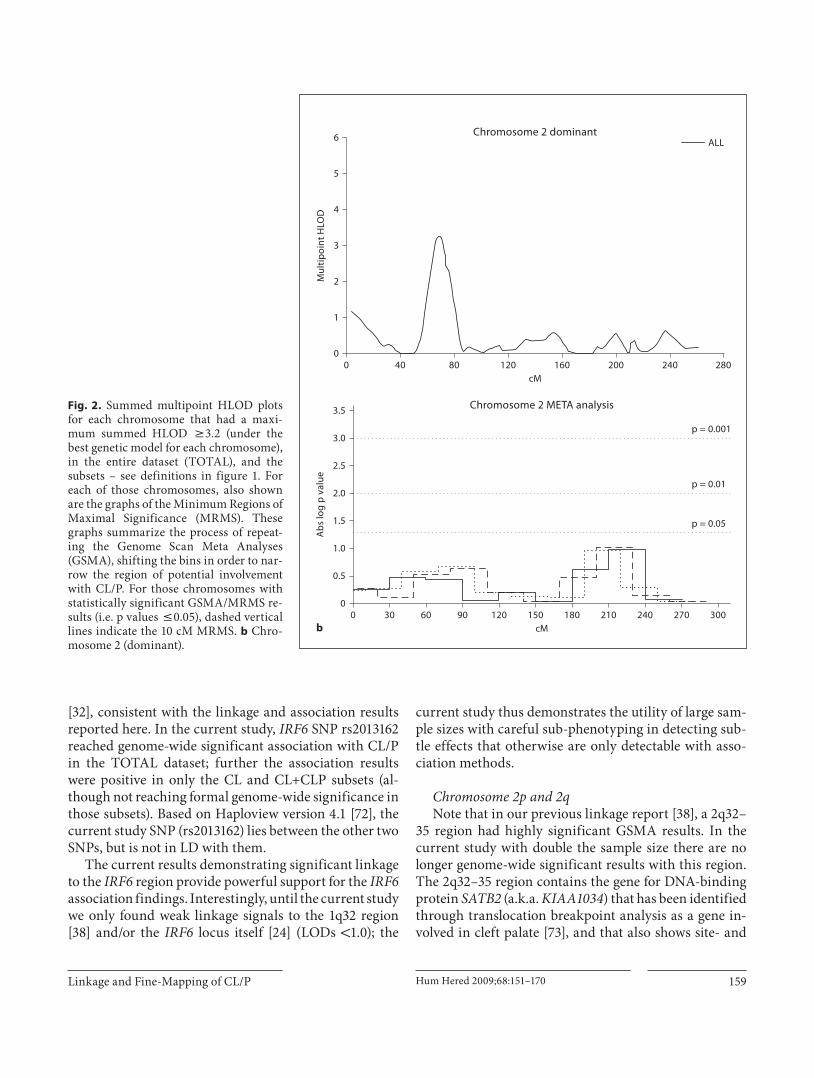
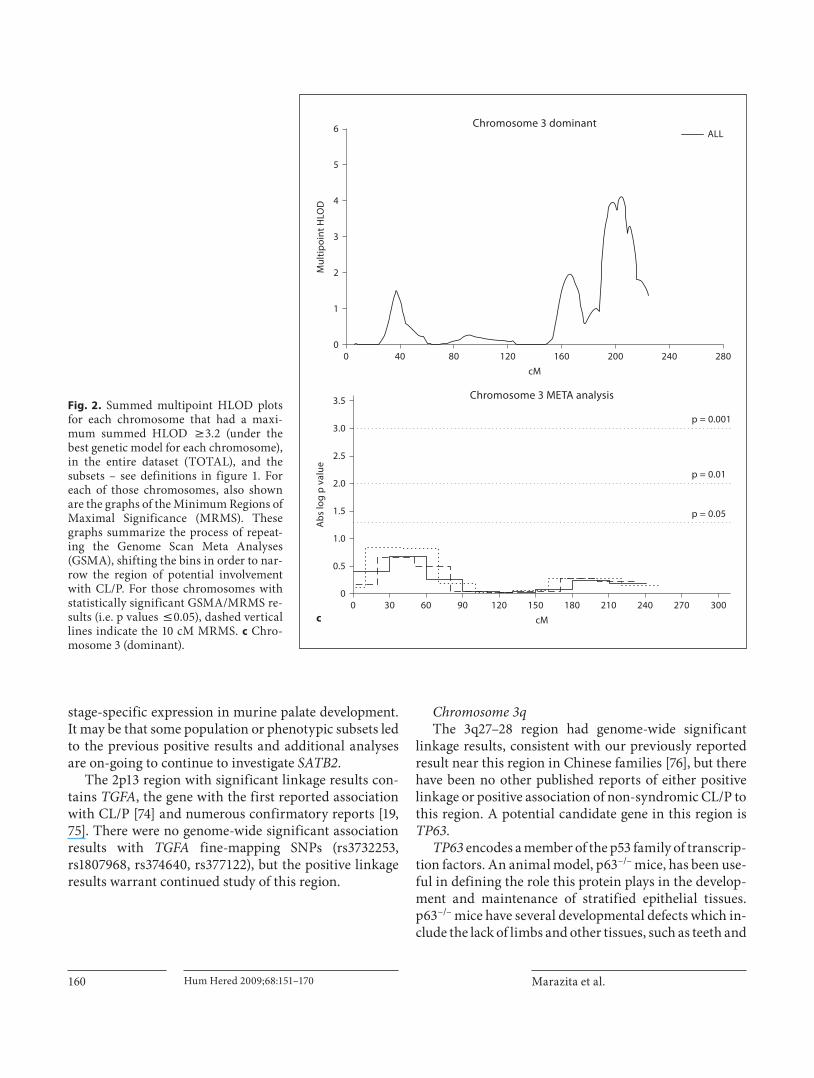
Fig. 2. Summed multipoint HLOD plots for each chromosome that had a maxi-mum summed HLOD 6 3.2 (under the best genetic model for each chromosome), in the entire dataset (TOTAL), and the subsets – see definitions in figure 1. For each of those chromosomes, also shown are the graphs of the Minimum Regions of Maximal Significance (MRMS). These graphs summarize the process of repeat-ing the Genome Scan Meta Analyses (GSMA), shifting the bins in order to nar-row the region of potential involvement with CL/P. For those chromosomes with statistically significant GSMA/MRMS re-sults (i.e. p values ̂ 0.05), dashed vertical lines indicate the 10 cM MRMS. a Chro-mosome 1 under a dominant model for TOTAL and for the CL subset.
Linkage and Fine-Mapping of CL/P Hum Hered 2009;68:151–170 159
[32] , consistent with the linkage and association results reported here. In the current study, IRF6 SNP rs2013162 reached genome-wide significant association with CL/P in the TOTAL dataset; further the association results were positive in only the CL and CL+CLP subsets (al-though not reaching formal genome-wide significance in those subsets). Based on Haploview version 4.1 [72] , the current study SNP (rs2013162) lies between the other two SNPs, but is not in LD with them.
The current results demonstrating significant linkage to the IRF6 region provide powerful support for the IRF6 association findings. Interestingly, until the current study we only found weak linkage signals to the 1q32 region [38] and/or the IRF6 locus itself [24] (LODs ! 1.0); the
current study thus demonstrates the utility of large sam-ple sizes with careful sub-phenotyping in detecting sub-tle effects that otherwise are only detectable with asso-ciation methods.
Chromosome 2p and 2q Note that in our previous linkage report [38] , a 2q32–
35 region had highly significant GSMA results. In the current study with double the sample size there are no longer genome-wide significant results with this region. The 2q32–35 region contains the gene for DNA-binding protein SATB2 (a.k.a. KIAA1034 ) that has been identified through translocation breakpoint analysis as a gene in-volved in cleft palate [73] , and that also shows site- and
2.5
00
b
30 60 90 150120 180cM
Chromosome 2 META analysis
210 240 270 300
0.5
1.0
1.5
2.0
p = 0.001
p = 0.01
p = 0.05
3.0
3.5
Ab
s lo
g p
val
ue
4
00 40 80 120
cM
Chromosome 2 dominant
160 200 240 280
1
2
3
5
6
Mul
tip
oin
t H
LOD
ALL
Fig. 2. Summed multipoint HLOD plots for each chromosome that had a maxi-mum summed HLOD 6 3.2 (under the best genetic model for each chromosome), in the entire dataset (TOTAL), and the subsets – see definitions in figure 1. For each of those chromosomes, also shown are the graphs of the Minimum Regions of Maximal Significance (MRMS). These graphs summarize the process of repeat-ing the Genome Scan Meta Analyses (GSMA), shifting the bins in order to nar-row the region of potential involvement with CL/P. For those chromosomes with statistically significant GSMA/MRMS re-sults (i.e. p values ̂ 0.05), dashed vertical lines indicate the 10 cM MRMS. b Chro-mosome 2 (dominant).
Marazita et al. Hum Hered 2009;68:151–170160
stage-specific expression in murine palate development. It may be that some population or phenotypic subsets led to the previous positive results and additional analyses are on-going to continue to investigate SATB2 .
The 2p13 region with significant linkage results con-tains TGFA , the gene with the first reported association with CL/P [74] and numerous confirmatory reports [19, 75] . There were no genome-wide significant association results with TGFA fine-mapping SNPs (rs3732253, rs1807968, rs374640, rs377122), but the positive linkage results warrant continued study of this region.
Chromosome 3q The 3q27–28 region had genome-wide significant
linkage results, consistent with our previously reported result near this region in Chinese families [76] , but there have been no other published reports of either positive linkage or positive association of non-syndromic CL/P to this region. A potential candidate gene in this region is TP63 .
TP63 encodes a member of the p53 family of transcrip-tion factors. An animal model, p63 –/– mice, has been use-ful in defining the role this protein plays in the develop-ment and maintenance of stratified epithelial tissues. p63 –/– mice have several developmental defects which in-clude the lack of limbs and other tissues, such as teeth and
4
00 40 80 120
cM
Chromosome 3 dominant
160 200 240 280
1
2
3
5
6
Mul
tip
oin
t H
LOD
ALL
2.5
00
c
30 60 90 150120 180
cM
Chromosome 3 META analysis
210 240 270 300
0.5
1.0
1.5
2.0
p = 0.001
p = 0.01
p = 0.05
3.0
3.5
Ab
s lo
g p
val
ue
Fig. 2. Summed multipoint HLOD plots for each chromosome that had a maxi-mum summed HLOD 6 3.2 (under the best genetic model for each chromosome), in the entire dataset (TOTAL), and the subsets – see definitions in figure 1. For each of those chromosomes, also shown are the graphs of the Minimum Regions of Maximal Significance (MRMS). These graphs summarize the process of repeat-ing the Genome Scan Meta Analyses (GSMA), shifting the bins in order to nar-row the region of potential involvement with CL/P. For those chromosomes with statistically significant GSMA/MRMS re-sults (i.e. p values ̂ 0.05), dashed vertical lines indicate the 10 cM MRMS. c Chro-mosome 3 (dominant).

Linkage and Fine-Mapping of CL/P Hum Hered 2009;68:151–170 161
mammary glands, which develop as a result of interac-tions between mesenchyme and epithelium. Further-more, recently completed detailed expression studies [77] during murine craniofacial development to dissect the molecular pathogenesis of the bilateral cleft lip and cleft palate seen in Tp63- deficient mice. Analysis of key sig-naling molecules revealed that the craniofacial defects re-sulted from increased Bmp4 signaling acting antagonisti-cally on Fgf8 and Shh [77] .
In humans, mutations in the TP63 gene are associated with ectodermal dysplasia and cleft lip/palate syndrome 3 (EEC3 [78, 79] ); split-hand/foot malformation 4 (SHFM4); Hay Wells syndrome [80] (ankyloblepharon-ectodermal defects-cleft lip/palate); ADULT syndrome
(acro-dermato-ungual-lacrimal-tooth); limb-mammary syndrome; Rap-Hodgkin syndrome (RHS [81, 82] ) and NS OFC [83] . Both alternative splicing and the use of al-ternative promoters results in multiple transcript vari-ants encoding different proteins, which may underlie the wide phenotypic spectrum associated with mutations in TP63 [84, 85] .
Therefore, the custom SNP panel included 10 SNPs within TP63 : rs4396880, rs1920266, rs4575879, rs7616178, rs4607088, rs7619526, rs4686529, rs7619549, rs9810322, and rs1515490. None of these SNPs reached genome-wide significance in the wFDR analyses, but given the strong linkage signal and the biological plausibility of this gene, our group is continuing analyses in this region. Further-
2.5
00
d
30 60 90 150120 180cM
Chromosome 9 META analysis
210 240 270 300
0.5
1.0
1.5
2.0
p = 0.001
p = 0.01
p = 0.05
3.0
3.5
Ab
s lo
g p
val
ue
4
00 40 80 120
cM
Chromosome 9 dominant
160 200 240 280
1
2
3
5
6
Mul
tip
oin
t H
LOD
ALLCLCLP
Fig. 2. Summed multipoint HLOD plots for each chromosome that had a maxi-mum summed HLOD 6 3.2 (under the best genetic model for each chromosome), in the entire dataset (TOTAL), and the subsets – see definitions in figure 1. For each of those chromosomes, also shown are the graphs of the Minimum Regions of Maximal Significance (MRMS). These graphs summarize the process of repeat-ing the Genome Scan Meta Analyses (GSMA), shifting the bins in order to nar-row the region of potential involvement with CL/P. For those chromosomes with statistically significant GSMA/MRMS re-sults (i.e. p values ̂ 0.05), dashed vertical lines indicate the 10 cM MRMS. d Chro-mosome 9 (dominant, TOTAL and CL+CLP).

Marazita et al. Hum Hered 2009;68:151–170162
more, given the interacting nature of the involvement of Tp63 in the murine model [77] we are simultaneously ex-ploring TP63, BMP4, FGF8 and SHH in our multiplex families. Notably, as described below, we also saw ge-nome-wide significant linkage to region 14q which is near the location for BMP4.
Chromosome 9q Region 9q21 had the most significant linkage result in
our previous report [35] . This region also reached genome-wide significance in the current study, and showed the most positive HLOD and GSMA results in the TOTAL and CL+CLP datasets. There are a number of possible candi-date genes in this region including the human homolog of
patched ( PTCH , 9q22.3), receptor tyrosine kinase-like or-phan receptor 2 ( ROR2 , 9q22), transforming growth factor beta receptor type 1 ( TGFBR1 , 9q33-q34), zinc finger pro-tein 189 ( ZNF189 , 9q22-q31) and FOXE1 (a.k.a. TTF2 , TITF2 ; 9q22). Therefore multiple SNPs from the 1-LOD and 2-LOD intervals around the 9q linkage peak were gen-otyped, as well as SNPs in each of these candidate genes.
The only SNPs genotyped in the 9q region to reach genome-wide significant association were in or near FOXE1 (see table 5 ), and were significantly associated with CL/P in the TOTAL and CLP datasets. FOXE1 is a forkhead domain-containing transcription factor (a.k.a. TTF2 , TITF2 ; 9q22); mutations in FOXE1 are associated with congenital hypothyroidism, thyroid agenesis and
4
00 40 80 120
cM
Chromosome 12 dominant
160 200 240 280
1
2
3
5
6
Mul
tip
oin
t H
LOD
ALLCLP
2.5
00
e
30 60 90 150120 180cM
Chromosome 12 META analysis
210 240 270 300
0.5
1.0
1.5
2.0
p = 0.001
p = 0.01
p = 0.05
3.0
3.5
Ab
s lo
g p
val
ue
Fig. 2. Summed multipoint HLOD plots for each chromosome that had a maxi-mum summed HLOD 6 3.2 (under the best genetic model for each chromosome), in the entire dataset (TOTAL), and the subsets – see definitions in figure 1. For each of those chromosomes, also shown are the graphs of the Minimum Regions of Maximal Significance (MRMS). These graphs summarize the process of repeat-ing the Genome Scan Meta Analyses (GSMA), shifting the bins in order to nar-row the region of potential involvement with CL/P. For those chromosomes with statistically significant GSMA/MRMS re-sults (i.e. p values ̂ 0.05), dashed vertical lines indicate the 10 cM MRMS. e Chro-mosome 12 (dominant, TOTAL and CLP subgroup).

Linkage and Fine-Mapping of CL/P Hum Hered 2009;68:151–170 163
cleft palate in humans (Bamford-Lazarus syndrome, MIM 241850) and mice [86–88] . The forkhead gene fam-ily ( Fox ), originally identified in Drosophila, encodes transcription factors with a conserved 100-amino acid DNA-binding motif called the ‘forkhead domain’ [89] and regulates diverse developmental processes in eukary-otes. Rare missense mutations in FOXE1 have been asso-ciated with isolated clefting [17, 90] .
FOXE1 is a major current focus of our research group, including studies of multi-species conservation, struc-ture, function, and etiology. Genotyping the FOXE1 lo-cus at a greater SNP density has excluded adjacent genes and narrowed the mutation to a 43 kb region including and upstream of FOXE1 (Moreno et al., unpublished re-
sults). Figure 4 shows the relative positions of the 9q21 SNPs that were genome-wide significant in the current study (see table 5 for list), as well as three additional fine-mapping SNPs recently found to be significantly associ-ated with CL/P (rs894673; rs3758249; rs1867278; Moreno et al. unpublished results), along with the LD patterns es-timated in the HapMap CEU population (Data Release 23a/phaseII Mar08, on NCBI B36 assembly, dbSNP b126) utilizing Haploview version 4.1 [72] . Of the recently stud-ied SNPs, rs3758249 is the one most strongly associated with CL/P in multiple populations (Moreno et al., unpub-lished results) and the associated SNPs from the current study are in a haplotype block with rs3758249 (see fig. 4 ). Notably, in both the current study and our recent FOXE1
4
00 40 80 120
cM
Chromosome 14 recessive
160 200 240 280
1
2
3
5
6
Mul
tip
oin
t H
LOD
ALL
2.5
00
f
30 60 90 150120 180cM
Chromosome 14 META analysis
210 240 270 300
0.5
1.0
1.5
2.0
p = 0.001
p = 0.01
p = 0.05
3.0
3.5
Ab
s lo
g p
val
ue
Fig. 2. Summed multipoint HLOD plots for each chromosome that had a maxi-mum summed HLOD 6 3.2 (under the best genetic model for each chromosome), in the entire dataset (TOTAL), and the subsets – see definitions in figure 1. For each of those chromosomes, also shown are the graphs of the Minimum Regions of Maximal Significance (MRMS). These graphs summarize the process of repeat-ing the Genome Scan Meta Analyses (GSMA), shifting the bins in order to nar-row the region of potential involvement with CL/P. For those chromosomes with statistically significant GSMA/MRMS re-sults (i.e. p values ̂ 0.05), dashed vertical lines indicate the 10 cM MRMS. f Chro-mosome 14 (recessive).

Marazita et al. Hum Hered 2009;68:151–170164
studies, the strongest associations are seen with families in which one or more affected family members have CL plus CP, and little or no evidence of association in fami-lies with CL alone or CP alone. Further, the involvement of FOXE1 during primary palatogenesis is supported by the previously uncharacterized epithelial expression in the medial nasal and maxillary processes that will un-dergo fusion (Moreno et al., unpublished results).
Chromosome 12p11 This region did not achieve significant linkage results
in the TOTAL dataset, however, it did reach significance in the CLP subset. Chromosomal rearrangements involv-ing the 12p region result in phenotypes including CL/P
or CP [69, 70] , including Pallister-Killian syndrome (mo-saic isochromosome 12p) [91] and others (del 12p [92] ; Fryns syndrome [93] ). However this region has not been previously investigated in non-syndromic CL/P and war-rants further investigation.
Chromosome 14q The 14q21–24 region had genome-wide significant re-
sults in our previous report, and also reached genome-wide significant linkage results in the current study. This region contains PAX9 , BMP4 and transforming growth factor beta 3 ( TGFB3 ) . Both Pax9 and Tgfb3 when inac-tivated in mice results in clefts of the secondary palate [94] . Positive results have been seen in association studies
4
00 40 80 120
cM
Chromosome 16 recessive
160 200 240 280
1
2
3
5
6
Mul
tip
oin
t H
LOD
ALLCLCLP
2.5
00
g
30 60 90 150120 180cM
Chromosome 16 META analysis
210 240 270 300
0.5
1.0
1.5
2.0
p = 0.001
p = 0.01
p = 0.05
3.0
3.5
Ab
s lo
g p
val
ue
Fig. 2. Summed multipoint HLOD plots for each chromosome that had a maxi-mum summed HLOD 6 3.2 (under the best genetic model for each chromosome), in the entire dataset (TOTAL), and the subsets – see definitions in figure 1. For each of those chromosomes, also shown are the graphs of the Minimum Regions of Maximal Significance (MRMS). These graphs summarize the process of repeat-ing the Genome Scan Meta Analyses (GSMA), shifting the bins in order to nar-row the region of potential involvement with CL/P. For those chromosomes with statistically significant GSMA/MRMS re-sults (i.e. p values ̂ 0.05), dashed vertical lines indicate the 10 cM MRMS. g Chro-mosome 16 (recessive in TOTAL and CL+CLP).

Linkage and Fine-Mapping of CL/P Hum Hered 2009;68:151–170 165
of CL/P and TGFB3, and one missense mutation has been reported [19, 95] . However, none of the one PAX9 or five TGFB3 SNPs tested in the current study reached genome-wide significant association in any of the datasets.
BMP4 (14q22–23) is another plausible candidate gene in this region. Multiple murine model studies have dem-onstrated a role for the Bmp4 pathway in lip and palate fusion [77] . In a Bmp4 conditional knockout mouse mod-el [96] , all embryos had bilateral cleft lip at 12 days post-conception but by 14.5 days only 22% still exhibited cleft lip, suggesting in utero healing. Our group has found BMP4 nonsense and missense mutations in CL/P, micro-form, and subclinical cleft cases that are absent in controls [97] and a recent report showed association of a common variant missense change with isolated cleft lip and palate in a Chinese population [98] . Only one BMP4 SNP was
included in the custom SNP panel (rs2147105), and was not significantly associated with CL/P in this study.
Given the strong linkage finding, and the biological plausibility of the possible candidates in this region, we are continuing to investigate BMP4 and other candidates in this region, and will incorporate GxG analyses as well (given the interacting patterns in the murine model re-cently reported [77] ).
Chromosome 16q Chromosome 16q24.1 was first identified in a genome
scan of Caucasian NSCLP sib pairs [33] . Two candidate genes in this region were subsequently investigated: IRF8 and CRISPLD2 [99] . No association was seen with IRF8 , but CRISPLD2 showed association in Caucasian and His-panic families. Although the function of CRISPLD2 is
IRF6region
FOXE1region
CL + CLP
–log
10 (w
tp)
1,500
0
1,0005000
2
4
CLP
–log
10 (w
tp)
1,500
0
1,0005000
2
4
6
Total
–log
10 (w
tp)
1,500
0
1,0005000
2
4
6
8
Fig. 3. Summaries of the weighted False Discovery Rate (wFDR) results for 1,476 SNPs selected within candidate genes or to fine-map the linkage peaks. Shown are graphs for the TOTAL dataset, and the CLP and CL+CLP subsets, i.e. those sub-sets in which there were genome-signifi-cant wFDR results. Shown are the –log 10 (wFDR p values), with the SNPs arrayed across the genome from chromosome 1 (left side of X axis) to chromosome 22.

Marazita et al. Hum Hered 2009;68:151–170166
unknown, its structure featuring the presence of a LCCL (Limulus factor C, Coch-5b2 and Lgl1) domain has been suggested to play a structural or immunologic role, or even be involved in cell motility which is required for ef-fective cell migration. In situ hybridization studies [99] showed that CRISPLD2 is expressed in the mandible, pal-ate, and nasopharynx regions during craniofacial devel-opment [99] .
FOXC2 is another plausible candidate in this region since FOXC2 mutations cause lymphodema-distichiasis which has incomplete penetrance of cleft palate [100–102] , the knockout has cleft palate, and decreased Foxc2 expression in the lateral nasal processes occurs in mice with SHH signaling inactivated in the cranial neural crest cells [103] . We are currently testing FOXC2 and CRISPLD2 SNPs in our study populations, as these were not included in the fine-mapping SNPs genotyped in the current study.
Summary and Future Plans The current study utilized linkage approaches in a
large sample of multiplex CL/P families to identify six genomic regions with genome-wide significant find-ings, plus one additional region significant in one phe-notypic subset. A follow-up fine-mapping SNP panel identified two genome-wide significant associations with SNPs in or near candidate genes ( IRF6 and FOXE1 ) , which have led to identification of the likely etiologic variants ( IRF6 [71] ; FOXE1 – Moreno et al., unpublished results). Note that the fine-mapping approach utilized here would only detect relatively common variants as-sociated with CL/P. Therefore, sequencing of candidate genes is now required to find those variants that may have resulted in linkage signals but with family-specific etiologic variants that could not be detected by LD ap-proaches such as the wFDR utilized here. We are also examining the genotyped SNPs for evidence of micorde-letions that are causal and that may be flagged from ap-parent non-mendelian inheritance. As described above, we are also continuing to pursue those regions with sig-nificant linkage results with further fine-mapping ef-forts.
A striking result from these studies is that some of the significant findings could be attributed to specific phe-notypic subsets. Indeed, some findings were significant only in specific phenotypic subgroups. Non-syndromic CL/P is a complex trait, with etiologic heterogeneity, so these results highlight the importance of careful pheno-typic delineation in large samples of families as one meth-od to begin to understand the observed etiologic hetero-geneity in CL/P families, and as a method to implement in other human disorders with similar levels of etiologic heterogeneity.
There are a number of additional sub-clinical pheno-types now under analysis in our group that suggest in-creased risk for CL/P: dental anomalies [104, 105] , defi-ciencies of the upper lip orbicularis oris muscle [106, 107] , asymmetry [108, 109] , and specific craniofacial measure-ments [110] in the non-overtly-affected relatives of indi-viduals affected with CL/P. Such sub-clinical phenotyp-ing holds great promise for addressing etiologic hetero-geneity in CL/P families by allowing a subdivision of families into potentially more homogeneous subsets based on both the overt and sub-clinical phenotypes present, thus markedly increasing the power and speci-ficity of our genetic studies.
Finally, identification of specific genes such as IRF6 and FOXE1 as well as the association with specific cleft phenotypes leads to a realistic expectation that improved
58
28
33
33
29
33
63
71
71
70
71
7122
392 491Block 1 (54 kb)
496
99,400 k
chr 9
99,500 k 99,600 k 99,700 k
500
* rs
4743
106
* rs
1877
431
rs89
4673
rs37
5824
9
rs18
6727
8
* rs
1443
434
* rs
9935
01
* rs
6586
503 518 5901
Fig. 4. Depicted are the LD patterns estimated in the HapMap CEU population for multiple SNPs in FOXE1. The SNPs marked with asterisks ( * ) are those that were found to be genome-wide significantly associated with CL/P in the current study (TOTAL and CL+CLP subset). The other SNPs have recently been found by our group to be strongly associated with CL/P (Moreno et al., unpublished results).
Co
lor v
ersi
on
avai
lab
le o
nlin
e
Linkage and Fine-Mapping of CL/P Hum Hered 2009;68:151–170 167
recurrence risk and OFC prognoses may soon be possible using a combination of molecular testing and improved phenotyping in families.
Acknowledgements
Many thanks to the families in our world-wide study sites who graciously agreed to participate, and without whom these studies would not be possible. The staff and collaborators at each study site were critical for successful completion of these studies: Dr. You-e Liu and Dr. Dan-ning Hu (China); Dr. Ajit Ray (India); Dr. Tuncbilek (Turkey); Carla Brandon, Kathy Bardi, Judith Resick, Dr. Katherine Neiswanger, Dr. Joseph Losee (USA, Pittsburgh); Katy Krahn, Amy Mach and Tamara Busch (USA, Iowa), Dora Rivera and Dr. Mauricio Camargo (Colombia). In the Philippines, Operation Smile International, Operation Smile Philippines, the HOPE Foundation, Bill and Kathy Magee, Edith Villanueva, Bue-na Nepomuceno, Henrietta Gamboa, Salie Onggada, Rachel Lim, and Gloria Melocoton were all critical to sample collection. Many thanks to Dr. Peter Chines of NHGRI for SNP mapping and an-notation.
These studies were supported by NIH grants R37-DE08559, R01-DE09886, R01-DE012472, R01-DE014677, R01-DE016148, P50-DE016215, R03-DE016632, KO2-DE015291, M01-RR00084; and a March of Dimes grant #6-FY01-616. Genotyping services were provided by the Center for Inherited Disease Research (CIDR) which is fully funded through a federal contract from the National Institutes of Health to The Johns Hopkins University, contract number N01-HG-65403. The content is solely the re-sponsibility of the authors and does not necessarily represent the official views of the National Institute of Dental and Craniofacial Research or the National Institutes of Health.
Electronic Database Information
URL’s for this article are: CIDR: Center for Inherited Disease Research (http://www.cidr.jhmi.edu/); OMIM: Online Mende-lian Inheritance in Man (http://www.ncbi.nlm.nih.gov/); Haplo-view: http://www.broad.mit.edu/haploview/haploview; HapMap: http://www.hapmap.org/; FBAT: http://www.biostat.harvard.edu/ � fbat/default.html.
References
1 Murray JC, Schutte BC: Cleft palate: Players, pathways, and pursuits. J Clin Invest 2004; 113: 1676–1678.
2 Trew CJ: Sistens plura exempla palati defici-entis. Nova Acta Physio-Medica Academiae Caesareae Leopoldion-Carolinae 1757; 1: 445–447.
3 Darwin C: The Variation of Plants and Ani-mals under Domestication. New York, Ap-pleton, 1875.
4 Sproule J: Hereditary nature of hare-lip. Br Med J 1863; 1: 412.
5 Rischbieth H: Hare-lip and cleft palate; in Pearson K (ed): Treasure of Human Inheri-tance, part iv. London, Dulau, 1910, pp 79–123.
6 Fogh-Andersen P: The Inheritance of Hare Lip and Cleft Palate; Contributions to the Elucidation of the Congenital Clefts of the Face. Copenhagen, Nyt Nordisk Forlag Ar-nold Busck, 1942.
7 Melnick M: Cleft lip and palate etiology and its meaning in early 20th century England: Galton/Pearson vs. Bateson; polygenically poor protoplasm vs. Mendelism. J Craniofac Genet Dev Biol 1997; 17: 65–79.
8 Melnick M, Marazita ML, Hu DN: Genetic analysis of cleft lip with or without cleft pal-ate in Chinese kindreds. Am J Med Genet Suppl 1986; 2: 183–190.
9 Hecht JT, Yang P, Michels VV, Buetow KH: Complex segregation analysis of nonsyn-dromic cleft lip and palate. Am J Hum Genet 1991; 49: 674–681.
10 Marazita ML, Hu DN, Spence MA, Liu YE, Melnick M: Cleft lip with or without cleft palate in Shanghai, China: Evidence for an autosomal major locus. Am J Hum Genet 1992; 51: 648–653.
11 Farrall M, Holder S: Familial recurrence-pattern analysis of cleft lip with or without cleft palate. Am J Hum Genet 1992; 50: 270–277.
12 FitzPatrick D, Farrall M: An estimation of the number of susceptibility loci for isolated cleft palate. J Craniofac Genet Dev Biol 1993; 13: 230–235.
13 Schliekelman P, Slatkin M: Multiplex rela-tive risk and estimation of the number of loci underlying an inherited disease. Am J Hum Genet 2002; 71: 1369–1385.
14 Christensen K, Mitchell LE: Familial recur-rence-pattern analysis of nonsyndromic iso-lated cleft palate – a Danish registry study. Am J Hum Genet 1996; 58: 182–190.
15 Mitchell LE, Christensen K: Analysis of the recurrence patterns for nonsyndromic cleft lip with or without cleft palate in the families of 3,073 Danish probands. Am J Med Genet 1996; 61: 371–376.
16 Jezewski PA, Vieira AR, Nishimura C, Lud-wig B, Johnson M, O’Brien SE, Daack-Hirsch S, Schultz RE, Weber A, Nepomucena B, Ro-mitti PA, Christensen K, Orioli IM, Castilla EE, Machida J, Natsume N, Murray JC: Com-plete sequencing shows a role for MSX1 in non-syndromic cleft lip and palate. J Med Genet 2003; 40: 399–407.
17 Vieira AR, Avila JR, Daack-Hirsch S, Dragan E, Felix TM, Rahimov F, Harrington J, Schultz RR, Watanabe Y, Johnson M, Fang J, O’Brien SE, Orioli IM, Castilla EE, Fitzpat-rick DR, Jiang R, Marazita ML, Murray JC: Medical sequencing of candidate genes for nonsyndromic cleft lip and palate. PLoS Genet 2005; 1:e64.
18 Watanabe A, Akita S, Tin NT, Natsume N, Nakano Y, Niikawa N, Uchiyama T, Yoshiu-ra K: A mutation in RYK is a genetic factor for nonsyndromic cleft lip and palate. Cleft Palate Craniofac J 2006; 43: 310–316.
19 Marazita ML, Neiswanger K: Association analysis; in Wysznyski D (ed): Cleft Lip and Palate: From Origin to Treatment. Oxford, Oxford University Press, 2002, pp 240–254.
20 Lidral AC, Moreno LM: Progress toward dis-cerning the genetics of cleft lip. Curr Opin Pediatr 2005; 17: 731–739.
21 Carinci F, Scapoli L, Palmieri A, Zollino I, Pezzetti F: Human genetic factors in nonsyn-dromic cleft lip and palate: An update. IntJ Pediatr Otorhinolaryngol 2007; 71: 1509–1519.
22 Vieira AR: Unraveling human cleft lip and palate research. J Dent Res 2008; 87: 119–125.
23 Kondo S, Schutte BC, Richardson RJ, Bjork BC, Knight AS, Watanabe Y, Howard E, de Lima RL, Daack-Hirsch S, Sander A, Mc-Donald-McGinn DM, Zackai EH, Lammer EJ, Aylsworth AS, Ardinger HH, Lidral AC, Pober BR, Moreno L, Arcos-Burgos M, Va-

Marazita et al. Hum Hered 2009;68:151–170168
lencia C, Houdayer C, Bahuau M, Moretti-Ferreira D, Richieri-Costa A, Dixon MJ, Murray JC: Mutations in IRF6 cause van der Woude and popliteal pterygium syndromes. Nat Genet 2002; 32: 285–289.
24 Zucchero TM, Cooper ME, Maher BS, Daack-Hirsch S, Nepomuceno B, Ribeiro L, Caprau D, Christensen K, Suzuki Y, Machida J, Natsume N, Yoshiura K, Vieira AR, Orioli IM, Castilla EE, Moreno L, Arcos-Burgos M, Lidral AC, Field LL, Liu YE, Ray A, Goldstein TH, Schultz RE, Shi M, Johnson MK, Kondo S, Schutte BC, Marazita ML, Murray JC: In-terferon regulatory factor 6 (IRF6) gene vari-ants and the risk of isolated cleft lip or palate. N Engl J Med 2004; 351: 769–780.
25 Scapoli L, Palmieri A, Martinelli M, Pezzetti F, Carinci P, Tognon M, Carinci F: Strong evidence of linkage disequilibrium between polymorphisms at the IRF6 locus and non-syndromic cleft lip with or without cleft pal-ate, in an Italian population. Am J Hum Gen-et 2005; 76: 180–183.
26 Ghassibe M, Bayet B, Revencu N, Verellen-Dumoulin C, Gillerot Y, Vanwijck R, Vik-kula M: Interferon regulatory factor-6:A gene predisposing to isolated cleft lip with or without cleft palate in the Belgian popula-tion. Eur J Hum Genet 2005; 13: 1239–1242.
27 Blanton SH, Cortez A, Stal S, Mulliken JB, Finnell RH, Hecht JT: Variation in IRF6 con-tributes to nonsyndromic cleft lip and palate. Am J Med Genet A 2005; 137: 259–262.
28 Srichomthong C, Siriwan P, Shotelersuk V: Significant association between IRF6 820G- 1 A and non-syndromic cleft lip with or without cleft palate in the Thai population. J Med Genet 2005; 42:e46.
29 Park JW, McIntosh I, Hetmanski JB, Jabs EW, Vander Kolk CA, Wu-Chou YH, Chen PK, Chong SS, Yeow V, Jee SH, Park BY, Fal-lin MD, Ingersoll R, Scott AF, Beaty TH: As-sociation between IRF6 and nonsyndromic cleft lip with or without cleft palate in four populations. Genet Med 2007; 9: 219–227.
30 Vieira AR, Cooper ME, Marazita ML, Orio-li IM, Castilla EE: Interferon regulatory fac-tor 6 (IRF6) is associated with oral-facial cleft in individuals that originate in South America. Am J Med Genet A 2007; 143A:2075–2078.
31 Jugessur A, Rahimov F, Lie RT, Wilcox AJ, Gjessing HK, Nilsen RM, Nguyen TT, Mur-ray JC: Genetic variants in IRF6 and the risk of facial clefts: Single-marker and haplo-type-based analyses in a population-based case-control study of facial clefts in Norway. Genet Epidemiol 2008; 32: 413–424.
32 Rahimov F, Marazita ML, Visel A, Cooper ME, Hitchler MJ, Rubini M, Domann FE, Govil M, Christensen K, Bille C, Melbye M, Jugessur A, Lie RT, Wilcox AJ, Fitzpatrick DR, Green ED, Mossey PA, Little J, Steegers-Theunissen RP, Pennacchio LA, Schutte BC, Murray JC: Disruption of an AP-2alpha bind-ing site in an IRF6 enhancer is associated with cleft lip. Nat Genet 2008; 40: 1341–1347.
33 Prescott NJ, Lees MM, Winter RM, Malcolm S: Identification of susceptibility loci for nonsyndromic cleft lip with or without cleft palate in a two stage genome scan of affected sib-pairs. Hum Genet 2000; 106: 345–350.
34 Marazita ML, Field LL, Cooper ME, Tobias R, Maher BS, Peanchitlertkajorn S, Liu YE: Genome scan for loci involved in cleft lip with or without cleft palate, in Chinese mul-tiplex families. Am J Hum Genet 2002; 71: 349–364.
35 Marazita ML, Field LL, Tuncbilek G, Cooper ME, Goldstein T, Gursu KG: Genome-scan for loci involved in cleft lip with or without cleft palate in consanguineous families from Turkey. Am J Med Genet A 2004; 126: 111–122.
36 Wyszynski DF, Albacha-Hejazi H, Aldirani M, Hammod M, Shkair H, Karam A, Alash-kar J, Holmes TN, Pugh EW, Doheny KF, McIntosh I, Beaty TH, Bailey-Wilson JE: A genome-wide scan for loci predisposing to non-syndromic cleft lip with or without cleft palate in two large Syrian families. Am J Med Genet A 2003; 123: 140–147.
37 Zeiger JS, Hetmanski JB, Beaty TH, Van-derKolk CA, Wyszynski DF, Bailey-Wilson JE, de Luna RO, Perandones C, Tolarova MM, Mosby T, Bennun R, Segovia M, Calda P, Pugh EW, Doheny K, McIntosh I: Evi-dence for linkage of nonsyndromic cleft lip with or without cleft palate to a region on chromosome 2. Eur J Hum Genet 2003; 11: 835–839.
38 Marazita ML, Murray JC, Lidral AC, Arcos-Burgos M, Cooper ME, Goldstein T, Maher BS, Daack-Hirsch S, Schultz R, Mansilla MA, Field LL, Liu YE, Prescott N, Malcolm S, Winter R, Ray A, Moreno L, Valencia C, Neiswanger K, Wyszynski DF, Bailey-Wil-son JE, Albacha-Hejazi H, Beaty TH, McIn-tosh I, Hetmanski JB, Tuncbilek G, Edwards M, Harkin L, Scott R, Roddick LG: Meta-analysis of 13 genome scans reveals multiple cleft lip/palate genes with novel loci on 9q21 and 2q32–35. Am J Hum Genet 2004; 75: 161–173.
39 O’Connell JR, Weeks DE: Pedcheck: A pro-gram for identification of genotype incom-patibilities in linkage analysis. Am J Hum Genet 1998; 63: 259–266.
40 Brown NL, Knott L, Halligan E, Yarram SJ, Mansell JP, Sandy JR: Microarray analysis of murine palatogenesis: Temporal expression of genes during normal palate development. Dev Growth Differ 2003; 45: 153–165.
41 Gong SG, Gong TW, Shum L: Identification of markers of the midface. J Dent Res 2005; 84: 69–72.
42 Mukhopadhyay P, Greene RM, Zacharias W, Weinrich MC, Singh S, Young WW Jr, Pisa-no MM: Developmental gene expression profiling of mammalian, fetal orofacial tis-sue. Birth Defects Res A Clin Mol Teratol 2004; 70: 912–926.
43 Jugessur A, Murray JC: Orofacial clefting: Recent insights into a complex trait. Curr Opin Genet Dev 2005; 15: 270–278.
44 Cai J, Ash D, Kotch LE, Jabs EW, Attie-Bitach T, Auge J, Mattei G, Etchevers H, Vekemans M, Korshunova Y, Tidwell R, Messina DN, Winston JB, Lovett M: Gene expression in pharyngeal arch 1 during human embryonic development. Hum Mol Genet 2005; 14: 903–912.
45 Diewert VM: Development of human cra-niofacial morphology during the late embry-onic and early fetal periods. Am J Orthod 1985; 88: 64–76.
46 Beier DR, Herron BJ: Genetic mapping and ENU mutagenesis. Genetica 2004; 122: 65–69.
47 Higgins AW, Alkuraya FS, Bosco AF, Brown KK, Bruns GA, Donovan DJ, Eisenman R, Fan Y, Farra CG, Ferguson HL, Gusella JF, Harris DJ, Herrick SR, Kelly C, Kim HG, Ki-shikawa S, Korf BR, Kulkarni S, Lally E, Leach NT, Lemyre E, Lewis J, Ligon AH, Lu W, Maas RL, MacDonald ME, Moore SD, Pe-ters RE, Quade BJ, Quintero-Rivera F, Saadi I, Shen Y, Shendure J, Williamson RE, Mor-ton CC: Characterization of apparently bal-anced chromosomal rearrangements from the developmental genome anatomy project. Am J Hum Genet 2008; 82: 712–722.
48 Sebastiani P, Lazarus R, Weiss ST, Kunkel LM, Kohane IS, Ramoni MF: Minimal hap-lotype tagging. Proc Natl Acad Sci USA 2003; 100: 9900–9905.
49 Fan JB, Oliphant A, Shen R, Kermani BG, Garcia F, Gunderson KL, Hansen M, Steem-ers F, Butler SL, Deloukas P, Galver L, Hunt S, McBride C, Bibikova M, Rubano T, Chen J, Wickham E, Doucet D, Chang W, Camp-bell D, Zhang B, Kruglyak S, Bentley D, Haas J, Rigault P, Zhou L, Stuelpnagel J, Chee MS: Highly parallel snp genotyping. Cold Spring Harb Symp Quant Biol 2003; 68: 69–78.
50 Ray AK, Field LL, Marazita ML: Nonsyn-dromic cleft lip with or without cleft palate in West Bengal, India: Evidence for an auto-somal major locus. Am J Hum Genet 1993; 52: 1006–1011.
51 Moreno L, Lidral A, Fonseca I, Valencia C, Arcos-Burgos M: Complex segregation anal-ysis of nonsyndromic cleft lip/palate in An-tioquia, Colombia. Actualidades Biologica 2004; 23: 49–56.
52 Marazita ML, Spence MA, Melnick M: Ge-netic analysis of cleft lip with or without cleft palate in Danish kindreds. Am J Med Genet 1984; 19: 9–18.
53 Marazita ML, Goldstein AM, Smalley SL, Spence MA: Cleft lip with or without cleft palate: Reanalysis of a three-generation fam-ily study from England. Genet Epidemiol 1986; 3: 335–342.
54 Smith CAB: Testing for heterogeneity of re-combination fraction values in human ge-netics. Ann Hum Genet 1963; 17: 175–182.

Linkage and Fine-Mapping of CL/P Hum Hered 2009;68:151–170 169
55 Vieland VJ, Wang K, Huang J: Power to de-tect linkage based on multiple sets of data in the presence of locus heterogeneity: Com-parative evaluation of model-based linkage methods for affected sib pair data. Hum Hered 2001; 51: 199–208.
56 Greenberg DA, Abreu PC: Determining trait locus position from multipoint analysis: Ac-curacy and power of three different statis-tics. Genet Epidemiol 2001; 21: 299–314.
57 Hodge SE, Vieland VJ, Greenberg DA: Hlods remain powerful tools for detection of link-age in the presence of genetic heterogeneity. Am J Hum Genet 2002; 70: 556–559.
58 Sobel E, Lange K: Descent graphs in pedigree analysis: Applications to haplotyping, loca-tion scores, and marker-sharing statistics. Am J Hum Genet 1996; 58: 1323–1337.
59 Hodge SE, Elston RC: Lods, wrods, and mods: The interpretation of lod scores calcu-lated under different models. Genet Epide-miol 1994; 11: 329–342.
60 Lander E, Kruglyak L: Genetic dissection of complex traits: Guidelines for interpreting and reporting linkage results. Nat Genet 1995; 11: 241–247.
61 Wise LH, Lanchbury JS, Lewis CM: Meta-analysis of genome searches. Ann Hum Gen-et 1999; 63: 263–272.
62 Levinson DF, Levinson MD, Segurado R, Lewis CM: Genome scan meta-analysis of schizophrenia and bipolar disorder, part I: Methods and power analysis. Am J Hum Genet 2003; 73: 17–33.
63 Lewis CM, Levinson DF, Wise LH, DeLisi LE, Straub RE, Hovatta I, Williams NM, Schwab SG, Pulver AE, Faraone SV, Brzusto-wicz LM, Kaufmann CA, Garver DL, Gurl-ing HM, Lindholm E, Coon H, Moises HW, Byerley W, Shaw SH, Mesen A, Sherrington R, O’Neill FA, Walsh D, Kendler KS, Eke-lund J, Paunio T, Lonnqvist J, Peltonen L, O’Donovan MC, Owen MJ, Wildenauer DB, Maier W, Nestadt G, Blouin JL, Antonarakis SE, Mowry BJ, Silverman JM, Crowe RR, Cloninger CR, Tsuang MT, Malaspina D, Harkavy-Friedman JM, Svrakic DM, Bassett AS, Holcomb J, Kalsi G, McQuillin A, Bryn-jolfson J, Sigmundsson T, Petursson H, Jazin E, Zoega T, Helgason T: Genome scan meta-analysis of schizophrenia and bipolar disor-der, part II: Schizophrenia. Am J Hum Gen-et 2003; 73: 34–48.
64 Cooper ME, Goldstein TH, Maher BS, Mara-zita ML: Identifying genomic regions for fine-mapping using genome scan meta-anal-ysis (GSMA) to identify the minimum re-gions of maximum significance (MRMS) across populations. BMC Genet 2005; 6(sup-pl 1):S42.
65 Rabinowitz D, Laird N: A unified approach to adjusting association tests for population admixture with arbitrary pedigree structure and arbitrary missing marker information. Hum Hered 2000; 50: 211–223.
66 Horvath S, Xu X, Laird NM: The family based association test method: Strategies for studying general genotype–phenotype asso-ciations. Eur J Hum Genet 2001; 9: 301–306.
67 Laird NM, Horvath S, Xu X: Implementing a unified approach to family-based tests of as-sociation. Genet Epidemiol 2000; 19(suppl 1):S36–S42.
68 Roeder K, Bacanu SA, Wasserman L, Devlin B: Using linkage genome scans to improve power of association in genome scans. Am J Hum Genet 2006; 78: 243–252.
69 Brewer C, Holloway S, Zawalnyski P, Schinzel A, FitzPatrick D: A chromosomal duplica-tion map of malformations: Regions of sus-pected haplo- and triplolethality – and toler-ance of segmental aneuploidy – in humans. Am J Hum Genet 1999; 64: 1702–1708.
70 Brewer C, Holloway S, Zawalnyski P, Schinzel A, FitzPatrick D: A chromosomal deletion map of human malformations. Am J Hum Genet 1998; 63: 1153–1159.
71 Rahimov F, Marazita ML, Visel A, Cooper ME, Hitchler MJ, Rubini M, Domann FE, Govil M, Christensen K, Bille C, Melbye M, Jugessur A, Lie RT, Wilcox AJ, Fitzpatrick DR, Green ED, Mossey PA, Little J, Steegers-Theunissen RP, Pennacchio LA, Schutte BC, Murray JC: Disruption of an AP-2alpha binding site in an IRF6 enhancer is associ-ated with cleft lip. Nat Genet 2008;40:1341–1347.
72 Barrett JC, Fry B, Maller J, Daly MJ: Haplo-view: Analysis and visualization of LD and haplotype maps. Bioinformatics 2005; 21: 263–265.
73 FitzPatrick DR, Carr IM, McLaren L, Leek JP, Wightman P, Williamson K, Gautier P, McGill N, Hayward C, Firth H, Markham AF, Fantes JA, Bonthron DT: Identification of SATB2 as the cleft palate gene on 2q32-q33. Hum Mol Genet 2003; 12: 2491–2501.
74 Ardinger HH, Buetow KH, Bell GI, Bardach J, VanDemark DR, Murray JC: Association of genetic variation of the transforming growth factor-alpha gene with cleft lip and palate. Am J Hum Genet 1989; 45: 348–353.
75 Mitchell LE: Transforming growth factor al-pha locus and nonsyndromic cleft lip with or without cleft palate: A reappraisal. Genet Ep-idemiol 1997; 14: 231–240.
76 Marazita ML, Field LL, Cooper ME, Tobias R, Maher BS, Peanchitlertkajorn S, Liu YE: Nonsyndromic cleft lip with or without cleft palate in China: Assessment of candidate re-gions. Cleft Palate Craniofac J 2002; 39: 149–156.
77 Thomason HA, Dixon MJ, Dixon J: Facial clefting in Tp63 deficient mice results from altered Bmp4, Fgf8 and Shh signaling. Dev Biol 2008; 321: 273–282.
78 Ray AK, Marazita ML, Pathak R, Beever CL, Cooper ME, Goldstein T, Shaw DF, Field LL: TP63 mutation and clefting modifier genes in an EEC syndrome family. Clin Genet 2004; 66: 217–222.
79 Barrow LL, van Bokhoven H, Daack-Hirsch S, Andersen T, van Beersum SE, Gorlin R, Murray JC: Analysis of the p63 gene in clas-sical EEC syndrome, related syndromes, and non-syndromic orofacial clefts. J Med Genet 2002; 39: 559–566.
80 McGrath JA, Duijf PH, Doetsch V, Irvine AD, de Waal R, Vanmolkot KR, Wessagowit V, Kelly A, Atherton DJ, Griffiths WA, Orlow SJ, van Haeringen A, Ausems MG, Yang A, McKeon F, Bamshad MA, Brunner HG, Hamel BC, van Bokhoven H: Hay-Wells syn-drome is caused by heterozygous missense mutations in the SAM domain of p63. Hum Mol Genet 2001; 10: 221–229.
81 Bougeard G, Hadj-Rabia S, Faivre L, Sara-fan-Vasseur N, Frebourg T: The Rapp-Hodg-kin syndrome results from mutations of the TP63 gene. Eur J Hum Genet 2003; 11: 700–704.
82 Shotelersuk V, Janklat S, Siriwan P, Tong-kobpetch S: De novo missense mutation, s541y, in the p63 gene underlying Rapp-Hodgkin ectodermal dysplasia syndrome. Clin Exp Dermatol 2005; 30: 282–285.
83 Leoyklang P, Siriwan P, Shotelersuk V: A mu-tation of the p63 gene in non-syndromic cleft lip. J Med Genet 2006; 43:e28.
84 van Bokhoven H, Hamel BC, Bamshad M, Sangiorgi E, Gurrieri F, Duijf PH, Van-molkot KR, van Beusekom E, van Beersum SE, Celli J, Merkx GF, Tenconi R, Fryns JP, Verloes A, Newbury-Ecob RA, Raas-Rot-schild A, Majewski F, Beemer FA, Janecke A, Chitayat D, Crisponi G, Kayserili H, Yates JR, Neri G, Brunner HG: P63 gene mutations in EEC syndrome, limb-mammary syn-drome, and isolated split hand-split foot malformation suggest a genotype-pheno-type correlation. Am J Hum Genet 2001; 69: 481–492.
85 van Bokhoven H, Brunner HG: Splitting p63. Am J Hum Genet 2002; 71: 1–13.
86 De Felice M, Ovitt C, Biffali E, Rodriguez-Mallon A, Arra C, Anastassiadis K, Macchia PE, Mattei MG, Mariano A, Scholer H, Mac-chia V, Di Lauro R: A mouse model for he-reditary thyroid dysgenesis and cleft palate. Nat Genet 1998; 19: 395–398.
87 Dathan N, Parlato R, Rosica A, De Felice M, Di Lauro R: Distribution of the titf2/foxe1 gene product is consistent with an important role in the development of foregut endo-derm, palate, and hair. Dev Dyn 2002; 224: 450–456.
88 Castanet M, Park SM, Smith A, Bost M, Leger J, Lyonnet S, Pelet A, Czernichow P, Chatterjee K, Polak M: A novel loss-of-func-tion mutation in TTF-2 is associated with congenital hypothyroidism, thyroid agene-sis and cleft palate. Hum Mol Genet 2002; 11: 2051–2059.
89 Lehman JA Jr, Artz JS: The minimal cleft lip. Plast Reconstr Surg 1976; 58: 306–309.

Marazita et al. Hum Hered 2009;68:151–170170
90 Venza M, Visalli M, Venza I, Torino C, Sala-dino R, Teti D: FOXEL gene mutation screen-ing by multiplex PCR/DHPLC in CHARGE syndrome and syndromic and non-syn-dromic cleft palate. J Chromatogr B Analyt Technol Biomed Life Sci 2006; 836: 39–46.
91 McPherson EW, Ketterer DM, Salsburey DJ: Pallister-Killian and Fryns syndromes: No-sology. Am J Med Genet 1993; 47: 241–245.
92 Glaser B, Rossier E, Barbi G, Chiaie LD, Blank C, Vogel W, Kehrer-Sawatzki H: Mo-lecular cytogenetic analysis of a constitu-tional de novo interstitial deletion of chro-mosome 12p in a boy with developmental delay and congenital anomalies. Am J Med Genet A 2003; 116A:66–70.
93 Alessandri JL, Attali T, Brayer C, Dupuy L, Pilorget H, Ramful D, Samperiz S, Tiran-Ra-jaofera I, Robin S: [Fryns syndrome. Report on 3 new cases]. Arch Pediatr 2007; 14: 903–907.
94 Sasaki Y, O’Kane S, Dixon J, Dixon MJ, Fer-guson MW: Temporal and spatial expression of Pax9 and Sonic hedgehog during develop-ment of normal mouse palates and cleft pal-ates in TGF-beta3 null embryos. Arch Oral Biol 2007; 52: 260–267.
95 Lidral AC, Romitti PA, Basart AM, Doetschman T, Leysens NJ, Daack-Hirsch S, Semina EV, Johnson LR, Machida J, Burds A, Parnell TJ, Rubenstein JL, Murray JC: Asso-ciation of MSX1 and TGFB3 with nonsyn-dromic clefting in humans. Am J Hum Gen-et 1998; 63: 557–568.
96 Liu W, Sun X, Braut A, Mishina Y, Behringer RR, Mina M, Martin JF: Distinct functions for bmp signaling in lip and palate fusion in mice. Development 2005; 132: 1453–1461.
97 Suzuki S, Marazita ML, Cooper ME, Miwa N, Hing A, Jugessur A, Natsume N, Shimo-zato K, Ohbayashi N, Suzuki Y, Niimi T, Minami K, Yamamoto M, Altannamar TJ, Erkhembaatar T, Furukawa H, Daack-Hirsch S, L’Heureux J, Brandon CA, Wein-berg SM, Neiswanger K, Deleyiannis FWB, de Salamanca JE, Vieira AR, Lidral AC, Martin JF, Murray JC: Mutations in BMP4 are associated with subepithelial, micro-form, and overt cleft lip. Am J Hum Genet 2009;84:406–411.
98 Lin JY, Chen YJ, Huang YL, Tang GP, Zhang L, Deng B, Li M, Ma H, Luan RS: Associa-tion of bone morphogenetic protein 4 gene polymorphisms with nonsyndromic cleft lip with or without cleft palate in Chinese children. DNA Cell Biol 2008;27:601–605.
99 Chiquet BT, Lidral AC, Stal S, Mulliken JB, Moreno LM, Arcos-Burgos M, Valencia-Ramirez C, Blanton SH, Hecht JT: CRISPLD2:A novel NSCLP candidate gene. Hum Mol Genet 2007; 16: 2241–2248.
100 Sholto-Douglas-Vernon C, Bell R, Brice G, Mansour S, Sarfarazi M, Child AH, Smith A, Mellor R, Burnand K, Mortimer P, Jef-fery S: Lymphoedema-distichiasis and FOXC2: Unreported mutations, de novo mutation estimate, families without coding mutations. Hum Genet 2005; 117: 238–242.
101 Bahuau M, Houdayer C, Tredano M, Sou-pre V, Couderc R, Vazquez MP: FOXC2 truncating mutation in distichiasis, lymph-edema, and cleft palate. Clin Genet 2002; 62: 470–473.
102 Traboulsi EI, Al-Khayer K, Matsumoto M, Kimak MA, Crowe S, Wilson SE, Finegold DN, Ferrell RE, Meisler DM: Lymphedema-distichiasis syndrome and FOXC2 gene mutation. Am J Ophthalmol 2002; 134: 592–596.
103 Jeong J, Mao J, Tenzen T, Kottmann AH, McMahon AP: Hedgehog signaling in the neural crest cells regulates the patterning and growth of facial primordia. Genes Dev 2004; 18: 937–951.
104 Vieira AR, McHenry TG, Daack-Hirsch S, Murray JC, Marazita ML: A genome wide linkage scan for cleft lip and palate and den-tal anomalies. Am J Med Genet A 2008; 146A:1406–1413.
105 Menezes R, Vieira AR: Dental anomalies as part of the cleft spectrum. Cleft Palate Cra-niofac J 2008; 45: 414–419.
106 Neiswanger K, Weinberg SM, Rogers CR, Brandon CA, Cooper ME, Bardi KM, De-leyiannis FW, Resick JM, Bowen A, Mooney MP, de Salamanca JE, Gonzalez B, Maher BS, Martin RA, Marazita ML: Orbicularis oris muscle defects as an expanded pheno-typic feature in nonsyndromic cleft lip with or without cleft palate. Am J Med Genet A 2007; 143: 1143–1149.
107 Weinberg SM, Brandon CA, McHenry TH, Neiswanger K, Deleyiannis FW, de Sala-manca JE, Castilla EE, Czeizel AE, Vieira AR, Marazita ML: Rethinking isolated cleft palate: Evidence of occult lip defects in a subset of cases. Am J Med Genet A 2008; 146A:1670–1675.
108 Neiswanger K, Cooper ME, Weinberg SM, Flodman P, Keglovits AB, Liu Y, Hu DN, Melnick M, Spence MA, Marazita ML: Cleft lip with or without cleft palate and dermatoglyphic asymmetry: Evaluation of a Chinese population. Orthod Craniofac Res 2002; 5: 140–146.
109 Neiswanger K, Cooper ME, Liu YE, Hu DN, Melnick M, Weinberg SM, Marazita ML: Bilateral asymmetry in Chinese families with cleft lip with or without cleft palate. Cleft Palate Craniofac J 2005; 42: 192–196.
110 Weinberg SM, Neiswanger K, Richtsmeier JT, Maher BS, Mooney MP, Siegel MI, Marazita ML: Three-dimensional morpho-metric analysis of craniofacial shape in the unaffected relatives of individuals with nonsyndromic orofacial clefts: A possible marker for genetic susceptibility. Am J Med Genet A 2008; 146A:409–420.
Copyright © 2022 FDOKUMEN