A three-dimensional computed tomographic analysis of the cervical spine in unoperated infants with...
9
J Oral Maxillofac Surg 68:354-362, 2010 Three-Dimensional Computed Tomographic Analysis of Airway Anatomy in Patients With Obstructive Sleep Apnea Zachary Abramson, BS,* Srinivas Susarla, DMD, MPH,† Meredith August, DMD, MD,‡ Maria Troulis, DDS, MSc,§ and Leonard Kaban, DMD, MD Purpose: To identify abnormalities in airway size and shape that correlate with the presence and severity of obstructive sleep apnea (OSA). Materials and Methods: This was a retrospective case series of patients undergoing treatment of OSA who had preoperative computed tomographic (CT) scans of the upper airway available. Patients who had undergone CT scanning for nonairway pathologic features during the same period served as the controls. Digital 3D-CT reconstructions were made and 12 parameters of airway size and 4 of shape were analyzed. The posterior airway space, middle airway space, and hyoid to mandibular plane distance were measured on the lateral cephalograms of the patients with OSA. Bivariate analysis was used to identify the factors associated with the presence and severity of OSA as measured by the respiratory disturbance index (RDI). Multiple regression analysis identified the factors that correlated with the RDI. Results: Of the 44 patients with OSA, 15 (10 men and 5 women) had pre- and postoperative CT scans available. In addition, 17 patients (11 men and 6 women) were used as controls. The airway length was significantly increased in the patients with OSA (P .01). On bivariate analysis, the length, lateral/ retroglossal anteroposterior dimension ratio and genial tubercle to hyoid bone distance were associated with the RDI (P .03). On multiple regression analysis, length (P .01) had a positive correlation and the lateral/retroglossal anteroposterior dimension ratio (P .04) an inverse correlation with the RDI. Conclusions: The results of this study indicate that the presence of OSA is associated with an increase in airway length. Airways that were more elliptical in shape and mediolaterally oriented (greater lateral/ retroglossal anteroposterior dimension ratio) had a decreased tendency toward obstruction. © 2010 American Association of Oral and Maxillofacial Surgeons J Oral Maxillofac Surg 68:354-362, 2010 Obstructive sleep apnea (OSA) is characterized by temporary cessation of breathing (apnea) or shallow breathing (hypopnea) with accompanying hemoglo- bin oxygen desaturation. 1 The signs and symptoms of repeated apneic and hypopneic episodes during sleep include excessive daytime sleepiness, night sweats, dry mouth, confusion, impotence, headaches, re- duced attention span, and poor job or school perfor- mance. In addition, recent studies have suggested an association between OSA and certain cardiovascular sequelae, such as hypertension and coronary artery disease. 2,3 Received from Department of Oral and Maxillofacial Surgery, Mas- sachusetts General Hospital, Harvard School of Dental Medicine, Boston, MA. *AO/Synthes/Massachusetts General Hospital Fellow in Pediatric Oral and Maxillofacial Surgery. †Resident in Oral and Maxillofacial Surgery. ‡Associate Professor. §Associate Professor and Residency Program Director. W.C. Guralnick Professor and Chairman. This study was funded in part by the Hanson Foundation (Bos- ton, MA), the Massachusetts General Hospital Department of Oral and Maxillofacial Surgery Education and Research Fund, and Syn- thes CMF (West Chester, PA). Address correspondence and reprint requests to Dr Kaban: De- partment of Oral and Maxillofacial Surgery, Massachusetts General Hospital, Warren 1201, 55 Fruit Street, Boston, MA 02114; e-mail: [email protected] © 2010 American Association of Oral and Maxillofacial Surgeons 0278-2391/10/6802-0020$36.00/0 doi:10.1016/j.joms.2009.09.087 354
-
Upload
independent -
Category
Documents
-
view
0 -
download
0
Transcript of A three-dimensional computed tomographic analysis of the cervical spine in unoperated infants with...
J6
Otbbri
R
s
B
O
Oral Maxillofac Surg8:354-362, 2010
Three-Dimensional ComputedTomographic Analysis of Airway
Anatomy in Patients With ObstructiveSleep Apnea
Zachary Abramson, BS,* Srinivas Susarla, DMD, MPH,†
Meredith August, DMD, MD,‡ Maria Troulis, DDS, MSc,§ and
Leonard Kaban, DMD, MD�
Purpose: To identify abnormalities in airway size and shape that correlate with the presence andseverity of obstructive sleep apnea (OSA).
Materials and Methods: This was a retrospective case series of patients undergoing treatment of OSAwho had preoperative computed tomographic (CT) scans of the upper airway available. Patients who hadundergone CT scanning for nonairway pathologic features during the same period served as the controls.Digital 3D-CT reconstructions were made and 12 parameters of airway size and 4 of shape were analyzed. Theposterior airway space, middle airway space, and hyoid to mandibular plane distance were measured on thelateral cephalograms of the patients with OSA. Bivariate analysis was used to identify the factors associatedwith the presence and severity of OSA as measured by the respiratory disturbance index (RDI). Multipleregression analysis identified the factors that correlated with the RDI.
Results: Of the 44 patients with OSA, 15 (10 men and 5 women) had pre- and postoperative CT scansavailable. In addition, 17 patients (11 men and 6 women) were used as controls. The airway length wassignificantly increased in the patients with OSA (P � .01). On bivariate analysis, the length, lateral/retroglossal anteroposterior dimension ratio and genial tubercle to hyoid bone distance were associatedwith the RDI (P � .03). On multiple regression analysis, length (P � .01) had a positive correlationand the lateral/retroglossal anteroposterior dimension ratio (P � .04) an inverse correlation with theRDI.
Conclusions: The results of this study indicate that the presence of OSA is associated with an increase inairway length. Airways that were more elliptical in shape and mediolaterally oriented (greater lateral/retroglossal anteroposterior dimension ratio) had a decreased tendency toward obstruction.© 2010 American Association of Oral and Maxillofacial Surgeons
J Oral Maxillofac Surg 68:354-362, 2010ddmasd
t
a
t
p
H
L
©
0
bstructive sleep apnea (OSA) is characterized byemporary cessation of breathing (apnea) or shallowreathing (hypopnea) with accompanying hemoglo-in oxygen desaturation.1 The signs and symptoms ofepeated apneic and hypopneic episodes during sleepnclude excessive daytime sleepiness, night sweats,
eceived from Department of Oral and Maxillofacial Surgery, Mas-
achusetts General Hospital, Harvard School of Dental Medicine,
oston, MA.
*AO/Synthes/Massachusetts General Hospital Fellow in Pediatric
ral and Maxillofacial Surgery.
†Resident in Oral and Maxillofacial Surgery.
‡Associate Professor.
§Associate Professor and Residency Program Director.
�W.C. Guralnick Professor and Chairman.
This study was funded in part by the Hanson Foundation (Bos- d
354
ry mouth, confusion, impotence, headaches, re-uced attention span, and poor job or school perfor-ance. In addition, recent studies have suggested an
ssociation between OSA and certain cardiovascularequelae, such as hypertension and coronary arteryisease.2,3
on, MA), the Massachusetts General Hospital Department of Oral
nd Maxillofacial Surgery Education and Research Fund, and Syn-
hes CMF (West Chester, PA).
Address correspondence and reprint requests to Dr Kaban: De-
artment of Oral and Maxillofacial Surgery, Massachusetts General
ospital, Warren 1201, 55 Fruit Street, Boston, MA 02114; e-mail:
2010 American Association of Oral and Maxillofacial Surgeons
278-2391/10/6802-0020$36.00/0
oi:10.1016/j.joms.2009.09.087
Rhscgsdassaadptercd
iomia
M
OcMcomtr(
rpt
spLiaTit
ts(i5tpTtptc
cves
tadbpabgmtb
f(siasL(bd(hah
am
ABRAMSON ET AL 355
In early investigations using video endoscopy,ojewski et al4 concluded that patients with OSAave “disproportionate anatomy” consisting of a largeoft palate, large tongue base, and mandibular defi-iency. Other investigators analyzed lateral cephalo-rams and demonstrated a decreased posterior airwaypace (PAS) and increased hyoid to mandibular planeistance (HMP) in patients with OSA compared withge-matched controls.5,6 However, these 2-dimen-ional images do not accurately reflect the 3-dimen-ional (3D) airway anatomy, and little evidence isvailable to document a correlation between the PASnd severity of OSA as measured by the respiratoryisturbance index (RDI).5,7,8 More recently, 3D com-uted tomography (CT) has been used to characterizehe airway anatomy in patients with OSA.9-16 How-ver, the small number of studies, the questionableeliability of 3D methods, and the lack of normalontrols have made interpretation of these studiesifficult.Normative 3D-CT upper airway parameters for var-
ous age groups have been previously published byur group.17 The purpose of the present study was toeasure the airway size and shape using 3D-CT imag-
ng and to correlate the characteristics of the upperirway with the presence and severity of OSA.
aterials and Methods
PATIENTS
This was a retrospective case series of patients withSA treated at the Department of Oral and Maxillofa-ial Surgery, Massachusetts General Hospital, fromarch 2002 through January 2007. Patients were in-
luded if the diagnosis of OSA was confirmed byvernight polysomnogram findings and a pretreat-ent 3D-CT scan from the soft palate to the base of
he epiglottis was available. Age and gender wereecorded for all patients, and the body mass indexBMI) and RDI were recorded for those with OSA.
The CT scans of patients without OSA or any sleep-elated symptoms were evaluated as controls in arevious study17 and were used for comparison withhe patients with OSA in the present study.
IMAGE ACQUISITION
The method for image acquisition and analysis de-cribed in the present report has been previouslyublished.17 Maxillofacial noncontrast CT scans (GEightSpeed, Milwaukee, WI) consisting of 2.5-mm ax-al tomograms, with reconstructions in the coronalnd sagittal planes, were used for the present study.he patients were in the supine position and were
nstructed to remain still, to not swallow, and to hold
heir breath at the end of exhalation. fiStandardized digital lateral cephalograms were ob-ained using Planmeca Dimax 2 Ceph (Planmeca, Hel-inki, Finland). The x-ray settings were 62 to 66 kVpaccording to gender and race), 9 to 12 mA (accord-ng to gender and race), and source-to-sensor distance0 to 60 cm (1.13� magnification). Radiographs wereaken with the patient standing in the natural headosition and stabilized by a head-holder and ear rods.he mandible was positioned in central relation and
he lips were relaxed. Patients were instructed tolace the tongue against the incisor teeth and noto swallow. A reference line of 50 mm was used toalibrate the measurements for each image.
IMAGE ANALYSIS
The scans were imported into the CT analyzingomputer software “3-D Slicer,” developed at the Har-ard Surgical Planning Laboratory (Brigham and Wom-n’s Hospital, Boston, MA). Digital 3D model recon-tructions of the airways were made (Fig 1).17
The superior upper airway boundary was defined athe level of the hard palate and the inferior boundaryt the base of the epiglottis, consistent with methodsescribed in previous studies.11,17 The superioroundary was the axial slice that best visualized theosterior nasal spine. The inferior boundary was thexial slice that intersected the inflection point madey the base of the epiglottis and the anterior pharyn-eal wall. The lateral and posterior boundaries of theodel consisted of the pharyngeal walls and the an-
erior boundary, the anterior wall of the pharynx, thease of the tongue, and the soft palate.
AIRWAY PARAMETERS
Once the 3D digital models were constructed, theollowing airway parameters were obtained: volumeVOL), surface area (SA), length (L), average cross-ectional (avgCSA), minimum retroglossal (RG), min-mum retropalatal (RP) and minimum cross-sectionalrea (minCSA), retroglossal anteroposterior dimen-ion (AP), retroglossal lateral dimension (LAT),AT/AP ratio, RP/RG, uniformity (U), and sphericity�). CT skeletal landmarks (genial tubercle and hyoidone) were identified in the midsagittal plane. Theistance between the genial tubercle and hyoid boneGH) was measured. For all patients with OSA, theeight was recorded and used to compute a correctedirway length (corrected airway length � length/eight).17
Standard cephalometric parameters were measurednd recorded for the OSA group: PAS, HMP, andiddle airway space. All airway parameters are de-
ned in Table 1.
dSCaitara.wts
R
thagspcgpmovostz
tpofcm2t
ceb7dtst
niat
n.a.rT
Fehm(ra
A lofac S
356 3D-CT OF AIRWAY ANATOMY IN OSA
STATISTICAL ANALYSIS
The data were entered into a statistical databaseuring the course of the study (Statistical Package forocial Sciences Graduate pack, version 11.0; SPSS,hicago, IL). Descriptive statistics were computed forll variables. Bivariate statistics were computed todentify airway parameters that differed between pa-ients with OSA and controls. For those with OSA, theirway parameters were evaluated to determine the cor-elations with the severity of disease (RDI). The vari-bles with associations that were near significant (P �15) were included in multiple regression analyses,
hich controlled for the simultaneous effects of mul-iple covariates. For all analyses, P � 0.05 was con-idered statistically significant.
esults
PATIENTS
A total of 44 patients with OSA were treated duringhe study period, of whom, 15 (10 men and 5 women)ad pre- and postoperative CT scans available and metll the inclusion criteria. Not all patients had under-one CT scanning, because routine pretreatment CTcanning was not a part of the original treatmentrotocol. The 3D-CT scans for the 15 patients in-luded in the present study were performed for sur-ical treatment planning and/or to rule out otherathologic features. The CT scans for 17 controls (11en and 6 women) were ordered for the evaluation
f traumatic injuries with no evidence of airway in-olvement. The traumatic injuries included isolatedrbital floor fractures in 3, anterior wall maxillaryinus fractures in 3, nondisplaced subcondylar frac-ures in 3, zygomatic arch fractures in 2, nondisplaced
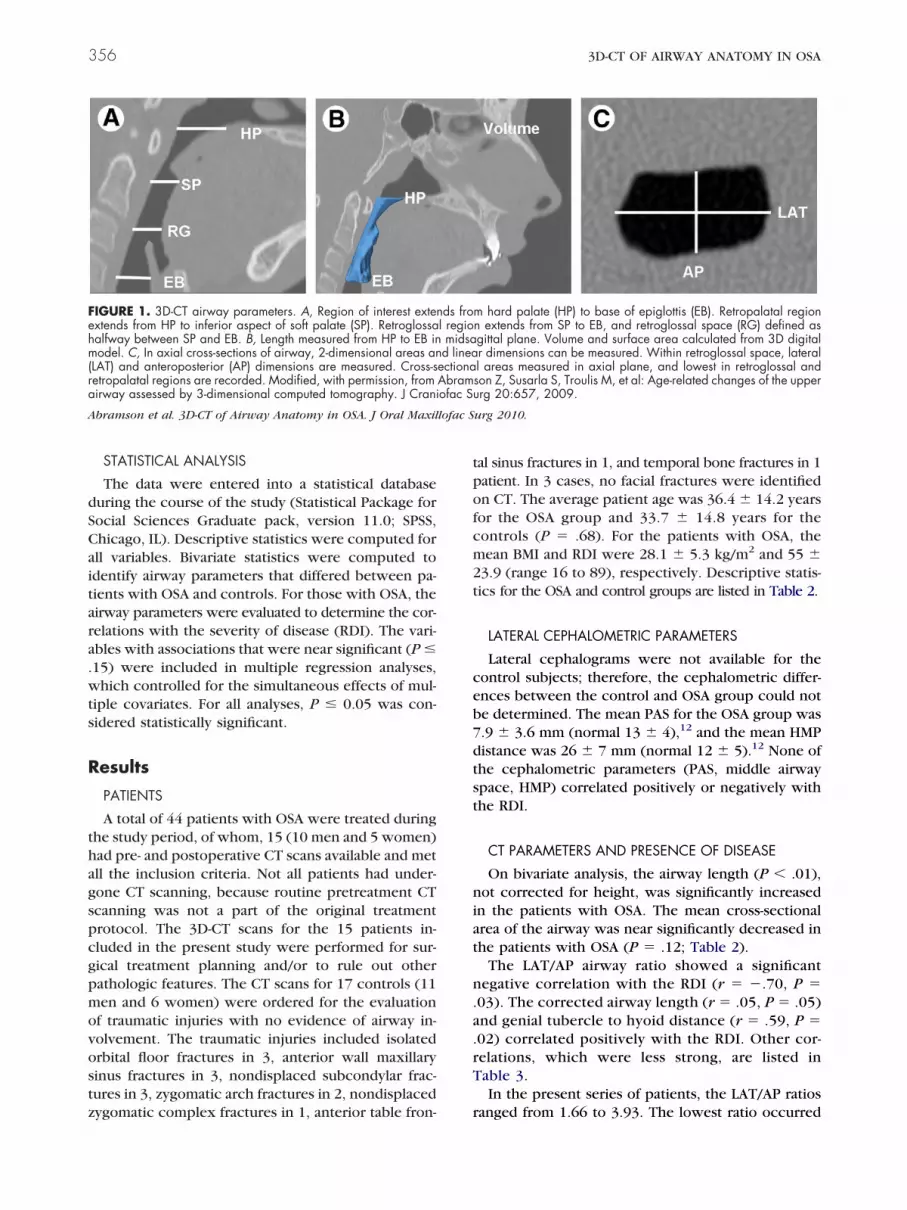
IGURE 1. 3D-CT airway parameters. A, Region of interest extenxtends from HP to inferior aspect of soft palate (SP). Retroglossaalfway between SP and EB. B, Length measured from HP to EB inodel. C, In axial cross-sections of airway, 2-dimensional areas an
LAT) and anteroposterior (AP) dimensions are measured. Cross-setropalatal regions are recorded. Modified, with permission, fromirway assessed by 3-dimensional computed tomography. J Crani
bramson et al. 3D-CT of Airway Anatomy in OSA. J Oral Maxil
ygomatic complex fractures in 1, anterior table fron- r
al sinus fractures in 1, and temporal bone fractures in 1atient. In 3 cases, no facial fractures were identifiedn CT. The average patient age was 36.4 � 14.2 yearsor the OSA group and 33.7 � 14.8 years for theontrols (P � .68). For the patients with OSA, theean BMI and RDI were 28.1 � 5.3 kg/m2 and 55 �
3.9 (range 16 to 89), respectively. Descriptive statis-ics for the OSA and control groups are listed in Table 2.
LATERAL CEPHALOMETRIC PARAMETERS
Lateral cephalograms were not available for theontrol subjects; therefore, the cephalometric differ-nces between the control and OSA group could note determined. The mean PAS for the OSA group was.9 � 3.6 mm (normal 13 � 4),12 and the mean HMPistance was 26 � 7 mm (normal 12 � 5).12 None ofhe cephalometric parameters (PAS, middle airwaypace, HMP) correlated positively or negatively withhe RDI.
CT PARAMETERS AND PRESENCE OF DISEASE
On bivariate analysis, the airway length (P � .01),ot corrected for height, was significantly increased
n the patients with OSA. The mean cross-sectionalrea of the airway was near significantly decreased inhe patients with OSA (P � .12; Table 2).
The LAT/AP airway ratio showed a significantegative correlation with the RDI (r � �.70, P �
03). The corrected airway length (r � .05, P � .05)nd genial tubercle to hyoid distance (r � .59, P �02) correlated positively with the RDI. Other cor-elations, which were less strong, are listed inable 3.In the present series of patients, the LAT/AP ratios
m hard palate (HP) to base of epiglottis (EB). Retropalatal regionn extends from SP to EB, and retroglossal space (RG) defined asgittal plane. Volume and surface area calculated from 3D digitalr dimensions can be measured. Within retroglossal space, laterall areas measured in axial plane, and lowest in retroglossal andson Z, Susarla S, Troulis M, et al: Age-related changes of the upperrg 20:657, 2009.
urg 2010.
ds frol regiomidsad linea
ectionaAbramofac Su
anged from 1.66 to 3.93. The lowest ratio occurred
wwepoca
ics
cigrrrovra
C
C
C
M3
A lofac S
ABRAMSON ET AL 357
hen the lateral and anteroposterior dimensionsere equal, and the greatest occurred when the lat-
ral dimensions were 4 times greater than the antero-osterior dimensions. This ratio relates to the shapef the airway, with lower ratios describing more cir-ular airways and greater ratios reflecting ellipticalirways.
The variables that were near significance (P � .15)n correlating with the RDI on bivariate analysis wereonsidered for inclusion in multiple regression analy-
Table 1. DEFINITION OF AIRWAY PARAMETERS
Airway Parameter Symbol Type
T, sizeVolume VOL 3D
Surface area SA 2DLength L 1DCorrected airway length CAL Ratio
Average cross-sectional area avgCSA 2DMinimum retropalatal area RP 2D
Minimum retroglossal area RG 2D
Minimum cross-sectional area minCSA 2D
Lateral dimension ofretroglossal airway
LAT 1D
Anteroposterior dimension ofretroglossal airway
AP 1D
Genial tubercle to hyoid bonedistance
GH 1D
T, shapeRatio of lateral to
anteroposterior dimensionsLAT/AP Ratio
Ratio of minimum retropalataland retroglossal areas
RP/RG Ratio
Airway uniformity U Ratio
Sphericity � Formula
ephalometricPosterior airway space PAS 1D
Middle airway space MAS 1D
Hyoid to mandibular planedistance
HMP 1D
odified, with permission, from Abramson Z, Susarla S, Tro-dimensional computed tomography. J Craniofac Surg 20:6
bramson et al. 3D-CT of Airway Anatomy in OSA. J Oral Maxil
is, controlled for the simultaneous effects of multiple 2
ovariates (Table 3). The overall model, which signif-cantly correlated with the RDI and contained thereatest number of individual CT parameters that cor-elated significantly with the RDI, consisted of a cor-ected airway length and LAT/AP ratio (Table 4). Thisegression model suggested that approximately 60%f the variability in RDI can be explained by theariability in the corrected airway length and LAT/APatio. An increase in corrected airway length wasssociated with an increase in the RDI (coefficient �
it Definition
Volume of airway from base of epiglottis and hardpalate
2 Surface area of airwayLength from hard palate to base of epiglottisLength from hard palate to base of epiglottis
divided by patient height in millimeters2 Average cross-sectional area, equal to VOL/length2 Minimum cross-sectional area of retropalatal
airway (from inferior aspect of soft palate tolevel of hard palate)
2 Minimum cross-sectional area of retroglossalairway (from base of epiglottis to inferior aspectof soft palate)
2 Lowest value among RG and RP, lowest cross-sectional area of airway
Lateral dimension of cross section of airway inmiddle of retroglossal area (between base ofepiglottis and inferior aspect of soft palate)
Anteroposterior dimension of cross section ofairway in middle of retroglossal area (betweenbase of epiglottis and inferior aspect of softpalate)
Distance from genial tubercle to hyoid bone inmidsagittal plane
Ratio of AP and lateral dimensions
Ratio of RP and RG areas
Airway uniformity, defined as minCSA divided byaveCSA
Mathematical measure of sphericity (how roundan object is); a flat object has sphericity of 0and a sphere has a sphericity of 1; sphericity(�) � [�1/3(6�VOL)2/3]/SA
Posterior airway space measured along line from Bpoint to gonion
Middle airway space taken parallel to Frankforthorizontal midway through soft palate
Hyoid to mandibular plane distance on lateralcephalogram
, et al: Age-related changes of the upper airway assessed by09.
urg 2010.
Un
mL
cmmmNA
mmmm
mm
mm
mm
mm
mm
NA
NA
NA
NA
mm
mm
mm
ulis M57, 20
41, P � .02). An increase in the lateral/AP ratio

w�
D
hibtmtnvit
ass
atgic
dwalRaRmin
to
D
O
A
C
C
A
A
f
c
A lofac S
358 3D-CT OF AIRWAY ANATOMY IN OSA
as associated with a decreased RDI (coefficient �14.9, P � .01).
iscussion
Historically, 2-dimensional lateral cephalogramsave been used to assess skeletal and airway anatomy
n patients with OSA. However, these images can onlye used for linear and angular measurements. In con-rast, CT imaging allows the clinician to make lineareasurements and also to calculate the cross-sec-
ional areas of the airway in 3 planes of space: coro-al, sagittal, and axial. The axial plane, which is notisualized on a lateral cephalogram, is the most phys-ologically relevant plane because it is perpendicularo the airflow.18
In the current study, the presence of OSA wasssociated with an increase in airway length. Theeverity of disease was predicted in the present
Table 2. DESCRIPTIVE STATISTICS FOR STUDY POPULAT
Variable Contro
emographic measuresAge 33.Women 6BMISA parameters (n � 10)RDINadir oxygen saturation
natomic measures (3D-CT)Volume 12.SA 56.Length (cm) 66.Height (cm)Length/height
ross-sectional area (mean) 181.RP 80.RG 147.
ross-sectional area (min) 73.Lateral 22.AP 10.GH 33.LAT/AP 2.RP/RG 0.5U 0.4� 0.4
natomic measures (cephalometric)PASMASHMP
bbreviations: RDI, respiratory disturbance index; other abContinuous data presented as mean � SD.P values computed using nonparametric methods (Mann
or categorical measures.*Data from Abramson Z, Susarla S, Troulis M, et al: Age
omputed tomography. J Craniofac Surg 20:657, 2009.†Statistically significant differences (P � .05).
bramson et al. 3D-CT of Airway Anatomy in OSA. J Oral Maxil
tudy by airway length and LAT/AP ratio of the l
irway in the retroglossal space (halfway betweenhe tip of the soft palate and the base of the epi-lottis). Irrespective of other CT variables, the RDIncreased with an increasing airway length and de-reasing LAT/AP ratio.A number of CT imaging studies have reported a
ecreased cross-sectional airway area in patientsith OSA.9,13 Assessing the severity of OSA, Li et
l11 reported an inverse relationship between theateral dimension of the retroglossal airway and theDI. They also reported the minimum retropalatalnd retroglossal areas were inversely related to theDI.11 Vos et al10 found that the BMI and theinimum cross-sectional area, regardless of where
t was measured, correlated with the apnea-hypop-ea index.Segal et al19 found a positive correlation between
he upper airway length and RDI, independent of ager BMI. They also reported that the upper airway
17)* OSA (n � 15) P Value
.8 36.4 � 14.2 .685 (33.3) .91
55.0 � 23.982.1 � 10.6
6 12.5 � 6.9 .58.2 57.0 � 20.4 .85.1 76.7 � 11.1 �.01†
176.3 � 9.50.4 � 0.05
.2 157.5 � 67.9 .12
.4 64.0 � 43 .46
.1 128.4 � 81.9 .28
.2 61.5 � 44.7 .357 22.6 � 7.8 .941 10.1 � 5.6 .488 36.8 � 6.3 .134 2.6 � 0.9 .3336 0.69 � 0.53 .4517 0.39 � 0.21 .8205 0.45 � 0.04 .82
7.9 � 3.68.6 � 3.1
26.0 � 7.0
tions as in Table 1.
ey U test) for continuous measures and Fisher’s exact test
d changes of the upper airway assessed by 3-dimensional
urg 2010.
ION
l (n �
7 � 14(35.3)NA
NANA
3 � 4.3 � 163 � 10NANA6 � 552 � 520 � 609 � 393 � 7.9 � 4.3 � 3.4 � 1.8 � 0.1 � 0.6 � 0.
NANANA
brevia
-Whitn
-relate
ength (standardized for body height) was signifi-
cpwAgc
cwtsca
twi
mvsaa(
nactspdcow
pi
D
A
Ab
r
Ai
LL
Aa
Ai
GABLL
A
Ai
1
2
3
ABRAMSON ET AL 359
antly larger in males than in females with OSA. In theresent study, the BMI correlated with both the air-ay length and the length standardized to the height.lso, in contrast to the findings by Segal et al,19
ender differences in airway length were not signifi-ant when controlling for patient height.In the multiple regression model, we found that the
orrected airway length was significantly associatedith the RDI in a positive direction (ie, an increase in
he corrected or standardized airway length corre-ponded to an increase in the RDI). Although theoefficient for the increase in RDI was notably large inbsolute terms (� � 240), it was small in relative
Table 3. BIVARIATE ASSOCIATIONS BETWEENPREDICTORS AND RDI
Variable
RDI
Coefficient P Value
emographic measuresAge 0.62 .01*Gender �0.58 .03*BMI 0.65 �.01*
natomic measuresVOL 0.52 .05*SA 0.43 .11*L 0.5 .06*Height 0.54 .45L/H 0.52 .05*avgCSA 0.49 .06*RP 0.25 .36RG 0.29 .29minCSA 0.26 .35LAT 0.23 .42AP 0.49 .07*GH 0.59 .02*LAT/AP �0.57 .03*RP/RG �0.15 .59U �0.05 .83� 0.26 .34
bbreviations: RDI, respiratory disturbance index; BMI,ody mass index; other abbreviations as in Table 1.*Associations meeting criterion for inclusion in multiple
egression model (P � .15).
bramson et al. 3D-CT of Airway Anatomy in OSA. J Oral Max-llofac Surg 2010.
Table 4. MULTIPLE REGRESSION ANALYSIS FOR RDIWITH CT PARAMETERS
Variable Coefficient P Value
AT/AP �14.9 .01ength/height 241 .02
bbreviations: RDI, respiratory disturbance index; otherbbreviations as in Table 1.R-square � 0.60, P � .001.
bramson et al. 3D-CT of Airway Anatomy in OSA. J Oral Max-llofac Surg 2010.
Ai
erms, because the range of the length/height ratiosas about 0.035 to 0.052, corresponding to increases
n the RDI of 8 to 12 points.When the BMI, age, and gender were added to theodel, it could explain approximately 70% of the
ariability in the RDI. However, because a moderatelytrong correlation was present between the BMI andirway length (r � .60, P � .001), in this setting, theirway length can serve as a CT proxy for the BMITable 5).
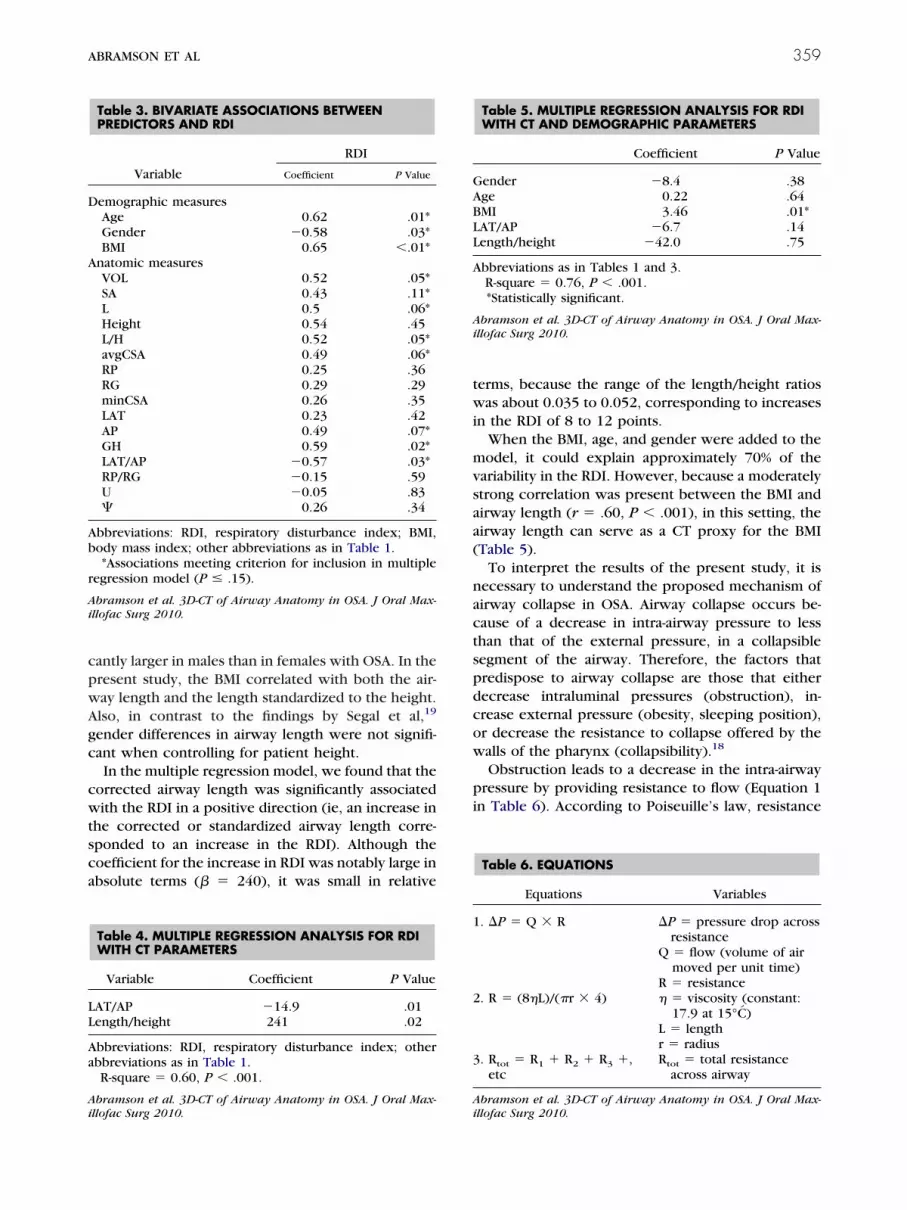
To interpret the results of the present study, it isecessary to understand the proposed mechanism ofirway collapse in OSA. Airway collapse occurs be-ause of a decrease in intra-airway pressure to lesshan that of the external pressure, in a collapsibleegment of the airway. Therefore, the factors thatredispose to airway collapse are those that eitherecrease intraluminal pressures (obstruction), in-rease external pressure (obesity, sleeping position),r decrease the resistance to collapse offered by thealls of the pharynx (collapsibility).18
Obstruction leads to a decrease in the intra-airwayressure by providing resistance to flow (Equation 1
n Table 6). According to Poiseuille’s law, resistance
Table 5. MULTIPLE REGRESSION ANALYSIS FOR RDIWITH CT AND DEMOGRAPHIC PARAMETERS
Coefficient P Value
ender �8.4 .38ge 0.22 .64MI 3.46 .01*AT/AP �6.7 .14ength/height �42.0 .75
bbreviations as in Tables 1 and 3.R-square � 0.76, P � .001.*Statistically significant.
bramson et al. 3D-CT of Airway Anatomy in OSA. J Oral Max-llofac Surg 2010.
Table 6. EQUATIONS
Equations Variables
. �P � Q � R �P � pressure drop acrossresistance
Q � flow (volume of airmoved per unit time)
R � resistance. R � (8�L)/(�r � 4) � � viscosity (constant:
17.9 at 15°C)L � lengthr � radius
. Rtot � R1 � R2 � R3 �,etc
Rtot � total resistanceacross airway
bramson et al. 3D-CT of Airway Anatomy in OSA. J Oral Max-llofac Surg 2010.
ai(ftiO
pmdttaaTcilrf
gws
OgscdMmweLbcaS
cpastnfiibgiti
FL
A
FApc
Ai
360 3D-CT OF AIRWAY ANATOMY IN OSA
t the site of an obstruction is directly proportional tots length and inversely proportional to the radiusEquation 2 in Table 6). In the present study, weound an increased airway length was associated withhe presence of OSA, suggesting a possible cause ofncreased upper airway resistance in patients withSA.19-21
The finding that airway length was increased inatients with OSA is surprising because of the com-on notion that the most constricted site is the pre-
ominant contributor to airway resistance (resis-ance to flow is inversely proportional to the radiuso the fourth power). However, because the upperirway consists of a single conduit, resistance isctually added in series (Equation 3 in Table 6).his suggests that small decreases in the airwayross-sectional area can be magnified by increasesn the airway length. Mild obstruction at multipleevels of the airway, in patients with OSA, mightesult in a large increase in total airway resistanceor a greater airway length.
Many patients with OSA are obese, with a BMIreater than 30 kg/m2. Consistent with other reports,e found a correlation between the BMI and disease
everity, as measured by the RDI.22
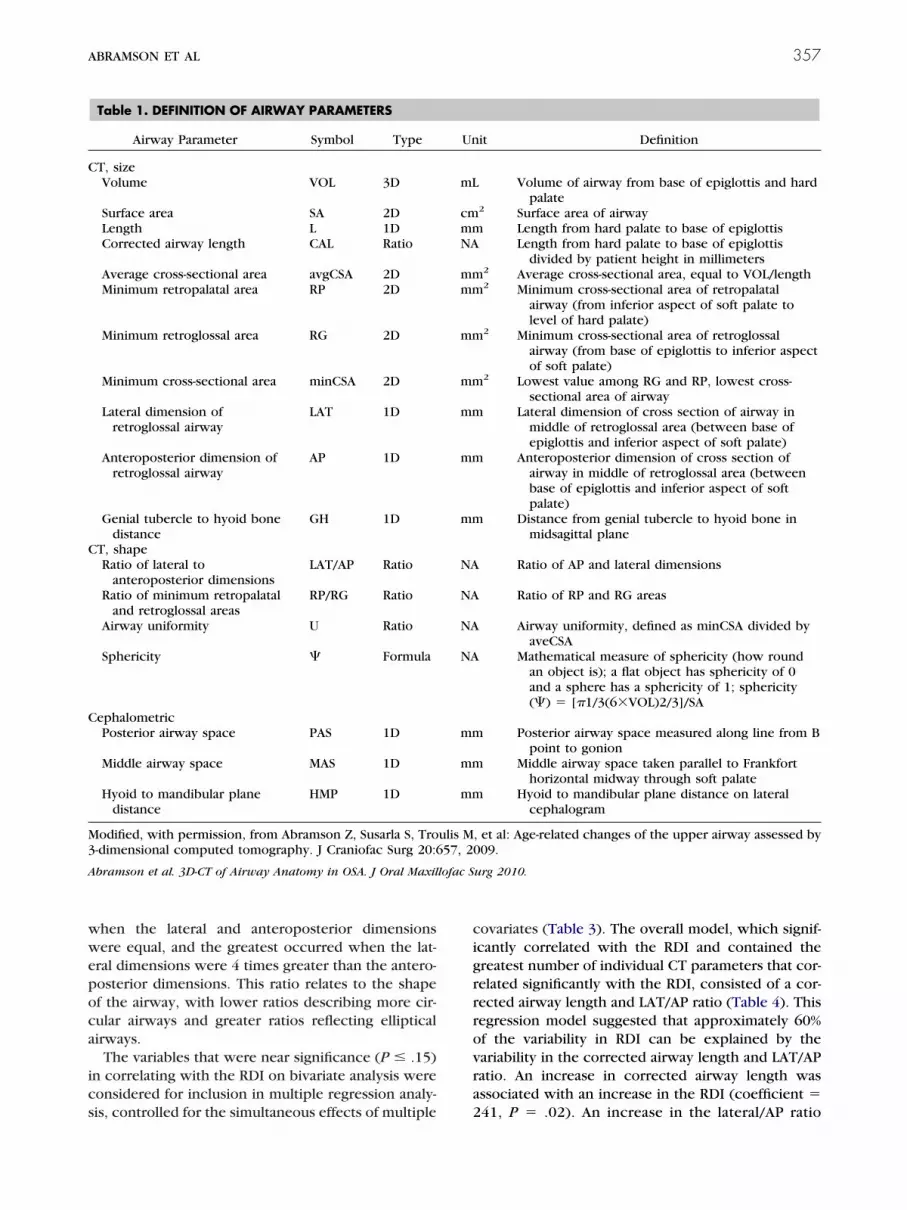
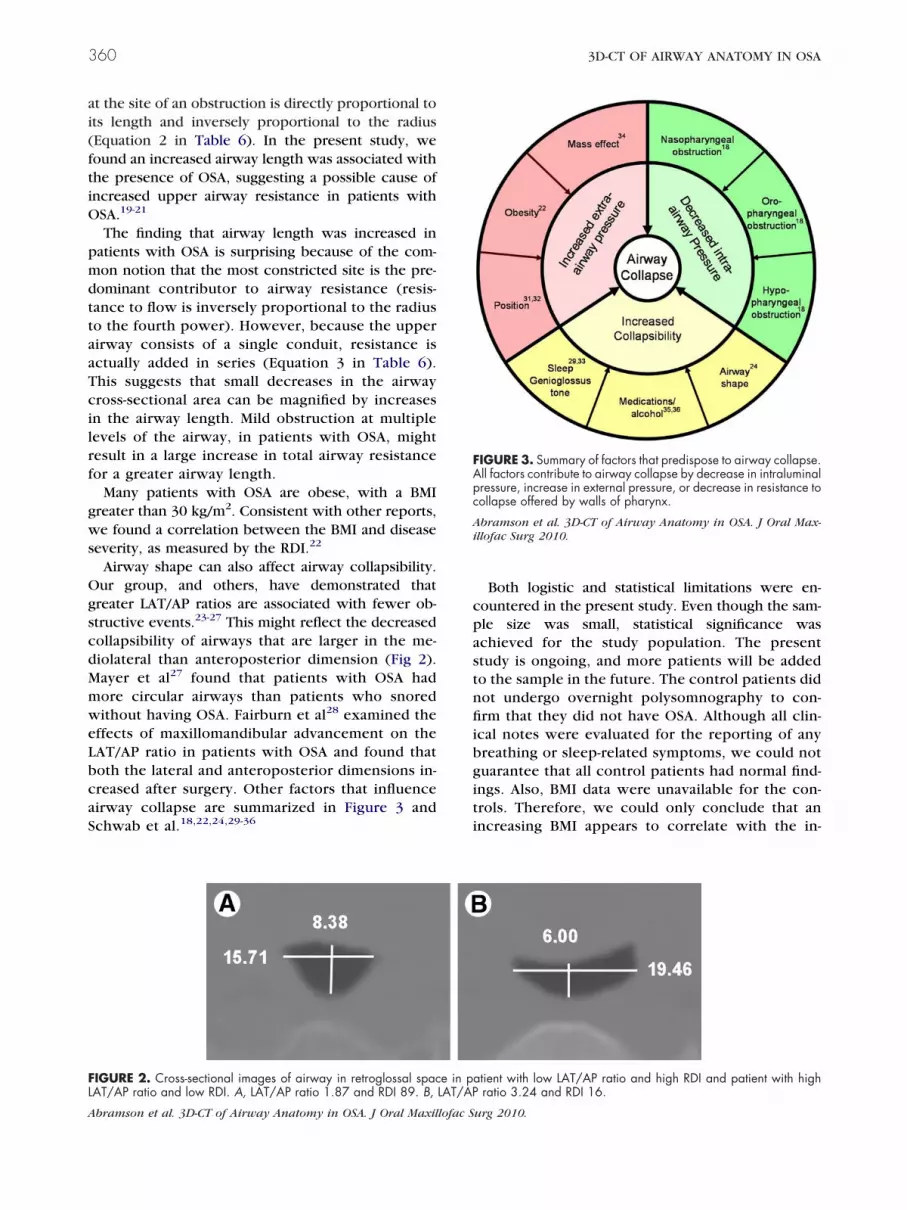
Airway shape can also affect airway collapsibility.ur group, and others, have demonstrated thatreater LAT/AP ratios are associated with fewer ob-tructive events.23-27 This might reflect the decreasedollapsibility of airways that are larger in the me-iolateral than anteroposterior dimension (Fig 2).ayer et al27 found that patients with OSA hadore circular airways than patients who snoredithout having OSA. Fairburn et al28 examined the
ffects of maxillomandibular advancement on theAT/AP ratio in patients with OSA and found thatoth the lateral and anteroposterior dimensions in-reased after surgery. Other factors that influenceirway collapse are summarized in Figure 3 andchwab et al.18,22,24,29-36
IGURE 2. Cross-sectional images of airway in retroglossal spacAT/AP ratio and low RDI. A, LAT/AP ratio 1.87 and RDI 89. B,
bramson et al. 3D-CT of Airway Anatomy in OSA. J Oral Maxillofac S
Both logistic and statistical limitations were en-ountered in the present study. Even though the sam-le size was small, statistical significance waschieved for the study population. The presenttudy is ongoing, and more patients will be addedo the sample in the future. The control patients didot undergo overnight polysomnography to con-rm that they did not have OSA. Although all clin-
cal notes were evaluated for the reporting of anyreathing or sleep-related symptoms, we could notuarantee that all control patients had normal find-ngs. Also, BMI data were unavailable for the con-rols. Therefore, we could only conclude that anncreasing BMI appears to correlate with the in-
tient with low LAT/AP ratio and high RDI and patient with highratio 3.24 and RDI 16.
IGURE 3. Summary of factors that predispose to airway collapse.ll factors contribute to airway collapse by decrease in intraluminalressure, increase in external pressure, or decrease in resistance toollapse offered by walls of pharynx.
bramson et al. 3D-CT of Airway Anatomy in OSA. J Oral Max-llofac Surg 2010.
e in paLAT/AP
urg 2010.

cto
iTsesa
ypsslwliAtiasrua
A
fHsaBa
R
1
1
1
1
1
1
1
1
1
1
2
2
2
2
2
2
2
2
2
2
ABRAMSON ET AL 361
reasing severity of OSA and could not report onhe relationship between the BMI and the presencef OSA.Another potential limitation was that the CT scans
n the present study were done of awake patients.he anatomy and physiology of the airway duringleep are different from those while awake.29 How-ver, the goal of the present study was not to simulateleep but to find useful anatomic correlates that canssist in diagnosis and treatment planning.
The results of the present study indicate that anal-sis of airway size and shape using 3D-CT imaging is aotentially powerful tool to assess the presence andeverity of OSA. The importance of airway size andhape in the etiopathogenesis of OSA has been high-ighted in the present study. Specifically, longer air-
ays appear to predispose patients to OSA. Less el-iptical airways with smaller LAT/AP ratios appear tonfluence obstructive events in patients with OSA.lthough the present study demonstrated an associa-
ion between airway shape and the severity of OSA, its still unclear how surgical intervention alters theirway shape and whether improvements in airwayhape will correlate with improvements in sleep-elated data. We plan additional investigations to eval-ate the effect of maxillomandibular advancement onirway size and shape.
cknowledgments
The authors thank Thomas Dodson, DMD, MPH, Associate Pro-essor of Oral and Maxillofacial Surgery, Massachusetts Generalospital, for his input regarding study design and statistical analy-
is; and James R. Tagoni, BS, Harvard School of Dental Medicine,nd Raul San Jose, PhD, Harvard Surgical Planning Laboratory,righam and Women’s Hospital (Boston, MA) for their technicaldvice regarding the use of computer software.
eferences1. Ryan CM, Bradly TD: Pathogenesis of obstructive sleep apnea.
J Appl Physiol 99:2440, 20052. Parish JM, Somers VK: Obstructive sleep apnea and cardiovas-
cular disease. Mayo Clin Proc 79:1036, 20043. Hla KM, Young TB, Bidwell T, et al: Sleep apnea and hyper-
tension: A population based study. Ann Intern Med 120:382,1994
4. Rojewski TE, Schuller DE, Clark RW, et al: Videoendoscopicdetermination of the mechanism of obstruction in obstructivesleep apnea. Otolaryngol Head Neck Surg 92:127, 1984
5. Guilleminault C, Riley R, Powell N: Obstructive sleep apneaand abnormal cephalometric measurements. Implications fortreatment. Chest 86:793, 1984
6. Partinen M, Guilleminault C, Quera-Salva M, et al: Obstructivesleep apnea and cephalometric roentgenograms: The role ofanatomic upper airway abnormalities in the definition of ab-normal breathing during sleep. Chest 93:1199, 1988
7. Zucconi M, Ferini-Strambi L, Palazzi S, et al: Habitual snoringwith and without obstructive sleep apnoea: The importance of
cephalometric variables. Thorax 47:157, 19928. Schäfer J, Sieron J, Pirsig W et al: Radiocephalometric find-ings and duration of snoring in habitual snoring and obstruc-tive apnea syndrome. Laryngorhinootologie 68:163, 1989
9. Lan Z, Itoi A, Takashima M, et al: Difference of pharyngealmorphology and mechanical property between OSAHA pa-tients and normal subjects. Auris Nasus Larynx 33:433,2006
0. Vos W, De Backer J, Devolder A, et al: Correlation betweenseverity of sleep apnea and upper airway morphology based onadvanced anatomical and functional imaging. J Biomech 40:2207, 2007
1. Li H, Chen N, Wang C, et al: Use of 3-dimensional computedtomography scan to evaluate upper airway patency for patientsundergoing sleep disordered breathing surgery. OtolaryngolHead Neck Surg 129:336, 2003
2. Verin E, Tardif C, Buffet X, et al: Comparison between anatomyand resistance of upper airway in normal subjects, snorers andOSAS patients. Respir Physiol 129:335, 2002
3. Caballero P, Alvares-Sala R, Garcia-Rio F, et al: CT evaluation ofthe upper airway in healthy subjects and in patients withobstructive sleep apnea syndrome. Chest 113:111, 1998
4. Chen NH, Li KK, Li SY, et al: Airway assessment by volumetriccomputed tomography in snorers and subjects with obstruc-tive sleep apnea in a Far-East Asian population. Laryngoscope112:721, 2002
5. Schwab RJ, Gupta KB, Gefter WB, et al: Upper airway and softtissue anatomy in normal subjects and in patients with sleep-disordered breathing; significance of lateral pharyngeal walls.Am J Respir Crit Care Med 152:1673, 1995
6. Sher AE, Schechtman KB, Piccirillo JF: The efficacy of surgicalmodifications of the upper airway in adults with obstructivesleep apnea syndrome. Sleep 19:156, 1996
7. Abramson Z, Susarla S, Troulis M, et al: Age-related changes ofthe upper airway assessed by 3-dimensional computed tomog-raphy. J Craniofac Surg 20:657, 2009
8. Isono S, Morrison DL, Sandrine HL, et al: Static mechanics ofthe velopharynx of patients with obstructive sleep apnea.J Appl Physiol 82:1319, 1993
9. Segal Y, Malhotra A, Pillar G: Upper airway length may beassociated with the severity of obstructive sleep apnea syn-drome. Sleep Breath 12:311, 2008
0. Pae EK, Lowe AA, Fleetham JA: A role of pharyngeal length inobstructive sleep apnea patients. Am J Orthod Dentofac Or-thop 111:12, 1997
1. Malhotra A, Huang Y, Fogel RB, et al: The male predispositionto pharyngeal collapse: Importance of airway length. Am JRespir Crit Care Med 166:1388, 2002
2. Nayeslowski G, Scierski W, Mrowk-Kata A, et al: Sleep studieswith patients with overweight and obesity. J Physiol Pharmacol56(Suppl 6):59, 2005
3. Suratt PM, Dee P, Atkinson RL, et al: Fluoroscopic and com-puter tomographic features of the pharyngeal airway in ob-structive sleep apnea. Am Rev Respir Dis 127:477, 1993
4. Leiter JC: Upper airway shape: Is it important in the pathogen-esis of obstructive sleep apnea? Am J Respir Crit Care Med153:894, 1996
5. Shelton KE, Gay SB, Woodson H, et al: Pharyngeal fat in ob-structive sleep apnea. Am Rev Respir Dis 148:462, 1993
6. Li KK, Guilleminault C, Riley RW, et al: Obstructive sleepapnea and maxillomandibular advancement: An assessment ofairway changes using radiographic and nasopharyngoscopicexamination. J Oral Maxillofac Surg 60:526, 2002
7. Mayer P, Pépin JL, Bettega G, et al: Relationship between bodymass index, age and upper airway measurements in snorersand sleep apnoea patients. Eur Respir J 9:1801, 1996
8. Fairburn SC, Waite PD, Vilos G, et al: Three-dimensionalchanges in upper airways of patients with obstructive sleepapnea following maxillomandibular advancement. J Oral Max-illofac Surg 65:6, 2007
9. Ayappa I, Rapoport DM: The upper airway in sleep: Physiology
of the pharynx. Sleep Med Rev 7:9, 2003
3
3
3
3
3
3
3
362 3D-CT OF AIRWAY ANATOMY IN OSA
0. Schwab RJ, Gefter WB, Hoffman EA, et al: Dynamic upperairway imaging during awake respiration in normal subjectsand patients with sleep disordered breathing. Am Rev RespirDis 148:1385, 1993
1. Jan MA, Marshall I, Douglas NJ: Effect of posture on upperairway dimensions in normal human. Am J Respir Crit CareMed 149:145, 1994
2. Battagel JM, Johal A, Smith AM, et al: Postural variation inoropharyngeal dimensions in subjects with sleep-disordered
breathing: A cephalometric study. Eur J Orthod 24:263, 20023. Patil SP, Schneider H, Marx JJ, et al: Neuromechanical control ofupper airway patency during sleep. J Appl Physiol 102:547, 2007
4. Smadi T, Raza MA, Woodson BT, et al: Obstructive sleep apneacaused by carotid body tumor: Case report. J Clin Sleep Med5:517, 2007
5. Hanly P, Powles P: Hypnotics should never be used in patientswith sleep apnea. J Psychosom Res 37(Suppl 1):59, 1993
6. Scanlan MF, Roebuck T, Little PJ, et al: Effect of moderatealcohol upon obstructive sleep apnea. Eur Respir J 16:909,
2000