Genetics of distal hereditary motor neuropathies
306
GENETICS OF DISTAL HEREDITARY MOTOR NEUROPATHIES By alexander peter drew A thesis submitted for the Degree of Doctor of Philosophy Supervised by Professor Garth A. Nicholson Dr. Ian P. Blair Faculty of Medicine University of Sydney 2012
-
Upload
khangminh22 -
Category
Documents
-
view
4 -
download
0
Transcript of Genetics of distal hereditary motor neuropathies

G E N E T I C S O F D I S TA L H E R E D I TA RYM O T O R N E U R O PAT H I E S
By
alexander peter drew
A thesis submitted for the Degree ofDoctor of Philosophy
Supervised byProfessor Garth A. Nicholson
Dr. Ian P. Blair
Faculty of MedicineUniversity of Sydney
2012

statement
No part of the work described in this thesis has been submitted in fulfilment ofthe requirements for any other academic degree or qualification. Except wheredue acknowledgement has been made, all experimental work was performedby the author.
Alexander Peter Drew

C O N T E N T S
acknowledgements . . . . . . . . . . . . . . . . . . . . . . . . . . . . . isummary . . . . . . . . . . . . . . . . . . . . . . . . . . . . . . . . . . . . iilist of figures . . . . . . . . . . . . . . . . . . . . . . . . . . . . . . . . vlist of tables . . . . . . . . . . . . . . . . . . . . . . . . . . . . . . . . viiiacronyms and abbreviations . . . . . . . . . . . . . . . . . . . . . xipublications . . . . . . . . . . . . . . . . . . . . . . . . . . . . . . . . . xiv
1 literature review . . . . . . . . . . . . . . . . . . . . . . . . . . . 11.1 Molecular genetics and mechanisms of disease in Distal
Hereditary Motor Neuropathies . . . . . . . . . . . . . . . . . . . 11.1.1 Small heat shock protein family . . . . . . . . . . . . . . 21.1.2 Dynactin 1 (DCTN1) . . . . . . . . . . . . . . . . . . . . . 91.1.3 Immunoglobulin mu binding protein 2 gene (IGHMBP2) 111.1.4 Senataxin (SETX) . . . . . . . . . . . . . . . . . . . . . . . 141.1.5 Glycyl-tRNA synthase (GARS) . . . . . . . . . . . . . . . 161.1.6 Berardinelli-Seip congenital lipodystrophy 2 (SEIPIN)
gene (BSCL2) . . . . . . . . . . . . . . . . . . . . . . . . . 181.1.7 ATPase, Cu2+-transporting, alpha polypeptide gene (ATP7A) 201.1.8 Pleckstrin homology domain-containing protein, G5 gene
(PLEKHG5) . . . . . . . . . . . . . . . . . . . . . . . . . . . 211.1.9 Transient receptor potential cation channel, V4 gene (TRPV4) 221.1.10 DYNC1H1 . . . . . . . . . . . . . . . . . . . . . . . . . . . 231.1.11 Clinical variability in dHMN . . . . . . . . . . . . . . . . 241.1.12 Common disease mechanisms in dHMN . . . . . . . . . 29
2 general materials and methods . . . . . . . . . . . . . . . . . 322.1 General materials and reagents . . . . . . . . . . . . . . . . . . . 32
2.1.1 Reagents and Enzymes . . . . . . . . . . . . . . . . . . . . 322.1.2 Equipment . . . . . . . . . . . . . . . . . . . . . . . . . . . 332.1.3 Plasticware . . . . . . . . . . . . . . . . . . . . . . . . . . . 33
2.2 Study participants . . . . . . . . . . . . . . . . . . . . . . . . . . . 342.3 DNA methods . . . . . . . . . . . . . . . . . . . . . . . . . . . . . 34
2.3.1 DNA extraction from blood . . . . . . . . . . . . . . . . . 342.3.2 DNA oligonucleotides . . . . . . . . . . . . . . . . . . . . 352.3.3 PCR protocol . . . . . . . . . . . . . . . . . . . . . . . . . 352.3.4 Agarose gel electrophoresis . . . . . . . . . . . . . . . . . 362.3.5 DNA purification from PCR . . . . . . . . . . . . . . . . . 362.3.6 DNA sequencing . . . . . . . . . . . . . . . . . . . . . . . 37

3 genetic mapping . . . . . . . . . . . . . . . . . . . . . . . . . . . . . 393.1 Introduction . . . . . . . . . . . . . . . . . . . . . . . . . . . . . . 39
3.1.1 Overview . . . . . . . . . . . . . . . . . . . . . . . . . . . 393.1.2 Homologous recombination and linkage disequilibrium 393.1.3 Genetic linkage analysis . . . . . . . . . . . . . . . . . . . 413.1.4 Penetrance in dHMN . . . . . . . . . . . . . . . . . . . . . 443.1.5 Characterisation of dHMN1 in a large Australian family 443.1.6 Previous genetic studies in dHMN1 at 7q34-q36 . . . . . 443.1.7 Hypothesis and aims . . . . . . . . . . . . . . . . . . . . . 48
3.2 Materials and Methods . . . . . . . . . . . . . . . . . . . . . . . . 503.2.1 Microsatellite analysis . . . . . . . . . . . . . . . . . . . . 503.2.2 Microsatellite markers . . . . . . . . . . . . . . . . . . . . 513.2.3 Haplotype analysis . . . . . . . . . . . . . . . . . . . . . . 513.2.4 Genetic linkage analysis . . . . . . . . . . . . . . . . . . . 523.2.5 Association analysis . . . . . . . . . . . . . . . . . . . . . 53
3.3 Results . . . . . . . . . . . . . . . . . . . . . . . . . . . . . . . . . 543.3.1 Fine mapping of family CMT54 . . . . . . . . . . . . . . . 543.3.2 Linkage analysis using new markers in CMT54 . . . . . 573.3.3 Identification of additional dHMN families . . . . . . . . 603.3.4 Linkage power analysis . . . . . . . . . . . . . . . . . . . 623.3.5 Genetic linkage analysis in additional dHMN families . 653.3.6 Suggestive linkage in family CMT44 . . . . . . . . . . . . 653.3.7 Uninformative families . . . . . . . . . . . . . . . . . . . . 663.3.8 dHMN families excluded from 7q34-q36 . . . . . . . . . 743.3.9 Haplotype association analysis . . . . . . . . . . . . . . . 75
3.4 Discussion . . . . . . . . . . . . . . . . . . . . . . . . . . . . . . . 763.4.1 Linkage analysis in CMT54 . . . . . . . . . . . . . . . . . 763.4.2 Linkage analysis in the extended dHMN cohort . . . . . 793.4.3 Proportion of dHMN caused by a pathogenic gene at
7q34-q36 . . . . . . . . . . . . . . . . . . . . . . . . . . . . 824 analysis of candidate genes . . . . . . . . . . . . . . . . . . . . 84
4.1 Introduction . . . . . . . . . . . . . . . . . . . . . . . . . . . . . . 844.1.1 Chapter overview . . . . . . . . . . . . . . . . . . . . . . . 844.1.2 Strategy for gene identification . . . . . . . . . . . . . . . 844.1.3 Identifying genes within a disease interval . . . . . . . . 854.1.4 Selection of candidate genes . . . . . . . . . . . . . . . . . 864.1.5 Gene screening methods . . . . . . . . . . . . . . . . . . . 88
4.2 Materials and Methods . . . . . . . . . . . . . . . . . . . . . . . . 904.2.1 In-silico candidate gene prioritisation . . . . . . . . . . . 904.2.2 PCR and sequencing for gene screening . . . . . . . . . . 904.2.3 Analysis of effect of variants on exon splicing . . . . . . 914.2.4 RNA studies of splicing variants . . . . . . . . . . . . . . 924.2.5 RNA folding prediction . . . . . . . . . . . . . . . . . . . 93
4.3 Results . . . . . . . . . . . . . . . . . . . . . . . . . . . . . . . . . 944.3.1 Positional candidate genes . . . . . . . . . . . . . . . . . . 94

4.3.2 Functional candidate gene selection . . . . . . . . . . . . 964.3.3 Screening candidate genes . . . . . . . . . . . . . . . . . . 994.3.4 Analysis of the interval defined by significantly associ-
ated haplotypes . . . . . . . . . . . . . . . . . . . . . . . . 1064.4 Discussion . . . . . . . . . . . . . . . . . . . . . . . . . . . . . . . 107
4.4.1 Gene screening summary . . . . . . . . . . . . . . . . . . 1074.4.2 Was the mutation missed? . . . . . . . . . . . . . . . . . . 108
5 copy number and structural variation . . . . . . . . . . . . 1095.1 Introduction . . . . . . . . . . . . . . . . . . . . . . . . . . . . . . 109
5.1.1 CNV and structural variation . . . . . . . . . . . . . . . . 1095.1.2 CNV in dHMN and related peripheral neuropathies . . 1125.1.3 Methods of detecting CNV . . . . . . . . . . . . . . . . . 1135.1.4 Hypothesis and Aim . . . . . . . . . . . . . . . . . . . . . 115
5.2 Materials and Methods . . . . . . . . . . . . . . . . . . . . . . . . 1155.2.1 Custom CGH Microarray . . . . . . . . . . . . . . . . . . 1155.2.2 Array processing . . . . . . . . . . . . . . . . . . . . . . . 1165.2.3 Software Nexus 5 . . . . . . . . . . . . . . . . . . . . . . . 1175.2.4 PCR confirmation of deletions . . . . . . . . . . . . . . . 118
5.3 Results . . . . . . . . . . . . . . . . . . . . . . . . . . . . . . . . . 1185.3.1 Cytogenetic analysis . . . . . . . . . . . . . . . . . . . . . 1185.3.2 CNV analysis at 7q34-q36 using aCGH . . . . . . . . . . 119
5.4 Discussion . . . . . . . . . . . . . . . . . . . . . . . . . . . . . . . 1305.4.1 Summary . . . . . . . . . . . . . . . . . . . . . . . . . . . . 1305.4.2 Comparison of methods for CNV analysis . . . . . . . . 1305.4.3 Limitations of array-based CGH . . . . . . . . . . . . . . 133
6 next generation sequencing of cmt54 . . . . . . . . . . . . . 1346.1 Introduction . . . . . . . . . . . . . . . . . . . . . . . . . . . . . . 134
6.1.1 NGS technology . . . . . . . . . . . . . . . . . . . . . . . . 1346.1.2 NGS of large genomes . . . . . . . . . . . . . . . . . . . . 1386.1.3 Applications of NGS to Mendelian disease . . . . . . . . 139
6.2 Materials and methods . . . . . . . . . . . . . . . . . . . . . . . . 1416.2.1 NimbleGen array-based targeted sequence capture . . . 1416.2.2 454 GS FLX sequencing . . . . . . . . . . . . . . . . . . . 1426.2.3 NimbleGen array-based exome capture and Solexa se-
quencing . . . . . . . . . . . . . . . . . . . . . . . . . . . . 1436.2.4 Confirmation of sequence variants using Sanger sequencing1446.2.5 Sequence variant analysis using Galaxy Browser . . . . . 1446.2.6 NGS assembly and annotation using Bowtie and SAMtools1446.2.7 Unequal coverage comparison . . . . . . . . . . . . . . . 1456.2.8 In silico prediction of functional impacts of sequence vari-
ants . . . . . . . . . . . . . . . . . . . . . . . . . . . . . . . 1456.3 Results . . . . . . . . . . . . . . . . . . . . . . . . . . . . . . . . . 146
6.3.1 Chromosome 7q34-q36 target region sequencing . . . . . 1466.3.2 7q34-q36 sequence variant analysis . . . . . . . . . . . . . 1476.3.3 Off-target and repeat mapping reads . . . . . . . . . . . . 154

6.3.4 Exome sequencing . . . . . . . . . . . . . . . . . . . . . . 1556.3.5 Further sequencing analysis using unequal coverage anal-
ysis . . . . . . . . . . . . . . . . . . . . . . . . . . . . . . . 1586.3.6 Exome wide analysis . . . . . . . . . . . . . . . . . . . . . 163
6.4 Discussion . . . . . . . . . . . . . . . . . . . . . . . . . . . . . . . 1646.4.1 Limitations of the NGS analysis . . . . . . . . . . . . . . 166
7 exome sequencing of cmt44 . . . . . . . . . . . . . . . . . . . . 1697.1 Introduction . . . . . . . . . . . . . . . . . . . . . . . . . . . . . . 1697.2 Materials and methods . . . . . . . . . . . . . . . . . . . . . . . . 170
7.2.1 Exome sequencing . . . . . . . . . . . . . . . . . . . . . . 1707.2.2 NGS variant analysis . . . . . . . . . . . . . . . . . . . . . 1717.2.3 HRM analysis . . . . . . . . . . . . . . . . . . . . . . . . . 172
7.3 Results . . . . . . . . . . . . . . . . . . . . . . . . . . . . . . . . . 1727.3.1 Exome sequencing in CMT44 . . . . . . . . . . . . . . . . 1727.3.2 Clinical detail of CMT44 . . . . . . . . . . . . . . . . . . . 1737.3.3 MFN2 genotyping in CMT44 using high resolution melt
analysis . . . . . . . . . . . . . . . . . . . . . . . . . . . . . 1777.3.4 Exome wide sequence variant analysis in CMT44 . . . . 1777.3.5 Comparison of SNPs between CMT44 and CMT54 . . . 179
7.4 Discussion . . . . . . . . . . . . . . . . . . . . . . . . . . . . . . . 1798 general discussion . . . . . . . . . . . . . . . . . . . . . . . . . . 185
8.1 Genetic studies in family CMT54 . . . . . . . . . . . . . . . . . . 1858.2 Genetic linkage analysis in additional dHMN families . . . . . 1908.3 Genetic studies in family CMT44 . . . . . . . . . . . . . . . . . . 1918.4 Conclusion . . . . . . . . . . . . . . . . . . . . . . . . . . . . . . . 192
a custom gnu bash scripts . . . . . . . . . . . . . . . . . . . . . . 194a.1 Linkage analysis . . . . . . . . . . . . . . . . . . . . . . . . . . . . 194a.2 NGS coverage visualisation . . . . . . . . . . . . . . . . . . . . . 197a.3 NGS variant comparison with fold coverage analysis . . . . . . 198
b pcr primers . . . . . . . . . . . . . . . . . . . . . . . . . . . . . . . . 205c pedigrees for additional dhmn families . . . . . . . . . . . 216d two point lod scores for additional
dhmn families . . . . . . . . . . . . . . . . . . . . . . . . . . . . . . . 230e multi-point lod scores for additional
dhmn families . . . . . . . . . . . . . . . . . . . . . . . . . . . . . . . 240f 7q34-q36 control haplotypes . . . . . . . . . . . . . . . . . . . 249g 7q34-q36 candidate genes and reported
gene expression . . . . . . . . . . . . . . . . . . . . . . . . . . . . . . 251h next generation sequencing . . . . . . . . . . . . . . . . . . . . 255i cnv identified with array cgh . . . . . . . . . . . . . . . . . . 257
bibliography . . . . . . . . . . . . . . . . . . . . . . . . . . . . . . . . . 261

A C K N O W L E D G E M E N T S
It is a pleasure to thank the people who made this PhD project possible. My
warmest thanks to my supervisors Professor Garth Nicholson and Dr Ian
Blair for your support, encouragement and the opportunities presented to
me throughout this project. To Garth, your expertise with the clinical aspects
of peripheral neuropathies as well as your academic experience have proved
invaluable. To Ian, thank you for your guidance in the lab, the opportunities
and resources I was given and the assistance with preparation of my thesis.
I am extremely grateful to all participating dHMN family members, without
whom this research would not be possible.
To my colleagues, in particular, Kelly Williams, for assistance with the
targeted sequencing of candidate genes and Jenn Solski, for assistance with
sequencing variants identified with NGS. To all the staff and students in the
Northcott Neuroscience and Molecular Medicine laboratories, thank you for
your friendly assistance over these years. The help of Annette Berryman in the
Molecular Medicine office and the procedural guidance of Tracey Dent and
Annet Doss in the ANZAC research institute office has been most helpful.
The support and encouragement of my friends and family has been essential.
My parents, Paul and Josephina Drew, have been a constant source of support,
both emotionally and financially during my postgraduate years. Finally, my
warmest thanks go to my girlfriend Victoria, without her loving support and
patience this thesis would never have been possible. You always bring me joy.
This work was supported in part by an Australian Postgraduate Award and
funding from the National Health and Medical Research Council of Australia
(511941).
i

S U M M A RY
The distal hereditary motor neuropathies (dHMN) are a clinically and geneti-
cally heterogeneous group of disorders that primarily affect motor neurons,
without significant sensory involvement. Using genome wide linkage analy-
sis in a large Australian family (CMT54), a form of dHMN was previously
mapped by this laboratory, to a 12.98 Mb interval on chromosome 7q34-q36.
The axonal neuropathy seen in this family was classified as dHMN1; with
autosomal dominant inheritance, early but variable age of onset, and muscle
weakness and wasting affecting the lower limbs.
In this project, genetic linkage analysis of the chromosome 7q34-q36 disease
interval was carried out in the original family (CMT54) and 20 smaller families
from an Australian dHMN cohort. Fine mapping in family CMT54, including
unaffected individuals suggested a minimum probable candidate interval
of 6.92 Mb, flanked by markers D7S615 and D7S2546 within the 12.98 Mb
critical disease interval. Of the additional dHMN families, one (family CMT44)
achieved suggestive linkage to the chromosome 7q34-q36 disease locus with a
LOD score of 2.02.
Mutation screening was carried out in family CMT54 at the chromosome
7q34-q36 locus. The 12.9 Mb disease interval contains 89 annotated protein-
coding genes, of which 60 lay within the prioritised 6.92 Mb interval. A combi-
nation of methods was used to screen these genes for a putative pathogenic
mutation. Functional candidate genes were identified via a literature and
database search. The coding exons of 35 prioritised candidate genes were
sequenced and no pathogenic mutation was identified. Cytogenetic analysis
excluded large scale chromosomal abnormalities. Array based comparative
ii

genomic hybridisation of the 7q34-q36 interval in patients did not identify any
pathogenic duplications or deletions.
Next generation sequencing (NGS) techniques were used to identify se-
quence variants within the remaining genes within the 7q34-q36 interval and
elsewhere in the genome. Two NGS based approaches were applied to muta-
tion screening in family CMT54. Initially, the chromosome 7q34-q36 disease
interval was analysed in one affected individual using a custom designed DNA
capture microarray and 454 GS FLX (Roche) sequencing. Approximately 80%
of patient coding exons were captured, sequenced and no pathogenic muta-
tions were identified. The chromosome 7q34-q36 target captured DNA sample
was also re-sequenced along with an additional two affected individuals and
one unaffected parent using exome capture and Solexa (Illumina) sequencing.
Combined, 99.5% of coding exons were sequenced in the chromosome 7q34-
q36 interval and all sequence variants that were identified were excluded from
a pathogenic role. Sequence variants identified elsewhere in the exome were
also excluded from a pathogenic role.
Exome sequencing of dHMN family CMT44 did not identify any putative
pathogenic mutation at the chromosome 7q34-q36 locus. The exomes of four
affected and one unaffected individuals were sequenced. Exome wide analysis
identified a potential digenic inheritance in CMT44 of a previously published
MFN2 mutation causing a mild CMT2 phenotype and a second mutation
causing a dHMN phenotype. Potential candidate mutations for dHMN were
identified in two genes, PCDHGA4 and DNAH11. PCDHGA4, was previously
shown to function in the brain and spinal cord, and deletion of PCDHG genes
in a mouse model causes a severe neurodegenerative phenotype.
The gene mutation causing dHMN that maps to chromosome 7q34-q36
remains to be identified. The disease mutation may lie in a coding region
not captured by current exome platforms, a non-coding region, or the muta-
tion may cause disease through an alternate mechanism not detected by the
iii

methods employed in this thesis.Future studies should concentrate on tran-
scriptome analysis by next-gen RNA sequencing, which may identify unknown
transcripts and exons that map to chromosome 7q34-q36 or highlight sequence
variants located in regulatory elements.
Identification of new gene mutations is critical to further understanding the
biochemical and cellular processes underlying dHMN. Although the causative
mutation for dHMN on 7q34-q36 was not identified, a significant proportion
of the disease interval has been excluded using a combination of traditional
and new technologies.
The purpose of this thesis is to identify new gene mutations causing dHMN.
The genetic and functional data presented here suggest this will be a difficult
task; the genetic heterogeneity complicates genetic analysis and the multiple
molecular mechanisms implicated to date make it difficult to pinpoint specific
candidate genes. The identification of additional genes and genetic modifiers
is necessary to increase our understanding of the disease mechanisms caus-
ing dHMN and related neuropathies. This will directly aid in the diagnosis
and classification of these neurodegenerative diseases and may lead to new
therapeutics and treatment strategies.
iv

L I S T O F F I G U R E S
Figure 1.1 Eleven causative genes described to date for dHMN. . . 4Figure 3.1 Original pedigree CMT54 and haplotype analysis at chr7q34-
q36 . . . . . . . . . . . . . . . . . . . . . . . . . . . . . . . 46Figure 3.2 Physical map of the chr7q34-q36 disease locus . . . . . . 49Figure 3.3 Fine mapping of the proximal end of the minimum prob-
able candidate interval in CMT54. . . . . . . . . . . . . . 55Figure 3.4 Detail of fine mapping of the distal end of minimum
probable candidate interval in family CMT54 . . . . . . . 57Figure 3.5 Updated pedigree CMT54 and haplotype analysis . . . . 59Figure 3.6 CMT54 multi-point LOD plot at 7q34-q36 . . . . . . . . . 61Figure 3.7 Pedigree CMT44 haplotype analysis . . . . . . . . . . . . 67Figure 3.8 CMT44 multi-point LOD plot. . . . . . . . . . . . . . . . . 69Figure 4.1 Genes mapping to the 7q34-q36 disease interval . . . . . 95Figure 4.2 Location of variant CNTNAP2:c.3476-15C>A and adja-
cent exons. . . . . . . . . . . . . . . . . . . . . . . . . . . . 104Figure 4.3 PCR amplification of cDNA flanking the CNTNAP2:c3476-
15C>A variant . . . . . . . . . . . . . . . . . . . . . . . . . 105Figure 4.4 Genes in the interval defined by significantly associated
haplotypes . . . . . . . . . . . . . . . . . . . . . . . . . . . 106Figure 5.1 Forms of CNV and structural variation at a chromosomal
or molecular scale. . . . . . . . . . . . . . . . . . . . . . . 111Figure 5.2 Array based CGH analysis. . . . . . . . . . . . . . . . . . 115Figure 5.3 Direct method for aCGH. . . . . . . . . . . . . . . . . . . 117Figure 5.4 The proportion of CNV calls within each size range. . . 120Figure 5.5 Array CGH analysis in CMT54. . . . . . . . . . . . . . . . 121Figure 5.6 CNV probe plot around deletion A. . . . . . . . . . . . . 122Figure 5.7 UCSC genome browser views of deletion A. . . . . . . . 123Figure 5.8 CNV probe plot around deletion B. . . . . . . . . . . . . 126Figure 5.9 UCSC genome browser views of deletion B. . . . . . . . 127Figure 5.10 CNV probe plot around deletion C. . . . . . . . . . . . . 128Figure 5.11 UCSC genome browser views of deletion C. . . . . . . . 129Figure 5.12 PCR Genotyping of control individuals for deletion C. . 129Figure 5.13 CNV probe plot around deletion D. . . . . . . . . . . . . 131Figure 5.14 UCSC genome browser views of deletion D. . . . . . . . 132Figure 6.1 Clonal amplification of immobilised template DNA in NGS136Figure 6.2 Filtering strategy for variants identified by targeted cap-
ture sequencing of 7q34-q36. . . . . . . . . . . . . . . . . 148Figure 6.3 454 sequencing contigs at the ACCN3 gene. . . . . . . . . 152Figure 6.4 7q34-q36 sequencing coverage AGRF sequencing . . . . 153
v

Figure 6.5 Recent segmental duplications at the chromosome 7q34-q36 disease locus. . . . . . . . . . . . . . . . . . . . . . . . 155
Figure 6.6 Sequencing coverage comparison between three exomecapture and one target region capture samples. . . . . . 160
Figure 7.1 Updated pedigree for family CMT44 . . . . . . . . . . . . 175Figure 7.2 HRM genotyping analysis of the MFN2 mutation identi-
fied in CMT44. . . . . . . . . . . . . . . . . . . . . . . . . 178Figure 7.3 Updated comparison of haplotypes between CMT44 and
CMT54 using SNP data from NGS. . . . . . . . . . . . . . 180Figure 7.4 Organisation of the protocadherin gene cluster on chro-
mosome 5p31. . . . . . . . . . . . . . . . . . . . . . . . . . 183Figure C.1 Pedigree CMT484 with haplotype analysis at 7q34-q36 . 217Figure C.2 Pedigree CMT274 with haplotype analysis at 7q34-q36 . 217Figure C.3 Pedigree CMT609 with haplotype analysis at 7q34-q36 . 218Figure C.4 Pedigree CMT677 with haplotype analysis at 7q34-q36 . 219Figure C.5 Pedigree CMT703 with haplotype analysis at 7q34-q36 . 219Figure C.6 Pedigree CMT131 with haplotype analysis at 7q34-q36 . 220Figure C.7 Pedigree CMT273 with haplotype analysis at 7q34-q36 . 220Figure C.8 Pedigree CMT333 with haplotype analysis at 7q34-q36 . 221Figure C.9 Pedigree CMT701 with haplotype analysis at 7q34-q36 . 222Figure C.10 Pedigree CMT260 with haplotype analysis at 7q34-q36 . 223Figure C.11 Pedigree CMT618 with haplotype analysis at 7q34-q36 . 224Figure C.12 Pedigree CMT477 with haplotype analysis at 7q34-q36 . 225Figure C.13 Pedigree CMT748 with haplotype analysis at 7q34-q36 . 226Figure C.14 Pedigree CMT779 with haplotype analysis at 7q34-q36 . 226Figure C.15 Pedigree CMT808 with haplotype analysis at 7q34-q36 . 226Figure C.16 Pedigree CMT375 with haplotype analysis at 7q34-q36 . 227Figure C.17 Pedigree CMT102 with haplotype analysis at 7q34-q36 . 227Figure C.18 Pedigree CMT724 with haplotype analysis at 7q34-q36 . 228Figure C.19 Pedigree CMT331 with haplotype analysis at 7q34-q36 . 229Figure E.1 Multi-point LOD plot for family CMT609. . . . . . . . . 240Figure E.2 Multi-point LOD plot for family CMT274. . . . . . . . . 241Figure E.3 Multi-point LOD plot for family CMT677. . . . . . . . . 241Figure E.4 Multi-point LOD plot for family CMT484. . . . . . . . . 242Figure E.5 Multi-point LOD plot for family CMT703. . . . . . . . . 242Figure E.6 Multi-point LOD plot for family CMT131. . . . . . . . . 243Figure E.7 Multi-point LOD plot for family CMT333. . . . . . . . . 243Figure E.8 Multi-point LOD plot for family CMT273. . . . . . . . . 244Figure E.9 Multi-point LOD plot for family CMT260. . . . . . . . . 244Figure E.10 Multi-point LOD plot for family CMT701 . . . . . . . . . 245Figure E.11 Multi-point LOD plot for family CMT618. . . . . . . . . 245Figure E.12 Multi-point LOD plot for family CMT724. . . . . . . . . 246Figure E.13 Multi-point LOD plot for family CMT331. . . . . . . . . 246Figure E.14 Multi-point LOD plot for family CMT477. . . . . . . . . 247Figure E.15 Multi-point LOD plot for family CMT779. . . . . . . . . 247
vi

Figure E.16 Multi-point LOD plot for family CMT748. . . . . . . . . 248Figure E.17 Multi-point LOD plot for family CMT808. . . . . . . . . 248
vii

L I S T O F TA B L E S
Table 1.1 OMIM classification of dHMN . . . . . . . . . . . . . . . 25Table 3.1 Previous two-point LOD scores in CMT54 . . . . . . . . 47Table 3.2 New STR markers for fine mapping . . . . . . . . . . . . 56Table 3.3 CMT54 two-point LOD scores between the dHMN locus
and microsatellite markers at 7q34-q36 . . . . . . . . . . 57Table 3.4 Sample and clinical information for 20 additional dHMN
families. . . . . . . . . . . . . . . . . . . . . . . . . . . . . 63Table 3.5 Simulated two-point LOD scores for additional dHMN
families at θ = 0.00 . . . . . . . . . . . . . . . . . . . . . . 64Table 3.6 CMT44 two-point LOD scores between the dHMN locus
and microsatellite markers on 7q34-q36 . . . . . . . . . . 68Table 3.7 Comparison of haplotypes between CMT54 and addi-
tional dHMN families . . . . . . . . . . . . . . . . . . . . 77Table 3.8 Haplotypes used in association analysis. . . . . . . . . . 78Table 3.9 Association analysis of haplotypes with dHMN using
Fisher’s exact test . . . . . . . . . . . . . . . . . . . . . . . 79Table 4.1 Candidate gene prioritisation ranking using GeneWan-
derer and Endeavour. . . . . . . . . . . . . . . . . . . . . . 99Table 4.2 DNA variants identified in genes screened. All mutations
found in affected individuals sequenced including knownSNPs. Allele frequency. When both controls are homozy-gous, allele freq will be 0% or 100%. 100% indicates theyare homozygous for the alternate SNP allele. Where rsnumbers are indicated, alleles identified in sequencingmatched those reported in dbSNP. . . . . . . . . . . . . . 101
Table 6.1 Summary statistics for targeted sequencing of CMT54family member III:14. . . . . . . . . . . . . . . . . . . . . . 147
Table 6.2 Novel non-synonymous variants identified by targetedcapture and sequencing of 7q34-q36. . . . . . . . . . . . . 149
Table 6.3 Novel sequence variants possibly affecting splicing iden-tified within the 7q34-q36 interval. . . . . . . . . . . . . . 150
Table 6.4 Novel variants within the 5’ and 3’ UTR of known genes. 151Table 6.5 Summary of exome and chromosome 7q34-q36 targeted
sequencing using Solexa platform. . . . . . . . . . . . . . 157Table 6.6 Sequence variants identified by exome capture and BGI
sequencing . . . . . . . . . . . . . . . . . . . . . . . . . . . 158Table 6.7 Novel sequence variants identified with exome sequencing.158Table 6.8 Segregation analysis of exome sequencing identified vari-
ants assuming unequal sequencing coverage. . . . . . . . 162
viii

Table 6.9 Markers with two-point LOD scores > 1.5 in a genomewide linkage analysis. . . . . . . . . . . . . . . . . . . . . 163
Table 6.10 Sequence variants predicted to be deleterious or affectingconserved sequences. . . . . . . . . . . . . . . . . . . . . . 164
Table 7.1 Summary of exome sequencing in CMT44. . . . . . . . . 174Table 7.2 Sequence variants identified by exome sequencing in
CMT44 . . . . . . . . . . . . . . . . . . . . . . . . . . . . . 174Table B.1 PCR primers used in gene screening. . . . . . . . . . . . 205Table B.2 PCR primers for microsatellite markers. . . . . . . . . . . 214Table B.3 PCR primers for RT-PCR. . . . . . . . . . . . . . . . . . . 214Table B.4 PCR primers for HRM analysis. . . . . . . . . . . . . . . . 214Table B.5 PCR primers for validation of CNV. . . . . . . . . . . . . 214Table B.6 PCR primers for validation of variants identified through
NGS. . . . . . . . . . . . . . . . . . . . . . . . . . . . . . . 215Table D.1 Two-point linkage analysis in family CMT274 for 7q34-
q36 markers. . . . . . . . . . . . . . . . . . . . . . . . . . . 230Table D.2 Two-point linkage analysis in family CMT609 for 7q34-
q36 markers. . . . . . . . . . . . . . . . . . . . . . . . . . . 231Table D.3 Two-point linkage analysis in family CMT333 for 7q34-
q36 markers. . . . . . . . . . . . . . . . . . . . . . . . . . . 231Table D.4 Two-point linkage analysis in family CMT484 for 7q34-
q36 markers. . . . . . . . . . . . . . . . . . . . . . . . . . . 232Table D.5 Pedigree CMT677 two-point LOD scores between the
dHMN locus and microsatellite markers on chromosome7q34-q36. . . . . . . . . . . . . . . . . . . . . . . . . . . . . 232
Table D.6 Two-point linkage analysis in family CMT703 for 7q34-q36 markers. . . . . . . . . . . . . . . . . . . . . . . . . . . 233
Table D.7 Two-point linkage analysis in family CMT131 for 7q34-q36 markers. . . . . . . . . . . . . . . . . . . . . . . . . . . 233
Table D.8 Two-point linkage analysis in family CMT273 for 7q34-q36 markers. . . . . . . . . . . . . . . . . . . . . . . . . . . 234
Table D.9 Two-point linkage analysis in family CMT808 for 7q34-q36 markers. . . . . . . . . . . . . . . . . . . . . . . . . . . 235
Table D.10 Two-point linkage analysis in family CMT260 for 7q34-q36 markers. . . . . . . . . . . . . . . . . . . . . . . . . . . 235
Table D.11 Two-point linkage analysis in family CMT779 for 7q34-q36 markers. . . . . . . . . . . . . . . . . . . . . . . . . . . 236
Table D.12 Two-point linkage analysis in family CMT477 for 7q34-q36 markers. . . . . . . . . . . . . . . . . . . . . . . . . . . 236
Table D.13 Two-point linkage analysis in family CMT331 for 7q34-q36 markers. . . . . . . . . . . . . . . . . . . . . . . . . . . 237
Table D.14 Two-point linkage analysis in family CMT724 for 7q34-q36 markers. . . . . . . . . . . . . . . . . . . . . . . . . . . 237
Table D.15 Two-point linkage analysis in family CMT618 for 7q34-q36 markers. . . . . . . . . . . . . . . . . . . . . . . . . . . 238
ix

Table D.16 Two-point linkage analysis in family CMT748 for 7q34-q36 markers. . . . . . . . . . . . . . . . . . . . . . . . . . . 238
Table D.17 Two-point linkage analysis in family CMT701 for 7q34-q36 markers. . . . . . . . . . . . . . . . . . . . . . . . . . . 239
Table D.18 Two-point linkage analysis in family CMT102 for 7q34-q36 markers. . . . . . . . . . . . . . . . . . . . . . . . . . . 239
Table D.19 Two-point linkage analysis in family CMT375 for 7q34-q36 markers. . . . . . . . . . . . . . . . . . . . . . . . . . . 239
Table F.1 Healthy control haplotypes for association analysis . . . 249Table G.1 Candidate genes within the minimum probable candidate
interval on 7q34-q36 . . . . . . . . . . . . . . . . . . . . . 251Table G.2 Candidate genes outside the minimum probable candi-
date interval on 7q34-q36 . . . . . . . . . . . . . . . . . . 253Table G.3 Expression pattern of genes within the chromosome 7q34-
q36 dHMN1 disease region. . . . . . . . . . . . . . . . . . 254Table H.1 Sequencing gaps in 454 sequencing of 7q34-q36 . . . . . 255Table H.2 Analysis of variants within chromosomal translocations
on 7q34-q36 . . . . . . . . . . . . . . . . . . . . . . . . . . 256Table I.1 Gains and losses identified in control individual II:7 using
aCGH. . . . . . . . . . . . . . . . . . . . . . . . . . . . . . 257Table I.2 Gains and losses identified in affected individual III:9
using aCGH. . . . . . . . . . . . . . . . . . . . . . . . . . . 258Table I.3 Gains and losses identified in affected individual III:12
using aCGH. . . . . . . . . . . . . . . . . . . . . . . . . . . 259Table I.4 Gains and losses identified in affected individual II:1
using aCGH. . . . . . . . . . . . . . . . . . . . . . . . . . . 260
x

A C R O N Y M S A N D A B B R E V I AT I O N S
ACRF Australian Cancer Research Foundation
aCGH array comparative genomic hybridisation
AD autosomal dominant
ADLD autosomal dominant leukodystrophy
AGE agarose gel electrophoresis
AGRF Australian Genome Research Foundation
ALS amyotrophic lateral sclerosis
AR autosomal recessive
ASSP Alternative Splice Site Predictor
BAsH GNU Bourne-Again SHell
bp base pair
CCDS consensus coding sequence
CHOP Children’s Hospital of Philadelphia
cM centimorgan
CMT Charcot-Marie-Tooth
CMT1A CMT type 1A
CNV copy number variation
ddNTP dideoxynucleotide
dHMN distal hereditary motor neuropathy
DNA deoxyribonucleic acid
DSMA distal spinal muscular atrophy
ESTs expressed sequence tags
FAM 6-carboxyfluorescein
FTD frontotemporal dementia
GWAS genome-wide association studies
xi

HNPP hereditary neuropathy with liability to pressure palsies
HSF Human Splicing Finder
IBD identical by descent
IBS identical by state
indel insertion or deletion
kb kilobase
LOD logarithm of the odds
MAF minor allele frequency
Mb megabase
microsatellite short tandem repeat
NCS nerve conduction studies
NGS next generation sequencing
NNSplice Splice Site Prediction by Neural Network
NS non-synonymous
OMIM Online Mendelian Inheritance in Man
PCR polymerase chain reaction
PCDHγ protocadherin-gamma
PPI protein-protein interaction
QC quality control
Rw rump white
SCA spinocerebellar ataxia
SD segmental duplication
small HSP small heat shock protein
SMA spinal muscular atrophy
SNP single nucleotide polymorphism
snRNP small nuclear ribonucleoprotein
SNV single nucleotide variation
SS splice site
xii

ssDNA single-stranded DNA
STS sequence-tagged site
WGA whole-genome association
Wt wild type
xiii
P U B L I C AT I O N S
papers
• Drew AP, Blair IP, Nicholson GA. “Molecular genetics and mechanisms of
disease in distal hereditary motor neuropathies: insights directing future genetic
studies”. Curr Mol Med. 2011 Nov;11(8):650-65.
abstracts
Presentations
• Drew AP, “Identifying a gene for distal motor neuron disease”, Concord
clinical week 2008, Seminar series finalist.
Posters
• Williams K, Solski J, Drew A, Albulym O, Durnall J, Thoeng A, Thomas
V, Warraich S, Crawford J, Rouleau G, Nicholson G, Blair I, “Exome
sequencing in ALS and other motor neuron diseases”, 22nd International
Symposium on ALS/MND, Sydney 2011.
• Williams K, Drew A, Solski J, Durnall J, Thoeng A, Albulym O, Warraich
S, Thomas V, Crawford J, Rouleau G, Nicholson G, Blair I, “Investigating
the genetic basis of ALS and other motor neuron diseases: Analysis of known
genes and search for new loci”, 21st International Symposium on ALS/MND,
Orlando 2010.
• Drew AP, Blair IP , Williams KL Nicholson GA, “Genetic analysis of
distal motor neuron disease”, ANS satellite meeting motor neuron disease
symposium 2010.
• Drew AP, Blair IP , Williams KL Nicholson GA, “Positional cloning of a
gene for distal motor neuron disease on 7q34-q36”, ASHG annual conference
Honolulu Oct 2009.
xiv

• Drew AP, Blair IP , Williams KL Nicholson GA, “Molecular genetic studies
of distal motor neuron disease”, ASMR NSW scientific meeting 2009.
• Drew AP, Blair IP , Williams KL Nicholson GA, “Molecular genetic studies
of distal motor neuron disease”, From cell to society 6 2008.
• Drew AP, Blair IP, Durnall JC, Gopinath S, Kennerson ML, Nicholson GA,
“Finding new genes causing motor neuron disease”, Lorne genome conference
2008.
xv

1L I T E R AT U R E R E V I E W
1.1 molecular genetics and mechanisms of disease in distal
hereditary motor neuropathies
The distal hereditary motor neuropathies (dHMNs) are a clinically and genet-
ically heterogeneous group of disorders that superficially resemble Charcot-
Marie-Tooth (CMT) neuropathy, where motor neurons are primarily affected
with an absence of significant sensory involvement. Distal HMN is also known
as distal spinal muscular atrophy (DSMA) or the spinal form of CMT (spinal
CMT). Distal HMN is distinct from the other peroneal muscular atrophies,
the combined motor and sensory neuropathies (hereditary motor and sensory
neuropathy; HMSN including CMT1 and CMT2) or exclusively sensory neu-
ropathy (hereditary sensory neuropathy; HSN). Symptoms caused by motor
neuron loss include weakness and wasting of muscles controlled by the af-
fected nerves, leading to loss of function of those muscles. The nerves affected
varies between types of dHMN. Sensory neuron loss in related diseases results
in loss of sensation and proprioception, while pain nerves generally remain
unaffected. This can lead to over use of affected limbs. The original classi-
fication of dHMN was based on the system proposed by Harding [1] with
seven subtypes defined according to; mode of inheritance, age at onset and
additional complicating features. Several additional types of dHMN have been
described, necessitating additional classifications (see Table 1.1). The molecular
genetic characterisation of dHMN has further delineated the classification of
these disorders and has highlighted some overlap between phenotypic forms
1

1 literature review 2
of dHMN. There are also rare sporadic cases which can be attributed, at least
in part, to de-novo mutations in dominant dHMN genes.
Several new genes with dHMN mutations have recently been identified,
confirming the genetic heterogeneity of dHMN. As shown in Table 1.1, there
are now 12 causative genes described for dHMN, and an additional five genetic
loci where the gene remains to be identified. Some of these mutated genes
are common between dHMN and CMT2. This review examines the growing
number of identified dHMN genes, discusses recent insights into the functions
of these genes and possible pathogenic mechanisms, and looks at the increasing
overlap between dHMN and other neuropathies including CMT2 and spinal
muscular atrophy (SMA).
1.1.1 Small heat shock protein family
Missense mutations in three genes from the small heat shock protein (small
HSP) family, heat shock 27kDa protein 1 (HSPB1), heat shock 22kDa protein
8 (HSPB8) and heat shock 27kDa protein 3 (HSPB3), cause both dHMN2 and
CMT2 [2–4]. Classically, dHMN2 is characterised by adult onset weakness and
wasting, predominantly in the distal muscles of the lower limbs, with a rapid
progression resulting in paralysis of the lower extremities within 5-10 years
[5]. However, there can be a broad clinical phenotype including some cases
with later bilateral hand weakness and minor sensory involvement. Also, a
more severe earlier onset phenotype, similar to amyotrophic lateral sclerosis
4 (ALS4; Section 1.1.4), has been observed with a specific HSPB1 mutation
[6]. Unrelated dHMN2 and CMT2 families have been reported with identical
mutations in HSPB1 or HSPB8, demonstrating that there is significant genetic
overlap between these disorders [2, 7–9].

1 literature review 3
The small HSPs are encoded by eleven genes, HSPB1 to HSPB11 [10]. The
three small HSPs involved in dHMN, HSPB1, HSPB8 and HSPB3 all contain
the highly conserved α-crystallin domain, characteristic of small HSPs [11].
The α-crystallin domain is flanked by a variable N-terminal and in HSPB1 and
HSPB8 a short C-terminal. The expression of the small HSP genes is variable
between tissue types, with expression of HSPB1, HSPB5, HSPB6, HSPB7 and
HSPB8 in spinal cord [12–14]. Both HSPB1 and HSPB8 are expressed in motor
neurons, with HSPB1 showing high expression [3, 15, 16].
In dHMN2, two missense mutations with autosomal dominant (AD) inheri-
tance have been identified in HSPB8, both affecting the same amino acid [3].
Ten mutations have been described in HSPB1 in dHMN and CMT2F families,
nine of which show AD inheritance and one with homozygous autosomal
recessive (AR) inheritance [2, 17, 18]. Most recently a mutation in HSPB3
was identified in a dHMN family [4]. The majority of the HSPB1 mutations
and both HSPB8 mutations are located in the conserved α-crystallin domain
(HSPB1; L99M, R127W, S135F, R136W, R140G and T151I. HSPB8; K141N and
K141E), with two mutations in the C-terminal of HSPB1 affecting the same
amino acid (P182L and P182S) and three mutations in the N-terminal region
(HSPB1; P39L and G84R. HSPB3; R7S). The G84R mutation is adjacent to the
α-crystallin domain and lies in a conserved phosphorylation recognition motif
(Figure 1.1 A).
Under normal cellular conditions, small HSPs freely interact to form large
oligomeric complexes containing several small HSP family members, leaving
only low levels of un-phosphorylated monomer [23, 24]. Under conditions
of stress, small HSPs are phosphorylated, triggering the large oligomers to
dissociate into smaller oligomers, dimers, and monomers [25, 26]. These phos-
phorylated active proteins act as molecular chaperones to help stabilise cellular
proteins, preventing protein aggregation and facilitating substrate refolding
in conjunction with other molecular chaperones [27]. In addition to their role

Figure 1.1: Eleven causative genes described to-date for dHMN. Protein domainsare drawn to scale. Mutations are numbered relative to the start ATG (codon 1)and the location is shown as vertical lines. The scale for each gene is indicated. (A)Small HSP family members HSPB1, HSPB8 and HSPB3. Most mutations lie withinthe α-crystallin domain (blue). (B) DCTN1, the G59S mutation lies within the CAP-gly domain (microtubule-binding) (orange). (C) IGHMBP2 and SETX are the twoUPF1-like helicases identified in dHMN. Most missense mutations in IGHMBP2 arelocated in the Superfamily I DNA and RNA helicase domain (green), whereas nullmutants (not shown) are distributed across the gene. Of the three reported SETXmutations, one lies in the Superfamily I DNA and RNA helicase domain and theremaining two lie in a putative N-terminal protein-protein interaction domain (aqua)[19]. (D) GARS mutations E71G, L129P, G240R, I280F, H418R D500N and G526R affectthe catalytic domain (red). S581L and G598L lie within the tRNA binding domain(blue). E71G also interacts with the tRNA binding domain [20]. (E) BSCL2 mutationsN88S and S90L both affect an N-glycosylation motif. (F) ATP7A mutations are locatedwithin or adjacent to transmembrane domains (purple). (G) The PLEKHG5 mutationis located within the pleckstrin-homology domain (yellow). (H) All TRPV4 mutationsare located within the ankyrn repeat domain (brown) as part of ANK4 and ANK5 [21].(I) DYNC1H1 mutations are localised to the dynein binding residues (brown). Figuregenerated with FancyGene [22].

1 literature review 4
3'UTR
200bp
ankyrn repeat domaintransmembrane domains
pore
R269HR269C
R315WR316C
TRPV4ANK4 ANK5
1000bp
motor domain
H306R Y970CI584LK671E
DYNC1H1stem domain
ATPaseATPase ATPase ATPase ATPaseATPase ATPasedimerisation residues
PLEKHG55'UTR
200bp
RhoGEF PH domain coiled coil
F647S
ATP7ACu#3Cu#2Cu#1 Cu#4 Cu#5 Cu#6
Copper binding sites
Phosphatase Phosphorylation ATP binding
3'UTR
T994I P1386S500bp
BSCL25'UTR
transmembrane transmembraneN-glycosylation motif
N88SS90L
100bp
3'UTR
GARS tRNA binding domainWHEP-TRS Catalytic Catalytic
200bp E71G L129P I280FG240R H418R D500NG526R
S581LG598A
3'UTR5'UTR
SETX
3'UTR
Superfamily I DNA and RNA helicase domain
T3I L389S R2136H1000bp
IGHMBP2
I Ia II III IV V VImotifs
L17P G86_A355del
Putative protein interaction domain
A
B
C
D
E
F
G
H
I
D974ED565NL472PL426P
W386RL364PL361P
E334K
P216LH213R
Q196A
Superfamily I DNA and RNA helicase domain
500bp
R3H Znf-AN1I Ia II III IV V VI
L192PC241RL125P
T221A
E382KG354S
H445PE514K
T493IR603C
R637C
R603HK572del L577P V580I R581S R583I G586C
NLS
DCTN1microtubule-binding domain dynein-binding domain actin-related protein-binding domain
3'UTR
G59S500bp
5'UTR
3'UTR
P39L G84R L99M R127WS135FR136W
T151L
R140G
P182LP182S
K141NK141E
R7S
HSPB1
HSPB8
HSPB3
5'UTR
3'UTR5'UTR
5'UTR
phosphorylation
3'UTR
100bp
α-crystallin domain
motifs

1 literature review 5
as chaperones, small HSPs are also involved in a diverse range of cellular
processes including, suppression of apoptosis, regulation of cytoskeleton dy-
namics, protection from oxidative stress, modulation of inflammation and
RNA processing [28–33].
With the diverse range of cellular activities of small HSPs, the definitive
mechanism through which mutations in HSPB1, HSPB3 and HSPB8 cause
dHMN remains unclear. The variability of clinical phenotypes caused by
these mutations further confuses their role. However, recent observations of
mutant small HSPs in disease models and characterisation of the function
of these proteins are providing insight into the processes involved in these
neurodegenerative disorders.
Protein aggregates are seen in many neurodegenerative diseases but it is
unclear whether these are a cause or consequence of the disease [34]. In
neuronal cell culture, expression of HSPB1 and HSPB8 carrying dHMN2
mutations leads to formation of insoluble aggregates in the cell body [2, 3, 35].
Expression of mutant HSPB8 leads to formation of aggregates containing
both HSPB1 and HSPB8 with increased interaction between the two proteins
[3]. In addition to aggregation in the cell body, the HSPB1 P182L mutation
prevented the correct transportation of both mutant and wild type (Wt) HSPB1
down neuronal processes [35]. Furthermore, aggregates were associated with
disrupted neurofilament assembly. These aggregates contained p150 dynactin
and neurofilament middle chain subunit (NFM) but not other cellular cargoes
actively transported in axons [2, 35]. Disrupted assembly and aggregation
of NF is also seen in CMT2E caused by mutations in the neurofilament-
light subunit (NFL) [36, 37]. In cultured primary mouse motor neurons, Zhai
et al [38] showed that both NFL and HSPB1 mutations caused progressive
degeneration and loss of motor neurons. Co-expression of mutant NFL with
Wt HSPB1 reduced the NF disruption and aggregation caused by mutant
NFL. Furthermore, in NFL-null motor neurons expressing mutant HSPB1,
1 literature review 6
no aggregation of NFL or NFM is observed, indicating that HSPB1 interacts
specifically with NFL [38].
In contrast to the cell culture models of the HSPB1, HSPB8 and NFL mutants,
analysis of mutant HSPB8 in primary motor neuron cultures did not result
in the formation of aggregates, but still resulted in a disruption of axonal
transport. The cultured primary motor-neurons had shortened neurites with
spheroids and end bulbs, resembling Wallerian degeneration, likely a result of
axon retraction rather than lack of outgrowth [39]. Spheroids and endbulbs
are filled with organelles and disorganised cytoskeleton components [40]. The
increase in apoptotic activity seen in injured neurons [41] was not observed
in the HSPB1 mutants, therefore, it is unlikely that the anti-apoptotic role of
HSPB1 influences the initial pathogenesis of dHMN [39].
HSPB1 also interacts with actin microfilaments both as a chaperone un-
der stress conditions and in the regulation of actin filament dynamics. As a
chaperone, phosphorylated HSPB1 monomers coat actin filaments, prevent-
ing the action of actin severing proteins activated by the stress response and
aiding the recovery of actin filaments after stress [27, 42, 43]. Under normal
conditions HSPB1 functions in a regulatory role, with un-phosphorylated
HSPB1 monomers preventing the polymerisation of actin, promoting a pool
of soluble actin subunits [44]. In motor neurons, actin microfilaments are the
main components of the plasma membrane cytoskeleton and are enriched in
presynaptic terminals, dendritic spines and growth cones [45]. The interaction
of mutant HSPB1 with actin microfilaments in motor neuron disease remains
to be investigated.
These studies suggest that disruption of the neurofilament network is a com-
mon triggering event for motor neuron degeneration in dHMN2 and CMT2E/F,
perhaps by disruption of axonal transport rather than direct neurotoxic effects
of protein aggregates.

1 literature review 7
As small HSPs interact with the cytoskeleton as chaperones under stress
conditions and a loss of chaperone activity is associated with other chaper-
onopathies [46], the influence of the mutations on the chaperone activity of
HSPB1 and HSPB8 have been investigated. In vivo analysis of HSPB1 mutations
in the α-crystallin and C-terminal domains showed there was no reduction in
the chaperone activity of HSPB1, some mutations even resulted in an increase
in chaperone activity. This was associated with increased levels of dimer to
monomer conversion of mutant proteins, with normal levels of HSPB1 dimer
maintained by Wt protein. All HSPB1 mutants examined showed enhanced
binding to target proteins, overall suggesting increased protein interaction
activity is involved in dHMN and CMT2 [26]. This supports previous analysis
showing decreased HSPB1 self-association correlates with increased chaperone
function [27]. Conversely, the chaperone activity of K141E HSPB8 mutant was
decreased, with a significant reduction seen at lower HSPB8 concentrations.
Interestingly, with specific substrates, mutant HSPB8 was active earlier than
Wt, but with a lower overall activity [47]. The K141N/E HSPB8 mutations
affect the equivalent residue mutated in HSPB4 in AD congenital cataract
[3, 48]. Mutation of this residue resulted in a similar reduction of chaperone
activity [49]. Unfortunately, comparisons are difficult because the analysis of
chaperone activity for HSPB1 and HSPB8 used different assays. The concentra-
tion of protein, the time point examined and the substrate selected all influence
the measured chaperone activity.
Recently, both HSPB1 and HSPB8 have been shown to interact in RNA
processing pathways. As RNA processing defects are postulated to be a major
factor in neurodegeneration [50, 51] these functions of HSPB1 and HSPB8
should be considered as a possible part of dHMN pathogenesis. Both disease
causing HSPB8 mutants lead to abnormally increased binding of HSPB8 to the
RNA helicase Ddx20 (gemin-3), which interacts with the survival-of-motor-
neurons protein (SMN) [52]. Mutations in the SMN1 gene encoding SMN

1 literature review 8
protein cause SMA type 1 (SMA1; MIM#253300) [53]. With reduced SMN
mRNA and protein in patients with SMA1, it is postulated that insufficient
levels of SMN in motor neurons results in SMA1 [54, 55]. SMN is part of
a multi-protein complex (including gemin-3), involved in the assembly and
regeneration of small nuclear ribonucleoproteins (snRNPs) (RNA-protein com-
plexes that combine with unmodified pre-mRNA and various other proteins to
form a spliceosome) [56, 57] and microtubule associated transport of RNA [58].
The role of mutant SMN in SMA is not well understood, however in SMA mice,
SMN deficiency results in reduced axon growth in motor-neurons, correlating
with reduced β-actin mRNA and protein in distal axons and growth cones
[59], as well as a reduction of snRNP assembly and expression of a subset of
Gemin proteins in spinal cord [60]. The HSPB8/Ddx20 interaction involves
RNA suggesting a role for HSPB8 in ribonucleoprotein processing in conjunc-
tion with SMN [52]. Recently, HSPB1 was identified as a critical subunit of the
AUF1- and signal transduction- regulated complex (ASTRC) and is an AU-rich
element (ARE) binding protein [33]. AU-rich element mRNA degradation is the
process whereby mRNAs with AREs in their 3’ UTR are specifically targeted
for degradation [61, 62]. The association of HSPB1 with ASTRC may provide a
sensing mechanism for ARE mRNA degradation involved in the regulation
of transiently expressed proteins, including those involved in inflammatory
responses, cell proliferation and intracellular signalling [33].
In addition to missense mutations, a mutation in the highly conserved heat
shock element promoter region of HSPB1 was identified in a sporadic ALS
patient with atypically long disease duration. This mutation lead to in vitro
reduction of expression of HSPB1 under normal conditions and elimination
of the heat shock response in neuronal cells, suggesting an increase in cellu-
lar damage and toxicity resulting from a lack of heat-shock response, may
contribute to the pathogenesis of motor neuron degeneration [63].

1 literature review 9
In summary, it is likely that dominant toxic interactions involving mutant
HSPB1 and HSPB8 cause dHMN through disruption of axonal transport, a
pathogenic mechanism to which motor neurons are particularly vulnerable.
1.1.2 Dynactin 1 (DCTN1)
A missense mutation in the DCTN1 gene encoding the p150Glued subunit of
dynactin (p150Glued) was described in a dHMN7B (MIM#607641) family [64].
Distal HMN7B, also known as distal spinal and bulbar muscular atrophy is an
AD lower motor neuron disease presenting in the second or third decade of life,
with vocal fold paralysis leading to breathing difficulties, progressive facial
weakness, weakness and muscle atrophy of the hands and later involvement of
the lower extremities [64, 65]. Rare DCTN1 mutations have also been identified
in ALS and ALS with FTD [65–67]
Dynactin is a microtubule motor protein involved in mitosis and specialised
subcellular movement [68]. Dynactin is a large protein complex necessary for
dynein and kinesinII based microtubule movement. The p150Glued subunit is
particularly important for its role in binding dynactin to microtubules through
its microtubule binding domain. Dynein and other molecular motors bind
to dynactin on the arm of p150Glued adjacent to the microtubule binding
domain, with the remaining rod like structure involved in binding a variety of
membrane and protein structures [68]. The p150Glued subunit is ubiquitously
expressed and is highly enriched in neurons of the central nervous system
[69].
The G59S mutation reported in dHMN7B is located in the conserved CAP-
gly domain of p150Glued [64] (Figure 1.1 B). Mutations in the CAP-gly domain
of p150Glued were also identified in Perry syndrome (MIM#168605), a rapidly
progressive AD neurological disorder involving parkinsonism, weight loss,
1 literature review 10
depression with suicidal attempts and later nocturnal hypoventilation leading
to respiratory insufficiency and death within 2-10 years [70]. With no motor
neuron involvement, Perry syndrome and dHMN7B are distinct disorders.
Unlike the mutations in dHMN7B and Perry syndrome, the ALS DCTN1
mutations are outside the CAP-gly domain.
The G59S p150Glued dHMN mutant shows decreased binding to microtubules
and does not disrupt the binding of Wt p150Glued [64, 71]. Dynactin was
disrupted in a late onset progressive motor neuron disease phenotype mouse
model through over expression of the dynamitin (p50) subunit of dynactin,
causing inhibition of retrograde axonal transport [72]. This was reflected in the
immunohistochemical staining of a patient with dHMN7B (74yo) after autopsy
which showed a change in distribution of dynactin, dyenin and related proteins
from diffuse fine granular staining throughout the cell body and axons to more
intense, coarser and irregularly shaped granules and larger accumulations
within the cell body, proximal axon and distal neurites. Normal neurofilament
staining in motor neuron cell bodies and axons indicated that the defect was
with dynactin [73]. The G59S p150Glued dHMN mutant leads to formation of
inclusion bodies, and it has been suggested that a loss of stability promotes
aggregation [71].
The G59S mutation is located in a fold of the CAP-gly domain and is
predicted to distort the folding of the microtubule domain [64]. Recent experi-
ments with yeast mutants analogous to the G59S human mutation have helped
understand the mechanism underlying the dysfunction of dynactin-mediated
transport in motor neuron disease. The CAP-gly domain has a critical role
in the initiation and persistence of dynein-dependant movement, but is not
essential for dyenin based movement. It was speculated that the GAP-Gly
activity is necessary for overcoming high force/load thresholds of movement
[74].

1 literature review 11
Analysis of the p150Glued mutants in Perry’s syndrome indicate the mutated
CAP-gly domain is folded correctly but is less stable than Wt p150Glued. The
domains containing the Perry syndrome mutations bind to microtubules
but fail to bind to EB1, a microtubule plus-end tracking protein, unlike a
G59A mutant which retained EB1 binding ability. The G59A mutant was
analysed instead of the G59S mutant, which was not correctly expressed in
this model [75]. Levy et al. [71] showed that EB1 binding was reduced with
the G59S mutation but the stability of the dynactin complex was not affected.
Ahmed et al. [75] inferred that the steric clashes stemming from the G59S
mutation prevent correct protein folding under physiological conditions and
that p150Glued is more unstable in dHMN7B than in Perry’s syndrome.
A reduction in the stability of CAP-gly domain of p150Glued supports the
model of motor neuron specific degradation proposed by Levy et al [71] that
mutant DCTN1 causes decreased binding of p150Glued to microtubules and EB1
resulting in disrupted axonal transport. An aberrant self-association leading
to aggregates, specifically in neurons, leads to further impairment of axonal
transport.
1.1.3 Immunoglobulin mu binding protein 2 gene (IGHMBP2)
Mutations in the IGHMBP2 gene on chromosome 11q13 result in dHMN6, also
known as distal spinal muscular atrophy 1 (DSMA1; MIM#604320) [76]. To date,
over 50 novel AR mutations have been described, with both homozygous and
compound heterozygous inheritance patterns, including; missense, nonsense,
frameshift, in-frame deletions and intronic splice mutations [76–86]. In addition,
a large deletion and a complex mRNA rearrangement of IGHMBP2 have been
identified together with missense mutations in two DSMA1 cases [78, 79].
In DSMA1 there is a progressive degeneration of spinal motor and sensory

1 literature review 12
neurons, with axonal degeneration, abnormal myelin formation, and motor
end-plate degeneration leading to muscle paralysis and wasting [87]. Patients
present with rapidly progressive, life threatening respiratory distress caused by
paralysis of the diaphragm, and distal muscle weakness and wasting with foot
and hand deformities [77, 88]. Sensory nerves are also affected in later stages
of the disease. Presentation within the first 6 months is strongly indicative
of IGHMBP2 mutations, with only few cases with later juvenile onset of
respiratory distress identified with IGHMBP2 mutations [84, 85].
The IGHMBP2 gene encodes Immunoglobulin mu binding protein 2 (IGHMBP2)
a ubiquitously expressed protein, predominantly present in the cytoplasm,
axons and growth cones with a smaller nuclear localised fraction in spinal
motor neurons [89, 90]. IGHMBP2 is a UPF1-like helicase, a member of the
superfamily I (SF1) DNA/RNA helicases [91], containing the seven helicase
motifs distinctive of SF1 helicases [92], including the conserved Walker A and
B ATPases [93] (Figure 1.1 C). IGHMBP2 also contains a R3H motif [94] and
zinc finger AN1-like domain [95]. Mutations in a second UPF1-like helicase,
senataxin, cause the dHMN, ALS4 [96]. Recent insight into the cellular func-
tion of IGHMBP2 has indicated it is a ribosome associated protein with 5’-3’
helicase activity [97]. The catalytic activity of IGHMBP2 requires both helicase
binding and ATP hydrolysis [97]. More specifically, it is involved in transla-
tion of mRNA[98]. IGHMBP2 is co-localised with RNA processing machinery
[99] and interacts with related helicases, Reptin, Pontin and Abt1 as well as
TFIIIC220 a RNA polymerase III transcription factor involved in tRNA gene
transcription, ribosomal maturation and pre-ribosomal RNA processing and
maturation [98].
The missense mutations in the helicase domain affect the catalytic activity of
IGHMBP2 either directly through disruption of the helicase binding activity
or indirectly by loss of the ATPase activity powering the helicase [97]. Rarer
missense mutations outside the helicase domain do not affect the helicase

1 literature review 13
binding or ATP hydrolysis activities of IGHMBP2, but rather result in reduced
protein levels (50% reduction by the T493I allele), by a disruption of protein
stability or reduced transcription of the normal mRNA levels [85]. Similarly, in
a splicing mutant where exon 8 is skipped there is partial expression resulting
in 24.4 ± 6.9% of Wt IGHMBP2 mRNA levels [84]. In this case, reduction of the
exon 8 skipped mRNA was probably the result of nonsense mediated mRNA
decay. A second nonsense mutation (C496X) leads to a complete loss of mutant
mRNA rather than truncated protein [80].
Some evidence suggests a possible correlation between IGHMBP2 protein
levels and age of onset of respiratory symptoms, with infantile onset having
a lower IGHMBP2 protein level than patients with juvenile onset [85]. Impor-
tantly, 50-75% Wt protein levels were shown in carriers, therefore the critical
level of IGHMBP2 for not developing symptoms lies in the range of 25-50%
[85]. This is supported by studies of the nmd mouse, a model of SMA resulting
from a homozygous splicing mutation in IGHMBP2 that express ∼20% of
normal IGHMBP2 mRNA levels in all tissues. The Nmd mouse model is not a
100% null mutant but rather a hypomorphic allele [100].
The recessive inheritance of DSMA1 indicates that there is a loss of function
of IGHMBP2 involved in the disease. This is either through missense mutations
in the helicase domain affecting the catalytic activity of IGHMBP2 or through
reduced protein levels. Protein levels are not the only factor influencing the
disease outcome in the nmd mouse model. A protective allele has been mapped
to the Mnm locus in the nmd mouse which rescues the nmd phenotype [100].
The modifying factor does not restore IGHMBP2 protein levels, rather it
possibly compensates for lost IGHMBP2 function. Interestingly, the Mnm
locus fails to rescue the dilated cardiomyopathy phenotype seen later in nmd
mice after the neurodegeneration phenotype is rescued [101]. In addition,
dilated cardiomyopathy is also seen in nmd mice after neuronal restoration of

1 literature review 14
IGHMBP2 levels and rescue of nmd phenotype, suggesting a motor neuron
specific activity of the Mnm locus [101].
In summary, DSMA1 involves the loss of function of IGHMBP2 helicase
activity through disruption of protein activity by missense mutations or overall
reduced protein levels. The level of active protein is likely to correlate with
the rate of disease progression and age of onset. As IGHMBP2 protein levels
are equivalently reduced in neurons and other cell types in DSMA1, motor
neurons are apparently more sensitive to the reduction of IGHMBP2 than other
cell types, possibly due to their large size, high metabolic demands and precise
connectivity requirements [85].
1.1.4 Senataxin (SETX)
Mutations in the SETX gene encoding senataxin cause the rare AD distal
hereditary motor neuropathy with pyramidal features known as juvenile
amyotrophic lateral sclerosis type 4 (ALS4; MIM#602433). ALS4 is a juvenile
or adolescent onset, slowly progressive disease that involves limb weakness
and muscle wasting with pyramidal signs as a result of degeneration of motor
neurons in the brain and spinal cord. Sensory involvement is not seen and
there is sparing of bulbar and respiratory muscles [102]. Three ALS4 families
were reported with senataxin mutations (T3I, L389S and R2136H) [96] with a
fourth ALS4 family later reclassified as dHMN1, with linkage to chromosome
7q34-q36 [103]. A large number of SETX mutations have also been reported
in several other disorders including the AR neurological disorder, ataxia with
ocular apraxia type 2 (AOA2) [104–117], a rare AR ataxia with peripheral
neuropathy [114] and an AD cerebellar ataxia/tremor syndrome [118]. While
the involvement of peripheral neuropathy suggests some clinical overlaps
between ALS4 and AOA2, they are clinically distinct [96, 114].

1 literature review 15
Senataxin is ubiquitously expressed, present primarily in the nucleus but also
present in the cytoplasm [19, 109]. Senataxin has a conserved SF1 RNA/DNA
helicase domain in the C-terminus with strong homology to the helicase
domains of UPF1 and IGHMBP2 [96, 104]. As such, senataxin is the second
UPF1-like helicase identified in a dHMN. The helicase domain of senataxin
is similarly conserved with the yeast orthologue Sen1p [96, 119]. Senataxin
also contains a putative N-terminal protein-protein interaction domain and a
C-terminal nuclear localisation signal [19, 104]. The SETX missense mutations
cluster in the helicase and protein-protein interaction domains suggesting
a role for these domains in disease (Figure 1.1 C) [19]. Although the direct
mechanisms through which mutations in SETX cause ALS4 are unknown,
recent studies have shown senataxin is involved in transcriptional regulation
of genes including RNA polymerase II termination factor and in pre-mRNA
processing affecting splicing efficiency and splice site selection [120].
The function of senataxin is similar to Sen1p in yeast, where it is a RNA
helicase acting on a wide range of RNA classes, including tRNAs, rRNAs and
small nuclear and nucleolar RNA [121], tRNA splicing [122], small nuclear
RNA synthesis [123], transcription and transcription-coupled DNA repair
[124] and as a RNA polymerase II transcription regulator [125]. An amino
acid substitution in the helicase domain of Sen1p altered the genome wide
distribution of RNA-polymerase II in both non-coding and protein coding
genes [125]. With similar mutations, Steinmetz [125] suggested a role for altered
gene transcription in ALS4 and AOA2.
In AOA2, senataxin mutations result in altered response to oxidative stress
[109, 117]. Both the knockdown of SETX expression and an AOA2 SETX
null mutant, showed a decrease in expression of genes involved in oxidative
stress, including SOD1, IMPDH2, CYC and RPL36 [120]. Mutant senataxin
also showed a similar toxic effect, however, knockdown of mutant senataxin

1 literature review 16
ameliorated the toxic effect of the mutant form. This resulted in normal levels
of oxidative stress response [117].
Mutant senataxin showed normal cellular distribution with no apparent
aggregation in cell culture and a normal molecular weight seen in Western
immunoblotting. It was therefore suggested that mislocalisation or generation
of abnormal protein isomers and aggregates do not play a role in ALS4 [19].
While it appears there is a possible role for decreased oxidative stress response
in AOA2, the mechanism of mutant senataxin in ALS4 has not been determined.
An error in transcriptional regulation of coding genes or an error in pre-mRNA
processing, affecting splice site selection or splicing efficiency are still plausible
possibilities in ALS4.
1.1.5 Glycyl-tRNA synthase (GARS)
Mutations of the GARS gene encoding glycyl-tRNA synthetase (GlyRS) were
initially reported in dHMN5 (MIM#600794) and CMT2D (MIM#601472) [126].
Distal HMN5, also known as distal spinal muscular atrophy type 5, is an
AD inherited peripheral neuropathy, characterized by adolescent onset of
weakness and atrophy of muscles in hands and feet, predominantly of the
upper limbs, with slow progression to involve the lower limbs in most cases
[127]. Distal HMN5 and CMT2D are allelic variants, with sensory involvement
distinguishing CMT2D from dHMN5 [126–128]. Atypical dHMN5 phenotypes
have also been reported with GARS mutations, a variable phenotype showing
lower or upper limb onset (G562R) [129], predominant lower limb involvement
(P244L) [130, 131] and early childhood onset with predominantly lower limb
involvement (G598A) [132]. Three GARS mutations were reported in distinct
dHMN5 and CMT2D families (dHMN5; L129P and G526R, CMT2D; G240R)
and one family with both CMT2D and dHMN5 individuals (E71G) [126].

1 literature review 17
Further GARS mutations have been described in dHMN5 (I280F and A57V)
and CMT2 (S581L, H418R, and P244L) (Figure 1.1 D) [127, 131–133].
Two mouse models of CMT2D have been described with mutations in the
mouse Gars gene, the orthologue of human GARS [134, 135]. These two Gars
mutations cause neuropathy through a dominant, gain-of-function mechanism
[135].
The aminoacyl-tRNA synthetases (ARS) (including GARS) are a family of
enzymes that catalyse the covalent bonding (charging) of an amino acid to its
corresponding transfer RNA (tRNA). The charged tRNA can then deliver the
amino acid to a growing polypeptide on a ribosome [136]. ARS are ubiquitously
expressed and highly conserved across organisms, reflecting their fundamental
role in protein synthesis. GlyRS is a homodimer, essential for the charging of
glycine to tRNAgly [137], in both the cytoplasm and mitochondria.
Antonellis and Green [20] proposed four mechanisms whereby mutant ARS
could cause neurodegeneration. (1) Impaired function of ARS enzymes ei-
ther through loss of tRNA charging function or altered cellular localization
(compartment specific loss of function) or (2) a toxic gain of function caused
by aggregation of mutant GARS or incorrectly synthesized proteins or (3)
disruption of a neuronal-specific secondary function of these enzymes or (4)
mitochondrial specific disruption of ARS function through loss of ARS trans-
port into mitochondria. While the pathologic mechanisms involving mutant
GlyRS in dHMN5 remain unclear, Motley et al. [138] suggested that a loss of
enzyme function through altered dimerisation or impaired axonal transport of
GARS with local protein synthesis defects, were likely pathogenic mechanisms
of GARS in CMT2D and dHMN5. Three out of four ARS genes mutated in
CMT (lysyl-, alanyl- and tyrosyl-tRNA) involve loss of function through re-
duction in tRNA aminoacylation [126, 139, 140] or altered axonal distribution
[141]. A dominant-negative loss of function of GlyRS would agree with the
loss of function observed by the other mutant ARS in CMT. However, other
1 literature review 18
possible pathogenic mechanisms include an altered non-canonical function of
GARS, toxic protein interactions or mitochondrial toxicity [138].
1.1.6 Berardinelli-Seip congenital lipodystrophy 2 (SEIPIN) gene (BSCL2)
In addition to GARS mutations, dHMN5 can also be caused by mutations in
the Berardinelli-Seip congenital lipodystrophy 2 (seipin) gene (BSCL2). These
mutations are also found in the allelic disorder spastic paraplegia 17 (SPG17;
MIM#270685) also known as Silver syndrome [142]. Two BSCL2 mutations
have been identified in dHMN5 and SPG17, N88S and S90L (Figure 1.1 E).
These affect a conserved N-glycosylation motif [142]. This glycosylation site
is a mutational hot-spot, with these mutations identified independently in
several families and as de-novo mutations in sporadic cases [6].
SPG17 is a rare AD neurodegenerative disorder, characterised by weakness
and wasting of the small muscles in the hand and marked spasticity in the
lower limbs [143]. BSCL2 mutations result in heterogeneous phenotypes, with
clinical variability often seen within individual families. While the clinical phe-
notypes are predominantly dHMN5 and SPG17, atypical phenotypes include,
subclinical neurological damage, variant SPG17 and dHMN5 with lower limb
or both lower and upper limb involvement and CMT2 [143–146].
Unlike the missense BSCL2 mutations in dHMN5 and SPG17, null mutations
cause congenital generalized lipodystrophy type 2 (CGL2; MIM #269700), a rare
AR disease of lipid metabolism [147]. CGL2 is characterised by a near absence
of adipose tissue from birth or infancy, severe insulin resistance and mental
retardation. Lipodystrophy is not evident in dHMN5 and SPG17, suggesting
that BSCL2 mutants in dHMN5 and SPG17 confer a dominant toxic gain of
function [144].

1 literature review 19
Three alternative transcripts of BSCL2 have been identified. Two are ubiq-
uitously expressed and one is specifically expressed in motor neurons in the
spinal cord, cortical neurons in the cerebral cortex, and in the testis and pi-
tuitary gland [142, 148]. The 288 aa central region of BSCL2 is functionally
conserved across species [149]. This region of BSCL2 contains two transmem-
brane domains, with the N and C-terminals in the cytoplasm. The conserved
N-glycosylation motif mutated in dHMN and SPG17 is located between these
two transmembrane domains [150].
Ito and Suzuki [151] demonstrated that mutations in seipin disrupt N-
glycosylation leading to incorrect protein folding in the endoplasmic reticulum
(ER). They proposed a mechanism for neurodegeneration, whereby some
misfolded seipin is eliminated by the ubiquitin-proteosome system, however
this is insufficient to prevent mutant seipin from accumulating in the ER,
leading to cell death through ER stress [152]. Similar accumulation of mutant
BSCL2 was seen in cell cultures expressing the N88S and S90L mutations,
with aggreosome like structures containing mutant BSCL2 along with altered
cellular localisation [142]. Further evidence for a toxic gain of function comes
from functional studies in yeast. BSCL2 proteins containing the N88S or S90L
mutations were able to rescue a lipid droplet morphology in the same way
as Wt BSCL2 and truncated BSCL2 containing only the conserved 288 amino
acid region. This contrasts with BSCL2 containing a CGL2 null-mutant, which
resulted in an altered lipid droplet morphology, indicating the N88S and S90L
mutants still possess some normal BSCL2 function [149].
In a dHMN family carrying a N88S BSCL2 mutation a second disease locus
was mapped to chromosome 16p [146]. This family had a variable dHMN
phenotype, including either lower or upper or both lower and upper limb
involvement, while some family members also showed pyramidal features.
All twelve patients with dHMN carried the N88S BSCL2 mutation and the
16p locus. One individual carried only the 16p locus and showed sub-clinical

1 literature review 20
neurological damage. This digenic inheritance of the 16p locus may have an
additive pathologic effect or be sufficient for an attenuated form of dHMN
[146].
While the number of studies of mutant BSCL2 is small, and no post-mortem
analysis has been reported, the proposed toxic gain of function leading to
neurodegeneration through ER stress remains a likely central mechanism in
dHMN5 and SPG17.
1.1.7 ATPase, Cu2+-transporting, alpha polypeptide gene (ATP7A)
Mutations causing X-linked dHMN (DSMAX; MIM#300489) have been reported
in the gene encoding the copper-transporting ATPase, ATP7A (Figure 1.1 F)
[153]. This X-linked dHMN syndrome is characterised by slowly progressive
distal weakness, with minor sensory involvement. The mutations occurred in
families of Brazilian [154] and North American [155] ancestry. An early age of
onset was observed in the Brazilian family with the North American family
presenting in the third or fourth decades. Similar motor-neuron disease like
symptoms can also result from acquired copper deficiency [156]. Mutations in
ATP7A have previously been described in the severe conditions, Menkes dis-
ease (MD) [157–159] and occipital horn syndrome (OHS) [160]. However, these
syndromes are phenotypically distinct from X-linked dHMN [153]. Analysis
of the copper transport function and cellular localisation of ATP7A indicate
the X-linked dHMN mutations are causing a protein trafficking defect, where
ATP7A doesn’t move away from the trans Golgi network in response to ele-
vated copper [153]. It is unclear how this defect in copper transport results in
a motor-neuron specific phenotype.

1 literature review 21
1.1.8 Pleckstrin homology domain-containing protein, G5 gene (PLEKHG5)
A mutation in the pleckstrin homology domain containing protein, family
G member 5 (PLEKHG5) gene was reported in large consanguineous pedi-
gree with an AR lower motor neuron disease [161, 162]. Classified as distal
spinal muscular atrophy 4 (DSMA4; MIM#611067) or dHMN4, this severe
juvenile onset, lower motor neuropathy presents with distal muscle wasting of
both upper and lower limbs, rapidly progressing to a general paralysis and
impaired respiration, but sparing cranial nerves [161]. A milder phenotype
was identified in one family member, with delayed onset, slower course and
moderate generalised weakness.
PLEKHG5 is a member of the Db1 protein family, with characteristic cat-
alytic Db1-homology domain and pleckstrin homology domain (Figure 1.1 G).
PLEKHG5 is a low abundance protein predominantly expressed in periph-
eral nerve, spinal cord and brain, with lower expression in heart and skeletal
muscle. [162, 163]. PLEKHG5 is a direct activator of RhoA in vivo, and is a
suppressor of neuronal differentiation [163]. PLEKHG5 is also an activator of
the NFκB signalling pathway [162, 164]. In neurons, NFκB activation stimu-
lates pro-survival genes, including anti-apoptotic proteins, antioxidants and
neurotrophic factors [165].
The reported mutation in PLEKHG5 leads to protein instability and a fail-
ure in activation of the NFκB pathway. Furthermore, aggregation of mutant
PLEKHG5 was seen when over expressed in a motor-neuron like cell line [162].
The demonstrated instability of mutant PLEKHG5, and its inability to activate
NFκB signalling, support a homozygous loss of function mechanism. Maystadt
et al. [162] proposed that PLECKHG5 may play a protective role in motor
neurons and that a loss of NFκB stimulating activity leads to neuronal-specific
1 literature review 22
cell death. Further investigation of PLEKHG5 aggregation is needed to support
a role in neurodegeration.
1.1.9 Transient receptor potential cation channel, V4 gene (TRPV4)
Two mutations in the vanilloid transient receptor potential cation-channel gene
(TRPV4) were recently identified in congenital DSMA linked to chromosome
12q23-q24 (MIM#600175) [21]. The congenital DSMA TRPV4 mutations were
concurrently reported with TRVP4 mutations in hereditary motor sensory
neuropathy type 2C (HMSN2C; MIM#606071, or CMT2C) and scapuloperoneal
spinal muscular atrophy (SPSMA; MIM#181405) [21, 166, 167], with overlap
of all the TRVP4 mutations between the three conditions [168]. In all, four
mutations were reported; two mutations affecting the same amino acid, R269H
and R269C, and two mutations affecting adjacent amino acids, R315W and
R316C (Figure 1.1 H). Both congenital DSMA families showed intra-familial
clinical variation. The phenotype of the original congenital DSMA family
ranged from mild distal lower limb involvement, through to a more severe
phenotype involving pelvic girdle weakness and subsequent scoliosis [169, 170].
The second family reported further clinical variation including mild and severe
congenital DSMA, SPSMA and HMSN2C [21]. Although congenital DSMA
and SPSMA were originally considered to be distinct [170], they have since
been confirmed to be allelic variants of mutant TRVP4 along with HMSN2C
[21, 166–168].
TRVP4 forms a homo-tetramer that acts as a plasma membrane calcium ion
channel, activated by heat, mechanical stress and extracellular hypotonicity
[171]. The four unique mutations in TRVP4 are all located in the cytosolic
N-terminal ankyrin repeats, a putative regulatory region involved in TRVP4
tetramerization or interaction with regulatory proteins [171].

1 literature review 23
The function of mutant TRVP4 in peripheral nerves is unclear, with conflict-
ing disease mechanisms reported [168]. Auer-Grumbach et al. [21] reported
reduced cell surface expression of TRPV4 calcium channels and reduced cal-
cium influx, whereas two other studies reported marked cellular toxicity, with
increased calcium channel activity [166, 167]. These differences have been
attributed to the use of different experimental techniques [168] and further
research is required to clarify the functional effects of TRPV4 mutations in
neurodegeneration.
1.1.10 DYNC1H1
During the preparation of this thesis, mutations in the dynein cytoplas-
mic 1 heavy chain 1(DYNC1H1) gene were identified in three families with
spinal muscular atrophy with lower extremity predominance (SMA-LED,
MIM#158600)[172] and one with CMT2O(MIM#614228)[173]. Both the SMA-
LED and CMT2O families with DYNC1H1 mutations showed a lower limb
predominance of motor neuron disease. The affected patients from SMA-LED
families, showed a pure motor neurone disease, manifesting in early childhood
as delayed motor development and lower limb weakness affecting walking and
running, without sensory involvement. The affected patients from the CMT2O
family also showed delayed motor development and early-onset muscle weak-
ness affecting walking. However, slow disease progression lead to distal lower
limb weakness and wasting with pes cavus deformity and variable sensory
involvement in some family members, including reduced vibration sense, loss
of proprioception and fine touch and lower limb pains. Some of the affected
patients from the CMT2O family had similar clinical descriptions to SMA-LED
indicating a clinical overlap between the disorders.

1 literature review 24
The four mutations are located in the tail domain of DYNC1H1, involved
in dimerisation of dyenin/dynactin complex motor units (Figure 1.1 I). Three
mouse models with motor neuron defects and muscle wasting have been
described with mutations in the mouse Dync1h1 gene [174, 175]. These three
mutations are also located in the tail domain of Dync1h1.
The discovery of DYNC1H1 mutations adds to previous evidence from
DCTN1 (Section 1.1.2) that disruption to retrograde transport in motor neurons
is a critical disease mechanism in dHMN. Other genes involved in these
processes are likely disease candidates in additional unsolved dHMN families.
1.1.11 Clinical variability in dHMN
The dHMN genes identified to date have a diverse range of functions, sug-
gesting motor neuron degeneration is a multifactorial process or that there are
numerous ways to disrupt these highly metabolic, terminally differentiated
cells. While distal motor neurons are primarily affected, the involvement of
other neuronal cell types, including upper motor neurons and sensory neu-
rons is apparent in some dHMN. This variability is both intrafamilial, with
individuals having different diagnoses within a single family as well as in-
terfamilial, where separate families carrying the same mutation, or different
mutations in the same gene, have differing diagnosis. In the case of sensory
involvement in dHMN, individuals without sensory signs are diagnosed as
dHMN, while individuals with clear sensory signs are diagnosed as CMT2.
The clinical variability in dHMN makes accurate diagnosis a complex and
difficult task. As the involvement of sensory and pyramidal tract signs are
prominent in several forms of dHMN they should be considered in diagnostic
and gene screening paradigms [6, 185]. This further complicates genetic studies
which rely on accurate diagnosis of family members for linkage analysis in

1 literature review 25
Tabl
e1.
1:O
MIM
clas
sific
atio
nof
dHM
N
Dis
ease
Locu
sG
ene
Inhe
rita
nce/
phen
otyp
e†R
efer
ence
s
dHM
N1
(MIM
%18
2960
)7q
34-q
36U
nkno
wn
AD
juve
nile
onse
tlo
wer
limb
pred
omin
ant
dist
alw
eakn
ess
and
was
ting
[103
]
dHM
N2A
(MIM
#158
590)
12q2
4.3
HSP
B8A
Dad
ult
onse
tlo
wer
limb
pred
omin
ant
dist
alw
eakn
ess
and
was
ting
[3]
dHM
N2B
(MIM
#608
634)
7q11
-q21
HSP
B1[2
]dH
MN
2C(M
IM#6
1337
6)5q
11.2
HSP
B3[4
]
dHM
N3
(MIM
%60
7088
)‡11
q13.
3U
nkno
wn
AR
adul
ton
set
dist
alw
eakn
ess
and
was
ting
[176
,177
]
dHM
N4
(MIM
%60
7088
)‡11
q13.
3U
nkno
wn
AR
juve
nile
onse
tsev
ere
mus
cle
wea
knes
san
dw
astin
gan
dpa
raly
sis
ofth
edi
aphr
agm
dHM
N5
(MIM
#600
794)
7p15
GA
RS
AD
uppe
rlim
bpr
edom
inan
tdi
stal
mus
cle
wea
knes
san
dw
asti
ng[1
26]
11q1
2-q1
4BS
CL2
[142
]
dHM
N6
(DSM
A1;
MIM
#604
320)
11q1
3.2
IGH
MBP
2A
Rin
fant
ileon
set
wit
hre
spir
ator
ydi
stre
ss[7
6]
dHM
N7A
(MIM
%15
8580
)2q
14U
nkno
wn
AD
adul
ton
set
wit
hvo
calc
ord
para
lysi
s[1
78]
dHM
N7B
(MIM
#607
641)
2p13
DC
TN1
AD
adul
ton
set
brea
thin
gdi
fficu
ltie
sdu
eto
voca
lcor
dpa
raly
sis,
faci
alw
eakn
ess
and
hand
mus
cle
atro
phy
[64]
X-L
inke
ddH
MN
(DSM
AX
;MIM
#300
489)
Xq1
3-q2
1A
TP7A
XL
juve
nile
onse
tdi
stal
wea
knes
san
dw
asti
ng[1
53]
DSM
A4
(MIM
#611
067)
1p35
PLEK
HG
5A
Rch
ildho
odon
set
mus
cle
wea
knes
san
dse
vere
lyde
crea
sed
resp
irat
ory
func
tion
[162
]
Con
geni
tald
ista
lSM
A(M
IM#6
0017
5)12
q23-
q24
TRPV
4A
Dco
ngen
ital
,non
prog
ress
ive
low
erlim
bw
eakn
ess
and
para
lysi
sw
ith
cont
ract
ures
[21,
169,
170,
179,
180]
dHM
N-A
LS4
(MIM
#602
433)
9q34
SETX
AD
juve
nile
onse
tdi
stal
wea
knes
san
dw
asti
ngw
ith
pyra
mid
altr
act
sign
s[9
6]
dHM
Nw
ith
pyra
mid
alfe
atur
es4q
34.3
-q35
.2U
nkno
wn
AD
adul
ton
set
low
erlim
bdi
stal
wea
knes
san
dw
asti
ngw
ith
pyra
mid
altr
act
sign
s[1
81]
dHM
N-J
(MIM
%60
5726
)9p
21.1
-p12
Unk
now
nA
Rju
veni
leon
set
dist
alw
eakn
ess
and
was
ting
wit
hpy
ram
idal
trac
tsi
gns
[182
,183
]
SMA
-LED
(MIM
#158
600)
14q3
2.31
DY
NC
1H1
AD
juve
nile
dela
yed
mot
orde
velo
pmen
tan
dlo
wer
limb
wea
knes
s[1
72]
†A
D,a
utos
omal
dom
inan
t,A
R,a
utos
omal
rece
ssiv
e,X
L,X
-chr
omos
ome
linke
d.‡
Afa
mily
map
ping
to11
q13.
3ha
sbo
thdH
MN
3an
ddH
MN
4ph
enot
ypes
[177
],Ir
obie
tal
[184
]su
gges
ted
that
they
are
the
sam
edi
sord
er.

1 literature review 26
such pedigrees. This adds to the limitations on linkage analysis caused by the
genetic heterogeneity of dHMN which prevents independent pedigrees from
being analysed together. In addition, the functional variability between known
genetic causes of dHMN limits the application of pure functional cloning based
gene identification (Section 4.1.2).
Sensory involvement is sometimes seen with mutations in dHMN genes,
highlighting the overlap between dHMN and CMT2. Interfamilial variability
is seen with unique HSPB1 mutations reported in unrelated dHMN2 and
CMT2 families. The S135F HSPB1 mutation results in both dHMN2 and CMT2
in unrelated families [2, 18]. As such, the differences in sensory symptoms
between these families cannot only be attributed to the different HSPB1 muta-
tions having varying influence between sensory and motor neurons, and the
disease mechanism must be the same between dHMN2/CMT2 with HSPB1
mutations. Similarly the K141N HSPB8 mutation causes both dHMN2 and
CMT2L in unrelated families with mild to moderate sensory involvement the
distinguishing feature between these conditions [3, 8]. Furthermore, GARS
mutations cause both dHMN5 and CMT2 in unrelated families, as well as in a
single pedigree carrying the E71G GARS mutation [126, 127, 131–133].
Additional interfamilial variability in dHMN further supports the overlap
of dHMN and CMT2. Nicholson et al. [185] identified several dHMN families
with variable sensory signs and individuals from CMTX families lacking
sensory symptoms. The X-linked dHMN families with ATP7A mutations have
minor sensory involvement in some family members [153]. The dHMN1 family
linked to chromosome 7q34-q36 has two individuals with minor sensory signs
[103] and the dHMN with pyramidal signs linked to chromosome 4q34.3-q35.2
has one individual with sensory signs [181]. Later sensory symptoms are seen
in DSMA1 with IGHMBP2 mutations, confirmed by autopsy results which
showed progressive motor and sensory neuron degeneration [87]. Generally
no sensory involvement is seen in with BSCL2 mutations, however in the large

1 literature review 27
family reported by Auer-Grumbach et al. [143], 20% of affected members had
a motor and sensory neuropathy consistent with CMT2.
Clinical variability in dHMN extends to upper motor neuron involvement
in some dHMN families. Upper motor neuron involvement has been reported,
again with intra- and interfamilial variability. Pyramidal signs are seen with
SETX mutations [6, 102], and the rare HSPB1 P182L mutation [6]. Pyramidal
signs have also been reported in dHMN1 mapped to chromosome 7q34-q36
[103], and dHMN with pyramidal features mapped to chromosome 4q34.3-
q35.2 [181]. Significant variability is also seen with BSCL2 mutations. Generally,
the N88S mutation causes a dHMN5 phenotype, with atrophy and weakness
of hand muscles whereas the S90L mutation causes the more severe SPG17
phenotype, with spasticity in the lower limbs and additional upper motor
neuron signs in addition to the muscle atrophy in the upper limbs [6]. The
unique de novo G598A GARS mutation causes an infantile SMA contrasting to
the usual dHMNV/CMT2 [132].
It is still unclear why variability of affected tissues and age of onset exists
between closely related individuals, however this implicates additional mod-
ifying factors, environmental or genetic, influencing the phenotype. Genetic
modifiers are other polymorphisms or mutations which ameliorate or intensify
the phenotype created by the primary disease mutation. Two genetic modifiers
have been mapped in a dHMN5 family and the nmd mouse model of DSMA1.
A digenic inheritance of the N88S BSCL2 mutation and a second locus mapping
to chromosome 16p was reported in a dHMN5 family with variable presen-
tation and additional pyramidal features in some family members [146]. The
chromosome 16p locus was also identified in two individuals with sub-clinical
motor neuron damage and is suggested to be a modifier locus, responsible for
some of the clinical variability within the family. The LITAF1 gene associated
with CMT1C is located in this region, however no mutation, copy number
variation or altered expression was identified. A further 49 genes remain in

1 literature review 28
the 16p locus, including other good candidate genes [146]. As previously de-
scribed, the Mnm locus in the nmd mouse model of DSMA1 with IGHMBP2
mutations, ameliorates the motor-neuron disease phenotype [100]. The Mnm
locus contains several tRNA genes and the ribosomal associated factor Abt1,
which associates with IGHMBP2; however, no polymorphisms were identified
in these genes to account for the compensatory effect of the Mnm locus [98].
While the two mapped dHMN genetic modifiers have not yet been identified,
the genetic modifiers influencing the severity of SMA caused by mutations in
the SMN1 gene have been characterised. The phenotype of SMN related SMA
is highly variable and ranges from the fatal infantile onset type 1 SMA (SMA1),
through the chronic infantile onset SMA type 2 (SMA2), juvenile type 3 SMA
(SMA3) and adult onset, type 4 SMA (SMA4). Mutations in SMN1 involve
deletions or exon skipping resulting in a loss of SMN protein. Heterozygous
SMN1 mutations cause the least severe phenotype SMA4, with loss of both
copies of SMN1 causing the more severe earlier onset forms of SMA. There
are several other factors which influence the severity of the disorder, the first
is the second copy of the SMN gene (SMN2) located on a large duplication
on chromosome 5. The SMN2 gene has a silent mutation which causes exon
7 skipping leading to an inactive protein. However SMN2 transcription still
produces about 10% of normal SMN mRNA. SMN2 copy number influences
the phenotype of SMA, with higher SMN2 copy number correlating with less
severe diagnosis [186]. SMN1 mutations that maintain partial transcription
levels similar to SMN2, lead to a less severe phenotype than a complete loss
of SMN1 [187]. Secondly, high expression levels of the PLS3 gene, encoding
Plastin3, have been shown to be protective against SMN1 mutations [188].
Plastin3 over expression rescued axon defects caused by SMN1 deletion. The
PLS3 protective effect is gender-specific to females and shows less than 100%
penetrance suggesting an unknown regulatory mechanism is responsible for
the altered expression levels of PLS3[188]. A third modifying factor is the

1 literature review 29
neuronal apoptosis inhibitory protein (NAIP) [189]. Partial deletions of NAIP
are a polymorphism found in 2% of non-SMA chromosomes. When NAIP
deletions are inherited with SMN1 mutations, the more severe SMA1 pheno-
type results. Deletions in the NAIP gene are found in a high proportion of
patients with SMA1, including 67% of European and 37% of Chinese SMA1
cohorts [189, 190]. NAIP is an inhibitor of cell death and regulator of neuronal
outgrowth [191]. These functions are lost with the deletions of NAIP. Similar
modifiers may play a role in the variability of dHMN.
1.1.12 Common disease mechanisms in dHMN
While the genes associated with dHMN encompass a diverse range of func-
tions, some common mechanisms have emerged. Disrupted axonal transport
has been implicated in dHMN with DCTN1, HSPB1 and HSPB8 mutations.
As a core component of microtubule based transport, the disruption of the
motor function of Dynactin 1 directly disrupts axonal transport. Disruption of
components of microtubule based movement, including cargo adapters, micro-
tubule tracks and motor proteins are seen in other neurodegenerative diseases
including ALS, Huntington’s disease, Parkinson’s disease and Alzheimer’s
disease [192]. The mechanism whereby HSPB1 and HSPB8 mutations disrupt
axonal transport is less clear, although a disruption of the axonal cytoskeleton
or protein aggregation are possible mechanisms leading to axon blockage.
Active transport along axons is crucial for the survival of motor neurons.
Transport is required for delivery of proteins, lipids and mitochondria to the
distal synapse, long distance signalling and the clearing of damaged proteins.
These requirements make neurons particularly susceptible to disruption of
axonal transport.

1 literature review 30
RNA processing defects are also emerging as a significant factor in mo-
tor neuron disease [193]. It is apparent that motor neurons are particularly
sensitive to disruptions in RNA processing pathways, which include, RNA
transcription, pre-mRNA splicing, editing, transportation, translation and
degradation [51]. Several genes mutated in dHMN have roles in RNA pro-
cessing including IGHMBP2, SETX and GARS which have been shown to be
disrupted. While HSPB8 and HSPB1 have functions involved in RNA pro-
cessing, whether these functions are involved in the pathogenesis of dHMN
has not been investigated. Recently, mutations in TAR DNA binding protein
(TDP-43) [194] and fused in sarcoma (FUS) [195] have been shown to cause
ALS. Both FUS and TDP-43 have roles in RNA processing including regulation
of splicing, transcription and transport. An understanding of the effects of
mutations in these RNA processing proteins should provide insight into the
disease mechanisms of dHMN and other motor neuron disease.
Protein aggregation and inclusion body formation are recognised as common
molecular mechanisms leading to neurodegeneration [34]. Protein aggregation
may result from a failure of the proteasome to clear misfolded proteins, which
aggregate causing further toxic effects, including blocked access to axons, toxic
interactions with additional proteins or triggering cell death pathways. In
dHMN2 with HSPB1 and HSPB8 mutations, protein aggregates were seen
in vitro, with aggregates containing other proteins including the cytoskele-
ton protein NFL. This was thought to contribute to disruption of the axonal
cytoskeleton and axonal transport. Mutant BSCL2 was shown to form aggreo-
some like structures and accumulate in the ER, leading to ER stress and cell
death [152].
It is unclear how mutations in ubiquitously expressed genes result in a motor
neuron predominant phenotype. Motor neurons may be more susceptible due
to their unique features such as their large size and long axons, and heavy
reliance on active transport and high energy demands, which make them

1 literature review 31
most vulnerable to the effects of these mutations. On the other hand, some
genes mutated in dHMN are specifically expressed or expressed at higher
levels in the CNS than other tissues, thereby accounting for much of the
motor neuron specific disease phenotype. Mutations in the PLEKHG5 gene,
which is specifically expressed in motor neurons, results in a more severe
dHMN phenotype than many of the other ubiquitously expressed dHMN
genes. PLEKHG5 mutations are thought to lead to cell death through loss of
NFkb signalling, resulting in a motor neuron specific phenotype due to its
limited expression.
Future genetic studies including those searching for additional disease
genes can use the information from known disease genes to identify likely
candidate genes in related genes and common pathways. As additional genes
are described in dHMN, it is likely the common disease mechanisms and
pathways will become clearer. These common disease pathways will provide
targets to develop disease treatments or preventative strategies.
The purpose of this thesis is to identify new gene mutations causing dHMN.
The genetic and functional data presented here suggest this will be a difficult
task; the genetic heterogeneity complicates genetic analysis and the multiple
molecular mechanisms implicated to date make it difficult to pinpoint specific
candidate genes. The identification of additional genes and genetic modifiers
is necessary to increase our understanding of the disease mechanisms caus-
ing dHMN and related neuropathies. This will directly aid in the diagnosis
and classification of these neurodegenerative diseases and may lead to new
therapeutics and treatment strategies.
2G E N E R A L M AT E R I A L S A N D M E T H O D S
This chapter details the general materials and methods used throughout this
project. Protocols specific to individual experiments are detailed in the relevant
chapters.
2.1 general materials and reagents
All solutions were prepared using Type 1, reagent-grade water, purified using a
Milli-Q Academic (Millipore) water purification system. Solutions, plasticware
and glassware were sterilised by autoclaving.
2.1.1 Reagents and Enzymes
The following reagents and enzymes were used: 10 mM dNTP Mix (Bioline),
Blue Perpetual Taq DNA polymerase (Vivantis) and supplied buffers, Chromo
AtTaq (Vivantis) and supplied Buffer A, ImmoMix Red (Bioline), 10× PCRx
Enhancer Solution (Invitrogen), HRM Master Mix (Idaho Technology), LC
Green Plus (Idaho Technology), agarose (Vivantis), 25× TAE buffer (Amresco),
SYBR safe (Invitrogen), HyperLadder I (Bioline), HyperLadder IV (Bioline),
100% ethanol (Ajax Finechem).
32

2 general materials and methods 33
2.1.2 Equipment
Pipetting was carried out using the following pipettes: Nichipet 100-1000 µL,
20-200 µL, and 2-20 µL (Nichiryo); Pipetman P2 (Gilson); multichannel 20-200
µL (Socorex). Disposable tips used for pipetting were: Ultratip (Greiner Bio-
One), Gilson yellow 200 and Gilson blue 1000; ART Aerosol Resistant Tips
(Molecular BioProducts), ART 10 and ART 20p; and Aerosol Barrier Tips (Inter-
path Services), 1000 µL, 200 µL, 20 µL and 10 µL. Thermal cycling was carried
out using either the GeneAmp PCR System 9700 (Applied Biosystems), Master-
cycler ep gradient S (Eppendorf), or Mastercycler pro S (Eppendorf). Agarose
gel electrophoresis was carried out in horizontal submarine units (Cleaver Sci-
entific and Amersham Bioscience) using a 3000Xi Electrophoresis power supply
(Bio-Rad). DNA concentration was measured using a BioPhotometer 6131 (Ep-
pendorf) with UVette cuvettes (Eppendorf) and a 10 mm optical path length.
Centrifugation was carried out using: PMC-860 Capsulefuge (Tomy), 5417C
centrifuge (Eppendorf), Biofuge pico (Heraeus), GS6R centrifuge (Beckman) or
Megafuge 1.0 (Heraeus).
2.1.3 Plasticware
The following plasticware were used: 1.5 mL microcentrifuge tubes (Astral
Scientific), 8-strip 200 µL PCR tubes (Scientific Specialities Inc.), 96-well un-
skirted PCR plates (Bioplastics), 96-well black-shell/white-well skirted PCR
plates (BioRad), 15 mL and 50 mL centrifuge tubes (Greiner Bio-One), and
Vacuette R 9 mL K3E K3EDTA (Greiner Bio-one) blood collection tubes.
2 general materials and methods 34
2.2 study participants
Individuals participating in this study gave informed consent in accordance
to protocols approved by the Sydney South West Area Health Service Ethics
Review Committee (Sydney Australia; Reference number: CH62/6/2006 - 050 -
G.Nicholson).
2.3 dna methods
2.3.1 DNA extraction from blood
DNA samples were extracted by the Molecular Medicine Laboratory, Concord
Repatriation General Hospital (Sydney, Australia). Genomic DNA was ex-
tracted from peripheral blood using the PUREGENE DNA isolation kit (Gentra
Systems) according to the manufacturers protocol. In brief, RBC lysis solution
was added to 3 mL of whole blood to a total volume of 12 mL and incubated
at room temperature for 10 min. White cells were pelleted by centrifugation for
10 min at 2000 × g and the supernatant discarded. Cells were lysed by adding
cell lysis solution (3 mL) and mixing by vortexing. Protein was precipitated by
addition of protein precipitation solution (1 mL) followed by vortexing and
centrifugation for 10 min at 2000 × g. Supernatant was recovered into a 15
mL centrifuge tube. DNA was precipitated by addition of 100% isopropanol (3
mL), mixing by inversion, then pelleted by centrifugation for 3 min at 2000 ×
g. The DNA pellet was washed in 70% ethanol (3 mL) and centrifuged for 1
min at 2000 × g. The supernatant was discarded and the DNA pellet was air
dried for 15 min. The DNA was re-suspended in 250 µL of DNA hydration
solution and stored at 4°C.

2 general materials and methods 35
DNA samples older than the year 2000 were extracted using an alternate
phenol chloroform based DNA extraction protocol as described by Sambrook
et al. [196].
2.3.2 DNA oligonucleotides
DNA oligonucleotides for PCR primers were designed using either the Exon-
Primer software through the UCSC genome browser [197], or LightScanner
Primer Design software version 1.0.R.84 (Idaho Technology). Primer sequences
are listed in Appendix B. Primers were synthesised by Invitrogen or Sigma.
2.3.3 PCR protocol
PCR reactions were carried out in a 10 µL reaction volume containing 10
ng template DNA, 1 U of Taq polymerase, 1 × reaction buffer, 100 µM each
dNTP, 1.5 mM MgCl2 and 4 pmol each of forward and reverse primers. If
required, PCRx Enhancer solution or LC Green Plus solutions were added at
1 × concentration during optimisation. MgCl2 concentration was increased
for difficult to optimise amplicons using a gradient from 1.5 mM to 2.5 mM.
PCR reaction thermal cycling involved: initial denaturation at 95°C for 10 min;
30 cycles of 95°C for 30 sec, optimal annealing temperature for 30 sec, and
72°C for 30 sec; and a final extension at 72°C for 5 min. The optimal annealing
temperature was determined using the Mastercycler ep gradient S (Eppendorf)
with a temperature gradient of 55 to 65°C. Thermal cyclers used are listed
in Section 2.1.2. Alternatively, a touchdown PCR protocol was used to avoid
optimisation of annealing temperature. The touchdown PCR protocol used:
initial denaturation at 95°C for 10 min; 10 cycles of 95°C for 30 sec, 72°C for
30 sec with a 1.5°C decrease in annealing temperature per cycle and 72°C for

2 general materials and methods 36
30 sec; 25 cycles of 95°C for 30 sec, 55°C for 30 sec and 72°C for 30 sec; and a
final extension at 72°C for 5 min.
2.3.4 Agarose gel electrophoresis
PCR amplicons were size fractionated using agarose gel electrophoresis. 1-
2% (w/v) agarose gels were prepared by disolving agarose into 1 × TAE
buffer with heating using a microwave oven. Molten agarose was allowed
to cool to 65°C before adding CYBR Safe (Invitrogen) DNA gel stain, then
poured into horizontal gel trays and allowed to solidify. PCR samples were
electrophoresed at 40 Vcm-1 for 40 min. DNA was visualised using a Safe
Imager Transilluminator (Invitrogen) and imaged using a Canon PhotoShot
S5-IS digital camera with Hoya O(G) filter. DNA size standards used included
HyperLadder I (200 bp to 10 kb) or HyperLadder IV (100 bp to 1 kb).
2.3.5 DNA purification from PCR
Purification of PCR products was carried out using alternate protocols de-
pending on the sequencing service used. The The Montage PCR96 Cleanup
Kit (Millipore) was used for PCR amplicons sequenced at Garvan sequencing
centre (Section 2.3.6.1) and ExoSAP PCR purification system was used for PCR
amplicons sequenced using the Macrogen sequencing service (Section 2.3.6.2).
The Montage PCR96 Clean-up Kit (Millipore) was used following the man-
ufacturers semi-automated protocol using a vacuum manifold (Millipore),
Pascal type 2005C vacuum pump (Alcatel) and high-speed microplate shaker
(Illumina). For PCR cleanup using ExoSAP, a master mix was prepared on ice
containing (per sample) 0.3 µL Exonuclease I (New England Biolabs), 1 µL
Shrimp Alkaline Phosphatase (Promega) and H2O to a volume of 5 µL. For a

2 general materials and methods 37
10 µL PCR reaction volume, 5 µL of ExoSAP master mix was added to each
completed PCR reaction and incubated for 30 min at 37°C then 15 min at 80°C.
2.3.6 DNA sequencing
Sequencing was carried out using the sequencing service at Australian Cancer
Research Foundation (ACRF) Facility GARVAN institute (Sydney, Australia)
and the sequencing service at Macrogen (Korea).
2.3.6.1 GARVAN sequencing
PCR amplicons were cleaned up using the The Montage PCR96 Clean-up
Kit (Millipore). Sequencing reactions were carried out using the Big Dye
terminator kit (Applied Biosystems) following the manufacturers protocol. In
brief, sequencing reactions were carried out in a half reaction volume of 10
µL containing: BigDye Sequencing Buffer (1 ×), ready reaction premix (1 ×),
sequencing primer (3.2 pmol), and PCR product DNA template (3-10 ng). Cycle
sequencing was carried out using a Mastercycler ep gradient S (Eppendorf)
with a modified protocol of: 96°C for 1 min; 40 cycles of 96°C for 10 sec, 50°C
5 sec, 60°C 4 min; then held at 4°C. Sequencing products were forwarded
to the sequencing service at Australian Cancer Research Foundation (ACRF)
Facility GARVAN institute (Sydney, Australia) for sequencing using an ABI
3100 Genetic Analyser (Applied Biosystems).
2.3.6.2 Macrogen sequencing
PCR products were cleaned up using ExoSAP. Cleaned up PCR products were
forwarded to Macrogen (Korea) for their standard-sequencing single or plate
service using Big Dye Terminator cycle sequencing (Applied Biosystems) and
3730xl DNA Analyzer (Applied Biosystems).
2 general materials and methods 38
2.3.6.3 Sequence analysis
Sequencing traces were downloaded from sequencing service providers in
.abi format. Sequences were aligned to the Human Mar. 2006 (NCBI36/hg18)
assembly reference sequence for the target gene using the software SeqMan
II version 5.08 (DNASTAR). Affected and control sequences were compared
to identify sequence variants. Correct alignment, exon coverage and sequence
variant annotation of aligned sequences for each PCR amplicon were checked
using the BLAT tool from the UCSC genome browser [198].

3G E N E T I C M A P P I N G
3.1 introduction
3.1.1 Overview
The focus of this genetic study is the dHMN1 disease locus on chromosome
7q34-q36 in a large Australian family, CMT54 [103]. This disease locus is a
12.9 megabase (Mb) region flanked by the markers D7S2513 and D7S637, with
a minimum probable candidate interval of 7.6 Mb flanked by D7S2511 and
D7S2546, suggested by recombination events in two unaffected individuals
[103]. There remains potential for fine mapping to refine the minimum probable
candidate interval in family CMT54. Further refinement of the disease interval
requires additional dHMN families linked to 7q34-q36 or expansion of the
original family. This chapter includes the fine mapping of the minimum
probable candidate interval in CMT54 and an analysis of the 7q34-q36 locus in
a cohort of dHMN families that are negative for known dHMN genes.
3.1.2 Homologous recombination and linkage disequilibrium
Homologous recombination is a mechanism whereby sections of DNA are
exchanged between pairs of homologous chromosomes. Homologous recombi-
nation results in a chromosomal crossover, creating two chromosomes with
a new combination of alleles. While genes located on separate chromosomes
39

3 genetic mapping 40
assort independently during meiosis, genes located on the same chromosome
only assort independently if homologous recombination occurs between them.
The further apart genes are on a chromosome the more likely this will occur.
Two genetic loci that do not assort independently are deemed linked. The
recombination fraction (θ) is a measure of the frequency of recombination
between two loci, the genetic distance between them. Recombination fractions
of < 0.5 indicate some degree of linkage, less offspring are recombinant than
would be expected for random assortment. A recombination fraction of 0.5
indicates that two loci are unlinked, that is 50% of offspring are recombinant.
The map unit of genetic distance is the centimorgan (cM), with one map unit
defined as the distance between two loci such that 1% of meiosis is recombinant
(θ = 0.01). Unless located closely together, two loci on the same chromosome
will be rapidly redistributed in a population through genetic recombination
and assume random assortment. Because closely located loci are less likely
to be recombined, they redistribute slowly and do not assort randomly in a
population. This non-random association of alleles at linked loci is termed
linkage disequilibrium or allelic association [199].
Genetic distance is a measure of the rate of recombination, not a physical
distance. An approximation of 1 cM Mb−1 is often used as a conversion from
cM to Mb [199], however the true rate of recombination varies across the
genome. The rate of recombination varies: between chromosomes, at different
regions across each chromosome, between individuals and between males
and females [200, 201]. The average male to female ratio of recombination
rate is 1.65. When examined at a Mb scale resolution, recombination rate
generally varies from 0-2 cM Mb−1, with localised peaks of high recombination
of 3-7 cM Mb−1 [200, 201]. Fine scale mapping at a kilobase (kb) resolution
has identified recombination hot spots approximately every 200 kb, generally
located outside genes, with higher densities of such hot-spots in regions of
higher recombination [202]. Recently, motifs and sequence contexts have been

3 genetic mapping 41
shown to play a role in recombination site selection [203]. In particular, the
PRDM9 reignition sequence is a major determinant of recombination site
selection [204].
3.1.3 Genetic linkage analysis
Genetic linkage analysis is a method for mapping a gene or genetic variant to
a specific chromosomal locus by identifying linked genetic markers. In human
genetics, linkage analysis can be an important first step in the identification
of disease genes. Recombination events within a pedigree are used to define
the locus harbouring the disease allele. Fine mapping is the process of refining
the location of these recombination events by analysing markers at greater
resolution around recombination sites.
3.1.3.1 DNA markers
DNA markers are characterised genetic variations which are polymorphic
within a study population. Markers are deemed informative in an individual
when allele phase can be identified, that is, both alleles can be assigned
a parental origin. Highly polymorphic markers are those with the greatest
heterozygosity, and therefore, are more likely to be informative within a
pedigree. Maximum heterozygosity is achieved when individuals within a
pedigree carry different alleles for a marker. This allows marker phase to
be assigned, and recombinant and non-recombinant meiosis to be identified,
giving the maximum possible linkage power for a pedigree. While several
types of polymorphic markers exist, short tandem repeat (microsatellite) and
single nucleotide polymorphism (SNP) markers are the most commonly used
in current genetic linkage analysis techniques.

3 genetic mapping 42
Microsatellites are short repeat sequences of 1-6 base pairs of DNA, with
the length of the microsatellite used to identify alleles. Di- and tri-nucleotide
sequences repeating 20-30 times are traditionally used as markers, as they are
highly polymorphic and suitable for PCR based amplification and sizing. Mark-
ers with 10 or more alleles are not uncommon, therefore microsatellite markers
are generally highly informative and allow correct phase to be assigned.
SNPs are single point mutations, insertions or deletions, common at a popu-
lation level, typically of 1% or greater. The informativeness of SNP markers is
lower compared with microsatellites, limited by the possible number of alleles
and the population incidence of the SNP. However, the ability to assay large
numbers cheaply and quickly with array based techniques and the higher
density across the genome, means SNP based genotyping can be suitably
informative when analysed using multi-point linkage techniques. However,
such analysis is generally limited to small pedigrees or genomic loci due to
software and computational limitations.
3.1.3.2 Two point linkage analysis
The odds of linkage between two loci is quantified as the ratio of the likelihood
of the two alternate assumptions; that the loci are linked (0 < θ < 0.5) or not
linked (θ = 0.5) [205]. In positional cloning, one locus is the marker being
tested and the second is the disease locus. The logarithm of the odds (LOD)
score (Z) is used to evaluate linkage in pedigrees [206]. The LOD score at a
selected value for θ is determined by the equation:
Z = log10
[θR(1− θ)NR
(0.5)R(0.5)NR
]
Where R = number of recombinants and NR = number of non recombinants.
Z is calculated at a range of values for θ from 0 to 0.5, with best estimate
of the distance between the two loci given by the value of θ where Z reaches

3 genetic mapping 43
its maximum positive value. This allows the localisation of a disease locus
within a genetic map. Calculations of LOD scores used in this thesis were
implemented in computer software; SuperLink, FastSLink and Genehunter
(Section 3.2.4).
To demonstrate significant linkage, the LOD score must be powerful enough
to reject the null hypothesis of no-linkage. By convention, a LOD score of +3
gives sufficient power, with 1000:1 odds in favour of genome wide linkage.
Conversely, a LOD score of -2 is considered sufficient to exclude the marker lo-
cus from linkage. LOD scores between these limits are uninformative, however
LOD scores > 1 may be considered suggestive of linkage and warrant further
investigation because the rates of false positive linkage with such scores are
low [205].
The strength of Z is influenced by the number of informative meioses within
a pedigree and the marker allele frequencies. To achieve a LOD score of +3
generally requires at least 10 informative meioses. As such, smaller pedigrees
cannot independently achieve significant LOD scores. In situations where the
disease in multiple pedigrees is thought to be due to mutations in a common
gene, LOD scores can be added to achieve a greater power to identify a disease
locus. LOD scores of -2 can be achieved with small pedigrees when alleles
do not segregate among two or more affected individuals. This is useful for
excluding linkage to known disease loci. Combining linkage data between
pedigrees in heterogeneous diseases such as dHMN, is usually ineffective
because each gene is only responsible for a small proportion of cases.
3.1.3.3 Multi-point Linkage analysis
Multi-point linkage analysis combines data from multiple adjacent markers in
a single analysis and as such, is useful for markers with limited informative-
ness. Multi-point linkage analysis is necessary for SNP based linkage analysis
as individually these markers are insufficiently informative. For highly infor-
3 genetic mapping 44
mative microsatellite markers this is less of a concern. A plot of the multi-point
LOD score across genetic distance is useful for visualising linkage or exclusion
across a genetic locus.
3.1.3.4 Haplotype analysis
A haplotype is a series of linked alleles at a chromosomal locus which can
be treated as a single unit of transmission. To identify a haplotype requires
informative markers, from which the phase of the alleles in a chromosomal
segment is determined. The segregation of a haplotype within a pedigree
is useful for visualising recombination events in individuals. The minimum
haplotype segregating with affected individuals in a pedigree defines the
disease interval. Fine mapping involves genotyping additional markers around
recombination sites to minimise the size of the disease interval.
3.1.4 Penetrance in dHMN
The penetrance of a disease allele is the proportion of individuals carrying the
mutation who exhibit clinical symptoms. Distal HMN is generally a highly
penetrant disorder, however there is some variability between different types
of dHMN. Mutations causing dHMN2A [3], dHMN2B [2] and ALS4 [96],
have complete penetrance. Similarly, dHMN5 and CMT2D caused by GARS
mutations showed complete penetrance in the first identified families [126],
however a subsequent dHMN5 family with a GARS mutation showed reduced
penetrance [129]. Distal HMN5 caused by BSCL2 mutations also shows reduced
penetrance in addition to clinical variability [142]. Until the mutation causing
dHMN mapped to 7q34-q36 is identified, the penetrance of dHMN1 in family
CMT54 cannot be confirmed. The possibility of reduced penetrance in dHMN
limits the use of recombination events in unaffected individuals for refining

3 genetic mapping 45
the disease locus, especially where the recombinant chromosome has not been
inherited further by unaffected offspring. Nevertheless, recombinant unaffected
individuals, not at risk of becoming affected, help prioritise candidate gene
selection in mutation screening analysis.
3.1.5 Characterisation of dHMN1 in a large Australian family
Genetic linkage analysis was carried out in a large Australian dHMN family
(CMT54) using microsatellite markers [103]. The disease in this family was
classified as dHMN1, showing autosomal dominant inheritance with 10 af-
fected individuals (Figure 3.1). The disease in this family is slowly progressive,
with an early but variable age of onset (range 3-40 years, median 10 years),
presenting with difficulties walking and running due to lower limb weakness.
Neurological examination identified predominant foot deformities including
pes cavus in all patients, and hammer toes with callus formation in all but
one patent. Increased muscle tone was observed in six patients. Power was
reduced in ankle extensors and intrinsic foot muscles in all but one patient.
Plantar responses were extensor in five patients. Reduced hand-grip in two
patients was the only upper limb weakness demonstrated. The only sensory
abnormalities identified were reduced vibration in the feet of four patients.
Sural nerve biopsy in one patient at age 43 years was consistent with chronic
axonal neuropathy.
3.1.6 Previous genetic studies in dHMN1 at 7q34-q36
A genome-wide two-point linkage analysis in family CMT54 showed signifi-
cant evidence for linkage at D7S636 on 7q36.1 with a LOD score of 3.22. An

Figu
re3.
1:P
revi
ousl
ypu
blis
hed
ped
igre
eof
CM
T54
and
hapl
otyp
ean
alys
isat
7q34
-q36
[103
].Fe
mal
esan
dm
ales
are
repr
esen
ted
byci
rcle
san
dsq
uare
sre
spec
tive
ly.B
lack
ened
sym
bols
indi
cate
affe
cted
indi
vidu
als.
Mar
ker
alle
les
are
liste
dbe
low
indi
vidu
als,
orde
red
from
cent
rom
ere
tote
lom
ere.
Hap
loty
pes
are
ind
icat
edby
bars
,wit
hth
eha
plo
typ
ese
greg
atin
gw
ith
the
dis
ease
blac
kene
d.T
hena
rrow
bar
inin
div
idu
alII
:7in
dica
tes
unin
form
ativ
em
arke
rs.T
here
com
bina
tion
even
tsin
indi
vidu
als
II:1
0an
dII
I:13
defin
eth
edi
seas
ege
neca
ndid
ate
inte
rval
flank
edby
D7S
2513
and
D7S
637.
Rec
ombi
natio
nev
ents
inun
affe
cted
indi
vidu
als
II:7
and
III:3
sugg
esta
min
imum
prob
able
cand
idat
ein
terv
al,fl
anke
dby
D7S
2511
and
D7S
2546
.Ind
ivid
uals
id’s
have
been
upda
ted
tom
atch
thos
ein
Figu
re3.
5.

3 genetic mapping 46

3 genetic mapping 47
Table 3.1: Previous two-point LOD scores between chromosome 7q34-q36 markersand the dHMN1 disease locus in CMT54 [103].
Marker LOD score at recombination fraction0.00 0.01 0.05 0.10 0.20 0.30 0.40
D7S1518 -5.09 0.86 1.36 1.41 1.20 0.70 0.25D7S2513 -0.05 0.04 0.22 0.30 0.30 0.20 0.06D7S2473 2.99 2.94 2.75 2.51 2.00 1.30 0.62D7S661 3.73 3.68 3.43 3.11 2.40 1.70 0.78D7S498 0.58 0.59 0.60 0.57 0.44 0.25 0.08
D7S2511 2.59 2.57 2.47 2.30 1.84 1.26 0.58D7S688 1.67 1.61 1.40 1.12 0.53 -0.05 -0.33
D7S2426 2.69 2.64 2.46 2.21 1.69 1.11 0.49D7S505 3.29 3.23 3.00 2.70 2.03 1.29 0.48D7S636 3.22 3.16 2.95 2.68 2.10 1.40 0.67
D7S2439 1.72 1.70 1.59 1.46 1.16 0.83 0.45D7S3070 3.59 3.53 3.30 2.99 2.32 1.57 0.74D7S483 3.29 3.24 3.03 2.76 2.15 1.46 0.69D7S798 1.76 1.74 1.63 1.49 1.20 0.90 0.46
D7S2462 2.17 2.14 2.00 1.82 1.45 1.02 0.55D7S2546 2.48 2.49 2.45 2.32 1.90 1.30 0.65D7S637 -2.23 0.71 1.31 1.45 1.30 1.00 0.47

3 genetic mapping 48
additional 16 markers flanking D7S636 were analysed in family CMT54, with
four additional markers providing significant evidence of linkage (Table 3.1).
Multi-point linkage analysis using the linked markers achieved a maximum
multi-point LOD score of 3.74 at D7S661. Recombinant haplotype analysis of
affected individuals defined the disease locus as the 21.78 cM interval flanked
by the markers D7S2513 and D7S637. Recombinant haplotype analysis includ-
ing unaffected individuals > 25 years of age suggests a minimum probable
candidate interval spanning 16.7 cM flanked by the markers D7S2511 and
D7S2546. Physical mapping of the flanking markers localised the disease inter-
val to chromosome 7q34-q36 (Figure 3.2). Transcript mapping and mutation
analysis of the 7q34-q36 dHMN1 locus is described in Chapter 4.
Two other dHMN genes and one spinocerebellar ataxia (SCA) gene have
also been mapped to chromosome 7 (Figure 3.2). The gene for dHMN2B,
HSPB1 is located proximal to the dHMN1 locus at 7q11.23 and the gene for
dHMN5, GARS, is located at 7p15.1. The gene for SCA18 (MIM ID %607458), an
autosomal dominant sensorimotor neuropathy with ataxia, has been localised
to 7q22-q32 [207]. A mutation in the interferon-related developmental regulator
1 (IFRD1) gene was identified as the probable pathogenic mutation for SCA18,
however it is yet to be replicated in additional families [208]. Mutations in
these genes and other known dHMN genes have been previously excluded in
CMT54 [209].
3.1.7 Hypothesis and aims
It is hypothesised that dHMN seen in family CMT54 is caused by a gene
mutation within the linked region on chromosome 7q34-q36. The aims of this
chapter are to:

3 genetic mapping 49
Figure 3.2: (Left) Ideogram of human chromosome 7, indicating the known dHMN andother neurodegenerative disease genes and loci mapped to chromosome 7. Horizontalbars indicate the location of disease genes and vertical bars indicate the extent ofeach disease locus. (Right) Physical map of the dHMN1 chromosome 7q34-q36 locus.Original flanking markers are shown in bold. The original 7 Mb minimum probablecandidate interval is flanked by the markers D7S2511 and D7S2546.

3 genetic mapping 50
• refine the minimum probable candidate interval in CMT54 through fine
mapping.
• identify additional dHMN families linked to 7q34-q36 to further refine
the disease interval and confirm the disease locus.
3.2 materials and methods
3.2.1 Microsatellite analysis
Microsatellite markers were PCR amplified from genomic DNA incorporating
a 6-carboxyfluorescein (FAM) label that was present on each forward primer
(Section 2.3.3). Primer details are included in Appendix B. Size separation of
Microsatellite marker alleles was performed using the microsatellite analysis
service from the Australian Cancer Research Foundation (ACRF) at the Garvan
Institute of Medical Research (Darlinghurst, NSW Australia). In brief, FAM
labelled PCR products were analysed using an ABI PRISM® 3100 Genetic
Analyzer (Applied Biosystems Ltd) using a GeneScan™ 600 LIZ size standard
(Applied Biosystems Ltd).
Scoring of microsatellite alleles was performed using the software, Gene-
Marker version 1.51 (SoftGenetics LLC). Allele sets were scored by size to allow
comparison of alleles between families. The software Cyrillic, version 2.1.3
(Cherwell Scientific Publishing Ltd) was used to input and manage pedigrees
and genotype data. Pedigree and marker data were exported from Cyrillic for
linkage analysis using the MLINK format.

3 genetic mapping 51
3.2.2 Microsatellite markers
The microsatellite markers used in fine mapping of the dHMN1 chromosome
7q34-q36 disease locus in family CMT54 were selected from the Marshfield
genetic map through the STS Markers track of the UCSC genome browser
(http://genome.ucsc.edu/)[210], based on their physical location between
candidate genes. When no suitable markers were available, additional new
microsatellite markers were designed by selecting repeat sequences from the
UCSC genome browser microsatellite track. The microsatellite track displays di-
nucleotide and tri-nucleotide repeats, with 100% identity, no indels of at least
15-mer, identified with the software Tandem Repeats Finder [211]. Flanking
PCR primers were designed using the software, LightScanner® Primer Design
version 1.0.R.84 (Idaho Technology Inc.) using DNA sequences from the hg18
(2006) assembly, downloaded using the UCSC genome browser. The Marshfield
STRP map used in genetic linkage analysis was modified to include these
additional markers. The physical position of the microsatellites in the hg18
human assembly was used to correctly order markers in the genetic map. No
genetic distances were available for these new markers, therefore the genetic
distances were approximated by averaging the genetic position of the flanking
markers in the sex-averaged Marshfield STRP map.
3.2.3 Haplotype analysis
Haplotypes were generated from genotype data using parental genotypes to
assign chromosomal phase of alleles where possible. Otherwise, allele phase
was inferred from the haplotypes of offspring and siblings. Recombinant hap-
lotypes were assigned by minimising the number of individuals with the new
recombinant haplotype. Pedigrees were analysed for co-inheritance of haplo-

3 genetic mapping 52
types with disease state. Pedigrees with non-segregation of haplotypes among
affected individuals and pedigrees in which an unaffected spouse carried the
disease associated haplotype were excluded. Families where unaffected at-risk
individuals carried the disease haplotype were not excluded due to possible
non-penetrance in dHMN.
3.2.4 Genetic linkage analysis
The easyLINKAGEplus version 5.02 software package [212] was used for
genetic linkage analysis, including; simulation of two-point LOD scores (Fast-
SLink), two-point linkage analysis (SuperLink), and multi-point linkage analy-
sis (GeneHunter). A modified version of the sex-averaged Marshfield STRP
genetic map including new microsatellite markers, was used in all linkage
analysis (Section 3.2.2). A script pedmake.sh (Appendix A), was written for
GNU Bourne-Again SHell (BAsH), version 4.1.5 (Free Software Foundation,
Inc) to convert the MLINK format files generated by Cyrillic into the pedigree
and marker files required for EasyLINKAGEplus.
3.2.4.1 FastSLink
The software FastSLink, version 2.51 [213, 214] was used for simulation of
maximum LOD scores for dHMN pedigrees. FastSLink parameters were;
dominant inheritance model, using microsatellite markers with six marker
alleles, disease allele frequency of 0.0001, penetrance of wt/mt and mt/mt
genotypes of 0.95, and 1000 replicates.
3.2.4.2 SuperLink
The software SuperLink, version 1.5 was used for two-point parametric linkage
analysis. SuperLink parameters were; single locus analysis type, autosomal-
3 genetic mapping 53
dominant trait with a penetrance vector of 0.95 for wt/mt and mt/mt alleles,
and disease allele frequency of 0.0001.
3.2.4.3 GeneHunter
The software GeneHunter, version 2.1.R5 was used for multi-point linkage
analysis. GeneHunter parameters were; autosomal-dominant trait with a pen-
etrance vector of 0.95 for wt/mt and mt/mt genotypes, no liability classes
applied, and 100 markers per set.
3.2.5 Association analysis
Common haplotypes of three or more alleles were identified by observation.
Each haplotype was treated as a single unit and tested for association with
the disease. The Fisher’s exact test of independence was used to test for
association of haplotypes with dHMN. A 2x2 contingency table was used, with
the first row the dHMN group haplotypes, and the second row the healthy
control group haplotypes. Column 1 counted chromosomes with a common
haplotype and column 2 counted chromosomes with a different haplotype. The
Fishers exact test calculation was carried out using the software, QuickCalcs -
online calculators for scientists (GraphPad Software, Inc, www.graphpad.com/
quickcalcs/index.cfm). Control haplotypes with incomplete matches due to
missing allele information were counted as matching to achieve the highest
stringency. The null hypothesis tested is: The relative proportion of each
haplotype is independent of the disease.

3 genetic mapping 54
3.3 results
3.3.1 Fine mapping of family CMT54
Using fine mapping there was potential to refine the minimum probable candi-
date interval defined by genetic recombination events in unaffected individuals
in pedigree CMT54. Markers were selected to saturate the flanking regions
of the minimum probable candidate interval, with one marker between each
gene located in these areas. This density of markers achieved the maximum
resolution for excluding genes from the minimum probable candidate interval.
3.3.1.1 Minimum probable candidate interval proximal flanking marker
Under the original analysis, haplotypes show a genetic recombination in in-
dividual CMT54-III:3, which defined the proximal flanking marker for the
minimum probable candidate interval as D7S2511.The physical distance be-
tween D7S2511 and the next marker, D7S688 is 2.00 Mb and contains half of the
gene CNTNAP2, the genes CUL1 and EZH2, and the uncharacterised transcript
C7orf33. The additional microsatellite markers D7S615, D7S2442 and D7S2419
were selected in the region between the previous markers D7S2511 and D7S688
(Figure 3.3). All three additional markers were informative in individual III:3.
Haplotype analysis localised the recombination event in individual III:3 to the
1.06 Mb interval between the markers D7S615 and D7S2442. Therefore, the
new proximal flanking marker for the minimum probable candidate interval is
marker D7S615. This excluded a further 0.74 Mb of CNTNAP2, a particularly
large gene occupying just under 1/5 of the critical disease interval.
3.3.1.2 Minimum probable candidate interval distal flanking marker
The genetic recombination in individual CMT54-II:7 (Figure 3.1), defined
the proximal flanking marker for the minimum probable candidate interval
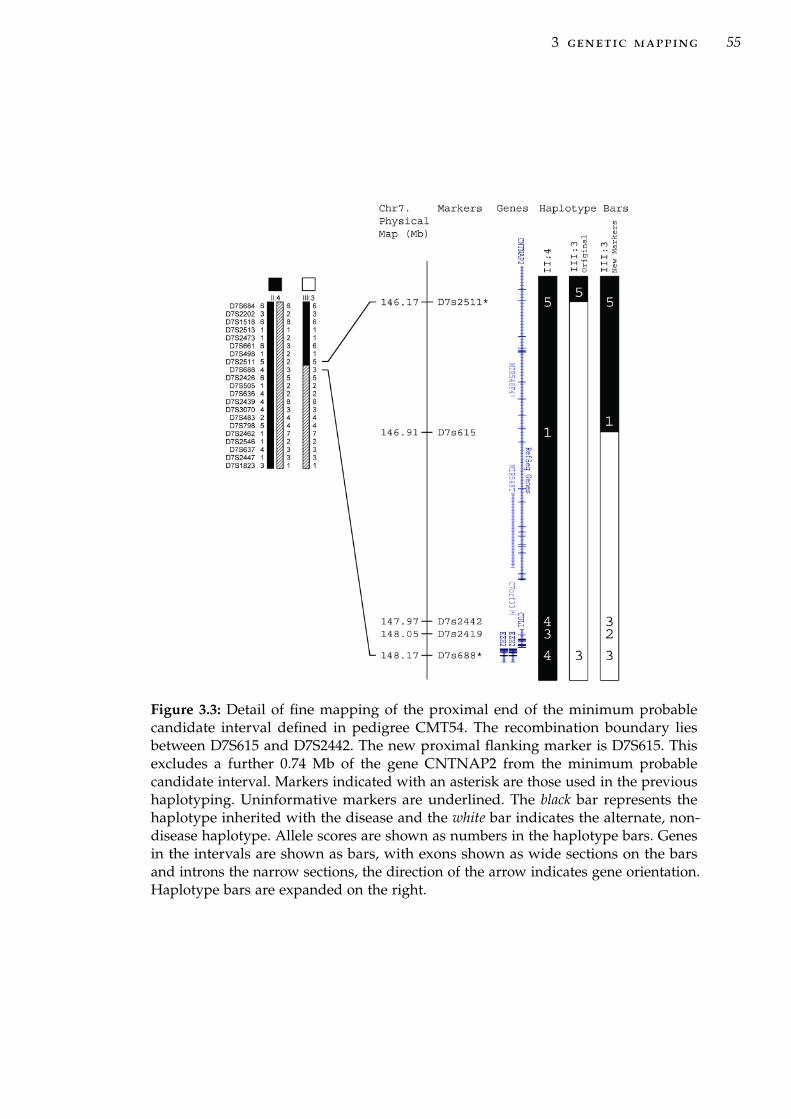
3 genetic mapping 55
Figure 3.3: Detail of fine mapping of the proximal end of the minimum probablecandidate interval defined in pedigree CMT54. The recombination boundary liesbetween D7S615 and D7S2442. The new proximal flanking marker is D7S615. Thisexcludes a further 0.74 Mb of the gene CNTNAP2 from the minimum probablecandidate interval. Markers indicated with an asterisk are those used in the previoushaplotyping. Uninformative markers are underlined. The black bar represents thehaplotype inherited with the disease and the white bar indicates the alternate, non-disease haplotype. Allele scores are shown as numbers in the haplotype bars. Genesin the intervals are shown as bars, with exons shown as wide sections on the barsand introns the narrow sections, the direction of the arrow indicates gene orientation.Haplotype bars are expanded on the right.
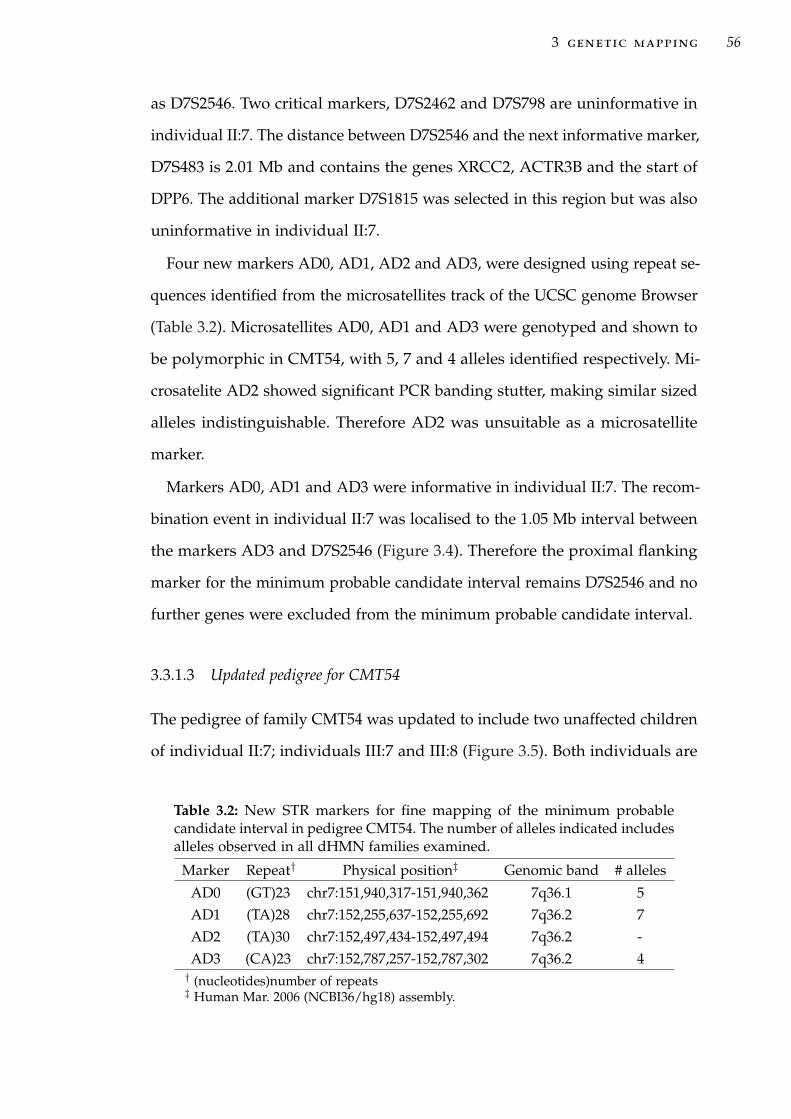
3 genetic mapping 56
as D7S2546. Two critical markers, D7S2462 and D7S798 are uninformative in
individual II:7. The distance between D7S2546 and the next informative marker,
D7S483 is 2.01 Mb and contains the genes XRCC2, ACTR3B and the start of
DPP6. The additional marker D7S1815 was selected in this region but was also
uninformative in individual II:7.
Four new markers AD0, AD1, AD2 and AD3, were designed using repeat se-
quences identified from the microsatellites track of the UCSC genome Browser
(Table 3.2). Microsatellites AD0, AD1 and AD3 were genotyped and shown to
be polymorphic in CMT54, with 5, 7 and 4 alleles identified respectively. Mi-
crosatelite AD2 showed significant PCR banding stutter, making similar sized
alleles indistinguishable. Therefore AD2 was unsuitable as a microsatellite
marker.
Markers AD0, AD1 and AD3 were informative in individual II:7. The recom-
bination event in individual II:7 was localised to the 1.05 Mb interval between
the markers AD3 and D7S2546 (Figure 3.4). Therefore the proximal flanking
marker for the minimum probable candidate interval remains D7S2546 and no
further genes were excluded from the minimum probable candidate interval.
3.3.1.3 Updated pedigree for CMT54
The pedigree of family CMT54 was updated to include two unaffected children
of individual II:7; individuals III:7 and III:8 (Figure 3.5). Both individuals are
Table 3.2: New STR markers for fine mapping of the minimum probablecandidate interval in pedigree CMT54. The number of alleles indicated includesalleles observed in all dHMN families examined.
Marker Repeat† Physical position‡ Genomic band # alleles
AD0 (GT)23 chr7:151,940,317-151,940,362 7q36.1 5AD1 (TA)28 chr7:152,255,637-152,255,692 7q36.2 7AD2 (TA)30 chr7:152,497,434-152,497,494 7q36.2 -AD3 (CA)23 chr7:152,787,257-152,787,302 7q36.2 4† (nucleotides)number of repeats‡ Human Mar. 2006 (NCBI36/hg18) assembly.

3 genetic mapping 57
Figure 3.4: Detail of fine mapping of the distal end of minimum probable candidate in-terval in family CMT54. The recombination boundary lies between AD3 and D7S2546.Markers indicated with an asterisk are those used in the previous haplotyping. Unin-formative markers are underlined. The black bar represents the haplotype inheritedwith the disease and the white bar indicates the alternate, non-disease haplotype.Allele scores are shown as numbers in the haplotype bars. Genes in the intervals areshown as bars, with exons shown as wide sections on the bars and introns the narrowsections, the direction of the arrow indicates gene orientation. Haplotype bars areexpanded on the right.

3 genetic mapping 58
Table 3.3: Pedigree CMT54 two-point LOD scores between the dHMN locus andadditional microsatellite markers on chromosome 7q34-q36. LOD scores for D7s2442,D7s2419 and AD0 reach significance. Markers AD1 and AD3 were not genotypedthrough the entire pedigree, limiting their LOD scores.
Marker LOD score at recombination fraction0.00 0.05 0.10 0.20 0.30 0.40
D7S615 2.0383 1.8863 1.7262 1.3782 0.9848 0.5323D7S2442 3.1630 2.9259 2.6765 2.1347 1.5235 0.8223D7S2419 3.7168 3.3267 2.9174 2.0417 1.1145 0.2948
AD0 4.9420 4.5508 4.1388 3.2432 2.2324 1.0944D7S1815 0.0000 0.0000 0.0000 0.0000 0.0000 0.0000
AD1 0.5961 0.5316 0.4664 0.3360 0.2105 0.0967AD3 0.8971 0.8087 0.7160 0.5191 0.3150 0.1285
recombinant, with neither inheriting the disease haplotype from individual II:7.
Therefore, these two individuals do not reduce the possibility of incomplete
penetrance in individual II:7.
3.3.2 Linkage analysis using new markers in CMT54
3.3.2.1 Two-point linkage analysis
Two-point LOD scores were calculated for the new markers in pedigree CMT54
(Table 3.3). Significant linkage was achieved for the markers D7S2442, D7S2419
and AD0 with LOD scores of 3.16, 3.71 and 4.94 at θ=0.00 respectively. The
LOD score for the marker D7S615 did not reach a significant LOD score due to
limited heterozygosity. The marker D7S1815 was uninformative in all meiosis
in family CMT54, with only one allele observed. The markers AD1 and AD3
were only genotyped in a subset of individuals in family CMT54 limiting their
LOD scores which are not representative of the power of these markers.

Figu
re3.
5:U
pdat
edpe
dig
ree
offa
mily
CM
T54
,sho
win
gha
plot
ypes
for
sele
cted
mar
kers
onch
rom
osom
e7q
34-q
36.F
emal
esan
dm
ales
are
rep
rese
nted
byci
rcle
san
dsq
uare
sre
spec
tive
ly.B
lack
ened
sym
bols
ind
icat
eaf
fect
edin
div
idu
als.
Mar
ker
alle
les
are
liste
dbe
low
ind
ivid
ual
s,or
der
edfr
omce
ntro
mer
eto
telo
mer
e.H
aplo
typ
esar
ein
dic
ated
byba
rs,
wit
hth
eha
plo
typ
ese
greg
atin
gw
ith
the
dis
ease
blac
kene
d.T
here
com
bina
tion
even
tsin
indi
vidu
als
II:1
0an
dII
I:13
defin
eth
edi
seas
ege
neca
ndid
ate
inte
rval
flank
edby
D7S
2513
and
D7S
637.
Rec
ombi
natio
nev
ents
inun
affe
cted
indi
vidu
als
II:7
and
III:3
sugg
est
am
inim
umpr
obab
leca
ndid
ate
inte
rval
,flan
ked
byD
7S61
5an
dD
7S25
46.

3 genetic mapping 59
3 genetic mapping 60
3.3.2.2 Multi-point linkage analysis in CMT54
Multi-point linkage analysis in CMT54 achieved a maximum LOD score of
3.5 in the interval between D7S2442 and D7S2462 corresponding with the
minimum probable candidate interval (Figure 3.6).
3.3.2.3 The minimum probable candidate interval in CMT54
Fine mapping in family CMT54 using haplotype and linkage analysis has
refined the minimum probable candidate interval by 0.74 Mb, to the 6.92
Mb interval flanked by D7S615 and D7S2546. This excluded region is located
within the CNTNAP2 gene which encompasses almost 1.5% of chromosome
7. CNTNAP2 spans the recombination in unaffected individual II:7, which
defines the proximal end of the minimum probable candidate interval.
3.3.3 Identification of additional dHMN families
Further refinement of the 7q34-q36 interval may also be achieved by identifying
additional dHMN families linked to 7q34-q36 and the analysis of recombinant
individuals within these families. An analysis of the 7q34-q36 disease locus
was carried out in a cohort of additional dHMN families to help refine the
locus. Families from the Molecular Medicine (Concord Hospital) peripheral
neuropathies database, indexed as dHMN, distal SMA or CMT2 with mild or
no sensory involvement were evaluated. Families were selected if the famil-
ial disease was inherited in an autosomal-dominant fashion, with unknown
genetic cause, and symptoms were similar to those shown by CMT54.
Fifty-eight additional dHMN families were identified from the database
with clinical features consistent with dHMN or CMT2 with no or minor
sensory involvement. Twenty of these families had sufficient DNA samples
available to enable haplotypes to be generated and were selected for genetic

3 genetic mapping 61
Multi-po
intL
OD
score
D7S684
D7S2202
D7S1518
D7S2513
D7S2473
D7S661
D7S2511
D7S615
D7S2442
D7S2426
D7S505
D7S636
D7S2439
D7S3070
D7S483
AD0
D7S1815
AD1
D7S798
AD3
D7S2462
D7S2546
D7S637
D7S2447
D7S1823
-4.0
-3.0
-2.0
-1.0
0.0
1.0
2.0
3.0
4.0
D7S2419
D7S688
D7S498
0 5 10 15 20 25
Genetic distance (cM)Figure 3.6: Multi-point LOD score plot for family CMT54, including the new markersfor fine mapping the minimum probable candidate interval.

3 genetic mapping 62
linkage analysis (Table 3.4). The remaining families had only one affected
DNA sample available or were otherwise unsuitable for linkage and haplotype
analysis and were indexed for future screening of any new dHMN gene.
Selected families were previously screened for mutations in known autosomal-
dominant dHMN genes; HSPB1, HSPB8, BSCL2, DCTN1, TRPV4, and SETX
(O.Albulym, personal communication). Families indicated as possible dHMN5
were screened for mutations in GARS, and YARS (A.Antonellis, personal
communication).
3.3.4 Linkage power analysis
The power of each family to detect linkage was determined using FastSLink as
part of the easy linkage software package. The theoretical LOD scores obtained
from simulated linkage analysis were comparable to the size of the families
(Table 3.5). No pedigrees reached a maximum simulated LOD score of greater
than 3.0, required for significant linkage. Pedigree CMT44 achieved the highest
simulated maximum LOD score of 2.02, sufficient for suggestive linkage. Pedi-
grees CMT260, CMT701, CMT375 and CMT618 achieved simulated maximum
LOD scores of > 1.5. The remaining pedigrees are small nuclear families. While
not powerful enough to achieve significant linkage on their own, these pedi-
grees may be informative if ancestral links between families can be identified.
Simulated negative LOD scores give an estimation of the exclusion power
of a pedigree. Two families CMT331 and CMT779 achieved simulated LOD
scores that reach significance for exclusion at θ = 0.00 (Table 3.5). At θ = 0.05,
CMT331 and CMT779 achieved simulated negative LOD scores of -1.05 and
-2.00 respectively. As dHMN is genetically heterogeneous, it is unlikely that
all these families share mutations in a common gene. Therefore, the combined

3 genetic mapping 63
Table 3.4: Sample and clinical information of the 20 additional dHMN families selectedfor genetic linkage analysis.
Family # Affectedsamples1
# Unaffectedsamples2,3
Condition Complicating features4
CMT44 5 7 dHMN2CMT102 3 1 dHMNCMT131 3 1 dMHNCMT260 4 (1) 3 dHMN or
CMTVCMT273 3 0 dHMNCMT274 3 1 dHMN or
CMTVCMT331 4 0 dHMN variable minor/mild
symptomsCMT333 3 1 dHMNCMT375 4 4 dHMNCMT477 2 3 dHMNCMT484 3 1 dHMN or
CMTVCMT609 4 4 (1) dHMN or
CMTVminor/mild sensory and
pyramidal signsCMT618 4 3 dHMN or
CMTVNS
CMT677 2 4 dHMN vocal cord paralysisCMT701 6 1 dHMN pyramidal signs + GOR
coughCMT703 3 0 dHMN5CMT724 4 4 CMT2D minor/mild sensoryCMT748 3 3 (1) dHMN pyramidal signsCMT779 3 (1) dHMNCMT808 3 3 dHMN pyramidal signs1 Carriers with affected children are indicated in ( ) in the affected samples column.2 Individuals with unknown clinical status are indicated in ( ) in the normal samples column.3 Number of normal samples includes married in parents.4 NS indicates normal sensory function in CMT families, GOR cough indicates gastro-
oesophageal reflux and chronic cough.

3 genetic mapping 64
Table 3.5: Simulated two-point LOD scores for additional dHMN families at θ = 0.00
Pedigree Average StdDev Min MaxCMT44 1.413277 0.672809 -1.880637 2.022451
CMT260 1.227786 0.616653 -1.079144 1.861581CMT701 1.108423 0.453187 -0.339436 1.747461CMT375 1.169244 0.619372 -1.793023 1.721420CMT618 1.351277 0.417707 0.079144 1.630130CMT724 0.917044 0.602872 -1.160476 1.441581CMT609 0.827045 0.341491 -0.719797 1.183100CMT331 0.617530 0.407886 -2.082981 1.181784CMT477 0.214345 0.384159 -1.027830 0.713644CMT779 0.376384 0.305761 -4.951016 0.602058CMT748 0.408205 0.325215 -1.021184 0.580868CMT808 0.412215 0.322585 -1.021187 0.580868CMT274 0.378580 0.328142 -1.021107 0.580862CMT677 0.192213 0.303921 -0.866278 0.442662CMT484 0.241424 0.119957 -0.000000 0.301028CMT703 0.197789 0.176466 -0.602437 0.301028CMT273 0.180616 0.147473 -0.000261 0.301028CMT131 0.183623 0.146825 -0.000261 0.301023CMT333 0.193699 0.076322 -0.124957 0.234141CMT102 0.223685 0.022229 0.176054 0.234128

3 genetic mapping 65
linkage power of this set of families was not calculated and families were
instead analysed for linkage/exclusion independently.
3.3.5 Genetic linkage analysis in additional dHMN families
Tests for a common founding mutation(s) were carried out in the 20 additional
dHMN families large enough for haplotype analysis. Family members were
genotyped for microsatellite markers at 7q34-q36. Haplotype analysis, two-
and multi-point linkage analysis was carried out on each family separately.
Nine families showed a haplotype segregating with affected individuals only.
Of these nine families, one achieved LOD scores suggestive of linkage to
7q34-q36 and eight families were uninformative. Ten families were excluded
from linkage to 7q34-q36 and in one family the marker phase could not
be determined. These results are detailed in Section 3.3.6, Section 3.3.7 and
Section 3.3.8.
3.3.6 Suggestive linkage in family CMT44
Family CMT44 is a multi-generational dHMN family with samples available
from five affected individuals across three generations (Figure 3.7). Genotypes
for markers across the 7q34-q36 interval were analysed in CMT44 using hap-
lotype analysis, two-point and multi-point linkage analysis. CMT44 has a
haplotype at 7q34-q36 which segregates with the five affected individuals and
one recombinant unaffected individual who carries the proximal end of the
disease haplotype. This haplotype is not present in three additional unaffected
individuals. One affected individual (III:7) shows a recombination event with
an alternate haplotype for markers at the distal end of the disease interval.
This recombination defines D7S637 as the distal flanking marker for CMT44.

3 genetic mapping 66
The proximal end of the disease interval lies beyond the most proximal marker
analysed in CMT44 (D7S1518), this is beyond the proximal limits of the dis-
ease interval defined by CMT54. However, the recombination event in the
unaffected individual III:6 suggests the probable proximal flanking marker
is D7S498. These two recombination events do not further refine the disease
interval beyond family CMT54; the marker D7S637 is the flanking marker
previously defined in family CMT54, and D7S498 lies beyond the minimum
probable candidate interval.
Family CMT44 achieved a two-point LOD score of 2.02 at D7S2511, D7S688,
D73070 and D7S483 (Table 3.6). The distal end of the disease interval is ex-
cluded with significantly negative LOD scores at D7S637 and D7S2447 due
to the recombination event in affected individual II:7. Multi-point linkage
analysis achieved a maximum LOD score of 2.02 across the interval between
D7S2511 and D7S2462 (Figure 3.8). This reaches the maximum possible power
for this pedigree at this locus and indicates the lower two-point LOD scores
within this interval are due to lower marker informativeness. These results
support suggestive linkage to chromosome 7q34-q36 in pedigree CMT44, with
the results reaching the limit of power in this pedigree.
3.3.7 Uninformative families
Analysis of genotypes for markers across the 7q34-q36 interval using hap-
lotype analysis, two-point and multi-point linkage analysis, indicated fami-
lies CMT609, CMT274, CMT677, CMT484, CMT703, CMT131, CMT333, and
CMT273 were uninformative at this locus. These families were not excluded
from the 7q34-q36 locus. The pedigrees, two-point LOD scores and multi-point
LOD plots for these families are included in Appendix C, Appendix D and
Appendix E respectively.

3 genetic mapping 67
Figure 3.7: Haplotype analysis of markers from the dHMN locus at 7q34-q36 in familyCMT44. Females and males are represented by circles and squares respectively. Blackenedsymbols indicate affected individuals. Marker alleles are listed below individuals,ordered from centromere to telomere. Haplotypes are indicated by bars, with the hap-lotype segregating with the disease blackened. A recombination in affected individualIII:7 defines D7S637 as the distal flanking marker in CMT44. The recombination inunaffected individual III:6 suggests the proximal flanking marker is D7S498.

3 genetic mapping 68
Table 3.6: Pedigree CMT44 two-point LOD scores between the dHMN locus andmicrosatellite markers on chromosome 7q34-q36. The maximum LOD score achievedis 2.0225 at the markers D7s2511, D7s688, D7s3070 and D7s483. These scores reach themaximum simulated LOD score of this pedigree.
Marker lod score at recombination fraction0.00 0.05 0.10 0.20 0.30 0.40
D7S1518 1.1405 1.0549 0.9647 0.7691 0.5486 0.2959D7S661 1.1405 0.9885 0.8304 0.5070 0.2184 0.0439D7S498 0.7214 0.8596 0.8744 0.7628 0.5583 0.3002
D7S2511 2.0225 1.8488 1.6661 1.2708 0.8358 0.3858D7S615 0.0000 0.0000 0.0000 0.0000 0.0000 0.0000
D7S2442 1.1406 1.0549 0.9647 0.7691 0.5486 0.2959D7S2419 0.3010 0.2577 0.2148 0.1335 0.0645 0.0170D7S688 2.0225 1.8488 1.6661 1.2708 0.8358 0.3858
D7S2439 1.1405 1.0549 0.9647 0.7691 0.5486 0.2959D7S3070 2.0225 1.8488 1.6661 1.2708 0.8358 0.3858D7S483 2.0225 1.8488 1.6661 1.2708 0.8358 0.3858
AD0AD0 0.5597 0.5174 0.4730 0.3766 0.2683 0.1445D7S1815 1.1405 1.0549 0.9647 0.7691 0.5486 0.2959AD3AD3 1.1405 1.0549 0.9647 0.7691 0.5486 0.2959D7S2462 0.8819 0.7939 0.7014 0.5017 0.2872 0.0899D7S637 -4.8289 0.5724 0.7194 0.6977 0.5316 0.2936
D7S2447 -5.4186 -0.4825 -0.2453 -0.0714 -0.0170 -0.0023

3 genetic mapping 69
Mu
lti-
po
int
LO
D s
core
Genetic distance (cM)
D7S1518
D7S661
D7S498
D7S2442
D7S2439
D7S3070 D
7S483A
D0
D7S1815
AD
3D
7S2462
D7S637
D7S2447
-5.0
-4.0
-3.0
-2.0
-1.0
0.0
1.0
2.0
3.0
D7S2511 D
7S615
D7S2419 D
7S688
5 10 15 20 250
Figure 3.8: Multi-point LOD plot for family CMT44. The LOD score between themarkers D7s2511 and D7s2462 reaches the maximum simulated two point LOD scoreof 2.02.

3 genetic mapping 70
3.3.7.1 CMT609
CMT609 is a multi-generational extended family, initially diagnosed as per-
oneal muscular atrophy with pyramidal features, with minor sensory involve-
ment [215]. The age of onset of dHMN in this family is lower than CMT54, with
individual IV:2 clinically affected when examined at age six. CMT609 shows a
haplotype segregating with four affected individuals across three generations
(Figure C.3). A genetic recombination event has occurred within the 7q34-q36
interval, however due to missing DNA this recombination could be assigned
to either individual II:2, II:4 or III:3. The recombinant haplotype has been
drawn as occurring in individual III:3 for simplicity (Figure C.3), however both
possible family founder haplotypes are considered in haplotype comparisons
(Section 3.3.9). Nevertheless, this recombination event excludes the interval
centromeric of D7S2462 with significantly negative LOD scores of < -3 at θ
= 0.00 (Table D.2 and Figure E.1). The remaining interval is uninformative
achieving a maximum two-point LOD score of 0.72 at θ = 0.00 for D7S2462. The
power of this family has potential to be increased as unaffected individual IV:3
also carries the disease haplotype. However this at-risk individual was aged
only three when clinically examined and therefore of unknown phenotype and
not included in linkage analysis. The recombination event in CMT609 would
refine the critical disease interval if this family were linked to 7q34-q36.
3.3.7.2 CMT274
CMT274 is a nuclear family including one affected parent with two affected
and one unaffected children. This pedigree has a haplotype spanning 7q34-
q36 which segregates with all three affected family members and not the
unaffected child, with no recombination events observed (Figure C.2). This
pedigree achieved a maximum two-point LOD score of 0.58 at θ = 0.00 for 5
markers across the 7q34-q36 interval (Table D.1). The multi-point LOD scores

3 genetic mapping 71
were similar, between 0.5 and 0.6 across the 7q34-q36 interval (Figure E.2).
These LOD scores reach the maximum power for this pedigree.
3.3.7.3 CMT677
CMT677 is a three-generation extended family. Generation II includes an
affected sibling pair and generation III includes three unaffected siblings and
one affected cousin. DNA samples were unavailable for generation I, the
affected parent II:2 and unaffected child III:3 (Figure C.4). The haplotype
for affected individual II:2 was partly inferred using the haplotypes of the
available family members. This pedigree has a haplotype spanning the 7q34-
q36 interval which segregates with the three affected individuals and not
unaffected individual III:2. Unaffected individual III:1 is recombinant and
carries the telomeric end of the chr.7q34-q36 interval. This recombination event
suggests the distal flanking marker is D7S3070 in CMT677. However, being in
an unaffected individual, without 100% penetrance this recombination does
not produce significantly negative LOD scores in the region affected. The
two-point and multi-point LOD scores were uninformative across the 7q34-q36
interval (LOD < 0.5; Table D.5 and Figure E.3). The multi-point LOD scores
achieved the maximum power for this pedigree in the interval not affected by
the recombination event.
3.3.7.4 CMT484
CMT484 is a nuclear family with one affected parent, two affected and one un-
affected offspring. The affected parent has a further family history of dHMN,
with another possibly affected family member not included in this study
(Figure C.1). No DNA was available for the unaffected individual III:2. The
pedigree for CMT484 shows a haplotype spanning the 7q34-q36 interval segre-
gating with the three affected individuals with no recombinations observed.
The affected siblings have alternate haplotypes from the unaffected parent

3 genetic mapping 72
confirming the correct assignment of the disease haplotype. Linkage analysis
was uninformative across 7q34-q36 with a maximum LOD score of 0.30 at θ
= 0.00 achieved at 9 markers (Table D.4). The multi-point LOD scores were
0.30 across the 7q34-q36 interval (Figure E.4). These LOD scores reach the
maximum power for this pedigree.
3.3.7.5 CMT703
CMT703 is a nuclear family with one affected parent, with two affected and
two unaffected children. The affected parent has a family history of dHMN.
DNA was not available from the two unaffected siblings III:3 and III:4 (Fig-
ure C.5). The pedigree for CMT703 has a haplotype spanning 7q34-q36 which
segregates with all three affected family members, however one affected child
has a recombination event between the markers D7S2511 and D7S2442. This
recombination event can be assigned to either III:1 or III:2, therefore there are
two possible parental haplotypes for CMT703. Haplotype analysis indicates
the distal flanking marker is D7S2442, excluding the distal end of the 7q34-q36
interval. Due to limited marker informativeness in the region affected by the
recombination event, linkage analysis only achieved a significant negative
two-point LOD score of -4.40 at θ = 0.00 for D7S3070 (Table D.6 and Figure E.5).
Two-point and multi-point LOD score were uninformative in the region not
excluded by the recombination event, reaching a maximum of 0.30 at θ = 0.00.
This reaches the maximum power for this pedigree. The genetic recombina-
tion in CMT703 would refine the disease interval if the family was expanded
sufficiently to achieve significant linkage.
3.3.7.6 CMT131
CMT131 is a three-generation family with four affected individuals (Figure C.6).
DNA was available for one affected individual in each generation. The family
founder has three unaffected siblings and no prior family history of dHMN.

3 genetic mapping 73
The pedigree for CMT131 has a haplotype shared by all three affected individ-
uals. Affected individual IV:1 shows a recombination event, carrying only the
proximal end of the disease haplotype. Haplotype analysis defined D7S3070 as
the proximal flanking marker in CMT131. Significant negative LOD scores ex-
clude the proximal end of the 7q34-q36 interval (Table D.7 and Figure E.6). The
remaining interval was uninformative in two-point and multi-point linkage
analysis, achieving a LOD score of 0.30, the maximum power for this pedigree.
The genetic recombination in CMT131 would refine the disease interval if the
family was expanded sufficiently to achieve significant linkage.
3.3.7.7 CMT333
CMT333 is a three-generation family with two affected and one unaffected sib-
lings in generation II and one affected individual in generation III (Figure C.8).
No disease was indicated in generation I, however they were not clinically
examined. DNA was unavailable for the unaffected sibling II:3 or from genera-
tion I. A haplotype at the 7q34-q36 interval segregates with all three affected
individuals, with no recombination events. Two-point and multi-point LOD
scores were uninformative across the interval, with multi-point LOD scores
reaching the maximum power for this pedigree (Table D.3 and Figure E.7).
3.3.7.8 CMT273
CMT273 is a four-generation family with one affected individual in each
generation. No DNA was available for the affected individual in generation I
or the four unaffected family members. A haplotype across 7q34-q36 segregates
with the affected individuals in generation II and III (Figure C.7). Affected
individual IV:1. carries the alternate haplotype which may exclude this interval.
However, in individual IV:1, the marker phase cannot be determined for
7 markers at the proximal end of the 7q34-q36 interval (D7S1518, D7S661,
D7S498, D7S2511, D7S615, D7S2442 and D7S2419) and two markers on the

3 genetic mapping 74
distal end of the interval (D7S637 and D7S2447). There is the possibility of
a recombination event within either of these regions. Two-point and multi-
point LOD scores reached -4.94 at θ = 0.00 for informative markers, significant
for exclusion. However, this family is insufficiently powerful to exclude the
flanking regions of uninformative markers, with two-point and multi-point
LOD scores uninformative at θ > 0.00 (Table D.8 and Figure E.8). Additional
markers are required to clarify if CMT273 is excluded from 7q34-q36 or if there
has been a genetic recombination in individual IV:1.
3.3.8 dHMN families excluded from 7q34-q36
Analysis of genotypes for markers across the 7q34-q36 interval using hap-
lotype analysis, two-point and multi-point linkage analysis, indicated fami-
lies CMT701, CMT260, CMT618, CMT477, CMT748, CMT779, CMT331 and
CMT808 were excluded from this interval. These families do not have a haplo-
type segregating with affected individuals and achieved significant negative
LOD scores for informative markers across the disease interval. Initial linkage
analysis using two markers in CMT375 and CMT102 identified non-segregation
of haplotypes and negative two-point LOD scores sufficient to exclude linkage.
The pedigrees, two-point LOD scores and multi-point LOD plots for these
families are included in Appendix C, Appendix D and Appendix E respectively.
CMT724 is an extended family which has a mild and variable dHMN phe-
notype with no sensory involvement. As this phenotype is mild, reduced
penetrance is more likely in this pedigree. All four affected individuals share a
haplotype for the 7q34-q36 locus (Figure C.18). Affected individual III:5 has
a recombination event, excluding the region distal to the marker D7S2439.
Two unaffected individuals also carry the disease haplotype. Due to the re-
combination event in individual III:5, markers distal to this location generate

3 genetic mapping 75
significantly negative two-point and multi-point LOD scores (Table D.14 and
Figure E.12). The LOD scores in the remaining interval are uninformative, how-
ever the occurrence of the disease haplotype in multiple unaffected individuals
suggests CMT724 is not linked to 7q34-q36.
The two largest families ascertained, CMT260 and CMT701 are good candi-
dates for further genetic analysis. Future clinical evaluation of at-risk individu-
als may identify newly affected individuals. This has the potential to increase
the linkage power in these families to a significant level in a genome wide
analysis.
3.3.9 Haplotype association analysis
The haplotypes of the eight additional dHMN families that were not excluded
were compared with CMT54 to identify any shared alleles (Table 3.7). The
minimal possible haplotypes defined by recombination events in affected indi-
viduals were considered for families CMT44, CMT131, CMT609 and CMT703.
Six haplotype blocks of three or more alleles common between CMT54 and
at least one additional family were identified (Table 3.8). CMT54 and CMT44
have two separate allele groups shared; haplotype A (1-4-3) for the mark-
ers D7S615, D7S2442, and D7S2419; and haplotype B (4-4-1) for the markers
D7S2439, D7S3070 and D7S483. CMT333 and CMT54 share six alleles; haplo-
type C (6-1-4-3-4-4) for markers D7S2511, D7S615, D7S2442, D7S2419, D7S688
and D7S2439. CMT54 and CMT484 share five alleles; haplotype D (7-1-6-1-
4) for markers D7S661, D7S498, D7S2511, D7S615 and D7S2442. CMT703,
CMT484 and CMT54 share three alleles; haplotype E (1-6-1) for markers
D7S161, D7S2511 and D7S615. Families CMT54, CMT333 and CMT484 share
three alleles in overlapping haplotype F (6-1-4), for markers D7S2511, D7S615
and D7S2442.

3 genetic mapping 76
Haplotypes for 56 healthy control chromosomes for markers across the 7q34-
q36 interval were determined by genotyping unaffected spouses in dHMN
families (Appendix F). The six haplotypes were tested for association with
the disease using a two tailed Fisher’s exact test of independence. The two
groups defined for this test were: the dHMN group, consisting of nine dHMN
families, including CMT54 and the additional dHMN families not excluded
from the 7q34-q36 locus and the normal control group, consisting of the 56
healthy control chromosomes from unaffected spouses. Statistically significant
evidence of association was demonstrated for four haplotypes: B (p = 0.0173),
C (p = 0.0173), D (p = 0.0481) and F (p = 0.0099) (Table 3.9). Haplotypes A (p =
0.1010) and E (p = 0.0735) did not reach significance, found in 6 and 5 of 56
control haplotypes respectively.
These results suggest the shared haplotypes B, C, D and F may be derived
from a common ancestor. However, the region covered by haplotype B is
mutually exclusive from haplotypes C, D and F. A larger haplotype of seven
markers spanning A and B in CMT44 is identical to CMT54 with the exception
of the allele for D7S688.
3.4 discussion
3.4.1 Linkage analysis in CMT54
Linkage analysis in family CMT54 refined the minimum probable candidate
interval by 0.74 Mb to the 6.92 Mb interval flanked by D7S615 and D7S2546.
This excluded region was within the CNTNAP2 gene which spans the recombi-
nation in unaffected individual II:7 defining the proximal end of the minimum
probable candidate interval. The critical disease interval based on affected
individuals alone is the 12.98 Mb interval flanked by D7S2513 and D7S637.
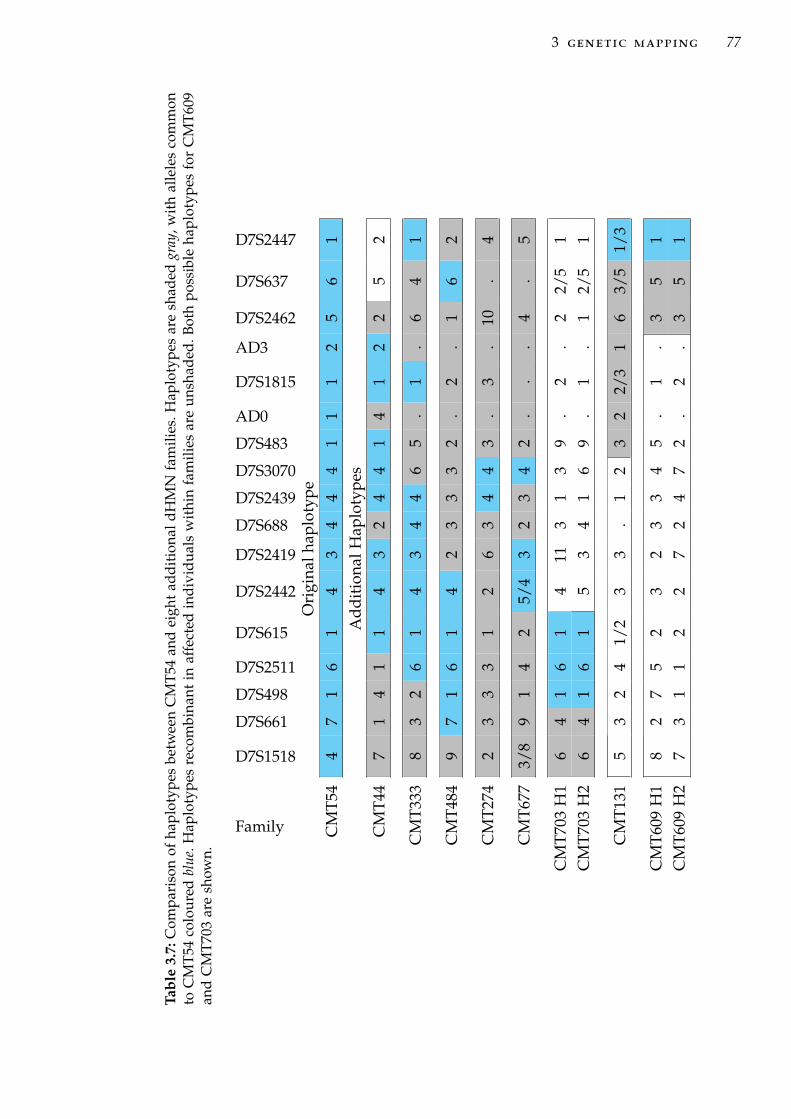
3 genetic mapping 77
Tabl
e3.
7:C
ompa
riso
nof
hapl
otyp
esbe
twee
nC
MT5
4an
dei
ght
addi
tiona
ldH
MN
fam
ilies
.Hap
loty
pes
are
shad
edgr
ay,w
ithal
lele
sco
mm
onto
CM
T54
colo
ured
blue
.Hap
loty
pes
reco
mbi
nant
inaf
fect
edin
divi
dual
sw
ithi
nfa
mili
esar
eun
shad
ed.B
oth
poss
ible
hapl
otyp
esfo
rC
MT6
09an
dC
MT
703
are
show
n.
Family
D7S1518
D7S661
D7S498
D7S2511
D7S615
D7S2442
D7S2419
D7S688
D7S2439
D7S3070
D7S483
AD0
D7S1815
AD3
D7S2462
D7S637
D7S2447
Ori
gina
lhap
loty
peC
MT5
44
71
61
43
44
41
11
25
61
Add
itio
nalH
aplo
type
sC
MT4
47
14
11
43
24
41
41
22
52
CM
T333
83
26
14
34
46
5.
1.
64
1
CM
T484
97
16
14
23
33
2.
2.
16
2
CM
T274
23
33
12
63
44
3.
3.
10.
4
CM
T677
3/8
91
42
5/4
32
34
2.
..
4.
5
CM
T703
H1
64
16
14
113
13
9.
2.
22/
51
CM
T703
H2
64
16
15
34
16
9.
1.
12/
51
CM
T131
53
24
1/2
33
.1
23
22/
31
63/
51/
3
CM
T609
H1
82
75
23
23
34
5.
1.
35
1C
MT6
09H
27
31
12
27
24
72
.2
.3
51

3 genetic mapping 78
Tabl
e3.
8:H
aplo
type
sus
edin
asso
ciat
ion
anal
ysis
are
boxe
d.Th
esi
xha
plot
ype
bloc
kste
sted
are
labe
lled
Ato
F.Ea
chfa
mily
ishi
ghlig
hted
aun
ique
colo
r.H
aplo
type
sex
clud
edby
reco
mbi
nati
onin
affe
cted
indi
vidu
als
are
shad
edgr
ay.
Haplotype
Family
D7S1518
D7S661
D7S498
D7S2511
D7S615
D7S2442
D7S2419
D7S688
D7S2439
D7S3070
D7S483
AD0
D7S1815
AD3
D7S2462
D7S637
D7S2447
# alleles
Ori
gina
lhap
loty
peC
MT
544
71
61
43
44
41
11
25
61
Add
itio
nalH
aplo
type
sC
MT
447
14
11
43
24
41
41
22
52
AC
MT
333
83
26
14
34
46
5.
1.
64
13
BC
MT
447
14
11
43
24
41
41
22
52
3
CC
MT
333
83
26
14
34
46
5.
1.
64
16
DC
MT
484
97
16
14
23
33
2.
2.
16
25
CM
T70
36
41
61
53
41
69
.1
.1
2/5
1E
CM
T48
49
71
61
42
33
32
.2
.1
62
3
CM
T33
38
32
61
43
44
65
.1
.6
41
FC
MT
484
97
16
14
23
33
2.
2.
16
2
3

3 genetic mapping 79
Table 3.9: Association analysis of haplotypes with dHMN using Fisher’s exact test ofindependence. Significance scores (p value) are shown for each haplotype identified inTable 3.8. In total, 9 haplotypes were counted in the dHMN group and 56 haplotypesin the healthy control group.
Haplotype block Freq. dHMN Freq. controls SignificanceA 3 6 0.1010B 2 0 0.0173C 2 0 0.0173D 2 1 0.0481E 3 5 0.0735F 3 4 0.0496
Because of reduced disease penetrance in dHMN, recombination events in
unaffected family members cannot be used to conclusively exclude regions.
The updated pedigree for CMT54 includes two additional unaffected children
of the unaffected individual used to define the proximal flanking marker for
the minimum probable candidate interval. Neither of these individuals carry
the recombinant haplotype and therefore it is not possible to discount the
possibility of non-penetrance in individual II:7. An accurate determination
of disease penetrance in CMT54 requires the identification of the pathogenic
7q34-q36 gene mutation.
3.4.2 Linkage analysis in the extended dHMN cohort
Linkage analysis in the larger dHMN cohort of 20 families identified suggestive
linkage to 7q34-q36 in family CMT44. CMT44 achieved a two-point LOD score
of 2.02 which reaches the maximum power for this pedigree. This strongly
supports the linkage of family CMT44 to the same locus as CMT54. Seven
additional families also had a haplotype segregating with affected individuals,
however they were uninformative in linkage analysis.

3 genetic mapping 80
The recombination event in the affected individual in CMT44 defines the
distal flanking marker in this family as D7S637, with a recombination in
an unaffected family member suggesting the proximal flanking marker is
D7S498. This interval does not refine the interval defined in CMT54, with
marker D7S637 previously defined as the distal flanking marker in CMT54 and
D7S498 beyond the proximal flanking marker defining the minimum probable
candidate interval in CMT54.
Association analysis of 7q34-q36 haplotypes from dHMN families was per-
formed in an attempt to determine the most likely location of the disease gene
and to establish whether a founding mutation was evident among families
with evidence of linkage to 7q34-q36. Haplotypes from four families showed
significant association with the disease compared to a healthy control cohort
using the Fisher’s two tailed test of independence. This association suggests
the haplotype shared by dHMN families is a result of a common disease
allele within an ancestral haplotype [216]. An association between unlinked
families cannot be used as evidence for linkage in these smaller families. To
identify with certainty families that have a haplotype that is IBD requires
a known pedigree linking the two families. Founder effects have previously
been identified in peripheral neuropathies. [217] identified a founder effect
in hereditary sensory neuropathy type I, with six families of English descent
sharing the p.T399G SPTLC1 mutation and associated surrounding haplotype
on chromosome 9. Similarly, a founder effect was demonstrated in a Gipsy
population with CMT type 4C for the SH3TC2 p.R1109X mutation and associ-
ated surrounding haplotype on chromosome 5q23-q33 [218]. A founder effect
was described in a Dutch population with CMT4C at the 5q23-q33 locus which
helped narrow the disease interval prior to identification of SH3TC2 as the
disease gene [219, 220]. A similar founder effect was identified in CMTX3 [221],
where the disease gene is yet to be elucidated.

3 genetic mapping 81
Families CMT54, CMT44, CMT333 and CMT484 have 7q34-q36 haplotypes
that are significantly associated with dHMN. However the haplotype shared
by CMT44 and CMT54 spans an interval mutually exclusive to the haplotype
shared by CMT54, CMT333 and CMT484. A founder effect is not possible if this
is the case as the disease allele cannot be located in both areas. This suggests
a false positive association. A larger haplotype of 7 markers is identical in
CMT44 and CMT54 apart from the allele for D7S688. CMT54 has a (4) allele
for D7S688 and CMT44 has a (2) allele. This larger haplotype in CMT44 would
span the separate haplotypes independently associated with dHMN if it were
a real ancestral haplotype. If this larger haplotype is a true ancestral haplotype
shared between CMT44 and CMT54, then the difference in the D7S688 marker
may be due to a change of the microsatellite repeat size, a genotyping error
or a tight double-recombinant. The (2) allele was identified in all five affected
individuals in CMT44, therefore a genotyping error is unlikely. A tight double-
recombinant is also highly unlikely as the genomic distance between the two
markers flanking D7S688 is only 0.002 Cm. Change in microsatellite repeat
number generally occurs as strand-slippage during replication, with gene-
conversion during recombination or DNA repair less common [222, 223]. Most
slip mutations involve a shift of a single-repeat (∼90%), with shifts of two-
and three-repeats rarer [222, 224]. Microsatellites have a mutation rate which
is proportional to the number of repeats, with higher repeats more likely to
be mutated [200]. D7S688 is a CA repeat with a nominal size of 22 repeats,
and therefore within the highly polymorphic size range (> 10 repeats). The
two alleles in CMT54 and CMT44 differ by three CA repeats (143 to 149 bp),
which is within the normal range of a single sequence-slip mutation during
replication. It is possible that the differing allele at D7S688 between CMT54
and CMT44 is due to a mutation of the microsatellite repeat and these two
families share a common founder. In further support for a founder effect in
these four families with evidence of haplotype association, they have a similar

3 genetic mapping 82
phenotype and all have British ancestry, however any localised geographic
links are unknown.
The convergence of the significantly associated haplotypes in CMT54, CMT333
and CMT484 suggests the disease allele lies in the region flanked by the
markers D7S498 and D7S2419. This spans the proximal end of the minimum
probable candidate interval in CMT54. Using the proximal flanking marker
for the minimum probable candidate interval, the most likely position of the
disease allele is within the 1.14 Mb interval flanked by the markers D7S615
and D7S2419.
3.4.3 Proportion of dHMN caused by a pathogenic gene at 7q34-q36
This study suggests that the incidence of dHMN with 7q34-q36 mutations is
low. In the screen of 20 dHMN families with unidentified genetic cause, good
evidence for linkage was shown in one family, CMT44, with an additional
7 families uninformative. Association analysis suggested possible ancestral
links between CMT54, CMT44 and two additional families. With these families
joined, then only one additional family is not excluded from the 7q34-q36 locus.
This suggests that the 7q34-q36 locus may be responsible for ∼5% of dHMN
within this cohort. In a review of 119 autosomal-dominant dHMN families
from the peripheral neuropathies database (from which the families in this
study were selected), mutations in known genes were responsible for ∼5% of
dHMN with the remaining ∼95% having unknown genetic cause (O.Albulym,
personal communication, June 2011). This is slightly lower than found in
another autosomal-dominant dHMN cohort where known genes account for
∼15% of dHMN [6]. In both cohorts, each gene individually accounts for
between ∼1.5 and ∼7% of of dHMN. The identification of the 7q34-q36 disease

3 genetic mapping 83
gene will likely lead to identification of additional families and clarify the
proportion of dHMN caused by mutations at 7q34-q36.

4A N A LY S I S O F C A N D I D AT E G E N E S
4.1 introduction
4.1.1 Chapter overview
This chapter describes the application of a positional candidate based approach
to the identification of the disease gene within the 7q34-q36 interval. The
strategy employed here is targeted towards the identification of a mutation
within the protein-coding exons and flanking intronic sequences of candidate
genes within the 7q34-q36 interval. This analysis was conducted concurrently
with the analysis of the 7q34-q36 locus in the extended dHMN cohort described
in Chapter 3.
4.1.2 Strategy for gene identification
Several contrasting strategies for disease gene identification have been de-
veloped to make best use of available experimental resources and charac-
teristics of the disease under study. These methods include functional and
positional cloning of disease genes [225] and more recently, next generation
sequencing (NGS) strategies (Chapter 6). Functional cloning identifies a disease
gene through a detailed understanding of the biochemical defect involved
in the disease, which implicates a specific gene. Where a disease gene is not
immediately apparent, functional cloning can be expanded to a functional
84

4 analysis of candidate genes 85
candidate approach. In such an approach, a series of informed decisions are
used to identify more likely candidate genes which are then screened for
mutations. In contrast, positional cloning identifies a disease gene based on
its location in a genetic map. This is possible if a narrow genomic interval can
be defined through linkage analysis and fine mapping to a locus containing
only one gene. When a genomic interval linked to a disease contains many
genes, positional cloning is combined with functional candidate gene selection
to prioritise gene screening. This is known as a positional candidate approach
[225].
As dHMN is functionally poorly understood, pure functional cloning is
not possible and positional cloning and candidate gene strategies are applied.
Most of the known dHMN genes have been identified through linkage analysis
and positional candidate gene screening in affected families. One dHMN gene,
HSPB3 was identified through a candidate gene based screen of all small HSPs
following the identification of two other small HSP genes in dHMN through
positional cloning (HSPB1 and HSPB8) [2–4]. Due to the genetic heterogeneity
of dHMN, individual genes account for only a few percent of overall disease;
any candidate based approaches require large cohorts to identify a new gene
even in a single family [226].
4.1.3 Identifying genes within a disease interval
With the completion of the human genome project most genes have been
reliably identified through automated gene annotation complemented with
manual gene annotation [227, 228], and genetic maps are well integrated
into the physical sequence based maps. The identification of genes within
a candidate interval has generally been reduced to a computer exercise
[229]. Genomic intervals can be examined with online tools such as NCBI
4 analysis of candidate genes 86
map viewer (http://www.ncbi.nlm.nih.gov/mapview) and the UCSC genome
browser (http://genome.ucsc.edu, [210]).
Without a comprehensive genome reference, identifying the genes within
a disease locus was previously the rate limiting step in positional cloning,
requiring the identification of expressed sequences from the linked genomic
region [reviewed in 230]. This meant that much smaller disease intervals were
required to achieve a reasonable gene identification workload [231]. Early
gene identification was greatly assisted by the development of genetic maps
generated using sequence-tagged site (STS) markers [232] and expression maps
using expressed sequence tags (ESTs) [233].
4.1.4 Selection of candidate genes
Disease intervals identified though linkage analysis can contain hundreds of
genes. In a positional candidate based approach, any functional annotation
suggesting a disease role is utilised to prioritise candidate genes with a higher
likelihood of carrying the disease mutation. Common gene annotation sources
include; comparative genomics, epidemiological studies, functional candidates,
in-silico analysis of annotation databases, and gene expression patterns.
4.1.4.1 Association analysis
Genetic association analysis is used to identify genes that may have a role in
disease aetiology by identifying genetic markers that are overrepresented in
disease population compared to a healthy control population, beyond what
should occur by chance [234]. Disease associated markers may be in linkage
disequilibrium with other functional changes, or may directly cause a change in
a protein or its expression [235]. In whole-genome association (WGA) analysis,
SNP markers are genotyped across all (or most) genes in the genome. Due

4 analysis of candidate genes 87
to the large number of SNPs examined, false positives are likely. Therefore,
any initial associations identified need to be confirmed with additional studies.
WGA has been applied to the related disorder amyotrophic lateral sclerosis
(ALS) with limited success, possibly due to the heterogeneous nature of ALS
[236].
4.1.4.2 Comparative genomics
Comparative genomics is based on the principle that biological features of
gene orthologs are evolutionarily conserved among a group of organisms [237].
This provides good functional information about candidate genes which have
been characterised in animal models. This was the case for the identification
of IGHMBP2 in DSMA1; mutations in the mouse orthologue, Igmbp2 were
previously shown to be responsible for the neurodegenerative phenotype in
nmd mice [238]. As such, IGHMBP2 was the most promising candidate gene
[76] (See Section 1.1.3).
4.1.4.3 Function dependant
Study of the known dHMN genes has highlighted some common pathways and
protein functions. These include: disrupted axonal transport, RNA processing
defects, protein aggregation and inclusion body formation (See Section 1.1.11).
Candidate genes with similar functions to these known dHMN genes are
good candidates as they possibly influence the same molecular pathways.
However, as the range of functions of known dHMN genes is broad, many
candidate genes can be hypothetically linked to these pathways and suggested
as functional candidates.
4.1.4.4 In-silico prioritisation of disease genes
In-silico gene prioritisation utilises software to analyse publicly available
databases of gene ontology to prioritise candidate genes within a disease

4 analysis of candidate genes 88
locus based on interactions and homology with known disease genes [239].
While the application of in-silico prioritisation has been successful in some
gene discoveries, its application relies on the known biology of the disease
being studied and requires that the gene being targeted is not acting in a novel
disease pathway.
4.1.4.5 Gene expression analysis
Generally, gene expression patterns matching the tissues affected in a disease
can be used as a guide for selecting candidate genes. However, ubiquitously
expressed genes can still cause disease in specific tissues. This is the case in
dHMN, where some of the known disease genes are ubiquitously expressed
(see Section 1.1.11).
4.1.5 Gene screening methods
Gene screening is the process of identifying the DNA variant (mutation)
responsible for the disease. To fully characterise the nature of a DNA variant
requires the determination of the DNA sequence. DNA sequencing by chain
termination, known as ’Sanger’ or ’dideoxy’ sequencing, is commonly used to
determine DNA sequence. Sanger sequencing can determine the sequence of
DNA fragments of up to 800 bp on average, in a single reaction [240], suitable
for sequencing individual exons of genes.
As a gene screening project may need to examine hundreds of exons, several
methods have been developed for the detection of single base pair changes in
DNA without sequencing, aiming to achieve faster and cheaper gene screening.
These methods detect altered properties of the variant DNA strand including:
mobility shift of variant DNA during electrophoresis (single-stranded confor-
mational analysis and denaturing gradient gel electrophoresis), detection of

4 analysis of candidate genes 89
heteroduplexes, altered digestion of variant DNA by enzymes or chemical
cleavage (RNase A cleavage and chemical mismatch cleavage) [reviewed in
241]. These methods all require the subsequent application of direct sequencing
to define precisely the nature of any sequence variant identified.
Advances in Sanger sequencing mean it is now rapid, accurate, and afford-
able enough to allow the direct sequencing of candidate genes without the
need for prior screening using alternate methods [242]. Recently, the use of
Sanger sequencing itself has begun to be replaced by NGS technologies (par-
ticularly exome sequencing) as the primary sequencing method in positional
cloning. NGS allows the sequencing of much larger targets in a single reaction.
During the course of this project, as NGS technologies have become available
they have been adopted where relevant. This chapter details the application of
a positional candidate approach to gene screening using Sanger sequencing of
candidate genes. The application of NGS to gene screening within the 7q34-q36
disease interval is detailed in Chapter 6.
4.1.5.1 Hypothesis and aims
It is hypothesised that dHMN seen in family CMT54 is caused by a single gene
mutation within the linked region on chromosome 7q34-q36. The aims of this
chapter are to:
• Identify and prioritise candidate genes in the 7q34-q36 disease interval.
• Sequence coding sequences and flanking intronic sequences of candidate
genes to identify the pathogenic mutation.

4 analysis of candidate genes 90
4.2 materials and methods
4.2.1 In-silico candidate gene prioritisation
Two web based in-silico candidate gene prioritisation programs were used;
GeneWanderer and Endeavour. The same set of reference genes was used
to generate comparisons in both programs. This set included the known
dHMN genes: HSPB1, HSPB8, GARS, BSCL2, IGHMBP2, DCTN1, SETX, and
PLEKHG5.
4.2.1.1 GeneWanderer
The web-based interface for the GeneWanderer software (http://compbio.
charite.de/genewanderer/GeneWanderer [243] was used with the parameters:
linkage interval was set as chr7:141,053,887-154,034,713, analysis method was
set to Random walk, and all interactions were selected.
4.2.1.2 Endeavour
The web-based interface for the Endeavour software (http://www.esat.kuleuven.
be/endeavourweb [244, 245] was used with the following parameters: the
species selected was Homo sapiens, all data sources, and the candidate gene
interval was chr7:141,053,887-154,034,713.
4.2.2 PCR and sequencing for gene screening
PCR amplification of exons was carried out as described in Section 2.3.3, with
primer sets detailed in Appendix B. Sequencing was carried out as described
in Section 2.3.6.
4 analysis of candidate genes 91
4.2.2.1 Sequence analysis
Sequence traces in .abi format were aligned using SeqMan II 5.08 (DNAStar),
and sequence variants were identified by visual inspection of sequence traces.
The consensus sequence from the affected individuals was aligned to the
Human Mar. 2006 (NCBI36/hg18) Assembly using the BLAT tool from the
UCSC genome browser [198]. Correct sequence identity, exon coverage, and
characterisation of identified variants was carried out following the BLAT
alignment.
4.2.3 Analysis of effect of variants on exon splicing
The effect of mutations on exon splicing can be predicted using a combination
of several splicing prediction programs and a modest threshold for change in
splicing scores [246]. The guidelines for validation of splicing variants [247]
were followed, with at least three programs used to predict the effect of each
novel variant and variants with two positive in-silico results further analysed
with RNA studies.
4.2.3.1 In-silico splicing prediction
The splicing prediction programs used were NetGene2 [248], Splice Site Pre-
diction by Neural Network (NNSplice) [249], Human Splicing Finder (HSF)
[250], GeneSplicer [251] and Alternative Splice Site Predictor (ASSP) [252].
Default options were used for each software. Where programs required DNA
sequences as input, DNA sequence was downloaded from the UCSC genome
browser Human Mar. 2006 (NCBI36/hg18) assembly then manually edited to
include DNA variants being tested.

4 analysis of candidate genes 92
4.2.4 RNA studies of splicing variants
4.2.4.1 Isolation of total RNA
Total RNA was extracted from lymphocytes purified from peripheral blood
using density gradient centrifugation. Approximately 30 ml of blood was
collected into 9 ml VACUETTE® K3EDTA tubes (Greiner bio-one). The blood
sample was made up to a volume of 35 ml by adding cold RPMI-1640 medium
(Sigma). The Blood/RPMI was overlaid onto 15 ml of Ficoll-paque® PLUS (GE
healthcare Bio-sciences AB, Sweden) and centrifuged at 1700 × rpm for 40 min
without brakes using a Megafuge® 1.0 (Heraeus® Instruments) type centrifuge.
The buffy coat was recovered by pipetting then washed twice by suspending
cells in 35-50 ml RPMI media followed by centrifugation at 1000 × rpm for 5
min.
RNA extraction was carried out using the total RNA isolation NucleoSpin®
RNA II kit (Machery-Nagel) as per the protocol Total RNA purification from
cultured cells and tissue with NucleoSpin® RNA II, version May 2003/Rev.02.
In brief, buffy coat cells were lysed using the supplied lysis buffer, with me-
chanical disruption by vortexing then passing the sample through a 21 g needle
three times. The cell lysate was filtered, RNA was bound to a NucleoSpin®
RNA II column, desalted, DNAse digested, and washed three times. RNA was
eluted using 60 µL of RNAse free water, then reapplied to the column and
re-eluted. All filtration, wash and elution centrifugation steps were carried out
using a 5417 C bench-top centrifuge (Eppendorf). Eluted RNA was stored at
-70 °C.

4 analysis of candidate genes 93
4.2.4.2 cDNA synthesis and RT-PCR
All cDNA synthesis was carried out using the iScript cDNA synthesis kit
(BioRAD), using the supplied protocol, in a 2 × reaction volume (40 µL). Each
reaction was set up as follows:
Component Volume
5× iScript Reaction Mix 8 µL
iScript Reverse Transcriptase 2 µL
RNA template up to 1 µg total RNA
Nuclease-free water to a total volume of 40 µL
The reaction mix was incubated for 5 minutes at 25°C, 30 minutes at 42°C,
and 5 minutes at 85°C. Synthesised cDNA was stored at -20°C. RT-PCR was
carried out using standard PCR protocol described in Section 2.3.3. Nucleotide
primers for RT-PCR are detailed in Appendix B.
4.2.5 RNA folding prediction
Sequence variants within the 3’UTR of genes may affect RNA secondary
structure. The software Mfold version 4.4 [253, 254] was used to predict RNA
secondary structure. Required nucleotide sequences were downloaded from
the UCSC genome browser, Human Mar. 2006 (NCBI36/hg18) assembly, then
manually edited to include the sequence variants being tested.

4 analysis of candidate genes 94
4.3 results
4.3.1 Positional candidate genes
The critical disease interval defined by recombination events in affected in-
dividuals in CMT54 spans 12.98 Mb of DNA at 7q34-q36 (NCBI36/hg18
assembly) and is contained in two sequenced map contigs: NT_007914.10
and NT_034885.1 (Figure 4.1) [255]. The sequence gap between these two
contigs has an estimated size of 99-100 kb based on fluorescence in situ hy-
bridisation analysis of human DNA and comparison to the analogous region
in the mouse genome (gap report HG-740: http://www.ncbi.nlm.nih.gov/
projects/genome/assembly/grc) [255]. The gap is located on the telomeric
end of the critical disease interval. The minimum probable candidate interval
defined by recombination events in unaffected individuals in CMT54 is located
entirely within sequenced map contig NT_007914.10. Positional candidate
genes were identified from within the critical disease interval by retrieving
records for known genes from the UCSC genes track using the UCSC table
browser tool [256]. The UCSC genes track contains gene records combined
from RefSeq [257, 258], Genbank [259], the consensus coding sequence (CCDS)
project [260] and UniProt [261] databases. The critical disease interval con-
tained 245 gene records after removing duplicates. These records correspond
to:
• 89 protein coding genes (not including taste, olfactory or T-cell receptor
transcripts).
• 10 taste receptor gene transcripts.
• 14 olfactory receptor gene transcripts in the olfactory receptor gene
cluster [262].

4 analysis of candidate genes 95
• 86 T-cell receptor beta-chain gene transcripts localised to the T-cell recep-
tor beta-chain gene complex at 7q35 [263].
• 32 putative non-coding transcripts
• 14 pseudogenes
The 89 coding genes are the target for this candidate gene screening approach
(Figure 4.1). The minimum probable candidate interval contains 60 gene tran-
scripts (Table G.1), with 28 gene transcripts in the remaining 7q34-q36 critical
disease interval (Table G.2). To ensure all possible exons of candidate genes
were screened, transcripts for splicing variants or alternate protein isoforms
were identified from the UCSC genes and RefSeq tracks from the UCSC
genome browser as well as the Uniprot database. Unique exons were added to
the candidate genes list as alternate isoforms.
TR
YX
3,
PR
SS1
, PR
SS
2EPH
B6
, TR
PV
6,
TR
PV
5C
7orf
34
, K
EL,
PIP
GSTK
1,
TM
EM
13
9C
ASP2
, C
LCN
1FA
M1
31
B,
ZYX
, EPH
A1
FAM
11
5C
, FA
M1
15
A
CN
TN
AP2
C7
orf
33
, C
UL1
, EZ
H2
PD
IA4
ZN
F78
6,
ZN
F42
5Z
NF3
98
, Z
NF2
82
ZN
F21
2,
ZN
F78
3Z
NF7
77
, Z
NF7
46
ZN
F76
7,
KR
BA
1,
ZN
F4
67
SSPO
, ATP6
V0
E2
AC
TR
3C
, LR
RC
61
C7
orf
29
, R
AR
RES2
REPIN
1,
ZN
F77
5G
IMA
P8
, G
IMA
P7
, G
IMA
P4
GIM
AP6
, G
IMA
P2
GIM
AP1
, G
IMA
P5
TM
EM
17
6B
, TM
EM
17
6A
AB
P1
, KC
NH
2N
OS3
, ATG
9B
AB
CB
8,
AC
CN
3C
DK
5,
SLC
4A
2,
FASTK
TM
UB
1,
AG
AP3
, G
BX
1A
SB
10
, A
BC
F2,
CSG
LCA
-TSM
AR
CD
3,
NU
B1
, W
DR
86
CR
YG
N,
RH
EB
, PR
KA
G2
G
ALN
TL5
, G
ALN
T1
1M
LL3
, C
CT8
L1X
RC
C2
, A
CTR
3B
DPP6
7q34 7q35 7q36.1 7q36.2
31.121.11 33 35q34
AR
HG
EF3
5,
AR
HG
EF5
NO
BO
X,
TPK
1
Olfact
ory
rece
pto
r g
enes
WEE2
, SSB
P1
PR
SS3
7,
CLE
C5
AM
GA
M,
LOC
93
43
2T-
cell
rece
pto
r B
gen
es
CDI
MPCI
Cytogenetic map
Genes
Known genes
Chromosome 7
5Mb
Map contigs NT_007914
NT_034885
Figure 4.1: Genes mapping to the 7q34-q36 disease interval. Top panel: chromosome7 ideogram depicting the location of the 7q34-q36 disease locus. Lower panel: detailof the 7q34-q36 disease locus. Figure labels indicate the following: critical diseaseinterval (blue bar), minimum probable candidate interval (green bar), cytogenetic mapand known genes.

4 analysis of candidate genes 96
4.3.2 Functional candidate gene selection
A literature and database search was carried out to identify functional can-
didate genes from the 89 positional candidate genes. This search included;
neurodegenerative disease role or association, comparative genomics, func-
tional candidates, gene expression patterns and in-silico prioritisation.
4.3.2.1 Relationship of candidate genes with neurodegenerative diseases
Using the Online Mendelian Inheritance in Man (OMIM) database (http:
//www.ncbi.nlm.nih.gov/omim), positional candidate genes were examined
for any known function in, or published association with neurodegenerative or
neurological diseases. Six genes were identified as potential candidate genes:
DPP6, ACCN3, CUL1, CNTNAP2, KCNH2 and NOS3. The gene DPP6 is asso-
ciated with susceptibility to sporadic ALS in different populations of European
ancestry [264]. The same association was reproduced in homogeneous Irish
[265] and Italian populations [266]. A second gene, ACCN1 was shown to be
associated with sporadic ALS in one study [267]. The positional candidate
ACCN3 forms a functional complex with ACCN1, which has a functional role
in the peripheral nervous system [268, 269]. Cullin1, coded by the candidate
gene CUL1, interacts with Parkin [270], mutations in which cause autosomal
recessive juvenile Parkinson’s disease (PARK2 or PDJ: MIM#600116) [271].
CNTNAP2 mutations cause several neurological diseases: recessive frameshift
mutations in CNTNAP2 cause cortical dysplasia-focal epilepsy (CDFE) syn-
drome [272]: CNTNAP2 haploinsufficiency causes schizophrenia and epilepsy
[273]: and CNTNAP2 is disrupted through a chromosomal insertion/translo-
cation in familial Gilles de la Tourette syndrome and obsessive compulsive
disorder (motor and vocal ticks) [274]. In addition, SNPs within CNTNAP2 are
associated with increased risk of developing autism [275]. KCNH2 is associated
with schizophrenia, and has a functional role in the brain [276]. Genetic vari-

4 analysis of candidate genes 97
ants in NOS3 infer a slight increase in risk for late-onset Alzheimer’s disease
[277, 278].
4.3.2.2 Identification of candidate genes through comparative genomics
Using comparative genomics, the gene CASP2 was identified as a good candi-
date gene. Mutant CASP2 causes accelerated motor neuron cell death during
development in a mouse model [279]. CDK5 was previously screened for CDS
mutations in this family [103] due to the observed deregulation of CDK5 in
a SOD1 ALS mouse model [280]. The candidate gene DPP6 is disrupted by
a chromosomal re-arrangement in the rump white (Rw) mouse which is em-
bryonic lethal in homozygotes [281]. However, complementation with DPP6
deletion mutants indicated that DPP6 disruption is not the embryonic lethal
factor in the Rw chromosomal rearrangement [282]. Therefore, this does not
add further support for DPP6 as a candidate gene.
4.3.2.3 Functional candidate genes
The function of candidate genes were examined to identify genes with roles
in tissues of the peripheral nervous system or in pathways affected in dHMN
(Section 1.1.11). Seven genes were identified as potential candidate genes: CUL1,
FASTK, SMARCD3, SSBP1, CNTNAP2, TRPV6 and TRPV5. CUL1 is a core
protein of the complex responsible for ubiquination of components of NFκB
complexes [283, 284]. Cell death through loss of NFκB signalling is caused by
PLEKHG5 mutations in DSMA4 [162] (see Section 1.1.8). FASTK is a negative
modulator of neurite outgrowth and a positive modulator of neurite retraction,
with a likely signalling role in cytoskeleton maintenance [285]. SMARCD3 is
involved in chromatin remodelling and transcriptional regulation [286]. SSBP1
is involved in genome stability as part of the single-stranded DNA (ssDNA)-
binding complex and is a core protein of mitochondrial nucleoid complexes
responsible for replication and translation of mtDNA [287, 288]. CNTNAP2 is

4 analysis of candidate genes 98
thought to have a role in the localisation of ion channels at the juxtaparanodal
region of myelin required for proper conduction of the nerve impulse [289].
TRPV6 and TRPV5 form calcium-permeable channels, which participate in
neurotransmission, muscle contraction, and exocytosis by providing calcium
as an intracellular second messenger. TRPV6 and TRPV5 are members of
the same subgroup of the transient receptor potential protein superfamily as
the recently identified dHMN gene TRPV4. However, TRPV6 and TRPV5 are
calcium selective channels as opposed to TRPV1-4 which are thermosensitive
non-selective cation channels. Nevertheless, they remain good candidate genes.
4.3.2.4 Prioritisation based on gene expression pattern
The gene expression pattern of candidate genes in brain, spinal cord and
muscle was examined using the expression section of the GeneCards® page
for each gene [290, www.genecards.org]. The GeneCards® expression figures
are generated using data from Genenote [291, 292] and GNF BioGPS [293, 294].
Five genes, CDK5, CNTNAP2, DPP6, WDR86 and ATP6V0E2 had high relative
expression levels in brain or spinal cord. For two genes NOBOX and ACTR3C,
there was no expression data available for some or all of the tissues. The
remaining genes were all expressed in the selected tissues (Appendix G,
Table G.3).
4.3.2.5 In silico prioritisation of candidate genes
Two separate programs, GeneWanderer and Endeavour, were used to prioritise
candidate genes. The web-based software GeneWanderer, investigates the
interaction of candidate genes with known disease genes through a protein-
protein interaction (PPI) network based on experimental data from several
species [243]. The second program, Endeavour, also investigates the interaction
of candidate genes with known disease genes, however uses a greater number
of relationships including; literature, functional annotation, gene expression,

4 analysis of candidate genes 99
Table 4.1: Candidate gene prioritisation ranking using GeneWanderer and Endeavoursoftware.
Rank GeneWanderer EndeavourGene Symbol Score Gene Symbol Score
1 CASP2 0.8695 CDK5 0.0002472 GSTK1 0.8504 CASP2 0.002673 TRPV6 0.03027 ACTR3B 0.003874 NOS3 0.03019 ARHGEF5 0.003955 CDK5 0.02678 CENTG3 0.007146 CUL1 0.02558 SSBP1 0.008377 MGAM 0.02010 ABP1 0.01058 KEL 0.01449 PDIA4 0.01679 CNTNAP2 0.01380 GIMAP4 0.0205
10 ABCF2 0.01109 ZYX 0.0225
protein domains, PPI, pathway membership, gene regulation, transcriptional
motifs, and sequence similarity [244, 245]. Two genes, CASP2 and CDK5 were
ranked highly by both programs, with the remainder unique to each list
(Table 4.1). Both these genes have previously been identified as good candidates.
The gene GSTK1 also scored highly with GeneWanderer.
4.3.3 Screening candidate genes
The protein-coding exons and flanking intronic regions of candidate genes were
sequenced using direct sequencing, in two affected and two normal individu-
als from CMT54. Functional candidate genes within the minimum probable
candidate interval were prioritised for sequencing, followed by some candi-
date genes beyond this interval. The remaining genes screened were generally
selected based on their location in the minimum probable candidate interval.
A total of 32 genes were sequenced (comprising 475 exons): CUL1, ACCN3,
DPP6, SMARCD3, KCNH2, NOS3, CASP2, FASTK, TRPV6, GSTK1, ABCF2,
CENTG3, ABP1, PDIA4, KEL, ZYX, ABCB8, RARRES2, CLCN1, TMUB1, NUB1,

4 analysis of candidate genes 100
EZH2, REPIN1, CRYGN, RHEB, ZNF775, PRKAG2, TMEM176A, TMEM176B,
GALNT11, SLC4A2, and XRCC2. One gene, MLL3 was partly sequenced with
40 of 59 exons sequenced. Prior to this PhD project, the protein-coding exons
and exon-intron boundaries for two positional candidate genes, CDK5 and
CNTNAP2, were sequenced in an affected individual from CMT54, with no
pathogenic variants identified. The sequencing traces for CNTNAP2 and CDK5
were reviewed to check for variants affecting splicing. In total, 31 sequence
variants were identified in both affected individuals screened (Table 4.2). 14 of
these variants were not present in the two unaffected individuals sequenced.
Of these variants, nine were reported validated SNPs in dbSNP 1.29 or 1.30.
Five variants were examined further as possible pathogenic mutations.
4.3.3.1 ACCN3:c.915C>T
The variant ACCN3:c.915C>T, is a non-synonymous base change predicted to
cause the amino acid substitution Pro289Ser. Examination of the conservation
track of the UCSC genome browser indicated Pro289 is 100% conserved across
mammals, however the Stickleback is Wt for Ser in this location. Sequencing
of CMT54 family members showed this variant segregated with all affected
individuals tested (9 individuals) and was not present in any unaffected
individuals. Sequencing of a healthy control cohort identified this variant in 9
of 269 individuals, with a minor allele frequency (MAF) of 1.67%. Therefore,
this variant was considered a non-pathogenic SNP.
4.3.3.2 DPP6:c.*347A>G
The variant DPP6:c.*347A>G, lies in the 3’UTR of a short isoform of the DPP6
gene. This base is conserved across primates. Using the software mfold version
4.4, the variant was predicted to cause altered mRNA secondary structure
(data not shown). Sequencing of all CMT54 family members showed that this
variant did not segregate with affected individuals, found only in 4 affected

4 analysis of candidate genes 101
Tabl
e4.
2:D
NA
vari
ants
iden
tifi
edin
gene
ssc
reen
ed.A
llm
utat
ions
foun
din
affe
cted
ind
ivid
uals
sequ
ence
din
clud
ing
know
nSN
Ps.
Alle
lefr
equ
ency
.Whe
nbo
thco
ntro
lsar
eho
moz
ygou
s,al
lele
freq
will
be0%
or10
0%.1
00%
ind
icat
esth
eyar
eho
moz
ygou
sfo
rth
eal
tern
ate
SNP
alle
le.W
here
rsnu
mbe
rsar
ein
dica
ted,
alle
les
iden
tifie
din
sequ
enci
ngm
atch
edth
ose
repo
rted
indb
SNP.
Gen
eSy
mbo
lR
efSe
qac
cess
ion
Var
iant
dbSN
PTy
pe#
Aff
ecte
d#
cont
rols
freq
uenc
yco
ntro
lsC
NTN
AP2
NM
_014
141
c.15
28+1
17in
sAA
AC
rs34
6158
41in
tron
1-
-C
NTN
AP2
NM
_014
141
c.34
76-1
5C>
Ain
tron
1-
-C
NTN
AP2
NM
_014
141
c.37
90-6
delC
Mul
tipl
eSN
Psin
tron
2-
-C
UL1
NM
_003
592
c.11
91+8
C>
Trs
1027
1133
intr
on2
225
%fo
rT
AC
CN
3N
M_0
0476
9c.
915C>
T-
mis
sens
e(P
289S
)9
269
3.2%
for
T
ABP
1N
M_0
0109
1c.
1856
+15G>
Ars
1198
1217
intr
on2
20%
for
AC
LCN
1N
M_0
0008
3c.
261C>
Trs
6962
852
cds-
syno
n2
20%
for
TC
LCN
1N
M_0
0008
3c.
1402
-9C>
Trs
2272
252
intr
on2
20%
for
TC
LCN
1N
M_0
0008
3c.
2154
C>
Trs
2272
251
cds-
syno
n2
210
0%fo
rT
CLC
N1
NM
_000
083
c.21
80C>
Trs
1343
8232
mis
sens
e(P
727L
)2
20%
for
T
CLC
N1
NM
_000
083
c.22
84+3
3C>
Grs
5668
0997
intr
on2
20%
for
GD
PP6
prot
ein
Q8I
YG
9‡c.
*347
A>
G-
3’U
TR4
of10
244.
1%fo
rG
DPP
6N
M_1
3079
7c.
1666
+47T>
A-
intr
on3
150
%fo
rA
DPP
6N
M_1
3079
7c.
358+
30C>
Trs
2291
538
intr
on3
10%
for
TD
PP6
NM
_130
797
c.45
7+32
G>
A†
rs37
5004
2in
tron
31
50%
for
AD
PP6
isof
orm
2N
M_0
0193
6c.
303G>
A†
cds-
syno
n
Tabl
e4.
2-c
ontin
ued
onne
xtpa
ge

4 analysis of candidate genes 102
Tabl
e4.
2-c
ontin
ued
from
prev
ious
page
Gen
eSy
mbo
lR
efSe
qac
cess
ion
Var
iant
dbSN
PTy
pe#
Aff
ecte
d#
cont
rols
freq
uenc
yco
ntro
lsEZ
H2
NM
_004
456
c.21
11-4
6C>
T-
intr
on2
20%
for
TEZ
H2
NM
_004
456
c.21
10+6
T>
Grs
4127
7434
intr
on2
225
%fo
rg
EZH
2N
M_0
0445
6c.
2276
+6T>
Crs
4127
7434
intr
on2
210
0%fo
rC
TMEM
176B
NM
_014
020
c.28
0A>
Crs
3173
833
mis
sens
e(S
94R
)2
250
%fo
rC
TMEM
176B
NM
_014
020
c.40
0G>
Ars
2072
443
mis
sens
e(A
134T
)2
250
%fo
rA
TMEM
176B
NM
_014
020
c.53
8C>
Trs
1725
6042
mis
sens
e(R
180W
)2
20%
for
TTM
EM17
6BN
M_0
1402
0c.
*3T>
Crs
2302
479
3’U
TR2
225
%fo
rC
NO
S3N
M_0
0060
3c.
270+
42G>
Ars
1800
781
intr
on2
225
%fo
rA
NO
S3N
M_0
0060
3c.
774T>
Crs
1549
758
cds-
syno
n2
225
%fo
rC
NO
S3N
M_0
0060
3c.
1998
C>
Grs
2566
514
cds-
syno
n2
225
%fo
rG
NU
B1N
M_0
6118
c.59
8+7A>
Grs
4468
86in
tron
22
75%
for
GK
CN
H2
NM
_172
057
c.16
39A>
Crs
1805
123
mis
sens
e(K
557T
)1
--
ABC
B8N
M_0
0718
8c.
659+
12C>
Trs
2303
924
intr
on2
20%
for
TA
BCB8
NM
_007
188
c.98
4T>
Ars
2303
926
cds-
syno
n2
225
%fo
rA
CRY
GN
NM
_144
727
c.41
1C>
Trs
2075
001
cds-
syno
n2
20%
for
TG
ALN
T11
NM
_022
087
c.71
2+50
C>
T-
intr
on2
225
%fo
rT
†O
neva
rian
tha
sm
ult
iple
affe
cts
inD
PP6
isof
orm
s.B
oth
the
DPP
6:c.
457+
32G>
Aan
dD
PP6
isof
orm
2:c.
303G>
Are
fer
toth
esa
me
mut
atio
n.‡
Uni
Prot
KB/
TrEM
BLac
cess
ion
num
ber.

4 analysis of candidate genes 103
individuals. Furthermore, this variant was present in 1 of 24 unrelated control
individuals (MAF = 2.1%). This variant was considered a non-pathogenic SNP.
4.3.3.3 EZH2:c.2111-46C>T
The variant EZH2:c.2111-46C>T, is an intronic variant located upstream of
exon 19. Examination of the conservation track of the UCSC genome browser
indicated this nucleotide is not conserved across species, with the T allele
present in one of six species at this position. Using four different splicing
prediction programs (NetGene2, NNSplice, HSF and GeneSplicer), this variant
was predicted to not affect splicing or create any additional splice motifs.
Therefore, this variant was excluded. Segregation analysis in the larger CMT54
pedigree was not carried out.
4.3.3.4 CNTNAP2:c.3476-15C>A
The variant CNTNAP2:c.3476-15C>A, is a non-coding variant that was con-
sidered to potentially affect both the long and short isoforms of CNTNAP2,
located 15 bp upstream of exon 21 and exon 1 respectively (Figure 4.2). Ex-
amination of the conservation track of the UCSC genome browser indicated
this nucleotide is not conserved across species with C and T nucleotides at
this location in eight species. Sequencing of CMT54 family members showed
this variant segregated with all affected individuals and was not present in
any unaffected individuals. The effect of the CNTNAP2:c.3476-15C>A variant
was simulated using the splicing prediction programs NetGene2, NNSplice
and HSF. This variant was predicted to reduce the power of the adjacent splice
site by -1% by NNSplice, and -5.24% by HSF with no change predicted by Net-
Gene2. In addition, the formation of a new enhancer motif site was predicted
by the HSF software. These scores suggested the CNTNAP2:c.3476-15C>A vari-
ant may affect splicing. The effect of this variant on splicing was investigated
by RT-PCR using three PCR primer sets designed to detect any aberrantly

4 analysis of candidate genes 104
CNTNAP2 short isoform
CNTNAP2
Ex. 20 Ex. 21 Exon 22 Ex. 23 Exon 24
3'UTR5' UTR
3'UTR
PCR-A (479bp)
PCR-B (390bp)
PCR-C (370bp)
Exon 1 Ex. 2 Exon 3C>A
C>A
20F 21F
shortF 23R 24R
23R 24R
100 bp
Figure 4.2: Location of variant CNTNAP2:c.3476-15C>A and adjacent exons. Thisvariant possibly affects both isoforms of CNTNAP2, with the variant located in thethree PCRs overlapping the splice site variant. Exon 22 is 240 bp and Exon 23 is 81 bp
spliced variants of CNTNAP2 (Figure 4.2). These amplicons may identify exon
skipping of exon 21 or criptic splice site use altering the length of the transcript.
No PCR products indicating aberrant exon splicing were detected in affected
individuals from CMT54 (Figure 4.3). However, this cannot rule out the pos-
sibility of a neuron-specific splicing defect. As neuronal tissue from affected
patients is unavailable in this study, this can not be readily tested. Sequencing
of a healthy control cohort identified a heterozygous C>A change in 6 of 84
control individuals sequenced (MAF = 3.57%). Therefore, this variant was
considered a non-pathogenic SNP. This variant was subsequently identified as
SNP rs77706740, included in the dbSNP build 132 (release 9/11/2010).
4.3.3.5 CNTNAP2:c.3790-6delC
The variant CNTNAP2:c.3790-6delC is a deletion that lies upstream of exon 22.
Examination of the conservation track of the UCSC genome browser indicated
this nucleotide is not conserved across 10 species, with variable gaps of up to
9 bp present at this location. There are seven SNPs reporting small deletions,

4 analysis of candidate genes 105
Figure 4.3: PCR amplification of cDNAflanking the CNTNAP2:c3476-15C>Avariant. PCR-A and PCR-B amplify cDNAfrom the full length CNTNAP2 transcriptwhereas PCR-C amplifies the short iso-form transcript. Lanes marked (1) and (2)are affected individuals, (+) unaffectedcontrol, (-) PCR negative control, and (M)DNA size marker HyperLadder IV 100-1000bp DNA ladder (Bioline).
2 -
600500400
M +I
A---
I 2 -
300
500400
M
-
--
+
B
+ -
300
500400
M
-
--
I 2
C

4 analysis of candidate genes 106
Cytogenetic map
Genes
Chromosome 7 21.11 31.1 33 q34 35CNTNAP2 short isoform LOC392145 C7orf33 CUL1CNTNAP2
7q35 7q36.1
500 kb
Figure 4.4: Genes in the interval defined by significantly associated haplotypes (Sec-tion 3.3.9). Top panel: chromosome 7 ideogram depicting the location of the smallerlocus. Lower panel: detail of the smaller locus. Figure labels indicate the following:cytogenetic map and known genes. The 5’ end of CNTNAP2 is excluded by the proxi-mal end of the interval. Only the 5’-UTR of CUL1 is included at the distal end of theinterval.
of two to four bases, affecting this base or adjacent bases, with this nucleotide
deleted in the SNPs, rs71188981, rs72268642 and rs72031591 (dbSNP build
130). Analysis of this variant with splicing prediction software indicated no
change with NetGene2 (confidence = 0.97) and a slight reduction in confidence
with ASSP (12.537 > 12.209). With the reported SNPs at this location and the
neutral scores in splicing prediction software, this variant was considered a
non-pathogenic SNP.
4.3.4 Analysis of the interval defined by significantly associated haplotypes
The 1.14 Mb interval defined by the overlapping haplotypes associated with
dHMN (Section 3.3.9) was examined in greater detail. This interval, at the
proximal end of the minimum probable candidate interval contains the 3’
end of CNTNAP2, the 5’ end of CUL1, transcript C7orf33 and pseudogene
LOC392145 (Figure 4.4). Both CNTNAP2 and CUL1 were good candidate genes
and protein-coding exons of both genes have been excluded. The CNTNAP2
3’UTR, CUL1 5’UTR, transcript C7orf33 and pseudogene LOC392145 were
examined using NGS detailed in Chapter 6.

4 analysis of candidate genes 107
4.4 discussion
4.4.1 Gene screening summary
The protein-coding exons and exon-intron boundaries of 35 genes have been
sequenced and no putative pathogenic mutation was identified. Thirty-one
sequence variants were identified in two affected individuals from CMT54,
however, all were excluded as non-pathogenic through: non-segregation with
all affected members of CMT54, being identified in unaffected spouses or
healthy controls, reported as SNPs in dbSNP, or without a putative pathogenic
function. No further genes were sequenced as this candidate based approach
was replaced with a NGS based screen of genes within the 7q34-q36 interval
(Chapter 6).
This application of a positional candidate based approach for gene screening
has been ineffective in identifying the pathogenic mutation. This may be due
to the disease gene having a novel function unrelated to the known dHMN
disease genes, a novel uncharacterised function of a candidate gene, or the
mutation confers a gain of new function to a gene not prioritised. Also, the
possibility of a mutation acting through a regulatory mechanism or being a
CNV need to be considered. These possibilities are considered in Chapter 6
and Chapter 5. Nevertheless, the examination of the protein-coding exons and
flanking intronic sequences for functional candidate genes is the most logical
place to start a gene screen such as this.
The two dHMN genes identified recently, ATP7A and TRPV4 are both novel
genes in dHMN. Both genes had no obvious relationship with the other
known dHMN genes and therefore were only identified after sequencing
numerous other candidate genes. The X-linked dHMN, DSMAX (Section 1.1.7),
was mapped to an interval containing 71 candidate genes, 33 of which were

4 analysis of candidate genes 108
screened prior to the identification of the pathogenic mutation in ATP7A.
ATP7A is a membrane bound copper transporter and ATP7A mutations had
been shown previously shown to cause Menkes disease and OHS, was not
selected as a priority candidate. Similarly, the gene for congenital DSMA
(Section 1.1.9), TRPV4 was not selected as a primary candidate, with the
protein-coding exons and exon-intron boundaries of 19 genes sequenced prior
to the identification of the pathogenic mutation in TRPV4. These recent gene
discoveries have added to the genetic heterogeneity of dHMN.
4.4.2 Was the mutation missed?
The possibility that the pathogenic mutation was missed is unlikely. Dideoxy
sequencing was used in this screen which has a very high accuracy. Only
sequence traces of high quality were used and two affected individuals were
sequenced for most exons. Sequencing can detect any molecular level change
within the size limits of the PCR amplicon sequenced. In addition, all exons
from alternate transcripts of the candidate genes were included. However, this
approach cannot readily identify CNV involving the entire PCR amplicon
or detect allele specific amplification due to additional SNPs within primer
binding sites. An analysis of CNV within the dHMN 7q34-q36 disease interval
was carried out in Chapter 5.
Most candidate genes were focused within the minimum probable candidate
interval, with only a handful of genes outside this interval sequenced. This
interval is defined by recombination events in unaffected individuals in CMT54,
as such the possibility of reduced penetrance means that the defined interval
may be incorrect, however with the information at hand this is the most likely
area. An examination of the remaining genes in the 7q34-q36 interval was
carried out using NGS, detailed in Chapter 6.

5C O P Y N U M B E R A N D S T R U C T U R A L VA R I AT I O N
5.1 introduction
Copy number variation (CNV) has recently been recognised as a major source
of genetic diversity in humans, including variation leading to disease [295].
It is estimated that copy number variation (CNV) affects 5% of the sequence
of the human genome [296], a much greater amount than the 1% affected by
SNPs [295]. This chapter explores CNV at the 7q34-q36 disease interval as a
potential disease mechanism in dHMN.
5.1.1 CNV and structural variation
By the classical definition, CNV refers to deoxyribonucleic acid (DNA) seg-
ments that are present in a genome at an abnormal number when compared
to a reference genome. CNV can result from a change in chromosome number
or unbalanced structural variation within chromosomes. Balanced structural
variation, including inversions or insertion/deletions, where the copy number
remains unchanged, are also a source of genetic variation which must be con-
sidered in disease gene identification strategies. Structural variation can occur
at a scale ranging from large chromosomal regions through to a molecular
level of a single base pair. While there is no set definition of the minimum size
of a CNV, functional definitions have been based on the limit of resolution
achievable with each new technology. With current technology reaching base-
109

5 copy number and structural variation 110
pair resolution, the functional minimum size definition for structural variation
is one exon or 50-100 bp of DNA [295, 297]. Similarly, the mean size of CNV
detected in the genome has decreased with the increasing resolution of new
techniques, with smaller CNV more common [297, Box 2].
5.1.1.1 Chromosomal CNV
Gain or loss of an entire autosomal chromosome has serious clinical conse-
quences. Generally, loss of one or two copies of an autosomal chromosome
(nullisomy and monosomy respectively) are pre-implantation or embryonic lethal
[199]. The gain of an additional autosomal chromosome (trisomy) is also usu-
ally embryonic lethal, however, some forms are survivable but with congenital
abnormalities. Gain or loss of a sex chromosome is clinically less severe, with
affected individuals generally showing only minor abnormalities.
5.1.1.2 Structural variation
Structural variations are rearrangements of DNA segments within homologous
or non-homologous chromosomes. Such rearrangements include: deletions, a
loss of a DNA segment; duplications, a gain of a DNA segment, either in tandem
or dispersed; inversion, the reversal of direction of a DNA segment; insertion,
a gain of a foreign DNA segment from a homologous or non-homologous
chromosome; translocation, the exchange of a DNA segments between non-
homologous chromosomes (Figure 5.1) [297]. Insertions can be either novel
sequences or mobile-elements (transposons). Structural variations can be unbal-
anced, where the copy number is altered, or balanced, where there is no change
in copy number. Complex structural variations, involving a combination of
several types of structural variation, can arise from multiple independent
rearrangements at the same loci or complex rearrangements occurring in one
event.

5 copy number and structural variation 111
The molecular mechanisms by which CNV can cause disease include: gene
dosage, gene interruption, gene fusion, position effects, unmasking of reces-
sive alleles or functional polymorphisms, and transvection effects [295]. Gene
dosage effects are seen when a dosage-sensitive gene is duplicated or deleted
which leads to over expression or haploinsufficiency respectively. Gene in-
terruption occurs when the breakpoint of a CNV or structural variation lies
within a gene, leading to loss of function. Gene fusion occurs when separate
genes or their regulatory elements are brought together by structural variation.
Positional effects involve alteration to the regulatory elements of genes. Thus,
expression of genes located beyond the region involved in a CNV can be af-
fected. Unmasking recessive alleles or functional polymorphisms occurs when
the good copy of a gene is deleted, thus allowing the effect of the recessive
allele to be observed. Transvection is the cross regulation of gene expression
by gene pairs on homologous chromosomes. Loss of one allele or regulatory
elements disrupts this regulation, affecting gene expression.
Most of the known CNV is located in genomic regions with no obvious
phenotypic effect [295]. In several genome-wide CNV studies, up to half of the
CNV identified in each study are present in multiple healthy individuals indi-
cating they are polymorphic [298–304]. Recent genome-wide high resolution
CNV analysis at a population scale has defined both common polymorphic
Deletion Duplication Inversion Insertion
Chr A
Chr B
DerivativeChr B
Translocation
DerivativeChr A
DerivativeChr B
Figure 5.1: Forms of CNV or structural variation at chromosomal or molecular scale.This includes deletion, duplication, inversion, insertion and translocation.

5 copy number and structural variation 112
CNVs (MAF > 5%) and population specific polymorphic CNVs [302, 304]. The
most common structural variation identified is sub-microscopic deletion.
5.1.2 CNV in dHMN and related peripheral neuropathies
Recently, the role of CNV in diseases of the nervous system, including: neu-
rodevelopmental, neurodegenerative, and psychiatric disorders has greatly
expanded [reviewed by 305]. The majority of disease genes in dHMN identified
to date involve point mutations or small deletions affecting only a few bp (Fig-
ure 1.1). An analysis of CNV within 35 peripheral neuropathy genes (including
the dHMN genes: HSPB1, HSPB8, DCTN1, SETX, GARS and BSCL2), did not
identify any putative pathogenic CNV other than known PMP22 duplications
in CMT type 1A (CMT1A) [306].
In rare cases, structural variation has been identified as the cause of dHMN.
In autosomal recessive dHMN6, where over 50 point mutations or small
deletions have been described in IGHMBP2, two cases were observed to carry
structural variations of IGHMBP2, heterozygous with point mutations [78, 79].
The first case involved a deletion of 18.5 kb of DNA spanning exons 3-7 and
the second case involved a complex structural variation with two deletions
and one inversion affecting exons 9-15, creating a premature stop codon.
Both of these CNVs lead to disruption of IGHMBP2 and unmasking of the
recessive allele on the alternate chromosome. Other important examples of
neuropathies caused by structural variation include: CMT1A caused by tandem
duplication of PMP22 [307]; hereditary neuropathy with liability to pressure
palsies (HNPP) caused by the deletion of the same 1.5 Mb region [308]; SMA
caused by deletion or gene conversion of SMN1 (see section Section 1.1.11);
and autosomal dominant leukodystrophy (ADLD) caused by duplication of
LMNB1 [309].

5 copy number and structural variation 113
5.1.3 Methods of detecting CNV
CNVs were first identified by cytogenetic analysis of chromosomal number and
structure at a microscopic resolution. Such techniques developed to achieve
a resolution of approximately 3 Mb. With the advent of sequencing, CNV at
specific targeted loci could be characterised to a base pair resolution. How-
ever, it wasn’t until recently that comprehensive genome-wide analysis of
CNV, at high resolution, has become possible. The technologies that have al-
lowed this include clone and oligonucleotide-based array comparative genomic
hybridisation (aCGH), SNP genotyping arrays, and NGS based CNV analysis.
For reviews on these techniques see Feuk et al. [310] and Alkan et al. [297].
No single technique, as yet, can correctly identify all structural variation
in a genome-wide scan. Karyotyping can robustly identify all the types of
structural variation but is limited by its resolution and cannot identify sub-
microscopic scale structural variation which account for the majority of known
structural variation. Array based CGH, based on relative amounts of probe
signals can only detect CNV, with balanced structural variation not detected
and translocations incorrectly identified as a duplication of the DNA segment
at the donor site. However, the resolution of aCGH is limited only by the
array probe densities, which have become increasingly high. SNP genotyping
arrays are similarity restricted to the identification of CNV and also achieve
a high resolution. Recently, the use of NGS in structural variation analysis
has shown great potential, however the computational and bioinformatics
overheads required still present a significant challenge beyond large research
groups. Structural variation analysis using NGS can be grouped into four
strategies: read-pair methods, which identify structural variation break points
by locating paired-end sequencing reads that are inconsistent with a reference
genome; read-depth methods, which identify CNV based on read depth of

5 copy number and structural variation 114
sequence alignments, similar to PCR based methods; split-read approaches,
which identify structural variation break points by identifying breaks in se-
quence alignment due to multiple reads; and sequence assembly comparisons,
where de novo assembled genome sequences are aligned to identify structural
variation [reviewed by, 297]. These approaches combined have the potential to
identify all types of structural variation, however are limited by the sequencing
read-length, sequence fragment sizes, library construction and uniqueness of
the genome region, factors that limit the effective detectable size of structural
variation to less than 1 kb.
5.1.3.1 Analysis of CNV at 7q34-q36 using aCGH
To examine the 7q34-q36 disease interval for pathogenic structural variation
two analysis were carried out in this thesis; karyotyping to detect microscopic
structural variation and high-density oligonucleotide aCGH targeted to the
7q34-q36 disease interval to detect deletions and duplications. To confirm
a structural variation as pathogenic would require: The structural variation
segregates with disease in CMT54; it is a novel structural variation, not reported
in the normal population or healthy controls; the structural variation has a
putative functional mechanism disrupting a gene or regulatory element; and
the structural variation must be validated by a second method.
Array CGH is a flexible technology that allows the design of custom microar-
rays targeted to specific regions of the genome. In this study an oligonucleotide
array was designed to target the 7q34-q36 disease interval. To detect CNV,
aCGH measures the relative amounts of test and reference DNA which bind
competitively to the array (Figure 5.2). While not providing a characterisation
of all structural variation, high-density aCGH combined with karyotyping
should identify the majority of structural variation within the 7q34-q36 interval.

5 copy number and structural variation 115
Sample DNA
Reference DNA
Digest and label DNA
Cy:5
Cy:3
Hybridise to array
Duplication Deletion
Detect and quantify Cy3:Cy5 signal ratios
Cy3
:Cy5
rati
o
Genomic position
Figure 5.2: aCGH analysis. Genomic DNA from the test sample is digested andlabelled with a contrasting flurophore to a reference DNA mixture. Both labelleddigested DNAs are hybridised to an array and the relative amounts of each DNAfragment are quantified. A plot of the log ration of test over reference identifiesintervals that are duplicated and deleted.
5.1.4 Hypothesis and Aim
It is hypothesised that dHMN seen in family CMT54 is caused by a single gene
mutation within the linked region on chromosome 7q34-q36. This mutation
may be a CNV or structural variation. The aims of this chapter are to:
• Identify microscopic CNV or structural variation using karyotyping of
chromosomal spreads.
• Identify any molecular level CNV using aCGH.
5.2 materials and methods
5.2.1 Custom CGH Microarray
CNV analysis was carried out using the Agilent 60-mer oligonucleotide mi-
croarray CGH for genomic DNA. An Agilent SurePrint G3 custom CGH
microarray 4x 180K was designed using Agilent Technologies Earray software
(release 6.5; https://earray.chem.agilent.com). The 7q34-q36 disease inter-
val and 100 Kb of flanking sequence was targeted with all available probes

5 copy number and structural variation 116
included. The design included 117636 probes to the chromosome 7q34-q36
disease interval, the Human CGH 3k Agilent Normalization Probe Group and
5 × the Human CGH 1k Agilent Replicate Probe Group. The average distance
between probes in the chromosome 7q34-q36 interval was 109 bp.
5.2.2 Array processing
Genomic DNA (gDNA) from the three clinically affected and one married
in control (section 6.2.2) as well as the Agilent SurePrint G3 custom CGH
microarray, was forwarded to the Department of Cytogenetics, the Children’s
Hospital at Westmead (Artur Darmanian, Senior Hospital Scientist) for aCGH
analysis. Arrays were processed following the Agilent Oligonucleotide Array-
Based CGH for Genomic DNA Analysis Protocol Version 5.0, (June 2007), using
the direct method for sample preparation (Figure 5.3). Briefly, for each sample
analysed, an equal amount of control human gDNA (Female 100ug (Promega)
Cat: G1521, Male 100ug (Promega) Cat: G1471) was prepared. Genomic DNA
was digested with AluI and RsaI restriction enzymes. Digested sample and
control DNA were alternatively labelled with random primers and Cyanine
3-dUTP (Cy3) or Cyanine 5-dUTP (Cy5). Following clean-up of labelled gDNA,
samples were prepared for hybridisation by mixing Cy3 and Cy5 labelled
gDNA with blocking and hybridisation buffers. Samples and arrays were
hybridised to the arrays for 19 hours at 65 °C. After washing, slides were
scanned using Agilent Microarray Scanner, model G2505B. Feature extraction
was carried out using the software, Genomic Workbench Standard Edition
version 5.0.14 (Agilent Technologies).

5 copy number and structural variation 117
Experimental sample gDNA
?Restriction digestion of gDNA
?Labelling of gDNA
?Purification of labelled gDNA
?Preparation before hybridisation
?19-hour hybridisation (65 °C)
?Microarray washing
?Microarray scanning
?
Feature extraction
Experimental sample gDNA
?Restriction digestion of gDNA
?Labelling of gDNA
?Purification of labelled gDNA
Figure 5.3: Workflow for Agilent aCGH using the Direct method.
5.2.3 Software Nexus 5
Feature extracted aCGH data was segmented with Nexus 5.0 (BioDiscovery)
using the rank segmentation algorithm. The significance threshold for segmen-
tation was set at 10-6 and the minimal number of probes required per segment
was 3. Copy number gains and loss were defined with a log2 Cy3/Cy5 ratio
of 0.2 and -0.2 respectively. High gains and homozygous losses were defined
with a ratio of 0.6 and -0.7 respectively.
5.2.3.1 UCSC genome browser
Copy number variation coordinates were exported from the Nexus 5 software
in bedGraph file format using the Human Mar. 2006 (NCBI36/hg18) assembly
reference then uploaded to the UCSC Genome browser [http://genome.ucsc.
edu, 210]. CNVs were compared to the following UCSC genome browser tracks:

5 copy number and structural variation 118
UCSC Genes, Database of Genomic Variants: Structural Variation and Segmental
Duplications.
5.2.3.2 CHOP Copy Number Variation project
Copy number variations identified with Nexux 5 software were checked against
the Copy Number Variation project at the Children’s Hospital of Philadelphia
(CHOP) (CNV.CHOP.org), a database of CNVs from over 2000 healthy children.
The UCSC liftover tool (http://genome.ucsc.edu) [210] was used to convert
the coordinates of CNVs from NCBI36/hg18 format generated by the Nexux
5 software, to the NCBI35/hg17 format used by the CHOP Copy Number
Variation project.
5.2.4 PCR confirmation of deletions
PCR amplicons were designed to bridge identified CNV based on the coordi-
nates generated from Nexus 5 software with primers designed to sequences
flanking each end of the identified CNV. PCR and sequencing protocols are
described in Chapter 2. Sequence generated from PCR bridging deletions was
aligned to the Human Mar. 2006 (NCBI36/hg18) assembly reference using the
BLAT alignment tool from the UCSC genome browser [198].
5.3 results
5.3.1 Cytogenetic analysis
Cytogenetic analysis was carried out to investigate if microscopic structural
variations are present in affected individuals in CMT54. Peripheral blood was
collected from clinically affected individual III:14 (Figure 3.5) and forwarded

5 copy number and structural variation 119
to the Department of Cytogenetics, the Children’s Hospital at Westmead (Dr
C Rudduck, Cytogeneticist). Five Trypsin (GTL) banded metaphases were
counted from 10 out of a total of 15 cells. Trypsin (GTL) banding showed a
female karyotype (46, XX) with no abnormalities detected.
5.3.2 CNV analysis at 7q34-q36 using aCGH
The 7q34-q36 dHMN1 disease interval was investigated in detail for deletions
and duplications using Agilent 60-mer oligonucleotide microarray CGH for
genomic DNA analysis. Three affected individuals and one married in control
individual from pedigree CMT54 were analysed. Based on the haplotype
analysis at 7q34-q36 carried out previously, the most genetically distant family
members were selected. The three affected individuals (Figure 3.5: II:1, III:9,
III:12) carry the disease chromosome and a unique alternate chromosome
at 7q34-q36. The healthy control individual (Figure 3.5: II:7) is the married
in parent of affected individual III:9 and therefore shares the non-disease
chromosome at 7q34-q36.
Using the Nexus 5 software a total of 89 unique CNVs were identified
within the 7q34-q36 interval screened at high resolution (Appendix I). These
CNVs included 40 duplications and 49 deletions. These CNVs had a mean
size of 3847 bp, with a range from 4 bp to 110312 bp. The size distribution of
identified CNV, showed most CNVs were sub-microscopic (< 3 kb) with the
largest proportion less than 500 bp (Figure 5.4). This matched the expected
distribution, with smaller CNVs more common [297].
The location of the CNVs were plotted against the 7q34-q36 interval for
the three affected individuals and the control individual (Figure 5.5). Two
heterozygous duplications and six heterozygous deletions were common to
the three affected individuals. The coordinates of the ends of the CNV were

5 copy number and structural variation 120
Perc
en
tag
e o
f C
NV
calls
0
5
10
15
20
25
30
35
40
45
50
CNV size (bp)50
0.0
1.5k
2.5k
3.5k
4.5k
5.5k
6.5k
7.5k
8.5k
9.5k
10k
30k
50k
70k
90k
110k
Figure 5.4: The proportion of CNV calls within each size range. The CNVs werecounted in 500 bp blocks up to 10 kb, then counted in 10 kb blocks. The size distributionof the CNVs identified matches the expected distribution, with smaller CNVs morecommon.
checked to ensure identity. CNVs that were not present in all three affected
individuals were excluded. Of the eight CNVs identified in the three affected
individuals, both duplications and two deletions were also present in the
control individual and excluded. The remaining four deletions, labelled A, B,
C and D were examined further (Figure 5.5).
5.3.2.1 Deletion A
Deletion A involves the loss of up to 178 kb of DNA from within the olfactory
receptor gene cluster at 7q35. The size of the deletion is different between
the three affected individuals; affected individual III:9 shows a single large
deletion of 178 kb, whereas affected individuals II:1 and III:12 have two smaller
deletions of 55.6 kb and 110.3 kb separated by a 12.1 kb gap, maintaining the
same overall size as the deletion in III:9. The probe plot generated with the
Nexux 5 software shows different Log2 cy3/cy5 ratios for the two deletion
patterns in affected individuals (Figure 5.6). Healthy control individual II:7
shows slight gain in Log2 cy3/cy5 ratio across this region, but is below the
threshold for a duplication call.

5 copy number and structural variation 121
123
123
CNVAffectedSamples
CNVHealthySample
7q34 7q35 7q36.1 7q36.2Cytogenetic map
Genes
Chromosome 7
5Mb
DGV Struct Var
MPCI
Del A Del B Del C Del D
Figure 5.5: Array CGH analysis in CMT54. Top: Chromosome 7 ideogram depicting thelocation of the 7q34-q36 disease locus analysed using aCGH (UCSC genome browser).Middle: detail of the 7q34-q36 disease locus. Figure labels indicate the following:cytogenetic map, minimum probable candidate interval (green bar), known genes,and known CNV from DGV. Bottom: Detail of CNV identified with Nexux5 softwarefor three affected individuals and one healthy married in parent from CMT54. Theupper graph shows number of affected individuals carrying deletions (red bars) andduplications (green bars). The lower graph shows CNVs carried by the healthy marriedin parent. Four deletions labelled A-D are carried by all three affected individualsand not by the control individual. Two additional deletions and two duplications arecarried by all three affected individuals as well as the control individual.
The Nexux 5 genome browser indicated that there is a reported CNV at this
location. Examination of reported CNV from DGV using the UCSC genome
browser showed several reported duplications, deletions and inversions at this
location (Figure 5.7). In particular, two CNV reports match the coordinates of
the 178 kb deletion seen in affected individual III:9 (DGV; variation_0726 and
variation_2110). These reports identified both duplication and deletion of this
interval. In addition, two deletions (DGV; variation_94938 and variation_94944)
and two duplications (DGV; variation_82238 and variation_82244) matched the
55.6 kb and 110.3 kb deletions identified in affected individuals II:1 and III:12.
Further complicating the situation, two small duplications were reported which
match the size of the 12.1 kb gap (DGV: variation_70060 and variation_82243).
It is possible that affected individuals II:1 and III:12 carry a duplication of
the 12.1 kb interval in addition to the larger deletion A. However, additional

5 copy number and structural variation 122
55.6 110.3 kb
178 kb
55.6 110.3 kb
Figure 5.6: CNV probeplot around deletionA. Top: Genomic loca-tion, probe design andreported CNV’s. Mainpanels: CNV probe plotsgenerated with Nexussoftware around dele-tion A. The log2 test-over-reference ratios ofhybridisation signals isplotted against genomicposition. Each probe isrepresented by a bluedot and the size of dele-tion is indicated by thered scale bar. The upperthree panels shown af-fected individuals II:1,III:9, and III:12, andthe lower panel showshealthy control individ-ual II:7. Affected in-dividual III:9 shows a178 kb deletion and af-fected individuals II:1and III:12 show twosmaller deletions of55.6 kb and 110.3 kb, in-dicated by the red scalebar below each probeplot. Control individ-ual II:7 has a slightgain across this regionwhich does not reachsignificance.

5 copy number and structural variation 123
chr7 (q35) 13 21.11 31.1 33 q34 35Scalechr7: 100 kb143550000 143600000 143650000 143700000----UCSC Genes Based on RefSeq, UniProt, GenBank, CCDS and Comparative GenomicsDatabase of Genomic Variants: Structural Variation (CNV, Inversion, In/del)CTAGE4FLJ43692FLJ43692 OR2A1 FKSG35OR2A9PBC040701OR2A7LOC728377CTAGE4 FKSG35FKSG35OR2A9P OR2A42 ARHGEF5ARHGEF5ARHGEF537083296237282949409493682237822359493459622700586497631398457145729493976127006137567 822397006294941 21100726822408224194937649753951194935822428223694942949438223894938 59845372837006082243 94944822447006337284 700578224594945 45737005670059 64974Affected (II:1)Affected (III:12)Affected (III:9)Control (II:7)Figure 5.7: UCSC genome browser views of deletion A. Detail of deletion A andreported CNVs from DGV. The deletions in the affected individuals are shown asorange bars. No CNV is shown for the healthy control individual. UCSC genes andDGV structural variation tracks are shown. Colour in the DGV structural variationtrack indicates the type of variation relative to the reference: purple indicates inversions,red indicates a gain in size, blue indicates loss in size, and green indicates both a lossand a gain in size.

5 copy number and structural variation 124
evidence would be required to confirm this. These size matches are likely due
to the same array platform and probe set being used in the experiments which
reported these CNVs as used in this experiment [311–313]. Numerous other
reported CNVs overlap deletion A.
To confirm the break points of deletion A, three PCR primer sets were de-
signed from the Nexuxs 5 software coordinates. Despite a robust optimisation
protocol, no PCR products were amplified. This suggests deletion A may be
more complex than indicated, or the deletion co-ordinates may be too far from
the true break point to allow PCR amplification.
The interval affected by deletion A contains several olfactory receptor genes
and one candidate gene ARHGEF5, located at the distal end of the deletion
(Figure 5.7). Three alternate transcripts are shown for ARHGEF5, two of which
are partly deleted and one entirely deleted. The deletion or duplication of
ARHGEF5 has been identified in numerous healthy individuals, from different
populations, in at least three studies [311–313]. This suggests that ARHGEF5
CNV is not involved in the pathogenesis of dHMN linked to 7q34-q36 and
deletion A is highly likely to be a common population variant.
5.3.2.2 Deletion B
Deletion B involves the loss of 5.4 kb of DNA from 7q35. The size of this
deletion is between 5.4 kb and 5.2 kb for the three affected individuals. The
probe plot generated with the Nexus 5 software shows the Log2 cy3/cy5 ration
varies between the three affected individuals (Figure 5.8). The healthy control
individual also shows a reduction in the Log2 cy3/cy5 ratio which is below the
threshold for a deletion call. The Nexus 5 genome browser shows a reported
CNV in this location (Figure 5.9 top panel). Examination of reported CNV
from DGV using the UCSC genome browser showed two deletions of similar
size to deletion B (Figure 5.9). Furthermore, no genes are located within or

5 copy number and structural variation 125
nearby this deletion. Therefore deletion B is likely to be a normal population
variant and non-pathogenic in CMT54.
5.3.2.3 Deletion C
Deletion C involves the loss of intronic sequence from CNTNAP2, 14Kb down-
stream and 80Kb upstream of the closest two exons. While CNTNAP2 spans
the proximal end of the minimum probable candidate interval in CMT54, this
deletion is located outside the minimum probable candidate interval. The size
of the deletion is 1.4-1.5 kb in the three affected individuals and is absent from
the control individual. The probe plot generated with the Nexux 5 software
shows an equal reduction in the Log2 cy3/cy5 ratio between the three affected
individuals and no reduction in the control individual. No CNV was reported
in this location by the Nexus genome browser, however, a single deletion at
this location was reported in DGV (DGV; variation_64982) (Figure 5.11).
To check for segregation in CMT54 and screen additional healthy controls,
PCR primers were designed flanking deletion C based on the coordinates from
the Nexus 5 software. The PCR primers were located outside the deletion, with
an expected amplicon size of ∼2 Kb for normal chromosomes and ∼600 bp for
chromosomes with the deletion. Amplification from affected individuals in
CMT54 produced only the 600 bp PCR product. The 2 kb PCR product was not
seen in any affected individuals from CMT54 or 36 control samples indicating
the 2 kb product was not amplified by the PCR as opposed to the deletion being
homozygous. To confirm the specificity of the PCR, the 600 bp PCR product
from an affected individual was sequenced and aligned to the Human Mar.
2006 (NCBI36/hg18) assembly using the BLAT tool from the UCSC genome
browser. The sequence aligned with 100% identity to the flanking sequence
around deletion C (Figure 5.11). This alignment confirmed the size of the
deletion as 1098 bp, smaller than indicated by the Nexux 5 software, possibly
due to a lower number of probes at the distal end of the deletion (Figure 5.11).
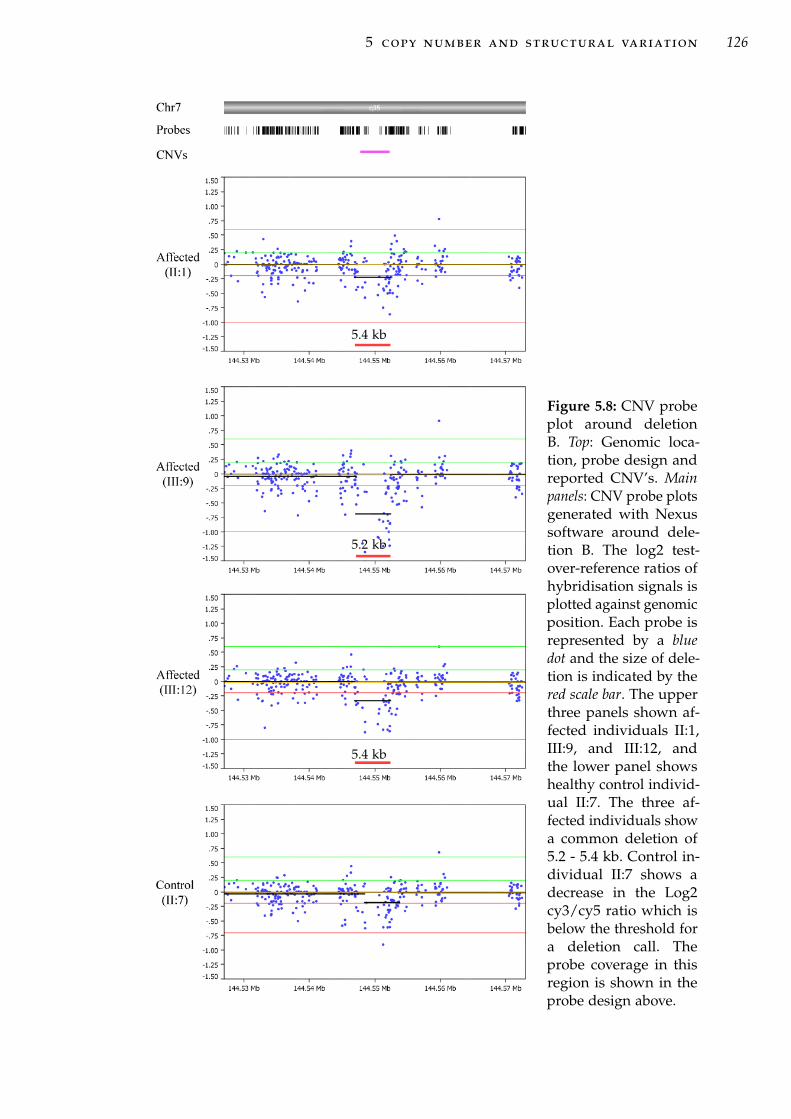
5 copy number and structural variation 126
5.4 kb
5.2 kb
5.4 kb
Figure 5.8: CNV probeplot around deletionB. Top: Genomic loca-tion, probe design andreported CNV’s. Mainpanels: CNV probe plotsgenerated with Nexussoftware around dele-tion B. The log2 test-over-reference ratios ofhybridisation signals isplotted against genomicposition. Each probe isrepresented by a bluedot and the size of dele-tion is indicated by thered scale bar. The upperthree panels shown af-fected individuals II:1,III:9, and III:12, andthe lower panel showshealthy control individ-ual II:7. The three af-fected individuals showa common deletion of5.2 - 5.4 kb. Control in-dividual II:7 shows adecrease in the Log2cy3/cy5 ratio which isbelow the threshold fora deletion call. Theprobe coverage in thisregion is shown in theprobe design above.

5 copy number and structural variation 127
chr7 (q35) 33 34 35Scalechr7: 2 kb144548000 144549000 144550000 144551000 144552000 144553000----UCSC Genes Based on RefSeq, UniProt, GenBank, CCDS and Comparative GenomicsDatabase of Genomic Variants: Structural Variation (CNV, Inversion, In/del)657864979Affected (II:1)Affected (III:12)Affected (III:9)Control (II:7)Figure 5.9: UCSC genome browser views of deletion B. Detail of deletion B andreported CNVs from DGV. The deletions in the affected individuals are shown asorange bars. No CNV is shown for the healthy control individual. UCSC genes andDGV structural variation tracks are shown. Colour in the DGV structural variationtrack indicates the type of variation relative to the reference: blue indicates loss in size.
Using this PCR as a test, the deletion was present in all 10 affected individuals
in CMT54 and the unaffected individual III:3 who carries the proximal end
of the disease haplotype after a genetic recombination event. None of the
remaining unaffected family members or spouses from CMT54 carried the
deletion. A screen of 36 unrelated healthy control individuals identified three
individuals with deletion C (Figure 5.12). With the deletion reported in DGV
and present in three of 36 healthy controls, deletion C was excluded as a
normal population variant.
5.3.2.4 Deletion D
Deletion D involves a loss of sequence from an intragenic region within the
minimum probable candidate interval in CMT54. The closest gene is ACTR3C
∼93 Kb downstream. The size of this deletion ranges from 1.9 kb to 2.6 kb
in the three affected individuals. The probe plot generated with the Nexus 5
software shows a variable Log2 cy3/cy5 ratio for the deletion between the three
affected individuals (Figure 5.13). In addition, the healthy control individual
also shows a reduction in the Log2 cy3/cy5 ratio, but is below the threshold
for a deletion call. In this location, the Nexus 5 genome browser showed a
known CNV and DGV contained 5 deletions, 1 insertion and 1 insertion and

5 copy number and structural variation 128
1.4 kb
1.5 kb
1.4 kb
Figure 5.10: CNV probeplot around deletionC. Top: Genomic loca-tion, probe design andreported CNV’s. Mainpanels: CNV probe plotsgenerated with Nexuxsoftware around dele-tion C. Each blue dotrepresents a probe. TheY-axis represents thelog2 test-over-referenceratios of hybridisationsignals. The X-axis rep-resents the genomic po-sition. The upper threepanels shown affectedindividuals II:1, III:9,and III:12, and thelower panel shows con-trol individual II:7. Af-fected individuals showa 1.4-1.5 kb deletion, in-dicated by the red scalebar below each probeplot. Control individ-ual II:7 does not showany CNV in this region.The probe coverage inthis region is shown inthe probe design above.There are no reportedCNVs in this region.

5 copy number and structural variation 129
chr7 (q35) 33 34 35
Your Sequence from Blat Search
A.
B.
Scalechr7:
Figure 5.11: (A) UCSC genome browser views of deletion C. Detail of deletion C andreported CNVs from DGV. The deletions in the affected individuals are shown asorange bars. No CNV is shown for the healthy control individual. UCSC genes andDGV structural variation tracks are shown. Colour in the DGV structural variationtrack indicates the type of variation relative to the reference: blue indicates loss in size.(B) Characterisation of break points of deletion C. PCR was targeted to the deletionallele and sequenced in two affected individuals. A BLAT search on the Human Mar.2006 (NCBI36/hg18) assembly18 aligned the sequence to the position of deletion C.The deleted area is the arrowed line joining the two sequence blocks. All three CNVresults from the NEXUS CNV analysis over reported the true size of the deletion(1098bp) due to a low density of probes at the 5’ end of the deletion.
M 1 2 3 4 5 6 7 8 9 10 11 12 13 14 15 16 17 18 19
M 20 21 22 23 24 25 26 27 28 29 30 31 32 33 34 35 36 37 38
Figure 5.12: Genotyping of control individuals for deletion C. Lanes marked M areHyperLadder IV DNA size marker, lanes 1 and 2 are CMT54 positive controls, lane3 is the PCR negative control, Lanes 4-37 are healthy control samples, and lane 38is samples 29-37 pooled before PCR. Normal controls 21, 23 and 34 are positive fordeletion C, indicating it is a normal population variant.

5 copy number and structural variation 130
deletion (Figure 5.14). Therefore, deletion D is a normal population variant
and non-pathogenic in CMT54.
5.4 discussion
5.4.1 Summary
While CNV is a known mechanism in dHMN and the related peripheral neu-
ropathy CMT1A, the evidence presented here suggests that CNV is not the
cause of disease in this instance. Cytogenetic analysis at a microscopic reso-
lution did not indicate any deletion, duplication or other structural variation
present at the 7q34-q36 interval. CNV analysis at a sub-microscopic resolution
using aCGH identified 89 unique duplications and deletions. Four deletions
were present in the three affected family members and not the married in
healthy control. However, no putative pathogenic link could be established for
these deletions and all were excluded. These results are in agreement with the
heterozygosity observed for microsatellite markers across the 7q34-q36 inter-
val (Chapter 3). Microsatellite markers can detect duplications by observing
increased allele dosage or number of alleles, whereas deletions are observed
by loss of heterozygosity. No unexplained homozygosity or additional alleles
were observed during microsatellite analysis.
5.4.2 Comparison of methods for CNV analysis
None of the CNV identified using aCGH were reported by the cytogenetic
analysis. The majority of the CNV identified by aCGH was sub-microscopic,
with the majority of CNV below 1.5 kb. The larger CNV identified ranged
in size from 12-110 kb, well below the 1-10 Mb resolution observable by
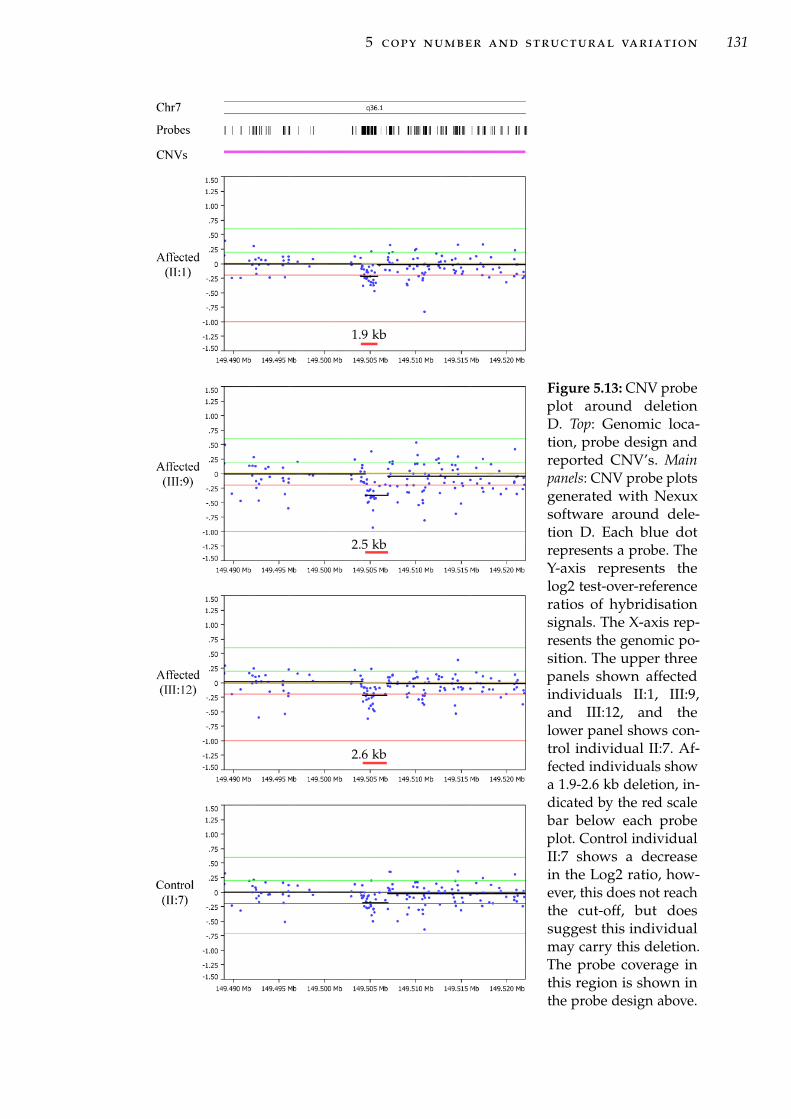
5 copy number and structural variation 131
1.9 kb
2.5 kb
2.6 kb
Figure 5.13: CNV probeplot around deletionD. Top: Genomic loca-tion, probe design andreported CNV’s. Mainpanels: CNV probe plotsgenerated with Nexuxsoftware around dele-tion D. Each blue dotrepresents a probe. TheY-axis represents thelog2 test-over-referenceratios of hybridisationsignals. The X-axis rep-resents the genomic po-sition. The upper threepanels shown affectedindividuals II:1, III:9,and III:12, and thelower panel shows con-trol individual II:7. Af-fected individuals showa 1.9-2.6 kb deletion, in-dicated by the red scalebar below each probeplot. Control individualII:7 shows a decreasein the Log2 ratio, how-ever, this does not reachthe cut-off, but doessuggest this individualmay carry this deletion.The probe coverage inthis region is shown inthe probe design above.

5 copy number and structural variation 132
chr7 (q36.1) 33 34 35Scalechr7:chr7:153033636 5 kb 149505000 149510000----UCSC Genes Based on RefSeq, UniProt, GenBank, CCDS and Comparative GenomicsDatabase of Genomic Variants: Structural Variation (CNV, Inversion, In/del)Duplications of >1000 Bases of Non-RepeatMasked Sequence3709271636647649849495932964 94960Affected (II:1)Affected (III:12)Affected (III:9)Control (II:7)Figure 5.14: UCSC genome browser views of deletion D. Detail of deletion D andreported CNVs from DGV. The deletions in the affected individuals are shown asorange bars. No CNV is shown for the healthy control individual. UCSC genes andDGV structural variation tracks are shown. Colour in the DGV structural variationtrack indicates the type of variation relative to the reference: red indicates a gain insize, blue indicates loss in size, and green indicates both a loss and a gain in size. Theyellow bar shows a segmental duplication on 7q36.1.
cytogenetic analysis. Therefore the karyotyping and CNV analysis are both in
agreement.
The methods used here sufficiently overlap in resolution to conclude that
microscopic structural variation and all scale of insertions and deletions are
unlikely to be responsible. There remains the possibility that sub-microscopic
balanced structural variation may be present within the 7q34-q36 interval. The
resolution of the custom oligonucleotide based aCGH used here was high
enough in most places to identify CNV and overlaps with resolution to detect
indels (CNV) with direct sequencing of exons.
The NGS data generated by targeted sequence capture was not amenable
to structural variation analysis with the computer resources available. The
analysis of this data for evidence of structural variation including inversions
and insertions or the characterisation of the breakpoints of the identified
structural variation to a base pair resolution should be perused if sufficiently
powerful computing resources become available to the research group.

5 copy number and structural variation 133
5.4.3 Limitations of array-based CGH
The CNVs reported in databases have been identified from individuals con-
sidered to be clinically normal. It is possible that apparently normal/healthy
individuals will later develop disease. The larger the cohorts the greater the
chance of including asymptomatic carriers of disease alleles. This has occurred
in the case of the duplication that causes CMT1A. This duplication has been
reported in a population based study of CNV [314] where the deletion was
found in apparently normal individuals. This is also likely to be a concern
with the CHOP variation database which has used healthy children as a sam-
ple group. This limits the usefulness of these as controls to exclude CNV as
pathogenic. To use reported CNVs as controls for excluding pathogenic CNV,
the CNV needs to be either; identified in multiple individuals, at a rate above
the frequency of the disease in the general population; or from a control group
that has been clinically examined and is not at risk of developing the disease.
The prevalence of autosomal dominant dHMN is much lower than CMT1A
(20 per 100 000) and CMT2 (2 per 100 000) [315], so reported CNV are suitable
for filtering CNVs in dHMN.
The size of reported CNVs also needs to be considered when filtering po-
tential CNV mutations. The size of reported CNVs is generally over-estimated
due to the limited resolution of the techniques used to create initial CNV
maps [295]. The large CNVs reported from platforms with limited resolution
may contain several smaller CNVs. The sequencing of deletion C here, shows
that with a high probe density, the size of the deletion was only slightly over
represented by the aCGH results. Thus, the size of CNVs within 7q34-q36 is
relatively accurate and can be compared to reported CNVs identified with
similar platforms.

6N E X T G E N E R AT I O N S E Q U E N C I N G O F C M T 5 4
6.1 introduction
The recent development of new sequencing technologies has revolutionised
the strategies for the identification of genetic defects underlying disease. These
new sequencing technologies are collectively referred to as next generation
sequencing (NGS) and encompass; DNA template preparation, sequencing,
data handling and bioinformatics [316]. NGS can generate very large amounts
of sequence data. This has led to a shift in focus from data generation (template
preparation and sequencing) to data analysis and validation. NGS is particular-
ity useful for the identification of disease genes and for targeted re-sequencing
of disease intervals defined by linkage analysis or genome-wide association
studies (GWAS). The development of NGS continues to rapidly advance and
associated costs have dropped so that NGS has become increasingly accessible.
This chapter details the application of NGS for the identification of genetic
variation in family CMT54 at both the 7q34-q36 dHMN disease interval and
elsewhere in the genome.
6.1.1 NGS technology
Multiple NGS platforms were used in this study. As described below, NGS
platforms vary in the methods and biochemistry used in each step. For detailed
134

6 next generation sequencing of cmt54 135
descriptions of currently available NGS platforms see reviews by Metzker [316]
and Shendure and Ji [317].
6.1.1.1 Template preparation
For the NGS platforms used here, template preparation, or library genera-
tion, involves the fragmentation of template DNA followed by immobilisation
on solid supports. The immobilisation of template fragments is the key to
achieving the massive parallel sequencing required to achieve high sequencing
throughput and low costs. For the detection of fluorescent sequencing sig-
nals, most instruments require amplification of the DNA template fragments.
Template amplification is generally achieved by emulsion or solid phase PCR.
Both approaches use an adapter ligated shotgun library and a single-primer
set, multi-template PCR. Physical separation of template fragments is used
to maintain single template specificity in PCRs, otherwise known as clonal
amplification.
For example, the 454 sequencing system (Roche) uses a water in oil emulsion
PCR where the template fragment concentration is controlled to achieve, at
most, a single template molecule in each emulsion reaction compartment [318].
PCR products are captured to micron-scale beads included in the emulsion.
After breaking the emulsion each bead contains PCR products from a single
template fragment (Figure 6.1 a). Beads are immobilised by chemical attach-
ment to a glass slide or picotitre plate. Alternatively, the Solexa sequencing
system (Illumina) uses bridge PCR, with PCR primers fixed to a solid support.
Adapter ligated template fragments are bound to complementary probes on
a sequencing slide. The concentration of template fragments is controlled to
achieve physical separation of initial template fragments. After PCR amplifica-
tion, template clusters contain copies of a single template fragment (Figure 6.1
b). Increased instrument sensitivity allows the Helicos sequencing systems
(Helicos Biosciences) to sequence from single-molecule templates, avoiding the

6 next generation sequencing of cmt54 136
Figure 6.1: Clonal amplification of immobilised template DNA in NGS. (a) Water-in-oil emulsion PCR. An adapter-ligated shotgun library is PCR amplified withinemulsion compartments. One PCR primer is attached to the surface of micron scalebeads included in the reaction. The concentration of template and beads is adjustedto achieve one template molecule per compartment. After breaking the emulsion,beads contain only one type of template molecule which are then fixed to a slideor picotitre plate. (b) Bridge PCR. Both PCR primers densely coat the surface of thesolid support slide. The initial concentration of the adapter-linked shotgun library iscontrolled to achieve physical separation between template molecules. PCR productsremain tethered near the original template fragment resulting in clonal clusters ofPCR products from single templates. Figure adapted from [317].
need for template amplification. As no amplification is needed, templates are
bound directly to supports with a primer or other adapter probe.
6.1.1.2 Sequencing Biochemistries
The NGS platforms used in this thesis are based on pyrosequencing and
reversible terminator sequencing biochemistries. Several other sequencing
biochemistries are currently available or under development and include
sequencing by ligation [319], semiconductor based sequencing [320] and real-
time sequencing [321].
Pyrosequencing is based on the detection of the pyrophosphate released
upon nucleotide incorporation during strand extension by DNA polymerase
[322, 323]. In brief, one of the four dNTP types is added to the sequencing
reaction and pyrophosphate released stoichiometrically is detected by chemi-
luminescence through a a set of enzymatic reactions using sulfurylase and
luciferase. In this reaction, pyrophosphate is converted to ATP by sulfurylase,

6 next generation sequencing of cmt54 137
which in turn is used by luciferase in the conversion of luciferin to oxyluciferin,
generating light in proportion to the amount of available ATP. Nucleotides are
sequentially cycled to generate a fluorescence flow diagram from which the
sequence can be read [324].
Reversible terminator based sequencing utilises cyclic addition of dNTPs
modified with a reversible terminator capping the 3’-OH and fluorescent
tag used in a similar way to dideoxynucleotides (ddNTPs) used in Sanger
sequencing [316]. In brief, after each nucleotide extension and imaging, excess
dNTPs are washed off and the fluorescent label and the strand terminator are
cleaved, restoring the 3’-OH, allowing extension in the subsequent extension
cycle. NGS systems using reversible terminators have been developed using
both four color individually tagged dNTPs (used here) [325] or single color
tags with sequential extension [326].
6.1.1.3 Data handling and bioinformatics
The current NGS instruments produce short sequence reads from the the end(s)
of longer DNA fragments making up the sequencing library. Read lengths
produced by current instruments include ’short-reads’ of 25-100 base pair (bp)
or ’long-reads’ of 250-800 bp [316]. Reads can be made from a single end of a
DNA fragment or can be read from both ends as ’paired-end’ reads. Paired-end
reads have advantages in assembly accuracy over single reads, in particular for
repeat and duplicated sequences [327]. This is a greater limitation for short-
reads than long-reads. Sequence reads are aligned to form longer sequence
contigs by mapping to a reference genome [328] or de novo assembly [329]. For
disease gene discovery, further bioinformatics may include, sequence variant
calling, annotation (genes, exons, known SNPs), copy number variation, and
segregation/inheritance analysis.

6 next generation sequencing of cmt54 138
6.1.2 NGS of large genomes
NGS is ideally suited to whole genome sequencing, particularly for smaller
prokaryote genomes [318]. While this is the ultimate approach for identifying
sequence variation within an individual, this remains costly in large genomes,
especially where higher read depths are required for accurate identification
of heterozygous variants [330]. To overcome this, several non-cloning based
approaches to genomic partitioning have been developed to enrich for genomic
regions of interest suitable for NGS. These include pooled PCR products,
multiplex PCR, and hybridisation sequence capture [331]. PCR based targeted
enrichment still requires a large preparation workload and is best suited to
small numbers of targets.
Hybridisation based sequence capture, either array-based or solution-based,
has allowed the generation of DNA libraries targeting specific genomic in-
tervals at an effective speed and cost [332]. Hybridisation sequence capture
is based on the construction of a small-fragment DNA library of defined se-
quences of interest to which sample DNA is hybridised; thus allowing for
uniform recovery of sequences of interest [333]. This was demonstrated by the
targeted capture of all known coding exons of the human genome [332]. The
protein coding portion of the genome is referred to as the exome. Using larger
standardised arrays has reduced the cost of exome capture and sequencing
[334]. In addition, as most known disease causing mutations are located in
coding regions, the exome is a high yield target for research [324]. Exome
sequencing has recently become a popular approach for the identification of
Mendelian disease mutations [335].

6 next generation sequencing of cmt54 139
6.1.3 Applications of NGS to Mendelian disease
With many human genomes now sequenced, the number of known single bp
sequence variants or small indels is over ∼3.4 million [336]. An examining of
only the protein coding portion of the genome identified an average of 17 272
coding variants per individual [334]. As mutations causing rare Mendelian
diseases are expected to be highly penetrant, SNPs that are common can be
excluded. The majority of sequence variants within an individual are common
SNPs. Studies have shown that around 92% of coding variants identified or 82%
of all sequence variants, were previously reported in SNP databases [334, 336,
337]. The identification of a single highly-penetrant disease causing variant
from several thousand variants requires a comparison of several individuals
and filtering strategies to reduce the number of variants to be validated.
The first successful application of NGS to the identification of a mutation in
a Mendelian disease was in the recessive disease, Miller syndrome [338]. Four
affected individuals including two siblings and two other affected individuals
from three families were exome sequenced. Under an autosomal recessive
model, only one candidate gene was shared between individuals from the
three families. Compound heterozygous mutations were identified in the gene
DHODH in all affected individuals. Confirmation with Sanger sequencing
showed that the mutations were inherited in a autosomal recessive manner,
and parents were heterozygous carriers of the mutations. DHODH mutations
were subsequently identified in an additional three Miller syndrome families
using Sanger sequencing.
Combining sibling pairs and unrelated families is effective in recessive
diseases with low genetic heterogeneity. Autosomal dominant diseases are
generally more genetically heterogeneous, including dHMN and other neu-
ropathies where each gene mutation is only responsible for a small proportion

6 next generation sequencing of cmt54 140
of cases. As such, unrelated individuals are less likely to have mutations in the
same gene. Multiple individuals from a single pedigree are therefore required
for comparison. In the analysis of Miller syndrome by Ng et al. [338], both
autosomal recessive and dominant modes of inheritance were considered;
using a dominant model increased the number of potential gene variants by a
factor of 14-25 × compared to the recessive model. Due to the shared genetic
background of individuals in a single pedigree, there is a greater number of
genetic variants segregating with the disease by chance. In a practical sense, an
autosomal dominant disease requires the comparison of four related affected
individuals to achieve a similar number of candidate variants as a recessive
disease comparing three individuals [334, 338]. The number of potential vari-
ants does not significantly decrease by adding additional affected individuals
above 4 or 3 for dominant and recessive modes of inheritance respectively.
In the Miller syndrome analysis, comparison to eight unrelated control
individuals was a more effective way of reducing the total number of sequence
variants [338]. Under the autosomal dominant disease model, comparing two
affected individuals and 8 unrelated controls achieved a similar number of
novel variants as comparing only the four affected individuals. However, with
rapidly expanding public sequence variation databases, the effect of comparing
additional control individuals will be less.
Additional strategies for filtering out SNPs unrelated to disease have been
employed. Various software can predict the effect of a sequence variant on
protein function and implicate those likely to be damaging. However, there is
a risk of falsely excluding a true mutation due to inaccurate predictions [338].
Where the disease in a large pedigree has been mapped to a chromosomal locus,
combining NGS with mapping information can greatly reduce the number
of novel candidate variants. Sequencing of fewer individuals is required to
identify a disease mutation [339]. Based on the reported rates of variation
and linkage disequilibrium, ∼4 novel non-synonymous, splice site or indel

6 next generation sequencing of cmt54 141
(NS/SS/Indel) variants would be expected within a disease interval containing
100 genes when sequencing one affected individual [339].
6.1.3.1 Hypothesis and aims
It is hypothesised that dHMN seen in family CMT54 is caused by a single gene
mutation within the linked region on chromosome 7q34-q36. With a defined
disease locus containing a large number of candidate genes, the use of NGS
has the potential to identify the disease gene mutation in CMT54. The aim of
this chapter is to:
• Capture and sequence genomic regions of interest in family CMT54 using
NGS in order to identify the genetic variant causing dHMN.
6.2 materials and methods
6.2.1 NimbleGen array-based targeted sequence capture
6.2.1.1 NimbleGen sequence capture array design
Two custom 385K 1-plex arrays were designed and manufactured by Roche
NimbleGen to capture genomic sequence from the 7q34-q36 disease interval.
The 12.98 Mb interval was defined by genetic recombinations in affected
individuals in CMT54 (NCBI36/hg18 assembly coordinates; chr7:141 054 291-
154 034 394). Unique probes were designed to 13 348 tiled regions covering 9.03
Mb of sequence within the target interval. Probe tiling excluded repetitive
DNA unsuitable for capture.
6.2.1.2 NimbleGen DNA sequence capture
Genomic DNA was purified from peripheral blood following the protocol
described previously (Section 2.3.1). DNA was tested for purity by UV spec-

6 next generation sequencing of cmt54 142
trophotometer and degradation by agarose gel electrophoresis according to
NimbleGen quality control (QC) requirements. DNA (∼ 40 µg) was forwarded
to Roche Diagnostics (Asia Pacific) for sequence capture using the custom
385K arrays, following standard manufacturer protocol (Roche NimbleGen).
In brief, approximately 20 µg of genomic DNA was fragmented to a size range
of 300-500 bp then purified. Adapters were ligated to the DNA fragments
using T4 DNA Ligase and small fragments (< 100 bp) removed. The library
was hybridized to the custom 385K arrays. Un-bound DNA fragments were
removed by washing followed by elution of target DNA fragments. Eluted
target DNA fragments were PCR amplified using primers complementary to
the adapter sequence. The amplified DNA library was used in subsequent
sequencing reactions.
6.2.2 454 GS FLX sequencing
The Roche NimbleGen target captured DNA was forwarded to Australian
Genome Research Facility (AGRF) for sequencing using the Roche GS FLX
(454) sequencing platform according to the manufacturer’s protocol. Sequence
reads were aligned to the Human Mar. 2006 (NCBI36/hg18) assembly using
gsMapper software (Roche). Identification of sequence variants required at
least two non-duplicate reads with at least 5 bp of sequence flanking the variant.
Sequence variants were defined as ’high-confidence’ if they were identified in
three non-duplicate reads and both forward and reverse directions. Variants
were annotated to the SNP database, dbSNP build 129.

6 next generation sequencing of cmt54 143
6.2.3 NimbleGen array-based exome capture and Solexa sequencing
Genomic DNA from two affected individuals and one ’married in’ unaffected
parent was forwarded to BGI (Hong Kong) for exome capture and sequenc-
ing. Exome capture was carried out using the NimbleGen Sequence Capture
Human Exome 2.1M Array following the manufacturers protocol (Roche Nim-
bleGen). In brief, genomic DNA was randomly fragmented to an average size
of 500 bp then purified. Adapters were ligated to the DNA fragments using
T4 DNA Ligase and small fragments (< 100 bp) removed. The library was
hybridized to a NimbleGen 2.1M Human exome array. Unbound DNA frag-
ments were removed by washing followed by elution of target DNA fragments.
Eluted target DNA fragments were randomly fragmented and Illumina com-
patible adapters ligated. PCR amplification using primers complementary to
the Illumina adapters was used to enrich the material for downstream Solexa
sequencing.
Sequencing was carried out using an Illumina Genome analyser according
to the manufacturers protocol. Adapter sequences within reads were removed
and the remaining read sequence used only if longer than 29 bp (BGI local
programming algorithm). Sequence reads were aligned to the Human Mar.
2006 (NCBI36/hg18) assembly using SOAP aligner software using one read
end of paired end reads [340]. A maximum of 6 sequence variants were allowed
per read. Consensus sequence and sequence variant calling was carried out
using SOAPsnp software. Sequence variants were annotated to dbSNP build
129.
6 next generation sequencing of cmt54 144
6.2.4 Confirmation of sequence variants using Sanger sequencing
Sequence variants were confirmed by PCR amplification of selected exons and
sequencing by Macrogen (Korea) as described in Section 2.3.6.
6.2.5 Sequence variant analysis using Galaxy Browser
Sequence variants were analysed using Galaxy Browser software (http://
galaxyproject.org/) [341, 342]. Sequence variants were annotated using ge-
nomic coordinates for UCSC genes (UCSC genes track) downloaded from the
UCSC table browser via Galaxy. Public sequence variation databases used
included dbSNP 129, dbSNP 130, and dbSNP 132 downloaded via the UCSC
table browser.
6.2.6 NGS assembly and annotation using Bowtie and SAMtools
Solexa sequencing reads were aligned to the Human Mar. 2006 (NCBI36/hg18)
assembly using Bowtie software version 0.12.5 in SAM mode. SAMtools soft-
ware version 0.1.8 was used to convert the Bowtie alignment to a pileup
format which describes the base-pair information at each chromosomal posi-
tion including SNV/indel calling, read-depth and quality scores. The Bowtie
alignment was converted from bam to sam format, sorted, then indexed and
output to a pileup formatted file. This version of Bowtie does not support
indel calling.
6.2.6.1 Sequence coverage visualisation
A custom BAsH script was written to extract read-depth coverage data from
SAMtools pileup format and create a bar graph in bedgraph format that

6 next generation sequencing of cmt54 145
can be visualised in the UCSC genome browser. This software allows the
visualisation of sequencing coverage at a single base level in an annotated
graphical environment. This script is shown in Appendix A.
6.2.7 Unequal coverage comparison
A custom BAsH script was written to check segregation of variants between
samples using an autosomal dominant model of inheritance. The script inspects
the read-depth at a chromosomal position before excluding variants. Only
variants with 10 × coverage are used to exclude variants. Comparisons are
based on the annotated position of variants as used in the UCSC genome
browser and requires all samples to use the same genome reference. First,
the software collates the reported variants from all samples. Segregation of
each variant is checked between the samples. If the variant is not identified
in a sample, the read-depth at the corresponding position is checked from
the pileup file. Where the sequence read-depth is >= 10 × and no sequence
variant is identified, the individual is considered as wt! (wt!) or equal to the
annotation reference. Where read-depth at the position of a variant is below 10
× the variant is flagged as uninformative. This script is shown in Appendix A.
6.2.8 In silico prediction of functional impacts of sequence variants
The software tools used for prediction of functional impacts of sequence
variants were: multiple sequence alignment (MSA) to identify conserved nu-
cleotides; the sequence based prediction tools SIFT (http://blocks.fhcrc.
org/sift/SIFT.html ) [343] and PANTHER (http://www.pantherdb.org/tools/
csnpScoreForm.jsp) [344]; the Sequence and structure-based prediction tools
SNAP (http://www.rostlab.org/services/SNAP/) [345] and Polyphen (http:

6 next generation sequencing of cmt54 146
//genetics.bwh.harvard.edu/pph/) [346, 347]. Web interfaces were used for
all tools.
6.3 results
6.3.1 Chromosome 7q34-q36 target region sequencing
The chromosome 7q34-q36 disease interval was sequenced in one affected
individual using targeted sequence capture and 454 sequencing. Peripheral
blood DNA from affected individual CMT54-III:14 (Figure 3.5), met quality
control standards (A260/280 = 1.83 with a high molecular weight by agarose
gel electrophoresis (AGE); and was captured using two 385K 1-plex arrays
(NimbleGen). Capture probes were designed against all non repeat-masked
sequences within the 7q34-q36 interval, covering 9.03 Mb of the 12.98 Mb
region (69.63%).
Captured DNA was forwarded to Australian Genome Research Foundation
(AGRF) Ltd. (Brisbane, Australia) for 454 sequencing and read alignment. A
total of 1 063 758 QC passed sequence reads were generated as single-end reads
with an average read length of 362 bp (Table 6.1). These reads were mapped
against the Human Mar. 2006 (NCBI36/hg18) assembly. Approximately 46%
of reads mapped to the 7q34-q36 interval, ∼53% mapped to regions outside
7q34-q36 or mapped to multiple locations (repeat-mapped) and 0.54% were un-
mapped. The repeat-mapped and unmapped reads were not used for sequence
variant identification. Reads mapping to the 7q34-q36 interval generated 5186
sequence contigs covering 9 501 821 bp (73.19% of the 7q34-q36 interval) with
an average of 18.84 × coverage. As DNA fragments and sequencing reads
are longer than the capture probes, sequence contigs cover 3.56% more of the
7q34-q36 disease interval than the area tiled by array capture probes. A total

6 next generation sequencing of cmt54 147
Table 6.1: Summary statistics for targeted sequencing of CMT54 family memberIII:14.
Sequencing reads 7q34-q36 coverageTotalreads∗
Uniquelymapped
7q34-q36mapped
Calledbases Depth† 7q34-q36
coverage‡
1 063 758 757 413 494 387 178 999 610 18.84 × 71.73%∗ Reads uniquely mapping to the Human Mar. 2006 (NCBI36/hg18) assembly (chr7 =
558261 reads and other chromosomes = 199152 reads).† Mean sequence depth across all sequence contigs mapping to 7q34-q36.‡ Percentage of 7q34-q36 covered by sequence contigs.
of 13 550 high confidence variants and 22 680 lower confidence variants were
identified within the 7q34-q36 interval.
6.3.2 7q34-q36 sequence variant analysis
The 13 550 high confidence sequence variants identified within the 7q34-q36
interval were filtered to identify putative pathogenic variants (Figure 6.2). After
excluding all variants annotated as SNPs (dbSNP 129), there were 3193 novel
variants. Novel variants were filtered using Galaxy browser software [341, 342]
against genomic intervals from the Human Mar. 2006 (NCBI36/hg18) assembly
to identify non-synonymous, splice site, 5’ UTR and 3’ UTR variants. Sequence
variants identified included single nucleotide variations (SNVs) and small
insertion or deletions (indels).
6.3.2.1 Novel non-synonymous variants
Twenty-four novel non-synonymous changes were identified (Table 6.2). Two
variants were reported in an updated dbSNP database (dbSNP 130) and
excluded. To identify false positives arising from reads mapping to repeat
sequences, 20 bp of consensus sequence flanking each variant was aligned to
the Human Mar. 2006 (NCBI36/hg18) assembly using the BLAT alignment
tool [198]. Six variants were identified as part of chromosomal translocations,
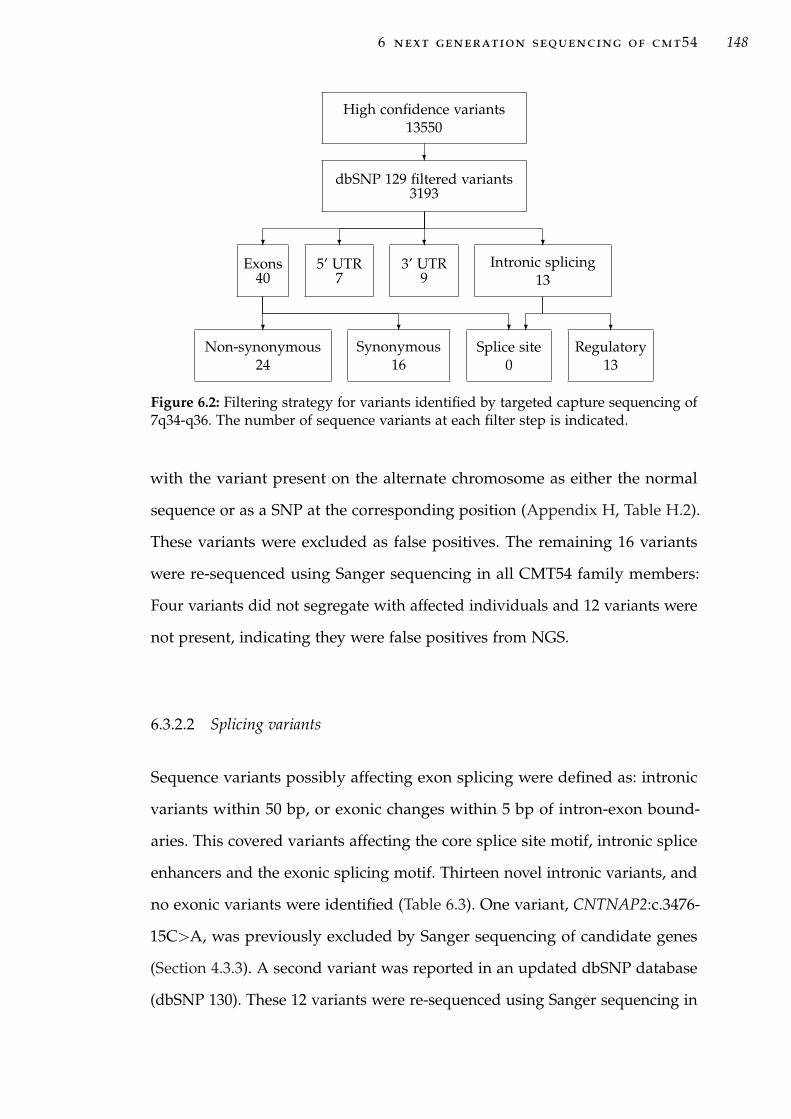
6 next generation sequencing of cmt54 148
High confidence variants13550
?
dbSNP 129 filtered variants3193
?
Exons40
?
Non-synonymous24
?
Synonymous16
?
Splice site0
?
5’ UTR7
?
3’ UTR9
?
Intronic splicing13
? ?
Regulatory13
Figure 6.2: Filtering strategy for variants identified by targeted capture sequencing of7q34-q36. The number of sequence variants at each filter step is indicated.
with the variant present on the alternate chromosome as either the normal
sequence or as a SNP at the corresponding position (Appendix H, Table H.2).
These variants were excluded as false positives. The remaining 16 variants
were re-sequenced using Sanger sequencing in all CMT54 family members:
Four variants did not segregate with affected individuals and 12 variants were
not present, indicating they were false positives from NGS.
6.3.2.2 Splicing variants
Sequence variants possibly affecting exon splicing were defined as: intronic
variants within 50 bp, or exonic changes within 5 bp of intron-exon bound-
aries. This covered variants affecting the core splice site motif, intronic splice
enhancers and the exonic splicing motif. Thirteen novel intronic variants, and
no exonic variants were identified (Table 6.3). One variant, CNTNAP2:c.3476-
15C>A, was previously excluded by Sanger sequencing of candidate genes
(Section 4.3.3). A second variant was reported in an updated dbSNP database
(dbSNP 130). These 12 variants were re-sequenced using Sanger sequencing in

6 next generation sequencing of cmt54 149
Table 6.2: Novel non-synonymous variants identified by targeted capture and se-quencing of the 7q34-q36 disease interval.
Gene Variant AAchange
Seq.depth
Variantfreq.
Validationresult†
PRSS2 c.416C>G S139C 5 0.6 FPPRSS2 c.449C>T S150F 6 0.67 FP
ZNF398 c.732C>A P244Q 21 0.14 FPKRBA1 c.307G>A E103K 28 0.11 FPSSPO c.2286G>T L762F 16 0.62 rs73168055SSPO c.9212_9213insC C3071R 11 1 rs71194663SSPO c.14297C>G H4766D 10 0.6 SNP ns
GIMAP5 c.914A>G H305R 28 0.11 SNP nsABCF2 c.154_155insTT G52fs 15 0.2 FPABCF2 c.151A>G T51G 15 0.27 FPABCF2 c.147G>C E49D 14 0.29 FPABCF2 c.143G>A R48K 13 0.31 FPABCF2 c.126_129delCTTC K43fs 13 0.31 FPABCF2 c.96T>C V32A 11 0.36 FPABCF2 c.65G>A R22Q 10 0.4 FPABCF2 c.59G>T R20L 10 0.4 FPMLL3 c.2689C>T R897X 3 1 Chr dupMLL3 c.2674G>A G892R 3 1 Chr dupMLL3 c.177_178delGA K60fs 12 0.25 SNP ns
CCT8L1 c.532A>G N178D 4 0.75 Chr dupCCT8L1 c.619A>G T207A 4 0.75 Chr dupCCT8L1 c.626A>C H209P 4 0.75 Chr dupCCT8L1 c.700G>A A234T 4 0.75 Chr dup
DPP6 iso2‡ c.283T>C S95P 27 0.11 SNP ns† Validation result indicates: SNP ns, the variant was validated in additional family mem-
bers and did not segregate with the disease; FP, false positive, not reproduced indicateSNPs not identified when re-sequencing using Sanger sequencing of the affected individ-ual sequenced by next generation sequencing; Chr dup, the SNP is part of a chromosomalduplication as detailed in section 5.3.1.3; rs#, the variant is a validated SNP reported indbSNP build 130.‡ This change is reported in a short transcript of DPP6 isoform 2 (UCSC gene: uc0101qh.1).
The transcript contains exons 1-3 with an additional 24 amino acids and stop codonfollowing exon 3.

6 next generation sequencing of cmt54 150
Table 6.3: Novel sequence variants possibly affecting splicing identified within the7q34-q36 interval by targeted DNA capture and 454 sequencing.
Gene Variant Type Seq.depth
Variantfreq.
Validationresult†
TRPV5 c.909+36T>A donor 18 0.17 FPCNTNAP2 c.1499-13T>C acceptor 28 0.11 FPCNTNAP2 c.3476-15C>A acceptor 20 0.45 +‡
ZNF398 c.776-18T>A acceptor 18 0.17 SNP nsGIMAP1 c.46-51_46-50delAG acceptor 26 0.12 FPPRKAG2 c.1437+46T>C donor 10 0.4 SNP ns,
rs73156279MLL3 c.1185-29C>G acceptor 6 0.67 FPMLL3 c.1185-9A>G acceptor 8 0.5 FPMLL3 c.2653-17G>A acceptor 3 1 FPMLL3 c.2653-37G>A acceptor 3 1 FPMLL3 c.3500-46C>T acceptor 4 0.75 FPMLL3 c.3500-23G>A acceptor 4 0.75 FPDPP6 c.457+13T>C donor 27 0.11 SNP ns
† Validation result indicates: +, variant segregates with three affected individuals and notthe control sample sequenced; SNP ns, variant was identified but did not segregatewith the three affected and not the control individual. FP, false positive, variant was notidentified in re-sequencing. rs#, the variant is a validated SNP reported in dbSNP build 130.The affected individual sequenced using NGS was one of the three affected individualsre-sequenced.‡ Variant is a novel SNP characterised in (Chapter 4).
three affected and one unaffected CMT54 family members. Three variants did
not segregate with the disease and nine variants were false positives.
6.3.2.3 5’ and 3’ UTR variants
Seven and nine novel variants were identified within the 5’-UTR and 3’-UTR
of known genes respectively (Table 6.4). One variant, DPP6:c.*347A>G, was
previously excluded by Sanger sequencing of candidate genes (Section 4.3.3).
Re-sequencing of the remaining 15 variants using Sanger sequencing in three
affected and one unaffected CMT54 family members excluded 4 variants which
did not segregate with the disease and 10 variants as false positives. The variant

6 next generation sequencing of cmt54 151
Table 6.4: Novel variants within the 5’ and 3’ UTR of known genes in the 7q34-q36disease interval.
Gene Variant Seq.depth
Variantfreq.
Validation result
5’ UTR sequence variantsGIMAP7 c.-32G>A 18 0.33 SNP ns
TMEM176B c.-170A>G 5 0.6 +, rs114949263ABCF2 c.-18C>A 11 0.36 FPABCF2 c.-31C>T 11 0.36 FP
CSGLCA-T c.-429T>C 16 0.19 FPPRKAG2 c.-346_357del 21 0.43 FPPRKAG2 c.-414T>C 24 0.42 +, rs117690714
3’ UTR sequence variantsCLEC5A c.*815_*816delTA 20 0.15 FPZNF783 c.*2008T>G 23 0.13 FPABCF2 c.*214G>A 22 0.27 FPABCF2 c.*184G>A 21 0.29 FPABCF2 c.*181C>T 22 0.27 FPABCF2 c.*178G>A 22 0.27 FPABCF2 c.*166G>A 7 0.57 SNP ns
GALNT11 c.*329T>A 14 0.21 +, rs117690714DPP6 c.*347A>G 23 0.57 + ‡
† Validation result indicates: SNP ns, the variant was validated in additional family membersand did not segregate with the disease in CMT54; +, variant segregates with the diseasein CMT54; FP, false positive, variant not identified when re-sequenced using Sangersequencing; rs#, the variant is a validated SNP reported in dbSNP build 132.‡ Variant is a novel SNP characterised in (Chapter 4).
GALNT11:c.T>A, which segregated with affected individuals from CMT54,
was identified in an updated dbSNP database (dbSNP 132).
6.3.2.4 454 sequencing quality
No putative pathogenic mutation was identified from the novel sequence
variants identified within the 7q34-q36 interval. Of the three novel variants pre-
viously identified in affected individual III:14 using Sanger sequencing (Chap-
ter 4), two were identified here (CNTNAP2:c.3476-15C>A and DPP6:c.*374A>G)
and one variant was missed (ACCN3:c.915C>T). The ACCN3 variant was also

6 next generation sequencing of cmt54 152
Contigs created by Roche NimbleGen 454 sequencing
UCSC Genes Based on RefSeq, UniProt, GenBank, CCDS and Comparative Genomics
Contig 324Contig 325
Chr7
Figure 6.3: 454 sequencing contigs at the ACCN3 gene. Top: Chromosome 7 ideograph:The region indicated by the red bar is expanded below. Lower: UCSC Genome Browserimage detailing detailing the two 454 sequence contigs that span the ACCN3 gene.The known SNV within exon 5 was missed, as both exons 5 and 6 are not covered byeither contig 324 or 325.
not identified in the lower confidence variant report. The ACCN3 gene was
covered by two sequence contigs, ACCN3 with exons 5 and 6 in the gap be-
tween these two contigs (Figure 6.3). The known SNV is located within exon
5, and hence, was not identified in the variant report. The low confidence
variants were briefly examined for changes within good candidate genes with
previous Sanger sequencing coverage. However, due to the high false positive
rate encountered with these and the high confidence changes previously, this
analysis was stopped. This sample was later re-sequenced with a higher quality
(Section 6.3.4), minimising the potential that the true variant may have been
reported here and missed.
Sequence variations within 7q34-q36 which were missed may be either in
the gaps between sequence contigs or within contigs with low read-depth. The
majority of gaps between the 5186 sequence contigs consist predominantly of
short sequence gaps < 10 kb in length. There were 18 large sequence gaps >
10 Kb totalling 467 kb, 3.6% of the disease interval (Table H.1). Examination of
the 18 large sequence gaps identified four gaps containing candidate genes:
gap 4 contained the entire FAM115C gene and gaps 11, 15, 17 and 18 contained
individual exons of the genes ARHGEF5, ACTR3B and DPP6 (Figure 6.4). The
remaining large sequence gaps were intergenic.
To confirm that genomic intervals within sequence contigs are free of se-
quence variants requires a minimum read-depth of 10 ×. This limits the

6 next generation sequencing of cmt54 153
0
50
10
Dep
th (
x)
Sequencing depth at reported variants
RefSeq Genes
7q34-q36 sequencing gaps of > 10 kb
Scalechr7:
GAP1GAP2GAP3GAP4GAP5
GAP8GAP9GAP10GAP11
GAP12GAP13GAP14
GAP15
GAP18GAP16
GAP17
GAP6GAP7
5Mb
20
30
40
chr7
Sequencing contigs
Figure 6.4: UCSC genome browser view of the 7q34-q36 region showing sequencingcoverage AGRF sequencing (NimbleGen). Top: Chromosome 7 ideograph: The 7q34-q36 target region indicated in the red box is expanded below. Lower): Detail of the7q34-q36 target region. Gaps greater than 10 Kb are shown as black bars labelled 1to 18. The sequencing read-depth at each reported variation is shown as a purple bar.Sequence contigs generated with 454 sequencing are shown in the black bar. RefSeqgenes are shown compacted in dark blue. The read-depth analysis indicates not allcontigs are sequenced at sufficient read-depth to rule out missed sequence variants.
possibility that all reads derive from a single chromosome, i.e. missing a se-
quence variation on the alternate chromosome. The read-depth at identified
variants ranged from 2 to 62× with an average of 15×. This is lower than
the average sequence contig read-depth of 18.8× and below the sequencing
target of 20×. As an indication of the variation seen in sequencing depth, the
read-depth at the identified variants was plotted across the 7q34-q36 interval
and visualised using the UCSC genome browser (Figure 6.4). This identified
several regions with low sequencing read-depth.It is likely that additional
sequence variants were missed due to contig gaps and localised intervals of
low sequence read-depth. Therefore, this analysis can only report the identified
variants. It is unable to determine if a genomic interval is free from variation.

6 next generation sequencing of cmt54 154
6.3.3 Off-target and repeat mapping reads
Repeat-mapped reads are those that map equally well to more than one ge-
nomic location. Repeat-mapped reads and reads mapping uniquely to genomic
regions outside the 7q34-q36 interval accounted for 53% of all reads. A fur-
ther 18.7% of reads mapped uniquely to other chromosomes, 6% mapped
uniquely to other areas on chromosome 7, and 29.66% were repeat-mapped. A
proportion of the reads mapping outside the 7q34-q36 interval and to other
chromosomes were included in the DNA capture design for QC purposes. Of
the repeat-mapped reads, 95% mapped to multiple locations on chromosome
7 and 5% mapped to other chromosomes. Some of these off-target reads and
repeat mapped reads may be the result of non-specific DNA sequence capture
or capturing DNA fragments from recent segmental duplication (SD) into or
out-of the 7q34-q36 interval.
A large amount of recent SD had been previously reported in the original
finished reference sequence for chr7 [255]. Recent SD within the 7q34-q36
disease interval in the Human Mar. 2006 (NCBI36/hg18) assembly reference
sequence was examined using the segmental duplications track (sequences of
>= 1 kb and >= 90% identity) [348, 349] of the UCSC table browser [256] and
Genome Pixelizer software [350]. Recent SDs at 7q34-q36 accounted for 2.53
Mb of DNA sequence, including: 86 intrachromosomal SDs totalling 1.97 Mb
within the 7q34-q36 interval, 3 intrachromosomal SDs (8.04 kb) of chromosome
7 outside the 7q34-q36 interval, and 86 interchromosomal SDs totalling 0.56
Mb (Figure 6.5). Therefore recent SD is likely to be responsible for some of the
off-target and repeat mapped reads obtained with targeted capture and 454
sequencing.

6 next generation sequencing of cmt54 155
1
10 11 12 13 13-R 15 16 17 19
2
21 22
3 4 5 6 7 8
9 X Y
7q34-q36
Figure 6.5: Recent segmental duplications of >= 1 kb and >= 90% identity at thechromosome 7q34-q36 disease locus in the Human Mar. 2006 (NCBI36/hg18) assemblyreference genome. Intrachromosomal segmental duplications within the 7q34-q36interval (blue), outside the 7q34-q36 interval (purple) and interchromosomal segmentalduplications (red) are shown. The 7q34-q36 interval is magnified 100 × compared tochromosomes. Details of recent segmental duplications were downloaded from thesegmental duplications track [348, 349] using the UCSC table browser [256]. The chartwas generated using Genome Pixelizer [350].
6.3.4 Exome sequencing
Because substantial areas of the 7q34-q36 target region were not covered by
targeted sequencing (above), the 7q34-q36 interval was re-examined in CMT54
using newly available exome sequencing. DNA from two affected individuals
(II:2 and III:9, Figure 3.5) and an unaffected ’married-in’ parent (CMT54-II:8),
was forwarded to BGI (Hong Kong) for exome capture and sequencing using
the NimbleGen 2.1M Human Exome Array (Roche) and Solexa sequencing
system (Illumina). The exome capture design targets 180 000 coding exons
from the consensus coding sequence (CCDS) database [260] and ∼550 miRNA
exons from miRBase [351]. Additionally, the NimbleGen target captured DNA
sequenced previously (affected individual III:14) was resequenced by BGI
using the Solexa sequencing system.
An average of 24.9 Gb of sequence was generated as paired-end, 74 bp reads
for each sequenced sample. Sequences were aligned by BGI (Hong Kong)
as single-end reads only. For the exome capture samples, this achieved an
average of 43× coverage for 94% of the CCDS exons targeted (Table 6.5). For

6 next generation sequencing of cmt54 156
the 7q34-q36 targeted capture (sequenced as two samples) this achieved an
average of 227× coverage for 99.5% of CCDS and miRNA exons within the
7q34-q36 interval.
6.3.4.1 Sequence variant analysis
An average of 30 526 sequence variants were identified within each exome
sequenced in family CMT54 (Table 6.6). These variants were annotated and
filtered using the online Galaxy Browser software. An average of 144 variants
within the linked interval on 7q34-q36 were identified in the exome sequenced
samples and 415 variants in the target captured sample. These variants were
compared to the dbSNP 130 database to remove variants present in the popu-
lation. Non-synonymous variants, were identified using open reading frame
co-ordinates from the CCDS database. After filtering, 4-6 non-synonymous
variants remained for each exome sequenced sample and 133 non-synonymous
variants for the target region captured sample.
With an autosomal dominant model of inheritance, all affected individuals
are expected to carry the same mutation, and be absent from ’married in’
unaffected individuals. Applying this to the data from the three affected and
one unaffected samples analysed, no non-synonymous variants were identified
within the 7q34-q36 interval. Extending this to all novel variants within the
7q34-q36 interval identified three intronic variants (Table 6.7). One variant was
excluded with previous Sanger sequencing (Chapter 4) and the remaining
two variants did not segregate with all affected individuals in CMT54 when
re-sequenced using Sanger sequencing.
Of the three sequence variants previously shown to segregate with the
disease in CMT54, only one was identified in this filtering approach (CNT-
NAP2:c.3476-15C>A). The SNV ACCN3:c.915C>T was identified within the
7q34-q36 target capture sequenced sample only. The variant DPP6:c.*374A>G
was not reported in any of the samples as this variant is within an alternate

6 next generation sequencing of cmt54 157
Tabl
e6.
5:Su
mm
ary
ofex
ome
and
chro
mos
ome
7q34
-q36
targ
eted
sequ
enci
ngus
ing
Sole
xapl
atfo
rm.
Sam
ple
Tota
lSe
quen
cing
base
sC
over
age
read
sTo
tal
Map
ped
Exom
em
appe
dD
epth
Exom
eII
:217
262
146
255
479
760
82
406
209
599
151
724
953
244
.48×
94.1
8%II
I:916
390
674
242
581
975
22
262
780
840
143
525
463
042
.08×
93.2
8%II
:816
903
507
250
171
903
62
358
641
852
147
501
204
143
.24×
94.2
8%II
I:14
a†17
743
070
262
597
436
01
814
973
684
1017
569
322
6.91×
99.4
1%II
I:14
b†15
865
300
234
806
440
01
646
449
085
1722
40.
38×
23.0
3%†
Cap
ture
dD
NA
from
the
cust
omca
ptur
ear
rays
wer
ese
quen
ced
sepa
rate
ly.T
heex
ome
cove
rage
does
not
incl
ude
sequ
ence
din
terv
als
outs
ide
CC
DS
exon
s.

6 next generation sequencing of cmt54 158
Table 6.6: Sequence variants identified by exome capture and BGI sequencing
Filter II:2 III:9 II:8 III:14(whole exome/7q34-q36 locus)
All Variants 30 676/142 30 655/154 30 248/135 na/415All Variants & not indbSNP 130
22 258/16 22 277/16 21 809/16 na/268
CDS Variants 12 542/65 12 570/71 12 227/51 na/242NS Variants 5464/29 5497/36 5353/22 na/159NS Variants & not indbSNP 130
4006/6 4024/6 3847/4 na/133
Table 6.7: Novel sequence variants identified with exome and targetedinterval sequencing with segregation analysis in CMT54.
Position Variant Gene Validationchr7:147 711 659 C>A CNTNAP2 healthy controls∗
chr7:148 137 226 G>A EZH2 no segregation in CMT54chr7:151 204 513 G>A PRKAG2 no segregation in CMT54∗ CNTNAP2 sequencing detailed in Chapter 4
DPP6 isoform not present in the CCDS reference database and therefore, not
targeted by the exome capture and BGI sequencing-bioinformatics pipeline.
As the pathogenic mutation was not identified a more detailed examination of
the sequencing data was undertaken.
6.3.5 Further sequencing analysis using unequal coverage analysis
The sequence read-depths and sequence contig sizes were compared between
the four sequenced samples to assess uniformity. Sequence contig coordinates
and single-base read-depth were not reported in the sequence variant report
by BGI, therefore, sequencing bioinformatics were repeated locally for the BGI
sequenced samples. Sequence reads were aligned to the Human Mar. 2006
(NCBI36/hg18) assembly using Bowtie software and sequence alignments
were converted to pileup format Using SAMtools software. Sequence contigs

6 next generation sequencing of cmt54 159
and per base read-depth were compared between samples using the custom
BAsH script PileupToBgr.sh and the UCSC genome browser (Appendix A).
The sequencing coverage was examined for the ACCN3 gene due to the
known variant present and the incomplete sequencing coverage. The three
exome captured samples had a similar coverage of sequence contigs, however,
the read-depth varied at the ends of target intervals and across exons 4-6 with
poor coverage (Figure 6.6). ACCN3 was sequenced to a greater extent in the
target captured DNA sample than the exome sequenced samples. Targeted
DNA capture included introns and exons at this location as well as the higher
number of sequencing reads. Overall, the same exons were covered poorly by
both DNA capture platforms. Additional genes were examined and all showed
similar variation in sequence coverage at the ends of target intervals or specific
exons (data not shown). This confirmed that there is variation in read-depth
and contig size between samples in the intervals sequenced.Differences in
sequence coverage need to be considered when comparing sequence variants
between samples to avoid false negatives from one sample excluding true
variants identified in another sample.
6.3.5.1 Sequence variant analysis considering unequal coverage
With an autosomal dominant model of inheritance, all affected individuals
should carry the same mutation (assuming there are no phenocopies), which
should be absent from ’married-in’ unaffected spouses. With unequal sequenc-
ing coverage, the per-base read-depth needs to be considered before excluding
a sequence variant that is not reported in an individual. A custom script was
written for the BAsH unix shell for variant segregation analysis with unequal
sequence coverage (CompSNPchr7.sh; Appendix A). The script checks for
segregation of identified sequence variants among the four CMT54 family
members. However, when a variant is not reported in an individual, the se-
quencing coverage at that position is checked. A sequence depth of at least 10

6 next generation sequencing of cmt54 160
chr7 (q36.1) 34
Scalechr7:
1 kb hg18150377000 150378000 150379000 150380000
UCSC Genes Based on RefSeq, UniProt, GenBank, CCDS and Comparative GenomicsACCN3ACCN3ACCN3
II:1
50 _
0 _
10 -
II:8
50 _
0 _
10 -
III:9
50 _
0 _
10 -
III:14
50 _
0 _
10 -
Figure 6.6: Sequencing coverage comparison between three exome capture and onetarget region capture samples. Top Chromosome 7 ideograph. The region boundedby the red box is expanded below. Lower panel Comparison of sequencing depth andcoverage for Illumina sequenced samples in the region of the candidate gene ACCN3.Control II:8, affected II:2 and affected III:9 were exome captured (green); targeted DNAcapture of the chr7q34-q36 dHMN1 disease interval was used for affected individualIII:14 (light blue). Sequencing depth greater than 50 fold is indicated by a pink line.Three isoforms of ACCN3 are shown in dark blue.

6 next generation sequencing of cmt54 161
reads at the selected DNA base position was required to exclude the presence
of a variant. Sequence variants were annotated against the dbSNP 130 database
to identify novel variants. The validation status of SNPs was considered before
excluding reported SNPs. Any SNPs from dbSNP 130 with an ’unknown’
validation were manually examined before excluding them.
Using unequal coverage analysis, the three novel variants that were previ-
ously shown to segregate with the disease in the three affected individuals from
CMT54 were also identified here (Section 6.3.4.1, Table 6.7). Four additional
variants were identified in regions where sequence coverage was insufficient to
exclude the possibility of a missed variant call (Table 6.8). These four variants
were subsequently excluded with Sanger sequencing of CMT54 family mem-
bers. One of these four variants was the ACCN3 mutation described previously.
The ACCN3 SNP was only identified in affected individual III:14, and not
in the two affected individuals or control individual sequenced with exome
sequencing with a with a read-depth of 3-7×. An additional five sequence
variants were identified that were reported SNPs with unknown validation
status (Table 6.8). Of these, four SNPs were excluded with updated annotation
information and one was confirmed as a false positive.
No sequence variation with a putative pathogenic role was identified in the
CCDS exons and flanking intronic regions from the 7q34-q36 disease interval
in CMT54. The sequencing coverage of these exons is high with 99.5% of
CCDS exons covered in the target captured sample. This includes the interval
that was common between families CMT54 and CMT44 which was identified
through haplotype comparisons.

6 next generation sequencing of cmt54 162
Tabl
e6.
8:Se
greg
atio
nan
alys
isof
exom
ese
quen
cing
iden
tified
vari
ants
assu
min
gun
equa
lseq
uenc
ing
cove
rage
.V
aria
nts
wit
hfo
ldco
vera
ge<
10fo
ld,t
heth
resh
old
for
aho
moz
ygou
sca
ll(n
ova
rian
tid
enti
fied)
.
Posi
tion
Var
iant
Gen
ety
peII
:2II
I:9II
I:14
II:8
Val
idat
ion
Nov
elva
rian
tsch
r7:1
4269
557
7A>
CC
ASP
25’
UTR
Y5
60
nose
greg
atio
nch
r7:1
4812
576
0G>
AC
UL1
intr
on8
3Y
9no
segr
egat
ion
chr7
:150
275
881
T>A
KC
NH
2N
S1
4Y
1no
segr
egat
ion
chr7
:150
378
829
C>
TA
CC
N3
NS
36
Y7
heal
thy
cont
rols
SNPs
wit
hun
know
nva
lidat
ion
stat
us(d
bSN
P130
)ch
r7:1
4128
200
7-/
AC
LEC
5Ain
tron
5Y
Y5
rs58
8802
3ch
r7:1
4833
389
1A
/CPD
IA4
intr
on5
5Y
16rs
1233
4067
,rs1
2333
828∗
chr7
:148
333
892
C/A
PDIA
4in
tron
54
Y16
rs12
3338
28∗
chr7
:148
952
576
G/A
ZN
F767
NS
3Y
07
rs71
5327
86ch
r7:1
5056
802
5-/
TSM
AR
CD
3in
tron
23
Y4
rs61
3561
47∗
Both
thes
eva
rian
tsin
corr
ectl
yre
port
asi
ngle
base
dele
tion
atpo
siti
on14
833
389
1in
are
peti
tive
sequ
ence
.

6 next generation sequencing of cmt54 163
Table 6.9: Markers with two-point LOD scores > 1.5 in a genome wide linkage analysisby Gopinath et al. [103].
Locus Marker LOD score2q36 D2S396 2.07 at θ = 07q36.1 D7S661 3.19 at θ = 07q36.1 D7S636 3.19 at θ = 07q36.2 D7S798 1.76 at θ = 08q21 D8S270 2.02 at θ = 018q12 D18S1102 1.76 at θ = 0
6.3.6 Exome wide analysis
As no putative disease causing mutation was identified within the chromosome
7q34-q36 disease locus, non-synonymous variants identified elsewhere in the
exome were examined. Sequence variants from the three exome sequenced
samples were examined. A total of 87 novel non-synonymous variants were
present in both affected individuals and absent in the unaffected control. The
location of these variants was compared to a 10 cM genome wide microsatellite
linkage analysis carried out previously as described by Gopinath et al. [103].
With the exception of the 7q34-q36 locus, there were three markers with a
two-point LOD score > 1.5 (Table 6.9). One variant in the TSPYL5 gene was
located near the marker D8S270 with a two-point LOD score of 2.02. Using
Sanger sequencing of two additional affected and two unaffected individuals
from CMT54, this variant did not segregate with the disease in the larger
CMT54 pedigree.
To identify NS variants with a likely functional impact from amongst the
remaining variants, a combination of five software tools were used to assess se-
quence conservation or effect on protein function. Variants that were predicted
to be deleterious by two or more of the software tools were considered can-
didates. Twenty-six potentially deleterious NS variants were re-sequenced in
additional CMT54 family members and control individuals. All were excluded

6 next generation sequencing of cmt54 164
Table 6.10: Sequence variants predicted to be deleterious or affectingconserved sequences.
MSA SNAP Polyphen SIFT Panther46/32/9 28/43/16 13/17/44/13 21/51/15 11/24/12/40
results indicate the number of variants in each group: MSA priority - High-/Medium/Low priority; SNAP - Not neutral/neutral/unknown; Polyphen -Probably damaging/possibly damaging/benign/unknown; SIFT - Affect/tol-erate/unknown; Panther - Probably damaging/possibly damaging/not dam-aging/unknown.
through: lack of segregation with affected individuals, presence in control
individuals or identified as homozygous SNPs.
6.4 discussion
NGS was used to screen all known genes within the chromosome 7q34-q36
disease interval. No putative pathogenic mutation was identified. Sequence
variations that were identified and analysed included non-synonymous SNV,
splice site, 5’ UTR and 3’ UTR sequence variants. A screen of non-synonymous
variants from elsewhere in the exome, including those predicted to be dele-
terious, also did not identify a putative pathogenic mutation. This analysis
considered variants that segregate with an autosomal dominant mode of in-
heritance, and took into account the differences in sequence coverage between
samples.
While a pathogenic mutation was not identified here, a similar exome
sequencing approach previously identified the disease gene TGM6 causing
spinocerebellar ataxia [339]. In this case four patients from a single pedigree
were sequenced and compared to identify the disease mutation as the sole
candidate sequence variant. This mutation lay within the previously linked
interval on chromosome 20p13-p12.2. Meta analysis showed that any two
exomes combined with the linked disease locus would have successfully

6 next generation sequencing of cmt54 165
identified the TGM6 mutation as the sole putative pathogenic candidate for
this autosomal dominant disorder.
By considering variation in sequencing coverage between samples, the se-
quence variants known to segregate with the disease in CMT54 were identified.
This identified several additional sequence variants which would have other-
wise been missed because of false negatives in individual samples caused by
poor or no sequencing coverage. This unequal coverage analysis is a novel way
of comparing sequencing variants between samples to account for variations in
sequencing coverage between samples. Other approaches to address differences
in sequencing coverage between a number (n) of samples have used a relaxed
model of segregation requiring variants to be present in n-1 or n-2 samples
only [338]. However, this application does not account for low read-depth and
would not have identified the ACCN3 SNP described here. Another approach
for the identification of variants within low coverage intervals is to combine
sequence reads from multiple affected individuals from a pedigree prior to
assembly and analyse them as a single ’virtual’ individual. By combining reads
from three affected individuals, Hedges et al. [352] demonstrated an increased
yield of sequence variants of 11%, compared to assembling three individuals
independently. This approach increases the chance of variants being reported
from areas of low sequencing coverage. It is necessary to consider unequal se-
quencing coverage if genes are to be excluded (i.e. free of putative pathogenic
sequence variation) as low read-depth will have a high false positive rate.
The addition of one sample with poor sequencing quality can falsely exclude
positive variants. This is also necessary when considering the differences in
sequence capture and sequencing platforms [353].

6 next generation sequencing of cmt54 166
6.4.1 Limitations of the NGS analysis
Despite the comprehensive analysis of NGS data, the chromosome 7q34-q36
mutation was not identified. The read-depth and sequencing coverage for one
affected individual was high after targeted sequence capture of the disease
interval. Due to the high average read-depth of 226×, most of the 99.5% of
CCDS exons were covered by sequence contigs at sufficient read-depth to be
confident that a sequence variant was not missed in these regions. However
there are several important limitations to this analysis.
An important limitation of sequence analysis based on a reference genome
is that gene annotation is not 100% complete with ongoing refinement and
addition of alternate transcripts. This is important for the definition of coding
exons used in the standard exome captures. The exome capture does not
sequence all exons within the genome because of incomplete annotation of the
reference genes and because not all exons are suitable targets for capture. This
includes coding regions within repetitive sequences and areas that may not
amplify effectively with PCR required for the sequence capture and enrichment.
In this project, a known variation in the 3’-UTR of DPP6, previously identified
by targeted Sanger sequencing of candidate genes, was not identified by exome
sequencing. In this case the DPP6 gene was not targeted in the NimbleGen
Sequence Capture 2.1M Human Exome Array used (2.1M Human Exome
Array annotation files). However, it was identified with the use of the custom
sequence capture microarray targeting the 7q34-q36 interval. In a comparison
of three current exome capture platforms, differences in the genes targeted
have been demonstrated; approximately 1100 additional genes were targeted
by the Agilent SureSelect platform compared to the NimbleGen exome array
[354].

6 next generation sequencing of cmt54 167
A further limitation is that exome sequencing does not capture regulatory
regions that may be involved in disease. These may include promoter regions,
splicing enhancers, cryptic splice sites and other remote regulatory elements.
Relatively few genes have well characterised regulatory elements beyond their
core promoter region. Similarly, the effect of synonymous variants on exon
splicing is difficult to assess. In rare cases, synonymous sequence variants
can cause exon skipping or other splicing errors [355]. These variants have
been reported to create leaky expression, with the incorrect transcript making
up only a small percentage of overall gene expression. As with promoter
predictions, splice site software is generally restricted to predicting the effect
of variants on well characterised core splicing and enhancer motifs.
With 20 000 to 24 000 SNVs identified on average in a human exome it is
essential to filter out known SNPs [356]. However, as the number of individuals
reported in sequence variant databases continues to grow, there is an increased
risk of undiagnosed individuals inadvertently being included. This is more
problematic for late onset diseases or those with subtle phenotypes. While the
true prevalence of autosomal dominant dHMN is unknown, the most common
form of peripheral neuropathy, CMT1, has a prevalence of approximately
20 cases per 100 000 and CMT2 2 per 100 000 [315]. Clinical dHMN is seen
less often than CMT2 in the Neurogenetics clinic at Concord Hospital and
assumed to have a lower prevalence (G. Nicholson, personal communication).
The genetic heterogeneity of dHMN decreases this further, as mutations in
a particular disease gene will account for a small percentage of all dHMN
[6]. With mutations being so rare, it is unlikely that undiagnosed dHMN
individuals will be present in the dbSNP cohorts. Nonetheless, a simple
filtering restriction by not using SNPs with a MAF rarer than a reasonable
threshold can easily overcome this. Using a MAF threshold of 0.001 for SNPs
has been suggested [356], however, for rare mendelian diseases this threshold
can be 0.000 01 or greater.

6 next generation sequencing of cmt54 168
A further limitation of the NGS strategy used here is the poor capacity to
identify indel mutations. While both SNV and indels were considered in the
original analysis using 454 sequencing and gsMapper software (Roche), no
putative pathogenic indels indels were identified. However, the performance
of this early 454 sequencing and gsMapper software in detecting indels was
shown to be limited, with a similar application missing 50% of the indels
identified by Sanger sequencing [353]. Indels were not called by the SOAP1
or Bowtie software used to assemble the reads from the Solexa sequencing
used in exome sequencing. The use of paired-end reads and the long reads
in a de novo assembly may better identity indels as well as translocations and
inversions. However the bioinformatics and computer resources required for
this assembly exceed those available for this project. Indel identification and
analysis using NGS is still in its infancy and currently has a much higher false
positive rate than SNV calling.
In this project, in silico predictions of disease effect were used to prioritise
non-synonymous variants from the exome analysis. However, excluding se-
quence variants based on predictions is a risky approach, as true pathogenic
variants may be missed. This was demonstrated with the analysis by Bamshad
et al. [356] in identifying DHODH mutations in Miller syndrome where in
silico predictions incorrectly excluded the true mutation under the recessive
model of inheritance tested. The filtering strategies employed here were less
stringent, requiring only two positive results from five software tools to screen
variants further.
These limitations provide possible explanations for not finding a pathogenic
variant. The pathogenic variant may be a variant in: a gene that is not yet
recognised; a gene that is not targeted by the exome capture; a repetitive
sequence that was not sequenced; a sequence variant in a regulatory element;
or an indel or other structural variation not identified within the limits of the
sequence assembly used here.

7E X O M E S E Q U E N C I N G O F C M T 4 4
7.1 introduction
A second dHMN family CMT44, with suggestive linkage to the chromosome
7q34-q36 interval, was examined by exome sequencing. Previous two-point
and multi-point linkage analysis in CMT44 achieved a maximum LOD score of
2.02 at the 7q34-q36 locus. This reached the theoretical maximum LOD-score
for this family. The haplotype comparisons carried out previously (Chapter 3)
indicate that families CMT44 and CMT54 possibly share a common ancestor.
If this is the case, CMT44 may share the same mutation with CMT54; and the
same difficulties will arise in mutation discovery. However, while the haplotype
association between these two families is statistically significant, there remains
the possibility that the families are unrelated. Recent analysis by Brewer [357]
has shown statistically significant haplotype associations to be incorrect when
a larger set of markers were included in the analysis. In addition, the more
recent sequencing platform used in analysis of CMT44 had the potential to
achieve greater coverage in difficult to sequence exons.
7.1.0.1 Hypothesis and aims
It is hypothesised that dHMN seen in family CMT44 is caused by a single gene
mutation within the linked region on chromosome 7q34-q36. The aim of this
chapter is to:
169
7 exome sequencing of cmt44 170
• Capture and sequence the exomes of individuals from family CMT44
using NGS in order to identify the genetic variant causing dHMN.
7.2 materials and methods
7.2.1 Exome sequencing
Genomic DNA from peripheral blood (3 µg) was forwarded to Axeq Tech-
nologies (Seoul, Korea) for exome sequencing. An Illumina sequencing library
was prepared for each sample which was enriched using the Illumina Exome
Enrichment protocol and sequenced using an Illumina HiSeq 2000 Sequencer.
7.2.1.1 Sequencing library preparation
Sequencing libraries were prepared using the Illumina TruSeq DNA Sample
Prep system following manufacturers protocols. In brief, 1 µg of genomic
DNA was fragmented by nebulization, 3’ ends of fragmented DNA were
repaired, then Illumina adapters were ligated to the fragments. Ligated DNA
fragments were size selected in the range of 350-400 bp. Size-selected DNA
fragments were PCR amplified to enrich for adapter ligated DNA fragments.
Correct library fragment size and concentration were assayed using an Agilent
Bioanalyzer.
7.2.1.2 Exome capture and enrichment
Exome capture and enrichment was carried out using the Illumina TruSeq
Exome Enrichment system following manufacturers protocols. In brief, DNA
libraries were indexed and pooled prior to enrichment. DNA libraries were
hybridised to capture probes bound to streptavidin beads. Bound libraries were
washed three times to remove non-specific binding fragments. The enriched

7 exome sequencing of cmt44 171
library was eluted and subjected to a second hybridization and three wash
steps. The enriched library was eluted from the capture probes and prepared
for sequencing.
7.2.1.3 Sequencing
The DNA libraries were PCR amplified to further enrich for adapter ligated
DNA fragments. Exome capture and enrichment was validated using Axeq
Technologies internal quality control procedures. Automated sequencing was
carried out using an Illumina HiSeq 2000 instrument.
7.2.1.4 NGS read mapping and variant detection
Sequence read-mapping and variant annotation was carried out by Axeq
Technologies (Seoul, Korea). Sequence reads were mapped to the Human Feb.
2009 (GRCh37/hg19) assembly using BWA software [358] using a read quality
threshold of 20. Sequence variants, including single-base substitutions and
indels, were called using SAMtools software [359] using a maximum read
depth of 1000× and a quality threshold of 20 for both SNVs and indels. SNPs
were annotated using dbSNP 131, dbSNP 132, and 1000 genomes SNP call
release (20101109, 628 individuals).
7.2.2 NGS variant analysis
Sequence variants were analysed using Galaxy Browser software (http://
galaxyproject.org/) [341, 342, 360]. Novel variants were annotated using
the dbSNP 134 and 1000 Genomes Phase 1 Integrated Variant Call Set. Pub-
lic data downloaded sites were; dbSNP 134 (ftp://ftp.ncbi.nih.gov/snp/),
the 1000 Genomes Phase 1 Integrated Variant Call Set (ftp://ftp-trace.
ncbi.nih.gov/1000genomes/ftp/) and the NHLBI Exome Sequencing Project

7 exome sequencing of cmt44 172
database (http://evs.gs.washington.edu/EVS/). Known peripheral neuropa-
thy genes were downloaded from the Mutation Database of Inherited Pe-
ripheral Neuropathies (http://www.molgen.ua.ac.be/cmtmutations/). Novel
variants were screened in a panel of 32 unrelated control exomes of unaffected
spouses from unrelated ALS and CMT families using Integrative Genomics
Viewer software [361].
7.2.3 HRM analysis
Genotyping of sequence variants was carried out with high resolution melt
analysis using the LightScanner System (Idaho Technology Inc.). Target exons
were PCR amplified in a 10 µL reaction volume with LightScanner master
mix (1×; Idaho Technology Inc.), PCR Enhancer (1×; Invitrogen), forward and
reverse primers (0.4 pmol µL-1 each) and 10 ng template DNA. Fluorescent melt
curves were acquired using the LightScanner instrument between 65°Cand
98°C.
7.3 results
7.3.1 Exome sequencing in CMT44
Exome sequencing was performed using four affected and one unaffected
individuals from CMT44 (individuals III:1, III:5, IV:1 and II:2; Figure 7.1). An
average of 6.5 billion bases of sequence per individual was generated as paired-
end reads with an average length of 105 bp (Table 7.1). This achieved a mean
read-depth of 47.72× across the five exomes. Exome coverage at 1× read-depth
ranged from 94.9% to 93.0%, however at 10× read-depth the exome coverage
was lower, ranging from 77.3% to 87.0% of target exons. An average of 65 236

7 exome sequencing of cmt44 173
SNVs and 13 385 indels were identified in each sample, of which 11.6% of
SNVs and 4.6% of indels, resulted in non-synonymous or acceptor/donor
splice site changes (including non-frameshift indels) (Table 7.2).
The non-synonymous and splice site variants (SNV and indels) that were
common to the four affected individuals were compared with the database of
44 known peripheral neuropathy genes (Mutation Database of Inherited Pe-
ripheral Neuropathies) and two additional dHMN genes (ATP7A and HSPB3).
A mutation in the MFN2 gene was identified in all four affected individuals.
This missense mutation MFN2:c.C368T (p.P123L), was previously reported in
autosomal dominant CMT2 by Verhoeven et al. [362]. However, exome data
showed that unaffected individual II:2 also carries this mutation (Figure 7.1).
CMT44 had previously been screened for mutations in MFN2, using individual
II:1 as the index patient (O.Albulym, personal communication). No mutation
was identified in indiviudal II:1. This indicated that the MFN2 mutation, had
been inherited from individual II:2. This warranted a clinical re-examination
of CMT44 family members.
7.3.2 Clinical detail of CMT44
Approximately seven years had elapsed since the previous clinical neurological
examination of CMT44 family members. A further neurological examination
of three individuals from CMT44 (II:1, II:2 and III:1) was carried out at the
Neurology clinic, Concord Hospital.
Individual II:1, aged 84, has a mild motor neuropathy, with minor muscle
wasting in the lower legs and pes cavus. Pes cavus was apparent since child-
hood, with a family history of similar feet from a young age. A mild axonal
motor neuropathy with no sensory loss was confirmed by nerve conduction
studies (NCS).

7 exome sequencing of cmt44 174
Tabl
e7.
1:Su
mm
ary
ofex
ome
sequ
enci
ngin
CM
T44.
Sam
ple
Tota
lSe
quen
cing
base
sEx
ome
cove
rage∗
read
sTo
tal
Map
ped
Exom
em
appe
dat
1×
dept
hat
10×
dept
hM
ean
dept
hII
I:188
020
920
942
123
951
47
679
947
663
419
758
166
394
.4%
85.7
%67
.6×
III:5
6964
633
07
034
279
330
601
213
387
03
485
101
401
94.7
%87
.0%
56.1×
III:7
6586
149
86
652
011
298
516
713
531
02
922
467
830
94.9
%87
.2%
47.1×
IV:1
4132
401
64
422
761
250
362
223
206
22
015
291
144
93.0
%77
.3%
32.5×
II:2
4622
317
24
947
525
468
403
622
067
92
188
857
813
93.2
%78
.4%
35.3×
∗Ba
sed
onan
exom
esi
zeof
6208
528
6bp
.
Tabl
e7.
2:Se
quen
ceva
rian
tsid
enti
fied
byex
ome
sequ
enci
ngin
CM
T44
Filt
erII
I:1II
I:5II
I:7IV
:1II
:2(S
NV
s/in
dels
)A
llV
aria
nts
6896
3/14
923
6808
7/14
092
6720
5/12
703
6063
6/12
446
6128
9/12
762
CD
SV
aria
nts
1935
4/84
519
200/
651
1916
5/48
617
954/
568
1790
7/61
7N
S/SS
Var
iant
s96
75/8
3699
31/6
4693
06/4
8189
42/5
6090
98/6
09N
S/SS
Var
iant
s&
not
inpu
blic
data
base
s∗
1037
/628
624/
414
309/
255
677/
367
686/
413
∗P
ubl
icSN
Pd
atab
ases
use
d:
dbS
NP
131,
dbS
NP
132
and
1000
geno
mes
SNP
call
rele
ase
(201
0110
9).

7 exome sequencing of cmt44 175
I:1 I:2
DNA
II:1
DNA
II:2
DNA
III:1
DNA
III:2 III:3 III:4
DNA
III:5
DNA
III:6 III:7
DNA
III:8III:9
DNA
IV:1
DNA
IV:2 IV:3 IV:5 IV:6IV:8
?
IV:4
II:5II:3
IV:7
III:10
IV:12 IV:13
II:4
IV:9 IV:10 IV:11
P123L/wtMFN2 - P123L/wt P123L/wt
MFN2 - P123L/wt
P123L/wtMFN2 - wt/wt
DNAH11 - V1692I/wtPCDHGA4 - Y33S/wt
V1692I/wtY33S/wt
V1692I/wtY33S/wt
DNAH11 - V1692I/wtPCDHGA4 - Y33S/wt
DNAH11 - V1692I/wtPCDHGA4 - Y33S/wt
wt/wtwt/wt
DNA DNA
P123L/wt
P123L/wt
wt/wt wt/wt
wt/wt wt/wt
DNA
Figure 7.1: Updated pedigree for family CMT44. Females and males are represented bycircles and squares respectively. solid coloured symbols indicate affected individuals, withorange indicating the dHMN phenotype, blue the mild motor and sensory neuropathyphenotype and black the more severe CMT2 phenotype. Bars indicate the haplotype at7q34-q36 described previously Figure 3.7, with blackened bars indicating the haplotypesegregating with the disease. The genotype for the MFN2, DNAH11 and PCDHGA4mutations are indicated below each individual.

7 exome sequencing of cmt44 176
Individual II:2, previously listed as unaffected (Chapter 3), now aged 84,
shows distal sensory signs with reduced vibration sensation in the legs. No
muscle wasting was apparent. NCS indicated a mild motor and sensory neu-
ropathy. Since the previous clinical examination, clinical symptoms had pro-
gressed slightly, the patient now required the use of a walking stick. The
mild clinical signs would not have brought this individual to the attention
of clinicians, if it were not for the affected offspring. Based on the previous
clinical description, this individual was initially ruled out as the carrier of the
gene mutation in this family.
Affected individual III:1, aged 52, has a severe motor and sensory neuropathy,
with gross wasting and weakness of muscles in the lower legs and hands. Pes
cavus was apparent since childhood. This is a more severe phenotype than
either parent. At 44 years of age a dHMN phenotype was present, however, no
sensory defect was apparent from NCS. The first sensory symptoms started at
49 years of age, confirmed by NCS.
Other family members were not re-examined, however previous clinical de-
scriptions indicate the more severe motor and sensory neuropathy phenotype
described for individual III:1, is seen in affected individuals III:5, III:7 and
IV:1, with pes cavus and leg problems from childhood and motor and sensory
symptoms developing from adulthood. Individuals III:3, III:6, and all other
individuals from generation IV were clinically normal.
The phenotype in generations III and IV is generally more severe than either
parental phenotype from generation II. This suggests that two peripheral
neuropathy genes are combined in this family; the MFN2 P123L mutation
inherited from individual II:2 who has a mild CMT2, and a second gene from
individual II:1 with a pure motor neuropathy. This second gene may be located
within the 7q34-q36 interval or elsewhere in the genome.
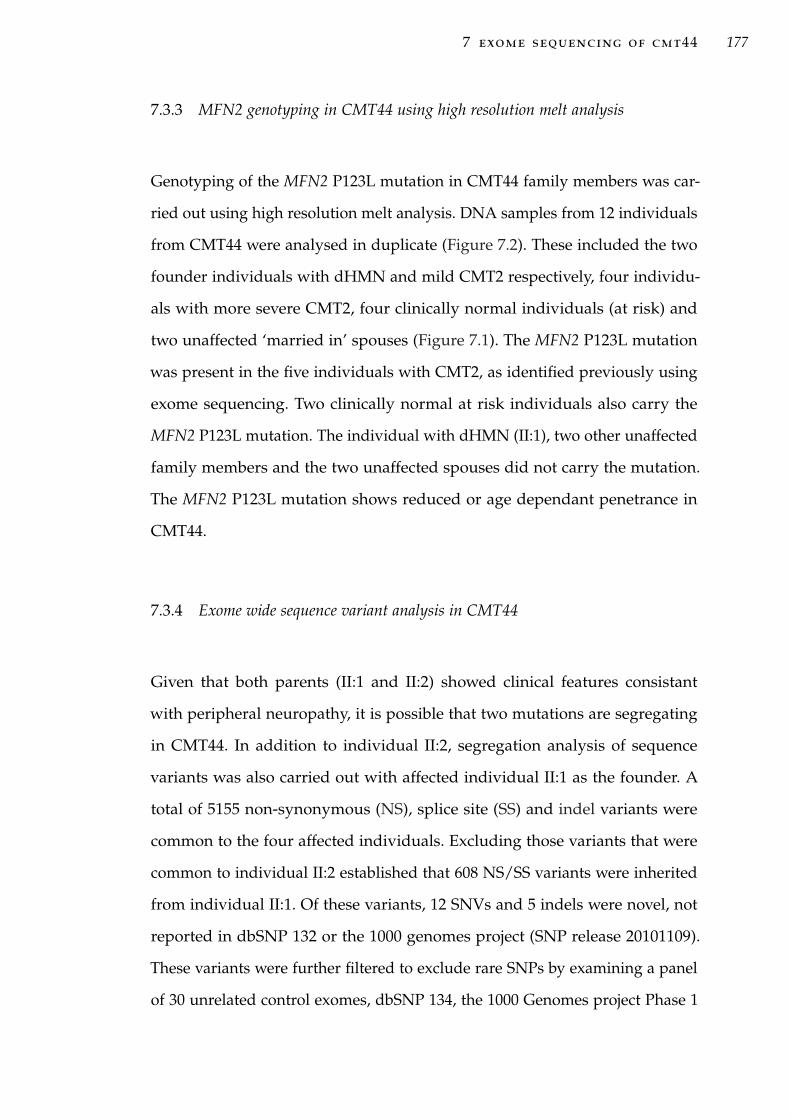
7 exome sequencing of cmt44 177
7.3.3 MFN2 genotyping in CMT44 using high resolution melt analysis
Genotyping of the MFN2 P123L mutation in CMT44 family members was car-
ried out using high resolution melt analysis. DNA samples from 12 individuals
from CMT44 were analysed in duplicate (Figure 7.2). These included the two
founder individuals with dHMN and mild CMT2 respectively, four individu-
als with more severe CMT2, four clinically normal individuals (at risk) and
two unaffected ‘married in’ spouses (Figure 7.1). The MFN2 P123L mutation
was present in the five individuals with CMT2, as identified previously using
exome sequencing. Two clinically normal at risk individuals also carry the
MFN2 P123L mutation. The individual with dHMN (II:1), two other unaffected
family members and the two unaffected spouses did not carry the mutation.
The MFN2 P123L mutation shows reduced or age dependant penetrance in
CMT44.
7.3.4 Exome wide sequence variant analysis in CMT44
Given that both parents (II:1 and II:2) showed clinical features consistant
with peripheral neuropathy, it is possible that two mutations are segregating
in CMT44. In addition to individual II:2, segregation analysis of sequence
variants was also carried out with affected individual II:1 as the founder. A
total of 5155 non-synonymous (NS), splice site (SS) and indel variants were
common to the four affected individuals. Excluding those variants that were
common to individual II:2 established that 608 NS/SS variants were inherited
from individual II:1. Of these variants, 12 SNVs and 5 indels were novel, not
reported in dbSNP 132 or the 1000 genomes project (SNP release 20101109).
These variants were further filtered to exclude rare SNPs by examining a panel
of 30 unrelated control exomes, dbSNP 134, the 1000 Genomes project Phase 1

7 exome sequencing of cmt44 178
85 86 87 88 89 90 91 92-0.1
-0.08
-0.06
-0.04
-0.02
0
0.08
0.06
0.04
0.02
0.08
0.06
0.04
0.02
0
1
85 86 87 88 89 90 91 92
Temperature °C
Nor
mal
ised
Fluo
resc
ence
Temperature °C
4Fl
uore
scen
ce
Figure 7.2: HRM genotyping analysis of the MFN2 mutation identified in CMT44.Normalised melt curves (above) and difference curves (below) are displayed for MFN2exon 5. The curves are color coded, indicating: grey for normal individuals not carryingthe mutation, including two married in spouses; red and orange for affected individualswith the mutation; and green for two unaffected at risk individuals carrying themutation. The orange curve differs due to the presence of a second SNP in the exon 5amplicon.

7 exome sequencing of cmt44 179
Integrated Variant Call Set (October 2011), and the NHLBI Exome Sequencing
Project database. After filtering, two novel non-synonymous SNVs remained
in the genes; Axonemal dynein heavy chain 11, (DNAH11:c.G5074A:p.V1692I)
and Protocadherin gamma-A4 (PCDHGA4:c.A98C:p.Y33S). There were no
putative pathogenic mutations identified within the 7q34-q36 disease interval
in CMT44. Furthermore, no novel sequence variants were identified within
these two genes in previous exome sequencing data from family CMT54.
7.3.5 Comparison of SNPs between CMT44 and CMT54
To examine whether the chromosome 7q34-q36 haplotype shared by CMT44
and CMT54 (Chapter 3) represented identical by descent (IBD) or identical
by state (IBS), a set of 30 SNPs from 7q34-q36 were selected from exome
sequencing data (Figure 7.3). Of these SNPs, 11 were homozygous for different
alleles in each family. The remaining alleles were homozygous and identical
between the two families (9 SNPs) or heterozygous with a possible match
(10 SNPs). Therefore, any SNP based haplotype would have at least 11/30
alleles not shared between the two families. It is therefore unlikely that CMT44
and CMT54 share a common ancestor for the 7q34-q36 disease interval as
suggested previously (Chapter 3).
7.4 discussion
We have identified a possible digenic inheritance of dHMN and CMT2 in
family CMT44. Both parents in generation II (Figure 7.1) show clinical features
of peripheral neuropathy. Parent II:1 has a purely motor neuropathy caused
by a novel gene mutation and parent II:2 has a mild CMT2 caused by the
MFN2 P123L mutation. Four additional affected individuals appear to carry
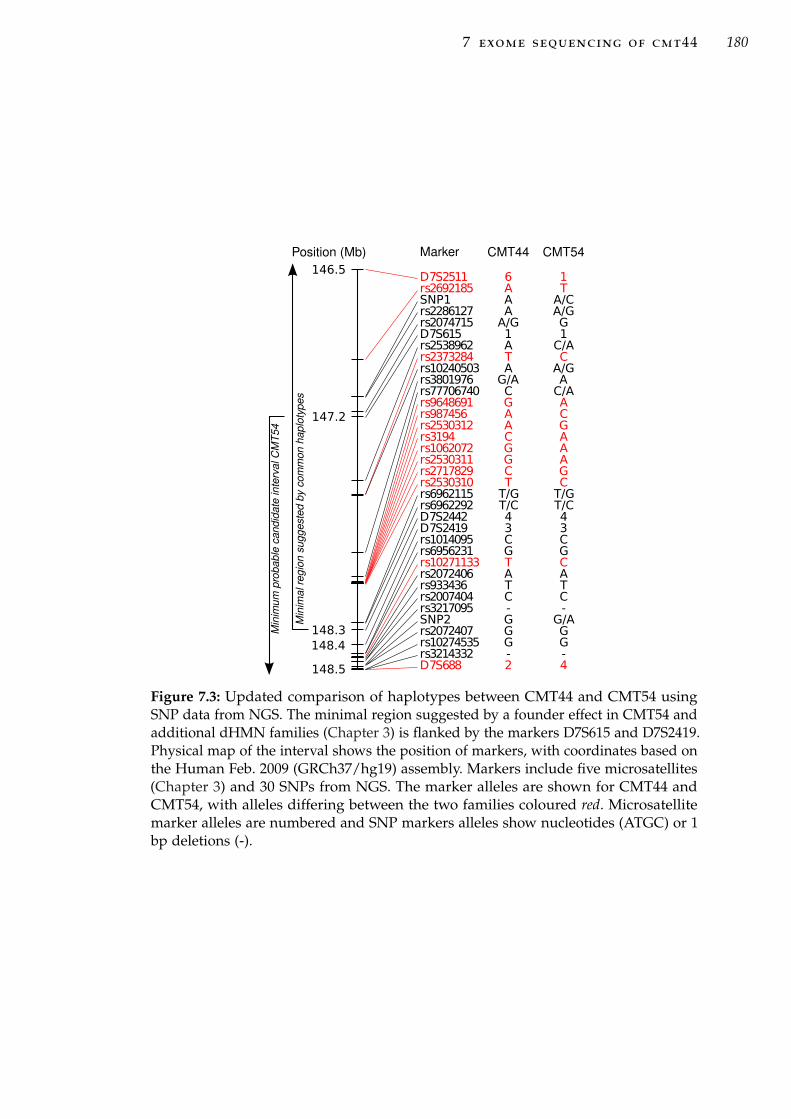
7 exome sequencing of cmt44 180
D7S2511rs2692185SNP1rs2286127rs2074715D7S615rs2538962rs2373284rs10240503rs3801976rs77706740rs9648691rs987456rs2530312rs3194rs1062072rs2530311rs2717829rs2530310rs6962115rs6962292D7S2442D7S2419rs1014095rs6956231rs10271133rs2072406rs933436rs2007404rs3217095SNP2rs2072407rs10274535rs3214332D7S688
146.5
147.2
148.3148.4
148.5
6AAAA/G1ATAG/ACGAACGGCTT/GT/C43CGTATC-GGG-2
1TA/CA/GG1C/ACA/GAC/AACGAAAGCT/GT/C43CGCATC-
G/AGG-4
CMT44 CMT54Position (Mb) Marker
Min
imum
pro
babl
e ca
ndid
ate
inte
rval
CM
T54
Min
imal
regi
on s
ugge
sted
by
com
mon
hap
loty
pes
Figure 7.3: Updated comparison of haplotypes between CMT44 and CMT54 usingSNP data from NGS. The minimal region suggested by a founder effect in CMT54 andadditional dHMN families (Chapter 3) is flanked by the markers D7S615 and D7S2419.Physical map of the interval shows the position of markers, with coordinates based onthe Human Feb. 2009 (GRCh37/hg19) assembly. Markers include five microsatellites(Chapter 3) and 30 SNPs from NGS. The marker alleles are shown for CMT44 andCMT54, with alleles differing between the two families coloured red. Microsatellitemarker alleles are numbered and SNP markers alleles show nucleotides (ATGC) or 1bp deletions (-).

7 exome sequencing of cmt44 181
both the MFN2 mutation and the second disease gene and have a substantially
more severe, earlier onset, CMT2 phenotype than either parent. The MFN2
mutation shows reduced or age dependant penetrance, with two unaffected at
risk individuals also carrying the mutation. The second gene mutation causing
the founder dHMN phenotype is possibly the DNAH11 V1692I variant or the
PCDHGA4 Y33S variant identified from exome analysis. The two mutations
segregating in CMT44 may have an additive effect creating the more severe
phenotype seen in individuals carrying both. This may also explain the lower
penetrance seen in generation IV of CMT44, where fewer individuals are likely
to carry both mutations.
A digenic inheritance has been previously described in a three generation
dHMN family with both a BSCL2 mutation and a second disease locus on
chromosome 16p [146]. In this family, 12 affected individuals inherited both
the BSCL2 mutation and the 16p locus, and one individual, with sub-clinical
motor neuron damage, carried only the 16p locus. The 16p locus was thought
to contribute to the dHMN phenotype seen in this family. Similarly, a family
with a CMT1 phenotype, has been described with mutations in the SH3TC2
gene [336]. Normally, compound heterozygous SH3TC2 mutations cause the
severe recessive disorder CMT4C through loss of function. In this family,
individuals carrying a single missense mutation Y169H, were diagnosed with
a mild axonal neuropathy. A second SH3TC2 mutation, R945X, was identified
in the family, which on its own did not cause disease. However, this second
mutation had an additive effect to the Y169H mutation, with affected patients
who were compound heterozygous for the SH3TC2 mutations having a more
severe CMT1 phenotype.
Neither of the two candidate dHMN genes DNAH11 or PCDHGA4 in CMT44
have been previously associated with a neurodegenerative disease. DNAH11
is an axonemal dynein, which are molecular motors that drive the beating
of cilia and flagella. These are distinct to the cytoplasmic dyneins involved

7 exome sequencing of cmt44 182
in retrograde axonal transport in neurons. Homozygous and compound het-
erozygous mutations in DNAH11 cause the recessive disorder, primary ciliary
dyskinesia 7 (PCD7; MIM#611884), caused by immotile cilia [363, 364]. A role
for cytoplasmic dyenins has been suggested in several neurodegenerative dis-
eases [365, 366], with rare mutations of DCTN1 in dHMN7B [64], ALS and
ALS with FTD [65–67]. The DNAH11 V1692I mutation is a highly conserved
amino acid in the stem domain, which joins the cargo binding domains to
the stalk and microtuble binding domains. This is a different region to the
mutations described in PCD7 which all cause truncation of the conserved C
terminal domain [363, 364] or the DCTN1 mutation in dHMN7 which disrupts
the microtubule binding domain [64].
PCDHGA4 is part of the protocadherin-gamma (PCDHγ) gene cluster, one
of three protocadherin gene clusters on chromosome 5q31 [367] (Figure 7.4-A).
Protocadherins are cell-adhesion molecules variably expressed in synaptic junc-
tions in brain and spinal cord [368, 369]. The PCDHγ gene cluster consists of 22
’variable region’ exons which are individually spliced to three ’constant region’
exons (Figure 7.4-B). Transcription of the 22 variable region genes is controlled
by individual promoters with selective cis-splicing removing any intermediate
variable region exons [370, 371]. Each variable exon encodes extracellular and
transmembrane domains of the protocadherin protein, and the constant region
exons encode the intracellular domain [372]. The extracellular domain contains
six highly conserved cadherin domains which mediate cell-cell interactions
when bound to calcium [367] (Figure 7.4-C). The Y33S mutation is located at a
highly conserved amino acid in the first cadherin domain. This amino acid is
100% conserved across the protocadherin genes on 5q31.
A mouse model with dramatic neurodegeration leading to neonatal death
has been described lacking all 22 Pcdhγ genes [368]. Neonatal mice are nearly
immobile and have reduced spinal cord synapses. In culture, neurons differ-
entiate with normal axonal outgrowth and form synapses, but neurons die

7 exome sequencing of cmt44 183
200 kb5q31.3
PCDHGA1PCDHGA2
PCDHGA3PCDHGB1
PCDHGA4PCDHGB2
PCDHGA5PCDHGB3
PCDHGA6PCDHGA7
PCDHGB4PCDHGA8
PCDHGB5PCDHGA9
PCDHGB6PCDHGA10
PCDHGB7
PCDHGA11PCDH-psi3
PCDHGA12PCDHGC3
PCDHGC4PCDHGC5
chr5Scale
PCDHα PCDHβ PCDHγ
A.
B.
C. PCDHGA4Y33S
CA1CA2CA3CA4CA5CA6
Figure 7.4: Organisation of the protocadherin gene cluster on chromosome 5p31. (A)Chromosome 5 ideograph with the location of the protocadherin gene cluster indicatedby a red bar. This locus, expanded below contains three gene families; PCDHα, β andγ. (B) The PDGHγ family contains 22 genes. The variable exons (blue) are tandemlyarranged upstream of the three common exons (orange). The PCDHGA4 variable exonis highlighted red. (C) The PCDHGA4 gene structure is shown, overlaid with theposition of the six cadherin protein domains (CA1-6;blue) transmembrane domain (red)and intracellular domain (yellow). The Y33S variant is located in the first CA domain.Protein domain coordinates were downloaded from the UniProt Knowledgebase [376].
soon afterwards. The neuronal die-back was shown to be cased by fewer and
weaker synapses after the deletion of Pcdhγ genes [373]. The PCDHγ locus is
unrelated to the CMT4C locus on 5q32 with mutations in the SH3TC2 gene
[220, 374, 375].
Only suggestive evidence of linkage to chromosome 7q34-q36 (LOD score
2.02) was identified in CMT44. With a genome wide linkage analysis it would
be expected that several loci reach a suggestive LOD score of 2 with five
affected individuals. This highlights the limits of genetic analysis using smaller
single families that are unable to generate significant linkage scores. In this
7 exome sequencing of cmt44 184
analysis we identified 17 rare SNVs or indels that segregated with five affected
individuals in family CMT44. It is likely that suitably informative markers at
these 17 loci would generate LOD scores approaching the maximum theoretical
value of 2 for this pedigree. The SNP genotype results indicate that there is
no common chromosome 7 haplotype between CMT54 and CMT44 and they
should be considered to be unrelated. A similar haplotype analysis linking
two CMTX3 families was recently shown to be incorrect when considering
additional SNP markers across the haplotype [357]. The SNPs used as markers
here were all common, with a population incidence of > 0.1 (mean 0.4). As
such they are unsuitable for haplotype comparison between families due to the
high probability of identity by state. However, for homozygous SNPs where
nucleotides are unique to each pedigree, the haplotypes can be effectively
shown to be different.
Analysis of exome data indicated that chromosome 7q34-q36 is unlikely to
play a role in the disease in CMT44. The two genes with non-synonymous
SNVs described here, in particular PCDHGA4, are good candidates for further
analysis in additional dHMN and CMT families. Unfortunately this analysis
was beyond the time-frame of this candidature. To confirm a pathogenic role for
either of these genes will require the identification of additional mutations in
pedigrees with a similar phenotype and further functional analysis. Functional
analysis of these genes including cell and animal models, may shed light on
the mechanisms that underlie neurodegenerative disease.

8G E N E R A L D I S C U S S I O N
Distal HMN is a disorder of the peripheral nervous system, predominantly
affecting motor neurons. It clinically resembles the related hereditary motor
and sensory neuropathies including CMT. This PhD project aimed to identify
the defective gene on chromosome 7q34-q36 that is responsible for autosomal
dominant dHMN1. A combination of traditional and new technologies were
applied including linkage analysis, positional cloning and NGS. In addition
to analysis of the original linked family CMT54, linkage analysis was carried
out in an additional 20 families from an Australian dHMN cohort, with exome
sequencing in one of these families with evidence of suggestive linkage to the
dHMN1 7q34-q36 disease locus.
8.1 genetic studies in family cmt54
Linkage and haplotype analysis in family CMT54 was used to refine the
minimum probable candidate interval containing the dHMN disease gene, to
the 6.92 Mb interval flanked by D7S615 and D7S2546. This interval is defined
by recombination events in clinically unaffected individuals in CMT54. This is
only considered a ‘probable’ candidate region due the possibility of reduced
penetrance in dHMN. The critical disease interval defined by recombinations in
affected individuals is the 12.98 Mb interval flanked by D7S2513 and D7S637.
The 12.98 Mb interval on 7q34-q36 contains 89 known candidate genes (not
including transcripts for taste, olfactory or T-cell receptors), with 56 candidate
genes within the minimum probable candidate interval. A positional candidate
185

8 general discussion 186
based approach was initially applied to screen selected candidate genes using
Sanger sequencing of exons and flanking intronic regions. With the possibility
of reduced penetrance, the minimum probable candidate interval was used
as a guide for prioritising candidate genes for sequencing. No pathogenic
mutation was identified in 32 genes screened (and 1 partially screened gene)
in CMT54.
Sanger sequencing can identify small scale sequence changes including point
mutations and small indels, but cannot identify larger scale structural variation.
Therefore, two complementary approaches were used to identify structural
variation in the 7q34-q36 interval in CMT54: karyotyping of chromosomal
spreads and aCGH. No microscopic structural variation or chromosomal
abnormalities were identified using karyotyping. Array based CGH identified
89 unique CNVs ranging from 4 bp to 110 312 bp, with a mean size of 3847
bp. Four deletions segregated with the disease when just three affected and
one unaffected ‘married in’ spouse were compared, however all were shown to
be non-pathogenic, being intragenic sequences or identified in normal control
populations. This excluded structural variation at a microscopic resolution and
CNV from an approximate resolution of 500 bp and greater as a source of the
causative disease mechanism in CMT54.
Using NGS, the 7q34-q36 disease interval was initially sequenced in one af-
fected individual using targeted DNA capture of the 7q34-q36 interval and 454
sequencing. This achieved coverage of ∼73% of the critical disease interval with
an average read-depth of 18.84 ×. No putative pathogenic sequence variant
was identified from all exons, flanking intronic intervals and 5’ and 3’ UTRs.
Using exome sequencing of two additional affected and one family control in-
dividual, and re-sequencing of the DNA target capture individual, the coding
exons from the 7q34-q36 interval were again examined with greater sequenc-
ing coverage. Differences in sequencing coverage were demonstrated between
patients, which limited the identification of confirmed known sequence vari-

8 general discussion 187
ants segregating with the affected individuals. To address this, a method was
developed to examine the segregation of all identified variants considering the
sequence read-depth in order to eliminate false negatives in affected individu-
als. Using this method, 99.4% of exons defined by the CCDS database within
the 7q34-q36 interval were sequenced with an average read depth of 227 ×. As
no putative pathogenic mutation was identified in CMT54 within the 7q34-q36
interval, novel non-synonymous changes from the remainder of the exome
were examined. After filtering using in silico based predictions of the effect of
sequence variants and sequencing in additional CMT54 family members, all
remaining non-synonymous changes were excluded.
While the sequencing of genes within the 7q34-q36 interval was compre-
hensive, including both the targeted Sanger sequencing and NGS based ap-
proaches, several possibilities still exist for the identification of the disease
mutation. These include; mutations in genomic regions not included in the cur-
rent analysis; or mutations that cause disease through a alternate mechanism
not detected by these methods.
Considering genomic regions not covered by the current analysis, it is
possible that the mutation may be present in: an unknown gene; an unknown
isoform of a known gene; or a regulatory region. In the positional candidate
based approach using Sanger sequencing, all alternate isoforms and known
exons were considered for each candidate gene. This was achieved by using
annotations from the UCSC genes track (UCSC genome browser) which uses
data from RefSeq, Genbank, CCDS and UniProt databases. Given the large
number of alternate transcripts for known genes in the candidate region,
it is reasonable to assume that other isoforms are yet to be discovered.The
sequencing approach using targeted DNA capture and NGS of the 7q34-q36
interval also applied the gene annotations from the UCSC genes track. On
the other hand, exome sequencing only targeted CCDS genes, as used in the
NimbleGen 2.1M exome capture arrays. The CCDS genes database includes a

8 general discussion 188
core set of protein coding regions that are consistently annotated and of high
quality. However, not all genes and alternate transcripts are included [354, 377].
While the exome capture array targets most genes and exons within the 7q34-
q36 interval, there are some notable exceptions, including DPP6, screened
previously as a positional candidate using Sanger sequencing. Additionally,
while most genes have been effectively identified since the completion of
the human genome project [227, 228], annotations continue to be updated.
An example of this is the AGAP3 gene (formerly CENTG3), within the 7q34-
q36 interval, which has been revised during the course of this project with
additional exons and isoforms annotated. While sequencing concentrated on
coding sequences and intronic splice site intervals, regulatory regions including
the UTR exons and core promoter were also examined. However, this analysis
was limited to basic annotation such as upstream start codons or mutated stop
codons. Several other regulatory mechanisms were not examined such as RNA
binding sites, metal response element binding sites, secondary structure, and
upstream non-core promoter elements, due to the difficulty in identifying these
regions for most genes in silico. Sequence coverage for UTRs was variable
between the platforms used. While all UTRs were targeted by the NimbleGen
7q34-q36 DNA capture arrays, these regions have been shown to be poorly
covered by NimbleGen exome capture platforms, only sequenced by over-run
of sequencing from coding sequences [227].
Considering structural variation as a disease mechanism at the 7q34-q36 in-
terval, there remains a gap in completeness of structural variation analysis due
to the limitations of resolution for the methods used in this thesis. Karyotyping
is able to assess all structural variation within the genome but is limited by
its microscopic resolution of approximately 3 Mb. Array based CGH used in
this thesis achieves a much higher resolution, with a very high probe density,
and was able to report on duplications and deletions down to a resolution of
only a few bp. However, the probe density varied across the 7q34-q36 interval
8 general discussion 189
with variable suitability of the sequence to probe design. The average probe
density achieved a resolution to detect a CNV of approximately 500 bp or
greater across the 7q34-q36 interval. This analysis is limited to duplications
and deletions of unique sequences; it does not explore inversions or balanced
translocations or known repeat elements such as microsatellites. Small indels
within genes in the 7q34-q36 interval were identified with targeted Sanger
sequencing and NGS analysis (454 sequencing and gsMapper software), how-
ever a gap remains in the resolution between the sequencing and aCGH based
platforms.
Recently a non-coding GGGGCC hexanucleotide repeat in the gene C9ORF72
was identified as a genetic cause of ALS and frontotemporal dementia (FTD)
by two studies [378, 379]. The size of this repeat ranges from 2-23 repeats in
controls to approximately 700 to 1600 repeats in patients [378]. The disease
associated allele is too large to amplify by PCR due to the large number of GC
rich repeats. Hence, in one study, this repeat expansion was identified by an
aberrant segregation pattern of alleles in a pedigree. In the second study, the
presence of the expanded repeat was identified by manual alignment of NGS
reads around a cluster of SNPs at this location. A similar repeat would not have
been identified by any of the methods employed in this project. With expansion
of short tandem repeats now demonstrated as a major disease mechanism in
ALS, similar repeats within genes in the 7q34-q36 interval in CMT54 are good
candidates for further gene screening.
A potential location for repeat elements is the gap in the human genome
reference sequence located within the intronic region of the DPP6 gene. This is
a non-bridged sequence gap with a nominal size of 99 kb [255] (Section 4.3.1).
Almost all such remaining gaps contain tandem repeat sequences [227]. This
region of DPP6 is excluded from the disease locus by a genetic recombination
in an unaffected individual by one informative marker (D7S2546). However, if
this unaffected individual were non-penetrant, then the disease gene based on
8 general discussion 190
positional cloning would be DPP6 alone. DPP6 was initially selected as a good
positional candidate gene due to its association with susceptibility to sporadic
ALS in several European populations [264–266] This association could not be
explained by coding sequence mutations in DPP6 [380]. DPP6 was sequenced
in this thesis, with no mutations identified. The potential size of the gap in the
genome reference sequence assembly makes it difficult to quantify using PCR
based methods.
The initial genome wide linkage analysis carried out in CMT54 identified
7q34-q36 as the only locus with significant linkage to the disease. While three
other loci achieved two-point LOD scores above 1.5, all non-synonymous
sequence variants in these intervals identified by exome sequencing were
excluded. Therefore, it remains likely that the causative disease mutation is
located within the 7q34-q36 locus and is yet to be identified.
8.2 genetic linkage analysis in additional dhmn families
Using linkage analysis, the 7q34-q36 interval was examined in a cohort of
20 families with dHMN or CMT with predominant motor phenotype. One
family (CMT44) was identified with suggestive linkage to 7q34-q36 (two-point
LOD score of 2.02) reaching the the maximum theoretical power for this
pedigree. Seven additional families had a haplotype segregating with affected
individuals at 7q34-q36, however, they were uninformative in linkage analysis.
Linkage to 7q34-q36 was excluded in the remaining 12 families.
Comparison of haplotypes between the families not excluded and a control
group of 56 haplotypes indicated CMT54 and three other families (including
CMT44) had haplotypes that statistically were significantly associated with the
disease. This implied that the haplotypes were IBD and the families share a
common ancestor for the 7q34-q36 interval. The common interval shared by
8 general discussion 191
these haplotypes suggested a smaller disease interval of 1.14 Mb. However,
subsequent analysis comparing CMT54 and CMT44 haplotypes using a larger
set of SNP markers showed the haplotypes are different. The initial false
haplotype association may have been caused by chance or due to differences
in ethnicity between the disease and control groups used in the analysis. The
families with the common haplotypes all had similar ethnic backgrounds.
With no additional families conclusively linked to 7q34-q36 from the larger
dHMN cohort it is likely that the gene on 7q34-q36 is a rare cause of dHMN.
This reflects the genetic heterogeneity in dHMN overall, with most genes
accounting for only a small percentage of disease [6]. If the disease gene on
7q34-q36 has a similar incidence to other dHMN genes we can expect few
of the 20 families to be linked to 7q34-q36. However, this does not exclude
the small families that were uninformative or gave suggestive LOD scores
at 7q34-q36. Many of these families achieved the maximum theoretical LOD
scores for markers at this locus.
8.3 genetic studies in family cmt44
In dHMN family, CMT44, exome sequencing identified the potential digenic
inheritance of the known CMT gene MFN2 and an unknown mutation in a
second gene. In this pedigree, the founder dHMN individual does not carry
the MFN2 mutation, which is instead transmitted from his spouse who has a
mild CMT phenotype. The four other affected individuals have a more severe
combined dHMN/CMT2 predominant motor phenotype and carry the MFN2
mutation and the unknown mutation. The MFN2 mutation shows reduced or
age dependant penetrance. The founder CMT individual has mild symptoms
and onset during advanced adulthood. Two clinically unaffected but at risk
individuals also carry the MFN2 mutation. A second mutation is likely to

8 general discussion 192
be inherited from the founder dHMN parent causing the dHMN phenotype.
A haplotype at the 7q34-q36 disease interval was shown to segregate with
individuals in CMT44 with a dHMN phenotype and not in any of the other
family members. No putative pathogenic sequence variants were identified
within the 7q34-q36 interval using exome sequencing. However, two candidate
SNVs were identified in the genes DNAH11 and PCDHGA4. The SNV in PCD-
HGA4 is a particularly good candidate gene for dHMN, with essential roles in
the brain and spinal cord and a mouse model with severe neurodegenerative
phenotype. As no pathogenic mutation was identified within the 7q34-q36
interval in CMT44, it is unlikely that this locus plays a major role in the disease
and the suggestive (but insignificant) LOD score of 2 has probably occurred by
chance.
The MFN2 P123L mutation was previously described in a small pedigree
with severe early onset CMT2. This phenotype contrasts with the reduced
penetrance and mild phenotype seen in some individuals in CMT44. The more
severe dHMN phenotype in four individuals is likely to result from inheritance
of both the dHMN and CMT2 genes from the two independently affected
parents. The genetic analysis of CMT44 highlights the difficulties associated
with diagnosis of dHMN and related peripheral neuropathies and reaffirms
that caution must be applied when using unaffected individuals to define
disease intervals.
8.4 conclusion
Identification of new gene mutations is critical to further understanding the
biochemical and cellular processes underlying dHMN. Although the causative
mutation for dHMN on 7q34-q36 was not identified, a significant proportion
of the disease interval has been excluded using a combination of traditional

8 general discussion 193
and new technologies. This project spanned a period where there has been a
revolution in sequencing technologies. NGS continues to be developed and
improved. Bioinformatics platforms are also rapidly advancing for analysis
of the vast amounts of sequencing data. Much of the sequencing data gen-
erated by NGS in this project can be re-examined when new more powerful
bioinformatics approaches address current limitations or when more powerful
computing resources become available. In addition to the analysis of 7q34-q36
in family CMT54, a strong candidate dHMN gene mutation has been identified
in CMT44. Finding the 7q34-q36 disease gene and other dHMN mutations will
lead to improved dHMN diagnostics and may identify potential therapeutic
targets for disease prevention or treatment. The further analysis of rare genetic
variants identified through NGS will allow us to characterise the influence
of less penetrant modifier loci on the variable phenotypes seen in dHMN
and other peripheral neuropathies. Future studies should include transcrip-
tome analysis by next-gen RNA sequencing, which may identify unknown
transcripts and exons that map to chromosome 7q34-q36.

AC U S T O M G N U B A S H S C R I P T S
This Appendix details the BAsH scripts written to automate tasks and analysis
in this thesis. All scripts were written by myself for BAsH, version 4.1.5 (Free
Software Foundation, Inc) using Ubuntu 10.04.4 LTS (www.ubuntu.com).
a.1 linkage analysis
The script pedmake.sh converts MLINK pedigree and marker data files into
the input format required for the Easylinkage plus software package. File
and marker naming limitations apply when using this script. File names can
have up to 4 digits in a marker (e.g. D7s1234). Unique marker names are
supported if added when prompted by the script and must be 6 or 7 characters
long. For markers not named accordingly, manually edit the mlink.DAT file
before running the script to change the marker names to comply with these
requirements. Family names should be 6 digits long (e.g. CMT123). The output
files from this script have been tested with; FastSLink, FastLink, SuperLink,
and GeneHunter.
1 #!/bin/bash
2 echo "converts cyrillic output into easy linkage format"
3 OPTIONS="Help Run Quit"
4 select opt in $OPTIONS; do
5 if [ "$opt" = "Quit" ]; then
6 echo done
7 exit
8 elif [ "$opt" = "Run" ]; then
9
10 echo "enter the marker chromosome"
11 read chrom
12 echo "D"$chrom > pattern.tmp
13 echo "d"$chrom >> pattern.tmp
194

a custom gnu bash scripts 195
14 echo "Are there any special microsat names (y/n)?"
15 read REPLY
16 while [ $REPLY == "y" ]
17 do
18 # if [ $REPLY == "y" ]; then
19 echo "enter the special name"
20 read specM
21 echo $specM >> pattern.tmp
22 echo "another(y/n)?"
23 read REPLY
24 # fi
25 done
26
27 echo "*searching for patterns"
28 cat pattern.tmp
29 grep -f pattern.tmp mlink.DAT > markers.tmp # get a list of markers from .
DAT file
30 echo "*the following markers were found"
31 cat markers.tmp
32 rm pattern.tmp
33
34 echo "is the disease marker in the 1st position (y/n)?"
35 read REPLY
36 if [ $REPLY == "y" ]; then
37 b=42 #position of first marker score A_1
38 d=45 #position of second marker A_2
39 elif [ $REPLY == "n" ]; then
40 b=36 #position of first marker score A_1
41 d=39 #position of second marker A_2
42 fi
43 fcount=1 # file counter
44
45 while read line
46 do
47 extnum=$(printf %03d $fcount) #adds leading zeros to the
extension mumber for the file name
48 markerC=‘echo "$line"‘; # marker name line info
49 markerD=‘echo ${markerC/\"/\@}‘ # Replaces first match of " with
@
50 markerE=‘echo ${markerD/\"}‘ # Removes last "
51 markerN=‘echo ${markerE:\‘expr index "$markerE" ’\@’\‘:7}‘ # holds the
marker name with the extra space at the end
52 echo "generating file for" $markerN
53
54 filename=‘echo ${markerE:\‘expr index "$markerE" ’\@’\‘:${#markerN}}"_"
$chrom"_"$extnum".abi"‘
55
56 echo $filename
57 echo "output for marker "$markerN" into file: "$filename
58 echo -e "MARKER\tLANE\tID\tA_1\tA_2" > $filename #file header
59 a=0 #line counter
60 while read line
61 do
62 a=$(($a+1)) #a++
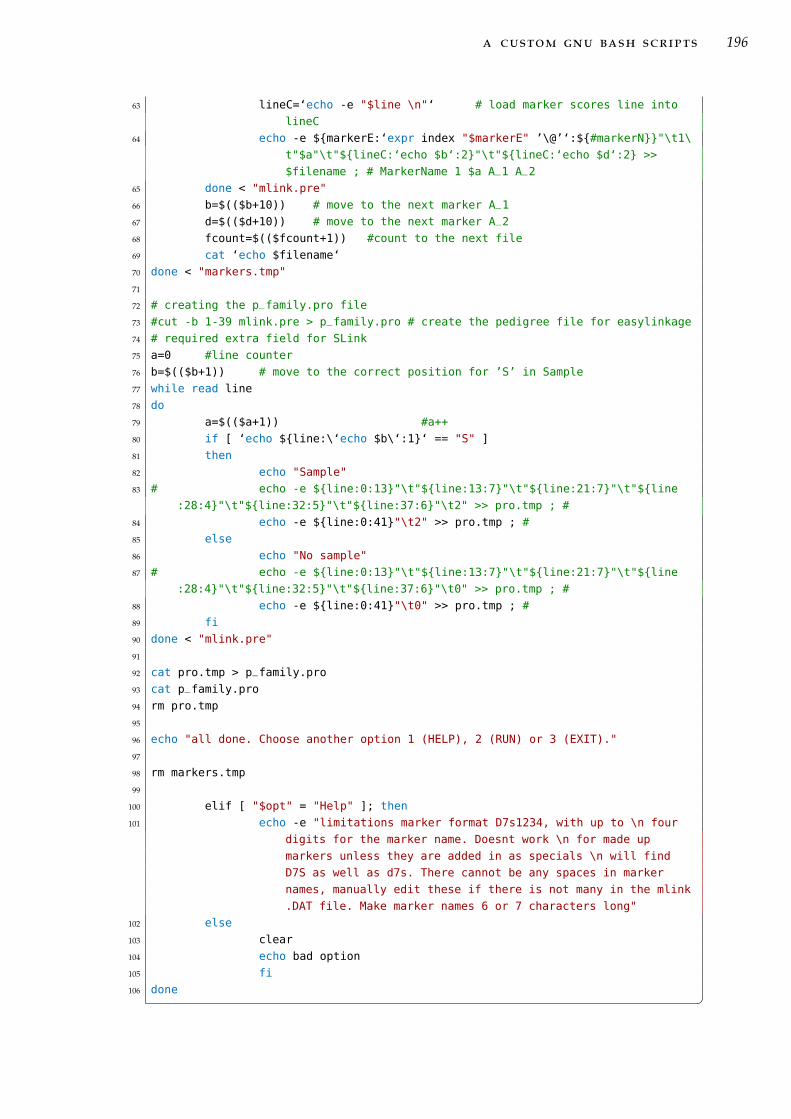
a custom gnu bash scripts 196
63 lineC=‘echo -e "$line \n"‘ # load marker scores line into
lineC
64 echo -e ${markerE:‘expr index "$markerE" ’\@’‘:${#markerN}}"\t1\
t"$a"\t"${lineC:‘echo $b‘:2}"\t"${lineC:‘echo $d‘:2} >>
$filename ; # MarkerName 1 $a A_1 A_2
65 done < "mlink.pre"
66 b=$(($b+10)) # move to the next marker A_1
67 d=$(($d+10)) # move to the next marker A_2
68 fcount=$(($fcount+1)) #count to the next file
69 cat ‘echo $filename‘
70 done < "markers.tmp"
71
72 # creating the p_family.pro file
73 #cut -b 1-39 mlink.pre > p_family.pro # create the pedigree file for easylinkage
74 # required extra field for SLink
75 a=0 #line counter
76 b=$(($b+1)) # move to the correct position for ’S’ in Sample
77 while read line
78 do
79 a=$(($a+1)) #a++
80 if [ ‘echo ${line:\‘echo $b\‘:1}‘ == "S" ]
81 then
82 echo "Sample"
83 # echo -e ${line:0:13}"\t"${line:13:7}"\t"${line:21:7}"\t"${line
:28:4}"\t"${line:32:5}"\t"${line:37:6}"\t2" >> pro.tmp ; #
84 echo -e ${line:0:41}"\t2" >> pro.tmp ; #
85 else
86 echo "No sample"
87 # echo -e ${line:0:13}"\t"${line:13:7}"\t"${line:21:7}"\t"${line
:28:4}"\t"${line:32:5}"\t"${line:37:6}"\t0" >> pro.tmp ; #
88 echo -e ${line:0:41}"\t0" >> pro.tmp ; #
89 fi
90 done < "mlink.pre"
91
92 cat pro.tmp > p_family.pro
93 cat p_family.pro
94 rm pro.tmp
95
96 echo "all done. Choose another option 1 (HELP), 2 (RUN) or 3 (EXIT)."
97
98 rm markers.tmp
99
100 elif [ "$opt" = "Help" ]; then
101 echo -e "limitations marker format D7s1234, with up to \n four
digits for the marker name. Doesnt work \n for made up
markers unless they are added in as specials \n will find
D7S as well as d7s. There cannot be any spaces in marker
names, manually edit these if there is not many in the mlink
.DAT file. Make marker names 6 or 7 characters long"
102 else
103 clear
104 echo bad option
105 fi
106 done �

a custom gnu bash scripts 197
a.2 ngs coverage visualisation
The script PileupToBgr.sh extracts sequencing depth from SAMTOOLS pileup
format and formats a bedgraph file for visualisation using the UCSC genome
browser. To work there must be some sequence coverage at the start position
selected. If there is no coverage at the desired start position then a position in
the previous gene must be selected where some sequence coverage is present.
1 #!/bin/bash
2
3 echo this script will take pileup formatted data and generate a bedgraph showing
the sequencing depth at each base position
4 echo it is recommended to examine small regions only to limit the size of the
files uploaded to the UCSC genome browser
5
6 echo enter sample number # id of the sample being examined
7 read sample
8 echo "enter the chromosome in the format chrN"
9 read chrom
10 echo "enter the start position for the gene or region of interest in the format
123456789" # 1st base position of gene of interest
11 read GeneStart
12 echo "enter the end position of the region of interest in the format 123456789"
13 read GeneEnd
14 echo enter the gene or region name "(Identifier)" # name of the gene of interest
15 read GeneName
16 GLength=$[$GeneEnd-$GeneStart] #calculate the length of the region of interest
17
18 # 1. make a smaller file with the info from just one chromosome
19 echo do you want to isolate chromosome data? only needs to be "done once. y/n" #
skip this step if it has already been done previously
20 read Answer
21 if [ $Answer = "y" ]; then
22 str1="grep "$chrom" "$sample".pileup > "$sample"."$chrom".pileup"
23 echo isolating $chrom data
24 eval $str1
25 fi
26
27 # 2. make a pile up file contining the sequence information for the gene of
interest
28 # due to gaps in the sequence where there is no coverage at all this pileup will
contain more coverage information at the end of the gene. This is because
it counts lines equal to the length of the gene so ant gaps will cause lines
after the gene to be included. This is no problem and beneficial as you can
see where the gaps really are.
29 str2="grep -A "$GLength" "$GeneStart" "$sample"."$chrom".pileup > "$GeneName".
pileup.tmp"
30 echo isolating $GeneName data
31 eval $str2
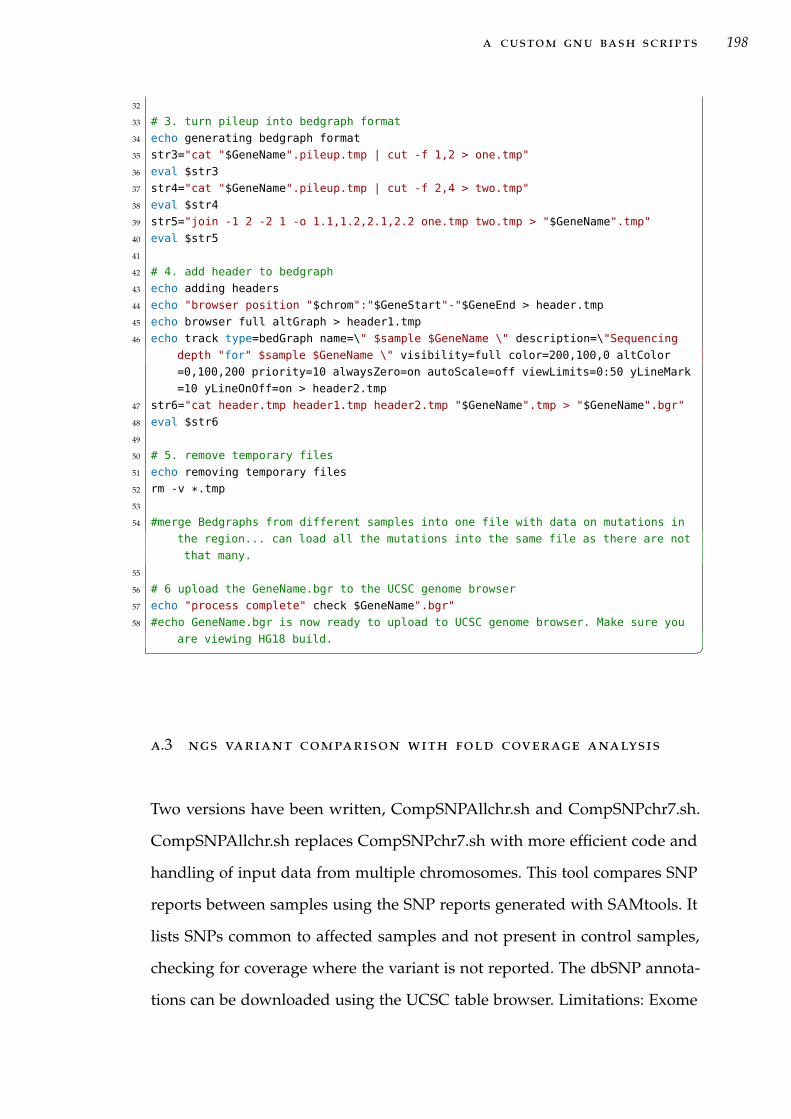
a custom gnu bash scripts 198
32
33 # 3. turn pileup into bedgraph format
34 echo generating bedgraph format
35 str3="cat "$GeneName".pileup.tmp | cut -f 1,2 > one.tmp"
36 eval $str3
37 str4="cat "$GeneName".pileup.tmp | cut -f 2,4 > two.tmp"
38 eval $str4
39 str5="join -1 2 -2 1 -o 1.1,1.2,2.1,2.2 one.tmp two.tmp > "$GeneName".tmp"
40 eval $str5
41
42 # 4. add header to bedgraph
43 echo adding headers
44 echo "browser position "$chrom":"$GeneStart"-"$GeneEnd > header.tmp
45 echo browser full altGraph > header1.tmp
46 echo track type=bedGraph name=\" $sample $GeneName \" description=\"Sequencing
depth "for" $sample $GeneName \" visibility=full color=200,100,0 altColor
=0,100,200 priority=10 alwaysZero=on autoScale=off viewLimits=0:50 yLineMark
=10 yLineOnOff=on > header2.tmp
47 str6="cat header.tmp header1.tmp header2.tmp "$GeneName".tmp > "$GeneName".bgr"
48 eval $str6
49
50 # 5. remove temporary files
51 echo removing temporary files
52 rm -v *.tmp
53
54 #merge Bedgraphs from different samples into one file with data on mutations in
the region... can load all the mutations into the same file as there are not
that many.
55
56 # 6 upload the GeneName.bgr to the UCSC genome browser
57 echo "process complete" check $GeneName".bgr"
58 #echo GeneName.bgr is now ready to upload to UCSC genome browser. Make sure you
are viewing HG18 build. �
a.3 ngs variant comparison with fold coverage analysis
Two versions have been written, CompSNPAllchr.sh and CompSNPchr7.sh.
CompSNPAllchr.sh replaces CompSNPchr7.sh with more efficient code and
handling of input data from multiple chromosomes. This tool compares SNP
reports between samples using the SNP reports generated with SAMtools. It
lists SNPs common to affected samples and not present in control samples,
checking for coverage where the variant is not reported. The dbSNP annota-
tions can be downloaded using the UCSC table browser. Limitations: Exome

a custom gnu bash scripts 199
sequencing pileup files with good coverage are large (6 gb to 8 gb). Pileup files
should be optimised to ensure good performance. If a linked region is being
examined extract only the target chromosome data using the grep command
(grep chr7 sample1.pileup > sample1.chr7.pileup). Otherwise use the cut com-
mand to remove only the necessary colums out of the data files to reduce their
size (optimised size 6̃0%) (cut -f 1-4 sample1.pileup > sample1.cut1-4.pileup).
The SNP report files are smaller and are not a limit to the comparison on a
reasonable desktop PC. Hard disk speed limits process on most computers,
so locate files on local HDD not on USB HDD or network attached storage. If
large amounts of RAM are available, load SNP and pileup files onto a RAM
disk to increase speed but output should be directed to normal HDD space.
This script is not recommended for routine use as it takes a long time to run
on an entire exome.
grep chr7 sample1.pileup > sample1.chr7.pileup
cut -f 1-4 sample1.pileup > sample1.cut1-4.pileup �1 #!/bin/bash
2
3 echo -e "**************\nCompSNP script\n**************"
4
5 echo "A specific file structure is required to run this script"
6 echo /Project
7 echo "/Project/snpfiles (/Project/\$SamPath/Sample1.snp)"
8 echo /Project/Sample1/Sample1.pileup
9 echo /Project/Sample2/Sample2.pileup
10 echo "Results are located in /Project/results renamed with the time of
completion"
11
12
13 echo -e "\nprogram requirements \n* Sample data: sample.snp and sample.pileup \n
snp file must have the same file name as the .pileup file\n* SNP database
reference for annotation\n eg. chr7q34-q36SNP130.snp \n* read the script
file for more detail\n\n"
14 read -p "Press any key to continue when files are ready or terminate using <ctrl
> C"
15
16 echo -e "\n\nEnter the path to the samples (dont use use / at end of path) \n\n
!!!Current default BGIData/onlychr7data/ will overwrite whatever you type!!!
"
17 read SamPath
18 SamPath=BGIData #SamPath points to the sample.snp files only
19

a custom gnu bash scripts 200
20 #Initialise results files
21 echo "‘date‘" > $SamPath/debug.txt
22 echo "‘date‘" > $SamPath/GoodSNP.txt
23 echo "‘date‘" > $SamPath/BadSNP.txt
24 echo "‘date‘" > $SamPath/checkSNP.tmp
25
26 # get sample numbers without file extensions
27 # should use read to input new sample numbers each time but i was using these
same four samples so added defaults that overwrite input
28 echo -e "Enter your sample numers \n\n!!!Current default will overwrite whatever
you type!!!"
29
30 echo -e "enter sample Affected 1:\c"
31 read Sam1
32 Sam1=A040681 # comment this line if you want to use different samples
33
34 echo -e "enter sample Affected 2:\c"
35 read Sam2
36 Sam2=A050794 # comment this line if you want to use different samples
37
38 echo -e "enter sample Affected 3:\c"
39 read Sam3
40 Sam3=A080682 # comment this line if you want to use different samples
41
42 echo -e "enter sample Control 1:\c"
43 read Sam4
44 Sam4=N010742 # comment this line if you want to use different samples
45
46 read -p "Press any key to start analysis... terminate process early using <ctrl>
C"
47
48 # adds a header with the sample numbers used to results files. Improvement would
create a unique file name each run.
49 echo -e "Samples:\t" $Sam1 $Sam2 $Sam3 $Sam4 >> $SamPath/GoodSNP.txt
50 echo -e "Samples:\t" $Sam1 $Sam2 $Sam3 $Sam4 >> $SamPath/BadSNP.txt
51 echo -e "Samples:\t" $Sam1 $Sam2 $Sam3 $Sam4 >> $SamPath/checkSNP.tmp
52 echo -e "Samples:\t" $Sam1 $Sam2 $Sam3 $Sam4 >> $SamPath/debug.txt
53 # Error checking for files
54 echo "header for file $Sam1.snp" >> $SamPath/debug.txt
55 head -n 1 $SamPath/$Sam1.snp >> $SamPath/debug.txt
56 echo "header for file $Sam1.pileup" >> $SamPath/debug.txt
57 head -n 1 "$Sam1/$Sam1.pileup" >> $SamPath/debug.txt
58
59 echo "header for file $Sam2.snp" >> $SamPath/debug.txt
60 head -n 1 $SamPath/$Sam2.snp >> $SamPath/debug.txt
61 echo "header for file $Sam2.pileup" >> $SamPath/debug.txt
62 head -n 1 "$Sam2/$Sam2.pileup" >> $SamPath/debug.txt
63
64 echo "header for file $Sam3.snp" >> $SamPath/debug.txt
65 head -n 1 $SamPath/$Sam3.snp >> $SamPath/debug.txt
66 echo "header for file $Sam3.pileup" >> $SamPath/debug.txt
67 head -n 1 "$Sam3/$Sam3.pileup" >> $SamPath/debug.txt
68
69 echo "header for file $Sam4.snp" >> $SamPath/debug.txt

a custom gnu bash scripts 201
70 head -n 1 $SamPath/$Sam4.snp >> $SamPath/debug.txt
71 echo "header for file $Sam4.pileup" >> $SamPath/debug.txt
72 head -n 1 "$Sam4/$Sam4.pileup" >> $SamPath/debug.txt
73 echo -e "\nNo file errors should have been reported. There should be a header
for each file." >> $SamPath/debug.txt
74
75 # generate SNP reference file automatically
76
77 echo "Generating SNP reference file"
78 cut -f 1,2 "$SamPath/$Sam1.snp" > AllSNP.tmp
79 cut -f 1,2 "$SamPath/$Sam2.snp" >> AllSNP.tmp
80 cut -f 1,2 "$SamPath/$Sam3.snp" >> AllSNP.tmp
81 cut -f 1,2 "$SamPath/$Sam4.snp" >> AllSNP.tmp
82 sort AllSNP.tmp > AllSNP.sort
83 uniq AllSNP.sort AllSNP.uniq
84 echo -e "unique SNPs: \c"
85 wc -l AllSNP.uniq
86
87 rm AllSNP.tmp
88 rm AllSNP.sort
89
90 DataFile=AllSNP.uniq
91 echo "DataFile is $DataFile" >> "$SamPath/debug.txt"
92 DataCol=1
93 echo "DataCol is $DataCol" >> "$SamPath/debug.txt"
94
95 #Pull out all markers from file (add -u command to sort to pull out unique SNPs)
96 #echo "The data file contains the following SNP positions"
97 str1="cat $DataFile"
98 #str1="cut -f $DataCol $DataFile"
99 #str1="sort -k "$DataCol","$DataCol" "$DataFile" | cut -f "$DataCol
100
101 #Count number of markers in $Datafile
102 echo -e "Begining analysis. \nThis may take some time. \nThere are ‘eval $str1|
wc -l‘ unique SNPs to be cross checked"
103 echo -e "number\tControl\tAff1\tAff2\tAff3\t"
104 #generates an array with the marker positions
105
106 OLD_IFS=$IFS
107 IFS=$’\n’
108 let line_counter=0
109 for line in $(cat "$DataFile"); do
110 str1=‘grep -m 1 ${line} $SamPath/$Sam1.snp | cut -f 1,2‘ # is there a
SNP in thos position?
111 str2=‘grep -m 1 ${line} $SamPath/$Sam2.snp | cut -f 1,2‘
112 str3=‘grep -m 1 ${line} $SamPath/$Sam3.snp | cut -f 1,2‘
113 str4=‘grep -m 1 ${line} $SamPath/$Sam1.snp | cut -f 1,2‘
114 str5=1
115 str6=0
116 echo -n -e "\n$line_counter:\t"
117 while :
118 do
119 str14=n
120 str11=n

a custom gnu bash scripts 202
121 str12=n
122 str13=n
123 if [[ $str4 ]]
124 then
125 str14=Y #This is the control sample so Y here excludes
this SNP
126 echo -n -e $str14 "\t"
127 str5=0
128 str6=0
129 break
130 else
131 str14=‘grep -m 1 ${line} $Sam4/$Sam4.pileup | cut -f 4‘
132 if [[ $str14 -lt 10 ]]
133 then #cannot exclude this SNP coverage is too
low
134 echo -n -e "!!"$str14"!!\t"
135 str6+=1
136 else # if this is above 10 then the sample is
included and will be caught by str5 analysis
137 echo -n -e $str14 "\t"
138 fi
139 fi
140 if [[ $str1 ]] # if the SNP exists in the sample.snp file it is reported
141 then
142 str11=Y
143 echo -n -e $str11 "\t"
144 else # the SNP is not reported in the sample.snp file, check the
coverage in the pileup file. Field 4 is the coverage figure
.
145 str11=‘grep -m 1 ${line} $Sam1/$Sam1.pileup | cut -f 4‘
146 str5=0
147 if [[ $str11 -lt 10 ]]
148 then #cannot exclude this SNP coverage is too
low
149 echo -n -e "!!"$str11"!!\t"
150 str6+=1
151 else #this SNP is not in this sample and has
good coverage therefore is excluded
152 echo -n -e $str11 "\t"
153 str6=0
154 break
155 fi
156 fi
157 if [[ $str2 ]]
158 then
159 str12=Y
160 echo -n -e $str12 "\t"
161 else
162 str12=‘grep -m 1 ${line} $Sam2/$Sam2.pileup | cut -f 4‘
163 str5=0
164 if [[ $str12 -lt 10 ]]
165 then #cannot exclude this SNP coverage is too
low
166 echo -n -e "!!"$str12"!!\t"

a custom gnu bash scripts 203
167 str6+=1
168 else #this SNP is not in this sample and has
good coverage therefore is excluded
169 echo -n -e $str12 "\t"
170 str6=0
171 break
172 fi
173 fi
174 if [[ $str3 ]]
175 then
176 str13=Y
177 echo -n -e $str13 "\t"
178 break
179 else
180 str13=‘grep -m 1 ${line} $Sam3/$Sam3.pileup | cut -f 4‘
181 str5=0
182 if [[ $str13 -lt 10 ]]
183 then #cannot exclude this SNP coverage is too
low
184 echo -n -e "!!"$str13"!!\t"
185 str6+=1
186 break
187 else #this SNP is not in this sample and has
good coverage therefore is excluded
188 echo -n -e $str13 "\t"
189 str6=0
190 break
191 fi
192 fi
193 done
194 if [[ $str5 -gt 0 ]]
195 then #generates a report on this SNP position from the UCSC snp
130 information
196 snpstr=‘grep ${line} chr7q34-q36SNP130.snp | cut -f
5,8,10,16,12,13‘
197 echo -e ${line}":\t" $str11"\t"$str12"\t"$str13"\t"
$str14"\t"$str5"\t" $snpstr >> "$SamPath/GoodSNP.txt
"
198 else # these SNPs are not found
199 echo -e ${line}":\t" $str11".\t"$str12".\t"$str13".\t"
$str14".\t"$str5 >> "$SamPath/BadSNP.txt"
200 fi
201 if [[ $str6 -gt 0 ]]
202 then
203 snpstr=‘grep "${line}" chr7q34-q36SNP130.snp | cut -f
5,8,10,16,12,13‘
204 echo -e ${line}":\t" $str11".\t"$str12".\t"$str13".\t"
$str14".\t"$str5"\t" $snpstr >> "$SamPath/checkSNP.
tmp"
205 fi
206 let line_counter=($line_counter+1)
207 done
208 IFS=$OLD_IFS
209

a custom gnu bash scripts 204
210 echo "SNPs that need to be checked" >> "$SamPath/GoodSNP.txt"
211 cat "$SamPath/checkSNP.tmp" >> "$SamPath/GoodSNP.txt"
212 rm "$SamPath/checkSNP.tmp"
213
214 mkdir results
215 mv "$SamPath/GoodSNP.txt" "results/‘date‘ GoodSNP.txt"
216 mv "$SamPath/BadSNP.txt" "results/‘date‘ BadSNP.txt"
217 mv "$SamPath/debug.txt" "results/‘date‘ debug.txt"
218 echo "the process is complete. The program output can be found in results/" �

BP C R P R I M E R S
This Appendix lists the PCR primers used in this thesis.
Table B.1: PCR primers used in gene screening. Primers were supplied by Invitrogenin a 25 nmole scale desalted purification
Gene / Exon Primer sequence (forward / reverse)RARRES2Ex1A F/R AGGAGCCAGAGTTGCTGGAG / ACCTAAACACGTGGGAGGGEx1B F/R AGAGGAAGGAGGGAAGATTTTG / CCCGGGCCATGCTACTCEx1C F/R AGTATTCGGCCTCCGGC / ACAGTGGCCTTTTCTCCAAAGEx2 F/R ATTTCCAGGCTCCTTCACCT / GAATGCGCTGGTCTCCTGEx3 F/R GGATCACACCAGGGCTTG / TTCTTAATGGACCTCCCAATTCEx4/5 F/R GCCTAGTTGGGGATCTGGTC / CCCCTCAGCATTCCCAGABP1Ex1_1 F/R AAAATTCCATGGCCCTAACC / ATACTCTGCTGTGGAGATGGGEx1_2 F/R AATGTCACCGAGTTTGCTGTG / GCTTGTGGGAGGAGAAGAGGEx1_3 F/R GTACAACGGGAAGTTCTATGGG / ATAATGGACCGGGTCATCGEx1_4 F/R ACCAAGTACCTCGATGTCGG / TTCCACCACCAGGGAGTTATAGEx2 F/R GATCCTGGGGTAGAATGAGGAG / ATCCACATAGACTAGGAACCCCEx3 F/R CTCTATTCTGACCCTGAGGCTG / GATGGTGATGAGGATGGTCCEx4 F/R GAGGAATTCAGCAAGTTTCCAG / CTCTGAGGGTTTATTGTCTGCCEZH2Ex2 F/R ACTGATTGTTAGTTTGCTGCGG / AAAACTTATTGAACTTAGGAGGGGEx3 F/R TTTTGTATTATTTGAATGTGGGAAAC / AAAGATGGACACCCTGAGGTCEx4 F/R ACCCTAAGTAAAAGAAAAGAGAGAATC / GGAAAAGAGTAATACTGCACAGGEx5 F/R AAATCTGGAGAACTGGGTAAAGAC / TCATGCCCTATATGCTTCATAAACEx6 F/R CTAGGCTATGCCTGTTTTGTCC / AAAAGAGAAAGAAGAAACTAAGCCCEx7 F/R GGCATTCCACAGACATGTAAAG / GCTCATCCGCTACATTGATTCEx8 F/R CATCAAAAGTAACACATGGAAACC / GCAATCCTCAAGCAACAAAGEx9 F/R TCCATTAATTGACTTTTCCAGTG / CATTAACGCTGACTTGATCACCEx10 F/R TTCACAATATAGAACTGTCTTGCC / AAACACCACAAGCTAGGGTACGEx11 F/R TTGAGTTGTCCTCATCTTTTCG / CCAAGAATTTTCTTTGTTTGGACEx12 F/R GCATCTAGCAGTGTCACAGAAG / AGAAACCAACAACAGCCCTTAGEx13 F/R TTCATGGCACAGATAGATCCAG / CAAATTGGTTTAACATACAGAAGGCEx14 F/R CACTCCACAGGTAGTAGGGAAG / AGGGAGTGCTCCCATGTTCEx15 F/R GAGAGTCAGTGAGATGCCCAG / TGCCCCAGCTAAATCATCTAAGEx16 F/R TTCTGTAGTCTACTTTGTCCCCAG / ATTCATTTCCAATCAAACCCACEx17 F/R TCCAGAAGGTCCAGTATTCACTC / GTCACCTCACTGACCTCTACCCEx18-19 F/R CAAACCCTGAAGAACTGTAACC / AACCCTCCTTTGTCCAGAGTTCEx20 F/R TTCTATGAATGTGCCGTTATGC / AAAACACTTTGCAGCTGGTGEx20-N F/R CACTATCTTCAGCAGGCTT / GTTAAATCAAGATTCATACAAAGACAACTA
Table B.1 - continued on next page
205
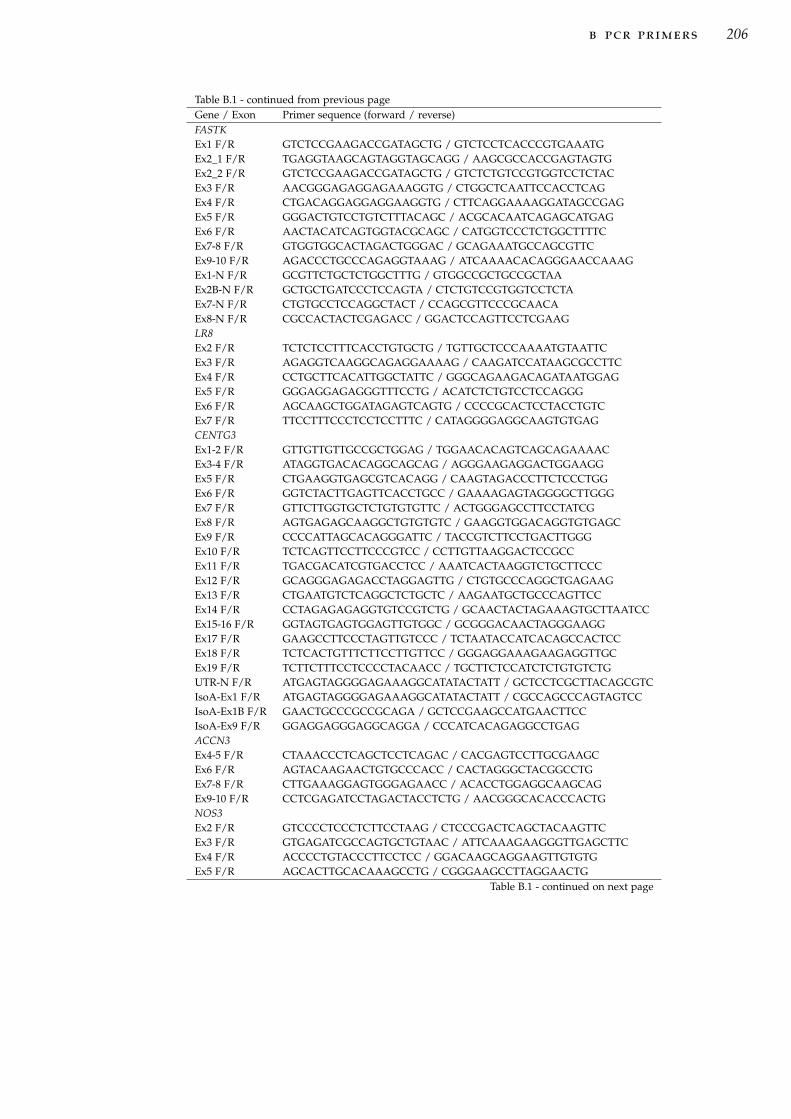
b pcr primers 206
Table B.1 - continued from previous pageGene / Exon Primer sequence (forward / reverse)FASTKEx1 F/R GTCTCCGAAGACCGATAGCTG / GTCTCCTCACCCGTGAAATGEx2_1 F/R TGAGGTAAGCAGTAGGTAGCAGG / AAGCGCCACCGAGTAGTGEx2_2 F/R GTCTCCGAAGACCGATAGCTG / GTCTCTGTCCGTGGTCCTCTACEx3 F/R AACGGGAGAGGAGAAAGGTG / CTGGCTCAATTCCACCTCAGEx4 F/R CTGACAGGAGGAGGAAGGTG / CTTCAGGAAAAGGATAGCCGAGEx5 F/R GGGACTGTCCTGTCTTTACAGC / ACGCACAATCAGAGCATGAGEx6 F/R AACTACATCAGTGGTACGCAGC / CATGGTCCCTCTGGCTTTTCEx7-8 F/R GTGGTGGCACTAGACTGGGAC / GCAGAAATGCCAGCGTTCEx9-10 F/R AGACCCTGCCCAGAGGTAAAG / ATCAAAACACAGGGAACCAAAGEx1-N F/R GCGTTCTGCTCTGGCTTTG / GTGGCCGCTGCCGCTAAEx2B-N F/R GCTGCTGATCCCTCCAGTA / CTCTGTCCGTGGTCCTCTAEx7-N F/R CTGTGCCTCCAGGCTACT / CCAGCGTTCCCGCAACAEx8-N F/R CGCCACTACTCGAGACC / GGACTCCAGTTCCTCGAAGLR8Ex2 F/R TCTCTCCTTTCACCTGTGCTG / TGTTGCTCCCAAAATGTAATTCEx3 F/R AGAGGTCAAGGCAGAGGAAAAG / CAAGATCCATAAGCGCCTTCEx4 F/R CCTGCTTCACATTGGCTATTC / GGGCAGAAGACAGATAATGGAGEx5 F/R GGGAGGAGAGGGTTTCCTG / ACATCTCTGTCCTCCAGGGEx6 F/R AGCAAGCTGGATAGAGTCAGTG / CCCCGCACTCCTACCTGTCEx7 F/R TTCCTTTCCCTCCTCCTTTC / CATAGGGGAGGCAAGTGTGAGCENTG3Ex1-2 F/R GTTGTTGTTGCCGCTGGAG / TGGAACACAGTCAGCAGAAAACEx3-4 F/R ATAGGTGACACAGGCAGCAG / AGGGAAGAGGACTGGAAGGEx5 F/R CTGAAGGTGAGCGTCACAGG / CAAGTAGACCCTTCTCCCTGGEx6 F/R GGTCTACTTGAGTTCACCTGCC / GAAAAGAGTAGGGGCTTGGGEx7 F/R GTTCTTGGTGCTCTGTGTGTTC / ACTGGGAGCCTTCCTATCGEx8 F/R AGTGAGAGCAAGGCTGTGTGTC / GAAGGTGGACAGGTGTGAGCEx9 F/R CCCCATTAGCACAGGGATTC / TACCGTCTTCCTGACTTGGGEx10 F/R TCTCAGTTCCTTCCCGTCC / CCTTGTTAAGGACTCCGCCEx11 F/R TGACGACATCGTGACCTCC / AAATCACTAAGGTCTGCTTCCCEx12 F/R GCAGGGAGAGACCTAGGAGTTG / CTGTGCCCAGGCTGAGAAGEx13 F/R CTGAATGTCTCAGGCTCTGCTC / AAGAATGCTGCCCAGTTCCEx14 F/R CCTAGAGAGAGGTGTCCGTCTG / GCAACTACTAGAAAGTGCTTAATCCEx15-16 F/R GGTAGTGAGTGGAGTTGTGGC / GCGGGACAACTAGGGAAGGEx17 F/R GAAGCCTTCCCTAGTTGTCCC / TCTAATACCATCACAGCCACTCCEx18 F/R TCTCACTGTTTCTTCCTTGTTCC / GGGAGGAAAGAAGAGGTTGCEx19 F/R TCTTCTTTCCTCCCCTACAACC / TGCTTCTCCATCTCTGTGTCTGUTR-N F/R ATGAGTAGGGGAGAAAGGCATATACTATT / GCTCCTCGCTTACAGCGTCIsoA-Ex1 F/R ATGAGTAGGGGAGAAAGGCATATACTATT / CGCCAGCCCAGTAGTCCIsoA-Ex1B F/R GAACTGCCCGCCGCAGA / GCTCCGAAGCCATGAACTTCCIsoA-Ex9 F/R GGAGGAGGGAGGCAGGA / CCCATCACAGAGGCCTGAGACCN3Ex4-5 F/R CTAAACCCTCAGCTCCTCAGAC / CACGAGTCCTTGCGAAGCEx6 F/R AGTACAAGAACTGTGCCCACC / CACTAGGGCTACGGCCTGEx7-8 F/R CTTGAAAGGAGTGGGAGAACC / ACACCTGGAGGCAAGCAGEx9-10 F/R CCTCGAGATCCTAGACTACCTCTG / AACGGGCACACCCACTGNOS3Ex2 F/R GTCCCCTCCCTCTTCCTAAG / CTCCCGACTCAGCTACAAGTTCEx3 F/R GTGAGATCGCCAGTGCTGTAAC / ATTCAAAGAAGGGTTGAGCTTCEx4 F/R ACCCCTGTACCCTTCCTCC / GGACAAGCAGGAAGTTGTGTGEx5 F/R AGCACTTGCACAAAGCCTG / CGGGAAGCCTTAGGAACTG
Table B.1 - continued on next page
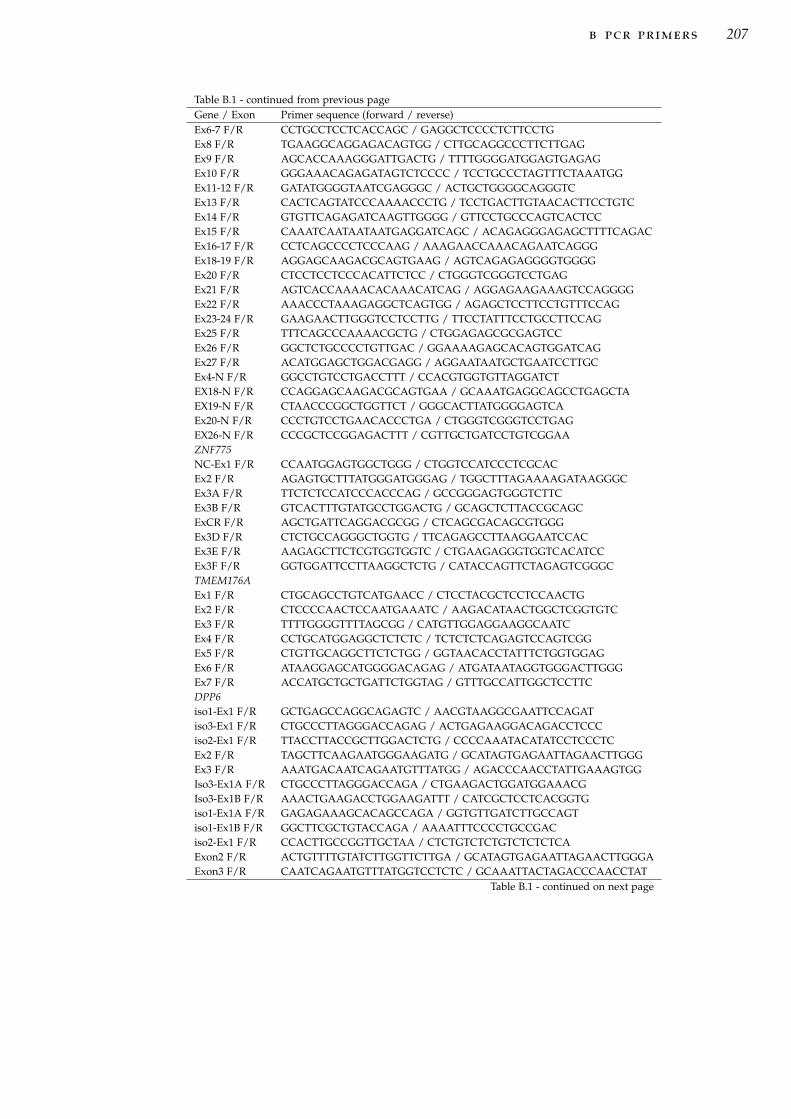
b pcr primers 207
Table B.1 - continued from previous pageGene / Exon Primer sequence (forward / reverse)Ex6-7 F/R CCTGCCTCCTCACCAGC / GAGGCTCCCCTCTTCCTGEx8 F/R TGAAGGCAGGAGACAGTGG / CTTGCAGGCCCTTCTTGAGEx9 F/R AGCACCAAAGGGATTGACTG / TTTTGGGGATGGAGTGAGAGEx10 F/R GGGAAACAGAGATAGTCTCCCC / TCCTGCCCTAGTTTCTAAATGGEx11-12 F/R GATATGGGGTAATCGAGGGC / ACTGCTGGGGCAGGGTCEx13 F/R CACTCAGTATCCCAAAACCCTG / TCCTGACTTGTAACACTTCCTGTCEx14 F/R GTGTTCAGAGATCAAGTTGGGG / GTTCCTGCCCAGTCACTCCEx15 F/R CAAATCAATAATAATGAGGATCAGC / ACAGAGGGAGAGCTTTTCAGACEx16-17 F/R CCTCAGCCCCTCCCAAG / AAAGAACCAAACAGAATCAGGGEx18-19 F/R AGGAGCAAGACGCAGTGAAG / AGTCAGAGAGGGGTGGGGEx20 F/R CTCCTCCTCCCACATTCTCC / CTGGGTCGGGTCCTGAGEx21 F/R AGTCACCAAAACACAAACATCAG / AGGAGAAGAAAGTCCAGGGGEx22 F/R AAACCCTAAAGAGGCTCAGTGG / AGAGCTCCTTCCTGTTTCCAGEx23-24 F/R GAAGAACTTGGGTCCTCCTTG / TTCCTATTTCCTGCCTTCCAGEx25 F/R TTTCAGCCCAAAACGCTG / CTGGAGAGCGCGAGTCCEx26 F/R GGCTCTGCCCCTGTTGAC / GGAAAAGAGCACAGTGGATCAGEx27 F/R ACATGGAGCTGGACGAGG / AGGAATAATGCTGAATCCTTGCEx4-N F/R GGCCTGTCCTGACCTTT / CCACGTGGTGTTAGGATCTEX18-N F/R CCAGGAGCAAGACGCAGTGAA / GCAAATGAGGCAGCCTGAGCTAEX19-N F/R CTAACCCGGCTGGTTCT / GGGCACTTATGGGGAGTCAEx20-N F/R CCCTGTCCTGAACACCCTGA / CTGGGTCGGGTCCTGAGEX26-N F/R CCCGCTCCGGAGACTTT / CGTTGCTGATCCTGTCGGAAZNF775NC-Ex1 F/R CCAATGGAGTGGCTGGG / CTGGTCCATCCCTCGCACEx2 F/R AGAGTGCTTTATGGGATGGGAG / TGGCTTTAGAAAAGATAAGGGCEx3A F/R TTCTCTCCATCCCACCCAG / GCCGGGAGTGGGTCTTCEx3B F/R GTCACTTTGTATGCCTGGACTG / GCAGCTCTTACCGCAGCExCR F/R AGCTGATTCAGGACGCGG / CTCAGCGACAGCGTGGGEx3D F/R CTCTGCCAGGGCTGGTG / TTCAGAGCCTTAAGGAATCCACEx3E F/R AAGAGCTTCTCGTGGTGGTC / CTGAAGAGGGTGGTCACATCCEx3F F/R GGTGGATTCCTTAAGGCTCTG / CATACCAGTTCTAGAGTCGGGCTMEM176AEx1 F/R CTGCAGCCTGTCATGAACC / CTCCTACGCTCCTCCAACTGEx2 F/R CTCCCCAACTCCAATGAAATC / AAGACATAACTGGCTCGGTGTCEx3 F/R TTTTGGGGTTTTAGCGG / CATGTTGGAGGAAGGCAATCEx4 F/R CCTGCATGGAGGCTCTCTC / TCTCTCTCAGAGTCCAGTCGGEx5 F/R CTGTTGCAGGCTTCTCTGG / GGTAACACCTATTTCTGGTGGAGEx6 F/R ATAAGGAGCATGGGGACAGAG / ATGATAATAGGTGGGACTTGGGEx7 F/R ACCATGCTGCTGATTCTGGTAG / GTTTGCCATTGGCTCCTTCDPP6iso1-Ex1 F/R GCTGAGCCAGGCAGAGTC / AACGTAAGGCGAATTCCAGATiso3-Ex1 F/R CTGCCCTTAGGGACCAGAG / ACTGAGAAGGACAGACCTCCCiso2-Ex1 F/R TTACCTTACCGCTTGGACTCTG / CCCCAAATACATATCCTCCCTCEx2 F/R TAGCTTCAAGAATGGGAAGATG / GCATAGTGAGAATTAGAACTTGGGEx3 F/R AAATGACAATCAGAATGTTTATGG / AGACCCAACCTATTGAAAGTGGIso3-Ex1A F/R CTGCCCTTAGGGACCAGA / CTGAAGACTGGATGGAAACGIso3-Ex1B F/R AAACTGAAGACCTGGAAGATTT / CATCGCTCCTCACGGTGiso1-Ex1A F/R GAGAGAAAGCACAGCCAGA / GGTGTTGATCTTGCCAGTiso1-Ex1B F/R GGCTTCGCTGTACCAGA / AAAATTTCCCCTGCCGACiso2-Ex1 F/R CCACTTGCCGGTTGCTAA / CTCTGTCTCTGTCTCTCTCAExon2 F/R ACTGTTTTGTATCTTGGTTCTTGA / GCATAGTGAGAATTAGAACTTGGGAExon3 F/R CAATCAGAATGTTTATGGTCCTCTC / GCAAATTACTAGACCCAACCTAT
Table B.1 - continued on next page

b pcr primers 208
Table B.1 - continued from previous pageGene / Exon Primer sequence (forward / reverse)Exon4 F/R AGTGATTTTACTTTACATAAGCATTCG / TTGGCTATGCTAAAAGTTGAAACCExon5 F/R AAATGGCACCAGCAGATAC / AGAAGAGTCAAGGAAATATACTTAATGAGprot-Ex6A F/R AGCATCCTGGGACCATAG / GGTCTCCATGGAATATCTGAAACAprot-Ex6B F/R CATTGCCAGCTTGCCATGTA / CCAGTCTCCTTCCCATGATTAprot-Ex6C F/R CAATGGACCCTCGTGAATAC / GCTTCAGACACATGGAGAAAGExon6 F/R CTGATGTTTGTTAGGATTCACAGT / AACAGCTCGTCCATGTTCExon7 F/R AGGAGAAAGGAGTTAAGTTATAGGTAG / CAGGCTGAGTACAGTGAGATExon8 F/R ACCCGGTTGATGATTTCAG / AAGAACCCAACTCCAATGTAGExon9 F/R CCTCATGTTCCTGCTGG / ACTGAGTGAGCAGGGTTExon10 F/R GCTTTGCAGAGCTGAAGT / CCAGAAGAGACCATGCACExon11 F/R TGGCTGTGTCACCACTG / GGGCTGAGACGACTCTGExon12 F/R GCCAAATTGTTTCCTGCAC / GTGATTTACTCTGAGAAGCCATExon13 F/R ATTTTATCCTGGTTCAACCTCTT / CCTAGAGGCTGTCACCCExon14 F/R GAGGATGAAGAGCCATGC / CTGTACTCCATAAGTGTAATTGACAAAExon15 F/R TGTCCATAGAGGTAGTGCCA / GGTGCAATTCTGCAAAGCExon16 F/R TCCGCAGATCACCCTCAT / CCCTCCCTGCAAGTGTGExon17 F/R AGCCTGTTTTCTTGTTCTCG / GGGCCAGCTGATCTCATExon18 F/R CAGTTACGCACATGAAAAGC / CTGCACTGTGTCACAGCExon19 F/R CACCCAGAGCACCCTCA / TTCAATATTCCTTTATCATGGGTGTExon20A F/R CGGGTCACGGGTAAAATC / CTTCGTGCAGGAGCTTGExon20B F/R GTGGTGGTAAAGTGTGACG / TTTAGGTAAGAGCAAATTGCATGAAExon21 F/R TCTGGGCTACAGGAAGACAA / GGATTAGACGTGGGTAATGGExon22 F/R GAACTGGCTGCTCTGGG / CTGAAGGGAGGGCTGTGExon23 F/R GGCCCTCCCTAGAGTTTG / GAAGGCAGAGTGGGCCATAExon24 F/R TTCTCAGTCAGGTTTCCAAGC / ACCCATGGTGCCATCAAExon25 F/R AGAGCCTCCTCCTTGATG / TGAACACCCGTCAGGTCExon26A F/R CACACCTTCTGTGCGTTC / TGGAGGCCGTGAGTGATExon26B F/R TTGCTTGGGAAACAAGCTC / TCACCATGTTGAACGTCCTCATTAExon26C F/R GTTCATATATGGGCTTGCTACT / TAAACCAAATGTCATGGGAAAGAGExon26D F/R TGTCCTCCTTGGTACCG / CGAAGTCAGTCCTGACATTCExon26E F/R TTCCTTTTGAGCTTGTGGAC / AAGTCTCCTGAAGCCTAGCAExon22-N F/R TGGAACTGGCTGCTCTGGG / GGACGGTGGTGCTGAAGGCUL1Ex2 F/R TTTTCATCTAATGGAGAACTAGCTG/TTTTACATGATGAACTGGGAGGEx3 F/R TTTGGTTGATATATTGGGAATGC/TGCAATAGCAAAACACTGTCACEx4 F/R CGCATATCAAATGTTCAGGG/AAACTGTGATGGTAGGGTCAGGEx5/6 F/R TGTCCTGATAGCAGATTTTGACC/CCTTCGTAAATGCTAACAATATCCEx7 F/R AACATAACTTAAACTGAATGCTACACC/CAACAAATGACTTGTAAAGAAAGCEx8 F/R CCTCCCTTATTTTCTTAATCGC/TTTTAAAACTGACATGGGCAAGEx9 F/R TGAGAATTTTAGGAAGCATTAGAGTTG/AGCCTTTTGTTTCTAGGGAAGCEx10/11 F/R GTTTCAACGATGGTACCAAAAG/GGAGGGAATGCAGATTTTCAACEx12 F/R TGAGATTGCCAGTTTGCTGTAG/GGACTGACTGAGTATTAATGAGAAAAGEx13 F/R AAAGCCAAAGGCACATCTTG/GCTCGGCCATAGAGCTGEx14 F/R TGTGCAACATAGAGTTGTGGG/TAGAGCTGACACCACTTCAAGGEx15 F/R AATAAAGAGCAATCCACATTCATC/ATCTGCAGGCCTGTCCCEx16 F/R GCTTTACTTAGAAACGCTGCC/AAACCTGCCACTATTTCACCAGEx17 F/R AACTTGGGCTGTATATTTTGGG/AAAGATGCCCATATCCTCTTCCEx18/19 F/R GAAAATGGACTGTGAGGTTGC/FAATACTGAGATCCGTGCTAGGGEx20 F/R AAGCAGGGCACTTCTTAAAGG/GCAATCACTCCTTTGTCACCCEx21 F/R CTCTGTGCAGCTTGTCCTTAAC/CATGCTACAGCAATCAATCCACEx22 F/R TGCCAGGAAGTAAAACTCTATGC/ACGGAGGGTCAGTCCCCKCNH2
Table B.1 - continued on next page

b pcr primers 209
Table B.1 - continued from previous pageGene / Exon Primer sequence (forward / reverse)Ex1 F/R ACCCGAAGCCTAGTGCTGG/CCATCCACACTCGGAAGAGEx2 F/R GAGTGGAGAATGTGGGGAAG/CTCGGGGCGTTCTCCAGEx3 F/R ACTTGGGTTCCAGGGTCC/CCATTACATCCTCCCTTCCTGEx4 F/R GTTCCCCTCCTTCCCTTACC/GTGAAAAGGTCAGAAGCCGAGEx5 F/R GGTCTCCACTCTCGATCTATGG/CTCTGGATCACAGCCCACTCEx6 F/R CTCCTCCTCATTCTGCTTGG/TTTCTCTGTCCTCCTCGCCEx7 F/R AAGTCTTTGGGGATCTGACCTC/GGCTAGCAGCCTCAGTTTCCEx8 F/R ACGCTGAGACTGAGACACTGAC/ACTTGTTTGCTGTGCCAAGAGEx9A F/R AGATTTCTCTGACATGGAGGGG/CCCAGTGACTGCATATTCAGAAGEx9B F/R GCCCTGTACTTCATCTCCCG/GGCCCTTAGTGAAACCAAATGEx1-New F/R AGTCCAGTCTTGGCCGC/ACCAGGCCCCATTGACTCEx2-New F/R CAGTCCCAGCCATGCTTC/CCCACAGAACCCTGCCCEx9-New F/R AGATTTCTCTGACATGGAGGGG/CCCAGTGACTGCATATTCAGAAGEx10 F/R AGCTGAGGGGACATGCTCTG/ATTCAATGTCACACAGCAAAGGEx11 F/R TTTTCTGTGTTAAGGAGGGAGC/AAGGGATGGGAAGGTCTGAGEx12 F/R TCCTGCCCAGTCCTCTCTC/CTGGGTGAGCGGGGTAGEx13 F/R GAAGAGCAGCGACACTTGC/CCCTCTACCAGACAACACCGEx14 F/R AGGGCCTGGGTTGACAG/CAGCAGAAAGGCAGCAAAGEx15 F/R CTCCCGTCCATCCTCTGTC/CTCCTGAGCAGGGCCTCEx1-New2 F/R CCCGAAGCCTAGTGCTG/CCCATCCACACTCGGAAGAEx2-New2 F/R GCTGTGTGAGTGGAGAATG/GTCACACCCCCACAGAACEx4-New2 F/R TCCATTTCCCAGGCCTT/GGCCCAGAATGCAGCAASMARCD3Ex2 F/R CAGATCCTCAGAATGGCCC/ATGTGGTGGGAGCAGGAGEx3 F/R GTCACCAGCCGAGGGTC/CGCTACTCGCTTACCTGGTCEx4 F/R GGTCACTCCTGTGTCCTGAGAG/AGGCCCCTGTGTTCTGGEx5/6 F/R CTCCCCTGACATCTTTTGTACC/CCTTAGTGCAGACACCTTGTTCEx7/8 F/R GCAGAGGATTTCATCTAAGCCC/TCTCTCAAGATGCACCACTTTGEx9 F/R TGTTTCCTCAATCAACACATCC/ATCTAGAAGGGAGGGGTGGTAGEx10/11 F/R GAATCAGACTTCCTCTCAGCTTC/ACACCCTGGTCTCAGAAAAGTCEx12/13 F/R TGAGGGGTTGTCCTTCACAG/CCACAAGCTGAACAGGGAGEx14 F/R GGTGTCAGTAGGTGGGATTGTC/TGAATGACTTTTAATCCAGCCCEx3-New F/R AACGCTCAGGGTCACCAG/CGCTCCCTGCTAATCATTCEx3-New2 F/R TCAACGCTCAGGGTCAC/ACTCGCTTACCTGGTCCNUB1Ex2 F/R TTACCCAACAAAGCACCTTAAC/GCCAAAAGTTTATATGGTCATGCEx3 F/R TCATCAGAGTTGATGGCCTTAG/TGGATTGTAACTTTCCAAACAACEx4 F/R TCAGTTTATATCCTCTGCCGTC/CTCACAGAGGATCAAATAAGCCEx5 F/R ATAGGATCTCTCTGTTGCCCAG/TTGGAAAAGCTATTTTCTGCTTTACEx6/7 F/R GGGTGACAGAGTGAGACCTTG/TCCAACCCTTTACAACACTTCCEx8 F/R TTCTTAATTTTGGCTTTTAGATTGAG/CCACTGTTGTAGATGAAAGTCTGCEx9 F/R AAACACAGCTCCCTTCCTAAAC/GCCAGATTTGTAAAACATTGAACACEx10 F/R TTTAATACCTATCATGTTGCCCC/GAGAAAGCACAGGCATGTTTCEx11 F/R CCAAAATCTGATGCCTTTTAATTC/AGTTTCTCCTTCCTTCCCAATCEx12 F/R CTGGAAATGCGGAGAATCC/CTCAGGGACAAGGCCAGAGEx13 F/R TCATAGCAGCAGAGGACGG/AGTCCTGCTGCCTGATTCACEx14 F/R TCTTAAACATGAGAGTCGGCTG/CCTCAGTCTCCACATCTGCCEx15 F/R CAGTCTGAGGTTGACTGTGGTC/AAAGAGCTGCATTAGCCTTTTCTMUB1Ex2 F/R GACCCTGTGGAGGTTCCAG/ATAAAGGAGGGCTGGGTCTTAGEx3 F/R GAGGGTGGGAGTGCTGTTC/AGAGGCAGGCCGGAGAGEx2-New F/R GGTTTAGGTGAACCGTAACG/CCTTCTGCGACCACTCTC
Table B.1 - continued on next page

b pcr primers 210
Table B.1 - continued from previous pageGene / Exon Primer sequence (forward / reverse)Ex3-New F/R GTGGGAGTGCTGTTCCG/CAGTCCGTGCCCTTCTCREPIN1Ex1A F/R GTTGGTCTCTGGAGTGACTGTG/CCGCAGATGAGCTCGAAGEx1B F/R GCCCTGGTTCTGCATCTG/GATCGCTTGTGAATCTTGCTGEx1C F/R CGCTTTACCAATAAGCCCTATC/GGCTGCCCTGGGAGAAGEx1D F/R AAGAACTTCGGCAAGAAGACG/TAGGATTCCCATTGTCCCCTACABCB8Ex1 F/R AGCCAACATAGAGCCCTCAG/CTCGTGGACTCCATCTCCCEx2 F/R AACAAGCATAAACATTTGCGG/CTACATGAGGCCTTCTCCCACEx3 F/R AAGAGGAAGTGCTCCTTCCAG/GGAATGCCATCCCTTTGCEx4/5 F/R GACAAGCGCAGTGCTCAGTAG/CTTCAGGATAAGGTCCTACCCCEx6 F/R GTGACTGATGGCCTGAGGG/GTCAGCCCAACATCAGGGEx7/8 F/R CTGACCCTTGGAAAAGTCCTTC/TGAGAGAGACCAGTGCATTCAGEx9 F/R AAGAGGAGTGAGTCCTGGGAG/ATGAAGGGAGGGCCTTTGEx10 F/R ACTCTCCCAGTCAGCAGTGG/AGCTGCACAGCAGTCGGEx11/12 F/R ACCTGCTTCCTTGCTCCC/GGGGACATTAGTCCAGACCTCEx13/14 F/R AGGGCTACAGGGAGACTTCAG/AAAGAAAGAAAAGGCACCTGAGEx15 F/R GACTGTCCCATTGTGTATGGTG/CTGCTCACTGCTCCTGTGGEx16 F/R GGCACTTAGAGGATCTTGATGG/CAACTTCATATAACTCATTGCAGCEx17 F/R GCCCAATGGCTGATAGAGAG/AGTCCCCAGTAGGCTCCCCRYGNEx1 F/R AGCAAATCTTTTGTCCGGG/GGATTTGTCACCATCAACAGTGEx2 F/R CTGGGAGTAGGGGTTCCATC/GATTCCTTGCCACTGTCTGCEx3 F/R GCTTCTGTTTCTGGGAGAGG/CACTGCTGGAGGTCTCATTCEx4 F/R GTAGATGGGTCCCCAAAAGG/AACTGGCAGAGAAATGAAAACTGRHEBEx1 F/R AAAAGCGGCGGAAGAAG/CTCACTTCCCCAGACGAGACEx2 F/R AATGTTTTCTGACCCTGATACC/CCTCCATGAATACACAATGGCEx3 F/R TCATTGTTCAAACTTCAGGTGG/ACAACCTGAGGGGTTTTCTTGEx4 F/R ATCCACTCTGCGTCTACTTTG/ACTATTAATAATTCCAGCACAGTCCEx5/6 F/R ATGTTAAAATGGTGAGTCTGTGAC/ACGACCATAACACCTCTGAACGEx7 F/R AGAAATTGACCAAAATGGAGCC/ATCAAGACAGAGGTCAAATGCCEx8 F/R CTGAAGGAAACAGGGTCAAAAG/TGAAAGCCACATCAAGTAGCACEx1-New F/R GATGGAGTTTCCGACACG/CGGCTCCAAACTTCGCAPRKAG2Ex1 F/R GTGGCTTCAGGGTGTAACAGAG/AGCGTTAACCGCTTCGGEx2 F/R AAGGATAAGGTCTCAGGAAGGG/GTGAACACACAGGTGGAAGTGEx3 F/R AGTTTCATACAGGGCAGGAGG/ATACAGGCACTCAGCACCAAGEx4 F/R GAGACCAGACCTCTGACCACC/TGCAGATAGACTGCTCAGCTTGEx5 F/R GTCCCTTCCCACGCTTC/TAATTCGAGTTCGGCGAGTAAGEx6 F/R GGTTTACGTATATGCTCTTCATCC/AATAAACGTTTGCTGGCATTGEx7 F/R AAGACTTGGTCAAATATGTTAAGGG/TGAATTCCAAACCGGCATCEx8 F/R TCCAGTTTGGTATACACAATTAACAC/GATTTGGAAAATCACCATCAGCEx9 F/R TGCTATTATCCAAGCTATGTTTTG/TTTTATGGAGCAGAGAGAAAAGGEx10 F/R AAACTGAAGGGTATTTGAATTTGTG/GCCCTGTTTGGAATGAAGAACEx11 F/R AAGTGCTTTAAGGCAGGGGTAG/GGGAGACCTCAAAACTAACAATTTCEx12 F/R TCATGTTAATTCAGGCATCCAG/CTCCTGTGCCAGGTCATCTTACEx13 F/R TGAATAAATTCAGCACCAAGGG/CCTCACACCCCAAAAGGTTAGEx14 F/R ATGCAGGTACTAAATTCAGATAAGC/CTGAGATTCAGGCTTCCAGAGEx15 F/R GGCTGGAGGGATGTGTTG/TTAAATGCTGCACTTCCTGTTCEx16 F/R CTGCCAGACACAGGTAGAAACC/ACATTCTTAACCACTTGCAGCCEx1-New F/R CTTCTTGGCCCGCTGGA/CAGCGTTAACCGCTTCG
Table B.1 - continued on next page

b pcr primers 211
Table B.1 - continued from previous pageGene / Exon Primer sequence (forward / reverse)GALNT11Ex2-New F/R AGTGGTCCTACTTGGTGGTTTG/TGATGCAGCATTTCTGATCTCEx3-New F/R CAACCTAGAGACAACCTAAGTTTGAG/CCTCGTGACCTCTTACACTGACEx4-New F/R GGTGAACAAGGGGACAGTAAATC/CTTGAAAGTTCAGCTGTGTTAGTGEx5-New F/R CTGTAGTATTTGCTTGATAGTTTGTTG/ATCAGGACAGGCGCTGAGEx6-New F/R ATTGGACGGGTGGTTGTACC/CTTTTGCTCCTTACAAAGAAGGEx1 F/R ACGGGTGGTTGTACCTAAATTG/CTTTTGCTCCTTACAAAGAAGGEx2 F/R GTTATGTTCCAAAATGACACTGAG/GGCAGCAGAGAAAGACCCTATCEx3 F/R CTTGCCAAGTTTCATAAACACC/CTTGCCAAGTTTCATAAACACCEx4 F/R TTCATTGATTCTCAGATACAGTTTAAG/TGCGTAGAGAAGTTCCCATAAAGEx10-New F/R AATTCGTACCTCCGGAATAACC/CTGATGTCCTCAGGAGTGACTGEx11-New F/R AGTGCATTGGTCTGTTTCTGC/AAAATGAGTTCATCTGCCACACEx12-New F/R ACTAACCTTTGGCTAAGAGGGG/CTTTCCTAAAGCCCCAAACTCCSLC4A2Ex2 F/R CCATCCAGGTTATGCCTCC/CTCACACCCCTGGTTGGCEx3 F/R ATTAGAGGAGATAGCTGCTGGC/ACTAGGACCCCAGTCCCTTCEx4/5 F/R GGGATCAGGTTTGACTGTCC/GTTCCAGCATCACCTCACTATCEx6/7 F/R AGCTAGGAGGGCCTGGAGTC/AGGCTTGAGATTACAGCTGGTCEx8 F/R ACTCACCTCTGACACCCACC/GTGGACCATGCTTCCTCTGEx9/10 F/R CATGTGTAGGCTGGTGTTCC/CCTCCCACTCTGAGTCCACEx11/12 F/R TGAGGAAGCCTGGGTGTG/CACAAAGAAGAGGGCTGAGGEx13 F/R GTCTTGATCCCCATGACTGC/ACCCAGGCCTCCGTCAGEx14/15 F/R ATCTGCCCAAGATAAGGGTACG/AGGTCCTGAGCTCTGGGTGEx16 F/R CTCGGTGAGGGCTCTTCTC/CTCAAATCCAGAGGATGGGACEx17/18 F/R TTCCACCCGACACTCACTG/TAAGCTTAAGGACAGGCTGGGEx19 F/R CTTAAGATGCCATCCCCTTTC/ATCCAAGGTTCCCTGAGGTCEx20 F/R CATTCTGGAAAGACCCTGTG/ATCCCCGATAACTATGGAGAGGEx21 F/R GTACGTTGCCTCTTGCCTTTC/CTGAACTGGGCAGATGGGEx22/23 F/R CTGGCACCTAGGAATGTTCTTC/CCAAAGCACTTTACTGCAGGGXRCC2Ex1 F/R CTGCGCAGTTGGTGAATG/CCCAAGCCTCCCAATCCEx2 F/R CACCCAGCCTAAAGTTATGAAATC/CACAACCTGTGTCTCATTTTCCEx3A F/R TTGCTTGTACAGCTCCATTTTG/TGCATTATAGTTTGTGTCGTTGCEx3B F/R CCTTTTGATTTTGGATAGCCTG/TTTAAAACTTTAGGGCTGGGCABCF2Ex2 F/R ATTCCTGAGAGGGATGGAGC/ATCAAGATTCCAACTCTGGCTGEx3 F/R AGTGCTCAGCAGGATTGGAG/TTTGCTCTGAACACAGTTGATGEx4/5 F/R ATGGATGAGGTCCCAGTTTGAC/ACCACTGACTCCTGTTCCAAACEx6 F/R ACTCAGAATTGCATGTAGCAGG/TAACATCAGTGCAGTTTCTGGGEx7 F/R GGACAACACATCTAAAAGGTGC/TCAAGTGACCCACCCACCEx8/9 F/R CTTACTGCACAGCCTTAGAGCC/GCTCCTTTCTTATCCACCTCACEx10 F/R GATAAGGTGGGGTGTGATTGG/AGCACAGAACAGGAGCAACTCEx11 F/R CTTCCTCCTCTCTTGGTGACTG/AGTAGTAGCCCCTGCATCACTCEx12/13 F/R GTTTGCCTGCTCTGCCTATG/AAATGGAGGAGACTCTGGTTTGEx14 F/R TTATAAATGGCGATGCTAATGG/GGGTATTATGCACCCTCCACEx15 F/R CTTCCTAGACGCCCCTCAG/GAGCGGCTGGTCAGGTTAEx16 F/R CTTGCAGTGTAGGCAGGACC/CACAGCCGTCTGGACTTCTCKELEx1 F/R AAGGGCAAGATTGCTTGG/GGGCAGGACTTTTGCACEx2 F/R AACTCTCTTCAATGCACCAT/TAGTAGATGAGTGTTTGTGGGATEx3 F/R TTCTTCCCATCCCTGTCTCTCAA/GGTCAGGGTGGGCAGAAEx4 F/R CCTGATGTTCTTTGCCTAGC/GGAGCAGTCATGGTCATTT
Table B.1 - continued on next page

b pcr primers 212
Table B.1 - continued from previous pageGene / Exon Primer sequence (forward / reverse)Ex5 F/R CCTTTGATAGGAATTTGGGGC/TAAGCATGCATTGGTCCCATAEx6 F/R AGAGCCGATCCAGACAA/ACCTTCCTCTAAGGGATGATTEx7 F/R CACCTGCCCTCTCCATC/CCAGAGGTCCCTGCTTTEx8 F/R CCTCTGAGGCCAGGAGAA/GAGGAAGAAGGAAAGGAGGTAATEx9 F/R TCACACCCAAGGGGAAG/CCAAGATCTACGGTGCTCAEx10 F/R GGCTCTTCTTGAAGCATCC/GAGAGAGATGCCGACATTTACEx11 F/R GGAATGAAGATCTAGTGAAGACTG/GGAAGGCTGCTTTGGGTAEx12 F/R GTCAGAAGCTGTGGGCA/CATCTCGCTTGTTCCAATACTEx13 F/R GCAACGAGTGGGAGAAAT/CTTAGGAGGGTCAGAGAAGTGEx14 F/R ATTGGTGTTTGTCAGCGT/GGCTTCCTTTCCTGTGAATCEx15 F/R GAGGGACTGTGTAGGTCTCA/CATCATAACACCTGTCGGCEx16 F/R GGACTTACGGTTGGAGAATTG/CCCTTGTGGTCTTCCCTTAEx17 F/R CTCACCTAGGCAGCACCAA/CAGGAATGGTGGAAGGAAAEx18 F/R GTGTGGAGGGACTTTCAAAT/AGCTTCAGTAATAAGGCGTTCEx19 F/R ATCACCCCTTGTCACCG/GGAAATCTTGCTCTGATTCCATMLL3Ex1 F/R GGAGGAACCCGAGCAGCA/GGTGACAGCTCCGGCCCEx2 F/R TCAAATTGTGCCTTATGTTGAATATAAGTC/TACATGCAGTGTACAAACATATGCAAAEx3 F/R ATGCTTTATAGATACATTCACCAGTGATTA/TTTCTCTATAGTCATTTCACTGCTTTATTCEx4 F/R AAGCACAAGTATCTATAGTTATCGC/GAACAATCCCATTTGAAAATTTATAAACATEx5 F/R ATTTGGCAGTACATTGCATTTAAACA/CTAGATGAAAGGTATTTATTATTGAGGACAEx6 F/R AGAGTTGATTTTGAAGTTTTATGTCTTTAT/AATCCTTTCAAGTGAACTTCTGATTEx7 F/R CTTCCCAGCTTATATTTGAATATTCCTT/ACTCAGGGAATTTACAACATTTGTTAEx8 F/R AATCCTTTCAAATGATTTTACTGTATAGTC/CTATTATATTACACAAACCTTTAGCACCEx9 F/R GCAGTTCCCAGGACTGATTATT/CCGATTTGTCTGGTCTCCATEx10 F/R AAGGTTTACATCAGAACTACAATTACAAAT/GCTGTAAGATGGTAGAGCAAATGACEx11 F/R GCAATGCCTTCTCTTTACCTAGATAAT/ATTGGTGATACAATGGCACAACEx12 F/R AATCATAATTGTTGACTTAATGAACAAAGA/ACTGAAGTTTTAGTCAATATTCACATATTTEx13 F/R AACTCTTTACTCAAATTACTGTTGAGGGAA/AGCAATCGCAAAAATGTCTTTGGEx14A F/R GTTCTAGTGTAGCCAAATGTTTTATATATC/CATCAATCCAGTAGAAAGTTCAGAATEx14B F/R CATTATGTCCTGAGGAACAGT/TCCACACCAAAGCTACACATATACEx15 F/R TTCCTTAGTTGCTGGCTTTGAC/AAGATTTAATTCTTAACATCCAGTAGGGEx16 F/R GTTTTATCTCAGTGGCATTTGGATTTA/ACTTGCTATGAGATTTTCATCATTAACTEx17 F/R TTCTGAAGCTTTCCAGTTAAGTGTA/GTATATGAGATAAAGCAGAAATGTGCAAEx18 F/R TAGCTATAGAGCTATATTAGTTAAGAAGGT/AACTGGGAGCTCATGTTACTEx19 F/R CTTCTAGGTACATAAGCACCATATTAATTT/ACCAAAGTGGTATGAGAAAGCEx20 F/R CTTCCTGAATTACAGTAACTGAGTAACTA/TTGTGATTAAGGAAAAGCTATTTTCCATEx21 F/R TGAAGACTCAGTGTTACAGGTTT/GGTTATGGACAGTAAGGTGCAAEx22 F/R GCACTTTTAACTTTAGTGTTCAAACAT/GTTTGACAAGTGGTAAGCCAATEx23 F/R ACATGGGTATTTTGGAACAGTAATC/ACACATATTTCAAAAGTTACTTTATATGCTEx24 F/R ATTCCCCATTATGTAGGGATTATATATTTG/ATTGAAGTCTTCAGTATTGTATTTTTCTTTEx25 F/R CCTGTGTACTGTGGAAATGTAG/TTTCCAATAGAAATATCAAGACCAAAGGEx26 F/R ATTACCTTCAGTGGGTTTGTCT/ACAACAAACCTATGTTTTAAAACTCAATACEx27 F/R TCTGTTATTTCTGCTTCCTTGTCAA/AAAGATTTAACTGAAAGGAAGATGTATGEx28 F/R CAGTATCTGCTGTACTCTAGGTT/ACACATCATACACCTCTCGCEx29 F/R GTTATATACTAAGTACAGGTAAATAGTGCT/AGAAGTTAAATTATAACCATGCAAAAATCTEx30 F/R AAGATTTTTGCATGGTTATAATTTAACTTC/AGACTAGTAGGGTCCTGGTAEx31 F/R CCCATACCAGGACCCTACT/CTTGCTTGTGTGTGTATATGTACCEx32 F/R AGCTTTACTTCAACTCCTTGTTAC/AATATCATACACAATCATTTAAGCAGACTAEx33 F/R TGTAATAGGTTTTAATGAAAGCTATACTTG/GTTAAGCTACCTTTCTATTGCAGTTEx34 F/R CATCAACATTCTTTATTACAACACATCAT/CCTAATACAAATAAGGTTCAAGCACTGEx35 F/R TTTCTTTTATTTGAGAAAGTTCATGATAGT/AAATAATAATGCAAAGACCTCCCT
Table B.1 - continued on next page

b pcr primers 213
Table B.1 - continued from previous pageGene / Exon Primer sequence (forward / reverse)Ex36A F/R TCCCCCCATGATGGTAGTT/AGATGGTGGTCGTGAGTTAGEx36B F/R GTCTTTCTCAGGCTCAGACT/TCACTGGTTCCAGCTGCTAEx36C F/R TCCCAAATCCTTGGGCCTATC/CTACAACAGGTCGTGGAGTTCEx36D F/R CCCAGCCTGGAACCATA/AGGTGTCTGGGAACATGTATCEx36E F/R TTCCTGCAAGCAGCACAA/TCCTGTGTAGAAATTACTCAGTTTGATGEx37 F/R GGGCAACATAGCAAGATCCCATATCTAA/GCCACCACACCCAGCTCEx38A F/R GGTGATAGCTTTGCTTTTGTAAGTC/GGAGCTTCTGAAAATTCACCACEx38B F/R CCCAGGGTCTACCTAATCAGC/GAGAACCAGAGTTTTGTTTTCTTGEx38C F/R GATCCAGAACTTGACATGGGAG/AACTTGACACATGATTGGATGGEx38D F/R TGTGGCATAACTGGATCAACTC/AACAAACTCCTCAAGGAGGAATAGEx39 F/R AATATTTGAATTACTTCTTAGTGTACGTTG/GGGCTTTCCATTTTCTGTATGTEx40 F/R ACTGTTAAGCACCTAATACAGTTT/AAGCATGAGTTTGCTGGGEx41 F/R TTTTCTTTCTTTCTTTTAAAGTTTTTTCCC/GGTTTAGAACAGCACACATAGAGEx42 F/R AGATTTGTGTAACTTATAATGTTGGACT/AGTCACTAATGAACAACACACCEx43A F/R ACCTCAACCACAGTCATCAGC/CCGTTGTCTCTCTTGCTGTTCEx43B F/R AGTCTCAAATGCAAATCCACAG/GTGTAAAAGAAGGCCTCACTGGEx43C F/R ATTCACCATCAATCCCTGTTG/TCCATGGAGAGCTTGTCTACTTCEx43D F/R AAGAGTCGGTGGAACCAGTC/GAATAATGTGGAAATACAGTTGCTGEx44 F/R AGCTTGGCACTGCATGAACTAA/GGCATGAGCCACTGCCCEx31-iso2 F/R GGTCTTAGAAAGTTGAGCTACAC/ACAAGCTCTATCAATTCTGACATGTTAEx45 F/R ACAGAACTACGTTTTAGCAAGG/CTTTACAATTCTATTGCCATTTCACAATACEx46 F/R GGCAATAGAATTGTAAAGTTCTACCC/AAAGACATTATGCCACATACATACATTTEx47 F/R AGGGTTGGTACAGGAAGC/AATCAAAATATTTACATTAGTAAATTGGCGEx48 F/R ACACTACGCCAATTTACTAATGTAAATA/TGGTAGACACCTGACCCATCEx49 F/R TTTCTTCAGTGGTTCACTGTTG/AAGATAATCAGTATCTCAAAGAGTAAGCEx50 F/R ATGTTGTAATGAGTTGATACTGCATAATTT/AAGAGACACTGCCAAGGACEx51 F/R AGAACCACTGTCACTTTTGAATATAACATA/ATGCCCAGAACACAGAAGTCEx52A F/R TTGTCTTAACAAGAATTGCTTTCCG/GATAGTCTTTGGGCACAGGATEx52B F/R ACATTTAAACCACCTTGTGAGGATGAAATA/TGTCGCACCTCATCACGCEx52C F/R CCAAAGGGAATTCATGAGCAAG/ACAAAATACATTCATTAGCCTGACAEx53 F/R TCCTTGTGAGTGGTTATTCTTCATT/ATGTTACAGCATGTGTTCAAGTEx54 F/R CCTTTGACCAGCTTGAGATTG/ACAGGAAACCACTAATACGCCEx55 F/R TTTGGGCATTACTCAGAGGTATC/TCACATACTGGACATCAATAGCTTEx56 F/R CGAGGGTGAAACCTTTGTATGAA/ACGGAGAAAGGGAGAGGATEx57 F/R AGTCCTCCTGGTGTGGATAG/TCTCCACCAGCACTGGCEx58 F/R ACTGCTTTATCAATAAATGGGAAGT/GACCTGTGTGAGGAGGGEx59 F/R AGATGGAGGCAGAAACGC/CCAATGGTGTGTTGAATCGCPDIA4Ex1 F/R CCAGACCCCGAGTTCTC/CACTAGTTCTGGAGCTGACEx2 F/R CCGGCCAGGAAAGTTTTAAG/TGAAGGGCTGAGCGAATEx3 F/R ATGTATTATTGTTGGATTTAAATCCCATAG/CAAATTCCCATTCCCTGCGEx4 F/R CTTCTGGAGGGAGGTGAAG/CTGTTCCTGCCTCACGGEx5 F/R GCTCATTTAGCTAGAAAGTGAGTC/TCAATGGCAGCTTCCTGTTAEx6 F/R ATGGGCCATGGGAAGTG/GATGTCCCAGGAGCTTTCTEx7 F/R GGTAACGAATTAAATCTCAGACATTTAG/GTGGCTCAAAGCAGAGTEx8 F/R GTCCCTCAAACATTGTACTCAAGAA/CACTCCACCTTGCCTGAAAEx9 F/R GAGTCTGAGCTGGGACTTG/CCTGGCCTGTCTGGATTEx10 F/R CCCAGAATCTTTGGCCTTT/ACTGTCGTTTGTTGCCG

b pcr primers 214
Table B.2: PCR primers for microsatellite markers. Forward primers were5’-FAM labelled.
Marker Primers forward / reverseD7S1815 F/R FAM-GCCTACTTCCCTTGCTTACC / CCCAGTTCATGCCTCTGCD7S615 F/R FAM-TCCTATGGAATTCCTGTGG / GCCATTGGTCACTCATATTTGD7S2442 F/R FAM-TGAGCCAAGATCACAGCACT / CTGGAAGCAACAGATGTCACTAD7S2419 F/R FAM-TTGTCCCAGGCAGTTTTAC / GGCAATGAAGTTTCCCAGAD0-23xGT F/R FAM-GCTGAGATGGCACCATTGTA / GTAGGTGTGGGGGTGGAGTAD1-28xTA F/R FAM-ACATGCCTGTTATCCCAGCTAC / CGTTTTGATACATTATGGAATGGAD2-30xTA F/R FAM-GGCCTTGTGATCATGTGAGTTA / GAAACGTTGAAACAATGACAGCAD3-23xCA F/R FAM-AGATACTCAGGAGGCTGAGGTG / ATTCCTGGGGATGCTTATGACD7S1823 F/R FAM-TCCAAGTAAAGGACAGACTTC / AGCCTCTGTGCAGATCCTC †
D7S2447 F/R FAM-GTCAGATGTAGGAACCAAGC / TCTCACTGTACTCAGCCTGT †
D7S1518 F/R FAM-TCAGTGGGGAAAGCCCTCAC / GGGCAACAAGAACGAAACTCC †
D7S684 F/R FAM-GCTTGCAGTGAGCCGAC / GATGTTGATGTAAGACTTTCCAGCC †
D7S637 F/R FAM-GCTGTACCTCCCAGCA / ATATCAAAACCAAGATGTTGAC †
D7S661 F/R FAM-TTGGCTGGCCCAGAAC / TGGAGCATGACCTTGGAA †
D7S2513 F/R FAM-GCAGCATTATCCTCAACAGC / CACAAATGGCAGCCTTTCD7S2473 F/R FAM-CAGACCTCAGTGCCTCAG / GGGGATTCACCAGTAGATG† Marked primers were supplied by Sigma. Otherwise primers were supplied by
Invitrogen.
Table B.3: PCR primers for RT-PCR. Primers supplied by Invitrogen.Name Primer sequenceCNTNAP2-Ex20 F GCCACGAGAAGACCATCTTTCNTNAP2-Ex21 F CCCAAGTCGCTCTTTCTGCNTNAP2-SiEx1 F GACAAAGGACGGTCCTCGCNTNAP2-Ex22 R TCTGGAGAGGCAACCAGTCNTNAP2-Ex23 R GGATTATATGGAAAATCCGCACTCNTNAP2-Ex24 R GGTGCACAGGATGGTGAA
Table B.4: PCR primers for HRM analysis. Primers supplied by Sigma.Name Primer sequenceMFN2 Exon5F CTGGTATCTGCGTTGTGAAAGTMFN2 Exon5R AGAGGTGAGGTCAGCCGTGTC
Table B.5: PCR primers for validation of CNV identified with aCGH at 7q34-q36.Primers supplied by Invitrogen
Name Primer sequenceDelAa_F AGATTCATATTCAAACCATCTTTATTTACGDelAb_F TAGTTCTAGGTATCAGGACTAAAGGAATDelAc_F GATTCCTTCACAGTTCTAGTAAAGATTDelAa_R AACAAAGCAGGGTCATAGCDelAc_R CAAAGCAGGGTCATAGCATDelC_F TATAATGTGTGGGATTGAGGGTCDelC_R CTGTTACATGAATTGAATAAACTACAGTTG

b pcr primers 215
Table B.6: PCR primers for validation of variants identified through NGS at 7q34-q36.Primers supplied by Invitrogen and Sigma as indicated.
Sequence Name SupplierAGCATCGCACTAATCCACG CLCN1-UTR6.1F InvitrogenGAGCTACAAAGGGATGGGG CLCN1-UTR6.1R InvitrogenCAATCCCTCACCCTACCTCTTAC CLCN1-UTR6.2F InvitrogenACAGTCATTCCCTGGATGC CLCN1-UTR6.2R InvitrogenGCAGGGCCTGCAGTGAC SSPO–>C F InvitrogenGACAGTGCCCTGGGTTGGTAA SSPO–>C R InvitrogenCTTTGGGTGGAGGCATGG SSPO-C>G F InvitrogenCCCCTCACAAGTCCGATG SSPO-C>G R InvitrogenGCCCTGGCTGTGGGAGAA PRSS-FRAG F InvitrogenGCCTGGAGGCGAGAGGATTTA PRSS-FRAG R InvitrogenACTTGATTATCTTACCTTCTTATTCAAGTT ZNF398 frag F InvitrogenTCTTCAGTCAGTCCTGGCA ZNF398 frag R InvitrogenTGAAGGAGATCCCAGAGTTCTTGTTT KRBA1 frag F InvitrogenAGTGCAGTGCCGTGGAC KRBA1 frag R InvitrogenTCAAATTGTGCCTTATGTTGAATATAAGTC MLL3 frag F InvitrogenGTACAAACATATGCAAAGCATCATTATAC MLL3 frag R InvitrogenCTGACTCCCGGCCTCTC CENTG3prot Ex1 F InvitrogenACACTCGGTCCAGACCC CENTG3prot Ex1 R InvitrogenCTGGTTACACAGGTGTGTTCAGT NOS3EST-Gen-F InvitrogenGGCATCTAAACAGCGCTCAAT NOS3EST-Gen-R InvitrogenTCCCTCGAACACGAGACG NOS3EST-cDNA-F InvitrogenAAACAGCGCTCAATTTCTTCTTT NOS3EST-cDNA-R InvitrogenATTCCAGCATTTTATTTTATTTGTTTTATT NOS3EST-LS-F InvitrogenAAGGCCAGCCTGGGCAA NOS3EST-LS-R InvitrogenCCAGTGTCTGGGTTCCTGAG SSCP-Exon19-21-F InvitrogenGAGGGAAGGATGATGTGTGG SSCP-Exon19-21-R InvitrogenGTGTCTGGGTGGGAGGAG SSCP-Exon63-65-F InvitrogenGTTCTTCGCTGTCCAGATCC SSCP-Exon63-65-R InvitrogenCGATCTGATTGCTGGGG SSCP-Exon99-100-F InvitrogenCTCTCCCCACACCTACCC SSCP-Exon99-100-R InvitrogenAGTACCAGGCCAAAGTGGAAT GIMAP5-frag-F InvitrogenAGGCACACAGCTCCAAGTCT GIMAP5-frag-R InvitrogenACAGCAGCGGGTAGTATTTAGG CUL1-Ex1AF InvitrogenACCAGCCTCTGGAGAAACG CUL1-Ex1AR InvitrogenCCCAACAGCTTCTCCCC CUL1-Ex1BF InvitrogenAGTCACTGCGACAccgc CUL1-Ex1BR InvitrogenTTTTCTGTCAGTGTGTCTCACC CUL1-Ex2F-Alex InvitrogenAAGGTCTAGCTGCGTCCCTC CR624471-Ex1_1F InvitrogenTCGAGAATTGGCTGAGGTTC CR624471-Ex1_1R InvitrogenTTCAACCTAAATACTACCCGCTG CR624471-Ex1_3F InvitrogenAACCCCACATAGGTACACTGG CR624471-Ex1_3R InvitrogenCTGTTGCTGCTGCTCGC UTR-A-CNTNAP2F InvitrogenCTCCAGGCTCCAGTTCTTCC UTR-A-CNTNAP2R InvitrogenCCTTCTTGGTTTGAATTTCCTC UTR-B-CNTNAP2F InvitrogenACTTCGGAGTTGATACCCTGG UTR-B-CNTNAP2R InvitrogenGCAGTGTCATCTCCTACCACAG CNTNAP2-Exon18F InvitrogenTTGGAAAATTCCTACCTAAGTTGAG CNTNAP2-Exon18R InvitrogenGATACTTTTGTGTGGCTCTCCC CNTNAP2-Alt-EX1F InvitrogenGCGCACCCTTGCAACAC CNTNAP2-Alt-EX1R InvitrogenATTATGCAATTGGGTTGGGAG LOC392145-EX1F Invitrogenctttctgtgcagggaacagc LOC392145-EX1R InvitrogenTCCCCTTCCCTGGGCTC CASP2-Ex1R SigmaTTCACCCCATTGGACCGC CASP2-Ex1F Sigma

CP E D I G R E E S F O R A D D I T I O N A L D H M N FA M I L I E S
This Appendix shows the pedigrees for the additional dHMN families not
shown in Chapter 3. The dHMN families uninformative for markers at 7q34-
q36 are; CMT484, CMT274, CMT677, CMT703, CMT131, CMT273, CMT333 and
CMT609. The dHMN families excluded from linkage to 7q34-q36 are; CMT701,
CMT260, CMT618, CMT477, CMT748, CMT779, CMT808, CMT375, CMT102,
CMT724 and CMT331.
216
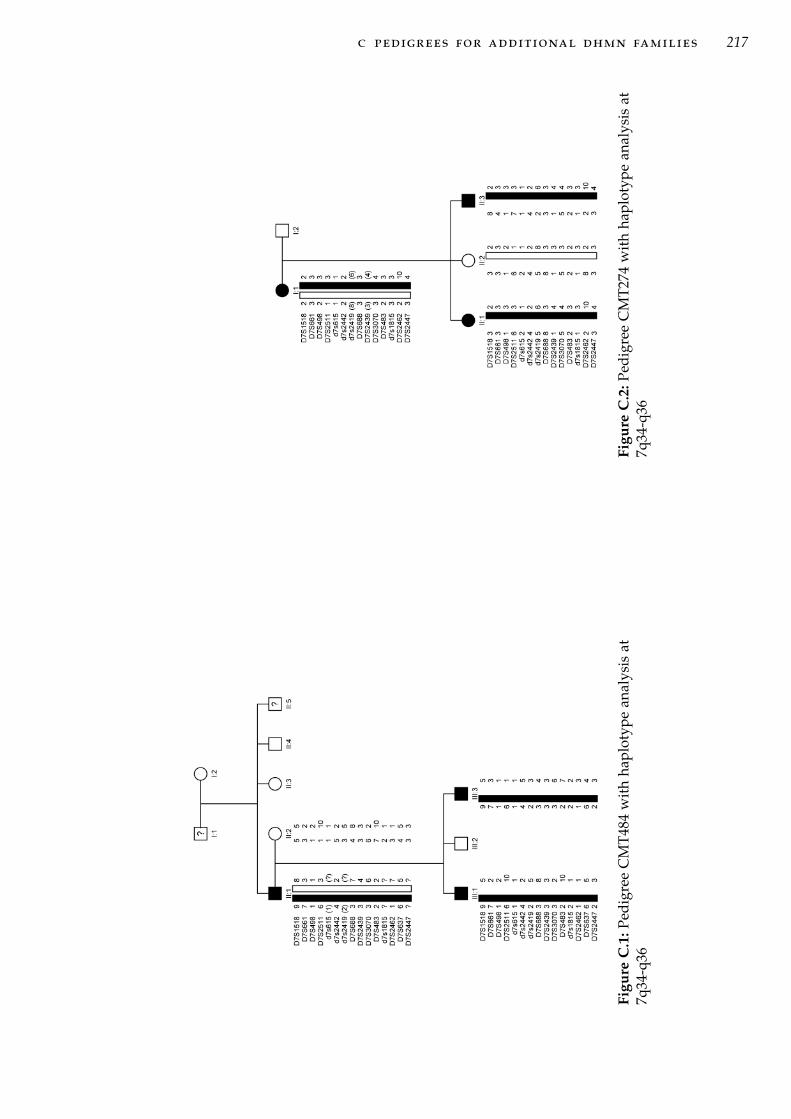
c pedigrees for additional dhmn families 217
Figu
reC
.1:P
edig
ree
CM
T484
wit
hha
plot
ype
anal
ysis
at7q
34-q
36Fi
gure
C.2
:Ped
igre
eC
MT2
74w
ith
hapl
otyp
ean
alys
isat
7q34
-q36

c pedigrees for additional dhmn families 218
Figure C.3: Pedigree CMT609 with haplotype analysis at 7q34-q36

c pedigrees for additional dhmn families 219
Figu
reC
.4:P
edig
ree
CM
T67
7w
ith
hap
loty
pe
anal
ysis
at7q
34-
q36
Figu
reC
.5:P
edig
ree
CM
T70
3w
ith
hap
loty
pe
anal
ysis
at7q
34-
q36

c pedigrees for additional dhmn families 220
Figure C.6: Pedigree CMT131 with haplo-type analysis at 7q34-q36
Figure C.7: Pedigree CMT273 withhaplotype analysis at 7q34-q36

c pedigrees for additional dhmn families 221
Figure C.8: Pedigree CMT333 with haplotype analysis at 7q34-q36

c pedigrees for additional dhmn families 222
Figu
reC
.9:P
edig
ree
CM
T701
wit
hha
plot
ype
anal
ysis
at7q
34-q
36

c pedigrees for additional dhmn families 223
Figu
reC
.10:
Pedi
gree
CM
T260
wit
hha
plot
ype
anal
ysis
at7q
34-q
36

c pedigrees for additional dhmn families 224
Figure C.11: Pedigree CMT618 with haplotype analysis at 7q34-q36

c pedigrees for additional dhmn families 225
Figure C.12: Pedigree CMT477 with haplotype analysis at 7q34-q36

c pedigrees for additional dhmn families 226
Figu
reC
.13:
Pedi
gree
CM
T748
with
hapl
o-ty
pean
alys
isat
7q34
-q36
Figu
reC
.14:
Pedi
gree
CM
T779
with
hapl
o-ty
pean
alys
isat
7q34
-q36
Figu
reC
.15:
Pedi
gree
CM
T808
with
hapl
o-ty
pean
alys
isat
7q34
-q36
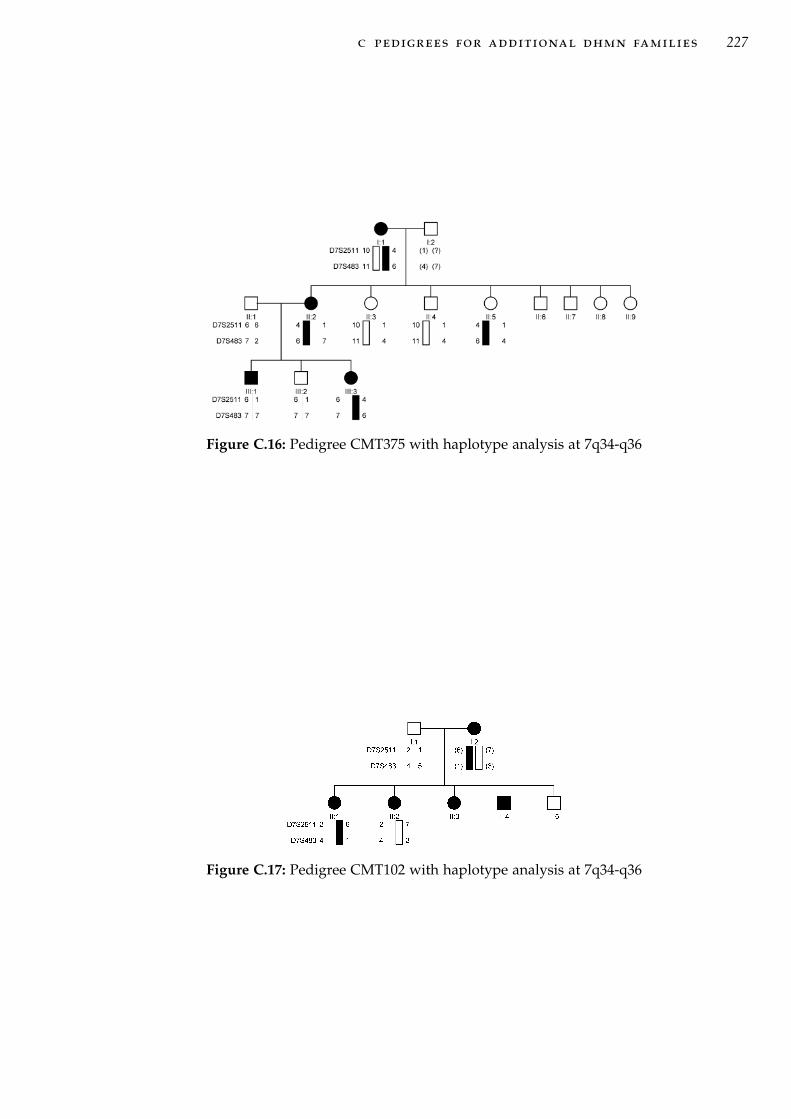
c pedigrees for additional dhmn families 227
Figure C.16: Pedigree CMT375 with haplotype analysis at 7q34-q36
Figure C.17: Pedigree CMT102 with haplotype analysis at 7q34-q36

c pedigrees for additional dhmn families 228
Figure C.18: (Main figure) Pedigree CMT724 with haplotype analysis at 7q34-q36. (Box)The two possible haplotype pairs for individuals II:1 and II:2 can be inferred fromgeneration III but can not be assigned to either individual.

c pedigrees for additional dhmn families 229
Figu
reC
.19:
Pedi
gree
CM
T331
wit
hha
plot
ype
anal
ysis
at7q
34-q
36

DT W O P O I N T L O D S C O R E S F O R A D D I T I O N A L
DHMN FAMILIES
This Appendix shows the two-point LOD scores for the additional dHMN
families not shown in Chapter 3. The dHMN families uninformative for mark-
ers at 7q34-q36 are; CMT484, CMT274, CMT677, CMT703, CMT131, CMT273,
CMT333 and CMT609. The dHMN families excluded from linkage to 7q34-
q36 are; CMT701, CMT260, CMT618, CMT477, CMT748, CMT779, CMT808,
CMT375, CMT102, CMT724 and CMT331.
Table D.1: Pedigree CMT274 two-point LOD scores between the dHMN locus andmicrosatellite markers on chromosome 7q34-q36.
Marker LOD score at recombination fraction0.00 0.05 0.10 0.20 0.30 0.40
D7S1518 0.0000 0.0000 0.0000 0.0000 0.0000 0.0000D7S661 0.0000 0.0000 0.0000 0.0000 0.0000 0.0000D7S498 0.5809 0.5153 0.4469 0.3035 0.1612 0.0463D7S2511 0.5809 0.5153 0.4469 0.3035 0.1612 0.0463D7S615 0.0000 0.0000 0.0000 0.0000 0.0000 0.0000D7S2442 0.0000 0.0000 0.0000 0.0000 0.0000 0.0000D7S2419 0.5809 0.5153 0.4469 0.3035 0.1612 0.0463D7S688 0.0000 0.0000 0.0000 0.0000 0.0000 0.0000D7S2439 0.5809 0.5153 0.4469 0.3035 0.1612 0.0463D7S3070 0.5809 0.5153 0.4469 0.3035 0.1612 0.0463D7S483 0.4403 0.3842 0.3271 0.2128 0.1075 0.0295D7S1815 0.0000 0.0000 0.0000 0.0000 0.0000 0.0000D7S2462 0.3538 0.3052 0.2566 0.1623 0.0797 0.0213D7S2447 0.4403 0.3842 0.3271 0.2128 0.1075 0.0295
230

d two point lod scores for additionaldhmn families 231
Table D.2: Pedigree CMT609 two-point LOD scores between the dHMN locus andmicrosatellite markers on chromosome 7q34-q36.
Marker LOD score at recombination fraction0.00 0.05 0.10 0.20 0.30 0.40
D7S1518 -3.5741 -0.4492 -0.2014 -0.0119 0.0449 0.0417D7S661 -3.2730 -0.1704 0.0539 0.1922 0.1910 0.1209D7S498 -3.4491 -0.0634 0.1437 0.2505 0.2231 0.1335D7S2511 0.5944 0.5222 0.4540 0.3294 0.2171 0.1102D7S615 -0.1041 -0.0720 -0.0493 -0.0219 -0.0086 -0.0025D7S2442 -3.2730 -0.1704 0.0539 0.1922 0.1910 0.1209D7S2419 -3.2730 -0.1704 0.0539 0.1922 0.1910 0.1209D7S688 0.4058 0.3657 0.3262 0.2482 0.1701 0.0889D7S2439 0.0039 0.0263 0.0398 0.0486 0.0416 0.0244D7S3070 -3.5741 -0.4492 -0.2014 -0.0119 0.0449 0.0417D7S483 0.3503 0.3799 0.3841 0.3449 0.2626 0.1474D7S1815 -0.0689 -0.0724 -0.0684 -0.0481 -0.0245 -0.0070D7S2462 0.7270 0.6616 0.5958 0.4616 0.3214 0.1702D7S637 -0.2024 -0.1814 -0.1543 -0.0970 -0.0490 -0.0163D7S2447 0.5351 0.5039 0.4682 0.3832 0.2792 0.1532
Table D.3: Pedigree CMT333 two-point LOD scores between the dHMN locus andmicrosatellite markers on chromosome 7q34-q36.
Marker LOD score at recombination fraction0.00 0.05 0.10 0.20 0.30 0.40
D7S1518 0.0223 0.0252 0.0256 0.0209 0.0123 0.0038D7S661 0.1316 0.1094 0.0887 0.0521 0.0239 0.0061D7S498 0.0580 0.0529 0.0466 0.0319 0.0167 0.0048D7S2511 0.0000 0.0000 0.0000 0.0000 0.0000 0.0000D7S615 0.0000 0.0000 0.0000 0.0000 0.0000 0.0000D7S2442 0.0280 0.0228 0.0181 0.0103 0.0046 0.0012D7S2419 0.0902 0.0744 0.0598 0.0347 0.0157 0.0040D7S688 0.0580 0.0529 0.0466 0.0319 0.0167 0.0048D7S2439 0.1397 0.1182 0.0975 0.0594 0.0283 0.0075D7S3070 0.1316 0.1094 0.0887 0.0521 0.0239 0.0061D7S483 0.0000 0.0000 0.0000 0.0000 0.0000 0.0000D7S1815 -0.2108 -0.1621 -0.1227 -0.0647 -0.0276 -0.0067D7S2462 0.0580 0.0291 0.0079 -0.0136 -0.0141 -0.0055D7S637 0.0580 0.0291 0.0079 -0.0136 -0.0141 -0.0055D7S2447 0.0792 0.0652 0.0523 0.0302 0.0137 0.0035

d two point lod scores for additionaldhmn families 232
Table D.4: Pedigree CMT484 two-point LOD scores between the dHMN locus andmicrosatellite markers on chromosome 7q34-q36.
Marker LOD score at recombination fraction0.00 0.05 0.10 0.20 0.30 0.40
D7S1518 0.3010 0.2577 0.2148 0.1335 0.0645 0.0170D7S661 0.3010 0.2577 0.2148 0.1335 0.0645 0.0170D7S498 0.0000 0.0000 0.0000 0.0000 0.0000 0.0000D7S2511 0.3010 0.2577 0.2148 0.1335 0.0645 0.0170D7S615 0.0000 0.0000 0.0000 0.0000 0.0000 0.0000D7S2442 0.3010 0.2577 0.2148 0.1335 0.0645 0.0170D7S2419 0.1761 0.1477 0.1206 0.0719 0.0334 0.0086D7S688 0.3010 0.2577 0.2148 0.1335 0.0645 0.0170D7S2439 0.3010 0.2577 0.2148 0.1335 0.0645 0.0170D7S3070 0.3010 0.2577 0.2148 0.1335 0.0645 0.0170D7S483 0.0000 0.0000 0.0000 0.0000 0.0000 0.0000D7S1815 0.0000 0.0000 0.0000 0.0000 0.0000 0.0000D7S2462 0.3010 0.2577 0.2148 0.1335 0.0645 0.0170D7S637 0.3010 0.2577 0.2148 0.1335 0.0645 0.0170D7S2447 0.1761 0.1477 0.1206 0.0719 0.0334 0.0086
Table D.5: Pedigree CMT677 two-point LOD scores between the dHMN locus andmicrosatellite markers on chromosome 7q34-q36.
Marker LOD score at recombination fraction0.00 0.05 0.10 0.20 0.30 0.40
D7S1518 -0.0212 -0.0340 -0.0402 -0.0373 -0.0228 -0.0072D7S661 0.1038 0.0780 0.0569 0.0272 0.0105 0.0024D7S498 -0.0984 -0.0783 -0.0630 -0.0398 -0.0211 -0.0064D7S2511 0.1415 0.1124 0.0874 0.0485 0.0220 0.0058D7S615 0.0000 0.0000 0.0000 0.0000 0.0000 0.0000D7S2442 0.2075 0.1682 0.1310 0.0673 0.0243 0.0040D7S2419 0.0186 0.0176 0.0159 0.0110 0.0057 0.0016D7S688 0.2239 0.1839 0.1453 0.0774 0.0294 0.0053D7S2439 -0.1947 -0.1414 -0.1022 -0.0509 -0.0216 -0.0056D7S3070 -0.7413 -0.4904 -0.3510 -0.1841 -0.0823 -0.0215D7S483 0.2129 0.1782 0.1464 0.0908 0.0456 0.0131D7S2462 -0.6164 -0.3733 -0.2460 -0.1118 -0.0451 -0.0110D7S637 0.1415 0.1124 0.0874 0.0485 0.0220 0.0058
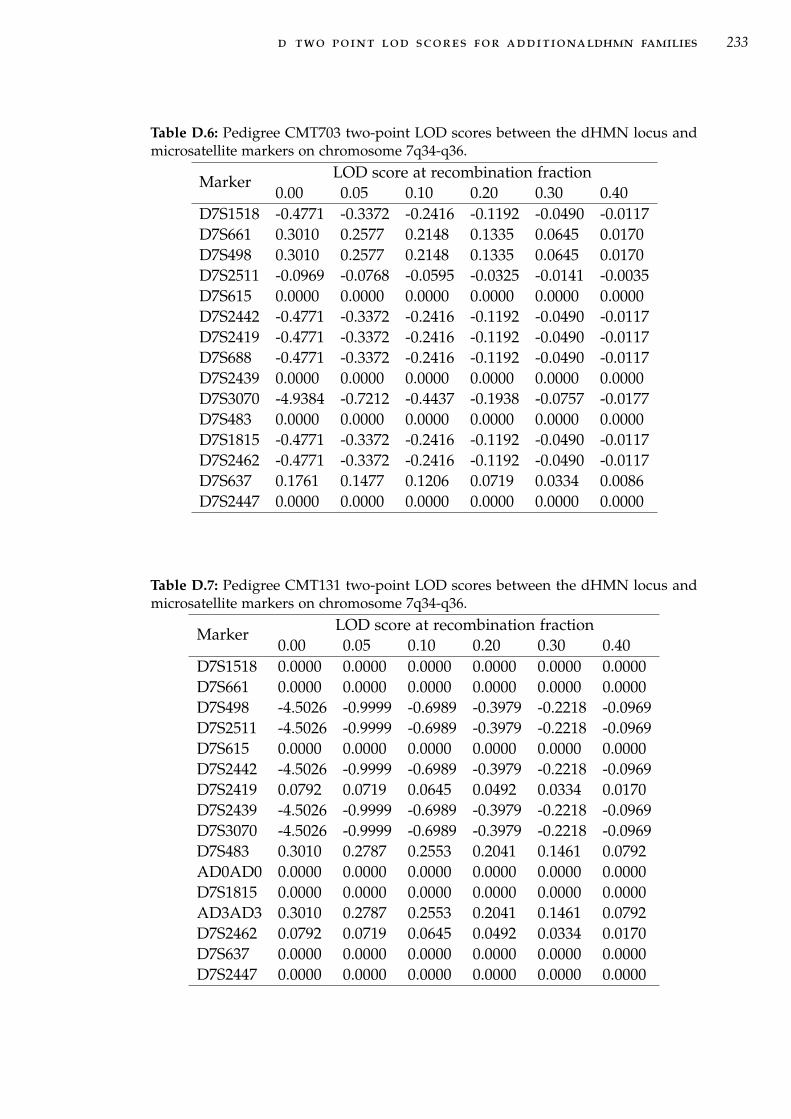
d two point lod scores for additionaldhmn families 233
Table D.6: Pedigree CMT703 two-point LOD scores between the dHMN locus andmicrosatellite markers on chromosome 7q34-q36.
Marker LOD score at recombination fraction0.00 0.05 0.10 0.20 0.30 0.40
D7S1518 -0.4771 -0.3372 -0.2416 -0.1192 -0.0490 -0.0117D7S661 0.3010 0.2577 0.2148 0.1335 0.0645 0.0170D7S498 0.3010 0.2577 0.2148 0.1335 0.0645 0.0170D7S2511 -0.0969 -0.0768 -0.0595 -0.0325 -0.0141 -0.0035D7S615 0.0000 0.0000 0.0000 0.0000 0.0000 0.0000D7S2442 -0.4771 -0.3372 -0.2416 -0.1192 -0.0490 -0.0117D7S2419 -0.4771 -0.3372 -0.2416 -0.1192 -0.0490 -0.0117D7S688 -0.4771 -0.3372 -0.2416 -0.1192 -0.0490 -0.0117D7S2439 0.0000 0.0000 0.0000 0.0000 0.0000 0.0000D7S3070 -4.9384 -0.7212 -0.4437 -0.1938 -0.0757 -0.0177D7S483 0.0000 0.0000 0.0000 0.0000 0.0000 0.0000D7S1815 -0.4771 -0.3372 -0.2416 -0.1192 -0.0490 -0.0117D7S2462 -0.4771 -0.3372 -0.2416 -0.1192 -0.0490 -0.0117D7S637 0.1761 0.1477 0.1206 0.0719 0.0334 0.0086D7S2447 0.0000 0.0000 0.0000 0.0000 0.0000 0.0000
Table D.7: Pedigree CMT131 two-point LOD scores between the dHMN locus andmicrosatellite markers on chromosome 7q34-q36.
Marker LOD score at recombination fraction0.00 0.05 0.10 0.20 0.30 0.40
D7S1518 0.0000 0.0000 0.0000 0.0000 0.0000 0.0000D7S661 0.0000 0.0000 0.0000 0.0000 0.0000 0.0000D7S498 -4.5026 -0.9999 -0.6989 -0.3979 -0.2218 -0.0969D7S2511 -4.5026 -0.9999 -0.6989 -0.3979 -0.2218 -0.0969D7S615 0.0000 0.0000 0.0000 0.0000 0.0000 0.0000D7S2442 -4.5026 -0.9999 -0.6989 -0.3979 -0.2218 -0.0969D7S2419 0.0792 0.0719 0.0645 0.0492 0.0334 0.0170D7S2439 -4.5026 -0.9999 -0.6989 -0.3979 -0.2218 -0.0969D7S3070 -4.5026 -0.9999 -0.6989 -0.3979 -0.2218 -0.0969D7S483 0.3010 0.2787 0.2553 0.2041 0.1461 0.0792AD0AD0 0.0000 0.0000 0.0000 0.0000 0.0000 0.0000D7S1815 0.0000 0.0000 0.0000 0.0000 0.0000 0.0000AD3AD3 0.3010 0.2787 0.2553 0.2041 0.1461 0.0792D7S2462 0.0792 0.0719 0.0645 0.0492 0.0334 0.0170D7S637 0.0000 0.0000 0.0000 0.0000 0.0000 0.0000D7S2447 0.0000 0.0000 0.0000 0.0000 0.0000 0.0000

d two point lod scores for additionaldhmn families 234
Table D.8: Pedigree CMT273 two-point LOD scores between the dHMN locus andmicrosatellite markers on chromosome 7q34-q36.
Marker LOD score at recombination fraction0.00 0.05 0.10 0.20 0.30 0.40
D7S1518 -0.0969 -0.0862 -0.0757 -0.0555 -0.0362 -0.0177D7S661 -0.0969 -0.0862 -0.0757 -0.0555 -0.0362 -0.0177D7S498 -0.0969 -0.0862 -0.0757 -0.0555 -0.0362 -0.0177D7S2511 0.0000 0.0000 0.0000 0.0000 0.0000 0.0000D7S615 0.0000 0.0000 0.0000 0.0000 0.0000 0.0000D7S2442 0.0000 0.0000 0.0000 0.0000 0.0000 0.0000D7S2419 0.0000 0.0000 0.0000 0.0000 0.0000 0.0000D7S688 -0.1761 -0.1549 -0.1347 -0.0969 -0.0621 -0.0300D7S2439 -4.9402 -1.0000 -0.6989 -0.3979 -0.2218 -0.0969D7S3070 0.0000 0.0000 0.0000 0.0000 0.0000 0.0000D7S483 0.0000 0.0000 0.0000 0.0000 0.0000 0.0000D7S1815 0.0000 0.0000 0.0000 0.0000 0.0000 0.0000D7S2462 -4.9402 -1.0000 -0.6989 -0.3979 -0.2218 -0.0969D7S637 -0.0969 -0.0862 -0.0757 -0.0555 -0.0362 -0.0177D7S2447 0.0000 0.0000 0.0000 0.0000 0.0000 0.0000

d two point lod scores for additionaldhmn families 235
Table D.9: Pedigree CMT808 two-point LOD scores between the dHMN locus andmicrosatellite markers on chromosome 7q34-q36.
Marker LOD score at recombination fraction0.00 0.05 0.10 0.20 0.30 0.40
D7S1518 0.0000 0.0000 0.0000 0.0000 0.0000 0.0000D7S661 -5.1858 -0.7413 -0.4625 -0.2096 -0.0877 -0.0247D7S498 -4.9402 -0.7413 -0.4625 -0.2096 -0.0877 -0.0247D7S2511 -0.2016 -0.1560 -0.1187 -0.0635 -0.0277 -0.0072D7S615 -5.1858 -0.7413 -0.4625 -0.2096 -0.0877 -0.0247D7S2442 -5.1858 -0.7413 -0.4625 -0.2096 -0.0877 -0.0247D7S2419 -4.9402 -0.7413 -0.4625 -0.2096 -0.0877 -0.0247D7S688 -4.9402 -0.7413 -0.4625 -0.2096 -0.0877 -0.0247D7S2439 -1.0212 -0.5733 -0.3758 -0.1712 -0.0679 -0.0160D7S3070 -4.9402 -0.7413 -0.4625 -0.2096 -0.0877 -0.0247D7S483 0.1037 0.1038 0.1018 0.0914 0.0720 0.0423D7S1815 0.5187 0.4788 0.4370 0.3467 0.2459 0.1317D7S2462 -1.0212 -0.5733 -0.3758 -0.1712 -0.0679 -0.0160D7S2447 -4.9402 -0.7413 -0.4625 -0.2096 -0.0877 -0.0247
Table D.10: Pedigree CMT260 two-point LOD scores between the dHMN locus andmicrosatellite markers on chromosome 7q34-q36.
Marker LOD score at recombination fraction0.00 0.05 0.10 0.20 0.30 0.40
D7S1518 -4.9720 -0.2587 0.0044 0.1649 0.1436 0.0545D7S661 -5.5081 -0.8214 -0.5004 -0.2035 -0.0705 -0.0139D7S498 -5.1560 -0.6542 -0.3532 -0.0999 -0.0138 0.0026D7S2511 -4.7725 -0.3563 -0.1115 0.0453 0.0549 0.0203D7S615 0.0667 0.0532 0.0415 0.0228 0.0099 0.0025D7S2442 0.5516 0.4869 0.4205 0.2824 0.1457 0.0390D7S2419 0.1987 0.1595 0.1229 0.0609 0.0201 0.0025D7S688 -4.8352 -0.4436 -0.1806 -0.0038 0.0211 0.0068D7S2439 0.0806 0.0637 0.0491 0.0263 0.0113 0.0028D7S3070 -4.8352 -0.4436 -0.1806 -0.0038 0.0211 0.0068D7S483 -5.5383 -0.9486 -0.6004 -0.2649 -0.1025 -0.0236D7S1815 -1.0985 -0.6980 -0.4767 -0.2326 -0.1010 -0.0264D7S2462 -5.1490 -0.6904 -0.4119 -0.1666 -0.0586 -0.0119D7S2447 -6.1524 -1.1612 -0.7143 -0.3007 -0.1117 -0.0247

d two point lod scores for additionaldhmn families 236
Table D.11: Pedigree CMT779 two-point LOD scores between the dHMN locus andmicrosatellite markers on chromosome 7q34-q36.
Marker LOD score at recombination fraction0.00 0.05 0.10 0.20 0.30 0.40
D7S1518 -4.9645 -1.9996 -1.3978 -0.7959 -0.4437 -0.1938D7S2511 0.3010 0.2577 0.2148 0.1335 0.0645 0.0170D7S615 0.0134 -0.0086 -0.0269 -0.0500 -0.0531 -0.0356D7S2442 -0.0389 -0.0534 -0.0641 -0.0728 -0.0641 -0.0389D7S2419 0.0000 0.0000 0.0000 0.0000 0.0000 0.0000D7S688 -4.9645 -1.9996 -1.3978 -0.7959 -0.4437 -0.1938D7S2439 0.0000 -0.0410 -0.0757 -0.1192 -0.1192 -0.0757D7S3070 -5.2180 -0.7212 -0.4437 -0.1938 -0.0757 -0.0177D7S483 -5.2180 -0.7212 -0.4437 -0.1938 -0.0757 -0.0177D7S1815 0.0000 0.0000 0.0000 0.0000 0.0000 0.0000D7S2462 -5.2180 -0.7212 -0.4437 -0.1938 -0.0757 -0.0177D7S2447 0.0000 0.0000 0.0000 0.0000 0.0000 0.0000
Table D.12: Pedigree CMT477 two-point LOD scores between the dHMN locus andmicrosatellite markers on chromosome 7q34-q36.
Marker LOD score at recombination fraction0.00 0.05 0.10 0.20 0.30 0.40
D7S1518 -0.9379 -0.6017 -0.4066 -0.1847 -0.0713 -0.0162D7S661 0.1020 0.0748 0.0544 0.0289 0.0155 0.0072D7S498 -0.1965 -0.1292 -0.0843 -0.0331 -0.0103 -0.0018D7S615 -0.2314 -0.1832 -0.1416 -0.0767 -0.0330 -0.0079D7S2442 -0.0517 -0.0588 -0.0569 -0.0380 -0.0153 -0.0009D7S2419 -0.8477 -0.5450 -0.3714 -0.1732 -0.0696 -0.0173D7S688 -0.1965 -0.1292 -0.0843 -0.0331 -0.0103 -0.0018D7S2439 -0.9379 -0.6017 -0.4066 -0.1847 -0.0713 -0.0162D7S3070 -1.0035 -0.6408 -0.4338 -0.2029 -0.0852 -0.0246D7S1815 0.0350 0.0251 0.0173 0.0073 0.0023 0.0004D7S2462 -0.6099 -0.4279 -0.3011 -0.1416 -0.0552 -0.0126D7S2447 -0.2979 -0.1716 -0.1035 -0.0404 -0.0174 -0.0076

d two point lod scores for additionaldhmn families 237
Table D.13: Pedigree CMT331 two-point LOD scores between the dHMN locus andmicrosatellite markers on chromosome 7q34-q36.
Marker LOD score at recombination fraction0.00 0.05 0.10 0.20 0.30 0.40
D7S1518 0.0561 0.0436 0.0330 0.0172 0.0072 0.0017D7S661 -2.3970 -0.4527 -0.2337 -0.0800 -0.0270 -0.0034D7S498 -1.7849 -0.5506 -0.3130 -0.1173 -0.0371 -0.0038D7S2511 0.2793 0.2383 0.1980 0.1222 0.0586 0.0154D7S615 0.0000 0.0000 0.0000 0.0000 0.0000 0.0000D7S2442 0.1213 0.0930 0.0610 0.0043 -0.0227 -0.0175D7S2419 -5.3260 -0.4600 -0.2023 0.0023 0.0666 0.0603D7S688 -0.1641 -0.1316 -0.1021 -0.0542 -0.0222 -0.0048D7S2439 0.2673 0.2147 0.1672 0.0890 0.0340 0.0030D7S3070 -2.6658 -0.5634 -0.3118 -0.1035 -0.0179 0.0121D7S483 -2.5798 -0.7164 -0.4417 -0.1932 -0.0755 -0.0177D7S1815 -2.2566 -0.9877 -0.6773 -0.3630 -0.1901 -0.0788D7S2462 0.4043 0.3624 0.3195 0.2330 0.1499 0.0728D7S2447 0.0502 0.0449 0.0447 0.0485 0.0462 0.0309
Table D.14: Pedigree CMT724 two-point LOD scores between the dHMN locus andmicrosatellite markers on chromosome 7q34-q36.
Marker LOD score at recombination fraction0.00 0.05 0.10 0.20 0.30 0.40
D7S2202 -1.1596 -0.5877 -0.2878 -0.0271 0.0390 0.0228D7S1518 0.6013 0.5264 0.4502 0.2971 0.1533 0.0429D7S2513 -1.1602 -0.5878 -0.2879 -0.0271 0.0390 0.0228D7S2473 0.5809 0.5153 0.4469 0.3035 0.1612 0.0463D7S661 -0.0121 -0.0114 -0.0101 -0.0066 -0.0033 -0.0009D7S498 -0.1414 -0.0627 -0.0216 0.0072 0.0070 0.0018D7S2511 0.1015 0.0839 0.0676 0.0393 0.0179 0.0045D7S615 -0.6518 -0.3902 -0.2515 -0.1101 -0.0449 -0.0118D7S2442 -0.5481 -0.2910 -0.1344 0.0175 0.0501 0.0243D7S2419 0.6080 0.5332 0.4570 0.3029 0.1570 0.0442D7S688 0.5923 0.5187 0.4438 0.2930 0.1512 0.0423D7S2439 -3.8570 -1.1223 -0.6148 -0.1923 -0.0362 0.0035D7S3070 -3.8570 -1.1223 -0.6148 -0.1923 -0.0362 0.0035D7S483 -4.4991 -1.1124 -0.6803 -0.2802 -0.1002 -0.0209D7S1815 -5.3591 -1.4482 -0.9227 -0.4044 -0.1535 -0.0342D7S2462 -5.1540 -1.5686 -0.9846 -0.4173 -0.1527 -0.0326D7S2447 -0.7413 -0.4724 -0.3223 -0.1516 -0.0610 -0.0145
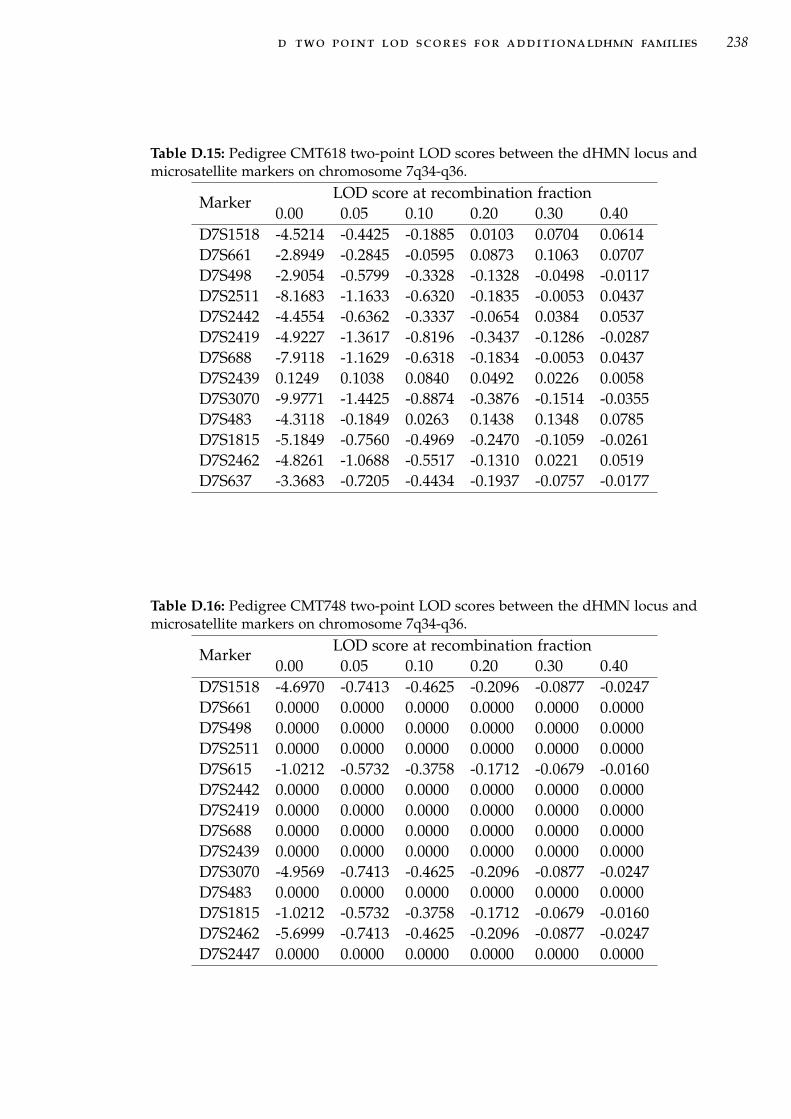
d two point lod scores for additionaldhmn families 238
Table D.15: Pedigree CMT618 two-point LOD scores between the dHMN locus andmicrosatellite markers on chromosome 7q34-q36.
Marker LOD score at recombination fraction0.00 0.05 0.10 0.20 0.30 0.40
D7S1518 -4.5214 -0.4425 -0.1885 0.0103 0.0704 0.0614D7S661 -2.8949 -0.2845 -0.0595 0.0873 0.1063 0.0707D7S498 -2.9054 -0.5799 -0.3328 -0.1328 -0.0498 -0.0117D7S2511 -8.1683 -1.1633 -0.6320 -0.1835 -0.0053 0.0437D7S2442 -4.4554 -0.6362 -0.3337 -0.0654 0.0384 0.0537D7S2419 -4.9227 -1.3617 -0.8196 -0.3437 -0.1286 -0.0287D7S688 -7.9118 -1.1629 -0.6318 -0.1834 -0.0053 0.0437D7S2439 0.1249 0.1038 0.0840 0.0492 0.0226 0.0058D7S3070 -9.9771 -1.4425 -0.8874 -0.3876 -0.1514 -0.0355D7S483 -4.3118 -0.1849 0.0263 0.1438 0.1348 0.0785D7S1815 -5.1849 -0.7560 -0.4969 -0.2470 -0.1059 -0.0261D7S2462 -4.8261 -1.0688 -0.5517 -0.1310 0.0221 0.0519D7S637 -3.3683 -0.7205 -0.4434 -0.1937 -0.0757 -0.0177
Table D.16: Pedigree CMT748 two-point LOD scores between the dHMN locus andmicrosatellite markers on chromosome 7q34-q36.
Marker LOD score at recombination fraction0.00 0.05 0.10 0.20 0.30 0.40
D7S1518 -4.6970 -0.7413 -0.4625 -0.2096 -0.0877 -0.0247D7S661 0.0000 0.0000 0.0000 0.0000 0.0000 0.0000D7S498 0.0000 0.0000 0.0000 0.0000 0.0000 0.0000D7S2511 0.0000 0.0000 0.0000 0.0000 0.0000 0.0000D7S615 -1.0212 -0.5732 -0.3758 -0.1712 -0.0679 -0.0160D7S2442 0.0000 0.0000 0.0000 0.0000 0.0000 0.0000D7S2419 0.0000 0.0000 0.0000 0.0000 0.0000 0.0000D7S688 0.0000 0.0000 0.0000 0.0000 0.0000 0.0000D7S2439 0.0000 0.0000 0.0000 0.0000 0.0000 0.0000D7S3070 -4.9569 -0.7413 -0.4625 -0.2096 -0.0877 -0.0247D7S483 0.0000 0.0000 0.0000 0.0000 0.0000 0.0000D7S1815 -1.0212 -0.5732 -0.3758 -0.1712 -0.0679 -0.0160D7S2462 -5.6999 -0.7413 -0.4625 -0.2096 -0.0877 -0.0247D7S2447 0.0000 0.0000 0.0000 0.0000 0.0000 0.0000

d two point lod scores for additionaldhmn families 239
Table D.17: Pedigree CMT701 two-point LOD scores between the dHMN locus andmicrosatellite markers on chromosome 7q34-q36.
Marker LOD score at recombination fraction0.00 0.05 0.10 0.20 0.30 0.40
D7S661 -4.4795 -0.5837 -0.3262 -0.1159 -0.0344 -0.0053D7S498 -8.9135 -1.6371 -1.0715 -0.5454 -0.2734 -0.1075D7S2511 -8.7837 -1.3049 -0.7699 -0.3097 -0.1101 -0.0230D7S2419 -4.8428 -0.6513 -0.3846 -0.1555 -0.0558 -0.0118D7S688 -9.2754 -1.4098 -0.8598 -0.3697 -0.1421 -0.0327D7S2439 -9.2308 -2.4876 -1.6226 -0.8057 -0.3821 -0.1346D7S3070 -4.1146 -1.8532 -1.2343 -0.6326 -0.3126 -0.1180D7S483 -3.8545 -1.2639 -0.7707 -0.3747 -0.2013 -0.0915D7S2462 -4.0306 -1.4206 -0.9053 -0.4600 -0.2406 -0.1008D7S637 -4.2524 -1.6062 -1.0544 -0.5429 -0.2749 -0.1083D7S2447 -4.4725 -1.9030 -1.2804 -0.6644 -0.3286 -0.1223
Table D.18: Pedigree CMT102 two-point LOD scores between the dHMN locus andmicrosatellite markers on chromosome 7q34-q36.
Marker LOD score at recombination fraction0.00 0.05 0.10 0.20 0.30 0.40
D7S2511 -3.9964 -0.7211 -0.4436 -0.1938 -0.0757 -0.0177D7S483 -3.9964 -0.7211 -0.4436 -0.1938 -0.0757 -0.0177
Table D.19: Pedigree CMT375 two-point LOD scores between the dHMN locus andmicrosatellite markers on chromosome 7q34-q36.
Marker LOD score at recombination fraction0.00 0.05 0.10 0.20 0.30 0.40
D7S2511 -5.1596 -0.6962 -0.3311 -0.0347 0.0562 0.0555D7S483 -6.1442 -0.6962 -0.3311 -0.0347 0.0562 0.0555

EM U LT I - P O I N T L O D S C O R E S F O R A D D I T I O N A L
DHMN FAMILIES
This Appendix shows the multi-point LOD scores for the additional dHMN
families not shown in Chapter 3. The dHMN families uninformative for mark-
ers at 7q34-q36 are; CMT484, CMT274, CMT677, CMT703, CMT131, CMT273,
CMT333 and CMT609. The dHMN families excluded from linkage to 7q34-
q36 are; CMT701, CMT260, CMT618, CMT477, CMT748, CMT779, CMT808,
CMT375, CMT102, CMT724 and CMT331. These plots show multi-point LOD
score plotted against genetic distance.
Mul
ti-p
oint
LO
Dsc
ore
D7S1518
D7S661
D7S2511
D7S615
D7S498
D7S2419
D7S688
D7S2442
D7S2439
D7S3070
D7S483
D7S1815
D7S2462
D7S637
D7S2447
-4.0
-3.0
-2.0
-1.0
0.0
1.0
2.0
3.0
5 10 15 20 250
Genetic distance (cM)
Figure E.1: Multi-point LOD plot for family CMT609.
240
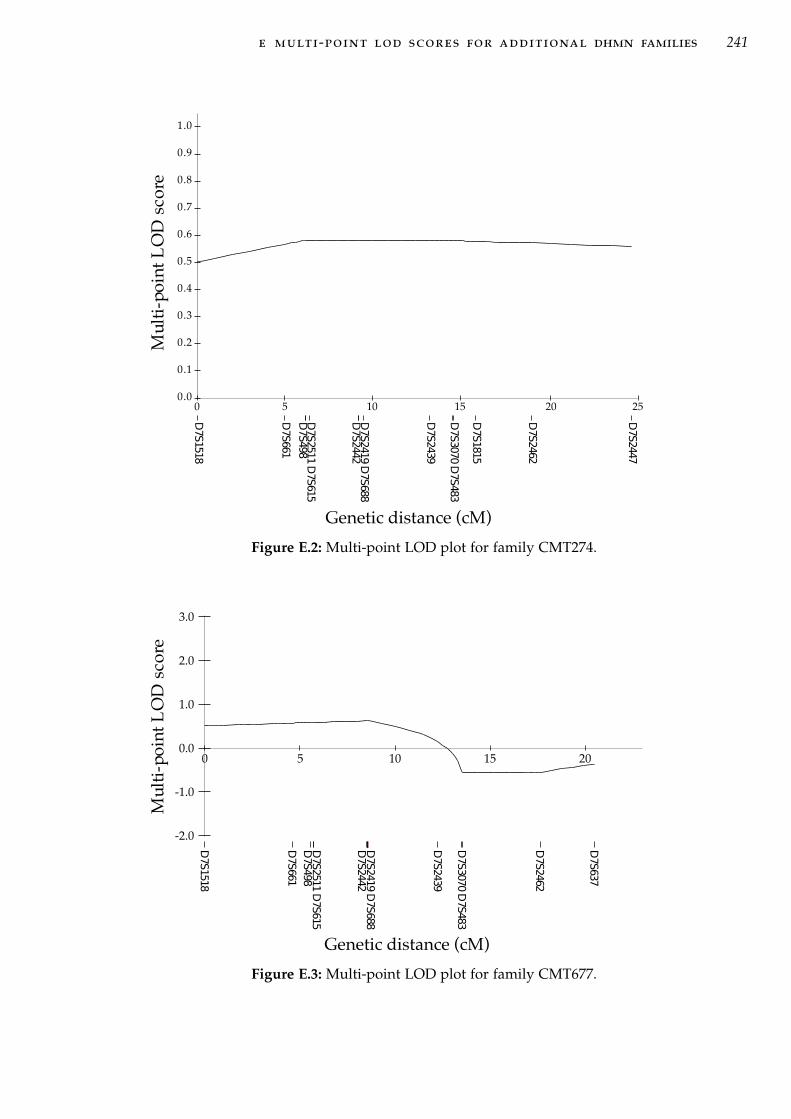
e multi-point lod scores for additional dhmn families 241
Mul
ti-p
oint
LO
Dsc
ore
D7S1518
D7S661
D7S2511
D7S615
D7S498
D7S2419
D7S688
D7S2442
D7S2439
D7S3070
D7S483
D7S1815
D7S2462
D7S2447
0.0
0.1
0.2
0.3
0.4
0.5
0.6
0.7
0.8
0.9
1.0
0 5 10 15 20 25
Genetic distance (cM)
Figure E.2: Multi-point LOD plot for family CMT274.
Mul
ti-p
oint
LO
Dsc
ore
D7S1518
D7S661
D7S498
D7S2442
D7S2439
D7S3070
D7S483
D7S2462
D7S637
-2.0
-1.0
0.0
1.0
2.0
3.0
D7S2511
D7S615
D7S2419
D7S688
0 5 10 15 20
Genetic distance (cM)
Figure E.3: Multi-point LOD plot for family CMT677.

e multi-point lod scores for additional dhmn families 242
Mu
lti-
po
int
LO
Dsc
ore
D7S1518
D7S661
D7S2511
D7S615
D7S498
D7S2419
D7S688
D7S2442
D7S2439
D7S3070
D7S483
D7S1815
D7S2462
D7S637
D7S2447
0.0
0.1
0.2
0.3
0.4
0.5
0.6
0.7
0 5 10 15 20 25
Genetic distance (cM)
Figure E.4: Multi-point LOD plot for family CMT484.
Mu
lti-
po
int
LO
D s
core
D7S1518
D7S661
D7S498
D7S2442
D7S2439
D7S3070 D
7S483
D7S1815
D7S2462
D7S637
D7S2447
-5.0
-4.0
-3.0
-2.0
-1.0
0.0
1.0
2.0
3.0
D7S2511 D
7S615
D7S2419 D
7S688
0 5 10 15 20 25
Genetic distance (cM)
Figure E.5: Multi-point LOD plot for family CMT703.

e multi-point lod scores for additional dhmn families 243
Multi-pointLOD
score
D7S1518
D7S661
D7S2511
D7S615
D7S498
D7S2419
D7S2442
D7S2419
D7S2439
D7S3070
D7S483
AD0
D7S1815
AD3
D7S2462
D7S637
D7S2447
-5.0
-4.0
-3.0
-2.0
-1.0
0.0
1.0
2.0
3.0
5 1 0 1 5 2 0 2 50
Figure E.6: Multi-point LOD plot for family CMT131.
Mu
lti-
po
int
LO
D s
core
Genetic distance (cM)
D7S1518
D7S661
D7S49
D7S2419 D
7S688
D7S2439
D7S3070 D
7S483
D7S1815
D7S2462
D7S637
D7S2447
0.0
0.1
0.2
0.3
0.4
0.5
0.6
0.7
0.8
0.9
1.0
D7S2511 D
7S615
D7S2442
0 5 10 15 20 25
Figure E.7: Multi-point LOD plot for family CMT333.

e multi-point lod scores for additional dhmn families 244
Mu
lti-
po
int
LO
D s
core
D7S1518
D7S661
D7S498
D7S2442
D7S2439
D7S3070 D
7S483
D7S1815
D7S2462
D7S637
D7S2447
-5.0
-4.0
-3.0
-2.0
-1.0
0.0
1.0
2.0
3.0
D7S2419 D
7S688
D7S2511 D
7S615
5 10 15 20 250
Genetic distance (cM)
Figure E.8: Multi-point LOD plot for family CMT273.
Mu
lti-
po
int
LO
D s
core
D7S1518
D7S661
D7S498
D7S2442
D7S2439
D7S3070 D
7S483
D7S1815
D7S2462
D7S2447
-6.0
-5.0
-4.0
-3.0
-2.0
-1.0
0.0
1.0
2.0
3.0
D7S2511 D
7S615
D7S2419 D
7S688
Genetic distance (cM)
0 5 10 15 20 25
Figure E.9: Multi-point LOD plot for family CMT260.

e multi-point lod scores for additional dhmn families 245
Mul
ti-p
oint
LO
Dsc
ore
D7S661
D7S498
D7S2511
D7S2419
D7S688
D7S2439
D7S3070
D7S483
D7S2462
D7S637
D7S2447
-8.0
-7.0
-6.0
-5.0
-4.0
-3.0
-2.0
-1.0
0.0
1.0
2.0
3.0
0 5 10 15 20
Genetic distance (cM)
Figure E.10: Multi-point LOD plot for family CMT701
Mul
ti-p
oint
LO
Dsc
ore
D7S1518
D7S661
D7S498
D7S2511
D7S2442
D7S2439
D7S3070
D7S483
D7S1815
D7S2462
D7S637
-8.0
-7.0
-6.0
-5.0
-4.0
-3.0
-2.0
-1.0
0.0
1.0
2.0
3.0
D7S2511
D7S2419
D7S688
20151050
Genetic distance (cM)
Figure E.11: Multi-point LOD plot for family CMT618.

e multi-point lod scores for additional dhmn families 246
Mul
ti-p
oint
LO
Dsc
ore
D7S2202
D7S1518
D7S2513
D7S2473
D7S661
D7S498
D7S2442
D7S2439
D7S3070
D7S483
D7S1815
D7S2462
D7S2447
-6.0
-5.0
-4.0
-3.0
-2.0
-1.0
0.0
1.0
2.0
3.0
D7S2511
D7S615
D7S2419
D7S688
Genetic distance (cM)
0 5 10 15 20 25
Figure E.12: Multi-point LOD plot for family CMT724.
Mul
ti-p
oint
LO
Dsc
ore
D7S1518
D7S661
D7S2511
D7S615
D7S498
D7S2419
D7S688
D7S2442
D7S2439
D7S3070
D7S483
D7S1815
D7S2462
D7S2447
-5.0
-4.0
-3.0
-2.0
-1.0
0.0
1.0
2.0
3.0
50 10 15 20 25
Genetic distance(cM)
Figure E.13: Multi-point LOD plot for family CMT331.
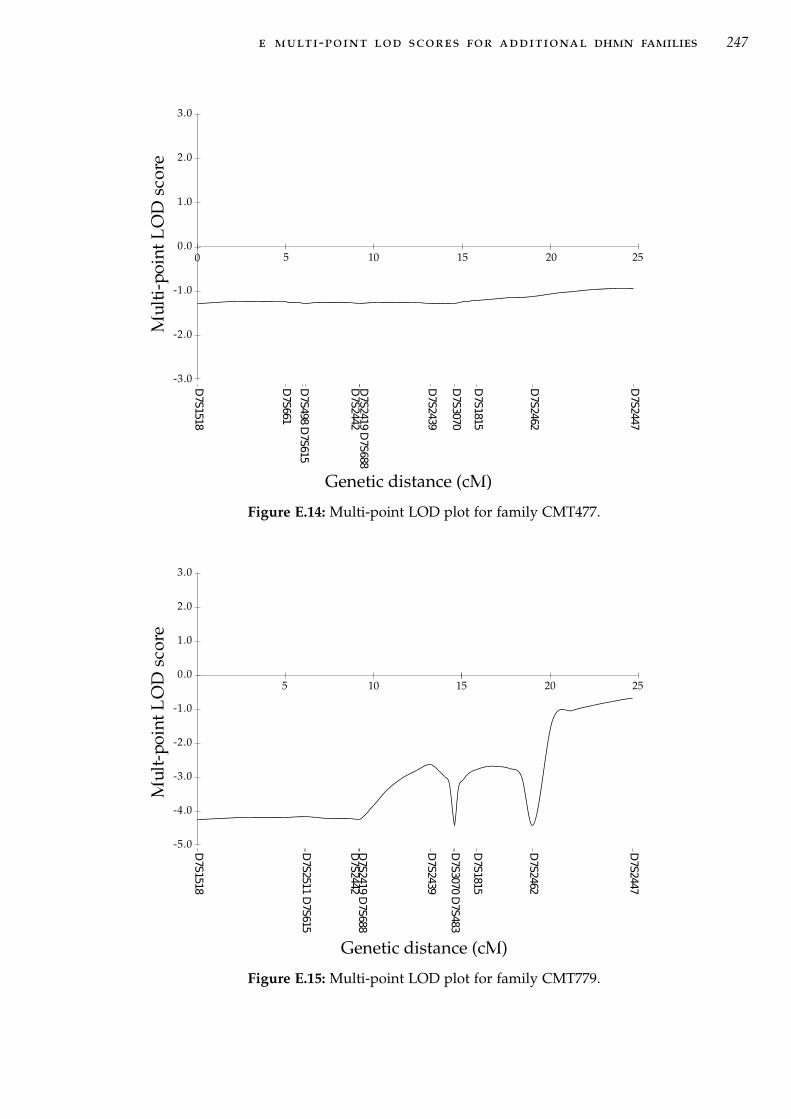
e multi-point lod scores for additional dhmn families 247
Mu
lti-
po
int
LO
D s
core
Genetic distance (cM)
D7S1518
D7S661
D7S498 D
7S615
D7S2442
D7S2439
D7S3070
D7S1815
D7S2462
D7S2447
-3.0
-2.0
-1.0
0.0
1.0
2.0
3.0
D7S2419 D
7S688
0 5 10 15 20 25
Figure E.14: Multi-point LOD plot for family CMT477.
Mu
lt-p
oin
t L
OD
sco
re
D7S1518
D7S2511 D
7S615
D7S2442
D7S2439
D7S3070 D
7S483
D7S1815
D7S2462
D7S2447
-5.0
-4.0
-3.0
-2.0
-1.0
0.0
1.0
2.0
3.0
D7S2419 D
7S688
Genetic distance (cM)
5 10 15 20 25
Figure E.15: Multi-point LOD plot for family CMT779.

e multi-point lod scores for additional dhmn families 248
Mul
ti-p
oint
LO
Dsc
ore
D7S1518
D7S661
D7S2511
D7S615
D7S498
D7S2419
D7S688
D7S2442
D7S2439
D7S3070
D7S483
D7S1815
D7S2462
D7S2447
-6.0
-5.0
-4.0
-3.0
-2.0
-1.0
0.0
1.0
2.0
3.0
Genetic distance (cM)
0 5 10 15 20 25
Figure E.16: Multi-point LOD plot for family CMT748.
Mul
ti-p
oint
LO
Dsc
ore
D7S1518
D7S661
D7S2511
D7S615
D7S498
D7S2419
D7S688
D7S2442
D7S2439
D7S3070
D7S483
D7S1815
D7S2462
D7S2447
-5.0
-4.0
-3.0
-2.0
-1.0
0.0
1.0
2.0
3.0
Genetic distance (cM)
0 5 10 15 20 25
Figure E.17: Multi-point LOD plot for family CMT808.

F7 Q 3 4 - Q 3 6 C O N T R O L H A P L O T Y P E S
Table F.1: Healthy control haplotypes for association analysis from unaffected spousesin dHMN families
# D7S
1518
D7S
661
D7S
498
D7S
2511
D7S
615
D7S
2442
D7S
2419
D7S
688
D7S
2439
D7S
3070
D7S
483
AD
0
D7S
1815
AD
3
D7S
2462
D7S
637
D7S
2447
1 5 3 3 7 1 2 5 8 1 6 3 . 2 . 5 . 22 9 3 2 5 1 4 3 4 4 2 4 . 1 . 3 . 33 7 3 1 5 2 2 3 4 1 3 3 . 2 . 2 . 34 6 3 7 6 2 2 5 3 1 4 4 . . . 8 . 15 8 7 2 7 1 4 7 4 1 1 2 . 5 . 5 5 16 8 4 8 8 1 5 7 3 1 2 6 . 1 . 3 1 27 5 3 1 1 1 5 3 4 3 6 7 . 2 . 3 4 .8 5 2 2 10 1 2 5 8 3 2 10 . 1 . 1 5 .9 7 5 1 1 1 7 3 2 3 2 3 . 2 . 2 4 1
10 11 4 2 1 2 4 3 4 4 3 3 . 3 . 6 5 311 8 2 2 . 2 4 3 4 4 1 3 . 2 . 7 5 .12 9 4 2 . 1 4 3 1 3 1 . . 1 . 6 5 .13 4 8 8 3 2 7 7 2 4 6 9 . 1 . 4 4 .14 5 3 1 5 1 4 3 3 4 1 2 . 4 . 2 3 .15 5 1 1 6 . 4 3 2 7 2 5 . 1 . 3 3 .16 8 1 1 5 . 8 3 7 10 1 5 . 2 . 5 1 .17 4 3 2 6 . 2 5 2 5 2 5 . 1 . 5 1 .18 9 1 1 5 . . 6 7 4 3 9 . 3 . 6 3 .19 8 3 1 1 . 2 3 7 10 1 2 . . . 5 1 .20 9 4 4 1 . 4 3 2 4 4 4 . . . 2 3 .21 2 1 1 6 2 . 3 . 4 . 6 . 1 . . . 322 5 3 1 7 2 . 3 . 1 . 3 . 1 . . . 323 6 7 2 6 1 . 3 7 4 4 9 . 2 . 2 . 324 9 5 2 8 1 5 3 5 2 4 4 . 2 . 1 . 125 7 1 1 6 1 2 3 4 4 7 2 . 2 . 2 . 126 10 5 1 1 2 4 3 4 3 3 3 . 1 . 9 . 327 4 5 3 6 1 4 11 . 3 4 2 2 3 2 6 3 128 5 3 1 5 2 2 5 . 3 6 4 2 2 4 5 5 329 3 1 2 3 2 2 4 2 3 2 2 2 2 2 2 3 230 5 3 1 4 1 2 3 5 1 5 3 2 2 1 2 6 231 5 2 1 1 2 2 3 6 6 2 5 4 1 1 2 5 1
Table F.1 - continued on next page
249

f 7q34-q36 control haplotypes 250
Table F.1 - continued from previous page
# D7S
1518
D7S
661
D7S
498
D7S
2511
D7S
615
D7S
2442
D7S
2419
D7S
688
D7S
2439
D7S
3070
D7S
483
AD
0
D7S
1815
AD
3
D7S
2462
D7S
637
D7S
2447
32 4 1 1 5 2 4 3 3 5 3 2 4 1 3 4 5 233 2 1 1 6 1 2 1 1 4 4 3 4 4 4 1 3 134 1 4 1 7 1 2 2 3 2 3 3 2 2 2 3 3 235 8 5 1 1 1 4 . 2 1 4 4 . 2 . 8 . 336 9 3 1 1 1 4 3 4 2 5 3 . 2 . . . 237 9 3 1 1 . 2 . . 4 3 2 5 . 2 1 . .38 9 7 1 . 2 2 3 4 1 4 . . 2 8 . . 239 4 2 1 5 1 6 6 4 10 . 9 . . . 5 4 340 5 1 2 3 2 4 6 7 1 . 10 . . . 2 5 341 7 7 1 6 1 4 13 4 3 . 3 . . . 6 4 242 5 2 2 2 2 4 14 4 4 . 2 . . . 5 5 343 9 1 1 1 1 4 13 5 4 . 9 . . . 7 3 144 5 3 1 1 2 2 14 1 4 . 9 . . . 5 3 345 5 1 1 1 1 2 13 5 1 . 3 . . . 5 5 246 2 3 1 6 1 7 6 3 4 . 2 . . . 6 3 247 3 3 1 6 2 4 5 8 1 5 2 . 1 . 2 . 348 8 4 1 7 1 4 2 3 . . . . . . 8 . 349 . 7 1 1 1 2 3 2 4 4 3 2 1 3 3 3 350 . 2 3 10 1 . . . . . 4 3 1 1 1 3 251 . 7 7 5 1 4 2 . 4 6 3 . 1 . 4 6 152 . . . 1 2 2 . 4 1 4 2 . 3 . 3 . 353 7 1 1/2 1/3 1 4 3 3/4 1/7 3 8 . 3 . 2 . 354 1 5 7 . 2 6 2 2 8 4 . . 1 . . . .55 1 3 2 1/4 1/2 4 . 2 4 4 2 . 3 . 3 . 256 6 . . 4 1 4 3 4 2 5 2 . 1 . 1 . 3

G7 Q 3 4 - Q 3 6 C A N D I D AT E G E N E S A N D R E P O RT E D
GENE EXPRESSION
Table G.1: Candidate genes within the minimum probable candidate interval on7q34-q36. Only alternate isoforms with unique exons are shown.
Symbol Accession # Gene name Alternate isoforms
CNTNAP2 NM_014141† contactin-associated protein-like 2 isoform 2 (NM_014141)†
C7orf33 NM_145304.2 chromosome 7 open reading frame 33
CUL1 NM_003592 cullin 1
EZH2 NM_004456 enhancer of zeste 2 isoform a isoform b (NM_152998)
PDIA4 NM_004911 protein disulfide isomerase-associated 4
ZNF786 NM_152411 zinc finger protein 786
ZNF425 NM_001001661 zinc finger protein 425
ZNF398 NM_170686 zinc finger 398 isoform a isoform b (NM_020781)
ZNF282 NM_003575 zinc finger protein 282
ZNF212 NM_012256 zinc finger protein 212
ZNF783 NM_001004302 zinc finger protein 783
ZNF777 NM_015694 zinc finger protein 777
ZNF746 NM_152557 zinc finger protein 746
ZNF767 NM_024910 zinc finger family member 767
KRBA1 NM_032534 KRAB A domain containing 1
ZNF467 NM_207336 zinc finger protein 467
SSPO NM_198455 SCO-spondin ZNF862 (NM_001099220)
ATP6V0E2 NM_145230 ATPase, H+ transporting, V0 subunit isoform 1 isoform 2(NM_001100592)
ACTR3C NM_001164458 Actin-related protein 3C variant 2(NM_001164459)
LRRC61 NM_001142928 leucine rich repeat containing 61 variant 2 (NM_023942)
C7orf29 NM_138434 Homo sapiens chromosome 7 open reading frame29
RARRES2 NM_002889 chemerin preproprotein
REPIN1 NM_014374 replication initiator 1 isoform 1 isoform 3(NM_001099695)
ZNF775 NM_173680 zinc finger protein 775
GIMAP8 NM_175571 GTPase, IMAP family member 8
GIMAP7 NM_153236 GTPase, IMAP family member 7
GIMAP4 NM_018326 GTPase, IMAP family member 4
GIMAP6 NM_024711 GTPase, IMAP family member 6
GIMAP2 NM_015660 GTPase, IMAP family member 2
GIMAP1 NM_130759 GTPase, IMAP family member 1
GIMAP5 NM_018384 GTPase, IMAP family member 5
Table G.1 - continued on next page† alternate isoforms with the same identifier as the parent gene.
251

g 7q34-q36 candidate genes and reported gene expression 252
Table G.1 - continued from previous pageSymbol Accession # Gene name Alternate isoforms
TMEM176B NM_014020 transmembrane protein 176B variant 1 variant 2(NM_001101311)
variant 3(NM_001101312)
TMEM176A NM_018487 hepatocellular carcinoma-associated antigen 112
ABP1 NM_001091† Amiloride-sensitive amine oxidase [copper-containing] isoform 2(NM_001091)†
KCNH2 NM_172057 voltage-gated potassium channel, subfamily H isoformc
Isoform b(NM_172056)
NOS3 NM_000603 nitric oxide synthase 3 (endothelial cell)
ATG9B NM_173681 ATG9 autophagy related 9 homolog B
ABCB8 NM_007188 ATP-binding cassette, sub-family B, member 8
ACCN3 NM_004769 amiloride-sensitive cation channel 3 isoform a isoform b(NM_020321)
CDK5 NM_004935 cyclin-dependent kinase 5
SLC4A2 NM_003040 solute carrier family 4, anion exchanger, memberisoform 1
isoform 1 variant 2(NM_001199692)
isoform 3(NM_001199694)
FASTK NM_006712 Fas-activated serine/threonine kinase isoform 1 isoform 4(NM_033015)
TMUB1 NM_031434 transmembrane and ubiquitin-like domain-containingprotein 1 isoform 1
isoform 2(NM_001136044)
AGAP3 NM_031946 centaurin, gamma 3 isoform a isoform b(NM_001042535)
GBX1 NM_001098834 gastrulation brain homeo box 1
ASB10 NM_001142459 ankyrin repeat and SOCS box-containing 10 variant 3(NM_080871)
ABCF2 NM_007189 ATP-binding cassette, sub-family F, member 2 isoforma
isoform b(NM_005692)
CSGLCA-T NM_019015 chondroitin sulfate glucuronyltransferase
SMARCD3 NM_001003802 SWI/SNF-related matrix-associated actin-dependentregulator of chromatin subfamily D member 3
variant 3(NM_001003801)
variant 3(NM_003078)
NUB1 NM_016118 NEDD8 ultimate buster-1
WDR86 NM_198285 WD repeat-containing protein 86
CRYGN NM_144727 Gamma-crystallin N (Gamma-N-crystallin)
RHEB NM_005614 Ras homolog enriched in brain
PRKAG2 NM_016203 5’-AMP-activated protein kinase subunit gamma-2 variant b(NM_024429)
variant c(NM_001040633)
GALNTL5 NM_145292 putative polypeptideN-acetylgalactosaminyltransferase-like protein 5
GALNT11 NM_022087 polypeptide N-acetylgalactosaminyltransferase 11
MLL3 NM_170606 myeloid/lymphoid or mixed-lineage leukemia 3
CCT8L1 NM_001029866 chaperonin containing TCP1, subunit 8
XRCC2 NM_005431 X-ray repair cross complementing protein 2
ACTR3B NM_020445 actin-related protein 3-beta isoform 1
DPP6 NM_130797 dipeptidyl-peptidase 6 isoform 1 isoform 2(NM_001936)
isoform 3(NM_001039350)
DPP6 protein(Q8IYG9)‡
† alternate isoforms with the same identifier as the parent gene.‡UniProtKB/TrEMBL accession number.
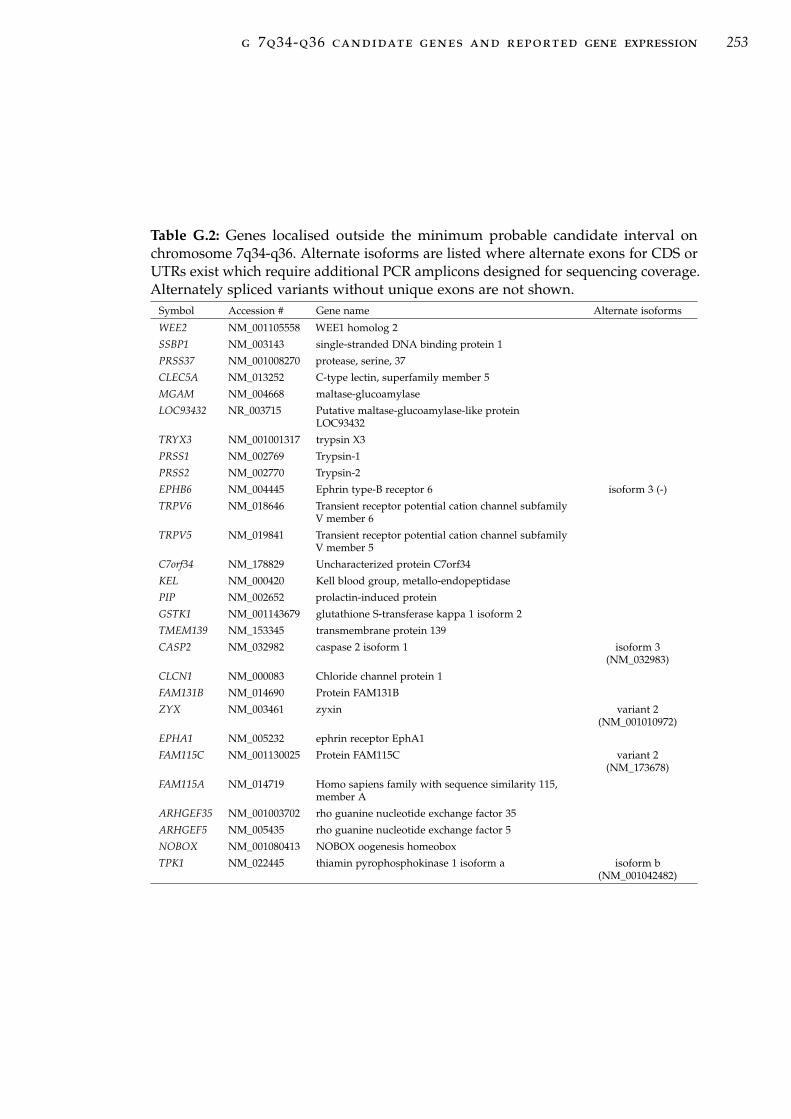
g 7q34-q36 candidate genes and reported gene expression 253
Table G.2: Genes localised outside the minimum probable candidate interval onchromosome 7q34-q36. Alternate isoforms are listed where alternate exons for CDS orUTRs exist which require additional PCR amplicons designed for sequencing coverage.Alternately spliced variants without unique exons are not shown.
Symbol Accession # Gene name Alternate isoforms
WEE2 NM_001105558 WEE1 homolog 2
SSBP1 NM_003143 single-stranded DNA binding protein 1
PRSS37 NM_001008270 protease, serine, 37
CLEC5A NM_013252 C-type lectin, superfamily member 5
MGAM NM_004668 maltase-glucoamylase
LOC93432 NR_003715 Putative maltase-glucoamylase-like proteinLOC93432
TRYX3 NM_001001317 trypsin X3
PRSS1 NM_002769 Trypsin-1
PRSS2 NM_002770 Trypsin-2
EPHB6 NM_004445 Ephrin type-B receptor 6 isoform 3 (-)
TRPV6 NM_018646 Transient receptor potential cation channel subfamilyV member 6
TRPV5 NM_019841 Transient receptor potential cation channel subfamilyV member 5
C7orf34 NM_178829 Uncharacterized protein C7orf34
KEL NM_000420 Kell blood group, metallo-endopeptidase
PIP NM_002652 prolactin-induced protein
GSTK1 NM_001143679 glutathione S-transferase kappa 1 isoform 2
TMEM139 NM_153345 transmembrane protein 139
CASP2 NM_032982 caspase 2 isoform 1 isoform 3(NM_032983)
CLCN1 NM_000083 Chloride channel protein 1
FAM131B NM_014690 Protein FAM131B
ZYX NM_003461 zyxin variant 2(NM_001010972)
EPHA1 NM_005232 ephrin receptor EphA1
FAM115C NM_001130025 Protein FAM115C variant 2(NM_173678)
FAM115A NM_014719 Homo sapiens family with sequence similarity 115,member A
ARHGEF35 NM_001003702 rho guanine nucleotide exchange factor 35
ARHGEF5 NM_005435 rho guanine nucleotide exchange factor 5
NOBOX NM_001080413 NOBOX oogenesis homeobox
TPK1 NM_022445 thiamin pyrophosphokinase 1 isoform a isoform b(NM_001042482)

g 7q34-q36 candidate genes and reported gene expression 254
Table G.3: Expression pattern of genes within the chromosome 7q34-q36 dHMN1disease region. (+) indicates the gene is expressed in the tissue indicated, (H) indicatesthe gene is expressed at a higher level in this tissue relative to other tissues in thedata set, (L) indicates the gene is expressed at a lower level in this tissue relative toother tissues, (-) indicates there is no gene expression detected. (*) indicates geneswith no expression data available from Genenote and GNF BioGPS, instead UniGene -electronic northern normal expression data is presented.
Gene Brain Spinal Cord Muscle
WEE2 + + +
SSBP1 + + +
PRSS37 + + +
CLEC5A + + +
MGAM L L L
LOC93432 + + +
TRYX3 + + +
PRSS1 L L L
PRSS2 L L L
EPHB6 + + +
TRPV6 + + +
TRPV5 + + +
C7orf34 + + +
KEL + + +
PIP L L L
GSTK1 + + +
TMEM139 + + +
CASP2 + + +
CLCN1 + + +
FAM131B + + L
ZYX + + +
EPHA1 + + +
FAM115C + + +
ARHGEF5 + + +
NOBOX*
TPK1 + + +
CNTNAP2 H H L
CUL1 + + +
EZH2 L L L
PDIA4 + + +
ZNF786 + L L
ZNF425 + + +
ZNF398 + L +
ZNF282 + + +
ZNF212 + + +
ZNF783 + + +
ZNF777 + + +
ZNF746 + + +
ZNF767 + + +
KRBA1 + + +
ZNF467 + + +
SSPO + + +
ATP6V0E2 H H +
Gene Brain Spinal Cord Muscle
ACTR3C* L
LRRC61 + + +
RARRES2 L L L
REPIN1 + + +
ZNF775 + + +
GIMAP8 + + +
GIMAP7 + + +
GIMAP4 + + +
GIMAP6 + + +
GIMAP2 + + +
GIMAP1 + + +
GIMAP5 + + +
TMEM176B L L L
TMEM176A L L L
ABP1 L L L
KCNH2 + + +
NOS3 + + +
ATG9B + + +
ABCB8 + + +
ACCN3 + + +
CDK5 H + +
SLC4A2 + + +
FASTK + + +
TMUB1 + + +
AGAP3 + + +
GBX1 + + +
ASB10 + + +
ABCF2 + + +
CSGLCA-T + + +
SMARCD3 + + +
NUB1 + + +
WDR86 + H +
CRYGN* + - -
RHEB + + +
PRKAG2 + + +
GALNTL5 + + +
GALNT11 + + +
MLL3 + + +
CCT8L1 + + +
XRCC2 + + +
ACTR3B + + +
DPP6 H H +
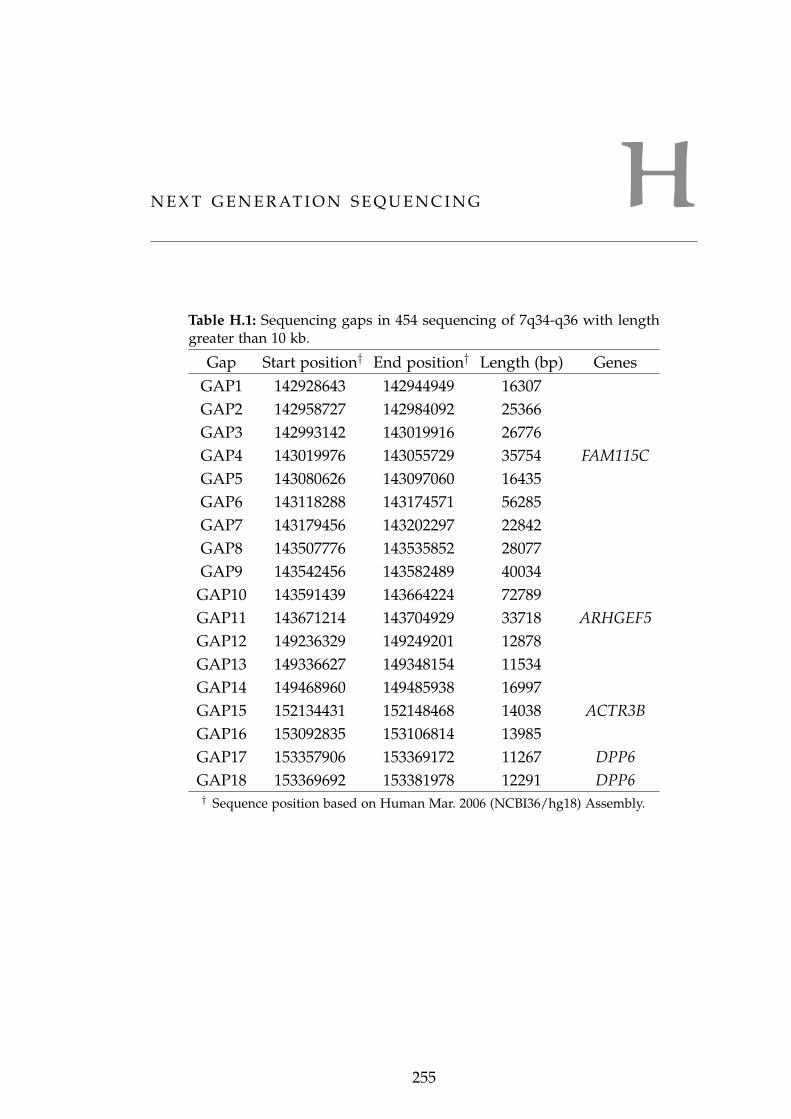
HN E X T G E N E R AT I O N S E Q U E N C I N G
Table H.1: Sequencing gaps in 454 sequencing of 7q34-q36 with lengthgreater than 10 kb.
Gap Start position† End position† Length (bp) GenesGAP1 142928643 142944949 16307GAP2 142958727 142984092 25366GAP3 142993142 143019916 26776GAP4 143019976 143055729 35754 FAM115CGAP5 143080626 143097060 16435GAP6 143118288 143174571 56285GAP7 143179456 143202297 22842GAP8 143507776 143535852 28077GAP9 143542456 143582489 40034
GAP10 143591439 143664224 72789GAP11 143671214 143704929 33718 ARHGEF5GAP12 149236329 149249201 12878GAP13 149336627 149348154 11534GAP14 149468960 149485938 16997GAP15 152134431 152148468 14038 ACTR3BGAP16 153092835 153106814 13985GAP17 153357906 153369172 11267 DPP6GAP18 153369692 153381978 12291 DPP6† Sequence position based on Human Mar. 2006 (NCBI36/hg18) Assembly.
255

h next generation sequencing 256
Table H.2: Analysis of novel variants within chromosomal translocations on 7q34-q36.Novel variants include six non-synonymous changes and three other novel variants
Identity† Chr. Strand Start End Ref. DNA SNP at position
MLL3:c.3611T>C100% 7 - 151548623 151548663 T
95.20% 1 - 147158243 147158283 C95.20% 2 + 91248287 91248327 G95.20% 13_rand - 177226 177266 C
MLL3:c.2689C>T100% 7 - 151563895 151563935 C100% 1 - 147142930 147142970 A/G rs58408284100% 2 + 91263559 91263599 G100% 13_rand - 163587 163627 G
97.60% 21 + 10048654 10048694 A/G rs58408284
MLL3:c.2674G>A100% 7 - 151563910 151563950 G
97.60% 1 - 147142915 147142955 C/T rs2838159 rs817533697.60% 2 + 91263574 91263614 C/T rs2838159 rs817533697.60% 13_rand - 163572 163612 G95.20% 21 + 10048669 10048709 C/T rs8175336
CCT8L1:c.483G>A100% 7 + 151773957 151773997 G
97.60% 22 - 15452938 15452978 T
CCT8L1:c.532A>G100% 7 + 151774006 151774046 A
95.20% 22 - 15452889 15452929 C
CCT8L1:c.579G>A100% 7 + 151774054 151774094 G
97.60% 22 - 15452841 15452881 T
CCT8L1:c.619A>G100% 7 + 151774093 151774133 A
95.20% 22 - 15452802 15452842 C
CCT8L1:c.626A>C100% 7 + 151774100 151774140 A
95.20% 22 - 15452795 15452835 G
CCT8L1:c.700G>A100% 7 + 151774175 151774215 G
97.60% 22 - 15452720 15452760 T† Identity indicates the variation of the sequence within 20bp in both directions around
reported variants.

IC N V I D E N T I F I E D W I T H A R R AY C G H
Table I.1: Gains and losses identified in control individual II:7 using aCGH. Start andend positions refer to the Human Mar. 2006 (NCBI36/hg18) assembly.
Chr. Start End
II:7 gains
chr7 141136570 141136707chr7 142281871 142282647chr7 148583077 148583362chr7 149208062 149208712chr7 153092228 153092495chr7 154022900 154027513II:7 losses
chr1 104250813 106105850chr3 117620757 119959839chr4 167486570 171501584chr6 122839696 126222259chr7 49342534 50068562chr7 77906667 79255842
Chr. Start End
chr7 112933761 114687270chr7 145426554 145427643chr7 147106328 147107617chr7 147703070 147707039chr7 148493747 148494200chr7 150677108 150677431chr7 151432571 151433370chr7 151728888 151747584chr9 92604082 93435806chr11 27545010 29000366chr11 38438080 39760781chr12 84625746 86284769chr18 30000311 31201020chr21 15899328 18942345
257

i cnv identified with array cgh 258
Table I.2: Gains and losses identified in affected individual III:9 using aCGH. Startand end positions refer to the Human Mar. 2006 (NCBI36/hg18) assembly.
Chr. Start End
Affected III:9 gains
chr7 141008522 141008827chr7 141136570 141136764chr7 141405649 141408015chr7 141411964 141433327chr7 141436298 141436906chr7 142368556 142369029chr7 142590983 142591379chr7 142926564 142928267chr7 143232340 143233967chr7 148583077 148583344chr7 148942734 148948626chr7 149208036 149208712chr7 150070208 150071040chr7 150469368 150472497chr7 151003440 151003796chr7 154021940 154027513chrX 133579511 134418254Affected III:9 losses
chr1 78301095 81843776chr1 104250813 106105850chr1 187316392 188037381chr2 109804744 111177875chr2 165516142 167081870chr2 218674727 219908166chr2 239631901 240609103chr3 37928555 38986892chr3 73618613 75126725chr3 76194026 81813307chr3 86019386 87778062chr3 171960773 176318840chr3 191707744 194848137chr4 11290241 17357044chr4 26907162 32192670chr4 124278703 124438026chr6 49926208 51776238chr6 78591356 80510744chr6 113488617 119933450
Chr. Start End
chr7 20398581 22826154chr7 87955968 88650701chr7 112933761 114687270chr7 118682103 122036934chr7 128353657 130376195chr7 141383232 141383755chr7 141452114 141452346chr7 141529779 141532054chr7 142705631 142707109chr7 143527056 143705101chr7 144547151 144552372chr7 145923012 145924645chr7 146642408 146643847chr7 148493747 148494215chr7 149504457 149506975chr7 150021169 150021774chr7 150677028 150677330chr7 151432885 151433370chr7 153572344 153576331chr8 28788076 30510657chr8 37782056 38480739chr8 115839571 118291267chr9 101609238 104005216chr9 121327018 122844496chr10 44219153 45339171chr10 87775822 89497316chr11 1405506 3601945chr12 73217711 74588154chr12 84625746 86284769chr13 106444209 109227022chr14 42637746 43884075chr14 79896757 83876603chr15 88803154 91002601chr18 22618645 26406470chr18 30000311 31201020chr18 46253735 48483432chr17 22200000 24170873chr21 15899328 18942345

i cnv identified with array cgh 259
Table I.3: Gains and losses identified in affected individual III:12 using aCGH. Startand end positions refer to the Human Mar. 2006 (NCBI36/hg18) assembly.
Chr. Start End
Affected III:12 gains
chr7 141076919 141077135chr7 141667108 141667973chr7 141691212 141712851chr7 142350806 142351891chr7 143232301 143233967chr7 143729164 143730031chr7 148583210 148583362chr7 148817533 148820960chr7 149207950 149208712chr7 149666004 149668696chr7 153092228 153092499chr7 154338103 154339800Affected III:2 losses
chr1 104250813 106105850chr2 33323057 35182721chr3 37928555 38986892chr3 144583097 147976445chr4 97035757 99272119chr5 117403380 118509111chr7 77906667 79255842chr7 112933761 114687270chr7 143527112 143582678
Chr. Start End
chr7 87955968 88650701chr7 143594780 143705101chr7 144546961 144552372chr7 144944021 144946260chr7 145532824 145533594chr7 146642327 146643847chr7 147703070 147707039chr7 148493747 148494215chr7 149504178 149506807chr7 151432885 151433370chr7 151511225 151515357chr7 151708944 151717257chr7 151728927 151747584chr7 154023876 154031412chr8 37782056 38480739chr8 111799647 114702528chr10 44219153 45339171chr11 38438080 39760781chr11 40954001 41584983chr12 73217711 74588154chr13 93112275 94079060chr14 42637746 43884075chr18 37521727 38182028

i cnv identified with array cgh 260
Table I.4: Gains and losses identified in affected individual II:1 using aCGH. Start andend positions refer to the Human Mar. 2006 (NCBI36/hg18) assembly.
Chr. Start End
Affected II:1 gains
chr7 141411964 141433443chr7 143729164 143730012chr7 148583210 148583362chr7 149207950 149208712chr7 149666004 149667659chr7 150065475 150065749chr7 153092228 153092495chr7 154022327 154029815chrX 22015874 23768392chrX 105779829 106404347chrX 115487962 116370306chrX 128122567 129811507chrX 133579511 134418254Affected II:1 losses
chr1 172119474 179297968chr1 181412375 186257480chr2 165516142 167081870chr3 37928555 38986892chr3 122740584 124718365chr4 90972361 93284435chr5 1597400 5644849chr6 49926208 51776238chr6 62601457 65114644chr6 78591356 80510744chr7 45237624 47001006chr7 112933761 114687270chr7 141452964 141453225chr7 141543684 141543981chr7 143527056 143582678
Chr. Start End
chr7 143594780 143705101chr7 144402282 144404560chr7 144546976 144552372chr7 144930202 144931073chr7 144944085 144945984chr7 146642408 146643847chr7 148136687 148137341chr7 148493747 148494215chr7 149503960 149505812chr7 150677108 150677330chr7 151432825 151433370chr7 151503095 151504259chr7 151597923 151620438chr7 151728927 151747193chr8 41597188 43507449chr8 101729326 106640189chr9 76586459 78615389chr10 44219153 45339171chr10 49721945 52447409chr10 110908377 111439564chr11 40954001 41584983chr12 84625746 86284769chr14 42637746 43884075chr14 57198571 58329722chr15 81026720 86249006chr15 88803154 91002601chr16 58191891 61617665chr18 22618645 26406470chr18 30000311 31201020chr18 37521727 38182028

B I B L I O G R A P H Y
[1] A.E. Harding. Inherited neuronal atrophy and degeneration predominantly of lower motor neurons. In P.J.Dyck, P.K. Thomas, J.W. Griffin, P.A. Low, and J.F. Poduslo, editors, Peripheral Neuropathy, pages 1051–1064.W.B. Saunders, Philadelphia, 3rd edition, 1993.
[2] O. V. Evgrafov, I. Mersiyanova, J. Irobi, L. Van Den Bosch, I. Dierick, C. L. Leung, O. Schagina, N. Verpoorten,K. Van Impe, V. Fedotov, E. Dadali, M. Auer-Grumbach, C. Windpassinger, K. Wagner, Z. Mitrovic, D. Hilton-Jones, K. Talbot, J. J. Martin, N. Vasserman, S. Tverskaya, A. Polyakov, R. K. Liem, J. Gettemans, W. Robberecht,P. De Jonghe, and V. Timmerman. Mutant small heat-shock protein 27 causes axonal Charcot-Marie-Toothdisease and distal hereditary motor neuropathy. Nat. Genet., 36:602–606, Jun 2004.
[3] J. Irobi, K. Van Impe, P. Seeman, A. Jordanova, I. Dierick, N. Verpoorten, A. Michalik, E. De Vriendt, A. Ja-cobs, V. Van Gerwen, K. Vennekens, R. Mazanec, I. Tournev, D. Hilton-Jones, K. Talbot, I. Kremensky, L. VanDen Bosch, W. Robberecht, J. Van Vandekerckhove, C. Van Broeckhoven, J. Gettemans, P. De Jonghe, andV. Timmerman. Hot-spot residue in small heat-shock protein 22 causes distal motor neuropathy. Nat. Genet.,36:597–601, Jun 2004.
[4] S. J. Kolb, P. J. Snyder, E. J. Poi, E. A. Renard, A. Bartlett, S. Gu, S. Sutton, W. D. Arnold, M. L. Freimer, V. H.Lawson, J. T. Kissel, and T. W. Prior. Mutant small heat shock protein B3 causes motor neuropathy: utility ofa candidate gene approach. Neurology, 74:502–506, Feb 2010.
[5] V. Timmerman, P. Raeymaekers, E. Nelis, P. De Jonghe, L. Muylle, C. Ceuterick, J. J. Martin, and C. Van Broeck-hoven. Linkage analysis of distal hereditary motor neuropathy type II (distal HMN II) in a single pedigree. J.Neurol. Sci., 109:41–48, May 1992.
[6] I. Dierick, J. Baets, J. Irobi, A. Jacobs, E. De Vriendt, T. Deconinck, L. Merlini, P. Van den Bergh, V. M. Rasic,W. Robberecht, D. Fischer, R. J. Morales, Z. Mitrovic, P. Seeman, R. Mazanec, A. Kochanski, A. Jordanova,M. Auer-Grumbach, A. T. Helderman-van den Enden, J. H. Wokke, E. Nelis, P. De Jonghe, and V. Timmerman.Relative contribution of mutations in genes for autosomal dominant distal hereditary motor neuropathies: agenotype-phenotype correlation study. Brain, 131:1217–1227, May 2008.
[7] K. W. Chung, S. B. Kim, S. Y. Cho, S. J. Hwang, S. W. Park, S. H. Kang, J. Kim, J. H. Yoo, and B. O. Choi. Distalhereditary motor neuropathy in Korean patients with a small heat shock protein 27 mutation. Exp. Mol. Med.,40:304–312, Jun 2008.
[8] B. Tang, X. Liu, G. Zhao, W. Luo, K. Xia, Q. Pan, F. Cai, Z. Hu, C. Zhang, B. Chen, F. Zhang, L. Shen, R. Zhang,and H. Jiang. Mutation analysis of the small heat shock protein 27 gene in chinese patients with Charcot-Marie-Tooth disease. Arch. Neurol., 62:1201–1207, Aug 2005.
[9] B. S. Tang, G. H. Zhao, W. Luo, K. Xia, F. Cai, Q. Pan, R. X. Zhang, F. F. Zhang, X. M. Liu, B. Chen, C. Zhang,L. Shen, H. Jiang, Z. G. Long, and H. P. Dai. Small heat-shock protein 22 mutated in autosomal dominantCharcot-Marie-Tooth disease type 2L. Hum. Genet., 116:222–224, Feb 2005.
[10] H. H. Kampinga, J. Hageman, M. J. Vos, H. Kubota, R. M. Tanguay, E. A. Bruford, M. E. Cheetham, B. Chen,and L. E. Hightower. Guidelines for the nomenclature of the human heat shock proteins. Cell Stress Chaperones,14:105–111, Jan 2009.
[11] G. Kappe, E. Franck, P. Verschuure, W. C. Boelens, J. A. Leunissen, and W. W. de Jong. The human genomeencodes 10 alpha-crystallin-related small heat shock proteins: HspB1-10. Cell Stress Chaperones, 8:53–61, 2003.
[12] S. Quraishe, A. Asuni, W. C. Boelens, V. O’Connor, and A. Wyttenbach. Expression of the small heat shockprotein family in the mouse CNS: differential anatomical and biochemical compartmentalization. Neuroscience,153:483–491, May 2008.
[13] P. Tallot, J. F. Grongnet, and J. C. David. Dual perinatal and developmental expression of the small heat shockproteins [FC12]aB-crystallin and Hsp27 in different tissues of the developing piglet. Biol. Neonate, 83:281–288,2003.
[14] P. Verschuure, C. Tatard, W. C. Boelens, J. F. Grongnet, and J. C. David. Expression of small heat shockproteins HspB2, HspB8, Hsp20 and cvHsp in different tissues of the perinatal developing pig. Eur. J. Cell Biol.,82:523–530, Oct 2003.
261

bibliography 262
[15] J. C. Plumier, D. A. Hopkins, H. A. Robertson, and R. W. Currie. Constitutive expression of the 27-kDa heatshock protein (Hsp27) in sensory and motor neurons of the rat nervous system. J. Comp. Neurol., 384:409–428,Aug 1997.
[16] R. Benndorf, X. Sun, R. R. Gilmont, K. J. Biederman, M. P. Molloy, C. W. Goodmurphy, H. Cheng, P. C.Andrews, and M. J. Welsh. HSP22, a new member of the small heat shock protein superfamily, interacts withmimic of phosphorylated HSP27 ((3D)HSP27). J. Biol. Chem., 276:26753–26761, Jul 2001.
[17] K. Kijima, C. Numakura, T. Goto, T. Takahashi, T. Otagiri, K. Umetsu, and K. Hayasaka. Small heat shockprotein 27 mutation in a Japanese patient with distal hereditary motor neuropathy. J. Hum. Genet., 50:473–476,2005.
[18] H. Houlden, M. Laura, F. Wavrant-De Vrieze, J. Blake, N. Wood, and M. M. Reilly. Mutations in the HSP27(HSPB1) gene cause dominant, recessive, and sporadic distal HMN/CMT type 2. Neurology, 71:1660–1668,Nov 2008.
[19] Y. Z. Chen, S. H. Hashemi, S. K. Anderson, Y. Huang, M. C. Moreira, D. R. Lynch, I. A. Glass, P. F. Chance, andC. L. Bennett. Senataxin, the yeast Sen1p orthologue: characterization of a unique protein in which recessivemutations cause ataxia and dominant mutations cause motor neuron disease. Neurobiol. Dis., 23:97–108, Jul2006.
[20] A. Antonellis and E. D. Green. The role of aminoacyl-tRNA synthetases in genetic diseases. Annu Rev GenomicsHum Genet, 9:87–107, 2008.
[21] M. Auer-Grumbach, A. Olschewski, L. Papi?, H. Kremer, M. E. McEntagart, S. Uhrig, C. Fischer, E. Frohlich,Z. Balint, B. Tang, H. Strohmaier, H. Lochmuller, B. Schlotter-Weigel, J. Senderek, A. Krebs, K. J. Dick, R. Petty,C. Longman, N. E. Anderson, G. W. Padberg, H. J. Schelhaas, C. M. van Ravenswaaij-Arts, T. R. Pieber, A. H.Crosby, and C. Guelly. Alterations in the ankyrin domain of TRPV4 cause congenital distal SMA, scapuloper-oneal SMA and HMSN2C. Nat. Genet., 42:160–164, Feb 2010.
[22] D. Rambaldi and F. D. Ciccarelli. FancyGene: dynamic visualization of gene structures and protein domainarchitectures on genomic loci. Bioinformatics, 25:2281–2282, Sep 2009.
[23] J. M. Fontaine, X. Sun, R. Benndorf, and M. J. Welsh. Interactions of HSP22 (HSPB8) with HSP20, alphaB-crystallin, and HSPB3. Biochem. Biophys. Res. Commun., 337:1006–1011, Nov 2005.
[24] A. A. Shemetov, A. S. Seit-Nebi, O. V. Bukach, and N. B. Gusev. Phosphorylation by cyclic AMP-dependentprotein kinase inhibits chaperone-like activity of human HSP22 in vitro. Biochemistry Mosc., 73:200–208, Feb2008.
[25] K. Kato, K. Hasegawa, S. Goto, and Y. Inaguma. Dissociation as a result of phosphorylation of an aggregatedform of the small stress protein, hsp27. J. Biol. Chem., 269:11274–11278, Apr 1994.
[26] L. Almeida-Souza, S. Goethals, V. de Winter, I. Dierick, R. Gallardo, J. Van Durme, J. Irobi, J. Gettemans,F. Rousseau, J. Schymkowitz, V. Timmerman, and S. Janssens. Increased monomerization of mutant HSPB1leads to protein hyperactivity in Charcot-Marie-Tooth neuropathy. J. Biol. Chem., 285:12778–12786, Apr 2010.
[27] D. Hayes, V. Napoli, A. Mazurkie, W. F. Stafford, and P. Graceffa. Phosphorylation dependence of hsp27multimeric size and molecular chaperone function. J. Biol. Chem., 284:18801–18807, Jul 2009.
[28] R. A. Stetler, Y. Gao, A. P. Signore, G. Cao, and J. Chen. HSP27: mechanisms of cellular protection againstneuronal injury. Curr. Mol. Med., 9:863–872, Sep 2009.
[29] P. Mehlen, A. Mehlen, J. Godet, and A. P. Arrigo. hsp27 as a switch between differentiation and apoptosis inmurine embryonic stem cells. J. Biol. Chem., 272:31657–31665, Dec 1997.
[30] R. Benndorf, K. Hayess, S. Ryazantsev, M. Wieske, J. Behlke, and G. Lutsch. Phosphorylation and supramolecu-lar organization of murine small heat shock protein HSP25 abolish its actin polymerization-inhibiting activity.J. Biol. Chem., 269:20780–20784, Aug 1994.
[31] A. P. Arrigo. The cellular "networking" of mammalian Hsp27 and its functions in the control of protein folding,redox state and apoptosis. Adv. Exp. Med. Biol., 594:14–26, 2007.
[32] Y. Chen, T. S. Voegeli, P. P. Liu, E. G. Noble, and R. W. Currie. Heat shock paradox and a new role of heatshock proteins and their receptors as anti-inflammation targets. Inflamm Allergy Drug Targets, 6:91–100, Jun2007.

bibliography 263
[33] K. S. Sinsimer, F. M. Gratacos, A. M. Knapinska, J. Lu, C. D. Krause, A. V. Wierzbowski, L. R. Maher,S. Scrudato, Y. M. Rivera, S. Gupta, D. K. Turrin, M. P. De La Cruz, S. Pestka, and G. Brewer. ChaperoneHsp27, a novel subunit of AUF1 protein complexes, functions in AU-rich element-mediated mRNA decay.Mol. Cell. Biol., 28:5223–5237, Sep 2008.
[34] C. A. Ross and M. A. Poirier. Protein aggregation and neurodegenerative disease. Nat. Med., 10 Suppl:S10–17,Jul 2004.
[35] S. Ackerley, P. A. James, A. Kalli, S. French, K. E. Davies, and K. Talbot. A mutation in the small heat-shockprotein HSPB1 leading to distal hereditary motor neuronopathy disrupts neurofilament assembly and theaxonal transport of specific cellular cargoes. Hum. Mol. Genet., 15:347–354, Jan 2006.
[36] I. V. Mersiyanova, A. V. Perepelov, A. V. Polyakov, V. F. Sitnikov, E. L. Dadali, R. B. Oparin, A. N. Petrin, andO. V. Evgrafov. A new variant of Charcot-Marie-Tooth disease type 2 is probably the result of a mutation inthe neurofilament-light gene. Am. J. Hum. Genet., 67:37–46, Jul 2000.
[37] G. M. Fabrizi, T. Cavallaro, C. Angiari, L. Bertolasi, I. Cabrini, M. Ferrarini, and N. Rizzuto. Giant axon andneurofilament accumulation in Charcot-Marie-Tooth disease type 2E. Neurology, 62:1429–1431, Apr 2004.
[38] J. Zhai, H. Lin, J. P. Julien, and W. W. Schlaepfer. Disruption of neurofilament network with aggregation oflight neurofilament protein: a common pathway leading to motor neuron degeneration due to Charcot-Marie-Tooth disease-linked mutations in NFL and HSPB1. Hum. Mol. Genet., 16:3103–3116, Dec 2007.
[39] J. Irobi, L. Almeida-Souza, B. Asselbergh, V. De Winter, S. Goethals, I. Dierick, J. Krishnan, J. P. Timmermans,W. Robberecht, P. De Jonghe, L. Van Den Bosch, S. Janssens, and V. Timmerman. Mutant HSPB8 causes motorneuron-specific neurite degeneration. Hum. Mol. Genet., 19:3254–3265, Aug 2010.
[40] M. Coleman. Axon degeneration mechanisms: commonality amid diversity. Nat. Rev. Neurosci., 6:889–898,Nov 2005.
[41] S. C. Benn, D. Perrelet, A. C. Kato, J. Scholz, I. Decosterd, R. J. Mannion, J. C. Bakowska, and C. J. Woolf.Hsp27 upregulation and phosphorylation is required for injured sensory and motor neuron survival. Neuron,36:45–56, Sep 2002.
[42] J. N. Lavoie, G. Gingras-Breton, R. M. Tanguay, and J. Landry. Induction of Chinese hamster HSP27 gene ex-pression in mouse cells confers resistance to heat shock. HSP27 stabilization of the microfilament organization.J. Biol. Chem., 268:3420–3429, Feb 1993.
[43] N. Mounier and A. P. Arrigo. Actin cytoskeleton and small heat shock proteins: how do they interact? CellStress Chaperones, 7:167–176, Apr 2002.
[44] B. M. Doshi, L. E. Hightower, and J. Lee. The role of Hsp27 and actin in the regulation of movement in humancancer cells responding to heat shock. Cell Stress Chaperones, 14:445–457, Sep 2009.
[45] G. Pigino, L.L. Kirkpatrick, and S.T. Brady. Cytoskeleton of Neurons and Glia. In G.J. Siegel, editor, Basicneurochemistry : molecular, cellular, and medical aspects, pages 123–138. Elsevier Academic, Toronto, 7th edition,2006.
[46] A. J. Macario and E. Conway de Macario. Chaperonopathies by defect, excess, or mistake. Ann. N. Y. Acad.Sci., 1113:178–191, Oct 2007.
[47] M. V. Kim, A. S. Kasakov, A. S. Seit-Nebi, S. B. Marston, and N. B. Gusev. Structure and properties of K141Emutant of small heat shock protein HSP22 (HspB8, H11) that is expressed in human neuromuscular disorders.Arch. Biochem. Biophys., 454:32–41, Oct 2006.
[48] M. Litt, P. Kramer, D. M. LaMorticella, W. Murphey, E. W. Lovrien, and R. G. Weleber. Autosomal dominantcongenital cataract associated with a missense mutation in the human alpha crystallin gene CRYAA. Hum.Mol. Genet., 7:471–474, Mar 1998.
[49] S. Bera, P. Thampi, W. J. Cho, and E. C. Abraham. A positive charge preservation at position 116 of alphaA-crystallin is critical for its structural and functional integrity. Biochemistry, 41:12421–12426, Oct 2002.
[50] D. Baumer, O. Ansorge, M. Almeida, and K. Talbot. The role of RNA processing in the pathogenesis of motorneuron degeneration. Expert Rev Mol Med, 12:e21, 2010.
[51] M. van Blitterswijk and J. E. Landers. RNA processing pathways in amyotrophic lateral sclerosis. Neurogenetics,11:275–290, Jul 2010.

bibliography 264
[52] X. Sun, J. M. Fontaine, A. D. Hoppe, S. Carra, C. DeGuzman, J. L. Martin, S. Simon, P. Vicart, M. J. Welsh,J. Landry, and R. Benndorf. Abnormal interaction of motor neuropathy-associated mutant HspB8 (Hsp22)forms with the RNA helicase Ddx20 (gemin3). Cell Stress Chaperones, 15:567–582, Sep 2010.
[53] S. Lefebvre, L. Burglen, S. Reboullet, O. Clermont, P. Burlet, L. Viollet, B. Benichou, C. Cruaud, P. Millasseau,and M. Zeviani. Identification and characterization of a spinal muscular atrophy-determining gene. Cell, 80:155–165, Jan 1995.
[54] S. Lefebvre, P. Burlet, Q. Liu, S. Bertrandy, O. Clermont, A. Munnich, G. Dreyfuss, and J. Melki. Correlationbetween severity and SMN protein level in spinal muscular atrophy. Nat. Genet., 16:265–269, Jul 1997.
[55] C. Soler-Botija, I. Cusco, L. Caselles, E. Lopez, M. Baiget, and E. F. Tizzano. Implication of fetal SMN2expression in type I SMA pathogenesis: protection or pathological gain of function? J. Neuropathol. Exp. Neurol.,64:215–223, Mar 2005.
[56] A. K. Gubitz, W. Feng, and G. Dreyfuss. The SMN complex. Exp. Cell Res., 296:51–56, May 2004.
[57] G. Meister, C. Eggert, and U. Fischer. SMN-mediated assembly of RNPs: a complex story. Trends Cell Biol., 12:472–478, Oct 2002.
[58] A. G. Todd, D. J. Shaw, R. Morse, H. Stebbings, and P. J. Young. SMN and the Gemin proteins form sub-complexes that localise to both stationary and dynamic neurite granules. Biochem. Biophys. Res. Commun., 394:211–216, Mar 2010.
[59] W. Rossoll, S. Jablonka, C. Andreassi, A. K. Kroning, K. Karle, U. R. Monani, and M. Sendtner. Smn, the spinalmuscular atrophy-determining gene product, modulates axon growth and localization of beta-actin mRNA ingrowth cones of motoneurons. J. Cell Biol., 163:801–812, Nov 2003.
[60] F. Gabanella, M. E. Butchbach, L. Saieva, C. Carissimi, A. H. Burghes, and L. Pellizzoni. Ribonucleoproteinassembly defects correlate with spinal muscular atrophy severity and preferentially affect a subset of spliceo-somal snRNPs. PLoS ONE, 2:e921, 2007.
[61] G. Laroia, R. Cuesta, G. Brewer, and R. J. Schneider. Control of mRNA decay by heat shock-ubiquitin-proteasome pathway. Science, 284:499–502, Apr 1999.
[62] G. Laroia, B. Sarkar, and R. J. Schneider. Ubiquitin-dependent mechanism regulates rapid turnover of AU-richcytokine mRNAs. Proc. Natl. Acad. Sci. U.S.A., 99:1842–1846, Feb 2002.
[63] I. Dierick, J. Irobi, S. Janssens, J. Theuns, R. Lemmens, A. Jacobs, E. Corsmit, N. Hersmus, L. Van Den Bosch,W. Robberecht, P. De Jonghe, C. Van Broeckhoven, and V. Timmerman. Genetic variant in the HSPB1 promoterregion impairs the HSP27 stress response. Hum. Mutat., 28:830, Aug 2007.
[64] I. Puls, C. Jonnakuty, B. H. LaMonte, E. L. Holzbaur, M. Tokito, E. Mann, M. K. Floeter, K. Bidus, D. Drayna,S. J. Oh, R. H. Brown, C. L. Ludlow, and K. H. Fischbeck. Mutant dynactin in motor neuron disease. Nat.Genet., 33:455–456, Apr 2003.
[65] C. Munch, R. Sedlmeier, T. Meyer, V. Homberg, A. D. Sperfeld, A. Kurt, J. Prudlo, G. Peraus, C. O. Hanemann,G. Stumm, and A. C. Ludolph. Point mutations of the p150 subunit of dynactin (DCTN1) gene in ALS.Neurology, 63:724–726, Aug 2004.
[66] C. Munch, A. Rosenbohm, A. D. Sperfeld, I. Uttner, S. Reske, B. J. Krause, R. Sedlmeier, T. Meyer, C. O.Hanemann, G. Stumm, and A. C. Ludolph. Heterozygous R1101K mutation of the DCTN1 gene in a familywith ALS and FTD. Ann. Neurol., 58:777–780, Nov 2005.
[67] C. Vilarino-Guell, C. Wider, A. I. Soto-Ortolaza, S. A. Cobb, J. M. Kachergus, B. H. Keeling, J. C. Dachsel,M. M. Hulihan, D. W. Dickson, Z. K. Wszolek, R. J. Uitti, N. R. Graff-Radford, B. F. Boeve, K. A. Josephs,B. Miller, K. B. Boylan, K. Gwinn, C. H. Adler, J. O. Aasly, F. Hentati, A. Destee, A. Krygowska-Wajs, M. C.Chartier-Harlin, O. A. Ross, R. Rademakers, and M. J. Farrer. Characterization of DCTN1 genetic variabilityin neurodegeneration. Neurology, 72:2024–2028, Jun 2009.
[68] T. A. Schroer. Dynactin. Annu. Rev. Cell Dev. Biol., 20:759–779, 2004.
[69] R. H. Melloni, M. K. Tokito, and E. L. Holzbaur. Expression of the p150Glued component of the dynactincomplex in developing and adult rat brain. J. Comp. Neurol., 357:15–24, Jun 1995.
[70] M. J. Farrer, M. M. Hulihan, J. M. Kachergus, J. C. Dachsel, A. J. Stoessl, L. L. Grantier, S. Calne, D. B. Calne,B. Lechevalier, F. Chapon, Y. Tsuboi, T. Yamada, L. Gutmann, B. Elibol, K. P. Bhatia, C. Wider, C. Vilarino-Guell,O. A. Ross, L. A. Brown, M. Castanedes-Casey, D. W. Dickson, and Z. K. Wszolek. DCTN1 mutations in Perrysyndrome. Nat. Genet., 41:163–165, Feb 2009.

bibliography 265
[71] J. R. Levy, C. J. Sumner, J. P. Caviston, M. K. Tokito, S. Ranganathan, L. A. Ligon, K. E. Wallace, B. H. LaMonte,G. G. Harmison, I. Puls, K. H. Fischbeck, and E. L. Holzbaur. A motor neuron disease-associated mutation inp150Glued perturbs dynactin function and induces protein aggregation. J. Cell Biol., 172:733–745, Feb 2006.
[72] B. H. LaMonte, K. E. Wallace, B. A. Holloway, S. S. Shelly, J. Ascano, M. Tokito, T. Van Winkle, D. S. Howland,and E. L. Holzbaur. Disruption of dynein/dynactin inhibits axonal transport in motor neurons causing late-onset progressive degeneration. Neuron, 34:715–727, May 2002.
[73] I. Puls, S. J. Oh, C. J. Sumner, K. E. Wallace, M. K. Floeter, E. A. Mann, W. R. Kennedy, G. Wendelschafer-Crabb,A. Vortmeyer, R. Powers, K. Finnegan, E. L. Holzbaur, K. H. Fischbeck, and C. L. Ludlow. Distal spinal andbulbar muscular atrophy caused by dynactin mutation. Ann. Neurol., 57:687–694, May 2005.
[74] J. K. Moore, D. Sept, and J. A. Cooper. Neurodegeneration mutations in dynactin impair dynein-dependentnuclear migration. Proc. Natl. Acad. Sci. U.S.A., 106:5147–5152, Mar 2009.
[75] S. Ahmed, S. Sun, A. E. Siglin, T. Polenova, and J. C. Williams. Disease-associated mutations in the p150(Glued)subunit destabilize the CAP-gly domain. Biochemistry, 49:5083–5085, Jun 2010.
[76] K. Grohmann, M. Schuelke, A. Diers, K. Hoffmann, B. Lucke, C. Adams, E. Bertini, H. Leonhardt-Horti,F. Muntoni, R. Ouvrier, A. Pfeufer, R. Rossi, L. Van Maldergem, J. M. Wilmshurst, T. F. Wienker, M. Sendtner,S. Rudnik-Schoneborn, K. Zerres, and C. Hubner. Mutations in the gene encoding immunoglobulin mu-binding protein 2 cause spinal muscular atrophy with respiratory distress type 1. Nat. Genet., 29:75–77, Sep2001.
[77] K. Grohmann, R. Varon, P. Stolz, M. Schuelke, C. Janetzki, E. Bertini, K. Bushby, F. Muntoni, R. Ouvrier,L. Van Maldergem, N. M. Goemans, H. Lochmuller, S. Eichholz, C. Adams, F. Bosch, P. Grattan-Smith,C. Navarro, H. Neitzel, T. Polster, H. Topaloglu, C. Steglich, U. P. Guenther, K. Zerres, S. Rudnik-Schoneborn,and C. Hubner. Infantile spinal muscular atrophy with respiratory distress type 1 (SMARD1). Ann. Neurol.,54:719–724, Dec 2003.
[78] M. Pitt, H. Houlden, J. Jacobs, Q. Mok, B. Harding, M. Reilly, and R. Surtees. Severe infantile neuropathy withdiaphragmatic weakness and its relationship to SMARD1. Brain, 126:2682–2692, Dec 2003.
[79] U. P. Guenther, M. Schuelke, E. Bertini, A. D’Amico, N. Goemans, K. Grohmann, C. Hubner, and R. Varon.Genomic rearrangements at the IGHMBP2 gene locus in two patients with SMARD1. Hum. Genet., 115:319–326,Sep 2004.
[80] I. Maystadt, M. Zarhrate, P. Landrieu, O. Boespflug-Tanguy, S. Sukno, P. Collignon, J. Melki, C. Verellen-Dumoulin, A. Munnich, and L. Viollet. Allelic heterogeneity of SMARD1 at the IGHMBP2 locus. Hum. Mutat.,23:525–526, May 2004.
[81] R. E. Appleton, C. Hubner, K. Grohmann, and R. Varon. ’Congenital peripheral neuropathy presenting asapnoea and respiratory insufficiency: spinal muscular atrophy with respiratory distress type 1 (SMARD1)’.Dev Med Child Neurol, 46:576, Aug 2004.
[82] A. Giannini, A. M. Pinto, G. Rossetti, E. Prandi, D. Tiziano, C. Brahe, and N. Nardocci. Respiratory failure ininfants due to spinal muscular atrophy with respiratory distress type 1. Intensive Care Med, 32:1851–1855, Nov2006.
[83] V. C. Wong, B. H. Chung, S. Li, W. Goh, and S. L. Lee. Mutation of gene in spinal muscular atrophy respiratorydistress type I. Pediatr. Neurol., 34:474–477, Jun 2006.
[84] U. P. Guenther, R. Varon, M. Schlicke, V. Dutrannoy, A. Volk, C. Hubner, K. von Au, and M. Schuelke. Clin-ical and mutational profile in spinal muscular atrophy with respiratory distress (SMARD): defining novelphenotypes through hierarchical cluster analysis. Hum. Mutat., 28:808–815, Aug 2007.
[85] U. P. Guenther, L. Handoko, R. Varon, U. Stephani, C. Y. Tsao, J. R. Mendell, S. Lutzkendorf, C. Hubner, K. vonAu, S. Jablonka, G. Dittmar, U. Heinemann, A. Schuetz, and M. Schuelke. Clinical variability in distal spinalmuscular atrophy type 1 (DSMA1): determination of steady-state IGHMBP2 protein levels in five patientswith infantile and juvenile disease. J. Mol. Med., 87:31–41, Jan 2009.
[86] V. Fanos, A. Cuccu, S. Nemolato, V. Marinelli, and G. Faa. A new nonsense mutation of the IGHMBP2 generesponsible for the first case of SMARD1 in a Sardinian patient with giant cell hepatitis. Neuropediatrics, 41:132–134, Jun 2010.
[87] A. Diers, M. Kaczinski, K. Grohmann, C. Hubner, and G. Stoltenburg-Didinger. The ultrastructure of pe-ripheral nerve, motor end-plate and skeletal muscle in patients suffering from spinal muscular atrophy withrespiratory distress type 1 (SMARD1). Acta Neuropathol., 110:289–297, Sep 2005.
bibliography 266
[88] A. M. Kaindl, U. P. Guenther, S. Rudnik-Schoneborn, R. Varon, K. Zerres, M. Schuelke, C. Hubner, and K. vonAu. Spinal muscular atrophy with respiratory distress type 1 (SMARD1). J. Child Neurol., 23:199–204, Feb2008.
[89] Y. Fukita, T. R. Mizuta, M. Shirozu, K. Ozawa, A. Shimizu, and T. Honjo. The human S mu bp-2, a DNA-binding protein specific to the single-stranded guanine-rich sequence related to the immunoglobulin muchain switch region. J. Biol. Chem., 268:17463–17470, Aug 1993.
[90] K. Grohmann, W. Rossoll, I. Kobsar, B. Holtmann, S. Jablonka, C. Wessig, G. Stoltenburg-Didinger, U. Fischer,C. Hubner, R. Martini, and M. Sendtner. Characterization of Ighmbp2 in motor neurons and implications forthe pathomechanism in a mouse model of human spinal muscular atrophy with respiratory distress type 1(SMARD1). Hum. Mol. Genet., 13:2031–2042, Sep 2004.
[91] A. E. Gorbalenyaa and E. V. Kooninb. Helicases: amino acid sequence comparisons and structure-functionrelationships. Curr. Opin. Struct. Biol., 3:419–429, June 1993.
[92] T. R. Mizuta, Y. Fukita, T. Miyoshi, A. Shimizu, and T. Honjo. Isolation of cDNA encoding a binding proteinspecific to 5’-phosphorylated single-stranded DNA with G-rich sequences. Nucleic Acids Res., 21:1761–1766,Apr 1993.
[93] J. E. Walker, M. Saraste, M. J. Runswick, and N. J. Gay. Distantly related sequences in the alpha- and beta-subunits of ATP synthase, myosin, kinases and other ATP-requiring enzymes and a common nucleotidebinding fold. EMBO J., 1:945–951, 1982.
[94] N. V. Grishin. The R3H motif: a domain that binds single-stranded nucleic acids. Trends Biochem. Sci., 23:329–330, Sep 1998.
[95] E. Liepinsh, A. Leonchiks, A. Sharipo, L. Guignard, and G. Otting. Solution structure of the R3H domain fromhuman Smubp-2. J. Mol. Biol., 326:217–223, Feb 2003.
[96] Y. Z. Chen, C. L. Bennett, H. M. Huynh, I. P. Blair, I. Puls, J. Irobi, I. Dierick, A. Abel, M. L. Kennerson,B. A. Rabin, G. A. Nicholson, M. Auer-Grumbach, K. Wagner, P. De Jonghe, J. W. Griffin, K. H. Fischbeck,V. Timmerman, D. R. Cornblath, and P. F. Chance. DNA/RNA helicase gene mutations in a form of juvenileamyotrophic lateral sclerosis (ALS4). Am. J. Hum. Genet., 74:1128–1135, Jun 2004.
[97] U. P. Guenther, L. Handoko, B. Laggerbauer, S. Jablonka, A. Chari, M. Alzheimer, J. Ohmer, O. Plottner,N. Gehring, A. Sickmann, K. von Au, M. Schuelke, and U. Fischer. IGHMBP2 is a ribosome-associated helicaseinactive in the neuromuscular disorder distal SMA type 1 (DSMA1). Hum. Mol. Genet., 18:1288–1300, Apr 2009.
[98] M. de Planell-Saguer, D. G. Schroeder, M. C. Rodicio, G. A. Cox, and Z. Mourelatos. Biochemical and geneticevidence for a role of IGHMBP2 in the translational machinery. Hum. Mol. Genet., 18:2115–2126, Jun 2009.
[99] M. Miao, S. L. Chan, G. L. Fletcher, and C. L. Hew. The rat ortholog of the presumptive flounder antifreezeenhancer-binding protein is a helicase domain-containing protein. Eur. J. Biochem., 267:7237–7246, Dec 2000.
[100] G. A. Cox, C. L. Mahaffey, and W. N. Frankel. Identification of the mouse neuromuscular degeneration geneand mapping of a second site suppressor allele. Neuron, 21:1327–1337, Dec 1998.
[101] T. P. Maddatu, S. M. Garvey, D. G. Schroeder, T. G. Hampton, and G. A. Cox. Transgenic rescue of neurogenicatrophy in the nmd mouse reveals a role for Ighmbp2 in dilated cardiomyopathy. Hum. Mol. Genet., 13:1105–1115, Jun 2004.
[102] P. De Jonghe, M. Auer-Grumbach, J. Irobi, K. Wagner, B. Plecko, M. Kennerson, D. Zhu, E. De Vriendt,V. Van Gerwen, G. Nicholson, H. P. Hartung, and V. Timmerman. Autosomal dominant juvenile amyotrophiclateral sclerosis and distal hereditary motor neuronopathy with pyramidal tract signs: synonyms for the samedisorder? Brain, 125:1320–1325, Jun 2002.
[103] S. Gopinath, I. P. Blair, M. L. Kennerson, J. C. Durnall, and G. A. Nicholson. A novel locus for distal motorneuron degeneration maps to chromosome 7q34-q36. Hum. Genet., 121:559–564, Jun 2007.
[104] M. C. Moreira, S. Klur, M. Watanabe, A. H. Nemeth, I. Le Ber, J. C. Moniz, C. Tranchant, P. Aubourg, M. Tazir,L. Schols, M. Pandolfo, J. B. Schulz, J. Pouget, P. Calvas, M. Shizuka-Ikeda, M. Shoji, M. Tanaka, L. Izatt, C. E.Shaw, A. M’Zahem, E. Dunne, P. Bomont, T. Benhassine, N. Bouslam, G. Stevanin, A. Brice, J. Guimaraes,P. Mendonca, C. Barbot, P. Coutinho, J. Sequeiros, A. Durr, J. M. Warter, and M. Koenig. Senataxin, theortholog of a yeast RNA helicase, is mutant in ataxia-ocular apraxia 2. Nat. Genet., 36:225–227, Mar 2004.
[105] A. Duquette, K. Roddier, J. McNabb-Baltar, I. Gosselin, A. St-Denis, M. J. Dicaire, L. Loisel, D. Labuda, L. Marc-hand, J. Mathieu, J. P. Bouchard, and B. Brais. Mutations in senataxin responsible for Quebec cluster of ataxiawith neuropathy. Ann. Neurol., 57:408–414, Mar 2005.

bibliography 267
[106] C. Criscuolo, L. Chessa, S. Di Giandomenico, P. Mancini, F. Sacca, G. S. Grieco, M. Piane, F. Barbieri,G. De Michele, S. Banfi, F. Pierelli, N. Rizzuto, F. M. Santorelli, L. Gallosti, A. Filla, and C. Casali. Ataxiawith oculomotor apraxia type 2: a clinical, pathologic, and genetic study. Neurology, 66:1207–1210, Apr 2006.
[107] T. Asaka, H. Yokoji, J. Ito, K. Yamaguchi, and A. Matsushima. Autosomal recessive ataxia with peripheralneuropathy and elevated AFP: novel mutations in SETX. Neurology, 66:1580–1581, May 2006.
[108] B. L. Fogel and S. Perlman. Novel mutations in the senataxin DNA/RNA helicase domain in ataxia withoculomotor apraxia 2. Neurology, 67:2083–2084, Dec 2006.
[109] A. Suraweera, O. J. Becherel, P. Chen, N. Rundle, R. Woods, J. Nakamura, M. Gatei, C. Criscuolo, A. Filla,L. Chessa, M. Fusser, B. Epe, N. Gueven, and M. F. Lavin. Senataxin, defective in ataxia oculomotor apraxiatype 2, is involved in the defense against oxidative DNA damage. J. Cell Biol., 177:969–979, Jun 2007.
[110] D. R. Lynch, C. D. Braastad, and N. Nagan. Ovarian failure in ataxia with oculomotor apraxia type 2. Am. J.Med. Genet. A, 143A:1775–1777, Aug 2007.
[111] M. Anheim, M. C. Fleury, J. Franques, M. C. Moreira, J. P. Delaunoy, D. Stoppa-Lyonnet, M. Koenig, andC. Tranchant. Clinical and molecular findings of ataxia with oculomotor apraxia type 2 in 4 families. Arch.Neurol., 65:958–962, Jul 2008.
[112] L. Arning, L. Schols, H. Cin, M. Souquet, J. T. Epplen, and D. Timmann. Identification and characterisationof a large senataxin (SETX) gene duplication in ataxia with ocular apraxia type 2 (AOA2). Neurogenetics, 9:295–299, Oct 2008.
[113] P. Nicolaou, A. Georghiou, C. Votsi, L. T. Middleton, E. Zamba-Papanicolaou, and K. Christodoulou. A novelc.5308_5311delGAGA mutation in Senataxin in a Cypriot family with an autosomal recessive cerebellar ataxia.BMC Med. Genet., 9:28, 2008.
[114] L. Schols, L. Arning, R. Schule, J. T. Epplen, and D. Timmann. "Pseudodominant inheritance" of ataxia withocular apraxia type 2 (AOA2). J. Neurol., 255:495–501, Apr 2008.
[115] M. Tazir, L. Ali-Pacha, A. M’Zahem, J. P. Delaunoy, M. Fritsch, S. Nouioua, T. Benhassine, S. Assami, D. Grid,J. M. Vallat, A. Hamri, and M. Koenig. Ataxia with oculomotor apraxia type 2: a clinical and genetic study of19 patients. J. Neurol. Sci., 278:77–81, Mar 2009.
[116] M. Anheim, B. Monga, M. Fleury, P. Charles, C. Barbot, M. Salih, J. P. Delaunoy, M. Fritsch, L. Arning, M. Syn-ofzik, L. Schols, J. Sequeiros, C. Goizet, C. Marelli, I. Le Ber, J. Koht, J. Gazulla, J. De Bleecker, M. Mukhtar,N. Drouot, L. Ali-Pacha, T. Benhassine, M. Chbicheb, A. M’Zahem, A. Hamri, B. Chabrol, J. Pouget, R. Murphy,M. Watanabe, P. Coutinho, M. Tazir, A. Durr, A. Brice, C. Tranchant, and M. Koenig. Ataxia with oculomotorapraxia type 2: clinical, biological and genotype/phenotype correlation study of a cohort of 90 patients. Brain,132:2688–2698, Oct 2009.
[117] G. Airoldi, A. Guidarelli, O. Cantoni, C. Panzeri, C. Vantaggiato, S. Bonato, M. Grazia D’Angelo, S. Falcone,C. De Palma, A. Tonelli, C. Crimella, S. Bondioni, N. Bresolin, E. Clementi, and M. T. Bassi. Characterizationof two novel SETX mutations in AOA2 patients reveals aspects of the pathophysiological role of senataxin.Neurogenetics, 11:91–100, Feb 2010.
[118] A. G. Bassuk, Y. Z. Chen, S. D. Batish, N. Nagan, P. Opal, P. F. Chance, and C. L. Bennett. In cis autosomaldominant mutation of Senataxin associated with tremor/ataxia syndrome. Neurogenetics, 8:45–49, Jan 2007.
[119] H. D. Kim, J. Choe, and Y. S. Seo. The sen1(+) gene of Schizosaccharomyces pombe, a homologue of buddingyeast SEN1, encodes an RNA and DNA helicase. Biochemistry, 38:14697–14710, Nov 1999.
[120] A. Suraweera, Y. Lim, R. Woods, G. W. Birrell, T. Nasim, O. J. Becherel, and M. F. Lavin. Functional role forsenataxin, defective in ataxia oculomotor apraxia type 2, in transcriptional regulation. Hum. Mol. Genet., 18:3384–3396, Sep 2009.
[121] D. Ursic, K. L. Himmel, K. A. Gurley, F. Webb, and M. R. Culbertson. The yeast SEN1 gene is required for theprocessing of diverse RNA classes. Nucleic Acids Res., 25:4778–4785, Dec 1997.
[122] M. Winey and M. R. Culbertson. Mutations affecting the tRNA-splicing endonuclease activity of Saccha-romyces cerevisiae. Genetics, 118:609–617, Apr 1988.
[123] T. P. Rasmussen and M. R. Culbertson. The putative nucleic acid helicase Sen1p is required for formation andstability of termini and for maximal rates of synthesis and levels of accumulation of small nucleolar RNAs inSaccharomyces cerevisiae. Mol. Cell. Biol., 18:6885–6896, Dec 1998.
bibliography 268
[124] D. Ursic, K. Chinchilla, J. S. Finkel, and M. R. Culbertson. Multiple protein/protein and protein/RNA inter-actions suggest roles for yeast DNA/RNA helicase Sen1p in transcription, transcription-coupled DNA repairand RNA processing. Nucleic Acids Res., 32:2441–2452, 2004.
[125] E. J. Steinmetz, C. L. Warren, J. N. Kuehner, B. Panbehi, A. Z. Ansari, and D. A. Brow. Genome-wide distribu-tion of yeast RNA polymerase II and its control by Sen1 helicase. Mol. Cell, 24:735–746, Dec 2006.
[126] A. Antonellis, R. E. Ellsworth, N. Sambuughin, I. Puls, A. Abel, S. Q. Lee-Lin, A. Jordanova, I. Kremensky,K. Christodoulou, L. T. Middleton, K. Sivakumar, V. Ionasescu, B. Funalot, J. M. Vance, L. G. Goldfarb, K. H.Fischbeck, and E. D. Green. Glycyl tRNA synthetase mutations in Charcot-Marie-Tooth disease type 2D anddistal spinal muscular atrophy type V. Am. J. Hum. Genet., 72:1293–1299, May 2003.
[127] K. Sivakumar, T. Kyriakides, I. Puls, G. A. Nicholson, B. Funalot, A. Antonellis, N. Sambuughin,K. Christodoulou, J. L. Beggs, E. Zamba-Papanicolaou, V. Ionasescu, M. C. Dalakas, E. D. Green, K. H. Fis-chbeck, and L. G. Goldfarb. Phenotypic spectrum of disorders associated with glycyl-tRNA synthetase muta-tions. Brain, 128:2304–2314, Oct 2005.
[128] R. Del Bo, F. Locatelli, S. Corti, M. Scarlato, S. Ghezzi, A. Prelle, G. Fagiolari, M. Moggio, M. Carpo, N. Bresolin,and G. P. Comi. Coexistence of CMT-2D and distal SMA-V phenotypes in an Italian family with a GARS genemutation. Neurology, 66:752–754, Mar 2006.
[129] O. Dubourg, H. Azzedine, R. B. Yaou, J. Pouget, A. Barois, V. Meininger, D. Bouteiller, M. Ruberg, A. Brice,and E. LeGuern. The G526R glycyl-tRNA synthetase gene mutation in distal hereditary motor neuropathytype V. Neurology, 66:1721–1726, Jun 2006.
[130] A. Hamaguchi, C. Ishida, K. Iwasa, A. Abe, and M. Yamada. Charcot-Marie-Tooth disease type 2D with anovel glycyl-tRNA synthetase gene (GARS) mutation. J. Neurol., 257:1202–1204, Jul 2010.
[131] A. Abe and K. Hayasaka. The GARS gene is rarely mutated in Japanese patients with Charcot-Marie-Toothneuropathy. J. Hum. Genet., 54:310–312, May 2009.
[132] P. A. James, M. Z. Cader, F. Muntoni, A. M. Childs, Y. J. Crow, and K. Talbot. Severe childhood SMA andaxonal CMT due to anticodon binding domain mutations in the GARS gene. Neurology, 67:1710–1712, Nov2006.
[133] B. Rohkamm, M. M. Reilly, H. Lochmuller, B. Schlotter-Weigel, N. Barisic, L. Schols, G. Nicholson, D. Pareyson,M. Laura, A. R. Janecke, G. Miltenberger-Miltenyi, E. John, C. Fischer, F. Grill, W. Wakeling, M. Davis, T. R.Pieber, and M. Auer-Grumbach. Further evidence for genetic heterogeneity of distal HMN type V, CMT2 withpredominant hand involvement and Silver syndrome. J. Neurol. Sci., 263:100–106, Dec 2007.
[134] K. L. Seburn, L. A. Nangle, G. A. Cox, P. Schimmel, and R. W. Burgess. An active dominant mutation ofglycyl-tRNA synthetase causes neuropathy in a Charcot-Marie-Tooth 2D mouse model. Neuron, 51(6):715–726,Sep 2006.
[135] W. W. Motley, K. L. Seburn, M. H. Nawaz, K. E. Miers, J. Cheng, A. Antonellis, E. D. Green, K. Talbot, X. L.Yang, K. H. Fischbeck, and R. W. Burgess. Charcot-Marie-Tooth-linked mutant GARS is toxic to peripheralneurons independent of wild-type GARS levels. PLoS Genet., 7(12):e1002399, Dec 2011.
[136] M. Delarue. Aminoacyl-tRNA synthetases. Curr. Opin. Struct. Biol., 5:48–55, Feb 1995.
[137] Q. Ge, E. P. Trieu, and I. N. Targoff. Primary structure and functional expression of human Glycyl-tRNAsynthetase, an autoantigen in myositis. J. Biol. Chem., 269:28790–28797, Nov 1994.
[138] W. W. Motley, K. Talbot, and K. H. Fischbeck. GARS axonopathy: not every neuron’s cup of tRNA. TrendsNeurosci., 33:59–66, Feb 2010.
[139] P. Latour, C. Thauvin-Robinet, C. Baudelet-Mery, P. Soichot, V. Cusin, L. Faivre, M. C. Locatelli, M. Mayen-con, A. Sarcey, E. Broussolle, W. Camu, A. David, and R. Rousson. A major determinant for binding andaminoacylation of tRNA(Ala) in cytoplasmic Alanyl-tRNA synthetase is mutated in dominant axonal Charcot-Marie-Tooth disease. Am. J. Hum. Genet., 86:77–82, Jan 2010.
[140] H. M. McLaughlin, R. Sakaguchi, C. Liu, T. Igarashi, D. Pehlivan, K. Chu, R. Iyer, P. Cruz, P. F. Cherukuri,N. F. Hansen, J. C. Mullikin, L. G. Biesecker, T. E. Wilson, V. Ionasescu, G. Nicholson, C. Searby, K. Talbot,J. M. Vance, S. Zuchner, K. Szigeti, J. R. Lupski, Y. M. Hou, E. D. Green, and A. Antonellis. Compoundheterozygosity for loss-of-function lysyl-tRNA synthetase mutations in a patient with peripheral neuropathy.Am. J. Hum. Genet., 87:560–566, Oct 2010.
bibliography 269
[141] A. Jordanova, J. Irobi, F. P. Thomas, P. Van Dijck, K. Meerschaert, M. Dewil, I. Dierick, A. Jacobs, E. De Vriendt,V. Guergueltcheva, C. V. Rao, I. Tournev, F. A. Gondim, M. D’Hooghe, V. Van Gerwen, P. Callaerts, L. VanDen Bosch, J. P. Timmermans, W. Robberecht, J. Gettemans, J. M. Thevelein, P. De Jonghe, I. Kremensky, andV. Timmerman. Disrupted function and axonal distribution of mutant tyrosyl-tRNA synthetase in dominantintermediate Charcot-Marie-Tooth neuropathy. Nat. Genet., 38:197–202, Feb 2006.
[142] C. Windpassinger, M. Auer-Grumbach, J. Irobi, H. Patel, E. Petek, G. Horl, R. Malli, J. A. Reed, I. Dierick,N. Verpoorten, T. T. Warner, C. Proukakis, P. Van den Bergh, C. Verellen, L. Van Maldergem, L. Merlini,P. De Jonghe, V. Timmerman, A. H. Crosby, and K. Wagner. Heterozygous missense mutations in BSCL2 areassociated with distal hereditary motor neuropathy and Silver syndrome. Nat. Genet., 36:271–276, Mar 2004.
[143] M. Auer-Grumbach, B. Schlotter-Weigel, H. Lochmuller, G. Strobl-Wildemann, P. Auer-Grumbach, R. Fischer,H. Offenbacher, E. B. Zwick, T. Robl, G. Hartl, H. P. Hartung, K. Wagner, and C. Windpassinger. Phenotypesof the N88S Berardinelli-Seip congenital lipodystrophy 2 mutation. Ann. Neurol., 57:415–424, Mar 2005.
[144] J. Irobi, P. Van den Bergh, L. Merlini, C. Verellen, L. Van Maldergem, I. Dierick, N. Verpoorten, A. Jor-danova, C. Windpassinger, E. De Vriendt, V. Van Gerwen, M. Auer-Grumbach, K. Wagner, V. Timmerman,and P. De Jonghe. The phenotype of motor neuropathies associated with BSCL2 mutations is broader thanSilver syndrome and distal HMN type V. Brain, 127:2124–2130, Sep 2004.
[145] B. P. van de Warrenburg, H. Scheffer, J. J. van Eijk, M. H. Versteeg, H. Kremer, M. J. Zwarts, H. J. Schelhaas,and B. G. van Engelen. BSCL2 mutations in two Dutch families with overlapping Silver syndrome-distalhereditary motor neuropathy. Neuromuscul. Disord., 16:122–125, Feb 2006.
[146] E. Brusse, D. Majoor-Krakauer, B. M. de Graaf, G. H. Visser, S. Swagemakers, A. J. Boon, B. A. Oostra, andA. M. Bertoli-Avella. A novel 16p locus associated with BSCL2 hereditary motor neuronopathy: a geneticmodifier? Neurogenetics, 10:289–297, Oct 2009.
[147] J. Magre, M. Delepine, E. Khallouf, T. Gedde-Dahl, L. Van Maldergem, E. Sobel, J. Papp, M. Meier, A. Megar-bane, A. Bachy, A. Verloes, F. H. d’Abronzo, E. Seemanova, R. Assan, N. Baudic, C. Bourut, P. Czernichow,F. Huet, F. Grigorescu, M. de Kerdanet, D. Lacombe, P. Labrune, M. Lanza, H. Loret, F. Matsuda, J. Navarro,A. Nivelon-Chevalier, M. Polak, J. J. Robert, P. Tric, N. Tubiana-Rufi, C. Vigouroux, J. Weissenbach, S. Savasta,J. A. Maassen, O. Trygstad, P. Bogalho, P. Freitas, J. L. Medina, F. Bonnicci, B. I. Joffe, G. Loyson, V. R. Panz,F. J. Raal, S. O’Rahilly, T. Stephenson, C. R. Kahn, M. Lathrop, and J. Capeau. Identification of the gene alteredin Berardinelli-Seip congenital lipodystrophy on chromosome 11q13. Nat. Genet., 28:365–370, Aug 2001.
[148] D. Ito, T. Fujisawa, H. Iida, and N. Suzuki. Characterization of seipin/BSCL2, a protein associated with spasticparaplegia 17. Neurobiol. Dis., 31:266–277, Aug 2008.
[149] W. Fei, G. Shui, B. Gaeta, X. Du, L. Kuerschner, P. Li, A. J. Brown, M. R. Wenk, R. G. Parton, and H. Yang.Fld1p, a functional homologue of human seipin, regulates the size of lipid droplets in yeast. J. Cell Biol., 180:473–482, Feb 2008.
[150] C. Lundin, R. Nordstrom, K. Wagner, C. Windpassinger, H. Andersson, G. von Heijne, and I. Nilsson. Mem-brane topology of the human seipin protein. FEBS Lett., 580:2281–2284, Apr 2006.
[151] D. Ito and N. Suzuki. Molecular pathogenesis of seipin/BSCL2-related motor neuron diseases. Ann. Neurol.,61:237–250, Mar 2007.
[152] D. Ito and N. Suzuki. Seipinopathy: a novel endoplasmic reticulum stress-associated disease. Brain, 132:8–15,Jan 2009.
[153] M. L. Kennerson, G. A. Nicholson, S. G. Kaler, B. Kowalski, J. F. Mercer, J. Tang, R. M. Llanos, S. Chu, R. I.Takata, C. E. Speck-Martins, J. Baets, L. Almeida-Souza, D. Fischer, V. Timmerman, P. E. Taylor, S. S. Scherer,T. A. Ferguson, T. D. Bird, P. De Jonghe, S. M. Feely, M. E. Shy, and J. Y. Garbern. Missense mutations in thecopper transporter gene ATP7A cause X-linked distal hereditary motor neuropathy. Am. J. Hum. Genet., 86:343–352, Mar 2010.
[154] R. I. Takata, C. E. Speck Martins, M. R. Passosbueno, K. T. Abe, A. L. Nishimura, M. D. Da Silva, A. Monteiro,M. I. Lima, F. Kok, and M. Zatz. A new locus for recessive distal spinal muscular atrophy at Xq13.1-q21. J.Med. Genet., 41:224–229, Mar 2004.
[155] M. Kennerson, G. Nicholson, B. Kowalski, K. Krajewski, D. El-Khechen, S. Feely, S. Chu, M. Shy, and J. Garbern.X-linked distal hereditary motor neuropathy maps to the DSMAX locus on chromosome Xq13.1-q21. Neurology,72:246–252, Jan 2009.
[156] C. C. Weihl and G. Lopate. Motor neuron disease associated with copper deficiency. Muscle Nerve, 34:789–793,Dec 2006.

bibliography 270
[157] C. Vulpe, B. Levinson, S. Whitney, S. Packman, and J. Gitschier. Isolation of a candidate gene for Menkesdisease and evidence that it encodes a copper-transporting ATPase. Nat. Genet., 3:7–13, Jan 1993.
[158] J. F. Mercer, J. Livingston, B. Hall, J. A. Paynter, C. Begy, S. Chandrasekharappa, P. Lockhart, A. Grimes,M. Bhave, and D. Siemieniak. Isolation of a partial candidate gene for Menkes disease by positional cloning.Nat. Genet., 3:20–25, Jan 1993.
[159] J. Chelly, Z. Tumer, T. Tonnesen, A. Petterson, Y. Ishikawa-Brush, N. Tommerup, N. Horn, and A. P. Monaco.Isolation of a candidate gene for Menkes disease that encodes a potential heavy metal binding protein. Nat.Genet., 3:14–19, Jan 1993.
[160] S. G. Kaler, L. K. Gallo, V. K. Proud, A. K. Percy, Y. Mark, N. A. Segal, D. S. Goldstein, C. S. Holmes, and W. A.Gahl. Occipital horn syndrome and a mild Menkes phenotype associated with splice site mutations at theMNK locus. Nat. Genet., 8:195–202, Oct 1994.
[161] I. Maystadt, M. Zarhrate, D. Leclair-Richard, B. Estournet, A. Barois, F. Renault, M. C. Routon, M. C. Durand,S. Lefebvre, A. Munnich, C. Verellen-Dumoulin, and L. Viollet. A gene for an autosomal recessive lower motorneuron disease with childhood onset maps to 1p36. Neurology, 67:120–124, Jul 2006.
[162] I. Maystadt, R. Rezsohazy, M. Barkats, S. Duque, P. Vannuffel, S. Remacle, B. Lambert, M. Najimi, E. Sokal,A. Munnich, L. Viollet, and C. Verellen-Dumoulin. The nuclear factor kappaB-activator gene PLEKHG5 ismutated in a form of autosomal recessive lower motor neuron disease with childhood onset. Am. J. Hum.Genet., 81:67–76, Jul 2007.
[163] M. De Toledo, V. Coulon, S. Schmidt, P. Fort, and A. Blangy. The gene for a new brain specific RhoA exchangefactor maps to the highly unstable chromosomal region 1p36.2-1p36.3. Oncogene, 20:7307–7317, Nov 2001.
[164] A. Matsuda, Y. Suzuki, G. Honda, S. Muramatsu, O. Matsuzaki, Y. Nagano, T. Doi, K. Shimotohno, T. Harada,E. Nishida, H. Hayashi, and S. Sugano. Large-scale identification and characterization of human genes thatactivate NF-kappaB and MAPK signaling pathways. Oncogene, 22:3307–3318, May 2003.
[165] S. W. Barger, A. M. Moerman, and X. Mao. Molecular mechanisms of cytokine-induced neuroprotection:NFkappaB and neuroplasticity. Curr. Pharm. Des., 11:985–998, 2005.
[166] G. Landoure, A. A. Zdebik, T. L. Martinez, B. G. Burnett, H. C. Stanescu, H. Inada, Y. Shi, A. A. Taye, L. Kong,C. H. Munns, S. S. Choo, C. B. Phelps, R. Paudel, H. Houlden, C. L. Ludlow, M. J. Caterina, R. Gaudet,R. Kleta, K. H. Fischbeck, and C. J. Sumner. Mutations in TRPV4 cause Charcot-Marie-Tooth disease type 2C.Nat. Genet., 42:170–174, Feb 2010.
[167] H. X. Deng, C. J. Klein, J. Yan, Y. Shi, Y. Wu, F. Fecto, H. J. Yau, Y. Yang, H. Zhai, N. Siddique, E. T. Hedley-Whyte, R. Delong, M. Martina, P. J. Dyck, and T. Siddique. Scapuloperoneal spinal muscular atrophy andCMT2C are allelic disorders caused by alterations in TRPV4. Nat. Genet., 42:165–169, Feb 2010.
[168] B. Nilius and G. Owsianik. Channelopathies converge on TRPV4. Nat. Genet., 42:98–100, Feb 2010.
[169] P. Fleury and G. Hageman. A dominantly inherited lower motor neuron disorder presenting at birth withassociated arthrogryposis. J. Neurol. Neurosurg. Psychiatr., 48:1037–1048, Oct 1985.
[170] A. J. van der Vleuten, C. M. van Ravenswaaij-Arts, C. J. Frijns, A. P. Smits, G. Hageman, G. W. Padberg,and H. Kremer. Localisation of the gene for a dominant congenital spinal muscular atrophy predominantlyaffecting the lower limbs to chromosome 12q23-q24. Eur. J. Hum. Genet., 6:376–382, 1998.
[171] G. Owsianik, D. D’hoedt, T. Voets, and B. Nilius. Structure-function relationship of the TRP channel super-family. Rev. Physiol. Biochem. Pharmacol., 156:61–90, 2006.
[172] M. B. Harms, K. M. Ori-McKenney, M. Scoto, E. P. Tuck, S. Bell, D. Ma, S. Masi, P. Allred, M. Al-Lozi, M. M.Reilly, L. J. Miller, A. Jani-Acsadi, A. Pestronk, M. E. Shy, F. Muntoni, R. B. Vallee, and R. H. Baloh. Mutationsin the tail domain of DYNC1H1 cause dominant spinal muscular atrophy. Neurology, Mar 2012.
[173] M. N. Weedon, R. Hastings, R. Caswell, W. Xie, K. Paszkiewicz, T. Antoniadi, M. Williams, C. King, L. Green-halgh, R. Newbury-Ecob, and S. Ellard. Exome sequencing identifies a DYNC1H1 mutation in a large pedigreewith dominant axonal Charcot-Marie-Tooth disease. Am. J. Hum. Genet., 89(2):308–312, Aug 2011.
[174] M. Hafezparast, R. Klocke, C. Ruhrberg, A. Marquardt, A. Ahmad-Annuar, S. Bowen, G. Lalli, A. S. With-erden, H. Hummerich, S. Nicholson, P. J. Morgan, R. Oozageer, J. V. Priestley, S. Averill, V. R. King, S. Ball,J. Peters, T. Toda, A. Yamamoto, Y. Hiraoka, M. Augustin, D. Korthaus, S. Wattler, P. Wabnitz, C. Dickneite,S. Lampel, F. Boehme, G. Peraus, A. Popp, M. Rudelius, J. Schlegel, H. Fuchs, M. Hrabe de Angelis, G. Schiavo,D. T. Shima, A. P. Russ, G. Stumm, J. E. Martin, and E. M. Fisher. Mutations in dynein link motor neurondegeneration to defects in retrograde transport. Science, 300(5620):808–812, May 2003.

bibliography 271
[175] X. J. Chen, E. N. Levedakou, K. J. Millen, R. L. Wollmann, B. Soliven, and B. Popko. Proprioceptive sensoryneuropathy in mice with a mutation in the cytoplasmic Dynein heavy chain 1 gene. J. Neurosci., 27(52):14515–14524, Dec 2007.
[176] L. Viollet, A. Barois, J. G. Rebeiz, Z. Rifai, P. Burlet, M. Zarhrate, E. Vial, M. Dessainte, B. Estournet,B. Kleinknecht, J. Pearn, R. D. Adams, J. A. Urtizberea, D. P. Cros, K. Bushby, A. Munnich, and S. Lefeb-vre. Mapping of autosomal recessive chronic distal spinal muscular atrophy to chromosome 11q13. Ann.Neurol., 51:585–592, May 2002.
[177] L. Viollet, M. Zarhrate, I. Maystadt, B. Estournet-Mathiaut, A. Barois, I. Desguerre, M. Mayer, B. Chabrol,B. LeHeup, V. Cusin, T. Billette De Villemeur, D. Bonneau, P. Saugier-Veber, A. Touzery-De Villepin, A. De-laubier, J. Kaplan, M. Jeanpierre, J. Feingold, and A. Munnich. Refined genetic mapping of autosomal recessivechronic distal spinal muscular atrophy to chromosome 11q13.3 and evidence of linkage disequilibrium in Eu-ropean families. Eur. J. Hum. Genet., 12:483–488, Jun 2004.
[178] M. McEntagart, N. Norton, H. Williams, M. D. Teare, M. Dunstan, P. Baker, H. Houlden, M. Reilly, N. Wood,P. S. Harper, P. A. Futreal, N. Williams, and N. Rahman. Localization of the gene for distal hereditary motorneuronopathy VII (dHMN-VII) to chromosome 2q14. Am. J. Hum. Genet., 68:1270–1276, May 2001.
[179] S. Reddel, R. A. Ouvrier, G. Nicholson, I. Dierick, J. Irobi, V. Timmerman, and M. M. Ryan. Autosomaldominant congenital spinal muscular atrophy–a possible developmental deficiency of motor neurones? Neu-romuscul. Disord., 18:530–535, Jul 2008.
[180] C. J. Frijns, J. Van Deutekom, R. R. Frants, and F. G. Jennekens. Dominant congenital benign spinal muscularatrophy. Muscle Nerve, 17:192–197, Feb 1994.
[181] M. Muglia, A. Magariello, L. Citrigno, L. Passamonti, T. Sprovieri, F. L. Conforti, R. Mazzei, A. Patitucci, A. L.Gabriele, C. Ungaro, M. Bellesi, and A. Quattrone. A novel locus for dHMN with pyramidal features maps tochromosome 4q34.3-q35.2. Clin. Genet., 73:486–491, May 2008.
[182] K. Christodoulou, E. Zamba, M. Tsingis, A. Mubaidin, K. Horani, S. Abu-Sheik, M. El-Khateeb, K. Kyriacou,T. Kyriakides, A. K. Al-Qudah, and L. Middleton. A novel form of distal hereditary motor neuronopathymaps to chromosome 9p21.1-p12. Ann. Neurol., 48:877–884, Dec 2000.
[183] L. T. Middleton, K. Christodoulou, A. Mubaidin, E. Zamba, M. Tsingis, K. Kyriacou, S. Abu-Sheikh, T. Kyri-akides, V. Neocleous, D. M. Georgiou, M. el Khateeb, A. al Qudah, and K. Horany. Distal hereditary motorneuronopathy of the Jerash type. Ann. N. Y. Acad. Sci., 883:65–68, Sep 1999.
[184] J. Irobi, I. Dierick, A. Jordanova, K. G. Claeys, P. De Jonghe, and V. Timmerman. Unraveling the genetics ofdistal hereditary motor neuronopathies. Neuromolecular Med., 8:131–146, 2006.
[185] G. Nicholson, M. Kennerson, M. Brewer, J. Garbern, and M. Shy. Genotypes & sensory phenotypes in 2 newX-linked neuropathies (CMTX3 and dSMAX) and dominant CMT/HMN overlap syndromes. Adv. Exp. Med.Biol., 652:201–206, 2009.
[186] I. Cusco, M. J. Barcelo, R. Rojas-Garcia, I. Illa, J. Gamez, C. Cervera, A. Pou, G. Izquierdo, M. Baiget, andE. F. Tizzano. SMN2 copy number predicts acute or chronic spinal muscular atrophy but does not account forintrafamilial variability in siblings. J. Neurol., 253(1):21–25, Jan 2006.
[187] D. D. Coovert, T. T. Le, P. E. McAndrew, J. Strasswimmer, T. O. Crawford, J. R. Mendell, S. E. Coulson, E. J.Androphy, T. W. Prior, and A. H. Burghes. The survival motor neuron protein in spinal muscular atrophy.Hum. Mol. Genet., 6:1205–1214, Aug 1997.
[188] G. E. Oprea, S. Krober, M. L. McWhorter, W. Rossoll, S. Muller, M. Krawczak, G. J. Bassell, C. E. Beattie, andB. Wirth. Plastin 3 is a protective modifier of autosomal recessive spinal muscular atrophy. Science, 320(5875):524–527, Apr 2008.
[189] N. Roy, M. S. Mahadevan, M. McLean, G. Shutler, Z. Yaraghi, R. Farahani, S. Baird, A. Besner-Johnston,C. Lefebvre, and X. Kang. The gene for neuronal apoptosis inhibitory protein is partially deleted in individualswith spinal muscular atrophy. Cell, 80:167–178, Jan 1995.
[190] Y. H. Liang, X. L. Chen, Z. S. Yu, C. Y. Chen, S. Bi, L. G. Mao, B. L. Zhou, and X. N. Zhang. Deletion analysisof SMN1 and NAIP genes in Southern Chinese children with spinal muscular atrophy. J Zhejiang Univ Sci B,10:29–34, Jan 2009.
[191] R. Gotz, C. Karch, M. R. Digby, J. Troppmair, U. R. Rapp, and M. Sendtner. The neuronal apoptosis inhibitoryprotein suppresses neuronal differentiation and apoptosis in PC12 cells. Hum. Mol. Genet., 9:2479–2489, Oct2000.

bibliography 272
[192] E. Perlson, S. Maday, M. M. Fu, A. J. Moughamian, and E. L. Holzbaur. Retrograde axonal transport: pathwaysto cell death? Trends Neurosci., 33:335–344, Jul 2010.
[193] S. J. Kolb, S. Sutton, and D. R. Schoenberg. RNA processing defects associated with diseases of the motorneuron. Muscle Nerve, 41:5–17, Jan 2010.
[194] J. Sreedharan, I. P. Blair, V. B. Tripathi, X. Hu, C. Vance, B. Rogelj, S. Ackerley, J. C. Durnall, K. L. Williams,E. Buratti, F. Baralle, J. de Belleroche, J. D. Mitchell, P. N. Leigh, A. Al-Chalabi, C. C. Miller, G. Nicholson, andC. E. Shaw. TDP-43 mutations in familial and sporadic amyotrophic lateral sclerosis. Science, 319:1668–1672,Mar 2008.
[195] C. Vance, B. Rogelj, T. Hortobagyi, K. J. De Vos, A. L. Nishimura, J. Sreedharan, X. Hu, B. Smith, D. Ruddy,P. Wright, J. Ganesalingam, K. L. Williams, V. Tripathi, S. Al-Saraj, A. Al-Chalabi, P. N. Leigh, I. P. Blair,G. Nicholson, J. de Belleroche, J. M. Gallo, C. C. Miller, and C. E. Shaw. Mutations in FUS, an RNA processingprotein, cause familial amyotrophic lateral sclerosis type 6. Science, 323:1208–1211, Feb 2009.
[196] J. Sambrook, E. F. Fritsch, and T Maniatis. Molecular Cloning, A laboratory manual,. Laboratory Press, ColdSpring Harbor, 2nd edition, 1989.
[197] X. Wu and D. J. Munroe. EasyExonPrimer: automated primer design for exon sequences. Appl. Bioinformatics,5:119–120, 2006.
[198] W. J. Kent. BLAT–the BLAST-like alignment tool. Genome Res., 12:656–664, Apr 2002.
[199] T. Strachan and A. P. Read. Human Molecular Genetics. Wiley-Liss, New York, 2nd edition, 1999.
[200] K. W. Broman, J. C. Murray, V. C. Sheffield, R. L. White, and J. L. Weber. Comprehensive human genetic maps:individual and sex-specific variation in recombination. Am. J. Hum. Genet., 63:861–869, Sep 1998.
[201] A. Kong, D. F. Gudbjartsson, J. Sainz, G. M. Jonsdottir, S. A. Gudjonsson, B. Richardsson, S. Sigurdardottir,J. Barnard, B. Hallbeck, G. Masson, A. Shlien, S. T. Palsson, M. L. Frigge, T. E. Thorgeirsson, J. R. Gulcher, andK. Stefansson. A high-resolution recombination map of the human genome. Nat. Genet., 31:241–247, Jul 2002.
[202] G. A. McVean, S. R. Myers, S. Hunt, P. Deloukas, D. R. Bentley, and P. Donnelly. The fine-scale structure ofrecombination rate variation in the human genome. Science, 304:581–584, Apr 2004.
[203] S. Myers, L. Bottolo, C. Freeman, G. McVean, and P. Donnelly. A fine-scale map of recombination rates andhotspots across the human genome. Science, 310:321–324, Oct 2005.
[204] F. Baudat, J. Buard, C. Grey, A. Fledel-Alon, C. Ober, M. Przeworski, G. Coop, and B. de Massy. PRDM9 is amajor determinant of meiotic recombination hotspots in humans and mice. Science, 327:836–840, Feb 2010.
[205] M. A. Pericak-Vance. Analysis of Genetic Linkage Data for Mendelian Traits. Current Protocols in HumanGenetics, Supplement 9:1.4.1–1.4.31, 2001.
[206] N. E. Morton. Sequential tests for the detection of linkage. Am. J. Hum. Genet., 7:277–318, Sep 1955.
[207] Z. Brkanac, M. Fernandez, M. Matsushita, H. Lipe, J. Wolff, T. D. Bird, and W. H. Raskind. Autosomaldominant sensory/motor neuropathy with Ataxia (SMNA): Linkage to chromosome 7q22-q32. Am. J. Med.Genet., 114:450–457, May 2002.
[208] Z. Brkanac, D. Spencer, J. Shendure, P. D. Robertson, M. Matsushita, T. Vu, T. D. Bird, M. V. Olson, and W. H.Raskind. IFRD1 is a candidate gene for SMNA on chromosome 7q22-q23. Am. J. Hum. Genet., 84:692–697, May2009.
[209] S. Gopinath. Finding new genes causing motor neuron diseases. Master’s thesis, Faculty of Medicine, Univer-sity of Sydney, 2006.
[210] W. J. Kent, C. W. Sugnet, T. S. Furey, K. M. Roskin, T. H. Pringle, A. M. Zahler, and D. Haussler. The humangenome browser at UCSC. Genome Res., 12:996–1006, Jun 2002.
[211] G. Benson. Tandem repeats finder: a program to analyze DNA sequences. Nucleic Acids Res., 27:573–580, Jan1999.
[212] T. H. Lindner and K. Hoffmann. easyLINKAGE: a PERL script for easy and automated two-/multi-pointlinkage analyses. Bioinformatics, 21:405–407, Feb 2005.
[213] J. Ott. Computer-simulation methods in human linkage analysis. Proc. Natl. Acad. Sci. U.S.A., 86:4175–4178,Jun 1989.

bibliography 273
[214] D.E. Weeks, J. Ott, and G.M. Lathrop. SLINK: a general simulation program for linkage analysis. Am. J. Hum.Genet., 47(Suppl):A204, September 1990.
[215] A. E. Harding and P. K. Thomas. Peroneal muscular atrophy with pyramidal features. J. Neurol. Neurosurg.Psychiatr., 47:168–172, Feb 1984.
[216] W. J. Ewens, R. S. Spielman, N. L. Kaplan, X. Gao, R. W. Morris, and E. R. Martin. Disease associations andfamily-based tests. Current Protocols in Human Genetics, 58:1.12.1–1.12.24, 2008.
[217] G. A. Nicholson, J. L. Dawkins, I. P. Blair, M. Auer-Grumbach, S. B. Brahmbhatt, and D. J. Hulme. Hereditarysensory neuropathy type I: haplotype analysis shows founders in southern England and Europe. Am. J. Hum.Genet., 69:655–659, Sep 2001.
[218] R. Claramunt, T. Sevilla, V. Lupo, A. Cuesta, J. M. Millan, J. J. Vilchez, F. Palau, and C. Espinos. The p.R1109Xmutation in SH3TC2 gene is predominant in Spanish Gypsies with Charcot-Marie-Tooth disease type 4. Clin.Genet., 71:343–349, Apr 2007.
[219] A. Gabreels-Festen, S. van Beersum, L. Eshuis, E. LeGuern, F. Gabreels, B. van Engelen, and E. Mariman.Study on the gene and phenotypic characterisation of autosomal recessive demyelinating motor and sensoryneuropathy (Charcot-Marie-Tooth disease) with a gene locus on chromosome 5q23-q33. J. Neurol. Neurosurg.Psychiatr., 66:569–574, May 1999.
[220] J. Senderek, C. Bergmann, C. Stendel, J. Kirfel, N. Verpoorten, P. De Jonghe, V. Timmerman, R. Chrast, M. H.Verheijen, G. Lemke, E. Battaloglu, Y. Parman, S. Erdem, E. Tan, H. Topaloglu, A. Hahn, W. Muller-Felber,N. Rizzuto, G. M. Fabrizi, M. Stuhrmann, S. Rudnik-Schoneborn, S. Zuchner, J. Michael Schroder, E. Buch-heim, V. Straub, J. Klepper, K. Huehne, B. Rautenstrauss, R. Buttner, E. Nelis, and K. Zerres. Mutations ina gene encoding a novel SH3/TPR domain protein cause autosomal recessive Charcot-Marie-Tooth type 4Cneuropathy. Am. J. Hum. Genet., 73:1106–1119, Nov 2003.
[221] M. Brewer, F. Changi, A. Antonellis, K. Fischbeck, P. Polly, G. Nicholson, and M. Kennerson. Evidence of afounder haplotype refines the X-linked Charcot-Marie-Tooth (CMTX3) locus to a 2.5 Mb region. Neurogenetics,9:191–195, Jul 2008.
[222] J. L. Weber and C. Wong. Mutation of human short tandem repeats. Hum. Mol. Genet., 2:1123–1128, Aug 1993.
[223] G. F. Richard, A. Kerrest, and B. Dujon. Comparative genomics and molecular dynamics of DNA repeats ineukaryotes. Microbiol. Mol. Biol. Rev., 72:686–727, Dec 2008.
[224] B. Brinkmann, M. Klintschar, F. Neuhuber, J. Huhne, and B. Rolf. Mutation rate in human microsatellites:influence of the structure and length of the tandem repeat. Am. J. Hum. Genet., 62:1408–1415, Jun 1998.
[225] F. S. Collins. Positional cloning moves from perditional to traditional. Nat. Genet., 9:347–350, Apr 1995.
[226] J. S. Collins and C. E. Schwartz. Detecting polymorphisms and mutations in candidate genes. Am. J. Hum.Genet., 71:1251–1252, Nov 2002.
[227] International Human Genome Sequencing Consortium. Finishing the euchromatic sequence of the humangenome. Nature, 431:931–945, Oct 2004.
[228] J. C. Venter, M. D. Adams, E. W. Myers, P. W. Li, R. J. Mural, G. G. Sutton, H. O. Smith, M. Yandell, C. A. Evans,R. A. Holt, J. D. Gocayne, P. Amanatides, R. M. Ballew, D. H. Huson, J. R. Wortman, Q. Zhang, C. D. Kodira,X. H. Zheng, L. Chen, M. Skupski, G. Subramanian, P. D. Thomas, J. Zhang, G. L. Gabor Miklos, C. Nelson,S. Broder, A. G. Clark, J. Nadeau, V. A. McKusick, N. Zinder, A. J. Levine, R. J. Roberts, M. Simon, C. Slayman,M. Hunkapiller, R. Bolanos, A. Delcher, I. Dew, D. Fasulo, M. Flanigan, L. Florea, A. Halpern, S. Hannenhalli,S. Kravitz, S. Levy, C. Mobarry, K. Reinert, K. Remington, J. Abu-Threideh, E. Beasley, K. Biddick, V. Bonazzi,R. Brandon, M. Cargill, I. Chandramouliswaran, R. Charlab, K. Chaturvedi, Z. Deng, V. Di Francesco, P. Dunn,K. Eilbeck, C. Evangelista, A. E. Gabrielian, W. Gan, W. Ge, F. Gong, Z. Gu, P. Guan, T. J. Heiman, M. E. Higgins,R. R. Ji, Z. Ke, K. A. Ketchum, Z. Lai, Y. Lei, Z. Li, J. Li, Y. Liang, X. Lin, F. Lu, G. V. Merkulov, N. Milshina, H. M.Moore, A. K. Naik, V. A. Narayan, B. Neelam, D. Nusskern, D. B. Rusch, S. Salzberg, W. Shao, B. Shue, J. Sun,Z. Wang, A. Wang, X. Wang, J. Wang, M. Wei, R. Wides, C. Xiao, C. Yan, A. Yao, J. Ye, M. Zhan, W. Zhang,H. Zhang, Q. Zhao, L. Zheng, F. Zhong, W. Zhong, S. Zhu, S. Zhao, D. Gilbert, S. Baumhueter, G. Spier,C. Carter, A. Cravchik, T. Woodage, F. Ali, H. An, A. Awe, D. Baldwin, H. Baden, M. Barnstead, I. Barrow,K. Beeson, D. Busam, A. Carver, A. Center, M. L. Cheng, L. Curry, S. Danaher, L. Davenport, R. Desilets,S. Dietz, K. Dodson, L. Doup, S. Ferriera, N. Garg, A. Gluecksmann, B. Hart, J. Haynes, C. Haynes, C. Heiner,S. Hladun, D. Hostin, J. Houck, T. Howland, C. Ibegwam, J. Johnson, F. Kalush, L. Kline, S. Koduru, A. Love,F. Mann, D. May, S. McCawley, T. McIntosh, I. McMullen, M. Moy, L. Moy, B. Murphy, K. Nelson, C. Pfannkoch,E. Pratts, V. Puri, H. Qureshi, M. Reardon, R. Rodriguez, Y. H. Rogers, D. Romblad, B. Ruhfel, R. Scott, C. Sitter,M. Smallwood, E. Stewart, R. Strong, E. Suh, R. Thomas, N. N. Tint, S. Tse, C. Vech, G. Wang, J. Wetter,S. Williams, M. Williams, S. Windsor, E. Winn-Deen, K. Wolfe, J. Zaveri, K. Zaveri, J. F. Abril, R. Guigo, M. J.

bibliography 274
Campbell, K. V. Sjolander, B. Karlak, A. Kejariwal, H. Mi, B. Lazareva, T. Hatton, A. Narechania, K. Diemer,A. Muruganujan, N. Guo, S. Sato, V. Bafna, S. Istrail, R. Lippert, R. Schwartz, B. Walenz, S. Yooseph, D. Allen,A. Basu, J. Baxendale, L. Blick, M. Caminha, J. Carnes-Stine, P. Caulk, Y. H. Chiang, M. Coyne, C. Dahlke,A. Mays, M. Dombroski, M. Donnelly, D. Ely, S. Esparham, C. Fosler, H. Gire, S. Glanowski, K. Glasser,A. Glodek, M. Gorokhov, K. Graham, B. Gropman, M. Harris, J. Heil, S. Henderson, J. Hoover, D. Jennings,C. Jordan, J. Jordan, J. Kasha, L. Kagan, C. Kraft, A. Levitsky, M. Lewis, X. Liu, J. Lopez, D. Ma, W. Majoros,J. McDaniel, S. Murphy, M. Newman, T. Nguyen, N. Nguyen, M. Nodell, S. Pan, J. Peck, M. Peterson, W. Rowe,R. Sanders, J. Scott, M. Simpson, T. Smith, A. Sprague, T. Stockwell, R. Turner, E. Venter, M. Wang, M. Wen,D. Wu, M. Wu, A. Xia, A. Zandieh, and X. Zhu. The sequence of the human genome. Science, 291:1304–1351,Feb 2001.
[229] A. D. Baxevanis. Using genomic databases for sequence-based biological discovery. Mol. Med., 9:185–192,2003.
[230] J. E. Parrish and D. L. Nelson. Methods for finding genes. A major rate-limiting step in positional cloning.Genet. Anal. Tech. Appl., 10:29–41, Apr 1993.
[231] N. Papadopoulos. Introduction to positional cloning. Clin. Exp. Allergy, 25 Suppl 2:116–118, Nov 1995.
[232] M. Olson, L. Hood, C. Cantor, and D. Botstein. A common language for physical mapping of the humangenome. Science, 245:1434–1435, Sep 1989.
[233] D. L. Nelson. Positional cloning reaches maturity. Curr. Opin. Genet. Dev., 5:298–303, Jun 1995.
[234] T. A. Pearson and T. A. Manolio. How to interpret a genome-wide association study. JAMA, 299:1335–1344,Mar 2008.
[235] H. K. Tabor, N. J. Risch, and R. M. Myers. Candidate-gene approaches for studying complex genetic traits:practical considerations. Nat. Rev. Genet., 3:391–397, May 2002.
[236] K. Garber. Genetics. The elusive ALS genes. Science, 319:20, Jan 2008.
[237] T.A. Brown, editor. Genomes. Wiley-Liss, Oxford, 2nd edition edition, 2002.
[238] S. A. Cook, K. R. Johnson, R. T. Bronson, and M. T. Davisson. Neuromuscular degeneration (nmd): a mutationon mouse chromosome 19 that causes motor neuron degeneration. Mamm. Genome, 6:187–191, Mar 1995.
[239] M. Zhu and S. Zhao. Candidate gene identification approach: progress and challenges. Int. J. Biol. Sci., 3:420–427, 2007.
[240] M. L. Metzker. Emerging technologies in DNA sequencing. Genome Res., 15:1767–1776, Dec 2005.
[241] M. Grompe. The rapid detection of unknown mutations in nucleic acids. Nat. Genet., 5:111–117, Oct 1993.
[242] E. Y. Chan. Advances in sequencing technology. Mutat. Res., 573:13–40, Jun 2005.
[243] S. Kohler, S. Bauer, D. Horn, and P. N. Robinson. Walking the interactome for prioritization of candidatedisease genes. Am. J. Hum. Genet., 82:949–958, Apr 2008.
[244] L. C. Tranchevent, R. Barriot, S. Yu, S. Van Vooren, P. Van Loo, B. Coessens, B. De Moor, S. Aerts, and Y. Moreau.ENDEAVOUR update: a web resource for gene prioritization in multiple species. Nucleic Acids Res., 36:W377–384, Jul 2008.
[245] S. Aerts, D. Lambrechts, S. Maity, P. Van Loo, B. Coessens, F. De Smet, L. C. Tranchevent, B. De Moor, P. Mary-nen, B. Hassan, P. Carmeliet, and Y. Moreau. Gene prioritization through genomic data fusion. Nat. Biotechnol.,24:537–544, May 2006.
[246] C. Houdayer, C. Dehainault, C. Mattler, D. Michaux, V. Caux-Moncoutier, S. Pages-Berhouet, C. D. d’Enghien,A. Lauge, L. Castera, M. Gauthier-Villars, and D. Stoppa-Lyonnet. Evaluation of in silico splice tools fordecision-making in molecular diagnosis. Hum. Mutat., 29:975–982, Jul 2008.
[247] J. Bell, D. Bodmer, E. Sistermans, and S. Ramsden. Practice guidelines for the interpretation and reporting ofunclassified variants (uvs) in clinical molecular genetics. Technical report, Clinical Molecular Genetics Societyand Dutch Society of Clinical Genetic Laboratory Specialists, http://www.cmgs.org/BPGs/, Oct 2007.
[248] S. M. Hebsgaard, P. G. Korning, N. Tolstrup, J. Engelbrecht, P. Rouze, and S. Brunak. Splice site prediction inArabidopsis thaliana pre-mRNA by combining local and global sequence information. Nucleic Acids Res., 24:3439–3452, Sep 1996.

bibliography 275
[249] M. G. Reese, F. H. Eeckman, D. Kulp, and D. Haussler. Improved splice site detection in Genie. J. Comput.Biol., 4:311–323, 1997.
[250] F. O. Desmet, D. Hamroun, M. Lalande, G. Collod-Beroud, M. Claustres, and C. Beroud. Human SplicingFinder: an online bioinformatics tool to predict splicing signals. Nucleic Acids Res., 37:e67, May 2009.
[251] M. Pertea, X. Lin, and S. L. Salzberg. GeneSplicer: a new computational method for splice site prediction.Nucleic Acids Res., 29:1185–1190, Mar 2001.
[252] M. Wang and A. Marin. Characterization and prediction of alternative splice sites. Gene, 366:219–227, Feb2006.
[253] D.H. Mathews, J. Sabina, M. Zuker, and D.H. Turner. Expanded Sequence Dependence of ThermodynamicParameters Provides Robust Prediction of Rna Secondary Structure. J. Mol. Biol., 288:910–940, 1999.
[254] M. Zuker, D.H. Mathews, and D.H. Turner. Algorithms and Thermodynamics for RNA Secondary StructurePrediction: A Practical Guide. In J. Barciszewski and B.F.C. Clark, editors, RNA Biochemistry and Biotechnology,.NATO ASI Series, Kluwer Academic Publishers„ 1999.
[255] L. W. Hillier, R. S. Fulton, L. A. Fulton, T. A. Graves, K. H. Pepin, C. Wagner-McPherson, D. Layman, J. Maas,S. Jaeger, R. Walker, K. Wylie, M. Sekhon, M. C. Becker, M. D. O’Laughlin, M. E. Schaller, G. A. Fewell,K. D. Delehaunty, T. L. Miner, W. E. Nash, M. Cordes, H. Du, H. Sun, J. Edwards, H. Bradshaw-Cordum,J. Ali, S. Andrews, A. Isak, A. Vanbrunt, C. Nguyen, F. Du, B. Lamar, L. Courtney, J. Kalicki, P. Ozersky,L. Bielicki, K. Scott, A. Holmes, R. Harkins, A. Harris, C. M. Strong, S. Hou, C. Tomlinson, S. Dauphin-Kohlberg, A. Kozlowicz-Reilly, S. Leonard, T. Rohlfing, S. M. Rock, A. M. Tin-Wollam, A. Abbott, P. Minx,R. Maupin, C. Strowmatt, P. Latreille, N. Miller, D. Johnson, J. Murray, J. P. Woessner, M. C. Wendl, S. P. Yang,B. R. Schultz, J. W. Wallis, J. Spieth, T. A. Bieri, J. O. Nelson, N. Berkowicz, P. E. Wohldmann, L. L. Cook, M. T.Hickenbotham, J. Eldred, D. Williams, J. A. Bedell, E. R. Mardis, S. W. Clifton, S. L. Chissoe, M. A. Marra,C. Raymond, E. Haugen, W. Gillett, Y. Zhou, R. James, K. Phelps, S. Iadanoto, K. Bubb, E. Simms, R. Levy,J. Clendenning, R. Kaul, W. J. Kent, T. S. Furey, R. A. Baertsch, M. R. Brent, E. Keibler, P. Flicek, P. Bork,M. Suyama, J. A. Bailey, M. E. Portnoy, D. Torrents, A. T. Chinwalla, W. R. Gish, S. R. Eddy, J. D. McPherson,M. V. Olson, E. E. Eichler, E. D. Green, R. H. Waterston, and R. K. Wilson. The DNA sequence of humanchromosome 7. Nature, 424:157–164, Jul 2003.
[256] D. Karolchik, A. S. Hinrichs, T. S. Furey, K. M. Roskin, C. W. Sugnet, D. Haussler, and W. J. Kent. The UCSCTable Browser data retrieval tool. Nucleic Acids Res., 32:D493–496, Jan 2004.
[257] K. D. Pruitt, T. Tatusova, W. Klimke, and D. R. Maglott. NCBI Reference Sequences: current status, policy andnew initiatives. Nucleic Acids Res., 37:D32–36, Jan 2009.
[258] K. D. Pruitt, T. Tatusova, and D. R. Maglott. NCBI reference sequences (RefSeq): a curated non-redundantsequence database of genomes, transcripts and proteins. Nucleic Acids Res., 35:D61–65, Jan 2007.
[259] D. A. Benson, I. Karsch-Mizrachi, D. J. Lipman, J. Ostell, and D. L. Wheeler. GenBank: update. Nucleic AcidsRes., 32:D23–26, Jan 2004.
[260] K. D. Pruitt, J. Harrow, R. A. Harte, C. Wallin, M. Diekhans, D. R. Maglott, S. Searle, C. M. Farrell, J. E.Loveland, B. J. Ruef, E. Hart, M. M. Suner, M. J. Landrum, B. Aken, S. Ayling, R. Baertsch, J. Fernandez-Banet,J. L. Cherry, V. Curwen, M. Dicuccio, M. Kellis, J. Lee, M. F. Lin, M. Schuster, A. Shkeda, C. Amid, G. Brown,O. Dukhanina, A. Frankish, J. Hart, B. L. Maidak, J. Mudge, M. R. Murphy, T. Murphy, J. Rajan, B. Rajput, L. D.Riddick, C. Snow, C. Steward, D. Webb, J. A. Weber, L. Wilming, W. Wu, E. Birney, D. Haussler, T. Hubbard,J. Ostell, R. Durbin, and D. Lipman. The consensus coding sequence (CCDS) project: Identifying a commonprotein-coding gene set for the human and mouse genomes. Genome Res., 19:1316–1323, Jul 2009.
[261] R. Leinonen, F. Nardone, W. Zhu, and R. Apweiler. UniSave: the UniProtKB sequence/annotation versiondatabase. Bioinformatics, 22:1284–1285, May 2006.
[262] S. Rouquier, S. Taviaux, B. J. Trask, V. Brand-Arpon, G. van den Engh, J. Demaille, and D. Giorgi. Distributionof olfactory receptor genes in the human genome. Nat. Genet., 18:243–250, Mar 1998.
[263] M. A. Robinson, M. P. Mitchell, S. Wei, C. E. Day, T. M. Zhao, and P. Concannon. Organization of human T-cellreceptor beta-chain genes: clusters of V beta genes are present on chromosomes 7 and 9. Proc. Natl. Acad. Sci.U.S.A., 90:2433–2437, Mar 1993.
[264] M. A. van Es, P. W. van Vught, H. M. Blauw, L. Franke, C. G. Saris, L. Van den Bosch, S. W. de Jong, V. de Jong,F. Baas, R. van’t Slot, R. Lemmens, H. J. Schelhaas, A. Birve, K. Sleegers, C. Van Broeckhoven, J. C. Schymick,B. J. Traynor, J. H. Wokke, C. Wijmenga, W. Robberecht, P. M. Andersen, J. H. Veldink, R. A. Ophoff, and L. H.van den Berg. Genetic variation in DPP6 is associated with susceptibility to amyotrophic lateral sclerosis. Nat.Genet., 40:29–31, Jan 2008.

bibliography 276
[265] S. Cronin, S. Berger, J. Ding, J. C. Schymick, N. Washecka, D. G. Hernandez, M. J. Greenway, D. G. Bradley,B. J. Traynor, and O. Hardiman. A genome-wide association study of sporadic ALS in a homogenous Irishpopulation. Hum. Mol. Genet., 17:768–774, Mar 2008.
[266] R. Del Bo, S. Ghezzi, S. Corti, D. Santoro, A. Prelle, M. Mancuso, G. Siciliano, C. Briani, L. Murri, N. Bresolin,and G. P. Comi. DPP6 gene variability confers increased risk of developing sporadic amyotrophic lateralsclerosis in Italian patients. J. Neurol. Neurosurg. Psychiatr., 79:1085, Sep 2008.
[267] T. Dunckley, M. J. Huentelman, D. W. Craig, J. V. Pearson, S. Szelinger, K. Joshipura, R. F. Halperin, C. Stamper,K. R. Jensen, D. Letizia, S. E. Hesterlee, A. Pestronk, T. Levine, T. Bertorini, M. C. Graves, T. Mozaffar, C. E.Jackson, P. Bosch, A. McVey, A. Dick, R. Barohn, C. Lomen-Hoerth, J. Rosenfeld, D. T. O’connor, K. Zhang,R. Crook, H. Ryberg, M. Hutton, J. Katz, E. P. Simpson, H. Mitsumoto, R. Bowser, R. G. Miller, S. H. Appel,and D. A. Stephan. Whole-genome analysis of sporadic amyotrophic lateral sclerosis. N. Engl. J. Med., 357:775–788, Aug 2007.
[268] E. Lingueglia, J. R. de Weille, F. Bassilana, C. Heurteaux, H. Sakai, R. Waldmann, and M. Lazdunski. Amodulatory subunit of acid sensing ion channels in brain and dorsal root ganglion cells. J. Biol. Chem., 272:29778–29783, Nov 1997.
[269] D. Alvarez de la Rosa, P. Zhang, D. Shao, F. White, and C. M. Canessa. Functional implications of thelocalization and activity of acid-sensitive channels in rat peripheral nervous system. Proc. Natl. Acad. Sci.U.S.A., 99:2326–2331, Feb 2002.
[270] J. F. Staropoli, C. McDermott, C. Martinat, B. Schulman, E. Demireva, and A. Abeliovich. Parkin is a componentof an SCF-like ubiquitin ligase complex and protects postmitotic neurons from kainate excitotoxicity. Neuron,37:735–749, Mar 2003.
[271] T. Kitada, S. Asakawa, N. Hattori, H. Matsumine, Y. Yamamura, S. Minoshima, M. Yokochi, Y. Mizuno, andN. Shimizu. Mutations in the parkin gene cause autosomal recessive juvenile parkinsonism. Nature, 392:605–608, Apr 1998.
[272] K. A. Strauss, E. G. Puffenberger, M. J. Huentelman, S. Gottlieb, S. E. Dobrin, J. M. Parod, D. A. Stephan, andD. H. Morton. Recessive symptomatic focal epilepsy and mutant contactin-associated protein-like 2. N. Engl.J. Med., 354:1370–1377, Mar 2006.
[273] J. I. Friedman, T. Vrijenhoek, S. Markx, I. M. Janssen, W. A. van der Vliet, B. H. Faas, N. V. Knoers, W. Cahn,R. S. Kahn, L. Edelmann, K. L. Davis, J. M. Silverman, H. G. Brunner, A. G. van Kessel, C. Wijmenga, R. A.Ophoff, and J. A. Veltman. CNTNAP2 gene dosage variation is associated with schizophrenia and epilepsy.Mol. Psychiatry, 13:261–266, Mar 2008.
[274] A. J. Verkerk, C. A. Mathews, M. Joosse, B. H. Eussen, P. Heutink, and B. A. Oostra. CNTNAP2 is disrupted ina family with Gilles de la Tourette syndrome and obsessive compulsive disorder. Genomics, 82:1–9, Jul 2003.
[275] D. E. Arking, D. J. Cutler, C. W. Brune, T. M. Teslovich, K. West, M. Ikeda, A. Rea, M. Guy, S. Lin, E. H. Cook,and A. Chakravarti. A common genetic variant in the neurexin superfamily member CNTNAP2 increasesfamilial risk of autism. Am. J. Hum. Genet., 82:160–164, Jan 2008.
[276] S. J. Huffaker, J. Chen, K. K. Nicodemus, F. Sambataro, F. Yang, V. Mattay, B. K. Lipska, T. M. Hyde, J. Song,D. Rujescu, I. Giegling, K. Mayilyan, M. J. Proust, A. Soghoyan, G. Caforio, J. H. Callicott, A. Bertolino,A. Meyer-Lindenberg, J. Chang, Y. Ji, M. F. Egan, T. E. Goldberg, J. E. Kleinman, B. Lu, and D. R. Weinberger.A primate-specific, brain isoform of KCNH2 affects cortical physiology, cognition, neuronal repolarization andrisk of schizophrenia. Nat. Med., 15:509–518, May 2009.
[277] M. Dahiyat, A. Cumming, C. Harrington, C. Wischik, J. Xuereb, F. Corrigan, G. Breen, D. Shaw, and D. St Clair.Association between Alzheimer’s disease and the NOS3 gene. Ann. Neurol., 46:664–667, Oct 1999.
[278] A. Akomolafe, K. L. Lunetta, P. M. Erlich, L. A. Cupples, C. T. Baldwin, M. Huyck, R. C. Green, and L. A.Farrer. Genetic association between endothelial nitric oxide synthase and Alzheimer disease. Clin. Genet., 70:49–56, Jul 2006.
[279] L. Bergeron, G. I. Perez, G. Macdonald, L. Shi, Y. Sun, A. Jurisicova, S. Varmuza, K. E. Latham, J. A. Flaws,J. C. Salter, H. Hara, M. A. Moskowitz, E. Li, A. Greenberg, J. L. Tilly, and J. Yuan. Defects in regulation ofapoptosis in caspase-2-deficient mice. Genes Dev., 12:1304–1314, May 1998.
[280] M. D. Nguyen, R. C. Lariviere, and J. P. Julien. Deregulation of Cdk5 in a mouse model of ALS: toxicityalleviated by perikaryal neurofilament inclusions. Neuron, 30:135–147, Apr 2001.
[281] R. B. Hough, A. Lengeling, V. Bedian, C. Lo, and M. Bucan. Rump white inversion in the mouse disruptsdipeptidyl aminopeptidase-like protein 6 and causes dysregulation of Kit expression. Proc. Natl. Acad. Sci.U.S.A., 95:13800–13805, Nov 1998.

bibliography 277
[282] L. Wilson, Y. H. Ching, M. Farias, S. A. Hartford, G. Howell, H. Shao, M. Bucan, and J. C. Schimenti. Randommutagenesis of proximal mouse chromosome 5 uncovers predominantly embryonic lethal mutations. GenomeRes., 15:1095–1105, Aug 2005.
[283] J. T. Winston, P. Strack, P. Beer-Romero, C. Y. Chu, S. J. Elledge, and J. W. Harper. The SCFbeta-TRCP-ubiquitin ligase complex associates specifically with phosphorylated destruction motifs in IkappaBalpha andbeta-catenin and stimulates IkappaBalpha ubiquitination in vitro. Genes Dev., 13:270–283, Feb 1999.
[284] T. Maniatis. A ubiquitin ligase complex essential for the NF-kappaB, Wnt/Wingless, and Hedgehog signalingpathways. Genes Dev., 13:505–510, Mar 1999.
[285] S. H. Loh, L. Francescut, P. Lingor, M. Bahr, and P. Nicotera. Identification of new kinase clusters required forneurite outgrowth and retraction by a loss-of-function RNA interference screen. Cell Death Differ., 15:283–298,Feb 2008.
[286] H. Z. Ring, V. Vameghi-Meyers, W. Wang, G. R. Crabtree, and U. Francke. Five SWI/SNF-related, matrix-associated, actin-dependent regulator of chromatin (SMARC) genes are dispersed in the human genome. Ge-nomics, 51:140–143, Jul 1998.
[287] D. F. Bogenhagen, D. Rousseau, and S. Burke. The layered structure of human mitochondrial DNA nucleoids.J. Biol. Chem., 283:3665–3675, Feb 2008.
[288] J. Huang, Z. Gong, G. Ghosal, and J. Chen. SOSS complexes participate in the maintenance of genomicstability. Mol. Cell, 35:384–393, Aug 2009.
[289] S. Poliak, L. Gollan, R. Martinez, A. Custer, S. Einheber, J. L. Salzer, J. S. Trimmer, P. Shrager, and E. Peles.Caspr2, a new member of the neurexin superfamily, is localized at the juxtaparanodes of myelinated axonsand associates with K+ channels. Neuron, 24:1037–1047, Dec 1999.
[290] M. Rebhan, V. Chalifa-Caspi, J. Prilusky, and D. Lancet. GeneCards: integrating information about genes,proteins and diseases. Trends Genet., 13:163, Apr 1997.
[291] I. Yanai, H. Benjamin, M. Shmoish, V. Chalifa-Caspi, M. Shklar, R. Ophir, A. Bar-Even, S. Horn-Saban,M. Safran, E. Domany, D. Lancet, and O. Shmueli. Genome-wide midrange transcription profiles revealexpression level relationships in human tissue specification. Bioinformatics, 21:650–659, Mar 2005.
[292] O. Shmueli, S. Horn-Saban, V. Chalifa-Caspi, M. Shmoish, R. Ophir, H. Benjamin-Rodrig, M. Safran, E. Do-many, and D. Lancet. GeneNote: whole genome expression profiles in normal human tissues. C. R. Biol., 326:1067–1072, 2003.
[293] C. Wu, C. Orozco, J. Boyer, M. Leglise, J. Goodale, S. Batalov, C. L. Hodge, J. Haase, J. Janes, J. W. Huss,and A. I. Su. BioGPS: an extensible and customizable portal for querying and organizing gene annotationresources. Genome Biol., 10:R130, 2009.
[294] A. I. Su, T. Wiltshire, S. Batalov, H. Lapp, K. A. Ching, D. Block, J. Zhang, R. Soden, M. Hayakawa, G. Kreiman,M. P. Cooke, J. R. Walker, and J. B. Hogenesch. A gene atlas of the mouse and human protein-encodingtranscriptomes. Proc. Natl. Acad. Sci. U.S.A., 101:6062–6067, Apr 2004.
[295] F. Zhang, W. Gu, M. E. Hurles, and J. R. Lupski. Copy number variation in human health, disease, andevolution. Annu Rev Genomics Hum Genet, 10:451–481, 2009.
[296] S. A. McCarroll, F. G. Kuruvilla, J. M. Korn, S. Cawley, J. Nemesh, A. Wysoker, M. H. Shapero, P. I. de Bakker,J. B. Maller, A. Kirby, A. L. Elliott, M. Parkin, E. Hubbell, T. Webster, R. Mei, J. Veitch, P. J. Collins, R. Handsaker,S. Lincoln, M. Nizzari, J. Blume, K. W. Jones, R. Rava, M. J. Daly, S. B. Gabriel, and D. Altshuler. Integrateddetection and population-genetic analysis of SNPs and copy number variation. Nat. Genet., 40:1166–1174, Oct2008.
[297] C. Alkan, B. P. Coe, and E. E. Eichler. Genome structural variation discovery and genotyping. Nat. Rev. Genet.,12:363–376, May 2011.
[298] J. Sebat, B. Lakshmi, J. Troge, J. Alexander, J. Young, P. Lundin, S. Maner, H. Massa, M. Walker, M. Chi,N. Navin, R. Lucito, J. Healy, J. Hicks, K. Ye, A. Reiner, T. C. Gilliam, B. Trask, N. Patterson, A. Zetterberg, andM. Wigler. Large-scale copy number polymorphism in the human genome. Science, 305:525–528, Jul 2004.
[299] A. J. Iafrate, L. Feuk, M. N. Rivera, M. L. Listewnik, P. K. Donahoe, Y. Qi, S. W. Scherer, and C. Lee. Detectionof large-scale variation in the human genome. Nat. Genet., 36:949–951, Sep 2004.

bibliography 278
[300] R. Redon, S. Ishikawa, K. R. Fitch, L. Feuk, G. H. Perry, T. D. Andrews, H. Fiegler, M. H. Shapero, A. R. Carson,W. Chen, E. K. Cho, S. Dallaire, J. L. Freeman, J. R. Gonzalez, M. Gratacos, J. Huang, D. Kalaitzopoulos,D. Komura, J. R. MacDonald, C. R. Marshall, R. Mei, L. Montgomery, K. Nishimura, K. Okamura, F. Shen,M. J. Somerville, J. Tchinda, A. Valsesia, C. Woodwark, F. Yang, J. Zhang, T. Zerjal, J. Zhang, L. Armengol, D. F.Conrad, X. Estivill, C. Tyler-Smith, N. P. Carter, H. Aburatani, C. Lee, K. W. Jones, S. W. Scherer, and M. E.Hurles. Global variation in copy number in the human genome. Nature, 444:444–454, Nov 2006.
[301] J. M. Kidd, G. M. Cooper, W. F. Donahue, H. S. Hayden, N. Sampas, T. Graves, N. Hansen, B. Teague, C. Alkan,F. Antonacci, E. Haugen, T. Zerr, N. A. Yamada, P. Tsang, T. L. Newman, E. Tuzun, Z. Cheng, H. M. Ebling,N. Tusneem, R. David, W. Gillett, K. A. Phelps, M. Weaver, D. Saranga, A. Brand, W. Tao, E. Gustafson,K. McKernan, L. Chen, M. Malig, J. D. Smith, J. M. Korn, S. A. McCarroll, D. A. Altshuler, D. A. Peiffer,M. Dorschner, J. Stamatoyannopoulos, D. Schwartz, D. A. Nickerson, J. C. Mullikin, R. K. Wilson, L. Bruhn,M. V. Olson, R. Kaul, D. R. Smith, and E. E. Eichler. Mapping and sequencing of structural variation fromeight human genomes. Nature, 453:56–64, May 2008.
[302] D. F. Conrad, D. Pinto, R. Redon, L. Feuk, O. Gokcumen, Y. Zhang, J. Aerts, T. D. Andrews, C. Barnes,P. Campbell, T. Fitzgerald, M. Hu, C. H. Ihm, K. Kristiansson, D. G. Macarthur, J. R. Macdonald, I. Onyiah,A. W. Pang, S. Robson, K. Stirrups, A. Valsesia, K. Walter, J. Wei, C. Tyler-Smith, N. P. Carter, C. Lee, S. W.Scherer, and M. E. Hurles. Origins and functional impact of copy number variation in the human genome.Nature, 464:704–712, Apr 2010.
[303] H. Park, J. I. Kim, Y. S. Ju, O. Gokcumen, R. E. Mills, S. Kim, S. Lee, D. Suh, D. Hong, H. P. Kang, Y. J. Yoo, J. Y.Shin, H. J. Kim, M. Yavartanoo, Y. W. Chang, J. S. Ha, W. Chong, G. R. Hwang, K. Darvishi, H. Kim, S. J. Yang,K. S. Yang, H. Kim, M. E. Hurles, S. W. Scherer, N. P. Carter, C. Tyler-Smith, C. Lee, and J. S. Seo. Discoveryof common Asian copy number variants using integrated high-resolution array CGH and massively parallelDNA sequencing. Nat. Genet., 42:400–405, May 2010.
[304] R. E. Mills, K. Walter, C. Stewart, R. E. Handsaker, K. Chen, C. Alkan, A. Abyzov, S. C. Yoon, K. Ye, R. K.Cheetham, A. Chinwalla, D. F. Conrad, Y. Fu, F. Grubert, I. Hajirasouliha, F. Hormozdiari, L. M. Iakoucheva,Z. Iqbal, S. Kang, J. M. Kidd, M. K. Konkel, J. Korn, E. Khurana, D. Kural, H. Y. Lam, J. Leng, R. Li, Y. Li, C. Y.Lin, R. Luo, X. J. Mu, J. Nemesh, H. E. Peckham, T. Rausch, A. Scally, X. Shi, M. P. Stromberg, A. M. Stutz,A. E. Urban, J. A. Walker, J. Wu, Y. Zhang, Z. D. Zhang, M. A. Batzer, L. Ding, G. T. Marth, G. McVean, J. Sebat,M. Snyder, J. Wang, K. Ye, E. E. Eichler, M. B. Gerstein, M. E. Hurles, C. Lee, S. A. McCarroll, J. O. Korbel, and. 1000 Genomes Project. Mapping copy number variation by population-scale genome sequencing. Nature,470:59–65, Feb 2011.
[305] J. A. Lee and J. R. Lupski. Genomic rearrangements and gene copy-number alterations as a cause of nervoussystem disorders. Neuron, 52:103–121, Oct 2006.
[306] J. Huang, X. Wu, G. Montenegro, J. Price, G. Wang, J. M. Vance, M. E. Shy, and S. Zuchner. Copy numbervariations are a rare cause of non-CMT1A Charcot-Marie-Tooth disease. J. Neurol., 257:735–741, May 2010.
[307] J. R. Lupski, R. M. de Oca-Luna, S. Slaugenhaupt, L. Pentao, V. Guzzetta, B. J. Trask, O. Saucedo-Cardenas,D. F. Barker, J. M. Killian, C. A. Garcia, A. Chakravarti, and P. I. Patel. DNA duplication associated withCharcot-Marie-Tooth disease type 1A. Cell, 66:219–232, Jul 1991.
[308] P. F. Chance, M. K. Alderson, K. A. Leppig, M. W. Lensch, N. Matsunami, B. Smith, P. D. Swanson, S. J.Odelberg, C. M. Disteche, and T. D. Bird. DNA deletion associated with hereditary neuropathy with liabilityto pressure palsies. Cell, 72:143–151, Jan 1993.
[309] Q. S. Padiath, K. Saigoh, R. Schiffmann, H. Asahara, T. Yamada, A. Koeppen, K. Hogan, L. J. Ptacek, and Y. H.Fu. Lamin B1 duplications cause autosomal dominant leukodystrophy. Nat. Genet., 38:1114–1123, Oct 2006.
[310] L. Feuk, A. R. Carson, and S. W. Scherer. Structural variation in the human genome. Nat. Rev. Genet., 7:85–97,Feb 2006.
[311] H. Matsuzaki, P. H. Wang, J. Hu, R. Rava, and G. K. Fu. High resolution discovery and confirmation of copynumber variants in 90 Yoruba Nigerians. Genome Biol., 10:R125, 2009.
[312] D. P. Locke, A. J. Sharp, S. A. McCarroll, S. D. McGrath, T. L. Newman, Z. Cheng, S. Schwartz, D. G. Albert-son, D. Pinkel, D. M. Altshuler, and E. E. Eichler. Linkage disequilibrium and heritability of copy-numberpolymorphisms within duplicated regions of the human genome. Am. J. Hum. Genet., 79:275–290, Aug 2006.
[313] A. J. Sharp, D. P. Locke, S. D. McGrath, Z. Cheng, J. A. Bailey, R. U. Vallente, L. M. Pertz, R. A. Clark,S. Schwartz, R. Segraves, V. V. Oseroff, D. G. Albertson, D. Pinkel, and E. E. Eichler. Segmental duplicationsand copy-number variation in the human genome. Am. J. Hum. Genet., 77:78–88, Jul 2005.

bibliography 279
[314] T. H. Shaikh, X. Gai, J. C. Perin, J. T. Glessner, H. Xie, K. Murphy, R. O’Hara, T. Casalunovo, L. K. Conlin,M. D’Arcy, E. C. Frackelton, E. A. Geiger, C. Haldeman-Englert, M. Imielinski, C. E. Kim, L. Medne, K. Anna-iah, J. P. Bradfield, E. Dabaghyan, A. Eckert, C. C. Onyiah, S. Ostapenko, F. G. Otieno, E. Santa, J. L. Shaner,R. Skraban, R. M. Smith, J. Elia, E. Goldmuntz, N. B. Spinner, E. H. Zackai, R. M. Chiavacci, R. Grundmeier,E. F. Rappaport, S. F. Grant, P. S. White, and H. Hakonarson. High-resolution mapping and analysis of copynumber variations in the human genome: a data resource for clinical and research applications. Genome Res.,19:1682–1690, Sep 2009.
[315] B. Guthmundsson, E. Olafsson, F. Jakobsson, and P. Luthvigsson. Prevalence of symptomatic Charcot-Marie-Tooth disease in Iceland: a study of a well-defined population. Neuroepidemiology, 34:13–17, 2010.
[316] M. L. Metzker. Sequencing technologies - the next generation. Nat. Rev. Genet., 11:31–46, Jan 2010.
[317] J. Shendure and H. Ji. Next-generation DNA sequencing. Nat. Biotechnol., 26:1135–1145, Oct 2008.
[318] M. Margulies, M. Egholm, W. E. Altman, S. Attiya, J. S. Bader, L. A. Bemben, J. Berka, M. S. Braverman, Y. J.Chen, Z. Chen, S. B. Dewell, L. Du, J. M. Fierro, X. V. Gomes, B. C. Godwin, W. He, S. Helgesen, C. H. Ho, C. H.Ho, G. P. Irzyk, S. C. Jando, M. L. Alenquer, T. P. Jarvie, K. B. Jirage, J. B. Kim, J. R. Knight, J. R. Lanza, J. H.Leamon, S. M. Lefkowitz, M. Lei, J. Li, K. L. Lohman, H. Lu, V. B. Makhijani, K. E. McDade, M. P. McKenna,E. W. Myers, E. Nickerson, J. R. Nobile, R. Plant, B. P. Puc, M. T. Ronan, G. T. Roth, G. J. Sarkis, J. F. Simons,J. W. Simpson, M. Srinivasan, K. R. Tartaro, A. Tomasz, K. A. Vogt, G. A. Volkmer, S. H. Wang, Y. Wang, M. P.Weiner, P. Yu, R. F. Begley, and J. M. Rothberg. Genome sequencing in microfabricated high-density picolitrereactors. Nature, 437:376–380, Sep 2005.
[319] A. Valouev, J. Ichikawa, T. Tonthat, J. Stuart, S. Ranade, H. Peckham, K. Zeng, J. A. Malek, G. Costa, K. McKer-nan, A. Sidow, A. Fire, and S. M. Johnson. A high-resolution, nucleosome position map of C. elegans revealsa lack of universal sequence-dictated positioning. Genome Res., 18:1051–1063, Jul 2008.
[320] J. M. Rothberg, W. Hinz, T. M. Rearick, J. Schultz, W. Mileski, M. Davey, J. H. Leamon, K. Johnson, M. J.Milgrew, M. Edwards, J. Hoon, J. F. Simons, D. Marran, J. W. Myers, J. F. Davidson, A. Branting, J. R. Nobile,B. P. Puc, D. Light, T. A. Clark, M. Huber, J. T. Branciforte, I. B. Stoner, S. E. Cawley, M. Lyons, Y. Fu, N. Homer,M. Sedova, X. Miao, B. Reed, J. Sabina, E. Feierstein, M. Schorn, M. Alanjary, E. Dimalanta, D. Dressman,R. Kasinskas, T. Sokolsky, J. A. Fidanza, E. Namsaraev, K. J. McKernan, A. Williams, G. T. Roth, and J. Bustillo.An integrated semiconductor device enabling non-optical genome sequencing. Nature, 475:348–352, Jul 2011.
[321] J. Korlach, K. P. Bjornson, B. P. Chaudhuri, R. L. Cicero, B. A. Flusberg, J. J. Gray, D. Holden, R. Saxena,J. Wegener, and S. W. Turner. Real-time DNA sequencing from single polymerase molecules. Meth. Enzymol.,472:431–455, 2010.
[322] M. Ronaghi, S. Karamohamed, B. Pettersson, M. Uhlen, and P. Nyren. Real-time DNA sequencing usingdetection of pyrophosphate release. Anal. Biochem., 242:84–89, Nov 1996.
[323] M. Ronaghi, M. Uhlen, and P. Nyren. A sequencing method based on real-time pyrophosphate. Science, 281:363, 365, Jul 1998.
[324] P. D. Stenson, M. Mort, E. V. Ball, K. Howells, A. D. Phillips, N. S. Thomas, and D. N. Cooper. The HumanGene Mutation Database: 2008 update. Genome Med, 1:13, 2009.
[325] J. Guo, N. Xu, Z. Li, S. Zhang, J. Wu, D. H. Kim, M. Sano Marma, Q. Meng, H. Cao, X. Li, S. Shi, L. Yu,S. Kalachikov, J. J. Russo, N. J. Turro, and J. Ju. Four-color DNA sequencing with 3’-O-modified nucleotidereversible terminators and chemically cleavable fluorescent dideoxynucleotides. Proc. Natl. Acad. Sci. U.S.A.,105:9145–9150, Jul 2008.
[326] J. Bowers, J. Mitchell, E. Beer, P. R. Buzby, M. Causey, J. W. Efcavitch, M. Jarosz, E. Krzymanska-Olejnik,L. Kung, D. Lipson, G. M. Lowman, S. Marappan, P. McInerney, A. Platt, A. Roy, S. M. Siddiqi, K. Steinmann,and J. F. Thompson. Virtual terminator nucleotides for next-generation DNA sequencing. Nat. Methods, 6:593–595, Aug 2009.
[327] M. J. Fullwood, C. L. Wei, E. T. Liu, and Y. Ruan. Next-generation DNA sequencing of paired-end tags (PET)for transcriptome and genome analyses. Genome Res., 19:521–532, Apr 2009.
[328] C. Trapnell and S. L. Salzberg. How to map billions of short reads onto genomes. Nat. Biotechnol., 27:455–457,May 2009.
[329] M. J. Chaisson, D. Brinza, and P. A. Pevzner. De novo fragment assembly with short mate-paired reads: Doesthe read length matter? Genome Res., 19:336–346, Feb 2009.
[330] D. R. Bentley. Whole-genome re-sequencing. Curr. Opin. Genet. Dev., 16:545–552, Dec 2006.

bibliography 280
[331] E. H. Turner, S. B. Ng, D. A. Nickerson, and J. Shendure. Methods for genomic partitioning. Annu RevGenomics Hum Genet, 10:263–284, 2009.
[332] E. Hodges, Z. Xuan, V. Balija, M. Kramer, M. N. Molla, S. W. Smith, C. M. Middle, M. J. Rodesch, T. J. Albert,G. J. Hannon, and W. R. McCombie. Genome-wide in situ exon capture for selective resequencing. Nat. Genet.,39:1522–1527, Dec 2007.
[333] M. A. Cleary, K. Kilian, Y. Wang, J. Bradshaw, G. Cavet, W. Ge, A. Kulkarni, P. J. Paddison, K. Chang, N. Sheth,E. Leproust, E. M. Coffey, J. Burchard, W. R. McCombie, P. Linsley, and G. J. Hannon. Production of complexnucleic acid libraries using highly parallel in situ oligonucleotide synthesis. Nat. Methods, 1:241–248, Dec 2004.
[334] S. B. Ng, E. H. Turner, P. D. Robertson, S. D. Flygare, A. W. Bigham, C. Lee, T. Shaffer, M. Wong, A. Bhattachar-jee, E. E. Eichler, M. Bamshad, D. A. Nickerson, and J. Shendure. Targeted capture and massively parallelsequencing of 12 human exomes. Nature, 461:272–276, Sep 2009.
[335] C. Gilissen, A. Hoischen, H. G. Brunner, and J. A. Veltman. Unlocking Mendelian disease using exomesequencing. Genome Biol, 12:228, Sep 2011.
[336] J. R. Lupski, J. G. Reid, C. Gonzaga-Jauregui, D. Rio Deiros, D. C. Chen, L. Nazareth, M. Bainbridge, H. Dinh,C. Jing, D. A. Wheeler, A. L. McGuire, F. Zhang, P. Stankiewicz, J. J. Halperin, C. Yang, C. Gehman, D. Guo,R. K. Irikat, W. Tom, N. J. Fantin, D. M. Muzny, and R. A. Gibbs. Whole-genome sequencing in a patient withCharcot-Marie-Tooth neuropathy. N. Engl. J. Med., 362:1181–1191, Apr 2010.
[337] P. C. Ng, S. Levy, J. Huang, T. B. Stockwell, B. P. Walenz, K. Li, N. Axelrod, D. A. Busam, R. L. Strausberg, andJ. C. Venter. Genetic variation in an individual human exome. PLoS Genet., 4:e1000160, 2008.
[338] S. B. Ng, K. J. Buckingham, C. Lee, A. W. Bigham, H. K. Tabor, K. M. Dent, C. D. Huff, P. T. Shannon, E. W.Jabs, D. A. Nickerson, J. Shendure, and M. J. Bamshad. Exome sequencing identifies the cause of a mendeliandisorder. Nat. Genet., 42:30–35, Jan 2010.
[339] J. L. Wang, X. Yang, K. Xia, Z. M. Hu, L. Weng, X. Jin, H. Jiang, P. Zhang, L. Shen, J. F. Guo, N. Li, Y. R. Li, L. F.Lei, J. Zhou, J. Du, Y. F. Zhou, Q. Pan, J. Wang, J. Wang, R. Q. Li, and B. S. Tang. TGM6 identified as a novelcausative gene of spinocerebellar ataxias using exome sequencing. Brain, 133:3510–3518, Dec 2010.
[340] R. Li, Y. Li, K. Kristiansen, and J. Wang. SOAP: short oligonucleotide alignment program. Bioinformatics, 24:713–714, Mar 2008.
[341] D. Blankenberg, G. Von Kuster, N. Coraor, G. Ananda, R. Lazarus, M. Mangan, A. Nekrutenko, and J. Taylor.Galaxy: a web-based genome analysis tool for experimentalists. Curr Protoc Mol Biol, Chapter 19:1–21, Jan2010.
[342] J. Goecks, A. Nekrutenko, J. Taylor, E. Afgan, G. Ananda, D. Baker, D. Blankenberg, R. Chakrabarty, N. Coraor,J. Goecks, G. Von Kuster, R. Lazarus, K. Li, A. Nekrutenko, J. Taylor, and K. Vincent. Galaxy: a comprehensiveapproach for supporting accessible, reproducible, and transparent computational research in the life sciences.Genome Biol., 11:R86, 2010.
[343] P. C. Ng and S. Henikoff. Predicting the effects of amino acid substitutions on protein function. Annu RevGenomics Hum Genet, 7:61–80, 2006.
[344] P. D. Thomas, M. J. Campbell, A. Kejariwal, H. Mi, B. Karlak, R. Daverman, K. Diemer, A. Muruganujan, andA. Narechania. PANTHER: a library of protein families and subfamilies indexed by function. Genome Res., 13:2129–2141, Sep 2003.
[345] Y. Bromberg, G. Yachdav, and B. Rost. SNAP predicts effect of mutations on protein function. Bioinformatics,24:2397–2398, Oct 2008.
[346] V. Ramensky, P. Bork, and S. Sunyaev. Human non-synonymous SNPs: server and survey. Nucleic Acids Res.,30:3894–3900, Sep 2002.
[347] S. Sunyaev, V. Ramensky, I. Koch, W. Lathe, A. S. Kondrashov, and P. Bork. Prediction of deleterious humanalleles. Hum. Mol. Genet., 10:591–597, Mar 2001.
[348] J. A. Bailey, Z. Gu, R. A. Clark, K. Reinert, R. V. Samonte, S. Schwartz, M. D. Adams, E. W. Myers, P. W. Li,and E. E. Eichler. Recent segmental duplications in the human genome. Science, 297:1003–1007, Aug 2002.
[349] J. A. Bailey, A. M. Yavor, H. F. Massa, B. J. Trask, and E. E. Eichler. Segmental duplications: organization andimpact within the current human genome project assembly. Genome Res., 11:1005–1017, Jun 2001.

bibliography 281
[350] A. Kozik, E. Kochetkova, and R. Michelmore. GenomePixelizer–a visualization program for comparativegenomics within and between species. Bioinformatics, 18:335–336, Feb 2002.
[351] S. Griffiths-Jones, H. K. Saini, S. van Dongen, and A. J. Enright. miRBase: tools for microRNA genomics.Nucleic Acids Res., 36:D154–158, Jan 2008.
[352] D. J. Hedges, D. Hedges, D. Burges, E. Powell, C. Almonte, J. Huang, S. Young, B. Boese, M. Schmidt, M. A.Pericak-Vance, E. Martin, X. Zhang, T. T. Harkins, and S. Zuchner. Exome sequencing of a multigenerationalhuman pedigree. PLoS ONE, 4:e8232, 2009.
[353] O. Harismendy, P. C. Ng, R. L. Strausberg, X. Wang, T. B. Stockwell, K. Y. Beeson, N. J. Schork, S. S. Murray,E. J. Topol, S. Levy, and K. A. Frazer. Evaluation of next generation sequencing platforms for populationtargeted sequencing studies. Genome Biol., 10:R32, 2009.
[354] N. F. Asan, Y. Xu, H. Jiang, C. Tyler-Smith, Y. Xue, T. Jiang, J. Wang, M. Wu, X. Liu, G. Tian, J. Wang, J. Wang,H. Yang, and X. Zhang. Comprehensive comparison of three commercial human whole-exome capture plat-forms. Genome Biol, 12:R95, Sep 2011.
[355] L. Cartegni, S. L. Chew, and A. R. Krainer. Listening to silence and understanding nonsense: exonic mutationsthat affect splicing. Nat. Rev. Genet., 3:285–298, Apr 2002.
[356] M. J. Bamshad, S. B. Ng, A. W. Bigham, H. K. Tabor, M. J. Emond, D. A. Nickerson, and J. Shendure. Exomesequencing as a tool for Mendelian disease gene discovery. Nat. Rev. Genet., 12:745–755, 2011.
[357] Megan Hwa. Brewer. Molecular genetics of X-linked Charcot-Marie-Tooth neuropathy (CMTX3). Master’sthesis, Faculty of Medicine, University of Sydney, 2011.
[358] H. Li and R. Durbin. Fast and accurate short read alignment with Burrows-Wheeler transform. Bioinformatics,25:1754–1760, Jul 2009.
[359] H. Li, B. Handsaker, A. Wysoker, T. Fennell, J. Ruan, N. Homer, G. Marth, G. Abecasis, and R. Durbin. TheSequence Alignment/Map format and SAMtools. Bioinformatics, 25:2078–2079, Aug 2009.
[360] B. Giardine, C. Riemer, R. C. Hardison, R. Burhans, L. Elnitski, P. Shah, Y. Zhang, D. Blankenberg, I. Albert,J. Taylor, W. Miller, W. J. Kent, and A. Nekrutenko. Galaxy: a platform for interactive large-scale genomeanalysis. Genome Res., 15:1451–1455, Oct 2005.
[361] J. T. Robinson, H. Thorvaldsdottir, W. Winckler, M. Guttman, E. S. Lander, G. Getz, and J. P. Mesirov. Integra-tive genomics viewer. Nat. Biotechnol., 29:24–26, Jan 2011.
[362] K. Verhoeven, K. G. Claeys, S. Zuchner, J. M. Schroder, J. Weis, C. Ceuterick, A. Jordanova, E. Nelis,E. De Vriendt, M. Van Hul, P. Seeman, R. Mazanec, G. M. Saifi, K. Szigeti, P. Mancias, I. J. Butler, A. Kochanski,B. Ryniewicz, J. De Bleecker, P. Van den Bergh, C. Verellen, R. Van Coster, N. Goemans, M. Auer-Grumbach,W. Robberecht, V. Milic Rasic, Y. Nevo, I. Tournev, V. Guergueltcheva, F. Roelens, P. Vieregge, P. Vinci, M. T.Moreno, H. J. Christen, M. E. Shy, J. R. Lupski, J. M. Vance, P. De Jonghe, and V. Timmerman. MFN2 mutationdistribution and genotype/phenotype correlation in Charcot-Marie-Tooth type 2. Brain, 129:2093–2102, Aug2006.
[363] L. Bartoloni, J. L. Blouin, Y. Pan, C. Gehrig, A. K. Maiti, N. Scamuffa, C. Rossier, M. Jorissen, M. Armengot,M. Meeks, H. M. Mitchison, E. M. Chung, C. D. Delozier-Blanchet, W. J. Craigen, and S. E. Antonarakis.Mutations in the DNAH11 (axonemal heavy chain dynein type 11) gene cause one form of situs inversustotalis and most likely primary ciliary dyskinesia. Proc. Natl. Acad. Sci. U.S.A., 99:10282–10286, Aug 2002.
[364] G. C. Schwabe, K. Hoffmann, N. T. Loges, D. Birker, C. Rossier, M. M. de Santi, H. Olbrich, M. Fliegauf,M. Failly, U. Liebers, M. Collura, G. Gaedicke, S. Mundlos, U. Wahn, J. L. Blouin, B. Niggemann, H. Omran,S. E. Antonarakis, and L. Bartoloni. Primary ciliary dyskinesia associated with normal axoneme ultrastructureis caused by DNAH11 mutations. Hum. Mutat., 29:289–298, Feb 2008.
[365] G. T. Banks and E. M. Fisher. Cytoplasmic dynein could be key to understanding neurodegeneration. GenomeBiol., 9:214, 2008.
[366] J. Eschbach and L. Dupuis. Cytoplasmic dynein in neurodegeneration. Pharmacol. Ther., 130:348–363, Jun 2011.
[367] Q. Wu and T. Maniatis. A striking organization of a large family of human neural cadherin-like cell adhesiongenes. Cell, 97:779–790, Jun 1999.
[368] X. Wang, J. A. Weiner, S. Levi, A. M. Craig, A. Bradley, and J. R. Sanes. Gamma protocadherins are requiredfor survival of spinal interneurons. Neuron, 36:843–854, Dec 2002.

bibliography 282
[369] C. Zou, W. Huang, G. Ying, and Q. Wu. Sequence analysis and expression mapping of the rat clusteredprotocadherin gene repertoires. Neuroscience, 144:579–603, Jan 2007.
[370] B. Tasic, C. E. Nabholz, K. K. Baldwin, Y. Kim, E. H. Rueckert, S. A. Ribich, P. Cramer, Q. Wu, R. Axel, andT. Maniatis. Promoter choice determines splice site selection in protocadherin alpha and gamma pre-mRNAsplicing. Mol. Cell, 10:21–33, Jul 2002.
[371] X. Wang, H. Su, and A. Bradley. Molecular mechanisms governing Pcdh-gamma gene expression: evidencefor a multiple promoter and cis-alternative splicing model. Genes Dev., 16:1890–1905, Aug 2002.
[372] Q. Wu, T. Zhang, J. F. Cheng, Y. Kim, J. Grimwood, J. Schmutz, M. Dickson, J. P. Noonan, M. Q. Zhang,R. M. Myers, and T. Maniatis. Comparative DNA sequence analysis of mouse and human protocadherin geneclusters. Genome Res., 11:389–404, Mar 2001.
[373] J. A. Weiner, X. Wang, J. C. Tapia, and J. R. Sanes. Gamma protocadherins are required for synaptic develop-ment in the spinal cord. Proc. Natl. Acad. Sci. U.S.A., 102:8–14, Jan 2005.
[374] E. LeGuern, A. Guilbot, M. Kessali, N. Ravise, J. Tassin, T. Maisonobe, D. Grid, and A. Brice. Homozygositymapping of an autosomal recessive form of demyelinating Charcot-Marie-Tooth disease to chromosome 5q23-q33. Hum. Mol. Genet., 5:1685–1688, Oct 1996.
[375] H. Azzedine, N. Ravise, C. Verny, A. Gabreels-Festen, M. Lammens, D. Grid, J. M. Vallat, G. Durosier,J. Senderek, S. Nouioua, T. Hamadouche, A. Bouhouche, A. Guilbot, C. Stendel, M. Ruberg, A. Brice, N. Birouk,O. Dubourg, M. Tazir, and E. LeGuern. Spine deformities in Charcot-Marie-Tooth 4C caused by SH3TC2 genemutations. Neurology, 67:602–606, Aug 2006.
[376] M. Magrane and U. Consortium. UniProt Knowledgebase: a hub of integrated protein data. Database (Oxford),2011:bar009, 2011.
[377] M. J. Clark, R. Chen, H. Y. Lam, K. J. Karczewski, R. Chen, G. Euskirchen, A. J. Butte, and M. Snyder. Perfor-mance comparison of exome DNA sequencing technologies. Nat. Biotechnol., 29:908–914, 2011.
[378] M. Dejesus-Hernandez, I. R. Mackenzie, B. F. Boeve, A. L. Boxer, M. Baker, N. J. Rutherford, A. M. Nicholson,N. A. Finch, H. Flynn, J. Adamson, N. Kouri, A. Wojtas, P. Sengdy, G. Y. Hsiung, A. Karydas, W. W. Seeley, K. A.Josephs, G. Coppola, D. H. Geschwind, Z. K. Wszolek, H. Feldman, D. S. Knopman, R. C. Petersen, B. L. Miller,D. W. Dickson, K. B. Boylan, N. R. Graff-Radford, and R. Rademakers. Expanded GGGGCC HexanucleotideRepeat in Noncoding Region of C9ORF72 Causes Chromosome 9p-Linked FTD and ALS. Neuron, 72:245–256,Oct 2011.
[379] A. E. Renton, E. Majounie, A. Waite, J. Simon-Sanchez, S. Rollinson, J. R. Gibbs, J. C. Schymick, H. Laaksovirta,J. C. van Swieten, L. Myllykangas, H. Kalimo, A. Paetau, Y. Abramzon, A. M. Remes, A. Kaganovich, S. W.Scholz, J. Duckworth, J. Ding, D. W. Harmer, D. G. Hernandez, J. O. Johnson, K. Mok, M. Ryten, D. Trabzuni,R. J. Guerreiro, R. W. Orrell, J. Neal, A. Murray, J. Pearson, I. E. Jansen, D. Sondervan, H. Seelaar, D. Blake,K. Young, N. Halliwell, J. B. Callister, G. Toulson, A. Richardson, A. Gerhard, J. Snowden, D. Mann, D. Neary,M. A. Nalls, T. Peuralinna, L. Jansson, V. M. Isoviita, A. L. Kaivorinne, M. Holtta-Vuori, E. Ikonen, R. Sulkava,M. Benatar, J. Wuu, A. Chio, G. Restagno, G. Borghero, M. Sabatelli, D. Heckerman, E. Rogaeva, L. Zinman,J. D. Rothstein, M. Sendtner, C. Drepper, E. E. Eichler, C. Alkan, Z. Abdullaev, S. D. Pack, A. Dutra, E. Pak,J. Hardy, A. Singleton, N. M. Williams, P. Heutink, S. Pickering-Brown, H. R. Morris, P. J. Tienari, and B. J.Traynor. A Hexanucleotide Repeat Expansion in C9ORF72 Is the Cause of Chromosome 9p21-Linked ALS-FTD. Neuron, 72:257–268, Oct 2011.
[380] H. Daoud, P. N. Valdmanis, P. A. Dion, and G. A. Rouleau. Analysis of DPP6 and FGGY as candidate genesfor amyotrophic lateral sclerosis. Amyotroph Lateral Scler, 11:389–391, Aug 2010.