Genetic-linkage mapping of complex hereditary disorders to
14
10.1101/gr.075622.107 Access the most recent version at doi: 2008 18: 1150-1162; originally published online Apr 16, 2008; Genome Res. Ivan Iossifov, Tian Zheng, Miron Baron, T. Conrad Gilliam and Andrey Rzhetsky whole-genome molecular-interaction network Genetic-linkage mapping of complex hereditary disorders to a data Supplementary http://www.genome.org/cgi/content/full/gr.075622.107/DC1 "Supplemental Research Data" References http://www.genome.org/cgi/content/full/18/7/1150#References This article cites 49 articles, 12 of which can be accessed free at: Open Access Freely available online through the Genome Research Open Access option. service Email alerting click here top right corner of the article or Receive free email alerts when new articles cite this article - sign up in the box at the Notes http://www.genome.org/subscriptions/ go to: Genome Research To subscribe to © 2008 Cold Spring Harbor Laboratory Press Cold Spring Harbor Laboratory Press on July 18, 2008 - Published by www.genome.org Downloaded from
Transcript of Genetic-linkage mapping of complex hereditary disorders to
10.1101/gr.075622.107Access the most recent version at doi: 2008 18: 1150-1162; originally published online Apr 16, 2008; Genome Res.
Ivan Iossifov, Tian Zheng, Miron Baron, T. Conrad Gilliam and Andrey Rzhetsky
whole-genome molecular-interaction networkGenetic-linkage mapping of complex hereditary disorders to a
dataSupplementary
http://www.genome.org/cgi/content/full/gr.075622.107/DC1 "Supplemental Research Data"
References
http://www.genome.org/cgi/content/full/18/7/1150#References
This article cites 49 articles, 12 of which can be accessed free at:
Open Access Freely available online through the Genome Research Open Access option.
serviceEmail alerting
click heretop right corner of the article or Receive free email alerts when new articles cite this article - sign up in the box at the
Notes
http://www.genome.org/subscriptions/ go to: Genome ResearchTo subscribe to
© 2008 Cold Spring Harbor Laboratory Press
Cold Spring Harbor Laboratory Press on July 18, 2008 - Published by www.genome.orgDownloaded from
Genetic-linkage mapping of complex hereditarydisorders to a whole-genome molecular-interactionnetworkIvan Iossifov,1 Tian Zheng,2 Miron Baron,3 T. Conrad Gilliam,4
and Andrey Rzhetsky4,5,6
1Department of Biomedical Informatics, Center for Computational Biology and Bioinformatics, Columbia University, New York,New York 10032, USA; 2Department of Statistics, Columbia University, New York, New York 10027, USA; 3Department ofPsychiatry, Columbia University, New York, New York 10032, USA; 4Department of Human Genetics, University of Chicago,Chicago, Illinois 60637, USA; 5Department of Medicine, Institute for Genomics & Systems Biology, Computation Institute,University of Chicago, Chicago, Illinois 60637, USA
Common hereditary neurodevelopmental disorders such as autism, bipolar disorder, and schizophrenia are mostlikely both genetically multifactorial and heterogeneous. Because of these characteristics traditional methods forgenetic analysis fail when applied to such diseases. To address the problem we propose a novel probabilisticframework that combines the standard genetic linkage formalism with whole-genome molecular-interaction data topredict pathways or networks of interacting genes that contribute to common heritable disorders. We apply themodel to three large genotype–phenotype data sets, identify a small number of significant candidate genes forautism (24), bipolar disorder (21), and schizophrenia (25), and predict a number of gene targets likely to be sharedamong the disorders.
[Supplemental material is available online at www.genome.org.]
Autism, bipolar disorder, and schizophrenia are common mala-dies characterized by moderate to high heritability, such thatpatterns of DNA sequence variation transmitted from parents tooffspring should correlate with susceptibility to (or protectionagainst) disease. Numerous epidemiological and genetic analyseshave suggested that none of these disorders can be explained bya single environmental or genetic cause and that all are probablygrounded in multiple genetic abnormalities (Veenstra-VanderWeele et al. 2004; Harrison and Weinberger 2005; Crad-dock and Forty 2006). In contrast to rare hereditary disorders,where the genetic mapping of single-gene disease-causing muta-tions has been enormously successful (McKusick 2007), the de-tection of multilocus genetic variation that renders the indi-vidual susceptible to development of a common heritable disor-der has proved to be much more challenging.
A major obstacle to the detection of heritable patterns ofdisease susceptibility is the curse of dimensionality (Bellman1961)—the exponentially expanding search space required to ex-plore all combinations of m genes or m genetic loci. Assumingthat we have 25,000 genes in our genome, the number of possiblecombinations of m genes increases exponentially, from roughly108 to 1012, to 1016, to 1037 for m = 2, 3, 4, and 10, respectively.Moreover, even the largest human genetics studies are limited tothe observation of several thousand meiotic events (the numberof instances where we can evaluate transmission of a given ge-netic variant from parents to offspring). Consequently, an ex-haustive combinatorial search of even very small sets of multiple
genetic loci would lead to an enormous burden of false-positivesignals for every real linkage signal because the number of statis-tical tests of significance performed on the same data set becomestoo large to allow for any useful level of statistical power.
The second obstacle to detecting multigenic inheritance isthat, even when a set of genes is identified as related to a disease,how variations within the genes jointly affect the susceptibilityto disease remains unknown. Genetic variation across multipleinteracting genes may affect phenotype in a linear (additive)manner or in a nonlinear (epistatic) way; the groups of interact-ing genes are likely to affect the disease phenotypes via an as-yet-unknown mixture of both interaction types. Furthermore,disease susceptibility may increase incrementally with increasinggenetic variation or dichotomously via a threshold effect. Finally,there is well-grounded suspicion (Harrison and Weinberger 2005)that the genetic causes of a given disorder can be completely orpartially different for different affected families. Although it istempting to test the whole spectrum of inheritance models, cur-rently it is an impractical task: The total number of possible mod-els of inheritance involving m genetically interacting genesgrows exponentially with m, and that increase further exacer-bates the exponential growth of the number of distinct gene setsof size m.
To address these practical and theoretical complications, wepropose a novel probabilistic method. This method restricts thesearch space for candidate gene sets by using knowledge aboutmolecular pathways and explicitly incorporates informationabout within-data set heterogeneity. Our approach extends thewell-established multipoint genetic linkage model (Kruglyak etal. 1996). Multipoint linkage analysis is a mathematical modelthat detects correlations between disease phenotypes within hu-man families and states of multiple polymorphic genetic markersthat are experimentally probed in every family member. Our ex-
6Corresponding author.E-mail [email protected]; fax (773) 834-2877.Article published online before print. Article and publication date are at http://www.genome.org/cgi/doi/10.1101/gr.075622.107. Freely available onlinethrough the Genome Research Open Access option.
Methods
1150 Genome Researchwww.genome.org
18:1150–1162 ©2008 by Cold Spring Harbor Laboratory Press; ISSN 1088-9051/08; www.genome.org
Cold Spring Harbor Laboratory Press on July 18, 2008 - Published by www.genome.orgDownloaded from

tension of the standard multipoint linkage analysis includes twoadditional major assumptions. First, unlike in previous work(Krauthammer et al. 2004; Aerts et al. 2006; Franke et al. 2006; Tuet al. 2006; De Bie et al. 2007; Lage et al. 2007), we assume thatgenetic variation within multiple genes (rather than a single genethat is common to all affected individuals) can influence thedisease phenotype and that potential disease-predisposing genesare grouped into a compact gene cluster within a molecular net-work (“gene cluster” is defined precisely below). We explicitlymodel biological information about functional relationships be-tween genes as a large molecular network of physical interac-tions. Using the constraints imposed by the molecular network,we dramatically restrict the search for sets of genes that can pre-dispose a person to a complex disorder and we also formulategene predictions that are biologically rooted. Second, we explic-itly assume that heterogeneity of genetic variations underlie thesame phenotype in different affected families. Following Oc-cam’s razor (“All things being equal, choose the simplesttheory”), we start by implementing the simplest generativemodel of a complex disease (single-gene genetic heterogeneity).We apply the extended model to detect significant correlationsamong three disease phenotypes (autism, bipolar disorder, andschizophrenia) and genetic variation in groups of genes that areunited by known physical and biochemical interactions (such as“BCL2 binds BAD” and “CDK5/DCTN5 phosphorylates TP53,” seethe following section and the Model Definition section for mod-eling details).
Instead of computationally testing all possible sets of mgenes as candidates for harboring disease-predisposing geneticvariation, we restrict our analysis to a much smaller collection ofm-gene sets that encode physically interacting molecules. Fur-thermore, we implement a procedure to enhance the linkagesignal by computing gene-specific P-values that characterize link-age significance (see Gene-Specific Significance Tests section).The gene-specific significance test measures how likely it is thata particular gene is linked to a phenotype given that the pheno-type is unlinked to any position in the genome. We need this testbecause genes within a large molecular network differ markedlyin their topological neighborhoods; the highly connected genestend to be spuriously implicated in linkage to a phenotype morefrequently than the poorly connected genes. We also identifyhighly nonrandom overlaps among predicted candidate genesfor all combinations of the three disorders (see Overlap Signifi-cance in the Supplemental material).
In this study, we use a molecular-interaction network gen-erated by the large-scale text-mining project GeneWays (Rzhet-sky et al. 2004). Our analysis uses only direct interactions be-tween genes or their products (a total of 47 distinct types, such asbinding, phosphorylation, and methylation) as opposed to regu-latory interactions between pairs of genes that are indirect (acti-vation or inhibition) and can be mediated by a large number ofother molecules. Our molecular network includes nearly 4000genes (see Molecular Network in the Supplemental material fordetails).
Gene clusters and gene mixture generative modelof a complex disease
When thinking about a complex hereditary disorder, we imaginea set of genes that can contribute to the risk of contracting agiven disease phenotype when the sequence of at least one ofthem is critically modified. Under this assumption we define a
gene cluster, C, as a set of genes with members that are groupedby their ability to harbor genetic polymorphisms that predisposethe bearer to a specific disease. For every gene within a genecluster C we define a cluster probability, denoted by pi (for the ithgene, i = 1, . . . , c, where c is the size of the cluster), so that thesum of pi over i = 1, . . . , c is equal to 1. We can think of thecluster probability pi as the share of guilt attributable to varia-tions at the locus of the ith gene for the disease phenotype in alarge group of randomly selected disease-affected families. Con-sider a hypothetical example that illustrates these concepts.Imagine that we have two genes, A and B, that encode directlyinteracting proteins; according to our definition, we have a genecluster of size c = 2. Furthermore, imagine that both genes canharbor genetic variation predisposing the bearer to disorder Z, sothat, among people affected with disease Z, 60% have harmfulpolymorphisms in gene A while the remaining 40% of affectedindividuals bear an aberration in gene B. In our model genes Aand B would be associated with cluster probabilities 0.6 and 0.4,respectively.
Here we explicitly assume that gene clusters are sets of genesthat are joined through direct molecular interactions into a “con-nected subgraph”. This assumption appears to be well-justifiedbased on our study of the physical-interaction clustering of genesharboring variations responsible for Mendelian and complexphenotypes (Feldman et al. 2008). We have discovered that genesknown to participate in the same polygenic disorder tend to beclose to each other in a molecular network; this result holds fortwo independently derived and rather different molecular-network models, including the molecular network used in thisstudy.
A gene that has a zero cluster probability may not be directlyinvolved in the disease etiology even though it is a member ofthe gene cluster that has the highest likelihood value. These zero-contribution genes can serve as connectors for genes that arestrongly linked to the disease. On the other hand, genes withhigher cluster probabilities are potentially more attractive puta-tive targets for development of drugs and diagnostic tests becausethey account for a larger number of individuals affected by thedisease and are more likely to bear disease-predisposing polymor-phisms at the corresponding loci. A sufficiently large set of geneswith appropriate cluster probabilities can be used to represent anarbitrary complex topological arrangement of a set of network-linked genes, albeit at a computational cost that grows rapidlywith an increase in gene cluster size. Using the substantial com-putational resources at our disposal, in this study we analyzeclusters up to 10 genes for all three disorders.
The precise formulation of our mathematical model requirestwo additional assumptions. First, we assume that only thosegenes that are within a gene cluster, C, harbor a disease-predisposing variation. Second, we assume that, for every familyunder analysis, exactly one gene from cluster C is a disease-predisposing gene. That is, the phenotype status of every indi-vidual is determined by the state (the allele) of the family-specificgene in the individual’s genome. Thus, our disease model is amixture of probabilistic models, each of which is determined byone disease-predisposing gene in C, with the mixing coefficientsbeing the cluster probabilities. The set of families affected by thesame disease under this model is a mixture of families that arepredisposed to the disease via mutations at different genes thatbelong to C.
Under these assumptions, we combine the molecular-interaction network in the GeneWays 6.0 database (Rzhetsky et
Molecular network linkage
Genome Research 1151www.genome.org
Cold Spring Harbor Laboratory Press on July 18, 2008 - Published by www.genome.orgDownloaded from
al. 2004) with whole-genome microsatellite genetic-linkage in-formation to test multigenic patterns of inheritance in three ma-jor neurodevelopmental disorders. Specifically, we analyze geno-typic and phenotypic data from three of the largest genetic link-age data collections. These data represent 336 multiplex autismfamilies, 414 multiplex bipolar families, and 87 multiplex schizo-phrenia families (see Supplemental Table S5 for detailed infor-mation). A family is dubbed “multiplex” with respect to a specificdisease if it includes more than one affected person. Evidence forsingle-gene contributions (in the context of interactive gene net-works) to disease susceptibility is represented as a set of simula-tion-based empirical P-values (see Tables 1, 2).
We analyzed multiple disorders for several reasons. Mostimportantly, despite their differences these three disorders sharemultiple symptoms. Autism, which has been recognized as anindependent disorder only in recent years, was originally called“childhood schizophrenia” because of multiple symptom over-lap (Akande et al. 2004; Harrison and Weinberger 2005), particu-larly the presence of negative symptoms of schizophrenia (suchas disruption of processing of emotions and social withdrawal).Similarly, bipolar disorder and schizophrenia form a continuumof symptoms (phenotypes), with a phenotypic variant calledschizoaffective disorder lying in between (a union of symptomsof both disorders). Several less common symptoms of autism andbipolar disorder (for example, hallucinations, that are only an-ecdotally reported in autistic patients; see Mukhopadhyay 2003)also overlap (Stahlberg et al. 2004). A significant literature de-scribes the symptomatology shared among these three neuropsy-chiatric disorders, particularly for schizophrenia and bipolar dis-order. The organic causes of the three disorders remain mysteri-
ous, so in each case diagnosis depends largely on behavioralsymptoms. We suggest that shared genetic variations underliethe similar behavioral symptoms in these distinctly defined dis-orders.
Prior work
Several years ago we (Krauthammer et al. 2004) proposed amethod that, given a molecular network and a set of gene-specific genetic linkage signals, identifies network neighbor-hoods that are significantly enriched with genes with higher-than-average linkage scores. We assumed that a human molecu-lar-interaction network harbors numerous connected subgraphsand that each subgraph is causally linked to a specific diseasephenotype. We originally applied our algorithm to analyze Alz-heimer’s disease data. A subsequent study (Franke et al. 2006)evaluated this approach within the context of a large molecularnetwork computed by integrating multiple whole-genome datasets; their analysis covered several Mendelian and polygenic dis-orders. Another group (Tu et al. 2006) applied pathway informa-tion to guide their inference of genetic trans-regulators, startingwith a genetic analysis of gene expression in yeast. Many groupsof researchers have used molecular networks to prioritize theirexperimentally identified candidate genes by estimating andranking functional similarity scores of the candidate genes toother molecules involved within the same disorder or pathway(Aerts et al. 2006; De Bie et al. 2007; Lage et al. 2007).
All of these methods have two things in common: a classical(molecular pathway-oblivious) genetic analysis and a procedurefor pathway-guided ranking of putative correlations betweenphenotypes and genomic loci. Our computer simulations (see
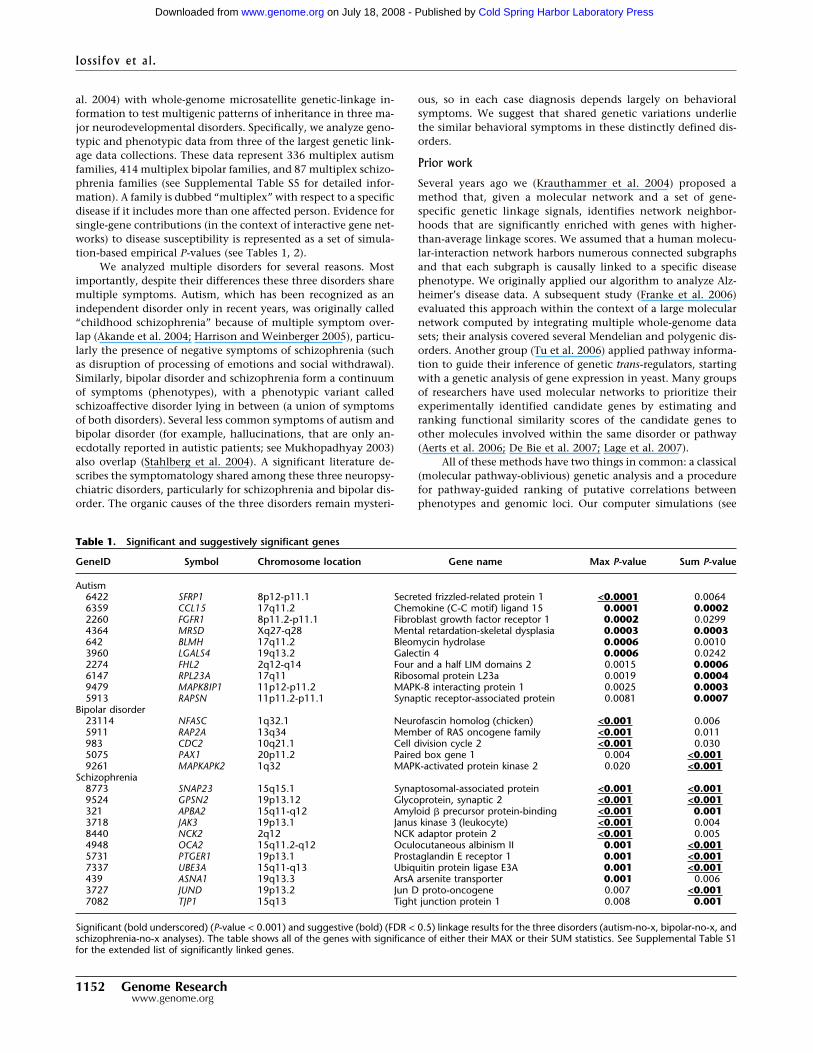
Table 1. Significant and suggestively significant genes
GeneID Symbol Chromosome location Gene name Max P-value Sum P-value
Autism6422 SFRP1 8p12-p11.1 Secreted frizzled-related protein 1 <0.0001 0.00646359 CCL15 17q11.2 Chemokine (C-C motif) ligand 15 0.0001 0.00022260 FGFR1 8p11.2-p11.1 Fibroblast growth factor receptor 1 0.0002 0.02994364 MRSD Xq27-q28 Mental retardation-skeletal dysplasia 0.0003 0.0003642 BLMH 17q11.2 Bleomycin hydrolase 0.0006 0.00103960 LGALS4 19q13.2 Galectin 4 0.0006 0.02422274 FHL2 2q12-q14 Four and a half LIM domains 2 0.0015 0.00066147 RPL23A 17q11 Ribosomal protein L23a 0.0019 0.00049479 MAPK8IP1 11p12-p11.2 MAPK-8 interacting protein 1 0.0025 0.00035913 RAPSN 11p11.2-p11.1 Synaptic receptor-associated protein 0.0081 0.0007
Bipolar disorder23114 NFASC 1q32.1 Neurofascin homolog (chicken) <0.001 0.0065911 RAP2A 13q34 Member of RAS oncogene family <0.001 0.011983 CDC2 10q21.1 Cell division cycle 2 <0.001 0.0305075 PAX1 20p11.2 Paired box gene 1 0.004 <0.0019261 MAPKAPK2 1q32 MAPK-activated protein kinase 2 0.020 <0.001
Schizophrenia8773 SNAP23 15q15.1 Synaptosomal-associated protein <0.001 <0.0019524 GPSN2 19p13.12 Glycoprotein, synaptic 2 <0.001 <0.001321 APBA2 15q11-q12 Amyloid � precursor protein-binding <0.001 0.0013718 JAK3 19p13.1 Janus kinase 3 (leukocyte) <0.001 0.0048440 NCK2 2q12 NCK adaptor protein 2 <0.001 0.0054948 OCA2 15q11.2-q12 Oculocutaneous albinism II 0.001 <0.0015731 PTGER1 19p13.1 Prostaglandin E receptor 1 0.001 <0.0017337 UBE3A 15q11-q13 Ubiquitin protein ligase E3A 0.001 <0.001439 ASNA1 19q13.3 ArsA arsenite transporter 0.001 0.0063727 JUND 19p13.2 Jun D proto-oncogene 0.007 <0.0017082 TJP1 15q13 Tight junction protein 1 0.008 0.001
Significant (bold underscored) (P-value < 0.001) and suggestive (bold) (FDR < 0.5) linkage results for the three disorders (autism-no-x, bipolar-no-x, andschizophrenia-no-x analyses). The table shows all of the genes with significance of either their MAX or their SUM statistics. See Supplemental Table S1for the extended list of significantly linked genes.
Iossifov et al.
1152 Genome Researchwww.genome.org
Cold Spring Harbor Laboratory Press on July 18, 2008 - Published by www.genome.orgDownloaded from

Simulations in the Supplemental material) indicate that, if thedisease phenotype is inherited according to the genetic hetero-geneity model (network gene cluster), as implemented in our
current approach, the classical single-locus genetic analysismethods tend to perform poorly in identifying disease suscepti-bility genes.
Table 2. Significant overlaps between suggestively linked genes for pairs and the triplet of disorders
Gene ID Symbol Location Gene name
P-value
Autism Bipolar Combined
Autism and bipolar disorder
1380 CR2 1q32 Complement component receptor 2 0.094 0.002 0.00155783 PTPN13 4q21.3 Protein tyrosine phosphatase 0.019 0.030 0.00267884 SLBP 4p16.3 Stem–loop binding protein 0.026 0.030 0.003411069 RAPGEF4 2q31-q32 Rap guanine exchange factor 4 0.033 0.030 0.00435602 MAPK10 4q22.1-q23 MAPK 10 0.067 0.019 0.00588853 DDEF2 2p25 Differentiation enhancing factor 2 0.063 0.024 0.00668881 CDC16 13q34 Cell division cycle 16 0.028 0.060 0.00713745 KCNB1 20q13.2 Potassium voltage-gated channel 1 0.071 0.044 0.012426765 SNORD12C 20q13.13 RNA, small nucleolar 0.044 0.071 0.012422915 MMRN1 4q22 Multimerin 1 0.091 0.046 0.01645799 PTPRN2 7q36 Protein tyrosine phosphatase 0.065 0.071 0.01751869 E2F1 20q11.2 E2F transcription factor 1 0.093 0.050 0.01794023 LPL 8p22 Lipoprotein lipase 0.079 0.065 0.019355294 FBXW7 4q31.3 Archipelago homolog (Drosophila) 0.059 0.094 0.02094741 NEF3 8p21 Neurofilament 3 0.070 0.086 0.02232444 FRK 6q21-q22.3 Fyn-related kinase 0.079 0.094 0.02696194 RPS6 9p21 Ribosomal protein S6 0.098 0.079 0.0279
Autism and schizophrenia Autism Schiz. Combined
10913 EDAR 2q11-q13 Ectodysplasin A receptor <0.001 0.042 0.00022274 FHL2 2q12-q14 Four and a half LIM domains 2 0.014 0.006 0.00045903 RANBP2 2q12.3 RAN binding protein 2 0.022 0.007 0.00089672 SDC3 1pter-p22.3 Syndecan 3 (N-syndecan) 0.005 0.066 0.0019266710 COMA 2q13 Congential oculomotor apraxia 0.013 0.048 0.00307188 TRAF5 1q32 TNF receptor-associated factor 5 0.031 0.031 0.004226765 SNORD12C 20q13.13 RNA, small nucleolar 0.044 0.047 0.008410018 BCL2L11 2q13 Apoptosis facilitator 0.052 0.044 0.00928027 STAM 10p14-p13 Signal transducing adaptor 1 0.068 0.041 0.01129994 CASP8AP2 6q15 CASP8-associated protein 2 0.065 0.055 0.01395602 MAPK10 4q22.1-q23 MAPK 10 0.067 0.077 0.01939892 SNAP91 6q14.2 Synaptosomal-associated protein 0.067 0.091 0.022622915 MMRN1 4q22 Multimerin 1 0.091 0.082 0.026911162 NUDT6 4q26 Nudix-type motif 6 0.080 0.096 0.02775464 PPA1 10q11.1-q24 Pyrophosphatase 1 0.095 0.094 0.0316
Bipolar disorder and schizophrenia Bipolar Schiz. Combined
5707 PSMD1 2q37.1 Proteasome 26S subunit 1 0.005 0.053 0.0015685 BTC 4q13-q21 Betacellulin 0.048 0.008 0.002010611 PDLIM5 4q22 PDZ and LIM domain 5 0.034 0.018 0.00282159 F10 13q34 Coagulation factor X 0.082 0.017 0.00655602 MAPK10 4q22.1-q23 MAPK 10 0.019 0.077 0.00674691 NCL 2q12-qter Nucleolin 0.024 0.065 0.00683267 HRB 2q36.3 HIV-1 Rev binding protein 0.030 0.082 0.01038720 MBTPS1 16 Transcription factor peptidase 0.048 0.060 0.011426765 SNORD12C 20q13.13 RNA, small nucleolar 0.071 0.047 0.013122915 MMRN1 4q22 Multimerin 1 0.046 0.082 0.01484851 NOTCH1 9q34.3 Notch homolog 1 (Drosophila) 0.075 0.081 0.022489874 SLC25A21 14q11.2 Solute carrier family 0.083 0.099 0.02942798 GNRHR 4q21.2 Gonadotropin-releasing receptor 0.087 0.099 0.0306
Overlap between autism, schizophrenia, and bipolar disorder Autism Schiz. Bipolar Combined
5602 MAPK10 4q22.1-q23 MAPK 10 0.067 0.077 0.019 0.002026765 SNORD12C 20q13.13 RNA, small nucleolar 0.044 0.047 0.071 0.002622915 MMRN1 4q22 Multimerin 1 0.091 0.082 0.046 0.0054
Significant overlaps between suggestively linked genes for pairs and the triplet of disorders (autism-no-x, bipolar-no-x, and schizophrenia-no-x analyses).Shown are all of the genes that have SUM statistic P-values < 0.1 in pair- or triplet-disorder analyses. See Supplemental Table S2 for the gene overlapresults for analyses including the X chromosome. Note that the COMA gene shown here is not one of the genes approved by HUGO (see thegenes_not_in_HUGO.xls supplemental file for the list of the 49 genes included in our analysis that have not yet been included in the HUGO nomen-clature).
Molecular network linkage
Genome Research 1153www.genome.org
Cold Spring Harbor Laboratory Press on July 18, 2008 - Published by www.genome.orgDownloaded from

Results and Discussion
The best candidate genes identified by our analysis (see Tables 1,2) reside in genomic regions that are also supported, in a “subset”of affected families, by the conventional multipoint linkageanalysis applied to the same data. In this sense our results aredirectly compatible with those from earlier studies. Unlike pre-vious studies, however, our method analyzes “groups” of func-tionally related genes rather than individual genes and, as a re-sult, the linkage signal is magnified through summation overmultiple genes within the same gene cluster, while each indi-vidual gene may exhibit only a weak evidence of linkage. Fromthe gene cluster analysis, we obtain a small number of candidategenes for each disorder with significant empirical P-values thatare appropriately adjusted for multiple testing (see Gene-SpecificSignificance Tests section; Benjamini and Hochberg 1995; Ben-jamini and Yekutieli 2001). In contrast, the results of the tradi-tional linkage methods are large genomic regions that may con-tain hundreds of genes, only a few of which are directly linked tothe disorder. Furthermore, our gene-specific P-values differ fromthe traditional empirical genetic locus-specific P-values that arecomputed using strictly local linkage information. Our P-valuesare based on a simulation of whole-genome data under a no-linkage null model. The null model represents the worst-casescenario in which a phenotype is completely uncorrelated withthe states of the genetic markers under study; small P-values in-dicate that the null model fits the data poorly and that, therefore,a genetic linkage signal is present. Simulations under the nullmodel are followed by a search for the maximum-likelihood genecluster within a whole-genome molecular-interaction network(see Gene-Specific Significance Tests section; Tables 1, 2).
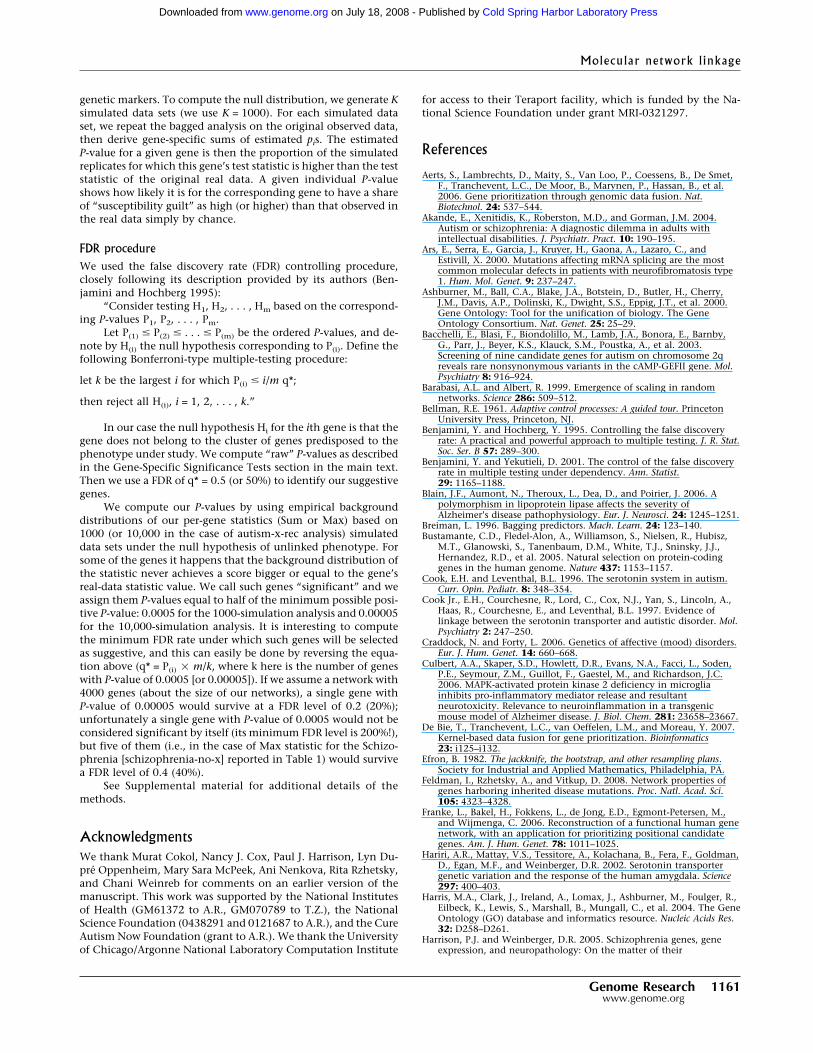
We present the results for chromosome 15 from the auto-some-only analysis of the schizophrenia families (Fig. 1A) to pro-vide an intuitive explanation of our methodology. The figuredisplays the whole-chromosome log-odds (LOD) scores for everyfamily in the data set computed using conventional multipoint-linkage methods. A log-odds score for a specific genomic positionis a decimal-base logarithm of the ratio of two probabilities whereone of the phenotypes is correlated with the given genomic po-sition and the other is uncorrelated with “any” genomic position(see Equation 2). Large positive values of this score indicatestrong evidence of correlation, whereas large negative values in-dicate strong evidence “against” correlation between a pheno-type and this particular genomic position. Superimposed on thefigure are the eight genes (UBE3A, OCA2, APBA2, TJP1, KLF13,GJD2, SNAP23, and MP2K5) that have significant gene-specificP-values according to our method. The most significant P-valuesare <0.001 for UBE3A, OCA2, and SNAP23; 0.001 for ABPA2;0.001 for TJP1; and 0.004 for KLF13. Note that these genes arelocated on the genetic map close to the maxima of the LOD scorefunctions for several families in the data set. In the Supplementalmaterials we show similar figures for each of the 22 autosomesand the X chromosome (where applicable) for all of the analysesthat we performed.
The conventional single-gene linkage signal for TJP1 orUBE3A on its own yields a weak empirical P-value because of thegenetic heterogeneity of the families: In addition to families withpositive LOD scores there are families that show strong negativesignals for both genes. It is only when we consider gene clustersthat the linkage signal becomes strong and obvious. Figure 2shows the typical output for this type of analysis for the schizo-phrenia data: The 14 top-ranking gene clusters are displayed with
their corresponding LOD score statistics (color-coded, see legend)on the left of the figure (Fig. 2A). The estimated gene clusterprobability (gene “guilt share” for the phenotype) is indicated bythe size of the corresponding gene node, and the chromosomallocation of each cluster gene and its cluster composition (color-coded) is displayed to the right (Fig. 2B,C). In contrast to themaximum-likelihood clusters, random clusters of 10 genes yieldoverwhelmingly negative cluster LOD scores (data not shown).
Figures 3 and 4 show results for the 14 top-scoring geneclusters for the corresponding autism and bipolar disorder datasets. The gene clusters shown in Figures 2, 3, and 4 vividly illus-trate the uneven contribution of different genes within the samecluster to the overall cluster LOD score. Each group of clusters hasheavy contributors: For example, UBE3A, CCT, and ABCC1 (forschizophrenia, autism, and bipolar disorder, respectively) havecluster probabilities of 0.32, 0.15, and 0.16. There are also geneswith nearly zero contribution to the cluster LOD score (such asthe ubiquitous brain-expressed ATP8A2, a major network hub;Barabasi and Albert 1999), which are nevertheless indispensableas connectors for multiple heavy-duty contributor genes.
Figure 5 shows a conglomerate of a larger number of top-ranking LOD score clusters for all three disorders, with gene-specific P-values for each involved gene (denoted by the size andcolor of the corresponding gene nodes). Figure 5A–C displays thetop-ranking 100, 100, and 50 10-gene clusters, for autism, bipolardisorder, and schizophrenia, respectively. Because the schizo-phrenia data set is relatively small, the top LOD clusters are lesscompact within the molecular network compared to those forautism and bipolar disorder. The 50-cluster molecular networkfor schizophrenia is almost as large as the 100-cluster networksfor autism and bipolar disorder. Nevertheless, the graphs indicatethat our input data are informative: We can imagine completelyuninformative data resulting in most of our 50 top LOD score10-gene clusters being disconnected and incorporating close to500 distinct genes, rather than covering a well-defined networkneighborhood.
Table 1 displays the top-ranking candidate genes for each ofthe three disease-gene analyses, rank-ordered based on theirgene-specific P-values. Following Lander and Kruglyak’s guide-lines (Lander and Kruglyak 1995), we classified all candidategenes for each of the three disorders represented in our molecularnetwork into significant (genes with apparent P-values < 0.001)and suggestively significant (genes that appear statistically sig-nificant at the false-discovery rate of 0.5; Benjamini and Hoch-berg 1995; Benjamini and Yekutieli 2001) (see FDR Proceduresection). Table 2 displays the top-ranking candidate genes de-tected in combinations of two- or three-disease analyses.
Figure 1 provides a pictorial summary of the data in Tables1 and 2, from which we make the following observations. First,the top-ranking clusters from each of the three data sets liewithin tightly clustered neighborhoods of the molecular-interaction network. The within-network proximity of the high-ranking gene candidates is higher for the larger data sets (autismand bipolar disorder). Second, the molecular-network neighbor-hoods for the three disorders are different, even though theypartially overlap. The figure suggests somewhat greater overlapamong susceptibility genes related to schizophrenia and bipolardisorder relative to autism. Finally, there are multiple genes withstrong P-values (<0.005) for more than one of the three disorders,as reflected by the color and size of the spheres (the color of eachtransparent sphere is associated with one of the three disorders;when the same node has strong P-values for more than one dis-
Iossifov et al.
1154 Genome Researchwww.genome.org
Cold Spring Harbor Laboratory Press on July 18, 2008 - Published by www.genome.orgDownloaded from

order, two or more spheres are nested and the resulting color is amixture).
A closer look at the candidate genes reveals that many areregulators of cell cycle and cell death (e.g., EDAR, BCL2L11,NEK6, SFRP1, and MAPK7). Another smaller subset of genes isresponsible for forming intercellular contacts (tight junction pro-tein 1 [TJP1], LGALS4, MMRN1, IBSP, and NPHP1). A few genesare brain-specific growth and signal-transduction receptors andsmall-molecule transporters (RAPSN, APBA2, UBE3A, ALK, andKCNB1), and a few others are related to the immune response(e.g., CCL15, CSF2, CD55, IL10).
In their recent study of positive selection patterns in thehuman genome, Bustamante et al. (2005) discovered that many
genes involved in cell-cycle and cell-death regulation appear tohave undergone recent positive selection in the lineage leadingto hominid primates. Thus, it is plausible that phenotypic effectsthat we classify as neurological disorders are artifacts of a mosaicof small genetic changes that occurred during evolutionary op-timization of multiple physiological systems involved in the un-usually prolonged individual development of a human brain. (Apathway-level natural selection was examined recently usingbacterial molecular networks; Wolf and Arkin 2003.) Develop-ment of the human brain involves a precisely orchestrated se-quence of decisions that determine cellular fate, and both genet-ics and environmental stimuli contribute to the live-or-die ver-dict for individual neurons. In retrospect, it is not surprising that
Figure 1. An example of genetic-linkage data used as the input to our analysis and the resulting network of top-scoring genes for the three disorders.(A) Standard multipoint-linkage analysis of human chromosome 15 for 94 schizophrenia families (schizophrenia-no-x analysis). Each line above thechromosome map represents the linkage signal for one family. Also shown are the positions of genetic markers on the chromosome map and the setof top-scoring candidate genes. In this case, four genes (CYFIP1, UBE3A, OCA2, and TJP1) have significant linkage statistics. (B) The molecular networkobtained by superimposition of the 70 best 10-gene clusters for each of the three disorders analyzed in this study (autism-no-x, bipolar-no-x, andschizophrenia-no-x analyses). Arrows indicate two genes (UBE3A and TJP1) discussed in the main text. Note that the COMA and TAM genes are not yetapproved by HUGO (see the genes_not_in_HUGO.xls supplemental file).
Molecular network linkage
Genome Research 1155www.genome.org
Cold Spring Harbor Laboratory Press on July 18, 2008 - Published by www.genome.orgDownloaded from

our top disease-predisposing candidate loci are enriched withthese cell-death (P-value of 0.03) and cell-cycle (P-value of 0.001)related genes as computed by a test of randomized gene samplingusing gene ontology (Ashburner et al. 2000; Harris et al. 2004)categories (P-values 0.03 and 0.001, respectively; see, for ex-ample, Rivals et al. 2007, for a description of the tests). However,this significance of enrichment is likely to be a mere reflection ofthe overall abundance of cell-cycle and cell-death related genesin our text-mined network (P < 10�10).
Although it is not feasible to describe our entire disease-
specific candidate gene set, a few genes merit comment. Re-searchers have previously considered several of our top-rankingcandidate genes in genetic analyses of complex neurodevelop-mental disorders. For example, Lovlie and colleagues already im-plicated our bipolar candidate, PLCG1, in bipolar disorder (Lovlieet al. 2001). The ion-transporter MLC1, one of our top-rankedgenes for autism, has been associated with schizophrenia andbipolar disorder (Verma et al. 2005). The UBE3A gene is impli-cated in autism when inherited as a maternal interstitial dupli-cation, which suggests both genetic and epigenetic causation;
Figure 2. Analysis of the 14 top-scoring 10-gene clusters for the schizophrenia data (schizophrenia-no-x). (A) Each cluster is shown separately, wherethe vertex size represents the cluster probability estimated for the corresponding gene. We used the color of the cluster to encode cluster LOD scores.(B) Position of all genes represented in the 14 clusters on human autosomes. (C) Molecular network combining the 14 clusters in one graph. In this case,the color and size of nodes indicate gene-specific P-values associated with each gene.
Iossifov et al.
1156 Genome Researchwww.genome.org
Cold Spring Harbor Laboratory Press on July 18, 2008 - Published by www.genome.orgDownloaded from

our finding of strong gene cluster contribution for UBE3A inschizophrenia is intriguing in view of multiple reports that ge-nomic imprinting may play a role in disease etiology (Veenstra-VanderWeele et al. 1999; Nurmi et al. 2001; Jiang et al. 2004).Gene expression and association analyses of PDLIM5 (which forus lies in the overlap between bipolar disorder and schizophre-nia) suggest its involvement in the etiology of bipolar disorderand schizophrenia (Kato et al. 2005), and RAPGEF4 (in the bipo-lar disorder and autism overlap genes) has been related to theautistic phenotype (Bacchelli et al. 2003). Intriguingly, many ofour candidate genes have been analyzed in relation to Alzhei-mer’s disease: BLMH (Nivet-Antoine et al. 2003); MAPK8IP1 (Hel-
becque et al. 2003); MAPKAPK2 (Culbert et al. 2006); LPL (Blainet al. 2006); NEFM (Wang et al. 2002); FRK (Watanabe et al.2004); and KCNIP3 (Jin et al. 2005). We also find interestingcandidates in the genes that barely missed meeting our statisticalsignificance criteria. For example, NRG1 (with a gene-specific P-value of 0.001 in one of our autism analyses) has been long con-sidered by experts to be the top schizophrenia candidate gene(Harrison and Weinberger 2005), and NF1 (P-value of 0.0009 inour autism analysis) is known to be genetically linked to neuro-fibromatosis (Ars et al. 2000), a Mendelian genetic disorder withpronounced cognitive symptoms.
All 14 top-ranking autism clusters include the serotonin
Figure 3. Analysis of the 14 top-scoring 10-gene clusters for the autism data (autism-x-rec); see Figure 2 for explanation of panels A–C. Note that thePKC and TAM genes are not yet approved by HUGO (see the genes_not_in_HUGO.xls supplemental file).
Molecular network linkage
Genome Research 1157www.genome.org
Cold Spring Harbor Laboratory Press on July 18, 2008 - Published by www.genome.orgDownloaded from

transporter gene SLC6A4 (P-value of 0.0016 in our autism analy-sis). The SLC6A4 gene has long been implicated in the geneticetiology of autism based on both genetic and physiological evi-dence (Cook and Leventhal 1996; Cook et al. 1997; Klauck et al.1997; Yirmiya et al. 2001; Hariri et al. 2002; Kim et al. 2002).Moreover, conventional genetic linkage studies of this data setidentified SLC6A4 as the single top-ranking candidate gene (Yo-nan et al. 2003).
Note that our analysis does not identify as significant any ofthe 16 genes that were previously suggested to be most likelyrelated to schizophrenia susceptibility (Harrison and Weinberger2005). To verify our results, we superimpose the positions ofthese 16 genes with chromosome-specific linkage signals for the94 families described in our schizophrenia data set (see Supple-mental materials). Consistent with the hypothesis of genetic het-
erogeneity, we find that our 94 families provide no or very weaklinkage support for the majority of the 16 genes (e.g., RGS4 andDISC1 [chr 1]; GAD1 [chr 2]; and GRM3 [chr 7]). A subset of the94 families provides good linkage support for MUTED, DTNBP1,and OFCC1 (chr 6), but, unfortunately, these genes have fewknown direct physical interactions and are either disconnectedor poorly connected within our molecular-interaction network.If the hypothesis of genetic heterogeneity of the schizophreniaphenotype is correct, we should be able to find additional sup-port for some of these 16 genes when analyzing a greater numberof affected families and a larger molecular network.
Unlike our earlier predominantly heuristic approach(Krauthammer et al. 2004), our current work unifies molecularnetworks and the parametric genetic-linkage formalism within acoherent mathematical model whose parameters (cluster prob-
Figure 4. Analysis of the 14 top-scoring 10-gene clusters for the bipolar disorder data (bipolar-no-x); see Figure 2 for explanation of panels A–C.
Iossifov et al.
1158 Genome Researchwww.genome.org
Cold Spring Harbor Laboratory Press on July 18, 2008 - Published by www.genome.orgDownloaded from

abilities) are estimated from data and arereadily interpreted biologically. We ana-lyzed data under multiple models of ge-netic penetrance and found that our re-sults are remarkably robust with regardto penetrance model variation (seeAnalysis Settings and Important Obser-vations in the Supplemental material).Because we based our mathematicalmodel on conventional linkage ap-proaches, it is applicable to the study ofany of the common heritable disorders.The appropriate genotype–phenotypedata are already available for many suchdisorders. As with our earlier algorithm,our current analysis depends largely onthe quality and size of the molecular-interaction network used as input. Here,we use a molecular network that con-tains ∼4000 human genes and omit fromour analysis the Y chromosome and themitochondrial genome. Based on ourcurrent work, we believe that it is fea-sible to collect molecular-interaction in-formation on 12,000 or more humangenes in the near future using the litera-ture-mining approach.
Similar to all other computationallytractable mathematical models, ours isassociated with certain simplifying as-sumptions and limitations. Specifically,our genetic model (heterogeneity) is thesimplest representative of a large familyof multigenic inheritance models. Fur-thermore, in our current implementa-tion of the model we perform our analy-sis with a predefined gene cluster sizerather than searching through all pos-sible gene cluster sizes. Our currentmodel is limited to genetic linkageanalysis, although it can be naturallytransformed for application to geneticassociation and gene expression data. Allof these limitations can be addressed inthe future with more complicated mod-eling and significantly better computa-tional resources.
Our framework is well suited tomodeling complex inheritance so thatwe can efficiently evaluate a range of lin-ear and nonlinear multilocus inheri-tance models. A unique feature of ourmodel is that it employs genetic linkagedata to identify “genes” rather than ge-netic linkage “intervals”. Thus, in addi-tion to circumventing the search-spaceproblem, the method also avoids thedaunting positional cloning typically re-quired in the study of common heritabledisorders. We are optimistic that increas-ingly more sophisticated genetic modelscan and will be developed despite the
Figure 5. Molecular networks combining the 100 best 10-gene clusters for autism (A) and bipolar (B)disorder and the 50 best 10-gene clusters for schizophrenia (C). The color and size of nodes in all threenetworks indicate gene-specific P-values (autism-no-x, bipolar-no-x, and schizophrenia-no-x analyses).Note that the LOC347422, PKC, TAM genes are not yet approved by HUGO (see the genes_not_in_HUGO.xls supplemental file).
Molecular network linkage
Genome Research 1159www.genome.org
Cold Spring Harbor Laboratory Press on July 18, 2008 - Published by www.genome.orgDownloaded from

large model search-space limitation. We also expect that, in thenear future, we and other groups will perform experimental vali-dation studies that will verify our approach.
Methods
Model definitionWe use the symbol D to represent a specific phenotype (disease)whose genetic component we wish to identify. For gene cluster C,the two major model assumptions discussed in the main text leadto the following likelihood equation:
P�Y |C,�� = �f ∈ families
P�Yf |C = �gene1,...,genec�,��
= �f ∈ families
�p1P�Yf |gene1 predisposes to D,�� + ...
+ pCP�Yf |genec predisposes to D,���
(1)
where C is the D-predisposing gene cluster comprising gene1,gene2, . . . , genec, with the corresponding cluster probabilities p1,p2, . . . , pc. Variable Y represents a union of the genotypic andphenotypic data; Yf is the portion of these data associated withthe fth family (pedigree). Vector � represents all of the linkage-related parameters, including genetic penetrance, backgroundfrequencies of marker alleles, and genetic distances between themarkers. We assume here that every gene in C has only onehealthy and one disease-predisposing allele and that the ex-pected frequencies of these alleles are the same for all genes in thecluster. We also assume that the genetic-penetrance parametersare the same for every gene in C.
Under this model, given the state of the chosen gene, thedisease-phenotype state of the individual is independent of therest of the individual’s genome and of the genotypes and phe-notypes of her/his family members. This assumption of indepen-dence leads to a “gene mixture generative model” of the data:The ith disease-predisposing gene is assigned to a family by arandom draw from C with probability pi. Once a gene is assignedto a family, the disease-related phenotype variation in this familyis probabilistically dependent on the state of the ith gene and isindependent of the states of all other genes in C and in the restof the genome. Supplemental Figure S3 shows a graphical repre-sentation of the model, and Supplemental Figures S4 and S5clarify the pedigree structure and its relation to the graphicalmodel.
Gene log-odds scoreUsing standard tools of statistical genetics, we can compute alog-odds (LOD) score for every gene and for every family (f ) rep-resented in our data. Assuming that there is exactly one D-predisposing genetic locus per family, we can compute the LODscore for any individual position (�) in the genome:
LODf ��� = log10
P�Yf |D-predisposing position is at �, ��
P�Yf |D-predisposing position is unlinked, ��.
(2)
Assuming that we know the beginning and the end of theith gene, we can compute a gene-specific LOD LODf (genei); thisrepresents the LOD score in the middle of the gene or at a uni-formly sampled position within the gene.
Gene cluster log-odds scoreWe define a “gene cluster LOD score” as follows:
LOD�C = �gene1, . . . , genec�, ��
= log10
P�Y |C = �gene1, . . . , genec�, ��
P�Y|C = {}, ��, (3)
where P(Y|C ={}, �) is the familiar probability P(Yf|D-predisposingposition is unlinked, �), renamed to emphasize its relation togene clusters.
We can calculate the cluster LOD score using the followingequation:
LOD�C = �gene1, . . . , genec�, ��
= �f
log10�i=1
c
pi
P�Yf |genei predisposes to D�
P�Yf|D-predisposing position is unlinked, ��
= �f
log10�i=1
c
pi10LODf �genei�.
(4)
In the case of a single-gene cluster (c = 1 and p1 = 1), Equa-tion 4 translates to the sum of the gene-wise LOD scores for allindividual families.
Gene-specific significance testsWe define the optimum gene cluster of size c as the cluster of cgenes that achieves the maximum cluster LOD score as definedby Equation 4, where the gene cluster probabilities (pis) are esti-mated using the maximum-likelihood method for each cluster.We identify the optimum c-gene cluster by using a version of thesimulated annealing procedure (Kirkpatrick et al. 1983) (seeSimulated Annealing in the Supplemental material for details ofthe implementation). Because a simulated annealing-basedsearch for the optimum in the discrete space of a molecular-network graph clearly has an element of stochastic instability, weuse a bootstrap-aggregation (bagging) technique to “push a goodbut unstable procedure a significant step towards optimality”(Breiman 1996). To implement the bagging technique, for eachdata set we perform bootstrapping (Efron 1982) over all familiesrepresented in the data set to generate B bootstrap replicates (weuse B = 100). We obtain each bootstrap replicate data set by draw-ing pedigrees from the original data set, at random but withreplacement. As a result, each pedigree from the original simu-lated data set may appear several times or not at all in any boot-strap replicate. For each replicate, we identify the optimum(maximum-likelihood) cluster of size c with the correspondingmaximum-likelihood estimates of cluster probabilities, pis. Allgenes not included in the optimum cluster are assigned clusterprobability values of zero. The test statistic for each gene over Bbootstrap replicates is merely a sum of estimates of cluster prob-ability pi over individual replicates (see Supplemental Fig. S6 fordetails). For a given gene, the statistic measures the relativestrength of this gene’s linkage signal compared to all genes understudy. Because the cluster probability for the ith gene, pi, is de-rived by searching for the maximum-likelihood cluster in awhole-genome molecular-interaction network, it explicitly takesinto account information about the whole genome throughanalysis of the gene clusters.
We evaluate the significance of each gene-specific test sta-tistic using simulated data under the null hypothesis that thedisease phenotype is completely unlinked to any part of the ge-nome (Terwilliger et al. 1993), preserving the real pedigree to-pologies encoded in our data sets and the real frequencies of
Iossifov et al.
1160 Genome Researchwww.genome.org
Cold Spring Harbor Laboratory Press on July 18, 2008 - Published by www.genome.orgDownloaded from
genetic markers. To compute the null distribution, we generate Ksimulated data sets (we use K = 1000). For each simulated dataset, we repeat the bagged analysis on the original observed data,then derive gene-specific sums of estimated pis. The estimatedP-value for a given gene is then the proportion of the simulatedreplicates for which this gene’s test statistic is higher than the teststatistic of the original real data. A given individual P-valueshows how likely it is for the corresponding gene to have a shareof “susceptibility guilt” as high (or higher) than that observed inthe real data simply by chance.
FDR procedureWe used the false discovery rate (FDR) controlling procedure,closely following its description provided by its authors (Ben-jamini and Hochberg 1995):
“Consider testing H1, H2, . . . , Hm based on the correspond-ing P-values P1, P2, . . . , Pm.
Let P(1) � P(2) � . . . � P(m) be the ordered P-values, and de-note by H(i) the null hypothesis corresponding to P(i). Define thefollowing Bonferroni-type multiple-testing procedure:
let k be the largest i for which P(i) � i/m q*;
then reject all H(i), i = 1, 2, . . . , k.”
In our case the null hypothesis Hi for the ith gene is that thegene does not belong to the cluster of genes predisposed to thephenotype under study. We compute “raw” P-values as describedin the Gene-Specific Significance Tests section in the main text.Then we use a FDR of q* = 0.5 (or 50%) to identify our suggestivegenes.
We compute our P-values by using empirical backgrounddistributions of our per-gene statistics (Sum or Max) based on1000 (or 10,000 in the case of autism-x-rec analysis) simulateddata sets under the null hypothesis of unlinked phenotype. Forsome of the genes it happens that the background distribution ofthe statistic never achieves a score bigger or equal to the gene’sreal-data statistic value. We call such genes “significant” and weassign them P-values equal to half of the minimum possible posi-tive P-value: 0.0005 for the 1000-simulation analysis and 0.00005for the 10,000-simulation analysis. It is interesting to computethe minimum FDR rate under which such genes will be selectedas suggestive, and this can easily be done by reversing the equa-tion above (q* = P(i) � m/k, where k here is the number of geneswith P-value of 0.0005 [or 0.00005]). If we assume a network with4000 genes (about the size of our networks), a single gene withP-value of 0.00005 would survive at a FDR level of 0.2 (20%);unfortunately a single gene with P-value of 0.0005 would not beconsidered significant by itself (its minimum FDR level is 200%!),but five of them (i.e., in the case of Max statistic for the Schizo-phrenia [schizophrenia-no-x] reported in Table 1) would survivea FDR level of 0.4 (40%).
See Supplemental material for additional details of themethods.
AcknowledgmentsWe thank Murat Cokol, Nancy J. Cox, Paul J. Harrison, Lyn Du-pré Oppenheim, Mary Sara McPeek, Ani Nenkova, Rita Rzhetsky,and Chani Weinreb for comments on an earlier version of themanuscript. This work was supported by the National Institutesof Health (GM61372 to A.R., GM070789 to T.Z.), the NationalScience Foundation (0438291 and 0121687 to A.R.), and the CureAutism Now Foundation (grant to A.R.). We thank the Universityof Chicago/Argonne National Laboratory Computation Institute
for access to their Teraport facility, which is funded by the Na-tional Science Foundation under grant MRI-0321297.
References
Aerts, S., Lambrechts, D., Maity, S., Van Loo, P., Coessens, B., De Smet,F., Tranchevent, L.C., De Moor, B., Marynen, P., Hassan, B., et al.2006. Gene prioritization through genomic data fusion. Nat.Biotechnol. 24: 537–544.
Akande, E., Xenitidis, K., Roberston, M.D., and Gorman, J.M. 2004.Autism or schizophrenia: A diagnostic dilemma in adults withintellectual disabilities. J. Psychiatr. Pract. 10: 190–195.
Ars, E., Serra, E., Garcia, J., Kruyer, H., Gaona, A., Lazaro, C., andEstivill, X. 2000. Mutations affecting mRNA splicing are the mostcommon molecular defects in patients with neurofibromatosis type1. Hum. Mol. Genet. 9: 237–247.
Ashburner, M., Ball, C.A., Blake, J.A., Botstein, D., Butler, H., Cherry,J.M., Davis, A.P., Dolinski, K., Dwight, S.S., Eppig, J.T., et al. 2000.Gene Ontology: Tool for the unification of biology. The GeneOntology Consortium. Nat. Genet. 25: 25–29.
Bacchelli, E., Blasi, F., Biondolillo, M., Lamb, J.A., Bonora, E., Barnby,G., Parr, J., Beyer, K.S., Klauck, S.M., Poustka, A., et al. 2003.Screening of nine candidate genes for autism on chromosome 2qreveals rare nonsynonymous variants in the cAMP-GEFII gene. Mol.Psychiatry 8: 916–924.
Barabasi, A.L. and Albert, R. 1999. Emergence of scaling in randomnetworks. Science 286: 509–512.
Bellman, R.E. 1961. Adaptive control processes: A guided tour. PrincetonUniversity Press, Princeton, NJ.
Benjamini, Y. and Hochberg, Y. 1995. Controlling the false discoveryrate: A practical and powerful approach to multiple testing. J. R. Stat.Soc. Ser. B 57: 289–300.
Benjamini, Y. and Yekutieli, D. 2001. The control of the false discoveryrate in multiple testing under dependency. Ann. Statist.29: 1165–1188.
Blain, J.F., Aumont, N., Theroux, L., Dea, D., and Poirier, J. 2006. Apolymorphism in lipoprotein lipase affects the severity ofAlzheimer’s disease pathophysiology. Eur. J. Neurosci. 24: 1245–1251.
Breiman, L. 1996. Bagging predictors. Mach. Learn. 24: 123–140.Bustamante, C.D., Fledel-Alon, A., Williamson, S., Nielsen, R., Hubisz,
M.T., Glanowski, S., Tanenbaum, D.M., White, T.J., Sninsky, J.J.,Hernandez, R.D., et al. 2005. Natural selection on protein-codinggenes in the human genome. Nature 437: 1153–1157.
Cook, E.H. and Leventhal, B.L. 1996. The serotonin system in autism.Curr. Opin. Pediatr. 8: 348–354.
Cook Jr., E.H., Courchesne, R., Lord, C., Cox, N.J., Yan, S., Lincoln, A.,Haas, R., Courchesne, E., and Leventhal, B.L. 1997. Evidence oflinkage between the serotonin transporter and autistic disorder. Mol.Psychiatry 2: 247–250.
Craddock, N. and Forty, L. 2006. Genetics of affective (mood) disorders.Eur. J. Hum. Genet. 14: 660–668.
Culbert, A.A., Skaper, S.D., Howlett, D.R., Evans, N.A., Facci, L., Soden,P.E., Seymour, Z.M., Guillot, F., Gaestel, M., and Richardson, J.C.2006. MAPK-activated protein kinase 2 deficiency in microgliainhibits pro-inflammatory mediator release and resultantneurotoxicity. Relevance to neuroinflammation in a transgenicmouse model of Alzheimer disease. J. Biol. Chem. 281: 23658–23667.
De Bie, T., Tranchevent, L.C., van Oeffelen, L.M., and Moreau, Y. 2007.Kernel-based data fusion for gene prioritization. Bioinformatics23: i125–i132.
Efron, B. 1982. The jackknife, the bootstrap, and other resampling plans.Society for Industrial and Applied Mathematics, Philadelphia, PA.
Feldman, I., Rzhetsky, A., and Vitkup, D. 2008. Network properties ofgenes harboring inherited disease mutations. Proc. Natl. Acad. Sci.105: 4323–4328.
Franke, L., Bakel, H., Fokkens, L., de Jong, E.D., Egmont-Petersen, M.,and Wijmenga, C. 2006. Reconstruction of a functional human genenetwork, with an application for prioritizing positional candidategenes. Am. J. Hum. Genet. 78: 1011–1025.
Hariri, A.R., Mattay, V.S., Tessitore, A., Kolachana, B., Fera, F., Goldman,D., Egan, M.F., and Weinberger, D.R. 2002. Serotonin transportergenetic variation and the response of the human amygdala. Science297: 400–403.
Harris, M.A., Clark, J., Ireland, A., Lomax, J., Ashburner, M., Foulger, R.,Eilbeck, K., Lewis, S., Marshall, B., Mungall, C., et al. 2004. The GeneOntology (GO) database and informatics resource. Nucleic Acids Res.32: D258–D261.
Harrison, P.J. and Weinberger, D.R. 2005. Schizophrenia genes, geneexpression, and neuropathology: On the matter of their
Molecular network linkage
Genome Research 1161www.genome.org
Cold Spring Harbor Laboratory Press on July 18, 2008 - Published by www.genome.orgDownloaded from

convergence. Mol. Psychiatry 10: 40–68.Helbecque, N., Abderrahamani, A., Meylan, L., Riederer, B., Mooser, V.,
Miklossy, J., Delplanque, J., Boutin, P., Nicod, P., Haefliger, J.A., etal. 2003. Islet-brain1/C-Jun N-terminal kinase interacting protein-1(IB1/JIP-1) promoter variant is associated with Alzheimer’s disease.Mol. Psychiatry 8: 413–422.
Jiang, Y.H., Sahoo, T., Michaelis, R.C., Bercovich, D., Bressler, J.,Kashork, C.D., Liu, Q., Shaffer, L.G., Schroer, R.J., Stockton, D.W., etal. 2004. A mixed epigenetic/genetic model for oligogenicinheritance of autism with a limited role for UBE3A. Am. J. Med.Genet. A 131: 1–10.
Jin, J.K., Choi, J.K., Wasco, W., Buxbaum, J.D., Kozlowski, P.B., Carp,R.I., Kim, Y.S., and Choi, E.K. 2005. Expression of calsenilin inneurons and astrocytes in the Alzheimer’s disease brain. Neuroreport16: 451–455.
Kato, T., Iwayama, Y., Kakiuchi, C., Iwamoto, K., Yamada, K., Minabe,Y., Nakamura, K., Mori, N., Fujii, K., Nanko, S., et al. 2005. Geneexpression and association analyses of LIM (PDLIM5) in bipolardisorder and schizophrenia. Mol. Psychiatry 10: 1045–1055.
Kim, S.J., Cox, N., Courchesne, R., Lord, C., Corsello, C., Akshoomoff,N., Guter, S., Leventhal, B.L., Courchesne, E., and Cook Jr., E.H.2002. Transmission disequilibrium mapping at the serotonintransporter gene (SLC6A4) region in autistic disorder. Mol. Psychiatry7: 278–288.
Kirkpatrick, S., Gelatt Jr., C.D., and Vecchi, M.P. 1983. Optimization bysimulated annealing. Science 220: 671–680.
Klauck, S.M., Poustka, F., Benner, A., Lesch, K.P., and Poustka, A. 1997.Serotonin transporter (5-HTT) gene variants associated with autism?Hum. Mol. Genet. 6: 2233–2238.
Krauthammer, M., Kaufmann, C.A., Gilliam, T.C., and Rzhetsky, A.2004. Molecular triangulation: Bridging linkage andmolecular-network information for identifying candidate genes inAlzheimer’s disease. Proc. Natl. Acad. Sci. 101: 15148–15153.
Kruglyak, L., Daly, M.J., Reeve-Daly, M.P., and Lander, E.S. 1996.Parametric and nonparametric linkage analysis: A unified multipointapproach. Am. J. Hum. Genet. 58: 1347–1363.
Lage, K., Karlberg, E.O., Storling, Z.M., Olason, P.I., Pedersen, A.G.,Rigina, O., Hinsby, A.M., Tumer, Z., Pociot, F., Tommerup, N., et al.2007. A human phenome-interactome network of protein complexesimplicated in genetic disorders. Nat. Biotechnol. 25: 309–316.
Lander, E. and Kruglyak, L. 1995. Genetic dissection of complex traits:Guidelines for interpreting and reporting linkage results. Nat. Genet.11: 241–247.
Lovlie, R., Berle, J.O., Stordal, E., and Steen, V.M. 2001. Thephospholipase C-gamma1 gene (PLCG1) and lithium-responsivebipolar disorder: Re-examination of an intronic dinucleotide repeatpolymorphism. Psychiatr. Genet. 11: 41–43.
McKusick, V.A. 2007. Mendelian inheritance in man and its onlineversion, OMIM. Am. J. Hum. Genet. 80: 588–604.
Mukhopadhyay, T.R. 2003. The mind tree: A miraculous child breaks thesilence of autism. Arcade, New York.
Nivet-Antoine, V., Coulhon, M.P., Le Denmat, C., Hamon, B., Dulcire,X., Lefebvre, M., Piette, F., Davous, P., Durand, D., and Duchassaing,D. 2003. Apolipoprotein E and bleomycin hydrolase.
Polymorphisms: Association with neurodegenerative diseases. Ann.Biol. Clin. (Paris) 61: 61–67.
Nurmi, E.L., Bradford, Y., Chen, Y., Hall, J., Arnone, B., Gardiner, M.B.,Hutcheson, H.B., Gilbert, J.R., Pericak-Vance, M.A., Copeland-Yates,S.A., et al. 2001. Linkage disequilibrium at the Angelman syndromegene UBE3A in autism families. Genomics 77: 105–113.
Rivals, I., Personnaz, L., Taing, L., and Potier, M.C. 2007. Enrichment ordepletion of a GO category within a class of genes: Which test?Bioinformatics 23: 401–407.
Rzhetsky, A., Iossifov, I., Koike, T., Krauthammer, M., Kra, P., Morris,M., Yu, H., Duboue, P.A., Weng, W., Wilbur, W.J., et al. 2004.GeneWays: A system for extracting, analyzing, visualizing, andintegrating molecular pathway data. J. Biomed. Inform. 37: 43–53.
Stahlberg, O., Soderstrom, H., Rastam, M., and Gillberg, C. 2004. Bipolardisorder, schizophrenia, and other psychotic disorders in adults withchildhood onset AD/HD and/or autism spectrum disorders. J. NeuralTransm. 111: 891–902.
Terwilliger, J.D., Speer, M., and Ott, J. 1993. Chromosome-basedmethod for rapid computer simulation in human genetic linkageanalysis. Genet. Epidemiol. 10: 217–224.
Tu, Z., Wang, L., Arbeitman, M.N., Chen, T., and Sun, F. 2006. Anintegrative approach for causal gene identification and generegulatory pathway inference. Bioinformatics 22: e489–e496.
Veenstra-VanderWeele, J., Gonen, D., Leventhal, B.L., and Cook Jr., E.H.1999. Mutation screening of the UBE3A/E6-AP gene in autisticdisorder. Mol. Psychiatry 4: 64–67.
Veenstra-VanderWeele, J., Christian, S.L., and Cook Jr., E.H. 2004.Autism as a paradigmatic complex genetic disorder. Annu. Rev.Genomics Hum. Genet. 5: 379–405.
Verma, R., Mukerji, M., Grover, D., B-Rao, C., Das, S.K., Kubendran, S.,Jain, S., and Brahmachari, S.K. 2005. MLC1 gene is associated withschizophrenia and bipolar disorder in Southern India. Biol. Psychiatry58: 16–22.
Wang, Y., Wang, Q., and Wang, J. 2002. Detection of level andmutation of neurofilament mRNA in Alzheimer’s disease. ZhonghuaYi Xue Za Zhi 82: 519–522.
Watanabe, T., Ohnuma, T., Shibata, N., Ohtsuka, M., Ueki, A., Nagao,M., and Arai, H. 2004. No genetic association between Fyn kinasegene polymorphisms (-93A/G, IVS10+37T/C and Ex12+894T/G) andJapanese sporadic Alzheimer’s disease. Neurosci. Lett. 360: 109–111.
Wolf, D.M. and Arkin, A.P. 2003. Motifs, modules and games inbacteria. Curr. Opin. Microbiol. 6: 125–134.
Yirmiya, N., Pilowsky, T., Nemanov, L., Arbelle, S., Feinsilver, T., Fried,I., and Ebstein, R.P. 2001. Evidence for an association with theserotonin transporter promoter region polymorphism and autism.Am. J. Med. Genet. 105: 381–386.
Yonan, A.L., Alarcon, M., Cheng, R., Magnusson, P.K., Spence, S.J.,Palmer, A.A., Grunn, A., Juo, S.H., Terwilliger, J.D., Liu, J., et al.2003. A genomewide screen of 345 families for autism-susceptibilityloci. Am. J. Hum. Genet. 73: 886–897.
Received December 15, 2007; accepted in revised form April 1, 2008.
Iossifov et al.
1162 Genome Researchwww.genome.org
Cold Spring Harbor Laboratory Press on July 18, 2008 - Published by www.genome.orgDownloaded from