Trends in total precipitation and magnitude–frequency of extreme precipitation in Iran, 1969–2009
Upload
independentCategory
view
0download
0
Generation of transient dayside subauroral proton precipitation
S. A. Fuselier,1 S. P. Gary,2 M. F. Thomsen,2 E. S. Claflin,1 B. Hubert,3 B. R. Sandel,4
and T. Immel5
Received 16 January 2004; revised 4 August 2004; accepted 25 October 2004; published 30 December 2004.
[1] The Imager for Magnetopause-to-Aurora Global Exploration (IMAGE) spacecraftobtained the first global images of the proton aurora. One of the discoveries from theseimages was a region of proton precipitation equatorward of the nominal auroral oval. Thisprecipitation can be observed for �10 min immediately following a large solar windpressure pulse. Various mechanisms have been proposed for producing this precipitation.This study focuses on one of the proposed mechanisms, the scattering and precipitation ofprotons due to interaction with electromagnetic ion cyclotron (EMIC) waves. Usingdata from the IMAGE spacecraft FUVand EUV imagers, in situ ring current data from theLos Alamos geosynchronous spacecraft, and in situ solar wind data from the ACEspacecraft, two features of the precipitation, the local time occurrence and limitedlatitudinal extent, are explained. The local time occurrence of the precipitation iscorrelated with the orientation of the pressure pulse front in the solar wind. The limitedlatitudinal extent of the emissions appears to be related to the interaction between the hotring current protons and the cold plasmaspheric ions that gives rise to EMIC wavegrowth. INDEX TERMS: 2455 Ionosphere: Particle precipitation; 2772 Magnetospheric Physics: Plasma
waves and instabilities; 2768 Magnetospheric Physics: Plasmasphere; 2139 Interplanetary Physics:
Interplanetary shocks; KEYWORDS: plasma instabilities, proton precipitation, wave/particle interactions
Citation: Fuselier, S. A., S. P. Gary, M. F. Thomsen, E. S. Claflin, B. Hubert, B. R. Sandel, and T. Immel (2004), Generation of
transient dayside subauroral proton precipitation, J. Geophys. Res., 109, A12227, doi:10.1029/2004JA010393.
1. Introduction
[2] Although aurora generated by precipitation of ener-getic (approximately tens of keV) protons have been ob-served from the ground [e.g., Ono et al., 1987], the firstglobal images of proton-generated aurora were obtainedfrom the Imager for Magnetopause-to-Aurora Global Ex-ploration (IMAGE) spacecraft [Burch, 2000]. This space-craft was launched into a polar, elliptical orbit in March2000. During the first 3 years of observations the spacecraftapogee precessed over the north geographic pole, providingexcellent viewing of the northern auroral region.[3] The spacecraft has a set of FUV imagers which image
aurora in three separate passbands [Mende et al., 2000].These aurora are produced by proton and electron precip-itation in the upper atmosphere. The unique ability to makesimultaneous images of aurora created solely by protonprecipitation and aurora created by a combination of proton
and electron precipitation has produced new results inauroral and magnetospheric physics [see, e.g., Mende etal., 2001].[4] One particularly interesting, new discovery is the
presence of auroral arcs equatorward of the dayside auroraloval. These auroral arcs have been described as afternoonsector detached proton auroral arcs [Burch et al., 2002],detached proton arcs [Immel et al., 2002], dayside detachedauroras [Zhang et al., 2003], and subauroral proton flashes[Hubert et al., 2003]. All of these descriptive terms identifycommon features of the phenomenon. In particular, the arcsoccur equatorward of and separate from the nominal day-side proton auroral oval, and they are created entirely fromprecipitation of protons [Immel et al., 2002; Hubert et al.,2003; Zhang et al., 2003]. (On the dayside the nominalproton auroral oval is produced by precipitation of protonsthat originate near the magnetopause.)[5] The persistence of the subauroral proton precipitation
suggests two separate categories for the phenomenon. Somearcs persist for many tens of minutes to over an hour [Burchet al., 2002; Immel et al., 2002], while others appearabruptly and fade within 10 min of their initial occurrence[Fuselier et al., 2001; Zhang et al., 2003; Hubert et al.,2003]. While the root generation mechanism for the protonprecipitation might be the same [e.g., Burch et al., 2002],the different durations suggest that two different processesdrive the arc creation.[6] The initial appearance of the longer-duration subauro-
ral arcs has been linked to changes in the interplanetarymagnetic field (IMF) [Burch et al., 2002]. When the IMF Bz
JOURNAL OF GEOPHYSICAL RESEARCH, VOL. 109, A12227, doi:10.1029/2004JA010393, 2004
1Lockheed Martin Advanced Technology Center, Palo Alto, California,USA.
2Los Alamos National Laboratory, Los Alamos, New Mexico, USA.3Institut d’Atmospherique et de Geophysique, Universite de Liege,
Liege, Belgium.4Lunar and Planetary Laboratory, University of Arizona, Tucson,
Arizona, USA.5Space Sciences Laboratory, University of California, Berkeley,
California, USA.
Copyright 2004 by the American Geophysical Union.0148-0227/04/2004JA010393$09.00
A12227 1 of 11

component rotates from southward to northward, the auroraloval contracts toward higher latitudes. Proton precipitationfrom the ring current may not change latitude, resulting inthe appearance of a subauroral arc as the auroral ovalcontracts. An IMF By rotation from negative to positivewill produce a similar effect. For this rotation the oval willshift from dusk to dawn, potentially exposing a subauroralproton arc on the duskside. Both IMF orientation changeshave been observed to create duskside, long-duration sub-auroral arcs [Burch et al., 2002]. The persistence of thesearcs on the duskside has been linked to the cold plasma-spheric population on that side of the magnetosphere [Burchet al., 2002; Spasojevic et al., 2004].[7] Shorter-duration subauroral proton arcs have been
associated with rapid increases in the solar wind dynamicpressure either through interplanetary shocks or pressurepulses [Fuselier et al., 2001; Zhang et al., 2003; Hubert etal., 2003]. These transient arcs have several features thatsuggest their generation mechanism. They occur in associ-ation with rapid increases in dynamic pressure [Fuselier etal., 2001], although the initial brightening of the arc can lagthe brightening of the auroral oval [Zhang et al., 2003].They are not confined to the duskside [Hubert et al., 2003].The arcs are often separated from the auroral oval inlatitude, usually by several degrees. Magnetic field linesthat are equatorward of the auroral oval are mapped to theequatorial, outer magnetosphere inside the magnetopause.This is the general region of the equatorial ring current, andthe precipitation in the arc consists of protons with ringcurrent energies [Hubert et al., 2003; Zhang et al., 2003].The arcs can occur under any solar wind IMF conditions,but they are best observed when the IMF is northwardduring the increase in dynamic pressure [Hubert et al.,2003].[8] Several mechanisms have been proposed for the
generation of these short-duration subauroral proton arcs[Hubert et al., 2003; Zhang et al., 2003]. To be consistentwith the precipitating proton energy, all proposed mecha-nisms invoke some sort of pitch angle diffusion of ringcurrent particles into the loss cone through wave-particleinteractions. Candidate instabilities include the loss coneinstability, field-aligned resonances, and the electromagneticion cyclotron (EMIC) instability [Hubert et al., 2003].Scattering by EMIC waves is particularly promising be-cause these waves are common in the outer magnetospherenear noon and near dawn, even in the absence of acompression of the magnetosphere [Anderson et al.,1992]. The ring current proton distributions can be nearthe threshold of the instability [Anderson et al., 1996], andthe waves are readily generated during compression events[Anderson and Hamilton, 1993]. Finally, the growth of theinstability is suppressed by rapid pitch angle scattering,reducing the anisotropy of ring current protons (i.e., reduc-ing the free energy source of the waves) [Gary et al., 1994,1995]. This rapid pitch angle scattering will force ringcurrent protons into the atmospheric loss cone.[9] While promising, the generation of subauroral proton
arcs through the above EMIC wave-particle mechanismrequires some detailed investigation. This or any othergeneration mechanism must be able to explain two charac-teristics of these short-duration proton arcs. First, theseproton arcs are not confined to the duskside but can occur
over a longitudinal extent centered at almost any local timeon the dayside. Second, the arcs are often separated from themain auroral oval, with a significant gap in the precipitatingprotons between the arc and the oval. The protons thatproduce the dayside auroral oval emissions originate at ornear the magnetopause. The occurrence frequency of EMICwaves also peaks close to the magnetopause [Anderson etal., 1992], as does the ring current proton anisotropy [e.g.,Sibeck et al., 1987]. In contrast, the subauroral arc resides atthe ionospheric foot point of magnetic field lines that crossthe equatorial plane in the vicinity of geosynchronous orbit(i.e., well inside the magnetopause). There is little scatteringof protons into the loss cone in the gap between theequatorial magnetopause and the mapped location of thesubauroral arcs. Based solely on the increasing ring currentproton anisotropy with increasing radial distance from theEarth, this gap is difficult to explain using the EMIC waves.[10] This paper investigates these two features of the
short-duration subauroral proton arcs produced by rapidchanges in solar wind dynamic pressure. In section 2 theinstrumentation used in the investigation is briefly de-scribed. In section 3 the IMAGE and solar wind observa-tions are introduced using a single event as an example. Insection 4 the IMAGE and solar wind observations frommany events are used to demonstrate how proton arcs canbe centered at almost any dayside local time. In section 5the aspects of EMIC wave theory relevant to the investiga-tion are described. In section 6, ring current and plasma-sphere observations are introduced, and EMIC wave theoryis applied to several events to demonstrate how proton arcscan occur detached from the auroral oval. Finally, insection 7 the observations are summarized and discussed.
2. Instrumentation
[11] Remote sensing auroral observations in this paper arefrom the spectrographic imager SI12 [Mende et al., 2000]on the IMAGE spacecraft. This spectrograph imagesDoppler-shifted Lyman-alpha emissions and excludesemissions from the intense, geocoronal Lyman-alpha lineat 121.6 nm. These Doppler-shifted emissions are pro-duced by protons precipitating into the upper atmospherethat charge-exchange with upper atmospheric constituents.The newly created hydrogen atoms are moving away fromthe spacecraft, so the Lyman-alpha photons they emit areDoppler-shifted to longer wavelengths. As discussed insection 1, this paper focuses on the dayside precipitationproduced by precipitating ring current protons with initialenergies of �10 keV.[12] Remote sensing plasmaspheric observations are from
the EUV cameras [Sandel et al., 2000] on the IMAGEspacecraft. These cameras produce images of 30.4 nm solarradiation that is resonantly scattered off of plasmasphericHe+. The observed 30.4 nm intensity is a line-of-sightintegral measure of the plasmaspheric He+.[13] In situ ring current and plasmaspheric observations
are from the Magnetospheric Plasma Analyzers (MPA)[Bame et al., 1993] on the Los Alamos National Laboratory(LANL) geosynchronous spacecraft. These electrostaticanalyzers measure ion and electron distributions with ener-gies from the spacecraft potential to �40 keV/e. The iondata are used to determine the in situ growth rate of EMIC
A12227 FUSELIER ET AL.: DAYSIDE SUBAURORAL PROTON PRECIPITATION
2 of 11
A12227
waves at geosynchronous orbit, occasionally for severallocal times (using data from several spacecraft). To deter-mine the growth rate of the waves, the hot proton temper-ature anisotropy, the plasma b (the ratio of particle energy tothe magnetic field energy), and the cold plasma density areneeded. Although there are no magnetometers on thespacecraft, the hot proton temperatures perpendicular andparallel to the background magnetic field direction aredetermined from the fully three-dimensional ion data andthe assumption of gyrotropy. The directions perpendicularand parallel to the background magnetic field obtained fromthe ion observations are checked using the simultaneouselectron observations (since electrons are also anisotropic inthe outer magnetosphere). To determine the plasma b, thedensities and temperatures from the electrostatic analyzers
are used, and magnetic field magnitude is estimated fromthe nearest GOES spacecraft (also in geosynchronous orbit).One of the features of the LANL MPA instruments is thatthey are typically at a negative potential. Thus the electro-static analyzers also measure the in situ cold plasmasphericion population (with typical energies below 1 eV/e). Thesein situ observations of the cold plasmaspheric populationhave been compared to the remote sensing observationsfrom the EUV cameras on IMAGE.[14] Finally, in situ solar wind plasma and magnetic field
observations are from the solar wind electron proton alphamonitor (SWEPAM) and the magnetic fields experiment onthe ACE spacecraft. This spacecraft is located in the solarwind at the L1 Lagrange point (�237 RE upstream from theEarth), resulting in time delays for solar wind propagation tothe Earth’s magnetopause of �50 min.
3. Subauroral Proton Arc Example on 25October 2001
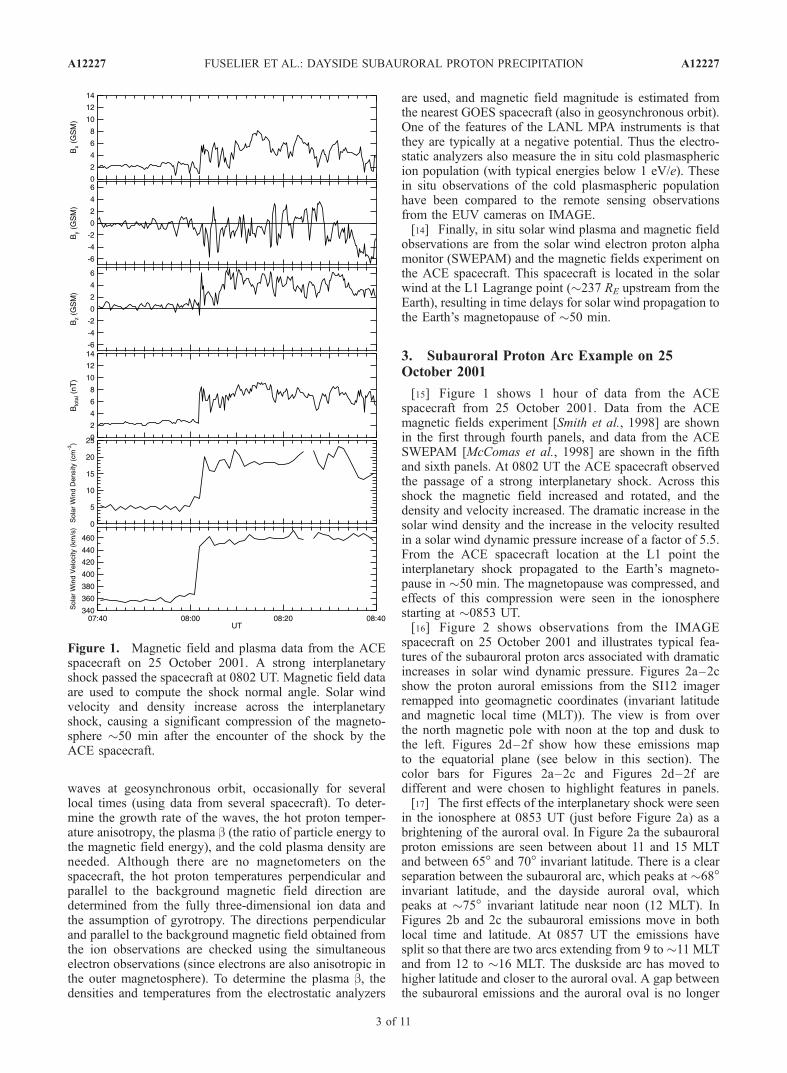
[15] Figure 1 shows 1 hour of data from the ACEspacecraft from 25 October 2001. Data from the ACEmagnetic fields experiment [Smith et al., 1998] are shownin the first through fourth panels, and data from the ACESWEPAM [McComas et al., 1998] are shown in the fifthand sixth panels. At 0802 UT the ACE spacecraft observedthe passage of a strong interplanetary shock. Across thisshock the magnetic field increased and rotated, and thedensity and velocity increased. The dramatic increase in thesolar wind density and the increase in the velocity resultedin a solar wind dynamic pressure increase of a factor of 5.5.From the ACE spacecraft location at the L1 point theinterplanetary shock propagated to the Earth’s magneto-pause in �50 min. The magnetopause was compressed, andeffects of this compression were seen in the ionospherestarting at �0853 UT.[16] Figure 2 shows observations from the IMAGE
spacecraft on 25 October 2001 and illustrates typical fea-tures of the subauroral proton arcs associated with dramaticincreases in solar wind dynamic pressure. Figures 2a–2cshow the proton auroral emissions from the SI12 imagerremapped into geomagnetic coordinates (invariant latitudeand magnetic local time (MLT)). The view is from overthe north magnetic pole with noon at the top and dusk tothe left. Figures 2d–2f show how these emissions mapto the equatorial plane (see below in this section). Thecolor bars for Figures 2a–2c and Figures 2d–2f aredifferent and were chosen to highlight features in panels.[17] The first effects of the interplanetary shock were seen
in the ionosphere at 0853 UT (just before Figure 2a) as abrightening of the auroral oval. In Figure 2a the subauroralproton emissions are seen between about 11 and 15 MLTand between 65� and 70� invariant latitude. There is a clearseparation between the subauroral arc, which peaks at �68�invariant latitude, and the dayside auroral oval, whichpeaks at �75� invariant latitude near noon (12 MLT). InFigures 2b and 2c the subauroral emissions move in bothlocal time and latitude. At 0857 UT the emissions havesplit so that there are two arcs extending from 9 to�11 MLTand from 12 to �16 MLT. The duskside arc has moved tohigher latitude and closer to the auroral oval. A gap betweenthe subauroral emissions and the auroral oval is no longer
Figure 1. Magnetic field and plasma data from the ACEspacecraft on 25 October 2001. A strong interplanetaryshock passed the spacecraft at 0802 UT. Magnetic field dataare used to compute the shock normal angle. Solar windvelocity and density increase across the interplanetaryshock, causing a significant compression of the magneto-sphere �50 min after the encounter of the shock by theACE spacecraft.
A12227 FUSELIER ET AL.: DAYSIDE SUBAURORAL PROTON PRECIPITATION
3 of 11
A12227
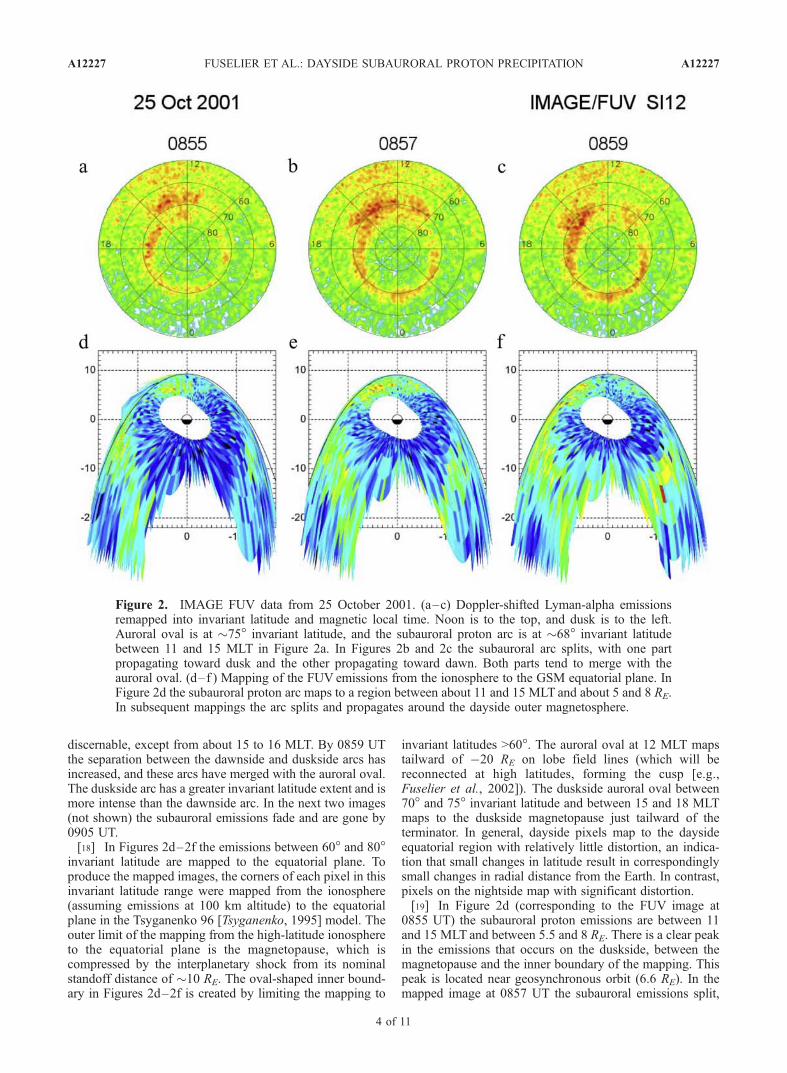
discernable, except from about 15 to 16 MLT. By 0859 UTthe separation between the dawnside and duskside arcs hasincreased, and these arcs have merged with the auroral oval.The duskside arc has a greater invariant latitude extent and ismore intense than the dawnside arc. In the next two images(not shown) the subauroral emissions fade and are gone by0905 UT.[18] In Figures 2d–2f the emissions between 60� and 80�
invariant latitude are mapped to the equatorial plane. Toproduce the mapped images, the corners of each pixel in thisinvariant latitude range were mapped from the ionosphere(assuming emissions at 100 km altitude) to the equatorialplane in the Tsyganenko 96 [Tsyganenko, 1995] model. Theouter limit of the mapping from the high-latitude ionosphereto the equatorial plane is the magnetopause, which iscompressed by the interplanetary shock from its nominalstandoff distance of �10 RE. The oval-shaped inner bound-ary in Figures 2d–2f is created by limiting the mapping to
invariant latitudes >60�. The auroral oval at 12 MLT mapstailward of �20 RE on lobe field lines (which will bereconnected at high latitudes, forming the cusp [e.g.,Fuselier et al., 2002]). The duskside auroral oval between70� and 75� invariant latitude and between 15 and 18 MLTmaps to the duskside magnetopause just tailward of theterminator. In general, dayside pixels map to the daysideequatorial region with relatively little distortion, an indica-tion that small changes in latitude result in correspondinglysmall changes in radial distance from the Earth. In contrast,pixels on the nightside map with significant distortion.[19] In Figure 2d (corresponding to the FUV image at
0855 UT) the subauroral proton emissions are between 11and 15 MLT and between 5.5 and 8 RE. There is a clear peakin the emissions that occurs on the duskside, between themagnetopause and the inner boundary of the mapping. Thispeak is located near geosynchronous orbit (6.6 RE). In themapped image at 0857 UT the subauroral emissions split,
Figure 2. IMAGE FUV data from 25 October 2001. (a–c) Doppler-shifted Lyman-alpha emissionsremapped into invariant latitude and magnetic local time. Noon is to the top, and dusk is to the left.Auroral oval is at �75� invariant latitude, and the subauroral proton arc is at �68� invariant latitudebetween 11 and 15 MLT in Figure 2a. In Figures 2b and 2c the subauroral arc splits, with one partpropagating toward dusk and the other propagating toward dawn. Both parts tend to merge with theauroral oval. (d–f ) Mapping of the FUV emissions from the ionosphere to the GSM equatorial plane. InFigure 2d the subauroral proton arc maps to a region between about 11 and 15 MLT and about 5 and 8 RE.In subsequent mappings the arc splits and propagates around the dayside outer magnetosphere.
A12227 FUSELIER ET AL.: DAYSIDE SUBAURORAL PROTON PRECIPITATION
4 of 11
A12227
moving to earlier and later magnetic local times and closerto the magnetopause. By 0859 UT the duskside emissionshave merged with the magnetopause emissions, forming abroad region of emissions extending earthward from themagnetopause several Earth radii and from about 14 to18 MLT. The fainter dawnside emissions have mergedwith the magnetopause between 8 and 11 MLT.[20] Although the splitting and propagation of the sub-
auroral emissions are features not discussed previously, theother features of the subauroral emissions shown in Figure 2have been reported [Hubert et al., 2003; Zhang et al., 2003].In particular, the emissions are not confined to the duskside,they are clearly separated from the auroral oval (at leastinitially), they appear approximately in association with thearrival of a solar wind dynamic pressure pulse, and they lastof the order of 10 min.
4. Local Time Dependenceof Subauroral Emissions
[21] The subauroral emissions in Figure 2 initially appearon the duskside. Similar events with peak emissions occur-ring initially at noon and on the dawnside have beenreported previously [Hubert et al., 2003]. To investigatethe local time occurrence of the emissions, solar wind datafrom ACE and IMAGE were surveyed from June 2000(shortly after science operations began on IMAGE) toOctober 2002. During this period, there were 18 interplan-etary shocks similar to the one shown in Figure 1 that hadassociated subauroral emissions like those in Figure 2.There were more interplanetary shocks and other suddenincreases in dynamic pressure in the solar wind during thisperiod. Not all of these sudden increases in solar winddynamic pressure had subauroral emissions associated withthem [see also Zhang et al., 2003]. Although interesting andpotentially important for understanding the creation of thesesubauroral emissions, the association between the type ofsolar wind disturbance and presence or absence of sub-
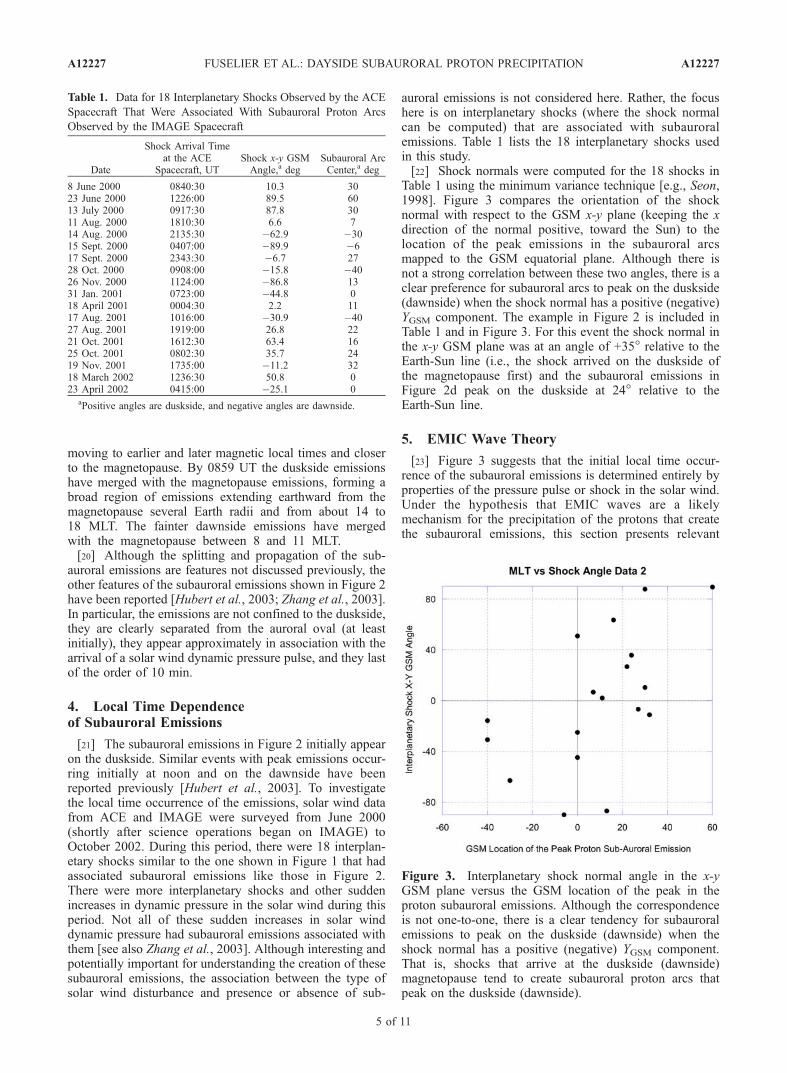
auroral emissions is not considered here. Rather, the focushere is on interplanetary shocks (where the shock normalcan be computed) that are associated with subauroralemissions. Table 1 lists the 18 interplanetary shocks usedin this study.[22] Shock normals were computed for the 18 shocks in
Table 1 using the minimum variance technique [e.g., Seon,1998]. Figure 3 compares the orientation of the shocknormal with respect to the GSM x-y plane (keeping the xdirection of the normal positive, toward the Sun) to thelocation of the peak emissions in the subauroral arcsmapped to the GSM equatorial plane. Although there isnot a strong correlation between these two angles, there is aclear preference for subauroral arcs to peak on the duskside(dawnside) when the shock normal has a positive (negative)YGSM component. The example in Figure 2 is included inTable 1 and in Figure 3. For this event the shock normal inthe x-y GSM plane was at an angle of +35� relative to theEarth-Sun line (i.e., the shock arrived on the duskside ofthe magnetopause first) and the subauroral emissions inFigure 2d peak on the duskside at 24� relative to theEarth-Sun line.
5. EMIC Wave Theory
[23] Figure 3 suggests that the initial local time occur-rence of the subauroral emissions is determined entirely byproperties of the pressure pulse or shock in the solar wind.Under the hypothesis that EMIC waves are a likelymechanism for the precipitation of the protons that createthe subauroral emissions, this section presents relevant
Table 1. Data for 18 Interplanetary Shocks Observed by the ACE
Spacecraft That Were Associated With Subauroral Proton Arcs
Observed by the IMAGE Spacecraft
Date
Shock Arrival Timeat the ACE
Spacecraft, UTShock x-y GSMAngle,a deg
Subauroral ArcCenter,a deg
8 June 2000 0840:30 10.3 3023 June 2000 1226:00 89.5 6013 July 2000 0917:30 87.8 3011 Aug. 2000 1810:30 6.6 714 Aug. 2000 2135:30 �62.9 �3015 Sept. 2000 0407:00 �89.9 �617 Sept. 2000 2343:30 �6.7 2728 Oct. 2000 0908:00 �15.8 �4026 Nov. 2000 1124:00 �86.8 1331 Jan. 2001 0723:00 �44.8 018 April 2001 0004:30 2.2 1117 Aug. 2001 1016:00 �30.9 �4027 Aug. 2001 1919:00 26.8 2221 Oct. 2001 1612:30 63.4 1625 Oct. 2001 0802:30 35.7 2419 Nov. 2001 1735:00 �11.2 3218 March 2002 1236:30 50.8 023 April 2002 0415:00 �25.1 0
aPositive angles are duskside, and negative angles are dawnside.
Figure 3. Interplanetary shock normal angle in the x-yGSM plane versus the GSM location of the peak in theproton subauroral emissions. Although the correspondenceis not one-to-one, there is a clear tendency for subauroralemissions to peak on the duskside (dawnside) when theshock normal has a positive (negative) YGSM component.That is, shocks that arrive at the duskside (dawnside)magnetopause tend to create subauroral proton arcs thatpeak on the duskside (dawnside).
A12227 FUSELIER ET AL.: DAYSIDE SUBAURORAL PROTON PRECIPITATION
5 of 11
A12227
theoretical properties of the electromagnetic proton cyclo-tron anisotropy instability. These properties will be used insection 6, which discusses the latitudinal dependence ofthe subauroral emissions.[24] The EMIC instability is driven by the temperature
anisotropy (Ah = T?h/Tkh � 1) of the hot ring current protondistribution in the outer magnetosphere. In the dusksidemagnetosphere a process known as drift shell splittingcauses these proton distributions to become increasinglyanisotropic as they propagate from the nightside around theduskside to the dayside [e.g., Sibeck et al., 1987]. In driftshell splitting, protons with small pitch angles preferentiallydrift to lower L shells on the dayside while those with largepitch angles drift to higher L shells. The result is a protonpopulation whose anisotropy increases with increasing Lshell in the subsolar and duskside magnetosphere. Com-pression of the magnetosphere due to the arrival of a solarwind pressure pulse should enhance this anisotropy to somedegree throughout the dayside magnetosphere [Andersonand Hamilton, 1993].[25] The proton temperature anisotropy is the free energy
source for the EMIC instability. This instability has maxi-mum growth rate at propagation parallel or antiparallel tothe background magnetospheric magnetic field, so thatprotons are predominantly pitch angle scattered by thewave. Wave-particle interactions strongly scatter particlesonly when the anisotropy is sufficiently strong to excite theinstability. This pitch angle scattering acts to reduce the freeenergy source and, when the anisotropy is reduced below acertain level, the instability is quenched.[26] Since the proton temperature anisotropy is the free
energy source, the growth rate of the EMIC instability is afunction primarily of the proton temperature anisotropy andthe proton b [e.g., Gary, 1993]. In the outer magnetosphere,there are typically two distinct proton populations, one hotand one cold. If the hot population is represented by aMaxwellian and Th � Tc, then the maximum growth rate ofthe EMIC instability is primarily a function of the anisot-ropy Ah, the hot plasma beta, bkh, and the cold plasmadensity nc. Here, bkh is the ratio of hot plasma thermalenergy to magnetic energy equal to 8pnhTkh/Bo
2 (nh is the hotproton density, Tkh is the hot proton temperature parallel tothe background magnetic field, and Bo is the backgroundmagnetic field magnitude). The nc/nh ratio changes thegrowth rate by changing the cyclotron resonance velocity ofthe hot protons. Linear theory calculations [e.g., Cornwall etal., 1970; Perraut and Roux, 1975; Gomberoff andCuperman, 1982; Anderson et al., 1992] show that thecold plasma has little effect on the maximum growth rate atnc/nh < 0.1. For higher cold plasma densities (nc/nh > 0.1),including conditions typically found in the outer magneto-sphere, the maximum growth rate increases with increasingnc/nh up to some value of the relative cold plasma densitythat depends on bkh. Still larger values of nc/nh lead to adecrease in the maximum growth rate.[27] The location of the precipitation in the ionosphere
depends critically on how and where the growth rate of theEMIC instability increases in the equatorial outer magneto-sphere. As discussed above in this section, the growth ratedepends on Ah, bkh, and nc/nh. In an adiabatic compressionof the magnetosphere the temperature anisotropy, hot andcold plasma densities, perpendicular temperature, and mag-
netic field can all increase. It is the competition between thecold plasma density and the other factors that will determinewhere in the equatorial magnetosphere the EMIC instabilitywill go unstable, rapidly scatter particles into the loss cone,and produce ionospheric precipitation.
6. Radial Dependence of Subauroral Emissions
[28] To investigate the relative importance of changes inAh, bkh, and nc in the growth of EMIC waves in themagnetosphere, in situ measurements of the ring currentand plasmasphere from the Los Alamos geosynchronousspacecraft are used (and, for the magnetic field magnitudethe magnetometer measurements from the nearest GOESspacecraft are used).[29] One of the important assumptions in the determina-
tion of the EMIC growth rate is that the outer magneto-spheric plasma consists of two populations, a hot ringcurrent component and a cold, plasmaspheric population.Typically, proton distributions in the outer magnetosphereare more complex, often consisting of two or more hotcomponents with different characteristic energies [e.g.,Anderson et al., 1996]. The lower energy component hasa temperature of �10–20 keV/e, while the higher-energycomponent can have temperatures above 40 keV/e. Despiteits lower density when compared to that of the lower energycomponent, the higher-energy proton component can con-tribute as much as half of the total growth rate of the EMICinstability [Anderson et al., 1996].[30] The MPAs on the Los Alamos spacecraft measure
ion energies (E/Q) from the spacecraft potential to 40 keV/e.Thus the analyzers cover the cold population and the lowerenergy ring current component well. The higher-energycomponent is measured by the Synchronous Orbit ParticleAnalyzers on the spacecraft. Unfortunately, the temperatureanisotropy is not a normal data product derived from theseenergetic particle telescopes.[31] By computing Ah and bkh using only the lower
energy component of the proton distribution measured bythe MPAs, the absolute value of the growth rate of theEMIC waves could be underestimated by about a factor of2. However, the interest here is on the relative changes in Ah
and bkh, and the growth rate as an interplanetary shock orpressure pulse compresses the magnetosphere. Thus as longas the higher-energy proton component does not changedramatically during the compression of the magnetosphere,the relative changes in Ah and bkh will be reasonably welldetermined from the MPA data. To minimize the effect ofthe higher-energy proton component on the relative changesin Ah and bkh, events were selected where the total energetic(from 50 to 200 keV/e) proton fluxes had little variation(less than a factor of 2) before and after the magnetosphericcompression.[32] Table 2 shows 11 events used to test the EMIC wave
mechanism and the relative importance of changes in Ah andbkh in producing EMIC wave growth. To identify a candi-date event, subauroral proton arcs were mapped from theionosphere to the equatorial magnetosphere using the sameprocedure described in section 3 that produced the mappingof the 25 October 2001 event (Figure 2). The locations ofthe Los Alamos geosynchronous spacecraft were checkedto determine if any were in the mapped precipitation
A12227 FUSELIER ET AL.: DAYSIDE SUBAURORAL PROTON PRECIPITATION
6 of 11
A12227
region. If data were available in the mapped region, thenthe higher-energy proton data were checked to make surethe total flux above 50 keV did not change by more than afactor of 2. The 25 October 2001 compression event wasparticularly good in all aspects because there were threeLos Alamos spacecraft located at different local times(Table 2) and all were in the broad region of precipitationobserved over the 10 min lifetime of the event (Figure 2).These observations were considered as separate events inTable 2, even though they come from the same magneto-spheric compression interval.[33] Using the plasma conditions 10 min before the
compression and immediately following the compressionobserved at the Los Alamos spacecraft, Ah, bkh, and themaximum growth rate were computed. The MPA datahave a resolution of 1 min and, unless there were signif-icant fluctuations in the density and/or temperature beforeor immediately after the compression, the highest timeresolution data were used. If there were significant fluctu-ations in these parameters, then a three spectrum averagewas used.[34] Most of the events in Table 2 support the EMIC
wave generation mechanism described in section 5. For 10of the 11 events the change in plasma conditions led to anincrease in the instability growth, as shown in the compar-ison of the two columns representing the maximum growthrates (gmax/Wp) before and after the magnetospheric com-pression. For only one event (8 November 2000) the relativechange in the growth rate was small and in the direction ofincreasing stability.[35] To understand how changes in local parameters lead
to changes in the instability growth rate, two systematicstudies were performed. These studies started with param-eters from Table 2 for the 10 cases where the growth rateincreased as a result of the compression. In the first study,two of the three parameters (Ah, bkh, nc) were fixed at theirvalues measured before the compression, while the thirdparameter was changed to its value measured after thecompression. The result of this study showed that thechange in Ah makes the largest contribution to the increasein the growth rate in 6 of the 10 events. In three remainingevents the change in bkh makes the largest contribution tothe increase in the growth rate. In only one event theincrease in nc (or, equivalently, the decrease in nh/nc) makesthe largest contribution to the increase in the growth rate.Thus under local conditions at geosynchronous orbit the
relative change in the cold plasma density was not a majorfactor in the enhancement in the growth rate.[36] The second study investigated the role that the nc
plays in the radial dependence of the growth rate after thecompression. Although the change in nc does not contributeto the growth rate increase locally at geosynchronous orbit,the radial profile of nc in the magnetosphere may play asignificant role in determining the radial extent of the regionwhere the EMIC waves are unstable after the magneto-spheric compression. Typically, there is significant coldplasma at intermediate distances from the Earth (e.g., insidegeosynchronous orbit), and the cold plasma densitydecreases rapidly at the plasmapause, further from the Earth.Such a density profile might cause the EMIC instability tobe driven above marginal stability at intermediate distancesfrom the Earth and not further from the Earth, even thoughthe temperature anisotropy in the dayside outer magneto-sphere increases with increasing radial distance from theEarth, and this anisotropy is the most important quantity indetermining the EMIC growth rate. The limited region ofprecipitation resulting from the control of the EMIC insta-bility threshold by nc would produce a subauroral arc that isseparated from the auroral oval, as in Figure 2.[37] The second systematic study was performed on the
same 10 events in Table 2 as the first study. For this study,Ah and bkh were fixed at their values observed by the LosAlamos spacecraft after the magnetospheric compression,and nc was reduced to zero. In 8 of 10 cases the growth ratewas stabilized (i.e., there was no longer positive growth ofthe instability), and in the last two cases the growth rate wasreduced to gmax/Wp < 4 � 10�5 (well below the marginalinstability threshold of gmax/Wp = 10�3).[38] Figure 4 shows how the reduction in the growth rate
depends on nh/nc for one of the events (11 September 2001,see Table 2). For this representative event a factor of 3reduction in nc results in an order of magnitude decrease inthe growth rate. This parametric study indicates that if Ah
and bkh were constant with increasing radial distance fromthe Earth then the plasma would be stable if the plasma-pause were between the observation point at geosynchro-nous orbit and the magnetopause. To be sure, Ah shouldincrease with increasing radial distance from the Earth.However, this increase is probably <50% and not nearlyas large as the factor of 5–10 decrease in nc across theplasmapause. Furthermore, in this parameter regime a linearincrease in Ah results in a linear increase in the EMIC
Table 2. Plasma Parameters at Geosynchronous Orbit for Subauroral Proton Arc Eventsa
Date
EventTime atIMAGE
LANLSpacecraft
SpacecraftMLT
Ah
Beforebkh
Beforenh/ncBefore
gmax/Wp
BeforeAh
AfterbkhAfter
nh/ncAfter
gmax/Wp
After
14 June 2000 1435 1991-080 15.2 0.53 0.153 0.55 7.5e-05 0.62 0.119 0.30 0.0006113 July 2000 0955 1991-080 10.7 0.46 0.0821 0.08 0.00027 0.55 0.0668 0.09 0.0004115 Sept. 2000 0453 1994-084 11.6 0.40 0.198 0.08 0.0012 0.59 0.255 0.28 0.003919 Sept. 2000 0720 1994-084 14.2 0.28 0.134 0.21 1.4e-08 0.37 0.130 0.15 2.6e-058 Nov. 2000 0614 1994-084 13.1 0.30 0.200 0.25 1.4e-06 0.29 0.267 0.39 7.4e-0718 April 2001 0045 1991-080 13.3 0.54 0.0904 0.09 0.00090 0.54 0.138 0.10 0.002111 Sept. 2001 1558 01A 16.3 0.28 0.132 0.05 0.00013 0.38 0.119 0.03 0.001125 Oct. 2001 0855 97A 13.5 0.46 0.131 0.38 1.2e-05 0.47 0.179 0.06 0.002825 Oct. 2001 0855 1994-084 15.9 0.40 0.135 0.10 0.00030 0.45 0.194 0.06 0.002925 Oct. 2001 0855 01A 9.4 0.64 0.138 0.05 0.0054 0.63 0.192 0.04 0.007412 Dec. 2001 1345 01A 14.2 0.32 0.179 0.03 0.0011 0.37 0.167 0.02 0.0021
aRead 7.5e-05 as 7.5 � 10�5, and so on, for all similar entries. LANL is Los Alamos National Laboratory.
A12227 FUSELIER ET AL.: DAYSIDE SUBAURORAL PROTON PRECIPITATION
7 of 11
A12227
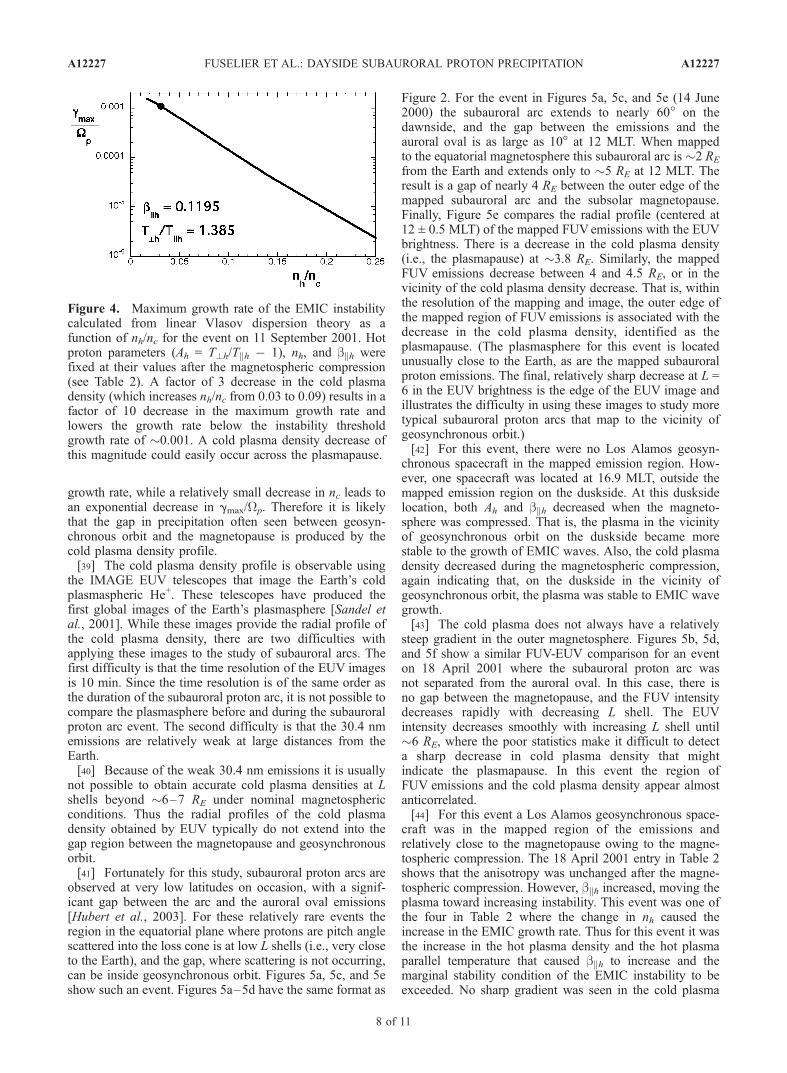
growth rate, while a relatively small decrease in nc leads toan exponential decrease in gmax/Wp. Therefore it is likelythat the gap in precipitation often seen between geosyn-chronous orbit and the magnetopause is produced by thecold plasma density profile.[39] The cold plasma density profile is observable using
the IMAGE EUV telescopes that image the Earth’s coldplasmaspheric He+. These telescopes have produced thefirst global images of the Earth’s plasmasphere [Sandel etal., 2001]. While these images provide the radial profile ofthe cold plasma density, there are two difficulties withapplying these images to the study of subauroral arcs. Thefirst difficulty is that the time resolution of the EUV imagesis 10 min. Since the time resolution is of the same order asthe duration of the subauroral proton arc, it is not possible tocompare the plasmasphere before and during the subauroralproton arc event. The second difficulty is that the 30.4 nmemissions are relatively weak at large distances from theEarth.[40] Because of the weak 30.4 nm emissions it is usually
not possible to obtain accurate cold plasma densities at Lshells beyond �6–7 RE under nominal magnetosphericconditions. Thus the radial profiles of the cold plasmadensity obtained by EUV typically do not extend into thegap region between the magnetopause and geosynchronousorbit.[41] Fortunately for this study, subauroral proton arcs are
observed at very low latitudes on occasion, with a signif-icant gap between the arc and the auroral oval emissions[Hubert et al., 2003]. For these relatively rare events theregion in the equatorial plane where protons are pitch anglescattered into the loss cone is at low L shells (i.e., very closeto the Earth), and the gap, where scattering is not occurring,can be inside geosynchronous orbit. Figures 5a, 5c, and 5eshow such an event. Figures 5a–5d have the same format as
Figure 2. For the event in Figures 5a, 5c, and 5e (14 June2000) the subauroral arc extends to nearly 60� on thedawnside, and the gap between the emissions and theauroral oval is as large as 10� at 12 MLT. When mappedto the equatorial magnetosphere this subauroral arc is �2 RE
from the Earth and extends only to �5 RE at 12 MLT. Theresult is a gap of nearly 4 RE between the outer edge of themapped subauroral arc and the subsolar magnetopause.Finally, Figure 5e compares the radial profile (centered at12 ± 0.5 MLT) of the mapped FUVemissions with the EUVbrightness. There is a decrease in the cold plasma density(i.e., the plasmapause) at �3.8 RE. Similarly, the mappedFUV emissions decrease between 4 and 4.5 RE, or in thevicinity of the cold plasma density decrease. That is, withinthe resolution of the mapping and image, the outer edge ofthe mapped region of FUV emissions is associated with thedecrease in the cold plasma density, identified as theplasmapause. (The plasmasphere for this event is locatedunusually close to the Earth, as are the mapped subauroralproton emissions. The final, relatively sharp decrease at L =6 in the EUV brightness is the edge of the EUV image andillustrates the difficulty in using these images to study moretypical subauroral proton arcs that map to the vicinity ofgeosynchronous orbit.)[42] For this event, there were no Los Alamos geosyn-
chronous spacecraft in the mapped emission region. How-ever, one spacecraft was located at 16.9 MLT, outside themapped emission region on the duskside. At this dusksidelocation, both Ah and bkh decreased when the magneto-sphere was compressed. That is, the plasma in the vicinityof geosynchronous orbit on the duskside became morestable to the growth of EMIC waves. Also, the cold plasmadensity decreased during the magnetospheric compression,again indicating that, on the duskside in the vicinity ofgeosynchronous orbit, the plasma was stable to EMIC wavegrowth.[43] The cold plasma does not always have a relatively
steep gradient in the outer magnetosphere. Figures 5b, 5d,and 5f show a similar FUV-EUV comparison for an eventon 18 April 2001 where the subauroral proton arc wasnot separated from the auroral oval. In this case, there isno gap between the magnetopause, and the FUV intensitydecreases rapidly with decreasing L shell. The EUVintensity decreases smoothly with increasing L shell until�6 RE, where the poor statistics make it difficult to detecta sharp decrease in cold plasma density that mightindicate the plasmapause. In this event the region ofFUV emissions and the cold plasma density appear almostanticorrelated.[44] For this event a Los Alamos geosynchronous space-
craft was in the mapped region of the emissions andrelatively close to the magnetopause owing to the magne-tospheric compression. The 18 April 2001 entry in Table 2shows that the anisotropy was unchanged after the magne-tospheric compression. However, bkh increased, moving theplasma toward increasing instability. This event was one ofthe four in Table 2 where the change in nh caused theincrease in the EMIC growth rate. Thus for this event it wasthe increase in the hot plasma density and the hot plasmaparallel temperature that caused bkh to increase and themarginal stability condition of the EMIC instability to beexceeded. No sharp gradient was seen in the cold plasma
Figure 4. Maximum growth rate of the EMIC instabilitycalculated from linear Vlasov dispersion theory as afunction of nh/nc for the event on 11 September 2001. Hotproton parameters (Ah = T?h/Tkh � 1), nh, and bkh werefixed at their values after the magnetospheric compression(see Table 2). A factor of 3 decrease in the cold plasmadensity (which increases nh/nc from 0.03 to 0.09) results in afactor of 10 decrease in the maximum growth rate andlowers the growth rate below the instability thresholdgrowth rate of �0.001. A cold plasma density decrease ofthis magnitude could easily occur across the plasmapause.
A12227 FUSELIER ET AL.: DAYSIDE SUBAURORAL PROTON PRECIPITATION
8 of 11
A12227
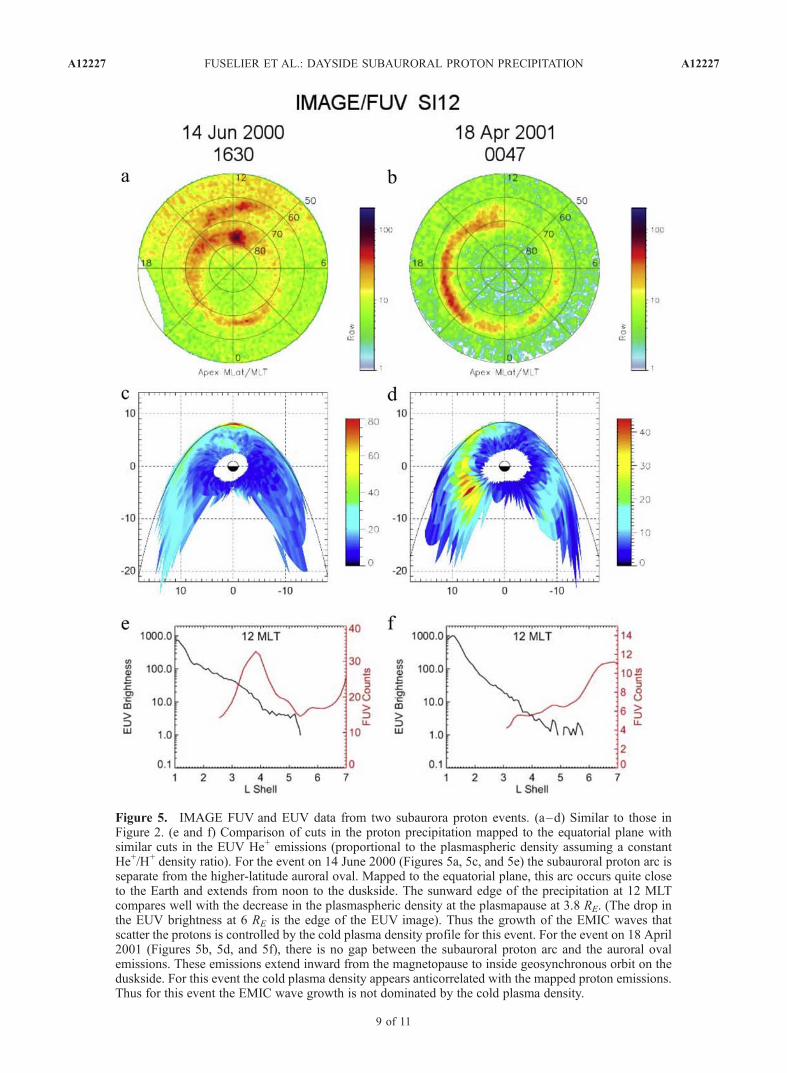
Figure 5. IMAGE FUV and EUV data from two subaurora proton events. (a–d) Similar to those inFigure 2. (e and f) Comparison of cuts in the proton precipitation mapped to the equatorial plane withsimilar cuts in the EUV He+ emissions (proportional to the plasmaspheric density assuming a constantHe+/H+ density ratio). For the event on 14 June 2000 (Figures 5a, 5c, and 5e) the subauroral proton arc isseparate from the higher-latitude auroral oval. Mapped to the equatorial plane, this arc occurs quite closeto the Earth and extends from noon to the duskside. The sunward edge of the precipitation at 12 MLTcompares well with the decrease in the plasmaspheric density at the plasmapause at 3.8 RE. (The drop inthe EUV brightness at 6 RE is the edge of the EUV image). Thus the growth of the EMIC waves thatscatter the protons is controlled by the cold plasma density profile for this event. For the event on 18 April2001 (Figures 5b, 5d, and 5f), there is no gap between the subauroral proton arc and the auroral ovalemissions. These emissions extend inward from the magnetopause to inside geosynchronous orbit on theduskside. For this event the cold plasma density appears anticorrelated with the mapped proton emissions.Thus for this event the EMIC wave growth is not dominated by the cold plasma density.
A12227 FUSELIER ET AL.: DAYSIDE SUBAURORAL PROTON PRECIPITATION
9 of 11
A12227
density in the outer magnetosphere, and the arc was notseparate from the auroral oval.
7. Discussion and Conclusions
[45] In this paper, the solar wind and magnetosphericdrivers for two features of subauroral proton arcs wereinvestigated. For the first feature, the local time occurrencein the peak of the subauroral emissions, the orientation ofthe solar wind pressure pulse or shock front plays animportant role. Figure 2 shows that the orientation of theshock front is associated with the side of the magnetospherewhere the peak of the mapped subauroral emissions islocated. The correlation is far from perfect, but shock frontsthat impact the duskside (dawnside) magnetosphere firsttend to produce regions of enhanced pitch angle scatteringon the duskside (dawnside).[46] There are several reasons why the correlation is not
expected to be perfect. The relatively short duration of thesubauroral arcs and their propagation to later and earlierlocal times (Figure 2) could reduce the correlation betweenthe shock front and the local time occurrence of the peak inthe emissions. Since the FUV imager makes a �5–10 ssnapshot of the auroral emissions every 2 min, and theevents typically last only 10 min, the initial precipitationmay be missed, and the subauroral arc might have alreadymoved to earlier (or later) local times by the time the firstimage is obtained. For example, the peak intensity of theemissions in Figure 2 moves almost 1 hour in magneticlocal time (i.e., 15�) from Figures 2a and 2d to Figures 2band 2e.[47] Another reason why the correlation is not expected to
be perfect is the uncertainty in the shock normal angle. Theminimum variance technique is correctly applied usingasymptotic conditions upstream and downstream from theshock. However, the precipitation occurs over a short timeperiod in the first �10 min of the shock arrival at themagnetopause. The orientation of the downstream field justafter the shock arrival is typically somewhat different fromthe asymptotic orientation (see Figure 1). It is estimated thatthis can contribute to uncertainties in the shock normalangle of the order of ±20�.[48] Finally, the correlation in Figure 3 is not expected to
be perfect because of the asymmetric distribution of coldplasma and hot proton anisotropy in the dayside magneto-sphere. Figure 3 shows that it is sometimes the case that thesubauroral proton arcs occur on the duskside, even when theinterplanetary shock arrives first on the dawnside. There isno corresponding tendency for arcs on the dawnside whenthe interplanetary shocks arrive first on the duskside.Figure 2 shows that as the emissions propagate aroundthe magnetosphere the dawnside emissions tend to fademore rapidly than the duskside emissions.[49] Two effects favor EMIC wave growth on the dusk-
side when compared to the dawnside. First, the cold plasmais typically further away from the Earth on the duskside,resulting in a region of higher EMIC growth rate furtherfrom the Earth on the duskside. Second, even in the absenceof a magnetopause compression the hot ring current protonanisotropy peaks on the duskside near the magnetopause[e.g., Anderson et al., 1996]. Combining this dusksidepreference with the possibility that the initial peak in the
emissions might be missed by the FUV imager suggests thatthere is a higher probability of observing a peak in theemissions on the duskside than on the dawnside.[50] The cold plasma density in the magnetosphere also
appears to play an important role in the second feature ofsubauroral proton arcs: the latitudinal extent and the gapbetween the subauroral arc and the main auroral oval. Hotplasma parameters (Ah and bkh) are the primary drivers ofthe instability at geosynchronous orbit. However, a decreasein nh/nc reduces the growth rate of the EMIC instability(Figure 4), thereby reducing the proton scattering and thesubsequent proton precipitation. Figure 4 indicates that, ifan observer were to move to higher L shells beyond theplasmapause, there would be a dramatic reduction orstabilization of the proton cyclotron instability and aquenching of the precipitation.[51] Figure 5e illustrates this point. It shows that the gap
between the mapped proton precipitation and the magneto-pause is related to the drop of the cold plasma density at theplasmapause observed by the EUV cameras. Thus eventhough Ah increases with radial distance from the Earth[e.g., Sibeck et al., 1987], the gap in the precipitation occursbecause of the sensitive dependence of the instabilitythreshold on the cold plasma density profile across theplasmapause.[52] The cold plasma density does not dominate the
EMIC wave growth for all cases. Figures 5b, 5d, and 5fshow such an example. When there is no gap between thesubauroral proton arc and the auroral oval, the mappedemissions appear to be anticorrelated with the cold plasmadensity profile. For this event the geosynchronous space-craft observations (the 18 April 2001 entry in Table 2) in theregion of the mapped emissions showed that the EMICwave growth rate increased because of an increase inbkh primarily through an increase in the hot plasma density.[53] These results suggest that the gap between the
subauroral arcs and the auroral oval is directly related tothe presence of a plasmapause in the outer magnetosphere.Even though the temperature anisotropy increases withincreasing radial distance from the Earth [Sibeck et al.,1987; Anderson et al., 1992; Anderson and Hamilton,1993], the decrease in the cold plasma density at theplasmapause typically determines the sunward extent ofthe precipitation region for the subauroral proton emissions.[54] Although the plasmapause plays an important role
in the events studied here, a statistical study of in situmagnetic field data showed that there is no evidence of anincrease in the occurrence frequency of EMIC waves atthe nominal location of the plasmapause [Anderson et al.,1992]. The apparent contradiction between the presentstudy and the previous statistical study can be understoodby considering the transient nature of the subauroralproton arcs. To show up in a statistical study of in situdata, the spacecraft observations of EMIC waves must bemade at the plasmapause at the time of a compression ofthe magnetosphere. The probability of this occurring issmall, so the statistical study does not reflect the transientconditions of the dayside outer magnetosphere just after amagnetospheric compression.[55] A similar EMIC wave mechanism for producing
longer-duration subauroral proton arcs has been suggested[Burch et al., 2002]. In this instance the subauroral proton
A12227 FUSELIER ET AL.: DAYSIDE SUBAURORAL PROTON PRECIPITATION
10 of 11
A12227
arc on the duskside is exposed by a rotation of the interplan-etary magnetic field. These arcs have a duration on the orderof an hour. Consistent with the importance of the cold plasmadensity in the generation of EMIC waves it has recently beendemonstrated that the sunward edge of a long-durationsubauroral proton arc is closely associated with the plasma-spheric plume on the duskside [Spasojevic et al., 2004]. Thusthe location of subauroral proton arcs appears to be con-trolled by the cold plasma density in the outer magnetosphereindependent of their duration. This result also does notcontradict large statistical studies of EMIC waves in theouter magnetosphere because, although the subauroral pro-ton arc persists for a long time (hours), the occurrencefrequency is low and requires certain solar wind conditions(e.g., a rotation in the interplanetary magnetic field).
[56] Acknowledgments. The success of the IMAGE mission is atribute to the many dedicated scientists and engineers that have worked andcontinue to work on the project. The PI for the mission is J. L. Burch. ACEobservations in this paper are from the NASA CDAWeb. N. Ness at BartolResearch Institute and D. J. McComas at Southwest Research Instituteprovided these data. Research at Lockheed Martin was supported throughan IMAGE subcontract from the University of California, Berkeley. Workat Los Alamos was conducted under the auspices of the U.S. Department ofEnergy, with partial support from NASA Sun-Earth Connections TheoryProgram. The authors thank the referee for insightful comments on thetheoretical aspects of EMIC wave growth.[57] Lou-Chuang Lee thanks Richard Denton for the assistance in
evaluating this paper.
ReferencesAnderson, B. J., and D. C. Hamilton (1993), Electromagnetic ion cyclotronwaves stimulated by modest magnetospheric compressions, J. Geophys.Res., 98, 11,369.
Anderson, B. J., R. E. Earlandson, and L. J. Zanetti (1992), A statisticalstudy of Pc 1–2 magnetic pulsations in the equatorial magnetosphere: 1.Equatorial occurrence distributions, J. Geophys. Res., 97, 3075.
Anderson, B. J., R. E. Denton, G. Ho, D. C. Hamilton, S. A. Fuselier,and R. J. Strangeway (1996), Observational test of local proton cyclotroninstability in the Earth’s magnetosphere, J. Geophys. Res., 101, 21,527.
Bame, S. J., D. J. McComas, M. F. Thomsen, B. L. Baraclough, R. C.Elphic, J. P. Glore, J. T. Gosling, J. C. Chavez, E. P. Evans, and F. J.Wymer (1993), Magnetospheric plasma analyzer for spacecraft withconstrained resources, Rev. Sci. Instrum., 64, 1026.
Burch, J. L. (2000), IMAGE mission overview, Space Sci. Rev., 91, 1.Burch, J. L., et al. (2002), Interplanetary magnetic field control of after-noon-sector detached proton auroral arcs, J. Geophys. Res., 107(A9),1251, doi:10.1029/2001JA007554.
Cornwall, J. M., F. V. Coroniti, and R. M. Thorne (1970), Turbulent loss ofring current protons, J. Geophys. Res., 75, 4699.
Fuselier, S. A., et al. (2001), Ion outflow observed by IMAGE: Implicationsfor source regions and heating mechanisms, Geophys. Res. Lett., 28,1163.
Fuselier, S. A., H. U. Frey, K. J. Trattner, S. B. Mende, and J. L. Burch(2002), Cusp aurora dependence on interplanetary magnetic field Bz,J. Geophys. Res., 107(A7), 1111, doi:10.1029/2001JA900165.
Gary, S. P. (1993), Theory of Space Plasma Microinstabilities, CambridgeUniv. Press, New York.
Gary, S. P., M. B. Moldwin, M. F. Thomsen, D. Winske, and D. J.McComas (1994), Hot proton anisotropies and cool proton temperaturesin the outer magnetosphere, J. Geophys. Res., 99, 23,603.
Gary, S. P., M. F. Thomsen, L. Yin, and D. Winske (1995), Electromagneticproton cyclotron instability: Interactions with magnetospheric protons,J. Geophys. Res., 100, 21,961.
Gomberoff, L., and S. Cuperman (1982), Combined effect of cold H+ andHe+ ions on the proton cyclotron electromagnetic instability, J. Geophys.Res., 87, 95.
Hubert, B., J. C. Gerard, S. A. Fuselier, and S. B. Mende (2003), Observa-tion of dayside subauroral proton flashes with the IMAGE-FUV imagers,Geophys. Res. Lett., 30(3), 1145, doi:10.1029/2002GL016464.
Immel, T. J., S. B. Mende, H. U. Frey, L. M. Peticolas, C. W. Carlson, J.-C.Gearad, B. Hubert, S. A. Fuselier, and J. L. Burch (2002), Precipitation ofauroral protons in detached arch, Geophys. Res. Lett., 29(11), 1519,doi:10.1029/2001GL013847.
McComas, D. J., S. J. Bame, P. Barker, W. C. Feldman, J. L. Phillips,P. Riley, and J. W. Griffee (1998), Solar wind electron proton alphamonitor (SWEPAM) for the Advanced Composition Explorer, SpaceSci. Rev., 86, 563.
Mende, S. B., et al. (2000), Far ultraviolet imaging from the IMAGE space-craft, 3, Spectral imaging of Lyman-a and OI 135.6 nm, Space Sci. Rev.,91, 287.
Mende, S. B., et al. (2001), Global observations of proton and electronauroras in a substorm, Geophys. Res. Lett., 28, 1139.
Ono, T., T. Hirasawa, and C. I. Meng (1987), Proton auroras observed at theequatorward edge of the duskside auroral oval, Geophys. Res. Lett., 14,660.
Perraut, S., and A. Roux (1975), Respective role of the cold and warmplasma densities on the generation mechanism of ULF waves in themagnetosphere, J. Atmos. Terr. Phys., 37, 407.
Sandel, B. R., et al. (2000), The extreme ultraviolet imager investigation forthe IMAGE mission, Space Sci. Rev., 91, 197.
Sandel, B. R., R. A. King, W. T. Forrester, D. L. Gallagher, A. L.Broadfoot, and C. C. Curtis (2001), Initial results from the IMAGEextreme ultraviolet imager, Geophys. Res. Lett., 28, 1439.
Seon, J. (1998), Determination of normal vectors for boundaries of plasmasbased upon Rankine-Hugoniot relations estimated with a single space-craft, J. Astron. Space Sci., 15, 11.
Sibeck, D. G., R. W. McEntire, A. T. Y. Lui, R. E. Lopez, and S. M.Krimigis (1987), Magnetic field drift shell splitting: Cause of unusualdayside particle pitch angle distributions during storms and substorms,J. Geophys. Res., 92, 13,485.
Smith, C. W., M. H. Acuna, L. F. Burlaga, J. L. Heureux, N. F. Ness, andJ. Scheifele (1998), The ACE magnetic fields experiment, Space Sci.Rev., 86, 611.
Spasojevic, M., H. U. Frey, M. F. Thomsen, S. A. Fuselier, B. R. Sandel,and U. S. Inan (2004), The link between a detached subauroral protonarc and a plasmaspheric plume, Geophys. Res. Lett., 31, L04803,doi:10.1029/2003GL018389.
Tsyganenko, N. A. (1995), Modeling the Earth’s magnetospheric magneticfield confined within a realistic magnetopause, J. Geophys. Res., 100,5599.
Zhang, Y., L. J. Paxton, T. J. Immel, H. U. Frey, and S. B. Mende (2003),Sudden solar wind dynamic pressure enhancements and dayside detachedauroras: IMAGE and DMSP observations, J. Geophys. Res., 108(A4),8001, doi:10.1029/2002JA009355.
�����������������������E. S. Claflin and S. A. Fuselier, Lockheed Martin Advanced Technology
Center, Space Physics Dept. ADCS B/255, 3251 Hanover Street, Palo Alto,CA 94304-1191, USA. ([email protected])S. P. Gary and M. F. Thomsen, Space and Atmospheric Sciences Group,
Los Alamos National Laboratory, Mail Stop D466, Group NIS-1, LosAlamos, NM 87545, USA.B. Hubert, Laboratoire de Physique Astrophysique et Planetaire, Institut
d’Atmospherique et de Geophysique, Universite de Liege, Allee du 6 Aout,17, Bat B5c, Liege B-4000, Belgium.T. Immel, Space Sciences Laboratory, University of California, Berkeley,
Grizzly Peak Blvd. at Centennial Dr., Berkeley, CA 94720-7450, USA.B. R. Sandel, Lunar and Planetary Laboratory, University of Arizona,
1040 East 4th Street, Room 901, Gould-Simpson Building, Tucson, AZ85721, USA.
A12227 FUSELIER ET AL.: DAYSIDE SUBAURORAL PROTON PRECIPITATION
11 of 11
A12227
Copyright © 2022 FDOKUMEN