Generation of knockdown mice that lack 14-3-3ε and 14-3-3γ using ...
223
1 Generation of knockdown mice that lack 14-3- 3ε and 14-3-3γ using RNA interference. By Lalit Sehgal LIFE09200604002 Tata Memorial Centre Mumbai A thesis submitted to the Board of Studies in Life Sciences In partial fulfilment of the requirements For the Degree of DOCTOR OF PHILOSOPHY Of HOMI BHABHA NATIONAL INSTITUTE August, 2012
-
Upload
khangminh22 -
Category
Documents
-
view
0 -
download
0
Transcript of Generation of knockdown mice that lack 14-3-3ε and 14-3-3γ using ...

1
Generation of knockdown mice that lack 14-3-3ε
and 14-3-3γ using RNA interference.
By
Lalit Sehgal
LIFE09200604002
Tata Memorial Centre
Mumbai
A thesis submitted to the
Board of Studies in Life Sciences
In partial fulfilment of the requirements
For the Degree of
DOCTOR OF PHILOSOPHY
Of
HOMI BHABHA NATIONAL INSTITUTE
August, 2012

2
HOMI BHABHA NATIONAL INSTITUTE Recommendations of the viva voce board members
As members of the viva voce board, we recommend that the dissertation prepared by Lalit
Sehgal titled ‘Generation of knockdown mice that lack 14-3-3ε and 14-3-3γ using RNA interference’ be accepted as fulfilling the requirements for the Degree of Doctor of
Philosophy.
---------------------------------------------------------------------------------- Date: Chair: Dr. Surekha. M Zingde
----------------------------------------------------------------------------------Date:
Convener: Dr. Sorab N. Dalal
---------------------------------------------------------------------------------- Date: External examiner: Dr Subeer S. Majumdar
----------------------------------------------------------------------------------Date:
Member 1: Dr. Rita. Mulherkar
---------------------------------------------------------------------------------- Date: Member 2: Dr. Neelam Shirsat
---------------------------------------------------------------------------------- Date: Member 3: Dr. Vidita Vaidya
The final approval and acceptance of this dissertation is contingent upon the candidate’s
submission of the final copies of the dissertation to HBNI. I hereby certify that I have read this dissertation prepared under my direction and recommend that it may be accepted as fulfilling the dissertation requirement.
Date:
Place:
Advisor: Sorab N Dalal

3
STATEMENT BY AUTHOR
This dissertation has been submitted in partial fulfilment of requirements for an advanced
degree at Homi Bhabha National Institute (HBNI) and is deposited in the Library to be
made available to borrowers under rules of the HBNI. Brief quotations from this
dissertation are allowable without special permission, provided that accurate
acknowledgement of source is made. Requests for permission for extended quotation
from or reproduction of this manuscript in whole or in part may be granted by the
Competent Authority of HBNI when in his or her judgment the proposed use of the
material is in the interests of scholarship. In all other instances, however, permission must
be obtained from the author.
Lalit Sehgal

4
DECLARATION
I declare that the thesis titled ‘Generation of knockdown mice that lack 14-3-3ε and 14-3-
3γ using RNA interference’ is a record of the work carried out by me during the period
September 2006 to December 2011 under the supervision of Dr. Sorab N Dalal. This
work is original and it has not been submitted earlier as a whole or in part for a degree,
diploma, associateship or fellowship at this or any other institute or university.
Navi Mumbai,
July 2012.
Lalit Sehgal

5
CERTIFICATE
I certify that the thesis titled ‘Generation of knockdown mice that lack 14-3-3ε and 14-3-
3γ using RNA interference’ submitted for the degree of Doctor of Philosophy by Lalit
Sehgal is a record of the research carried out by him during the period September 2006 to
December 2011 under my supervision. This work has not formed the basis for the award
of any degree, diploma, associateship or fellowship at this or any other institute or
university.
Navi Mumbai,
July 2012.
Sorab N Dalal

6
ACKNOWLEDGEMENTS
This PhD work would have been impossible without the help and support of many people
and I feel immensely honored to get this opportunity to convey my gratitude to everyone
who has supported and guided me during my PhD work. Firstly, I thank Sorab for being a
patient and motivating mentor. He has always been the greatest source of appreciation
and criticism for my work. His impeccable guidance accompanied by the freedom of
thought that he granted, has helped me to explore my potential. His enthusiasm to teach
has helped me learn to think logically about experiments and deal with difficult problems.
He has been a continuous source of inspiration and I thank him for everything. I am
thankful to Dr Rajiv Sarin (Director, ACTREC) and Dr Surekha Zingde (Deputy
Director, ACTREC) for providing me an opportunity to work in this institute. I am
fortunate to have Dr SM Zingde, Dr Rita Mulherkar, Dr Neelam Shirsat and Dr Vidita
Vaidya (TIFR) as my doctoral committee members. I am grateful for their expert
comments, critical analysis of my data and helpful suggestions. I also thank Dr Milind
Vaidya and Dr Rajiv Kalraiya for for involving me in collaborative studies with their
group. My special thanks to Dr Robin Mukhopadhyaya for helping us with mapping of
genomic integration sites. I thank Dr Sumeet Gujral (TMH) for analyzing the mouse
tissue sections of the knockdown mice. I would like to thank Dr Shubha Tole (TIFR) and
her lab members for helping me with the brain phenotype analysis. Special thanks to Dr
Satyajit Rath (NII) and Dr SV Chiplunkar (ACTREC) for scientific discussions, which
helped me to plan experiments. I also thank Dr Sanjeev Waghmare for his discussion on
skin phenotype. I also thank Dr Ullas Koltur (TIFR) for his help in analysis of mouse
testis. I would like to thank Dr Krishanu Ray and Mr Lalit Borde of TIFR electron
microscope facility who helped me a lot to acquire ultra-structure images. I would like to
thank Dr Young Lee (Korea), Dr James Larner (USA), Dr Gary Koretzky (USA), Dr
Friedemann Keifer (Germany), Dr Stefan Linder (Germany), Dr Tetsu Akiyoma (Japan),
Dr Chen Gu (USA), Dr Lawerence Goldstein (USA), Dr Satyajit Mayor (NCBS) and Dr
Nagaraj Balasubhramanium (IISER) for providing various constructs. I extend my
gratitude to Vaishali Kailaje, Tanuja and Jairaj of imaging facility for helping me acquire
all the microscopic images and appreciate their enthusiastic approach towards their work.

7
I am thankful to Mr Uday Dandekar for his efforts to maintain the common instrument
facility. I also thank Dr Rahul Thorat and Dr Arvind Ingle of animal house for their help
during my work. My special thanks to Sandeep Kale and other animal house staff
members that have helped me during my work. The financial support by ACTREC and
DBT is sincerely acknowledged. I thank all my labmates previous and present, Samrat,
Nileema, Elphine, Amol, Amitabha, Prajakta, Rashmi, Mansa, Srikanta, Mugdha, Kumar,
Sonali, Anushree, Arunabha and Khrievono for their support and help. I am thankful to
Mr L.D. Pawar, Vishal Mhatre and Arun Kole for their help and technical support. I
would like to thank Mugdha Sawant, Khyati Bhatt, Anandi Rajan, Sneha Sansare,
Vallabhi S, Rini Shah, Neha Parayath, Harshali Bandekar, Sujay Gaikwad, Kedar
Prabhudesai and Dipika Gupta who have worked with me. I have spent a great time with
my seniors and batch mates Aditya Ambade, Santosh, Hunain Alam, Satyajeet Khare,
Srikant B, Shrikanth A, Rohan Kamat, Bhairav Paleja, Cheryl, Atul Pranay, Amit Singh,
Ajit Chande, Amit Ranjan, Amit Fulzele, Manoj Ramteke, Poulami Das, Tabish Hussain,
Palavi Goel and Sapna Iyer and am thankful for their perennial help and constructive
criticism. I will also cherish my stay during my PhD spent with my wonderful roommates
Atul Pranay, Rajan Kumar and Manoj Ramteke. Thanks are due to all the Ph.D research
fellows who have made each day at ACTREC a new experience for me. I owe my
deepest thanks to my mother, father and sister for their constant love and support and for
believing in my capabilities.
Lalit Sehgal

8
INDEX
PAGE NO.
SYNOPSIS 11
LIST OF ABBREVIATIONS 32
LIST OF TABLES 34
LIST OF FIGURES 35
1. CHAPTER 1 : INTRODUCTION 39
1.1 The cell cycle. 40
1.2 Cell cycle checkpoint pathways. 44
1.3 The cdc25 family of dual specificity phosphatases. 53
1.4 14-3-3 proteins. 59
1.5 Generation of transgenic mouse models. 63
2. CHAPTER 2 : AIMS AND OBJECTIVES 67
3. CHAPTER 3 : MATERIALS AND METHODS 69
3.1 Generation of lentiviral vectors for the expression of shRNA’s. 70
3.2 Generation of lentiviral vectors expressing shRNA and EGFP-f. 70
3.3 Generation of lentiviral vectors for cDNA expression. 70
3.4 Generation of Bi-cistronic lentiviral vectors 71
3.5 Generation of K18-YFP and K8-CFP constructs 71
3.6 Design of shRNA oligonucleotides 71
3.7 Cloning of shRNA oligonucleotides 72
3.8 Design of shRNA miR oligonucleotides 72
3.9 Cloning of shRNAmiR oligonucleotides into pTRIPZ. 74
3.10 Constructs for expression of HA-tagged/EGFP tagged proteins. 75
3.11 Constructs for expression of HA-tagged shRNA resistant cDNA. 75
3.12 Cell lines and transfections. 76
3.13 Virus Production and titration. 77
3.14 Animal experiments. 78
3.15 Injection of viral particles and generation of transgenic mice. 78

9
3.16 Isolation of Genomic DNA (gDNA). 79
3.17 Polymerase Chain Reactions and Reverse Transcriptase PCR. 79
3.18 Antibodies. 80
3.19 Histology. 81
3.20 Immunohistochemistry. 81
3.21 Immunofluorescence and confocal microscopy. 81
3.22 Inverse PCR and mapping of integration sites. 83
3.23 Spleenocyte culture. 83
3.24 Single or Multi color flow cytometry 83
3.25 FRET assays. 84
3.26 Antibodies used for Western blotting. 85
3.27 SDS PAGE and Western blotting protocol. 85
3.28 GST pulldown assays. 86
3.29 Immunoprecipitation. 87
3.30 Electron microscopy. 88
3.31 Calcium Switch experiments. 88
3.32 Hanging drop assay to determine cell-cell adhesion. 89
3.33 Cell-ECM adhesion assay. 89
3.34 Wound healing assay to determine cell migration. 90
3.35 Soft agar assay. 90
3.36 Tumor formation in nude mice. 90
3.37 Biodistribution of 18F-FDG using Positron Electron Tomography. 91
3.38 Reagents 91
4. CHAPTER 4 : RESULTS
4.1 To generate novel constitutive and inducible lentiviral 96
Vectors for transgene expression or the generation of
Knockdown mice.
4.2 Generation of transgenic mice 106
4.3 Generation of 14-3-3γ knockdown mice. 115

10
4.4 Generation of 14-3-3ε knockdown mice. 155
5. CHAPTER 5 : DISCUSSION 181
5.1 Generation of lentiviral vectors. 182
5.2 Novel protocol for the generation of transgenic mice. 183
5.3 Generation of knockdown mice for 14-3-3ε and 14-3-3γ. 185
6. BIOLIOGRAPHY 195
7. PUBLICATIONS 222
11
A synopsis of thesis to be submitted to the Homi Bhabha National
Institute
For the degree of Doctor of Philosophy
In Life Sciences
Name of the candidate: Lalit Sehgal
Title of the thesis: Generation of knockdown mice that lack 14-3-3 and 14-3-3 using
RNA interference
Degree: Ph.D.
Subject: Life Science
Registration number: LIFE09200604002
Date of registration: 01/09/2006
Name and designation of the guide : Dr. Sorab N. Dalal
S. O. ‘F’ ACTREC,
Assistant Professor HBNI
Institute: Tata Memorial Centre, Advanced Centre for Treatment Research and
Education in Cancer (ACTREC), Kharghar, Navi Mumbai – 410210

12
INTRODUCTION.
In most eukaryotic cell cycles a DNA synthesis phase alternates with a chromosome
segregation phase. A failure to do so results in defects in the inheritance of the genetic
material (263). Checkpoint pathways monitor DNA integrity and prevent cell cycle
progression in the presence of unreplicated or damaged DNA (91). Activation of the G2/M
checkpoint in response to damaged DNA leads to a cell cycle arrest at the G2 to M
transition (reviewed in (278)). Defects in the G2/M checkpoint pathway allow cells to
initiate mitosis even in the presence of damaged or unreplicated DNA, leading to genomic
instability (reviewed in (278, 378)). Thus, loss of check point function is often a
contributing factor to neoplastic progression (91, 278).
Cell cycle transitions are dependent on a class of proteins called the cyclins and their
associated kinases, the cdks (reviewed in (349, 388)). The transition of cells from G2 to M
phase requires an active cdk1/cyclin B complex (345), which is activated by
dephosphorylation of a Threonine residue at position 14 (T14) and a Tyrosine residue at
position 15 (Y15) in cdk1 by the dual specificity phosphatase, cdc25C (103, 112). cd25C
itself is negatively regulated by phosphorylation on a serine residue at position 216 (S216)
during interphase. S216 is not phosphorylated during mitosis (281). This site is a target
for phosphorylation by DNA damage checkpoint kinases such as Chk1 and Chk2 (228,
281, 311).
The phosphorylation of cdc25C on S216 creates a binding site for 14-3-3 proteins leading
to the hypothesis that 14-3-3 proteins negatively regulate cdc25C function (69, 281).
Binding of 14-3-3 proteins to cdc25C leads to its retention in the cytoplasm thus
preventing mitotic progression (69, 126). Mutation of Serine 216 to Alanine (S216A)

13
results in loss of 14-3-3 binding and a pan-cellular localization of cdc25C. These results
suggest that 14-3-3 proteins regulate cdc25C function in part by restricting it to the
cytoplasm in interphase. Further, it has been reported that 14-3-3 proteins prevent
interaction between cdc25C and its substrate, the cyclin B/cdk1 complex (244). Therefore,
14-3-3 proteins regulate cdc25C function at multiple levels.
It has been demonstrated that 14-3-3and bind to wild type cdc25C in vitro but
not to the S216A mutant (71). However, coimmunoprecipitation experiments revealed
that only 14-3-3 and 14-3-3 form a complex with and inhibit cdc25C function in vivo
(71). Similarly, cells lacking either 14-3-3 or 14-3-3 show an override of the S phase
and DNA damage checkpoints and these are due to the inability of these cells to regula te
cdc25C function (157, 354). Further, our laboratory has identified a structural motif
conserved in 14-3-3 and 14-3-3 that mediates specific complex formation with cdc25C
in vivo (354). These results suggest that the activity of different 14-3-3 isoforms is not
redundant and that each 14-3-3 protein may selectively bind to different ligands.
Since 14-3-3 and 14-3-3 have a role to play in regulating checkpoint function (157,
354), we wished to determine whether the generation of a hypomorphic allele for these
genes in the mouse would affect growth and development. To address this question, an
attempt was made to generate knockdown mice for 14-3-3and using vector
mediated RNA interference. Our work has resulted in the development of a novel method
for the generation of transgenic mice and revealed multiple phenotypes that are associated
with 14-3-3 loss. An analysis of these phenotypes will result in an increased
understanding of how these proteins regulate multiple cellular pathways.
14
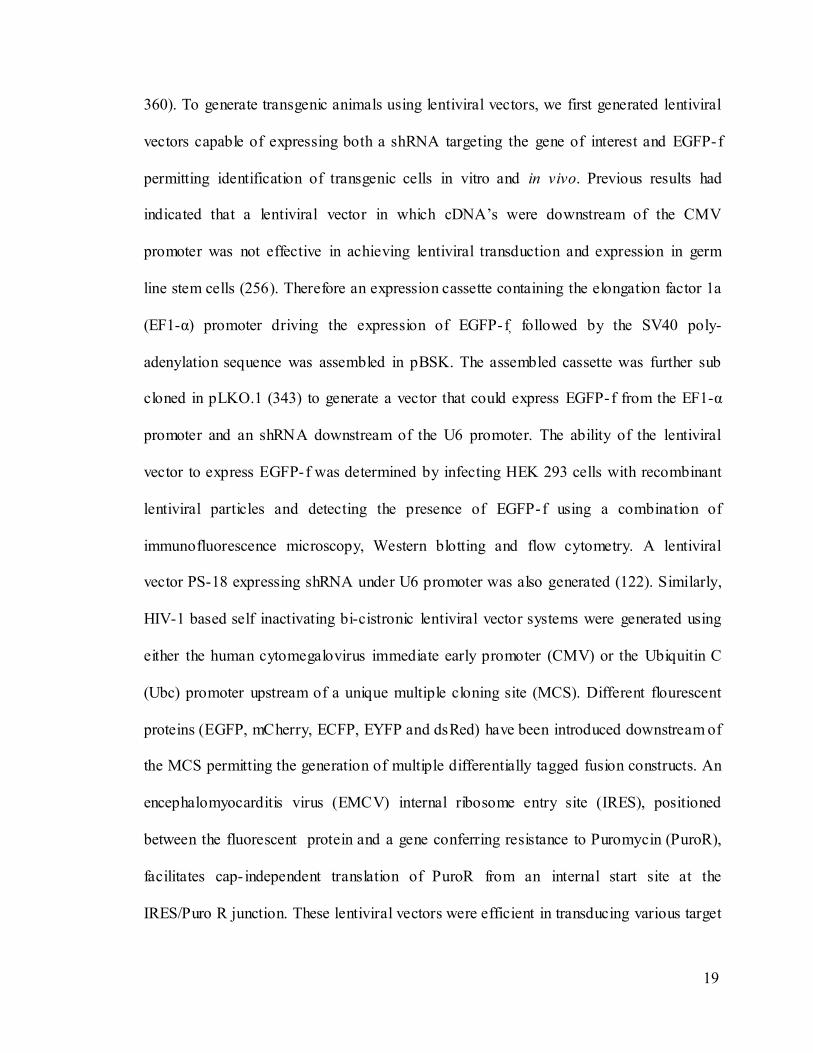
AIMS AND OBJECTIVES.
1. To determine if loss of 14-3-3 and/or 14-3-3 in MESC results in mislocalization of
cdc25C.
2. To generate novel constitutive and inducible lentiviral vectors for transgene expression
or the generation of knockdown mice.
3. To develop a new technique for the generation of transgenic animals.
4. To study the role of 14-3-3 and 14-3-3 in growth and development by generating
knockdown mice.
MATERIALS AND METHODS.
Animals. Swiss mice Crl:CFW(SW) and NIH nude mice (Nu/Nu) were bred and
maintained in the laboratory animal facility of ACTREC as per the national guidelines
provided by the Committee for the Purpose of Control and Supervision of the
Experiments on Animals (CPCSEA), Ministry of Environment and Forest, Government of
India. The animals were housed in a controlled environment with the temperature and
relative humidity being maintained at 23±20C and 40-70% respectively and a day night
cycle of 12 hrs each (7:00 to 19:00 light; 19:00 to 7:00 dark). The animals were received
an autoclaved balanced diet prepared in-house as per the standard formula and sterile
water ad libitum. Mice were housed in the Individually Ventilated Cage (IVC) system
(M/S Citizen, India) provided with autoclaved rice husk bedding material available
locally. Protocols for the experiments were approved by the Institutional Animal Ethics
Committee (IAEC) of ACTREC.
Generation of Lentiviral vectors. The generation of the pLKO.1 EGFP-f vector has been
described (322). The pTRIPZ (Open Biosystems) lentiviral vector was digested with XbaI

15
and NheI (NEB) to remove tetO-CMV, turboRFP, 5’-3’mir30 sequences, shRNA cloning
sites and Ubc promoter sequences. The CMV promoter was amplified from pCDNA3.0
(Invitrogen), digested with XbaI and NheI (NEB) and cloned into the modified pTRIPZ
vector to generate pLV-CMV-Puro. The MCS fluorescent tag cassettes were excised from
the vectors pECFPN1, pEYFPN1, pEGFPN1, pmCherryN1 and pDsRedN1 (Clontech)
with NheI and NotI and cloned into pLV-CMV-Puro digested with NheI and NotI to
generate pLV-CMV-FB-IRES-Puro. The bi-cistronic lentiviral vectors with ubiquitin
promoter driven expression of fluorescent proteins were generated by digesting the
pTRIPZ vector with XbaI and MluI (NEB) to remove tetO-CMV, turboRFP, 5’-3’mir30
sequences and the shRNA cloning site sequences. The resulting vector fragment was
treated with Mung bean nuclease (NEB) to generate blunt ends and self- ligated. The
resulting circular plasmid was digested with NheI and NotI to remove the rtTA3 gene
flanked by loxP sites and the fluorescent protein MCS cassettes cloned into it as described
above to generate pLV-Ubc-FP-IRES-Puro.
Virus production and generation of transgenic mice. Viruses were produced and the
viral titre determined according to the manufacturers protocol (Invitrogen). The protocol
for the generation of transgenic mice has been described (322). Briefly, a solution of
lentiviruses resuspended in dPBS (Invitrogen) containing trypan blue (0.04%) was
injected slowly into the inter-tubular space of one testis using a 30 gauge needle. The
untransduced testis was vasectomised. The animals were kept on thermal plate until they
recovered from the surgery to avoid hypothermia. The pre- founder male mice were co-
habitated with wild-type females (ratio 1:2) 35 days post-transduction and the pups
generated were analyzed for the presence of the EGFP-f transgene by PCR..

16
Isolation of genomic DNA (gDNA) and polymerase chain reactions. Genomic DNA
was purified and subjected to PCR analysis using transgene-specific primers. RNA was
prepared from tissues using the Qiagen RNeasy kit as per the manufacturer’s protocol and
RT-PCR was conducted using RevertAid™ First Strand cDNA synthesis Kit (NEB)
according to manufacturer’s protocol.
Fluorescence and Immunofluorescence microscopy. 5 m cryosections of multiple
tissues were observed by confocal microscopy to detect the presence of EGFP-f. Confocal
images were obtained by using a LSM 510 Meta Carl Zeiss Confocal system with an
Argon 488 nm and Helium/Neon 543 nm lasers. All images were obtained using an Axio
Observer Z.1 microscope (numerical aperture [NA] 1.4) at a magnification of 63 X.
Inverse PCR and mapping of integration sites. Lentiviral integration sites were
identified by modifying the ligation-mediated PCR method as described (319). The
amplified products were cloned into the pJet1.2/Blunt vector (Fermentas) followed by
sequencing on a 3100 Avant Genetic Analyser to identify the site of integration.
Histology and immunohistochemistry. Four weeks after subcutaneous injection, the
mice were sacrificed and the tumor and lung tissues were fixed in 10% formaldehyde
(SIGMA) overnight and processed for histology. Five micron sections of paraffin
embedded tissue were prepared and hematoxylin/eosin staining and immunohistochemical
staining was performed according to standard methods (163). The degree of metastasis
was determined by examining three lung sections per mouse and visualizing the area of
alveolar tissue that was filled with metastatic colonies. Permeabilization for antigen
retrieval was performed by microwaving the fixed tissue sections in 10mM Tris buffer
(pH 9) with 2mM EDTA.

17
Hanging drop and wound healing assays . Hanging drop assays to measure cell-cell
adhesion and wound healing assays to measure cell migration were performed as
described (122, 197).
Isolation of spleenocytes. The spleen was dissected in 3ml of media (i.e. RPMI 1640
with 10% FBS) in a small petri dish (35x10mm) on a sterile wire mesh screen. The spleen
was pushed through the screen with the plunger of a 10ml syringe into the petri dish. The
spleenocytes were collected and centrifuged at 500xg for 30 minutes on a Ficoll Hypaque
gradient. The lymphocytes were purified and cultured as described (REF).
Analysis of spleenocytes by flow cytometry. Single cell suspensions were prepared and
incubated with monoclonal antibodies (mAbs) (10 µg/106 cells) used in one-color, dual or
tri-color flow cytometry to identify the markers present on the spleenocytes. Data
acquisition and single-color, Dual-color or tri-color flow cytometry analyses were
performed on a FACScan using the Cellquest program (Becton Dickinson, San Diego,
USA).
Soft agar assays and tumor formation in nude mice. Soft agar assays and nude mouse
experiments were performed as described (196). All animal studies were approved by the
Institutional Animal Ethics committee constituted under the guidelines of the CPCSEA,
Government of India. 106 cells of the NIH3T3 derived 14-3-3 knockdown were
resuspended in DMEM medium without serum and injected subcutaneously in the dorsal
flank of 6-8 weeks old NMRI Nude (Nu/Nu) (292) (obtained from ACTREC animal
house facility). Five mice were injected for each clone. Tumor formation was monitored
at intervals of 2-3 days and tumor size was measured by a vernier calipers. Tumor volume

18
(mm3) was calculated by the formula ½ LV2 where L is the largest dimension and V its
perpendicular dimension, as previously reported (292, 389).
RESULTS
To determine if loss of 14-3-3 and/or 14-3-3 in MESC results in mislocalization of
cdc25C. To address whether the loss of 14-3-3 or 14-3-3 results in mislocalization of
cdc25C, we first determined whether 14-3-3 and 14-3-3formed a complex with mouse
cdc25C by performing GST pull down assays. While both 14-3-3 and 14-3-3formed a
complex with human cdc25C in this assay, neither protein could form a detectable
complex with mouse cdc25C. In humans, 14-3-3 proteins bind to cdc25C in vitro and in
vivo upon phosphorylation at a Serine residue at position 216; however a comparison of
sequences of cdc25C proteins from different species demonstrated that this sequence was
absent in mouse, rat and hamster cdc25C but was present in cdc25C from Xenopus laevis
and Sus domestica. These results lead us to conclude that 14-3-3 proteins might regulate
cell cycle progression in a cdc25C independent fashion in the mouse.
Generation of constitutive and inducible lentiviral vectors for transgene expression
or the generation of knockdown mice. Within the last decade, multiple lentiviral vectors
have been developed as tools for gene delivery and for therapeutic and experimenta l
transgenic applications (66, 105, 173, 226, 234, 284, 285, 295, 336, 400) as they permit in
vivo gene delivery to terminally differentiated cells in multiple tissue types (66, 105, 173,
183). Because of their ability to transduce quiescent cells, lentiviral vectors are also
promising tools for ex vivo genetic modification of stem cells (29, 297), which reside
almost exclusively in the G0/G1 phase of the cell cycle and can also be used to generate
transgenic mouse models of human disease (3, 138, 169, 226, 253, 255, 256, 284, 307,
19
360). To generate transgenic animals using lentiviral vectors, we first generated lentiviral
vectors capable of expressing both a shRNA targeting the gene of interest and EGFP-f
permitting identification of transgenic cells in vitro and in vivo. Previous results had
indicated that a lentiviral vector in which cDNA’s were downstream of the CMV
promoter was not effective in achieving lentiviral transduction and expression in germ
line stem cells (256). Therefore an expression cassette containing the elongation factor 1a
(EF1-α) promoter driving the expression of EGFP- f, followed by the SV40 poly-
adenylation sequence was assembled in pBSK. The assembled cassette was further sub
cloned in pLKO.1 (343) to generate a vector that could express EGFP-f from the EF1-α
promoter and an shRNA downstream of the U6 promoter. The ability of the lentiviral
vector to express EGFP-f was determined by infecting HEK 293 cells with recombinant
lentiviral particles and detecting the presence of EGFP-f using a combination of
immunofluorescence microscopy, Western blotting and flow cytometry. A lentiviral
vector PS-18 expressing shRNA under U6 promoter was also generated (122). Similarly,
HIV-1 based self inactivating bi-cistronic lentiviral vector systems were generated using
either the human cytomegalovirus immediate early promoter (CMV) or the Ubiquitin C
(Ubc) promoter upstream of a unique multiple cloning site (MCS). Different flourescent
proteins (EGFP, mCherry, ECFP, EYFP and dsRed) have been introduced downstream of
the MCS permitting the generation of multiple differentially tagged fusion constructs. An
encephalomyocarditis virus (EMCV) internal ribosome entry site (IRES), positioned
between the fluorescent protein and a gene conferring resistance to Puromycin (PuroR),
facilitates cap- independent translation of PuroR from an internal start site at the
IRES/Puro R junction. These lentiviral vectors were efficient in transducing various target

20
cell lines and could be used for live cell imaging techniques such as FRET (manuscript
submitted).
Development of a new technique for the generation of transgenic animals. The
generation of genetically modified mice has spurred great advances in our understanding
of various aspects of growth and development. Multiple technologies have used either
injection into a one celled embryo followed by implantation into a pseudo pregnant
mother (121), or used stem cell aggregation techniques to generate either knockout (123)
or knockdown mice (360). These experiments are expensive, labor- intensive, time-
consuming and require several female donors. Spermatogonial stem cells are responsible
for the production of spermatozoa (74) and are an appropriate target for germline
modification (254). Nagano et. al. have generated transgenic mice by infecting
spermatogonial stem cells in vitro with recombinant retroviruses followed by xenogenic
transplantation of the cells into the testes of a male mouse (253). In some cases the
recipient mice were unreceptive to the donor spermatogonial cells (253) and the overall
success rate was rather low. Similarly, in vivo transduction of testicular germ cells with
retroviral constructs carrying a lacZ gene, resulted in a poor success rate of 2.8% (169).
The low success rates post implantation, however precluded these from replacing
embryonic injection. Similar experiments using lentiviruses, resulted in better success
rates (138).
Recombinant lentiviruses expressing EGFP-f (EGFP tagged with a farnesylation signal)
were injected into the intertubular spaces of the testis targeting undifferentiated
spermatogonia present in the seminiferous tubules. Injection into the intertubular space
allows the lentivirus to infect undifferentiated spermatogonial cells located at the

21
basement of the seminiferous tubules (168). Five to ten microlitres of recombinant EGFP-
f expressing lentiviruses (5 x 10⁶ TU/ml) was injected into the intertubular spaces of the
testis of 28 day old Crl:CFW(SW) male mice. These male mice, referred to as pre-founder
mice, were mated with wild type females of the same strain 35 days post infection.
Transgenic pups were generated from mating experiments with three independently
derived pre-founder mice at an overall rate greater than 60%, a rate that is much higher
than previously reported with conventional transgenic protocols or with retroviral
infection of spermatogonial stem cells in vitro or in vivo (169, 253). The experiments
resulted in the development of a simple, cost effective, and efficient technique for the
generation of transgenic mice by in vivo transduction of the desired gene/shRNA
construct into undifferentiated spermatogonia of the testis (322). This technology does not
compromise the fertility of the off-spring, resulting in germline transmission of the
transgene, using a limited number of animals .
Generation of mice with a knockdown of 14-3-3ε or 14-3-3γ. To generate knockdown
mice for 14-3-3γ, lentiviruses that express EGFP-f and shRNA’s that target 14-3-3γ were
injected into the efferent duct of the developing testes to infect spermatogonial stem cells.
None of the mice injected with lentiviruses expressing shRNA’s targeting 14-3-3γ
produced pups when mated with wild type female mice. Even pups that lack the transgene
were not produced in these mating experiments suggesting that male mice injected with
the 14-3-3γ knockdown viruses were sterile. To determine if the mice infected with the
14-3-3γ knockdown constructs were sterile, three male mice injected with viruses
encoding the 14-3-3γ shRNA were sacrificed and a histochemical analysis performed on
sections from the testes. Wild type mice showed the presence of multiple spermatids at

22
different stages of development in the testes and showed the presence of developed sperm
in the epididymis. However, testes from the mice injected with the 14-3-3γ shRNA failed
to show different developmental stages in the testes with most of the developing
spermatids stuck at stage VIII. In addition, there was a problem with transport of
spermatids across the Blood Testes Barrier (BTB) as most of the vescicles in the
epididymis of these mice did not contain any sperm. These results suggest that sterility in
males upon loss of 14-3-3γ may be due to problems with spermatocyte development
and/or transport across the BTB to the epididymis. Apart from the problems in
development or maturation we have also observed the adhesion defects betwee n sertoli
cells and developing spermatocytes in the testis where 14-3-3γ expression was inhibited.
To confirm whether 14-3-3γ regulates cell adhesion, HCT116 derived 14-3-3γ
knockdown clones were tested for their ability to form clusters in a hanging drop assay.
Upon loss of 14-3-3γ cell- cell adhesion properties in HCT116 cells were altered. We also
found that the localization of the desmosomal proteins (PKG, PKP3, DP and DSC2/3) to
the cell border was decreased in the 14-3-3γ knockdown clones. To determine how 14-3-
3γ regulates desmosome assembly, we next asked if 14-3-3γ could form a complex with
proteins present in the desmosome. GST pull down assays and immunoprecipitation
experiments demonstrated that 14-3-3γ is able to bind to PKG, PKP3 and DP both in vitro
and in vivo. This result raises questions such as how 14-3-3γ regulates desmosome
assembly, cell-cell adhesion and sperm development and maturation.
To generate knockdown mice for 14-3-3ε, lentiviruses that express EGFP- f and shRNA’s
that target 14-3-3ε were injected into the efferent duct of the developing testes to infect
spermatogonial stem cells. When the 14-3-3ε fore-founder mice were mated with a

23
normal female, pups were screened for the presence of EGFP-f by PCR amplification
from genomic DNA. 14-3-3ε levels were determined in the EGFP- f positive mice by
reverse transcriptase coupled PCR (RT-PCR). The levels of knockdown were established
by comparing the levels of 14-3-3ε mRNA to that of the housekeeping gene GAPDH.
Three animals that showed a decreased level of 14-3-3ε died within 160 days of birth, as
compared to control mice. A decrease in body weight upon downregulation of 14-3-3ε
was also observed in the knockdown mice.
It was reported earlier that a mice that are heterozygous or homozygous null for 14-3-3ε
have defects in brain development and neuronal migration (363). In the homozygous null,
most mice die just after birth. These results suggest that loss of 14-3-3ε leads to defects in
brain development. To determine if this phenotype was observed in our 14-3-3ε
knockdown mice, brain sections from wild type or knockdown mice were stained with
antibodies to 14-3-3ε and examined under the microscope. It was observed that there is a
decrease in staining for 14-3-3ε in brain sections derived from the knockdown mice as
opposed to sections derived from wild type mice. The defect in the cortical layers
observed was not significant.
The 14-3-3ε knockdown mice died about 160 days post birth. To determine the cause of
death in the knockdown mice, the mice were dissected and the internal organs examined.
All the mice had significantly enlarged spleens (splenomegaly).To determine the cause of
the splenomegaly and the alterations in the other internal organs, an immunohistochemical
analysis performed. It was observed that the lungs, liver and kidneys of the 14-3-3ε
knockdown mice showed the presence of infiltrating cells of lymphoid origin as compared

24
to WT mice. This was confirmed by immunohistochemical analysis using antibodies to
CD3.
To confirm whether the splenomegaly was due to an increase in lymphoid cells in the
spleen, the spleens of WT or 14-3-3ε knockdown mice were stained with antibodies to
CD3 (T cell marker). The spleen sections of the 14-3-3ε knockdown mice showed an
increased presence of CD3 and CD45 positive lymphocytes as compared to WT mice. The
spleen cells were purified from mice and an immunophenotyping experiment was
performed using antibodies that recognize the CD3, CD4, CD8 and B220 antigens. It was
observed that there is increase in the CD4+ population in the cells purified from the
spleens of the knockdown mice as compared to the vector control. We also found that the
CD4-/CD8- double negative T cell population is increased in cells purified from the
spleen of knockdown mice. Interestingly; multiple reports have suggested that 14-3-3ε
levels are reduced in adult T-cell leukemias. In addition, we have also observed that there
is an increase in the number of CD3+ positive cells in the lungs of the knockdown mice as
compared to the vector controls.
It has been reported that a downstream effector of T cell activation, SLP-76, is important
to maintain T cells in activated state (164). An in silico analysis of SLP-76 using Motif
Scan revealed the presence of a 14-3-3 binding motif in SLP-76 and the hematopoietic
protein kinase 1 phosphorylates SLP-76 at Serine residue 376 to generate 14-3-3 binding
motif (79). To determine if 14-3-3ε can form a complex with SLP76 in the presence of
HPK1, FLAG-SLP76, and HA 14-3-3ε were transfected into HEK 293 cells in the
presence or absence of HA-HPK1. It was observed that SLP76 formed a complex with
25
14-3-3ε only in the presence of HPK1. This result suggested that 14-3-3ε is negatively
regulating T cell activation by binding to and inhibiting SLP76 function.
We also observed swollen lymph nodes in some of the 14-3-3ε knockdown mice. To
determine if the swollen lymph nodes were due to the presence o f transformed cells,
pieces of the lymph node were transplanted on to the backs of SCID mice. The lymph
nodes were capable of forming a transplantable tumor. A PET analysis using 5FDG
demonstrated that the tumor is vascularized and capable of initiating the formation of
blood vessels. These results suggest that 14-3-3ε downregulation may lead to neoplastic
transformation. To determine whether 14-3-3ε can inhibit tumor formation, stable cell
clones lacking 14-3-3ε generated in NIH3T3 cells were tested for their ability to form
colonies in soft agar as compared to the vector control. The 14-3-3ε knockdown clone
E17, formed larger and more colonies in soft agar as compared to the vector control. The
migration ability of cells lacking 14-3-3ε increased as determined by wound healing
assay. In addition we determined whether the NIH3T3 derived 14-3-3ε knockdown clone
can form tumors in SCID mice. Five out of six injected mice showed the presence of
tumor as compared to none for the vector control. These results suggest that loss of 14-3-
3ε can lead to neoplastic transformation.
The 14-3-3ε knockdown mice show patchy hair loss. To determine whether the
organization of the epidermis is altered in the 14-3-3ε knockdown clones, skin sections
from WT or mutant mice were stained with hematoxylin and eosin. We observed
epidermal stratification is altered in the skin of 14-3-3ε knockdown mice as compared to
the wild type mice. Hair follicles and the hair shaft develop normally in the WT mice
however in the 14-3-3ε knockdown mice the hair shaft did not develop and hair follicles

26
were abundant in dermal layer of the skin. In addition it was also observed that the
average thickness of both epidermal and dermal layer was decreased as compared to wild
type mice. These results suggest that 14-3-3ε regulates epidermal stratification and
development of hair follicles.
DISCUSSION.
To summarize we have developed multiple lentiviral vectors that can be used to express
cDNA’s in cultured cells (122) and for the generation of transgenic mice. The lentiviral
vectors generated can be used to over express either shRNA, cDNA or both. The lentiviral
vectors generated were tested for their ability to transduce cells in vitro and in vivo.
A new cost effective, rapid technique with a high rate of success for the generation of
transgenic mice by in vivo viral transduction of the gene of interest into undifferentiated
spermatogonia has been developed during the course of this thesis (322). This technology
does not compromise the fertility of the off-spring, resulting in germline transmission of
the transgene, using a limited number of animals. A very high rate of transgenesis was
obtained in this process, with all the animals being able to sire transgenic pups, leading to
the rapid generation of multiple transgenic pups with different integration events allowing
the generation of multiple transgenic lines. The procedure could be extended to other
animals, especially non-human primates, resulting in a significant advancement in
transgenic research and the use of other animal models to model human disease (322).
We found that the mice injected with lentiviruses expressing shRNAs targeting 14-3-3γ
were unable to sire pups when mated with wild type female mice. A further analysis of
the testes phenotype showed severe cell-cell adhesion defects, defects in spermatogenesis
and mice sterility. It has been previously reported that the different isoforms of 14-3-3

27
proteins are expressed in testis (348). As germ cells differentiate from spermatogonia into
elongated spermatids, they move across seminiferous epithelium to reach the luminal
compartment by reorganizing the blood testis barrier (BTB) (184, 210, 348). At the same
time, these germ cells must also maintain stable attachment with Sertoli cells via
desmosome and actin based cell junctions to prevent depletion of immature germ cells
from the seminiferous epithelium, which may result in infertility. Moreover loss of
desmosomal proteins (Dsg2 Dsc2/3) in sertoli cells has also disrupted BTB dynamics and
function (210). The localization of various desmosomal proteins (DSC2/3, DP. PKG and
PKP3) was altered upon loss of 14-3-3γ in HCT116 cells. These observations suggest that
the severe cell-cell adhesion defects in testes may be due to altered localization of
desmosomal protein upon 14-3-3γ loss.
To study the contribution of 14-3-3ε in growth and development of mice the knockdown
mice were generated as described (322). The 14-3-3ε knockdown mice died nearly 6
months post birth. It has been reported earlier that mice heterozygous or homozygous null
for 14-3-3ε have defects in brain development and neuronal migration (363). We observed
that although the level of 14-3-3ε in brain is significantly reduced, cortical thinning was
not observed. These mice showed pleotropic phenotypes including spleenomegaly and
patchy hair loss (alopecia). We observed lymphocytic infiltration in various organs (lung,
liver and kidney) of the 14-3-3ε knockdown mice. The levels of CD3+ and CD4+ cells
were significantly increased. Upon analysis we also found that the level of CD3+ CD4-
CD8- cells is more in the knockdown mice, generally observed in patients with leukemia
(352). It is also reported that the level of 14-3-3ε is significantly reduced in human
malignancies such as Leukemia or lymphoma (8, 9). We hyphothesized that the the CD3+
28
DN cells in peripheral cells may arise by hyperproliferation of the T cells. This was
strengthen by the find that 14-3-3ε binds to SLP-76 in presence of kinase HPK1 (79).
These results therefore suggest that 14-3-3ε may negatively regulate the T cell activation.
To further understand the role of 14-3-3ε and 14-3-3γ in growth and development we
wish to generate inducible knock down mice.
Publications from the thesis.
1. Lalit Sehgal, Rahul Thorat, Nileema Khapre, Amitabha Mukhopadhaya, Mugdha
Sawant and Sorab N Dalal Lentiviral mediated transgenesis by in vivo
manipulation of Spermatogonial stem cells. PLoS ONE 6(7): e21975.
2. Gosavi, P., S. T. Kundu, N. Khapare, Lalit Sehgal, M. S. Karkhanis, and S. N.
Dalal. E-cadherin and plakoglobin recruit plakophilin3 to the cell border to
initiate desmosome assembly. Cell. Mol. Life Sci. (2011) 68:1439–1454. (One of
the vectors developed during the course of this thesis was used in experiments
done in this paper).
3. Lalit Sehgal, Rahul Thorat, Nileema Khapre, Amitabha Mukhopadhaya, Mugdha
Sawant and Sorab N Dalal. A protocol for generation of transgenic mice by
manipulating spermatogonial stem cells in vivo. (Nature Protocol Exchange, 29
May, 2012).
4. Lalit Sehgal, Amitabha Mukhopadhaya, Anandi Rajan, Khyati Bhatt, Mugdha
Sawant, Dipika Gupta, Rahul Thorat, Neelima Khapare, and Sorab N Dalal. Role
of 14-3-3γ in cell-cell adhesion and mice sterility. (Manuscript under
preparation).

29
5. Lalit Sehgal, Srikanth B., Khyati Bhatt, Sneha Sansare, Amitabha
Mukhopadhayay, Rajiv D. Kalraiya , and Sorab N. Dalal. Generation of HIV-1
based bi-cistronic lentiviral vectors for stable gene expression and live cell
imaging. (Accepted, Indian Journal of Experimental Biology).
Other publications.
1. Hunain Alam, Lalit Sehgal, Samrat T. Kundu, Sorab N. Dalal and Milind
M.Vaidya Novel function of Keratin 5 and 14 in proliferation and differentiation
of stratified epithelial cells. (Molecular biology of Cell, volume 22, November 1
2011, 4068-4078)
2. Hunain Alam, Amruta V. Bhate, Prakash Gangadaran, Sharda S. Sawant, Lalit
Sehgal, Shimul Salot, Prerana P. Dange, Devendra A. Chaukar, Anil K D’cruz,
Sadhna Kannan, Rajiv Gude, Shubhada Kane, Sorab N. Dalal and Milind M.
Vaidya.Fascin overexpression promotes neoplastic progression in OSCC. (BMC
Cancer. 2012 Jan 20;12(1):32).
3. Khapare N*, Lalit Sehgal*, S Kundu*, R Priya, Mugdha Sawant, P Gosavi, N
Gupta, H Alam, M Karkhanis, N Naik, M M Vaidya, S N Dalal, Cytokeratin 8
stabilization is required for the transformation induced upon loss of plakophilin3
expression. (PLoS One. 2012; 7 (6):e38561. Epub 2012 Jun 6.) * These authors
contributed equally.
Patents :
1. Lalit sehgal, Rahul throat, Nileema Khapre and Sorab N Dalal; Lentiviral
mediated transgenesis. (2010) Patent Governement of India (current status filed
2442/DEL/2010)

30
2. Lalit sehgal, Rahul throat, Nileema Khapre and Sorab N Dalal; Lentiviral
mediated transgenesis. (2011) Patent United States of America (current status
filed 13004382 dated 11 January 2011)
Poster/oral Presentations.
1 Lalit Sehgal, Rahul Thorat, Nileema Khapre, Amitabha Mukhopadhaya and Sorab
N Dalal Lentiviral mediated transgenesis by in-vivo manipulation of
spermatogonial stem cells. Presented a poster at AACR New Horizons in Cancer
Research: Biology to Prevention to Therapy conference, Delhi , December 13-16,
2011.
2 Lalit Sehgal, Rahul Thorat, Nileema Khapre, Amitabha Mukhopadhaya and Sorab
N Dalal Lentiviral mediated transgenesis using Sperm mediated gene transfer.
Presented a Poster at 79th annual meeting of Society of biological chemistry Indian
institute of Sciences, Bangalore 13th December 2010-15th December 2010.
3 Lalit Sehgal, Rahul Thorat, Nileema Khapre, Amitabha Mukhopadhaya, and
Sorab N Dalal Lentiviral mediated transgenesis in vivo. Presented a poster at
Mouse development, genetics and genomics meeting at Cold spring Harbor
Laboratory, NY USA, 26th October 2010-30th October 2010.
4 Lalit Sehgal, Rahul Thorat, Nileema Khapre, Amitabha Mukhopadhaya, and
Sorab N Dalal Generation of transgenic mice by Sperm mediated gene transfer.
Presented a talk entitled “at 5th Graduate students meet at ACTREC 18 and 19th
December 2009. Received third prize.
5 Lalit Sehgal, Rahul Thorat, Nileema Khapre, Amitabha Mukhopadhaya, and
Sorab N Dalal Generation of knockdown mice by Sperm mediated gene transfer.

31
Presented a poster at 33rd All India cell biology conference 2009 & international
workshop on cell cycle regulation held at central university of Hyderabad,
Hyderabad from 10th -13th December 2009.
6 Lalit Sehgal, Amitabha Mukhopadhaya, and Sorab N Dalal “Generation of stem
cell lines and knockdown mice that lack 14-3-3ε and 14-3-3γ using RNA
interference” Participated and presented a poster at international meeting on
Model organism and stem cell biology at NCBS, Bangalore, Feb 23-25 2008.

32
List of abbreviations:
AD Adriamycin
DAPI 4, 6-diamidino-2-phenylindone
DNA Deoxyribonucleic acid
EB Elution buffer
EGFP-f Enhanced green fluorescence protein-
Farnesylated
FACS Fluorescence activated cell sorter.
G1 Gap phase I
G2 Gap phase II
M Mitotic phase
S Synthetic phase
GST Glutathione S-transferase
HA Haemagglutinin
WB Western Blot
IP Immuno Precipitation
WCE Whole cell extract
HCT Human colon Tumor
HEK Human embryonic kidney
HRP Horseradish Peroxidase
HU Hydroxyurea
HC Immunoglobulin Heavy chain
LC Immunoglobulin Light chain
IR Ionizing radiation
PAGE Polyacrylamide gel electrophoresis
PBS Phosphate buffered saline
PCR Polymerase chain reaction
PI Propidium iodide
RNA Ribonucleicacid
SDS Sodium dodecyl sulphate
33
shRNA Short hairpin RNA
siRNA Small interfering RNA
TBS-T Tris buffered saline with Tween-20
U.V Ultraviolet
WT Wild Type
C Cytokeratin
IF Intermediate filament
DSG Desmoglein
DSC Desmocollin
PG Plakoglobin
PKP Plakophilin
DP Desmoplakin
IEF Iso-Electric Focussing
2D Two dimensional

34
List of Tables:
Page No
1. Table 3.1: List of oligonucleotides used for PCR reactions. 71
2. Table 3.2: List of oligonucleotides used for shRNA cloning. 73
3. Table 3.3: List of oligonucleotides used for cloning shRNAmiR. 74
4. Table 3.4: List of oligonucleotides used for cloning HA tagged
14-3-3 protein. 75
5. Table 3.5: List of oligonucleotides used for cloning shRNA
resistant 14-3-3ε and 14-3-3γ. 76
6. Table 3.6: Calcium phosphate transfection mix. 76
7. Table 3.7: List of oligonucleotides used to amplify YFP K18. 79
8. Table 3.8: List of oligonucleotides used for genomic PCR reactions. 80
9. Table 4.2.1: Percentage of EGFP-f positive pups obtained from
individual mating with three different pre-founder mice. 108
10. Table 4.2.2: Summary of the integration events observed in
the different transgenic animals. 114
11. Table 4.3.1: 14-3-3γ knockdown clones show a defect in cell adhesion. 129

35
List of Figures:
Page No
1. Figure 1.1: The cell cycle: 40
2. Figure 1.2: The DNA damage checkpoint pathway. 45
3. Figure 1.3: The G1/S DNA damage checkpoint response. 48
4. Figure 1.4: The incomplete S phase checkpoint response. 50
5. Figure 1.5: The G2/M DNA damage checkpoint response. 52
6. Figure 1.6: Regulation of cdc25C by the checkpoint pathway 55
7. Figure 4.1.1: Generation of lentiviral vectors for the
expression of shRNA’s. 97
8. Figure 4.1.2: Generation of pBSK-F2 shuttle vector 98
9. Figure 4.1.3: Generation of lentiviral vectors for the
expression of cDNA 99
10. Figure 4.1.4: Generation of bi-cistronic lentiviral vectors
for the expression of cDNA 100
11. Figure 4.1.5: Transient and stable transgene expression using
bi-cistronic lentiviral vector. 101
12. Figure 4.1.6: Application of bi-cistronic lentiviral vectors
in live cell imaging.. 98
13. Figure 4.1.7: Application of bi-cistronic lentiviral vectors
in live cell imaging. 103
14. Figure 4.2.1: Infection of morulae in vivo results in the
generation of EGFP-f transgenic mice. 106
15. Figure 4.2.2: Generation of transgenic mice. 109
16. Figure 4.2.3: EGFP-f expression in various tissues of founder mice. 111
17. Figure 4.2.4. Analysis of integration events in
the EGFP-f transgenic mice. 113
18. Figure 4.3.1: 14-3-3γ or 14-3-3ε does not interact with cdc25C. 116
19. Figure 4.3.2: Testing the 14-3-3γ cDNA and shRNA constructs. 117
20. Figure 4.3.3: Generation of 14-3-3γ knockdown mice 118
21. Figure 4.3.4: Screening for the lentiviral integration in testis

36
injected with 14-3-3γ shRNA lentiviral constructs. 119
22. Figure 4.3.5: Expression of EGFP-f in testis injected with
14-3-3γ shRNA lentiviral constructs. 120
23. Figure 4.3.6: Expression of 14-3-3γ in testes injected with
14-3-3γ shRNA lentiviral constructs. 121
24. Figure 4.3.7: Staging of 14-3-3γ knockdown testes. 123
25. Figure 4.3.8: 14-3-3γ knockdown leads a defect in sperm
migration to the epididymis. 124
26. Figure 4.3.9: 14-3-3γ knockdown leads to defects in testes
development. 126
27. Figure 4.3.10: Ultra structure of 14-3-3γ knockdown testes. 127
28. Figure 4.3.11: 14-3-3γ knockdown in HCT116 cells shows
reduced cell-cell adhesion. 129
29. Figure 4.3.12: 14-3-3γ knockdown in HCT116 cells shows
reduced cell-ECM adhesion. 130
30. Figure 4.3.13: 14-3-3γ loss leads to depletion of multiple
desmosomal proteins at the cell border. 133
31. Figure 4.3.14: Expression levels of adhesion proteins are
not altered upon 14-3-3γ down-regulation. 133
32. Figure 4.3.15: 14-3-3γ loss does not alter the localization
of adherens junction, gap junction and polarity proteins at
the cell border. 134
33. Figure 4.3.16: Localization of PKP3 at the cell border is
altered in 14-3-3γ knockdown testes. 135
34. Figure 4.3.17: 14-3-3γ loss loss does not lead to alteration
in the localization of keratin 8 and keratin 18. 136
35. Figure 4.3.18: Reintroduction of shRNA resistant 14-3-3γ
in 14-3-3γ knockdown clones rescues the defects in the
localization of desmosomal proteins. 137
36. Figure 4.3.19: 14-3-3γ is required to initiate
desmosome formation. 140
37
37. Figure 4.3.20: 14-3-3γ interacts with PG and
Kinesin 1 motor protein KIF5B. 141
38. Figure 4.3.21: Plakoglobin recruitment to the cell
border is microtubule dependent. 143
39. Figure 4.3.22: 14-3-3γ loss does not alter the localization
of KIF5B to to microtubules. 144
40. Figure 4.3.23: Desmocollin2/3 recruitment to the cell border
is microtubule dependent. 145
41. Figure 4.3.24: ATPγS treatment inhibits the DSC2/3
recruitment to cell border. 147
42. Figure 4.3.25: Generation of stable KIF5B knockdown
clones in HCT116 cells. 149
43. Figure 4.3.26: Loss of KIF5B does not alter
microtubule organiozation. 150
44. Figure 4.3.27: KIF5B loss leads to depletion of
PG at the cell border. 152
45. Figure 4.3.28: KIF5B loss leads to depletion of
DSC2/3 at the cell border. 153
46. Figure 4.4.1: Testing the efficiency of cDNA
and shRNA constructs. 156
47. Figure 4.4.2: Generation of 14-3-3ε knockdown mice. 157
48. Figure 4.4.3: 14-3-3ε knockdown in brain. 159
49. Figure 4.4.4: Patchy hair loss in 14-3-3ε knockdown mice. 161
50. Figure 4.4.5: Epidermal loss in 14-3-3ε knockdown mice. 162
51. Figure 4.4.6: Stratification of skin is impaired in
14-3-3ε knockdown mice. 163
52. Figure 4.4.7: Phenotypes in 14-3-3ε knockdown mice. 165
53. Figure 4.4.8: 14-3-3ε knockdown mice show lymphocyte
infiltration in various organs. 166
54. Figure 4.4.9: 14-3-3ε knockdown mice spleen and lungs
show CD3 positive cells. 167
38
55. Figure 4.4.10: 14-3-3ε levels are reduced in splenocytes
from 14-3-3ε knockdown mice. 169
56. Figure 4.4.11: 14-3-3ε knockdown mice have aberrent
T cell population. 170
57. Figure 4.4.12: 14-3-3ε regulates T cell activation. 172
58. Figure 4.4.13: Bone marrow cells from 14-3-3ε knockdown
mice are not capable of inducing splenomegaly in SCID mice. 173
59. Figure 4.4.14: Lymph node inflammation in the knockdown
mice is due to tumor formation. 174
60. Figure 4.4.15: Generation of stable 14-3-3ε knockdown
clones in NIH-3T3 cells. 175
61. Figure 4.4.16: NIH3T3 cells lacking 14-3-3ε leads to
acquisition of neoplastic transformation. 176
62. Figure 4.4.17: HA-14-3-3ε-R is resistant to degradation
by E1 shRNA construct. 178
63. Figure 4.4.18: Generation of inducible 14-3-3ε knockdown mice. 179
64. Figure 5.1 Schematic representation of desmosomal protein
PG recruitment to cell border upon loss of 14-3-3γ,
KIF5B or α-tubulin in HCT116 cells. 191

39
CHAPTER 1
INTRODUCTION

40
1. Introduction
1.1 The cell cycle.
The eukaryotic cell cycle ensures faithful replication of the genetic material and
segregation of the genetic material to the daughter cells (91, 262). The cell cycle is
divided into four phases namely, G1, S, G2 and M (Figure 1.1). DNA replication occurs
during the synthesis phase (S phase) and chromosome segregation during mitosis (M
phase). Two gap phases G1 and G2 lie between M phase and S phase and S phase and M
phase respectively (262). Progression of cells through the cell cycle is dependent on
completion of the previous cell cycle phase (91).
Figure 1.1 The cell cycle: The cell cycle can be divided into four sequential phases G1,
S, G2 and M. Different cyclin/cdk complexes are active at the indicated points in the cell
cycle. Cdk activity is regulated by cyclin expression, post-translational modifications (see
text for details) and by two different families of cdk inhibitors (CdkI) as indicated.

41
1.1.1 Cyclin Cdk complexes
Eukaryotic cell cycle transitions are dependent on a class of proteins called the cyclins
and their associated kinases, the cyclin dependent kinases (Cdks) and progression of cells
from one phase of the cell cycle to another requires the activity of cyclin/Cdk complexes.
. Cyclin concentration varies in a cyclical manner during the different phases of cell cycle
and is classified based on the sequences in the conserved cyclin box region (286, 287).
The cyclin box is the domain is required for binding to and activating the Cdks (286, 287)
and cyclin binding is required for Cdk activation (180, 206). Cyclin mRNA increases and
peaks at a specific point in cycle. Once the specific cell cycle stage is completed cyclin
mRNA expression decreases and the cyclins are targeted for degradation by ubiquitin
mediated proteasomal degradation (93). Thus, the progression of the cell cycle through
the various phases is dependent upon the abundance of a particular cyclin at particular
phase in the cell cycle and the activity of the associated cdk.
Cdks are serine threonine kinases and are the catalytic subunit in the complex and have
no activity in the absence of the cyclins (reviewed in (286)). Budding and fission yeast
have a single cdk, cdc28 and cdc2 respectively, which associate with multiple cyclins to
mediate cell cycle progression (11). In mammals, different cdks associate with more than
one cyclin and each cyclin can associate with one or more cdks (reviewed in (243, 286,
287)). The different cyclin/cdk complexes are described below. In addition to cyclin
binding, cdk activity is regulated by post translational modifications (reviewed in (286))
and by cdk inhibitors (CDKI). Two families of CdkI’s have been identified in
mammalian cells, the CIP/KIP family and the INK4 family (129, 139, 291, 325). The
CIP/Kip members include p21, p27 and p57 (141, 204, 227, 290, 392).The CIP/KIP
members inhibit activities of, cyclin E and A dependent kinases (330) and p21 can inhibit
cyclinB/cdk1 activity (51, 141, 314, 392). There are four members of the INK4 family
(p15, p16, p18 and p19) and they bind to and inhibit the function of the cyclin D/cdk4/6
complexes (49, 130, 139, 325).

42
1.1.1. a Cyclin D cdk complexes
The D cyclin and their associated kinases cdk4 and cdk6 are important for the transition
from G1 to S phase. There are three D type cyclins in mammals (D1, D2, D3), which are
expressed in a tissue specific manner (329) and their expression is induced upon
mitogenic stimulation (231). The levels of the D cyclins begin to rise in early G1 and
peak at the beginning of of S Phase. The level of the D type cyclins rapidly declines
during S-phase due to the ubiquitin dependent degradation of cyclin D by the SCF
complex (399). The D type cyclins promote the G1/S transition by sequestering the CDK
inhibitors, p27 and p21 which are potent cdk2 inhibitors and by the phosphorylation of
pRb protein reviewed in (220, 331). The INK4 family of CdkI’s bind to cdk4 and cdk6
and inhibit their activity by interfering with the binding of cyclins to the cdks (330). The
cyclinD/cdk complexes promote entry into S phase in part by phosphorylating the Rb
tumor suppressor (230). This results in the disruption of Rb-E2F complexes permitting
the expression of E2F target genes that are required for S-phase entry (382).
1.1.1.b Cyclin E cdk complexes
The E-type (E1 and E2) cyclins regulate the progression of cells through late G1 and into
S phase (182, 271). E-type cyclins are expressed in all cell types (85, 131, 182, 401).
However, the expression of E-type cyclins depends on the activation of E2F, which is
activated by an increase cyclin D associated CDK activity as described above (30, 270).
Expression of E-type cyclins begins in late G1 and continues till the cells enter S phase
(30, 270). When cells enter S phase, E-type cyclins are ubiquitinated by the SCF complex
followed by degradation via the ubiquitin proteasome pathway (75, 258, 335, 380).
Cyclin E predominantly associates with and activates cdk2 (85, 131, 182, 201, 401). The
cyclinE/cdk2 complex phosphorylates Rb and contributes to activation of the E2F family
of transcription factors. E2F induces cyclin E expression from E2F responsive cyclin E
promoter, which results in increased Rb phosphorylation forming a positive feedback
loop (30, 270). CyclinE/cdk2 complexes also regulate the levels of Cip/Kip family of
CDK inhibitors (326, 375). The cyclinE/cdk2 complex phosphorylates these CDK
inhibitors, which promotes their ubiquitination and proteasomal degradation (219, 326,
375).

43
1.1.1.c Cyclin A cdk complexes
The A type cyclins, A1 and A2, are E2F responsive genes (219). The A cyclins pair with
cdk2 and inactivate p27 and pRb protein thereby promoting cell cycle progression. Low
levels of cyclin A/cdk2 activity are detected in late G1 phase (119, 274). The level of
cyclin A/cdk2 continues to rise through the S phase and is steady till early mitosis. In S
phase cyclin A/cdk2 activity is required to phosphorylate substrates that initiate DNA
replication (328, 331). CyclinA/cdk2 kinase activity is inhibited by CIP/KIP family of
cdk inhibitors. The CIP/KIP inhibitors bind to cdks at their catalytic site preventing ATP
binding and activity. (330).
1.1.1.d Cyclin B cdk complexes
Cyclin B associated CDK activity is required for mitotic progression. In human cells two
B-type cyclins, B1 and B2 are expressed. The level of cyclin B1 rise at S phase and is
highest during mitosis (289). The two cyclins differ in their ability to induce mitosis and
the difference is due to their distinct subcellular localization (83). Cyclin B1 is
predominantly cytoplasmic during interphase and is transported to the nucleus just before
the initiation of mitosis (31, 165, 288). The B2 type cyclins are mainly cytoplasmic and
localize to Golgi bodies (31, 165, 288). The functional significance of the B type cyclins
in proliferation and development is reflected in the respective knockout mouse
phenotypes. Cyclin B2 null mice are normal and fertile whereas cyclin B1 null mice die
early during embryogenesis (31). As the cyclin B1 knockout mice is an early embryonic
lethal, this suggests that cyclin B1 has an essential role in cell cycle progression (384)
and can compensate for the absence of cyclin B2.
During interphase, cdk1 is phosphorylated on three residues. Phosphorylation on T161 by
CAK is required for cdk1 activation (124, 198-200). In addition to T161, cdk1 is
phosphorylated on two residues in its ATP binding site, T14 and Y15 (23, 261).
Phosphorylation of these residues inhibits access to ATP that is required for cdk activity
(339). These residues are phosphorylated by wee1, myt1 and mik1 kinases (mik1
phosphorylates cdk1 on Y15 as demonstrated in S. pombe (205)) (76, 205, 249, 277).
Wee1 is a nuclear protein whereas myt1 is a cytoplasmic membrane bound protein. Thus

44
the cyclin-cdk complex is held in an inactive state in the nucleus and cytoplasm.
Activation of cyclinB1/cdk1 complex requires the dephosphorylation of cdk1 on T14 and
Y15 by the cdc25 family of dual specificity phosphatases (86, 112, 237, 345). A cdk1
mutant (cdk1AF mutant) in which T14 and Y15 are mutated to alanine and phenylalanine
respectively does not get phosphorylated and induces premature entry into mitosis (27,
125, 187). Prior to mitosis the phosphate residues on T14 and Y15 are removed by the
action of the cdc25 family of dual specificity phosphatases (86, 112, 192, 237, 321, 344,
345) which are discussed below.
1.2 Cell cycle checkpoint pathways.
Checkpoint pathways are signal transduction pathways that are activated by stress to
DNA. The stress, which can be incomplete S-phase, DNA damage or aberrant attachment
to the mitotic spindle, is detected by sensor proteins that transduce the signal to
downstream effector kinases leading to multiple responses of which one is cell cycle
arrest (reviewed in (91, 142, 405)) (Figure 1.2). Checkpoint pathways can be activated by
a variety of agents. e.g. agents such as ultraviolet radiation (UV) and hydroxyurea
interfere with DNA replication and different types of DNA damage can be induced by
exposure to physical agents such as UV or ionizing radiation (IR) or by chemical agents
such as methyl-methane sulphonate (MMS), cisplatin, adriamycin (Doxorubicin), etc. In
addition to these agents, highly reactive chemical species, such as free radicals or reactive
oxygen species, which arise as a result of cellular metabolism, also cause DNA damage
(reviewed in (72, 405)). Spindle inhibitors such as colchicine and nocodazole disrupt the
mitotic spindle resulting in activation of the spindle assembly checkpoint (reviewed in
(186)). Activation of the checkpoint pathways result in a variety of responses such as cell
cycle arrest, apoptosis, repair of damaged DNA and transcription of repair genes
(reviewed in (405))
Checkpoint dependent cell cycle arrest is important because it gives the cell time to repair
the damage (reviewed in (91)). Loss of checkpoint pathways allows cells to continue
cycling in presence of incompletely replicated or damaged DNA or in presence of an
incomplete spindle assembly (reviewed in (262)). Loss of checkpoint function may result
in accumulation of mutations, deletions, amplifications, translocationsand aneuploidy, all

45
of which are associated with acquisition of the neoplastic phenotype (reviewed in (91,
262)).
Figure 1.2: The DNA damage checkpoint pathway: The DNA damage checkpoint
pathway is a signal transduction pathway consisting of sensors transducers and effectors
that relay signals such as DNA damage or replication stress to to initiate the indicated
responses.

46
1.2.1 Checkpoint kinases
The activation of a checkpoint pathway depends on the detection of a signal and the
transduction of this signal to intermediate and effector proteins, resulting in various
cellular responses, one of which is cell cycle arrest (reviewed in (405)). Checkpoint
kinases play a critical role in this signal transduction. In response to signals such as
incomplete S phase or DNA damage, these kinases are activated, resulting in
phosphorylation of various effector proteins, which are required to enforce a cell cycle
arrest. Ataxia Telangiectasia Mutated (ATM) and Ataxia Telangiectasia Mutated and
Rad3 related (ATR) are transducing kinases required to propagate the checkpoint
response upon DNA damage or incomplete S-phase. ATM and ATR are serine threonine
kinases and belong to the PI3K family and are activated in response to DNA damage
(334). ATM deficient cells do not arrest at G1, S and G2 phase upon exposure to
ionizing radiation (1). ATR null cells are not viable suggesting that ATR functions are
essential for cell cycle checkpoint function and defects in ATR cannot be complemented
by ATM (405). ATM is activated upon exposure to gamma irradiation by
autophosphorylation of the serine 1981 residue thereby causing dissociation of the dimer
to form an active monomer (15). Activated ATM then phosphorylates its substrates and is
recruited to the sites of DNA damage by BRCA1 and NBS1. After recruitment to DNA
break sites, ATM phosphorylates NBS1 BRCA1 and SMC1 that are localized to these
break sites in response to DNA damage response (178). ATR is predominantly
responsive to replication stress and single strand DNA breaks. ATR is present as a
heterodimer with ATRIP in the presence or absence of DNA damage. ATR-ATRIP
complex localizes to single strand breaks that are produced either on DNA damage or
stalled replication fork and phosphorylates its effector kinases (67, 369, 407). ATM and
ATR phosphorylate Chk1 on Ser 317 and Ser345 resulting in activation of Chk1 (133,
214, 405). ATM and ATR phosphorylate Chk2 on Thr68 resulting in activation of Chk2
(4, 34, 35, 52, 228, 229). CHK1 and CHK2 kinases further activate effector proteins such
as p53, BRCA1, NBS1, H2AX, etc. that execute the various functions of the DNA
damage response (46, 215, 300) as discussed below.

47
1.2.2 The G1/S DNA Damage checkpoint:
The G1/S DNA damage checkpoint monitors damage to DNA in G1 phase and prevent S
phase entry until the damaged DNA is repaired. The G1 arrest is enforced by preventing
initiation of DNA replication and by preventing the transactivation of genes required for
S phase progression through various mechanisms. The checkpoint is activated by
physical (ionizing radiation) or chemical agents (Adriamycin, cisplatin and bleomycin)
that cause DNA double strand breaks.
The G1/S DNA damage checkpoint involves activation of the kinases ATM and ATR.
DNA damage induces phosphorylation and activation of ATM and ATR (15, 356). These
kinases then phosphorylate and activate the downstream kinases Chk1 and Chk2 (4, 34,
35, 52, 133, 214, 228) . Activated Chk1 and Chk2 phosphorylate cdc25A, a dual
specificity phosphatase that is required to activate cyclinE/cdk2 complex (56, 120, 143,
217, 241, 341, 370, 391). Phosphorylation of cdc25A triggers the ubiquitination and
proteasomal degradation of cdc25A, preventing the activation of cyclinE/cdk2 complex
and leading to a G1 arrest (56, 120, 143, 217, 241, 341, 370, 391) (Figure 1.3). In
response to DNA damage, p53 is activated by phosphorylation on Ser 15 residue by
ATM and ATR and on residue S20 by CHK1 and CHK2 (18). Phosphorylation of p53
stabilizes p53 by preventing the interaction between p53 and its negative regulator
Mdm2. DNA damage also induces the expression of the ARF, a negative regulator of
Mdm2 (176). Thus, phosphorylation of p53 and inhibition of Mdm2 by ARF results in
stabilization of p53, allowing the transactivation of p53 responsive cell cycle regulatory
proteins such as p21 (216, 236, 246) (Figure 1.3). p53 activates gene expression of p21
which results in the inhibition of cyclin E/cdk2 and cyclin A/cdk2 complexes, which are
required for S phase progression (18, 172, 376). In response to genotoxic stress, cdc25A
is phosphorylated by the CHK1/CHK2 kinases and targeted for degradation thus
inhibiting the activity of the cyclin E/A cdk2 complex and preventing S phase
progression (17, 18) (Figure 1.3).
48
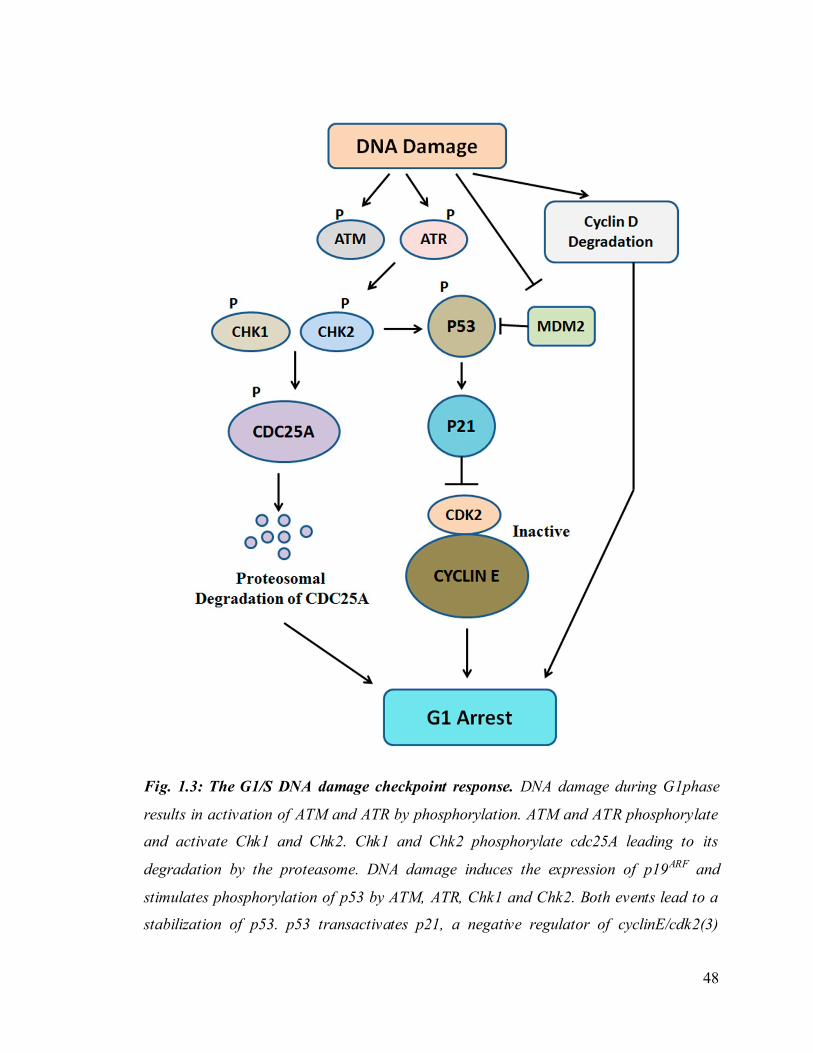
Fig. 1.3: The G1/S DNA damage checkpoint response. DNA damage during G1phase
results in activation of ATM and ATR by phosphorylation. ATM and ATR phosphorylate
and activate Chk1 and Chk2. Chk1 and Chk2 phosphorylate cdc25A leading to its
degradation by the proteasome. DNA damage induces the expression of p19ARF and
stimulates phosphorylation of p53 by ATM, ATR, Chk1 and Chk2. Both events lead to a
stabilization of p53. p53 transactivates p21, a negative regulator of cyclinE/cdk2(3)

49
complexes. DNA damage induced degradation of cyclinD and accumulation of p16
results in inactivation of cyclinD/cdk4(6) complexes. Binding of p16 to cyclinD/cdk4(6)
complexes also displaces p21 from these complexes, which binds and incativtes
cycline/cdk2(3). Inhibition of cyclinD and cyclinE associated CDKs leads to a G1 arrest.
1.2.3 The S phase DNA Damage checkpoint
The replicative phase or S phase is highly prone to errors, due to either the
misincorporation of bases or environmentally induced single strand and double strand
breaks and base modifications (108). The S-phase checkpoint functions in concert with
DNA replication to couple DNA replication with repair. The S phase checkpoint also
prevents the onset of mitosis before DNA replication is completed by inhibiting the
activity of the cyclin B/cdk1 complex (20).
The S phase checkpoint is activated upon replication stress by DNA damaging agents
such as UV and IR or drugs such as adriamycin, bleomycin or alkylating agents such as
methyl methane sulfonate. The S phase checkpoint causes the activation of the
ATM/ATR–CHK1/CHK2 pathway (fig 1.4). During replication if the DNA encounters a
break or lesion the replication fork is stalled (108). The stalled replication fork results in
unwinding of DNA double helix, which in turn is recognized by the single strand binding
Replication Protein A (RPA) (42) (Figure 1.4). RPA then recruits Rad family members,
ATR-ATRIP complex to the lesion site thereby activating ATR (407) (Figure 1.4). ATR
then phosphorylates its downstream kinase, CHK1 and CHK2, which further
phosphorylate cdc25A on S123 and targets cdc25A for ubiquitin mediated degradation
(17, 18) (Figure 1.4). Chk1 and Chk2 also phosphorylate and inhibit the function of
cdc25 phosphatases B and C (56, 120, 143, 217, 228, 241, 281, 318, 341, 370, 391). The
inhibition of cdc25 family of phosphatases prevents dephosphorylation of cdk1 on T14
and Y15, maintaining the cyclinB1/cdk1 complex in an inactive state and preventing
mitotic progression (Figure 1.4). Inhibition of cdc25A also prevents activation
cyclinE/cdk2, cyclinA/cdk2 and cyclinA/cdk1, thus preventing both, progression through
S phase and mitotic progression (Figure 1.4).

50
Fig. 1.4: The incomplete S phase checkpoint response. Stalled replication forks result in
formation of single stranded segments during replication resulting in recruitment of Rad
and Rfc family members. These activate ATM and ATR, which in turn result in activation
of Chk1 and Chk3 by phosphorylation. Chk1 and Chk2 phosphorylate cdc25A, cdc25B
and cdc25C resulting in generation of a 14-3-3 binding site. 14-3-3 binding results in

51
cytoplasmic accumulation of cdc25 phosphatases and also prevents interaction with their
substrates, cyclin/CDK complexes. Phosphorylated cdc25A also undergoes proteolytic
degradation Inhibition of cdc25 phosphatases results in inactivation of cyclinE, cyclinA
and cyclin/B associated CDKs, preventing S phase and mitotic progression.
1.2.4 The G2/M DNA Damage checkpoint:
The G2/M checkpoint prevents entry of the cells into mitosis when cells encounter DNA
damage during the G2 phase or enter the G2 phase with damaged DNA from the previous
phases of the cell cycle. The checkpoint is activated in response to DNA damaging agents
such as UV, IR, adriamycin and methylmethane sulfonates (95). The main target of the
G2/M checkpoint is the cyclinB/cdk1 complex whose activity is required for the entry of
cells into mitosis.
Checkpoint response is triggered by DNA damage which is sensed by sensor proteins,
presumably belonging to the rad family (21, 92, 218, 406-408) (Figure 1.5). The signal is
then communicated to transducers resulting in the activation of kinases ATM and ATR
(Figure 1.5). ATM and ATR phosphorylate and activate the checkpoint kinases Chk1 and
Chk2 (4, 35, 52, 111, 228, 229, 252) (Figure 1.5). Chk1 and Chk2 phosphorylate and
inhibit the function of cdc25 phosphatases A, B and C (56, 120, 143, 217, 228, 241, 281,
318, 341, 370, 391) (Figure. 1.5). The inhibition of cdc25 family of phosphatases
prevents dephosphorylation of cdk1 on threonine 14 and tyrosine 15, maintaining the
cyclinA/cdk1 and cyclinB1/cdk1 complexes in an inactive state and preventing mitotic
progression. Activated Chk1 also phosphorylates Wee1 and promotes its association with
14-3-3 proteins (203, 265) (Figure. 1.5). Phosphorylation and 14-3-3 binding seem to
activate Wee1 which maintains the inhibitory phosphorylations on cdk1(203, 265)
(Figure 1.5). DNA damage checkpoint response also stabilizes Wee1 levels by preventing
its ubiquitin mediated proteolysis (395) (Figure 1.5).
Checkpoint kinases also phosphorylate p53 resulting in stabilization of p53 and
transactivation of p53 responsive genes (54, 116, 151, 232, 332, 404) (Figure.1.5).
Among the genes that p53 transactivates in response to DNA damage are p21 and 14-3-
3σ (149, 216, 236, 246) (Figure 1.5). Both p21 and 14-3-3σ inhibit the activity of
cyclinB1/cdk1 complex (40, 50) (Figure 1.5). p21 belongs to the Cip/Kip family CDK

52
inhibitor that binds to and inhibits the activity of cyclinB1/cdk1 (51, 141, 314, 392)
(Figure 1.5). Binding of 14-3-3σ sequesters cyclinB1/cdk1 complex to the cytoplasm and
prevents the activation of mitotic cascade(50) (Figure 1.5).
Figure. 1.5: The G2/M DNA damage checkpoint response. DNA damage in G2 results
in recruitment of the Rad family of sensor proteins. This results in activation of ATM and
ATR by phosphorylation. ATM and ATR phosphorylate and activate Chk1 and Chk2 and
stabilize p53. Chk1 and Chk2 phosphorylate cdc25A, cdc25B and cdc25C generating a

53
14-3-3 binding site. 14-3-3 binding results in cytoplasmic sequestration of cdc25
phosphatases and inhibits interaction of cdc25 phosphatases with their substrates, the
cyclin/CDK complexes. Chk1 phosphorylate and activate Wee1 which inhibits cdk1 by
phosphorylation on Thr14 and Tyr15. ATM, ATR, Chk1 and Chk2 mediated
phosphorylation of p53 results in stabilization of p53 and transactivation of p53
responsive genes p21 and 14-3-3σ. 14-3-3σ and p21 bind to and inhibit cyclinB1/cdk1.
1.3 The cdc25 family of dual specificity phosphatases
Cdc25 proteins are a family of conserved dual specificity phosphatases that play an
important role in cell cycle regulation by dephosphorylating the T14 and Y15 residues
and activating cdks (86, 112, 192, 237, 321, 344, 345), resulting in the promotion ofcell
cycle progression (113). Cdc25 homologues are conserved from yeast to humans,
suggesting the importance of this phosphatase in cell cycle regulation. In general, cdc25
phosphatases are constitutively expressed during the cell cycle and their levels remain
relatively constant throughout the cell cycle (118), although the levels of some cdc25
family members vary in a cell cycle dependent manner (16, 43, 81). The cdc25 proteins
contain two domains, the N-terminal or regulatory domain and the C-terminal highly
homologous phosphatase domain (251).
Cdc25A levels are low in early G1 and rise during S and G2 phases until degradation of
cdc25A at mitotic exit (81). Cdc25A levels begin to accumulate in late G1 through the
transcriptional activities of c-myc and E2F (81). Cdc25A activity is required for both the
G1/S transition and G2/M transitions (84). During interphase, cdc25A is targeted for
ubiquitin-proteasome mediated proteolysis by the SCF complex upon activation of the S-
phase or DNA damage checkpoints (81). Cdc25A promotes the G1/S transition by
activating cyclin D associated cdk4/cdk6 complexes (162) and cyclin E and cyclin A
associated cdk2 complexes (28, 155). Cdc25A also maintains the cyclinE/cdk2 and
cyclinA/cdk2 complexes in an active state by preventing the binding of the CDK
inhibitor p21 to these complexes (308). During mitosis cdc25A is stabilized by
phosphorylation on Ser17 and Ser115 residues by cyclinB1/cdk1 complex. The stabilized
cdc25A removes the inhibitory phosphorylation on cdk1 complex and activates
cyclinB1/cdk1complex (217).
54
Cdc25B promotes progression through S phase and mitosis by activating the
cyclinA/cdk2, cyclinA/cdk1 and cyclinB/cdk1 complexes (101, 156). Cdc25B levels
accumulate in late S and early G2 after which it is targeted for degradation. Cdc25B is
phosphorylated by the cyclinA/cdk2 complex resulting in proteolytic degradation of
cdc25B by SCF β-TrCP complex (16, 43). Expression of dominant negative cdc25B
prevents the initial activation of cyclinB1/cdk1 complex (102).
Cdc25A is nuclear in its localization, cdc25B shuttles in and out of the nucleus and
cdc25C is cytoplasmic throughout interphase and localizes to the nucleus just prior to
mitosis (69, 73). Thus multiple cdc25 proteins are regulated in a spatio temporal manner
to coordinate irreversible cell cycle progression events. Since cdc25 phosphatases are
crucial in promoting cell cycle progression, the activities of the cdc25 phosphatases are
monitored by checkpoint pathways. In response to DNA damage or replication stress the
cdc25 proteins are inactivated by the checkpoint pathway. Cdc25 proteins are targets of
the checkpoint kinases CHK1 and CHK2. CHK1and CHK2 phosphorylate cdc25A on
multiple sites leading to its rapid degradation in the presence of unreplicated or damaged
DNA (80). Cdc25B is phosphorylated by the MAPKAP kinase-2 (221) and CHK1 on
exposure to U.V radiation and in unperturbed cells and this generates a binding site for
the 14-3-3 family of proteins. Binding of 14-3-3 to cdc25B restricts cdc25B to the
cyctoplasm and hence is unable to activate cdk1 (117, 318).
Cdc25C promotes mitotic progression by activating the cyclinB/cdk1 complex (103,
112). The activity of human cdc25C is positively and negatively regulated by
phosphorylation events. During interphase the major site of phosphorylation in cdc25C is
a serine residue at position 216 (S216) and this residue is not phosphorylated in mitotic
cells (269, 280). Cdc25C activity is negatively regulated by the both the S-phase and G2
DNA damage checkpoint pathways. Ogg et al demonstrated that C-TAK1 can
phosphorylate cdc25C on S216 in interphase cells (ref). During incomplete replication or
in the presence of damaged DNA, activated CHK1 and CHK2 were observed to
phosphorylate cdc25C on a serine residue at position S216 (S216). cdc25C is
constitutively phosphorylated on S216 throughout interphase but not in mitotic cells
suggesting that phosphorylation of S216 negatively regulates cdc25C function (268, 279).
A phosphosite mutant of cdc25C (S216A) was able to override a DNA damage induced

55
G2 arrest and induced premature chromatin condensation (PCC) during S-phase at levels
higher than the wild type protein (69, 279).
Figure 1.6: Regulation of cdc25C by the checkpoint pathway: DNA damage or
incomplete S-phase leads to phosphorylation of cdc25C on S216 by CHK1/CHK2/C-
TAK1/MK2. This generates a binding site for 14-3-3 proteins binding of 14-3-3 to

56
cdc25C negatively regulate cdc25C function. Cdc25C is activated by dissociation of 14-
3-3 which is accompanied by dephosphorylation on S216 residue and phosphorylation by
cyclinB1/cdk1 complex on multiple sites. Activated cdc25C dephosphorylates inhibitory
residues on cyclinB/cdk1 leading to a positive feedback loop.
Phosphorylation of serine 216 generates a binding site for the 14-3-3 family of proteins in
cdc25C (194, 279). Binding of 14-3-3 proteins to cdc25C decreases the catalytic activity
of cdc25C (194, 279), but since 14-3-3 proteins bind adjacent to the putative NLS in
cdc25C it was suggested that 14-3-3 proteins might regulate the subcellular localization
of cdc25C (191). Consistent with this hypothesis a mutant of cdc25C that was unable to
bind to 14-3-3, proteins (S216A), showed a pan cellular localization as compared to the
wild type protein (69). These results suggest that 14-3-3 proteins negatively regulate
cdc25C function by preventing its transport to the nucleus prior to mitosis (Figure 1.6).
Some data suggests that the 14-3-3 proteins inhibit cdc25C function either by masking
the nuclear localization signal (245) and by promoting its nuclear export as both the
nuclear export signal (NES) and the 14-3-3 binding site are required to maintain the
cytoplasmic localization of cdc25C (126). 14-3-3 proteins also inhibit the association
between cdc25C and cyclinB1 thereby preventing the activation of the cyclinB/cdk
complex (244). The binding of 14-3-3 proteins to cdc25C leading to the negative
regulation of cdc25C function has been conserved from yeasts to human. In fission yeast
CDS1 (CHK2 homologue) and CHK1 phosphorylate cdc25 and generate a binding site
for the 14-3-3 proteins, rad24 and rad25 (402). Binding of cdc25 to the 14-3-3 proteins in
fission yeast and X. laevis results in nuclear exclusion similar to that observed in human
cells (69, 191, 194). The inhibitory phosphorylation on S216 of cdc25C was not limited
to the DNA damage responsive checkpoint pathway. In addition to the checkpoint
kinases there are reports of other kinase C-TAK1and PKA that phosphorylate cdc25C on
S216 (S287 in X. laevis cdc25C) in unperturbed cells maintaining the inactive state of
cdc25C throughout interphase (52, 280, 311).
Just prior to mitosis, cdc25C translocates to the nucleus to activate the cyclin B/cdk
complex (69). This is dependent on the removal of the 14-3-3 proteins and
dephosphorylation of the 14-3-3 binding site followed by hyperphosphorylation on
multiple sites in its N terminus (193). Cdk2 activity was found to be necessary for the

57
removal of S216 phosphorylation as inhibition of cdk2 by the cdk2 inhibitor CIP blocked
cell cycle progression to mitosis (222). In Xenopus, phosphorylation on T138 residue of
cdc25C by cdk2 was required for 14-3-3 removal and subsequent S287
dephosphorylation. A T138V mutant retained phosphorylation on S287 residue and
exhibited prolonged 14-3-3 binding (222). The removal of 14-3-3 proteins from cdc25C
is followed by the dephosphorylation of S287 by PP1 and hyperphosphorylation on
multiple sites in the N-terminus. During mitosis, the active state of cdc25C is maintained
by phosphorylation on a residue at S214 position by cyclin B1/cdk1 complex (39). This
residue lies in close proximity to the S216 residue and phosphorylation of S214 by cdk1
blocks subsequent phosphorylation of S216 residue. A S214A mutant when expressed in
HeLa cells depleted of cdc25C displayed a delay in mitotic entry that was reversed by the
S214A/S216A double mutant (39). Also IR induced DNA damage failed to induce S216
phosphorylation and 14-3-3 binding in mitotic cells. These results suggest that in mitotic
cells phosphorylated S214 residue prevents the phosphorylation of S216 residue and
inactivation of cdc25C (39).
During mitosis phosphorylation of multiple residues in the N-terminus of cdc25C by the
cyclinB1/cdk1 complex results in a stimulation of cdc25C phosphatase activity (101, 104,
154, 344). The increased phosphorylation co-relates with mitotic entry (193).
Dephosphorylation of the N-terminal residues reduces cdc25 phosphatase activity (193).
Cdc25 is also phosphorylated on these N-terminal residues by polo- like kinases (89, 90,
294). However, activation of cdc25 by polo like kinases is required for mitotic
progression in Xenopus laevis (294) , yeast or mammalian cells (371, 372). It has been
demonstrated that the Plk1 is critical for mitotic progression of cancer cells, and that in
non-transformed cells knockdown of Plk1 resulted in at least a 4 hour delay of mitosis
(207, 371). During mitosis cdc25C activity is required to maintain the cyclinB1/cdk1
complex in an active state. It has been reported that this is achieved by preventing the
association of cdc25C with 14-3-3 proteins through inhibition of S216 phosphorylation
(69, 191, 194). During mitosis cdc25C is not phosphorylated on S216 and is localized to
the nucleus (69). In X. laevis, it has been demonstrated that binding of 14-3-3 to cdc25
during mitosis is prevented by dephosphorylation of Serine reisude 287 (S287), the
residue that corresponds to S216 in human cdc25C (191, 194). Dephosphorylation of
58
S287 in X. laevis cdc25C is catalyzed by a phosphatase PP1 and this dephosphorylation
occur just prior to mitosis (223, 224). In human cells, a mechanism for the inhibition of
phosphorylation of cdc25C on serine 216 and 14-3-3 binding during mitosis has been
demonstrated. However, inhibition of S216 phosphorylation requires the phosphorylation
of an adjacent serine residue (S214) in cdc25C by cyclinB1/cdk1 complex (39).
Expression of the S214A mutant in cells depleted of endogenous cdc25C induced delay
in mitotic entry, which could be rescued by re-expression of S214A/S216A double
mutant (39). Thus S214 phosphorylation may help maintain cdc25C in an active state till
mitosis is complete (39).
Cdc25C knockout mice are viable and do not display any obvious abnormalities (55).
Among adult tissues in which cdc25C is detected, its transcripts are most abundant in
testis, followed by thymus, ovary, spleen, and intestine. Mice lacking cdc25C were
fertile, indicating that cdc25C does not contribute an essential function during
spermatogenesis or oogenesis in the mouse. T- and B-cell development was also found to
be normal in cdc25C-/- mice, and cdc25C-/- mouse splenic T and B cells exhibited
normal proliferative responses in vitro (55). These findings indicate that cdc25A and/or
cdc25B may compensate for loss of cdc25C in the mouse (55). Mice with cdc25B
disrupted are also viable and healthy, although females are sterile due to a meiotic defect
during oogenesis (211). One explanation for the lack of a cell cycle phenotype in mice
with either cdc25B or cdc25C disrupted is compensation by the other family members
and/or other phosphatases. However transgenic mice lacking both cdc25B and cdc25C
phosphatases are healthy and viable, demonstrating that cdc25B and cdc25C are
dispensable for murine embryonic development and for mitotic entry (94). Mice
heterozygous for cdc25A were viable, fertile, and healthy, demonstrating that a single
allele of cdc25A is sufficient for normal mouse development (202). In contrast, mice
homozygous for the mutation were never identified, indicating that the cdc25A null
mutants died in utero (202). Cdc25A-deficient embryos exhibit growth retardation and
die before E7.5 due to the induction of apoptosis. Conditional disruption of the entire
family is lethal in adults due to a loss of small intestinal epithelial cell proliferation in
crypts of Lieberkuhn (202). However conditional disruption of cdc25A in adults did not
show the same phenotype, thereby suggesting that although cdc25A is essential during
59
embryogenesis, a loss of cdc25A can be compensated for by other family members in
adult mice (202).
1.4 14-3-3 proteins.
14-3-3 proteins were first purified as abundant proteins in brain tissue extracts and
derived their name from their migration pattern on DEAE cellulose chromatography and
starch gel electrophoresis (reviewed in (5, 6, 107)). 14-3-3 proteins are conserved from
yeast to mammals. Yeast 14-3-3 proteins are functionally interchangeable with the
mammalian 14-3-3 proteins indicating their high level of conservation (99). A sequence
alignment of the various 14-3-3 isoforms across species reveals high sequence
conservation across evolution. There are two isoforms in yeast and at least seven different
isoforms of 14-3-3 proteins in mammals (β, ε, γ, σ, ξ, η and τ) that are encoded by seven
distinct genes (reviewed in (107) ). 14-3-3 proteins are abundantly present in all tissues
except 14-3-3σ whose expression is restricted to epithelial cells. 14-3-3 proteins have
been observed to be localized to the cytoplasm as well as nucleus (191, 225) (362).
14-3-3 proteins are able to bind to partner proteins containing either of two
phosphoserine motifs i.e. R[S/Ar][+/S]pS[LEAM]P or RX[Ar/S][+]PS[LEAM]P (where
Ar is an amino acid with an aromatic side chain, + an amino acid with a basic side chain
and pS is phosphoserine) (250, 394). The 14-3-3 ligands share the same phosphopeptide
binding groove and bind with similar affinity as compared to the phosphopeptide (99).
Ligands such as cdc25B bind to 14-3-3 via a phosphorylated motif (13, 117) whereas
some ligands such as Exoenzyme S (Exo S) bind to 14-3-3 through a nonphosphorylated
motif (136, 148). 14-3-3 proteins regulate the activities of a number of important
signaling proteins (82, 366). The binding of 14-3-3 proteins to their targets often leads to
an altered sub cellular localisation of partner proteins, for instance the binding of 14-3-3
to cdc25C sequesters cdc25C in the cytoplasm (69). Alteration in enzymatic activities
such as 14-3-3 binding to Raf increases its kinase activity. Alteration of DNA binding
capability such as binding of 14-3-3 to p53 increases its DNA binding activity upon DNA
damage (381). Thus, 14-3-3 proteins regulate multiple signalling pathways in mammalian
cells.

60
1.4.114-3-3 structure
X-ray crystallographic analyses of the various 14-3-3 dimers bound to a phosphopeptide
corresponding to a consensus motif, reveal that all 14-3-3 proteins have the same basic
tertiary structure (396). The structure reveals that the 14-3-3 proteins bind to their ligands
as homodimers or heterodimers. The 14-3-3 dimer forms a U-shaped molecule, the base
of which constitutes a highly conserved phosphopeptide binding groove. Each monomer
of the 14-3-3 dimer consists of nine antiparallel helices designated 1to 9. The N
terminal helices which constitute helices α1to α4, mediate dimer formation between the
monomers and contain residues that are variable and may specify the homo or hetero
dimerization. Helices 3,5,7 and 9 form the phosphopeptide binding groove. The
phosphorylated serine/threonine residue in the ligand makes contact with certain
conserved residues, Lys 49, Arg56, Arg127and Tyr 128 that form a basic pocket in the
phosphopeptide binding groove, whereas the rest of the ligand is in contact with the
carboxy terminal portion of the 14-3-3 protein. The invariant residues in the 14-3-3
proteins line the interior of this phosphopeptide binding groove, whereas non conserved
resides are located on the exterior of the cup shaped structure (213, 390). The structure of
the phosphopeptide binding groove and the location of the phosphopeptide in this groove
is conserved in all 14-3-3 isoforms, with the exception of 14-3-3σ (383). This suggested
that specificity of 14-3-3 ligand interactions emanates from residues that lie outside the
conserved phosphopeptide binding groove and may possibly be involved in formation of
contacts with the ligand as a whole.
14-3-3 proteins are 30 kDa proteins that function as dimers. By the construction of N
terminal deletion mutants of the 14-3-3 isoform it was observed that the N terminal 26
amino acids were important for dimerisation (167). This is consistent with the X-ray
crystallography data described above. 14-3-3 isoforms exist as homodimers as well as
heterodimers. Though each 14-3-3 monomer can bind independently to the ligand
containing a phosphopeptide, dimerization of the 14-3-3 proteins are required for their
interaction with the ligand (38). In addition to complex formation with the ligand,
dimerization of the 14-3-3 proteins might be required to modulate ligand function as 14-
3-3 monomers with an N terminal deletion that were unable to form dimers bound to Raf
but were incapable of activating it in vivo (327). It was later demonstrated that the 14-3-3

61
dimer was essential for Raf activation due to the stable binding of 14-3-3 to the Raf
polypeptide at two sites (367). 14-3-3 proteins form particular combinations of
homodimers and heterodimers. For instance, 14-3-3γ forms homodimers and
heterodimerizes with 14-3-3ε while 14-3-3ε dimerises with β, γ, ξ and η but does not
form homodimers (53, 396). 14-3-3σ is reported to form only homodimers (383). The
differential ability of the 14-3-3 isoforms to dimerise is dictated by the unique residues
present at the dimer interface (396). The differential ability of 14-3-3 proteins to form
homo or hetero dimers might influence the function of the 14-3-3 proteins. Homodimers
might function to sequester proteins while heterodimers might function as adapter
proteins bringing into proximity two molecules that otherwise would not directly interact
with one another resulting in the generation of large signaling complexes. Thus,
dimerization of 14-3-3 proteins may regulate their ligand binding properties and may
contribute to regulation of various cellular pathways by 14-3-3 isoforms.
1.4.2 14-3-3 and cell cycle regulation:
14-3-3 proteins play crucial roles in cell cycle regulation and checkpoint function. The
14-3-3 homologs of S. pombe rad24 and rad25 are important mediators of the DNA
damage checkpoint pathway. rad24 null cells have been shown to be sensitive to IR and
U.V radiation due to the premature entry of cells into mitosis following DNA damage
(96, 377). 14-3-3 proteins associate with cdc25A, cdc25B and cdc25C during interphsae
and upon activation of the DNA damage and replication checkpoint pathways (56, 311).
Binding of 14-3-3 proteins to cdc25B and cdc25C results in cytoplasmic sequestration
and inhibition of the cdc25 proteins (65, 73, 97, 212, 239). The presence of multiple 14-
3-3 isoforms implied that either the proteins are redundant in their function or a specific
14-3-3 protein would modulate cdc25C function. Therefore the ability of these isoforms
to regulate cdc25C function was tested. Five isoforms ε, β, γ, σ and ξ were tested for their
ability to form a complex with cdc25C in vitro and in vivo by Dalal et.al (71). It was
observed that all the five 14-3-3 isoforms tested could form a complex with cdc25C in
vitro. However only 14-3-3ε and 14-3-3γ were able to form a complex with cdc25C in
vivo (71). To determine whether binding of 14-3-3 protein to cdc25C was necessary to
regulate cdc25C function, the ability of the 14-3-3 isoforms to affect cdc25C function
was also tested. Cdc25C on overexpression leads to premature entry into mitosis and the

62
cells undergoing premature mitosis show premature chromatin condensation (PCC) (69).
The functional ability of the 14-3-3 isoforms to regulate cdc25C function was tested by
determining the ability of the 14-3-3 isoforms to inhibit PCC caused by cdc25C
overexpression. It was observed that only the two 14-3-3 isoforms that were able to form
a complex with cdc25C in vivo, 14-3-3ε and 14-3-3γ could inhibit cdc25C function. 14-
3-3ε and 14-3-3γ however could not inhibit PCC caused by the 14-3-3 non binding
cdc25C mutant, S216A indicating that binding of 14-3-3 to cdc25C via the phosphomotif
was essential in the regulation of cdc25C function (69, 279).
The binding of 14-3-3 proteins to their ligands occurs via two interactions (393). The first
is the primary interaction that involves the interaction of the phosphoserine of the ligand
with the residues in the phosphopeptide binding groove. After the primary interaction, the
14-3-3 undergoes conformational changes that specify secondary contacts with other
domains in the ligand (396). This secondary interaction is known to impart ligand
specificity to the 14-3-3 protein. 14-3-3ɛ and 14-3-3γ have the F/V pocket that maybe
required for specific complex formation with cdc25C in vivo. 14-3-3 isoforms (β, η, τ, σ
and ζ) that do not form a comp lex with cdc25C do not form this pocket, either because
they do not have a Phenylalanine residue at the position corresponding to 135 in 14-3-3ɛ
or because they lack the E94-K142 salt bridge present in 14-3-3γ (354). Thus, it seems
that the F/V pocket contributes to the specificity of complex formation of 14-3-3ɛ and 14-
3-3γ with cdc25C in vivo (354). Further, mutation of this residue to the corresponding
residue present in other 14-3-3 isoforms (F135V) leads to reduced binding to cdc25C and
a decrease in the ability to inhibit cdc25C function in vivo. Similarly, F135V failed to
rescue the incomplete S phase and the G2 DNA damage checkpoint defects observed in
cells lacking 14-3-3ε (354). These results suggest that the specificity of the 14-3-3 ligand
interaction may be dependent on structural motifs present in the individual 14-3-3
isoforms (354). Similarly, a decrease in the expression of 14-3-3γ in HCT116 cells
resulted in an override of both the incomplete S phase and the G2 DNA damage
checkpoint due to failure to inhibit cdc25C function (157).
1.4.3. 14-3-3 knockout mice
Several 14-3-3 genes have been knocked out in mice resulting in a variety of phenotypes.
E.g. Gene-targeted disruption of 14-3-3σ in mice impairs B-cell homeostasis as a result
63
of enhanced apoptosis of peripheral B cells (347). Loss of 14-3-3σ led to abnormal BCR
signaling that damaged the TI immune response, inhibition of early antigenspecific IgM
secretion, increased degradation of FOXO1 protein and elevated FOXOs transcriptional
activity (347). Thus, 14-3-3σ is essential for B-cell homeostasis because it maintains
steady-state FOXO1 protein and modulates FOXO-mediated apoptosis (347). Knockout
mice have also been generated for 14-3-3ε and 14-3-3γ. Toyo-oka et al have found that
mice with homozygous deletion of 14-3-3 died at birth and the heterozygous mice
shows defect in neuronal migration and cortical thining by altering the function of the
LIS1 complex (363). Specifically, they found that 14-3-3 interacts with NUDEL, a
known binding partner of LIS1 and that the interaction with 14-3-3 protects Cdk5-
phosphorylated NUDEL from dephosphorylation. Maintaining the phosphorylation status
of NUDEL is crucial for the correct localization and function of the LIS1-NUDEL
complex resulting in neuronal migration. 14-3-3 also binds to NUDEL as demonstrated
by yeast two hybrid assay (363), however targeted disruption of 14-3-3 in mice did not
show defects in neuronal migration or cortical thinning and moreover the knockout mice
were not lethal (342). These results suggest that loss of 14-3-3 genes in the animal may
not necessarily reflect what happens in cells in culture. This might be due to
compensation by other 14-3-3 isoforms and therefore, studying hypomorphic alleles for
the different isoforms might lead to novel insights into their role in growth and
development.
1.5 Generation of transgenic mouse models.
The first gene transfer into mouse using isolated DNA revealed that the generation of
animals stably harboring foreign DNA (121) and having modified phenotypic properties
(33, 275) was possible. These experiments also revealed some of the limitations of
transgenesis: the generation of transgenic animals by gene microinjection was laborious;
the first transgene unexpectedly remained very poorly active or inactive; the growth
hormone gene induced an overgrowing of the transgenic mice with numerous
physiological side-effects (32). These observations revealed that the reintegration of an
isolated gene into the genome of an animal may generate complex and unpredictable
biological situations. Direct gene injections were extended to three others mammals (137)

64
and later to several lower vertebrates and invertebrates. Gene replacement by
homologous recombination was achieved in 1989 (44). Since then the generation of
transgenic animal models is one of the major tools used by biologists to study gene
expression and function. The study of human diseases is greatly facilitated by the
generation of transgenic animals mimicking health disorders (153, 161, 306). Transgenic
pigs are expected to be the source of organs and cells for transplantation to humans (68).
Recombinant proteins of pharmaceuticals interest are being prepared in the milk of
transgenic animals (158-160). Despite this impressive and growing success, transgenesis
still suffers from many imperfections.
Direct DNA microinjection into the pronuclei of embryos was the first technique which
led to regular and relatively easy success in mammals. Essentially the same protocol is
followed in mouse, rat, rabbit, pig, sheep, goat and cow, however with a decreasing yield
of transgenic animals from mouse to cow. The number of embryos generated by
superovulation is low and the success of microinjection appeared accessible only if
embryos were prepared in vitro after oocyte maturation and fertilization followed by in
vitro development of the microinjected to the blastocyst stage (188). This method
remains laborious and costly. In lower vertebrates and invertebrates, pronuclei are not
visible and the microinjection must therefore be performed in cytoplasm, using much
larger amounts of DNA. For unknown reasons, the success of this approach is quite
variable from one species to another.
Another approach to generate transgenic animals consists of introducing foreign DNA in
gametes before fertilization. The incubation of spermatozoa in the presence of DNA
followed by in vivo or in vitro fertilization led to the generation of transgenic mice, fish,
chicken, rabbits, pigs, sheep and cows (14). The gene transfer by spermatozoa was
achieved successfully in mice but required the use of conditions where the sperm
membrane was altered by incubation with detergent or by freezing and thawing to allow
foreign DNA to penetrate into the cell (282). The mechanism of gene transfer into
epididymal spermatozoa by injection of a DNA-transfectant complex into testis resulted
in the generation of a limited number of transgenic animals (312).
Spermatogonial stem cells are responsible for the production of spermatozoa (74) and are
an appropriate target for germline modification (254). Recently, a report has described
65
the generation of transgenic mice after electroporation of DNA into the testes of an adult
mouse, 16 of 17 fore founder mice generated in that study were able to sire transgenic
pups (78). Nagano et. al. have generated transgenic mice by infecting spermatogonial
stem cells in vitro with recombinant retroviruses followed by xenogenic transplantation
of the cells into the testes of a male mouse (253). In some cases the recipient mice were
unreceptive to the donor spermatogonial cells (253) and the overall success rate was
rather low. Similarly, in vivo transduction of testicular germ cells with retroviral
constructs carrying a lacZ gene, resulted in a poor success rate of 2.8% (169). The low
success rates post implantation, however precluded these from replacing embryonic
injection. Similar experiments using lentiviruses resulted in better success rates (138).
Other methods employed in the recent past have infected fertilized eggs in vitro with
recombinant lentiviruses, followed by implantation of the embryo into pseudopregnant
females (284). While these methods provided better success rates, the implantation
experiments are technically cumbersome and require several female donors. A recent
report has also described the generation of recombinant spermatozoa in organotypic
cultures that could be used to generate transgenic mice (313). While this method
generated transgenic animals at high efficiency, generating organotypic cultures is not
trivial and is not performed in most laboratories. Another experiments showed that
retroviral vectors introduced between the zona pellucida and the plasma membrane of the
oocytes can be implemented to generate transgenic cows (48) and monkeys (47). This
success was met with viral particles containing the VSV-G envelope, which is known to
recognize membrane phospholipids of all cell types.
An enormous hurdle to understanding the contributions of multiple genes to the
generation of a given phenotype in mammalian cells has been the difficulty of doing
somatic cell genetics in higher eukaryotes. The advent of technologies that exploit
cellular RNA interference (RNAi) mechanisms has resulted in an explosion of genetic
screens that have resulted in the identification of novel genes involved in cell growth and
development (reviewed in (140, 233, 340)). The use of vector driven production of
shRNA’s to induce a knockdown of gene expression, thus generating a hypomorphic
allele,has permitted the stable knockdown of gene products in mammalian cells in culture
permitting the development of long term assays to examine pathways involved in cell
66
growth and development (37, 272). Recently, shRNA's have been used to induce
knockdowns in both embryonic and adult stem cells. In addition, this approach has been
used for the generation of mice that have lost gene expression and are phenotypically
similar to conventional knockout mice (195, 323, 351, 373). Similar to conventional
knockout technology, shRNA mediated knockdowns can be inducible and tissue specific
permitting the analysis of genes whose loss may lead to embryonic lethality (373). The
generation of lentiviral mediated knockdown mice to study pathways involved in the
regulation of cell division and cell cycle checkpoint control will address the role of 14-3-
3ε and 14-3-3γ in cell growth, development and tumorigenesis.

67
CHAPTER 2
AIMS AND OBJECTIVES

68
2. Aims and Objectives.
1. To determine if loss of 14-3-3 and/or 14-3-3 in MESC results in mislocalization of
cdc25C.
2. To generate novel constitutive and inducible lentiviral vectors for transgene expression
or the generation of knockdown mice.
3. To develop a new technique for the generation of transgenic animals.
4. To study the role of 14-3-3 and 14-3-3 in growth and development by generating
knockdown mice.

69
CHAPTER 3
MATERIALS AND METHODS

70
3. Materials and Methods. 3.1 Generation of lentiviral vectors for the expression of shRNA’s.
The pLKO.1 puro lentiviral vector (343) was modified to remove the Cla1 site in the
stuffer downstream of the U6 promoter (1.9Kb). A 1 kb fragment containing a Multiple
Cloning Site (MCS) was excised from pDesRedN1 with BshTI and EcoRI and cloned
into pLKO.1 digested with the same enzymes to generate the pS18 lentiviral vector. The
pLKO.1 vector was also modified to remove the stuffer and introduce a MCS for cloning
shRNA casettes into pLKO.1 to generate pLKO.1 MCS.
3.2 Generation of lentiviral vectors expressing shRNA and EGFP-f.
The EGFP-f (Farnesylated EGFP) expression cassette was assembled in pBSK(-)
(Stratagene). The sequences of all the oligonucleotides used for gene amplification are
shown in Table 3.1. The EF1α promoter was amplified from pEF6MycHisA (Invitrogen)
and cloned in pBSK digested with HindIII and EcoRI (NEB). Subsequently, the EGFP-f
gene was amplified and cloned downstream of the EF1α promoter as an EcoRI and
BamHI fragment. The resulting vector was digested with BamHI and NotI and the SV-40
poly A signal, amplified from pEF6MycHisA, was inserted into the above vector using
these restriction sites. A restriction site for BsuI5I (Fermentas) was introduced upstream
of the NotI restriction site. The resultant vector is called pBSK –F2. The expression
cassette generated contained BshTI and EcoRI sites that were required for cloning the
shRNA oligonucleotides into pLKO.1 puro. To overcome this hurdle the BshTI and
EcoRI sites were blunted using Klenow (NEB) and the fragment self- ligated resulting in
the loss of both the BshTI and EcoRIrestriction sites . The resultant EGFP-f expression
cassette was excised from pBSK (-) vector with BsuI5I and cloned in pLKO.1 MCS to
generate pLKO.1 EGFP-f Puro.
3.3 Generation of lentiviral vectors for cDNA expression.
The EGFP-f expression cassette was assembled in pBSK(-) (Stratagene) to generate
pBSK – F2 as described earlier . To generate the vector for gene expression studies the
EGFP-f gene in pBSK-F2 was replaced with a MCS containing eleven unique sites to
generate pBSK-FM3 (Table 3.2). The resultant expression cassette containing a MCS
downstream of the EF1α promoter was excised from pBSK – FM3 vector with BsuI5I
and cloned in pLKO.1 puro to generate the pEF.55 vector.

71
Name of oligonucleotide Sequence
EF1α Forward AAGCTTGGAATTGGCTCCGGTGCCCGTC
EF1α Reverse GAATTCCCTCACGACACCTGAAATGG
EGFP-f Forward GAATTCCACCATGGTGAGCAAG
EGFP-f Reverse GGATCCCCTCAGGAGAGCACACACTT
PolyA Forward GGATCCCCATACCACATTTGTAGAGG
PolyA Reverse GCGGCCGCATCGATACATTGATGAGTTTGGACAAACCAC
Table 3.1: List of oligonucleotides used for PCR reactions.
3.4 Generation of Bi-cistronic lentiviral vectors.
The pTRIPZ (Open Biosystems) lentiviral vector was digested with XbaI and NheI
(NEB) to remove tetO-CMV, turboRFP, 5’-3’mir30 sequences, shRNA cloning sites and
Ubc promoter sequences. The CMV promoter was amplified from pCDNA3.0
(Invitrogen), digested with XbaI and NheI (NEB) and cloned into the modified pTRIPZ
vector to generate pLV-CMV-Puro. The MCS fluorescent tag cassettes were excised
from the vectors pECFPN1, pEYFPN1, pEGFPN1, pmCherryN1 and pDsRedN1
(Clontech) with NheI and NotI and cloned into pLV-CMV-Puro digested with NheI and
NotI to generate pLV-CMV-FP-IRES-Puro.
3.5 Generation of pLV-CMV-K18-YFP and pLV-Ubc-K8-CFP constructs.
The K18-YFP cDNA was excised from the pEYFPN1-K18 construct and cloned into the
pLV-CMV-YFP vector using the enzymes EcoRI and NotI. The K8 cDNA was excised
from the pECFPN1-K8 construct and cloned into the pLV-Ubc-CFP vector using the
enzymes EcoRI and BamHI.
3.6 Design of shRNA oligonucleotides .
Oligonucleotide sequences encoding short hairpin RNAs (shRNAs) targeting mouse 14-
3-3 and 14-3-3 were designed as per the guidelines outlined by Dykxhoorn et. al. (87).
18-21 bases long nucleotide sequences from the coding sequence of 14-3-3 and 14-3-3
were identified according to these guidelines as follows. 18-21 nucleotide sequences from
the open reading frame of 14-3-3 and 14-3-3, starting with GG were selected from the

72
open reading frame of 14-3-3 and 14-3-3, to facilitate cloning of the shRNA
oligonucleotides downstream of the U6 promoter. The specificity of these sequences was
determined by performing an online BLAST search of the human DNA sequence
database (NCBI). Only sequences that that matched the targeted 14-3-3 isoform but not
the other 14-3-3 family members were used for to design the shRNA cassettes. Using this
strategy, three sequences targeting 14-3-3 and three sequences targeting 14-3-3 were
selected and used to generate shRNA oligonucleotides.
Once the target sequence (sense) was identified, a reverse complement of the target
sequence (antisense) was made using the software Editseq (DNASTAR). The first strand
of each single stranded shRNA oligonucleotide sequence (strand ‘A’) was designed as
follows. The sense and the antisense strand were separated by a 9-bp spacer sequence,
AAGTTCTC (36). To the 3’ end of this single stranded shRNA oligonucleotide was
added a stretch of 6 ‘T’s and one ‘C’ to facilitate efficient termination of transcription. To
generate strand ‘B’, a reverse complement of the whole single stranded sequence was
made, excluding the first two ‘G’s present at the 5’ end of the sense strand. At the 5’ end
of the strand ‘A’, an AgeI overhang was incorporated and at the 5’ end of the sequence
‘B’, an EcoRI overhang was incorporated to facilitate cloning into the pLKO.1 EGFP-f
vector.
3.7 Cloning of shRNA oligonucleotides into pLKO.1 puro and pLKO.1 EGFP-f.
Single stranded shRNA oligonucleotides were designed against mouse 14-3-3ε, 14-3-3γ
and human KIF5B as described above and obtained from a commercial supplier
(SigmaTable 3.2). The shRNA oligonucleotide pairs were annealed and then their 5’ ends
phosphorylated by using T4 polynucleotide kinase (Fermentas). Following
phosphorylation, the oligonucleotide sequences were ligated to AgeI-EcoRI digested
pLKO.1 puro and pLKO.1 –EGFP-F plasmids, downstream of the U6 promoter (338).
3.8 Design of shRNA miR oligonucleotides .
Oligonucleotide sequences encoding short hairpin RNAs (shRNAs) targeting mouse 14-
3-3 were designed as discussed above. The sense and the antisense strand were
separated by a 19-bp spacer sequence, TAGTGAAGCCACAGATGTA. This
oligonucleotide sequence was further converted to shRNAmiR by introducing the Drosha
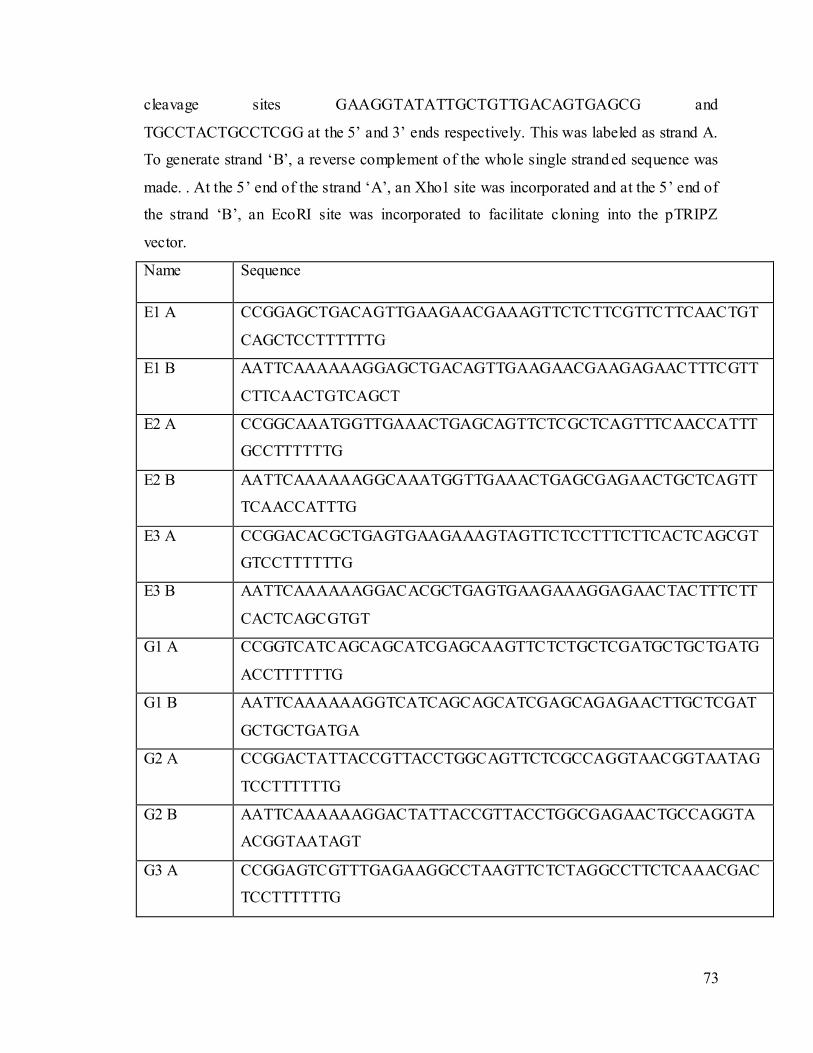
73
cleavage sites GAAGGTATATTGCTGTTGACAGTGAGCG and
TGCCTACTGCCTCGG at the 5’ and 3’ ends respectively. This was labeled as strand A.
To generate strand ‘B’, a reverse complement of the whole single strand ed sequence was
made. . At the 5’ end of the strand ‘A’, an Xho1 site was incorporated and at the 5’ end of
the strand ‘B’, an EcoRI site was incorporated to facilitate cloning into the pTRIPZ
vector.
Name Sequence
E1 A CCGGAGCTGACAGTTGAAGAACGAAAGTTCTCTTCGTTCTTCAACTGT
CAGCTCCTTTTTTG
E1 B AATTCAAAAAAGGAGCTGACAGTTGAAGAACGAAGAGAACTTTCGTT
CTTCAACTGTCAGCT
E2 A
CCGGCAAATGGTTGAAACTGAGCAGTTCTCGCTCAGTTTCAACCATTT
GCCTTTTTTG
E2 B AATTCAAAAAAGGCAAATGGTTGAAACTGAGCGAGAACTGCTCAGTT
TCAACCATTTG
E3 A CCGGACACGCTGAGTGAAGAAAGTAGTTCTCCTTTCTTCACTCAGCGT
GTCCTTTTTTG
E3 B AATTCAAAAAAGGACACGCTGAGTGAAGAAAGGAGAACTACTTTCTT
CACTCAGCGTGT
G1 A CCGGTCATCAGCAGCATCGAGCAAGTTCTCTGCTCGATGCTGCTGATG
ACCTTTTTTG
G1 B AATTCAAAAAAGGTCATCAGCAGCATCGAGCAGAGAACTTGCTCGAT
GCTGCTGATGA
G2 A CCGGACTATTACCGTTACCTGGCAGTTCTCGCCAGGTAACGGTAATAG
TCCTTTTTTG
G2 B AATTCAAAAAAGGACTATTACCGTTACCTGGCGAGAACTGCCAGGTA
ACGGTAATAGT
G3 A CCGGAGTCGTTTGAGAAGGCCTAAGTTCTCTAGGCCTTCTCAAACGAC
TCCTTTTTTG
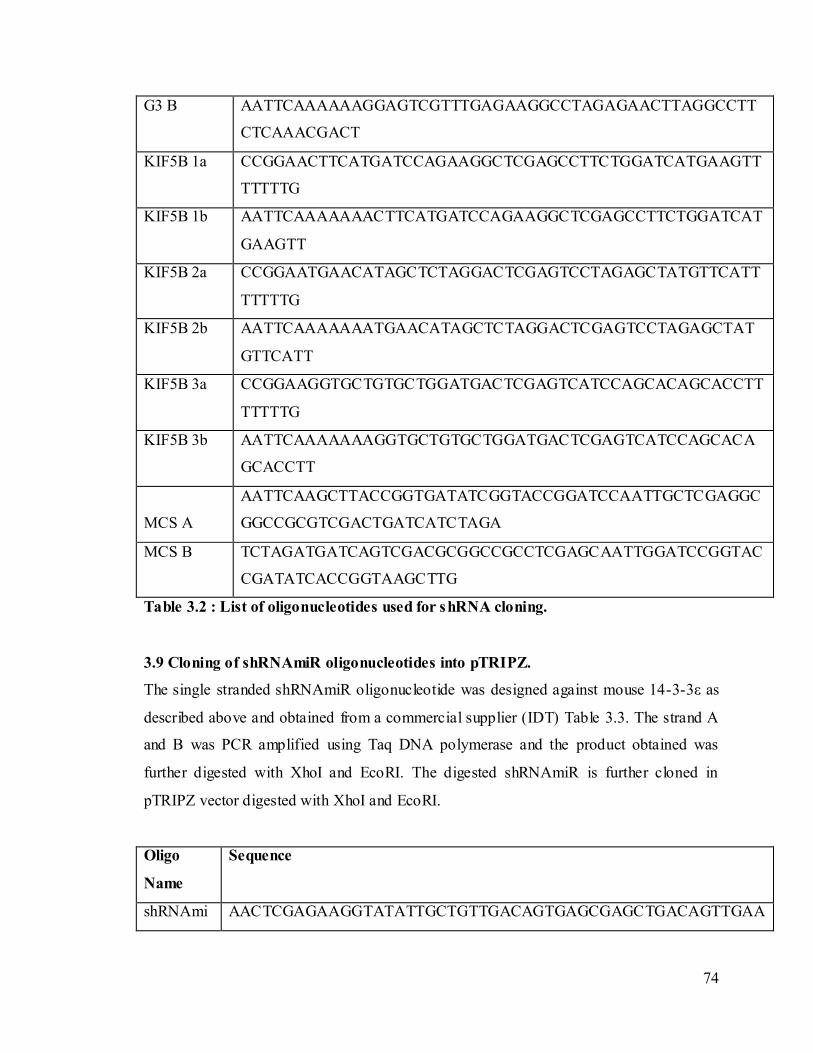
74
G3 B AATTCAAAAAAGGAGTCGTTTGAGAAGGCCTAGAGAACTTAGGCCTT
CTCAAACGACT
KIF5B 1a CCGGAACTTCATGATCCAGAAGGCTCGAGCCTTCTGGATCATGAAGTT
TTTTTG
KIF5B 1b AATTCAAAAAAACTTCATGATCCAGAAGGCTCGAGCCTTCTGGATCAT
GAAGTT
KIF5B 2a CCGGAATGAACATAGCTCTAGGACTCGAGTCCTAGAGCTATGTTCATT
TTTTTG
KIF5B 2b AATTCAAAAAAATGAACATAGCTCTAGGACTCGAGTCCTAGAGCTAT
GTTCATT
KIF5B 3a CCGGAAGGTGCTGTGCTGGATGACTCGAGTCATCCAGCACAGCACCTT
TTTTTG
KIF5B 3b AATTCAAAAAAAGGTGCTGTGCTGGATGACTCGAGTCATCCAGCACA
GCACCTT
MCS A
AATTCAAGCTTACCGGTGATATCGGTACCGGATCCAATTGCTCGAGGC
GGCCGCGTCGACTGATCATCTAGA
MCS B TCTAGATGATCAGTCGACGCGGCCGCCTCGAGCAATTGGATCCGGTAC
CGATATCACCGGTAAGCTTG
Table 3.2 : List of oligonucleotides used for shRNA cloning.
3.9 Cloning of shRNAmiR oligonucleotides into pTRIPZ.
The single stranded shRNAmiR oligonucleotide was designed against mouse 14-3-3ε as
described above and obtained from a commercial supplier (IDT) Table 3.3. The strand A
and B was PCR amplified using Taq DNA polymerase and the product obtained was
further digested with XhoI and EcoRI. The digested shRNAmiR is further cloned in
pTRIPZ vector digested with XhoI and EcoRI.
Oligo
Name
Sequence
shRNAmi AACTCGAGAAGGTATATTGCTGTTGACAGTGAGCGAGCTGACAGTTGAA

75
R E1 A GAACGAATAGTGAAGCCACAGATGTA
shRNAmi
R E1 B
CCGAATTCCGAGGCAGTAGGCAAGCTGACAGTTGAAGAACGAATACAT
CTGTGGCTTCACTATTCGTTCTTC
Table 3.3: List of oligonucleotides used for cloning shRNAmiR.
3.10 Constructs for expression of HA-tagged/EGFP tagged proteins. To generate HA-
tagged versions of mouse 14-3-3 and mouse 14-3-3, 14-3-3 and 14-3-3 were
amplified as a BamHI-XhoI fragments from mouse brain cDNA library respectively and
cloned into BamHI -XhoI digested pCDNA3 plasmid (Invitrogen), resulting in generation
of pCDNA3 HA-m-14-3-3or 14-3-3 constructs (Table 3.4). To generate EGFP-tagged
mouse 14-3-3, the mouse 14-3-3 versions were digested from the TA vector as BamHI-
XhoI fragments and cloned into BglII-XhoI digested pEGFP-f plasmid to generate EGFP
tagged mouse 14-3-3.
Name of oligonucleotide Sequence
14-3-3ε Fwd GGGATCCATGGATGATCGGGAGGATCTG
14-3-3ε Rev GCTCGAGTCACTGATTCTCATCTTCC
14-3-3γ Fwd GGGATCCATGGTGGACCGCGAGCAAC
14-3-3γ Rev GCTCGAGTTAGTTGTTGCCTTCACCG
Table 3.4: List of oligonucleotides used for cloning HA tagged 14-3-3 protein.
3.11 Constructs for expression of HA-tagged shRNA resistant 14-3-3and 14-3-3 .
To generate a version of 14-3-3 (pCDNA-HA-14-3-3-R) which was resistant to the E1
shRNA construct or a version of 14-3-3 (pCDNA-HA-14-3-3-R) which was resistant
the G2 shRNA construct, primers incorporating a silent mutation in the E1 shRNA
binding site in 14-3-3 or incorporating a silent mutation in the G2 shRNA binding site

76
in 14-3-3 were designed (Table 3.5). The Quikchange site directed mutatgenesis kit
(Stratagene) kit, was used as per the conditions specified in the kit to generate either
pCDNA-HA-14-3-3-R or pCDNA-HA-14-3-3γ-R. The mutation was confirmed by
sequencing. To generate a tet inducible construct, the HA-14-3-3-R and pCDNA-HA-
14-3-3γ-R was cloned into the pTRIPZ (Open Biosystems) vector digested with BshTI
and EcoRI to generate pTRIPZ-HA-14-3-3-R and pTRIPZ-HA-14-3-3γ-R respectively.
Name of
oligonucleotide
Sequence
E1 shRNA Res Fwd GGATGGACGTGGAGTTAACTGTAGAAGAACGAAACC
E1 shRNA Res Rev GGTTTCGTTCTTCTACAGTTAACTCCACGTCCATC
G2 shRNA Res Fwd GATGAAAGGGGATTACTATCGATATCTGGCAGAAGTG
G2 shRNA Res Rev CACTTCTGCCAGATATCGATAGTAATCCCCTTTCATC
Table 3.5: List of oligonucleotides used for cloning shRNA resistant 14-3-3ε and 14-
3-3γ.
3.12 Cell lines and transfections. The HEK293, HCT116 (ATCC), NIH3T3 (ATCC),
HHL-17(ATCC) and the HCT 116 derived stable cell lines were cultured in Dulbecco’s
modified Eagles medium (DMEM) (GIBCO) supplemented with 10% Fetal bovine
Serum (JRH/GIBCO), 100U of penicillin (Nicholas Piramal), 100g/ml of streptomycin
(Nicholas Piramal) and 2 g/ml of amphotericin B (HiMedia). Cells were transfected by
calcium phosphate precipitation protocol as described (70) or by lipofectamine reagent
(Invitrogen) as per the manufacturer’s protocol. The total amount of DNA and volume of
reagents of transfection mix for each culture dish is tabulated below:
Diameter of
culture dish
Amount
of DNA
Amount
of D/W
Amount of
0.5 M CaCl2
Amount of
2X BBS
Total Volume
35mm 5ug 45ul 50ul 100 200ul
60mm 10ug 90ul 100ul 200 400ul

77
100mm 25ug 225ul 250ul 500 1000ul
Table 3.6. Calcium phosphate transfection mix. The table shows the different volumes
of the reagents to be mixed for calcium phosphate transfections in different culture
dishes.
The reagents for transfection are described in the reagents section. Sterile D/W and a
working aliquot of calcium chloride for transfection were stored at 40C for not more than
a month. BES buffered saline (BBS) was stored at-200C. About half an hour prior to use,
calcium chloride and D/W were warmed to 37oC and BBS was thawed at R.T just prior to
use. For determination of efficacy of the shRNA constructs, 1μg of the shRNA construct
was cotransfected with 3μg of the respective epitope tagged cDNA expression construct.
For stable selection of knockdown clones 1μg of the shRNA construct was transfected
into NIH3T3 cells. The HCT116 cells were transfected at a confluency o f 20-30% and
the HEK 293 cells were transfected at a confluency of 40-50%.
3.13 Virus Production and titration
The lentiviral vector pLKO.1 EGFP-f was co-transfected with the Vira Power packaging
mix into 293-T cells and viruses were harvested as per the manufacturer’s instructions
(Invitrogen). The lentiviruses were concentrated by centrifuging the tissue culture
supernatant at 35000 x g in a swinging bucket rotor for 45 minutes at 4°C. The viral
pellet was then re-suspended in 1/100th volume of Dulbeco’s PBS (Invitrogen). The viral
titre was determined using flow cytometry for EGFP-f as per the manufacturers protocol
(Invitrogen). The viral supernatant was serially diluted and added to HEK 293 cells in
presence of polybrene. 72 hrs post transduction, GFP reporter expressing cells were
analyzed by flow cytometry. The titer was assessed using the following formula.
F x N x D x 1000
V
TU: Transducing units, F: Number of GFP positive cells (%), N: Number of cells used
at the time of transduction, D: Dilution factor & V: Total volume of the medium.
TU/ml =
78
3.14 Animal experiments.
Swiss mice Crl:CFW(SW) were bred and maintained in the laboratory animal facility of
ACTREC. Maintenance of the animal facility is as per the national guidelines provided
by the Committee for the Purpose of Control and Supervision of the Experiments on
Animals (CPCSEA), Ministry of Environment and Forest, Government of India. The
animals were housed in a controlled environment with the temperature and relative
humidity being maintained at 23±20C and 40-70% respectively and a day night cycle of
12 hrs each (7:00 to 19:00 light; 19:00 to 7:00 dark). The animals were received an
autoclaved balanced diet prepared in-house as per the standard formula and sterile water
ad libitum. Mice were housed in Individually Ventilated Cage (IVC) system (M/S
Citizen, India) provided with autoclaved rice husk bedding material available locally.
Protocols for the experiments were approved by the Institutional Animal Ethics
Committee (IAEC) of ACTREC. The animal study proposal number is 11/2008 dated
August 19, 2008.
3.15 Injection of viral particles and generation of transgenic mice.
28 day old Crl:CFW(SW) male mice were anesthetized by intra-peritoneal injection of
Avertin (Sigma) (2,2 tribromo-ethanol and t-amyl alcohol at the rate of 0.015ml/gm body
weight). Hair was removed from the inguinal area of mice and the surgical site was
cleaned using betadiene. Anterior to the penis, a single midline cutaneous incision of
approx. 1-1.5 cm length was made using sterile surgical scissors under aseptic conditions.
After making the incision in the muscles, the testes were removed from the scrotal sac
with a curved sterile forceps through the incision by gently pulling the dorsal fat pad
associated with the testis. A solution of lentiviruses resuspended in dPBS (Invitrogen)
containing trypan blue (0.04%) was injected slowly into the inter-tubular space of one
testis using a 30 gauge needle. The untransduced testis was vasectomised. The animals
were kept on thermal plate until they recovered from the surgery to avoid hypothermia.
The pre-founder male mice were co-habitated with wild-type females 35 days post-
transduction and the pups generated were analyzed for the presence of the EGFP-f
transgene.
The pre-founder male mice were mated with wild-type females (ratio 1:2). Pups born
were analyzed by PCR using genomic DNA obtained from their tail tip and those positive

79
for the transgene were considered as F1 generation of transgenic animals. F2 generation
of mice were produced either by breeding transgene positive animals with wild-type
Crl:CFW(SW) mice or by breeding two mice positive for the presence of the transgene.
The pups from these matings were analyzed for the presence of the transgene as
described below.
3.16 Isolation of Genomic DNA (gDNA).
Tail biopsies (~3mm) from 3 weeks old pups sired by pre-founder males were taken and
lysed for 16h at 55°C in high salt digestion buffer containing 50mM Tris HCl, 1% SDS,
100mM NaCl, 100mM EDTA and 1200μg/ml Proteinase K (Jackson Laboratories). The
lysate was processed for isolation of DNA using phenol-chloroform extraction followed
by ethanol precipitation. 106 HHL-17 cells stably expressing YFP-K18 were lysed for 16
hr at 55°C in high salt digestion buffer containing 50mM Tris HCl, 1% SDS, 100mM
NaCl, 100mM EDTA and 1000μg/ml Proteinase K (Jackson Laboratories). The lysate
was subjected to phenol-chloroform extraction and the DNA was subsequently purified
by ethanol precipitation. The transgene (K18-YFP) was amplified from genomic DNA by
PCR using forward primer specific to K18 and reverse primer specific to YFP (Table
3.6).
Name of oligonucleotide Sequence
YFP Reverse AAGTCGTGCTGCTTCATGTGGT
K18 Forward GACACCAATATCACACGACTGC
Table 3.7: List of oligonucleotides used to amplify YFP K18.
3.17 Polymerase Chain Reactions and Reverse Transcriptase PCR.
The genomic DNA was subjected for PCR analysis using transgene-specific primers
(EGFP-f or RFP) (Table 3.7). Every PCR reaction set had three controls. The
pLKO.EGFP-f plasmid was used as a template for a positive control, the genomic DNA
obtained from WT mice was used as a negative control and amplification of the
endogenous patch gene was used as a loading control. RNA was prepared from tissues
using the Qiagen RNeasy kit as per the manufacturer’s protocol and RT-PCR was

80
conducted using RevertAid™ First S trand cDNA synthesis Kit (NEB) according to
manufacturer’s protocol.
Name of oligonucleotide Sequence
Ptch Forward CTGCGGCAAGTTTTTGGTTG
Ptch Reverse AGGGCTTCTCGTTGGCTACAAG
IPCR A CGGCGCGCCCTGCTGAGC
IPCR B GGCCACCGTCGGCGTCTCGCCCG
GAPDH Forward GGCTGCCCAGAACATCAT
GAPDH Reverse CGGACACATTGGGGGTAG
EGFP-f Fwd GAATTCCACCATGGTGAGCAAG
EGFP-f Rev GGATCCCCTCAGGAGAGCACACACTT
RFP Fwd ATGAGCGAGCTGATCAAGG
RFP Rev TTATCTGTGCCCCAGTTTGC
Table 3.8: List of oligonucleotides used for genomic PCR reactions.
3.18 Antibodies.
Tissue culture supernatants of the anti-HA (12CA5), anti-14-3-3γ antibody (CG31)
antibodies were used at a dilution of 1:50. The anti-14-3-3 antibody (T-16, Santacruz)
and ascitic fluid containing the anti-CDC25C antibody (TC14) were used at a dilution of
1:2000. The anti-GFP antibody (JL-8, Clontech) was used at a dilution of 1:15,000. The
primary antibodies for plakophilin3 (clone 23E3-4, Zymed, dilution 1:1000), cytokeratin8
(mouse monoclonal, Sigma, dilution 1:5000), cytokeratin18 (mouse monoclonal, Sigma,
dilution 1:50,000), β Actin (mouse monoclonal, Sigma, dilution 1:5000), desmoglein2
(mouse monoclonal, Zymed, dilution 1:500), desmoglein3 (mouse monoclonal, Zymed,
dilution 1:500), desmocollin2 & 3 (mouse monoclonal, Zymed, dilution 1:500),
desmoplakin I & II (rabbit polyclonal, Santacruz, dilution 1:1000 or Abexome 1:100),
plakoglobin (mouse monoclonal, Abcam, dilution 1:500 or abexome 1:100) were used for
Western blot analysis. Respective secondary antibodies were used at a dilut ion of 1:1000
(Invitrogen) or 1:5000 (Pierce). All primary antibody dilutions were made in 1% BSA
81
solution in TBS-T containing 0.02% sodium azide. The antibody dilutions of secondary
goat anti-mouse HRP and goat anti-rabbit HRP antibodies were made in 2.5% milk
(Carnation) in TBS-T containing 1% goat serum. Dilutions of the secondary anti-goat
antibody were made in 2.5% milk (Carnation) in TBS-T without goat serum.
3.19 Histology.
For histological analysis of mutlitple tissues were fixed in 10% formaldehyde (SIGMA)
overnight and processed for histology. Five micron sections of paraffin embedded tissue
were prepared and haematoxylin/eosin staining was performed according to standard
methods (197).
3.20 Immunohistochemistry.
For immunohistochemical staining of lung, spleen, testis and skin section, the mice were
sacrificed and the tissues were fixed in 10% formaldehyde (SIGMA) overnight and
processed for histology. 5µm sections of paraffin embedded tissue were prepared and
permeabilized for antigen retrieval by microwaving the fixed tissue sections in 10mM
Tris buffer (pH 9) with 2mM EDTA and immunohistochemical staining was performed
using vectastain ABC kit according to manufacturer’s protocol.
3.21 Immunofluorescence and confocal microscopy.
5 m cryosections of multiple tissues were observed by confocal microscopy to detect the
presence of EGFP-f. Confocal images were obtained by using a LSM 510 Meta Carl
Zeiss Confocal system with an Argon 488 nm and Helium/Neon 543 nm lasers. All
images were obtained using an Axio Observer Z.1 microscope (numerical aperture [NA]
1.4) at a magnification of X 63. 5µm cryosections of the different tissues were
deparafinzed and treated with 1% sodium borohydrate at room temperature to reduce
auto-fluoresence of tissues. Blocking was performed with 1%BSA and tissues were
further immunostained using GFP monoclonal antibody 1:50 (clonetech) overnight to
detect the presence of EGFP-f. The next day, the sections were washed and incubated
with the secondary antibody (Goat Anti mouse Alexa fluor 568 1:200 Invitrogen).
Prpodium iodide was used to stain sperm DNA. Confocal images were obtained as

82
above. The image was further analyzed using LSM 510 image browser and pseudoclour
(green) was used for representing the EGFP-f expression.
To determine the intracellular localization of the desmosomal proteins in the 14-3-3γ or
KIF5B knockdown clones, immunofluorescence analyses were performed. The cells were
cultured on chromic acid treated, poly- l-Lysine coated glass coverslips at a confluence of
70- 80%. Prior to fixation, the cells were washed carefully twice with 1X PBS. HCT116
derived clones were fixed in absolute methanol for 10min at - 20ᵒC to detect α-tubulin,
KIF5B, PKP2, Par3, ZO1, P-cadherin, K8, K18, DP, PG, DSC, DSG2, E-Cadherin and
PKP3 The cells were permeabilized using 0.3% triton-X100 in 1X PBS for 15 minutes at
room temperature. Permeabilization was followed by two washes of 1X PBS. Primary
antibodies were prepared in 3% BSA in 1X PBS + 0.1% NP-40 solution. Primary
antibodies to DSG2 (mouse monoclonal, Abcam, dilution 1:25), DSC 2 and 3 (mouse
monoclonal, Zymed, dilution 1:25), DP (rabbit polyclonal, ABD Serotec, dilution 1:400),
DP (mouse monoclonal Abexome, clone # 1B8 DP-200, dilution 1:100), PG (mouse
monoclonal, Abcam, dilution 1:25), PKP3 (clone 23E3-4, Zymed, dilution 1:25), PKP2
(mouse monoclonal, BD clontech, dilution 1:25), KIF5B (rabbit polyclonal, Abcam,
dilution 1:100), α-tubulin (mouse monoclonal, Abcam, dilution 1:150), Par3 (mouse
monoclonal, Millipore, dilution 1:50), K8 (mouse monoclonal, sigma, dilution 1:100),
K18 (mouse monoclonal, sigma, dilution 1:100),ZO-1 (rabbit polyclonal, Abcam,
dilution 1:100), P-cadherin (mouse monoclonal, BD Transduction laboratories, dilution
1:100) and E-cadherin (clone 36/E-Cadherin, mouse monoclonal, BD Transduction
laboratories, dilution 1:100) were incubated with the cells for 1 hour at room temperature
in a humidifying container on a parafilm. The coverslips were transferred on a fresh piece
of parafilm using a beaked forceps followed by four alternate washes of 1X PBS and 1X
PBS + 0.1% NP-40. Secondary antibodies were prepared in 3% BSA in 1X PBS + 0.1%
NP-40 solution. The secondary antibody, Alexa 568 or Alexa 488 conjugated anti mo use
IgG or anti rabbit IgG, (Molecular Probes) was used at a dilution of 1:100 and incubated
for half hour at room temperature in a humidifying container. The coverslips were
transferred on a fresh piece of parafilm using a beaked forceps followed by four alternate
washes of 1X PBS and 1X PBS + 0.1% NP-40. The coverslips were then mounted on
chromic acid treated, clean glass slides using 10-20 μl of Vectashield (Vectastain)

83
mounting agent. Confocal images were obtained by using a LSM 510 Meta Carl Zeiss
Confocal system with an Argon 488 nm and Helium/Neon 543 nm lasers. All images
were obtained using an Axio Observer Z.1 microscope (numerical aperture [NA] 1.4) at a
magnification of 630X with 2X optical zoom. The surface intensity of staining for the
different proteins was measured using the LSM software.
3.22 Inverse PCR and mapping of integration sites.
Lentiviral integration sites were identified by modifying the ligation-mediated PCR
method as described (319). In brief, 5 µg genomic DNA was digested with EcoRI for 4 h
and purified using the Qia-Quick PCR purification kit (Qiagen). The purified DNA was
then self- ligated with T4 ligase (NEB) at 4oC overnight. The circular DNA was amplified
using a specific primer pair. The amplified products were cloned into the pJet1.2/Blunt
vector (Fermentas) followed by sequencing on a 3100 Avant Genetic Analyser. The
nucleotide sequences were aligned and examined to confirm the presence of the expected
known transgene sequence and to identify the flanking sequence which would be derived
from the site of insertion. These flanking sequences were matched with the mouse
genome using a stringency of >90% over at least 100 bp. The insertion site sequence was
analyzed using the Basic Local Alignment Search Tool (BLAST) to determine the
chromosomal location of the transgene.
3.23 Spleenocyte culture
Spleens were collected in a petri plate. An incision was made on both the ends of the
spleen and the spleenocytes were washed out using 1X PBS. The cells were collected by
centrifugation at 2500g for 5 minutes. The splenocyte pellet was incubated with sterile
distilled water for 1 minute to lyse RBC’s. The spleenocytes were collected by
centrifugation at 2500g for 5 minutes. The isolated spleenocytes were then cultured in
RPMI-1640 media.
3.24 Single or Multi color flow cytometry
Cell surface antigens to identify different lymphocyte subsets were detected with CD3
APC, CD4 Pacific Blue, CD8 PE, CD PE, B220 PE, (BD Pharmingen USA) conjugated

84
antibodies for flow analysis of human For surface staining cells were incubated in staining
buffer (PBS containing Na-Azide and 2% FCS) with the optimal amount (1µg for 106
cells) of indicated mAb alone or in combination for 30 minutes at 40C in dark. Cells were
subsequently washed and fixed with 1% paraformaldehyde. Appropriate isotype controls
were used in the experiments (All from BD Biosciences, USA). Altogether 10,000 events
were collected and analyzed using FACSAria flow cytometer (BD Bioscience, San Jose,
CA, USA). Data acquisition and single-color, Dual-color or tri-color flow cytometry
analyses were performed on a FACScan using the Cellquest program (Becton Dickinson,
San Diego, USA).
3.25 FRET assays.
FRET measurements were done using the acceptor photobleaching method in live cells
(170). The following images were acquired for FRET efficiency calculations.
1. Pre-bleach image using settings for the donor fluorophore only
2. Pre-bleach image using settings for the acceptor fluorophore only (used to check the
presence of acceptor labelling).
3. Using the donor settings remove any neutral density filters (widefield systems) or turn
the acceptor laser power to maximum (confocal systems)
4. Illuminate the acceptor until it has completely bleached (the time will depend on the
power of the illumination and the fluorophore). FRET Calculations were performed by
the following formulae.
FRET efficiency = (Dpost - Bpost) – (Dpre - Bpre) / (Dpost - Bpost)
Dpost =Donor emission after photobleach
Bpost = Background after photobleach
Dpre = Donor emission prior to photobleach
Bpre = Background prior to photobleach
The nomenclature and equations for FRET calculations and the FRET protocol was
obtained from the Centre for Optical Instrumentation Laboratory, Wellcome Trust Center
for Cell Biology,University of Edinburgh .
85
3.26 Antibodies used for Western blotting.
The primary antibodies for HA (TS of clone 12CA5, dilution 1:50), PKP3 (clone 23E3-4,
Zymed, dilution 1:1000), β Actin (mouse monoclonal, Sigma, dilution 1:5000), 14-3-3γ
(TS of clone CG-31, dilution 1:50), 14-3-3ε (T-16 rabbit polyclonal, Santacruz, dilution
1:500), desmoglein2 (mouse monoclonal, Zymed, dilution 1:500), desmoglein3 (mouse
monoclonal, Zymed, dilution 1:500), desmocollin2&3 (mouse monoclonal,Zymed,
dilution 1:500), DP-200 (mouse monoclonal, Abexome, dilution 1:1000), plakoglobin
(mouse monoclonal, abexome, dilution 1:1000), E-cadherin (mouse monoclonal, dilution
1:2000), pPLCγ (rabbit polyclonal, cell signaling, dilution 1:1000), SLP-76 (mouse
monoclonal, cell signalling, dilution 1:1000) were used for western blot analysis.
Respective secondary antibodies were used at a dilution of 1:1000 (Invitrogen) or 1:5000
(Pierce). Protein samples were resolved on a polyacrylamide gel by SDS PAGE and then
transferred to a nitro cellulose membrane and processed for western blot analysis as
described.
3.27 SDS PAGE and Western blotting protocol.
Protein samples were resolved on a polyacrylamide gel by SDS PAGE (BioRad).
Proteins on the SDS-PAGE gel were transferred to nitrocellulose membranes
(Microdevices Inc.) in a wet transfer apparatus (BioRad) using 55 constant volts for 3
hours or 110 volts for 90 minutes. 3 hour transfer is performed for proteins with
molecular weights above 100 kD. The membranes were blocked in 5% milk at R.T for 1
hour. The blots were rinsed in TBST to remove residual milk. Membranes were
incubated overnight with the primary antibody at 4oC. Membranes were washed thrice
with TBS-T for 5 minutes each. Membranes were incubated with the secondary anti-
mouse/ anti rabbit/ anti goat HRP (Pierce) antibody for 1 hour at room temperature.
Membranes were washed thrice with TBS-T for 10 minutes each. The blots were
developed with PicoWest (Pierce) Western blot chemiluminiscent substrates as per the
manufacturer’s instructions and the signal captured onto X-ray films (Kodak).

86
3.28 GST pulldown assays.
To detect in vitro interaction between 14-3-3 proteins and cdc25C or 14-3-3γ and PG,
GST pulldown assays were performed.
3.28 (a) Production of GST-fusion proteins.
A single colony of BL21 cells transformed with plasmids expressing GST or various
GST-fused 14-3-3 isoforms was inoculated in 10ml of LB-Amp broth. The inoculated
broth was distributed in 5ml aliquots in two 50ml screw cap conical tube (Tarsons) and
grown for 16-18 hours on a shaker at 37oC. The 10ml overnight starter culture was used
to inoculate 100 ml LB-Amp broth in a 1.5L flask (Tarsons) followed by incubation on a
shaker at 37oC. After 1 hour of incubation, 11μl of 1M IPTG was added to each flask and
the flasks were further incubated on shaker at 37oC for 3 hours. After 3 hours the culture
was transferred to 50ml round bottom tubes (HS-50, Laxbro) on ice. Cells were pelleted
by centrifugation at 5000 rpm (SS-34 rotor, Sorvall) for 10 minutes at 4oC. The
supernatant was discarded and cells were suspended gently in ice cold 0.1% triton X-100
in PBS, using a 10ml pipette while ensuring that there is minimum frothing. The cell
suspension was sonicated (Branson) at 50 duty cycles for 10 seconds and then placed on
ice for 10 seconds. This was repeated 4 times. The suspension was centrifuged at 5000
rpm (SS-34 rotor, Sorvall) for 10 minutes at 4oC. The supernatant was transferred to 15ml
screw cap conical tubes (Tarsons) on ice. To each tube was added 150μl of a 50% slurry
of glutathione sepharose beads (Amersham). The tubes were kept on a rocker at 4oC for 1
hour. After 1 hour, the beads were pelleted by centrifugation at 3000 rpm (rotor no. 1,
Rota6-R benchtop centrifuge, Plastocraft) for 1 minute at
4oC. The supernatant was discarded and to each tube was added 1ml of NET-N. The
beads were resuspended in NET-N and transferred to 1.5ml eppendorf tubes on ice. The
beads were pelleted by centrifugation at 3000 rpm (rotor no. 1, Rota6- R benchtop
centrifuge, Plastocraft) for 1 minute at 4oC. Beads were washed twice with NET-N. After
the final wash, beads were resuspended in 75μl of NET-N. The beads were stored at 4oC
till further use.
3.28 (b) GST pulldown.
HCT116 or NIH3T3 cells were grown to 80-90% confluency in 100mm dishes. Two
plates were used for pulldown with each fusion protein. The medium was decanted and to
87
each plate was added cold 500ml of EBC lysis buffer containing protease inhibitors. Cells
on the plate were scraped using a cell scraper and were collected in a 1.5ml eppendorf on
ice. Cells were incubated on ice for 15 minutes followed by centrifugation at 10,000 rpm
(rotor no. 1, Rota6-R benchtop centrifuge, Plastocraft) for 15 minutes at 4oC. The
supernatant was transferred to another 1.5ml eppendorf. 25μl of the supernatant was kept
separately in another 1.5ml eppendorf as whole cell extract and stored at -80oC till further
use. To the remainder of supernatant was added 30μl of GST-14-3-3 beads or GST beads
and additional 500μl of cold EBC lysis buffer containing protease inhibitors. The tubes
were kept on a rocker at 4oC overnight. After overnight rocking, the beads were pelleted
by centrifugation at 3000 rpm (rotor no. 4, Rota6- R benchtop centrifuge, Plastocraft) for
1 minute at 4oC. The beads were washed thrice with cold NET-N. After decanting NET-
N from the final wash, 50μl of 1X Laemmli’s buffer containing β-mercaptoethanol and
bromophenol blue was added to the beads. 12.5μl of 3X Laemmli’s sample buffer was
added to the whole cell extracts. All extracts were boiled for 4 minutes and resolved on a
10% SDSPAGE gel and Western blot was performed with the PG or cdc25C antibody.
To determine the levels of GST and GST-fusion proteins used for pulldown, the blot was
stained with Ponceau stain (Sigma).
3.29 Immunoprecipitation.
To detect in vivo interactions between endogenous KIF5B with HA tagged 14-3-3γ,
immunoprecipitation experiments were performed. 40- 44 hours post transfection the
medium was decanted and to each plate was added cold 1ml of EBC lysis buffer
containing protease inhibitors. Cells on the plate were scraped using a cell scraper and
were collected in a 1.5ml eppendorf on ice. Cells were incubated on ice for 15 minutes
followed by centrifugation at 10,000 rpm (Rota6R, rotor no.1Plastocraft) for 15 minutes
at 4oC. The supernatant was transferred to another 1.5ml eppendorf. 50μl of the
supernatant was kept separately in another 1.5ml eppendorf as whole cell extract, boiled
in Laemmli’s buffer and stored at -80oC till further use. To the remainder of the lysate,
200µl of 12CA5 antibody supernatant was added and the tubes were rocked for 2 hours at
4oC. 40μl of Protein G Sepharose (GE Healthcare) was added to the reaction mixture and
the reactions incubated at 4oC for one hour on a rocking platform. The immune

88
complexes were washed thrice with NET-N, boiled in 1X sample buffer and resolved on
a SDS-PAGE gel. Western blotting was performed to detect the different proteins.
Immunoprecipitation assays were also performed to study the interaction between SLP-
76 and 14-3-3ε in presence of HPK1 in vivo. HEK293 cells were seeded at 35-40%
confluency in a 100 mm dish. These cells were cotransfected with constructs expressing
Flag-epitope tagged SLP-76 (10μg) and HA-epitope tagged 14-3-3ε (5μg) in presence or
absence of HPK1 (10µg). 48 hrs post transfection, cells were harvested and IP was
performed as described above using Flag antibody (1µg) followed by SDSPAGE and
western blotting using antibody to SLp-76 and 14-3-3ε.
3.30 Electron microscopy.
To determine whether intracellular junction formed appropriately in the 14-3-3γ
knockdown testis, electron microscopy was performed. Testis section was fixed with 3%
glutaraldehyde and post fixed with 1% osmium tetra oxide (Tedpella). Cultures were
dehydrated and processed. Grids were contrasted with alcoholic uranyl acetate for 1
minute and lead citrate for half a minute. The grids were observed under a Carl Zeiss
LIBRA120 EFTEM transmission electron microscope, at an accelerating voltage of
120KV and at X 25000 magnification. Images were captured using a Slow Scan CCD
camera (TRS, Germany).
3.31 Calcium Switch experiments.
To determine the role of 14-3-3 in de novo desmosome assembly, pTU6 vector control
cells or 14-3-3 knockdown cells were grown on poly L-Lysine coated glass coverslips to
a confluency of 10 – 20 %. The cells were then incubated in low calcium medium for 16-
20 hours. Subsequently cells were washed and fed with normal calcium containing
medium and at different time intervals after calcium replenishment, cells were fixed and
immunofluorescence staining was performed to determine the localization of the
different desmosomal proteins.

89
3.32 Hanging drop assay to determine cell-cell adhesion.
To determine whether 14-3-3 down regulation results in alteration in desmosome
function a hanging drop assay was performed to estimate the cell-cell adhesive properties
of the 14-3-3 knockdown cells compared to the vector control cell line. 2 x 10⁴ cells
were suspended in 35μl drops of complete medium from the lid of 24-well plate for 16 h.
The corresponding wells contained PBS to maintain humidity. After the incubation, the
drops were pipetted five times with a 200μl standard tip, fixed with 3% glutaraldehyde,
and aliquots were spread on coverslips. Images of five random fields from three
independent suspensions were taken with a plan-Neofluar lens (numerical aperture [NA]
0.3) at 10X on an upright AxioImager.Z1 microscope (Carl Zeiss, Germany) for each
sample. The area of cell clusters was determined using the Axiovision rel 4.5 software
(Zeiss). The number and area of cell clusters give a direct interpretation of the
intercellular adhesive property of the cells.
3.33 Cell-ECM adhesion assay.
As we have observed the cell-ECM adhesion defects in the 14-3-3γ knockdown testis, we
tested the ability of derived 14-3-3γ knockdown clones to adhere to different extra
cellular matrix (ECM) proteins, Fibronectin and Collagen IV assay as described
previously (7). 6 well flat bottom plates with coverslips were coated with 500μl/well of
ECM substrates: (Fibronectin: 2.5 μg /ml, Collagen type IV in PBS) were blocked with
2% BSA in PBS for 2 hr at 37°C. 3x10⁴cells in 100μl DMEM containing 0.1% BSA was
added to each substrate coated well and kept at 37°C for 1hr. Non adherent cells were
removed by giving two washes with PBS and the adherent cells were fixed in 4%
paraformaldehyde and stained for filamentous actin using FITC-conjugated phalloidin
(Sigma). The coverslips were then mounted on chromic acid treated, clean glass slides
using 10-20 μl of Vectashield (Vectastain) mounting agent. Confocal images were
obtained by using a LSM 510 Meta Carl Zeiss Confocal system with an Argon 488 nm
and Helium/Neon 543 nm lasers. All images were obtained using an Axio Observer Z.1
microscope (numerical aperture [NA] 1.4) at a magnification of 630X with 2X optical
zoom.
90
3.34 Wound healing assay to determine cell migration.
To determine if 14-3-3 in NIH 3T3 loss leads to an increase in cell migration in vitro, a
monolayer wounding assay was performed. The 14-3-3 knockdown cells were grown till
they were 90% confluent, following which they were treated with 10 µg/ml of mitomycin
C (Sigma) for 3 hours, to inhibit proliferation. Three hours after the addition of
mitomycin C, the cells were washed and a linear scratch wound was made on the plate.
The cells were fed with complete medium and observed under a Axiovert 200 M Inverted
Carl Zeiss microscope fitted with a stage maintained at 37ᵒC and 5% CO2. Cells were
observed by time lapse microscopy and images were taken every 5 minutes for 20 hours
using an AxioCam MRm camera with a 10 X phase 1 objective. Migration was measured
using Axiovision software.
3.35 Soft agar assay.
To determine whether the NIH 3T3 derived 14-3-3ε knockdown clones, show anchorage
independent growth, soft agarose assays were performed where the stable knockdown
clones were trypsinized and counted. 2,500 cells were plated in 0.4% soft agarose for the
NIH3T3 clones. The cells were maintained in the presence of the relevant antibiotic.
After 2-3 weeks, the number of colonies was counted in triplicate. Three independent
experiments were performed for each clone analyzed.
3.36 Tumor formation in nude mice
To determine the role of 14-3-3 in neoplastic progression in vivo, 106 cells of the NIH
3T3 derived vector control or 14-3-3 knockdown clones were resuspended in DMEM
medium without serum and injected subcutaneously in the dorsal flank of 6-8 weeks old
SCID (292) (obtained from ACTREC animal house facility). Five mice were injected for
each clone. Tumour formation was monitored at intervals of 2-3 days and tumour size was
measured by a vernier calipers. Tumour volume (mm3) was calculated by the formula ½
LV2 where L is the largest dimension and V its perpendicular dimension.

91
3.37 Biodistribution of 18F-FDG using Positron Electron Tomography (PET).
To determine the biodistribution of 18F-FDG in tumors, SCID mice with tumors were
studied. The 18F-FDG (7.4 MBq [200 mCi] in 0.2 mL) was injected in tail vein after a
short (5 min) isoflurane (2% in 100% oxygen) anesthesia period. PET was started 60 min
after 18F-FDG injection. microPET was performed with the P4 microPET scanner
(Concorde Microsystems Inc.). In brief, the device has a ring diameter of 26 cm and a 7.8-
cm axial field of view. The intrinsic spatial resolution ranges from 1.56 to 2.01 mm, with
a mean of 1.75 mm. The reconstructed resolution is 1.8-mm full width at half maximum in
the center of the field of view and 3 mm at 4-cm radial offset. Images were reconstructed
using microPET analysis software.
3.38 Reagents
a) Transfection reagents:
2X BBS (BES-buffered solution), pH6.95: 50mM BES, 280mMNaCL, 1.5mMNa2HPO4.
0.5M CaCl2
b) Lysis Buffer for protein extraction
Tris HCL, pH7.5 50mM
KCl 120mM
EDTA 5mM
NP-40 0.1%
Glycerol 10%
c) 1X Laemmli’s buffer
Component Final concentration Amount
1M Tris pH 6.8 50mM 5ml
Glycerol (SD fine) 10% 10ml
10% SDS 2% 20ml
Bromophenol blue (Sigma) 0.1% 0.1g
Make up the volume to 95ml with distilled water. Before use, to 950l of 1X buffer add
50l of -mercaptoethanol.

92
d) 3X Laemmli’s buffer
Component Final concentration Amount
1M Tris pH 6.8 150mM 15ml
Glycerol (SD fine) 30% 30ml
SDS (Sigma) 6% 6g
Bromophenol blue (Sigma) 0.3% 0.3g
Make up the volume to 85ml with distilled water. Before use, to 850l of 1X buffer add
150l of -mercaptoethanol.
e) 10X running buffer (10X electrode buffer)
Component Final concentration Amount
Tris base (Sigma) 250mM 30.0g
Glycine (Signa) 2.5M 187.7g
SDS (Sigma) 10% 10.0g
Dissolve in 750ml of distilled water. Make up the volume to 1000ml with distilled water.
f) Transfer buffer
Component Amount
Tris base 12.1g
Glycine 57.6g
Methanol 800ml
10% SDS 4ml
Make up volume to 4L with distilled water.
g) TBS-T (tris buffered saline with Tween-20)
Component Final concentration Amount
1M Tris pH8.0 10mM 10.0ml

93
2.5M NaCl 150mM 60ml
Tween-20 (Sigma) 0.1% 1.0ml
Make up the volume to 1000ml with distilled water.
h) NET-N
Component Final concentration Amount
1M Tris pH 8.0 20mM 20ml
2.5M NaCl 100mM 40ml
0.5M EDTA pH 8.0 1mM 2ml
NP-40 (or Igepal) (Sigma) 0.5% 5ml
Make up volume to 1L with distilled water. Store at 4oC.
i) EBC lysis buffer
Component Final concentration Amount
1M Tris pH 8.0 50mM 50ml
2.5M NaCl 125mM 50ml
NP-40 (or Igepal) (Sigma) 0.5% 5ml
Make up volume to 1L with distilled water. Store at 4oC.
Before use add the following protease inhibitors (for 10ml EBC lysis buffer).
Inhibitor Final concentration Amount
1mg/ml leupeptin 10g/ml 100l
2mg/ml Aprotinin 20g/ml 100l
500mM PMSF 1mM 20l
1M NaF 50mM 500l
0.2M Na orthovanadate 1mM 50l

94
0.5M EDTA 1mM 20l
10mg/ml pepstatin 10g/ml 10l
j) 4% paraformaldehyde in PBS – Dissolve 4gm of paraformaldehyde (Sigma) in 90ml
PBS by heating at 70oC in a waterbath. Make up the volume to 100ml with PBS. Filter
through a filter paper and store at 4oC.
k) 4% paraformaldehyde and 2% glucose in PBS – Dissolve 4gm of
paraformaldehyde (Sigma) in 90ml PBS by heating at 70oC in a waterbath. Add 2g
glucose and make up the volume to 100ml with PBS. Filter through a filter paper and
store at 4oC.
l) 0.3% Triton X-100 in PBS – Dissolve 0.3ml of Triton X-100 (Sigma) in 100ml of
PBS and filter through a filter paper. Store at 4oC.

95
CHAPTER 4
RESULTS

96
4. To generate novel constitutive and inducible lentiviral vectors for transgene
expression or the generation of knockdown mice.
4. 1 Introduction.
Lentiviruses are a class of retrovirus that can infect both dividing and non dividing cells
because their preintegration complex can cross an intact nuclear membrane. Within the
last decade, multiple lentiviral vectors have been developed as tools for gene delivery and
for therapeutic and experimental transgenic applications (66, 105, 173, 226, 234, 284,
285, 295, 322, 336, 400) as they permit in vivo gene delivery to terminally differentiated
cells in multiple tissue types (66, 105, 173, 183). Large cDNA’s can be cloned into these
vectors and the viral cDNA integrates into the genome; both properties support the long-
term expression of the transgene (259). Because of their ability to transduce quiescent
cells, lentiviral vectors are also promising tools for ex vivo genetic modification of stem
cells (29, 297), which reside almost exclusively in the G0/G1 phase of the cell cycle and
can also be used to generate transgenic mouse models of human disease (3, 138, 169,
226, 253, 255, 256, 284, 307, 322, 360). Depending upon the requirements, lentiviral
vectors carrying the transgenes can be engineered and used effectively to alter target
various cell types in vitro and in vivo. Increased interest in these vectors has given rise to
a need for development of safer, user-friendly designs for different applications.
4.1.1 Generation of lentiviral vectors for the expression of shRNA’s.
The lentiviral vector backbone for the expression of shRNA’s was derived from pLKO.1
puro (343) (figure 4.1.1 a). This vector contains a human U6 promoter that drives RNA
Polymerase III based transcription for the generation of shRNA transcripts. One
limitation of this vector was that the number of restriction sites for cloning was limited.
The stuffer sequence (1.9kb) downstream of the U6 promoter was replaced with 1 kb
fragment containing an MCS to generate the pS18 lentiviral vector (figure 4.1.1b) as
described in materials and methods. The pLKO.1 vector was also modified to remove the
stuffer and introduce a novel MCS containing additional restriction sites for cloning
shRNA’s into pLKO.1 to generate pLKO.1 MCS vector (figure 4.1.1 c) as described in
materials and methods.

97
Figure 4.1.1 Generation of lentiviral vectors for the expression of shRNA’s. (A)
Schematic representation of pLKO.1 Puro. (B) Schematic representation of pS18. (C)
Schematic representation of pLKO.1 MCS.
The vectors described above lacked the cDNA expressing fluorescent reporter (e.g.
EGFP-f) that can be used to track transduced cells. To overcome this hurdle, a modified
lentiviral vector capable of expressing both the shRNA and a fluorescent reporter (EGFP-
f) was generated. Previous results had indicated that a lentivirus vector in which
cDNA’s were downstream of the CMV promoter was not effective in achieving lentiviral
transduction and expression in germ line stem cells (256). Therefore an expression
cassette containing the elongation factor1α (EF1-α) promoter driving the expression of
EGFP-f, followed by SV40 poly-adenylation sequence was assembled in pBSK to
generate pBSK-F2 (figure 4.1.2 a). The restriction sites for BshTI in elongation factor1α
(EF1-α) promoter was removed as this can interfere in cloning of shRNA
oligonucleotides in the resultant vector. The loss of this restriction site resulted in the loss
of transcription factor binding sites (TFBS) for CAC binding protein and NF-1 (figure
4.1.2 b). To ensure that the loss of TFBS in elongation factor1α (EF1-α) promoter did not
compromise its promoter activity, we performed a GFP reporter assay using the
elongation factor1α (EF1-α) promoter in pBSK-F2 vector and modified elongation
factor1α (EF1-α) promoter in pBSK-F2A8 vector. As determined by flow cytometry and
Western blotting, the loss of TFBS in elongation factor1α (EF1-α) promoter enhances its
activity (figure 4.1.2 c, d & e). The expression of EGFP-f in the modified vector was
confirmed by flouresence microscopy (figure 4.2 f). The modified assembled cassette

98
form pBSK-F2A8 was further sub cloned in pLKO.1 MCS to generate pLKO.1 EGFP-f
Puro which expresses both EGFP-f and a shRNA downstream of the U6 promoter (figure
4.1.2 g).
Figure 4.1.2 Generation of pBSK-F2 shuttle vector (A) Schematic representation of
pBSK-F2. (B) Transcription factor binding site in EF1 promoter. (C) EGFP-f reporter
assay in HEK 293 cells using pBSK-F2 and pBSK-F2A8 shuttle vector as determined by
Flow cytometry. (D) Graphical representation of percentage of GFP positive as obtained
in EGFP-f reporter assay. (E) Westren blot analysis for the expression of EGFP-f in
HEK 293 cells transfected with pBSK-F2 or pBSK-F2A8 shuttle vector using GFP
monoclonal antibody, actin was probed for loading control. (F) Confocal image of
HEK 293 cells expressing EGFP-f. (G) Schematic representation of pLKO EGFP-f Puro.

99
4.1.2 Generation of lentiviral vectors for cDNA expression.
The lentiviral vector backbone for the expression of cDNA was derived from pLKO.1
puro (343). An expression cassette containing the elongation factor1α (EF1-α) promoter
driving the expression of EGFP-f, followed by SV40 poly-adenylation sequence in
pBSK-F2A8 was modified by replacing EGFP-f with an MCS containing unique
restriction sites to generate pBSK-FM3 (figure 4.1.3 a & b). Further the expression
cassette from pBSK-FM3 was subcloned in pLKO.1 puro using ClaI to generate pEF.55
lentiviral vector (figure 4.1.3 c).
Figure 4.1.3 Generation of lentiviral vectors for the expression of cDNA (A) Schematic
representation of pBSK-FM3. (b)Multiple cloning sites depicting the restriction sites
introduced in pBSK-FM3. (c) Schematic representation of pEF55 lentiviral vector.
4.1.3 Generation of bi-cistronic lentiviral vectors.
The lentiviral vector backbone for the expression vectors was derived from the pTRIPZ
vector (Open Biosystems). The CMV promoter was cloned into the pTRIPZ vector as
described in Materials and Methods followed by the introduction of a MCS upstream of
various fluorescent proteins (EGFP, ECFP, EYFP, mCherry and dsRed) and the IRES
PuroR cassette to obtain the resultant bi-cistronic lentiviral vector pLV- FP-IRES-Puro
(figure 4.1.4 a). A notable shortcoming of several of the currently available bi-cistronic

100
lentiviral vectors is the lack of suitable restriction sites in the MCS for generation of
fluorescent protein fusions. The vectors thus generated contain an MCS with eight unique
restriction sites to choose from as opposed to four in currently available bi-cistronic
vector systems (figure 4.1.4 b). Apart from providing a greater choice of restriction sites,
this vector contains Nhe1 and Not1 sites upstream of the IRES. These sites permit the
cloning of both N terminal and C terminal tagged fluorescent fusion proteins from any of
the commercially available expression vectors into the lentiviral vectors generated above.
Figure 4.1.4 Generation of bi-cistronic lentiviral vectors for the expression of cDNA
(A) Schematic representation of pLV-FP-IRES-Puro, where FP stands for dsRED,
mCherry, EGFP, CFP and YFP. (b) Schematic representation of the unique multiple
cloning sites available for cloning. The sequence of the MCS is shown in frame with the
start codon of the downstream florescent protein (FP). The positions of unique restriction
sites are indicated.
4.1.4 The bi-cistronic lentiviral vectors can be used for both transient and stable
gene expression in culture.
The ability of these bi-cistronic lentiviral vectors to express various fluorescent proteins
(EGFP, ECFP, EYFP, mCherry and dsRed) was assessed by infecting HEK-293 cells
with viruses produced using the various bi-cistronic lentiviral vectors. As shown in
(figure 4.1.5 a), HEK-293 cells expressed the different fluorescent proteins upon
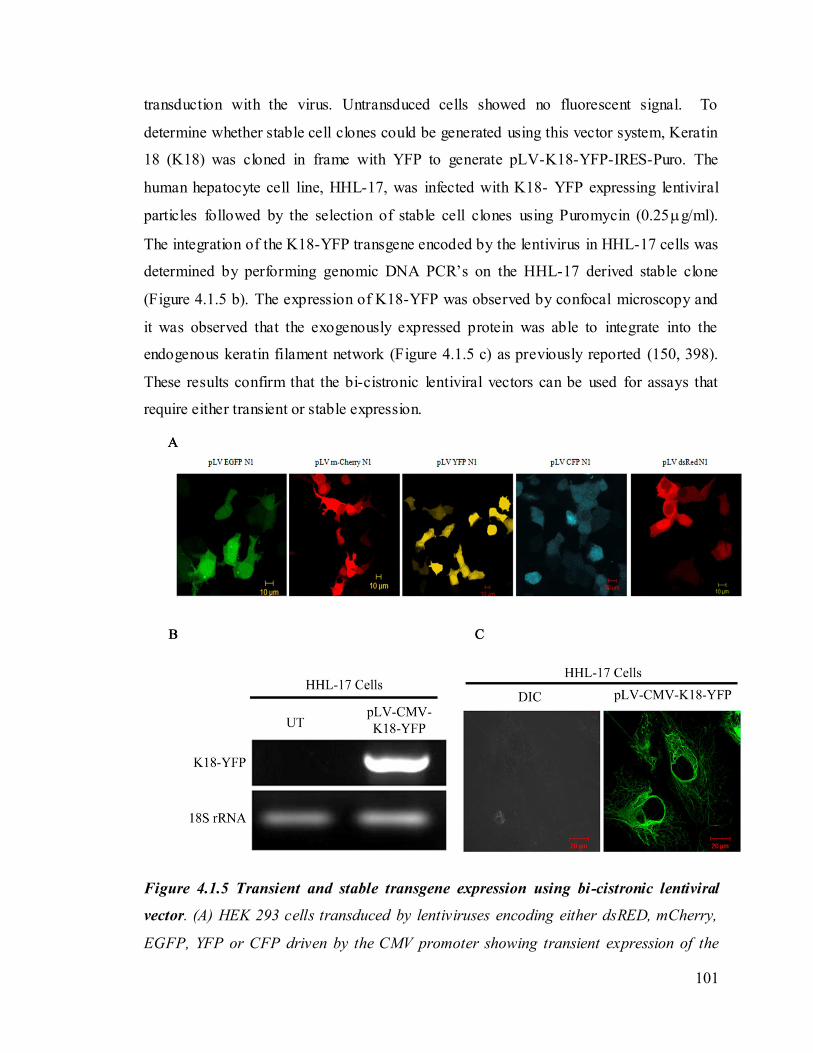
101
transduction with the virus. Untransduced cells showed no fluorescent signal. To
determine whether stable cell clones could be generated using this vector system, Keratin
18 (K18) was cloned in frame with YFP to generate pLV-K18-YFP-IRES-Puro. The
human hepatocyte cell line, HHL-17, was infected with K18- YFP expressing lentiviral
particles followed by the selection of stable cell clones using Puromycin (0.25g/ml).
The integration of the K18-YFP transgene encoded by the lentivirus in HHL-17 cells was
determined by performing genomic DNA PCR’s on the HHL-17 derived stable clone
(Figure 4.1.5 b). The expression of K18-YFP was observed by confocal microscopy and
it was observed that the exogenously expressed protein was able to integrate into the
endogenous keratin filament network (Figure 4.1.5 c) as previously reported (150, 398).
These results confirm that the bi-cistronic lentiviral vectors can be used for assays that
require either transient or stable expression.
Figure 4.1.5 Transient and stable transgene expression using bi-cistronic lentiviral
vector. (A) HEK 293 cells transduced by lentiviruses encoding either dsRED, mCherry,
EGFP, YFP or CFP driven by the CMV promoter showing transient expression of the

102
fluorescent tag. (B) PCR amplification of genomic DNA purified from HHL-17 cells
stably transduced with lentiviruses expressing YFP-K18. (C) Expression of K18-YFP in
stable cell clones generated in HHL-17 cells (YFP is pseudo-colored in green). (Original
magnification 630X with 2X optical zoom). Scale bars are shown in each panel.
4.1.5 The bi-cistronic lentiviral vectors can be used for live cell imaging
experiments.
To determine if these bi-cistronic lentiviral vectors could be used for studying cellular
processes in live cells, the ability of Keratin 8 (K8) fused to CFP and K18-YFP to form
an intermediate filament network in HEK-293 cells was determined. HEK-293 cells do
not express K8 and K18, and thus were an ideal system to study filament formation.
Lentiviral vectors expressing K18-YFP and K8-CFP downstream of the CMV promoter
and the Ubc promoter respectively were generated. HEK 293 cells were transduced with
lentiviruses expressing either K18-YFP or K8-CFP alone or in combination and
visualized by confocal microscopy. HEK-293 cells transduced with either K18-YFP or
K8-CFP alone did not demonstrate filament formation and instead showed the presence
of distinct punctuate structures in the cytoplasm (Figure 4.1.6 a). However HEK-293
cells transduced with both K18-YFP and K8-CFP demonstrated filament network
formation (Figure 4.1.6 a). These results are consistent with previously published work
suggesting that keratin filaments are formed due to heterotypic interactions between a
type I and type II keratin and that lack of one type results in the presence of cytoplasmic
aggregates of the other member of the pair (98, 147, 150, 189, 238, 242, 320). Further, in
HHL-17 cells, ectopic expression of both K18-YFP and K8-CFP results in the formation
of a keratin filament network (figure 4.1.6 b). These results suggest that bi-cistronic
lentiviral vectors can be used to co-express different fluorescent proteins for studying
protein organization into higher order structures and protein colocalization.

103
Figure 4.1.6: Application of bi-cistronic lentiviral vectors in live cell imaging. (A) HEK
293 cells were transduced with either pLV-CMV- K18-YFP -IRES-Puro (Red pseudo
color) or pLV-Ubc-K8-CFP-IRES-Puro (green pseudo color) or both constructs. No
signal was observed in the YFP channel upon only K8-CFP transduction and no signal

104
was observed in the CFP channel upon K18-YFP transduction. Note that cells expressing
only one partner of the pair do not show the presence of filaments and show the presence
of discrete cytoplasmic aggregates while cells expressing both constructs show the
presence of filament network and that the two proteins co-localize as seen in the merged
image. (B) HH17 cells were transduced with pLV-CMV- K18-YFP -IRES-Puro (Red
pseudo color) and pLV-Ubc-K8-CFP-IRES-Puro (green pseudo color). The transduced
cells were visualized using confocal microscopy. (Original magnification 630X with 2X
optical zoom). Scale bars are shown in each panel.
One of the techniques used to study protein-protein interactions in vivo is Forster
resonance energy transfer (FRET) (324). FRET is based upon the transfer of energy from
an excited donor fluorophor to a proximate acceptor fluorophor, resulting in enhanced
fluorescence emission of the acceptor. This phenomenon only occurs when the distance
between donor and acceptor is less than 10 nm and the emission spectra of the donor
overlaps with the excitation of the acceptor. As K8 and K18 bind to one another to form
keratin filaments (398), the K18-YFP and K8-CFP constructs were used to determine
whether these vectors can be used to perform FRET assays. HHL-17 and HEK-293 cells
were transduced with both K18-YFP and K8-CFP, and the FRET efficiency between
these two proteins was measured in live cells as described in materials and methods. It
was observed that K18-YFP and K8-CFP interact with each other with a FRET efficiency
of 44.6% in HHL-17 cells (Figures 4.1.7 a, b and c) and 41% in HEK-293 cells (figure
4.1.7 d).The percentage FRET efficiency obtained for K18-YFP and K8-CFP is highly
significant (Figure 4.1.7 d) as determined by measuring the FRET efficiency of three
different regions for acceptor photobleaching and no bleaching (control) followed by
statistical analysis using students t-test. These results suggest that the bi-cistronic
lentiviral vector can be effectively used to study protein-protein interactions in live cells
using FRET.

105
Figure 4.1.7: Application of bi-cistronic lentiviral vectors in live cell imaging. (A)
Acceptor photobleaching FRET was performed in HHL-17 cells co-transduced with both
pLV-CMV- K18-YFP -IRES-Puro (Red pseudo color) and pLV-Ubc-K8-CFP-IRES-Puro
(green pseudo color). Pre-bleach and post-bleach images were acquired using an
LSM510 confocal microscope. The gain in the fluorescence intensity of the donor (K8-
CFP) upon acceptor photobleaching is shown in the inset. (B) Graph representing the
gain in mean fluorescence intensity upon acceptor photobleaching as a function of time is
depicted. The mean fluorescence intensity is on the Y-axis and time in seconds on the X-
axis. (C) Graph representing the percentage FRET efficiency for K18-YFP and K8-CFP
using acceptor photobleaching in HHL-17 cell. The bars represent the mean and the
error bars the standard deviation. The p value was obtained using a student’s t-test.
(Original magnification 630X with 2X optical zoom). Scale bars are shown in each panel.
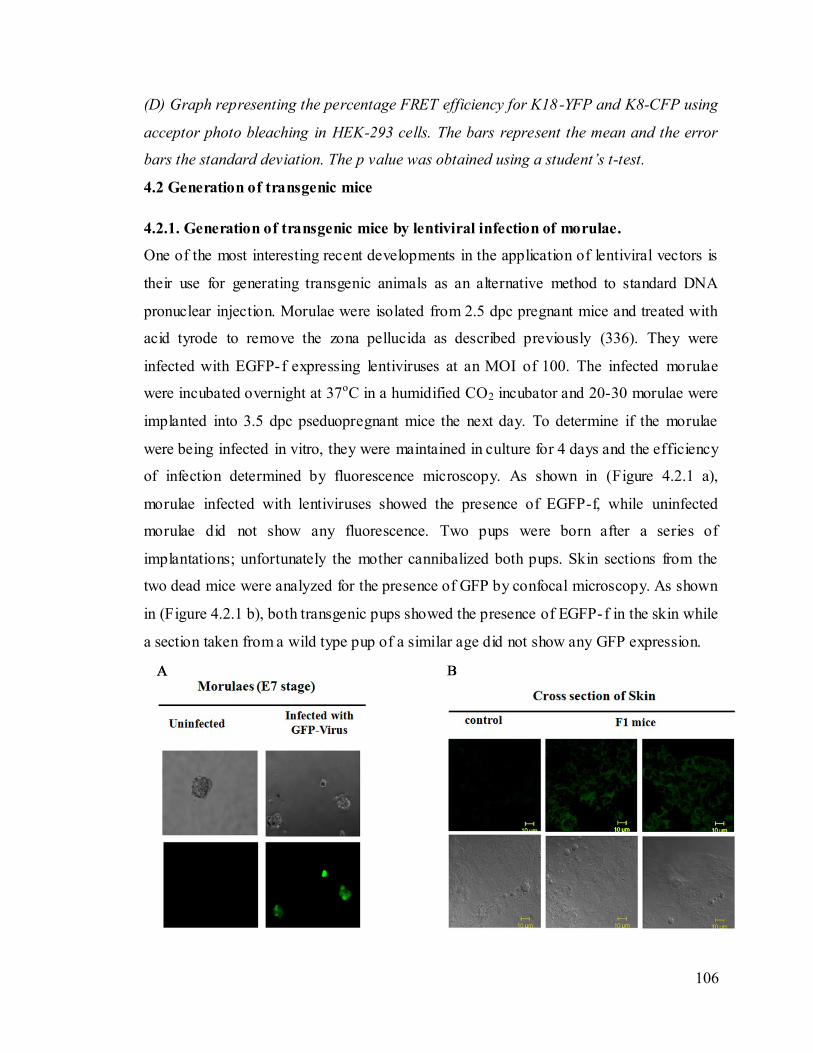
106
(D) Graph representing the percentage FRET efficiency for K18-YFP and K8-CFP using
acceptor photo bleaching in HEK-293 cells. The bars represent the mean and the error
bars the standard deviation. The p value was obtained using a student’s t-test.
4.2 Generation of transgenic mice
4.2.1. Generation of transgenic mice by lentiviral infection of morulae.
One of the most interesting recent developments in the application of lentiviral vectors is
their use for generating transgenic animals as an alternative method to standard DNA
pronuclear injection. Morulae were isolated from 2.5 dpc pregnant mice and treated with
acid tyrode to remove the zona pellucida as described previously (336). They were
infected with EGFP-f expressing lentiviruses at an MOI of 100. The infected morulae
were incubated overnight at 37oC in a humidified CO2 incubator and 20-30 morulae were
implanted into 3.5 dpc pseduopregnant mice the next day. To determine if the morulae
were being infected in vitro, they were maintained in culture for 4 days and the efficiency
of infection determined by fluorescence microscopy. As shown in (Figure 4.2.1 a),
morulae infected with lentiviruses showed the presence of EGFP-f, while uninfected
morulae did not show any fluorescence. Two pups were born after a series of
implantations; unfortunately the mother cannibalized both pups. Skin sections from the
two dead mice were analyzed for the presence of GFP by confocal microscopy. As shown
in (Figure 4.2.1 b), both transgenic pups showed the presence of EGFP-f in the skin while
a section taken from a wild type pup of a similar age did not show any GFP expression.

107
Figure 4.2.1: Infection of morulae in vivo results in the generation of EGFP-f
transgenic mice. (A) Morulae after infection with lentivirus at 100 MOI expressing
EGFP-f. The morulaes were visualized under the fluorescence microscope five days after
transduction. (B) Cross section of the mouse skin from pups obtained by the implantation
of morulaes infected with lentivirus.
4.2.2 Lentiviral Mediated Transgenesis by In Vivo Manipulation of Spermatogonial
Stem Cells.
5-10 µl of recombinant EGFP-f expressing lentiviruses (5 x 10⁶ TU/ml) was injected into
the intertubular spaces of the testis of 28 day old Crl:CFW(SW) male mice (Figure 4.2.2
a). Injection into the intertubular space allows the lentivirus to infect undifferentiated
spermatogonial cells located at the basement of the seminiferous tubules (168). These
male mice, referred to as pre-founder mice, were mated with wild type females of the
same strain 35 days post infection. To determine whether the progeny from this cross
carried the transgene, EGFP-f was amplified from genomic DNA isolated from the
progeny. An amplification for the patch gene served as a loading control (Figure 4.2.2 c-
e). Transgenic pups were generated from mating experiments with three independently
derived pre-founder mice at an overall rate greater than 60% (Figure 4.2.2 c-e, Table
4.2.1), a rate that is much higher than previously reported with conventional transgenic
protocols or with retroviral infection of spermatogonial stem cells in vitro or in vivo (169,
253). All mice showed amplification for the patch gene, which served as a loading
control and also demonstrated that the band for EGFP-f was specific. Further, WT mice
did not show any product for the EGFP-f transgene (data not shown). Inbreeding of
transgene positive pups from the mice showed an increased incidence of transgene
positivity in the F1 generation and an even higher incidence in the F2 generat ion (Figure
4.2.2 c). Further, a transgene positive male mouse, 1883, was out bred with a wild type
female mouse of the same strain. Three of the six pups from this cross showed the
presence of the transgene (Figure 4.2.2 c). These results suggest that inheritance of the
transgene is stable and that fertility of the transgenic mice is not compromised.

108
Pre-founder mice
Founder Mice per litter Founder mice per litter positive for
EGFP-f
607 8 1
607 11 9
607 6 4
Total 25 14
Success rate 56%
608 8 5
608 6 4
608 8 4
Total 22 13
Success rate 59%
609 8 4
609 12 10
609 13 7
Total 33 22
Success rate 66%
Grand Total 80 49
Total success rate 61.25%
Table 4.2.1. Percentage of EGFP-f positive pups obtained from individual matings with
three different pre-founder mice. The pre-founder mice were mated with multiple WT
female mice and the frequency of EGFP-f positive pups determined after each mating.
Note that an overall success rate of greater than 60% was obtained in these matings.
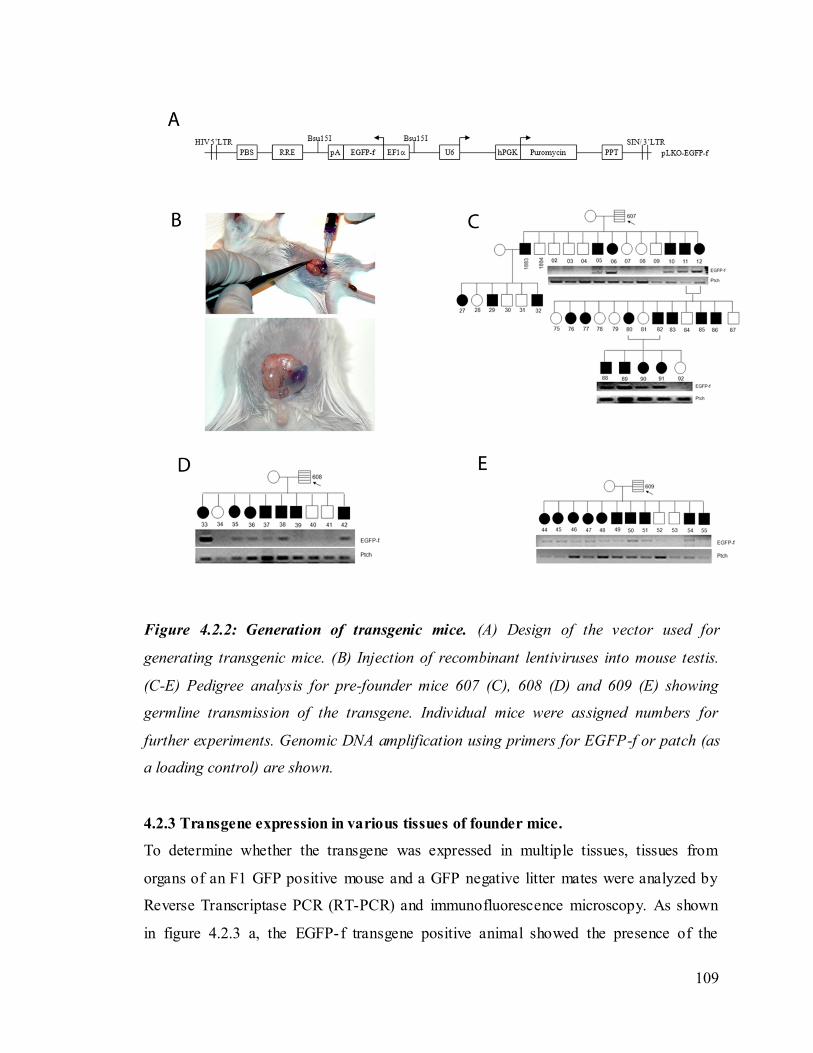
109
Figure 4.2.2: Generation of transgenic mice. (A) Design of the vector used for
generating transgenic mice. (B) Injection of recombinant lentiviruses into mouse testis.
(C-E) Pedigree analysis for pre-founder mice 607 (C), 608 (D) and 609 (E) showing
germline transmission of the transgene. Individual mice were assigned numbers for
further experiments. Genomic DNA amplification using primers for EGFP-f or patch (as
a loading control) are shown.
4.2.3 Transgene expression in various tissues of founder mice.
To determine whether the transgene was expressed in multiple tissues, tissues from
organs of an F1 GFP positive mouse and a GFP negative litter mates were analyzed by
Reverse Transcriptase PCR (RT-PCR) and immunofluorescence microscopy. As shown
in figure 4.2.3 a, the EGFP-f transgene positive animal showed the presence of the
110
EGFP-f message as compared to RNA prepared from tissue sections derived from the
negative litter mate control. A RT-PCR analysis for the housekeeping gene, GAPDH,
served as a loading control. Similarly, immunofluorescence microscopy on tissue sections
from the transgenic mice showed green fluorescence in multiple tissues, when compared
to the control mice (Figure 4.2.3 b). An analysis of hematoxylin and eosin stained
sections of different tissues indicate no change in the morphology of tissue from
transgenic mice as compared to control mice (Figure 4.2.3 c). The mean intensity
fluorescence obtained by three different section of the same tissue of transgenic mice is
much higher when compared to control mice (Figure 4.2.3 d).
To demonstrate that the spermatogonial stem cells had been infected in the pre-founder
mice, the mice were sacrificed after multiple breeding experiments and tissue sections
prepared from the testis of the pre-founder and control mice. The tissue sections were
stained with antibodies to GFP. As shown in (Figure 4.2.3 e), cells in the interstitial
spaces and the spermatogonial stem cells showed staining for GFP in pre- founder but not
in control mice. An immunofluoresence analysis on sections from the epididymis
followed by confocal microscopy demonstrated that mature sperm also stained positively
for GFP in profounder mice, whereas sections from wild type mice did not show any
signal for GFP (Figure 4.2.3 f). The GFP staining mostly localized to the tail region and
was mostly excluded from the head region.

111
Figure 4.2.3: EGFP-f expression in various tissues of founder mice. (A) Multiple
tissue sections from control and transgenic littermates were analyzed for the expression
of EGFP-f mRNA by RT-PCR analysis. Control mice did not show the presence of the
EGFP-f mRNA but transgenic mice showed the expression of the EGFP-f mRNA in
multiple tissues (H=heart, B=brain, L=liver, Lu=lung and S=skin). An RT-PCR was
performed for GAPDH as a loading control. (B) Multiple tissue sections from control and
transgenic littermates were analyzed for the expression of the EGFP-f transgene by
112
confocal microscopy. Original magnification is 630X. Scale bars are shown in the
figures. (C) Hematoxylin and eosin stained sections from wild type or transgenic mice.
Original magnification is 630X. Scale bars are shown in the figures. (D) The mean
fluorescence intensity from control and transgenic sections is on the Y-axis and the
different tissues are represented on the X-axis. The error bars represent the standard
deviation for sections derived from at least three different mice. (E) Testis sections from
control mice or pre-founder mice were stained with antibodies to GFP followed by
immunflourescence analysis and confocal microcospy. The top panel shows the DIC
image of the fluorescence field. Note that the pre-founder mice show high levels of
EGFP-f expression in both cells in the interstitial spaces and in spermatogonial stem
cells (filled arrow) that line the basement membrane of the seminiferous tubules. Original
magnification is 630X and scale bars are indicated in the figures. ST=seminiferous
tubule and IS=interstitial spaces. (F) Epididymis sections from control mice or pre-
founder mice were stained with antibodies to GFP (green) and propidium iodide (red) to
stain DNA, followed by immunflourescence analysis and confocal microcospy. The top
panel shows the DIC image of the fluorescence field and the bottom panel shows the
merged image. Note that the pre-founder mice show high levels of EGFP-f expression in
the sperm tails in the profounder mouse but not in WT mice. Original magnification is
630X and scale bars are indicated in the figures.
4.2.4 Analysis of transgene integration events in the EGFP-f transgenic mice.
The pre-founder mice were able to sire transgenic pups for over a year after infection
with the recombinant lentivirus indicating that the transgene was integrated in the
spermatogonial cells. To demonstrate that expression of the transgene was independent of
the site of integration, integration sites were mapped in founder mice using a variant of a
protocol developed by Schroder et. al. as summarized in figure 4.2.4 a (319). The
integration events to different sites on chromosomes were represented graphically as
described earlier (301). In addition, we have listed the percentage of total integration
events on each chromosome (Figure 4.2.4 b). Most of the integration events were
observed in three different sites on chromosome two. This resulted in the maximum
number of mice having integrants in chromosome two. The sites of integration were

113
sequenced and the distribution among the different chromosomes mapped as shown
(figure 4.2.4 b and table 4.2). These results show that expression of the transgene was
independent of the site of integration. Further, the number of integration events in each
transgenic mouse was determined. It was observed that most mice had either one or two
integration events (Figure 4.2.4 c). The percentage of mice having one, two or three
integration events are also listed (Figure 4.2.4 c). This suggests that at the virus titer used
in these experiments most spermatogonial stem cells develop either one or two
integration events.
Figure 4.2.4. Analysis of integration events in the EGFP-f transgenic mice. (A)
Protocol for the identification of integration sites. (B) Graph showing the frequency of
integration events observed in the transgenic animals. Chromosome number is on the X-
axis and the number of mice showing integration in the respective chromosomes is on the
Y-axis. The number above each bar in the graph indicates the percentage of total
integration events analyzed on each chromosome. (C) Graph showing the number of
integration events in each mouse. No of integration events is on the X-axis and number of
mice on the Y-axis. The number above each bar indicates the percentage of mice with
one, two or three integration events.

114
Chromosome
number
Accession Number Number of mice
showing
integrations
Identity of mice
showing integrations
1 NT_39170.7 3 6 &,12
2 NW_001030712.1
NW_001030694.1
NW_001030686.1
9 11,12,33,35,45 &51
3 NT_039207
NT_162143
2 38
4 NW_001030747 2 49 & 54
6 NW_039353 1 33
8 NT_078575.6 3 11 & 45
13 NT_039578 2 6 & 38
14 NW001030543 2 42 & 37
18 NW_001030631
NW_001030635.1
3 12 & 52
Table 4.2.2 Summary of the integration events observed in the different transgenic
animals. The chromosome number is shown in column one while the number of the
individual mice with an integration in these chromosomes is shown in column 4. The
integration events in each chromosome are shown in the third column of this table with
the appropriate accession number in column 2. As can be seen from the table, multiple
mice show different combinations of integration events suggesting that transgene
expression is independent of integration site. The number of assigned to the mice in this
table is similar to the number reported in figure 3.9.
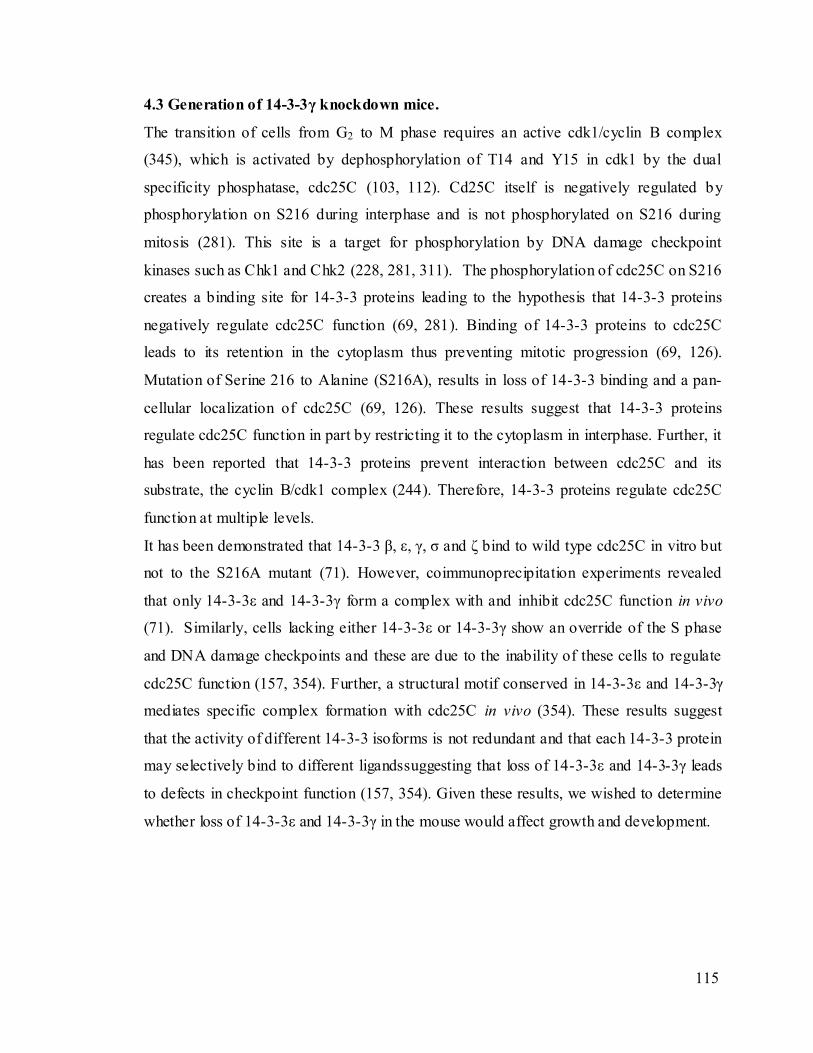
115
4.3 Generation of 14-3-3γ knockdown mice.
The transition of cells from G2 to M phase requires an active cdk1/cyclin B complex
(345), which is activated by dephosphorylation of T14 and Y15 in cdk1 by the dual
specificity phosphatase, cdc25C (103, 112). Cd25C itself is negatively regulated by
phosphorylation on S216 during interphase and is not phosphorylated on S216 during
mitosis (281). This site is a target for phosphorylation by DNA damage checkpoint
kinases such as Chk1 and Chk2 (228, 281, 311). The phosphorylation of cdc25C on S216
creates a binding site for 14-3-3 proteins leading to the hypothesis that 14-3-3 proteins
negatively regulate cdc25C function (69, 281). Binding of 14-3-3 proteins to cdc25C
leads to its retention in the cytoplasm thus preventing mitotic progression (69, 126).
Mutation of Serine 216 to Alanine (S216A), results in loss of 14-3-3 binding and a pan-
cellular localization of cdc25C (69, 126). These results suggest that 14-3-3 proteins
regulate cdc25C function in part by restricting it to the cytoplasm in interphase. Further, it
has been reported that 14-3-3 proteins prevent interaction between cdc25C and its
substrate, the cyclin B/cdk1 complex (244). Therefore, 14-3-3 proteins regulate cdc25C
function at multiple levels.
It has been demonstrated that 14-3-3 β, ε, γ, σ and ζ bind to wild type cdc25C in vitro but
not to the S216A mutant (71). However, coimmunoprecipitation experiments revealed
that only 14-3-3ε and 14-3-3γ form a complex with and inhibit cdc25C function in vivo
(71). Similarly, cells lacking either 14-3-3ε or 14-3-3γ show an override of the S phase
and DNA damage checkpoints and these are due to the inability of these cells to regulate
cdc25C function (157, 354). Further, a structural motif conserved in 14-3-3ε and 14-3-3γ
mediates specific complex formation with cdc25C in vivo (354). These results suggest
that the activity of different 14-3-3 isoforms is not redundant and that each 14-3-3 protein
may selectively bind to different ligandssuggesting that loss of 14-3-3ε and 14-3-3γ leads
to defects in checkpoint function (157, 354). Given these results, we wished to determine
whether loss of 14-3-3ε and 14-3-3γ in the mouse would affect growth and development.

116
4.3.1 To determine whether 14-3-3ε and 14-3-3γ bind to mouse cdc25C in vitro.
To address whether the loss of 14-3-3ε or 14-3-3γ results in mis- localization of cdc25C,
we first determined whether 14-3-3ε and 14-3-3γ formed a complex with mouse cdc25C
by performing GST pull down assays. Protein lysates from three confluent 100mm dishes
of NIH3T3 cells were incubated with GST, GST 14-3-3ε or GST 14-3-3γ bound to
glutathione-Sepharose beads. The reactions were washed with NET-N and the complexes
were resolved on 10% SDS-PAGE gels followed by Western blotting using antibodies to
cdc25C. GST 14-3-3ε or GST 14-3-3γ could not form a detectable complex with mouse
cdc25C (Figure 4.3.1 A). In humans, 14-3-3 proteins bind to cdc25C in vitro and in vivo
upon phosphorylation at a Serine residue at position 216 (refs); however a comparison of
sequences of cdc25C proteins from different species demonstrated that this sequence was
absent in mouse cdc25C but was present in cdc25C from Xenopus laevis (Figure 4.3.1 B).
These results lead us to conclude that 14-3-3 proteins might regulate cell cycle
progression in a cdc25C independent fashion in the mouse.
Figure 4.3.1: 14-3-3γ or 14-3-3ε does not interact with cdc25C. (A) Protein extracts
prepared from NIH3T3 cells were incbubated with GST, GST-14-3-3ε or GST-14-3-3γ on
glutathione Sepharose beads. The reactions were resolved on 10% SDS PAGE gels
followed by Western blot analysis with antibodies against cdc25C. The whole cell extract
(WCE) shows one tenth input. Clustal W based sequence alignment of the cdc25C from
different species showing the residues surrounding position 216 (human cdc25C

117
numbering). Alignment was done using the MegAlign DNA analysis software
(DNASTAR). Note that the Serine at position 216 is not present in mouse cdc25C.
4.3.2 Testing the efficiency of cDNA and shRNA constructs.
A cDNA for the mouse 14-3-3γ gene product was cloned in pCDNA3.0 downstream of
the HA epitope as described in Materials and Methods. The ability of the construct to
express mouse 14-3-3γ was determined by transfection of different amounts of the HA-
tagged mouse 14-3-3γ construct into HCT116 cells. Constructs expressing HA-tagged
mouse 14-3-3-ε transfected in HCT116 cells served as positive control for the HA
antibody, whereas cells transfected with pCDNA 3.0 alone served as negative control for
HA antibody. Maximal expression of the HA-14-3-3-γ was obtained when 1µg of the
construct was transfected into HCT116 cells, as determined by Western blotting with
antibodies to the HA epitope (Figure 4.3.2 A).
To identify a shRNA constructs that could inhibit the expression of 14-3-3γ, three
different shRNA constructs against 14-3-3γ were designed and cloned in pLKO.1 as
described in Materials and Methods. The ability of these constructs to inhibit the
expression of exogenously expressed 14-3-3γ was determined by co-transfection of the
pLKO.1 based shRNA constructs with HA-tagged mouse 14-3-3γ in HCT116 cells. The
levels of HA-mouse 14-3-3γ were determined by Western blotting. No down regulation
of HA-14-3-3γ was observed in the cells transfected with vector control (Figure 4.3.2 B).
The constructs pLKO.1 G1, G2 and G3 could inhibit the expression of HA-14-3-3γ
(Figure 4.3.2 B). Western blots for β-actin were performed to serve as loading controls.
The G3 construct was used to generate 14-3-3γ knockdown mice.
Figure 4.3.2: Testing the 14-3-3γ cDNA and shRNA constructs. (A) 0.5 – 5µg of a
construct expressing mouse HA-14-3-3γ were transfected in HCT116 cells. The cells were

118
lysed 48 hrs post transfection and protein extracts resolved on 10% SDS page gels and
Western blots performed with antibodies to the HA epitope or β-actin. The cells
transfected with HA tagged mouse 14-3-3ε and vector control served as positive and
negative controls respectively. (B) 0.5, 1 or 1.5µg of the vector control (pLKO.1puro) or
shRNA constructs targeting mouse 14-3-3γ were co-transfected with an HA-epitope
tagged mouse 14-3-3γ construct into HCT116 cells The cells were lysed 60 hrs post
transfection to prepare protein extracts, which were resolved on a 10% SDS page gels
and Western blots performed with antibodies against HA (12CA5) and β -actin.
4.3.3 Generation of 14-3-3γ knockdown mice
To generate knockdown mice for 14-3-3γ, lentiviruses that express EGFP-f and the G3
shRNA that targets 14-3-3γ were produced and concentrated as described in Materials
and Methods. The lentiviral particles were injected into the interstitial spaces of the
developing testes to infect spermatogonial stem cells as described (322). The 14-3-3γ
fore-founder mouse (indicated by the hatched box and arrow) was mated with normal
female mice of the same strain (Figure 4.3.3). None of the mice injected with lentiviruses
expressing shRNA’s targeting 14-3-3γ produced pups when mated with wild type female
mice. Even pups that lack the transgene were not produced in these mating experiments
suggesting that male mice injected with the 14-3-3γ knockdown viruses were sterile.
Figure 4.3.3: Generation of 14-3-3γ knockdown mice. The profounder mice (hatched
box) were mated to wild type female of same strain and none of the profounder mice
produced any pups.
To determine if the mouse testes infected with the 14-3-3γ knockdown lentiviral
constructs is integrated in testis, genomic DNA was isolated from the testis of three male
mice injected with viruses encoding the 14-3-3γ shRNA and were then screened for the

119
presence of EGFP-f by performing polymerase chain reactions with EGFP-f specific
primers. Genomic DNA was also isolated from one male mouse testes injected with
viruses encoding the only EGFP-f serving as a positive control and one male mouse testes
not injected with any viruses to serve as negative control for the presence of EGFP-f. It
was observed that all three mice injected with the lentiviral constructs expressing EGFP-f
shRNA targeting 14-3-3γ showed the presence of the EGFP- f transgene, whereas the
negative control did not showed the presence of transgene and the positive control
showed the presence of the EGFP-f transgene (Figure 4.3.4). This result suggested that
the lentiviral cDNA was integrated into the genomic DNA in the testis. In addition, testis
injected with the 14-3-3γ knockdown viruses expressed EGFP- f, whereas testis from wild
type mice did not express EGFP-f as determined by immunofluorescence analysis using
antibodies to GFP (Figure 4.3.5).
Figure 4.3.4: Screening for the lentiviral integration in testis injected with 14-3-3γ
shRNA lentiviral constructs. Genomic DNA was purified from testis sections of the
indicated mice and used as a template for the amplification of EGFP-f or the mouse
patch gene, which served as a loading control.

120
Figure 4.3.5: Expression of EGFP-f in testis injected with 14-3-3γ shRNA lentiviral
constructs. Immunofluorescence analysis was performed on paraffin sections from
control testes or 14-3-3γ knockdown testes using specific antibodies to GFP. Nuclei were
counter-stained with propidium iodide (PI).
To determine if the mice infected with the 14-3-3γ knockdown constructs have reduced
levels of 14-3-3γ in the testis, tissue sections from testis isolated from mice injected with
the vector control, or mice injected with viruses encoding the 14-3-3γ shRNA were
sacrificed and an immunohistochemical analysis using antibodies to 14-3-3γ was
performed. The levels of 14-3-3γ in the mouse testis infected with the 14-3-3γ
knockdown lentiviral constructs are greatly reduced as compared to level of 14-3-3γ in

121
the mouse tested infected with vector control lentiviral constructs (Figure 4.3.6). These
results suggest that 14-3-3γ expression is inhibited upon injection of the testis with the
recombinant lentivirus.
Figure 4.3.6: Expression of 14-3-3γ in testes injected with 14-3-3γ shRNA lentiviral
constructs. Immunohistochemical analysis was performed on paraffin sections from
control testes or 14-3-3γ knockdown testes using antibodies to 14-3-3γ, the nucleus was
counterstained with hematoxylin. Note that section from 14-3-3γ knockdown testes shows
the reduced levels of 14-3-3γ as compared to control testes.
4.3.4 Defects in 14-3-3γ knockdown testis.
The mouse testes consist of seminiferous tubules that are responsible for the production
of spermatozoa. These tubules are lined by the tunica propria attached to which are germ
cells that are capable of developing into spermatids by a process called spermatogenesis
(58). In addition to the developing spermatocytes and spermatids, the semeniferous
tubule also contains sertoli cells that form the blood testes barrier (BTB) and provide
support to the developing spermatocyte. During spermatogenesis, the germ cells go
through different stages of development (64). The ordered sequence of events is called
the spermatogenic cycle. In mice, one complete spermatogenic cycle consists of twelve
stages (266, 267). Different portions of the seminiferous tubule are at different stages in
the spermatogenic cycle (266). The spermatogenic cycle begins with the differentiation of
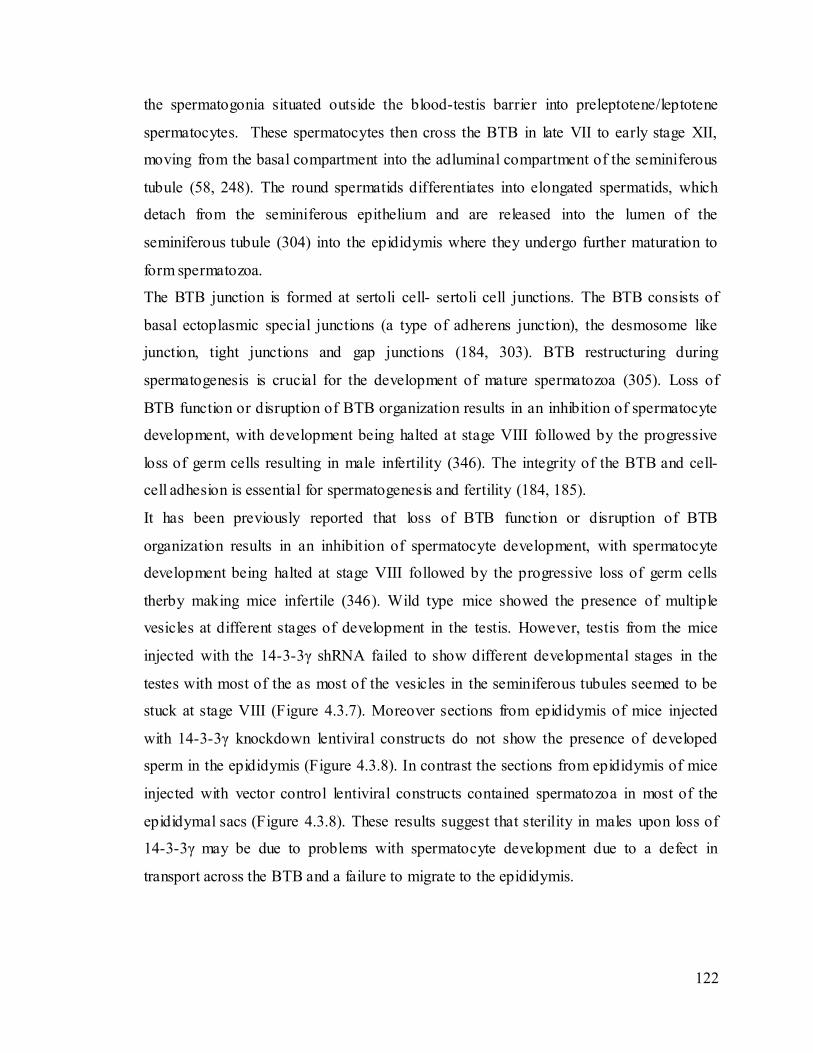
122
the spermatogonia situated outside the blood-testis barrier into preleptotene/leptotene
spermatocytes. These spermatocytes then cross the BTB in late VII to early stage XII,
moving from the basal compartment into the adluminal compartment of the seminiferous
tubule (58, 248). The round spermatids differentiates into elongated spermatids, which
detach from the seminiferous epithelium and are released into the lumen of the
seminiferous tubule (304) into the epididymis where they undergo further maturation to
form spermatozoa.
The BTB junction is formed at sertoli cell- sertoli cell junctions. The BTB consists of
basal ectoplasmic special junctions (a type of adherens junction), the desmosome like
junction, tight junctions and gap junctions (184, 303). BTB restructuring during
spermatogenesis is crucial for the development of mature spermatozoa (305). Loss of
BTB function or disruption of BTB organization results in an inhibition of spermatocyte
development, with development being halted at stage VIII followed by the progressive
loss of germ cells resulting in male infertility (346). The integrity of the BTB and cell-
cell adhesion is essential for spermatogenesis and fertility (184, 185).
It has been previously reported that loss of BTB function or disruption of BTB
organization results in an inhibition of spermatocyte development, with spermatocyte
development being halted at stage VIII followed by the progressive loss of germ cells
therby making mice infertile (346). Wild type mice showed the presence of multiple
vesicles at different stages of development in the testis. However, testis from the mice
injected with the 14-3-3γ shRNA failed to show different developmental stages in the
testes with most of the as most of the vesicles in the seminiferous tubules seemed to be
stuck at stage VIII (Figure 4.3.7). Moreover sections from epididymis of mice injected
with 14-3-3γ knockdown lentiviral constructs do not show the presence of developed
sperm in the epididymis (Figure 4.3.8). In contrast the sections from epididymis of mice
injected with vector control lentiviral constructs contained spermatozoa in most of the
epididymal sacs (Figure 4.3.8). These results suggest that sterility in males upon loss of
14-3-3γ may be due to problems with spermatocyte development due to a defect in
transport across the BTB and a failure to migrate to the epididymis.
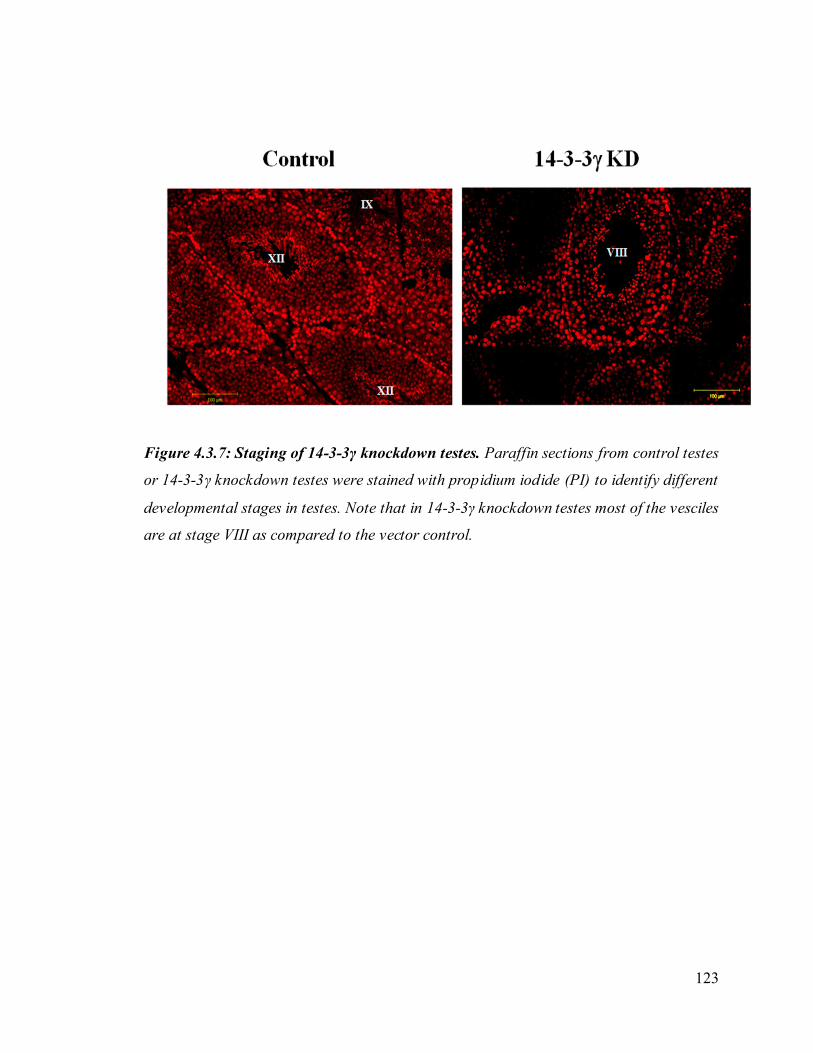
123
Figure 4.3.7: Staging of 14-3-3γ knockdown testes. Paraffin sections from control testes
or 14-3-3γ knockdown testes were stained with propidium iodide (PI) to identify different
developmental stages in testes. Note that in 14-3-3γ knockdown testes most of the vesciles
are at stage VIII as compared to the vector control.

124
Figure 4.3.8: 14-3-3γ knockdown leads a defect in sperm migration to the epididymis.
(A) Epididymis sections from mice injected with viruses encoding the vector control or a
shRNA targeting 14-3-3γ were stained with hematoxylin and eosin. The sacs of the
epididymis in the 14-3-3γ knockdown mice show no sperm while the sacs of the
epididymis in WT mice show the presence of mature sperm. (B) A graphical
representation of the differences in the amount of sperm in epididymis and testes of the
WT and 14-3-3γ knockdown virus injected animals is shown. The number of vesicles

125
containing spermatozoa is on the Y-axis. An average count and standard deviation for
three different mice is shown. Student’ T test was performed.
Apart from the problems in development or maturation adhesion defects were also
observed between sertoli cells and developing spermatocytes upon inhibition of 14-3-3γ
expression in the testis (Figure 4.3.9 A and B). It was also observed that the adhesion of
sertoli cells to the basal lamina is reduced upon loss of 14-3-3γ. To determine whether the
intracellular junctions between sertoli cells are disrupted in 14-3-3γ knockdown mice, the
wild type and 14-3-3γ knockdown testis was sectioned, fixed using 3% glutaraldehyde
and 1% osmium tetraoxide and contrasted with alcoholic uranyl acetate and lead citrate
on grids. The ultrastructure of cell-cell junctions in the testis was studied using electron
microscopy. It was observed that the testis sections from vector control mice display
intact cell- cell junctions and the cells are closely packed, whereas the testis section from
14-3-3γ knockdown mice do not have intact cellular junctions and the cells are loosely
packed (Figure 4.3.10). These results suggest that loss of 14-3-3γ in mice testis leads to
reduced intercellular adhesion between sertoli cells and between sertoli cells and
spermatocytes leading to defects in development and sterility.
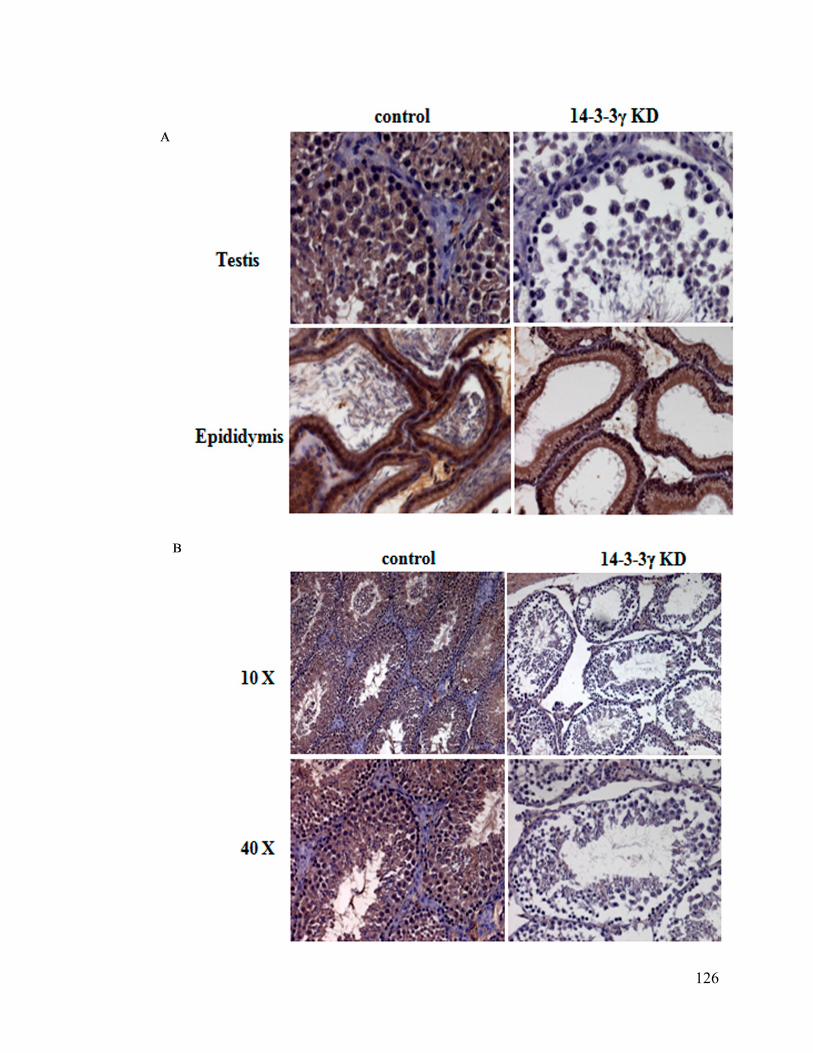
126

127
Figure 4.3.9: 14-3-3γ knockdown leads to defects in testes development. (A&B) Testis
sections from mice injected with viruses encoding the vector control or a shRNA
targeting 14-3-3γ were stained with antibodies to 14-3-3γ. Please note that the staining
for 14-3-3γ is specific as 14-3-3γ expression is not observed in the interstitial space. Note
that the levels of 14-3-3γ are not altered in the epididymis of upon injection with either
vector control virus or 14-3-3γ knockdown virus. There is a decrease in 14 -3-3γ
expression in the testes injected with viruses encoding the 14-3-3γ shRNA. In addition,
cell-cell adhesion is altered in the semeniferous tubules that accompany the 14-3-3γ
knockdown.
Figure 4.3.10: Ultra structure of 14-3-3γ knockdown testes. Electron micrograph of
testes sections from mice injected with viruses encoding the vector control or a shRNA
targeting 14-3-3γ. Note that the cell-cell adhesion is severely impaired in 14-3-3γ
knockdown testes. The intracellular junctions are shown by white arrows. Note the intact
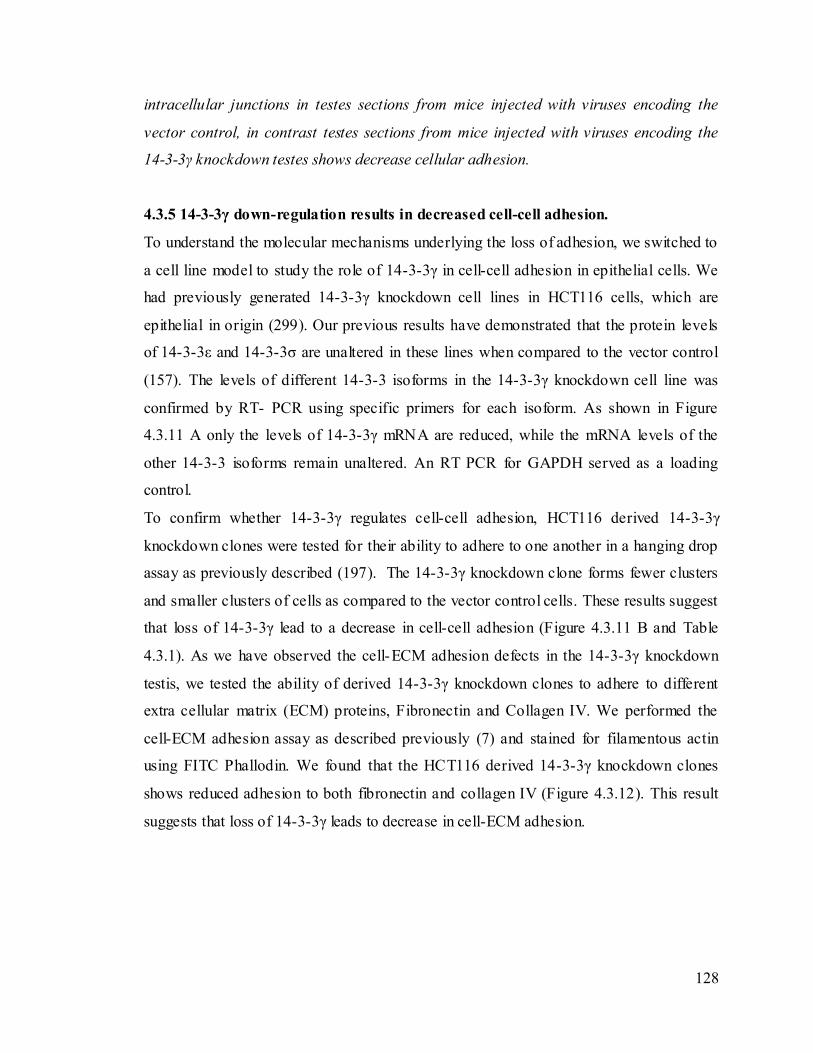
128
intracellular junctions in testes sections from mice injected with viruses encoding the
vector control, in contrast testes sections from mice injected with viruses encoding the
14-3-3γ knockdown testes shows decrease cellular adhesion.
4.3.5 14-3-3γ down-regulation results in decreased cell-cell adhesion.
To understand the molecular mechanisms underlying the loss of adhesion, we switched to
a cell line model to study the role of 14-3-3γ in cell-cell adhesion in epithelial cells. We
had previously generated 14-3-3γ knockdown cell lines in HCT116 cells, which are
epithelial in origin (299). Our previous results have demonstrated that the protein levels
of 14-3-3ε and 14-3-3σ are unaltered in these lines when compared to the vector control
(157). The levels of different 14-3-3 isoforms in the 14-3-3γ knockdown cell line was
confirmed by RT- PCR using specific primers for each isoform. As shown in Figure
4.3.11 A only the levels of 14-3-3γ mRNA are reduced, while the mRNA levels of the
other 14-3-3 isoforms remain unaltered. An RT PCR for GAPDH served as a loading
control.
To confirm whether 14-3-3γ regulates cell-cell adhesion, HCT116 derived 14-3-3γ
knockdown clones were tested for their ability to adhere to one another in a hanging drop
assay as previously described (197). The 14-3-3γ knockdown clone forms fewer clusters
and smaller clusters of cells as compared to the vector control cells. These results suggest
that loss of 14-3-3γ lead to a decrease in cell-cell adhesion (Figure 4.3.11 B and Table
4.3.1). As we have observed the cell-ECM adhesion defects in the 14-3-3γ knockdown
testis, we tested the ability of derived 14-3-3γ knockdown clones to adhere to different
extra cellular matrix (ECM) proteins, Fibronectin and Collagen IV. We performed the
cell-ECM adhesion assay as described previously (7) and stained for filamentous actin
using FITC Phallodin. We found that the HCT116 derived 14-3-3γ knockdown clones
shows reduced adhesion to both fibronectin and collagen IV (Figure 4.3.12). This result
suggests that loss of 14-3-3γ leads to decrease in cell-ECM adhesion.
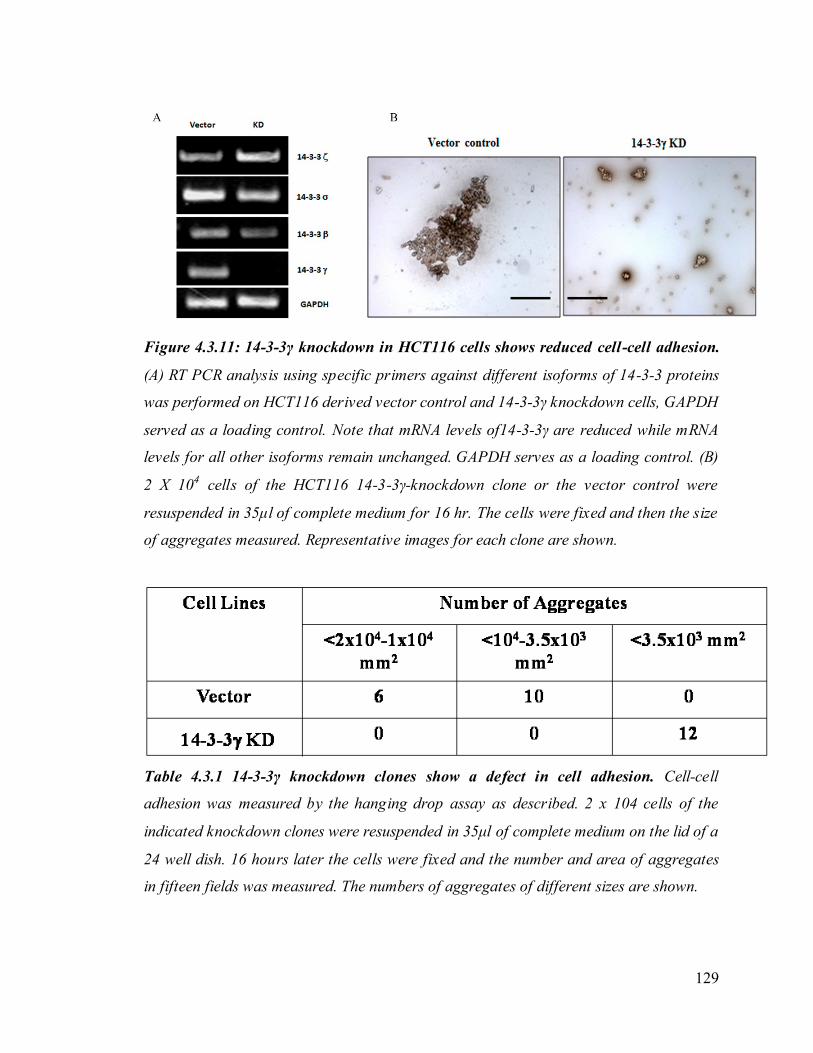
129
Figure 4.3.11: 14-3-3γ knockdown in HCT116 cells shows reduced cell-cell adhesion.
(A) RT PCR analysis using specific primers against different isoforms of 14-3-3 proteins
was performed on HCT116 derived vector control and 14-3-3γ knockdown cells, GAPDH
served as a loading control. Note that mRNA levels of14-3-3γ are reduced while mRNA
levels for all other isoforms remain unchanged. GAPDH serves as a loading control. (B)
2 X 10⁴ cells of the HCT116 14-3-3γ-knockdown clone or the vector control were
resuspended in 35μl of complete medium for 16 hr. The cells were fixed and then the size
of aggregates measured. Representative images for each clone are shown.
Table 4.3.1 14-3-3γ knockdown clones show a defect in cell adhesion. Cell-cell
adhesion was measured by the hanging drop assay as described. 2 x 10⁴ cells of the
indicated knockdown clones were resuspended in 35μl of complete medium on the lid of a
24 well dish. 16 hours later the cells were fixed and the number and area of aggregates
in fifteen fields was measured. The numbers of aggregates of different sizes are shown.

130
Figure 4.3.12: 14-3-3γ knockdown in HCT116 cells shows reduced cell-ECM adhesion.
2 X 10³ cells of the HCT116 14-3-3γ-knockdown clone or the vector control were plated
on ECM protein coated plate for 45min followed by staining using FITC Phallodin.
Representative images for each clone are shown.
4.3.6 Desmosomes
Desmosomes are adherens like junctions present in epithelial tissues (62, 109, 110, 127,
316) . Ultrastructurally desmosomes appear as electron dense structures comprised of the
intercellular region and the desmosomal plaque. The intercellular region is bisected by an
electron dense region which is made up of the extracellular domains of the cadherin super
gene family (77). On the cytoplasmic face of the plasma membrane, the desmosomal
plaque consists of a very dense outer dense plaque (ODP) and a less dense inner plaque
which are separated by a region of low electron density. Desmosomes are composed of
proteins from three gene super families namely, the cadherins, the armadillo family of
proteins and the plakins. The extracellular domains of the cadherins (desmocollins and
desmogleins) on adjacent cells dimerize in a calcium dependent manner in the

131
intercellular space (12, 110, 115, 181). The cytoplasmic tails of the desmosomal
cadherins in turn interact with the armadillo (ARM) family proteins like the plakophilins
and plakoglobin (10, 145, 317, 385). These in turn associate with the members of the
plakin family (desmoplakin), which anchor intermediate filaments to the desmosomal
plaque (144).
4.3.7 Cell border localization of desmosomal components is significantly reduced
upon 14-3-3γ down regulation.
To determine the reasons for the decrease in cell-cell adhesion upon loss of 14-3-3γ, the
vector control and 14-3-3γ knockdown cells were stained with antibodies against several
proteins that are present in either desmosomes, adherens junctions, gap junctions and in
polarity complexes as all of these regulate cell-cell adhesion in epithelial tissues and have
been shown to be required for cell-cell adhesion in the testis (10, 19, 109, 115, 209). As
shown in figure 4.3.13 A, the levels of the desmosomal plaque proteins plakoglobin (PG)
plakophilin3 (PKP3) and plakophilin 2 (PKP2) are lower at the cell border in the
knockdown clone as compared to the vector control. Similarly, the levels of the
desmosomal cadherins, desmocollins 2 and 3 (Dsc 2/3) and desmoglein 2 (Dsg2) and the
plakin family member desmoplakin (DP) are also decreased at the border in the
knockdown clone as compared to the vector control (Figure 4.3.13 B) The cell border
staining was quantitated as previously described (122) and the reduction in cell border
staining for the different desmosomal components was statistically significant (Figure
4.3.13 C). The reduced cell border intensity is not due to a decrease in the levels of these
proteins in the knockdown clones as demonstrated by a Western blot analysis (Figure
4.3.14). These results are in agreement with our previously published data which
demonstrated that PG is required for desmosome formation and that a decrease in levels
for this protein leads to PKP3 accumulating in the cytoplasm, which is accompanied by
adepletion of other desmosomal proteins from the cell border (122). In contrast, E-
cadherin, P-cadherin, ZO-1 , Par3 and β-catenin levels at the cell border were unaltered in
the 14-3-3γ knockdown clones (Figure 4.3.15 A and B), suggesting that loss of 14-3-3γ
specifically affects desmosome assembly and does not affect adherens junc tion or tight
junction formation or the formation of polarity complexes. To confirm whether the

132
defects observed in the 14-3-3γ knockdown testis is due to loss of desmosomal proteins at
the cell border, we stained the tissue section from testes of vector control or 14-3-3γ
knockdown mice. We found that PKP3 is not present at the border in the 14-3-3γ
knockdown testis (Figure 4.3.16), suggesting that loss of 14-3-3γ might play a role in the
assembly of desmosome like junctions in the testis and probably in other tissues. The
staining of tissue sections with antibodies to the other junctional components is
underway.
As desmosomes anchor intermediate filaments, we stained the vector control and
knockdown clones with antibodies to Keratin8 (K8) and Keratin18 (K18). No change in
the expression levels and ability to form keratin filaments was observed in the 14-3-3γ
knockdown clone as compared to vector control (Figure 4.3.17). This result suggests that
14-3-3γ loss does not alter expression and filament formation by K8 and K18.

133
Figure 4.3.13: 14-3-3γ loss leads to depletion of multiple desmosomal proteins at the
cell border. (A) HCT116 derived vector control or 14-3-3γ knockdown clones were fixed
and immuno stained with the indicated antibodies (DSC2/3, DSG2, and PG). Original
magnification x 630 with 4X optical zoom. (B) HCT116 derived vector control or 14-3-3γ
knockdown clones were fixed and immuno stained with the indicated antibodies (DP,
PKP2, and PKP3). Original magnification x 630 with 2X optical zoom. Note that cell
border recruitment of PG and PKP3 is reduced and the intracellular level of PG and
PKP3 is increased in 14-3-3γ knockdown clones as compared to vector control cells. (C)
The mean fluorescence intensities at the cell borders were measured for 24 cells in 3
independent experiments for each immunofluorescence analysis. p values indicated were
obtained using a student’s t-test.
Figure 4.3.14: Expression levels of adhesion proteins are not altered upon 14-3-3γ
down-regulation. Protein extracts from the HCT116 derived vector control or 14-3-3γ
knockdown clones were resolved on a 7.5% SDS PAGE gel and Western blots performed
with antibodies to the indicated proteins. Please note that the levels of adhesion proteins
are not altered upon loss of 14-3-3γ.
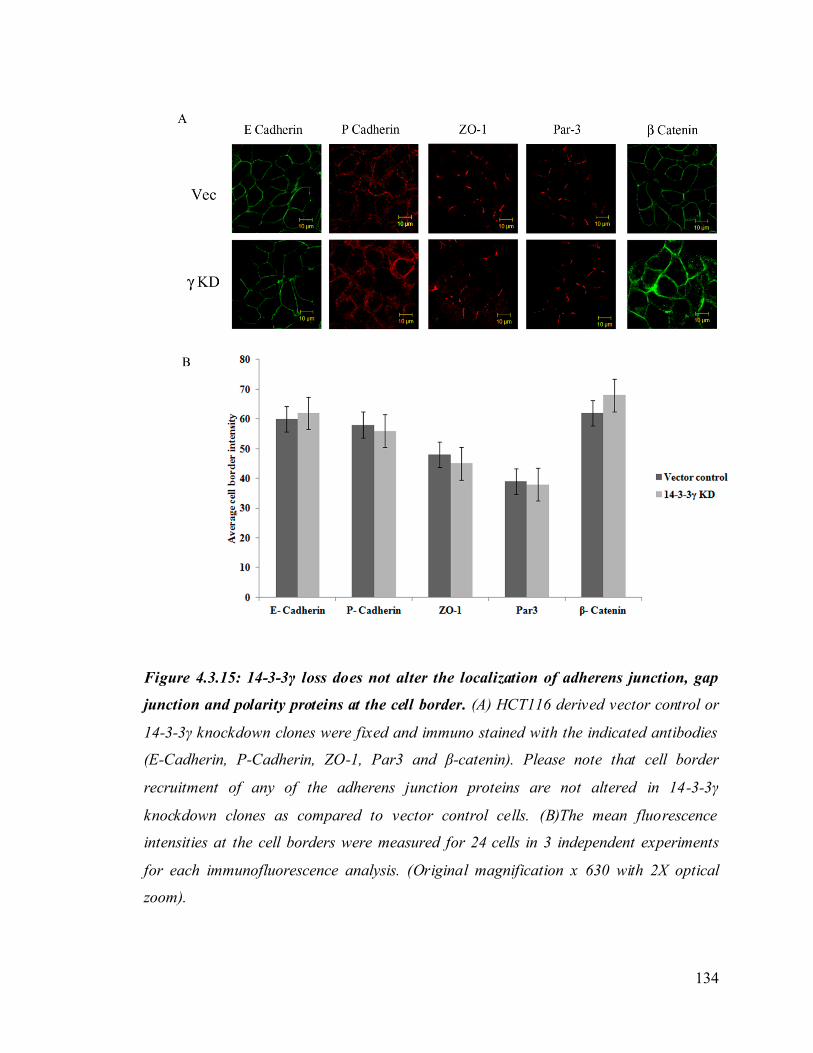
134
Figure 4.3.15: 14-3-3γ loss does not alter the localization of adherens junction, gap
junction and polarity proteins at the cell border. (A) HCT116 derived vector control or
14-3-3γ knockdown clones were fixed and immuno stained with the indicated antibodies
(E-Cadherin, P-Cadherin, ZO-1, Par3 and β-catenin). Please note that cell border
recruitment of any of the adherens junction proteins are not altered in 14-3-3γ
knockdown clones as compared to vector control cells. (B)The mean fluorescence
intensities at the cell borders were measured for 24 cells in 3 independent experiments
for each immunofluorescence analysis. (Original magnification x 630 with 2X optical
zoom).
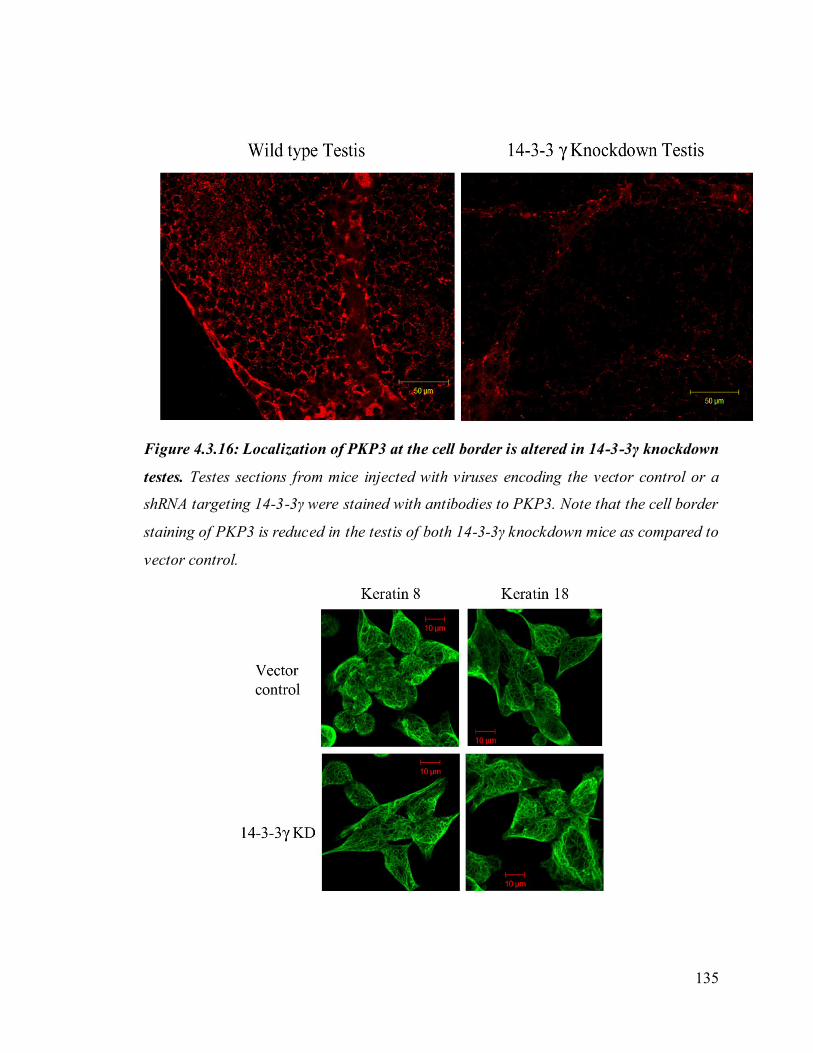
135
Figure 4.3.16: Localization of PKP3 at the cell border is altered in 14-3-3γ knockdown
testes. Testes sections from mice injected with viruses encoding the vector control or a
shRNA targeting 14-3-3γ were stained with antibodies to PKP3. Note that the cell border
staining of PKP3 is reduced in the testis of both 14-3-3γ knockdown mice as compared to
vector control.

136
Figure 4.3.17: 14-3-3γ loss loss does not lead to alteration in the localization of keratin
8 and keratin 18. HCT116 derived vector control or 14-3-3γ knockdown clones were
fixed and immuno stained with the indicated antibodies (Keratin 8 and Keratin 18).
Please note that localization of both Keratin 8 and Keratin 18 are not altered in 14-3-3γ
knockdown clones as compared to vector control cells. . (Original magnification x 630
with 2X optical zoom).
4.3.8 Reintroduction of shRNA resistant 14-3-3γ in 14-3-3γ knockdown clones
rescues the defects in the localization of desmosomal proteins.
To ensure that the defects in the localization of the desmosomal proteins observed were
not due to off target effects of the shRNA constructs, rescue experiments were performed
with a shRNA resistant version of 14-3-3γ, 14-3-3γ-R. HCT116 derived 14-3-3γ
knockdown clones were transfected with either GFP or GFP 14-3-3γ-R mutant
constructs. These cells were then stained using antibodies to PG. As shown in fig 4.3.18,
expression of GFP 14-3-3γ-R in the HCT116 derived 14-3-3γ knockdown clones resulted
in a re- localization of PG to cell border, a result that was not observed in cells transfected
with GFP alone (Figure 4.3.18). These results suggest that the defects in the localization
of desmosomal proteins are specifically due to the loss of 14-3-3γ.
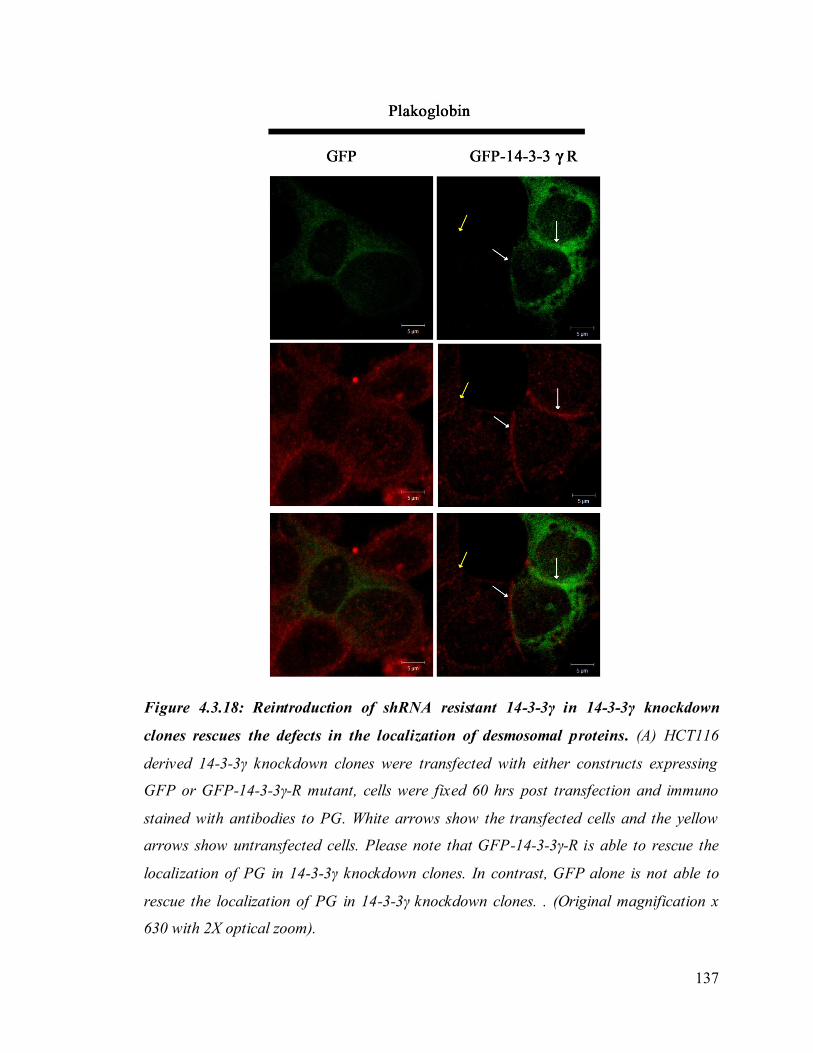
137
Figure 4.3.18: Reintroduction of shRNA resistant 14-3-3γ in 14-3-3γ knockdown
clones rescues the defects in the localization of desmosomal proteins. (A) HCT116
derived 14-3-3γ knockdown clones were transfected with either constructs expressing
GFP or GFP-14-3-3γ-R mutant, cells were fixed 60 hrs post transfection and immuno
stained with antibodies to PG. White arrows show the transfected cells and the yellow
arrows show untransfected cells. Please note that GFP-14-3-3γ-R is able to rescue the
localization of PG in 14-3-3γ knockdown clones. In contrast, GFP alone is not able to
rescue the localization of PG in 14-3-3γ knockdown clones. . (Original magnification x
630 with 2X optical zoom).
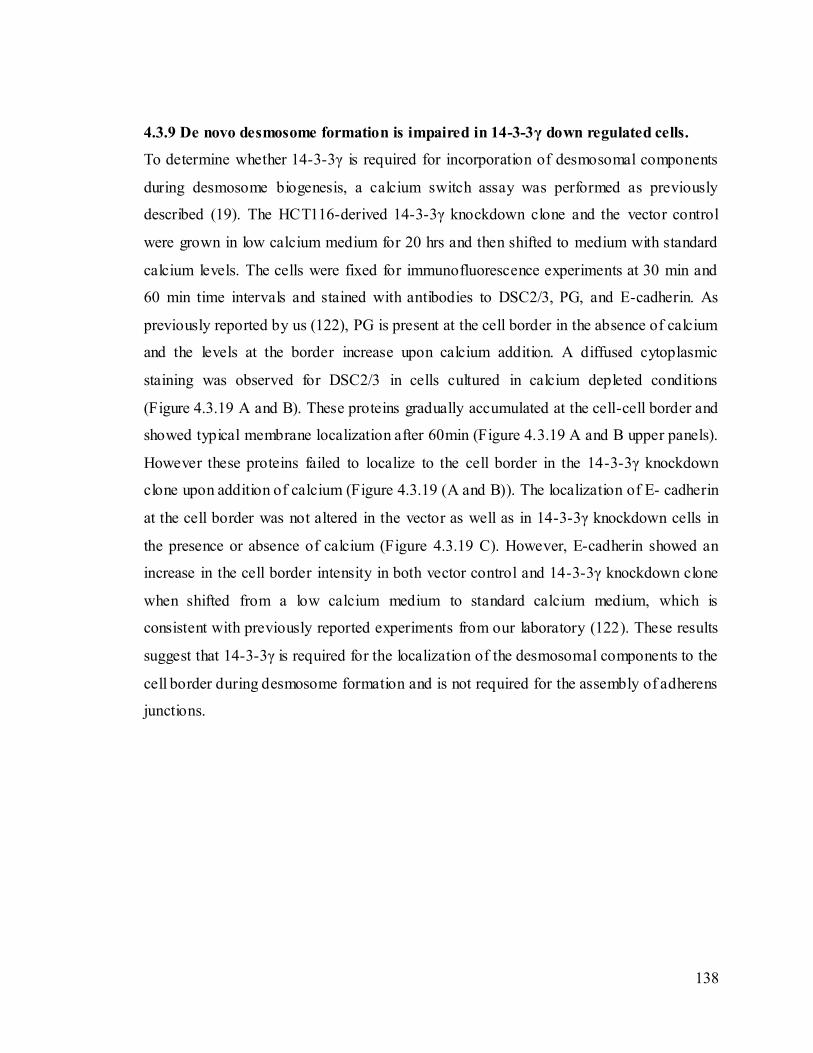
138
4.3.9 De novo desmosome formation is impaired in 14-3-3γ down regulated cells.
To determine whether 14-3-3γ is required for incorporation of desmosomal components
during desmosome biogenesis, a calcium switch assay was performed as previously
described (19). The HCT116-derived 14-3-3γ knockdown clone and the vector control
were grown in low calcium medium for 20 hrs and then shifted to medium with standard
calcium levels. The cells were fixed for immunofluorescence experiments at 30 min and
60 min time intervals and stained with antibodies to DSC2/3, PG, and E-cadherin. As
previously reported by us (122), PG is present at the cell border in the absence of calcium
and the levels at the border increase upon calcium addition. A diffused cytoplasmic
staining was observed for DSC2/3 in cells cultured in calcium depleted conditions
(Figure 4.3.19 A and B). These proteins gradually accumulated at the cell-cell border and
showed typical membrane localization after 60min (Figure 4.3.19 A and B upper panels).
However these proteins failed to localize to the cell border in the 14-3-3γ knockdown
clone upon addition of calcium (Figure 4.3.19 (A and B)). The localization of E- cadherin
at the cell border was not altered in the vector as well as in 14-3-3γ knockdown cells in
the presence or absence of calcium (Figure 4.3.19 C). However, E-cadherin showed an
increase in the cell border intensity in both vector control and 14-3-3γ knockdown clone
when shifted from a low calcium medium to standard calcium medium, which is
consistent with previously reported experiments from our laboratory (122). These results
suggest that 14-3-3γ is required for the localization of the desmosomal components to the
cell border during desmosome formation and is not required for the assembly of adherens
junctions.
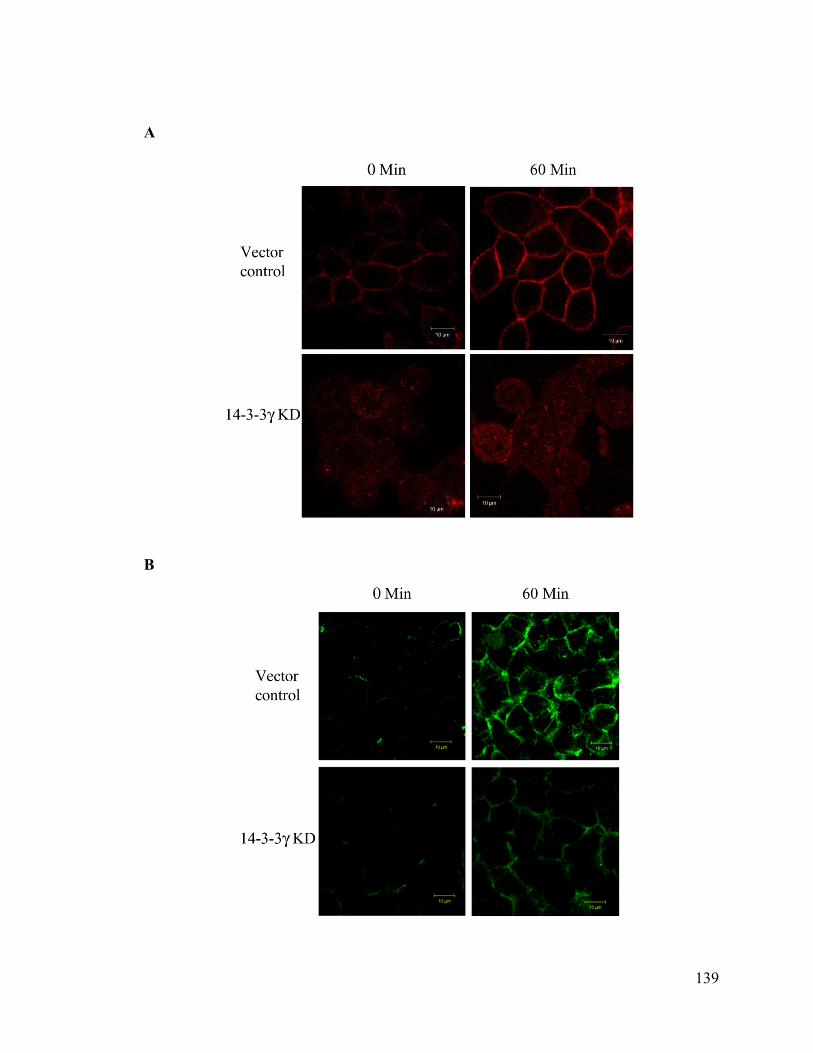
139
A
B
140
C
Figure 4.3.19: 14-3-3γ is required to initiate desmosome formation. (A) HCT116
derived vector control and 14-3-3γ knockdown cells were incubated in low calcium
medium for 16-18 hours. Cells were washed and fed with normal medium with optimum
calcium concentration, fixed and immunostained at different time intervals of 0 and 60
minutes. Immuno staining was performed with the indicated antibodies (A) PG, (B)
DSC2/3 and (C) E-cadherin. Scale bars are indicated on the figures. Arrows indicate cell
border localization. (Original magnification x 630 with 2X optical zoom).
4.3.10 14-3-3γ interacts with plakoglobin and the kinesin 1 motor protein, KIF5B.
To understand how 14-3-3γ regulates the localization of desmosomal proteins to the cell
border, a GST pulldown assay was performed to identify adhesion proteins which interact
with 14-3-3γ. Protein lysates from three confluent 100mm dishes of HCT116 cells were
incubated with GST or GST 14-3-3γ bound to glutathione-Sepharose beads. The
reactions were washed with NET-N and the complexes resolved on 10% SDS-PAGE
gels followed by Western blotting using antibodies to PG. GST-14-3-3γ formed a
complex with PG in contrast to the negative control (Figure 4.3.20 A). Previous results
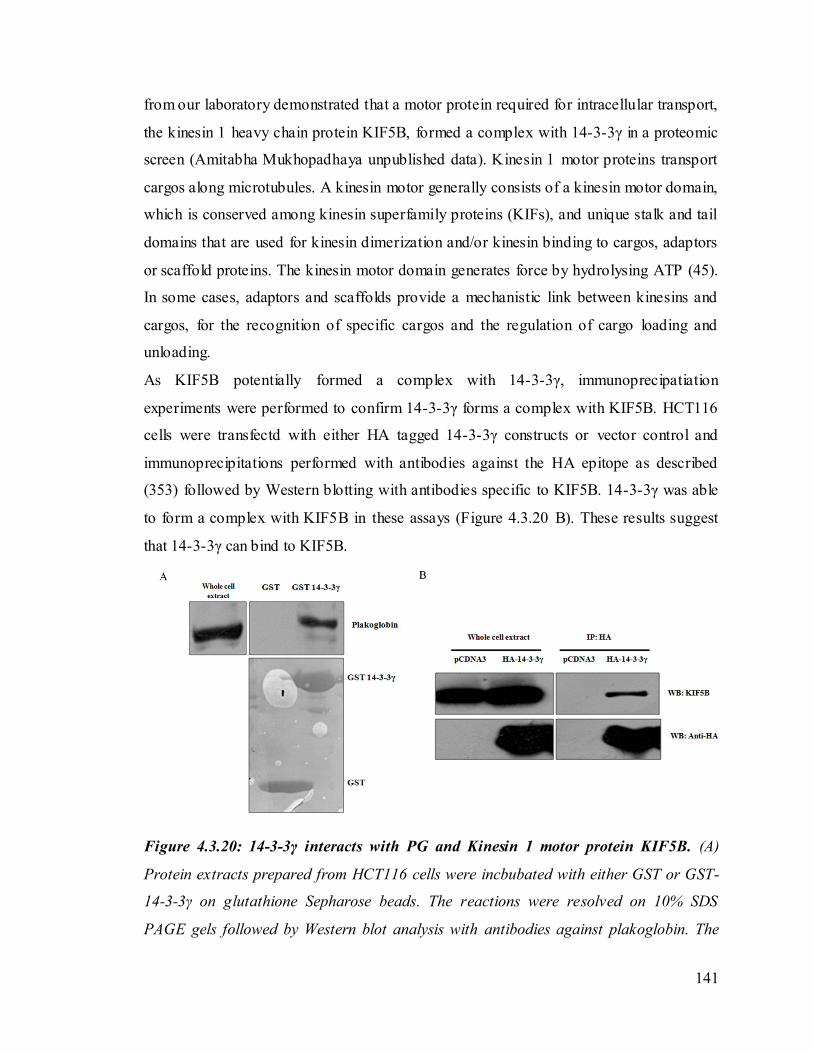
141
from our laboratory demonstrated that a motor protein required for intracellular transport,
the kinesin 1 heavy chain protein KIF5B, formed a complex with 14-3-3γ in a proteomic
screen (Amitabha Mukhopadhaya unpublished data). Kinesin 1 motor proteins transport
cargos along microtubules. A kinesin motor generally consists of a kinesin motor domain,
which is conserved among kinesin superfamily proteins (KIFs), and unique stalk and tail
domains that are used for kinesin dimerization and/or kinesin binding to cargos, adaptors
or scaffold proteins. The kinesin motor domain generates force by hydrolysing ATP (45).
In some cases, adaptors and scaffolds provide a mechanistic link between kinesins and
cargos, for the recognition of specific cargos and the regulation of cargo loading and
unloading.
As KIF5B potentially formed a complex with 14-3-3γ, immunoprecipatiation
experiments were performed to confirm 14-3-3γ forms a complex with KIF5B. HCT116
cells were transfectd with either HA tagged 14-3-3γ constructs or vector control and
immunoprecipitations performed with antibodies against the HA epitope as described
(353) followed by Western blotting with antibodies specific to KIF5B. 14-3-3γ was able
to form a complex with KIF5B in these assays (Figure 4.3.20 B). These results suggest
that 14-3-3γ can bind to KIF5B.
Figure 4.3.20: 14-3-3γ interacts with PG and Kinesin 1 motor protein KIF5B. (A)
Protein extracts prepared from HCT116 cells were incbubated with either GST or GST-
14-3-3γ on glutathione Sepharose beads. The reactions were resolved on 10% SDS
PAGE gels followed by Western blot analysis with antibodies against plakoglobin. The

142
whole cell extract (WCE) shows one tenth input. (B) HCT116 cells were transfected with
HA tagged 14-3-3γ or the vector (pCDNA3). Protein extracts were prepared 48 hours
post transfection and immunoprecipitations (IP) performed with antibodies to the HA
epitope. The total extracts (WCE) and IP’s were resolved on SDS -PAGE gels followed by
Western blotting with antibodies to HA and KIF5B.
4.3.11 PG recruitment to cell border is microtubule dependent.
As 14-3-3γ can interact with both plakoglobin and KIF5B we hypothesized that PG is
recruited to the cell border byKIF5B in a microtubule dependent manner and 14-3-3γ is
required to load PG onto KIF5B. To test this hypothesis we first asked whether PG
recruitment to cell border is microtubule dependent both in the presence or absence of
calcium as previous results from the laboratory have demonstrated that PG is present at
cell border in HCT116 cells both in presence or absence of calcium. To test this
hypothesis, HCT116 cells were cultured in low calcium medium in presence or absence
of nocodazole which induces microtubule depolymerization for 2 hours. An
immunoflouresence analysis was performed using specific antibodies to PG and α-
tubulin. As shown in figure 4.3.21 (A and B) the cell border recruitment of PG is
compromised in the cells treated with nocodazole and the decrease in the cell border
recruitment of PG is statistically significant (Figure 4.3.21 B). The nocodazole used in
the experiment was sufficient to depolymerize microtubules as can be seen by the
absence of microtubules (Figure 4.3.21 A and C). These results suggest that PG
recruitment to the cell border is microtubule dependent. We also stained the HCT116
derived vector control 14-3-3γ knockdown cells with antibodies to KIF5B and α-tubulin.
We found that there is no difference in either the expression or localization of KIF5B or
α-tubulin in HCT116 derived vector control and 14-3-3γ knockdown clones (Figure
4.3.22). We found that in both vector control and 14-3-3γ knockdown clones KIF5B
decorates the α-tubulin filaments.
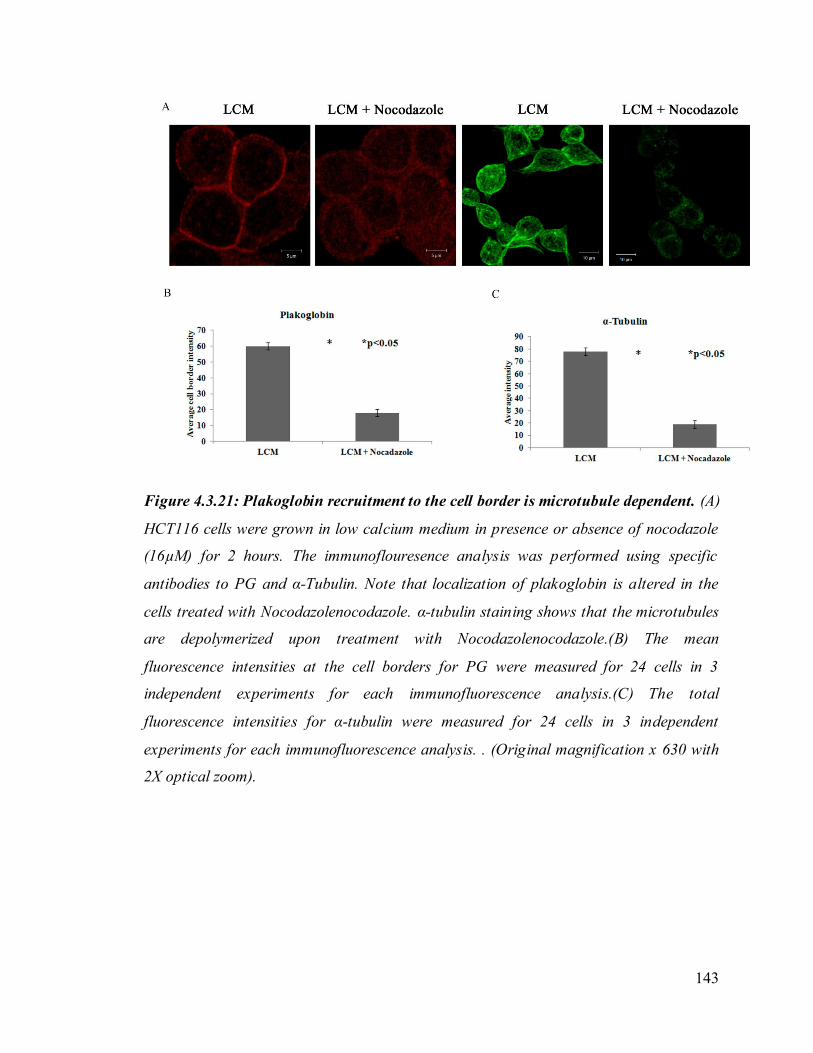
143
Figure 4.3.21: Plakoglobin recruitment to the cell border is microtubule dependent. (A)
HCT116 cells were grown in low calcium medium in presence or absence of nocodazole
(16µM) for 2 hours. The immunoflouresence analysis was performed using specific
antibodies to PG and α-Tubulin. Note that localization of plakoglobin is altered in the
cells treated with Nocodazolenocodazole. α-tubulin staining shows that the microtubules
are depolymerized upon treatment with Nocodazolenocodazole.(B) The mean
fluorescence intensities at the cell borders for PG were measured for 24 cells in 3
independent experiments for each immunofluorescence analysis.(C) The total
fluorescence intensities for α-tubulin were measured for 24 cells in 3 independent
experiments for each immunofluorescence analysis. . (Original magnification x 630 with
2X optical zoom).

144
Figure 4.3.22: 14-3-3γ loss does not alter the localization of KIF5B to to microtubules.
HCT116 derived vector control or 14-3-3γ knockdown clones were fixed and immuno
stained with the indicated antibodies (KIF5B and α-tubulin). Please note in the zoom
images that KIF5B localizes to microtubules in both cell types (Original magnification x
630 with 2X optical zoom).
4.3.12 DSC2/3 recruitment to cell border is microtubule dependent.
Recently a report has shown that the desmosomal cadherins are recruited to the cell
border in a microtubule dependent manner (260). The cell line used in the above
experiment was SCC9 cells which is cells of stratified squamous epithelia (298) and is
different from the HCT116 cells which are derived from simple epithelia (299). So we
asked whether desmocollin 2/3 (DSC2/3) recruitment to cell border during desmosome
biogenesis is dependent on microtubule based processes in HCT116 cells. A calcium
switch assay was performed as previously described (19) in the presence or absence of
nocodazole. The HCT116 cells were grown in low calcium medium for 20 hrs and then
shifted to medium with standard calcium levels in presence or absence of nocodazole.
The cells were fixed for immunofluorescence experiment at 30 min and 60 min time
intervals and stained with antibodies to DSC2/3 and α-tubulin. A diffused cytoplasmic
staining was observed for DSC2/3 in the cells cultured in low calcium medium (Figure

145
4.3.23 (A and B)). These proteins gradually accumulated at the cell-cell border at 60 min
for HCT116 cells treated with DMSO and showed typica l membrane localization.
However at 60 min DSC2/3 protein failed to localize to the cell border in the HCT116
cells treated with nocodazole upon addition of calcium. As shown in the (Figure 4.3.23
(A and B)) the nocodazole used in the experiment was effective enough to depolymerize
microtubules. These results suggest that both calcium dependent and calcium
independent desmosomal proteins may be recruited to the cell border in a microtubule
dependent manner. However the transport of calcium independent desmosomal proteins
(plakoglobin) is followed by the recruitment of calcium dependent desmosomal proteins
(desmocollin 2/3) to the cell border in a microtubule dependent manner.
Figure 4.3.23: Desmocollin2/3 recruitment to the cell border is microtubule dependent.
(A) HCT116 cells were grown in low calcium medium for 20 hrs and then shifted to

146
medium with standard calcium levels in presence or absence of nocodazole (16µM) for 2
hours. The immunoflouresence analysis was performed using specific antibodies to
DSC2/3 and α-tubulin. Please note that DSC2/3 localizes to cell border at 60 min in
HCT116 cells treated with DMSO whereas DSC2/3 fails to localize to cell border in the
cells treated with nocodazole. α-tubulin staining shows that the microtubules are
depolymerized upon treatment with nocodazole. (B) The mean fluorescence intensities at
the cell borders were measured for 24 cells in 3 independent experiments for each
immunofluorescence analysis. . (C) The total fluorescence intensities for α-tubulin were
measured for 24 cells in 3 independent experiments for each immunofluorescence
analysis. . (Original magnification x 630 with 2X optical zoom).
4.3.13 ATPγS treatment inhibits the DSC2/3 recruitment to cell border.
To further ascertain the role of KIF5B in recruitment to cell border during desmosome
biogenesis, a calcium switch assay as previously described (19) was performed in
presence or absence of the ATP analog, ATPγS. A specific inhibitor of kinesin was not
available so we used ATP analogs to inhibit the ATPase activity of kinesin 1 motor
proteins. The ATPase domain in kinesin 1 motor proteins is required to hydrolyze ATP to
support the active process of movement along microtubules (45, 152, 374). ATPγS is an
ATP analog in which one of the gamma-phosphate oxygens is replaced by a sulfur atom;
this molecule is hydrolyzed at a dramatically slower rate than ATP itself and functions as
an inhibitor of ATP-dependent processes. HCT116 cells were grown in low calcium
medium for 20 hrs and then shifted to medium with standard calcium levels in presence
or absence of ATPγS (500µM). The cells were fixed for immunofluorescence
experiment at 30 time interval and stained with antibodies to DSC2/3 and α-tubulin. A
diffused cytoplasmic staining was observed for DSC2/3 in the cells cultured in calcium
depleted conditions (Figure 4.3.24 (A and B)). These proteins gradually accumulated at
the cell-cell border at 60 min for HCT116 cells treated with DMSO and showed typical
membrane localization. However at 60 min DSC2/3 protein failed to localize to the cell
border in the HCT116 cells treated with ATPγS even upon addition of calcium. As
shown in Figure 4.3.24 the ATPγS used in the experiment does not affect microtubule
organization. These results suggest that even in the presence of functional microtubules

147
the desmosomal proteins recruitment to the cell border is dependent on the ATPase
activity of motor proteins. However, as ATPγS inhibits multiple cellular processes, these
results need to be confirmed with specific kinesin inhibitors.
Figure 4.3.24: ATPγS treatment inhibits the DSC2/3 recruitment to cell border. (A)
HCT116 cells were grown in low calcium medium for 20 hrs and then shifted to medium
with standard calcium levels in presence or absence of ATP analog ATPγS (500µM) for 2
hours. The immunoflouresence analysis was performed using specific antibodies to
DSC2/3 and α-Tubulin. Please note that DSC2/3 localizes to cell border at 60 min in
HCT116 cells treated with DMSO whereas DSC2/3 fails to localize to cell border in the
cells treated with ATPγS. No difference in α-tubulin staining was observed upon
treatment with ATPγS. (B) The mean fluorescence intensities at the cell borders were
measured for 24 cells in 3 independent experiments for each immunofluorescence

148
analysis. (C) The mean fluorescence intensities of the cell were measured for 24 cells in 3
independent experiments for each immunofluorescence analysis. (Original magnification
x 630 with 2X optical zoom).
4.3.14 Generation of HCT116 derived KIF5B knockdown cell lines.
The experiments done so far suggested that the recruitment of PG to cell border is
microtubule dependent. We next wanted to understand whether KIF5B is required for the
recruitment of PG and other desmosomal proteins to the cell border. To test the
hypothesis that PG recruitment to the cell surface thus initiating desmosome formation is
dependent on Kinesin 1 motor protein (KIF5B), the expression of KIF5B was inhibited in
HCT116 cells using vector driven RNA interference. HCT116 cells were transfected with
the KIF5B knockdown construct or the vector control and stable clones were generated
after selection in puromycin. As compared to the control pLKO.1 vector we identified
five stably selected clones with a down regulation of KIF5B (Figure 4.3.25 (A)) as
determined by Western blotting using specific antibodies to KIF5B. A Western blot for
actin served as a loading control. It is reported previously that when the Kif5b gene was
disrupted in mice, perinuclear accumulation of mitochondria is observed, suggesting that
the KIF5 motors are essential for mitochondrial transport (350). To confirm whether
these mitochondrial defects are replicated in our HCT116 derived KIF5B knockdown
clones, we incubated the vector control cells and two KIF5B knockdown clones K1.3 and
K1.5 with Mitotracker488 (500nM), which localizes to mitochondria, for 45 minutes
followed by confocal imaging in live cells. As shown in the figure 4.3.25 (B), both
HCT116 derived KIF5B knockdown clones K1.3 and K1.5 show a perinuclear
accumulation of mitochondria, In contrast, the mitochondria in vector control cells are
present all through the cell. This result suggests that the KIF5B knockdown clones
generated by us functionally affects the transport of mitochondria.
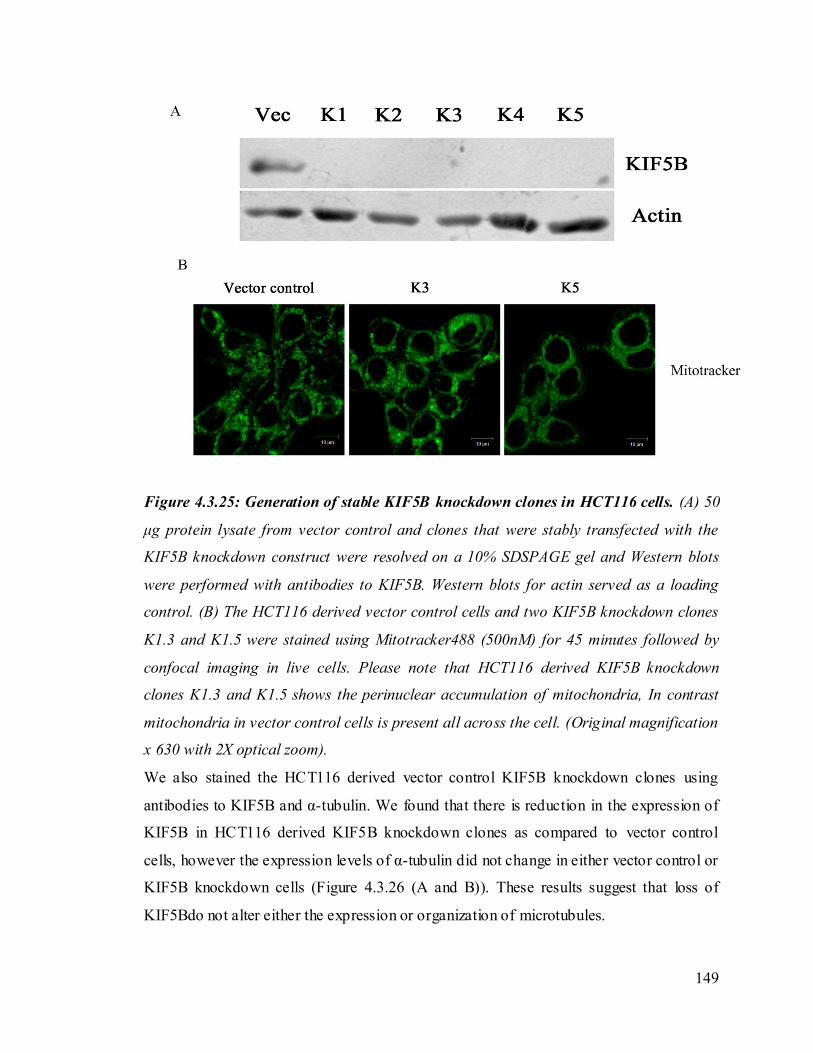
149
Figure 4.3.25: Generation of stable KIF5B knockdown clones in HCT116 cells. (A) 50
μg protein lysate from vector control and clones that were stably transfected with the
KIF5B knockdown construct were resolved on a 10% SDSPAGE gel and Western blots
were performed with antibodies to KIF5B. Western blots for actin served as a loading
control. (B) The HCT116 derived vector control cells and two KIF5B knockdown clones
K1.3 and K1.5 were stained using Mitotracker488 (500nM) for 45 minutes followed by
confocal imaging in live cells. Please note that HCT116 derived KIF5B knockdown
clones K1.3 and K1.5 shows the perinuclear accumulation of mitochondria, In contrast
mitochondria in vector control cells is present all across the cell. (Original magnification
x 630 with 2X optical zoom).
We also stained the HCT116 derived vector control KIF5B knockdown clones using
antibodies to KIF5B and α-tubulin. We found that there is reduction in the expression of
KIF5B in HCT116 derived KIF5B knockdown clones as compared to vector control
cells, however the expression levels of α-tubulin did not change in either vector control or
KIF5B knockdown cells (Figure 4.3.26 (A and B)). These results suggest that loss of
KIF5Bdo not alter either the expression or organization of microtubules.
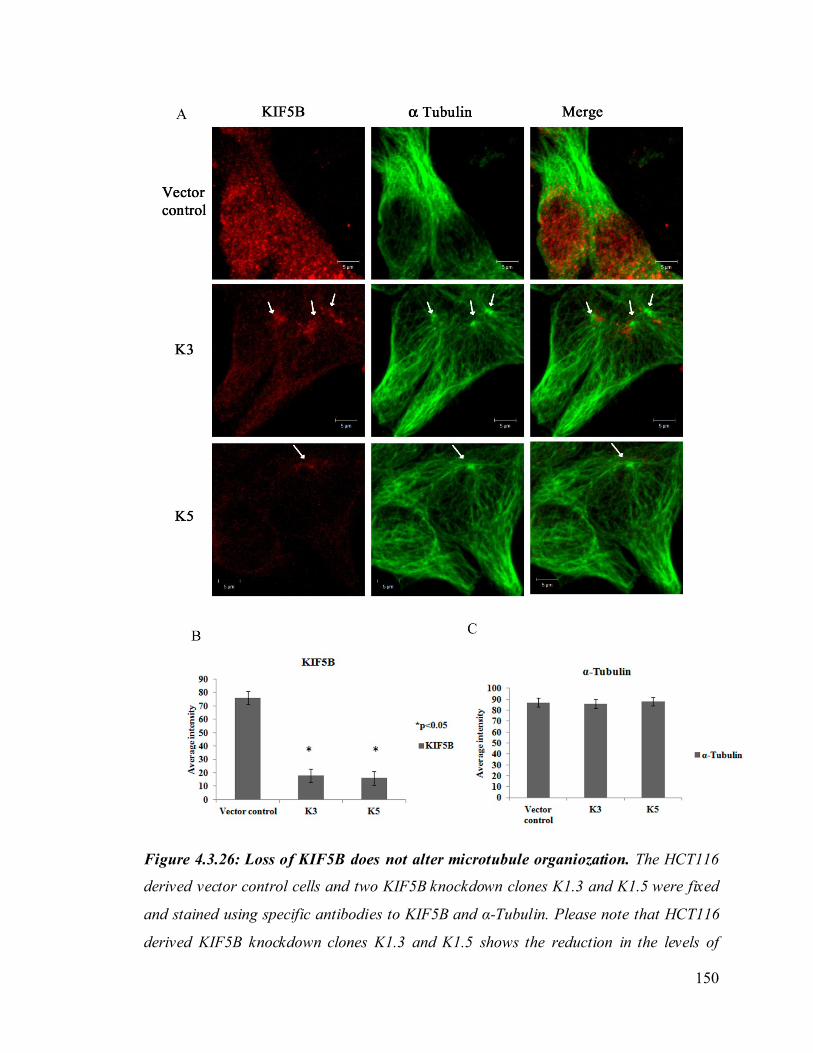
150
Figure 4.3.26: Loss of KIF5B does not alter microtubule organiozation. The HCT116
derived vector control cells and two KIF5B knockdown clones K1.3 and K1.5 were fixed
and stained using specific antibodies to KIF5B and α-Tubulin. Please note that HCT116
derived KIF5B knockdown clones K1.3 and K1.5 shows the reduction in the levels of

151
KIF5B, however its reduction does not alter the organization of microtubules as
determined by α-tubulin staining in the same cells. (B) The mean fluorescence intensities
at the cell borders or the whole cell were measured for 24 cells in 3 independent
experiments for each immunofluorescence analysis. (Original magnification x 630 with
4X optical zoom).
4.3.15 Recruitment of desmosomal proteins PG and DSC2/3 to cell border is
impaired upon loss of KIF5B.
To test the hypothesis that PG recruitment to the cell surface thus initiating desmosome
formation is dependent on KIF5B, an immunofluorescence experiment was performed
using antibodies to PG, and KIF5B or DSC2/3 and KIF5B followed by confocal
microscopy. PG and DSC2/3 localized to the cell border in the vector control cells but not
in the KIF5B knockdown clones (K1.3 and K1.5) (Figure 4.3.27 (A and B) and Figure
4.3.28 (A and B)). The levels of KIF5B were significantly reduced in the KIF5B
knockdown clones (K1.3 and K1.5) as compared to the vector controls) (Figure 4.3.27 (A
and B) and Figure 4.3.28 (A and B)). These results suggest that KIF5B is required to
recruit PG to cell border to initiate desmosome assembly. Similar experiments are being
performed in mouse testis to determine whether KIF5B is required for cell-cell adhesion
in the testis.

152
Figure 4.3.27: KIF5B loss leads to depletion of PG at the cell border. (A) HCT116
derived vector control or KIF5B knockdown clones (K1.3 and K1.5) were fixed and
immuno stained with the antibody to PG). Note that cell border recruitment of PG is
reduced and the intracellular level of PG is increased in KIF5B knockdown clones as

153
compared to vector control cells. (B)The mean fluorescence intensities at the cell borders
were measured for 24 cells in 3 independent experiments for each immunofluorescence
analysis. p values indicated were obtained using a student’s t-test. (Original
magnification x 630 with 2X optical zoom).

154
Figure 4.3.28: KIF5B loss leads to depletion of DSC2/3 at the cell border. (A) HCT116
derived vector control or KIF5B knockdown clones (K1.3 and K1.5) were fixed and
immuno stained with the antibody to DSC2/3.. Note that cell border recruitment of
DSC2/3 is reduced and the intracellular level of DSC2/3 is increased in KIF5B
knockdown clones as compared to vector control cells. (B)The mean fluorescence
intensities at the cell borders were measured for 24 cells in 3 independent experiments
for each immunofluorescence analysis. p values indicated were obtained using a
student’s t-test. (Original magnification x 630 with 2X optical zoom).
4.3.16 Conclusion
We found that the mice injected with lentiviruses expressing shRNAs targeting 14-3-3γ
were unable to sire pups when mated with wild type female mice. A further analysis of
the testes phenotype showed severe cell-cell adhesion defects, defects in spermatogenesis
and male sterility. It has been previously reported that the different isoforms of 14-3-3
proteins are expressed in testis (348). As germ cells differentiate from spermatogonia into
elongated spermatids, they move across seminiferous epithelium to reach the luminal
compartment by reorganizing the blood testis barrier (BTB) (184, 210, 348). At the same
time, these germ cells must also maintain stable attachment with Sertoli cells via
desmosome and actin based cell junctions to prevent depletion of immature germ cells
from the seminiferous epithelium, which may result in infertility. Moreover loss of
desmosomal proteins (Dsg2 Dsc2/3) in sertoli cells has also disrupted BTB dynamics and
function (210). The localization of various desmosomal proteins (DSC2/3, DSG2, DP.
PG and PKP3) was altered upon loss of 14-3-3γ in HCT116 cells. This loss was reversed
by using 14-3-3γshRNA resistant cDNA, suggesting that the alteration in localization of
desmosomal proteins were caused by the reduced levels of 14-3-3γ. We have determined
that 14-3-3γ interacts with PG and KIF5B in vitro and in vivo. We hypothesize that 14-3-
3γ is an adaptor molecule that act as scaffold between PG and KIF5B for the recruitment
of PG to cell border in microtubule dependent manner. Loss of KIF5B in HCT116 cells
fails to recruit the desmosomal proteins to cell border. These observations suggest that the
severe cell-cell adhesion defects in testes may be due to altered localization of
desmosomal protein upon 14-3-3γ loss.

155
4.4 Generation of 14-3-3ε knockdown mice.
4.4.1 Testing the efficiency of cDNA and shRNA constructs.
A cDNA for the mouse 14-3-3ε gene product was cloned in pCDNA3.0 (Invitrogen)
downstream of the HA epitope as described in Materials and Methods. The ability of the
construct to express mouse 14-3-3ε was determined by transfection of different amounts
of the HA-tagged mouse 14-3-3ε construct into HCT116 cells. Western blotting with
antibodies to the HA epitope demonstrated that maximal expression of HA-14-3-3ε was
obtained when 1µg of the construct was transfected into HCT116 cells (Figure 4.4.1 A).
Cells transfected with an HA-tagged human 14-3-3γ and with pCDNA 3.0 served as
positive and negative controls respectively.
Three different shRNA constructs against 14-3-3ε were designed as described in
Materials and Methods. The ability of these constructs to inhibit the expression of
exogenously expressed 14-3-3ε was determined by co-transfection of the pLKO.1 based
shRNA constructs and HA-tagged mouse 14-3-3ε in HCT116 cells. Protein levels of HA-
mouse 14-3-3ε were determined by Western blotting with antibodies to the HA epitope.
The construct pLKO.1 E1 could inhibit the expression of HA-14-3-3ε, but the constructs
pLKO.1 E2 and E3 could not inhibit expression of HA-14-3-3ε (Figure 4.4.1 B). No
inhibition of HA-14-3-3ε expression was observed in cells transfected with the vector
control (Figure 4.4.1 B). Western blots for actin were performed to serve as loading
controls.

156
Figure 4.4.1: Testing the efficiency of cDNA and shRNA constructs. (A) 0.5 – 5µg of a
construct expressing mouse HA-14-3-3ε were transfected in HCT116 cells. The cells were
harvested 48 hrs post transfection,protein extracts resolved on 10% SDS page gels and
Western blots performed with antibodies to the HA epitope or β -actin. Cells transfected
with an HA-tagged human 14-3-3γ and with pCDNA 3.0 served as positive and negative
controls respectively. (B) 0.5, 1 or 1.5µg of the vector control (pLKO.1puro) or shRNA
constructs targeting mouse 14-3-3ε were co-transfected with an HA-epitope tagged
mouse 14-3-3ε construct into HCT116 cells The cells were lysed 60 hrs post transfection
to prepare protein extracts, which were resolved on a 10% SDS page gels and Western
blots performed with antibodies against HA (12CA5) and β-actin.
4.4.2 Generation of 14-3-3ε knockdown mice
To generate knockdown mice for 14-3-3ε, lentiviral particles containing both an
expression cassette for EGFP-f and an shRNA cassette that targets 14-3-3ε were injected
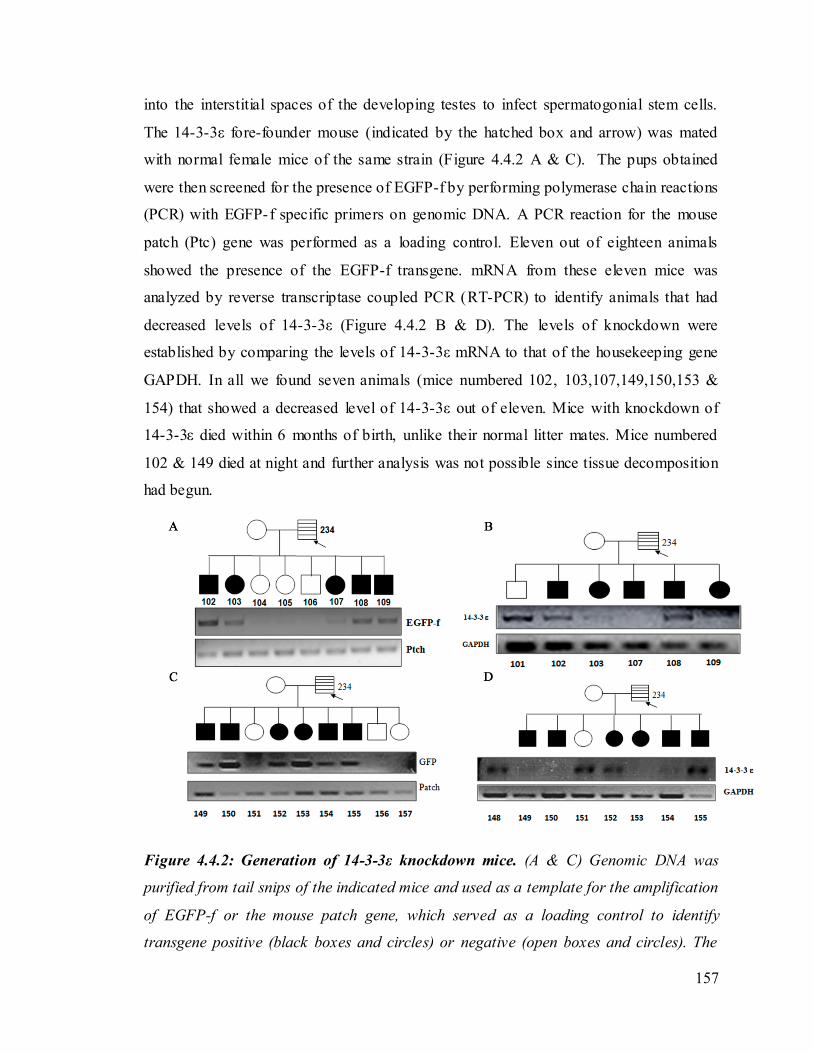
157
into the interstitial spaces of the developing testes to infect spermatogonial stem cells.
The 14-3-3ε fore-founder mouse (indicated by the hatched box and arrow) was mated
with normal female mice of the same strain (Figure 4.4.2 A & C). The pups obtained
were then screened for the presence of EGFP-f by performing polymerase chain reactions
(PCR) with EGFP-f specific primers on genomic DNA. A PCR reaction for the mouse
patch (Ptc) gene was performed as a loading control. Eleven out of eighteen animals
showed the presence of the EGFP-f transgene. mRNA from these eleven mice was
analyzed by reverse transcriptase coupled PCR (RT-PCR) to identify animals that had
decreased levels of 14-3-3ε (Figure 4.4.2 B & D). The levels of knockdown were
established by comparing the levels of 14-3-3ε mRNA to that of the housekeeping gene
GAPDH. In all we found seven animals (mice numbered 102, 103,107,149,150,153 &
154) that showed a decreased level of 14-3-3ε out of eleven. Mice with knockdown of
14-3-3ε died within 6 months of birth, unlike their normal litter mates. Mice numbered
102 & 149 died at night and further analysis was not possible since tissue decomposition
had begun.
Figure 4.4.2: Generation of 14-3-3ε knockdown mice. (A & C) Genomic DNA was
purified from tail snips of the indicated mice and used as a template for the amplification
of EGFP-f or the mouse patch gene, which served as a loading control to identify
transgene positive (black boxes and circles) or negative (open boxes and circles). The

158
pattern of inheritance is shown in the pedigree. . (B & D) To identify animals with a
knockdown of 14-3-3ε and RT PCR analysis was performed using primers to amplify
either 14-3-3ε or GAPDH, which served as a loading control. The profounder mice (234)
and the founder mice are labeled as indicated in the figure.
4.4.3 Analysis of cortical development in the brains of 14-3-3ε knockdown mice.
It has been reported previously that mice that are heterozygous or homozygous null for
14-3-3ε have defects in brain development and neuronal migration. Most of the
homozygous null mice die just after birth and the heterozygouse mice have a thinner
cortex than wild type mice. These results suggested that even a haploinsufficiency of 14-
3-3ε leads to defects in brain development due to slower neuronal migration of
hippocampal and cortical neurons (363). To determine if this phenotype is duplicated in
the 14-3-3ε knockdown mice, brain sections from wild type or knockdown mice were
stained with antibodies to 14-3-3ε to study organization of the cerebral cortex (Figure
4.4.3 A). As determined by immuno-histochemical analysis using specific antibodies to
14-3-3ε, there is a decrease in staining for 14-3-3ε in brain sections derived from mouse
number 103 as opposed to sections derived from wild type mice (Figure 4.4.3 A).
However as these were coronal sections it was difficult to study cortical organization,
therefore the whole brain from three mice numbered 152,153 and 154 and three wild type
litter mates were fixed in paraformaldehyde and sagittal sections generated by Achira
Roy in Dr Tole’s lab at TIFR. An in-situ hybridization using cux2, which marks cortical
layers II-IV, showed a decrease in the staining of cux2 in mice number 153 and 154 but
not 152 as compared to the wild type littermates (Figure 4.4.3 B). Mouse 152 had higher
levels of 14-3-3ε as compared to 153 and 154 (Figure 4.4.2 D). We tried to perform an
immunohistochemical analysis for 14-3-3ε, in sections from these mice; however, we
were unable to stain these sections with antibodies to 14-3-3ε. Further, no significant
defects in cortical organization were observed in these mice. This might be due to the fact
that the level of 14-3-3ε in these mice is less than that observed for mouse number 103.
Therefore, these results should be repeated with larger numbers of mice with a consistent
knockdown of 14-3-3ε to convincingly demonstrate that the knockdown mice show
defects in the development of the cerebral cortex.
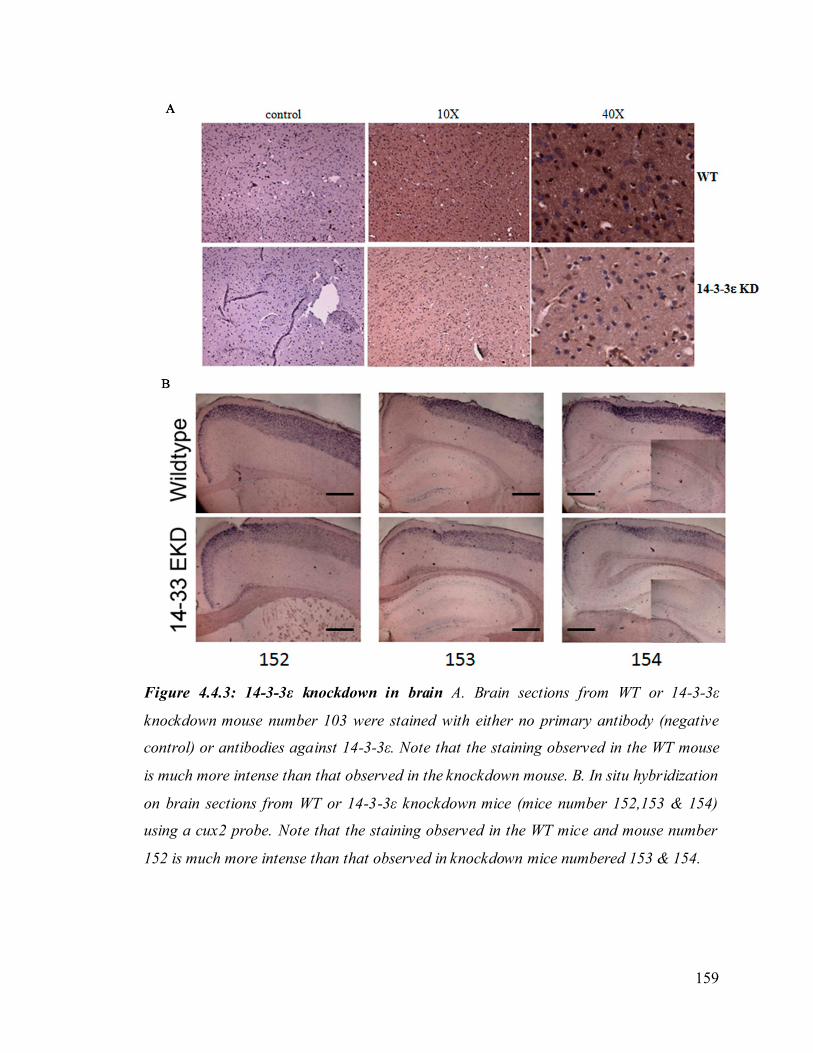
159
Figure 4.4.3: 14-3-3ε knockdown in brain A. Brain sections from WT or 14-3-3ε
knockdown mouse number 103 were stained with either no primary antibody (negative
control) or antibodies against 14-3-3ε. Note that the staining observed in the WT mouse
is much more intense than that observed in the knockdown mouse. B. In situ hybridization
on brain sections from WT or 14-3-3ε knockdown mice (mice number 152,153 & 154)
using a cux2 probe. Note that the staining observed in the WT mice and mouse number
152 is much more intense than that observed in knockdown mice numbered 153 & 154.
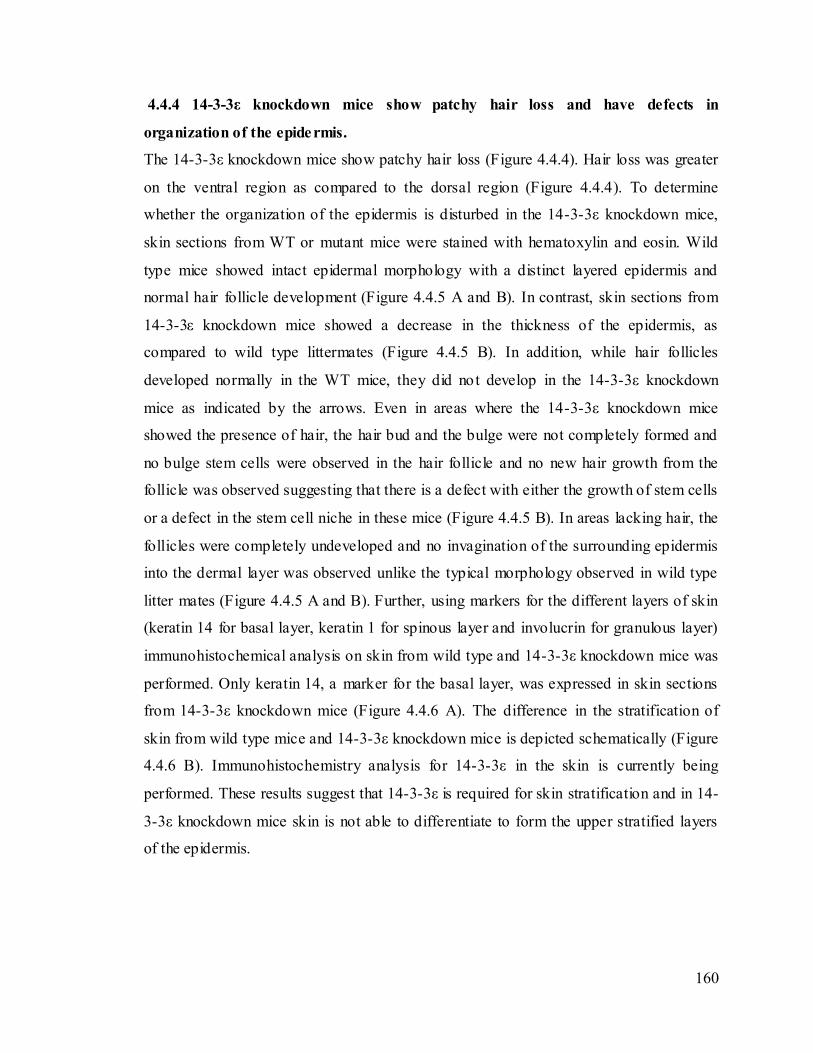
160
4.4.4 14-3-3ε knockdown mice show patchy hair loss and have defects in
organization of the epidermis.
The 14-3-3ε knockdown mice show patchy hair loss (Figure 4.4.4). Hair loss was greater
on the ventral region as compared to the dorsal region (Figure 4.4.4). To determine
whether the organization of the epidermis is disturbed in the 14-3-3ε knockdown mice,
skin sections from WT or mutant mice were stained with hematoxylin and eosin. Wild
type mice showed intact epidermal morphology with a distinct layered epidermis and
normal hair follicle development (Figure 4.4.5 A and B). In contrast, skin sections from
14-3-3ε knockdown mice showed a decrease in the thickness of the epidermis, as
compared to wild type littermates (Figure 4.4.5 B). In addition, while hair follicles
developed normally in the WT mice, they did not develop in the 14-3-3ε knockdown
mice as indicated by the arrows. Even in areas where the 14-3-3ε knockdown mice
showed the presence of hair, the hair bud and the bulge were not completely formed and
no bulge stem cells were observed in the hair follicle and no new hair growth from the
follicle was observed suggesting that there is a defect with either the growth of stem cells
or a defect in the stem cell niche in these mice (Figure 4.4.5 B). In areas lacking hair, the
follicles were completely undeveloped and no invagination of the surrounding epidermis
into the dermal layer was observed unlike the typical morphology observed in wild type
litter mates (Figure 4.4.5 A and B). Further, using markers for the different layers of skin
(keratin 14 for basal layer, keratin 1 for spinous layer and involucrin for granulous layer)
immunohistochemical analysis on skin from wild type and 14-3-3ε knockdown mice was
performed. Only keratin 14, a marker for the basal layer, was expressed in skin sections
from 14-3-3ε knockdown mice (Figure 4.4.6 A). The difference in the stratification of
skin from wild type mice and 14-3-3ε knockdown mice is depicted schematically (Figure
4.4.6 B). Immunohistochemistry analysis for 14-3-3ε in the skin is currently being
performed. These results suggest that 14-3-3ε is required for skin stratification and in 14-
3-3ε knockdown mice skin is not able to differentiate to form the upper stratified layers
of the epidermis.
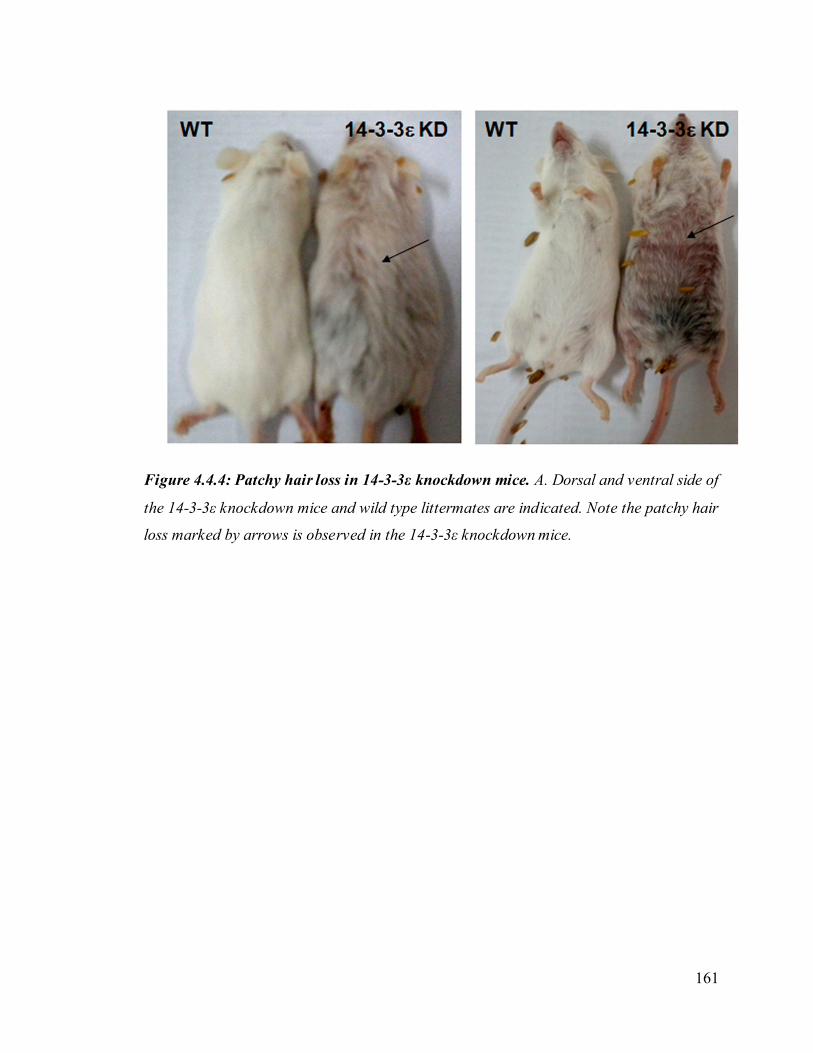
161
Figure 4.4.4: Patchy hair loss in 14-3-3ε knockdown mice. A. Dorsal and ventral side of
the 14-3-3ε knockdown mice and wild type littermates are indicated. Note the patchy hair
loss marked by arrows is observed in the 14-3-3ε knockdown mice.

162
Figure 4.4.5: Epidermal loss in 14-3-3ε knockdown mice. A & B. Skin sections from WT
or 14-3-3ε knockdown mice (mouse number 153) were stained with hematoxylin and
eosin and observed by light microscopy. The mutant mice showed defects in the formation
of the epidermis with a decrease in the number of stratified layers and defective hair
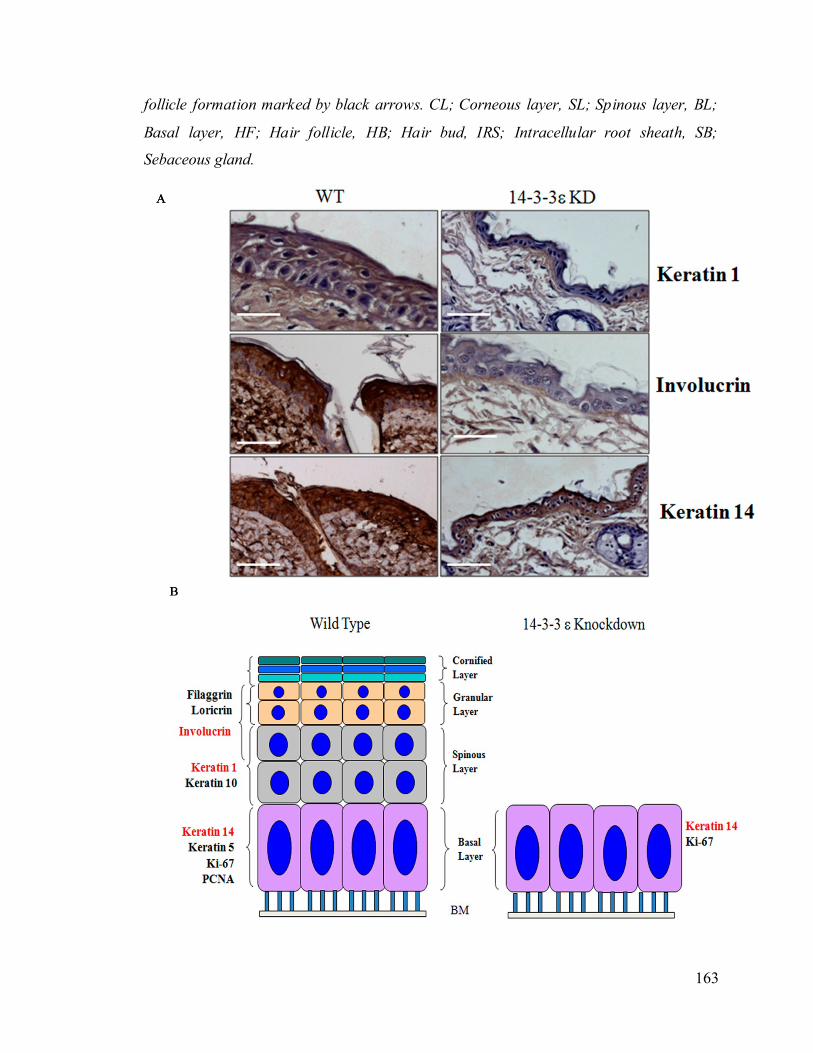
163
follicle formation marked by black arrows. CL; Corneous layer, SL; Spinous layer, BL;
Basal layer, HF; Hair follicle, HB; Hair bud, IRS; Intracellular root sheath, SB;
Sebaceous gland.

164
Figure 4.4.6: Stratification of skin is impaired in 14-3-3ε knockdown mice. A. Skin
sections from wild type and 14-3-3 ε knockdown mice were stained using specific
antibodies for different stratified layers (keratin 14, keratin1 and involucrin). The skin
from the knockdown mice only shows the presence of basal layer marker keratin 14. B.
Schematic representation of difference in stratification of skin from wild type and 14-3-3ε
knockdown mice.
4.4.5 14-3-3ε knockdown mice show defects in T-cell development.
The 14-3-3ε knockdown mice died or were sacrificed because they were very sick about
6 months post birth. To determine the cause of death in the knockdown mice, the mice
were dissected and the internal organs examined. All the mice had significantly enlarged
spleens average length of 4.5 cm as compared to 2 cm in the wild type mice (Figure 4.4.7
A). In addition, all the mice with enlarged spleens showed the presence of infiltrating
cells, with morphology typical of lymphocytes, in the lungs, liver and kidneys, which is
indicative of a lymphoproliferative disorder (Figure 4.4.8). Two of the knockdown mice
with enlarged spleens also had enlarged lymph nodes (Figure 4.4.7 B) and one mouse
showed a solid tumor in the intestinal tract (Figure 4.4.7 C). These results indicated that
loss of 14-3-3ε may lead to uncontrolled cell growth in various tissues.

165
Figure 4.4.7: Phenotypes in 14-3-3ε knockdown mice. (A). The size of the spleens from
14-3-3ε knockdown mice were compared to those from the wild type litter mates. Note
that the spleens from the knockdown mice are greatly enlarged as compared to spleens
from the wild type litter mate controls. (B). Two 14-3-3ε knockdown mice showed the
presence of enlarged lymph nodes as compared to the lymph nodes from either wild type
mice or other knockdown mice. (C). A solid tumor was observed in the intestine of 14-3-3
ε knockdown mouse number 103 while no such growth was observed in any of the wild
type litter mates.
To confirm that the enlarged spleens and the presence of the infiltrating cells in other
tissues were due to a deregulation of lymphocyte growth and differentiation, the spleens
of WT or 14-3-3ε knockdown mice were stained with antibodies to CD3 (T cell marker)
and CD45 (activated lymphocyte marker) . As shown in (Figure 4.4.9 A), spleen sections
derived from the 14-3-3ε knockdown mice showed an increased presence of CD3 and
CD45 positive lymphocytes as compared to WT mice, a phenotype consistent with the
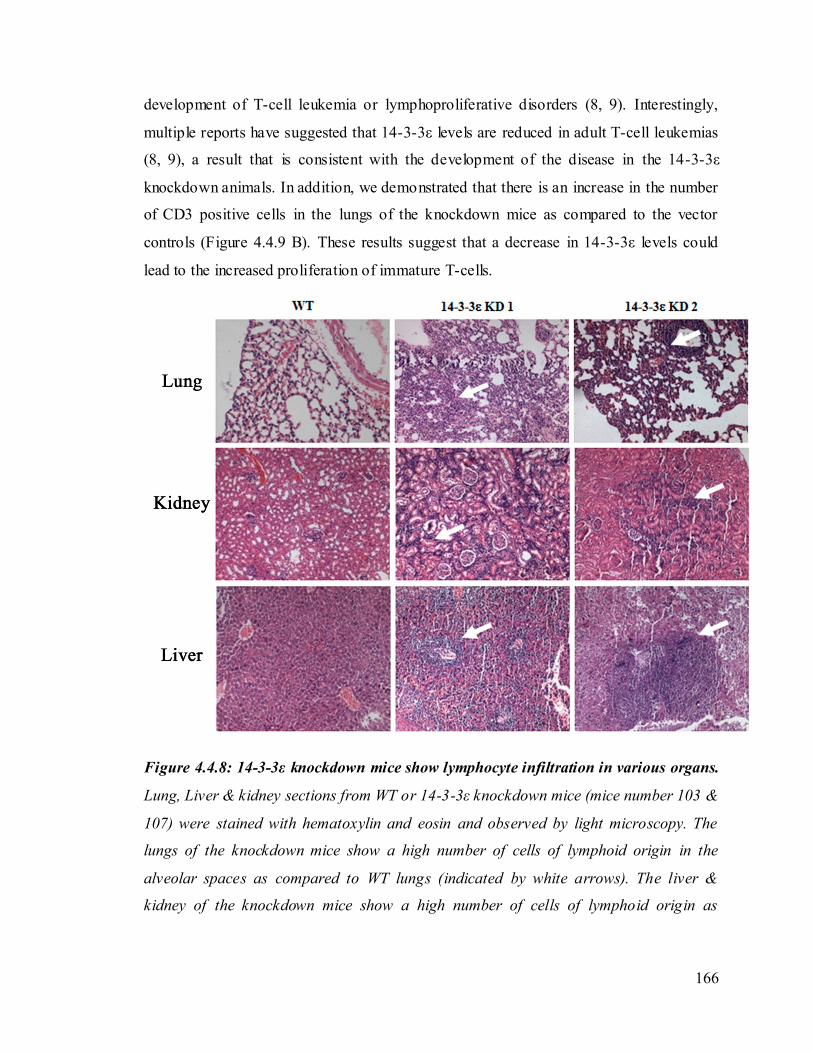
166
development of T-cell leukemia or lymphoproliferative disorders (8, 9). Interestingly,
multiple reports have suggested that 14-3-3ε levels are reduced in adult T-cell leukemias
(8, 9), a result that is consistent with the development of the disease in the 14-3-3ε
knockdown animals. In addition, we demonstrated that there is an increase in the number
of CD3 positive cells in the lungs of the knockdown mice as compared to the vector
controls (Figure 4.4.9 B). These results suggest that a decrease in 14-3-3ε levels could
lead to the increased proliferation of immature T-cells.
Figure 4.4.8: 14-3-3ε knockdown mice show lymphocyte infiltration in various organs.
Lung, Liver & kidney sections from WT or 14-3-3ε knockdown mice (mice number 103 &
107) were stained with hematoxylin and eosin and observed by light microscopy. The
lungs of the knockdown mice show a high number of cells of lymphoid origin in the
alveolar spaces as compared to WT lungs (indicated by white arrows). The liver &
kidney of the knockdown mice show a high number of cells of lymphoid origin as

167
compared to WT lungs (indicated by white arrows). Infiltrating lymphoid cells are
indicated by arrows.
Figure 4.4.9: 14-3-3ε knockdown mice spleen and lungs shows CD3 positive cells. (A).
Spleen sections from WT or 14-3-3ε knockdown mice (mice number 103) were stained
with antibodies to CD3 or CD45. Note that the number of CD3 or CD45 positive cells is
greatly increased in the mutant mice as compared to the WT. (B). Lung sections from WT
168
or 14-3-3ε knockdown mice (mice number 103) were stained with antibodies to CD3. No
CD3 positive cells were observed in lung sections from WT mice but the infiltrating cells
in the 14-3-3ε knockdown mice were positive for CD3.
T-cell precursors arrive at the thymus from the bone marrow via the bloodstream and
undergo development to form mature T cells, which are exported to the periphery where
they can undergo antigen- induced activation and differentiation into effector cells and
memory cells (190). Each stage of development is characterized by stage-specific
intracellular events and the display of distinctive cell-surface markers (190). T cell
precursors in the thymus express the cell surface receptor CD3, during TCR-gene
rearrangement and are designated as CD3 double negative (DN) cells. Upon completion
of the TCR-gene rearrangement the T cell precursor exhibits the cell surface receptor
CD4 and CD8 in addition to CD3; these are CD3 double positive (DP) cells. The CD3+
DN thymocytes that do not mature, die by apoptosis within the thymus either because
they fail to make a productive TCR-gene rearrangement or because they fail to survive
thymic selection (190). Double-positive thymocytes further develop into immature
single-positive CD4 thymocytes or single positive CD8 thymocytes (190). These single-
positive cells undergo additional negative selection and migrate from the cortex to the
medulla, where they pass from the thymus into peripheral organs such as the spleen and
lymph nodes (190). To identify the cell type showing aberrant expansion in the 14-3-3ε
knockdown animals, lymphocyte cultures derived from the spleen were generated as
described in Materials and Methods. The isolated splenocytes from 14-3-3ε knockdown
mice showed a reduction in the level of 14-3-3ε compared to wild type mice as
determined by Western blotting (Figure 4.4.10). Western blots for β-actin were
performed as a loading control. Immunophenotyping using antibodies that recognized the
T cell markers CD3, CD4 and CD8 and the B cell marker, B220 demonstrated that the
14-3-3ε knockdown mice showed an increase in CD3 and CD4 positive cells and a
modest increase in the CD8 positive cells as compared to cells derived from the WT
spleen (Figure 4.4.11 A,B, & C). In contrast, there was a decrease in B220 positive cells
in the 14-3-3ε knockdown animals as compared to the WT animals (Figure 4.4.11 D).
Further, an analysis of subsets of T cells showed that the CD3+ CD4- CD8- DN
population was increased in the cultures derived from 14-3-3ε knockdown mice as
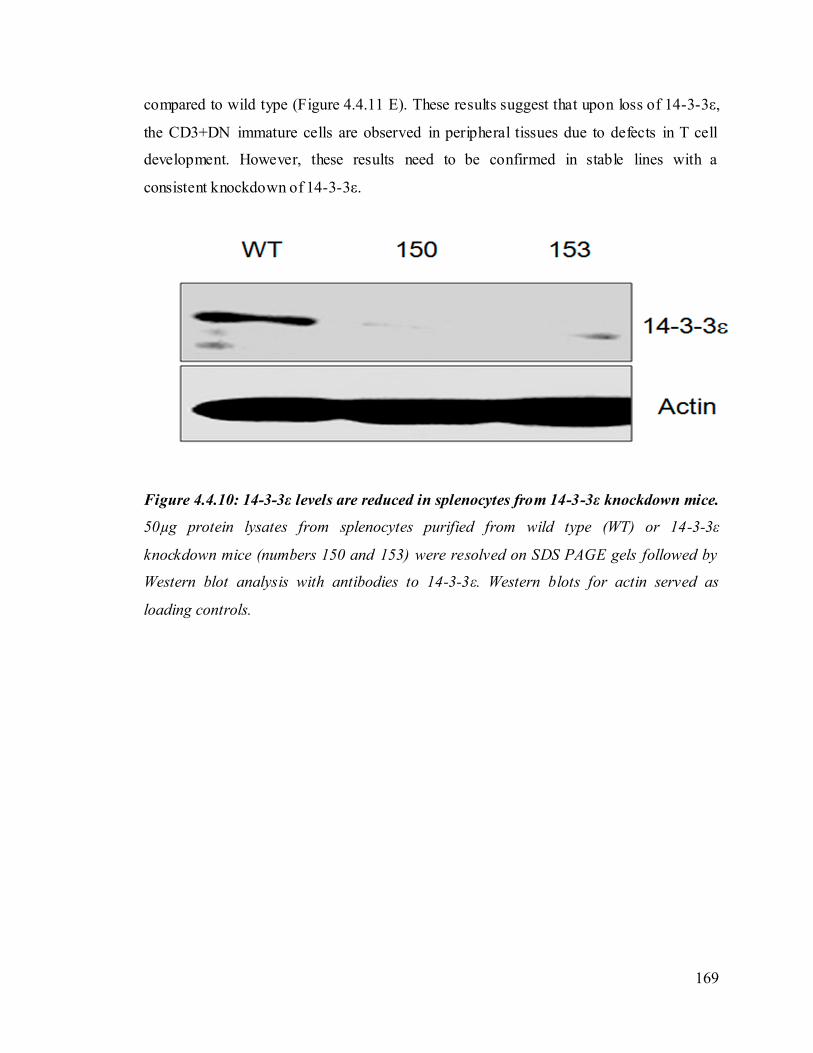
169
compared to wild type (Figure 4.4.11 E). These results suggest that upon loss of 14-3-3ε,
the CD3+DN immature cells are observed in peripheral tissues due to defects in T cell
development. However, these results need to be confirmed in stable lines with a
consistent knockdown of 14-3-3ε.
Figure 4.4.10: 14-3-3ε levels are reduced in splenocytes from 14-3-3ε knockdown mice.
50µg protein lysates from splenocytes purified from wild type (WT) or 14-3-3ε
knockdown mice (numbers 150 and 153) were resolved on SDS PAGE gels followed by
Western blot analysis with antibodies to 14-3-3ε. Western blots for actin served as
loading controls.

170
Figure 4.4.11: 14-3-3ε knockdown mice have aberrent T cell population. (A, B, C, D, &
E). Spleenocytes from wild type (WT) or 14-3-3ε knockdown mice (150 and 153) were
immunophenotyped with antibodies to CD3 (A), CD4 (B), CD8 (C) and B220 (D). CD3

171
and CD4 positive lyumphocyte numbers are increased in 14-3-3ε knockdown mice as
compared to wild type mice. B220 population is decreased in 14-3-3 ε knockdown mice
as compared to wild type mice. There is no change in the numbers of CD8 positive
lymphocytes. Moreover the number of lymphocytes that are CD+CD4-CD8- are
increased in 14-3-3 ε knockdown mice as compared to wild type mice (E).
It has been reported previously that one of the proteins that is required for T-cell
maturation is SLP76 (41, 63). SLP76 is an adaptor protein that positively regulates T cell
receptor (TCR) signaling. Upon T cell activation, SLP-76 further phosphorylates
phospolipaseCγ at Tyrosine 783 (79). It has been previously reported that SLP76 binds to
14-3-3 proteins and that this is dependent on phosphorylation of SLP76 at a Serine
residue at position 376 by HPK1 (79). 14-3-3 association is required to inhibit SLP76
signaling, thus resulting in the formation of a negative feedback loop (79). To determine
whether 14-3-3ε could form a complex with SLP76, flag epitope tagged SLP76 and HA-
tagged 14-3-3ε were transfected into HEK293 cells in the presence or absence of HPK1.
48 hours post transfection protein extracts were prepared and immunoprecipitations
performed with antibodies to the Flag-epitope tag followed by Western blotting with
antibodies to Flag and 14-3-3ε. As shown in (Figure 4.4.12 A), SLP76 formed a complex
with 14-3-3ε only upon expression of HPK1. We hypothesize that 14-3-3ε negatively
regulates T cell activation by binding to and inhibiting SLP-76 function. It is reported
earlier that phospholipaseCγ is phosphorylated on Y783 upon T cell activation (79), so
we determined if the isolated splenocytes from 14-3-3ε knockdown mice shows increase
in the level of phosphorylated -phospolipaseCγ. Splenocytes from 14-3-3ε knockdown
mice show an increase in the level of p-PhospolipaseCγ compared to splenocytes from
wild type mice as determined by Western blotting upon activation with Concavalin A
(Figure 4.4.12 B), thereby suggesting that the loss of 14-3-3ε leads to permanent T cell
activation. These results need to be confirmed by performing blots for total
PhospholipaseCγ to confirm that the difference in the levels of the activated form are not
due to an increase in enzyme levels. These results suggest that one possible mechanism
by which T cell development might be altered in the 14-3-3ε knockdown animals may be
through the aberrant activation of SLP76.

172
Figure 4.4.12: 14-3-3ε regulates T cell activation. (A) 14-3-3ε forms a complex with
SLP76 in the presence of HPK1. HEK293 cells were transfected with the indicated
constructs. Protein extracts were prepared 48 hours post transfection and
immunoprecipitations (IP) performed with antibodies to the FLAG epitope. The total
extracts (WCE) and IP’s were resolved on SDS-PAGE gels followed by Western blotting
with antibodies to Flag and 14-3-3ε. (B) Spleenocytes from wild type and 14-3-3 ε
knockdown mice is activated using Concavlin A and immunoblotted for the p-PLC-γ
(Y783) and β actin. Note that the p-PLC-γ levels are increased in 14-3-3 ε knockdown
mice as compared to wild type mice.
To determine whether cells of the lymphoid lineage present in spleen observed in the 14-
3-3ε knockdown mice are due to malignant transformation induced by 14-3-3ε loss, we
injected the splenocytes from WT and 14-3-3ε knockdown mice into SCID mice. None of
the mice injected with splenocytes either from WT mice or 14-3-3ε knockdown mice
developed tumors. It is possible that the defects in lymphoid behaviour that are observed
in the 14-3-3ε knockdown mice are due to systemic defects caused by the knockdown of
14-3-3ε in hematopoietic system. To determine whether the defect is specific to the
hematopoietic system, bone marrow cells from 14-3-3ε knockdown mice was injected in
tail vein of SCID mice. The mice were then monitored and sacrificed after 180 days. The
mice injected with bone marrows cells from 14-3-3ε knockdown mice do not show
increase in the size of spleen (Figure 4.4.13). This result suggests that bone marrows cells
from 14-3-3ε knockdown mice are not capable of inducing splenomegaly in SCID mice.

173
Figure 4.4.13: Bone marrow cells from 14-3-3ε knockdown mice are not capable of
inducing splenomegaly in SCID mice. The size of the spleens from SCID mice injected
with either bone marrow cells from 14-3-3ε knockdown mice or wild type littermate. Note
that there is no difference in size of spleens from the SCID mice injected with bone
marrow cells from 14-3-3ε knockdown mice as compared to wild type litter mate
controls.
To determine whether the enlarged lymph nodes present in some of the 14-3-3ε
knockdown mice, were due to the development of a tumor, a piece of the lymph node was
subcutaneously implanted on the back of a SCID mouse. As shown in (Figure 4.4.14 A &
B), the lymph node transplant developed large tumors and the tumor was transplantable
for three successive transplantations (Figure 4.4.14 C). Further, after the third
transplantation, a tumor bearing mouse was injected with radiolabeled FDG as described
in Materials and Methods and was followed by imaging on a Positron Emission
Tomography (PET) machine. As shown in (Figure 4.4.14 D), the tumor is vascularized
and able to take up the labeled FDG, thereby suggesting that enlarged lymph node from
14-3-3ε knockdown mice can form tumors. These experiments need to be repeated on
lymph nodes isolated from multiple mice before we can draw conclusions about whether
loss of 14-3-3ε leads to tumor progression.
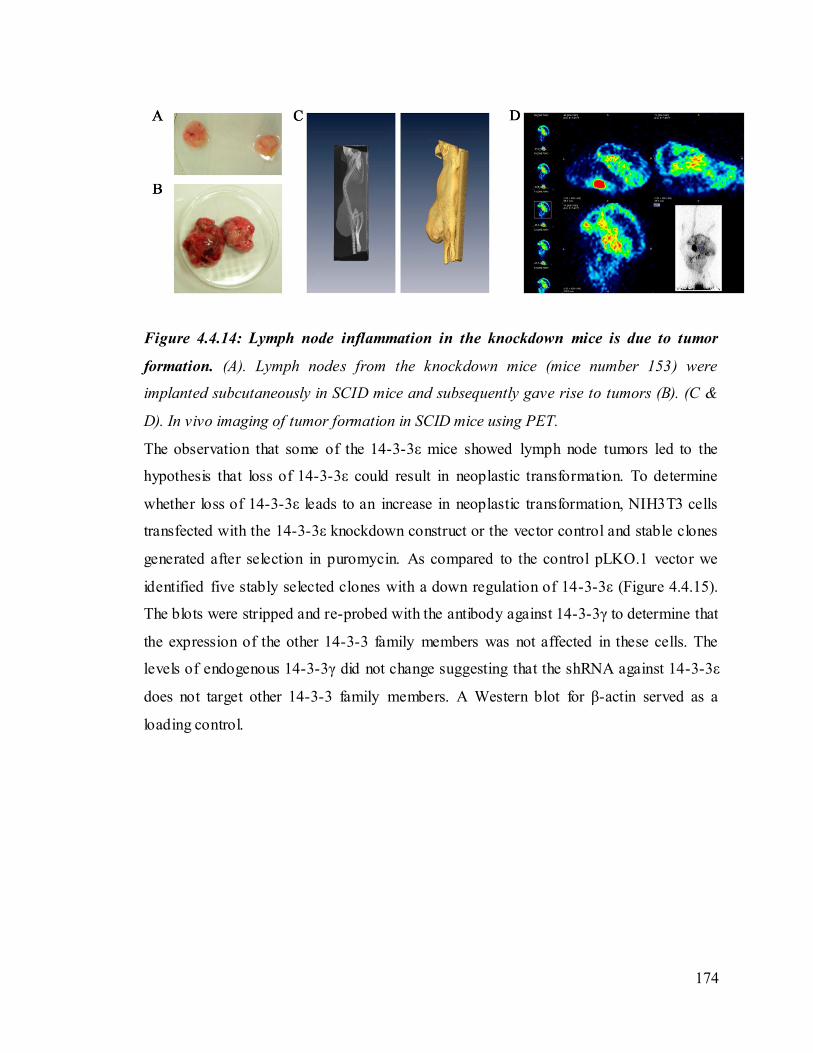
174
Figure 4.4.14: Lymph node inflammation in the knockdown mice is due to tumor
formation. (A). Lymph nodes from the knockdown mice (mice number 153) were
implanted subcutaneously in SCID mice and subsequently gave rise to tumors (B). (C &
D). In vivo imaging of tumor formation in SCID mice using PET.
The observation that some of the 14-3-3ε mice showed lymph node tumors led to the
hypothesis that loss of 14-3-3ε could result in neoplastic transformation. To determine
whether loss of 14-3-3ε leads to an increase in neoplastic transformation, NIH3T3 cells
transfected with the 14-3-3ε knockdown construct or the vector control and stable clones
generated after selection in puromycin. As compared to the control pLKO.1 vector we
identified five stably selected clones with a down regulation of 14-3-3ε (Figure 4.4.15).
The blots were stripped and re-probed with the antibody against 14-3-3γ to determine that
the expression of the other 14-3-3 family members was not affected in these cells. The
levels of endogenous 14-3-3γ did not change suggesting that the shRNA against 14-3-3ε
does not target other 14-3-3 family members. A Western blot for β-actin served as a
loading control.

175
Figure 4.4.15: Generation of stable 14-3-3ε knockdown clones in NIH-3T3 cells. 50 μg
protein lysate from control and clones that were stably transfected with the 14-3-3ε
knockdown construct were resolved on a 10% SDSPAGE gel and Western blots were
performed with antibodies to 14-3-3ε and 14-3-3γ. Western blots for actin served as a
loading control.
To determine whether 14-3-3ε can function as a tumor suppressor, stable cell clones
lacking 14-3-3ε generated in NIH3T3 cells were tested for their ability to form colonies
in soft agar as compared to the vector control. As shown in (Figure 4.4.16 A & B), the
14-3-3ε knockdown clone E17, formed larger and more colonies in soft agar as compared
to the vector control, P3. Further, cells lacking 14-3-3ε showed increased migratory
ability in a scratch wound healing assay (Figure 4.4.16 C & D). To further determine
whether loss of 14-3-3ε could lead to neoplastic transformation, the vector control and
knockdown cells were injected into SCID mice and the mice monitored for tumor
formation. As shown in (Figure 4.4.16 E & F), mice injected with the knockdown clones
showed the presence of larger tumors as compared to the vector control. These results
suggest that loss of 14-3-3ε leads to neoplastic progression. These results suggest that
loss of 14-3-3ε may lead to neoplastic transformation.
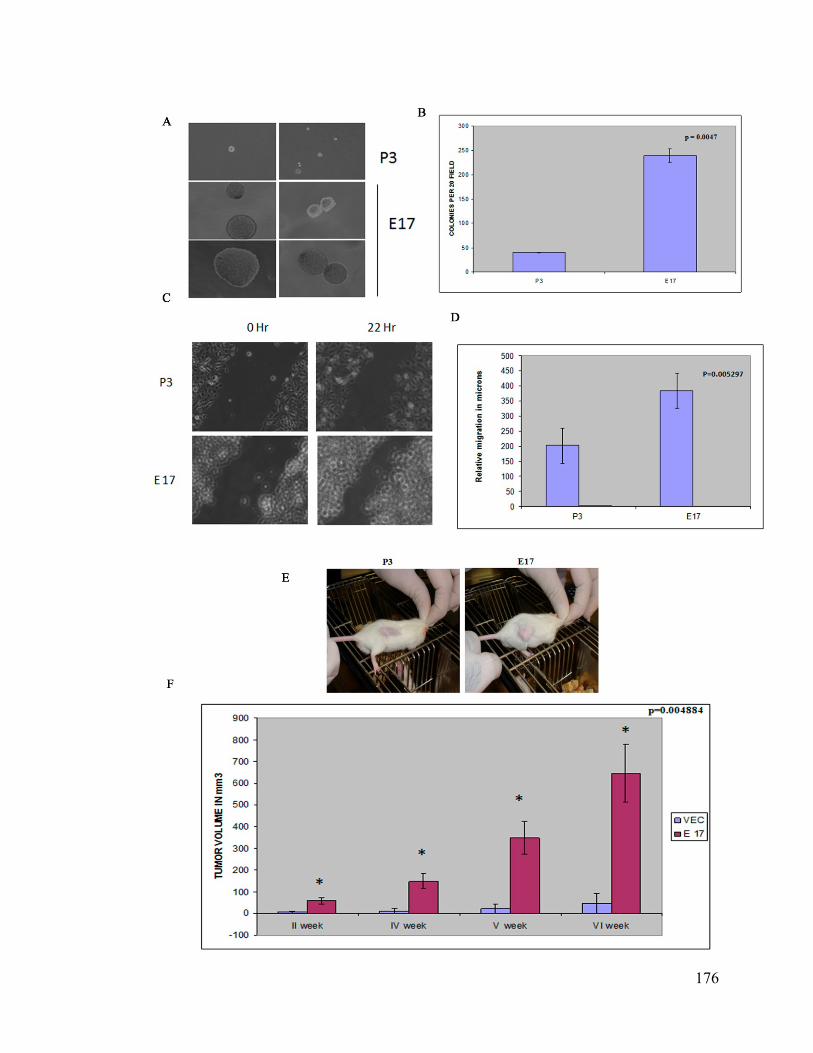
176

177
Figure 4.4.16: NIH3T3 cells lacking 14-3-3ε leads to acquisition of neoplastic
transformation. (A & B). The NIH 3T3 14-3-3ε knockdown clone E17 or the vector
control P3 were plated in soft agar and colony formation determined after 2-3 weeks.
The number of colonies formed by the clones per 20 fields (10X) was counted in triplicate
in each experiment and plotted as bar graph. (C & D). Scratch wound healing assays
were performed on the vector controls and E17. As shown, the distance migrated by the
knockdown clones was greater than the vector control. A graphical representation of the
data is shown. Significance was determined by the student’s t-test. (E & F). 106 cells of
each clone were injected into the flanks of six SCID mice and the mice were observed for
a period of six weeks. The mean tumor volume is plotted in graph. Significance was
determined by the student’s t-test.
4.4.6 Generation of inducible 14-3-3ε knockdown and over-expressor mice.
The 14-3-3ε knockdown mice show multiple phenotypes that were not observed in the
knockout mice (363), presumably because the 14-3-3ε knockout mice die just after birth.
To determine whether the phenotypes observed are due to loss of 14-3-3ε, a rescue
experiment needs to be performed to ensure that the defects observed in 14-3-3ε
knockdown mice were not due to off target effects of the shRNA constructs, a rescue
experiment with a 14-3-3ε cDNA needs to be performed. The shRNA resistant version of
mouse 14-3-3ε, 14-3-3ε-R, was cloned in pTRIPZ (Open Biosystems) downstream of the
HA epitope as described in Materials and Methods. Co-expression of wild type HA-14-
3-3ε or the HA-14-3-3ε-R mutant with pLKO.1 E1 construct followed by a Western blot
with the anti-HA antibody revealed that although wild type HA- 14-3-3ε expression was
inhibited by the shRNA construct, HA-14-3-3ε-R mutant was resistant to shRNA
mediated down regulation (Figure 4.4.17).
To perform the rescue experiment, we wished to generate mice in which expression of
both an shRNA for 14-3-3ε and an shRNA resistant 14-3-3ε construct could be induced
by doxycyclin. To generate inducible knockdown mice for 14-3-3ε, lentiviruses that
express a shRNAmiR that targets 14-3-3ε were cloned in pTRIPZ (Open Biosystems) as
described in Materials and Methods. Lentiviral particles containing both an RFP and a
shRNAmiR cassette that targets 14-3-3ε were injected into the interstitial spaces of the

178
developing testes to infect spermatogonial stem cells as described in Material and
Methods. The 14-3-3ε fore- founder mouse (indicated by the hatched box and arrow) was
mated with normal female mice of the same strain (Figure 4.4.18). The pups obtained
were then screened for the presence of RFP by performing polymerase chain reactions
with RFP specific primers on genomic DNA. A PCR reaction for the mouse patch (Ptc)
gene was performed as a loading control. Five out of seven animals showed the presence
of the RFP transgene (Figure 4.4.18). Stable lines will be generated and the ability of
doxycyclin to inhibit 14-3-3ε expression will be tested at a later date.
Figure 4.4.17: HA-14-3-3ε-R is resistant to degradation by E1 shRNA construct. 50µg
protein extracts from HCT116 cells co-transfected with shRNA constructs targeting 14-3-
3ε along with wild type or mutant 14-3-3ε were resolved on a 10% SDS-PAGE gel and
Western blots were performed using antibodies to GFP and actin. Note that 14-3-3ε-R
mutant is resistant to degradation by E1 shRNA construct as compared to WT-14-3-3ε.

179
Figure 4.4.18: Generation of inducible 14-3-3ε knockdown mice. Pedigree analysis for
pre-founder mice showing germline transmission of the transgene. Genomic DNA
amplification using primers for RFP or patch (as a loading control) are shown.
4.4.7 Conclusion
To study the contribution of 14-3-3ε in growth and development of mice 14-3-3ε
knockdown mice were generated as described (322). The 14-3-3ε knockdown mice died at
6 months post birth. It has been reported earlier that mice heterozygous or homozygous
null for 14-3-3ε have defects in brain development and neuronal migration (363). We
observed that although the level of 14-3-3ε in brain is significantly reduced, cortical
thinning was observed only in mice with a greater level of 14-3-3ε knockdown. These
mice showed pleotropic phenotypes including spleenomegaly and patchy hair loss
(alopecia). We observed lymphocytic infiltration in various organs (lung, liver and
kidney) of the 14-3-3ε knockdown mice. The levels of CD3+ and CD4+ cells were
significantly increased. Upon analysis we also found that the level of CD3+ CD4- CD8-
cells is more in the knockdown mice, generally observed in patients with leukemia (352).
It is also reported that the level of 14-3-3ε is significantly reduced in human malignancies

180
such as Leukemia or lymphoma (8, 9). We hyphothesized that the the CD3+ DN cells in
peripheral tissues like the spleen, may arise due to the hyperproliferation of immature T
cells. This hypothesis was strengthened by the finding that 14-3-3ε binds to SLP-76 in
presence of kinase HPK1 (79). These results therefore suggest that 14-3-3ε may
negatively regulate the T cell activation. To further understand the role of 14-3-3ε in
growth and development inducible knock down mice will be generated to test the
contribution of 14-3-3ε to development in the epidermis and in the lymphoid system.

181
CHAPTER 5
DISCUSSION
182
5. Discussion
5.1 Generation of lentiviral vectors.
Multiple lentiviral vectors have been developed during the course of this thesis that can be
used to express cassettes expressing either an shRNA, a cDNA or both in cultured cells
(122) and in transgenic mice (322). The lentiviral vectors generated were tested for their
ability to transduce cells in vitro and in vivo (Figure 4.1.5, Figure 4.2.1, Figure 4.2.3 and
Figure 4.3.5). Lentiviral vectors are widely used to infect non- dividing cells and
embryonic stem cells (284, 315). We have developed lentiviral vectors for the expression
of shRNA’s using a human U6 promoter that drives RNA Polymerase III based
transcription for the generation of shRNA transcripts. One limitation of earlier versions of
these vectors was that the number of restriction sites for cloning was limited. We have
introduced a novel MCS containing additional restriction sites for cloning shRNA’s,
resulting in the generation of a versatile vector that can be used by multiple users (Figure
4.1.1). Older versions of these vectors did not contain a cDNA for a fluorescent reporter
(e.g. EGFP-f) that could be used to track transduced cells. To overcome this hurdle, we
have also generated lentiviral vectors capable of expressing both the shRNA and a
fluorescent reporter (EGFP-f) (Figure 4.1.2).
Five different bi-cistronic lentiviral vectors have been generated in this report for the
expression of fusion proteins tagged at the N-terminus with a fluorescent tag in
mammalian cells (Figure 4.1.4). Apart from providing a greater choice of restriction sites,
this vector contains Nhe1 and Not1 sites upstream of the IRES. These sites permit the
cloning of both N terminal and C terminal tagged fluorescent fusion proteins from any of
the commercially available expression vectors into the lentiviral vectors generated in this
report. The bi-cistronic lentiviral vectors presented here could also be used for other
imaging techniques such as fluorescence resonance energy transfer (FRET) and
fluorescence (FRAP) (Figure 4.1.6 and Figure 4.1.7). Currently lentiviral vectors are
being extensively used to generate transgenic animals (135, 234, 257, 284, 307, 322, 360,
361). Recently, non- invasive high-resolution multiphoton tomography has demonstrated
the in-vivo imaging of the live animal expressing fluorescent proteins under tissue specific
promoter (368). This advancement in the in-vivo imaging method enables the researcher

183
to generate transgenic animals expressing different fluorescent prote ins. The bi-cistronic
lentiviral vectors in this report described thus can be used to generate transgenic animals
to perform functional genomic studies in vivo.
5.2 Novel protocol for the generation of transgenic mice.
A new cost effective, rapid technique with a high rate of success for the generation of
transgenic mice by in vivo transduction of the gene of interest into undifferentiated
spermatogonia has been developed during the course of this thesis using EGFP-f as the
transgene (322). This technology does not compromise the fertility of the off-spring,
resulting in germline transmission of the transgene, using a limited number of animals.
Previously published reports have demonstrated that lentiviral mediated transgenesis is
relatively stable and can be inherited in the germline (240, 259, 283, 284). Thus, the use
of lentiviruses as a vector delivery system to generate transgenic animals does not
compromise inheritance or the development of the animal, results that are consistent with
those obtained in this report (Figure 4.2.2). Further, previous protocols that modify
spermatogonial stem cells, either in vitro or in vivo, used retroviruses and yielded
transgenic pups at very low efficiencies (169, 253). Previously, male rat germ cells were
transduced in culture using HIV-1 based lentiviral vectors, which were then transplanted
into the testis of wild type rats (138). The rate of colonization of the recombinant germ
cells in wild type testis was low (33%) and only one of three male mice was fertile. The
founder mice in these experiments produced founder pups at a rate of 30% (138). The
processes reported in this thesis result in a very high rate of transgenesis, with all the
animals being able to sire transgenic pups, leading to the rapid generation of multiple
transgenic pups with different integration events allowing the generation of multiple
transgenic lines (Table 4.2.1, Table 4.2.2 and Figure 4.2.4).
Recently, organotypic testis cultures have been generated that allow the production of
recombinant sperm, which could be used to generate transgenic animals (313). While this
allows the generation of recombinant sperm without the generation of profounder
animals, the process can be technically challenging, especially for laboratories not used to
establishing and propagating organotypic cultures. The procedures described in this thesis
are easily performed and require a small simple surgery. Although, the rate of

184
transgenesis reported here may not be better than the conventional lentiviral transgenesis
method (284), the technique is cost effective, simple and faster to perform. Further,
infecting the spermatogonial stem cells in vivo allows the repeated use of the pre-
founder, eliminating the necessity to repeatedly infect embryos or organotypic cultures
with lentiviruses. Further, as demonstrated here the pre-founder mice can be mated
multiple times, resulting the generation of a number of transgenic pups. As multiple
transgenic lines are required to rule out integration site specific events, the generation of
multiple lines described herein results in a quick analysis of the phenotype and allows
experiments to proceed at a rapid pace.
Several groups have reported that knockdown mice replicate the phenotypes observed in
knockout mice (360, 361, 373). While this greatly enhances the ability of scientists to
study the consequences of gene depletion in the whole animal, the use of implantation
strategies did not permit the use of genetic screens using lentivirus driven bar-coded
shRNA’s, as performed in cell lines in culture (22, 273). The protocol described in this
thesis now permits the use of such genetic screens in the whole animal to understand the
contribution of various gene products to growth, development and disease. Screens using
tissue specific production of miRNAs (296), or by using either temporal or tissue specific
Cre based inducible systems (361, 373) can also be designed to examine the effects of
knockdown/overexpression of a gene product in a particular tissue type. As the
experiments described in this thesis have shown, most of the mice have one or two
integration events (Figure 4.2.4). Therefore, it should be possible to design genetic
screens without worrying about the complications that could ensue from multiple
integration events in the same animal. The number of integration events could be
increased or decreased by altering the titer of the virus used for injection; however,
lowering titer might hamper efficiency of generation of transgenic mice in the F1
generation. The design of the constructs generated in this thesis also permits in vivo
rescue experiments using one lentiviral construct that expresses both the shRNA and the
resistant cDNA from different promoters, thus eliminating concern about off target
effects of the shRNA construct. Finally, the procedure could be extended to other
animals, especially non-human primates, resulting in a significant advancement in

185
transgenic research and the use of models that are closer to human subjects to model
human disease.
5.3 Generation of knockdown mice for 14-3-3ε and 14-3-3γ.
Human 14-3-3 and 14-3-3 are the only 14-3-3 isoforms that bind to and inhibit human
cdc25C function in vivo (71), while all 14-3-3 isoforms tested bind to cdc25C in vitro
(71). In humans, 14-3-3 proteins bind to cdc25C in vitro and in vivo upon
phosphorylation at a Serine residue at position 216; however a comparison of sequences
of cdc25C proteins from different species demonstrated that this sequence was absent in
mouse cdc25C but was present in cdc25C from Xenopus laevis (Figure 4.3.1 b).
Consistent with this we observed that 14-3-3 proteins are unable to form a complex with
cdc25C in mouse cells (Figure 4.3.1 a). These results are also consistent with previously
published data that suggest that cdc25C null mice do not have cell cycle or checkpoint
defects (94). These results lead us to conclude that 14-3-3 proteins might regulate cell
cycle progression in a cdc25C independent fashion in the mouse.
Desmosomes are highly specialized adherens like junctions that anchor intermediate
filaments at membrane-associated plaques in adjoining epithelial cells (115). These
junctions are important for maintaining the integrity of tissues that endure mechanical
stress, such as the epidermis and myocardium. The importance of the mechanical
functions of desmosomal constituents is evident by pathologies reported in animal
models. Conditional loss of DP in the heart (106) or nullmutations of the armadillo
family proteins PG and PKP2 (25, 26, 114, 128, 302) yield animals with cardiac
abnormalities and associated lethality beginning at approximately embryonic day 11
(302). In PG knockout mice, embryos survive until birth and skin fragility was also
observed (25).
Several studies have shown the role of the desmosome and its components in promoting
tumor progression. Desmosomal cadherin expression has been shown to be altered in a
number of types of cancers. Loss of DSG3 has been linked to poor prognosis in lung
cancer patients (100). DSG2 has also been shown to be significantly lost or down

186
regulated in gastric cancer cases (24, 397). DSC2 has been shown to be lost in colorectal
cancers (175). In oral squamous cell carcinoma (OSCC) samples, DSG3 and DSC3
showed low expression as compared to normal epithelia. Further, reduced DSC3 was
correlated with lymph node metastasis (379). Previous reports suggest that PG functions
as a tumor suppressor, as loss of heterozygosity of the plakoglobin gene and hyper
methylation of the plakoglobin promoter is associated with onset of early prostrate cancer
(333). PKP1 and PKP3 expression was observed to be extensively reduced in
oropharyngeal carcinomas (276). A previous report from our laboratory demonstrates that
PKP3 loss leads to a decrease in cell–cell adhesion leading to the stimulation of neoplastic
progression and metastasis (197). PKP3 is required for the recruitment of other
desmosomal proteins, to the cell border in human cell lines derived from both simple and
stratified epithelia (122). However, the recruitment of PKP3 to the cell border is
dependent on the presence of both PG and E-cadherin at the cell border to initiate
desmosome assembly (122). PG localizes to both desmosomes and adherens junctions,
and is required for the initiation of desmosome formation by adherens junctions (2, 179,
208). Initiation of desmosome formation is compromised upon loss of PG in cells lines
and tissues (2, 122, 302). The results described in this thesis build on this model and
demonstrate that 14-3-3γ is essential for recruitment of PG to the cell border (Figure
4.3.13) and initiation of de novo desmosome biogenesis (Figure 4.3.19). 14-3-3γ forms a
complex with PG (Figure 4.3.20) and upon loss of 14-3-3γ, PG recruitment to cell border
is compromised. In the absence of 14-3-3γ, PG does not localize to the border and
therefore cannot induce desmosome formation in collaboration with E-cadherin by
recruiting PKP3 to the cell border (Figure 4.3.13). Upon reintroduction of shRNA
resistant 14-3-3γ in knockdown cells rescue the recruitment of PG to the cell border,
therby suggesting that 14-3-3γ has a role in recruitment of PG to the cell border (Figure
4.3.18).
A key question that is currently being addressed in the literature is how are desmosomal
proteins transported to the border and assembled to form desmosomes. Microtubule (MT)-
based motor proteins in the kinesin superfamily support vesicular transport toward the cell
membrane (reviewed in (152, 374)). Kinesins are a family of molecular motors that use
the energy of ATP hydrolysis to move along the surface of microtubule filaments

187
(reviewed in (152, 374)). Kinesins transport cargo from the Golgi to the endoplasmic
reticulum (ER) and from the transGolgi network (TGN) to the plasma membrane (166),
and also transport lysosomes and endosomes (reviewed in (152, 374). Previous studies
suggest that upon loss of kinesin associated protein-3 (KAP3), the nonmotor accessory
subunit of kinesin-2, an increase in cytoplasmic staining of N-cadherin was observed,
without change in overall expression, suggesting a defect in transport of N-cadherin to the
cell surface (355). It is reported earlier that p120 catenin (p120) a component of adherens
junctions is recruited to the cell border in microtubule dependent manner (57). The p120-
related molecule p0071 (plakophilin-4) has also been shown to interact with the kinesin-2
subunit KIF3B (174). Consistent with these reports, the kinesin 1 and kinesin 2 motor
proteins are required for the recruitment of desmosomal cadherins to the cell border in
SCC9 cells (260). The results reported in this thesis demonstrate that PG recruitment to
cell border in presence or absence of calcium is microtubule dependent (Figure 4.3.21).
Our data also shows that loss of kinesin 1 family motor protein KIF5B in HCT116 cells
results in an inability PG to the cell border (Figure 4.3.27), whereas E-cadherin
localization to the cell border is unaltered. Failure in recruitment of PG to the cell border
in KIF5B knockdown cells lead to altered localization of other desmosomal proteins
(Figure 4.3.28). This result is consistent with the observation that in PG knockdown cells,
PKP3 doesn’t accumulate at the cell border, resulting in an inhibition of desmosome
formation (122). These results are also consistent with previously published results that
suggest that PG is required for the stimulation of desmosome formation by preformed
adherens junctions (132, 171, 208, 235, 359) and that both PG and E-cadherin presence at
the border is required for the localization of PKP3 to the border and desmosome
formation (122, 235).
Our data demonstrates that 14-3-3γ forms a complex with both PG and KIF5B (Figure
4.3.20), thereby suggesting that 14-3-3γ, PG and KIF5B exist in a tripartite complex.
Kinesin localization on microtubules was not altered upon loss of 14-3-3γ. However, PG
did not localize to the cell border upon loss of either 14-3-3γ or KIF5B. Therefore, it is
possible that 14-3-3γ is required to load the PG on kinesin. However further investigation
is warranted to demonstrate that a tripartite complex between PG, KIF5B and 14-3-3γ is
formed and that this complex is required for transport of PG to the cell border.

188
Loss of cell adhesion between sertoli cells (SC-SC) or sertoli cell and germ cell (SC-GC)
leads to sterility in mice (185, 210, 248, 346, 403). Another important Sertoli cell feature
that is critical for spermatogenesis is the blood-testis barrier (BTB), an ultrastructure
comprised of co-existing and mutually interacting junction types (tight junctions (TJs),
basal ectoplasmic specializations (ESs), desmosomes and gap junctions) that basically
maintains epithelial cell polarity and integrity (58). Moreover loss of desmosomal proteins
(Dsg2 Dsc2/3) in sertoli cells has also disrupted BTB dynamics and function (210).
Consistent with this observation our data suggests that upon loss of 14-3-3γ, cell adhesion
between sertoli cells and germ cells is disrupted (Figure 4.3.9 and Figure 4.3.10). Further,
cell adhesion between adjacent sertoli cells is disrupted leading to collapse of the BTB,
presumably due to defects in desmosome formation (Figure 4.3.16). Consistent with these
observations our data also suggest that upon loss of 14-3-3γ in cell culture the cell-cell
adhesion is greatly reduced (Figure 4.3.11) with inability to form desmosomes Consistent
with these observations our data also suggest that upon loss of 14-3-3γ in cell culture the
adhesion of cell to ECM substrate (Collagen IV) is greatly reduced (Figure 4.3.13). These
results are consistent with the previous observation that upon loss of 14-3-3θ, sertoli cell
adhesion is compromised (386). Decrease in desmosome formation in testis upon loss of
14-3-3γ might affect other complexes in BTB. To address this issue, tissue sections need
to be stained with antibodies to other junctional proteins. Desmosome like junctions, are
found between Sertoli cells at the BTB and between-Sertoli cells and all germ cells up to
stage VIII (elongating spermatids) (58, 61, 247, 248). Consistent with this observation we
found that loss of 14-3-3γ leads to arrest in stage VIII of spermatogenic cycle (Figure
4.3.7). These results suggest that 14-3-3γ loss results in decrease desmosome formation
leading to mice sterility.
Recent studies have shown that the basement membrane in the testis is important to the
event of germ cell movement across the BTB because proteins in the ECM were shown to
regulate BTB dynamics (58). Previous reports suggest that defects in the basement
membrane can lead to Infertility in men (309, 310) . Consistent with these observations,
our data demonstrates upon loss of 14-3-3γ, adhesion of GC and SC to basal lamina is
compromised leading to mice sterility (Figure 4.3.9). Collagens are ubiquitous structural
proteins found in ECM of all mammalian tissues including the testis, with 19 collagen

189
subtypes known to date. Type IV collagen, a network-forming collagen type (293), and
laminins are the most abundant building blocks of the basement membrane (88, 293, 357,
358). It was recently shown that antibodies against collagen IV could perturb Sertoli cell -
BTB junction (337). Consistent with these observations our data also suggest that upon
loss of 14-3-3γ in cell culture the adhesion of cell to ECM substrate (Collagen IV) is
greatly reduced (Figure 4.3.12). The basement membrane type IV collagen can be
recognized by α1β1 and α2β1 integrins (146, 264). However previous unpublished work
from our laboratory suggest that 14-3-3γ do not bind to integrins (134). In the testis, at
the Sertoli cell–ECM interface, the only adhesive structure mounting Serto li cells to the
tunica propria is the hemidesmosome (60, 184, 387). It may be possible that disruption
desmosomal junctions upon loss of 14-3-3γ may also lead to the disruption of
hemidesmosomes in testis.
Our data demonstrates that transport of spermatozoa to epididymis is altered upon
knockdown of 14-3-3γ (Figure 4.3.8). In some semeniferous tubule, spermatocytes are
observed in the lumen of the knockdown testes; however the epididymal sacs are almost
empty (Figure 4.3.8). The process of spermatazoa maturation is known as spermiogenesis
(59). Heat shock proteins and male testis-specific members of the HSP70 family are
expressed during spermiogenesis (365). The testis-specific chaperone, HSC70, is
expressed in postmeiotic spermatids as they progress from step nine to the completion of
spermatogenesis, but the precise role of this protein is not known (364, 365). Previous
unpublished work by Amitabaha Mukhopadhaya in our laboratory suggests that HSC70
interacts with 14-3-3γ. It is possible that upon loss of 14-3-3γ in testis the HSC70
functions are perturbed leading to mice sterility, however this needs to be tested.
The 14-3-3γ knockout mice do not show any adhesion defects (342), which is surprising
given our findings. This might be due to strain specific differences or due to
compensation from other 14-3-3 family members in the knockout mouse. The in vitro
experiments performed during the course of this thesis demonstrate that the knockdown
phenotype can be rescued by a shRNA resistant 14-3-3γ cDNA. If a similar experiment
provides a rescue of the phenotype in vivo, it would suggest that our experimental
strategy which relies on generating hypomorphic mutants might reveal phenotypes that
are not observed upon performing traditional knockout experiments.

190
Based on all the above observations we constructed a model (Figure 5.1). 14-3-3γ is
important to load PG to microtubule motor protein Kinesin KIF5B, both in presence or
absence of calcium. Loss of 14-3-3γ disrupts loading of PG to KIF5B, and the recruitment
of PG to the cell border is compromised. The absence of PG on cell border upon loss of
14-3-3γ fails to recruit other desmosomal proteins thereby halting initiation o f desmosome
formation. These observations are consistent with previous results that suggest that
initiation of desmosomes is compromised upon loss of PG in cells lines and tissues (2,
122, 302). The failure to initiate desmosome formation upon loss of 14-3-3γ in testis lead
to reduced cell-cell and cell-ECM adhesion in cells and testis. The loss of adhesion can
further contribute to mice sterility.
The results from the in vitro studies suggest that loss of 14-3-3γ could lead to defects in
desmosome formation in tissues other than the testis. To test this hypothesis, transgenic
mice carrying either an inducible 14-3-3γ knockdown construct or mice containing a
shRNA for 14-3-3γ downstream of a tissue specific promoter could be generated. These
reagents will help in the study the role of 14-3-3γ in cell-cell adhesion and desmosome
formation in multiple tissues and will determine whether loss of 14-3-3γ leads to global
defects in desmosome formation or whether it is required for the formation of desmosome
like junctions only in the testis. In the present study however, there are some questions
that need to be answered, such as (1) which region of PG and KIF5B are required for
complex formation with 14-3-3γ? (2) Can over expression of a mutant KIF5B that cannot
bind to 14-3-3γ result in an alteration in the localization of PG at the cell border? (3) Will
a mutant PG protein that cannot bind to 14-3-3γ localize to the cell border? (4) Can down
regulation of KIF5B in mouse testis phenocopy the cell adhesion defects observed upon
loss of 14-3-3γ?
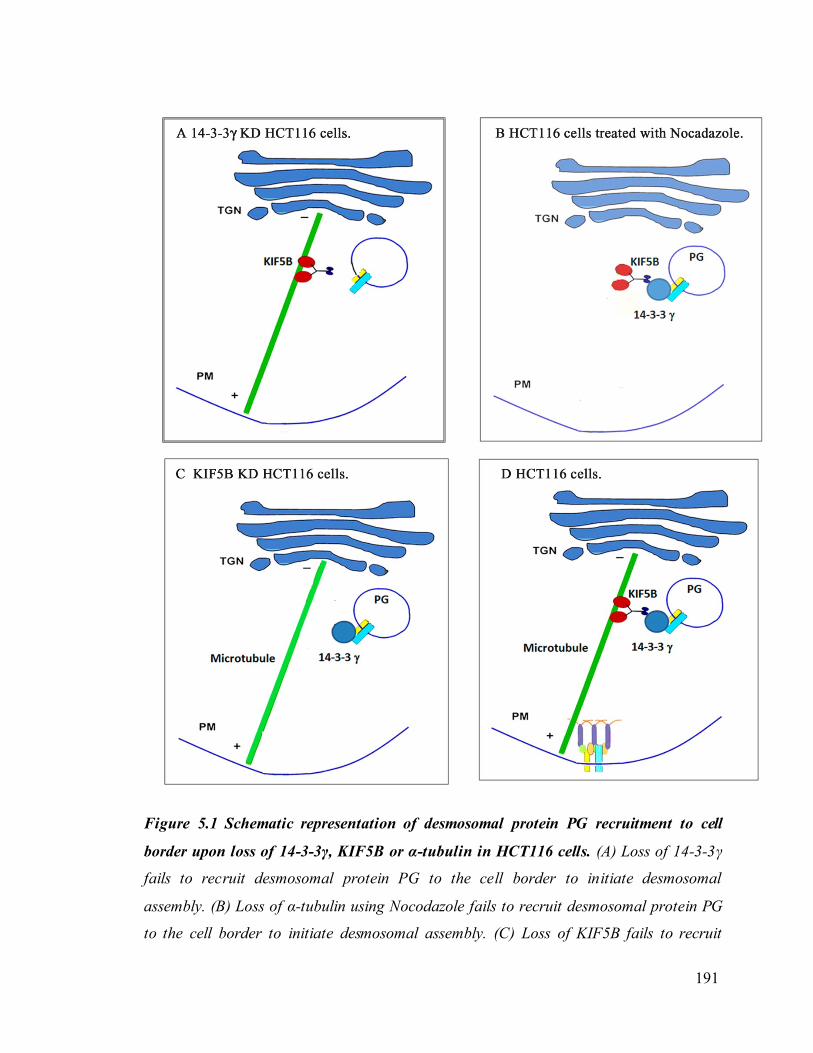
191
Figure 5.1 Schematic representation of desmosomal protein PG recruitment to cell
border upon loss of 14-3-3γ, KIF5B or α-tubulin in HCT116 cells. (A) Loss of 14-3-3γ
fails to recruit desmosomal protein PG to the cell border to initiate desmosomal
assembly. (B) Loss of α-tubulin using Nocodazole fails to recruit desmosomal protein PG
to the cell border to initiate desmosomal assembly. (C) Loss of KIF5B fails to recruit

192
desmosomal protein PG to the cell border to initiate desmosomal assembly. (D) 14-3-3γ
act as an adaptor between PKG and KIF5B to transport PKG to cell border in a
microtubule dependent manner in WT HCT116 cells.
The 14-3-3ε knockdown mice died at 6 months post birth. These mice showed pleotropic
phenotypes, the first being splenomegaly (Figure 4.4.7). The mice which had enlarged
spleens also showed lymphocytic infiltration in the lungs, liver and kidneys (Figure
4.4.8). The enlarged spleens and the lungs showed an increased level of CD3 positive
cells (Figure 4.4.9). An analysis of the CD3 positive cells from the spleens of the 14-3-3ε
knockdown mice showed that the levels of CD3+ and CD4+ cells in splenocytes were
significantly increased (Figure 4.4.11). Upon further analysis, we also found that the level
of CD3+ CD4- CD8- (CD3+ DN) cells were increased in the knockdown mice (Figure
4.4.11), a phenotype generally observed in patients with leukemia (352). During T cell
development, CD3+ DN cells that do not mature die due to the induction of apoptosis and
therefore, these cells are not seen in peripheral tissues (190). The data reported in the
thesis suggest two possibilities: (1) either the CD3+DN immature cells evade apoptosis
(2) or the rate of proliferation of CD3+DN exceeds the rate of clearance of CD3+DN
immature thymocytes by apoptosis.
It has been reported previously that one of the proteins that is required for T-cell
maturation and activation is SLP76. SLP76 is an adaptor protein that positively regulates
T cell receptor (TCR) signaling. SLP76-/- mice contained no peripheral T cells as a result
of an early block in thymopoiesis at DN stage (63). Thus, the SLP-76 adapter protein is
required for normal thymocyte development and plays a crucial role in translating signals
mediated by pre-T cell receptors into distal biochemical events (63). Upon T cell
activation, SLP-76 activation results in an increase in the phosphorylation of
phospolipaseCγ at Tyrosine 783 (79). It has been previously reported that SLP76 binds to
14-3-3 proteins and that this is dependent on phosphorylation of SLP76 at a Serine
residue at position 376 by HPK1 (79). We have confirmed that the SLP76 interacts with
14-3-3ε in presence of HPK1 (Figure 4.4.12). We further hypothesized that 14-3-3ε
association with SLP76 is required to inhibit SLP76 signaling thus resulting in the
formation of a negative feedback loop. This was supported by the observation that upon

193
loss of 14-3-3ε the T cell activation is more as determined by the increased
phosphorylation of phospolipaseCγ at Tyrosine 783 (Figure 4.4.12). Therefore, these
results suggest that 14-3-3ε may negatively regulate T cell activation.
Bone marrow cells from 14-3-3ε knockdown mice were not capable of inducing
splenomegaly in immunocompromised mice suggesting that the defects in lymphoid
behaviour that are observed in the 14-3-3ε knockdown mice are not due to systemic
defects caused by the knockdown of 14-3-3ε in hematopoietic system (Figure 4.4.13).
Splenomegaly is often seen in leukemia; however isolated splenocytes from 14-3-3ε
knockdown mice did not form a tumor when injected subcutaneously into
immunocompromised mice. However, it was observed that the enlarged lymph nodes
present in some of the 14-3-3ε knockdown mice, developed tumors when transplanted
subcutaneously in SCID mice and the tumor was transplantable for 3 successive
transplantations, thereby suggesting that enlarged lymph node from 14-3-3ε knockdown
mice can form tumors (Figure 4.4.14). Interestingly, multiple reports have suggested that
14-3-3ε levels are reduced in adult T-cell leukemias (8, 9). Our results suggest that loss of
14-3-3ε results in increased division and survival of immature thymocytes, however
additional hits maybe required for these cells to give rise to neoplastic disease. These
results are consistent with the observation that the NIH 3T3 derived 14-3-3ε knockdown
cells which do not have an intact p53 pathway (176) are transformed (Figure 4.4.16).
These results suggest that loss of 14-3-3ε could result in neoplastic transformation.
It has been reported previously mice heterozygous with respect to 14-3-3ε are normal and
fertile, however homozygous null mice died at birth due to defects in the organization of
cortical layers resulting in lower neuronal migration of hippocampal and cortical neurons
(363). We have not observed any 14-3-3ε knockdown mice that died at birth, possibly
because the 14-3-3ε protein levels in these mice are sufficient to support normal cortical
development, which is compromised in the knockout mice (363). We found that the
thickness for cortical layer in knockdown mice is reduced in some of the 14-3-3ε
knockdown mice generated as determined by in-situ hybridization using cortical layer II-
IV specific marker cux2 (Figure 4.4.3). These results are consistent with the observations
that are made in 14-3-3ε knockout mice. However, the differences between WT and 14-3-
3ε knockdown mice are difficult to quantify and need to be repeated with larger numbers

194
of mice with a consistent knockdown to convincingly demonstrate that the knockdown
mice show defects in the development of the cerebral cortex. This would be best
accomplished by generating inducible knockdown mice, specifically mice that have a
specific knockdown in the cortex using tissue specific promoters.
The 14-3-3ε knockdown mice show patchy hair loss and the organization of the
epidermis is disturbed in the 14-3-3ε knockdown mice (Figure 4.4.4 and Figure 4.4.5). It
was also observed that the average thickness of the skin is reduced in 14-3-3ε knockdown
mice with patchy hair loss (Figure 4.4.5). We found that only keratin 14, a marker for the
basal layer was present in skin sections from 14-3-3ε knockdown mice (Figure 4.4.6).
Till date no report has shown the role of 14-3-3ε in skin stratification, however a report
by Kilani et al demonstrate that 14-3-3ε is present in terminally differentiated
keratinocytes and is not present in the basal layer, thereby suggesting that 14-3-3ε may
play an important role in organization of stratification of skin (177). Based on the
observations made by Kilani et. al. (177) one could hypothesize that upon loss of 14-3-3ε
in skin terminal differentiation of keratinocytes would be blocked, which is exactly what
is observed in the 14-3-3ε knockdown mice. In our study, we were unable to determine
how the loss of 14-3-3ε leads to patchy hair loss and disruption of hair follicle
differentiation. It is possible that 14-3-3ε may regulate hair follicle development by
regulating the differentiation of the bulge stem cells and the hair cycle (177). However
these observations would be strengthened by generating a skin specific knockdown of 14-
3-3ε. The results presented here suggest that 14-3-3ε may be required for skin
stratification and the development of hair follicles as in the absence of 14-3-3ε, the basal
layer is not able to completely differentiate to form upper stratified layers in epidermis of
skin and hair follicle development is severely compromised. Upon loss of 14-3-3ε in
mice pleotropic phenotypes were observed which were not reported earlier; therefore the
rescue experiments needs to be performed in future. This can be achieved by generating a
mouse line expressing inducible 14-3-3ε resistant to E1 shRNA and further can be used
to cross breed with 14-3-3ε knockdown mice. To test whether 14-3-3ε plays a role in hair
follicle development or skin diferentiation, transgenic mice carrying either an inducible
14-3-3ε knockdown construct downstream of a tissue specific promoter could be
generated.

195
BIBLIOGRAPHY:
1. Abraham, R. T. 2001. Cell cycle checkpoint signaling through the ATM and
ATR kinases. Genes Dev 15:2177-2196. 2. Acehan, D., C. Petzold, I. Gumper, D. D. Sabatini, E. J. Muller, P. Cowin,
and D. L. Stokes. 2008. Plakoglobin is required for effective intermediate filament anchorage to desmosomes. J Invest Dermatol 128:2665-2675.
3. Ahangarani, R. R., W. Janssens, V. Carlier, L. Vanderelst, T.
Vandendriessche, M. Chuah, M. Jacquemin, and J. M. Saint-Remy. 2011. Retroviral vectors induce epigenetic chromatin modifications and IL-10
production in transduced B cells via activation of toll- like receptor 2. Mol Ther 19:711-722.
4. Ahn, J. Y., J. K. Schwarz, H. Piwnica-Worms, and C. E. Canman. 2000.
Threonine 68 phosphorylation by ataxia telangiectasia mutated is required for efficient activation of Chk2 in response to ionizing radiation. Cancer Res
60:5934-5936. 5. Aitken, A. 2006. 14-3-3 proteins: a historic overview. Semin Cancer Biol 16:162-
172.
6. Aitken, A. 2002. Functional specificity in 14-3-3 isoform interactions through dimer formation and phosphorylation. Chromosome location of mammalian
isoforms and variants. Plant Mol Biol 50:993-1010. 7. Alam, H., A. V. Bhate, P. Gangadaran, S. S. Sawant, S. Salot, L. Sehgal, P. P.
Dange, D. A. Chaukar, K. D'Cruz A, S. Kannan, R. Gude, S. Kane, S. N.
Dalal, and M. M. Vaidya. 2012. Fascin overexpression promotes neoplastic progression in Oral Squamous Cell Carcinoma. BMC Cancer 12:32.
8. Alizadeh, A. A., M. B. Eisen, R. E. Davis, C. Ma, I. S. Lossos, A. Rosenwald,
J. C. Boldrick, H. Sabet, T. Tran, X. Yu, J. I. Powell, L. Yang, G. E. Marti, T.
Moore, J. Hudson, Jr., L. Lu, D. B. Lewis, R. Tibshirani, G. Sherlock, W. C.
Chan, T. C. Greiner, D. D. Weisenburger, J. O. Armitage, R. Warnke, R.
Levy, W. Wilson, M. R. Grever, J. C. Byrd, D. Botstein, P. O. Brown, and L.
M. Staudt. 2000. Distinct types of diffuse large B-cell lymphoma identified by gene expression profiling. Nature 403:503-511.
9. Alizadeh, A. A., D. T. Ross, C. M. Perou, and M. van de Rijn. 2001. Towards
a novel classification of human malignancies based on gene expression patterns. J Pathol 195:41-52.
10. Anastasiadis, P. Z., and A. B. Reynolds. 2000. The p120 catenin family: complex roles in adhesion, signaling and cancer. J Cell Sci 113 ( Pt 8):1319-1334.
11. Andrews, B., and V. Measday. 1998. The cyclin family of budding yeast: abundant use of a good idea. Trends Genet 14:66-72.
12. Angst, B. D., C. Marcozzi, and A. I. Magee. 2001. The cadherin superfamily: diversity in form and function. J Cell Sci 114:629-641.
13. Astuti, P., R. Boutros, B. Ducommun, and B. Gabrielli. 2010. Mitotic
phosphorylation of Cdc25B Ser321 disrupts 14-3-3 binding to the high affinity Ser323 site. J Biol Chem 285:34364-34370.
196
14. Baccetti, B., and C. Spadafora. 2000. Proceedings of the workshop "sperm-mediated gene transfer: advances in sperm cell research and applications." Siena,
Italy May 23-6, 1999. Conclusions. Mol Reprod Dev 56:329-330. 15. Bakkenist, C. J., and M. B. Kastan. 2003. DNA damage activates ATM through
intermolecular autophosphorylation and dimer dissociation. Nature 421:499-506. 16. Baldin, V., C. Cans, M. Knibiehler, and B. Ducommun. 1997. Phosphorylation
of human CDC25B phosphatase by CDK1-cyclin A triggers its proteasome-
dependent degradation. J Biol Chem 272:32731-32734. 17. Bartek, J., C. Lukas, and J. Lukas. 2004. Checking on DNA damage in S
phase. Nat Rev Mol Cell Biol 5:792-804. 18. Bartek, J., and J. Lukas. 2003. Chk1 and Chk2 kinases in checkpoint control
and cancer. Cancer Cell 3:421-429.
19. Bass-Zubek, A. E., L. M. Godsel, M. Delmar, and K. J. Green. 2009. Plakophilins: multifunctional scaffolds for adhesion and signaling. Curr Opin Cell
Biol 21:708-716. 20. Baus, F., V. Gire, D. Fisher, J. Piette, and V. Dulic. 2003. Permanent cell cycle
exit in G2 phase after DNA damage in normal human fibroblasts. Embo J
22:3992-4002. 21. Bermudez, V. P., L. A. Lindsey-Boltz, A. J. Cesare, Y. Maniwa, J. D. Griffith,
J. Hurwitz, and A. Sancar. 2003. Loading of the human 9-1-1 checkpoint complex onto DNA by the checkpoint clamp loader hRad17-replication factor C complex in vitro. Proc Natl Acad Sci U S A 100:1633-1638.
22. Berns, K., E. M. Hijmans, J. Mullenders, T. R. Brummelkamp, A. Velds, M.
Heimerikx, R. M. Kerkhoven, M. Madiredjo, W. Nijkamp, B. Weigelt, R.
Agami, W. Ge, G. Cavet, P. S. Linsley, R. L. Beijersbergen, and R. Bernards. 2004. A large-scale RNAi screen in human cells identifies new components of the p53 pathway. Nature 428:431-437.
23. Berry, L. D., and K. L. Gould. 1996. Regulation of Cdc2 activity by phosphorylation at T14/Y15. Prog Cell Cycle Res 2:99-105.
24. Biedermann, K., H. Vogelsang, I. Becker, S. Plaschke, J. R. Siewert, H.
Hofler, and G. Keller. 2005. Desmoglein 2 is expressed abnormally rather than mutated in familial and sporadic gastric cancer. J Pathol 207:199-206.
25. Bierkamp, C., K. J. McLaughlin, H. Schwarz, O. Huber, and R. Kemler. 1996. Embryonic heart and skin defects in mice lacking p lakoglobin. Dev Biol
180:780-785. 26. Bierkamp, C., H. Schwarz, O. Huber, and R. Kemler. 1999. Desmosomal
localization of beta-catenin in the skin of plakoglobin null-mutant mice.
Development 126:371-381. 27. Blasina, A., E. S. Paegle, and C. H. McGowan. 1997. The role of inhibitory
phosphorylation of CDC2 following DNA replication block and radiation- induced damage in human cells. Mol Biol Cell 8:1013-1023.
28. Blomberg, I., and I. Hoffmann. 1999. Ectopic expression of Cdc25A accelerates
the G(1)/S transition and leads to premature activation of cyclin E- and cyclin A-dependent kinases. Mol Cell Biol 19:6183-6194.

197
29. Blomer, U., L. Naldini, T. Kafri, D. Trono, I. M. Verma, and F. H. Gage. 1997. Highly efficient and sustained gene transfer in adult neurons with a
lentivirus vector. J Virol 71:6641-6649. 30. Botz, J., K. Zerfass-Thome, D. Spitkovsky, H. Delius, B. Vogt, M. Eilers, A.
Hatzigeorgiou, and P. Jansen-Durr. 1996. Cell cycle regulation of the murine cyclin E gene depends on an E2F binding site in the promoter. Mol Cell Biol 16:3401-3409.
31. Brandeis, M., I. Rosewell, M. Carrington, T. Crompton, M. A. Jacobs, J.
Kirk, J. Gannon, and T. Hunt. 1998. Cyclin B2-null mice develop normally and
are fertile whereas cyclin B1-null mice die in utero. Proc Natl Acad Sci U S A 95:4344-4349.
32. Brinster, R. L., H. Y. Chen, M. E. Trumbauer, M. K. Yagle, and R. D.
Palmiter. 1985. Factors affecting the efficiency of introducing foreign DNA into mice by microinjecting eggs. Proc Natl Acad Sci U S A 82:4438-4442.
33. Brinster, R. L., H. Y. Chen, R. Warren, A. Sarthy, and R. D. Palmiter. 1982. Regulation of metallothionein--thymidine kinase fusion plasmids injected into mouse eggs. Nature 296:39-42.
34. Brondello, J. M., M. N. Boddy, B. Furnari, and P. Russell. 1999. Basis for the checkpoint signal specificity that regulates Chk1 and Cds1 protein kinases. Mol
Cell Biol 19:4262-4269. 35. Brown, A. L., C. H. Lee, J. K. Schwarz, N. Mitiku, H. Piwnica-Worms, and J.
H. Chung. 1999. A human Cds1-related kinase that functions downstream of
ATM protein in the cellular response to DNA damage. Proc Natl Acad Sci U S A 96:3745-3750.
36. Brummelkamp, T. R., R. Bernards, and R. Agami. 2002. A system for stable expression of short interfering RNAs in mammalian cells. Science 296:550-553.
37. Brummelkamp, T. R., R. Bernards, and R. Agami. 2002. A system for stable
expression of short interfering RNAs in mammalian cells. Science 296:550-553. 38. Brunet, A., F. Kanai, J. Stehn, J. Xu, D. Sarbassova, J. V. Frangioni, S. N.
Dalal, J. A. DeCaprio, M. E. Greenberg, and M. B. Yaffe. 2002. 14-3-3 transits to the nucleus and participates in dynamic nucleocytoplasmic transport. J Cell Biol 156:817-828.
39. Bulavin, D. V., Y. Higashimoto, Z. N. Demidenko, S. Meek, P. Graves, C.
Phillips, H. Zhao, S. A. Moody, E. Appella, H. Piwnica-Worms, and A. J.
Fornace, Jr. 2003. Dual phosphorylation controls Cdc25 phosphatases and mitotic entry. Nat Cell Biol 5:545-551.
40. Bunz, F., A. Dutriaux, C. Lengauer, T. Waldman, S. Zhou, J. P. Brown, J. M.
Sedivy, K. W. Kinzler, and B. Vogelstein. 1998. Requirement for p53 and p21 to sustain G2 arrest after DNA damage. Science 282:1497-1501.
41. Burns, J. C., E. Corbo, J. Degen, M. Gohil, C. Anterasian, B. Schraven, G. A.
Koretzky, S. Kliche, and M. S. Jordan. 2011. The SLP-76 Src homology 2 domain is required for T cell development and activation. J Immunol 187:4459-
4466. 42. Byun, T. S., M. Pacek, M. C. Yee, J. C. Walter, and K. A. Cimprich. 2005.
Functional uncoupling of MCM helicase and DNA polymerase activities activates the ATR-dependent checkpoint. Genes Dev 19:1040-1052.
198
43. Cans, C., B. Ducommun, and V. Baldin. 1999. Proteasome-dependent degradation of human CDC25B phosphatase. Mol Biol Rep 26:53-57.
44. Capecchi, M. R. 1989. Altering the genome by homologous recombination. Science 244:1288-1292.
45. Caviston, J. P., and E. L. Holzbaur. 2006. Microtubule motors at the intersection of trafficking and transport. Trends Cell Biol 16:530-537.
46. Cerosaletti, K., and P. Concannon. 2004. Independent roles for nibrin and
Mre11-Rad50 in the activation and function of Atm. J Biol Chem 279:38813-38819.
47. Chan, A. W., K. Y. Chong, C. Martinovich, C. Simerly, and G. Schatten. 2001. Transgenic monkeys produced by retroviral gene transfer into mature oocytes. Science 291:309-312.
48. Chan, A. W., E. J. Homan, L. U. Ballou, J. C. Burns, and R. D. Bremel. 1998. Transgenic cattle produced by reverse-transcribed gene transfer in oocytes. Proc
Natl Acad Sci U S A 95:14028-14033. 49. Chan, F. K., J. Zhang, L. Cheng, D. N. Shapiro, and A. Winoto. 1995.
Identification of human and mouse p19, a novel CDK4 and CDK6 inhibitor with
homology to p16ink4. Mol Cell Biol 15:2682-2688. 50. Chan, T. A., H. Hermeking, C. Lengauer, K. W. Kinzler, and B. Vogelstein.
1999. 14-3-3Sigma is required to prevent mitotic catastrophe after DNA damage. Nature 401:616-620.
51. Charrier-Savournin, F. B., M. T. Chateau, V. Gire, J. Sedivy, J. Piette, and
V. Dulic. 2004. p21-Mediated nuclear retention of cyclin B1-Cdk1 in response to genotoxic stress. Mol Biol Cell 15:3965-3976.
52. Chaturvedi, P., W. K. Eng, Y. Zhu, M. R. Mattern, R. Mishra, M. R. Hurle,
X. Zhang, R. S. Annan, Q. Lu, L. F. Faucette, G. F. Scott, X. Li, S. A. Carr,
R. K. Johnson, J. D. Winkler, and B. B. Zhou. 1999. Mammalian Chk2 is a
downstream effector of the ATM-dependent DNA damage checkpoint pathway. Oncogene 18:4047-4054.
53. Chaudhri, M., M. Scarabel, and A. Aitken. 2003. Mammalian and yeast 14-3-3 isoforms form distinct patterns of dimers in vivo. Biochem Biophys Res Commun 300:679-685.
54. Chehab, N. H., A. Malikzay, M. Appel, and T. D. Halazonetis. 2000. Chk2/hCds1 functions as a DNA damage checkpoint in G(1) by stabilizing p53.
Genes Dev 14:278-288. 55. Chen, M. S., J. Hurov, L. S. White, T. Woodford-Thomas, and H. Piwnica-
Worms. 2001. Absence of apparent phenotype in mice lacking Cdc25C protein
phosphatase. Mol Cell Biol 21:3853-3861. 56. Chen, M. S., C. E. Ryan, and H. Piwnica-Worms. 2003. Chk1 kinase
negatively regulates mitotic function of Cdc25A phosphatase through 14-3-3 binding. Mol Cell Biol 23:7488-7497.
57. Chen, X., S. Kojima, G. G. Borisy, and K. J. Green. 2003. p120 catenin
associates with kinesin and facilitates the transport of cadherin-catenin complexes to intercellular junctions. J Cell Biol 163:547-557.
199
58. Cheng, C. Y., and D. D. Mruk. 2002. Cell junction dynamics in the testis: Sertoli-germ cell interactions and male contraceptive development. Physiol Rev
82:825-874. 59. Cheng, C. Y., and D. D. Mruk. 2011. Regulation of spermiogenesis, spermiation
and blood-testis barrier dynamics: novel insights from studies on Eps8 and Arp3. Biochem J 435:553-562.
60. Cheng, C. Y., E. W. Wong, P. P. Lie, M. W. Li, D. D. Mruk, H. H. Yan, K.
W. Mok, J. Mannu, P. P. Mathur, W. Y. Lui, W. M. Lee, M. Bonanomi, and
B. Silvestrini. 2011. Regulation of blood-testis barrier dynamics by desmosome,
gap junction, hemidesmosome and polarity proteins: An unexpected turn of events. Spermatogenesis 1:105-115.
61. Cheng, C. Y., E. W. Wong, H. H. Yan, and D. D. Mruk. 2010. Regulation of
spermatogenesis in the microenvironment of the seminiferous epithelium: new insights and advances. Mol Cell Endocrinol 315:49-56.
62. Cheng, X., and P. J. Koch. 2004. In vivo function of desmosomes. J Dermatol 31:171-187.
63. Clements, J. L., B. Yang, S. E. Ross-Barta, S. L. Eliason, R. F. Hrstka, R. A.
Williamson, and G. A. Koretzky. 1998. Requirement for the leukocyte-specific adapter protein SLP-76 for normal T cell development. Science 281:416-419.
64. Clermont, Y. 1972. Kinetics of spermatogenesis in mammals: seminiferous epithelium cycle and spermatogonial renewal. Physiol Rev 52:198-236.
65. Conklin, D. S., K. Galaktionov, and D. Beach. 1995. 14-3-3 proteins associate
with cdc25 phosphatases. Proc Natl Acad Sci U S A 92:7892-7896. 66. Consiglio, A., A. Quattrini, S. Martino, J. C. Bensadoun, D. Dolcetta, A.
Trojani, G. Benaglia, S. Marchesini, V. Cestari, A. Oliverio, C. Bordignon,
and L. Naldini. 2001. In vivo gene therapy of metachromatic leukodystrophy by lentiviral vectors: correction of neuropathology and protection against learning
impairments in affected mice. Nat Med 7:310-316. 67. Cortez, D., S. Guntuku, J. Qin, and S. J. Elledge. 2001. ATR and ATRIP:
partners in checkpoint signaling. Science 294:1713-1716. 68. Cozzi, E., E. Bosio, M. Seveso, M. Vadori, and E. Ancona. 2005.
Xenotransplantation-current status and future perspectives. Br Med Bull 75-
76:99-114. 69. Dalal, S. N., C. M. Schweitzer, J. Gan, and J. A. DeCaprio. 1999. Cytoplasmic
localization of human cdc25C during interphase requires an intact 14-3-3 binding site. Mol Cell Biol 19:4465-4479.
70. Dalal, S. N., C. M. Schweitzer, J. Gan, and J. A. DeCaprio. 1999. Cytoplasmic
localization of human cdc25C during interphase requires an intact 14-3-3 binding site. Mol. Cell. Biol. 19:4465-4479.
71. Dalal, S. N., M. B. Yaffe, and J. A. DeCaprio. 2004. 14-3-3 Family Members Act Coordinately to Regulate Mitotic Progression. Cell Cycle 3.
72. Dasika, G. K., S. C. Lin, S. Zhao, P. Sung, A. Tomkinson, and E. Y. Lee.
1999. DNA damage- induced cell cycle checkpoints and DNA strand break repair in development and tumorigenesis. Oncogene 18:7883-7899.
200
73. Davezac, N., V. Baldin, B. Gabrielli, A. Forrest, N. Theis-Febvre, M.
Yashida, and B. Ducommun. 2000. Regulation of CDC25B phosphatases
subcellular localization. Oncogene 19:2179-2185. 74. de Rooij, D. G., and L. D. Russell. 2000. All you wanted to know about
spermatogonia but were afraid to ask. Journal of andrology 21:776-798. 75. Dealy, M. J., K. V. Nguyen, J. Lo, M. Gstaiger, W. Krek, D. Elson, J. Arbeit,
E. T. Kipreos, and R. S. Johnson. 1999. Loss of Cul1 results in early embryonic
lethality and dysregulation of cyclin E. Nat Genet 23:245-248. 76. Den Haese, G. J., N. Walworth, A. M. Carr, and K. L. Gould. 1995. The Wee1
protein kinase regulates T14 phosphorylation of fission yeast Cdc2. Mol Biol Cell 6:371-385.
77. Desai, B. V., R. M. Harmon, and K. J. Green. 2009. Desmosomes at a glance. J
Cell Sci 122:4401-4407. 78. Dhup, S., and S. S. Majumdar. 2008. Transgenesis via permanent integration of
genes in repopulating spermatogonial cells in vivo. Nature methods 5:601-603. 79. Di Bartolo, V., B. Montagne, M. Salek, B. Jungwirth, F. Carrette, J.
Fourtane, N. Sol-Foulon, F. Michel, O. Schwartz, W. D. Lehmann, and O.
Acuto. 2007. A novel pathway down-modulating T cell activation involves HPK-1-dependent recruitment of 14-3-3 proteins on SLP-76. J Exp Med 204:681-691.
80. Donzelli, M., and G. F. Draetta. 2003. Regulating mammalian checkpoints through Cdc25 inactivation. EMBO Rep 4:671-677.
81. Donzelli, M., M. Squatrito, D. Ganoth, A. Hershko, M. Pagano, and G. F.
Draetta. 2002. Dual mode of degradation of Cdc25 A phosphatase. Embo J 21:4875-4884.
82. Dougherty, M. K., and D. K. Morrison. 2004. Unlocking the code of 14-3-3. J Cell Sci 117:1875-1884.
83. Draviam, V. M., S. Orrechia, M. Lowe, R. Pardi, and J. Pines. 2001. The
localization of human cyclins B1 and B2 determines CDK1 substrate specificity and neither enzyme requires MEK to disassemble the Golgi apparatus. J Cell Biol
152:945-958. 84. Ducruet, A. P., A. Vogt, P. Wipf, and J. S. Lazo. 2005. Dual specificity protein
phosphatases: therapeutic targets for cancer and Alzheimer's disease. Annu Rev
Pharmacol Toxicol 45:725-750. 85. Dulic, V., E. Lees, and S. I. Reed. 1992. Association of human cyclin E with a
periodic G1-S phase protein kinase. Science 257:1958-1961. 86. Dunphy, W. G., and A. Kumagai. 1991. The cdc25 protein contains an intrinsic
phosphatase activity. Cell 67:189-196.
87. Dykxhoorn, D. M., C. D. Novina, and P. A. Sharp. 2003. Killing the messenger: short RNAs that silence gene expression. Nat Rev Mol Cell Biol
4:457-467. 88. Dym, M. 1994. Basement membrane regulation of Sertoli cells. Endocr Rev
15:102-115.
89. Elia, A. E., L. C. Cantley, and M. B. Yaffe. 2003. Proteomic screen finds pSer/pThr-binding domain localizing Plk1 to mitotic substrates. Science
299:1228-1231.

201
90. Elia, A. E., P. Rellos, L. F. Haire, J. W. Chao, F. J. Ivins, K. Hoepker, D.
Mohammad, L. C. Cantley, S. J. Smerdon, and M. B. Yaffe. 2003. The
molecular basis for phosphodependent substrate targeting and regulation of Plks by the Polo-box domain. Cell 115:83-95.
91. Elledge, S. J. 1996. Cell cycle checkpoints: preventing an identity crisis. Science 274:1664-1672.
92. Ellison, V., and B. Stillman. 2003. Biochemical characterization of DNA
damage checkpoint complexes: clamp loader and clamp complexes with specificity for 5' recessed DNA. PLoS Biol 1:E33.
93. Evans, T., E. T. Rosenthal, J. Youngblom, D. Distel, and T. Hunt. 1983. Cyclin: a protein specified by maternal mRNA in sea urchin eggs that is destroyed at each cleavage division. Cell 33:389-396.
94. Ferguson, A. M., L. S. White, P. J. Donovan, and H. Piwnica-Worms. 2005. Normal cell cycle and checkpoint responses in mice and cells lacking Cdc25B and
Cdc25C protein phosphatases. Mol Cell Biol 25:2853-2860. 95. Foiani, M., A. Pellicioli, M. Lopes, C. Lucca, M. Ferrari, G. Liberi, M. Muzi
Falconi, and P. Plevani. 2000. DNA damage checkpoints and DNA replication
controls in Saccharomyces cerevisiae. Mutat Res 451:187-196. 96. Ford, J. C., F. al-Khodairy, E. Fotou, K. S. Sheldrick, D. J. Griffiths, and A.
M. Carr. 1994. 14-3-3 protein homologs required for the DNA damage checkpoint in fission yeast. Science 265:533-535.
97. Forrest, A., and B. Gabrielli. 2001. Cdc25B activity is regulated by 14-3-3.
Oncogene 20:4393-4401. 98. Franke, W. W., D. L. Schiller, M. Hatzfeld, and S. Winter. 1983. Protein
complexes of intermediate-sized filaments: melting of cytokeratin complexes in urea reveals different polypeptide separation characteristics. Proc Natl Acad Sci U S A 80:7113-7117.
99. Fu, H., R. R. Subramanian, and S. C. Masters. 2000. 14-3-3 proteins: structure, function, and regulation. Annu Rev Pharmacol Toxicol 40:617-647.
100. Fukuoka, J., T. Dracheva, J. H. Shih, S. M. Hewitt, T. Fujii, A. Kishor, F.
Mann, K. Shilo, T. J. Franks, W. D. Travis, and J. Jen. 2007. Desmoglein 3 as a prognostic factor in lung cancer. Hum Pathol 38:276-283.
101. Gabrielli, B. G., J. M. Clark, A. K. McCormack, and K. A. Ellem. 1997. Hyperphosphorylation of the N-terminal domain of Cdc25 regulates activity
toward cyclin B1/Cdc2 but not cyclin A/Cdk2. J Biol Chem 272:28607-28614. 102. Gabrielli, B. G., C. P. De Souza, I. D. Tonks, J. M. Clark, N. K. Hayward,
and K. A. Ellem. 1996. Cytoplasmic accumulation of cdc25B phosphatase in
mitosis triggers centrosomal microtubule nucleation in HeLa cells. J Cell Sci 109
( Pt 5):1081-1093.
103. Gabrielli, B. G., M. S. Lee, D. H. Walker, H. Piwnica-Worms, and J. L.
Maller. 1992. Cdc25 regulates the phosphorylation and activity of the Xenopus cdk2 protein kinase complex. J Biol Chem 267:18040-18046.
104. Galaktionov, K., and D. Beach. 1991. Specific activation of cdc25 tyrosine phosphatases by B-type cyclins: evidence for multiple roles of mitotic cyclins.
Cell 67:1181-1194.
202
105. Galimi, F., and I. M. Verma. 2002. Opportunities for the use of lentiviral vectors in human gene therapy. Curr Top Microbiol Immunol 261:245-254.
106. Garcia-Gras, E., R. Lombardi, M. J. Giocondo, J. T. Willerson, M. D.
Schneider, D. S. Khoury, and A. J. Marian. 2006. Suppression of canonical
Wnt/beta-catenin signaling by nuclear plakoglobin recapitulates phenotype of arrhythmogenic right ventricular cardiomyopathy. J Clin Invest 116:2012-2021.
107. Gardino, A. K., S. J. Smerdon, and M. B. Yaffe. 2006. Structural determinants
of 14-3-3 binding specificities and regulation of subcellular localization of 14-3-3-ligand complexes: a comparison of the X-ray crystal structures of all human 14-
3-3 isoforms. Semin Cancer Biol 16:173-182. 108. Garinis, G. A., J. R. Mitchell, M. J. Moorhouse, K. Hanada, H. de Waard, D.
Vandeputte, J. Jans, K. Brand, M. Smid, P. J. van der Spek, J. H.
Hoeijmakers, R. Kanaar, and G. T. van der Horst. 2005. Transcriptome analysis reveals cyclobutane pyrimidine dimers as a major source of UV-induced
DNA breaks. Embo J 24:3952-3962. 109. Garrod, D. R., A. J. Merritt, and Z. Nie. 2002. Desmosomal adhesion:
structural basis, molecular mechanism and regulation (Review). Mol Membr Biol
19:81-94. 110. Garrod, D. R., A. J. Merritt, and Z. Nie. 2002. Desmosomal cadherins. Curr
Opin Cell Biol 14:537-545. 111. Gatei, M., K. Sloper, C. Sorensen, R. Syljuasen, J. Falck, K. Hobson, K.
Savage, J. Lukas, B. B. Zhou, J. Bartek, and K. K. Khanna. 2003. Ataxia-
telangiectasia-mutated (ATM) and NBS1-dependent phosphorylation of Chk1 on Ser-317 in response to ionizing radiation. J Biol Chem 278:14806-14811.
112. Gautier, J., M. J. Solomon, R. N. Booher, J. F. Bazan, and M. W. Kirschner. 1991. cdc25 is a specific tyrosine phosphatase that directly activates p34cdc2. Cell 67:197-211.
113. Gautier, J., M. J. Solomon, R. N. Booher, J. F. Bazan, and M. W. Kirschner. 1991. cdc25 is a specific tyrosine phosphatase that directly activates p34cdc2. Cell
67:197-211. 114. Gerull, B., A. Heuser, T. Wichter, M. Paul, C. T. Basson, D. A. McDermott,
B. B. Lerman, S. M. Markowitz, P. T. Ellinor, C. A. MacRae, S. Peters, K. S.
Grossmann, J. Drenckhahn, B. Michely, S. Sasse-Klaassen, W. Birchmeier,
R. Dietz, G. Breithardt, E. Schulze-Bahr, and L. Thierfelder. 2004. Mutations
in the desmosomal protein plakophilin-2 are common in arrhythmogenic right ventricular cardiomyopathy. Nat Genet 36:1162-1164.
115. Getsios, S., A. C. Huen, and K. J. Green. 2004. Working out the strength and
flexibility of desmosomes. Nat Rev Mol Cell Biol 5:271-281. 116. Giannakakou, P., D. L. Sackett, Y. Ward, K. R. Webster, M. V.
Blagosklonny, and T. Fojo. 2000. p53 is associated with cellular microtubules and is transported to the nucleus by dynein. Nat Cell Biol 2:709-717.
117. Giles, N., A. Forrest, and B. Gabrielli. 2003. 14-3-3 acts as an intramolecular
bridge to regulate cdc25B localization and activity. J Biol Chem 278:28580-28587.
203
118. Girard, F., U. Strausfeld, J. C. Cavadore, P. Russell, A. Fernandez, and N. J.
Lamb. 1992. cdc25 is a nuclear protein expressed constitutively throughout the
cell cycle in nontransformed mammalian cells. J Cell Biol 118:785-794. 119. Girard, F., U. Strausfeld, A. Fernandez, and N. J. Lamb. 1991. Cyclin A is
required for the onset of DNA replication in mammalian fibroblasts. Cell 67:1169-1179.
120. Goloudina, A., H. Yamaguchi, D. B. Chervyakova, E. Appella, A. J. Fornace,
Jr., and D. V. Bulavin. 2003. Regulation of human Cdc25A stability by Serine 75 phosphorylation is not sufficient to activate a S phase checkpoint. Cell Cycle
2:473-478. 121. Gordon, J. W., G. A. Scangos, D. J. Plotkin, J. A. Barbosa, and F. H. Ruddle.
1980. Genetic transformation of mouse embryos by microinjection of purified
DNA. Proceedings of the National Academy of Sciences of the United States of America 77:7380-7384.
122. Gosavi, P., S. T. Kundu, N. Khapare, L. Sehgal, M. S. Karkhanis, and S. N.
Dalal. 2011. E-cadherin and plakoglobin recruit plakophilin3 to the cell border to initiate desmosome assembly. Cell Mol Life Sci 68:1439-1454.
123. Gossler, A., T. Doetschman, R. Korn, E. Serfling, and R. Kemler. 1986. Transgenesis by means of blastocyst-derived embryonic stem cell lines.
Proceedings of the National Academy of Sciences of the United States of America 83:9065-9069.
124. Gould, K. L., S. Moreno, D. J. Owen, S. Sazer, and P. Nurse. 1991.
Phosphorylation at Thr167 is required for Schizosaccharomyces pombe p34cdc2 function. Embo J 10:3297-3309.
125. Gould, K. L., and P. Nurse. 1989. Tyrosine phosphorylation of the fission yeast cdc2+ protein kinase regulates entry into mitosis. Nature 342:39-45.
126. Graves, P. R., C. M. Lovly, G. L. Uy, and H. Piwnica-Worms. 2001.
Localization of human Cdc25C is regulated both by nuclear export and 14-3-3 protein binding. Oncogene 20:1839-1851.
127. Green, K. J., and C. A. Gaudry. 2000. Are desmosomes more than tethers for intermediate filaments? Nat Rev Mol Cell Biol 1:208-216.
128. Grossmann, K. S., C. Grund, J. Huelsken, M. Behrend, B. Erdmann, W. W.
Franke, and W. Birchmeier. 2004. Requirement of plakophilin 2 for heart morphogenesis and cardiac junction formation. J Cell Biol 167:149-160.
129. Gu, Y., C. W. Turck, and D. O. Morgan. 1993. Inhibition of CDK2 activity in vivo by an associated 20K regulatory subunit. Nature 366:707-710.
130. Guan, K. L., C. W. Jenkins, Y. Li, M. A. Nichols, X. Wu, C. L. O'Keefe, A.
G. Matera, and Y. Xiong. 1994. Growth suppression by p18, a p16INK4/MTS1- and p14INK4B/MTS2-related CDK6 inhibitor, correlates with wild-type pRb
function. Genes Dev 8:2939-2952. 131. Gudas, J. M., M. Payton, S. Thukral, E. Chen, M. Bass, M. O. Robinson, and
S. Coats. 1999. Cyclin E2, a novel G1 cyclin that binds Cdk2 and is aberrantly
expressed in human cancers. Mol Cell Biol 19:612-622. 132. Gumbiner, B., B. Stevenson, and A. Grimaldi. 1988. The role of the cell
adhesion molecule uvomorulin in the formation and maintenance of the epithelial junctional complex. J Cell Biol 107:1575-1587.

204
133. Guo, Z., A. Kumagai, S. X. Wang, and W. G. Dunphy. 2000. Requirement for Atr in phosphorylation of Chk1 and cell cycle regulation in response to DNA
replication blocks and UV-damaged DNA in Xenopus egg extracts. Genes Dev 14:2745-2756.
134. Gupta, D. 2011. Identification of adhesion proteins which interact with 14-3-3γ. 135. Hachiya, A., P. Sriwiriyanont, A. Patel, N. Saito, A. Ohuchi, T. Kitahara, Y.
Takema, R. Tsuboi, R. E. Boissy, M. O. Visscher, J. M. Wilson, and G. P.
Kobinger. 2007. Gene transfer in human skin with different pseudotyped HIV-based vectors. Gene Ther 14:648-656.
136. Hallberg, B. 2002. Exoenzyme S binds its cofactor 14-3-3 through a non-phosphorylated motif. Biochem Soc Trans 30:401-405.
137. Hammer, R. E., V. G. Pursel, C. E. Rexroad, Jr., R. J. Wall, D. J. Bolt, K. M.
Ebert, R. D. Palmiter, and R. L. Brinster. 1985. Production of transgenic rabbits, sheep and pigs by microinjection. Nature 315:680-683.
138. Hamra, F. K., J. Gatlin, K. M. Chapman, D. M. Grellhesl, J. V. Garcia, R. E.
Hammer, and D. L. Garbers. 2002. Production of transgenic rats by lentiviral transduction of male germ-line stem cells. Proceedings of the National Academy
of Sciences of the United States of America 99:14931-14936. 139. Hannon, G. J., and D. Beach. 1994. p15INK4B is a potential effector of TGF-
beta-induced cell cycle arrest. Nature 371:257-261. 140. Hannon, G. J., and J. J. Rossi. 2004. Unlocking the potential of the human
genome with RNA interference. Nature 431:371-378.
141. Harper, J. W., S. J. Elledge, K. Keyomarsi, B. Dynlacht, L. H. Tsai, P.
Zhang, S. Dobrowolski, C. Bai, L. Connell-Crowley, E. Swindell, and et al.
1995. Inhibition of cyclin-dependent kinases by p21. Mol Biol Cell 6:387-400. 142. Hartwell, L. H., and T. A. Weinert. 1989. Checkpoints: controls that ensure the
order of cell cycle events. Science 246:629-634.
143. Hassepass, I., R. Voit, and I. Hoffmann. 2003. Phosphorylation at serine 75 is required for UV-mediated degradation of human Cdc25A phosphatase at the S-
phase checkpoint. J Biol Chem 278:29824-29829. 144. Hatsell, S., and P. Cowin. 2001. Deconstructing desmoplakin. Nat Cell Biol
3:E270-272.
145. Hatzfeld, M. 1999. The armadillo family of structural proteins. Int Rev Cytol 186:179-224.
146. Heino, J. 2000. The collagen receptor integrins have distinct ligand recognition and signaling functions. Matrix Biol 19:319-323.
147. Hendrix, M. J., E. A. Seftor, Y. W. Chu, K. T. Trevor, and R. E. Seftor. 1996.
Role of intermediate filaments in migration, invasion and metastasis. Cancer Metastasis Rev 15:507-525.
148. Henriksson, M. L., M. S. Francis, A. Peden, M. Aili, K. Stefansson, R.
Palmer, A. Aitken, and B. Hallberg. 2002. A nonphosphorylated 14-3-3 binding motif on exoenzyme S that is functional in vivo. Eur J Biochem 269:4921-4929.
149. Hermeking, H., C. Lengauer, K. Polyak, T. C. He, L. Zhang, S.
Thiagalingam, K. W. Kinzler, and B. Vogelstein. 1997. 14-3-3 sigma is a p53-
regulated inhibitor of G2/M progression. Mol Cell 1:3-11.

205
150. Herrmann, H., M. Haner, M. Brettel, N. O. Ku, and U. Aebi. 1999. Characterization of distinct early assembly units of different intermediate filament
proteins. J Mol Biol 286:1403-1420. 151. Hirao, A., Y. Y. Kong, S. Matsuoka, A. Wakeham, J. Ruland, H. Yoshida, D.
Liu, S. J. Elledge, and T. W. Mak. 2000. DNA damage- induced activation of p53 by the checkpoint kinase Chk2. Science 287:1824-1827.
152. Hirokawa, N., Y. Noda, Y. Tanaka, and S. Niwa. 2009. Kinesin superfamily
motor proteins and intracellular transport. Nat Rev Mol Cell Biol 10:682-696. 153. Hock, B. J., Jr., and B. T. Lamb. 2001. Transgenic mouse models of
Alzheimer's disease. Trends Genet 17:S7-12. 154. Hoffmann, I., P. R. Clarke, M. J. Marcote, E. Karsenti, and G. Draetta. 1993.
Phosphorylation and activation of human cdc25-C by cdc2--cyclin B and its
involvement in the self-amplification of MPF at mitosis. Embo J 12:53-63. 155. Hoffmann, I., G. Draetta, and E. Karsenti. 1994. Activation of the phosphatase
activity of human cdc25A by a cdk2-cyclin E dependent phosphorylation at the G1/S transition. Embo J 13:4302-4310.
156. Honda, R., Y. Ohba, A. Nagata, H. Okayama, and H. Yasuda. 1993.
Dephosphorylation of human p34cdc2 kinase on both Thr-14 and Tyr-15 by human cdc25B phosphatase. FEBS Lett 318:331-334.
157. Hosing, A. S., S. T. Kundu, and S. N. Dalal. 2008. 14-3-3 Gamma is required to enforce both the incomplete S phase and G2 DNA damage checkpoints. Cell Cycle 7:3171-3179.
158. Houdebine, L. M. 2004. Preparation of recombinant proteins in milk. Methods Mol Biol 267:485-494.
159. Houdebine, L. M. 1995. The production of pharmaceutical proteins from the milk of transgenic animals. Reprod Nutr Dev 35:609-617.
160. Houdebine, L. M. 2000. Transgenic animal bioreactors. Transgenic Res 9:305-
320. 161. Hutchinson, J. N., and W. J. Muller. 2000. Transgenic mouse models of human
breast cancer. Oncogene 19:6130-6137. 162. Iavarone, A., and J. Massague. 1997. Repression of the CDK activator Cdc25A
and cell-cycle arrest by cytokine TGF-beta in cells lacking the CDK inhibitor p15.
Nature 387:417-422. 163. Ihrie, R. A., M. R. Marques, B. T. Nguyen, J. S. Horner, C. Papazoglu, R. T.
Bronson, A. A. Mills, and L. D. Attardi. 2005. Perp is a p63-regulated gene essential for epithelial integrity. Cell 120:843-856.
164. Jackman, J. K., D. G. Motto, Q. Sun, M. Tanemoto, C. W. Turck, G. A. Peltz,
G. A. Koretzky, and P. R. Findell. 1995. Molecular cloning of SLP-76, a 76-kDa tyrosine phosphoprotein associated with Grb2 in T cells. J Biol Chem
270:7029-7032. 165. Jackman, M., M. Firth, and J. Pines. 1995. Human cyclins B1 and B2 are
localized to strikingly different structures: B1 to microtubules, B2 primarily to the
Golgi apparatus. Embo J 14:1646-1654. 166. Jaulin, F., X. Xue, E. Rodriguez-Boulan, and G. Kreitzer. 2007. Polarization-
dependent selective transport to the apical membrane by KIF5B in MDCK cells. Dev Cell 13:511-522.
206
167. Jones, D. H., H. Martin, J. Madrazo, K. A. Robinson, P. Nielsen, P. H.
Roseboom, Y. Patel, S. A. Howell, and A. Aitken. 1995. Expression and
structural analysis of 14-3-3 proteins. J Mol Biol 245:375-384. 168. Kanatsu-Shinohara, M., A. Ogura, M. Ikegawa, K. Inoue, N. Ogonuki, K.
Tashiro, S. Toyokuni, T. Honjo, and T. Shinohara. 2002. Adenovirus-mediated gene delivery and in vitro microinsemination produce offspring from infertile male mice. Proceedings of the National Academy of Sciences of the United States
of America 99:1383-1388. 169. Kanatsu-Shinohara, M., S. Toyokuni, and T. Shinohara. 2004. Transgenic
mice produced by retroviral transduction of male germ line stem cells in vivo. Biology of reproduction 71:1202-1207.
170. Karpova, T., and J. G. McNally. 2006. Detecting protein-protein interactions
with CFP-YFP FRET by acceptor photobleaching. Curr Protoc Cytom Chapter
12:Unit12 17.
171. Kartenbeck, J., U. Haselmann, and N. Gassler. 2005. Synthesis of junctional proteins in metastasizing colon cancer cells. Eur J Cell Biol 84:417-430.
172. Kastan, M. B., and D. S. Lim. 2000. The many substrates and functions of
ATM. Nat Rev Mol Cell Biol 1:179-186. 173. Kay, M. A., J. C. Glorioso, and L. Naldini. 2001. Viral vectors for gene
therapy: the art of turning infectious agents into vehicles of therapeutics. Nat Med 7:33-40.
174. Keil, R., C. Kiessling, and M. Hatzfeld. 2009. Targeting of p0071 to the
midbody depends on KIF3. J Cell Sci 122:1174-1183. 175. Khan, K., R. Hardy, A. Haq, O. Ogunbiyi, D. Morton, and M. Chidgey. 2006.
Desmocollin switching in colorectal cancer. Br J Cancer 95:1367-1370. 176. Khan, S. H., J. Moritsugu, and G. M. Wahl. 2000. Differential requirement for
p19ARF in the p53-dependent arrest induced by DNA damage, microtubule
disruption, and ribonucleotide depletion. Proc Natl Acad Sci U S A 97:3266-3271.
177. Kilani, R. T., A. Medina, A. Aitken, R. B. Jalili, M. Carr, and A. Ghahary. 2008. Identification of different isoforms of 14-3-3 protein family in human dermal and epidermal layers. Mol Cell Biochem 314:161-169.
178. Kitagawa, R., C. J. Bakkenist, P. J. McKinnon, and M. B. Kastan. 2004. Phosphorylation of SMC1 is a critical downstream event in the ATM-NBS1-
BRCA1 pathway. Genes Dev 18:1423-1438. 179. Knudsen, K. A., and M. J. Wheelock. 1992. Plakoglobin, or an 83-kD
homologue distinct from beta-catenin, interacts with E-cadherin and N-cadherin. J
Cell Biol 118:671-679. 180. Kobayashi, H., E. Stewart, R. Poon, J. P. Adamczewski, J. Gannon, and T.
Hunt. 1992. Identification of the domains in cyclin A required for binding to, and activation of, p34cdc2 and p32cdk2 protein kinase subunits. Mol Biol Cell 3:1279-1294.
181. Koch, P. J., and W. W. Franke. 1994. Desmosomal cadherins: another growing multigene family of adhesion molecules. Curr Opin Cell Biol 6:682-687.
182. Koff, A., A. Giordano, D. Desai, K. Yamashita, J. W. Harper, S. Elledge, T.
Nishimoto, D. O. Morgan, B. R. Franza, and J. M. Roberts. 1992. Formation

207
and activation of a cyclin E-cdk2 complex during the G1 phase of the human cell cycle. Science 257:1689-1694.
183. Kootstra, N. A., and I. M. Verma. 2003. Gene therapy with viral vectors. Annu Rev Pharmacol Toxicol 43:413-439.
184. Kopera, I. A., B. Bilinska, C. Y. Cheng, and D. D. Mruk. 2010. Sertoli-germ cell junctions in the testis: a review of recent data. Philos Trans R Soc Lond B Biol Sci 365:1593-1605.
185. Kopera, I. A., L. Su, B. Bilinska, C. Y. Cheng, and D. D. Mruk. 2009. An in vivo study on adjudin and blood-testis barrier dynamics. Endocrinology
150:4724-4733. 186. Kops, G. J., B. A. Weaver, and D. W. Cleveland. 2005. On the road to cancer:
aneuploidy and the mitotic checkpoint. Nat Rev Cancer 5:773-785.
187. Krek, W., J. Marks, N. Schmitz, E. A. Nigg, and V. Simanis. 1992. Vertebrate p34cdc2 phosphorylation site mutants: effects upon cell cycle progression in the
fission yeast Schizosaccharomyces pombe. J Cell Sci 102 ( Pt 1):43-53. 188. Krimpenfort, P., A. Rademakers, W. Eyestone, A. van der Schans, S. van den
Broek, P. Kooiman, E. Kootwijk, G. Platenburg, F. Pieper, R. Strijker, and
et al. 1991. Generation of transgenic dairy cattle using 'in vitro' embryo production. Biotechnology (N Y) 9:844-847.
189. Ku, N. O., and M. B. Omary. 2000. Keratins turn over by ubiquitination in a phosphorylation-modulated fashion. J Cell Biol 149:547-552.
190. Kuby, G. a. 2000. Immunology, 5 ed.
191. Kumagai, A., and W. G. Dunphy. 1999. Binding of 14-3-3 proteins and nuclear export control the intracellular localization of the mitotic inducer Cdc25. Genes
Dev 13:1067-1072. 192. Kumagai, A., and W. G. Dunphy. 1991. The cdc25 protein controls tyrosine
dephosphorylation of the cdc2 protein in a cell- free system. Cell 64:903-914.
193. Kumagai, A., and W. G. Dunphy. 1992. Regulation of the cdc25 protein during the cell cycle in Xenopus extracts. Cell 70:139-151.
194. Kumagai, A., P. S. Yakowec, and W. G. Dunphy. 1998. 14-3-3 proteins act as negative regulators of the mitotic inducer Cdc25 in Xenopus egg extracts. Mol Biol Cell 9:345-354.
195. Kunath, T., G. Gish, H. Lickert, N. Jones, T. Pawson, and J. Rossant. 2003. Transgenic RNA interference in ES cell-derived embryos recapitulates a genetic
null phenotype. Nature Biotech. 21:559-561. 196. Kundu, S. T., P. Gosavi, N. Khapare, R. Patel, A. S. Hosing, G. B. Maru, A.
Ingle, J. A. Decaprio, and S. N. Dalal. 2008. Plakophilin3 downregulation leads
to a decrease in cell adhesion and promotes metastasis. Int J Cancer 123:2303-2314.
197. Kundu, S. T., P. Gosavi, N. Khapare, R. Patel, A. S. Hosing, G. B. Maru, A.
Ingle, J. A. Decaprio, and S. N. Dalal. 2008. Plakophilin3 downregulation leads to a decrease in cell adhesion and promotes metastasis. Int J Cancer 123:2303-
2314. 198. Larochelle, S., J. Batliner, M. J. Gamble, N. M. Barboza, B. C. Kraybill, J. D.
Blethrow, K. M. Shokat, and R. P. Fisher. 2006. Dichotomous but stringent

208
substrate selection by the dual- function Cdk7 complex revealed by chemical genetics. Nat Struct Mol Biol 13:55-62.
199. Larochelle, S., K. A. Merrick, M. E. Terret, L. Wohlbold, N. M. Barboza, C.
Zhang, K. M. Shokat, P. V. Jallepalli, and R. P. Fisher. 2007. Requirements
for Cdk7 in the assembly of Cdk1/cyclin B and activation of Cdk2 revealed by chemical genetics in human cells. Mol Cell 25:839-850.
200. Larochelle, S., J. Pandur, R. P. Fisher, H. K. Salz, and B. Suter. 1998. Cdk7 is
essential for mitosis and for in vivo Cdk-activating kinase activity. Genes Dev 12:370-381.
201. Lauper, N., A. R. Beck, S. Cariou, L. Richman, K. Hofmann, W. Reith, J. M.
Slingerland, and B. Amati. 1998. Cyclin E2: a novel CDK2 partner in the late G1 and S phases of the mammalian cell cycle. Oncogene 17:2637-2643.
202. Lee, G., L. S. White, K. E. Hurov, T. S. Stappenbeck, and H. Piwnica-
Worms. 2009. Response of small intestinal epithelial cells to acute disruption of
cell division through CDC25 deletion. Proc Natl Acad Sci U S A 106:4701-4706. 203. Lee, J., A. Kumagai, and W. G. Dunphy. 2001. Positive regulation of Wee1 by
Chk1 and 14-3-3 proteins. Mol Biol Cell 12:551-563.
204. Lee, M. H., I. Reynisdottir, and J. Massague. 1995. Cloning of p57KIP2, a cyclin-dependent kinase inhibitor with unique domain structure and tissue
distribution. Genes Dev 9:639-649. 205. Lee, M. S., T. Enoch, and H. Piwnica-Worms. 1994. mik1+ encodes a tyrosine
kinase that phosphorylates p34cdc2 on tyrosine 15. J Biol Chem 269:30530-
30537. 206. Lees, E. M., and E. Harlow. 1993. Sequences within the conserved cyclin box of
human cyclin A are sufficient for binding to and activation of cdc2 kinase. Mol Cell Biol 13:1194-1201.
207. Lei, M., and R. L. Erikson. 2008. Plk1 depletion in nontransformed diploid cells
activates the DNA-damage checkpoint. Oncogene 27:3935-3943. 208. Lewis, J. E., J. K. Wahl, 3rd, K. M. Sass, P. J. Jensen, K. R. Johnson, and M.
J. Wheelock. 1997. Cross-talk between adherens junctions and desmosomes depends on plakoglobin. J Cell Biol 136:919-934.
209. Li, M. W., D. D. Mruk, W. M. Lee, and C. Y. Cheng. 2010. Connexin 43 is
critical to maintain the homeostasis of the blood-testis barrier via its effects on tight junction reassembly. Proc Natl Acad Sci U S A 107:17998-18003.
210. Lie, P. P., C. Y. Cheng, and D. D. Mruk. 2010. Crosstalk between desmoglein-2/desmocollin-2/Src kinase and coxsackie and adenovirus receptor/ZO-1 protein complexes, regulates blood-testis barrier dynamics. Int J Biochem Cell Biol
42:975-986. 211. Lincoln, A. J., D. Wickramasinghe, P. Stein, R. M. Schultz, M. E. Palko, M.
P. De Miguel, L. Tessarollo, and P. J. Donovan. 2002. Cdc25b phosphatase is required for resumption of meiosis during oocyte maturation. Nat Genet 30:446-449.
212. Lindqvist, A., H. Kallstrom, and C. Karlsson Rosenthal. 2004. Characterisation of Cdc25B localisation and nuclear export during the cell cycle
and in response to stress. J Cell Sci 117:4979-4990.

209
213. Liu, D., J. Bienkowska, C. Petosa, R. J. Collier, H. Fu, and R. Liddington. 1995. Crystal structure of the zeta isoform of the 14-3-3 protein. Nature 376:191-
194. 214. Liu, Q., S. Guntuku, X. S. Cui, S. Matsuoka, D. Cortez, K. Tamai, G. Luo, S.
Carattini-Rivera, F. DeMayo, A. Bradley, L. A. Donehower, and S. J.
Elledge. 2000. Chk1 is an essential kinase that is regulated by Atr and required for the G(2)/M DNA damage checkpoint. Genes Dev 14:1448-1459.
215. Lukas, C., J. Falck, J. Bartkova, J. Bartek, and J. Lukas. 2003. Distinct spatiotemporal dynamics of mammalian checkpoint regulators induced by DNA
damage. Nat Cell Biol 5:255-260. 216. Macleod, K. F., N. Sherry, G. Hannon, D. Beach, T. Tokino, K. Kinzler, B.
Vogelstein, and T. Jacks. 1995. p53-dependent and independent expression of
p21 during cell growth, differentiation, and DNA damage. Genes Dev 9:935-944. 217. Mailand, N., A. V. Podtelejnikov, A. Groth, M. Mann, J. Bartek, and J.
Lukas. 2002. Regulation of G(2)/M events by Cdc25A through phosphorylation-dependent modulation of its stability. Embo J 21:5911-5920.
218. Majka, J., and P. M. Burgers. 2003. Yeast Rad17/Mec3/Ddc1: a sliding clamp
for the DNA damage checkpoint. Proc Natl Acad Sci U S A 100:2249-2254. 219. Malek, N. P., H. Sundberg, S. McGrew, K. Nakayama, T. R. Kyriakides, and
J. M. Roberts. 2001. A mouse knock- in model exposes sequential proteolytic pathways that regulate p27Kip1 in G1 and S phase. Nature 413:323-327.
220. Malumbres, M., and M. Barbacid. 2005. Mammalian cyclin-dependent kinases.
Trends Biochem Sci 30:630-641. 221. Manke, I. A., A. Nguyen, D. Lim, M. Q. Stewart, A. E. Elia, and M. B. Yaffe.
2005. MAPKAP kinase-2 is a cell cycle checkpoint kinase that regulates the G2/M transition and S phase progression in response to UV irradiation. Mol Cell 17:37-48.
222. Margolis, S. S., J. A. Perry, C. M. Forester, L. K. Nutt, Y. Guo, M. J. Jardim,
M. J. Thomenius, C. D. Freel, R. Darbandi, J. H. Ahn, J. D. Arroyo, X. F.
Wang, S. Shenolikar, A. C. Nairn, W. G. Dunphy, W. C. Hahn, D. M.
Virshup, and S. Kornbluth. 2006. Role for the PP2A/B56delta phosphatase in regulating 14-3-3 release from Cdc25 to control mitosis. Cell 127:759-773.
223. Margolis, S. S., J. A. Perry, D. H. Weitzel, C. D. Freel, M. Yoshida, T. A.
Haystead, and S. Kornbluth. 2006. A role for PP1 in the Cdc2/Cyclin B-
mediated positive feedback activation of Cdc25. Mol Biol Cell 17:1779-1789. 224. Margolis, S. S., S. Walsh, D. C. Weiser, M. Yoshida, S. Shenolikar, and S.
Kornbluth. 2003. PP1 control of M phase entry exerted through 14-3-3-regulated
Cdc25 dephosphorylation. Embo J 22:5734-5745. 225. Markiewicz, E., G. Wilczynski, J. Filipski, and J. Szopa. 1997. Modification of
the apoptotic-like effects of MBP protein overexpression in E. coli by fusion with 14-3-3 derived polypeptides. Cell Death Differ 4:272-275.
226. Marumoto, T., A. Tashiro, D. Friedmann-Morvinski, M. Scadeng, Y. Soda,
F. H. Gage, and I. M. Verma. 2009. Development of a novel mouse glioma model using lentiviral vectors. Nat Med 15:110-116.
227. Matsuoka, S., M. C. Edwards, C. Bai, S. Parker, P. Zhang, A. Baldini, J. W.
Harper, and S. J. Elledge. 1995. p57KIP2, a structurally distinct member of the
210
p21CIP1 Cdk inhibitor family, is a candidate tumor suppressor gene. Genes Dev 9:650-662.
228. Matsuoka, S., M. Huang, and S. J. Elledge. 1998. Linkage of ATM to cell cycle regulation by the Chk2 protein kinase. Science 282:1893-1897.
229. Matsuoka, S., G. Rotman, A. Ogawa, Y. Shiloh, K. Tamai, and S. J. Elledge. 2000. Ataxia telangiectasia-mutated phosphorylates Chk2 in vivo and in vitro. Proc Natl Acad Sci U S A 97:10389-10394.
230. Matsushime, H., D. E. Quelle, S. A. Shurtleff, M. Shibuya, C. J. Sherr, and J.
Y. Kato. 1994. D-type cyclin-dependent kinase activity in mammalian cells. Mol
Cell Biol 14:2066-2076. 231. Matsushime, H., M. F. Roussel, R. A. Ashmun, and C. J. Sherr. 1991. Colony-
stimulating factor 1 regulates novel cyclins during the G1 phase of the cell cycle.
Cell 65:701-713. 232. Maya, R., M. Balass, S. T. Kim, D. Shkedy, J. F. Leal, O. Shifman, M. Moas,
T. Buschmann, Z. Ronai, Y. Shiloh, M. B. Kastan, E. Katzir, and M. Oren. 2001. ATM-dependent phosphorylation of Mdm2 on serine 395: role in p53 activation by DNA damage. Genes Dev 15:1067-1077.
233. Meister, G., and T. Tuschl. 2004. Mechanisms of gene silencing by double-stranded RNA. Nature 431:343-349.
234. Michalkiewicz, M., T. Michalkiewicz, A. M. Geurts, R. J. Roman, G. R.
Slocum, O. Singer, D. Weihrauch, A. S. Greene, M. Kaldunski, I. M. Verma,
H. J. Jacob, and A. W. Cowley, Jr. 2007. Efficient transgenic rat production by
a lentiviral vector. Am J Physiol Heart Circ Physiol 293:H881-894. 235. Michels, C., T. Buchta, W. Bloch, T. Krieg, and C. M. Niessen. 2009. Classical
cadherins regulate desmosome formation. J Invest Dermatol 129:2072-2075. 236. Michieli, P., M. Chedid, D. Lin, J. H. Pierce, W. E. Mercer, and D. Givol.
1994. Induction of WAF1/CIP1 by a p53- independent pathway. Cancer Res
54:3391-3395. 237. Millar, J. B., C. H. McGowan, G. Lenaers, R. Jones, and P. Russell. 1991.
p80cdc25 mitotic inducer is the tyrosine phosphatase that activates p34cdc2 kinase in fission yeast. Embo J 10:4301-4309.
238. Miller, R. K., S. Khuon, and R. D. Goldman. 1993. Dynamics of keratin
assembly: exogenous type I keratin rapidly associates with type II keratin in vivo. J Cell Biol 122:123-135.
239. Mils, V., V. Baldin, F. Goubin, I. Pinta, C. Papin, M. Waye, A. Eychene, and
B. Ducommun. 2000. Specific interaction between 14-3-3 isoforms and the human CDC25B phosphatase. Oncogene 19:1257-1265.
240. Miyoshi, H., M. Takahashi, F. H. Gage, and I. M. Verma. 1997. Stable and efficient gene transfer into the retina using an HIV-based lentiviral vector.
Proceedings of the National Academy of Sciences of the United States of America 94:10319-10323.
241. Molinari, M., C. Mercurio, J. Dominguez, F. Goubin, and G. F. Draetta.
2000. Human Cdc25 A inactivation in response to S phase inhibition and its role in preventing premature mitosis. EMBO Rep 1:71-79.

211
242. Moll, R., W. W. Franke, D. L. Schiller, B. Geiger, and R. Krepler. 1982. The catalog of human cytokeratins: patterns of expression in normal epithelia, tumors
and cultured cells. Cell 31:11-24. 243. Morgan, D. O. 1995. Principles of CDK regulation. Nature 374:131-134.
244. Morris, M. C., A. Heitz, J. Mery, F. Heitz, and G. Divita. 2000. An essential phosphorylation-site domain of human cdc25C interacts with both 14-3-3 and cyclins. J Biol Chem 275:28849-28857.
245. Morris, M. C., J. Mery, A. Heitz, F. Heitz, and G. Divita. 1999. Design and synthesis of a peptide derived from positions 195-244 of human cdc25C
phosphatase. J Pept Sci 5:263-271. 246. Moustakas, A., and D. Kardassis. 1998. Regulation of the human
p21/WAF1/Cip1 promoter in hepatic cells by functional interactions between Sp1
and Smad family members. Proc Natl Acad Sci U S A 95:6733-6738. 247. Mruk, D. D., and C. Y. Cheng. 2004. Cell-cell interactions at the ectoplasmic
specialization in the testis. Trends Endocrinol Metab 15:439-447. 248. Mruk, D. D., and C. Y. Cheng. 2004. Sertoli-Sertoli and Sertoli-germ cell
interactions and their significance in germ cell movement in the seminiferous
epithelium during spermatogenesis. Endocr Rev 25:747-806. 249. Mueller, P. A., T. R. Coleman, A. Kumagai, and W. G. Dunphy. 1995. Myt1:
a membrane-associated inhibitory kinase that phosphorylates cdc2 on both Threonine-14 and Tyrosine-15. Science 270:86-90.
250. Muslin, A. J., J. W. Tanner, P. M. Allen, and A. S. Shaw. 1996. Interaction of
14-3-3 with signaling proteins is mediated by recognition of phosphoserine. Cell 84:889-897.
251. Myer, D. L., M. Bahassi el, and P. J. Stambrook. 2005. The Plk3-Cdc25 circuit. Oncogene 24:299-305.
252. Myers, J. S., and D. Cortez. 2006. Rapid activation of ATR by ionizing radiation
requires ATM and Mre11. J Biol Chem 281:9346-9350. 253. Nagano, M., C. J. Brinster, K. E. Orwig, B. Y. Ryu, M. R. Avarbock, and R.
L. Brinster. 2001. Transgenic mice produced by retroviral transduction of male germ-line stem cells. Proc Natl Acad Sci U S A 98:13090-13095.
254. Nagano, M., and R. L. Brinster. 1998. Spermatogonial transplantation and
reconstitution of donor cell spermatogenesis in recipient mice. Apmis 106:47-55; discussion 56-47.
255. Nagano, M., T. Shinohara, M. R. Avarbock, and R. L. Brinster. 2000. Retrovirus-mediated gene delivery into male germ line stem cells. FEBS Lett 475:7-10.
256. Nagano, M., D. J. Watson, B. Y. Ryu, J. H. Wolfe, and R. L. Brinster. 2002. Lentiviral vector transduction of male germ line stem cells in mice. FEBS Lett
524:111-115. 257. Nakagawa, T., M. I. Feliu-Mojer, P. Wulf, C. Lois, M. Sheng, and C. C.
Hoogenraad. 2006. Generation of lentiviral transgenic rats expressing glutamate
receptor interacting protein 1 (GRIP1) in brain, spinal cord and testis. Journal of neuroscience methods 152:1-9.
258. Nakayama, K., H. Nagahama, Y. A. Minamishima, M. Matsumoto, I.
Nakamichi, K. Kitagawa, M. Shirane, R. Tsunematsu, T. Tsukiyama, N.

212
Ishida, M. Kitagawa, K. Nakayama, and S. Hatakeyama. 2000. Targeted disruption of Skp2 results in accumulation of cyclin E and p27(Kip1), polyploidy
and centrosome overduplication. Embo J 19:2069-2081. 259. Naldini, L., U. Blomer, F. H. Gage, D. Trono, and I. M. Verma. 1996.
Efficient transfer, integration, and sustained long-term expression of the transgene in adult rat brains injected with a lentiviral vector. Proceedings of the National Academy of Sciences of the United States of America 93:11382-11388.
260. Nekrasova, O. E., E. V. Amargo, W. O. Smith, J. Chen, G. E. Kreitzer, and
K. J. Green. 2011. Desmosomal cadherins utilize distinct kinesins for assembly
into desmosomes. J Cell Biol 195:1185-1203. 261. Norbury, C., J. Blow, and P. Nurse. 1991. Regulatory phosphorylation of the
p34cdc2 protein kinase in vertebrates. Embo J 10:3321-3329.
262. Nurse, P. 2000. The incredible life and times of biological cells. Science 289:1711-1716.
263. Nurse, P. 1994. Ordering S phase and M phase in the cell cycle. Cell 79:547-550. 264. Nykvist, P., H. Tu, J. Ivaska, J. Kapyla, T. Pihlajaniemi, and J. Heino. 2000.
Distinct recognition of collagen subtypes by alpha(1)beta(1) and alpha(2)beta(1)
integrins. Alpha(1)beta(1) mediates cell adhesion to type XIII collagen. J Biol Chem 275:8255-8261.
265. O'Connell, M. J., J. M. Raleigh, H. M. Verkade, and P. Nurse. 1997. Chk1 is a wee1 kinase in the G2 DNA damage checkpoint inhibiting cdc2 by Y15 phosphorylation. Embo J 16:545-554.
266. Oakberg, E. F. 1956. A description of spermiogenesis in the mouse and its use in analysis of the cycle of the seminiferous epithelium and germ cell renewal. Am J
Anat 99:391-413. 267. Oakberg, E. F. 1956. Duration of spermatogenesis in the mouse and timing of
stages of the cycle of the seminiferous epithelium. Am J Anat 99:507-516.
268. Ogg, S., B. Gabrielli, and H. Piwnica-Worms. 1994. Purification of a serine kinase that associates with and phosphorylates human cdc25C on serine 216. J.
Biol. Chem. 269:30461-30469. 269. Ogg, S., B. Gabrielli, and H. Piwnica-Worms. 1994. Purification of a serine
kinase that associates with and phosphorylates human Cdc25C on serine 216. J
Biol Chem 269:30461-30469. 270. Ohtani, K., J. DeGregori, and J. R. Nevins. 1995. Regulation of the cyclin E
gene by transcription factor E2F1. Proc Natl Acad Sci U S A 92:12146-12150. 271. Ohtsubo, M., A. M. Theodoras, J. Schumacher, J. M. Roberts, and M.
Pagano. 1995. Human cyclin E, a nuclear protein essential for the G1-to-S phase
transition. Mol Cell Biol 15:2612-2624. 272. Paddison, P. J., A. A. Caudy, E. Bernstein, G. J. Hannon, and D. S. Conklin.
2002. Short hairpin RNAs (shRNAs) induce sequence-specific silencing in mammalian cells. Genes and Dev. 16:948-958.
273. Paddison, P. J., J. M. Silva, D. S. Conklin, M. Schlabach, M. Li, S. Aruleba,
V. Balija, A. O'Shaughnessy, L. Gnoj, K. Scobie, K. Chang, T. Westbrook,
M. Cleary, R. Sachidanandam, W. R. McCombie, S. J. Elledge, and G. J.
Hannon. 2004. A resource for large-scale RNA-interference-based screens in mammals. Nature 428:427-431.

213
274. Pagano, M., R. Pepperkok, F. Verde, W. Ansorge, and G. Draetta. 1992. Cyclin A is required at two points in the human cell cycle. Embo J 11:961-971.
275. Palmiter, R. D., R. L. Brinster, R. E. Hammer, M. E. Trumbauer, M. G.
Rosenfeld, N. C. Birnberg, and R. M. Evans. 1982. Dramatic growth of mice
that develop from eggs microinjected with metallothionein-growth hormone fusion genes. Nature 300:611-615.
276. Papagerakis, S., A. H. Shabana, J. Depondt, P. Gehanno, and N. Forest.
2003. Immunohistochemical localization of plakophilins (PKP1, PKP2, PKP3, and p0071) in primary oropharyngeal tumors: correlation with clinical parameters.
Hum Pathol 34:565-572. 277. Parker, L. L., and H. Piwnica-Worms. 1992. Inactivation of the p34cdc2-cyclin
B complex by the human WEE1 tyrosine kinase. Science 257:1955-1957.
278. Paulovich, A. G., D. P. Toczyski, and L. H. Hartwell. 1997. When checkpoints fail. Cell 88:315-321.
279. Peng, C.-Y., P. R. Graves, R. S. Thoma, Z. Wu, A. S. Shaw, and H. Piwnica-
Worms. 1997. Mitotic and G2 checkpoint control: regulation of 14-3-3 protein binding by phosphorylation of cdc25C on serine-216. Science 277:1501-1505.
280. Peng, C. Y., P. R. Graves, S. Ogg, R. S. Thoma, M. J. Byrnes, 3rd, Z. Wu, M.
T. Stephenson, and H. Piwnica-Worms. 1998. C-TAK1 protein kinase
phosphorylates human Cdc25C on serine 216 and promotes 14-3-3 protein binding. Cell Growth Differ 9:197-208.
281. Peng, C. Y., P. R. Graves, R. S. Thoma, Z. Wu, A. S. Shaw, and H. Piwnica-
Worms. 1997. Mitotic and G2 checkpoint control: regulation of 14-3-3 protein binding by phosphorylation of Cdc25C on serine-216. Science 277:1501-1505.
282. Perry, A. C., T. Wakayama, H. Kishikawa, T. Kasai, M. Okabe, Y. Toyoda,
and R. Yanagimachi. 1999. Mammalian transgenesis by intracytoplasmic sperm injection. Science 284:1180-1183.
283. Pfeifer, A., E. P. Brandon, N. Kootstra, F. H. Gage, and I. M. Verma. 2001. Delivery of the Cre recombinase by a self-deleting lentiviral vector: efficient gene
targeting in vivo. Proceedings of the National Academy of Sciences of the United States of America 98:11450-11455.
284. Pfeifer, A., M. Ikawa, Y. Dayn, and I. M. Verma. 2002. Transgenesis by
lentiviral vectors: lack of gene silencing in mammalian embryonic stem cells and preimplantation embryos. Proc Natl Acad Sci U S A 99:2140-2145.
285. Pfeifer, A., T. Kessler, M. Yang, E. Baranov, N. Kootstra, D. A. Cheresh, R.
M. Hoffman, and I. M. Verma. 2001. Transduction of liver cells by lentiviral vectors: analysis in living animals by fluorescence imaging. Mol Ther 3:319-322.
286. Pines, J. 1995. Cyclins and cyclin-dependent kinases: a biochemical view. Biochem J 308 ( Pt 3):697-711.
287. Pines, J. 1995. Cyclins, CDKs and cancer. Semin Cancer Biol 6:63-72. 288. Pines, J., and T. Hunter. 1994. The differential localization of human cyclins A
and B is due to a cytoplasmic retention signal in cyclin B. Embo J 13:3772-3781.
289. Pines, J., and T. Hunter. 1989. Isolation of a human cyclin cDNA: evidence for cyclin mRNA and protein regulation in the cell cycle and for interaction with
p34cdc2. Cell 58:833-846.
214
290. Polyak, K., J. Y. Kato, M. J. Solomon, C. J. Sherr, J. Massague, J. M.
Roberts, and A. Koff. 1994. p27Kip1, a cyclin-Cdk inhibitor, links transforming
growth factor-beta and contact inhibition to cell cycle arrest. Genes Dev 8:9-22. 291. Polyak, K., M. H. Lee, H. Erdjument-Bromage, A. Koff, J. M. Roberts, P.
Tempst, and J. Massague. 1994. Cloning of p27Kip1, a cyclin-dependent kinase inhibitor and a potential mediator of extracellular antimitogenic signals. Cell 78:59-66.
292. Potiron, V. A., G. Sharma, P. Nasarre, J. A. Clarhaut, H. G. Augustin, R. M.
Gemmill, J. Roche, and H. A. Drabkin. 2007. Semaphorin SEMA3F Affects
Multiple Signaling Pathways in Lung Cancer Cells. Cancer Res 67:8708-8715. 293. Prockop, D. J., and K. I. Kivirikko. 1995. Collagens: molecular biology,
diseases, and potentials for therapy. Annu Rev Biochem 64:403-434.
294. Qian, Y. W., E. Erikson, C. Li, and J. L. Maller. 1998. Activated polo- like kinase Plx1 is required at multiple points during mitosis in Xenopus laevis. Mol
Cell Biol 18:4262-4271. 295. Ramezani, A., T. S. Hawley, and R. G. Hawley. 2000. Lentiviral vectors for
enhanced gene expression in human hematopoietic cells. Mol Ther 2:458-469.
296. Rao, M. K., J. Pham, J. S. Imam, J. A. MacLean, D. Murali, Y. Furuta, A. P.
Sinha-Hikim, and M. F. Wilkinson. 2006. Tissue-specific RNAi reveals that
WT1 expression in nurse cells controls germ cell survival and spermatogenesis. Genes Dev 20:147-152.
297. Reiser, J., G. Harmison, S. Kluepfel-Stahl, R. O. Brady, S. Karlsson, and M.
Schubert. 1996. Transduction of nondividing cells using pseudotyped defective high-titer HIV type 1 particles. Proc Natl Acad Sci U S A 93:15266-15271.
298. Rheinwald, J. G., and M. A. Beckett. 1981. Tumorigenic keratinocyte lines requiring anchorage and fibroblast support cultures from human squamous cell carcinomas. Cancer Res 41:1657-1663.
299. Rodriguez-Bravo, V., S. Guaita-Esteruelas, N. Salvador, O. Bachs, and N.
Agell. 2007. Different S/M checkpoint responses of tumor and non tumor cell
lines to DNA replication inhibition. Cancer Res 67:11648-11656. 300. Rogakou, E. P., C. Boon, C. Redon, and W. M. Bonner. 1999. Megabase
chromatin domains involved in DNA double-strand breaks in vivo. J Cell Biol
146:905-916. 301. Ronen, K., O. Negre, S. Roth, C. Colomb, N. Malani, M. Denaro, T. Brady, F.
Fusil, B. Gillet-Legrand, K. Hehir, Y. Beuzard, P. Leboulch, J. D. Down, E.
Payen, and F. D. Bushman. 2011. Distribution of Lentiviral Vector Integration Sites in Mice Following Therapeutic Gene Transfer to Treat beta-thalassemia.
Mol Ther. 302. Ruiz, P., V. Brinkmann, B. Ledermann, M. Behrend, C. Grund, C.
Thalhammer, F. Vogel, C. Birchmeier, U. Gunthert, W. W. Franke, and W.
Birchmeier. 1996. Targeted mutation of plakoglobin in mice reveals essential functions of desmosomes in the embryonic heart. J Cell Biol 135:215-225.
303. Russell, L. 1977. Desmosome-like junctions between Sertoli and germ cells in the rat testis. Am J Anat 148:301-312.
304. Russell, L. 1977. Movement of spermatocytes from the basal to the adluminal compartment of the rat testis. Am J Anat 148:313-328.

215
305. Russell, L. D. 1978. The blood-testis barrier and its formation relative to spermatocyte maturation in the adult rat: a lanthanum tracer study. Anat Rec
190:99-111. 306. Ryan, T. M., D. J. Ciavatta, and T. M. Townes. 1997. Knockout-transgenic
mouse model of sickle cell disease. Science 278:873-876. 307. Ryu, B. Y., K. E. Orwig, J. M. Oatley, C. C. Lin, L. J. Chang, M. R.
Avarbock, and R. L. Brinster. 2007. Efficient generation of transgenic rats
through the male germline using lentiviral transduction and transplantation of spermatogonial stem cells. Journal of andrology 28:353-360.
308. Saha, P., Q. Eichbaum, E. D. Silberman, B. J. Mayer, and A. Dutta. 1997. p21CIP1 and Cdc25A: competition between an inhibitor and an activator of cyclin-dependent kinases. Mol Cell Biol 17:4338-4345.
309. Salomon, F., and C. E. Hedinger. 1982. Abnormal basement membrane structures of seminiferous tubules in infertile men. Lab Invest 47:543-554.
310. Salomon, F., P. Saremaslani, M. Jakob, and C. E. Hedinger. 1982. Immune complex orchitis in infertile men. Immunoelectron microscopy of abnormal basement membrane structures. Lab Invest 47:555-567.
311. Sanchez, Y., C. Wong, R. S. Thoma, R. Richman, Z. Wu, H. Piwnica-Worms,
and S. J. Elledge. 1997. Conservation of the Chk1 checkpoint pathway in
mammals: linkage of DNA damage to Cdk regulation through Cdc25. Science 277:1497-1501.
312. Sato, M., A. Ishikawa, and M. Kimura. 2002. Direct injection of foreign DNA
into mouse testis as a possible in vivo gene transfer system via epididymal spermatozoa. Mol Reprod Dev 61:49-56.
313. Sato, T., K. Katagiri, A. Gohbara, K. Inoue, N. Ogonuki, A. Ogura, Y.
Kubota, and T. Ogawa. 2011. In vitro production of functional sperm in cultured neonatal mouse testes. Nature 471:504-507.
314. Satyanarayana, A., M. B. Hilton, and P. Kaldis. 2008. p21 Inhibits Cdk1 in the absence of Cdk2 to maintain the G1/S phase DNA damage checkpoint. Mol Biol
Cell 19:65-77. 315. Scherr, M., and M. Eder. 2002. Gene transfer into hematopoietic stem cells
using lentiviral vectors. Curr Gene Ther 2:45-55.
316. Schmidt, A., H. W. Heid, S. Schafer, U. A. Nuber, R. Zimbelmann, and W.
W. Franke. 1994. Desmosomes and cytoskeletal architecture in epithelial
differentiation: cell type-specific plaque components and intermediate filament anchorage. Eur J Cell Biol 65:229-245.
317. Schmidt, A., and S. Jager. 2005. Plakophilins--hard work in the desmosome,
recreation in the nucleus? Eur J Cell Biol 84:189-204. 318. Schmitt, E., R. Boutros, C. Froment, B. Monsarrat, B. Ducommun, and C.
Dozier. 2006. CHK1 phosphorylates CDC25B during the cell cycle in the absence of DNA damage. J Cell Sci 119:4269-4275.
319. Schroder, A. R., P. Shinn, H. Chen, C. Berry, J. R. Ecker, and F. Bushman.
2002. HIV-1 integration in the human genome favors active genes and local hotspots. Cell 110:521-529.
320. Schweizer, J., P. E. Bowden, P. A. Coulombe, L. Langbein, E. B. Lane, T. M.
Magin, L. Maltais, M. B. Omary, D. A. Parry, M. A. Rogers, and M. W.

216
Wright. 2006. New consensus nomenclature for mammalian keratins. J Cell Biol 174:169-174.
321. Sebastian, B., A. Kakizuka, and T. Hunter. 1993. Cdc25M2 activation of cyclin-dependent kinases by dephosphorylation of threonine-14 and tyrosine-15.
Proc Natl Acad Sci U S A 90:3521-3524. 322. Sehgal, L., R. Thorat, N. Khapare, A. Mukhopadhaya, M. Sawant, and S. N.
Dalal. 2011. Lentiviral mediated transgenesis by in vivo manipulation of
spermatogonial stem cells. PLoS One 6:e21975. 323. Seibler, J., B. Kuter-Luks, H. Kern, S. Streu, L. Plum, J. Mauer, R. Kuhn, J.
C. Bruning, and F. Schwenk. 2005. Single copy shRNA configuration for ubiquitous gene knockdown in mice. Nuc. Acids Res. 33:e67.
324. Sekar, R. B., and A. Periasamy. 2003. Fluorescence resonance energy transfer
(FRET) microscopy imaging of live cell protein localizations. J Cell Biol 160:629-633.
325. Serrano, M., G. J. Hannon, and D. Beach. 1993. A new regulatory motif in cell-cycle control causing specific inhibition of cyclin D/CDK4. Nature 366:704-707.
326. Sheaff, R. J., M. Groudine, M. Gordon, J. M. Roberts, and B. E. Clurman. 1997. Cyclin E-CDK2 is a regulator of p27Kip1. Genes Dev 11:1464-1478.
327. Shen, Y. H., J. Godlewski, A. Bronisz, J. Zhu, M. J. Comb, J. Avruch, and G.
Tzivion. 2003. Significance of 14-3-3 self-dimerization for phosphorylation-dependent target binding. Mol Biol Cell 14:4721-4733.
328. Sherr, C. J. 1996. Cancer cell cycles. Science 274:1672-1677. 329. Sherr, C. J. 1993. Mammalian G1 cyclins. Cell 73:1059-1065.
330. Sherr, C. J., and J. M. Roberts. 1999. CDK inhibitors: positive and negative regulators of G1-phase progression. Genes Dev 13:1501-1512.
331. Sherr, C. J., and J. M. Roberts. 2004. Living with or without cyclins and cyclin-
dependent kinases. Genes Dev 18:2699-2711. 332. Shieh, S. Y., J. Ahn, K. Tamai, Y. Taya, and C. Prives. 2000. The human
homologs of checkpoint kinases Chk1 and Cds1 (Chk2) phosphorylate p53 at multiple DNA damage- inducible sites. Genes Dev 14:289-300.
333. Shiina, H., J. E. Breault, W. W. Basset, H. Enokida, S. Urakami, L. C. Li, S.
T. Okino, M. Deguchi, M. Kaneuchi, M. Terashima, T. Yoneda, K. Shigeno,
P. R. Carroll, M. Igawa, and R. Dahiya. 2005. Functional Loss of the gamma-
catenin gene through epigenetic and genetic pathways in human prostate cancer. Cancer Res 65:2130-2138.
334. Shiloh, Y. 2003. ATM and related protein kinases: safeguarding genome
integrity. Nat Rev Cancer 3:155-168. 335. Singer, J. D., M. Gurian-West, B. Clurman, and J. M. Roberts. 1999. Cullin-3
targets cyclin E for ubiquitination and controls S phase in mammalian cells. Genes Dev 13:2375-2387.
336. Singer, O., G. Tiscornia, M. Ikawa, and I. M. Verma. 2006. Rapid generation
of knockdown transgenic mice by silencing lentiviral vectors. Nat Protoc 1:286-292.
337. Siu, M. K., W. M. Lee, and C. Y. Cheng. 2003. The interplay of collagen IV, tumor necrosis factor-alpha, gelatinase B (matrix metalloprotease-9), and tissue

217
inhibitor of metalloproteases-1 in the basal lamina regulates Sertoli cell-tight junction dynamics in the rat testis. Endocrinology 144:371-387.
338. Skaar, J. R., T. Arai, and J. A. DeCaprio. 2005. Dimerization of CUL7 and PARC is not required for all CUL7 functions and mouse development. Mol Cell
Biol 25:5579-5589. 339. Solomon, M. J., M. Glotzer, T. H. Lee, M. Philippe, and M. W. Kirschner.
1990. Cyclin activation of p34cdc2. Cell 63:1013-1024.
340. Sontheimer, E. J. 2005. Assembly and function of RNA silencing complexes. Nat Rev Mol Cell Biol 6:127-138.
341. Sorensen, C. S., R. G. Syljuasen, J. Falck, T. Schroeder, L. Ronnstrand, K.
K. Khanna, B. B. Zhou, J. Bartek, and J. Lukas. 2003. Chk1 regulates the S phase checkpoint by coupling the physiological turnover and ionizing radiation-
induced accelerated proteolysis of Cdc25A. Cancer Cell 3:247-258. 342. Steinacker, P., P. Schwarz, K. Reim, P. Brechlin, O. Jahn, H. Kratzin, A.
Aitken, J. Wiltfang, A. Aguzzi, E. Bahn, H. C. Baxter, N. Brose, and M. Otto. 2005. Unchanged survival rates of 14-3-3gamma knockout mice after inoculation with pathological prion protein. Mol Cell Biol 25:1339-1346.
343. Stewart, S. A., D. M. Dykxhoorn, D. Palliser, H. Mizuno, E. Y. Yu, D. S. An,
D. M. Sabatini, I. S. Chen, W. C. Hahn, P. A. Sharp, R. A. Weinberg, and C.
D. Novina. 2003. Lentivirus-delivered stable gene silencing by RNAi in primary cells. RNA (New York, N.Y 9:493-501.
344. Strausfeld, U., A. Fernandez, J. P. Capony, F. Girard, N. Lautredou, J.
Derancourt, J. C. Labbe, and N. J. Lamb. 1994. Activation of p34cdc2 protein kinase by microinjection of human cdc25C into mammalian cells. Requirement
for prior phosphorylation of cdc25C by p34cdc2 on sites phosphorylated at mitosis. J Biol Chem 269:5989-6000.
345. Strausfeld, U., J. C. Labbe, D. Fesquet, J. C. Cavadore, A. Picard, K. Sadhu,
P. Russell, and M. Doree. 1991. Dephosphorylation and activation of a p34cdc2/cyclin B complex in vitro by human CDC25 protein. Nature 351:242-
245. 346. Su, L., C. Y. Cheng, and D. D. Mruk. 2010. Adjudin-mediated Sertoli-germ cell
junction disassembly affects Sertoli cell barrier function in vitro and in vivo. Int J
Biochem Cell Biol 42:1864-1875. 347. Su, Y. W., Z. Hao, A. Hirao, K. Yamamoto, W. J. Lin, A. Young, G. S.
Duncan, H. Yoshida, A. Wakeham, P. A. Lang, K. Murakami, H.
Hermeking, B. Vogelstein, P. Ohashi, and T. W. Mak. 2011. 14-3-3sigma regulates B-cell homeostasis through stabilization of FOXO1. Proc Natl Acad Sci
U S A 108:1555-1560. 348. Sun, S., E. W. Wong, M. W. Li, W. M. Lee, and C. Y. Cheng. 2009. 14-3-3
and its binding partners are regulators of protein-protein interactions during spermatogenesis. J Endocrinol 202:327-336.
349. Takizawa, C. G., and D. O. Morgan. 2000. Control of mitosis by changes in the
subcellular location of cyclin-B1-Cdk1 and Cdc25C. Curr Opin Cell Biol 12:658-665.
350. Tanaka, Y., Y. Kanai, Y. Okada, S. Nonaka, S. Takeda, A. Harada, and N.
Hirokawa. 1998. Targeted disruption of mouse conventional kinesin heavy chain,

218
kif5B, results in abnormal perinuclear clustering of mitochondria. Cell 93:1147-1158.
351. Tang, F.-C., G.-L. Meng, H.-B. Yang, C.-J. Li, Y. Shi, M.-X. Ding, K.-G.
Shang, B. Zhang, and Y.-F. Xue. 2004. Stable supression of gene expression in
murine embryonic stem cells by RNAi dervived from DNA vector-based short hairpin RNA. Stem Cells 22:93-99.
352. Tbakhi, A., M. Edinger, J. Myles, B. Pohlman, and R. R. Tubbs. 1996. Flow
cytometric immunophenotyping of non-Hodgkin's lymphomas and related disorders. Cytometry 25:113-124.
353. Telles, E. 2009. 14-3-3 isotype specificity in cdc25C function. Thesis. University of Mumbai, Kharghar, Navi Mumbai.
354. Telles, E., A. S. Hosing, S. T. Kundu, P. Venkatraman, and S. N. Dalal. 2009.
A novel pocket in 14-3-3epsilon is required to mediate specific complex formation with cdc25C and to inhibit cell cycle progression upon activation of
checkpoint pathways. Exp Cell Res 315:1448-1457. 355. Teng, J., T. Rai, Y. Tanaka, Y. Takei, T. Nakata, M. Hirasawa, A. B.
Kulkarni, and N. Hirokawa. 2005. The KIF3 motor transports N-cadherin and
organizes the developing neuroepithelium. Nat Cell Biol 7:474-482. 356. Tibbetts, R. S., K. M. Brumbaugh, J. M. Williams, J. N. Sarkaria, W. A.
Cliby, S. Y. Shieh, Y. Taya, C. Prives, and R. T. Abraham. 1999. A role for ATR in the DNA damage- induced phosphorylation of p53. Genes Dev 13:152-157.
357. Timpl, R. 1996. Macromolecular organization of basement membranes. Curr Opin Cell Biol 8:618-624.
358. Timpl, R., and J. C. Brown. 1996. Supramolecular assembly of basement membranes. Bioessays 18:123-132.
359. Tinkle, C. L., H. A. Pasolli, N. Stokes, and E. Fuchs. 2008. New insights into
cadherin function in epidermal sheet formation and maintenance of tissue integrity. Proc Natl Acad Sci U S A 105:15405-15410.
360. Tiscornia, G., O. Singer, M. Ikawa, and I. M. Verma. 2003. A general method for gene knockdown in mice by using lentiviral vectors expressing small interfering RNA. Proc Natl Acad Sci U S A 100:1844-1848.
361. Tiscornia, G., V. Tergaonkar, F. Galimi, and I. M. Verma. 2004. CRE recombinase- inducible RNA interference mediated by lentiviral vectors.
Proceedings of the National Academy of Sciences of the United States of America 101:7347-7351.
362. Todd, A., N. Cossons, A. Aitken, G. B. Price, and M. Zannis-Hadjopoulos.
1998. Human cruciform binding protein belongs to the 14-3-3 family. Biochemistry 37:14317-14325.
363. Toyo-oka, K., A. Shionoya, M. J. Gambello, C. Cardoso, R. Leventer, H. L.
Ward, R. Ayala, L. H. Tsai, W. Dobyns, D. Ledbetter, S. Hirotsune, and A.
Wynshaw-Boris. 2003. 14-3-3epsilon is important for neuronal migration by
binding to NUDEL: a molecular explanation for Miller-Dieker syndrome. Nat Genet 34:274-285.

219
364. Tsunekawa, N., M. Matsumoto, S. Tone, T. Nishida, and H. Fujimoto. 1999. The Hsp70 homolog gene, Hsc70t, is expressed under translational control during
mouse spermiogenesis. Mol Reprod Dev 52:383-391. 365. Tsunekawa, N., T. Nishida, and H. Fujimoto. 1999. Expression of the
spermatid-specific Hsp70 antigen is conserved in mammals including marsupials. J Vet Med Sci 61:381-388.
366. Tzivion, G., V. S. Gupta, L. Kaplun, and V. Balan. 2006. 14-3-3 proteins as
potential oncogenes. Semin Cancer Biol 16:203-213. 367. Tzivion, G., Z. Luo, and J. Avruch. 1998. A dimeric 14-3-3 protein is an
essential cofactor for Raf kinase activity. Nature 394:88-92. 368. Uchugonova, A., R. M. Hoffman, M. Weinigel, and K. Koenig. 2011.
Watching stem cells in the skin of living mice non- invasively. Cell Cycle 10.
369. Unsal-Kacmaz, K., and A. Sancar. 2004. Quaternary structure of ATR and effects of ATRIP and replication protein A on its DNA binding and kinase
activities. Mol Cell Biol 24:1292-1300. 370. Uto, K., D. Inoue, K. Shimuta, N. Nakajo, and N. Sagata. 2004. Chk1, but not
Chk2, inhibits Cdc25 phosphatases by a novel common mechanism. Embo J
23:3386-3396. 371. van Vugt, M. A., A. Bras, and R. H. Medema. 2004. Polo- like kinase-1 controls
recovery from a G2 DNA damage- induced arrest in mammalian cells. Mol Cell 15:799-811.
372. van Vugt, M. A., and R. H. Medema. 2005. Getting in and out of mitosis with
Polo- like kinase-1. Oncogene 24:2844-2859. 373. Ventura, A., A. Meissner, C. P. Dillon, M. McManus, P. A. Sharp, L. Van
Parijs, R. Jaenisch, and T. Jacks. 2004. Cre- lox-regulated conditional RNA interference from transgenes. Proceedings of the National Academy of Sciences of the United States of America 101:10380-10385.
374. Verhey, K. J., and J. W. Hammond. 2009. Traffic control: regulation of kinesin motors. Nat Rev Mol Cell Biol 10:765-777.
375. Vlach, J., S. Hennecke, and B. Amati. 1997. Phosphorylation-dependent degradation of the cyclin-dependent kinase inhibitor p27. Embo J 16:5334-5344.
376. Wahl, G. M., and A. M. Carr. 2001. The evolution of diverse biological
responses to DNA damage: insights from yeast and p53. Nat Cell Biol 3:E277-286.
377. Walworth, N., S. Davey, and D. Beach. 1993. Fission yeast chk1 protein kinase links the rad checkpoint pathway to cdc2. Nature 363:368-371.
378. Walworth, N. C. 2000. Cell-cycle checkpoint kinases: checking in on the cell
cycle. Curr Opin Cell Biol 12:697-704. 379. Wang, L., T. Liu, Y. Wang, L. Cao, M. Nishioka, R. L. Aguirre, A. Ishikawa,
L. Geng, and N. Okada. 2007. Altered expression of desmocollin 3, desmoglein 3, and beta-catenin in oral squamous cell carcinoma: correlation with lymph node metastasis and cell proliferation. Virchows Arch 451:959-966.
380. Wang, Y., S. Penfold, X. Tang, N. Hattori, P. Riley, J. W. Harper, J. C.
Cross, and M. Tyers. 1999. Deletion of the Cul1 gene in mice causes arrest in
early embryogenesis and accumulation of cyclin E. Curr Biol 9:1191-1194.

220
381. Waterman, M. J., E. S. Stavridi, J. L. Waterman, and T. D. Halazonetis. 1998. ATM-dependent activation of p53 involves dephosphorylation and
association with 14-3-3 proteins. Nat Genet 19:175-178. 382. Weintraub, S. J., C. A. Prater, and D. C. Dean. 1992. Retinoblastoma protein
switches the E2F site from positive to negative element. Nature 358:259-261. 383. Wilker, E. W., R. A. Grant, S. C. Artim, and M. B. Yaffe. 2005. A structural
basis for 14-3-3sigma functional specificity. J Biol Chem 280:18891-18898.
384. Winston, N., F. Bourgain-Guglielmetti, M. A. Ciemerych, J. Z. Kubiak, C.
Senamaud-Beaufort, M. Carrington, C. Brechot, and J. Sobczak-Thepot.
2000. Early development of mouse embryos null mutant for the cyclin A2 gene occurs in the absence of maternally derived cyclin A2 gene products. Dev Biol 223:139-153.
385. Witcher, L. L., R. Collins, S. Puttagunta, S. E. Mechanic, M. Munson, B.
Gumbiner, and P. Cowin. 1996. Desmosomal cadherin binding domains of
plakoglobin. J Biol Chem 271:10904-10909. 386. Wong, E. W., S. Sun, M. W. Li, W. M. Lee, and C. Y. Cheng. 2009. 14-3-3
Protein regulates cell adhesion in the seminiferous epithelium of rat testes.
Endocrinology 150:4713-4723. 387. Wrobel, K. H., R. Mademann, and F. Sinowatz. 1979. The lamina propria of
the bovine seminiferous tubule. Cell Tissue Res 202:357-377. 388. Wuarin, J., and P. Nurse. 1996. Regulating S phase: CDKs, licensing and
proteolysis. Cell 85:785-787.
389. Xiang, R., A. R. Davalos, C. H. Hensel, X. J. Zhou, C. Tse, and S. L. Naylor. 2002. Semaphorin 3F gene from human 3p21.3 suppresses tumor formation in
nude mice. Cancer Res 62:2637-2643. 390. Xiao, B., S. J. Smerdon, D. H. Jones, G. G. Dodson, Y. Soneji, A. Aitken, and
S. J. Gamblin. 1995. Structure of a 14-3-3 protein and implications for
coordination of multiple signalling pathways. Nature 376:188-191. 391. Xiao, Z., Z. Chen, A. H. Gunasekera, T. J. Sowin, S. H. Rosenberg, S. Fesik,
and H. Zhang. 2003. Chk1 mediates S and G2 arrests through Cdc25A degradation in response to DNA-damaging agents. J Biol Chem 278:21767-21773.
392. Xiong, Y., G. J. Hannon, H. Zhang, D. Casso, R. Kobayashi, and D. Beach. 1993. p21 is a universal inhibitor of cyclin kinases. Nature 366:701-704.
393. Yaffe, M. B. 2002. How do 14-3-3 proteins work?-- Gatekeeper phosphorylation and the molecular anvil hypothesis. FEBS Lett 513:53-57.
394. Yaffe, M. B., K. Rittinger, S. Volinia, P. R. Caron, A. Aitken, H. Leffers, S. J.
Gamblin, S. J. Smerdon, and L. C. Cantley. 1998. The structural basis for 14-3-3 phosphopeptide binding specificity. Cell 91:961-971.
395. Yamada, A., B. Duffy, J. A. Perry, and S. Kornbluth. 2004. DNA replication checkpoint control of Wee1 stability by vertebrate Hsl7. J Cell Biol 167:841-849.
396. Yang, X., W. H. Lee, F. Sobott, E. Papagrigoriou, C. V. Robinson, J. G.
Grossmann, M. Sundstrom, D. A. Doyle, and J. M. Elkins. 2006. Structural basis for protein-protein interactions in the 14-3-3 protein family. Proc Natl Acad
Sci U S A 103:17237-17242.
221
397. Yashiro, M., N. Nishioka, and K. Hirakawa. 2006. Decreased expression of the adhesion molecule desmoglein-2 is associated with diffuse-type gastric
carcinoma. Eur J Cancer 42:2397-2403. 398. Yoon, K. H., M. Yoon, R. D. Moir, S. Khuon, F. W. Flitney, and R. D.
Goldman. 2001. Insights into the dynamic properties of keratin intermediate filaments in living epithelial cells. J Cell Biol 153:503-516.
399. Yu, Z. K., J. L. Gervais, and H. Zhang. 1998. Human CUL-1 associates with
the SKP1/SKP2 complex and regulates p21(CIP1/WAF1) and cyclin D proteins. Proc Natl Acad Sci U S A 95:11324-11329.
400. Zal, T., and N. R. Gascoigne. 2004. Using live FRET imaging to reveal early protein-protein interactions during T cell activation. Curr Opin Immunol 16:418-427.
401. Zariwala, M., J. Liu, and Y. Xiong. 1998. Cyclin E2, a novel human G1 cyclin and activating partner of CDK2 and CDK3, is induced by viral oncoproteins.
Oncogene 17:2787-2798. 402. Zeng, Y., and H. Piwnica-Worms. 1999. DNA damage and replication
checkpoints in fission yeast require nuclear exclusion of the Cdc25 phosphatase
via 14-3-3 binding. Mol Cell Biol 19:7410-7419. 403. Zhang, J., C. H. Wong, W. Xia, D. D. Mruk, N. P. Lee, W. M. Lee, and C. Y.
Cheng. 2005. Regulation of Sertoli-germ cell adherens junction dynamics via changes in protein-protein interactions of the N-cadherin-beta-catenin protein complex which are possibly mediated by c-Src and myotubularin-related protein
2: an in vivo study using an androgen suppression model. Endocrinology 146:1268-1284.
404. Zhang, Y., and Y. Xiong. 2001. A p53 amino-terminal nuclear export signal inhibited by DNA damage- induced phosphorylation. Science 292:1910-1915.
405. Zhou, B. B., and S. J. Elledge. 2000. The DNA damage response: putting
checkpoints in perspective. Nature 408:433-439. 406. Zou, L., D. Cortez, and S. J. Elledge. 2002. Regulation of ATR substrate
selection by Rad17-dependent loading of Rad9 complexes onto chromatin. Genes Dev 16:198-208.
407. Zou, L., and S. J. Elledge. 2003. Sensing DNA damage through ATRIP
recognition of RPA-ssDNA complexes. Science 300:1542-1548. 408. Zou, L., D. Liu, and S. J. Elledge. 2003. Replication protein A-mediated
recruitment and activation of Rad17 complexes. Proc Natl Acad Sci U S A 100:13827-13832.

222
PUBLICATIONS
Publications from the thesis.
1. Lalit Sehgal, Rahul Thorat, Nileema Khapre, Amitabha Mukhopadhaya, Mugdha Sawant and Sorab N Dalal Lentiviral mediated transgenesis by in vivo
manipulation of Spermatogonial stem cells. PLoS ONE 6(7): e21975.
2. Gosavi, P., S. T. Kundu, N. Khapare, Lalit Sehgal, M. S. Karkhanis, and S. N. Dalal. E-cadherin and plakoglobin recruit plakophilin3 to the cell border to
initiate desmosome assembly. Cell. Mol. Life Sci. (2011) 68:1439–1454
3. Lalit Sehgal, Rahul Thorat, Nileema Khapre, Amitabha Mukhopadhaya, Mugdha
Sawant and Sorab N Dalal. A protocol for generation of transgenic mice by manipulating spermatogonial stem cells in vivo. (Nature Protocol Exchange, 29
May, 2012).
4. Lalit Sehgal, Amitabha Mukhopadhaya, Anandi Rajan, Khyati Bhatt, Mugdha Sawant, Dipika Gupta, Rahul Thorat, Neelima Khapare, and Sorab N Dalal. Role
of 14-3-3γ in cell-cell adhesion and mice sterility. (Manuscript under
preparation).
5. Lalit Sehgal, Srikanth B., Khyati Bhatt, Sneha Sansare, Amitabha
Mukhopadhayay, Rajiv D. Kalraiya , and Sorab N. Dalal. Generation of HIV-1 based bi-cistronic lentiviral vectors for stable gene expression and live cell
imaging. (Accepted, Indian Journal of Experimental Biology).
Other publications. 1. Hunain Alam, Lalit Sehgal, Samrat T. Kundu, Sorab N. Dalal and Milind
M.Vaidya Novel function of Keratin 5 and 14 in proliferation and differentiation of stratified epithelial cells. (Molecular biology of Cell, volume 22, November 1
2011, 4068-4078) 2. Hunain Alam, Amruta V. Bhate, Prakash Gangadaran, Sharda S. Sawant, Lalit
Sehgal, Shimul Salot, Prerana P. Dange, Devendra A. Chaukar, Anil K D’cruz,
Sadhna Kannan, Rajiv Gude, Shubhada Kane, Sorab N. Dalal and Milind M. Vaidya.Fascin overexpression promotes neoplastic progression in OSCC. (BMC
Cancer. 2012 Jan 20;12(1):32). 3. Khapare N*, Lalit Sehgal*, S Kundu*, R Priya, Mugdha Sawant, P Gosavi, N
Gupta, H Alam, M Karkhanis, N Naik, M M Vaidya, S N Dalal, Cytokeratin 8
stabilization is required for the transformation induced upon loss of plakophilin3 expression. (PLoS One. 2012; 7 (6):e38561. Epub 2012 Jun 6.) * These authors
contributed equally. Patents :
1. Lalit sehgal, Rahul throat, Nileema Khapre and Sorab N Dalal; Lentiviral
mediated transgenesis. (2010) Patent Governement of Ind ia (current status filed 2442/DEL/2010
2. Lalit sehgal, Rahul throat, Nileema Khapre and Sorab N Dalal; Lentiviral mediated transgenesis. (2011) Patent United States of America (current status filed 13004382 dated 11 January 2011)
Poster/oral Presentations.
1. Lalit Sehgal, Rahul Thorat, Nileema Khapre, Amitabha Mukhopadhaya and
Sorab N Dalal Lentiviral mediated transgenesis by in-vivo manipulation of spermatogonial stem cells. Presented a poster at AACR New Horizons in Cancer
223
Research: Biology to Prevention to Therapy conference, Delhi , December 13-16, 2011.
2. Lalit Sehgal, Rahul Thorat, Nileema Khapre, Amitabha Mukhopadhaya and Sorab N Dalal Lentiviral mediated transgenesis using Sperm mediated gene
transfer. Presented a Poster at 79th annual meeting of Society of biological chemistry Indian institute of Sciences, Bangalore 13th December 2010-15th December 2010.
3. Lalit Sehgal, Rahul Thorat, Nileema Khapre, Amitabha Mukhopadhaya, and Sorab N Dalal Lentiviral mediated transgenesis in vivo. Presented a poster at
Mouse development, genetics and genomics meeting at Cold spring Harbor Laboratory, NY USA, 26th October 2010-30th October 2010.
4. Lalit Sehgal, Rahul Thorat, Nileema Khapre, Amitabha Mukhopadhaya, and
Sorab N Dalal Generation of transgenic mice by Sperm mediated gene transfer. Presented a talk entitled “at 5th Graduate students meet at ACTREC 18 and 19th
December 2009. Received third prize. 5. Lalit Sehgal, Rahul Thorat, Nileema Khapre, Amitabha Mukhopadhaya, and
Sorab N Dalal Generation of knockdown mice by Sperm mediated gene transfer.
Presented a poster at 33rd All India cell biology conference 2009 & international workshop on cell cycle regulation held at central university of Hyderabad,
Hyderabad from 10th -13th December 2009. 6. Lalit Sehgal, Amitabha Mukhopadhaya, and Sorab N Dalal “Generation of stem
cell lines and knockdown mice that lack 14-3-3ε and 14-3-3γ using RNA
interference” Participated and presented a poster at international meeting on Model organism and stem cell biology at NCBS, Bangalore, Feb 23-25 2008.